Embed Size (px)
Citation preview

h
CommunicateResearcSurvey Results
Findings of a survey of MPs
conducted on behalf of EAMA
www.communicateresearch.com
CommunicateResearch Ltd, 50 Broadway, Westminster, London, SW1H 0RG T. (020) 7152 4010 F. (020) 7152 4001
Registered in England and Wales No 4810991
Registered Office: Park Chambers, 55 Kingston Hill, Kingston upon Thames, Surrey KT2 7PS

Prepared for EAMA 1
CommunicateResearch
Contents PAGE
Methodology & overview
2
Q1. Irrespective of how familiar you with these sectors, we would like to ask you about how you have gained your knowledge of each of them.
4
Q2. As far as you can tell, is each of these statements about manufacturing in the UK true or false?
7
Q3. Do you agree or disagree with each of these statements about government funded business support and the way companies are regulated?
16
APPENDIX – FULL DATA

Prepared for EAMA 2
CommunicateResearch
Methodology
CommunicateResearch surveyed 154 MPs between 7th June and 24th June 2005, using self-completion postal questionnaires. The sample comprised 80 Labour MPs, 51 Conservative MPs, 20 Liberal Democrats, and 3 MPs representing the smaller parties. Data were weighted to reflect the exact party composition and regional distribution of seats in the House of Commons. Data may not add up to 100 due to rounding.
Overview
• Different sources of information prove most influential for
MPs with regard to different industries. In general, lobbying by firms and individuals in MPs’ constituencies scored the highest number of ‘very influential’ ratings.
• With special regard to the manufacturing industry,
constituency firms and individuals are still most influential, followed by Parliamentary briefings, then other sources such as the media, and finally MPs’ own career backgrounds. This suggests perhaps that MPs generally have little inherent knowledge of the manufacturing industry, and that other lobbying methods are therefore doubly important.
• Respondents’ awareness of issues concerning the
manufacturing industry is generally low. Of nine ‘true or false?’ questions posed, only two provoked a significant majority of correct responses.
• Respondents are broadly in favour of supporting UK exports at the expense of encouraging foreign direct investment.
• Conservative respondents (and, to an extent, Lib Dems) are most enthusiastic about reducing taxes on business; conversely, Labour are the most sceptical.
• An unexpectedly small number of Labour MPs endorse their own government’s treatment of the manufacturing industry. This indicates that 48% of Labour MPs are either apathetic about or critical of their government’s relationship with the manufacturing industry.

Prepared for EAMA 3
CommunicateResearch
• Participants from all parties believe that MPs should take a
greater role in leading the drive to cut red tape for business. The Conservatives are most enthusiastic about phasing out red tape in general.

Prepared for EAMA 4
CommunicateResearch
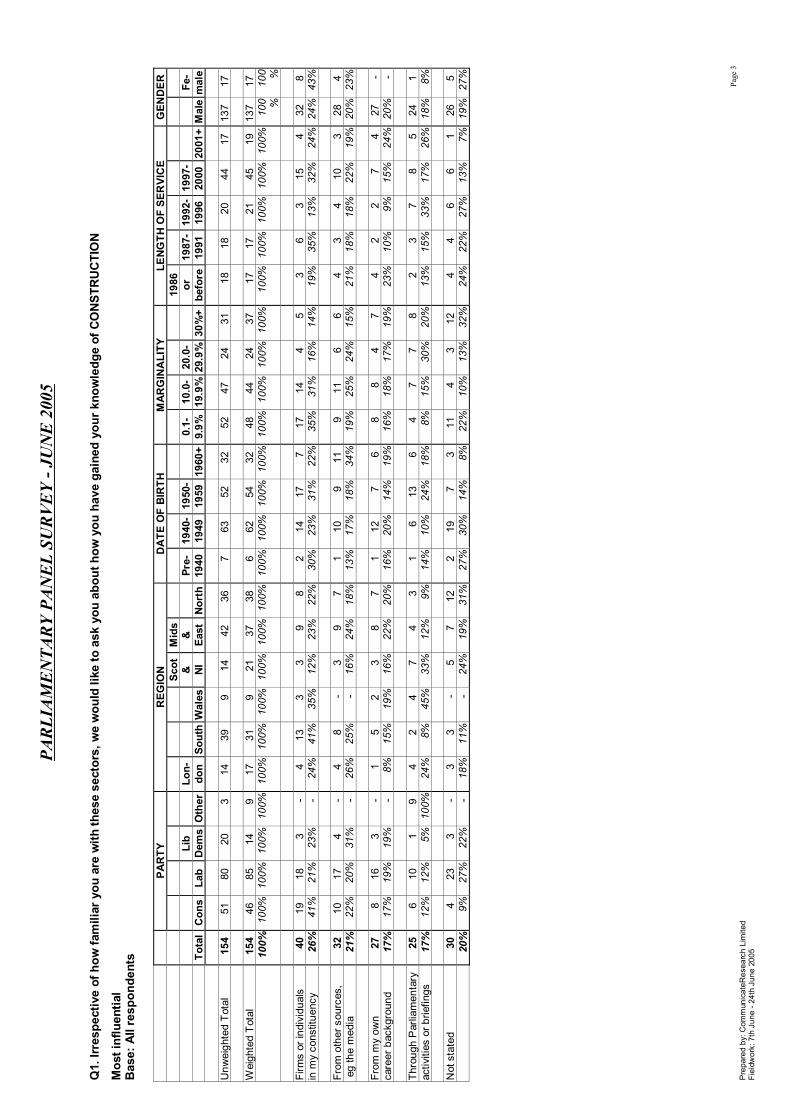
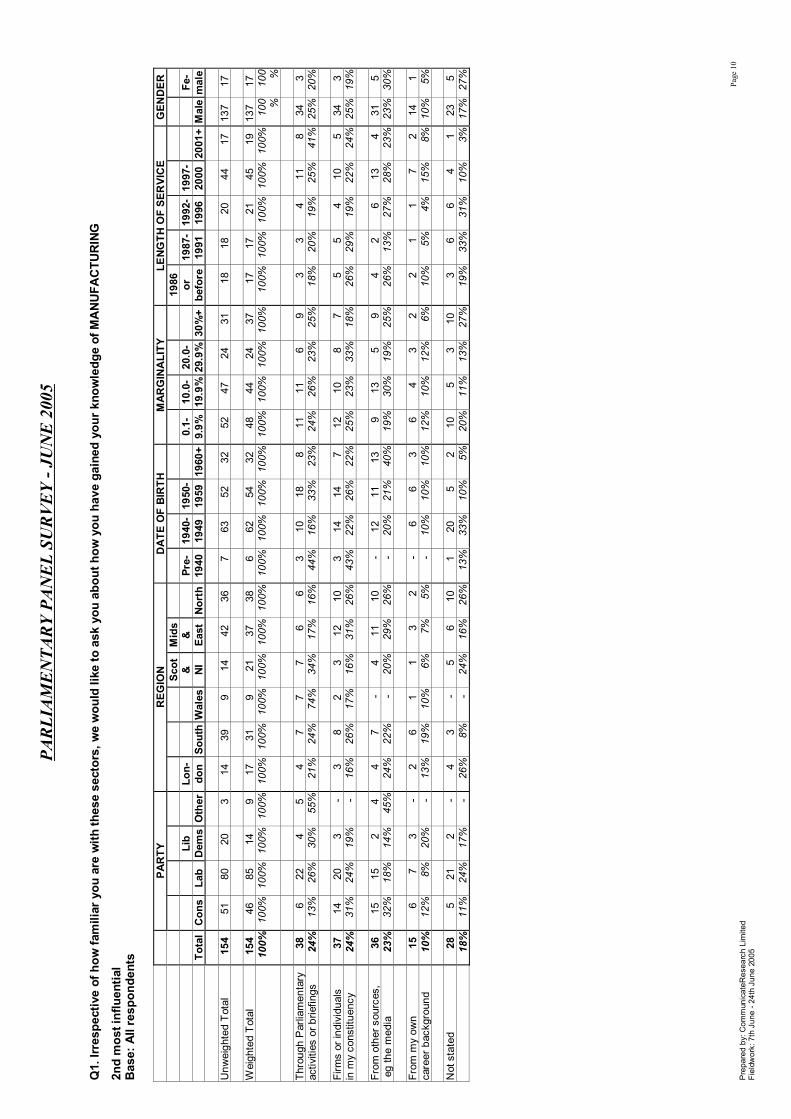
Q1 Irrespective of how familiar you are with these sectors, we would like to ask you about how you have gained your knowledge of them.
• From my own career background • From other sources, eg the media • Through Parliamentary activities or briefings • Firms or individuals in my constituency • Not stated
05
10152025303540
Bankin
g and
insu
rance
Busine
ss se
vices
Constr
uctio
n
Manufa
cturin
g
Pharm
aceu
ticals
Retailin
g
% 'm
ost i
nflu
entia
l' Own career background
Other sources, eg media
Parliamentary activities/briefings
Firms/individuals inconstituency
Not stated
Firms/ individuals in
constituency 24%
Own career background
21%
Other sources, eg media
19%
Parliamentary activities/ briefings
17%
Average % of MPs rating as ‘most influential’
The first table shows the percentage of MPs who rated each of the options as the most influential source of information about various sectors. It is evident that different sources supply knowledge most effectively in different industries. MPs’ own career backgrounds are the most crucial aid with respect to banking and insurance and business services, but the lobbying of firms or individuals within their constituencies are more influential in terms of construction, manufacturing and

Prepared for EAMA 5
CommunicateResearch
retailing, and Parliamentary briefings are the most common source of information about the pharmaceuticals industry. Across the board of industries, firms and individuals in constituencies contribute most frequently towards MPs’ knowledge of the six sectors. Individual career backgrounds were next most influential, indicating that many MPs have interest and involvement in these industries before moving into politics. Parliamentary briefings and other sources are apparently least important on average, but a respectable 17% and 18% of MPs still name them as the most influential to them personally.
0
0.5
1
1.5
2
2.5
3
3.5
4
Total
Labo
ur
Conse
rvativ
e
Lib D
emOthe
r
Mea
n sc
ores
for m
anuf
actu
ring
Firms/individuals in myconstituency
Parliamentary activitiesor briefings
Own career background
Other sources, eg media
This table focuses on the manufacturing industry in more detail, to show the party breakdown of mean scores for each source of information. These scores are based on a ranking of 4 to 1, where 4 was most influential and 1 was least influential. The advantage of this methodology is that it takes into account the degrees of preference expressed by MPs’ second choice, third choice and fourth choice rankings. Once this is taken into account, we can see that the results differ from those illustrated in the first table. Overall, firms or individuals in constituencies are still the most reliable source of information for MPs, Parliamentary activities and sources come next with only a hair’s breadth between them, and MPs’ own

Prepared for EAMA 6
CommunicateResearch
career backgrounds are least influential. This suggests perhaps that MPs generally have little inherent knowledge of the manufacturing industry, and that other lobbying methods are therefore doubly important. Analysis of the regional cross-breaks for mean scores revealed that respondents from Scotland and Northern Ireland were significantly more likely (by almost 1.0 points) to learn about the manufacturing industry from Parliamentary activities or briefings, and significantly less likely (by the same margin) to hear from firms or individuals in their constituencies. MPs from London were least likely to have learnt from a background in manufacturing, and most likely to have learnt through media sources.

Prepared for EAMA 7
CommunicateResearch
Q2 As far as you can tell, is each of these statements about manufacturing in the UK true or false?
Manufacturing accounts for more than 60% of UK exports
Manufacturing accounts for…
0 10 20 30 40 5
Total
Labour
Conservative
Lib Dem
Other
% of correct responses
0
Only 39% of MPs overall knew that manufacturing accounts for over 60% of exports from the UK. Labour MPs were by far the most knowledgeable, their correct response rate almost nudging 50% while the other parties failed to reach 30%. MPs whose constituencies are based in the South of England were by far the most likely to guess incorrectly - 72% , compared to the next highest regional category (London) at 58%.

Prepared for EAMA 8
CommunicateResearch
The UK exports more engineering products than it imports
UK exports more…
0 10 20 30 40 50 60 70
Total
Labour
Conservative
Lib Dem
Other
% of correct responses
Just under half of MPs questioned guessed that in fact the UK imports more engineering products. This proximity to the 50% mark may well indicate pure guesswork- except, perhaps, in the case of the Conservatives, whose success rate approaches 60%. Again, MPs from the South scored the highest success rate, with 60% responding correctly- and female MPs were more successful too.

Prepared for EAMA 9
CommunicateResearch
The UK spends a higher proportion of its GDP on investment than
most other leading industrialised countries
UK spends higher proportion…
0 20 40 60 80 10
Total
Labour
Conservative
Lib Dem
Other
% of correct responses
0
The results for this statement were far more encouraging; a total of 65% of respondents knew that the UK is in fact behind most leading industrialised countries in terms of its investment. The Conservatives were most likely to guess correctly, with almost four-fifths opting for ‘false’. Again, MPs from the South were overwhelmingly most likely to guess right- over three-quarters of them got the right answer. Female MPs also had a much higher success rate than male- 87% as opposed to 62%.

Prepared for EAMA 10
CommunicateResearch
The UK exports more manufactured goods per head than Japan or
the USA
UK exports more manufactured…
0 10 20 30 40 5
Total
Labour
Conservative
Lib Dem
Other
% of correct responses
0
Only 35% knew that this statement is true. Labour MPs were most successful, with the Tories and Lib Dems neck and neck on only 30%.

Prepared for EAMA 11
CommunicateResearch
UK manufactured exports have doubled in the past 10 years
UK manufactured exports…
0 5 10 15 20 25 30 35 40
Total
Labour
Conservative
Lib Dem
Other
% of correct responses
The success rates here are low once again, with under 40% of respondents from all parties guessing correctly but the Tories coming in especially low with only 20%. Interestingly LondonMPs were the most likely to answer this question correctly, whileScottish & Northern Irish MPs were least likely to do so.

Prepared for EAMA 12
CommunicateResearch
Services earn more for the UK balance of payments than
manufactured goods
Services earn more for the UK…
0 5 10 15 20 25 30 35
Total
Labour
Conservative
Lib Dem
Other
% of correct responses
Respondents once again demonstrated poor levels of knowledge, this time concerning the profitability of the services industry versus the manufacturing sector. Labour MPs score twice as highly as the Liberal Democrats and Conservatives, but even so cannot muster more than 30% of correct responses.
Prepared for EAMA 13
CommunicateResearch
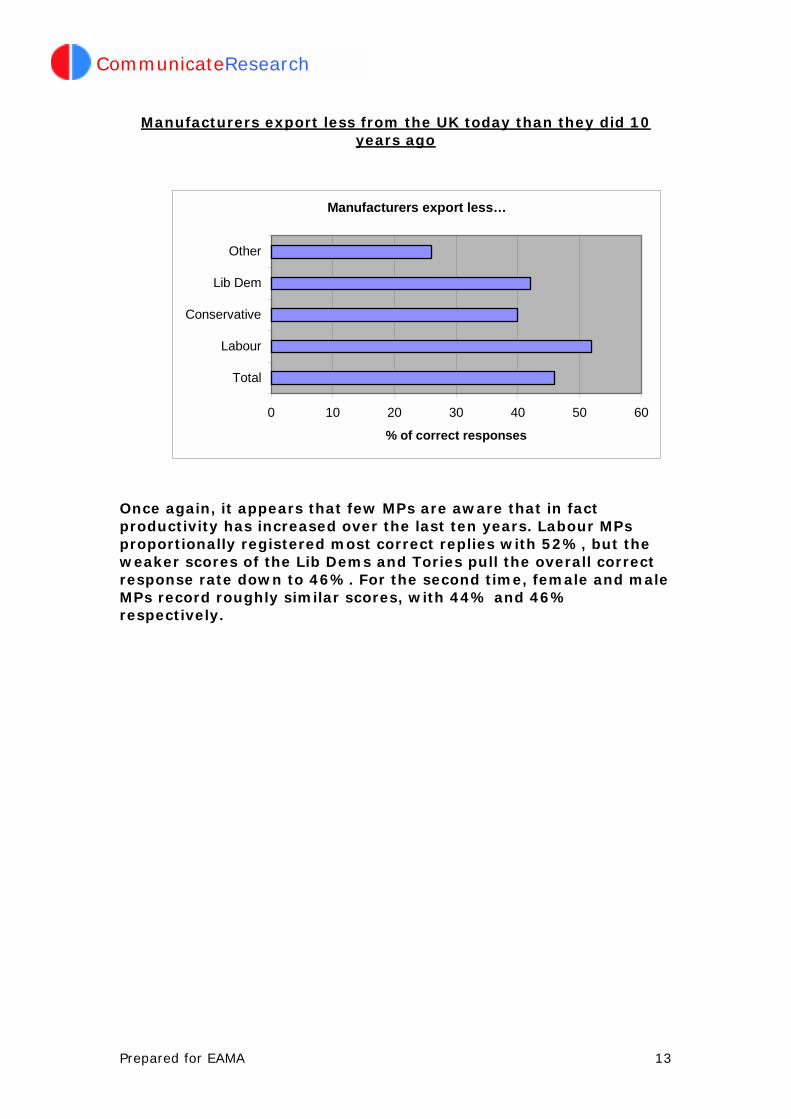
Manufacturers export less from the UK today than they did 10
years ago
Manufacturers export less…
0 10 20 30 40 50 60
Total
Labour
Conservative
Lib Dem
Other
% of correct responses
Once again, it appears that few MPs are aware that in fact productivity has increased over the last ten years. Labour MPs proportionally registered most correct replies with 52%, but the weaker scores of the Lib Dems and Tories pull the overall correct response rate down to 46%. For the second time, female and male MPs record roughly similar scores, with 44% and 46% respectively.

Prepared for EAMA 14
CommunicateResearch
SME manufacturers struggle to cope with all the red tape and
regulation they now have to deal with
SME manufacturers struggle…
0 20 40 60 80 10
Total
Labour
Conservative
Lib Dem
Other
% of correct responses
0
This statement provoked a far more encouraging response than most of the others. 69% of MPs believe, correctly, that SME manufacturers struggle to deal with red tape and regulation. The Conservatives are most decisive, with the 100% success rate perhaps reflecting not only superior awareness of industry conditions but also a predisposition to criticize the Labour Government. This factor would explain too the similarly high Lib Dem response and the comparatively low Labour figure. It is worth noting, however, that despite Labour MPs’ assumed predisposition to defend their government’s policies, over half still believe that SME manufacturers ‘struggle to cope’, indicating scepticism about feasibility of those policies.

Prepared for EAMA 15
CommunicateResearch
Summary: % of total MPs who answered correctly
Manufacturing accounts for >60% of UK exports 39% UK exports more engineering products than it
imports 48%
UK spends a higher proportion of its GDP on investment than many other leading industrialised
countries 65%
UK exports more manufactured goods per head than Japan or the USA
35%
UK manufactured exports have doubled in the past 10 years
31%
UK government has done more for manufacturing in the last four years than any other G8
government N/a
Services earn more for the UK balance of payments than manufactured goods
24%
Manufacturers export less from the UK today than they did 10 years ago
46%
SME manufacturers struggle to cope with all the red tape and regulation they now have to deal with
69%
• In general, MPs’ awareness of issues surrounding the
manufacturing industry is low.
• Only two posed statements provoked any kind of correct consensus- ‘The UK spends a higher proportion of its GDP on investment than many other leading industrialised countries’ and ‘SME manufacturers struggle to cope with all the red tape and regulation they now have to deal with’. These engendered a correct response of 65% and 69% respectively.
• The rest of the questions gain correct responses from
around 31-48% of MPs, which indicates not only a large amount of guesswork, but also that respondents were overall far more likely to guess in favour of the wrong answer.
• The entirely opinion-based statement ‘UK government has
done more for manufacturing in the last four years than any other G8 government’ throws up an interesting response. Predictably enough, zero Conservative or Lib Dem MPs agree, but notably, only 52% of Labour MPs take the chance to endorse their own government by concurring. This means that 48% of Labour MPs are either apathetic about their government’s relationship with the manufacturing industry (9% did not reply) or critical of it (39% answered ‘false’).
Prepared for EAMA 16
CommunicateResearch
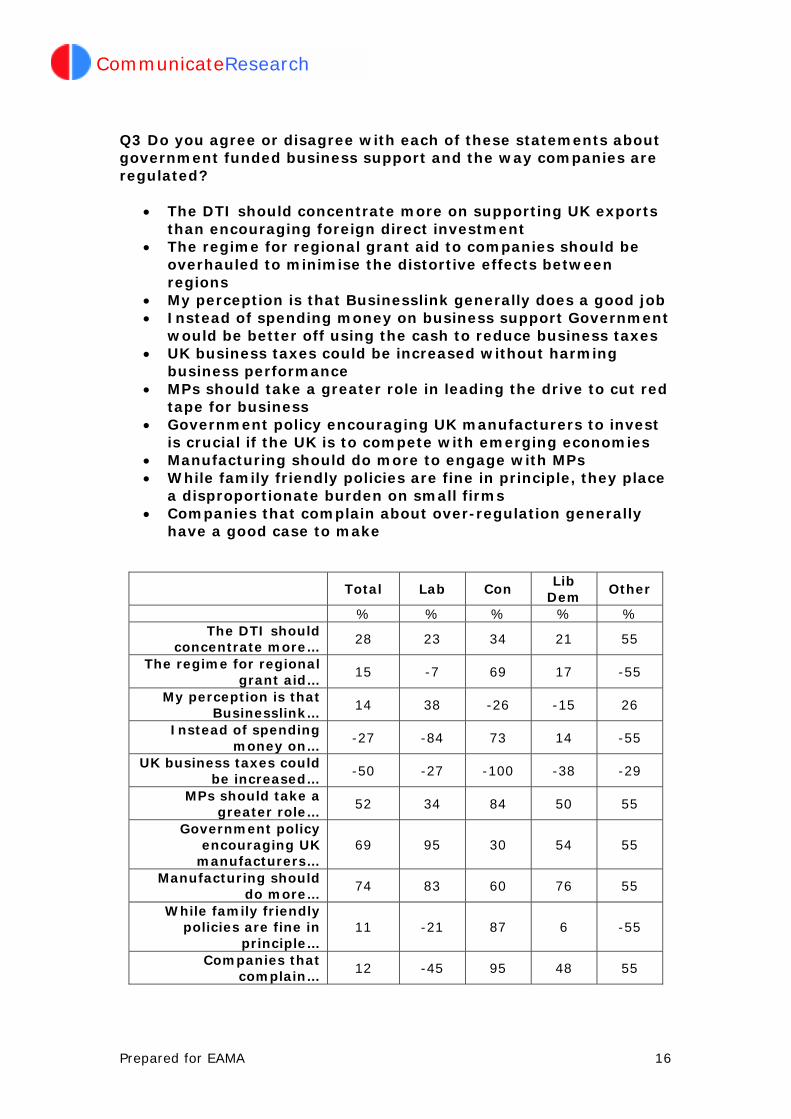
Q3 Do you agree or disagree with each of these statements about government funded business support and the way companies are regulated?
• The DTI should concentrate more on supporting UK exports
than encouraging foreign direct investment • The regime for regional grant aid to companies should be
overhauled to minimise the distortive effects between regions
• My perception is that Businesslink generally does a good job • Instead of spending money on business support Government
would be better off using the cash to reduce business taxes • UK business taxes could be increased without harming
business performance • MPs should take a greater role in leading the drive to cut red
tape for business • Government policy encouraging UK manufacturers to invest
is crucial if the UK is to compete with emerging economies • Manufacturing should do more to engage with MPs • While family friendly policies are fine in principle, they place
a disproportionate burden on small firms • Companies that complain about over-regulation generally
have a good case to make
Total Lab Con
Lib Dem
Other
% % % % % The DTI should
concentrate more… 28 23 34 21 55
The regime for regional grant aid…
15 -7 69 17 -55
My perception is that Businesslink…
14 38 -26 -15 26
Instead of spending money on…
-27 -84 73 14 -55
UK business taxes could be increased…
-50 -27 -100 -38 -29
MPs should take a greater role…
52 34 84 50 55
Government policy encouraging UK
manufacturers… 69 95 30 54 55
Manufacturing should do more…
74 83 60 76 55
While family friendly policies are fine in
principle… 11 -21 87 6 -55
Companies that complain…
12 -45 95 48 55

Prepared for EAMA 17
CommunicateResearch
• Respondents show themselves to be broadly in favour of
supporting UK exports at the expense of encouraging foreign direct investment, with the Conservatives most enthusiastic.
• The Tories also voted overwhelmingly in favour of
overhauling the regime for regional grant aid to companies to minimise the distortive effects between regions, though the other parties were more cautious.
• The Conservatives and Liberal Democrats are sceptical that
Businesslink do a good job, although it gets a comfortable vote of confidence from Labour MPs.
• The Tories are in favour of reducing business taxes at the
expense of business support- so, to a lesser degree, are the Lib Dems- but Labour are extremely sceptical.
• All the parties record a negative score for the proposition
that UK business taxes could be increased without harming business performance, but the Tories lead the way with 100% voting against it.
• All parties record high positive scores for the suggestion
that MPs should take a greater role in leading the drive to cut red tape for business, indicating that in general they are interested in becoming involved in reforming UK business conditions.
• All parties, led by Labour, strongly approve the proposition
that government policy encouraging UK manufacturers to invest is crucial if the UK is to compete with emerging economies.
• Even higher ratings are scored for the statement that
manufacturing should do more to engage with MPs, demonstrating once more the extent of MPs’ potential interest in the sector.
• Labour MPs are comfortably in favour of family-friendly
policies, whereas the Conservatives overwhelmingly feel that they place a disproportionate burden on small firms.
• 95% of Conservative MPs feel that companies complaining
about over-regulation generally have a good case to make, and Lib Dems concur to a more moderate extent, but Labour MPs strongly disagree.

Prepared for EAMA 19
CommunicateResearch
APPENDIX:
FULL DATA

PAR
TY
REG
ION
D
ATE
OF
BIR
TH
MA
RG
INA
LITY
LE
NG
TH O
F SE
RVI
CE
GEN
DER
Scot
Mid
s
1986
Li
b
Lon-
&
&
Pr
e-
1940
-19
50-
0.
1-
10.0
-20
.0-
or
19
87-
1992
-19
97-
Fe-
To
tal
Con
sLa
b D
ems
Oth
er
don
Sout
hW
ales
NI
East
Nor
th19
4019
4919
59
1960
+9.
9%19
.9%
29.9
%30
%+
befo
re19
9119
9620
0020
01+
Mal
e m
ale
U
nwei
ghte
d T
otal
15
4 51
80
20
3
14
39
9 14
42
36
7
63
52
32
52
47
24
31
18
18
20
44
17
137
17
W
eigh
ted
Tot
al
154
46
85
14
9 17
31
9
21
37
38
6 62
54
32
48
44
24
37
17
17
21
45
19
13
7 17
100%
100%
100%
10
0%
100%
10
0%10
0%10
0%10
0%10
0%10
0%10
0%10
0%10
0%
100%
100%
100%
100%
100%
100%
100%
100%
100%
100%
10
0 %
100 %
From
my
own
47
22
17
6 3
4 12
3
3 17
8
2 15
16
14
21
16
5
5 5
3 5
10
5 45
2
care
er b
ackg
roun
d 31
%47
%20
%
41%
29
%
26%
38%
28%
16%
46%
20%
30%
25%
30%
42
%44
%37
%19
%14
%32
%18
%23
%21
%28
%
33%
11
%
Fr
om o
ther
sou
rces
, 31
10
17
4
- 4
9 1
2 8
8 1
13
10
7 6
13
8 4
4 4
6 11
4
28
3 e
g th
e m
edia
20
%22
%20
%
25%
-
21%
28%
10%
9%21
%20
%13
%22
%19
%
21%
12%
29%
34%
10%
21%
21%
28%
25%
19%
20
%
16%
Thro
ugh
Par
liam
enta
ry
28
5 14
2
7 3
1 4
7 4
9 2
8 12
5
6 5
6 11
3
3 6
11
3 24
4
activ
ities
or b
riefin
gs
18%
11%
17%
14
%
71%
16
%3%
42%
32%
12%
24%
30%
14%
22%
17
%12
%11
%26
%28
%17
%20
%27
%24
%14
%
18%
20
%
Fi
rms
or in
divi
dual
s 24
7
16
1 -
4 7
2 4
4 4
- 8
11
5 9
5 3
7 1
2 -
9 7
17
6 in
my
cons
titue
ncy
15%
15%
18%
9%
-
24%
21%
19%
18%
10%
10%
- 13
%20
%
16%
18%
12%
12%
18%
6%13
%-
20%
36%
13
%
37%
Not
sta
ted
25
2 21
1
- 2
3 -
5 4
10
2 17
5
2 7
5 2
11
4 5
5 5
1 22
3
16
%5%
25%
11
%
- 13
%11
%-
24%
11%
26%
27%
27%
9%
5%15
%11
%9%
29%
24%
29%
22%
11%
3%
16%
15
%
PAR
LIA
ME
NTA
RY
PAN
EL
SUR
VEY
- JU
NE
200
5
Q1.
Irre
spec
tive
of h
ow fa
mili
ar y
ou a
re w
ith th
ese
sect
ors,
we
wou
ld li
ke to
ask
you
abo
ut h
ow y
ou h
ave
gain
ed y
our k
now
ledg
e of
BA
NK
ING
& IN
SUR
AN
CE
Mos
t inf
luen
tial
Bas
e: A
ll re
spon
dent
s
Page
1
Pre
pare
d by
: Com
mun
icat
eRes
earc
h Li
mite
d
Fiel
dwor
k: 7
th J
une
- 24t
h Ju
ne 2
005

PAR
TY
REG
ION
D
ATE
OF
BIR
TH
MA
RG
INA
LITY
LE
NG
TH O
F SE
RVI
CE
GEN
DER
Scot
Mid
s
1986
Li
b
Lon-
&
&
Pr
e-
1940
-19
50-
0.
1-
10.0
-20
.0-
or
19
87-
1992
-19
97-
Fe-
To
tal
Con
sLa
b D
ems
Oth
er
don
Sout
hW
ales
NI
East
Nor
th19
4019
4919
59
1960
+9.
9%19
.9%
29.9
%30
%+
befo
re19
9119
9620
0020
01+
Mal
e m
ale
U
nwei
ghte
d T
otal
15
4 51
80
20
3
14
39
9 14
42
36
7
63
52
32
52
47
24
31
18
18
20
44
17
137
17
W
eigh
ted
Tot
al
154
46
85
14
9 17
31
9
21
37
38
6 62
54
32
48
44
24
37
17
17
21
45
19
13
7 17
100%
100%
100%
10
0%
100%
10
0%10
0%10
0%10
0%10
0%10
0%10
0%10
0%10
0%
100%
100%
100%
100%
100%
100%
100%
100%
100%
100%
10
0 %
100 %
From
my
own
42
20
12
8 3
5 13
3
4 13
5
2 12
13
15
21
15
3
3 3
2 4
11
5 41
2
care
er b
ackg
roun
d 27
%42
%14
%
57%
29
%
31%
40%
28%
20%
34%
13%
30%
20%
25%
46
%43
%35
%14
%7%
15%
10%
21%
24%
28%
30
%
9%
Fi
rms
or in
divi
dual
s 29
10
14
3
2 4
7 5
3 4
6 2
10
12
6 10
9
5 5
3 4
4 9
5 20
9
in m
y co
nstit
uenc
y 19
%22
%16
%
18%
26
%
24%
22%
52%
12%
12%
16%
30%
16%
21%
17
%21
%21
%20
%13
%16
%23
%18
%21
%28
%
15%
51
%
Th
roug
h P
arlia
men
tary
27
6
16
1 4
3 2
2 9
7 4
- 9
10
8 5
6 4
13
3 2
1 10
6
25
1 ac
tiviti
es o
r brie
fings
17
%12
%19
%
5%
45%
16
%6%
19%
44%
19%
11%
- 15
%18
%
23%
9%13
%17
%33
%20
%15
%4%
23%
34%
19
%
7%
Fr
om o
ther
sou
rces
, 26
8
17
1 -
3 7
- 1
6 9
1 13
10
3
5 9
7 5
4 4
6 9
- 25
1
eg
the
med
ia
17%
16%
20%
9%
-
16%
21%
- 6%
16%
25%
13%
21%
19%
8%
9%21
%28
%14
%24
%24
%26
%19
%-
18%
5%
Not
sta
ted
30
3 25
1
- 2
3 -
4 7
14
2 18
9
2 8
5 5
12
4 5
6 6
2 25
5
20
%7%
30%
11
%
- 13
%11
%-
18%
19%
36%
27%
29%
17%
5%
17%
11%
21%
32%
24%
29%
31%
13%
10%
19
%
28%
PAR
LIA
ME
NTA
RY
PAN
EL
SUR
VEY
- JU
NE
200
5
Q1.
Irre
spec
tive
of h
ow fa
mili
ar y
ou a
re w
ith th
ese
sect
ors,
we
wou
ld li
ke to
ask
you
abo
ut h
ow y
ou h
ave
gain
ed y
our k
now
ledg
e of
BU
SIN
ESS
SER
VIC
ES
Mos
t inf
luen
tial
Bas
e: A
ll re
spon
dent
s
Page
2
Pre
pare
d by
: Com
mun
icat
eRes
earc
h Li
mite
d
Fiel
dwor
k: 7
th J
une
- 24t
h Ju
ne 2
005
PAR
TY
REG
ION
D
ATE
OF
BIR
TH
MA
RG
INA
LITY
LE
NG
TH O
F SE
RVI
CE
GEN
DER
Scot
Mid
s
1986
Li
b
Lon-
&
&
Pr
e-
1940
-19
50-
0.
1-
10.0
-20
.0-
or
19
87-
1992
-19
97-
Fe-
To
tal
Con
sLa
b D
ems
Oth
er
don
Sout
hW
ales
NI
East
Nor
th19
4019
4919
59
1960
+9.
9%19
.9%
29.9
%30
%+
befo
re19
9119
9620
0020
01+
Mal
e m
ale
U
nwei
ghte
d T
otal
15
4 51
80
20
3
14
39
9 14
42
36
7
63
52
32
52
47
24
31
18
18
20
44
17
137
17
W
eigh
ted
Tot
al
154
46
85
14
9 17
31
9
21
37
38
6 62
54
32
48
44
24
37
17
17
21
45
19
13
7 17
100%
100%
100%
10
0%
100%
10
0%10
0%10
0%10
0%10
0%10
0%10
0%10
0%10
0%
100%
100%
100%
100%
100%
100%
100%
100%
100%
100%
10
0 %
100 %
Firm
s or
indi
vidu
als
40
19
18
3 -
4 13
3
3 9
8 2
14
17
7 17
14
4
5 3
6 3
15
4 32
8
in m
y co
nstit
uenc
y 26
%41
%21
%
23%
-
24%
41%
35%
12%
23%
22%
30%
23%
31%
22
%35
%31
%16
%14
%19
%35
%13
%32
%24
%
24%
43
%
Fr
om o
ther
sou
rces
, 32
10
17
4
- 4
8 -
3 9
7 1
10
9 11
9
11
6 6
4 3
4 10
3
28
4 e
g th
e m
edia
21
%22
%20
%
31%
-
26%
25%
- 16
%24
%18
%13
%17
%18
%
34%
19%
25%
24%
15%
21%
18%
18%
22%
19%
20
%
23%
From
my
own
27
8 16
3
- 1
5 2
3 8
7 1
12
7 6
8 8
4 7
4 2
2 7
4 27
-
care
er b
ackg
roun
d 17
%17
%19
%
19%
-
8%15
%19
%16
%22
%20
%16
%20
%14
%
19%
16%
18%
17%
19%
23%
10%
9%15
%24
%
20%
-
Th
roug
h P
arlia
men
tary
25
6
10
1 9
4 2
4 7
4 3
1 6
13
6 4
7 7
8 2
3 7
8 5
24
1 ac
tiviti
es o
r brie
fings
17
%12
%12
%
5%
100%
24
%8%
45%
33%
12%
9%14
%10
%24
%
18%
8%15
%30
%20
%13
%15
%33
%17
%26
%
18%
8%
Not
sta
ted
30
4 23
3
- 3
3 -
5 7
12
2 19
7
3 11
4
3 12
4
4 6
6 1
26
5
20%
9%27
%
22%
-
18%
11%
- 24
%19
%31
%27
%30
%14
%
8%22
%10
%13
%32
%24
%22
%27
%13
%7%
19
%
27%
PAR
LIA
ME
NTA
RY
PAN
EL
SUR
VEY
- JU
NE
200
5
Q1.
Irre
spec
tive
of h
ow fa
mili
ar y
ou a
re w
ith th
ese
sect
ors,
we
wou
ld li
ke to
ask
you
abo
ut h
ow y
ou h
ave
gain
ed y
our k
now
ledg
e of
CO
NST
RU
CTI
ON
Mos
t inf
luen
tial
Bas
e: A
ll re
spon
dent
s
Page
3
Pre
pare
d by
: Com
mun
icat
eRes
earc
h Li
mite
d
Fiel
dwor
k: 7
th J
une
- 24t
h Ju
ne 2
005

PAR
TY
REG
ION
D
ATE
OF
BIR
TH
MA
RG
INA
LITY
LE
NG
TH O
F SE
RVI
CE
GEN
DER
Scot
Mid
s
1986
Li
b
Lon-
&
&
Pr
e-
1940
-19
50-
0.
1-
10.0
-20
.0-
or
19
87-
1992
-19
97-
Fe-
To
tal
Con
sLa
b D
ems
Oth
er
don
Sout
hW
ales
NI
East
Nor
th19
4019
4919
59
1960
+9.
9%19
.9%
29.9
%30
%+
befo
re19
9119
9620
0020
01+
Mal
e m
ale
U
nwei
ghte
d T
otal
15
4 51
80
20
3
14
39
9 14
42
36
7
63
52
32
52
47
24
31
18
18
20
44
17
137
17
W
eigh
ted
Tot
al
154
46
85
14
9 17
31
9
21
37
38
6 62
54
32
48
44
24
37
17
17
21
45
19
13
7 17
100%
100%
100%
10
0%
100%
10
0%10
0%10
0%10
0%10
0%10
0%10
0%10
0%10
0%
100%
100%
100%
100%
100%
100%
100%
100%
100%
100%
10
0 %
100 %
Firm
s or
indi
vidu
als
55
19
27
5 5
7 15
6
5 12
11
1
19
24
11
18
19
10
9 5
6 9
15
9 48
7
in m
y co
nstit
uenc
y 36
%40
%32
%
33%
55
%
40%
46%
65%
22%
31%
30%
16%
32%
44%
34
%37
%43
%39
%23
%29
%34
%43
%32
%50
%
35%
41
%
Fr
om m
y ow
n 25
10
14
1
- 1
6 2
1 7
7 2
10
7 7
10
7 4
4 2
3 1
8 3
25
- ca
reer
bac
kgro
und
16%
22%
16%
9%
-
8%18
%26
%6%
20%
18%
31%
15%
13%
21
%20
%16
%16
%11
%14
%21
%5%
17%
16%
18
%
-
From
oth
er s
ourc
es,
24
8 12
4
- 4
5 1
3 5
5 2
10
6 7
6 8
5 5
4 2
2 8
3 22
2
eg
the
med
ia
16%
17%
14%
27
%
- 26
%17
%9%
16%
14%
12%
27%
16%
11%
20
%13
%17
%22
%12
%21
%12
%9%
17%
14%
16
%
11%
Thro
ugh
Par
liam
enta
ry
23
6 11
1
4 1
2 -
8 7
4 -
7 10
6
5 5
3 10
3
1 5
10
3 19
4
activ
ities
or b
riefin
gs
15%
14%
13%
9%
45
%
8%8%
- 38
%19
%10
%-
11%
18%
19
%10
%11
%14
%26
%16
%5%
22%
22%
14%
14
%
21%
Not
sta
ted
27
3 21
3
- 3
3 -
4 6
11
2 17
7
2 10
6
2 10
3
5 4
5 1
23
5
18%
7%25
%
22%
-
18%
11%
- 18
%16
%29
%27
%27
%14
%
5%20
%13
%9%
26%
19%
29%
21%
11%
7%
17%
27
%
PAR
LIA
ME
NTA
RY
PAN
EL
SUR
VEY
- JU
NE
200
5
Q1.
Irre
spec
tive
of h
ow fa
mili
ar y
ou a
re w
ith th
ese
sect
ors,
we
wou
ld li
ke to
ask
you
abo
ut h
ow y
ou h
ave
gain
ed y
our k
now
ledg
e of
MA
NU
FAC
TUR
ING
Mos
t inf
luen
tial
Bas
e: A
ll re
spon
dent
s
Page
4
Pre
pare
d by
: Com
mun
icat
eRes
earc
h Li
mite
d
Fiel
dwor
k: 7
th J
une
- 24t
h Ju
ne 2
005

PAR
TY
REG
ION
D
ATE
OF
BIR
TH
MA
RG
INA
LITY
LE
NG
TH O
F SE
RVI
CE
GEN
DER
Scot
Mid
s
1986
Li
b
Lon-
&
&
Pr
e-
1940
-19
50-
0.
1-
10.0
-20
.0-
or
19
87-
1992
-19
97-
Fe-
To
tal
Con
sLa
b D
ems
Oth
er
don
Sout
hW
ales
NI
East
Nor
th19
4019
4919
59
1960
+9.
9%19
.9%
29.9
%30
%+
befo
re19
9119
9620
0020
01+
Mal
e m
ale
U
nwei
ghte
d T
otal
15
4 51
80
20
3
14
39
9 14
42
36
7
63
52
32
52
47
24
31
18
18
20
44
17
137
17
W
eigh
ted
Tot
al
154
46
85
14
9 17
31
9
21
37
38
6 62
54
32
48
44
24
37
17
17
21
45
19
13
7 17
100%
100%
100%
10
0%
100%
10
0%10
0%10
0%10
0%10
0%10
0%10
0%10
0%10
0%
100%
100%
100%
100%
100%
100%
100%
100%
100%
100%
10
0 %
100 %
Thro
ugh
Par
liam
enta
ry
44
12
25
5 2
7 6
3 6
9 13
1
15
25
3 12
11
8
13
5 6
7 14
6
38
6 ac
tiviti
es o
r brie
fings
29
%26
%29
%
33%
26
%
40%
20%
33%
28%
24%
35%
16%
24%
47%
9%
24%
25%
34%
35%
29%
35%
36%
30%
31%
28
%
33%
From
oth
er s
ourc
es,
29
11
14
3 -
2 7
3 3
12
2 1
10
6 12
12
9
4 3
4 -
3 8
3 27
2
eg
the
med
ia
19%
25%
17%
25
%
- 13
%22
%28
%16
%31
%6%
13%
17%
11%
36
%26
%20
%17
%9%
25%
- 13
%18
%17
%
20%
9%
From
my
own
26
9 11
2
4 2
8 2
4 6
4 2
8 6
10
7 10
4
5 1
3 2
13
2 24
2
care
er b
ackg
roun
d 17
%20
%13
%
11%
45
%
13%
27%
19%
20%
15%
10%
28%
13%
11%
31
%14
%23
%18
%13
%5%
16%
9%29
%10
%
18%
10
%
Fi
rms
or in
divi
dual
s 25
11
10
1
3 3
7 2
4 4
5 1
11
9 5
9 8
4 4
3 4
4 3
6 20
5
in m
y co
nstit
uenc
y 16
%24
%12
%
5%
29%
16
%21
%19
%19
%11
%14
%16
%17
%16
%
14%
18%
18%
17%
11%
16%
21%
22%
7%31
%
15%
26
%
N
ot s
tate
d 30
3
24
4 -
3 3
- 4
7 14
2
18
8 3
9 6
3 12
4
5 4
7 2
27
4
20%
5%29
%
26%
-
18%
10%
- 18
%18
%36
%27
%29
%15
%
9%18
%14
%13
%32
%24
%29
%21
%16
%10
%
19%
22
%
PAR
LIA
ME
NTA
RY
PAN
EL
SUR
VEY
- JU
NE
200
5
Q1.
Irre
spec
tive
of h
ow fa
mili
ar y
ou a
re w
ith th
ese
sect
ors,
we
wou
ld li
ke to
ask
you
abo
ut h
ow y
ou h
ave
gain
ed y
our k
now
ledg
e of
PH
ARM
AC
EUTI
CA
LS
Mos
t inf
luen
tial
Bas
e: A
ll re
spon
dent
s
Page
5
Pre
pare
d by
: Com
mun
icat
eRes
earc
h Li
mite
d
Fiel
dwor
k: 7
th J
une
- 24t
h Ju
ne 2
005

PAR
TY
REG
ION
D
ATE
OF
BIR
TH
MA
RG
INA
LITY
LE
NG
TH O
F SE
RVI
CE
GEN
DER
Scot
Mid
s
1986
Li
b
Lon-
&
&
Pr
e-
1940
-19
50-
0.
1-
10.0
-20
.0-
or
19
87-
1992
-19
97-
Fe-
To
tal
Con
sLa
b D
ems
Oth
er
don
Sout
hW
ales
NI
East
Nor
th19
4019
4919
59
1960
+9.
9%19
.9%
29.9
%30
%+
befo
re19
9119
9620
0020
01+
Mal
e m
ale
U
nwei
ghte
d T
otal
15
4 51
80
20
3
14
39
9 14
42
36
7
63
52
32
52
47
24
31
18
18
20
44
17
137
17
W
eigh
ted
Tot
al
154
46
85
14
9 17
31
9
21
37
38
6 62
54
32
48
44
24
37
17
17
21
45
19
13
7 17
100%
100%
100%
10
0%
100%
10
0%10
0%10
0%10
0%10
0%10
0%10
0%10
0%10
0%
100%
100%
100%
100%
100%
100%
100%
100%
100%
100%
10
0 %
100 %
Firm
s or
indi
vidu
als
51
13
26
7 5
5 13
6
3 12
12
1
20
21
9 17
18
9
8 5
5 7
17
9 42
10
in
my
cons
titue
ncy
33%
29%
30%
53
%
55%
29
%43
%62
%13
%33
%32
%13
%32
%40
%
29%
35%
40%
36%
22%
27%
27%
34%
37%
49%
31
%
55%
From
my
own
31
14
11
2 4
4 7
- 7
7 6
1 8
10
12
11
7 6
8 3
4 2
9 2
30
2 ca
reer
bac
kgro
und
20%
29%
13%
16
%
45%
21
%24
%-
35%
18%
16%
13%
13%
19%
37
%23
%16
%23
%20
%15
%24
%9%
19%
12%
22
%
9%
Fr
om o
ther
sou
rces
, 30
10
17
3
- 5
6 3
5 9
4 1
11
9 9
6 11
7
6 3
3 4
10
6 29
1
eg
the
med
ia
20%
22%
20%
21
%
- 29
%18
%28
%22
%23
%11
%14
%18
%18
%
28%
13%
26%
27%
16%
16%
15%
20%
21%
30%
21
%
7%
Th
roug
h P
arlia
men
tary
12
6
6 -
- 1
2 1
1 3
4 1
4 7
- 5
3 -
4 3
1 1
5 1
11
1 ac
tiviti
es o
r brie
fings
8%
12%
7%
- -
8%6%
10%
6%7%
11%
16%
7%13
%
- 10
%7%
- 11
%19
%5%
4%12
%5%
8%
7%
Not
sta
ted
29
3 24
1
- 2
3 -
5 7
11
3 19
6
2 9
5 3
12
4 5
7 5
1 25
4
19
%7%
28%
11
%
- 13
%11
%-
24%
19%
29%
43%
31%
10%
5%
19%
11%
13%
32%
24%
29%
32%
11%
3%
18%
22
%
PAR
LIA
ME
NTA
RY
PAN
EL
SUR
VEY
- JU
NE
200
5
Q1.
Irre
spec
tive
of h
ow fa
mili
ar y
ou a
re w
ith th
ese
sect
ors,
we
wou
ld li
ke to
ask
you
abo
ut h
ow y
ou h
ave
gain
ed y
our k
now
ledg
e of
RET
AILI
NG
Mos
t inf
luen
tial
Bas
e: A
ll re
spon
dent
s
Page
6
Pre
pare
d by
: Com
mun
icat
eRes
earc
h Li
mite
d
Fiel
dwor
k: 7
th J
une
- 24t
h Ju
ne 2
005

PAR
TY
REG
ION
D
ATE
OF
BIR
TH
MA
RG
INA
LITY
LE
NG
TH O
F SE
RVI
CE
GEN
DER
Scot
Mid
s
1986
Li
b
Lon-
&
&
Pr
e-
1940
-19
50-
0.
1-
10.0
-20
.0-
or
19
87-
1992
-19
97-
Fe-
To
tal
Con
sLa
b D
ems
Oth
er
don
Sout
hW
ales
NI
East
Nor
th19
4019
4919
59
1960
+9.
9%19
.9%
29.9
%30
%+
befo
re19
9119
9620
0020
01+
Mal
e m
ale
U
nwei
ghte
d T
otal
15
4 51
80
20
3
14
39
9 14
42
36
7
63
52
32
52
47
24
31
18
18
20
44
17
137
17
W
eigh
ted
Tot
al
154
46
85
14
9 17
31
9
21
37
38
6 62
54
32
48
44
24
37
17
17
21
45
19
13
7 17
100%
100%
100%
10
0%
100%
10
0%10
0%10
0%10
0%10
0%10
0%10
0%10
0%10
0%
100%
100%
100%
100%
100%
100%
100%
100%
100%
100%
10
0 %
100 %
From
oth
er s
ourc
es,
50
17
29
4 -
8 9
3 3
15
13
3 18
18
12
17
14
9
10
3 4
5 17
5
44
6 e
g th
e m
edia
32
%37
%34
%
30%
-
45%
27%
28%
16%
39%
35%
44%
29%
33%
37
%35
%32
%35
%27
%18
%23
%24
%38
%29
%
32%
35
%
Fi
rms
or in
divi
dual
s 44
15
17
5
7 4
10
5 7
9 10
3
17
15
9 10
15
9
10
8 4
8 15
4
42
2 in
my
cons
titue
ncy
28%
32%
20%
39
%
71%
21
%31
%52
%32
%23
%28
%43
%28
%27
%
28%
20%
33%
37%
27%
45%
26%
39%
34%
20%
31
%
12%
Thro
ugh
Par
liam
enta
ry
22
4 15
-
3 1
4 2
5 4
5 -
6 14
3
6 7
2 8
2 1
2 6
7 20
3
activ
ities
or b
riefin
gs
15%
9%18
%
- 29
%
8%14
%19
%25
%12
%14
%-
9%27
%
8%12
%15
%7%
22%
13%
8%8%
13%
40%
14
%
15%
From
my
own
12
6 4
2 -
- 7
- 2
2 1
- 4
2 6
6 3
2 1
1 2
1 4
1 9
3 ca
reer
bac
kgro
und
8%13
%5%
15
%
- -
23%
- 9%
5%3%
- 7%
3%
19%
12%
8%7%
3%5%
10%
7%8%
7%
7%
16%
Not
sta
ted
26
4 19
2
- 4
2 -
4 8
8 1
17
6 3
10
5 3
8 3
6 4
3 1
22
4
17%
9%23
%
17%
-
26%
5%-
18%
21%
21%
13%
27%
10%
8%
21%
11%
13%
21%
19%
33%
21%
7%3%
16
%
22%
PAR
LIA
ME
NTA
RY
PAN
EL
SUR
VEY
- JU
NE
200
5
Q1.
Irre
spec
tive
of h
ow fa
mili
ar y
ou a
re w
ith th
ese
sect
ors,
we
wou
ld li
ke to
ask
you
abo
ut h
ow y
ou h
ave
gain
ed y
our k
now
ledg
e of
BA
NK
ING
& IN
SUR
AN
CE
2nd
mos
t inf
luen
tial
Bas
e: A
ll re
spon
dent
s
Page
7
Pre
pare
d by
: Com
mun
icat
eRes
earc
h Li
mite
d
Fiel
dwor
k: 7
th J
une
- 24t
h Ju
ne 2
005

PAR
TY
REG
ION
D
ATE
OF
BIR
TH
MA
RG
INA
LITY
LE
NG
TH O
F SE
RVI
CE
GEN
DER
Scot
Mid
s
1986
Li
b
Lon-
&
&
Pr
e-
1940
-19
50-
0.
1-
10.0
-20
.0-
or
19
87-
1992
-19
97-
Fe-
To
tal
Con
sLa
b D
ems
Oth
er
don
Sout
hW
ales
NI
East
Nor
th19
4019
4919
59
1960
+9.
9%19
.9%
29.9
%30
%+
befo
re19
9119
9620
0020
01+
Mal
e m
ale
U
nwei
ghte
d T
otal
15
4 51
80
20
3
14
39
9 14
42
36
7
63
52
32
52
47
24
31
18
18
20
44
17
137
17
W
eigh
ted
Tot
al
154
46
85
14
9 17
31
9
21
37
38
6 62
54
32
48
44
24
37
17
17
21
45
19
13
7 17
100%
100%
100%
10
0%
100%
10
0%10
0%10
0%10
0%10
0%10
0%10
0%10
0%10
0%
100%
100%
100%
100%
100%
100%
100%
100%
100%
100%
10
0 %
100 %
Firm
s or
indi
vidu
als
43
9 24
5
4 5
10
2 7
8 11
2
18
16
7 11
12
7
13
4 4
4 17
5
42
1 in
my
cons
titue
ncy
28%
20%
29%
34
%
45%
29
%33
%19
%32
%22
%28
%27
%29
%30
%
22%
22%
28%
30%
34%
25%
21%
20%
38%
26%
31
%
5%
Th
roug
h P
arlia
men
tary
39
10
22
1
5 1
7 5
5 9
11
3 9
21
6 11
10
7
11
4 4
7 12
6
35
4 ac
tiviti
es o
r brie
fings
25
%22
%26
%
9%
55%
8%
24%
55%
25%
24%
29%
47%
14%
40%
17
%24
%22
%28
%29
%23
%23
%36
%26
%31
%
26%
22
%
Fr
om o
ther
sou
rces
, 29
15
10
3
- 5
5 2
3 8
6 1
9 6
13
12
11
3 3
3 3
- 6
5 24
5
eg
the
med
ia
19%
33%
12%
21
%
- 29
%15
%19
%13
%22
%17
%13
%14
%11
%
40%
25%
26%
11%
7%19
%17
%-
13%
30%
17
%
28%
From
my
own
13
6 5
2 -
- 7
1 1
3 -
- 5
3 4
3 6
2 1
2 1
1 4
2 10
3
care
er b
ackg
roun
d 8%
13%
6%
14%
-
- 23
%7%
6%9%
- -
8%6%
14
%6%
13%
9%3%
14%
5%4%
9%10
%
7%
17%
Not
sta
ted
31
5 23
3
- 6
2 -
5 9
10
1 21
7
2 11
5
5 10
3
6 8
6 1
26
5
20%
11%
27%
22
%
- 34
%5%
- 24
%23
%26
%13
%35
%12
%
7%23
%11
%21
%27
%19
%33
%41
%14
%3%
19
%
28%
PAR
LIA
ME
NTA
RY
PAN
EL
SUR
VEY
- JU
NE
200
5
Q1.
Irre
spec
tive
of h
ow fa
mili
ar y
ou a
re w
ith th
ese
sect
ors,
we
wou
ld li
ke to
ask
you
abo
ut h
ow y
ou h
ave
gain
ed y
our k
now
ledg
e of
BU
SIN
ESS
SER
VIC
ES
2nd
mos
t inf
luen
tial
Bas
e: A
ll re
spon
dent
s
Page
8
Pre
pare
d by
: Com
mun
icat
eRes
earc
h Li
mite
d
Fiel
dwor
k: 7
th J
une
- 24t
h Ju
ne 2
005

PAR
TY
REG
ION
D
ATE
OF
BIR
TH
MA
RG
INA
LITY
LE
NG
TH O
F SE
RVI
CE
GEN
DER
Scot
Mid
s
1986
Li
b
Lon-
&
&
Pr
e-
1940
-19
50-
0.
1-
10.0
-20
.0-
or
19
87-
1992
-19
97-
Fe-
To
tal
Con
sLa
b D
ems
Oth
er
don
Sout
hW
ales
NI
East
Nor
th19
4019
4919
59
1960
+9.
9%19
.9%
29.9
%30
%+
befo
re19
9119
9620
0020
01+
Mal
e m
ale
U
nwei
ghte
d T
otal
15
4 51
80
20
3
14
39
9 14
42
36
7
63
52
32
52
47
24
31
18
18
20
44
17
137
17
W
eigh
ted
Tot
al
154
46
85
14
9 17
31
9
21
37
38
6 62
54
32
48
44
24
37
17
17
21
45
19
13
7 17
100%
100%
100%
10
0%
100%
10
0%10
0%10
0%10
0%10
0%10
0%10
0%10
0%10
0%
100%
100%
100%
100%
100%
100%
100%
100%
100%
100%
10
0 %
100 %
Firm
s or
indi
vidu
als
40
13
19
6 3
4 9
3 6
12
6 3
14
16
7 14
13
8
6 3
3 6
10
7 38
2
in m
y co
nstit
uenc
y 26
%27
%22
%
45%
29
%
26%
27%
29%
28%
33%
16%
44%
23%
31%
21
%29
%29
%31
%15
%19
%20
%28
%23
%37
%
28%
13
%
Th
roug
h P
arlia
men
tary
38
10
26
3
- 4
9 2
5 9
9 1
14
16
7 12
11
5
10
4 3
2 16
5
32
6 ac
tiviti
es o
r brie
fings
25
%21
%30
%
18%
-
24%
29%
25%
24%
23%
23%
16%
22%
30%
22
%26
%24
%22
%26
%26
%18
%9%
35%
25%
24
%
32%
From
oth
er s
ourc
es,
26
12
13
1 -
4 7
1 1
6 7
1 11
11
4
6 10
4
6 5
2 3
9 3
21
5 e
g th
e m
edia
17
%27
%15
%
9%
- 24
%23
%10
%6%
17%
17%
13%
17%
20%
13
%13
%23
%17
%16
%26
%13
%16
%20
%18
%
16%
28
%
Fr
om m
y ow
n 21
7
6 2
7 1
3 3
5 3
6 -
4 6
10
5 4
4 7
2 2
6 5
2 18
3
care
er b
ackg
roun
d 14
%14
%7%
11
%
71%
5%
11%
36%
23%
8%15
%-
7%12
%
31%
11%
9%17
%20
%10
%10
%27
%11
%10
%
13%
15
%
N
ot s
tate
d 29
5
21
2 -
4 3
- 4
7 11
2
19
4 4
10
6 3
9 3
7 4
5 2
27
2
19%
11%
25%
16
%
- 21
%10
%-
18%
19%
30%
27%
31%
8%
13%
22%
14%
13%
24%
19%
40%
20%
12%
10%
20
%
11%
PAR
LIA
ME
NTA
RY
PAN
EL
SUR
VEY
- JU
NE
200
5
Q1.
Irre
spec
tive
of h
ow fa
mili
ar y
ou a
re w
ith th
ese
sect
ors,
we
wou
ld li
ke to
ask
you
abo
ut h
ow y
ou h
ave
gain
ed y
our k
now
ledg
e of
CO
NST
RU
CTI
ON
2nd
mos
t inf
luen
tial
Bas
e: A
ll re
spon
dent
s
Page
9
Pre
pare
d by
: Com
mun
icat
eRes
earc
h Li
mite
d
Fiel
dwor
k: 7
th J
une
- 24t
h Ju
ne 2
005
PAR
TY
REG
ION
D
ATE
OF
BIR
TH
MA
RG
INA
LITY
LE
NG
TH O
F SE
RVI
CE
GEN
DER
Scot
Mid
s
1986
Li
b
Lon-
&
&
Pr
e-
1940
-19
50-
0.
1-
10.0
-20
.0-
or
19
87-
1992
-19
97-
Fe-
To
tal
Con
sLa
b D
ems
Oth
er
don
Sout
hW
ales
NI
East
Nor
th19
4019
4919
59
1960
+9.
9%19
.9%
29.9
%30
%+
befo
re19
9119
9620
0020
01+
Mal
e m
ale
U
nwei
ghte
d T
otal
15
4 51
80
20
3
14
39
9 14
42
36
7
63
52
32
52
47
24
31
18
18
20
44
17
137
17
W
eigh
ted
Tot
al
154
46
85
14
9 17
31
9
21
37
38
6 62
54
32
48
44
24
37
17
17
21
45
19
13
7 17
100%
100%
100%
10
0%
100%
10
0%10
0%10
0%10
0%10
0%10
0%10
0%10
0%10
0%
100%
100%
100%
100%
100%
100%
100%
100%
100%
100%
10
0 %
100 %
Thro
ugh
Par
liam
enta
ry
38
6 22
4
5 4
7 7
7 6
6 3
10
18
8 11
11
6
9 3
3 4
11
8 34
3
activ
ities
or b
riefin
gs
24%
13%
26%
30
%
55%
21
%24
%74
%34
%17
%16
%44
%16
%33
%
23%
24%
26%
23%
25%
18%
20%
19%
25%
41%
25
%
20%
Firm
s or
indi
vidu
als
37
14
20
3 -
3 8
2 3
12
10
3 14
14
7
12
10
8 7
5 5
4 10
5
34
3 in
my
cons
titue
ncy
24%
31%
24%
19
%
- 16
%26
%17
%16
%31
%26
%43
%22
%26
%
22%
25%
23%
33%
18%
26%
29%
19%
22%
24%
25
%
19%
From
oth
er s
ourc
es,
36
15
15
2 4
4 7
- 4
11
10
- 12
11
13
9
13
5 9
4 2
6 13
4
31
5 e
g th
e m
edia
23
%32
%18
%
14%
45
%
24%
22%
- 20
%29
%26
%-
20%
21%
40
%19
%30
%19
%25
%26
%13
%27
%28
%23
%
23%
30
%
Fr
om m
y ow
n 15
6
7 3
- 2
6 1
1 3
2 -
6 6
3 6
4 3
2 2
1 1
7 2
14
1 ca
reer
bac
kgro
und
10%
12%
8%
20%
-
13%
19%
10%
6%7%
5%-
10%
10%
10
%12
%10
%12
%6%
10%
5%4%
15%
8%
10%
5%
Not
sta
ted
28
5 21
2
- 4
3 -
5 6
10
1 20
5
2 10
5
3 10
3
6 6
4 1
23
5
18%
11%
24%
17
%
- 26
%8%
- 24
%16
%26
%13
%33
%10
%
5%20
%11
%13
%27
%19
%33
%31
%10
%3%
17
%
27%
PAR
LIA
ME
NTA
RY
PAN
EL
SUR
VEY
- JU
NE
200
5
Q1.
Irre
spec
tive
of h
ow fa
mili
ar y
ou a
re w
ith th
ese
sect
ors,
we
wou
ld li
ke to
ask
you
abo
ut h
ow y
ou h
ave
gain
ed y
our k
now
ledg
e of
MA
NU
FAC
TUR
ING
2nd
mos
t inf
luen
tial
Bas
e: A
ll re
spon
dent
s
Page
10
P
repa
red
by: C
omm
unic
ateR
esea
rch
Lim
ited
Fi
eldw
ork:
7th
Jun
e - 2
4th
June
200
5

PAR
TY
REG
ION
D
ATE
OF
BIR
TH
MA
RG
INA
LITY
LE
NG
TH O
F SE
RVI
CE
GEN
DER
Scot
Mid
s
1986
Li
b
Lon-
&
&
Pr
e-
1940
-19
50-
0.
1-
10.0
-20
.0-
or
19
87-
1992
-19
97-
Fe-
To
tal
Con
sLa
b D
ems
Oth
er
don
Sout
hW
ales
NI
East
Nor
th19
4019
4919
59
1960
+9.
9%19
.9%
29.9
%30
%+
befo
re19
9119
9620
0020
01+
Mal
e m
ale
U
nwei
ghte
d T
otal
15
4 51
80
20
3
14
39
9 14
42
36
7
63
52
32
52
47
24
31
18
18
20
44
17
137
17
W
eigh
ted
Tot
al
154
46
85
14
9 17
31
9
21
37
38
6 62
54
32
48
44
24
37
17
17
21
45
19
13
7 17
100%
100%
100%
10
0%
100%
10
0%10
0%10
0%10
0%10
0%10
0%10
0%10
0%10
0%
100%
100%
100%
100%
100%
100%
100%
100%
100%
100%
10
0 %
100 %
Thro
ugh
Par
liam
enta
ry
44
16
21
5 3
5 13
4
6 11
5
3 16
16
10
13
20
4
7 6
3 4
14
7 37
8
activ
ities
or b
riefin
gs
29%
35%
25%
33
%
29%
31
%43
%38
%28
%29
%15
%42
%27
%29
%
30%
27%
46%
17%
19%
33%
16%
22%
30%
36%
27
%
46%
From
oth
er s
ourc
es,
39
12
25
2 -
7 5
1 3
12
11
1 13
20
5
12
12
6 8
3 6
4 15
2
36
3 e
g th
e m
edia
25
%26
%29
%
15%
-
40%
15%
10%
16%
31%
30%
14%
22%
36%
16
%25
%28
%26
%22
%16
%35
%19
%32
%13
%
26%
18
%
Fi
rms
or in
divi
dual
s 34
10
16
4
4 1
8 2
7 7
9 2
10
10
12
8 7
7 12
5
2 5
11
6 31
3
in m
y co
nstit
uenc
y 22
%21
%19
%
28%
45
%
8%27
%19
%32
%19
%23
%30
%16
%19
%
37%
17%
17%
27%
31%
27%
10%
22%
25%
34%
22
%
20%
From
my
own
11
4 3
1 2
- 3
3 1
- 3
- 5
2 3
6 -
3 1
1 1
2 1
3 11
-
care
er b
ackg
roun
d 7%
8%4%
9%
26
%
- 11
%33
%6%
- 8%
- 8%
4%
10%
13%
- 13
%3%
5%5%
11%
2%14
%
8%
-
Not
sta
ted
26
4 19
2
- 4
2 -
4 8
9 1
17
6 2
9 4
4 9
3 6
5 5
1 23
3
17
%10
%23
%
16%
-
21%
5%-
18%
21%
24%
13%
27%
11%
7%
18%
9%17
%24
%19
%33
%26
%11
%3%
17
%
17%
PAR
LIA
ME
NTA
RY
PAN
EL
SUR
VEY
- JU
NE
200
5
Q1.
Irre
spec
tive
of h
ow fa
mili
ar y
ou a
re w
ith th
ese
sect
ors,
we
wou
ld li
ke to
ask
you
abo
ut h
ow y
ou h
ave
gain
ed y
our k
now
ledg
e of
PH
ARM
AC
EUTI
CA
LS
2nd
mos
t inf
luen
tial
Bas
e: A
ll re
spon
dent
s
Page
11
P
repa
red
by: C
omm
unic
ateR
esea
rch
Lim
ited
Fi
eldw
ork:
7th
Jun
e - 2
4th
June
200
5

PAR
TY
REG
ION
D
ATE
OF
BIR
TH
MA
RG
INA
LITY
LE
NG
TH O
F SE
RVI
CE
GEN
DER
Scot
Mid
s
1986
Li
b
Lon-
&
&
Pr
e-
1940
-19
50-
0.
1-
10.0
-20
.0-
or
19
87-
1992
-19
97-
Fe-
To
tal
Con
sLa
b D
ems
Oth
er
don
Sout
hW
ales
NI
East
Nor
th19
4019
4919
59
1960
+9.
9%19
.9%
29.9
%30
%+
befo
re19
9119
9620
0020
01+
Mal
e m
ale
U
nwei
ghte
d T
otal
15
4 51
80
20
3
14
39
9 14
42
36
7
63
52
32
52
47
24
31
18
18
20
44
17
137
17
W
eigh
ted
Tot
al
154
46
85
14
9 17
31
9
21
37
38
6 62
54
32
48
44
24
37
17
17
21
45
19
13
7 17
100%
100%
100%
10
0%
100%
10
0%10
0%10
0%10
0%10
0%10
0%10
0%10
0%10
0%
100%
100%
100%
100%
100%
100%
100%
100%
100%
100%
10
0 %
100 %
Thro
ugh
Par
liam
enta
ry
42
10
22
3 7
4 8
4 8
9 8
1 16
15
10
10
14
6
13
3 4
7 15
7
38
4 ac
tiviti
es o
r brie
fings
27
%22
%26
%
19%
74
%
24%
25%
46%
39%
24%
22%
14%
25%
28%
32
%21
%31
%24
%34
%16
%25
%35
%34
%40
%
28%
21
%
Fi
rms
or in
divi
dual
s 40
14
23
3
- 4
9 2
5 7
13
3 13
17
8
13
11
5 11
5
4 3
14
4 37
3
in m
y co
nstit
uenc
y 26
%31
%27
%
22%
-
26%
29%
19%
24%
18%
35%
43%
21%
31%
24
%27
%25
%21
%29
%31
%24
%14
%30
%21
%
27%
17
%
Fr
om o
ther
sou
rces
, 31
13
12
5
- 5
8 -
1 9
8 1
11
10
8 12
11
5
3 5
2 2
7 4
25
6 e
g th
e m
edia
20
%28
%15
%
39%
-
29%
24%
- 3%
25%
21%
13%
18%
19%
26
%25
%26
%20
%7%
29%
13%
9%16
%21
%
18%
33
%
Fr
om m
y ow
n 18
5
9 1
2 1
5 3
3 5
- -
7 8
3 4
5 6
3 1
1 3
7 3
15
2 ca
reer
bac
kgro
und
11%
11%
11%
5%
26
%
8%16
%35
%16
%12
%-
- 11
%14
%
11%
9%12
%23
%7%
5%5%
16%
15%
14%
11
%
12%
Not
sta
ted
24
4 18
2
- 2
2 -
4 8
8 2
16
4 2
9 3
3 9
3 6
5 3
1 21
3
15
%8%
21%
16
%
- 13
%5%
- 18
%21
%21
%30
%25
%7%
7%
18%
6%13
%23
%19
%33
%26
%6%
3%
15%
17
%
PAR
LIA
ME
NTA
RY
PAN
EL
SUR
VEY
- JU
NE
200
5
Q1.
Irre
spec
tive
of h
ow fa
mili
ar y
ou a
re w
ith th
ese
sect
ors,
we
wou
ld li
ke to
ask
you
abo
ut h
ow y
ou h
ave
gain
ed y
our k
now
ledg
e of
RET
AILI
NG
2nd
mos
t inf
luen
tial
Bas
e: A
ll re
spon
dent
s
Page
12
P
repa
red
by: C
omm
unic
ateR
esea
rch
Lim
ited
Fi
eldw
ork:
7th
Jun
e - 2
4th
June
200
5

PAR
TY
REG
ION
D
ATE
OF
BIR
TH
MA
RG
INA
LITY
LE
NG
TH O
F SE
RVI
CE
GEN
DER
Scot
Mid
s
1986
Li
b
Lon-
&
&
Pr
e-
1940
-19
50-
0.
1-
10.0
-20
.0-
or
19
87-
1992
-19
97-
Fe-
To
tal
Con
sLa
b D
ems
Oth
er
don
Sout
hW
ales
NI
East
Nor
th19
4019
4919
59
1960
+9.
9%19
.9%
29.9
%30
%+
befo
re19
9119
9620
0020
01+
Mal
e m
ale
U
nwei
ghte
d T
otal
15
4 51
80
20
3
14
39
9 14
42
36
7
63
52
32
52
47
24
31
18
18
20
44
17
137
17
W
eigh
ted
Tot
al
154
46
85
14
9 17
31
9
21
37
38
6 62
54
32
48
44
24
37
17
17
21
45
19
13
7 17
100%
100%
100%
10
0%
100%
10
0%10
0%10
0%10
0%10
0%10
0%10
0%10
0%10
0%
100%
100%
100%
100%
100%
100%
100%
100%
100%
100%
10
0 %
100 %
Thro
ugh
Par
liam
enta
ry
44
16
22
6 -
6 12
4
2 13
7
2 17
11
14
10
19
9
6 6
5 5
16
5 39
5
activ
ities
or b
riefin
gs
28%
35%
26%
41
%
- 34
%39
%38
%9%
36%
19%
30%
27%
21%
43
%20
%43
%37
%16
%33
%28
%25
%36
%29
%
28%
30
%
Fi
rms
or in
divi
dual
s 34
9
20
2 3
1 7
1 5
10
10
2 10
16
6
11
11
4 7
4 2
4 7
5 31
2
in m
y co
nstit
uenc
y 22
%19
%24
%
15%
29
%
8%23
%10
%22
%27
%25
%28
%16
%30
%
19%
23%
24%
18%
20%
25%
10%
20%
16%
29%
23
%
13%
From
oth
er s
ourc
es,
24
10
8 2
4 2
7 2
7 2
4 -
5 13
6
9 3
1 11
1
3 1
12
2 21
3
eg
the
med
ia
16%
21%
9%
15%
45
%
13%
21%
19%
32%
7%11
%-
8%24
%
19%
18%
8%5%
29%
8%17
%4%
26%
12%
15
%
19%
From
my
own
17
4 9
2 2
3 2
3 3
4 3
1 6
8 2
5 2
5 5
1 1
4 5
5 16
1
care
er b
ackg
roun
d 11
%9%
10%
14
%
26%
16
%7%
33%
12%
10%
8%16
%10
%15
%
6%10
%6%
22%
12%
6%5%
20%
10%
24%
12
%
8%
N
ot s
tate
d 35
7
26
2 -
5 3
- 5
8 14
2
24
6 4
14
8 4
9 5
7 6
5 1
30
5
23%
16%
30%
16
%
- 29
%11
%-
24%
21%
36%
27%
39%
10%
12
%28
%19
%17
%24
%27
%40
%31
%12
%7%
22
%
29%
PAR
LIA
ME
NTA
RY
PAN
EL
SUR
VEY
- JU
NE
200
5
Q1.
Irre
spec
tive
of h
ow fa
mili
ar y
ou a
re w
ith th
ese
sect
ors,
we
wou
ld li
ke to
ask
you
abo
ut h
ow y
ou h
ave
gain
ed y
our k
now
ledg
e of
BA
NK
ING
& IN
SUR
AN
CE
3rd
mos
t inf
luen
tial
Bas
e: A
ll re
spon
dent
s
Page
13
P
repa
red
by: C
omm
unic
ateR
esea
rch
Lim
ited
Fi
eldw
ork:
7th
Jun
e - 2
4th
June
200
5

PAR
TY
REG
ION
D
ATE
OF
BIR
TH
MA
RG
INA
LITY
LE
NG
TH O
F SE
RVI
CE
GEN
DER
Scot
Mid
s
1986
Li
b
Lon-
&
&
Pr
e-
1940
-19
50-
0.
1-
10.0
-20
.0-
or
19
87-
1992
-19
97-
Fe-
To
tal
Con
sLa
b D
ems
Oth
er
don
Sout
hW
ales
NI
East
Nor
th19
4019
4919
59
1960
+9.
9%19
.9%
29.9
%30
%+
befo
re19
9119
9620
0020
01+
Mal
e m
ale
U
nwei
ghte
d T
otal
15
4 51
80
20
3
14
39
9 14
42
36
7
63
52
32
52
47
24
31
18
18
20
44
17
137
17
W
eigh
ted
Tot
al
154
46
85
14
9 17
31
9
21
37
38
6 62
54
32
48
44
24
37
17
17
21
45
19
13
7 17
100%
100%
100%
10
0%
100%
10
0%10
0%10
0%10
0%10
0%10
0%10
0%10
0%10
0%
100%
100%
100%
100%
100%
100%
100%
100%
100%
100%
10
0 %
100 %
From
oth
er s
ourc
es,
43
11
22
4 7
6 9
5 8
8 7
1 13
18
11
13
10
7
13
2 4
6 21
4
40
4 e
g th
e m
edia
28
%24
%25
%
29%
71
%
37%
30%
55%
38%
21%
18%
14%
21%
34%
34
%28
%23
%28
%35
%12
%21
%29
%46
%23
%
29%
22
%
Fi
rms
or in
divi
dual
s 33
16
11
4
3 3
7 1
5 10
6
2 10
11
9
11
14
3 6
7 3
4 4
4 30
2
in m
y co
nstit
uenc
y 21
%34
%13
%
27%
29
%
18%
23%
10%
22%
28%
16%
30%
17%
21%
29
%22
%31
%10
%15
%40
%15
%20
%8%
19%
22
%
14%
Thro
ugh
Par
liam
enta
ry
27
9 15
3
- 1
10
2 2
5 6
1 14
7
6 6
12
6 4
3 3
3 11
3
24
4 ac
tiviti
es o
r brie
fings
18
%19
%18
%
24%
-
8%31
%25
%9%
14%
17%
13%
22%
13%
18
%13
%27
%23
%10
%19
%15
%16
%23
%17
%
17%
21
%
Fr
om m
y ow
n 16
4
12
- -
3 3
1 3
4 3
2 6
6 2
4 4
4 4
1 1
- 6
5 14
1
care
er b
ackg
roun
d 10
%9%
14%
-
- 16
%8%
10%
12%
10%
9%29
%9%
12%
7%
8%10
%15
%10
%6%
8%-
13%
26%
11
%
8%
N
ot s
tate
d 35
7
25
3 -
4 3
- 4
10
15
1 19
11
4
14
4 6
11
4 7
7 4
3 29
6
23
%15
%30
%
20%
-
21%
8%-
18%
27%
40%
13%
31%
21%
12
%28
%9%
24%
31%
23%
41%
35%
10%
14%
21
%
35%
PAR
LIA
ME
NTA
RY
PAN
EL
SUR
VEY
- JU
NE
200
5
Q1.
Irre
spec
tive
of h
ow fa
mili
ar y
ou a
re w
ith th
ese
sect
ors,
we
wou
ld li
ke to
ask
you
abo
ut h
ow y
ou h
ave
gain
ed y
our k
now
ledg
eof
BU
SIN
ESS
SER
VIC
ES
3rd
mos
t inf
luen
tial
Bas
e: A
ll re
spon
dent
s
Page
14
Pre
pare
d by
: Com
mun
icat
eRes
earc
h Li
mite
d
Fiel
dwor
k: 7
th J
une
- 24t
h Ju
ne 2
005

PAR
TY
REG
ION
D
ATE
OF
BIR
TH
MA
RG
INA
LITY
LE
NG
TH O
F SE
RVI
CE
GEN
DER
Scot
Mid
s
1986
Li
b
Lon-
&
&
Pr
e-
1940
-19
50-
0.
1-
10.0
-20
.0-
or
19
87-
1992
-19
97-
Fe-
To
tal
Con
sLa
b D
ems
Oth
er
don
Sout
hW
ales
NI
East
Nor
th19
4019
4919
59
1960
+9.
9%19
.9%
29.9
%30
%+
befo
re19
9119
9620
0020
01+
Mal
e m
ale
U
nwei
ghte
d T
otal
15
4 51
80
20
3
14
39
9 14
42
36
7
63
52
32
52
47
24
31
18
18
20
44
17
137
17
W
eigh
ted
Tot
al
154
46
85
14
9 17
31
9
21
37
38
6 62
54
32
48
44
24
37
17
17
21
45
19
13
7 17
100%
100%
100%
10
0%
100%
10
0%10
0%10
0%10
0%10
0%10
0%10
0%10
0%10
0%
100%
100%
100%
100%
100%
100%
100%
100%
100%
100%
10
0 %
100 %
From
oth
er s
ourc
es,
43
12
20
4 7
5 10
7
5 9
6 2
10
20
11
14
9 9
10
2 4
5 17
5
40
3 e
g th
e m
edia
28
%26
%24
%
29%
71
%
29%
33%
74%
26%
25%
16%
31%
17%
38%
33
%29
%22
%38
%27
%13
%26
%25
%37
%25
%
29%
20
%
Th
roug
h P
arlia
men
tary
31
13
12
5
- 3
8 2
3 10
5
2 9
11
8 8
13
5 4
3 3
3 8
7 27
4
activ
ities
or b
riefin
gs
20%
29%
14%
36
%
- 18
%26
%19
%13
%26
%14
%29
%15
%21
%
26%
17%
31%
19%
11%
19%
15%
17%
19%
37%
20
%
22%
Firm
s or
indi
vidu
als
28
9 19
1
- 4
5 -
3 5
11
1 13
10
4
3 10
5
10
7 3
5 10
1
27
1 in
my
cons
titue
ncy
18%
19%
22%
5%
-
24%
16%
- 12
%14
%30
%13
%22
%18
%
13%
6%23
%22
%27
%42
%18
%23
%22
%7%
20
%
5%
Fr
om m
y ow
n 15
5
6 1
3 -
5 1
5 3
1 1
5 6
4 6
6 1
3 1
- 1
4 5
11
4 ca
reer
bac
kgro
und
10%
11%
7%
9%
29%
-
15%
7%25
%9%
3%13
%8%
11%
12
%12
%14
%4%
7%6%
- 5%
10%
25%
8%
24
%
N
ot s
tate
d 37
7
27
3 -
5 3
- 5
10
14
1 24
7
6 17
5
4 10
3
7 6
6 1
32
5
24%
15%
32%
20
%
- 29
%10
%-
24%
26%
37%
13%
39%
13%
17
%36
%11
%17
%27
%19
%41
%31
%13
%7%
23
%
29%
PAR
LIA
ME
NTA
RY
PAN
EL
SUR
VEY
- JU
NE
200
5
Q1.
Irre
spec
tive
of h
ow fa
mili
ar y
ou a
re w
ith th
ese
sect
ors,
we
wou
ld li
ke to
ask
you
abo
ut h
ow y
ou h
ave
gain
ed y
our k
now
ledg
e of
CO
NST
RU
CTI
ON
3rd
mos
t inf
luen
tial
Bas
e: A
ll re
spon
dent
s
Page
15
P
repa
red
by: C
omm
unic
ateR
esea
rch
Lim
ited
Fi
eldw
ork:
7th
Jun
e - 2
4th
June
200
5

PAR
TY
REG
ION
D
ATE
OF
BIR
TH
MA
RG
INA
LITY
LE
NG
TH O
F SE
RVI
CE
GEN
DER
Scot
Mid
s
1986
Li
b
Lon-
&
&
Pr
e-
1940
-19
50-
0.
1-
10.0
-20
.0-
or
19
87-
1992
-19
97-
Fe-
To
tal
Con
sLa
b D
ems
Oth
er
don
Sout
hW
ales
NI
East
Nor
th19
4019
4919
59
1960
+9.
9%19
.9%
29.9
%30
%+
befo
re19
9119
9620
0020
01+
Mal
e m
ale
U
nwei
ghte
d T
otal
15
4 51
80
20
3
14
39
9 14
42
36
7
63
52
32
52
47
24
31
18
18
20
44
17
137
17
W
eigh
ted
Tot
al
154
46
85
14
9 17
31
9
21
37
38
6 62
54
32
48
44
24
37
17
17
21
45
19
13
7 17
100%
100%
100%
10
0%
100%
10
0%10
0%10
0%10
0%10
0%10
0%10
0%10
0%10
0%
100%
100%
100%
100%
100%
100%
100%
100%
100%
100%
10
0 %
100 %
Thro
ugh
Par
liam
enta
ry
38
16
17
5 -
7 11
2
1 12
5
2 16
10
10
12
16
6
4 5
3 4
10
6 31
7
activ
ities
or b
riefin
gs
25%
35%
20%
36
%
- 42
%36
%26
%3%
31%
12%
30%
26%
18%
32
%25
%37
%24
%10
%32
%15
%19
%23
%34
%
23%
38
%
Fr
om o
ther
sou
rces
, 35
10
20
3
2 3
11
5 5
5 7
- 10
20
5
11
7 7
10
3 4
5 12
4
31
4 e
g th
e m
edia
23
%21
%23
%
24%
26
%
16%
34%
55%
22%
13%
19%
- 16
%38
%
14%
22%
16%
30%
27%
18%
26%
23%
27%
24%
23
%
25%
From
my
own
24
9 7
1 7
- 4
1 7
7 4
2 5
9 8
7 8
3 5
2 2
3 7
3 24
-
care
er b
ackg
roun
d 15
%20
%8%
5%
74
%
- 13
%9%
33%
20%
12%
29%
8%16
%
25%
15%
18%
13%
13%
11%
12%
14%
15%
14%
17
%
-
Firm
s or
indi
vidu
als
21
6 13
3
- 2
3 1
4 4
7 1
8 8
5 4
7 4
7 3
1 3
9 3
19
2 in
my
cons
titue
ncy
14%
13%
15%
20
%
- 13
%9%
10%
18%
12%
19%
14%
13%
15%
14
%8%
15%
15%
19%
20%
5%13
%19
%17
%
14%
13
%
N
ot s
tate
d 36
5
29
2 -
5 3
- 5
9 15
2
22
7 5
14
6 4
12
3 7
6 7
2 32
4
23
%11
%34
%
16%
-
29%
8%-
24%
23%
39%
27%
36%
14%
15
%30
%13
%17
%31
%19
%41
%31
%16
%10
%
23%
24
%
PAR
LIA
ME
NTA
RY
PAN
EL
SUR
VEY
- JU
NE
200
5
Q1.
Irre
spec
tive
of h
ow fa
mili
ar y
ou a
re w
ith th
ese
sect
ors,
we
wou
ld li
ke to
ask
you
abo
ut h
ow y
ou h
ave
gain
ed y
our k
now
ledg
e of
MA
NU
FAC
TUR
ING
3rd
mos
t inf
luen
tial
Bas
e: A
ll re
spon
dent
s
Page
16
P
repa
red
by: C
omm
unic
ateR
esea
rch
Lim
ited
Fi
eldw
ork:
7th
Jun
e - 2
4th
June
200
5

PAR
TY
REG
ION
D
ATE
OF
BIR
TH
MA
RG
INA
LITY
LE
NG
TH O
F SE
RVI
CE
GEN
DER
Scot
Mid
s
1986
Li
b
Lon-
&
&
Pr
e-
1940
-19
50-
0.
1-
10.0
-20
.0-
or
19
87-
1992
-19
97-
Fe-
To
tal
Con
sLa
b D
ems
Oth
er
don
Sout
hW
ales
NI
East
Nor
th19
4019
4919
59
1960
+9.
9%19
.9%
29.9
%30
%+
befo
re19
9119
9620
0020
01+
Mal
e m
ale
U
nwei
ghte
d T
otal
15
4 51
80
20
3
14
39
9 14
42
36
7
63
52
32
52
47
24
31
18
18
20
44
17
137
17
W
eigh
ted
Tot
al
154
46
85
14
9 17
31
9
21
37
38
6 62
54
32
48
44
24
37
17
17
21
45
19
13
7 17
100%
100%
100%
10
0%
100%
10
0%10
0%10
0%10
0%10
0%10
0%10
0%10
0%10
0%
100%
100%
100%
100%
100%
100%
100%
100%
100%
100%
10
0 %
100 %
Firm
s or
indi
vidu
als
42
15
23
4 -
6 10
1
6 11
9
1 18
16
8
13
17
4 8
6 4
3 17
3
38
4 in
my
cons
titue
ncy
27%
32%
28%
29
%
- 32
%31
%10
%31
%29
%23
%13
%29
%30
%
23%
27%
38%
17%
22%
37%
22%
14%
37%
15%
28
%
22%
From
oth
er s
ourc
es,
39
14
16
4 5
6 10
4
4 6
9 3
15
17
4 10
13
10
6
5 4
8 8
8 32
7
eg
the
med
ia
25%
30%
18%
31
%
55%
34
%31
%42
%19
%17
%24
%46
%24
%32
%
12%
20%
31%
40%
17%
30%
26%
41%
17%
44%
24
%
38%
Thro
ugh
Par
liam
enta
ry
22
5 12
1
4 1
3 3
4 6
5 1
5 6
10
5 4
5 8
1 2
2 9
4 22
-
activ
ities
or b
riefin
gs
14%
11%
14%
9%
45
%
8%10
%29
%20
%17
%12
%14
%9%
11%
31
%10
%10
%22
%20
%4%
11%
9%21
%22
%
16%
-
Fr
om m
y ow
n 15
6
7 2
- 1
5 2
1 5
1 -
2 6
6 8
3 1
2 1
- 1
3 3
13
2 ca
reer
bac
kgro
und
10%
12%
8%
16%
-
5%15
%19
%6%
14%
3%-
4%11
%
20%
17%
8%4%
6%5%
- 5%
8%15
%
9%
12%
Not
sta
ted
36
7 27
2
- 4
4 -
5 9
14
2 21
9
5 13
6
4 13
4
7 6
8 1
31
5
23%
15%
32%
16
%
- 21
%14
%-
24%
23%
38%
27%
34%
16%
15
%26
%14
%17
%36
%24
%41
%31
%18
%3%
23
%
28%
PAR
LIA
ME
NTA
RY
PAN
EL
SUR
VEY
- JU
NE
200
5
Q1.
Irre
spec
tive
of h
ow fa
mili
ar y
ou a
re w
ith th
ese
sect
ors,
we
wou
ld li
ke to
ask
you
abo
ut h
ow y
ou h
ave
gain
ed y
our k
now
ledg
e of
PH
ARM
AC
EUTI
CA
LS
3rd
mos
t inf
luen
tial
Bas
e: A
ll re
spon
dent
s
Page
17
P
repa
red
by: C
omm
unic
ateR
esea
rch
Lim
ited
Fi
eldw
ork:
7th
Jun
e - 2
4th
June
200
5

PAR
TY
REG
ION
D
ATE
OF
BIR
TH
MA
RG
INA
LITY
LE
NG
TH O
F SE
RVI
CE
GEN
DER
Scot
Mid
s
1986
Li
b
Lon-
&
&
Pr
e-
1940
-19
50-
0.
1-
10.0
-20
.0-
or
19
87-
1992
-19
97-
Fe-
To
tal
Con
sLa
b D
ems
Oth
er
don
Sout
hW
ales
NI
East
Nor
th19
4019
4919
59
1960
+9.
9%19
.9%
29.9
%30
%+
befo
re19
9119
9620
0020
01+
Mal
e m
ale
U
nwei
ghte
d T
otal
15
4 51
80
20
3
14
39
9 14
42
36
7
63
52
32
52
47
24
31
18
18
20
44
17
137
17
W
eigh
ted
Tot
al
154
46
85
14
9 17
31
9
21
37
38
6 62
54
32
48
44
24
37
17
17
21
45
19
13
7 17
100%
100%
100%
10
0%
100%
10
0%10
0%10
0%10
0%10
0%10
0%10
0%10
0%10
0%
100%
100%
100%
100%
100%
100%
100%
100%
100%
100%
10
0 %
100 %
Thro
ugh
Par
liam
enta
ry
42
12
22
6 2
7 10
3
6 12
5
2 16
16
10
10
16
10
6
5 2
6 13
8
34
8 ac
tiviti
es o
r brie
fings
28
%25
%27
%
42%
26
%
39%
31%
36%
28%
31%
14%
27%
25%
29%
30
%20
%37
%41
%17
%32
%10
%31
%29
%41
%
25%
46
%
Fr
om o
ther
sou
rces
, 35
10
19
1
4 4
9 3
8 3
8 1
11
15
8 12
7
4 13
2
3 4
16
3 33
2
eg
the
med
ia
23%
22%
23%
9%
45
%
24%
29%
29%
38%
9%21
%13
%18
%28
%
24%
25%
15%
15%
34%
11%
17%
22%
36%
16%
24
%
13%
From
my
own
21
7 8
3 3
- 4
2 3
8 5
1 6
9 6
9 6
2 4
2 3
- 5
6 20
1
care
er b
ackg
roun
d 14
%15
%10
%
23%
29
%
- 12
%17
%13
%21
%14
%16
%9%
16%
17
%18
%14
%6%
12%
11%
15%
- 10
%32
%
14%
8%
Firm
s or
indi
vidu
als
19
12
5 1
- 3
7 2
1 5
2 1
7 7
5 5
8 5
1 4
2 4
5 -
18
1 in
my
cons
titue
ncy
12%
26%
6%
10%
-
16%
21%
19%
3%15
%5%
14%
11%
13%
14
%10
%19
%21
%2%
23%
10%
18%
11%
- 13
%
4%
N
ot s
tate
d 36
5
29
2 -
4 3
- 4
9 18
2
23
7 5
13
6 4
13
4 8
6 6
2 31
5
24
%11
%34
%
16%
-
21%
8%-
18%
24%
47%
30%
37%
14%
15
%27
%14
%17
%35
%24
%47
%30
%14
%10
%
23%
29
%
PAR
LIA
ME
NTA
RY
PAN
EL
SUR
VEY
- JU
NE
200
5
Q1.
Irre
spec
tive
of h
ow fa
mili
ar y
ou a
re w
ith th
ese
sect
ors,
we
wou
ld li
ke to
ask
you
abo
ut h
ow y
ou h
ave
gain
ed y
our k
now
ledg
e of
RET
AILI
NG
3rd
mos
t inf
luen
tial
Bas
e: A
ll re
spon
dent
s
Page
18
P
repa
red
by: C
omm
unic
ateR
esea
rch
Lim
ited
Fi
eldw
ork:
7th
Jun
e - 2
4th
June
200
5

PAR
TY
REG
ION
D
ATE
OF
BIR
TH
MA
RG
INA
LITY
LE
NG
TH O
F SE
RVI
CE
GEN
DER
Scot
Mid
s
1986
Li
b
Lon-
&
&
Pr
e-
1940
-19
50-
0.
1-
10.0
-20
.0-
or
19
87-
1992
-19
97-
Fe-
To
tal
Con
sLa
b D
ems
Oth
er
don
Sout
hW
ales
NI
East
Nor
th19
4019
4919
59
1960
+9.
9%19
.9%
29.9
%30
%+
befo
re19
9119
9620
0020
01+
Mal
e m
ale
U
nwei
ghte
d T
otal
15
4 51
80
20
3
14
39
9 14
42
36
7
63
52
32
52
47
24
31
18
18
20
44
17
137
17
W
eigh
ted
Tot
al
154
46
85
14
9 17
31
9
21
37
38
6 62
54
32
48
44
24
37
17
17
21
45
19
13
7 17
100%
100%
100%
10
0%
100%
10
0%10
0%10
0%10
0%10
0%10
0%10
0%10
0%10
0%
100%
100%
100%
100%
100%
100%
100%
100%
100%
100%
10
0 %
100 %
From
my
own
48
9 32
2
4 6
6 4
9 11
12
2
18
20
8 7
17
8 15
6
5 5
20
7 40
7
care
er b
ackg
roun
d 31
%20
%38
%
15%
45
%
37%
19%
39%
44%
29%
31%
28%
29%
37%
24
%15
%39
%33
%41
%34
%31
%26
%44
%37
%
30%
42
%
Fi
rms
or in
divi
dual
s 28
12
12
4
- 4
6 2
2 8
5 1
9 8
9 9
8 5
5 1
3 4
10
2 24
4
in m
y co
nstit
uenc
y 18
%27
%14
%
27%
-
26%
21%
19%
9%21
%14
%16
%15
%15
%
29%
20%
19%
19%
14%
5%18
%20
%23
%12
%
18%
21
%
Th
roug
h P
arlia
men
tary
27
16
8
3 -
3 11
-
2 7
4 2
10
9 7
15
6 3
3 3
1 3
7 3
26
1 ac
tiviti
es o
r brie
fings
18
%34
%9%
24
%
- 16
%35
%-
9%19
%12
%27
%15
%17
%
22%
32%
14%
13%
7%17
%5%
12%
15%
14%
19
%
8%
Fr
om o
ther
sou
rces
, 19
4
8 1
5 -
5 4
4 4
2 1
6 9
3 4
7 4
3 4
1 3
2 6
18
1 e
g th
e m
edia
12
%9%
9%
9%
55%
-
16%
42%
19%
10%
6%16
%10
%16
%
9%9%
17%
17%
8%21
%5%
16%
4%33
%
13%
5%
Not
sta
ted
33
4 25
3
- 4
3 -
4 8
14
1 18
8
5 12
5
5 11
4
7 5
6 1
28
4
21%
9%29
%
25%
-
21%
10%
- 18
%21
%38
%13
%30
%15
%
17%
25%
11%
19%
30%
23%
41%
25%
14%
3%
21%
24
%
PAR
LIA
ME
NTA
RY
PAN
EL
SUR
VEY
- JU
NE
200
5
Q1.
Irre
spec
tive
of h
ow fa
mili
ar y
ou a
re w
ith th
ese
sect
ors,
we
wou
ld li
ke to
ask
you
abo
ut h
ow y
ou h
ave
gain
ed y
our k
now
ledg
e of
BA
NK
ING
& IN
SUR
AN
CE
Leas
t inf
luen
tial
Bas
e: A
ll re
spon
dent
s
Page
19
P
repa
red
by: C
omm
unic
ateR
esea
rch
Lim
ited
Fi
eldw
ork:
7th
Jun
e - 2
4th
June
200
5
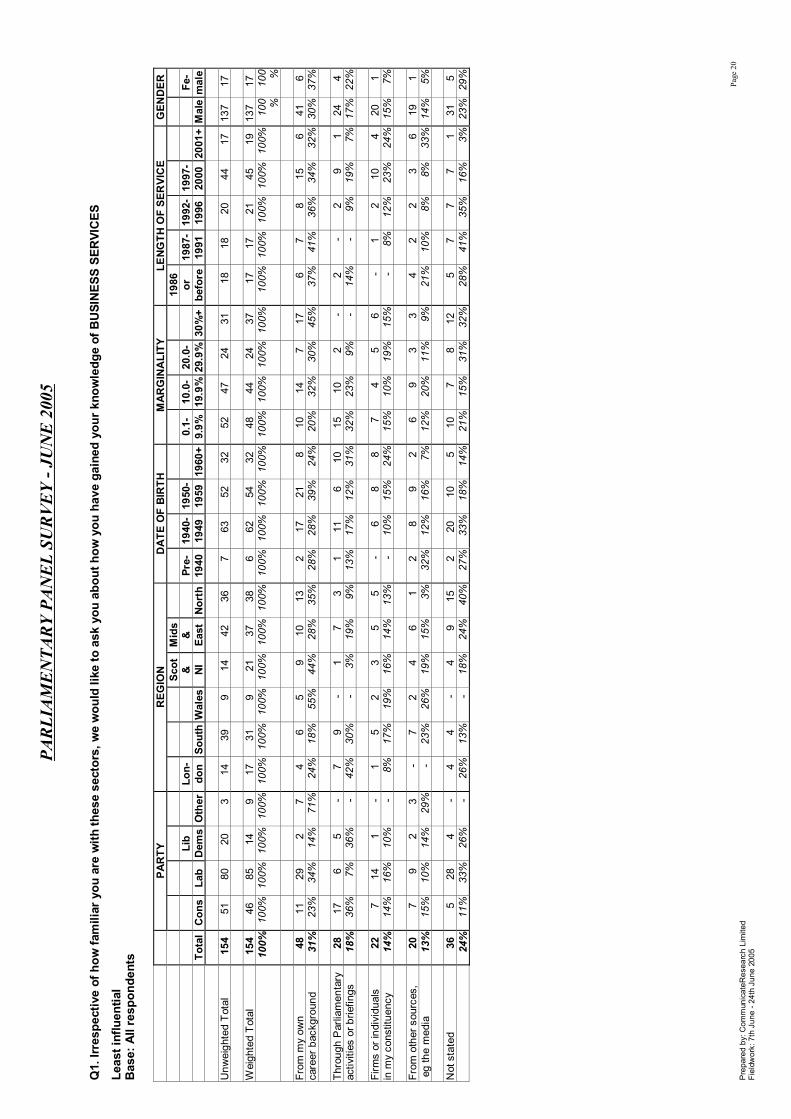
PAR
TY
REG
ION
D
ATE
OF
BIR
TH
MA
RG
INA
LITY
LE
NG
TH O
F SE
RVI
CE
GEN
DER
Scot
Mid
s
1986
Li
b
Lon-
&
&
Pr
e-
1940
-19
50-
0.
1-
10.0
-20
.0-
or
19
87-
1992
-19
97-
Fe-
To
tal
Con
sLa
b D
ems
Oth
er
don
Sout
hW
ales
NI
East
Nor
th19
4019
4919
59
1960
+9.
9%19
.9%
29.9
%30
%+
befo
re19
9119
9620
0020
01+
Mal
e m
ale
U
nwei
ghte
d T
otal
15
4 51
80
20
3
14
39
9 14
42
36
7
63
52
32
52
47
24
31
18
18
20
44
17
137
17
W
eigh
ted
Tot
al
154
46
85
14
9 17
31
9
21
37
38
6 62
54
32
48
44
24
37
17
17
21
45
19
13
7 17
100%
100%
100%
10
0%
100%
10
0%10
0%10
0%10
0%10
0%10
0%10
0%10
0%10
0%
100%
100%
100%
100%
100%
100%
100%
100%
100%
100%
10
0 %
100 %
From
my
own
48
11
29
2 7
4 6
5 9
10
13
2 17
21
8
10
14
7 17
6
7 8
15
6 41
6
care
er b
ackg
roun
d 31
%23
%34
%
14%
71
%
24%
18%
55%
44%
28%
35%
28%
28%
39%
24
%20
%32
%30
%45
%37
%41
%36
%34
%32
%
30%
37
%
Th
roug
h P
arlia
men
tary
28
17
6
5 -
7 9
- 1
7 3
1 11
6
10
15
10
2 -
2 -
2 9
1 24
4
activ
ities
or b
riefin
gs
18%
36%
7%
36%
-
42%
30%
- 3%
19%
9%13
%17
%12
%
31%
32%
23%
9%-
14%
- 9%
19%
7%
17%
22
%
Fi
rms
or in
divi
dual
s 22
7
14
1 -
1 5
2 3
5 5
- 6
8 8
7 4
5 6
- 1
2 10
4
20
1 in
my
cons
titue
ncy
14%
14%
16%
10
%
- 8%
17%
19%
16%
14%
13%
- 10
%15
%
24%
15%
10%
19%
15%
- 8%
12%
23%
24%
15
%
7%
Fr
om o
ther
sou
rces
, 20
7
9 2
3 -
7 2
4 6
1 2
8 9
2 6
9 3
3 4
2 2
3 6
19
1 e
g th
e m
edia
13
%15
%10
%
14%
29
%
- 23
%26
%19
%15
%3%
32%
12%
16%
7%
12%
20%
11%
9%21
%10
%8%
8%33
%
14%
5%
Not
sta
ted
36
5 28
4
- 4
4 -
4 9
15
2 20
10
5
10
7 8
12
5 7
7 7
1 31
5
24
%11
%33
%
26%
-
26%
13%
- 18
%24
%40
%27
%33
%18
%
14%
21%
15%
31%
32%
28%
41%
35%
16%
3%
23%
29
%
PAR
LIA
ME
NTA
RY
PAN
EL
SUR
VEY
- JU
NE
200
5
Q1.
Irre
spec
tive
of h
ow fa
mili
ar y
ou a
re w
ith th
ese
sect
ors,
we
wou
ld li
ke to
ask
you
abo
ut h
ow y
ou h
ave
gain
ed y
our k
now
ledg
e of
BU
SIN
ESS
SER
VIC
ES
Leas
t inf
luen
tial
Bas
e: A
ll re
spon
dent
s
Page
20
P
repa
red
by: C
omm
unic
ateR
esea
rch
Lim
ited
Fi
eldw
ork:
7th
Jun
e - 2
4th
June
200
5

PAR
TY
REG
ION
D
ATE
OF
BIR
TH
MA
RG
INA
LITY
LE
NG
TH O
F SE
RVI
CE
GEN
DER
Scot
Mid
s
1986
Li
b
Lon-
&
&
Pr
e-
1940
-19
50-
0.
1-
10.0
-20
.0-
or
19
87-
1992
-19
97-
Fe-
To
tal
Con
sLa
b D
ems
Oth
er
don
Sout
hW
ales
NI
East
Nor
th19
4019
4919
59
1960
+9.
9%19
.9%
29.9
%30
%+
befo
re19
9119
9620
0020
01+
Mal
e m
ale
U
nwei
ghte
d T
otal
15
4 51
80
20
3
14
39
9 14
42
36
7
63
52
32
52
47
24
31
18
18
20
44
17
137
17
W
eigh
ted
Tot
al
154
46
85
14
9 17
31
9
21
37
38
6 62
54
32
48
44
24
37
17
17
21
45
19
13
7 17
100%
100%
100%
10
0%
100%
10
0%10
0%10
0%10
0%10
0%10
0%10
0%10
0%10
0%
100%
100%
100%
100%
100%
100%
100%
100%
100%
100%
10
0 %
100 %
From
my
own
53
20
27
6 -
10
14
4 3
16
8 3
17
25
8 17
19
9
7 6
6 6
20
6 45
8
care
er b
ackg
roun
d 35
%44
%32
%
40%
-
58%
43%
38%
12%
42%
21%
44%
27%
47%
26
%36
%45
%39
%19
%33
%37
%29
%44
%31
%
33%
46
%
Th
roug
h P
arlia
men
tary
28
12
14
2
- 1
8 1
3 7
9 1
14
6 7
11
6 4
6 4
2 4
8 1
26
2 ac
tiviti
es o
r brie
fings
18
%26
%16
%
14%
-
8%25
%10
%12
%18
%23
%13
%23
%10
%
22%
24%
15%
17%
16%
23%
11%
20%
18%
5%
19%
12
%
Fi
rms
or in
divi
dual
s 20
3
9 2
7 1
3 3
6 3
4 -
3 7
10
4 2
5 9
- -
3 7
5 16
4
in m
y co
nstit
uenc
y 13
%6%
11%
11
%
71%
5%
8%36
%29
%8%
11%
- 5%
13%
31
%7%
6%22
%23
%-
- 15
%16
%29
%
12%
21
%
Fr
om o
ther
sou
rces
, 19
6
9 1
3 -
3 2
6 3
5 1
7 9
2 3
10
1 5
3 2
2 3
6 18
1
eg
the
med
ia
12%
13%
10%
10
%
29%
-
11%
17%
28%
9%12
%16
%11
%16
%
6%7%
22%
4%13
%16
%10
%10
%6%
31%
13
%
5%
N
ot s
tate
d 34
5
26
3 -
5 4
- 4
9 13
2
21
7 5
13
6 5
11
5 7
5 7
1 31
3
22
%11
%30
%
25%
-
29%
13%
- 18
%23
%33
%27
%33
%13
%
15%
26%
13%
19%
29%
28%
41%
25%
16%
3%
23%
17
%
PAR
LIA
ME
NTA
RY
PAN
EL
SUR
VEY
- JU
NE
200
5
Q1.
Irre
spec
tive
of h
ow fa
mili
ar y
ou a
re w
ith th
ese
sect
ors,
we
wou
ld li
ke to
ask
you
abo
ut h
ow y
ou h
ave
gain
ed y
our k
now
ledg
e of
CO
NST
RU
CTI
ON
Leas
t inf
luen
tial
Bas
e: A
ll re
spon
dent
s
Page
21
P
repa
red
by: C
omm
unic
ateR
esea
rch
Lim
ited
Fi
eldw
ork:
7th
Jun
e - 2
4th
June
200
5

PAR
TY
REG
ION
D
ATE
OF
BIR
TH
MA
RG
INA
LITY
LE
NG
TH O
F SE
RVI
CE
GEN
DER
Scot
Mid
s
1986
Li
b
Lon-
&
&
Pr
e-
1940
-19
50-
0.
1-
10.0
-20
.0-
or
19
87-
1992
-19
97-
Fe-
To
tal
Con
sLa
b D
ems
Oth
er
don
Sout
hW
ales
NI
East
Nor
th19
4019
4919
59
1960
+9.
9%19
.9%
29.9
%30
%+
befo
re19
9119
9620
0020
01+
Mal
e m
ale
U
nwei
ghte
d T
otal
15
4 51
80
20
3
14
39
9 14
42
36
7
63
52
32
52
47
24
31
18
18
20
44
17
137
17
W
eigh
ted
Tot
al
154
46
85
14
9 17
31
9
21
37
38
6 62
54
32
48
44
24
37
17
17
21
45
19
13
7 17
100%
100%
100%
10
0%
100%
10
0%10
0%10
0%10
0%10
0%10
0%10
0%10
0%10
0%
100%
100%
100%
100%
100%
100%
100%
100%
100%
100%
10
0 %
100 %
From
my
own
55
16
32
5 2
8 11
5
6 13
11
1
18
24
12
13
17
10
15
7 3
9 17
10
43
12
ca
reer
bac
kgro
und
36%
34%
38%
35
%
26%
45
%36
%55
%31
%35
%29
%13
%29
%45
%
37%
27%
40%
40%
40%
42%
20%
42%
37%
54%
31
%
69%
From
oth
er s
ourc
es,
26
8 14
1
3 1
6 3
4 9
3 3
8 11
5
8 12
3
3 3
3 2
5 6
25
1 e
g th
e m
edia
17
%18
%16
%
9%
29%
8%
18%
36%
19%
23%
8%47
%13
%20
%
15%
18%
26%
11%
9%16
%16
%10
%12
%33
%
19%
5%
Thro
ugh
Par
liam
enta
ry
20
12
6 1
- 1
6 -
- 4
8 -
7 8
5 9
5 5
1 2
2 3
7 -
20
- ac
tiviti
es o
r brie
fings
13
%26
%7%
9%
-
8%20
%-
- 12
%20
%-
12%
14%
15
%18
%11
%22
%3%
10%
13%
13%
16%
- 14
%
-
Firm
s or
indi
vidu
als
16
5 5
2 4
2 4
1 5
3 2
1 4
5 7
5 3
1 7
1 1
1 9
1 15
2
in m
y co
nstit
uenc
y 11
%11
%6%
17
%
45%
10
%13
%9%
26%
7%4%
13%
6%9%
21
%10
%7%
4%19
%5%
5%4%
19%
6%
11%
10
%
N
ot s
tate
d 37
5
28
4 -
5 4
- 5
9 14
2
25
7 4
13
7 6
11
5 8
7 7
1 34
3
24
%11
%33
%
30%
-
29%
13%
- 24
%23
%38
%27
%40
%13
%
12%
28%
16%
23%
30%
28%
47%
31%
16%
7%
25%
17
%
PAR
LIA
ME
NTA
RY
PAN
EL
SUR
VEY
- JU
NE
200
5
Q1.
Irre
spec
tive
of h
ow fa
mili
ar y
ou a
re w
ith th
ese
sect
ors,
we
wou
ld li
ke to
ask
you
abo
ut h
ow y
ou h
ave
gain
ed y
our k
now
ledg
e of
MA
NU
FAC
TUR
ING
Leas
t inf
luen
tial
Bas
e: A
ll re
spon
dent
s
Page
22
P
repa
red
by: C
omm
unic
ateR
esea
rch
Lim
ited
Fi
eldw
ork:
7th
Jun
e - 2
4th
June
200
5

PAR
TY
REG
ION
D
ATE
OF
BIR
TH
MA
RG
INA
LITY
LE
NG
TH O
F SE
RVI
CE
GEN
DER
Scot
Mid
s
1986
Li
b
Lon-
&
&
Pr
e-
1940
-19
50-
0.
1-
10.0
-20
.0-
or
19
87-
1992
-19
97-
Fe-
To
tal
Con
sLa
b D
ems
Oth
er
don
Sout
hW
ales
NI
East
Nor
th19
4019
4919
59
1960
+9.
9%19
.9%
29.9
%30
%+
befo
re19
9119
9620
0020
01+
Mal
e m
ale
U
nwei
ghte
d T
otal
15
4 51
80
20
3
14
39
9 14
42
36
7
63
52
32
52
47
24
31
18
18
20
44
17
137
17
W
eigh
ted
Tot
al
154
46
85
14
9 17
31
9
21
37
38
6 62
54
32
48
44
24
37
17
17
21
45
19
13
7 17
100%
100%
100%
10
0%
100%
10
0%10
0%10
0%10
0%10
0%10
0%10
0%10
0%10
0%
100%
100%
100%
100%
100%
100%
100%
100%
100%
100%
10
0 %
100 %
From
my
own
66
22
36
5 3
10
12
3 9
19
14
3 25
28
10
19
23
10
13
11
6
8 19
9
55
11
care
er b
ackg
roun
d 43
%48
%42
%
38%
29
%
56%
37%
29%
44%
50%
38%
46%
40%
53%
31
%40
%53
%42
%35
%63
%37
%39
%42
%50
%
40%
63
%
Fi
rms
or in
divi
dual
s 26
7
12
4 2
4 5
5 -
7 5
2 6
12
6 10
7
6 2
- 2
3 9
3 23
3
in m
y co
nstit
uenc
y 17
%16
%14
%
28%
26
%
23%
16%
51%
- 19
%12
%28
%10
%22
%
17%
20%
17%
26%
6%-
12%
16%
20%
16%
17
%
16%
From
oth
er s
ourc
es,
14
4 5
1 4
- 6
2 5
- 1
- 4
3 7
3 4
1 6
1 1
- 8
4 13
1
eg
the
med
ia
9%9%
6%
5%
45%
-
19%
19%
26%
- 3%
- 6%
6%
23%
5%10
%4%
17%
5%5%
- 17
%20
%
10%
5%
Thro
ugh
Par
liam
enta
ry
13
7 5
1 -
- 5
- 1
3 3
- 5
1 6
6 3
1 2
2 1
2 3
1 13
-
activ
ities
or b
riefin
gs
8%15
%6%
5%
-
- 15
%-
6%9%
8%-
9%3%
18
%13
%7%
6%6%
10%
5%9%
6%7%
9%
-
N
ot s
tate
d 35
5
27
3 -
4 4
- 5
8 15
2
21
9 3
11
6 6
14
4 7
7 7
1 33
3
23
%11
%32
%
25%
-
21%
13%
- 24
%22
%39
%27
%35
%17
%
10%
22%
13%
23%
36%
23%
41%
36%
16%
7%
24%
17
%
PAR
LIA
ME
NTA
RY
PAN
EL
SUR
VEY
- JU
NE
200
5
Q1.
Irre
spec
tive
of h
ow fa
mili
ar y
ou a
re w
ith th
ese
sect
ors,
we
wou
ld li
ke to
ask
you
abo
ut h
ow y
ou h
ave
gain
ed y
our k
now
ledg
e of
PH
ARM
AC
EUTI
CA
LS
Leas
t inf
luen
tial
Bas
e: A
ll re
spon
dent
s
Page
23
P
repa
red
by: C
omm
unic
ateR
esea
rch
Lim
ited
Fi
eldw
ork:
7th
Jun
e - 2
4th
June
200
5

PAR
TY
REG
ION
D
ATE
OF
BIR
TH
MA
RG
INA
LITY
LE
NG
TH O
F SE
RVI
CE
GEN
DER
Scot
Mid
s
1986
Li
b
Lon-
&
&
Pr
e-
1940
-19
50-
0.
1-
10.0
-20
.0-
or
19
87-
1992
-19
97-
Fe-
To
tal
Con
sLa
b D
ems
Oth
er
don
Sout
hW
ales
NI
East
Nor
th19
4019
4919
59
1960
+9.
9%19
.9%
29.9
%30
%+
befo
re19
9119
9620
0020
01+
Mal
e m
ale
U
nwei
ghte
d T
otal
15
4 51
80
20
3
14
39
9 14
42
36
7
63
52
32
52
47
24
31
18
18
20
44
17
137
17
W
eigh
ted
Tot
al
154
46
85
14
9 17
31
9
21
37
38
6 62
54
32
48
44
24
37
17
17
21
45
19
13
7 17
100%
100%
100%
10
0%
100%
10
0%10
0%10
0%10
0%10
0%10
0%10
0%10
0%10
0%
100%
100%
100%
100%
100%
100%
100%
100%
100%
100%
10
0 %
100 %
From
my
own
53
17
32
5 -
7 11
5
4 11
15
2
24
20
8 12
21
8
13
8 4
9 19
7
46
7 ca
reer
bac
kgro
und
35%
36%
37%
36
%
- 42
%35
%49
%18
%30
%41
%28
%38
%38
%
23%
24%
47%
33%
35%
47%
26%
41%
42%
39%
34
%
42%
Thro
ugh
Par
liam
enta
ry
26
15
8 3
- 3
10
1 2
7 4
1 6
10
9 13
6
4 2
2 2
2 8
- 24
2
activ
ities
or b
riefin
gs
17%
33%
10%
19
%
- 16
%31
%9%
9%19
%9%
13%
10%
18%
28
%27
%14
%18
%6%
10%
13%
9%17
%-
18%
9%
From
oth
er s
ourc
es,
22
8 8
1 5
- 6
4 3
7 2
1 8
10
3 6
9 5
2 4
3 3
4 5
20
2 e
g th
e m
edia
14
%17
%9%
9%
55
%
- 19
%42
%13
%19
%6%
16%
12%
19%
10
%12
%20
%21
%6%
21%
15%
16%
9%28
%
15%
12
%
Fi
rms
or in
divi
dual
s 18
3
11
1 4
1 1
- 9
6 2
1 5
5 8
4 2
2 10
-
1 3
6 5
17
1 in
my
cons
titue
ncy
12%
5%13
%
5%
45%
8%
3%-
41%
15%
4%16
%8%
9%
24%
9%4%
10%
26%
- 5%
13%
14%
26%
12
%
7%
N
ot s
tate
d 35
4
26
4 -
6 4
- 4
6 15
2
19
9 5
13
7 5
10
4 7
4 8
1 30
5
23
%9%
31%
31
%
- 34
%13
%-
18%
16%
39%
27%
31%
17%
14
%27
%15
%19
%27
%23
%41
%20
%17
%7%
22
%
29%
PAR
LIA
ME
NTA
RY
PAN
EL
SUR
VEY
- JU
NE
200
5
Q1.
Irre
spec
tive
of h
ow fa
mili
ar y
ou a
re w
ith th
ese
sect
ors,
we
wou
ld li
ke to
ask
you
abo
ut h
ow y
ou h
ave
gain
ed y
our k
now
ledg
e of
RET
AILI
NG
Leas
t inf
luen
tial
Bas
e: A
ll re
spon
dent
s
Page
24
Pre
pare
d by
: Com
mun
icat
eRes
earc
h Li
mite
d
Fiel
dwor
k: 7
th J
une
- 24t
h Ju
ne 2
005

PAR
TY
REG
ION
D
ATE
OF
BIR
TH
MA
RG
INA
LITY
LE
NG
TH O
F SE
RVI
CE
GEN
DER
Scot
Mid
s
1986
Li
b
Lon-
&
&
Pr
e-
1940
-19
50-
0.
1-
10.0
-20
.0-
or
19
87-
1992
-19
97-
Fe-
To
tal
Con
sLa
b D
ems
Oth
er
don
Sout
hW
ales
NI
East
Nor
th19
4019
4919
59
1960
+9.
9%19
.9%
29.9
%30
%+
befo
re19
9119
9620
0020
01+
Mal
e m
ale
U
nwei
ghte
d T
otal
15
4 51
80
20
3
14
39
9 14
42
36
7
63
52
32
52
47
24
31
18
18
20
44
17
137
17
W
eigh
ted
Tot
al
154
46
85
14
9 17
31
9
21
37
38
6 62
54
32
48
44
24
37
17
17
21
45
19
13
7 17
100%
100%
100%
10
0%
100%
10
0%10
0%10
0%10
0%10
0%10
0%10
0%10
0%10
0%
100%
100%
100%
100%
100%
100%
100%
100%
100%
100%
10
0 %
100 %
True
60
13
40
4
2 6
7 5
5 19
17
4
22
27
6 17
18
12
13
6
4 11
22
6
54
6
39%
28%
47%
29
%
26%
37
%24
%52
%24
%50
%45
%59
%36
%51
%
20%
36%
41%
48%
34%
32%
22%
55%
48%
31%
39
%
34%
Fals
e 83
31
41
8
3 10
22
4
12
18
17
3 36
23
22
30
23
12
18
11
12
8
17
13
72
11
54
%68
%49
%
60%
29
%
58%
72%
48%
56%
47%
46%
41%
58%
43%
67
%62
%53
%49
%48
%63
%70
%39
%38
%69
%
53%
66
%
N
ot s
tate
d 11
2
3 2
4 1
1 -
4 1
4 -
4 3
4 1
3 1
7 1
1 1
7 -
11
-
7%4%
4%
11%
45
%
5%5%
- 20
%2%
10%
- 6%
6%
13%
2%6%
3%18
%5%
8%6%
15%
- 8%
-
PAR
LIA
ME
NTA
RY
PAN
EL
SUR
VEY
- JU
NE
200
5
Q2.
As
far a
s yo
u ca
n te
ll, is
eac
h of
thes
e st
atem
ents
abo
ut m
anuf
actu
ring
in th
e U
K tr
ue o
r fal
se?
Man
ufac
turin
g ac
coun
tsfo
r mor
e th
an 6
0% o
f UK
exp
orts
B
ase:
All
resp
onde
nts
Page
25
Pre
pare
d by
: Com
mun
icat
eRes
earc
h Li
mite
d
Fiel
dwor
k: 7
th J
une
- 24t
h Ju
ne 2
005

PAR
TY
REG
ION
D
ATE
OF
BIR
TH
MA
RG
INA
LITY
LE
NG
TH O
F SE
RVI
CE
GEN
DER
Scot
Mid
s
1986
Li
b
Lon-
&
&
Pr
e-
1940
-19
50-
0.
1-
10.0
-20
.0-
or
19
87-
1992
-19
97-
Fe-
To
tal
Con
sLa
b D
ems
Oth
er
don
Sout
hW
ales
NI
East
Nor
th19
4019
4919
59
1960
+9.
9%19
.9%
29.9
%30
%+
befo
re19
9119
9620
0020
01+
Mal
e m
ale
U
nwei
ghte
d T
otal
15
4 51
80
20
3
14
39
9 14
42
36
7
63
52
32
52
47
24
31
18
18
20
44
17
137
17
W
eigh
ted
Tot
al
154
46
85
14
9 17
31
9
21
37
38
6 62
54
32
48
44
24
37
17
17
21
45
19
13
7 17
100%
100%
100%
10
0%
100%
10
0%10
0%10
0%10
0%10
0%10
0%10
0%10
0%10
0%
100%
100%
100%
100%
100%
100%
100%
100%
100%
100%
10
0 %
100 %
True
67
17
43
7
- 11
10
6
5 16
19
2
28
26
10
19
20
10
17
7 8
8 19
9
59
8
43%
36%
51%
51
%
- 63
%33
%64
%22
%44
%49
%28
%46
%49
%
31%
39%
46%
43%
46%
40%
49%
36%
41%
50%
43
%
45%
Fals
e 75
27
37
5
5 5
19
3 11
20
16
5
28
24
18
28
21
12
14
9 7
12
19
9 65
10
48%
58%
44%
38
%
55%
32
%60
%36
%53
%54
%42
%72
%46
%44
%
56%
58%
48%
48%
37%
55%
43%
58%
42%
50%
48
%
55%
Not
sta
ted
13
3 5
2 4
1 2
- 5
1 3
- 5
4 4
2 3
2 7
1 1
1 8
- 13
-
8%
6%5%
11
%
45%
5%
7%-
26%
2%9%
- 8%
7%
13%
3%6%
9%18
%5%
7%6%
17%
- 9%
-
PAR
LIA
ME
NTA
RY
PAN
EL
SUR
VEY
- JU
NE
200
5
Q2.
As
far a
s yo
u ca
n te
ll, is
eac
h of
thes
e st
atem
ents
abo
ut m
anuf
actu
ring
in th
e U
K tr
ue o
r fal
se?
The
UK
exp
orts
mor
e en
gine
erin
g pr
oduc
ts th
an it
impo
rts
Bas
e: A
ll re
spon
dent
s
Page
26
P
repa
red
by: C
omm
unic
ateR
esea
rch
Lim
ited
Fi
eldw
ork:
7th
Jun
e - 2
4th
June
200
5

PAR
TY
REG
ION
D
ATE
OF
BIR
TH
MA
RG
INA
LITY
LE
NG
TH O
F SE
RVI
CE
GEN
DER
Scot
Mid
s
1986
Li
b
Lon-
&
&
Pr
e-
1940
-19
50-
0.
1-
10.0
-20
.0-
or
19
87-
1992
-19
97-
Fe-
To
tal
Con
sLa
b D
ems
Oth
er
don
Sout
hW
ales
NI
East
Nor
th19
4019
4919
59
1960
+9.
9%19
.9%
29.9
%30
%+
befo
re19
9119
9620
0020
01+
Mal
e m
ale
U
nwei
ghte
d T
otal
15
4 51
80
20
3
14
39
9 14
42
36
7
63
52
32
52
47
24
31
18
18
20
44
17
137
17
W
eigh
ted
Tot
al
154
46
85
14
9 17
31
9
21
37
38
6 62
54
32
48
44
24
37
17
17
21
45
19
13
7 17
100%
100%
100%
10
0%
100%
10
0%10
0%10
0%10
0%10
0%10
0%10
0%10
0%10
0%
100%
100%
100%
100%
100%
100%
100%
100%
100%
100%
10
0 %
100 %
True
43
8
30
3 3
6 5
3 5
10
13
1 19
19
4
11
14
6 11
5
8 2
15
7 41
2
28
%17
%35
%
20%
29
%
37%
15%
36%
25%
28%
34%
14%
32%
35%
12
%22
%33
%26
%31
%30
%49
%8%
33%
36%
30
%
13%
Fals
e 10
0 36
52
10
2
10
24
6 12
25
24
5
39
34
22
34
28
17
21
11
9 18
25
12
85
15
65%
78%
61%
74
%
26%
58
%77
%64
%55
%67
%63
%86
%64
%64
%
67%
71%
65%
70%
55%
65%
51%
85%
56%
64%
62
%
87%
Not
sta
ted
11
2 3
1 4
1 3
- 4
2 1
- 3
1 7
4 1
1 5
1 -
1 5
- 11
-
7%
5%4%
6%
45
%
5%8%
- 20
%5%
3%-
5%2%
21
%7%
2%3%
15%
5%-
6%11
%-
8%
-
PAR
LIA
ME
NTA
RY
PAN
EL
SUR
VEY
- JU
NE
200
5
Q2.
As
far a
s yo
u ca
n te
ll, is
eac
h of
thes
e st
atem
ents
abo
ut m
anuf
actu
ring
in th
e U
K tr
ue o
r fal
se?
The
UK
spe
nds
a hi
gher
pro
port
ion
of it
s G
DP
on in
vest
men
t tha
n m
ost o
ther
lead
ing
indu
stria
lised
cou
ntrie
s B
ase:
All
resp
onde
nts
Page
27
Pre
pare
d by
: Com
mun
icat
eRes
earc
h Li
mite
d
Fiel
dwor
k: 7
th J
une
- 24t
h Ju
ne 2
005
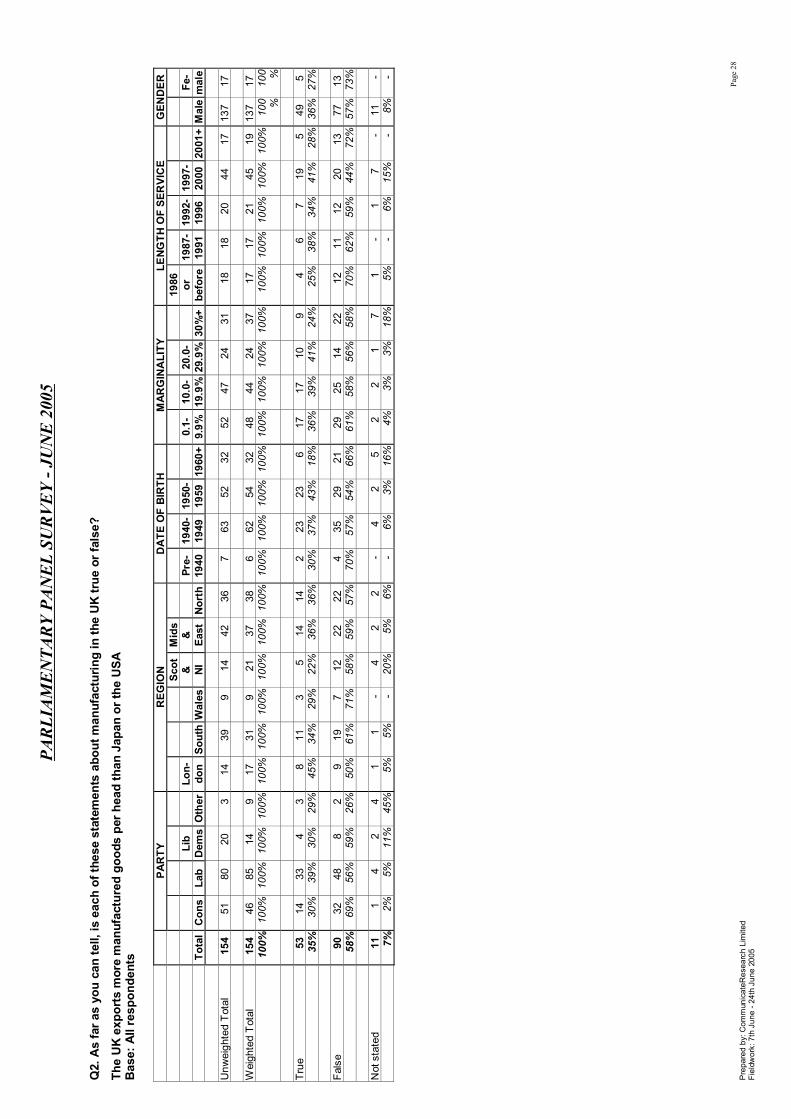
PAR
TY
REG
ION
D
ATE
OF
BIR
TH
MA
RG
INA
LITY
LE
NG
TH O
F SE
RVI
CE
GEN
DER
Scot
Mid
s
1986
Li
b
Lon-
&
&
Pr
e-
1940
-19
50-
0.
1-
10.0
-20
.0-
or
19
87-
1992
-19
97-
Fe-
To
tal
Con
sLa
b D
ems
Oth
er
don
Sout
hW
ales
NI
East
Nor
th19
4019
4919
59
1960
+9.
9%19
.9%
29.9
%30
%+
befo
re19
9119
9620
0020
01+
Mal
e m
ale
U
nwei
ghte
d T
otal
15
4 51
80
20
3
14
39
9 14
42
36
7
63
52
32
52
47
24
31
18
18
20
44
17
137
17
W
eigh
ted
Tot
al
154
46
85
14
9 17
31
9
21
37
38
6 62
54
32
48
44
24
37
17
17
21
45
19
13
7 17
100%
100%
100%
10
0%
100%
10
0%10
0%10
0%10
0%10
0%10
0%10
0%10
0%10
0%
100%
100%
100%
100%
100%
100%
100%
100%
100%
100%
10
0 %
100 %
True
53
14
33
4
3 8
11
3 5
14
14
2 23
23
6
17
17
10
9 4
6 7
19
5 49
5
35
%30
%39
%
30%
29
%
45%
34%
29%
22%
36%
36%
30%
37%
43%
18
%36
%39
%41
%24
%25
%38
%34
%41
%28
%
36%
27
%
Fa
lse
90
32
48
8 2
9 19
7
12
22
22
4 35
29
21
29
25
14
22
12
11
12
20
13
77
13
58%
69%
56%
59
%
26%
50
%61
%71
%58
%59
%57
%70
%57
%54
%
66%
61%
58%
56%
58%
70%
62%
59%
44%
72%
57
%
73%
Not
sta
ted
11
1 4
2 4
1 1
- 4
2 2
- 4
2 5
2 2
1 7
1 -
1 7
- 11
-
7%
2%5%
11
%
45%
5%
5%-
20%
5%6%
- 6%
3%
16%
4%3%
3%18
%5%
- 6%
15%
- 8%
-
PAR
LIA
ME
NTA
RY
PAN
EL
SUR
VEY
- JU
NE
200
5
Q2.
As
far a
s yo
u ca
n te
ll, is
eac
h of
thes
e st
atem
ents
abo
ut m
anuf
actu
ring
in th
e U
K tr
ue o
r fal
se?
The
UK
exp
orts
mor
e m
anuf
actu
red
good
s pe
r hea
d th
an J
apan
or t
he U
SA
Bas
e: A
ll re
spon
dent
s
Page
28
P
repa
red
by: C
omm
unic
ateR
esea
rch
Lim
ited
Fi
eldw
ork:
7th
Jun
e - 2
4th
June
200
5

PAR
TY
REG
ION
D
ATE
OF
BIR
TH
MA
RG
INA
LITY
LE
NG
TH O
F SE
RVI
CE
GEN
DER
Scot
Mid
s
1986
Li
b
Lon-
&
&
Pr
e-
1940
-19
50-
0.
1-
10.0
-20
.0-
or
19
87-
1992
-19
97-
Fe-
To
tal
Con
sLa
b D
ems
Oth
er
don
Sout
hW
ales
NI
East
Nor
th19
4019
4919
59
1960
+9.
9%19
.9%
29.9
%30
%+
befo
re19
9119
9620
0020
01+
Mal
e m
ale
U
nwei
ghte
d T
otal
15
4 51
80
20
3
14
39
9 14
42
36
7
63
52
32
52
47
24
31
18
18
20
44
17
137
17
W
eigh
ted
Tot
al
154
46
85
14
9 17
31
9
21
37
38
6 62
54
32
48
44
24
37
17
17
21
45
19
13
7 17
100%
100%
100%
10
0%
100%
10
0%10
0%10
0%10
0%10
0%10
0%10
0%10
0%10
0%
100%
100%
100%
100%
100%
100%
100%
100%
100%
100%
10
0 %
100 %
True
47
9
33
5 -
8 9
2 3
12
13
1 20
19
7
15
12
9 11
2
6 8
17
3 43
4
31
%20
%38
%
37%
-
47%
29%
25%
12%
33%
33%
13%
32%
36%
23
%32
%26
%37
%30
%13
%35
%37
%38
%16
%
32%
22
%
Fa
lse
94
34
48
7 5
8 19
7
14
22
23
5 37
32
19
30
31
12
21
13
11
10
22
16
80
14
61%
74%
57%
48
%
55%
48
%61
%75
%68
%60
%62
%87
%61
%60
%
59%
63%
70%
50%
56%
78%
65%
48%
50%
84%
59
%
78%
Not
sta
ted
13
3 4
2 4
1 3
- 4
3 2
- 4
2 6
3 2
3 5
1 -
3 6
- 13
-
8%
6%5%
15
%
45%
5%
10%
- 20
%8%
5%-
7%5%
19
%6%
3%13
%15
%8%
- 15
%12
%-
9%
-
PAR
LIA
ME
NTA
RY
PAN
EL
SUR
VEY
- JU
NE
200
5
Q2.
As
far a
s yo
u ca
n te
ll, is
eac
h of
thes
e st
atem
ents
abo
ut m
anuf
actu
ring
in th
e U
K tr
ue o
r fal
se?
UK
man
ufac
ture
d ex
port
s ha
ve d
oubl
ed in
the
last
10
year
s B
ase:
All
resp
onde
nts
Page
29
P
repa
red
by: C
omm
unic
ateR
esea
rch
Lim
ited
Fi
eldw
ork:
7th
Jun
e - 2
4th
June
200
5

PAR
TY
REG
ION
D
ATE
OF
BIR
TH
MA
RG
INA
LITY
LE
NG
TH O
F SE
RVI
CE
GEN
DER
Scot
Mid
s
1986
Li
b
Lon-
&
&
Pr
e-
1940
-19
50-
0.
1-
10.0
-20
.0-
or
19
87-
1992
-19
97-
Fe-
To
tal
Con
sLa
b D
ems
Oth
er
don
Sout
hW
ales
NI
East
Nor
th19
4019
4919
59
1960
+9.
9%19
.9%
29.9
%30
%+
befo
re19
9119
9620
0020
01+
Mal
e m
ale
U
nwei
ghte
d T
otal
15
4 51
80
20
3
14
39
9 14
42
36
7
63
52
32
52
47
24
31
18
18
20
44
17
137
17
W
eigh
ted
Tot
al
154
46
85
14
9 17
31
9
21
37
38
6 62
54
32
48
44
24
37
17
17
21
45
19
13
7 17
100%
100%
100%
10
0%
100%
10
0%10
0%10
0%10
0%10
0%10
0%10
0%10
0%10
0%
100%
100%
100%
100%
100%
100%
100%
100%
100%
100%
10
0 %
100 %
True
47
-
44
- 3
7 4
4 9
8 14
1
21
18
7 10
11
6
20
4 5
5 19
9
41
6
30%
- 52
%
- 29
%
40%
14%
39%
43%
23%
37%
14%
34%
34%
20
%20
%25
%25
%53
%22
%28
%22
%42
%47
%
30%
34
%
Fa
lse
93
46
33
11
2 9
26
6 6
27
19
5 35
32
21
36
30
14
12
13
10
15
19
10
82
11
60%
100%
39%
80
%
26%
55
%82
%61
%31
%72
%49
%86
%56
%60
%
64%
74%
69%
59%
32%
74%
57%
71%
41%
53%
60
%
61%
Not
sta
ted
15
- 8
3 4
1 1
- 5
2 5
- 6
3 5
3 3
4 5
1 3
1 7
- 14
1
9%
- 9%
20
%
45%
5%
4%-
26%
5%14
%-
10%
6%
16%
6%6%
16%
15%
4%15
%6%
16%
- 10
%
5%
PAR
LIA
ME
NTA
RY
PAN
EL
SUR
VEY
- JU
NE
200
5
Q2.
As
far a
s yo
u ca
n te
ll, is
eac
h of
thes
e st
atem
ents
abo
ut m
anuf
actu
ring
in th
e U
K tr
ue o
r fal
se?
The
UK
gov
ernm
ent h
as d
one
mor
e fo
r man
ufac
turin
g in
the
last
four
yea
rs th
an a
ny o
ther
gov
ernm
ent i
n th
e G
8 B
ase:
All
resp
onde
nts
Page
30
P
repa
red
by: C
omm
unic
ateR
esea
rch
Lim
ited
Fi
eldw
ork:
7th
Jun
e - 2
4th
June
200
5

PAR
TY
REG
ION
D
ATE
OF
BIR
TH
MA
RG
INA
LITY
LE
NG
TH O
F SE
RVI
CE
GEN
DER
Scot
Mid
s
1986
Li
b
Lon-
&
&
Pr
e-
1940
-19
50-
0.
1-
10.0
-20
.0-
or
19
87-
1992
-19
97-
Fe-
To
tal
Con
sLa
b D
ems
Oth
er
don
Sout
hW
ales
NI
East
Nor
th19
4019
4919
59
1960
+9.
9%19
.9%
29.9
%30
%+
befo
re19
9119
9620
0020
01+
Mal
e m
ale
U
nwei
ghte
d T
otal
15
4 51
80
20
3
14
39
9 14
42
36
7
63
52
32
52
47
24
31
18
18
20
44
17
137
17
W
eigh
ted
Tot
al
154
46
85
14
9 17
31
9
21
37
38
6 62
54
32
48
44
24
37
17
17
21
45
19
13
7 17
100%
100%
100%
10
0%
100%
10
0%10
0%10
0%10
0%10
0%10
0%10
0%10
0%10
0%
100%
100%
100%
100%
100%
100%
100%
100%
100%
100%
10
0 %
100 %
True
10
6 38
55
11
3
14
24
5 17
21
25
4
41
38
23
37
32
12
25
16
13
11
28
16
92
14
69
%82
%65
%
78%
29
%
82%
77%
55%
80%
55%
67%
70%
67%
70%
70
%77
%72
%49
%68
%90
%77
%51
%62
%85
%
68%
79
%
Fa
lse
37
7 26
2
2 2
6 4
- 14
10
2
15
16
4 8
11
12
7 1
4 9
12
3 33
4
24
%15
%30
%
15%
26
%
13%
20%
45%
- 37
%27
%30
%25
%30
%
11%
16%
26%
48%
18%
5%23
%43
%27
%15
%
24%
21
%
N
ot s
tate
d 11
2
4 1
4 1
1 -
4 3
2 -
5 -
6 4
1 1
5 1
- 1
5 -
11
-
7%4%
5%
6%
45%
5%
3%-
20%
7%6%
- 8%
- 19
%8%
2%3%
15%
5%-
6%11
%-
8%
-
PAR
LIA
ME
NTA
RY
PAN
EL
SUR
VEY
- JU
NE
200
5
Q2.
As
far a
s yo
u ca
n te
ll, is
eac
h of
thes
e st
atem
ents
abo
ut m
anuf
actu
ring
in th
e U
K tr
ue o
r fal
se?
Serv
ices
ear
n m
ore
for t
he U
K b
alan
ce o
f pay
men
ts th
an m
anuf
actu
red
good
s B
ase:
All
resp
onde
nts
Page
31
P
repa
red
by: C
omm
unic
ateR
esea
rch
Lim
ited
Fi
eldw
ork:
7th
Jun
e - 2
4th
June
200
5

PAR
TY
REG
ION
D
ATE
OF
BIR
TH
MA
RG
INA
LITY
LE
NG
TH O
F SE
RVI
CE
GEN
DER
Scot
Mid
s
1986
Li
b
Lon-
&
&
Pr
e-
1940
-19
50-
0.
1-
10.0
-20
.0-
or
19
87-
1992
-19
97-
Fe-
To
tal
Con
sLa
b D
ems
Oth
er
don
Sout
hW
ales
NI
East
Nor
th19
4019
4919
59
1960
+9.
9%19
.9%
29.9
%30
%+
befo
re19
9119
9620
0020
01+
Mal
e m
ale
U
nwei
ghte
d T
otal
15
4 51
80
20
3
14
39
9 14
42
36
7
63
52
32
52
47
24
31
18
18
20
44
17
137
17
W
eigh
ted
Tot
al
154
46
85
14
9 17
31
9
21
37
38
6 62
54
32
48
44
24
37
17
17
21
45
19
13
7 17
100%
100%
100%
10
0%
100%
10
0%10
0%10
0%10
0%10
0%10
0%10
0%10
0%10
0%
100%
100%
100%
100%
100%
100%
100%
100%
100%
100%
10
0 %
100 %
True
71
26
35
7
3 6
17
4 14
16
14
5
25
27
14
18
27
9 17
13
9
8 17
10
62
9
46
%56
%42
%
48%
29
%
32%
55%
39%
68%
42%
38%
73%
41%
50%
43
%38
%61
%36
%45
%74
%55
%38
%37
%51
%
45%
49
%
Fa
lse
71
18
44
6 2
11
13
6 3
19
20
2 33
24
12
26
16
15
14
4
8 12
23
8
63
8
46%
40%
52%
42
%
26%
63
%40
%61
%12
%51
%52
%27
%53
%44
%
38%
54%
36%
60%
37%
21%
45%
56%
51%
42%
46
%
44%
Not
sta
ted
13
2 6
2 4
1 1
- 4
3 4
- 4
3 6
4 2
1 7
1 -
1 6
1 12
1
8%
4%7%
11
%
45%
5%
5%-
20%
7%10
%-
6%6%
19
%8%
3%3%
18%
5%-
6%12
%7%
9%
6%
PAR
LIA
ME
NTA
RY
PAN
EL
SUR
VEY
- JU
NE
200
5
Q2.
As
far a
s yo
u ca
n te
ll, is
eac
h of
thes
e st
atem
ents
abo
ut m
anuf
actu
ring
in th
e U
K tr
ue o
r fal
se?
Man
ufac
ture
rs e
xpor
t les
s fr
om th
e U
K to
day
than
they
did
10
year
s ag
o B
ase:
All
resp
onde
nts
Page
32
P
repa
red
by: C
omm
unic
ateR
esea
rch
Lim
ited
Fi
eldw
ork:
7th
Jun
e - 2
4th
June
200
5

PAR
TY
REG
ION
D
ATE
OF
BIR
TH
MA
RG
INA
LITY
LE
NG
TH O
F SE
RVI
CE
GEN
DER
Scot
Mid
s
1986
Li
b
Lon-
&
&
Pr
e-
1940
-19
50-
0.
1-
10.0
-20
.0-
or
19
87-
1992
-19
97-
Fe-
To
tal
Con
sLa
b D
ems
Oth
er
don
Sout
hW
ales
NI
East
Nor
th19
4019
4919
59
1960
+9.
9%19
.9%
29.9
%30
%+
befo
re19
9119
9620
0020
01+
Mal
e m
ale
U
nwei
ghte
d T
otal
15
4 51
80
20
3
14
39
9 14
42
36
7
63
52
32
52
47
24
31
18
18
20
44
17
137
17
W
eigh
ted
Tot
al
154
46
85
14
9 17
31
9
21
37
38
6 62
54
32
48
44
24
37
17
17
21
45
19
13
7 17
100%
100%
100%
10
0%
100%
10
0%10
0%10
0%10
0%10
0%10
0%10
0%10
0%10
0%
100%
100%
100%
100%
100%
100%
100%
100%
100%
100%
10
0 %
100 %
True
10
7 46
46
12
3
11
27
2 14
27
26
3
46
35
22
38
35
14
19
13
13
14
28
13
95
12
69
%10
0%54
%
89%
29
%
63%
87%
25%
68%
71%
68%
56%
75%
65%
68
%78
%81
%58
%52
%74
%79
%68
%61
%72
%
69%
70
%
Fa
lse
37
- 34
1
2 6
4 7
3 8
10
2 12
18
5
9 7
10
10
4 2
4 12
5
31
5
24%
- 40
%
5%
26%
32
%13
%75
%12
%21
%25
%28
%20
%33
%
15%
18%
17%
42%
27%
26%
13%
21%
28%
28%
23
%
30%
Not
sta
ted
11
- 6
1 4
1 -
- 4
3 3
1 3
1 5
2 1
- 8
- 1
2 5
- 11
-
7%
- 7%
6%
45
%
5%-
- 20
%8%
7%16
%5%
2%
16%
4%2%
- 21
%-
8%11
%11
%-
8%
-
PAR
LIA
ME
NTA
RY
PAN
EL
SUR
VEY
- JU
NE
200
5
Q2.
As
far a
s yo
u ca
n te
ll, is
eac
h of
thes
e st
atem
ents
abo
ut m
anuf
actu
ring
in th
e U
K tr
ue o
r fal
se?
SME
man
ufac
ture
rs s
trug
gle
to c
ope
with
all
the
red
tape
& re
gula
tion
they
now
hav
e to
dea
l with
B
ase:
All
resp
onde
nts
Page
33
P
repa
red
by: C
omm
unic
ateR
esea
rch
Lim
ited
Fi
eldw
ork:
7th
Jun
e - 2
4th
June
200
5

PAR
TY
REG
ION
D
ATE
OF
BIR
TH
MA
RG
INA
LITY
LE
NG
TH O
F SE
RVI
CE
GEN
DER
Scot
Mid
s
1986
Li
b
Lon-
&
&
Pr
e-
1940
-19
50-
0.
1-
10.0
-20
.0-
or
19
87-
1992
-19
97-
Fe-
To
tal
Con
sLa
b D
ems
Oth
er
don
Sout
hW
ales
NI
East
Nor
th19
4019
4919
59
1960
+9.
9%19
.9%
29.9
%30
%+
befo
re19
9119
9620
0020
01+
Mal
e m
ale
U
nwei
ghte
d T
otal
15
4 51
80
20
3
14
39
9 14
42
36
7
63
52
32
52
47
24
31
18
18
20
44
17
137
17
W
eigh
ted
Tot
al
154
46
85
14
9 17
31
9
21
37
38
6 62
54
32
48
44
24
37
17
17
21
45
19
13
7 17
100%
100%
100%
10
0%
100%
10
0%10
0%10
0%10
0%10
0%10
0%10
0%10
0%10
0%
100%
100%
100%
100%
100%
100%
100%
100%
100%
100%
10
0 %
100 %
Agr
ee
83
28
44
6 5
14
14
5 14
19
17
5
38
28
13
28
25
12
18
9 7
13
24
13
73
10
54
%60
%52
%
45%
55
%
82%
46%
52%
65%
52%
44%
72%
61%
52%
39
%57
%57
%49
%49
%54
%39
%65
%54
%69
%
53%
57
%
D
isag
ree
40
12
25
3 -
- 12
4
3 12
10
2
18
15
6 8
12
10
9 6
7 4
10
4 37
3
26
%26
%29
%
24%
-
- 37
%38
%16
%31
%26
%28
%29
%27
%
18%
17%
28%
43%
25%
37%
42%
21%
21%
22%
27
%
15%
Don
't kn
ow/n
o op
inio
n 25
7
14
3 -
2 5
1 -
6 10
-
5 10
10
13
6
2 4
1 2
3 6
2 20
5
16
%15
%17
%
25%
-
13%
17%
10%
- 17
%26
%-
8%18
%
30%
26%
13%
8%12
%9%
11%
14%
14%
8%
15%
28
%
N
ot s
tate
d 6
- 1
1 4
1 -
- 4
- 1
- 1
1 4
- 1
- 5
- 1
- 5
- 6
-
4%-
2%
6%
45%
5%
- -
20%
- 3%
- 1%
2%
13%
- 2%
- 15
%-
8%-
11%
- 5%
-
PAR
LIA
ME
NTA
RY
PAN
EL
SUR
VEY
- JU
NE
200
5
Q3.
Do
you
agre
e or
dis
agre
e w
ith e
ach
of th
ese
stat
emen
ts a
bout
gov
ernm
ent f
unde
d bu
sine
ss s
uppo
rt a
nd th
e w
ay c
ompa
nies
are
regu
late
d?
The
DTI
sho
uld
conc
entr
ate
mor
e on
sup
porti
ng U
K ex
port
s th
an e
ncou
ragi
ng fo
reig
n di
rect
inve
stm
ent
Bas
e: A
ll re
spon
dent
s
Page
34
P
repa
red
by: C
omm
unic
ateR
esea
rch
Lim
ited
Fi
eldw
ork:
7th
Jun
e - 2
4th
June
200
5

PAR
TY
REG
ION
D
ATE
OF
BIR
TH
MA
RG
INA
LITY
LE
NG
TH O
F SE
RVI
CE
GEN
DER
Scot
Mid
s
1986
Li
b
Lon-
&
&
Pr
e-
1940
-19
50-
0.
1-
10.0
-20
.0-
or
19
87-
1992
-19
97-
Fe-
To
tal
Con
sLa
b D
ems
Oth
er
don
Sout
hW
ales
NI
East
Nor
th19
4019
4919
59
1960
+9.
9%19
.9%
29.9
%30
%+
befo
re19
9119
9620
0020
01+
Mal
e m
ale
U
nwei
ghte
d T
otal
15
4 51
80
20
3
14
39
9 14
42
36
7
63
52
32
52
47
24
31
18
18
20
44
17
137
17
W
eigh
ted
Tot
al
154
46
85
14
9 17
31
9
21
37
38
6 62
54
32
48
44
24
37
17
17
21
45
19
13
7 17
100%
100%
100%
10
0%
100%
10
0%10
0%10
0%10
0%10
0%10
0%10
0%10
0%10
0%
100%
100%
100%
100%
100%
100%
100%
100%
100%
100%
10
0 %
100 %
Agr
ee
79
37
35
6 -
12
17
3 6
22
18
3 33
30
13
29
25
12
13
11
12
5
23
9 72
6
51
%80
%41
%
47%
-
72%
54%
35%
28%
59%
47%
56%
53%
55%
40
%60
%57
%48
%34
%67
%68
%26
%50
%48
%
53%
37
%
D
isag
ree
55
5 41
4
5 2
9 6
10
9 18
3
23
19
9 14
13
10
18
5
4 14
13
10
46
8
36
%11
%48
%
30%
55
%
13%
30%
65%
46%
25%
48%
44%
38%
36%
29
%29
%31
%42
%47
%28
%22
%65
%28
%52
%
34%
49
%
D
on't
know
/no
opin
ion
16
4 9
2 -
2 5
- 1
6 2
- 5
5 6
6 4
2 3
1 2
2 5
- 13
2
10
%9%
11%
17
%
- 10
%15
%-
6%16
%5%
- 8%
9%
19%
11%
10%
10%
8%5%
10%
9%10
%-
10%
14
%
N
ot s
tate
d 5
- -
1 4
1 -
- 4
- -
- 1
- 4
- 1
- 4
- -
- 5
- 5
-
3%-
- 6%
45
%
5%-
- 20
%-
- -
1%-
13%
- 2%
- 11
%-
- -
11%
- 4%
-
PAR
LIA
ME
NTA
RY
PAN
EL
SUR
VEY
- JU
NE
200
5
Q3.
Do
you
agre
e or
dis
agre
e w
ith e
ach
of th
ese
stat
emen
ts a
bout
gov
ernm
ent f
unde
d bu
sine
ss s
uppo
rt a
nd th
e w
ay c
ompa
nies
are
regu
late
d?
The
regi
me
for r
egio
nal g
rant
aid
to c
ompa
nies
sho
uld
be o
verh
aule
d to
min
imis
e th
e di
stor
tive
effe
cts
betw
een
regi
ons
Bas
e: A
ll re
spon
dent
s
Page
35
P
repa
red
by: C
omm
unic
ateR
esea
rch
Lim
ited
Fi
eldw
ork:
7th
Jun
e - 2
4th
June
200
5

PAR
TY
REG
ION
D
ATE
OF
BIR
TH
MA
RG
INA
LITY
LE
NG
TH O
F SE
RVI
CE
GEN
DER
Scot
Mid
s
1986
Li
b
Lon-
&
&
Pr
e-
1940
-19
50-
0.
1-
10.0
-20
.0-
or
19
87-
1992
-19
97-
Fe-
To
tal
Con
sLa
b D
ems
Oth
er
don
Sout
hW
ales
NI
East
Nor
th19
4019
4919
59
1960
+9.
9%19
.9%
29.9
%30
%+
befo
re19
9119
9620
0020
01+
Mal
e m
ale
U
nwei
ghte
d T
otal
15
4 51
80
20
3
14
39
9 14
42
36
7
63
52
32
52
47
24
31
18
18
20
44
17
137
17
W
eigh
ted
Tot
al
154
46
85
14
9 17
31
9
21
37
38
6 62
54
32
48
44
24
37
17
17
21
45
19
13
7 17
100%
100%
100%
10
0%
100%
10
0%10
0%10
0%10
0%10
0%10
0%10
0%10
0%10
0%
100%
100%
100%
100%
100%
100%
100%
100%
100%
100%
10
0 %
100 %
Agr
ee
60
8 45
4
2 7
7 7
5 17
17
4
25
26
5 13
17
14
16
6
8 12
18
4
55
5
39%
18%
53%
29
%
26%
40
%23
%71
%25
%44
%46
%60
%41
%48
%
15%
26%
40%
56%
43%
33%
49%
56%
39%
22%
40
%
28%
Dis
agre
e 39
20
13
6
- 2
15
- -
12
10
- 16
15
8
18
12
4 5
4 5
6 12
2
35
4
25%
44%
15%
44
%
- 13
%48
%-
- 32
%26
%-
26%
28%
25
%38
%28
%17
%12
%23
%27
%30
%27
%12
%
26%
22
%
D
on't
know
/no
opin
ion
49
17
26
3 3
7 9
3 12
9
10
3 18
13
15
17
12
7
13
8 3
3 10
12
40
9
32
%38
%31
%
22%
29
%
42%
29%
29%
55%
24%
26%
40%
29%
25%
47
%36
%28
%27
%34
%44
%17
%14
%22
%66
%
29%
51
%
N
ot s
tate
d 6
- 1
1 4
1 -
- 4
- 1
- 2
- 4
- 2
- 4
- 1
- 5
- 6
-
4%-
1%
6%
45%
5%
- -
20%
- 3%
- 3%
- 13
%-
4%-
11%
- 6%
- 11
%-
4%
-
PAR
LIA
ME
NTA
RY
PAN
EL
SUR
VEY
- JU
NE
200
5
Q3.
Do
you
agre
e or
dis
agre
e w
ith e
ach
of th
ese
stat
emen
ts a
bout
gov
ernm
ent f
unde
d bu
sine
ss s
uppo
rt a
nd th
e w
ay c
ompa
nies
are
regu
late
d?
My
perc
eptio
n is
that
Bus
ines
s Li
nk g
ener
ally
doe
s a
good
job
Bas
e: A
ll re
spon
dent
s
Page
36
Pre
pare
d by
: Com
mun
icat
eRes
earc
h Li
mite
d
Fiel
dwor
k: 7
th J
une
- 24t
h Ju
ne 2
005

PAR
TY
REG
ION
D
ATE
OF
BIR
TH
MA
RG
INA
LITY
LE
NG
TH O
F SE
RVI
CE
GEN
DER
Scot
Mid
s
1986
Li
b
Lon-
&
&
Pr
e-
1940
-19
50-
0.
1-
10.0
-20
.0-
or
19
87-
1992
-19
97-
Fe-
To
tal
Con
sLa
b D
ems
Oth
er
don
Sout
hW
ales
NI
East
Nor
th19
4019
4919
59
1960
+9.
9%19
.9%
29.9
%30
%+
befo
re19
9119
9620
0020
01+
Mal
e m
ale
U
nwei
ghte
d T
otal
15
4 51
80
20
3
14
39
9 14
42
36
7
63
52
32
52
47
24
31
18
18
20
44
17
137
17
W
eigh
ted
Tot
al
154
46
85
14
9 17
31
9
21
37
38
6 62
54
32
48
44
24
37
17
17
21
45
19
13
7 17
100%
100%
100%
10
0%
100%
10
0%10
0%10
0%10
0%10
0%10
0%10
0%10
0%10
0%
100%
100%
100%
100%
100%
100%
100%
100%
100%
100%
10
0 %
100 %
Agr
ee
50
38
5 7
- 6
20
1 -
13
10
3 18
14
15
25
19
5
1 10
3
6 13
4
44
6
32%
82%
6%
49%
-
34%
63%
16%
- 34
%26
%42
%30
%26
%
46%
51%
44%
19%
3%56
%20
%27
%29
%24
%
32%
35
%
D
isag
ree
91
4 77
5
5 9
9 8
17
22
26
4 40
36
11
20
21
19
31
7
12
15
26
13
81
10
59
%9%
90%
35
%
55%
53
%29
%84
%80
%59
%68
%58
%65
%67
%
35%
40%
49%
77%
84%
39%
70%
73%
57%
72%
59
%
58%
Don
't kn
ow/n
o op
inio
n 8
4 3
1 -
1 2
- -
3 2
- 2
4 2
4 2
1 1
1 2
- 2
1 7
1
5%8%
4%
9%
- 8%
7%-
- 7%
5%-
4%7%
7%
9%5%
3%2%
5%10
%-
3%4%
5%
8%
Not
sta
ted
5 -
- 1
4 1
- -
4 -
- -
1 -
4 -
1 -
4 -
- -
5 -
5 -
3%
- -
6%
45%
5%
- -
20%
- -
- 1%
- 13
%-
2%-
11%
- -
- 11
%-
4%
-
PAR
LIA
ME
NTA
RY
PAN
EL
SUR
VEY
- JU
NE
200
5
Q3.
Do
you
agre
e or
dis
agre
e w
ith e
ach
of th
ese
stat
emen
ts a
bout
gov
ernm
ent f
unde
d bu
sine
ss s
uppo
rt a
nd th
e w
ay c
ompa
nies
are
regu
late
d?
Inst
ead
of s
pend
ing
mon
ey o
n bu
sine
ss s
uppo
rt G
over
nmen
t wou
ld b
e be
tter o
ff us
ing
the
cash
to re
duce
bus
ines
s ta
xes
Bas
e: A
ll re
spon
dent
s
Page
37
P
repa
red
by: C
omm
unic
ateR
esea
rch
Lim
ited
Fi
eldw
ork:
7th
Jun
e - 2
4th
June
200
5

PAR
TY
REG
ION
D
ATE
OF
BIR
TH
MA
RG
INA
LITY
LE
NG
TH O
F SE
RVI
CE
GEN
DER
Scot
Mid
s
1986
Li
b
Lon-
&
&
Pr
e-
1940
-19
50-
0.
1-
10.0
-20
.0-
or
19
87-
1992
-19
97-
Fe-
To
tal
Con
sLa
b D
ems
Oth
er
don
Sout
hW
ales
NI
East
Nor
th19
4019
4919
59
1960
+9.
9%19
.9%
29.9
%30
%+
befo
re19
9119
9620
0020
01+
Mal
e m
ale
U
nwei
ghte
d T
otal
15
4 51
80
20
3
14
39
9 14
42
36
7
63
52
32
52
47
24
31
18
18
20
44
17
137
17
W
eigh
ted
Tot
al
154
46
85
14
9 17
31
9
21
37
38
6 62
54
32
48
44
24
37
17
17
21
45
19
13
7 17
100%
100%
100%
10
0%
100%
10
0%10
0%10
0%10
0%10
0%10
0%10
0%10
0%10
0%
100%
100%
100%
100%
100%
100%
100%
100%
100%
100%
10
0 %
100 %
Agr
ee
22
- 19
3
- 3
4 2
3 7
4 1
12
6 4
7 6
4 5
2 2
4 9
2 19
3
14
%-
22%
23
%
- 16
%13
%19
%12
%19
%11
%14
%19
%11
%
11%
15%
13%
17%
13%
12%
11%
17%
21%
12%
14
%
19%
Dis
agre
e 98
46
41
8
3 14
25
4
10
26
20
5 41
34
17
36
33
15
14
13
10
15
25
9
91
8
64%
100%
49%
61
%
29%
79
%80
%45
%46
%70
%52
%86
%67
%64
%
54%
75%
75%
63%
37%
77%
58%
71%
55%
50%
66
%
45%
Don
't kn
ow/n
o op
inio
n 24
-
20
1 2
- 2
3 5
3 10
-
6 10
7
4 3
5 12
2
3 2
6 6
19
5
15%
- 23
%
10%
26
%
- 7%
36%
22%
8%28
%-
11%
18%
23
%8%
7%19
%31
%11
%17
%11
%13
%31
%
14%
28
%
N
ot s
tate
d 10
-
5 1
4 1
- -
4 1
4 -
2 4
4 1
2 -
7 -
2 -
5 1
8 1
6%
- 6%
6%
45
%
5%-
- 20
%3%
10%
- 3%
7%
13%
2%4%
- 18
%-
14%
- 11
%7%
6%
8%
PAR
LIA
ME
NTA
RY
PAN
EL
SUR
VEY
- JU
NE
200
5
Q3.
Do
you
agre
e or
dis
agre
e w
ith e
ach
of th
ese
stat
emen
ts a
bout
gov
ernm
ent f
unde
d bu
sine
ss s
uppo
rt a
nd th
e w
ay c
ompa
nies
are
regu
late
d?
UK
bus
ines
s ta
xes
coul
d be
incr
ease
d w
ithou
t har
min
g bu
sine
ss p
erfo
rman
ce
Bas
e: A
ll re
spon
dent
s
Page
38
P
repa
red
by: C
omm
unic
ateR
esea
rch
Lim
ited
Fi
eldw
ork:
7th
Jun
e - 2
4th
June
200
5

PAR
TY
REG
ION
D
ATE
OF
BIR
TH
MA
RG
INA
LITY
LE
NG
TH O
F SE
RVI
CE
GEN
DER
Scot
Mid
s
1986
Li
b
Lon-
&
&
Pr
e-
1940
-19
50-
0.
1-
10.0
-20
.0-
or
19
87-
1992
-19
97-
Fe-
To
tal
Con
sLa
b D
ems
Oth
er
don
Sout
hW
ales
NI
East
Nor
th19
4019
4919
59
1960
+9.
9%19
.9%
29.9
%30
%+
befo
re19
9119
9620
0020
01+
Mal
e m
ale
U
nwei
ghte
d T
otal
15
4 51
80
20
3
14
39
9 14
42
36
7
63
52
32
52
47
24
31
18
18
20
44
17
137
17
W
eigh
ted
Tot
al
154
46
85
14
9 17
31
9
21
37
38
6 62
54
32
48
44
24
37
17
17
21
45
19
13
7 17
100%
100%
100%
10
0%
100%
10
0%10
0%10
0%10
0%10
0%10
0%10
0%10
0%10
0%
100%
100%
100%
100%
100%
100%
100%
100%
100%
100%
10
0 %
100 %
Agr
ee
105
41
49
10
5 13
24
6
12
23
28
3 45
38
20
35
35
16
19
11
13
14
28
12
97
8
68
%89
%58
%
69%
55
%
74%
78%
61%
56%
61%
73%
42%
72%
71%
61
%72
%80
%64
%51
%63
%77
%69
%62
%63
%
71%
47
%
D
isag
ree
25
2 20
3
- 3
4 3
3 8
6 -
11
9 5
9 3
6 8
4 2
3 5
4 23
2
16
%5%
24%
19
%
- 16
%12
%29
%12
%21
%15
%-
18%
17%
16
%18
%6%
25%
20%
22%
12%
16%
12%
23%
17
%
12%
Don
't kn
ow/n
o op
inio
n 16
2
13
1 -
1 3
1 3
6 3
2 5
5 3
4 4
3 4
2 2
2 7
1 10
6
10
%4%
16%
6%
-
5%8%
10%
12%
15%
8%28
%9%
9%
11%
9%10
%11
%11
%10
%10
%10
%15
%7%
7%
33
%
N
ot s
tate
d 8
1 2
1 4
1 1
- 4
1 1
2 1
1 4
- 2
- 6
1 -
1 5
1 7
1
5%2%
3%
6%
45%
5%
3%-
20%
3%3%
30%
1%2%
13
%-
4%-
17%
5%-
5%11
%7%
5%
8%
PAR
LIA
ME
NTA
RY
PAN
EL
SUR
VEY
- JU
NE
200
5
Q3.
Do
you
agre
e or
dis
agre
e w
ith e
ach
of th
ese
stat
emen
ts a
bout
gov
ernm
ent f
unde
d bu
sine
ss s
uppo
rt a
nd th
e w
ay c
ompa
nies
are
regu
late
d?
MPs
sho
uld
take
on
a gr
eate
r rol
e in
lead
ing
the
driv
e to
cut
red
tape
for b
usin
ess
Bas
e: A
ll re
spon
dent
s
Page
39
P
repa
red
by: C
omm
unic
ateR
esea
rch
Lim
ited
Fi
eldw
ork:
7th
Jun
e - 2
4th
June
200
5

PAR
TY
REG
ION
D
ATE
OF
BIR
TH
MA
RG
INA
LITY
LE
NG
TH O
F SE
RVI
CE
GEN
DER
Scot
Mid
s
1986
Li
b
Lon-
&
&
Pr
e-
1940
-19
50-
0.
1-
10.0
-20
.0-
or
19
87-
1992
-19
97-
Fe-
To
tal
Con
sLa
b D
ems
Oth
er
don
Sout
hW
ales
NI
East
Nor
th19
4019
4919
59
1960
+9.
9%19
.9%
29.9
%30
%+
befo
re19
9119
9620
0020
01+
Mal
e m
ale
U
nwei
ghte
d T
otal
15
4 51
80
20
3
14
39
9 14
42
36
7
63
52
32
52
47
24
31
18
18
20
44
17
137
17
W
eigh
ted
Tot
al
154
46
85
14
9 17
31
9
21
37
38
6 62
54
32
48
44
24
37
17
17
21
45
19
13
7 17
100%
100%
100%
10
0%
100%
10
0%10
0%10
0%10
0%10
0%10
0%10
0%10
0%10
0%
100%
100%
100%
100%
100%
100%
100%
100%
100%
100%
10
0 %
100 %
Agr
ee
123
27
81
10
5 13
23
9
17
26
34
5 52
49
17
34
36
21
32
14
15
18
33
17
10
8 15
80%
58%
96%
74
%
55%
74
%74
%10
0%80
%71
%91
%87
%84
%91
%
52%
70%
83%
86%
86%
81%
90%
87%
74%
89%
79
%
87%
Dis
agre
e 17
13
1
3 -
2 4
- -
8 2
- 2
4 11
12
3
2 -
1 1
3 4
1 16
1
11
%28
%1%
20
%
- 13
%12
%-
- 22
%6%
- 4%
7%
33%
24%
7%7%
- 5%
5%13
%9%
4%
11%
5%
Don
't kn
ow/n
o op
inio
n 8
6 3
- -
1 3
- -
3 1
- 7
1 1
3 3
2 1
2 1
- 3
1 7
1
5%12
%3%
-
- 8%
11%
- -
7%3%
- 11
%2%
3%
6%6%
7%3%
10%
5%-
6%7%
5%
8%
Not
sta
ted
6 1
- 1
4 1
1 -
4 -
- 1
1 -
4 -
2 -
4 1
- -
5 -
6 -
4%
2%-
6%
45%
5%
3%-
20%
- -
13%
1%-
13%
- 4%
- 11
%5%
- -
11%
- 4%
-
PAR
LIA
ME
NTA
RY
PAN
EL
SUR
VEY
- JU
NE
200
5
Q3.
Do
you
agre
e or
dis
agre
e w
ith e
ach
of th
ese
stat
emen
ts a
bout
gov
ernm
ent f
unde
d bu
sine
ss s
uppo
rt a
nd th
e w
ay c
ompa
nies
are
regu
late
d?
Gov
ernm
ent p
olic
y en
cour
agin
g U
K m
anuf
actu
rers
to in
vest
is c
ruci
al if
the
UK
is to
com
pete
with
em
ergi
ng e
cono
mie
s B
ase:
All
resp
onde
nts
Page
40
P
repa
red
by: C
omm
unic
ateR
esea
rch
Lim
ited
Fi
eldw
ork:
7th
Jun
e - 2
4th
June
200
5

PAR
TY
REG
ION
D
ATE
OF
BIR
TH
MA
RG
INA
LITY
LE
NG
TH O
F SE
RVI
CE
GEN
DER
Scot
Mid
s
1986
Li
b
Lon-
&
&
Pr
e-
1940
-19
50-
0.
1-
10.0
-20
.0-
or
19
87-
1992
-19
97-
Fe-
To
tal
Con
sLa
b D
ems
Oth
er
don
Sout
hW
ales
NI
East
Nor
th19
4019
4919
59
1960
+9.
9%19
.9%
29.9
%30
%+
befo
re19
9119
9620
0020
01+
Mal
e m
ale
U
nwei
ghte
d T
otal
15
4 51
80
20
3
14
39
9 14
42
36
7
63
52
32
52
47
24
31
18
18
20
44
17
137
17
W
eigh
ted
Tot
al
154
46
85
14
9 17
31
9
21
37
38
6 62
54
32
48
44
24
37
17
17
21
45
19
13
7 17
100%
100%
100%
10
0%
100%
10
0%10
0%10
0%10
0%10
0%10
0%10
0%10
0%10
0%
100%
100%
100%
100%
100%
100%
100%
100%
100%
100%
10
0 %
100 %
Agr
ee
124
31
75
12
5 12
21
8
17
29
36
4 51
47
22
39
34
18
32
11
15
18
33
17
11
0 14
80%
68%
89%
85
%
55%
71
%66
%90
%80
%79
%95
%59
%82
%87
%
69%
82%
78%
74%
86%
66%
90%
87%
72%
91%
80
%
79%
Dis
agre
e 9
3 5
1 -
3 3
- -
4 -
- 4
3 2
1 4
4 -
- 1
1 6
2 7
3
6%8%
6%
9%
- 16
%10
%-
- 10
%-
- 6%
6%
7%3%
9%16
%-
- 5%
5%13
%9%
5%
16
%
D
on't
know
/no
opin
ion
13
9 5
- -
1 6
1 -
4 1
2 6
3 3
6 4
3 1
5 1
1 2
- 13
1
9%
19%
5%
- -
8%19
%10
%-
11%
3%28
%9%
5%
10%
12%
9%11
%3%
29%
5%4%
4%-
9%
5%
N
ot s
tate
d 7
2 -
1 4
1 2
- 4
- 1
1 2
1 4
2 2
- 4
1 -
1 5
- 7
-
5%5%
- 6%
45
%
5%5%
- 20
%-
2%13
%3%
2%
13%
3%4%
- 11
%5%
- 4%
11%
- 5%
-
PAR
LIA
ME
NTA
RY
PAN
EL
SUR
VEY
- JU
NE
200
5
Q3.
Do
you
agre
e or
dis
agre
e w
ith e
ach
of th
ese
stat
emen
ts a
bout
gov
ernm
ent f
unde
d bu
sine
ss s
uppo
rt a
nd th
e w
ay c
ompa
nies
are
regu
late
d?
Man
ufac
turin
g sh
ould
do
mor
e to
eng
age
with
MPs
B
ase:
All
resp
onde
nts
Page
41
P
repa
red
by: C
omm
unic
ateR
esea
rch
Lim
ited
Fi
eldw
ork:
7th
Jun
e - 2
4th
June
200
5

PAR
TY
REG
ION
D
ATE
OF
BIR
TH
MA
RG
INA
LITY
LE
NG
TH O
F SE
RVI
CE
GEN
DER
Scot
Mid
s
1986
Li
b
Lon-
&
&
Pr
e-
1940
-19
50-
0.
1-
10.0
-20
.0-
or
19
87-
1992
-19
97-
Fe-
To
tal
Con
sLa
b D
ems
Oth
er
don
Sout
hW
ales
NI
East
Nor
th19
4019
4919
59
1960
+9.
9%19
.9%
29.9
%30
%+
befo
re19
9119
9620
0020
01+
Mal
e m
ale
U
nwei
ghte
d T
otal
15
4 51
80
20
3
14
39
9 14
42
36
7
63
52
32
52
47
24
31
18
18
20
44
17
137
17
W
eigh
ted
Tot
al
154
46
85
14
9 17
31
9
21
37
38
6 62
54
32
48
44
24
37
17
17
21
45
19
13
7 17
100%
100%
100%
10
0%
100%
10
0%10
0%10
0%10
0%10
0%10
0%10
0%10
0%10
0%
100%
100%
100%
100%
100%
100%
100%
100%
100%
100%
10
0 %
100 %
Agr
ee
76
42
28
6 -
10
21
3 1
22
19
5 34
22
16
29
25
10
12
13
11
9
18
6 69
7
49
%91
%33
%
45%
-
58%
68%
28%
6%58
%50
%72
%55
%41
%
49%
59%
58%
42%
32%
77%
65%
43%
40%
31%
51
%
38%
Dis
agre
e 58
2
46
5 5
6 8
7 12
11
14
1
20
25
12
16
14
13
16
2 4
7 20
12
48
11
38%
4%54
%
39%
55
%
37%
25%
72%
59%
30%
37%
14%
33%
46%
38
%33
%32
%53
%42
%15
%23
%36
%43
%62
%
35%
62
%
D
on't
know
/no
opin
ion
14
2 11
1
- -
1 -
3 4
5 -
7 7
- 4
3 1
6 1
2 4
3 1
14
-
9%4%
13%
10
%
- -
5%-
16%
12%
13%
- 11
%13
%
- 8%
7%5%
15%
4%12
%21
%6%
7%
10%
-
N
ot s
tate
d 6
1 -
1 4
1 1
- 4
- -
1 1
- 4
- 2
- 4
1 -
- 5
- 6
-
4%2%
- 6%
45
%
5%3%
- 20
%-
- 13
%1%
- 13
%-
4%-
11%
5%-
- 11
%-
4%
-
PAR
LIA
ME
NTA
RY
PAN
EL
SUR
VEY
- JU
NE
200
5
Q3.
Do
you
agre
e or
dis
agre
e w
ith e
ach
of th
ese
stat
emen
ts a
bout
gov
ernm
ent f
unde
d bu
sine
ss s
uppo
rt a
nd th
e w
ay c
ompa
nies
are
regu
late
d?
Whi
le fa
mily
frie
ndly
pol
icie
s ar
e fin
e in
prin
cipl
e, th
ey p
lace
a d
ispr
opor
tiona
te b
urde
n on
sm
all f
irms
B
ase:
All
resp
onde
nts
Page
42
P
repa
red
by: C
omm
unic
ateR
esea
rch
Lim
ited
Fi
eldw
ork:
7th
Jun
e - 2
4th
June
200
5

PAR
TY
REG
ION
D
ATE
OF
BIR
TH
MA
RG
INA
LITY
LE
NG
TH O
F SE
RVI
CE
GEN
DER
Scot
Mid
s
1986
Li
b
Lon-
&
&
Pr
e-
1940
-19
50-
0.
1-
10.0
-20
.0-
or
19
87-
1992
-19
97-
Fe-
To
tal
Con
sLa
b D
ems
Oth
er
don
Sout
hW
ales
NI
East
Nor
th19
4019
4919
59
1960
+9.
9%19
.9%
29.9
%30
%+
befo
re19
9119
9620
0020
01+
Mal
e m
ale
U
nwei
ghte
d T
otal
15
4 51
80
20
3
14
39
9 14
42
36
7
63
52
32
52
47
24
31
18
18
20
44
17
137
17
W
eigh
ted
Tot
al
154
46
85
14
9 17
31
9
21
37
38
6 62
54
32
48
44
24
37
17
17
21
45
19
13
7 17
100%
100%
100%
10
0%
100%
10
0%10
0%10
0%10
0%10
0%10
0%10
0%10
0%10
0%
100%
100%
100%
100%
100%
100%
100%
100%
100%
100%
10
0 %
100 %
Agr
ee
70
44
13
8 5
7 21
4
6 18
14
3
25
28
15
27
23
12
8 11
8
13
14
7 64
7
46
%95
%16
%
59%
55
%
42%
66%
42%
28%
50%
37%
42%
41%
52%
46
%55
%53
%51
%21
%65
%45
%63
%31
%35
%
47%
38
%
D
isag
ree
53
- 52
1
- 8
7 5
6 12
15
2
23
21
7 14
13
10
16
3
6 5
20
8 46
7
34
%-
61%
11
%
- 45
%22
%49
%30
%33
%40
%28
%37
%39
%
22%
29%
30%
40%
44%
19%
37%
23%
44%
41%
33
%
43%
Don
't kn
ow/n
o op
inio
n 22
2
17
3 -
1 3
1 5
5 7
- 13
3
6 8
6 2
7 2
3 2
6 3
20
2
15%
4%21
%
24%
-
8%9%
10%
22%
15%
19%
- 21
%6%
19
%16
%13
%9%
18%
11%
17%
9%14
%17
%
15%
12
%
N
ot s
tate
d 8
1 2
1 4
1 1
- 4
1 1
2 1
1 4
- 2
- 6
1 -
1 5
1 7
1
5%2%
3%
6%
45%
5%
3%-
20%
3%3%
30%
1%2%
13
%-
4%-
17%
5%-
5%11
%7%
5%
8%
PAR
LIA
ME
NTA
RY
PAN
EL
SUR
VEY
- JU
NE
200
5
Q3.
Do
you
agre
e or
dis
agre
e w
ith e
ach
of th
ese
stat
emen
ts a
bout
gov
ernm
ent f
unde
d bu
sine
ss s
uppo
rt a
nd th
e w
ay c
ompa
nies
are
regu
late
d?
Com
pani
es th
at c
ompl
ain
abou
t ove
r-re
gula
tion
gene
rally
hav
e a
good
cas
e to
mak
e B
ase:
All
resp
onde
nts
Page
43
P
repa
red
by: C
omm
unic
ateR
esea
rch
Lim
ited
Fi
eldw
ork:
7th
Jun
e - 2
4th
June
200
5