Embed Size (px)
Citation preview
Findings from the Virginia Department of Health (VDH) 2010 Central Line-Associated Bloodstream Infection (CLABSI) Data Audit Project
Andrea Alvarez, MPHVirginia Department of HealthHealthcare-Associated Infections Program Coordinator
Mary Andrus, BA, RN, CICInfection Preventionist Consultant
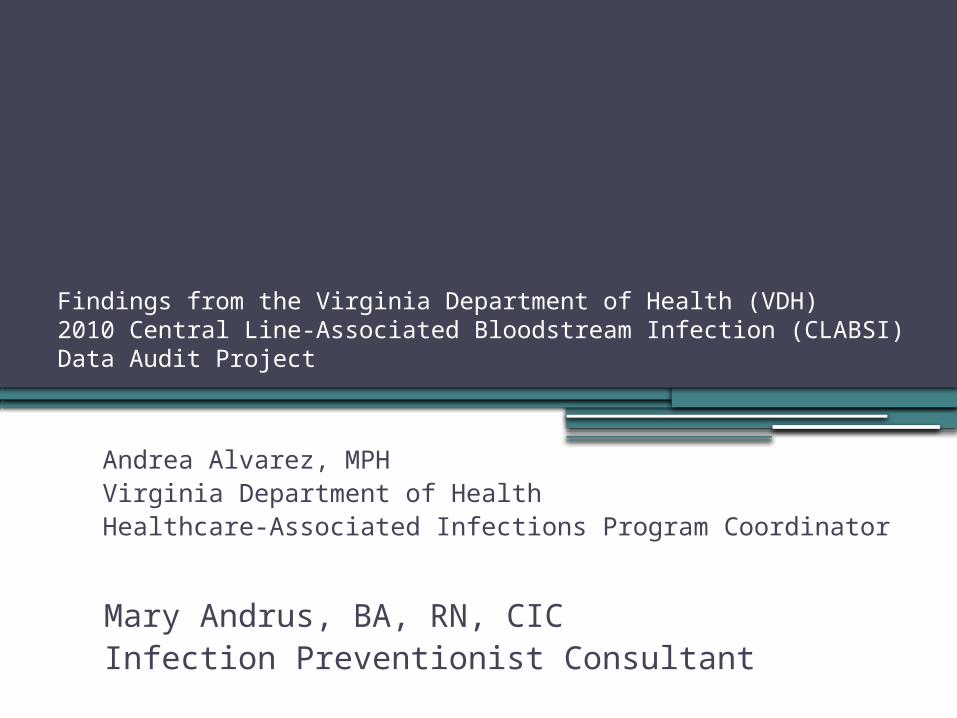
Learning Objectives1) Quantify the CLABSI case status discrepancies
identified by the data validation specialists
2) Describe issues leading to the misclassification of CLABSI events
3) Identify lessons learned regarding CLABSI surveillance and quality assurance methods
4) Learn how the CLABSI data audit project aligns with state and federal HAI reporting initiatives and the VDH HAI Program

Outline of Today’s Webinar•Introduction•Methods•Results•Discussion•Next Steps
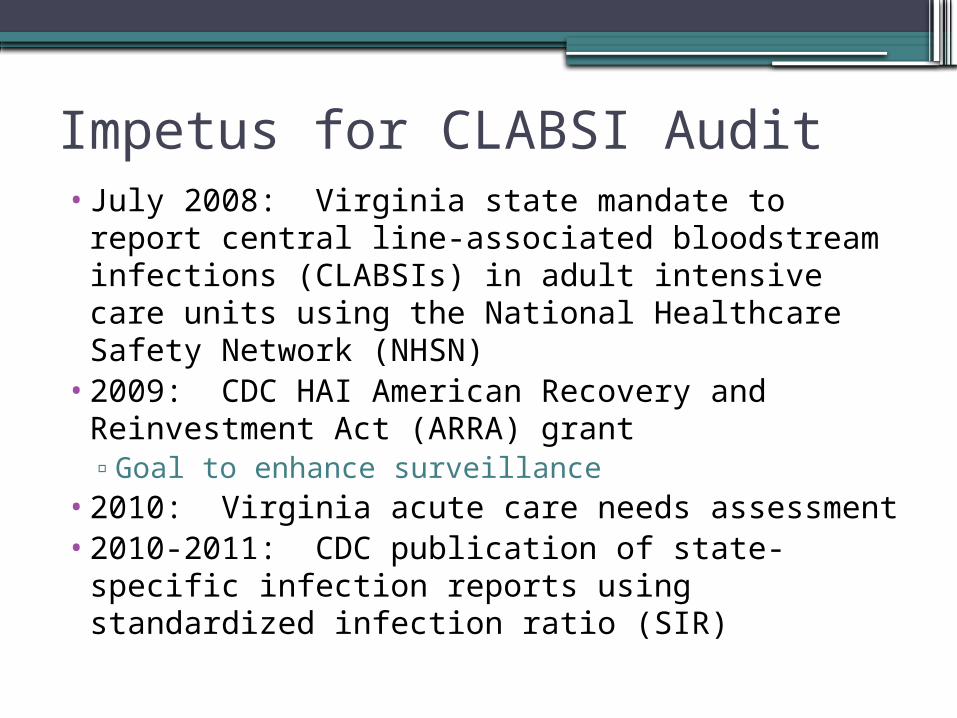
Impetus for CLABSI Audit• July 2008: Virginia state mandate to report
central line-associated bloodstream infections (CLABSIs) in adult intensive care units using the National Healthcare Safety Network (NHSN)
•2009: CDC HAI American Recovery and Reinvestment Act (ARRA) grant▫Goal to enhance surveillance
•2010: Virginia acute care needs assessment•2010-2011: CDC publication of state-specific
infection reports using standardized infection ratio (SIR)

2009Q1 2009Q2 2009Q3 2009Q4 2010Q1 2010Q2 2010Q3 2010Q40
0.2
0.4
0.6
0.8
1
1.2
1.4
1.6
1.8
2
CLABSI rate by bedsize category and quarter, Virginia, 2009-2010
200 beds or fewer201 to 500 bedsMore than 500 bedsState Total
Year and quarter of CLABSI event
CLA
BSI r
ate
(per
1,0
00 c
entr
al li
ne d
ays)

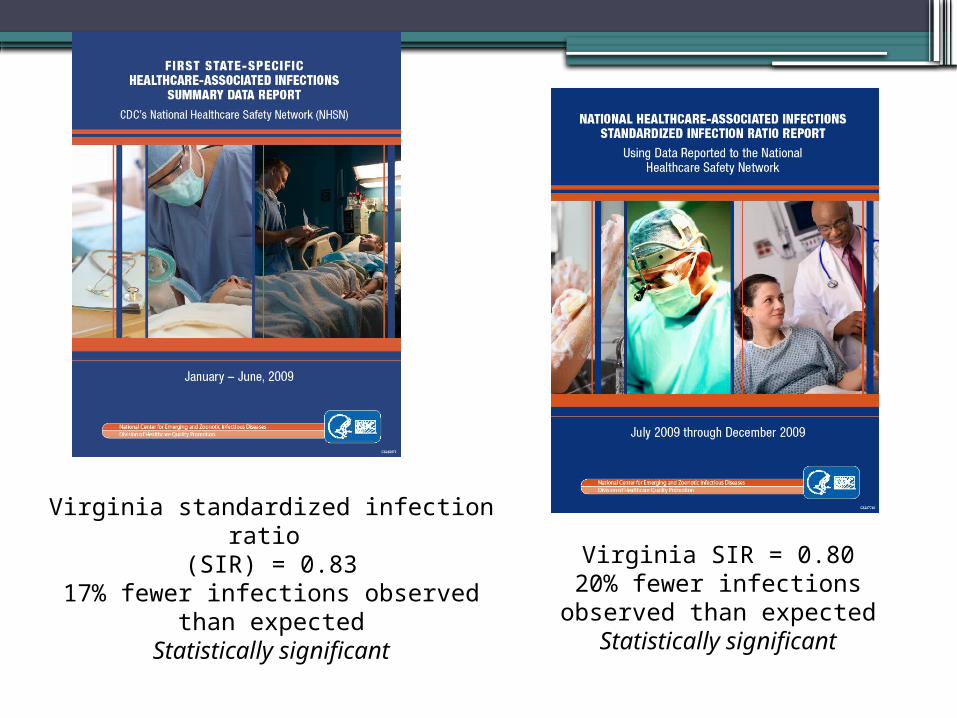
Virginia standardized infection ratio (SIR) = 0.83
17% fewer infections observed than expected
Statistically significant
Virginia SIR = 0.8020% fewer infections
observed than expectedStatistically significant
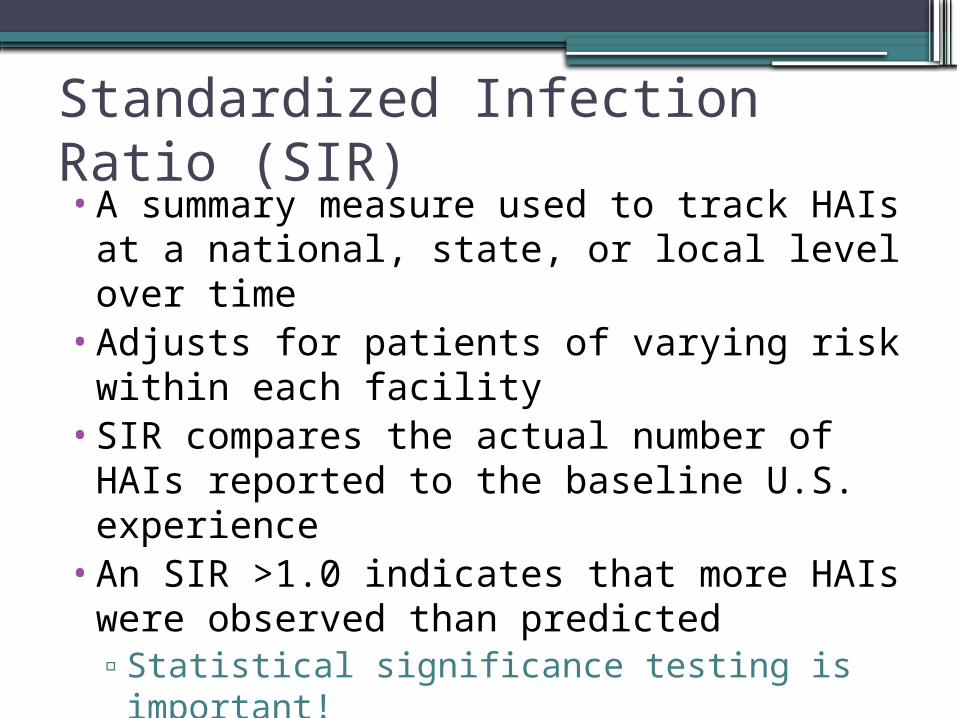
Standardized Infection Ratio (SIR)•A summary measure used to track HAIs at
a national, state, or local level over time•Adjusts for patients of varying risk within
each facility•SIR compares the actual number of HAIs
reported to the baseline U.S. experience•An SIR >1.0 indicates that more HAIs
were observed than predicted▫Statistical significance testing is important!
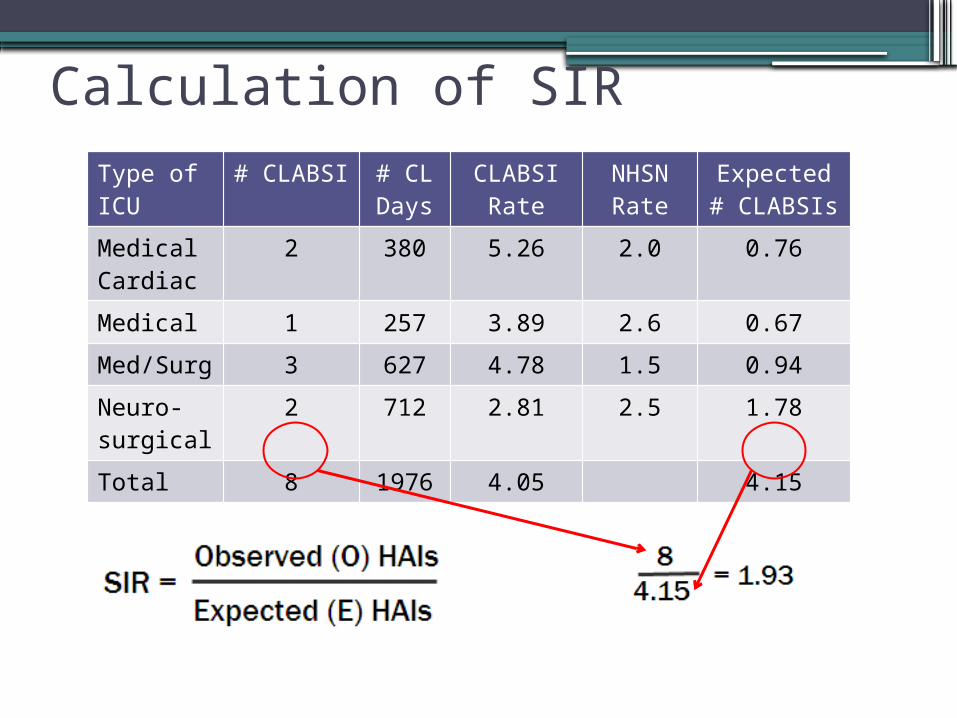
Calculation of SIRType of ICU
# CLABSI
# CL Days
CLABSI Rate
NHSN Rate
Expected #
CLABSIs
Medical Cardiac
2 380 5.26 2.0 0.76
Medical 1 257 3.89 2.6 0.67
Med/Surg
3 627 4.78 1.5 0.94
Neuro-surgical
2 712 2.81 2.5 1.78
Total 8 1976 4.05 4.15
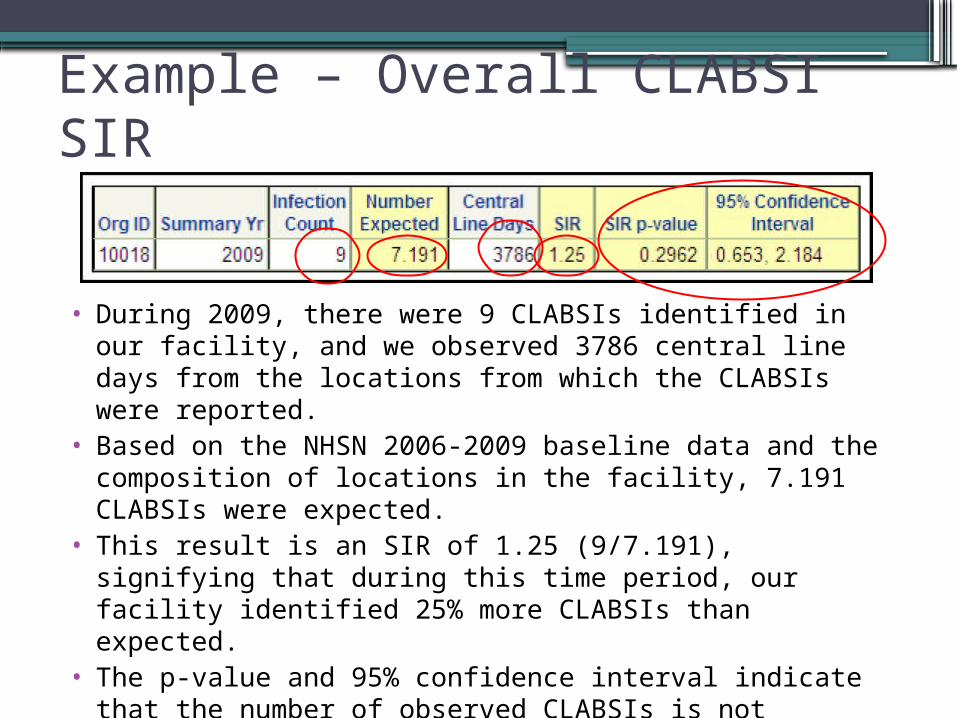
Example – Overall CLABSI SIR
• During 2009, there were 9 CLABSIs identified in our facility, and we observed 3786 central line days from the locations from which the CLABSIs were reported.
• Based on the NHSN 2006-2009 baseline data and the composition of locations in the facility, 7.191 CLABSIs were expected.
• This result is an SIR of 1.25 (9/7.191), signifying that during this time period, our facility identified 25% more CLABSIs than expected.
• The p-value and 95% confidence interval indicate that the number of observed CLABSIs is not significantly higher than the number of expected CLABSIs.
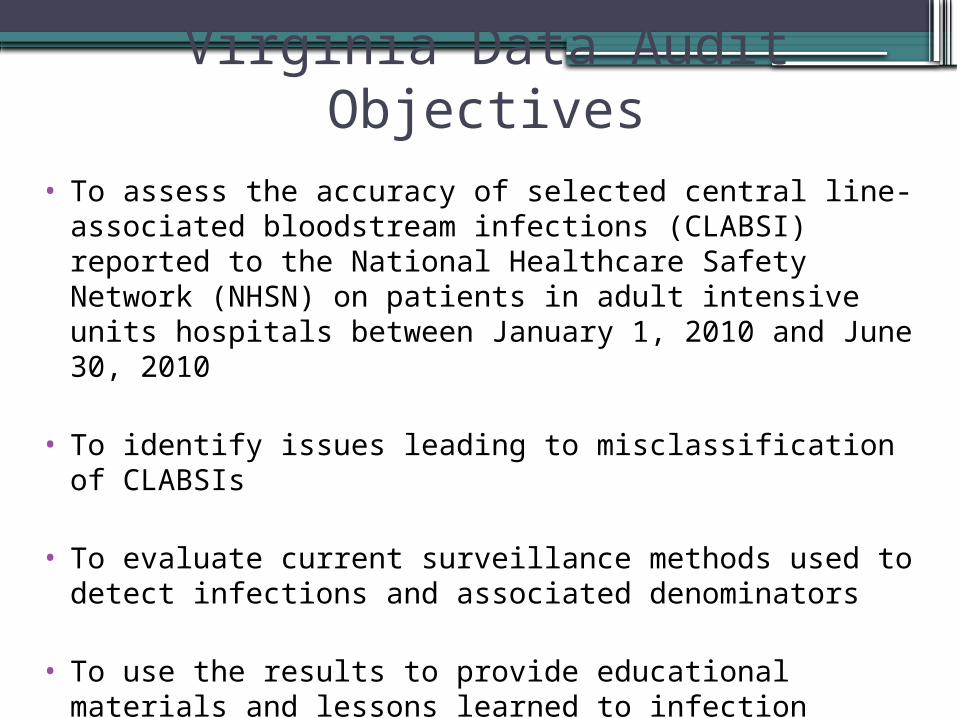
Virginia Data Audit Objectives• To assess the accuracy of selected central line-associated
bloodstream infections (CLABSI) reported to the National Healthcare Safety Network (NHSN) on patients in adult intensive units hospitals between January 1, 2010 and June 30, 2010
• To identify issues leading to misclassification of CLABSIs
• To evaluate current surveillance methods used to detect infections and associated denominators
• To use the results to provide educational materials and lessons learned to infection preventionists across the Commonwealth

Responsibilities•Virginia Department of Health
▫Development of CLABSI audit protocol Review protocols from other states that have
done validation studies Collaborate with APIC-VA and Virginia
Hospital and Healthcare Association (VHHA) Select hospitals and charts for review
•VHHA ▫Hire Validation Specialists and other staff
Responsibilities (cont’d)•Validation Specialists
▫Have previous experience in infection prevention and chart review
▫Coordinate and conduct site visits with participating hospital
▫Conduct chart reviews and process interviews at each hospital
•Consultant – Mary Andrus▫Train Validation Specialists▫Consult on difficult cases▫Coordinate training ▫Present audit results to all hospitals
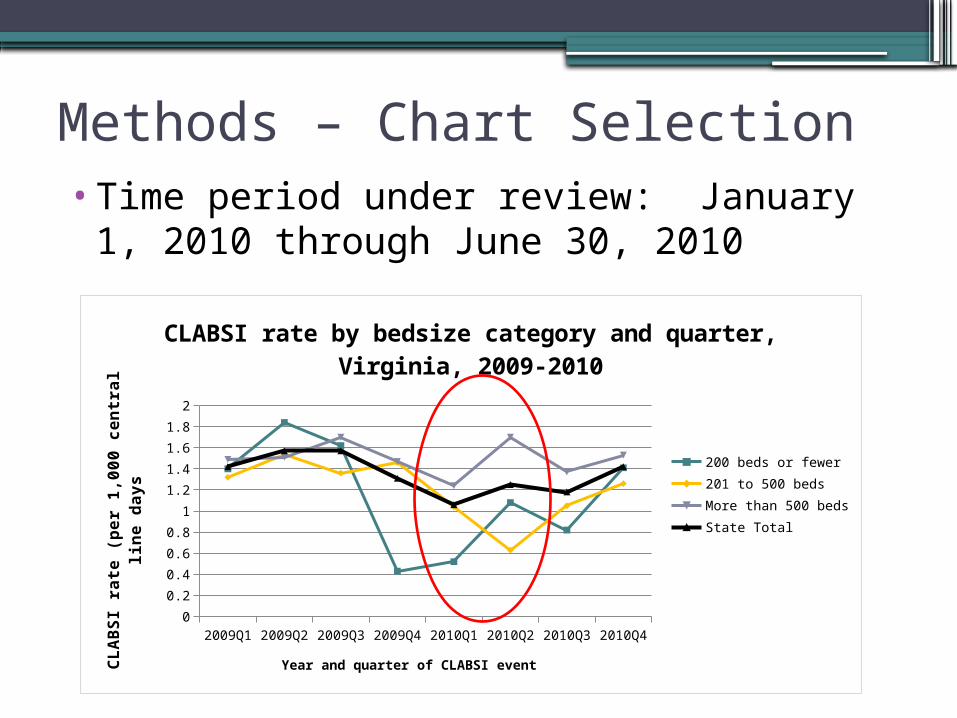
Methods – Chart Selection•Time period under review: January 1,
2010 through June 30, 2010
2009Q1 2009Q2 2009Q3 2009Q4 2010Q1 2010Q2 2010Q3 2010Q40
0.2
0.4
0.6
0.8
1
1.2
1.4
1.6
1.8
2
CLABSI rate by bedsize category and quarter, Virginia, 2009-2010
200 beds or fewer201 to 500 bedsMore than 500 bedsState Total
Year and quarter of CLABSI event
CLA
BSI r
ate
(per
1,0
00 c
entr
al li
ne d
ays
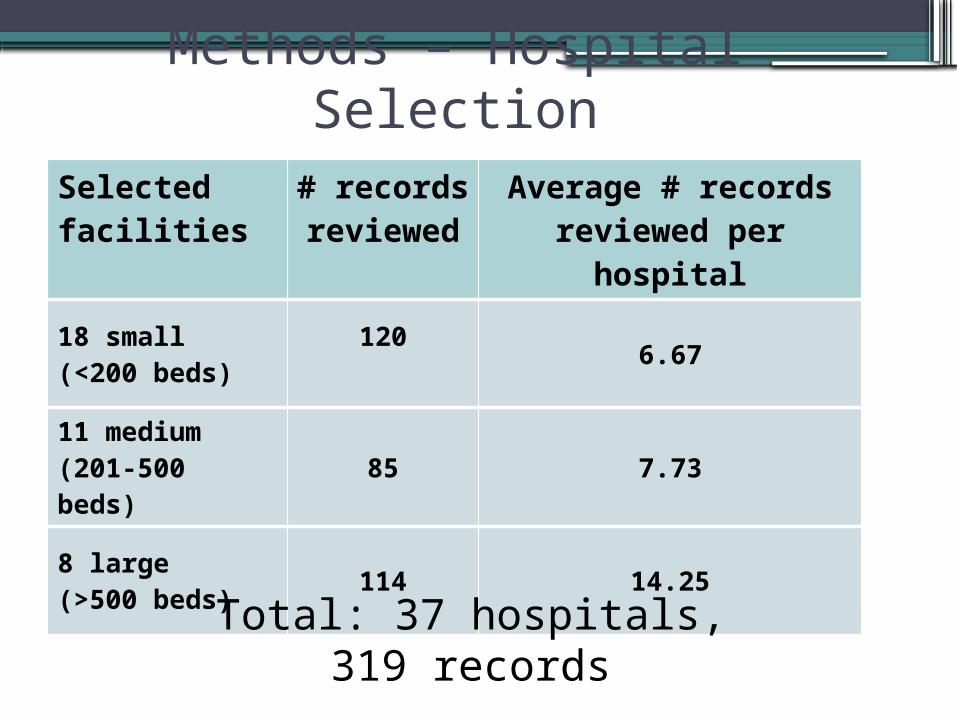
Methods – Hospital SelectionSelected facilities
# records reviewed
Average # records reviewed per hospital
18 small (<200 beds)
120 6.67
11 medium (201-500 beds)
85 7.73
8 large (>500 beds)
114 14.25
Total: 37 hospitals, 319 records
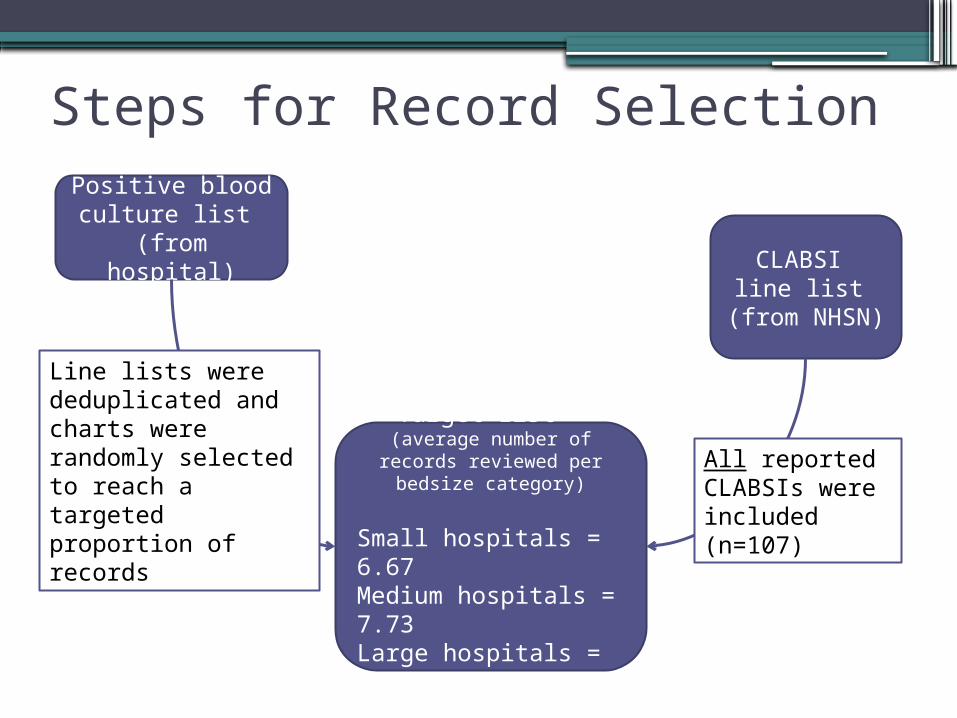
Steps for Record Selection
CLABSI line list
(from NHSN)
Positive blood culture list
(from hospital)
Target List (average number of records
reviewed per bedsize category)
Small hospitals = 6.67Medium hospitals = 7.73Large hospitals = 14.25
All reported CLABSIs were included (n=107)
Line lists were deduplicated and charts were randomly selected to reach a targeted proportion of records
Audit Training – October 12, 2010
• Conducted by Mary Andrus, Surveillance Solutions Worldwide, Inc.
• Auditors and VDH staff participated• Content:
▫ NHSN overview▫ BSI definition and data collection
protocol▫ Audit format and directions▫ Interview process▫ Other CDC/NHSN definitions▫ Case studies and practice
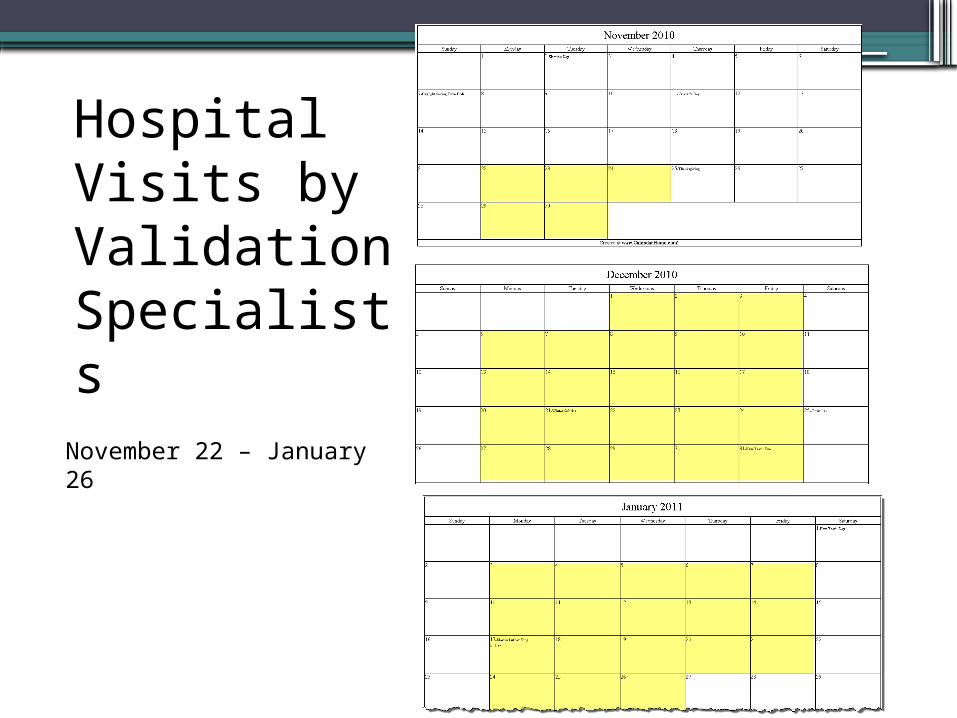
Hospital Visits by Validation Specialists
November 22 – January 26
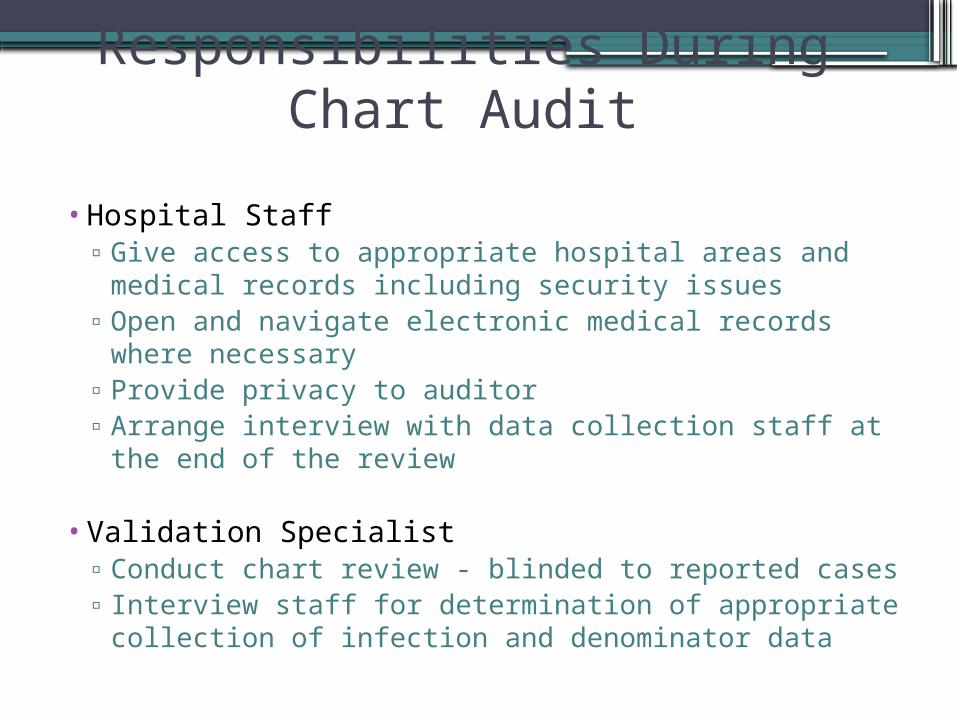
Responsibilities During Chart Audit
• Hospital Staff▫ Give access to appropriate hospital areas and medical
records including security issues▫ Open and navigate electronic medical records where
necessary▫ Provide privacy to auditor▫ Arrange interview with data collection staff at the end
of the review
• Validation Specialist▫ Conduct chart review - blinded to reported cases▫ Interview staff for determination of appropriate
collection of infection and denominator data
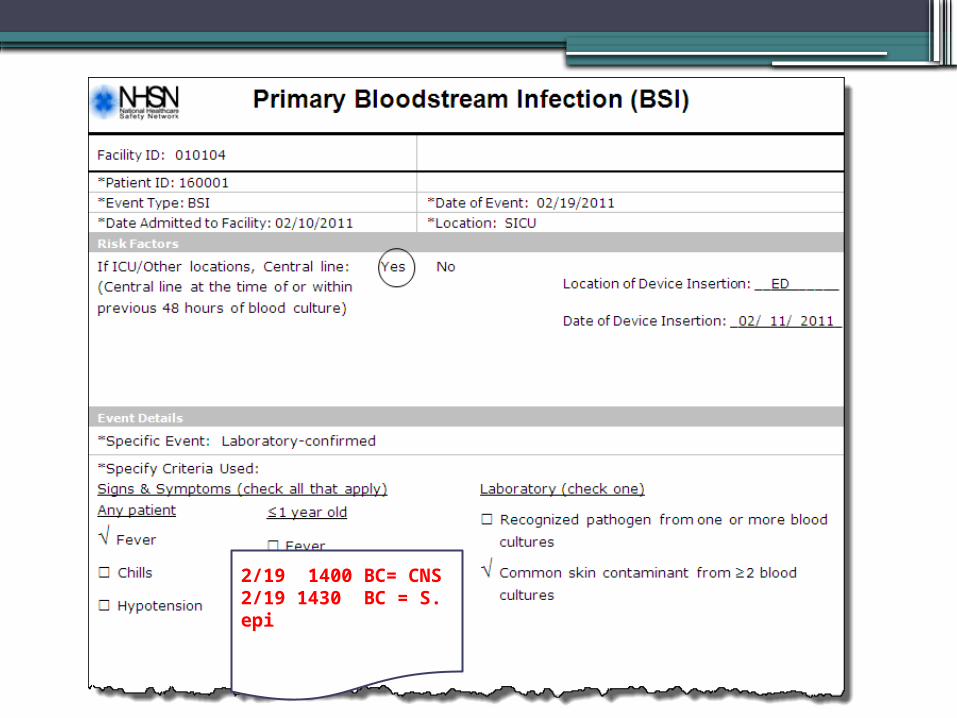
2/19 1400 BC= CNS2/19 1430 BC = S. epi
Resolution of Discrepant Cases•VDH staff compared reported CLABSIs
(from NHSN) to those identified in the audit•Letter sent to each hospital, outlining
summary of findings and process of resolution for discrepancies
•Validation specialist and hospital discussed disagreements
•Contacted consultant (Mary Andrus) when hospital and validation specialist could not agree
•Hospitals made changes to NHSN data entry as appropriate
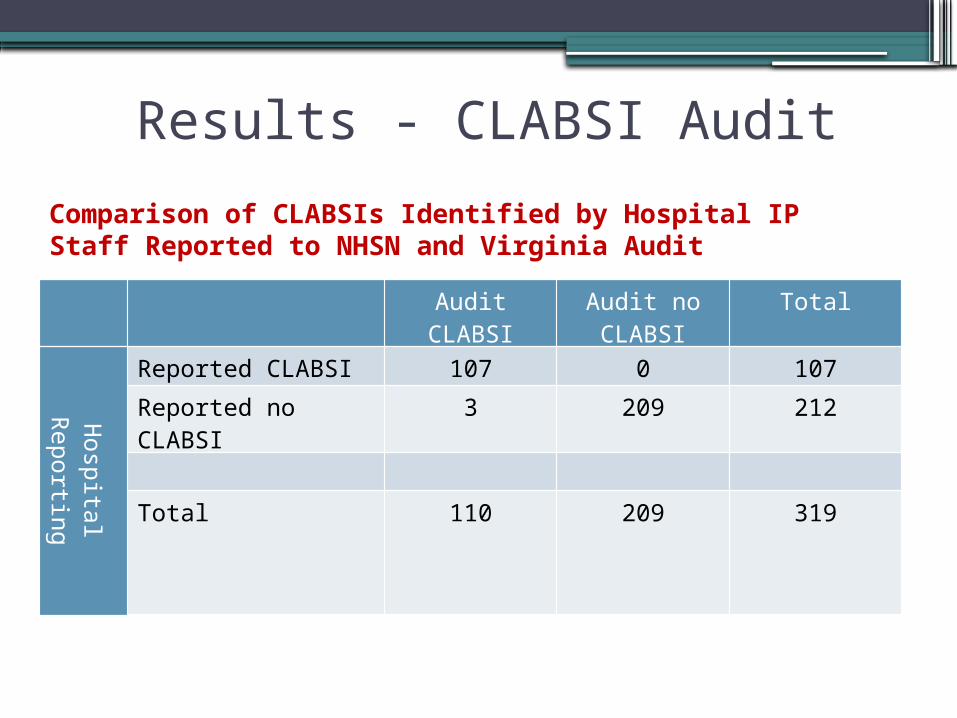
Comparison of CLABSIs Identified by Hospital IP Staff Reported to NHSN and Virginia Audit
Audit CLABSI
Audit no CLABSI
Total
Hospital
Reporting
Reported CLABSI 107 0 107
Reported no CLABSI
3 209 212
Total 110 209 319
Results - CLABSI Audit
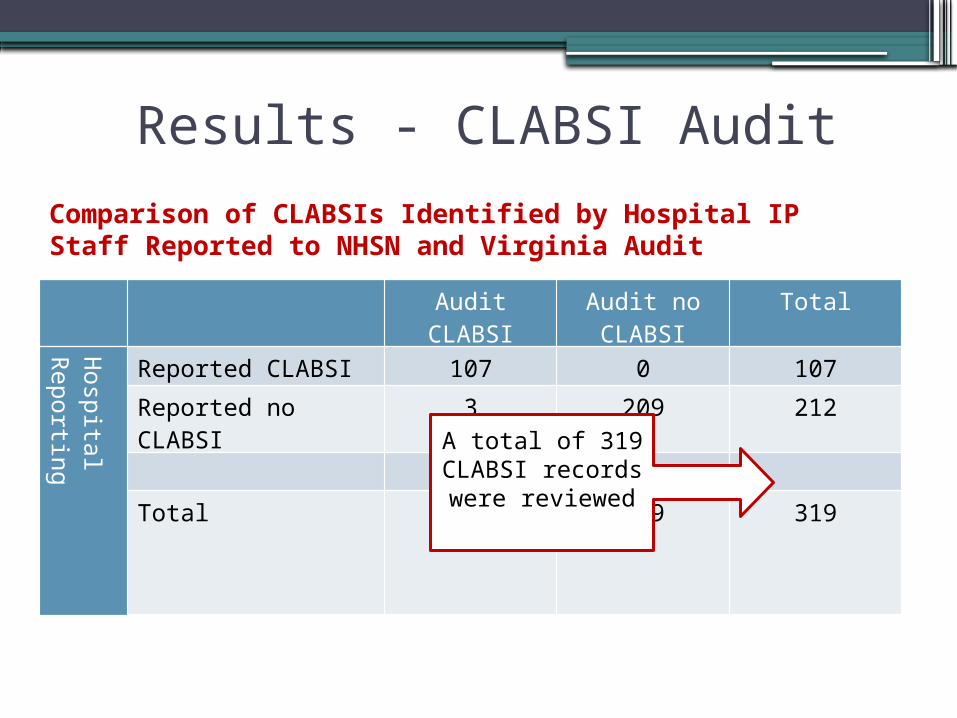
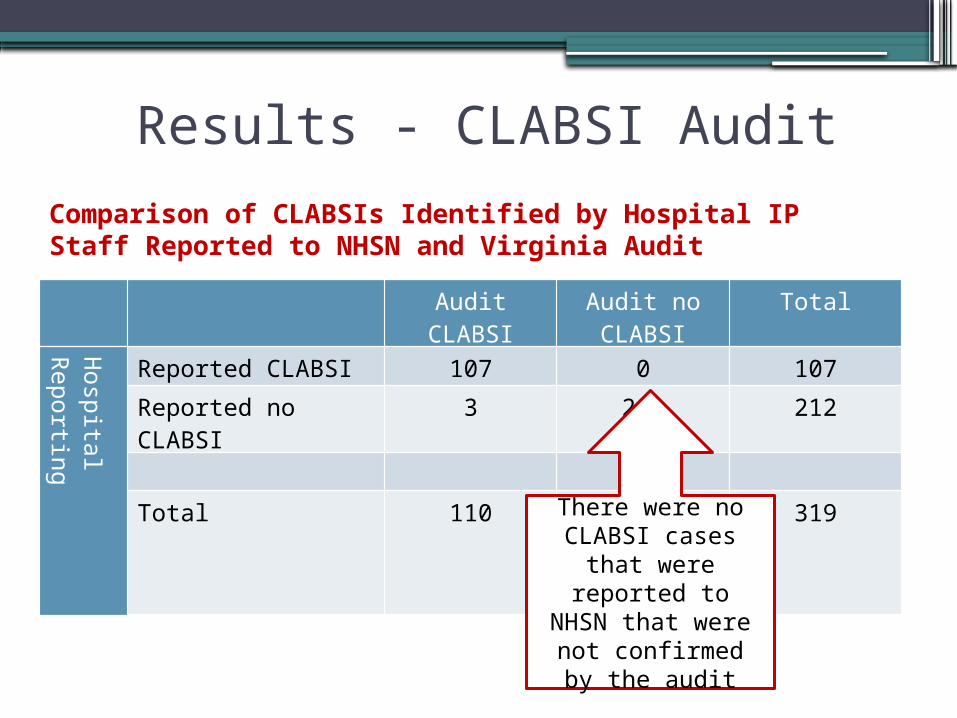
Comparison of CLABSIs Identified by Hospital IP Staff Reported to NHSN and Virginia Audit
Audit CLABSI
Audit no CLABSI
Total
Hospital Reporting
Reported CLABSI 107 0 107
Reported no CLABSI
3 209 212
Total 110 209 319
A total of 319 CLABSI records were reviewed
Results - CLABSI Audit
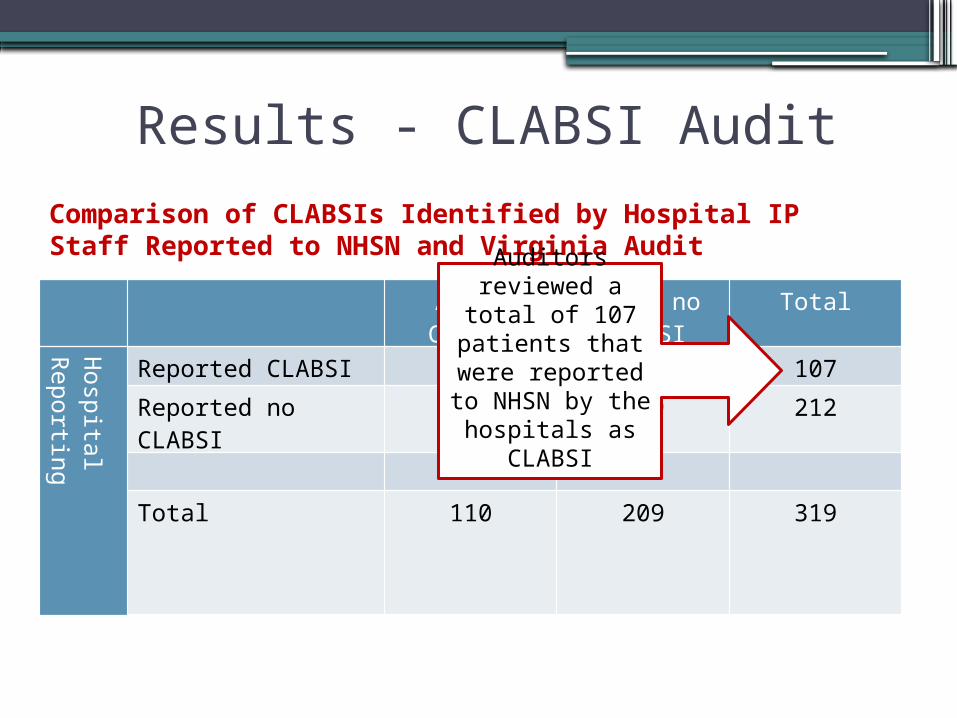
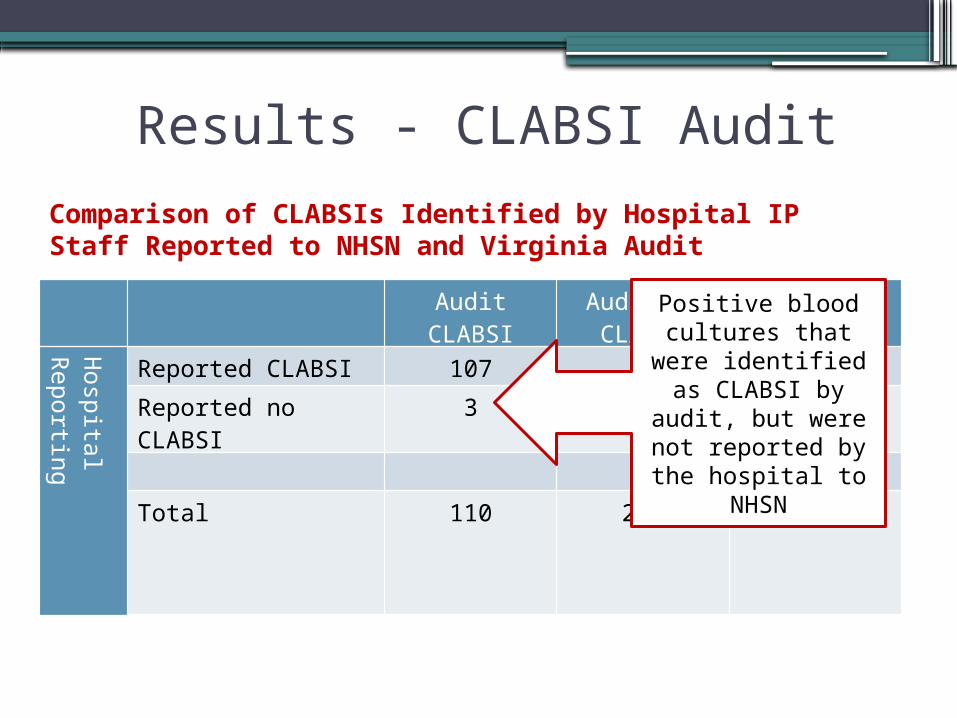
Comparison of CLABSIs Identified by Hospital IP Staff Reported to NHSN and Virginia Audit
Audit CLABSI
Audit no CLABSI
Total
Hospital Reporting
Reported CLABSI 107 0 107
Reported no CLABSI
3 209 212
Total 110 209 319
Auditors reviewed a total of 107 patients
that were reported to
NHSN by the hospitals as
CLABSI
Results - CLABSI Audit
Results - CLABSI Audit
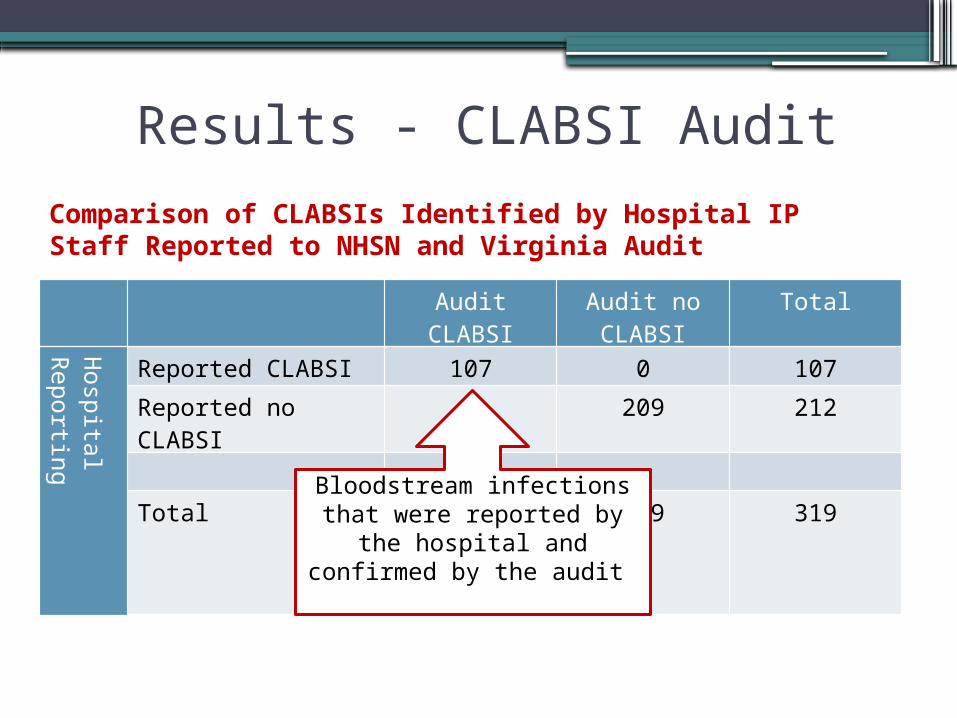
Comparison of CLABSIs Identified by Hospital IP Staff Reported to NHSN and Virginia Audit
Audit CLABSI
Audit no CLABSI
Total
Hospital Reporting
Reported CLABSI 107 0 107
Reported no CLABSI
3 209 212
Total 110 209 319Bloodstream infections
that were reported by the hospital and confirmed by
the audit
Results - CLABSI Audit
Comparison of CLABSIs Identified by Hospital IP Staff Reported to NHSN and Virginia Audit
Audit CLABSI
Audit no CLABSI
Total
Hospital Reporting
Reported CLABSI 107 0 107
Reported no CLABSI
3 209 212
Total 110 209 319There were no CLABSI cases that were reported to NHSN that were not confirmed by
the audit

Results - CLABSI Audit
Comparison of CLABSIs Identified by Hospital IP Staff Reported to NHSN and Virginia Audit
Audit CLABSI
Audit no CLABSI
Total
Hospital Reporting
Reported CLABSI 107 0 107
Reported no CLABSI
3 209 212
Total 110 209 319
Total number of positive blood
cultures reviewed by auditors
Results - CLABSI Audit
Comparison of CLABSIs Identified by Hospital IP Staff Reported to NHSN and Virginia Audit
Audit CLABSI
Audit no CLABSI
Total
Hospital Reporting
Reported CLABSI 107 0 107
Reported no CLABSI
3 209 212
Total 110 209 319
Positive blood cultures that were
identified as CLABSI by audit,
but were not reported by the
hospital to NHSN

Results - CLABSI Audit
Comparison of CLABSIs Identified by Hospital IP Staff Reported to NHSN and Virginia Audit
Audit CLABSI
Audit no CLABSI
Total
Hospital Reporting
Reported CLABSI 107 0 107
Reported no CLABSI
3 209 212
Total 110 209 319
Positive blood cultures that were not
identified as CLABSI by audit, and were not
reported by the hospital to NHSN

CLABSI Misreported Cases•Total of 3 reporting errors:
▫3 under-reported•34 hospitals had no identified CLABSI
reporting errors▫2 small hospitals had one error each▫1 medium hospital had one error
•Misreported cases▫1 case was identified as a 2° BSI when it
actually met the criteria for a CLABSI▫2 cases appear to have been overlooked
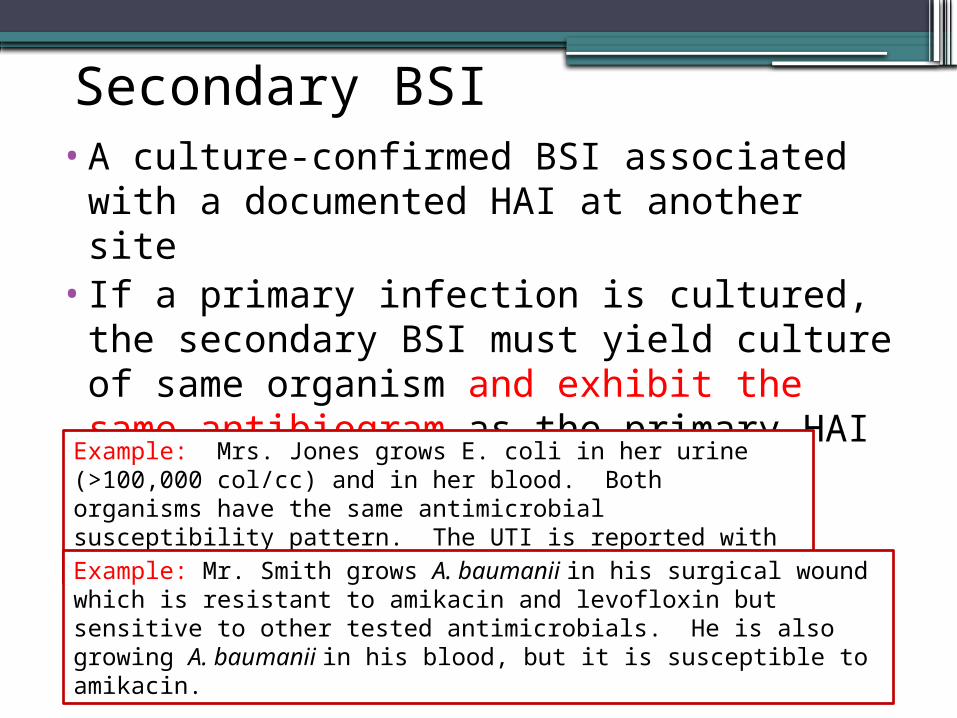
Secondary BSI•A culture-confirmed BSI associated with a
documented HAI at another site•If a primary infection is cultured, the
secondary BSI must yield culture of same organism and exhibit the same antibiogram as the primary HAI site
Example: Mrs. Jones grows E. coli in her urine (>100,000 col/cc) and in her blood. Both organisms have the same antimicrobial susceptibility pattern. The UTI is reported with a secondary BSI.Example: Mr. Smith grows A. baumanii in his surgical wound which is resistant to amikacin and levofloxin but sensitive to other tested antimicrobials. He is also growing A. baumanii in his blood, but it is susceptible to amikacin.
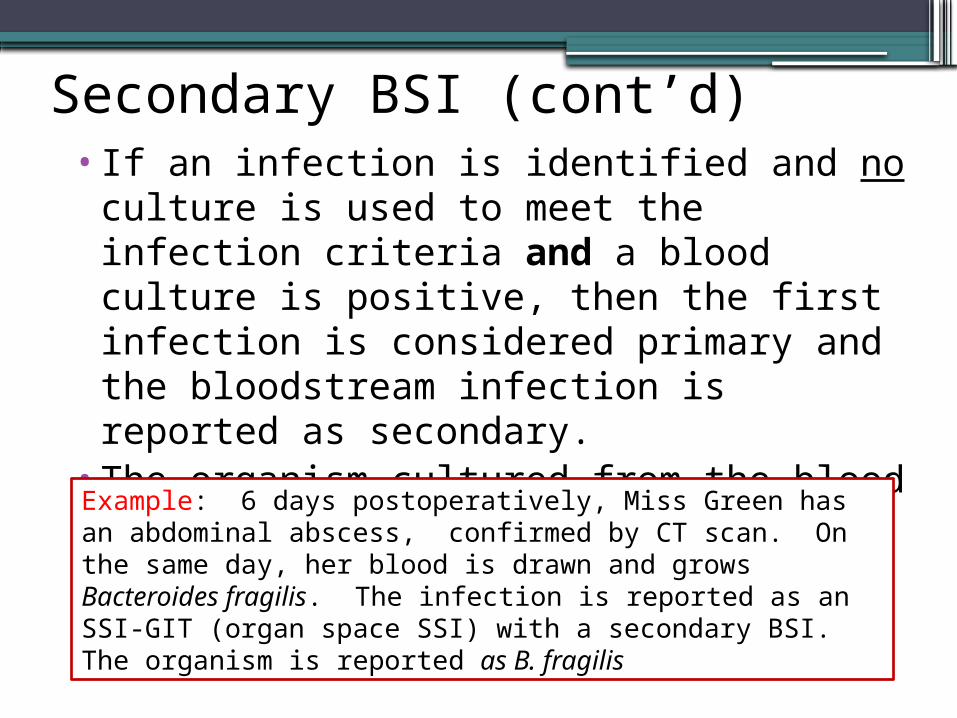
Secondary BSI (cont’d)•If an infection is identified and no culture
is used to meet the infection criteria and a blood culture is positive, then the first infection is considered primary and the bloodstream infection is reported as secondary.
•The organism cultured from the blood is reported as the organism for the primary site.
Example: 6 days postoperatively, Miss Green has an abdominal abscess, confirmed by CT scan. On the same day, her blood is drawn and grows Bacteroides fragilis. The infection is reported as an SSI-GIT (organ space SSI) with a secondary BSI. The organism is reported as B. fragilis
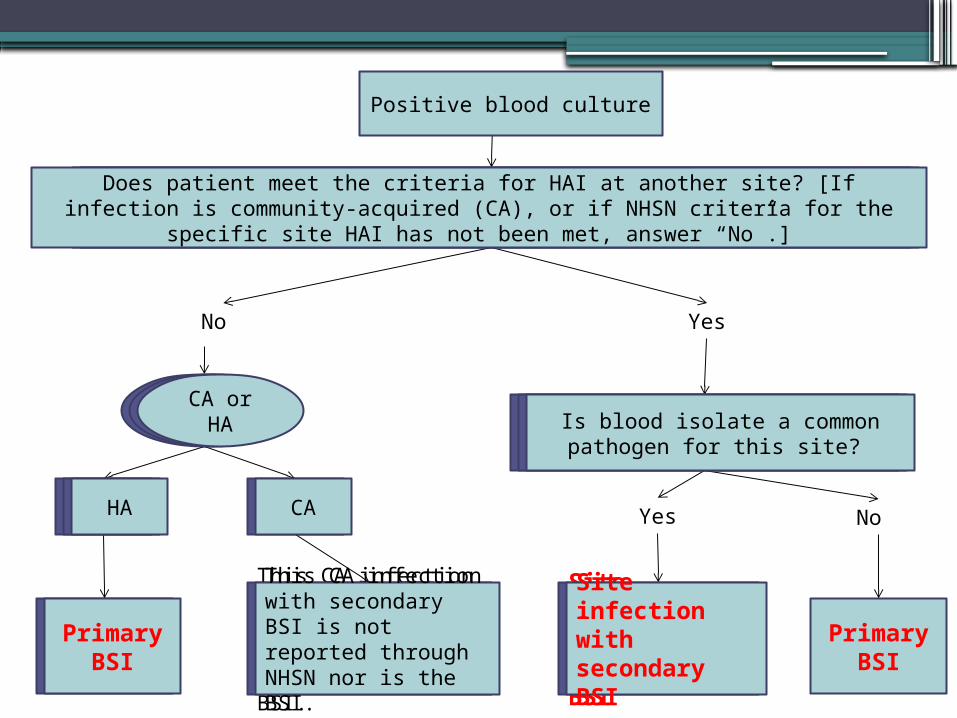
Does patient meet the criteria for HAI at another site? (If infection is CA, or if NHSN criteria for the specific site HAI has not been met, answer “No”.)
No Yes
CA or HA Is blood isolate a common
pathogen for this site?
HA CA
This CA infection with secondary BSI is not reported through NHSN nor is the BSI.
Primary BSI
NoYes
Site infection with secondary BSI
Primary BSI
Does patient meet the criteria for HAI at another site? (If infection is CA, or if NHSN criteria for the specific site HAI has not been met, answer “No”.)
CA or HA Is blood isolate a common
pathogen for this site?
HA CA
This CA infection with secondary BSI is not reported through NHSN nor is the BSI.
Primary BSI
Site infection with secondary BSI
Positive blood culture
Does patient meet the criteria for HAI at another site? [If infection is community-acquired (CA), or if NHSN criteria for the specific site HAI has not
been met, answer “No”.]
CA or HA Is blood isolate a common
pathogen for this site?
HA
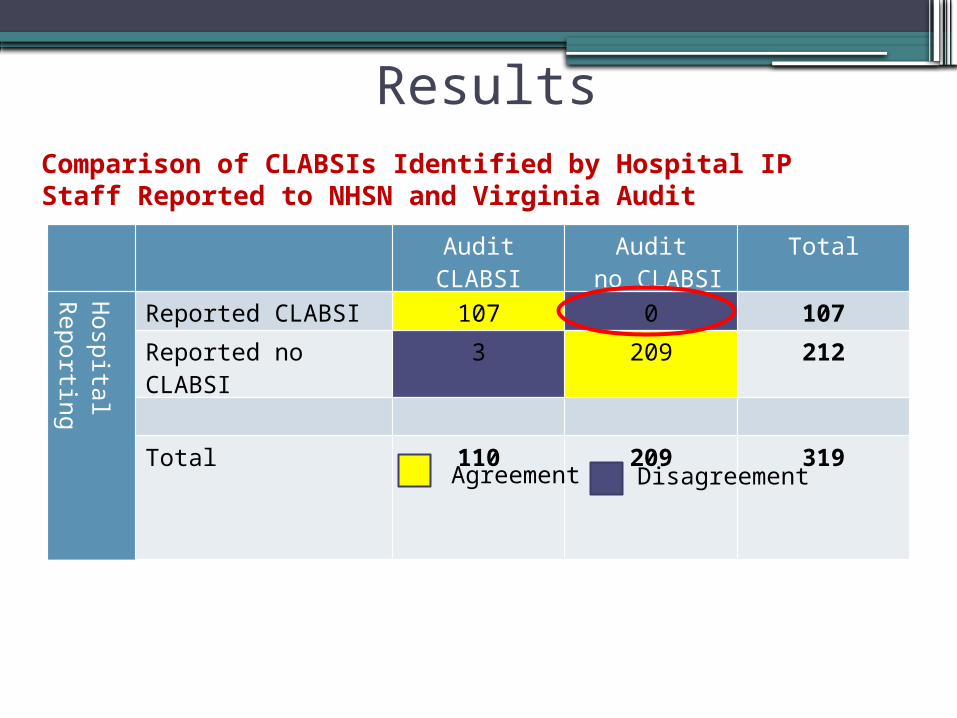
ResultsComparison of CLABSIs Identified by Hospital IP Staff Reported to NHSN and Virginia Audit
Audit CLABSI
Audit no CLABSI
Total
Hospital Reporting
Reported CLABSI 107 0 107
Reported no CLABSI
3 209 212
Total 110 209 319Agreement Disagreement
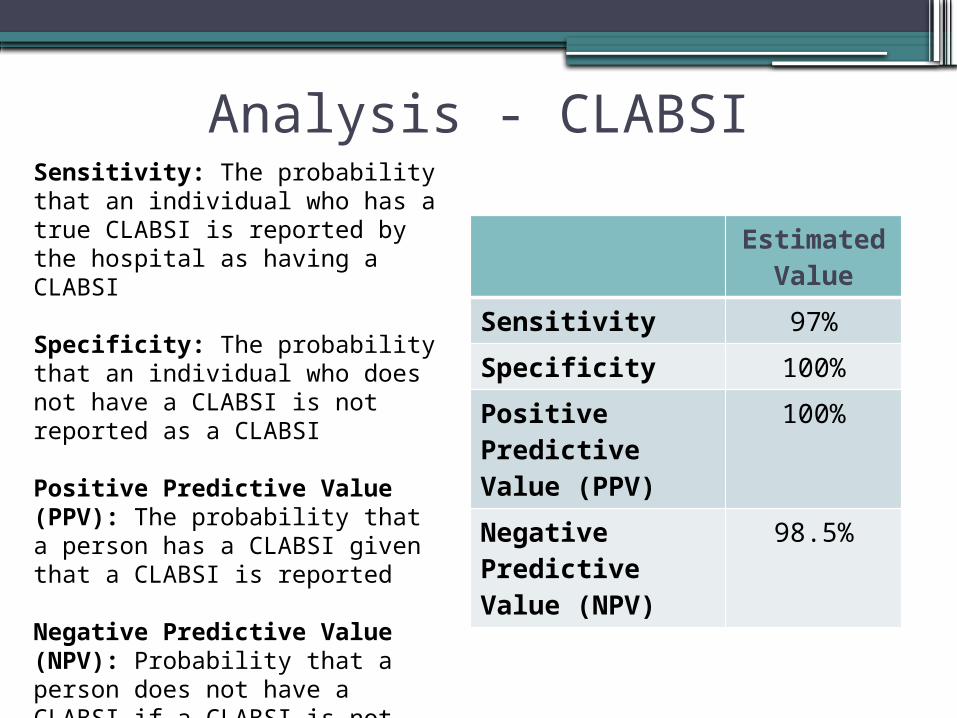
Analysis - CLABSI
Estimated Value
Sensitivity 97%
Specificity 100%
Positive Predictive Value (PPV)
100%
Negative Predictive Value (NPV)
98.5%
Sensitivity: The probability that an individual who has a true CLABSI is reported by the hospital as having a CLABSI
Specificity: The probability that an individual who does not have a CLABSI is not reported as a CLABSI
Positive Predictive Value (PPV): The probability that a person has a CLABSI given that a CLABSI is reported
Negative Predictive Value (NPV): Probability that a person does not have a CLABSI if a CLABSI is not reported
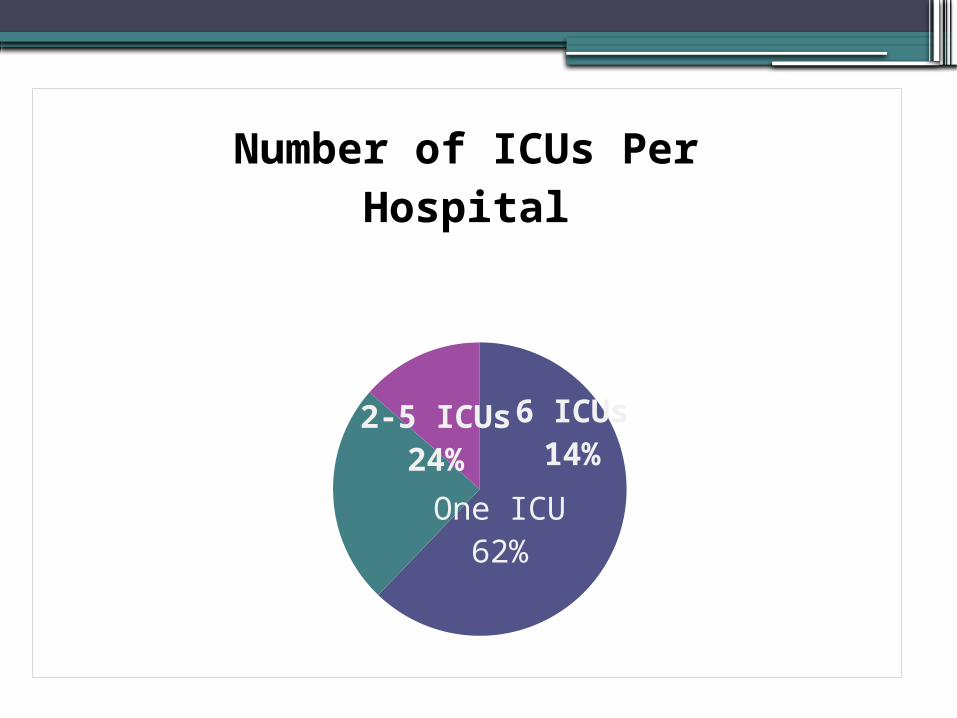
One ICU62%
2-5 ICUs24%
6 ICUs14%
Number of ICUs Per Hos-pital
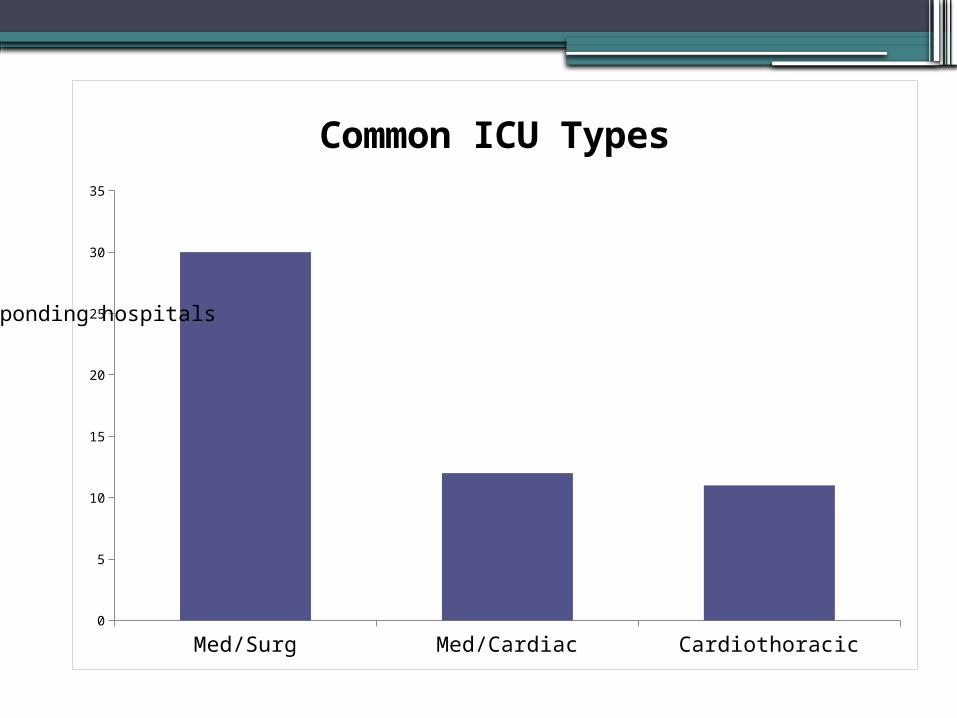
Med/Surg Med/Cardiac Cardiothoracic0
5
10
15
20
25
30
35
Common ICU Types
Nu
mb
er
of
resp
on
din
g h
osp
itals
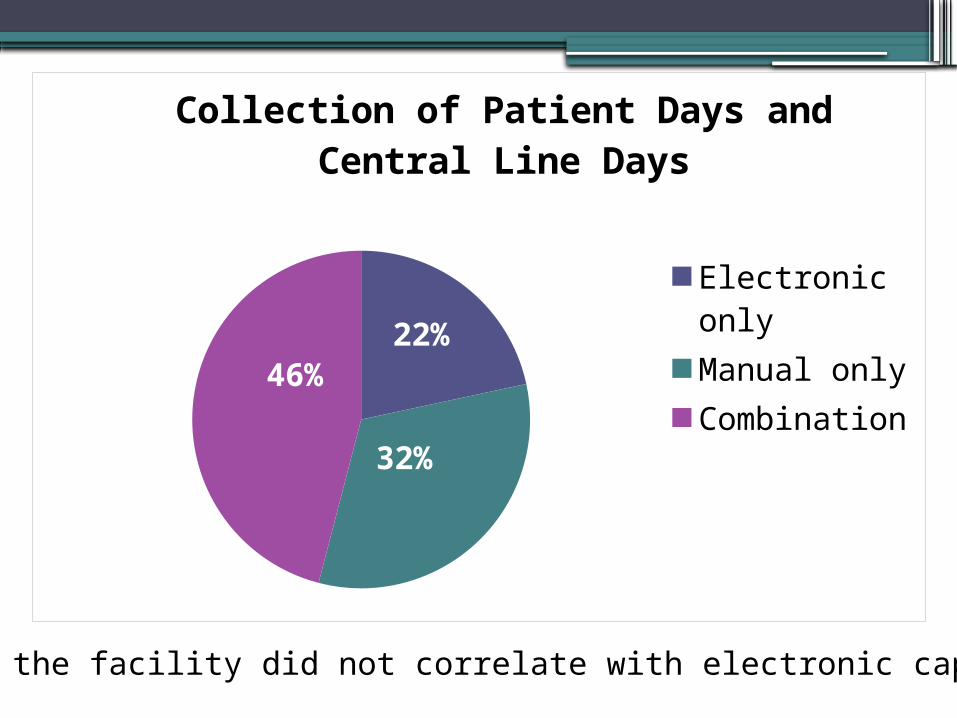
Size of the facility did not correlate with electronic capacity.
22%
32%
46%
Collection of Patient Days and Central Line Days
Electronic onlyManual onlyCombination
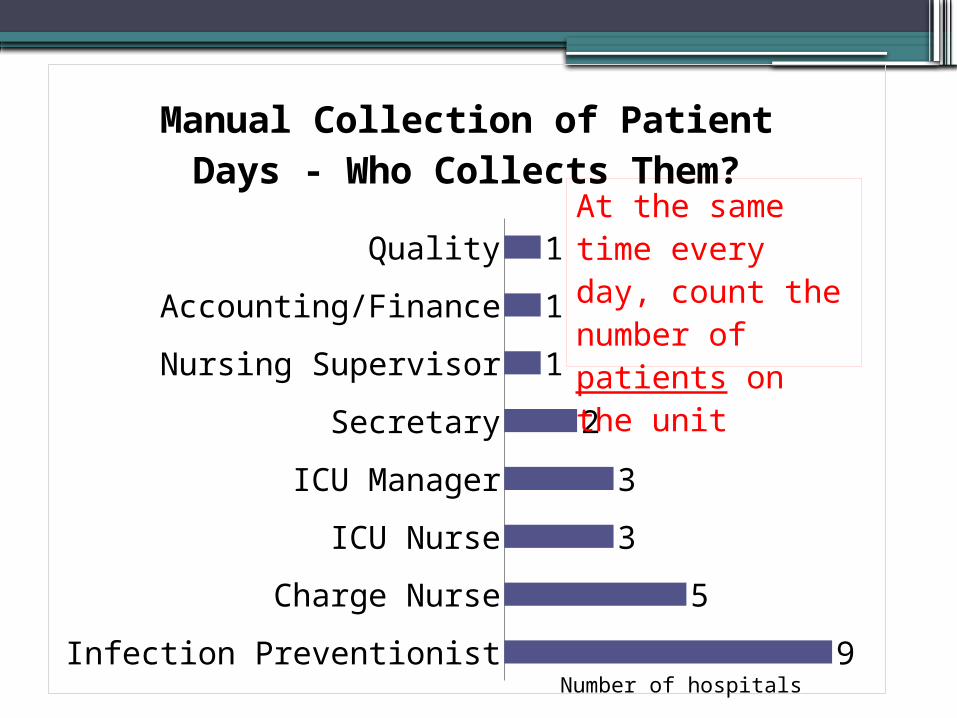
Infection Preventionist
Charge Nurse
ICU Nurse
ICU Manager
Secretary
Nursing Supervisor
Accounting/Finance
Quality
9
5
3
3
2
1
1
1
Manual Collection of Patient Days - Who Collects Them?
At the same time ev-ery day, count the number of patients on the unit
Number of hospitals
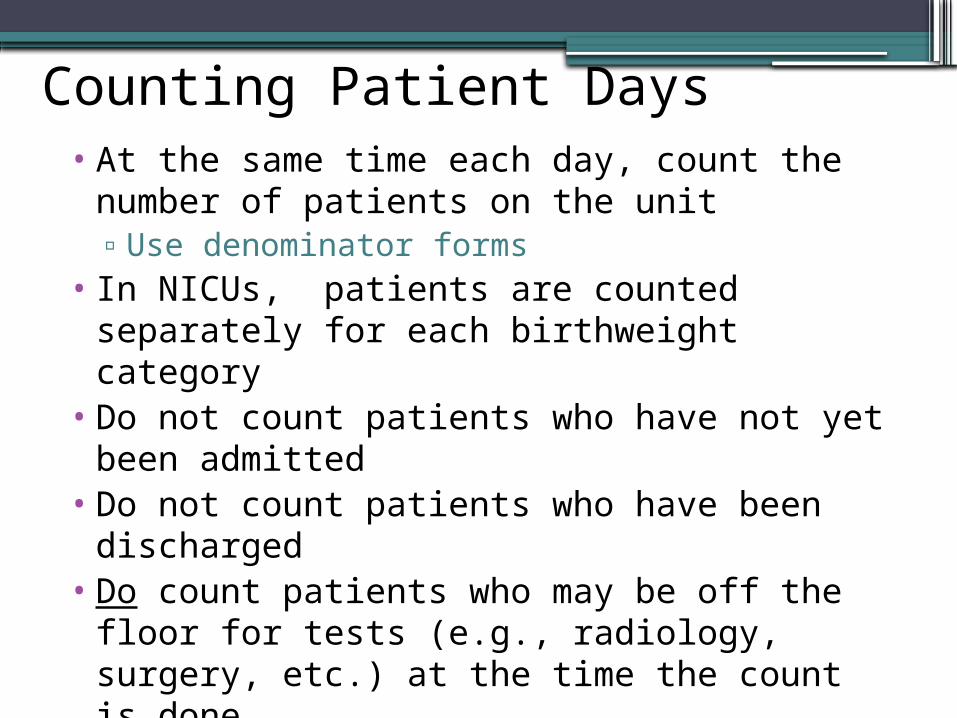
Counting Patient Days• At the same time each day, count the number
of patients on the unit▫Use denominator forms
• In NICUs, patients are counted separately for each birthweight category
• Do not count patients who have not yet been admitted
• Do not count patients who have been discharged
• Do count patients who may be off the floor for tests (e.g., radiology, surgery, etc.) at the time the count is done
• The total is recorded in NHSN at the end of the month
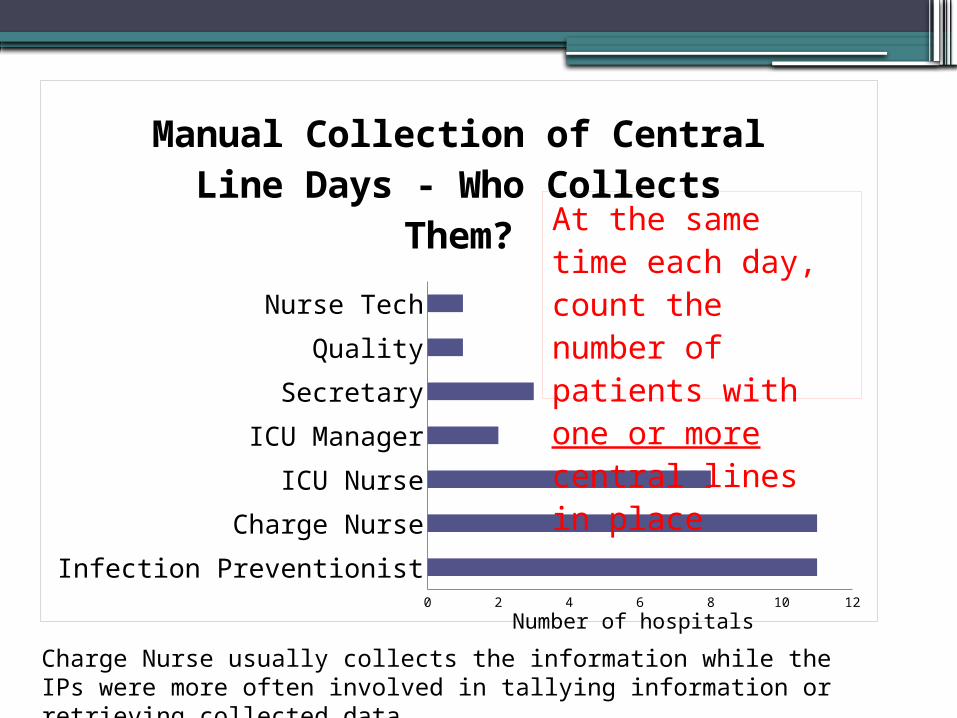
Infection Preventionist
Charge Nurse
ICU Nurse
ICU Manager
Secretary
Quality
Nurse Tech
0 2 4 6 8 10 12
Manual Collection of Central Line Days - Who Collects
Them? At the same time each day, count the number of patients with one or more central lines in place
Charge Nurse usually collects the information while the IPs were more often involved in tallying information or retrieving collected data
Number of hospitals
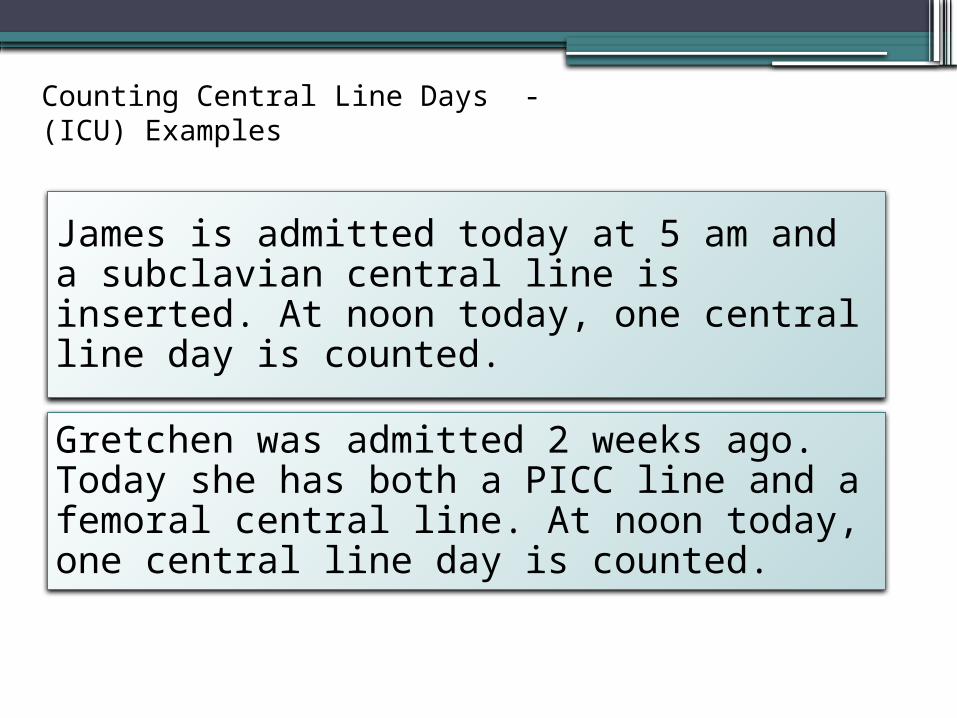
Counting Central Line Days -(ICU) Examples
James is admitted today at 5 am and a subclavian central line is inserted. At noon today, one central line day is counted.
Gretchen was admitted 2 weeks ago. Today she has both a PICC line and a femoral central line. At noon today, one central line day is counted.
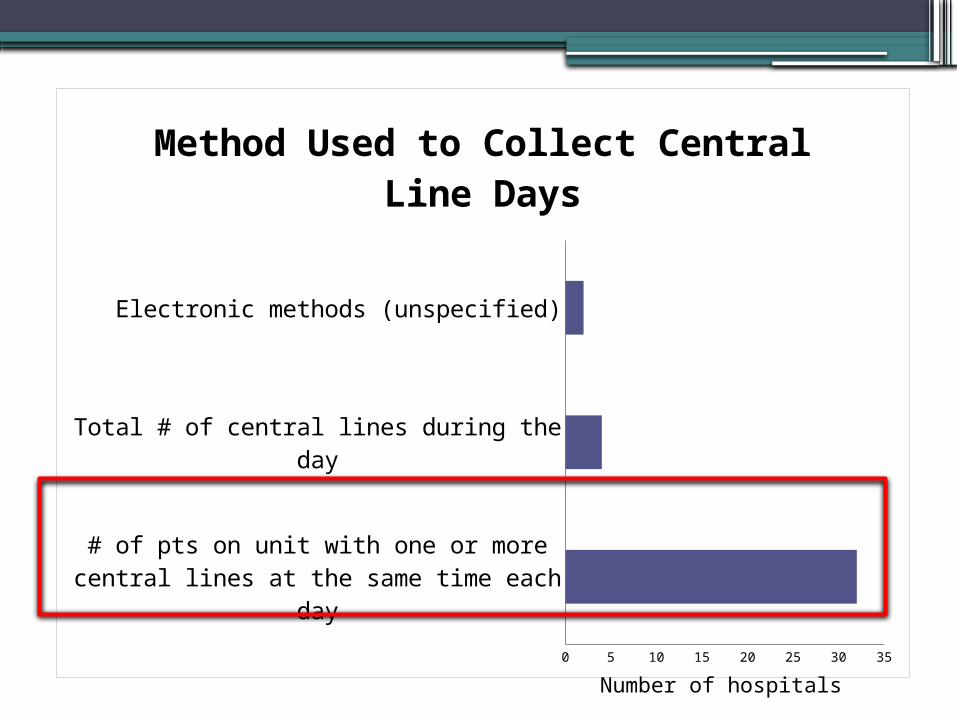
# of pts on unit with one or more central lines at the same time each
day
Total # of central lines during the day
Electronic methods (unspecified)
0 5 10 15 20 25 30 35
Method Used to Collect Central Line Days
Number of hospitals
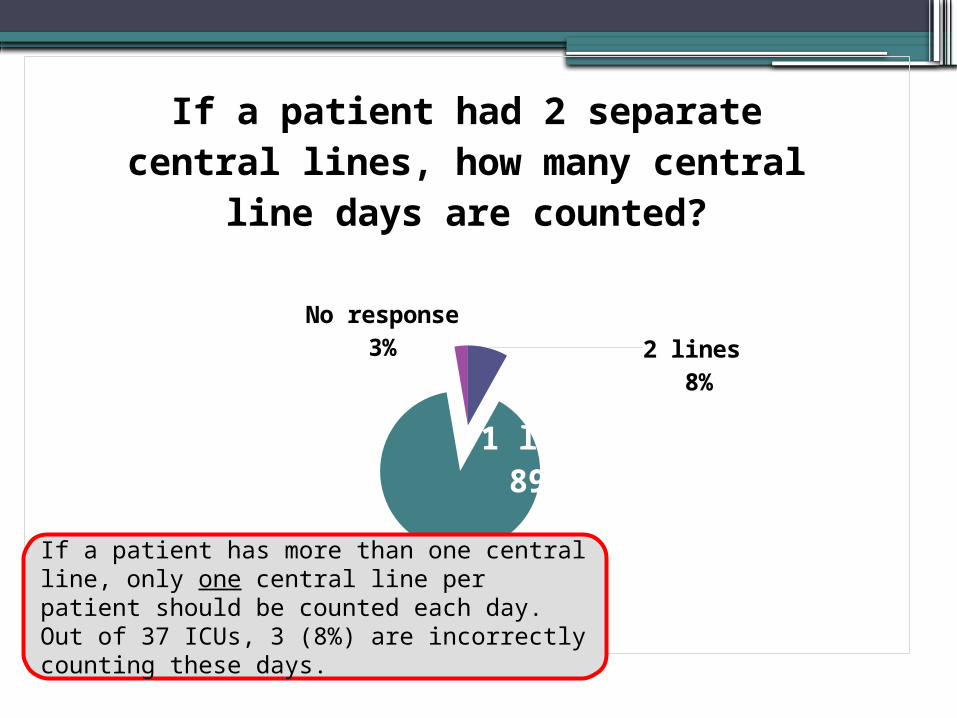
2 lines 8%
1 line89%
No response3%
If a patient had 2 separate cen-tral lines, how many central line
days are counted?
If a patient has more than one central line, only one central line per patient should be counted each day. Out of 37 ICUs, 3 (8%) are incorrectly counting these days.
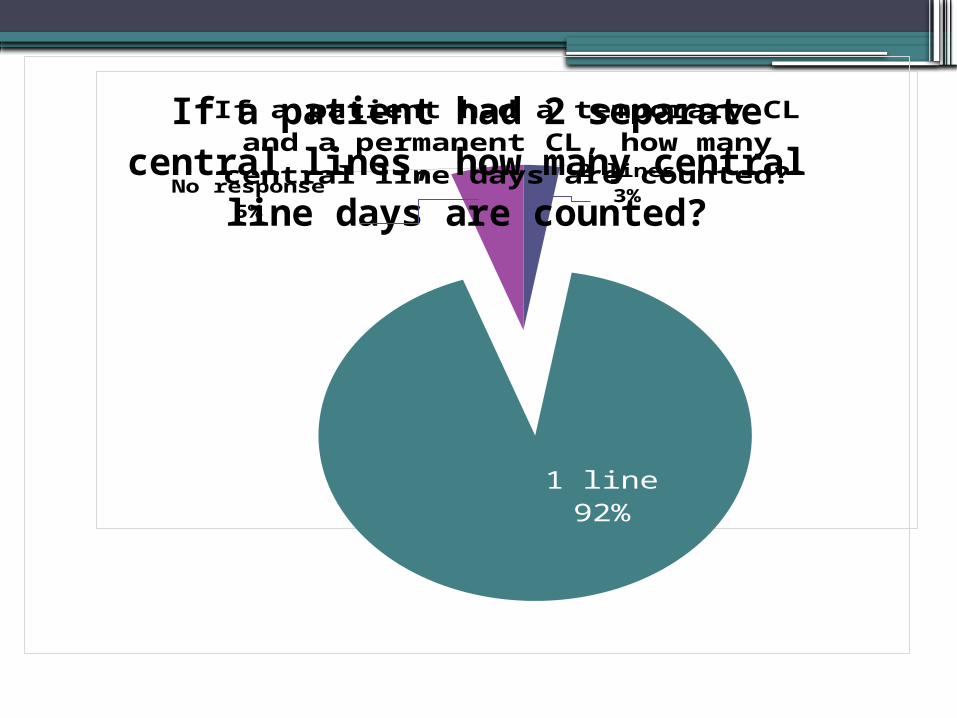
2 lines3%
1 line92%
No response5%
If a patient had a temporary CL and a permanent CL, how many central
line days are counted?
If a patient had 2 separate cen-tral lines, how many central line
days are counted?
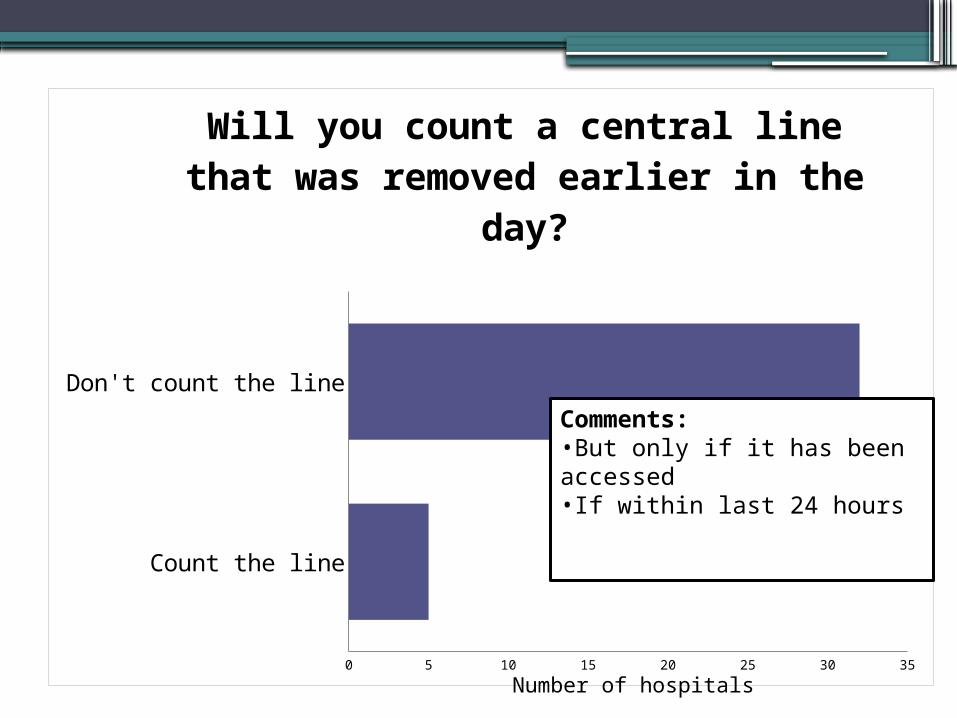
Count the line
Don't count the line
0 5 10 15 20 25 30 35
Will you count a central line that was removed earlier in the day?
Comments:•But only if it has been accessed•If within last 24 hours
Number of hospitals
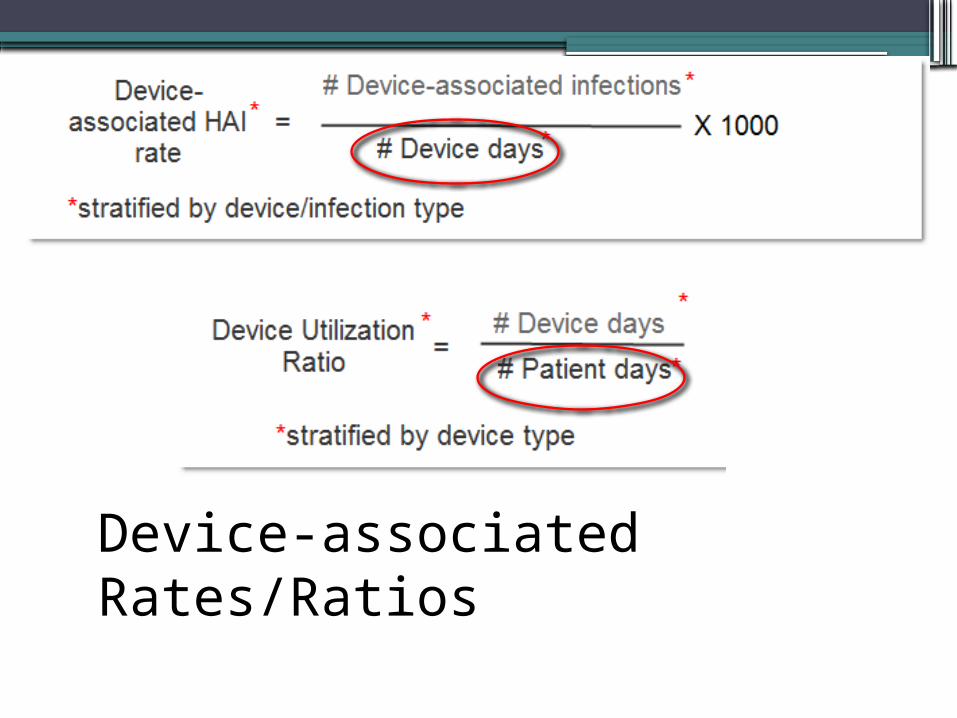
Device-associated Rates/Ratios
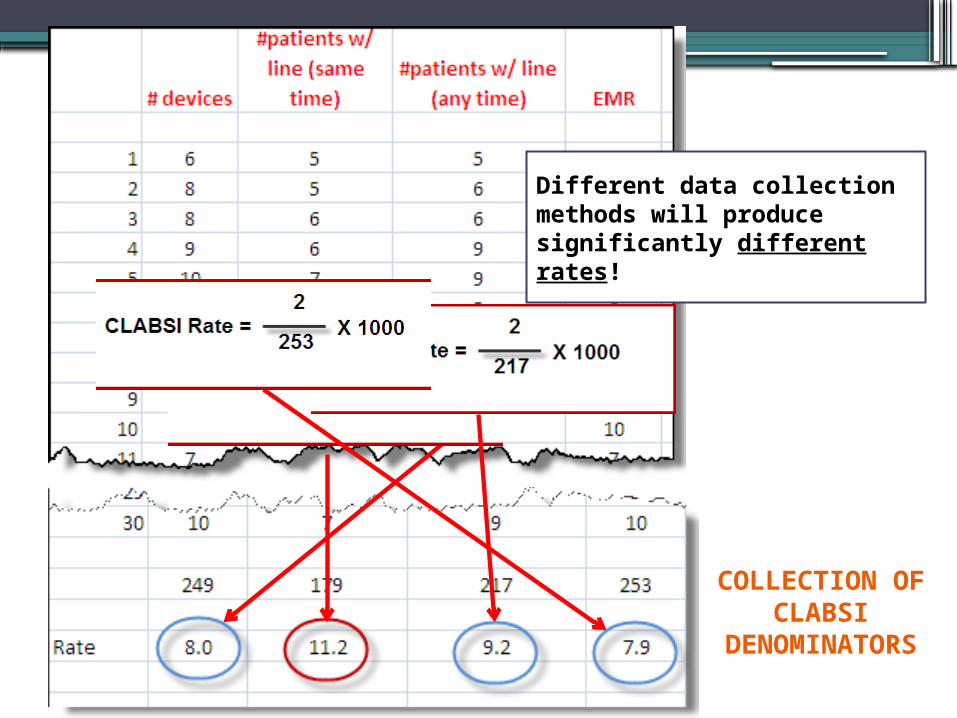
Different data collection methods will produce significantly different rates!
COLLECTION OF CLABSI
DENOMINATORS
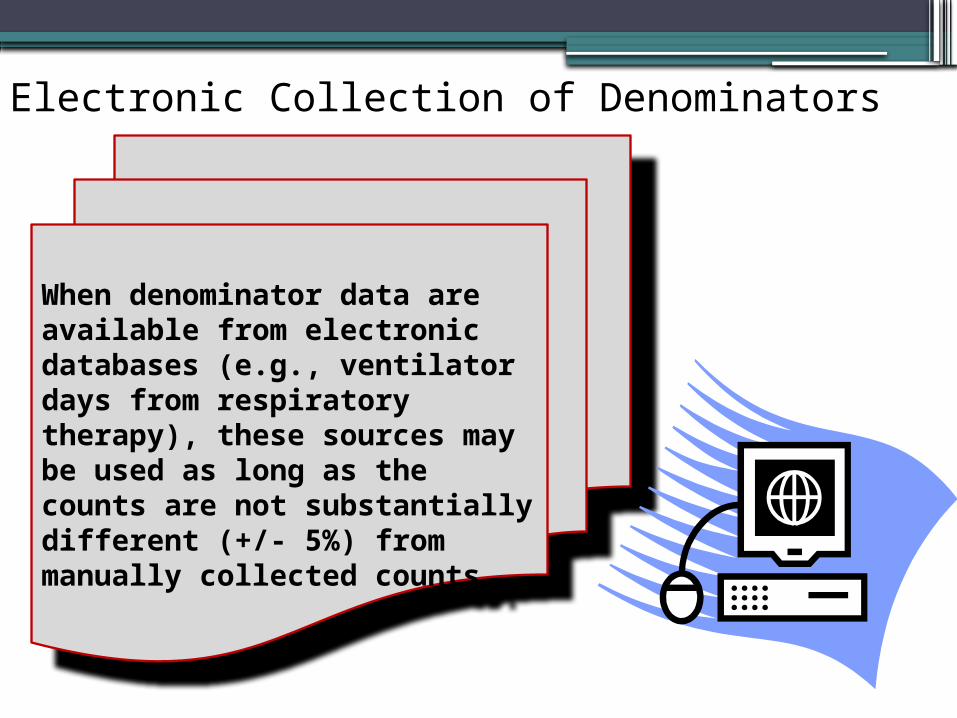
Electronic Collection of Denominators
When denominator data are available from electronic databases (e.g., ventilator days from respiratory therapy), these sources may be used as long as the counts are not substantially different (+/- 5%) from manually collected counts.
Are peripheral IVs counted as central lines?
No – 100% answered correctly
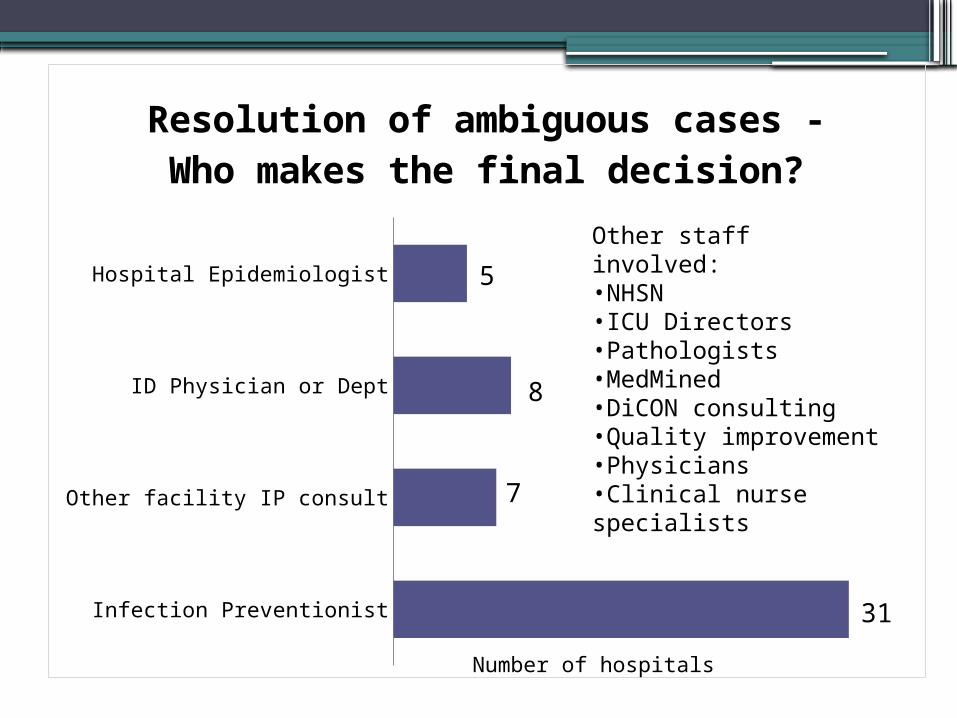
Infection Preventionist
Other facility IP consult
ID Physician or Dept
Hospital Epidemiologist
31
7
8
5
Resolution of ambiguous cases -Who makes the final decision?
Other staff involved:•NHSN•ICU Directors•Pathologists•MedMined•DiCON consulting•Quality improvement•Physicians•Clinical nurse specialists
Number of hospitals
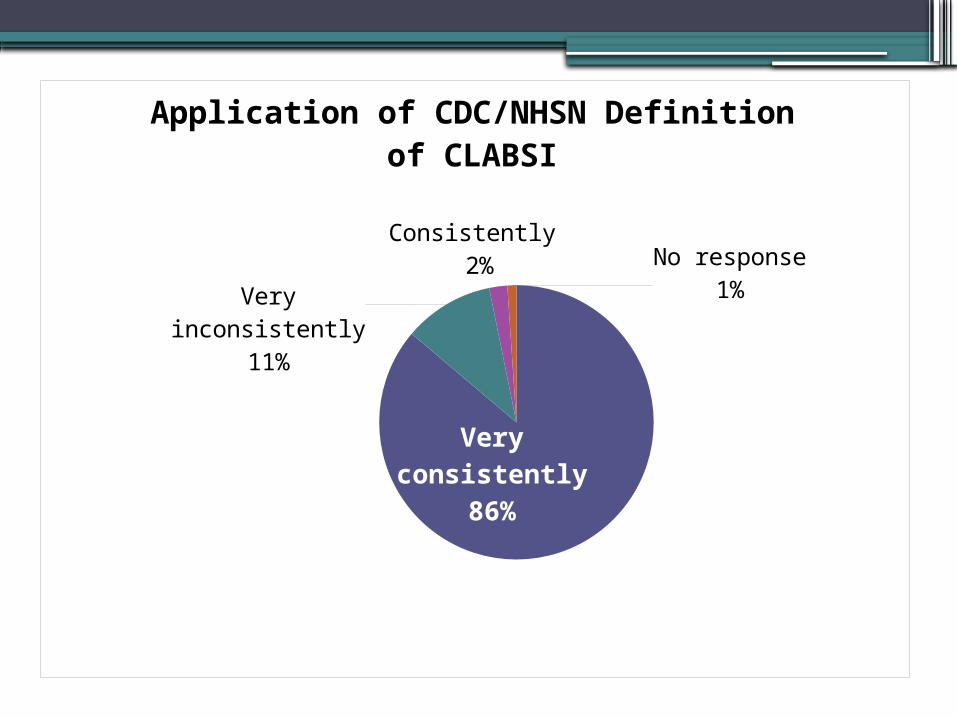
Very con-sistently
86%
Very incon-sistently
11%
Consistently 2% No response
1%
Application of CDC/NHSN Definition of CLABSI

Annual competency skills review
Staff orientation
Ongoing staff education
Use NHSN materials
Corporate webinars
APIC Webinars
No training
0 1 2 3 4 5 6 7 8 9 10
Methods for Training for Data Collectors
Number of hospitals
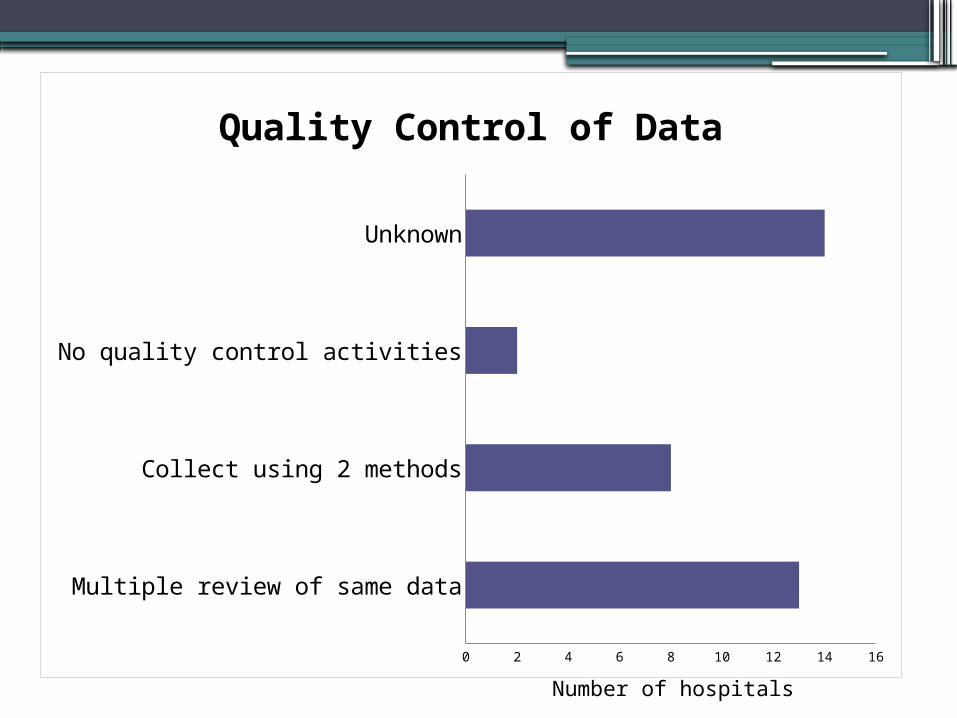
Multiple review of same data
Collect using 2 methods
No quality control activities
Unknown
0 2 4 6 8 10 12 14 16
Quality Control of Data
Number of hospitals
Discussion
• Great job applying the surveillance definitions!▫Celebrate and promote your success
• Areas for improvement▫Denominator data collection▫Quality assurance▫Continued education
• Quarterly reporting reminders▫Monthly reporting plan essential!▫Update NHSN (and VDH) about changes to unit
composition▫www.vdh.virginia.gov/Epidemiology/
Surveillance/HAI/haireport.htm
Discussion (cont’d)
•Limitations of project▫Audited ½ hospitals, took sample of blood
cultures Unable to quantify total number of CLABSIs in
the entire state May have missed some under-reporting issues
•How has this project impacted you?▫Increased confidence in standardization and
quality of data?▫Changes to data collection, quality assurance
methods, or educational strategies?
Next Steps•Public reporting
▫Proposed additions to state reporting regulations
▫CMS – CLABSI in NICU, PICU•Publish VDH report on CLABSI audit project•Presentation of CLABSI data in quarterly
reports?▫More analyses by unit?▫Transition to use of SIR?
•VDH/APIC conference 11/10/11 (Richmond)▫More about quality assurance using NHSN,
data analysis, and presentation•NHSN denominator simplification project
Thank You!
•Participating facilities•VHHA
▫Barbara Brown, PhD•Data validation specialists
▫Jeanette Daniel, RN, CIC▫Bonnie Harris, RN, CIC▫Carol Jamerson, RN, BSN, CIC▫Loretta Reardon, RN, CIC
•APIC-VA

Questions?
Contact the VDH HAI Program
Program Coordinator [email protected] / 804-864-8097
[email protected] / 804-864-7550
Nurse [email protected] / 804-864-7547