Embed Size (px)
Citation preview
Findings from the 2009 Quality of Life survey
Voscur Assembly
Create Centre, 3rd March 2010
Sarah McMahonConsultation and Research Co-ordinatorConsultation, Research and Intelligence
Team, Bristol City CouncilEmail: [email protected]

Contents
About the survey 2009 Summary of trends Interpretation of specific indicators
Influencing local decisions Satisfaction with the neighbourhood Happiness and life satisfaction
Trends in neighbourhood partnership areas
Equalities groups Key web sites and contacts Questions and answers
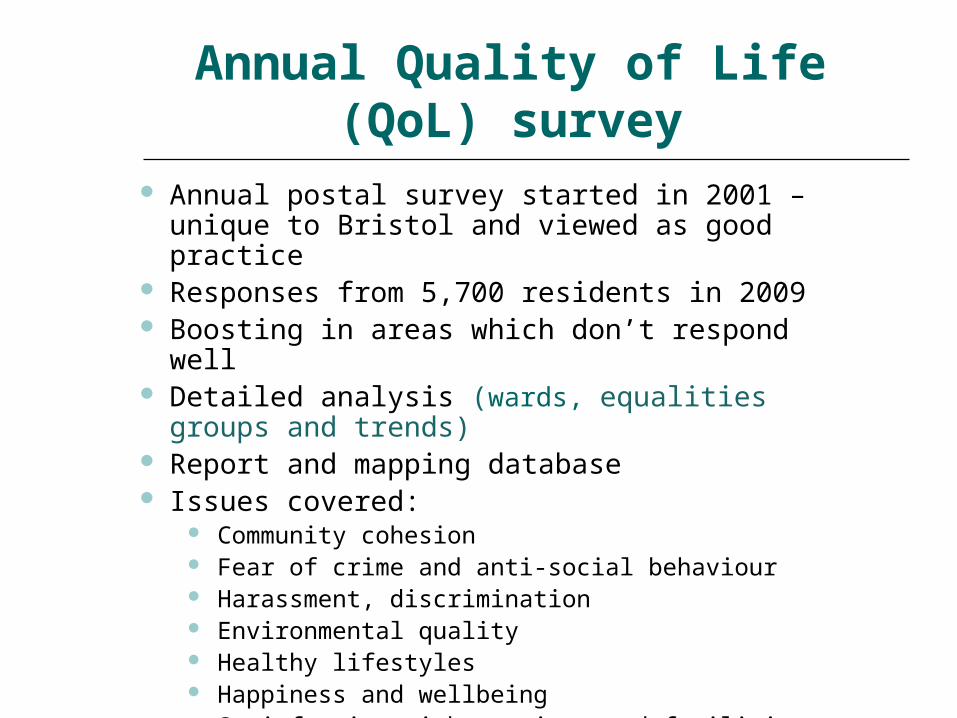
Annual Quality of Life (QoL) survey
Annual postal survey started in 2001 – unique to Bristol and viewed as good practice
Responses from 5,700 residents in 2009 Boosting in areas which don’t respond well Detailed analysis (wards, equalities groups and
trends) Report and mapping database Issues covered:
Community cohesion Fear of crime and anti-social behaviour Harassment, discrimination Environmental quality Healthy lifestyles Happiness and wellbeing Satisfaction with services and facilities

Summary of trends for 2009 (to date) Getting better or staying good
Community safety, ASB, victims of crime and policing Community cohesion (respect, responsible parenting) Neighbourhood satisfaction (litter, fly tipping) Park and playground quality Bus service Healthy lifestyles (smoking, healthy eating) Facilities for disabled people and older people
Staying the same – no trend Satisfaction with life and happiness General health (long term illness and obesity) Influencing decisions Satisfaction with the council
Getting worse, staying poor Drunk and rowdy behaviour Taking moderate exercise More people claiming benefits

Interpretation of the evidence Feeling influential about local decisions (NI 04)
Only 23% of residents feel influential Bristol ranks bottom for core cities
(2008) The ward pattern is similar each year
with many residents in the same areas feeling less influential
People feel more influential in BME groups (31%), in Southville, Bishopston and Ashley (all over 36%)
More residents living in east Bristol feel less influential
15.7 to 20.9
21 to 26.3
26.4 to 31.7
31.7 to 37
% respondents who feel they can influence decisions
Source: Quality of Life survey Bristol City Council 2009
%10.4 to 15.6
% who feel they can influence decisions in their local area
2224
26 252323
2530
27
2005 2006 2007 2008 2009
QoL survey Place or BV surveyCore city average Bristol target

Ward trends Feeling influential about local decisions (NI 04)
Avonmouth (26%) Kingsweston (21%)
Ashley (36%) Easton (30%) Lawrence Hill (27%)
Bishopsworth (17%) Hartcliffe (24%) Whitchurch Park (22%)
0.0
10.0
20.0
30.0
40.0
50.0
2005 2006 2007 2008 2009
0.010.020.030.040.050.0
2005 2006 2007 2008 2009
0.010.020.030.040.050.0
2005 2006 2007 2008 20090.0
10.020.030.040.050.0
2005 2006 2007 2008 2009
0.010.020.030.040.050.0
2005 2006 2007 2008 2009
0.010.020.030.040.050.0
2005 2006 2007 2008 2009
0.010.020.0
30.040.050.0
2005 2006 2007 2008 20090.0
10.020.030.040.050.0
2005 2006 2007 2008 2009

Interpretation of the evidence Satisfaction with the local neighbourhood as a place to live (NI 05)
Bristol has measured an improving trend and 80% of residents are satisfied
Bristol is 2nd best of the 8 core cities (75%) and is the same as the England average (80%)
Residents in deprived areas are least satisfied (67%) and the Muslim community (66%).
The gap in satisfaction between deprived areas and the rest the city, is closing
% residents satisfied with the local area as a place to live
75 77 79 80
68
7975
82 84
2006 2007 2008 2009 2010
QoL survey Place or BV survey
Core city average Bristol target
57.9 to 68.9
69 to 79.9
80 to 88.6
88.7 to 97.4
% respondents satisfied with neighbourhood
Source: Quality of Life survey Bristol City Council 2009
%

Interpretation of the evidence Happiness and life satisfaction
Happiness and life satisfaction are very stable indicators and reflect the national averages for these (91% and 74% respectively)
Happiness and life satisfaction are both lowest for disabled people (79% and 53% respectively), and in both Lawrence Hill and Filwood.
Happiness and life satisfaction
91 92 90 91 91
74 76 74 74 74
0102030405060708090
100
2005 2006 2007 2008 2009
% r
esid
ents
% happy % satisfied with life
81.2 to 85.9
86 to 90.5
90.6 to 93.7
93.8 to 97
% respondents who say they are happy
Source: Quality of Life survey Bristol City Council 2009
%
% respondents satisfied with life
0102030405060708090
100
All
NR
A
Old
er p
eopl
e
Dis
able
d pe
ople
BM
E
Car
er
LGB
T
Mal
e
Fem
ale
Chr
istia
n
Mus
lim
No
faith

9 8 7 6 5 4 3 2 1 1 2 3 4 5 6 7 8 9
AvonmouthKingsweston
HenburySouthmead
HenleazeStoke Bishop
Westbury on Trym
HorfieldLockleaze
EastvilleHillfields
Frome Vale
BishopstonCotham
Redland
CabotClifton
Clifton East
AshleyEaston
Lawrence Hill
St George EastSt George West
BedminsterSouthville
FilwoodKnowle
Windmill Hill
Brislington EastBrislington West
BishopsworthHartcliffe
Whitchurch
HengroveStockwood
Quality of life indicator trends grouped by NP area
Deteriorating Improving
Avonmouth and Kingsweston
Declining satisfaction with appearance of the built environment
Declining sports activity and access to sports centre
Improving fear of crime and less ASB
Better facilities for older people
Ashley, Easton, Lawrence Hill
Declining sports activity and exercise
Improving fear of crime, ASB, people using drugs
Less noise in the neighbourhood
More visits to parks (Easton)
Neighbourhood trends
Bishopsworth, Hartcliffe and Whitchurch Park
Declining sports activity and exercise
Improving fear of crime, ASB, people using drugs
Less noise in the neighbourhood
Improving neighbourhood satisfaction & park quality
Declining litter and refuse problem
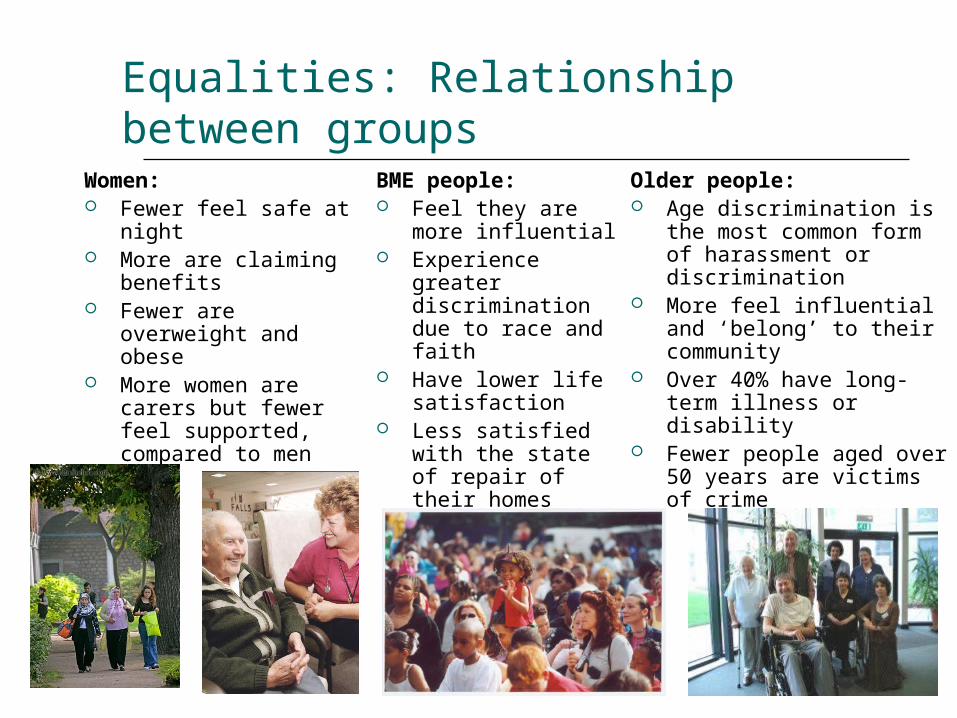
Equalities: Relationship between groups
Women: Fewer feel safe at
night More are claiming
benefits Fewer are overweight
and obese More women are
carers but fewer feel supported, compared to men
Older people: Age discrimination is the
most common form of harassment or discrimination
More feel influential and ‘belong’ to their community
Over 40% have long-term illness or disability
Fewer people aged over 50 years are victims of crime
BME people: Feel they are more
influential Experience greater
discrimination due to race and faith
Have lower life satisfaction
Less satisfied with the state of repair of their homes
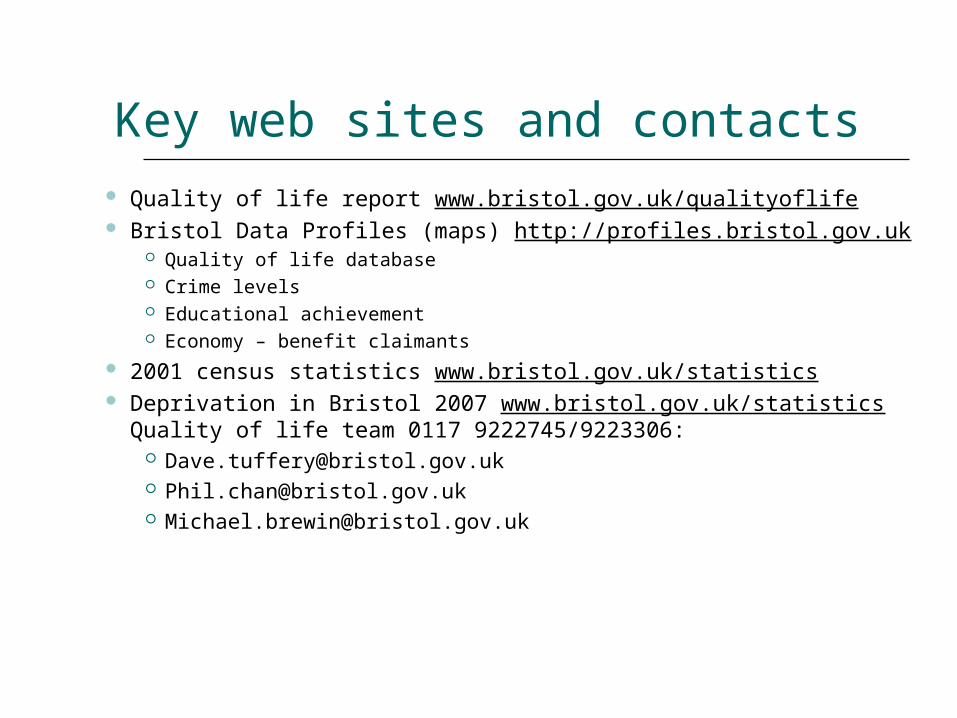
Key web sites and contacts
Quality of life report www.bristol.gov.uk/qualityoflife Bristol Data Profiles (maps) http://profiles.bristol.gov.uk
Quality of life database Crime levels Educational achievement Economy – benefit claimants
2001 census statistics www.bristol.gov.uk/statistics Deprivation in Bristol 2007 www.bristol.gov.uk/statistics Quality
of life team 0117 9222745/9223306: [email protected] [email protected] [email protected]

Questions and Answers