Embed Size (px)
Citation preview
Finding the ‘Start Line’ with an Institutional
Effectiveness Inventory
Sharron L. Ronco, Ph.D. Assistant Provost, Institutional Effectiveness & Analysis
Stephanie G. Brown
Doctoral Candidate, Educational Leadership
Florida Atlantic University 777 Glades Rd.
Boca Raton, FL 33431 (561) 297-2665
(561) 297-2590 fax [email protected]
Paper presented at the 2000 Annual Meeting, Commission on Colleges of the SouthernAssociation of Colleges and Schools, December 2-6, Atlanta, Georgia

It has been nearly a quarter of a century since assessment began as a way for a
college or university to measure its impact on students. Instead of focusing on inputs and
resources, assessment looks critically at student learning, articulating program goals,
setting standards for accomplishment, and measuring the extent to which standards are
met. The question, “What should our graduates know, be able to do, and value?” is the
focal point for beginning an assessment effort where outcomes matter most.
The mandate for assessment developed as various national commissions studying
higher education concluded that a “disturbing and dangerous mismatch exists between
what American society needs from higher education and what it is receiving.”
(Wingspread Group on Higher Education, 1993). What began as an experimental
response to those concerns on the part of a handful of institutions has developed into a
national agenda. For the past 15 years, there has been relentless pressure for assessment
and the expectations associated with it (Gray, 1997).
Influences on student assessment have been exerted by national-level efforts,
state-level initiatives, accreditation agencies, the private sector and professional
associations. All six regional accrediting agencies now require evidence of student
assessment. According to a recent survey, all but four of fifty states reported some type
of student assessment, and the requirement to demonstrate effectiveness via student
outcomes has become part of performance funding in a number of states (Ewell, 1996;
Cole, Nettles & Sharp, 1997; Peterson and Einarson, 2000). Regardless of who guides
the effort to strengthen institutional accountability, it appears inevitable that student
Xiaomei Feng assisted with data analysis for this paper.
outcomes assessment will endure as a topic of institutional, regional and national concern
into the 21st century.
Conceptual Framework
Like many institutions, our impetus for instituting a program of institutional
effectiveness was an impending regional accreditation visit. Undertaking assessment in
at atmosphere where many faculty are unfamiliar with the concept is a challenge,
particularly at a large, diffuse university where colleges are independent and faculty in a
single discipline may be scattered across several campuses. In order to lay the
groundwork for an initiative that is certain to claim a fair amount of time and resources
over the next several years, we decided to begin by polling departments on their existing
assessment activities. We chose to develop an inventory checklist to identify current
campus practices for assessing student performance-related outcomes.
The development of an inventory checklist was not a novel idea for such an
undertaking. The Southern Association of Colleges and Schools encourages its member
institutions to begin their evaluation of institutional effectiveness by conducting an
assessment of existing practices within the institution, and even suggests a format for the
inventory (Commission on Colleges of the Southern Association of Colleges and
Schools, 1996). Nichols (1995) discusses the importance and added value of conducting
an inventory of assessment activities. Many of his case study institutions reported the use
of an inventory for means of collecting and reporting information (Nichols, 1993).
Palomba and Banta (1999) point out that completing an inventory of current data
collection methods may uncover several activities that, although not specifically designed
2

for program assessment, can help accomplish its purpose. Institutions using inventories
reported benefits ranging from the identification of disparities in existing operations and
programs to using inventory results as benchmarks to measure future assessment efforts
(Nichols, 1995; Hodge, 1997).
Administering the Inventory Checklist
The purpose of the inventory checklist was to stimulate conversation and provoke
thought among department chairs and their units about ways in which student
performance-related outcomes are measured and to evaluate current methods for overall
program effectiveness. The inventory checklist identified strengths, weaknesses, and
needed resources in individual programs. It highlighted areas in which programs had
proven methods of assessment in place, and uncovered methods of assessment not in
place but potentially useful. It allowed respondents to determine which methods were not
desirable or applicable for program assessment.
The inventory checklist was designed to be administered in an interview setting
and with three areas of interest in mind. The first area focused on departmental mission,
intended educational outcomes, and written methods of assessment for evaluating
program effectiveness. The second area focused on direct and indirect indicators of
assessment. Direct indicators assess knowledge and skills demonstrated by the student,
such as capstone courses, portfolio assessments, licensure, certification, or professional
exams, and video and audiotape evaluations. Indirect indicators assess students’ and
others’ opinions of their learning, such as student course evaluations, employer surveys
and questionnaires, student exit interviews, and alumni surveys. The third area focused
3

on the use of inventory results for overall program improvement, and identification of
needed resources such as training, personnel, and technology, for improving student
outcomes and program effectiveness.
Prior to the interview, a web search was conducted to identify educational
outcomes plans from other institutions that had completed, or were in the process of
completing, the SACS reaffirmation Self-Study. At least one educational outcomes plan
was printed for each discipline, so that chairs could have a tangible example of
assessment work done by their colleagues in other institutions. The plan, along with a
copy of the inventory checklist, was provided to each department chair a few days prior
to the interview.
The interview consisted of a one-on-one discussion with each department chair.
The focus of the interview was to complete the inventory checklist, gather any supporting
documentation offered, and ask as many questions as possible about specific outcomes
assessment methods used by each department or program. The inventory checklist
proved beneficial in gathering information in several ways. First, it stimulated an
exchange of information between the department chair and the interviewer regarding
specific outcomes assessment methods used by departments and programs. Second, it
delineated examples of many different types of outcomes assessment methods, thus
encouraging departments and programs to consider assessment in broader, and less
strictly quantitative, terms. Third, it brought to realization the fact that some departments
and programs were well on their way in identifying formal assessment activities.
Likewise, departments or programs lagging in formal assessment activities were
4
identified. Finally, departments and programs were able to identify and prioritize the
areas where programs, services, and operations needed to be improved.
The inventory checklist, coupled with individual interviews, proved to be an
effective method for gathering information about individual departments and programs.
The interview format was non-threatening, thereby allowing for an open and honest
dialogue between the interviewer and the department chair. Department chairs candidly
voiced their concerns, fears, and support about the reaffirmation project. Two-way
communications between the interviewer and the department chair was not only
stimulated, but also encouraged. Each party was given the opportunity to ask questions,
not only concerning the department or program, but the reaffirmation project as well.
Administering the checklist to the administrative and academic support units took
a slightly different route. Believing that it was impractical and unnecessary to interview
each unit director separately, we instead attended scheduled staff meetings in each area
and explained the institutional effectiveness cycle, walking the participants through the
checklist. We asked for the inventories to be completed and returned to our office within
a month. The response rate was good, but the self-report aspect of this collection effort
made the results a little less credible, particularly where documentation was not attached
to the checklist.
Using the Checklist Results
Information from the completed checklists was first organized onto a spreadsheet
to simplify analysis of results (Figure 1). Tallied results indicated that 80% of the
departments reported having written mission statements, 43% said that they had
5

Figure 1. Sample spreadsheet data for compiling checklist results. College Business Business Business Business Business Department Marketing School of Accounting Economics Finance Program Marketing Accounting Economics Finance Program level BS MACC MAT BS Written mission statement? Yes Yes Yes Yes Intended educational outcomes? Yes Yes No Yes Written methods of assessment? Yes Yes No Yes Separate accreditation? AACSB No AACSB AACSB Direct indicators of assessment:
Comprehensive exam Currently use N/A N/A Would use Writing proficiency exam N/A Currently use N/A N/A National exam Would use N/A Would use N/A GRE subject test N/A N/A N/A N/A Certification exam N/A Currently use N/A N/A Licensure exam N/A Currently use N/A N/A Local pretest-posttest Would use N/A Would use N/A Performance assessment N/A N/A N/A N/A Video/audio tape evaluation N/A N/A N/A N/A Senior thesis/major project N/A Currently use N/A Currently use Portfolio evaluation N/A N/A N/A N/A Capstone courses Would use N/A N/A Currently use
articulated intended educational outcomes, and 37% had defined methods of assessment
for evaluating program effectiveness in terms of measurable student outcomes. Almost
all reported that they had used assessment, however informally obtained, to improve
programs.
The ordering of direct measures shown in Figure 2 clarified which indicators were
most frequently used across departments. Direct measures are those that require students
to display their knowledge and skills as they respond to the measurement itself. Senior
projects topped the list of most frequently used direct indicators, followed by the GRE
subject tests, capstone courses and comprehensive exams. The “white space” between
shaded bars was of special interest, since it points to indicators departments would be
6

willing to consider making a part of their program assessments. For the most part, white
space was scarce for direct indicators; departments were either using the indicator or
were not interested in using it. Measures requiring performance rather than testing were
slightly more popular. Since fewer than half of the departments were either using or
planning to use most direct measures, it became obvious that these measures were going
to be a hard sell.
The assessment picture for indirect indicators looked more hopeful (Figure 3).
Indirect measures ask students, or those connected with them, to reflect on their learning
rather than demonstrate it. Aside from course evaluations, which most departments
engage in regularly, there was low participation but high interest in using most of the
indirect indicators. These generally fell into two categories; those involving analysis of
existing data (“Analysis of grade distribution, “ “Examination of department data,”
“Comparison with peer institutions”) and those requiring collection of outcomes data on
graduates. Having an empirical identification of these departmental needs gave our
office the mandate we felt was necessary to proceed with centrally directed assessment
activities.
Arraying the indicators by college provided a more detailed diagnosis of
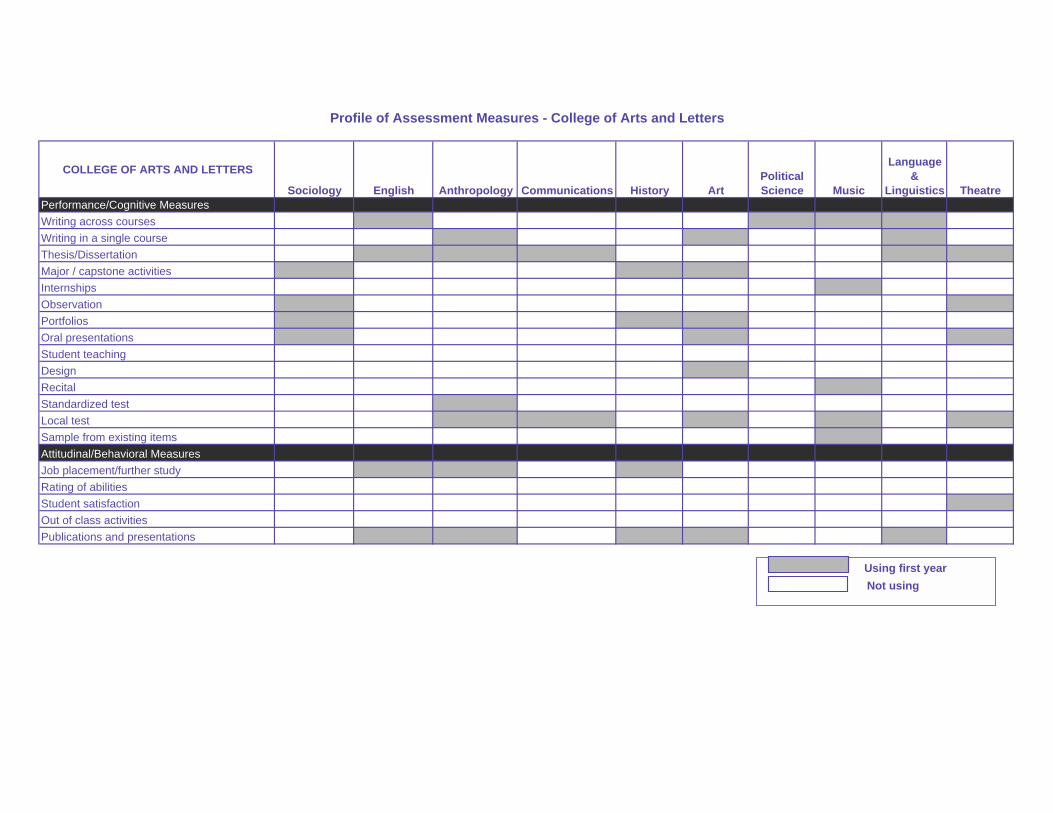
assessment activities and needs. For example, Figure 4 illustrates that most departments
in the College of Arts and Letters had little interest in direct measures. Although
licensure and certification exams are not used in these disciplines, the rejection of almost
any kind of direct display of knowledge and skills was disconcerting. More favorable
was the interest displayed in using indirect indicators. The patterns within as well as
across the columns quickly profiled those departments likely to be cooperative in
7

Figure 2 Direct indicators of assessment in academic departments
8
Number of Departments0 10 20 30 40 50 60
Licensure exam
Local pretest-posttest
National exam
Certification exam
Writing proficiency exam
Performance assessment
Video/audio tape evaluation
Portfolio evaluation
Comprehensive exam
Capstone courses
GRE subject test
Senior thesis/major project
Currently use Would use Not interested

Figure 3 Indirect indicators of assessment in academic departments
9
Number of Departments0 10 20 30 40 50 60
Performance in graduate school
Tracking alumni honors/rewards
Graduate school acceptance rates
Employer survey
Exit interviews
Comparison with peer institution
Student satisfaction survey
Alumni survey
Job placement
Examination of department data
Focus group discussion
Community service participation
Analysis of student grade distribution
Graduation/retention rates
Community perception
Internship evaluation
Identify/assess at-risk students
Other evaluation of course instruction
Curriculum/syllabus analysis
Student course evaluation
Currently Use Would use Not interested

assessment (Communications) vs. the probable resisters (Political Science). The contrast
of Arts and Letters with the profiled College of Education (Figure 5) is revealing.
Education has separate discipline accreditations and is accustomed to demonstrating
student outcomes. Their profile identifies them as potential cheerleaders or advocates
whose experiences might be used to energize their colleagues in other colleges.
A parallel ordering of assessment indicators for administrative and academic
support units showed a number of indicators already in use (Figure 6). The ones
generating most interest for future use were measures that could be implemented using a
centrally administered client satisfaction survey, and comparisons with peer institutions.
When asked what resources were needed to develop better methods for assessing
outcomes, department chairs consistently mentioned financial and human support,
training and technology. Assistance with development of instruments and tracking of
program graduates was frequently requested. Department chairs also expressed concern
over the time required to identify, gather and produce documentation and information
supporting departmental efforts for improving student performance-related outcomes.
They urged establishment of a timeline delineating tasks, responsible individuals,
resources and due dates to ensure that the process stayed on track. They believed that
this type of coordinated effort would best be achieved with institution-wide leadership
and support from the Office of Institutional Effectiveness and Analysis.
The inventory checklist analysis led us to the sobering realization that we had far
to go before accreditation time. We promptly arranged for outside consultants to conduct
a two-day workshop to further acquaint administrators, faculty and staff with the
concepts of institutional effectiveness and provide expert guidance for those willing to
10

Figure 4 Profile of indicators - College of Arts and Letters
COLLEGE OF ARTS AND LETTERS Sociology English Anthropology Communications History ArtPolitical Science Music
Direct indicatorsComprehensive examWriting proficiency examNational examGRE subject testCertification examLicensure examLocal pretest-posttestPerformance assessmentVideo/audio tape evaluationSenior thesis/major projectPortfolio evaluationCapstone coursesIndirect indicatorsComparison with peer institutionJob placementEmployer surveyGraduate School acceptance ratesPerformance in graduate schoolGraduation/retention ratesExit interviewsStudent satisfaction surveyStudent course evaluation Internship evaluationFocus group discussionAlumni surveyTracking alumni honors/rewardsIdentify/assess at-risk studentsAnalysis of student grade distributionExamination of department dataOther evaluation of course instructionCurriculum/syllabus analysisCommunity perceptionCommunity service participation
A = Currently usedB = Would useC = Not interested11
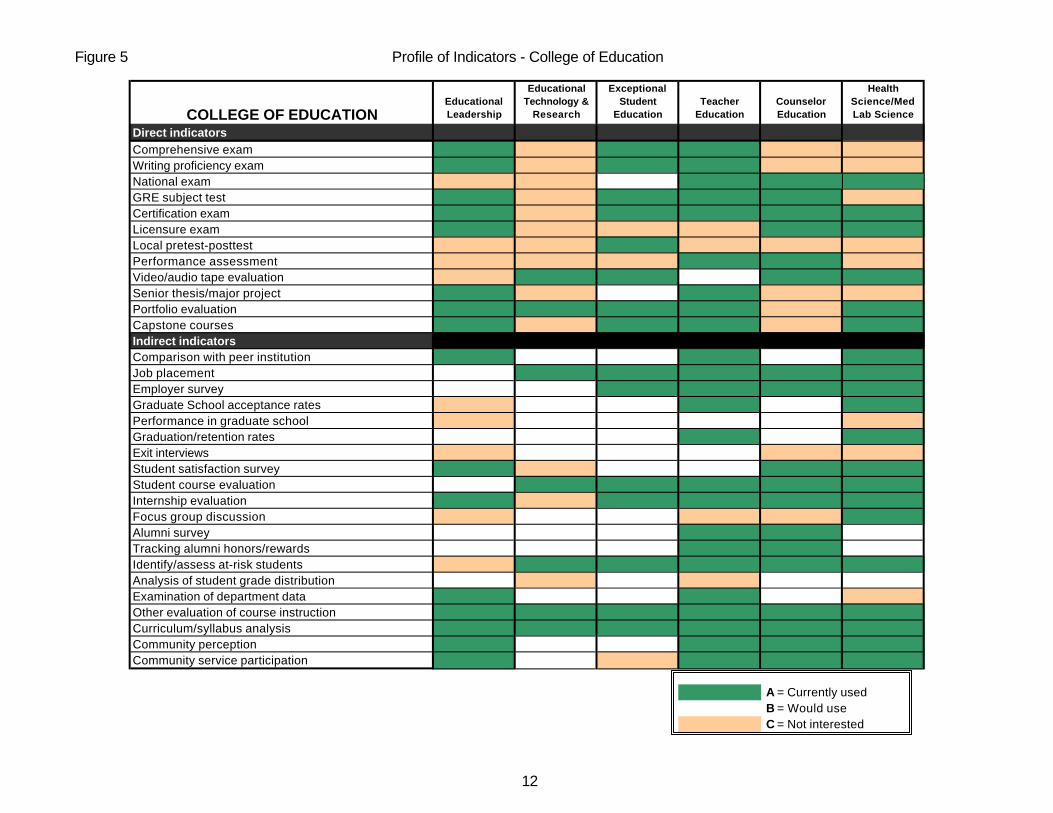
Figure 5 Profile of Indicators - College of Education
COLLEGE OF EDUCATIONEducational Leadership
Educational Technology &
Research
Exceptional Student
EducationTeacher
EducationCounselor Education
Health Science/Med Lab Science
Direct indicatorsComprehensive examWriting proficiency examNational examGRE subject testCertification examLicensure examLocal pretest-posttestPerformance assessmentVideo/audio tape evaluationSenior thesis/major projectPortfolio evaluationCapstone coursesIndirect indicatorsComparison with peer institutionJob placementEmployer surveyGraduate School acceptance ratesPerformance in graduate schoolGraduation/retention ratesExit interviewsStudent satisfaction surveyStudent course evaluation Internship evaluationFocus group discussionAlumni surveyTracking alumni honors/rewardsIdentify/assess at-risk studentsAnalysis of student grade distributionExamination of department dataOther evaluation of course instructionCurriculum/syllabus analysisCommunity perceptionCommunity service participation
A = Currently usedB = Would useC = Not interested
12
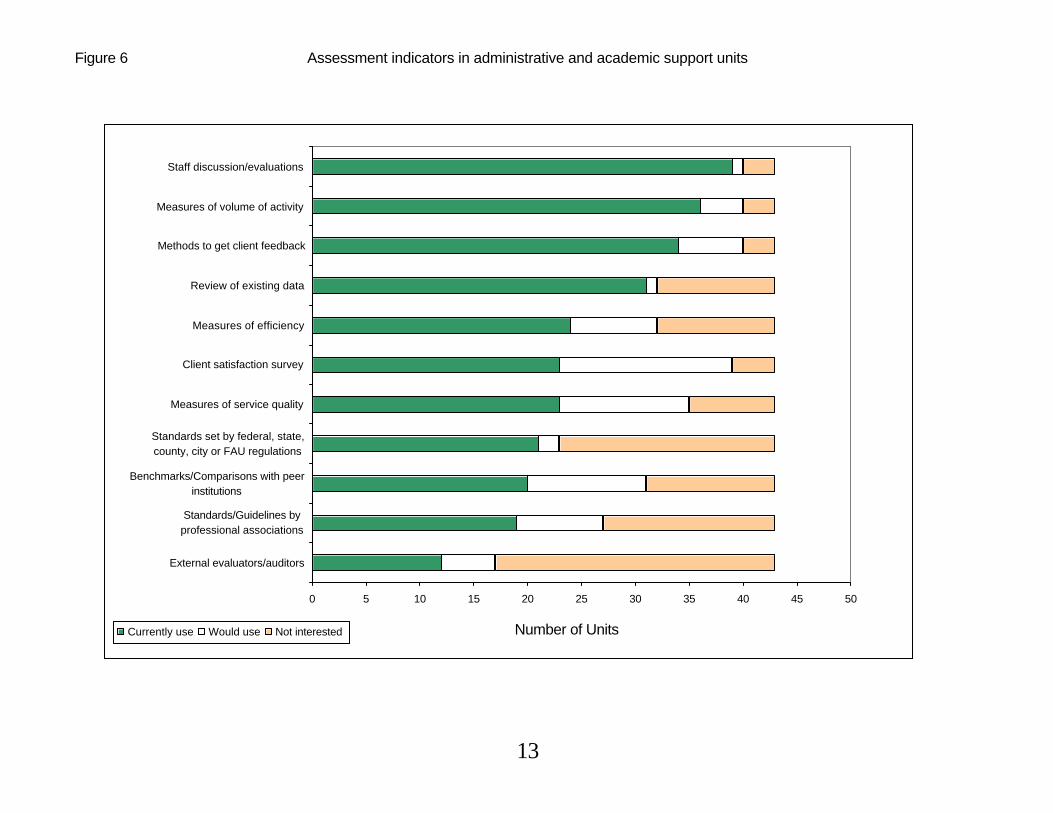
Figure 6 Assessment indicators in administrative and academic support units
0 5 10 15 20 25 30 35 40 45 50
External evaluators/auditors
Standards/Guidelines byprofessional associations
Benchmarks/Comparisons with peerinstitutions
Standards set by federal, state,county, city or FAU regulations
Measures of service quality
Client satisfaction survey
Measures of efficiency
Review of existing data
Methods to get client feedback
Measures of volume of activity
Staff discussion/evaluations
Currently use Would use Not interested Number of Units
13
get started with their plans. A decision was made to form an Academic Programs
Assessment Committee with representation from all colleges to oversee the development
of program assessment plans at all degree levels. Since research has shown that the
biggest obstacle to implementing student outcomes assessment is faculty resistance
(Maki, 1999), there was a strong effort to extend Committee membership to senior
faculty with few or no administrative responsibilities. The Committee will recommend
approval or modification of the plans to the Provost. The expressed need for technical
support to assist departments in instrument identification and data analysis resulted in the
funding of a new position for an assessment coordinator. Meanwhile, the SACS Self-
Study Committee charged with Institutional Effectiveness reviewed the inventories and
prepared an initial report for the administration on the compliance status with Section III
of the Criteria. As the process of developing assessment plans proceeded, the checklists
served as a baseline for measuring progress.
Conclusion
The assessment of student performance-related outcomes offers an excellent
opportunity for initiating a systematic and continuing process for gathering, interpreting,
and using information that will result in increasing institutional effectiveness and
educational improvement. Although a systematic process for assessing student
performance-related outcomes is mandated by accrediting agencies, the initiative can be a
catalyst for many positive changes in improving educational outcomes and institutional
effectiveness.
For us, the inventory checklist was a way to introduce the concept of student
outcomes assessment in a nonthreatening, low-risk, collegial context. It allowed us to
14
answer questions, allay fears, and confront resistance on an individual basis. Talking in
person is particularly useful for those who are new to the process. By reassuring faculty
and chairs that many of their existing efforts were already moving in the right direction,
we bought goodwill for the project. Reluctant faculty were often pleased to discover that
assessment did not necessarily involve only quantitative measurements and did not
require standardized testing. Finally, the inventory results got the attention of campus
administrators, whose leadership was critical for ensuring that assessment efforts stayed
on track.
Two minor limitations of the checklist surfaced during its use. There was some
initial confusion over the role this information would play in the Self-Study process.
Some chairs were concerned that the information submitted via the checklist would
represent their department’s final, rather than initial, status with respect to institutional
effectiveness and that they would not have an opportunity to update their progress.
Second, the examples of direct and indirect measures on the checklist, while
comprehensive, were not intended to preclude other kinds of measures that might be
devised for program assessment. There was some risk that faculty and administrators
would not look beyond these indicators for others that might be more appropriate for their
programs.
Successful assessment is more than a collection of techniques, instruments and
outcomes; it is a cultural issue that affects how a community of scholars defines its
responsibilities to its students (Magruder, McManis & Young, 1997). Now that we’ve
identified the ‘Start Line’, the goal of transforming the information collected via the
inventories into a successful assessment culture seems more attainable.
15
References
Cole, J.J.K., Nettles, M.T. and Sharp, S. (1997). Assessment of teaching and learning for improvement and accountability: State Governing, Coordinating Board and Regional Accreditation Association Policies and Practices. University of Michigan: National Center for Postsecondary Improvement. Commission on Colleges of the Southern Association of Colleges and Schools (1996). Resource Manual on Institutional Effectiveness, Third Edition. Ewell, P.T. (1996). The current pattern of state-level assessment: Results of a national inventory. Assessment Update, 8 (3) 1-2, 12-13, 15. Gray, P.J. (1997). Viewing assessment as an innovation: Leadership and the change process. In T.W. Banta and P.J. Gray (Eds.), The Campus-Level Impact of Assessment: Progress, Problems and Possibilities. New Directions for Higher Education, 100, (Winter), 5–15. Hodge, V. (1997). Student learning outcomes assessment and institutional effectiveness at Bellevue Community College: Report of the 1996-97 assessment inventory ERIC ED 411 009. Magruder, J., McManis, M.A. & Young, C.C. (1997). The right idea at the right time: Development of a transformational assessment culture. New Directions for Higher Education, 100, (Winter), 17-29. Maki, P.L. (1999). A regional accrediting commission’s survey on student outcomes assessment and its response. Assessment Update, 11 (3). Nichols, J.O. (1993). Assessment Case Studies: Common Issues in Implementation with Various Campus Approaches to Resolution. New York: Agathon Press. Nichols, J.O. (1995). A Practitioner’s Handbook for Institutional Effectiveness and Student Outcomes Assessment Implementation. New York: Agathon Press. Palomba, C.A. & Banta, T.W. (1999). Assessment Essentials: Planning, Implementing and Improving Assessment in Higher Education. San Francisco: Jossey-Bass. Peterson, M.W. and Einarson, M.K. (2000). Analytic framework of institutional support for student assessment. In J.C. Smart (Ed.) Higher Education: Handbook of Theory and Research Volume XV. Bronx, NY: Agathon Press. Wingspread Group on Higher Education (1993). An American Imperative: Higher Expectations for Higher Education. Milwaukee: Johnson Foundation.
16
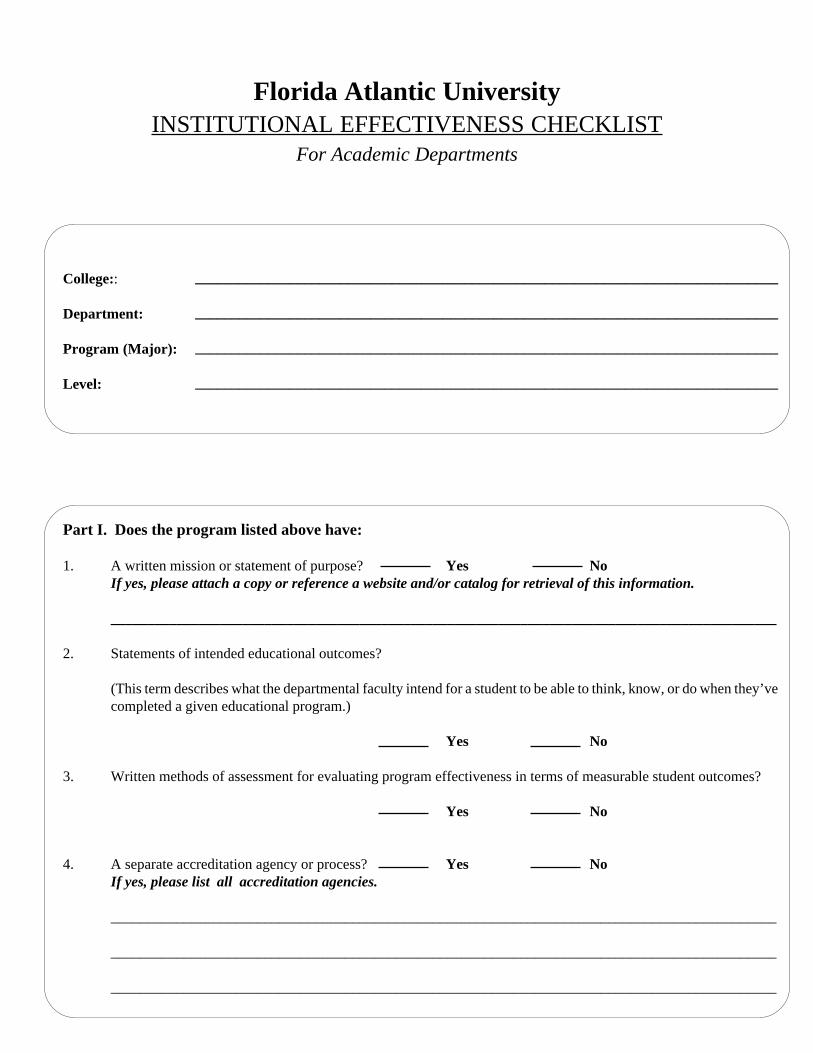
Florida Atlantic UniversityINSTITUTIONAL EFFECTIVENESS CHECKLIST
For Academic Departments
College::
Department:
Program (Major):
Level:
________________________________________________________________________________
________________________________________________________________________________
________________________________________________________________________________
________________________________________________________________________________
Part I. Does the program listed above have:
1. A written mission or statement of purpose? Yes NoIf yes, please attach a copy or reference a website and/or catalog for retrieval of this information.
___________________________________________________________________________________________
2. Statements of intended educational outcomes?
(This term describes what the departmental faculty intend for a student to be able to think, know, or do when they’vecompleted a given educational program.)
Yes No
3. Written methods of assessment for evaluating program effectiveness in terms of measurable student outcomes?
Yes No
4. A separate accreditation agency or process? Yes NoIf yes, please list all accreditation agencies.
___________________________________________________________________________________________
___________________________________________________________________________________________
___________________________________________________________________________________________
F1999_02
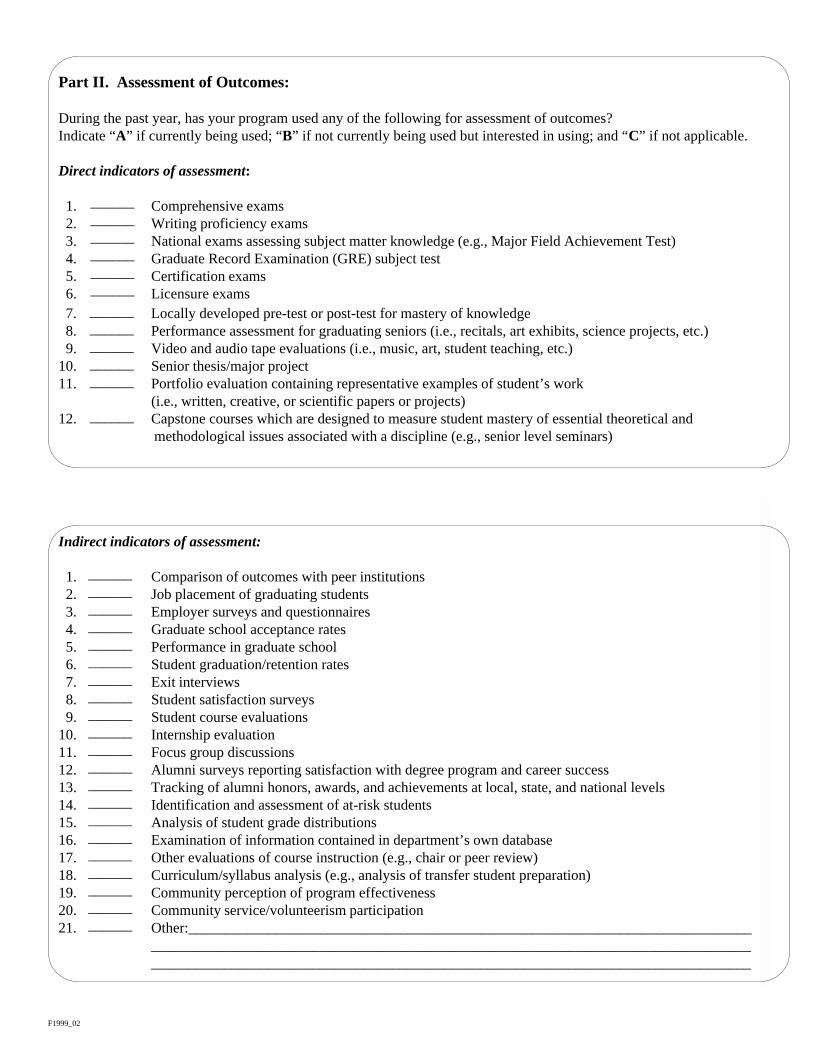
7. Locally developed pre-test or post-test for mastery of knowledge 8. Performance assessment for graduating seniors (i.e., recitals, art exhibits, science projects, etc.) 9. Video and audio tape evaluations (i.e., music, art, student teaching, etc.)10. Senior thesis/major project11. Portfolio evaluation containing representative examples of student’s work
(i.e., written, creative, or scientific papers or projects)12. Capstone courses which are designed to measure student mastery of essential theoretical and
methodological issues associated with a discipline (e.g., senior level seminars)
Indirect indicators of assessment:
1. Comparison of outcomes with peer institutions 2. Job placement of graduating students 3. Employer surveys and questionnaires 4. Graduate school acceptance rates 5. Performance in graduate school 6. Student graduation/retention rates 7. Exit interviews 8. Student satisfaction surveys 9. Student course evaluations10. Internship evaluation11. Focus group discussions12. Alumni surveys reporting satisfaction with degree program and career success13. Tracking of alumni honors, awards, and achievements at local, state, and national levels14. Identification and assessment of at-risk students15. Analysis of student grade distributions16. Examination of information contained in department’s own database17. Other evaluations of course instruction (e.g., chair or peer review)18. Curriculum/syllabus analysis (e.g., analysis of transfer student preparation)19. Community perception of program effectiveness20. Community service/volunteerism participation21. Other:_____________________________________________________________________________
____________________________________________________________________________________________________________________________________________________________________
______________________________________________________________________________________________________________________________
______________________________
______
Part II. Assessment of Outcomes:
During the past year, has your program used any of the following for assessment of outcomes?Indicate “A” if currently being used; “B” if not currently being used but interested in using; and “C” if not applicable.
Direct indicators of assessment:
1. Comprehensive exams 2. Writing proficiency exams 3. National exams assessing subject matter knowledge (e.g., Major Field Achievement Test) 4. Graduate Record Examination (GRE) subject test 5. Certification exams 6. Licensure exams
____________________________________
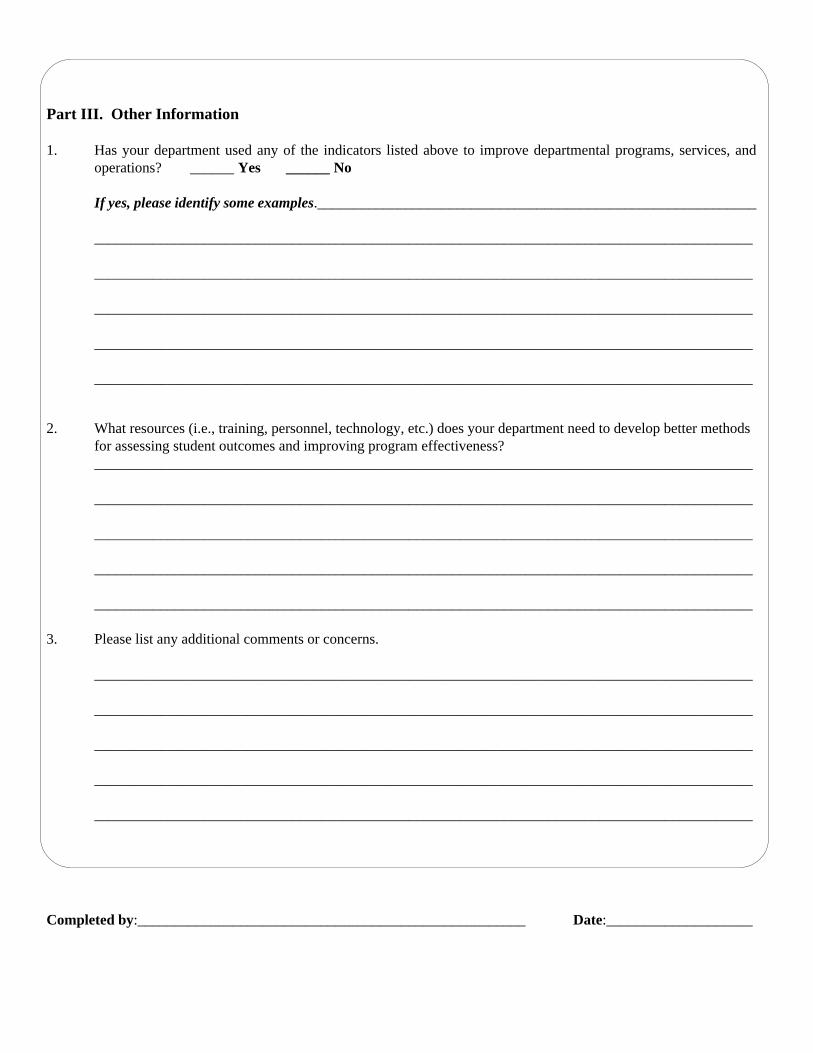
Part III. Other Information
1. Has your department used any of the indicators listed above to improve departmental programs, services, andoperations? ______ Yes ______ No
If yes, please identify some examples.____________________________________________________________
__________________________________________________________________________________________
__________________________________________________________________________________________
__________________________________________________________________________________________
__________________________________________________________________________________________
__________________________________________________________________________________________
2. What resources (i.e., training, personnel, technology, etc.) does your department need to develop better methodsfor assessing student outcomes and improving program effectiveness?__________________________________________________________________________________________
__________________________________________________________________________________________
__________________________________________________________________________________________
__________________________________________________________________________________________
__________________________________________________________________________________________
3. Please list any additional comments or concerns.
__________________________________________________________________________________________
__________________________________________________________________________________________
__________________________________________________________________________________________
__________________________________________________________________________________________
__________________________________________________________________________________________
Completed by:_____________________________________________________ Date:____________________

Part II. Evaluation Measures
During the past year, has your unit used any of the following for assessment of outcomes?Indicate “A” if currently being used; “B” if not currently being used but interested in using; and“C” if not applicable.
1. Measures of volume of activityExamples: Number of clients served, circulation data, gross sales.
Specify: ________________________________________________________________
2. Measures of efficiencyExamples: Average turnaround time for filling requests, timely service/prompt response, budget information.
Specify: ________________________________________________________________
3. Measures of service qualityExamples: Error rates, accuracy of the information provided.
Specify: ________________________________________________________________
4. Client satisfaction surveysExamples: Student satisfaction survey, alumni survey, employer survey, customer survey.
Specify: ________________________________________________________________
5. Other methods to obtain client feedbackExamples: Focus groups, comments via email, evaluation forms, suggestion box, hotline.
Specify: ________________________________________________________________
For Administrative and Academic Support Units
Florida Atlantic UniversityINSTITUTIONAL EFFECTIVENESS CHECKLIST
Unit: Campus:
Part I. Does your unit have
1. A formal statement of purpose which supports FAU’s mission and goals?Yes (please attach a copy) No
2. Explicit goals which support this unit’s purpose?Yes No
3. Procedures to evaluate the extent to which goals are being achieved?Yes No

Institutional Effectiveness and Analysis SO 303
6. Staff discussions/evaluations of services to clients
7. Review of existing dataExamples: Departmental routine records/reports, institutional data, audits.
Specify:_________________________________________________________________
8. Standards/guidelines provided by professional associations such as SCUP, NACUBO
9. Standards set by federal, state, county, city or FAU regulations
10. External evaluators/auditors
11. Benchmarks/Comparisons with peer institutions
12. Other: __________________________________________________________________
Part III. Other information
1. Have you used the results of any of the evaluation measures listed above to improve administrative and academicsupport services and operations? _____ Yes _____ No
If so, please identify some examples.
Part II. Evaluation Measures - continued
2. What resources (i.e., training, personnel, technology, etc.) does your unit need to develop better methods for assessing service outcomes and improving service quality and effectiveness?
3. Please list any additional comments or concerns.
Completed by: ________________________________________ Date: ___________________Please return your completed form to:
_____________________________________________________________________________________________________________________________________________________________________________________________________________________________________________________________________________________________________________________________________________________________________________________________________________________________________________________________________________________________________________________________________________________________________________________________________________________________________________________________________________________________________________________________
_____________________________________________________________________________________________________________________________________________________________________________________________________________________________________________________________________________________________________________________________________________________________________________________________________________________________________________________________________________________________________________________________________________________________________________________________________________________________________________________________________________________________________________________________
_____________________________________________________________________________________________________________________________________________________________________________________________________________________________________________________________________________________________________________________________________________________________________________________________________________________________________________________________________________________________________________________________________________________________________________________________________________________________________________________________________________________________________________________________
F1999_01

Criteria for SuccessPercent
10% 0.4%20% 1.0%25% 0.8%30% 0.4%40% 1.0%50% 10.4%60% 6.7%66% 1.0%70% 11.7%75% 12.7%80% 13.8%85% 2.1%90% 19.2%95% 2.1%
100% 8.6%Not specified 7.9%
Total 100%
Did the Measure Use a Student Sample?Percent
No 81.9%Unknown 8.8%10% 0.4%15% 0.8%20% 1.5%20 students per term 0.4%25% 2.7%30% 3.5%Total 100%
Profile of Assessment Measures - College of Arts and Letters
COLLEGE OF ARTS AND LETTERS
Sociology English Anthropology Communications History ArtPolitical Science Music
Language &
Linguistics TheatrePerformance/Cognitive MeasuresWriting across coursesWriting in a single courseThesis/DissertationMajor / capstone activitiesInternshipsObservationPortfoliosOral presentationsStudent teachingDesignRecitalStandardized testLocal testSample from existing itemsAttitudinal/Behavioral MeasuresJob placement/further studyRating of abilitiesStudent satisfaction Out of class activitiesPublications and presentations
Using first yearNot using

Profile of Assessment Measures - College of Education
COLLEGE OF EDUCATION Counselor Ed Ed Leadership Health Sciences Teacher EducPerformance/Cognitive MeasuresWriting across coursesWriting in a single courseThesis/DissertationMajor / capstone activitiesInternshipsObservationPortfoliosOral presentationsStudent teachingDesignRecitalStandardized testLocal testSample from existing itemsAttitudinal/Behavioral MeasuresJob placement/further studyRating of abilitiesStudent satisfaction Out of class activitiesPublications and presentations
Using first yearNot using
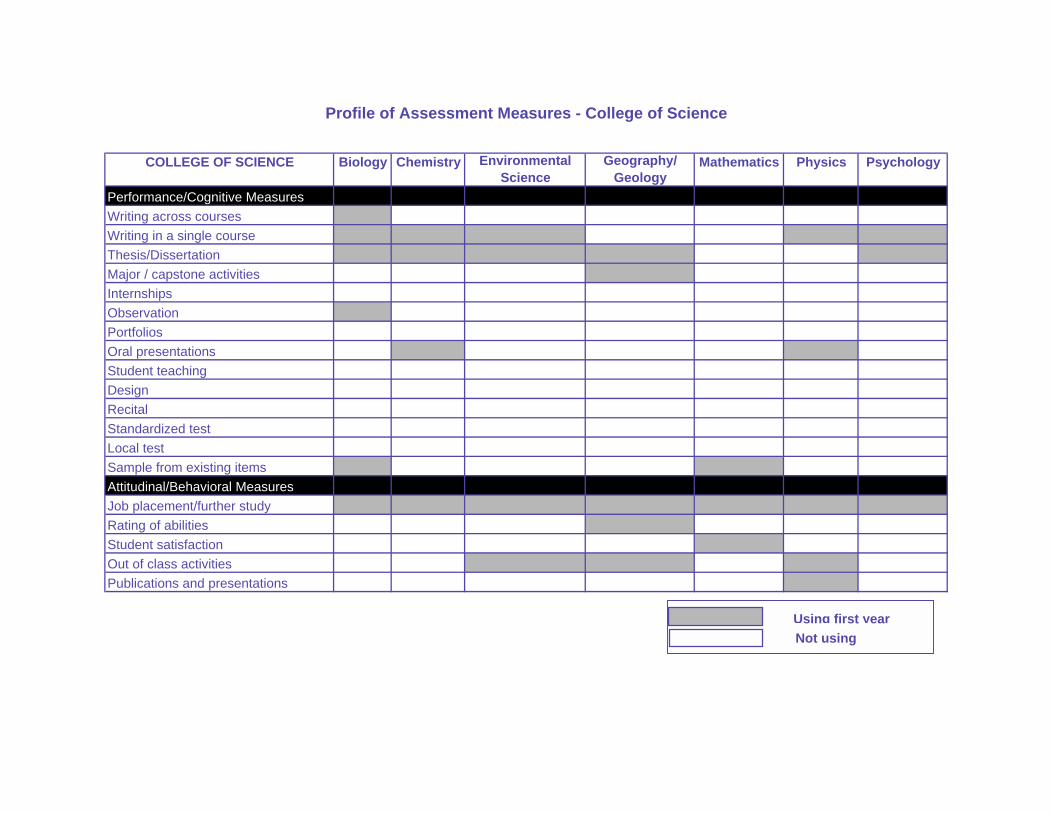
Profile of Assessment Measures - College of Science
COLLEGE OF SCIENCE Biology Chemistry Environmental Science
Geography/ Geology
Mathematics Physics Psychology
Performance/Cognitive MeasuresWriting across coursesWriting in a single courseThesis/DissertationMajor / capstone activitiesInternshipsObservationPortfoliosOral presentationsStudent teachingDesignRecitalStandardized testLocal testSample from existing itemsAttitudinal/Behavioral MeasuresJob placement/further studyRating of abilitiesStudent satisfaction Out of class activitiesPublications and presentations
Using first yearNot using
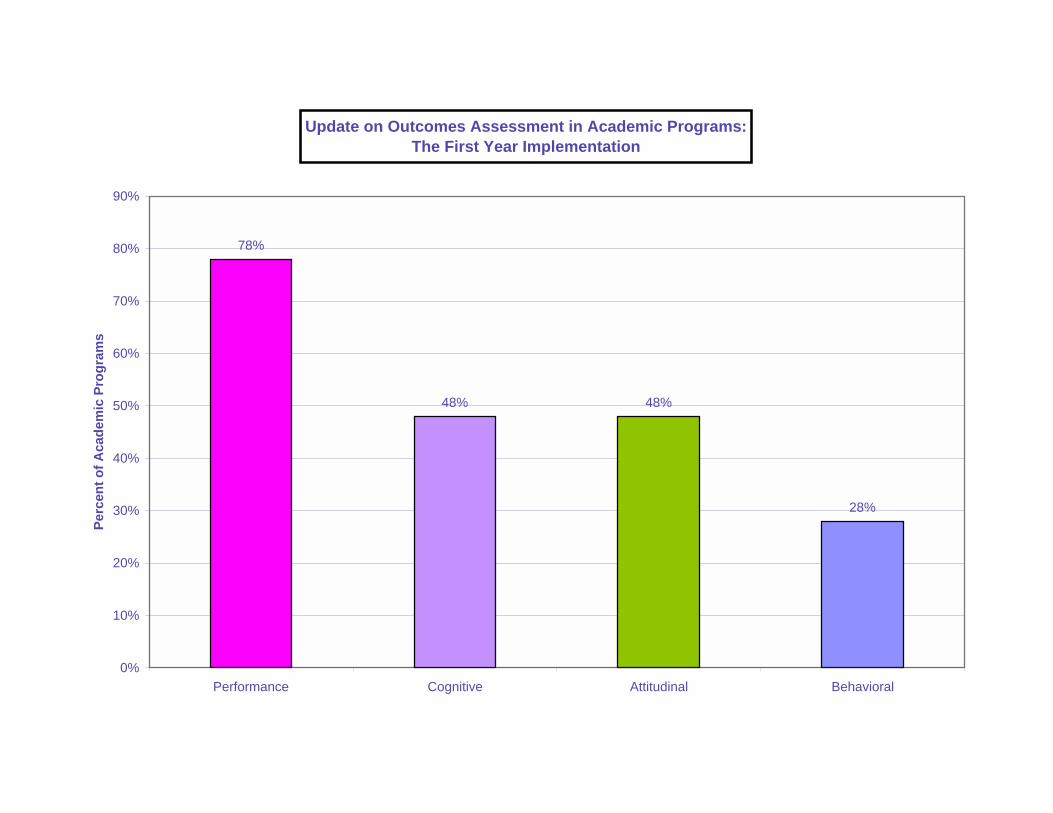
Update on Outcomes Assessment in Academic Programs: The First Year Implementation
78%
48% 48%
28%
0%
10%
20%
30%
40%
50%
60%
70%
80%
90%
Performance Cognitive Attitudinal Behavioral
Perc
ent o
f Aca
dem
ic P
rogr
ams

Percent of Academic Programs Using Various Types of Assessment Measures
Behavioral Assessment Measures (Counts)
Job Placement /further study
10% 9% 9%
Out of classactivities
Publicationsand
presentations
Job placement / further study Rating of abilities StudentSatisfaction
40% 15% 8%
Out of class
Attitudinal Assessment Measures (Surveys)
2%
Standardized testSample fromexisting test
items
24% 15% 10%
Cognitive Assessment Measures
Local test
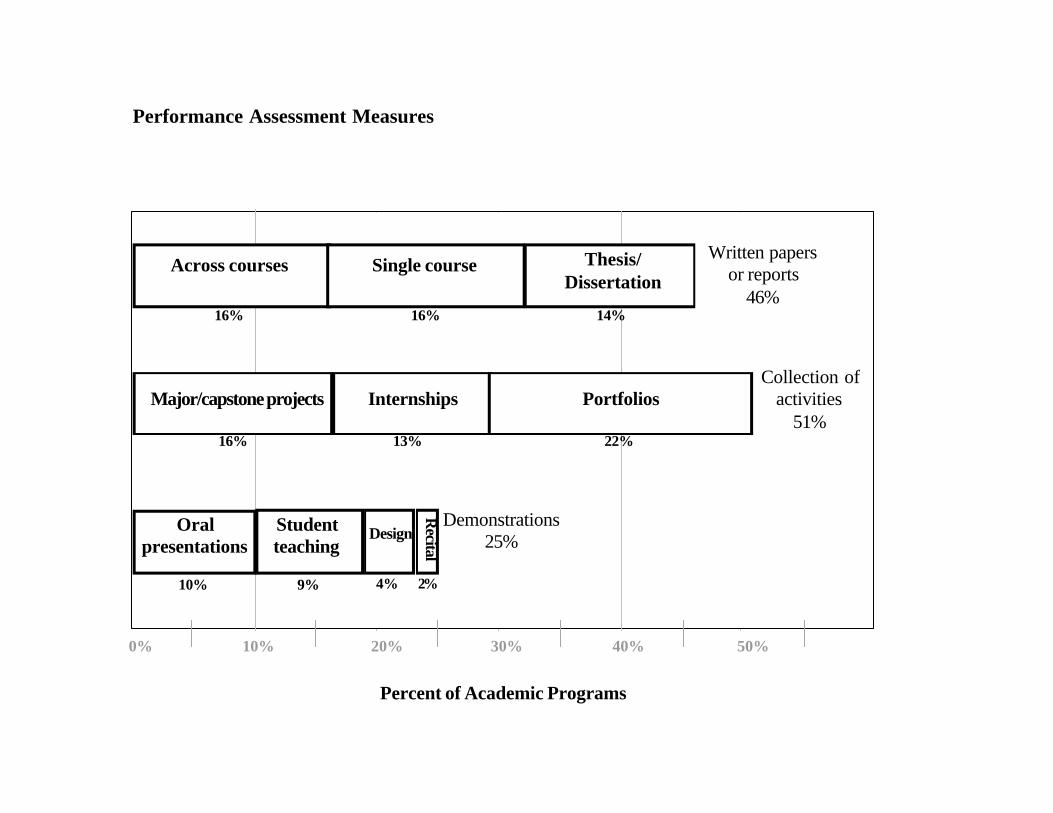
Performance Assessment Measures
Across courses Single course Thesis/Dissertation
Written papersor reports
46%
Major/capstone projects Internships Portfolios
Oralpresentations
Studentteaching
Design
16% 16% 14%
Recital
Collection ofactivities
51%
Demonstrations25%
10% 20% 30% 40% 50%0%
16% 13% 22%
10% 9% 4% 2%
Percent of Academic Programs