Embed Size (px)
Citation preview
Aswath Damodaran 1
Finding the Right Financing Mix: TheCapital Structure Decision
Aswath Damodaran
Stern School of Business
Aswath Damodaran 2
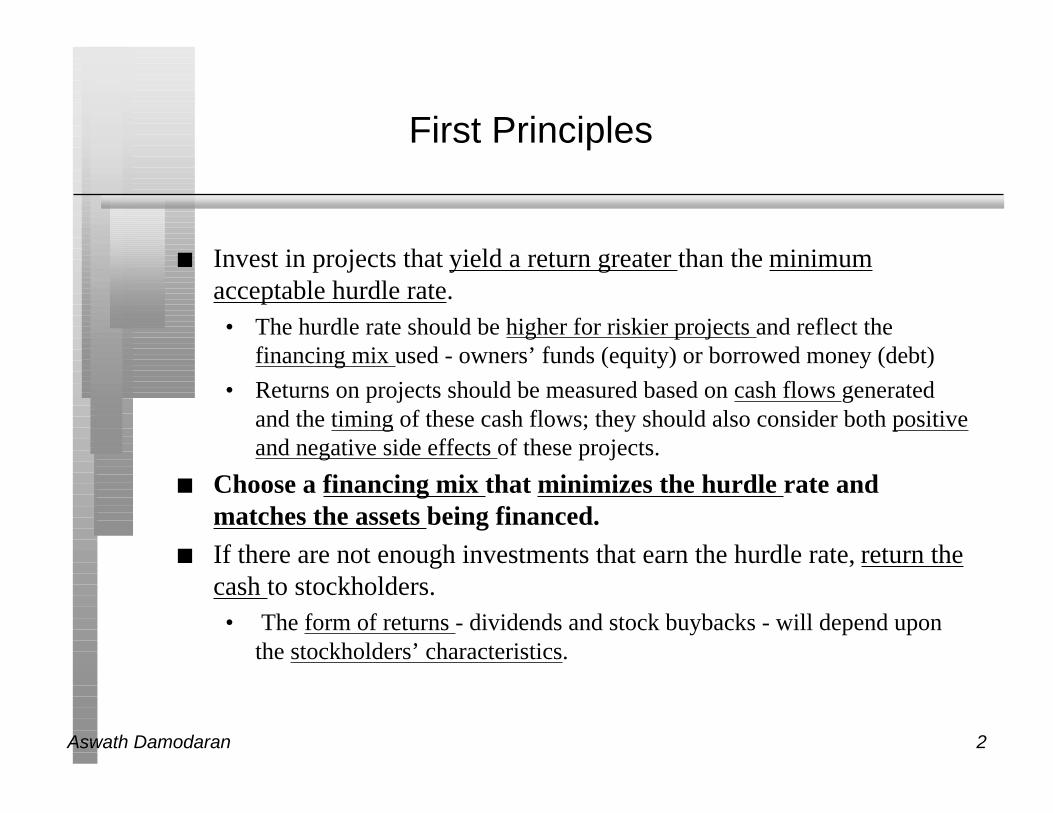
First Principles
n Invest in projects that yield a return greater than the minimumacceptable hurdle rate.• The hurdle rate should be higher for riskier projects and reflect the
financing mix used - owners’ funds (equity) or borrowed money (debt)
• Returns on projects should be measured based on cash flows generatedand the timing of these cash flows; they should also consider both positiveand negative side effects of these projects.
n Choose a financing mix that minimizes the hurdle rate andmatches the assets being financed.
n If there are not enough investments that earn the hurdle rate, return thecash to stockholders.• The form of returns - dividends and stock buybacks - will depend upon
the stockholders’ characteristics.
Aswath Damodaran 3
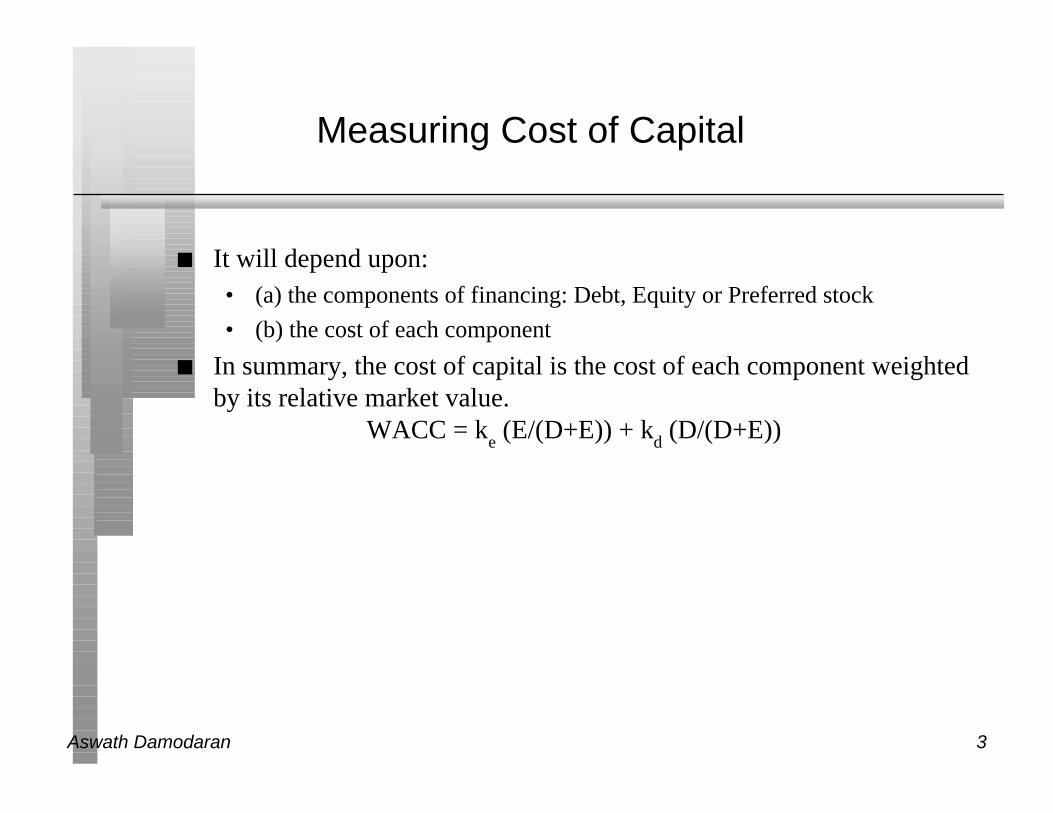
Measuring Cost of Capital
n It will depend upon:• (a) the components of financing: Debt, Equity or Preferred stock
• (b) the cost of each component
n In summary, the cost of capital is the cost of each component weightedby its relative market value.
WACC = ke (E/(D+E)) + kd (D/(D+E))
Aswath Damodaran 4
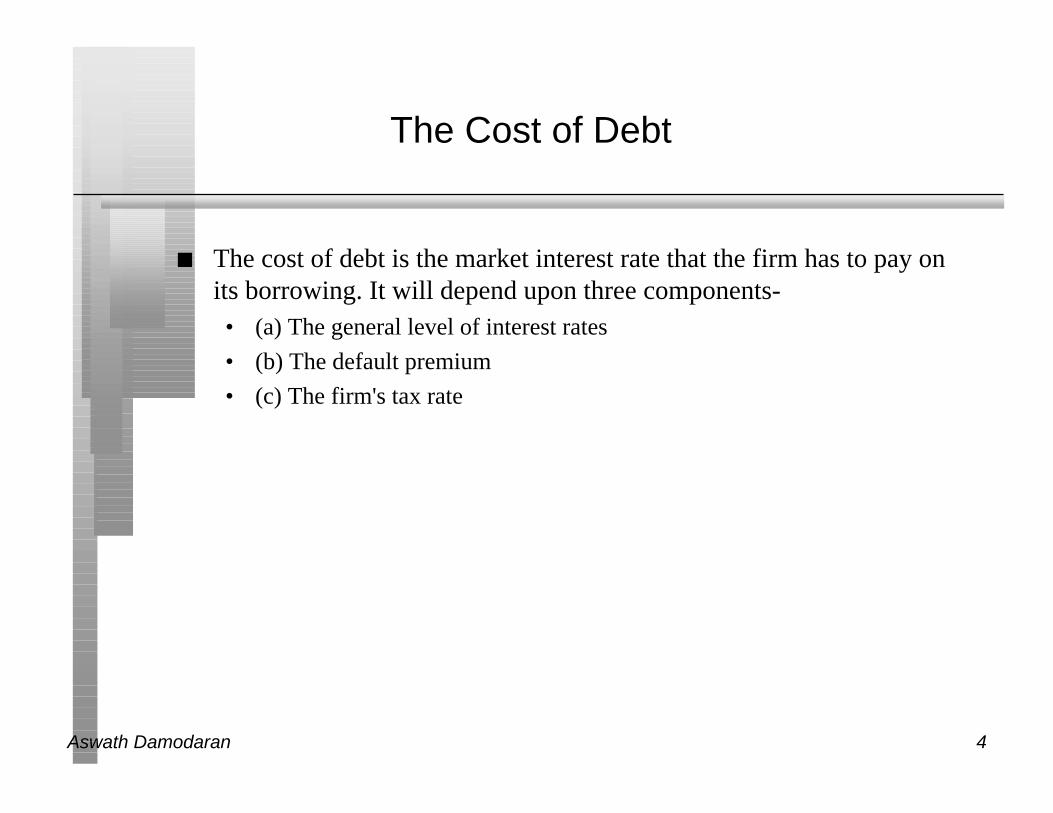
The Cost of Debt
n The cost of debt is the market interest rate that the firm has to pay onits borrowing. It will depend upon three components-• (a) The general level of interest rates
• (b) The default premium
• (c) The firm's tax rate
Aswath Damodaran 5
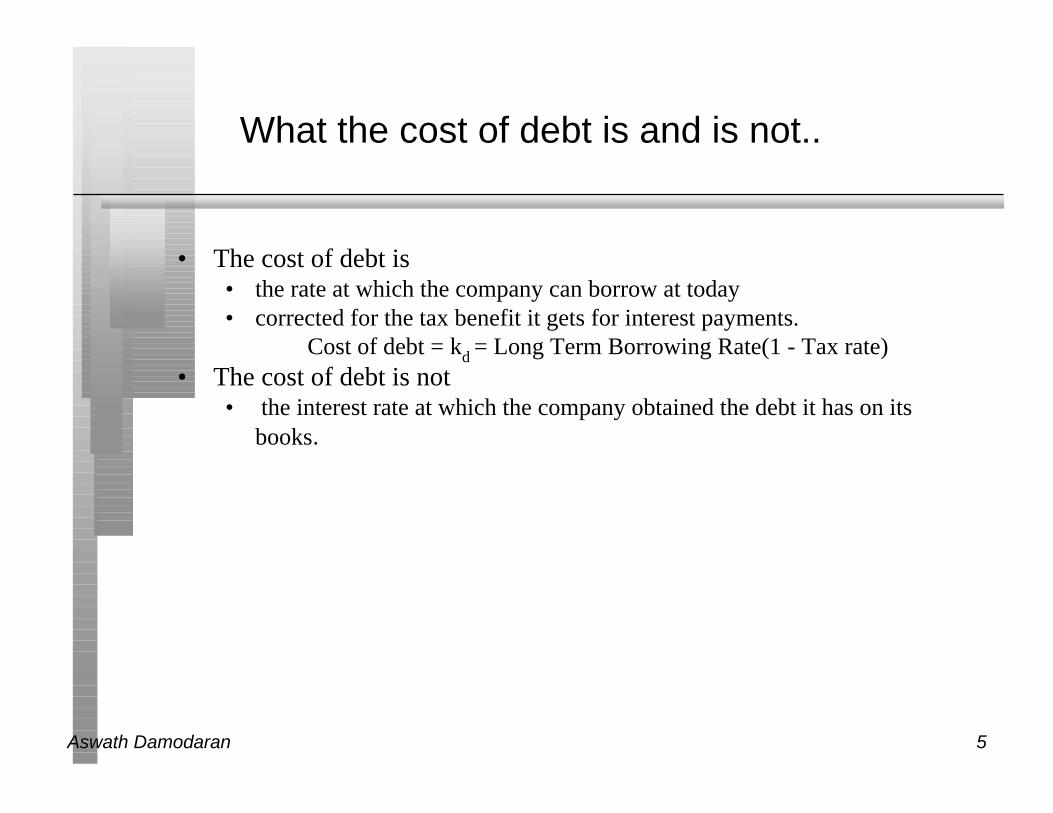
What the cost of debt is and is not..
• The cost of debt is• the rate at which the company can borrow at today• corrected for the tax benefit it gets for interest payments.
Cost of debt = kd = Long Term Borrowing Rate(1 - Tax rate)• The cost of debt is not
• the interest rate at which the company obtained the debt it has on itsbooks.
Aswath Damodaran 6
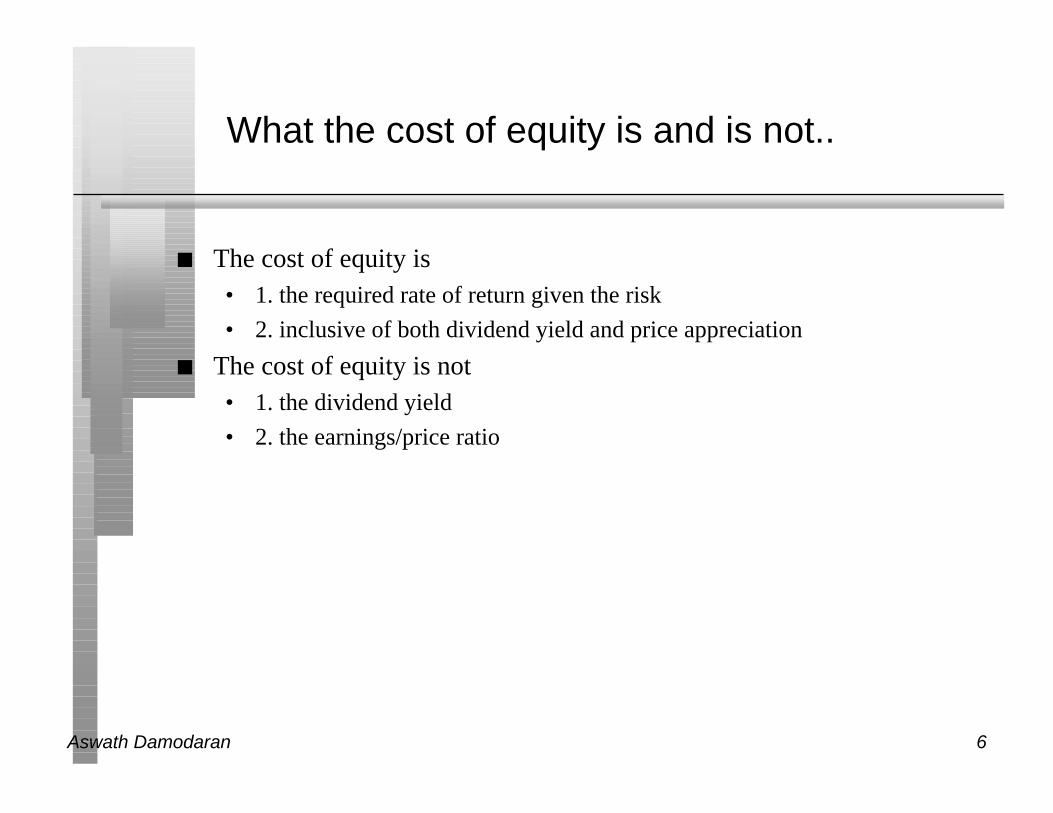
What the cost of equity is and is not..
n The cost of equity is• 1. the required rate of return given the risk
• 2. inclusive of both dividend yield and price appreciation
n The cost of equity is not• 1. the dividend yield
• 2. the earnings/price ratio
Aswath Damodaran 7
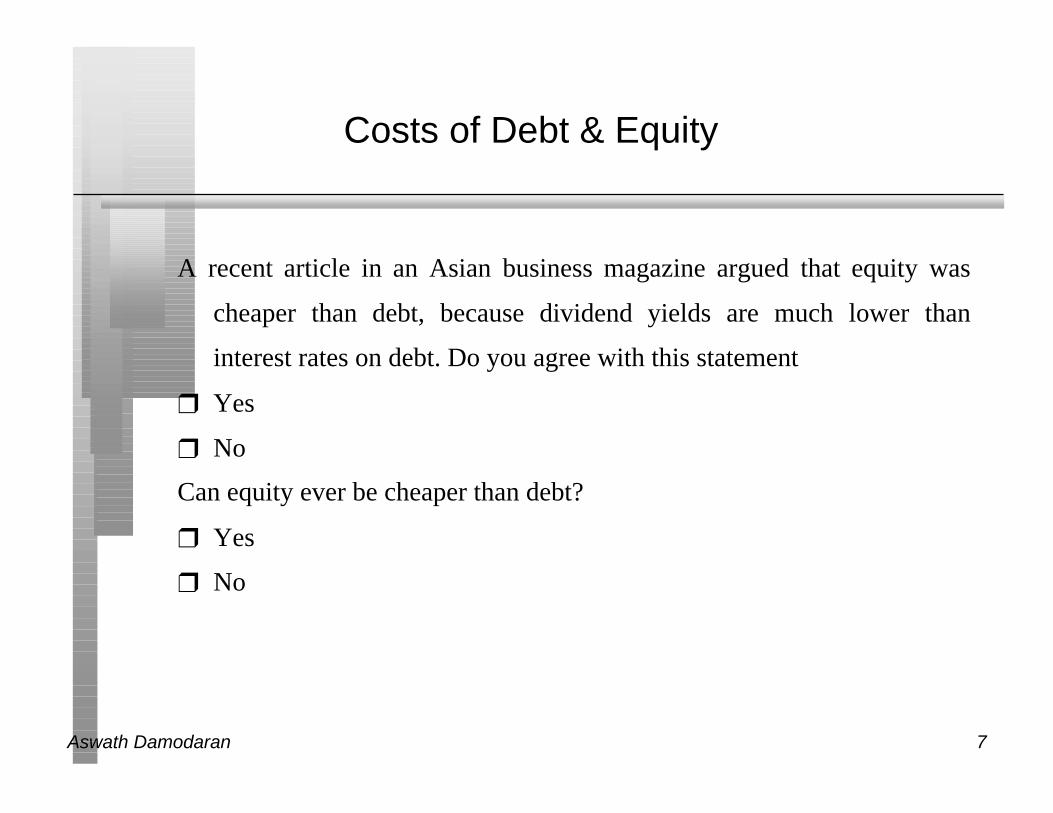
Costs of Debt & Equity
A recent article in an Asian business magazine argued that equity was
cheaper than debt, because dividend yields are much lower than
interest rates on debt. Do you agree with this statement
❒ Yes
❒ No
Can equity ever be cheaper than debt?
❒ Yes
❒ No
Aswath Damodaran 8
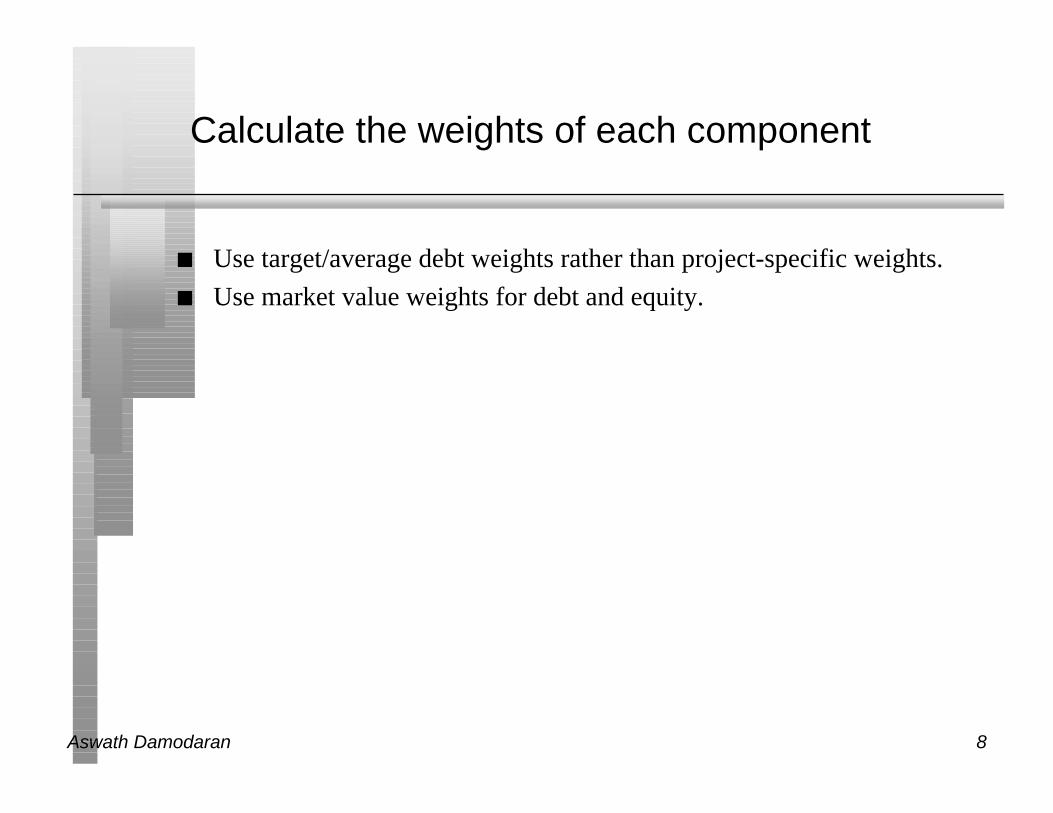
Calculate the weights of each component
n Use target/average debt weights rather than project-specific weights.
n Use market value weights for debt and equity.
Aswath Damodaran 9
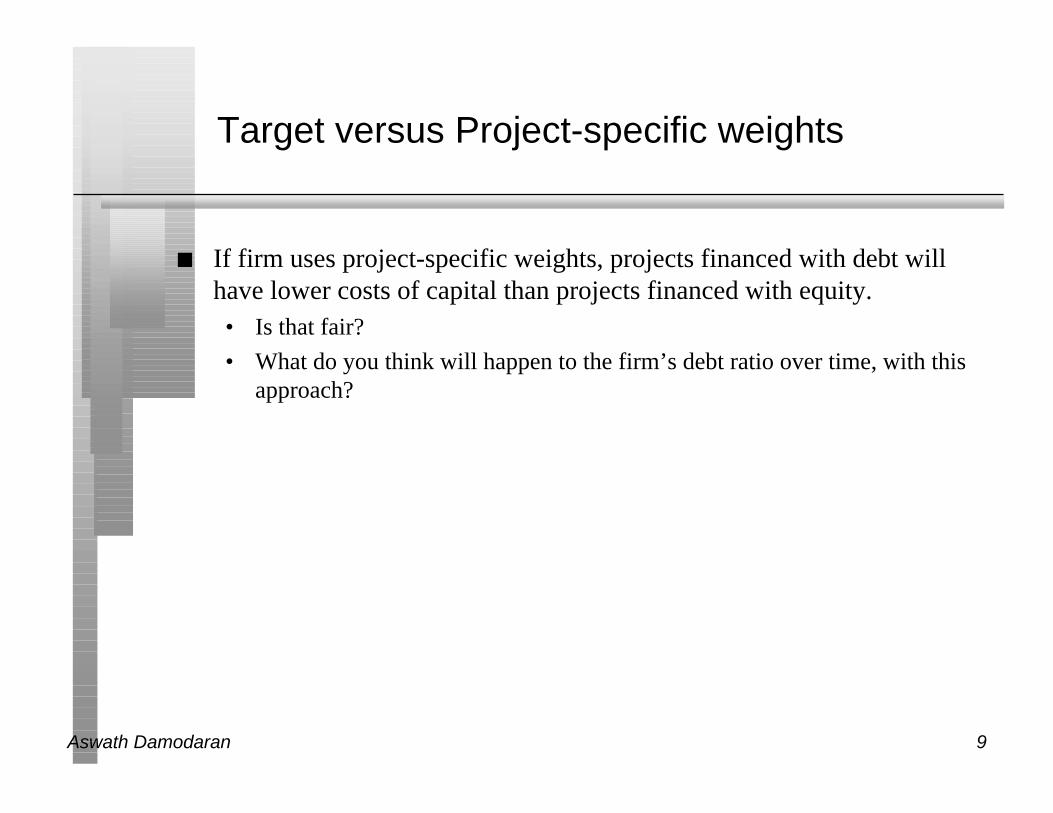
Target versus Project-specific weights
n If firm uses project-specific weights, projects financed with debt willhave lower costs of capital than projects financed with equity.• Is that fair?
• What do you think will happen to the firm’s debt ratio over time, with thisapproach?
Aswath Damodaran 10
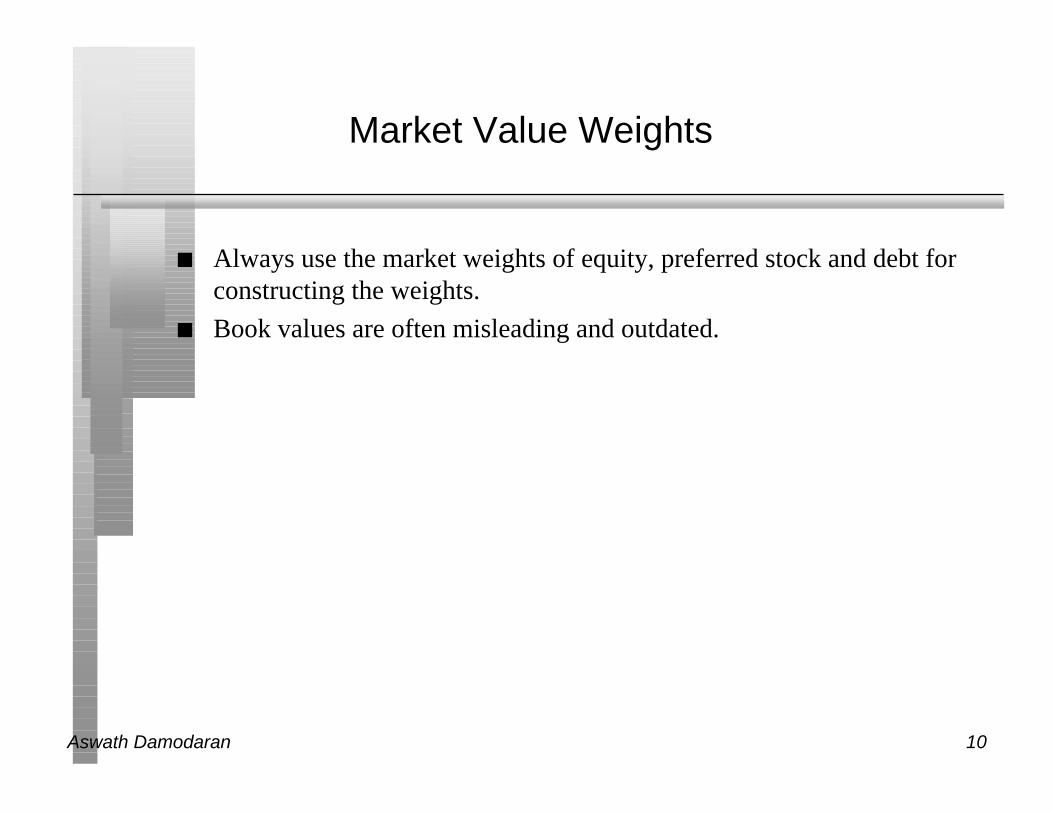
Market Value Weights
n Always use the market weights of equity, preferred stock and debt forconstructing the weights.
n Book values are often misleading and outdated.
Aswath Damodaran 11
Fallacies about Book Value
1. People will not lend on the basis of market value.
2. Book Value is more reliable than Market Value because it does notchange as much.
3. Using book value is more conservative than using market value.
Aswath Damodaran 12
Issue: Use of Book Value
Many CFOs argue that using book value is more conservative than usingmarket value, because the market value of equity is usually muchhigher than book value. Is this statement true, from a cost of capitalperspective? (Will you get a more conservative estimate of cost ofcapital using book value rather than market value?)
❒ Yes❒ No
Aswath Damodaran 13
Why does the cost of capital matter?
n Value of a Firm = Present Value of Cash Flows to the Firm,discounted back at the cost of capital.
Aswath Damodaran 14
Optimum Capital Structure and Cost of Capital
n If the cash flows to the firm are held constant, and the cost of capital isminimized, the value of the firm will be maximized.
Aswath Damodaran 15
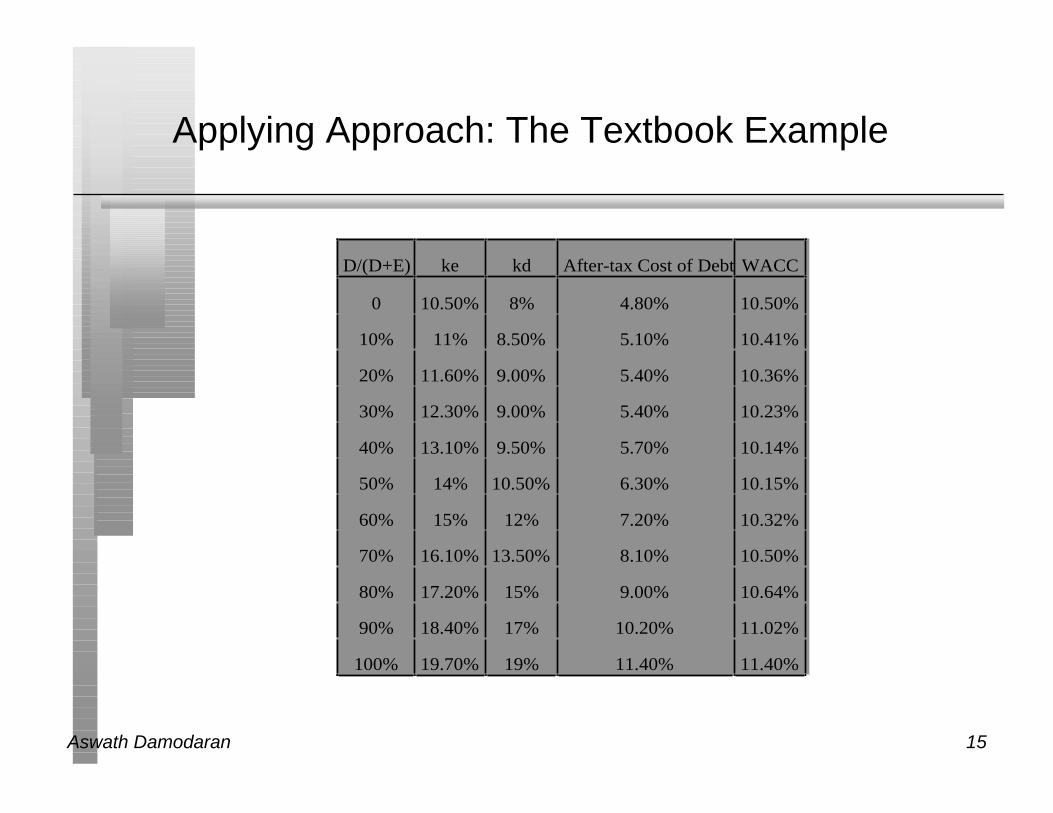
Applying Approach: The Textbook Example
D/(D+E) ke kd After-tax Cost of Debt WACC
0 10.50% 8% 4.80% 10.50%
10% 11% 8.50% 5.10% 10.41%
20% 11.60% 9.00% 5.40% 10.36%
30% 12.30% 9.00% 5.40% 10.23%
40% 13.10% 9.50% 5.70% 10.14%
50% 14% 10.50% 6.30% 10.15%
60% 15% 12% 7.20% 10.32%
70% 16.10% 13.50% 8.10% 10.50%
80% 17.20% 15% 9.00% 10.64%
90% 18.40% 17% 10.20% 11.02%
100% 19.70% 19% 11.40% 11.40%
Aswath Damodaran 16
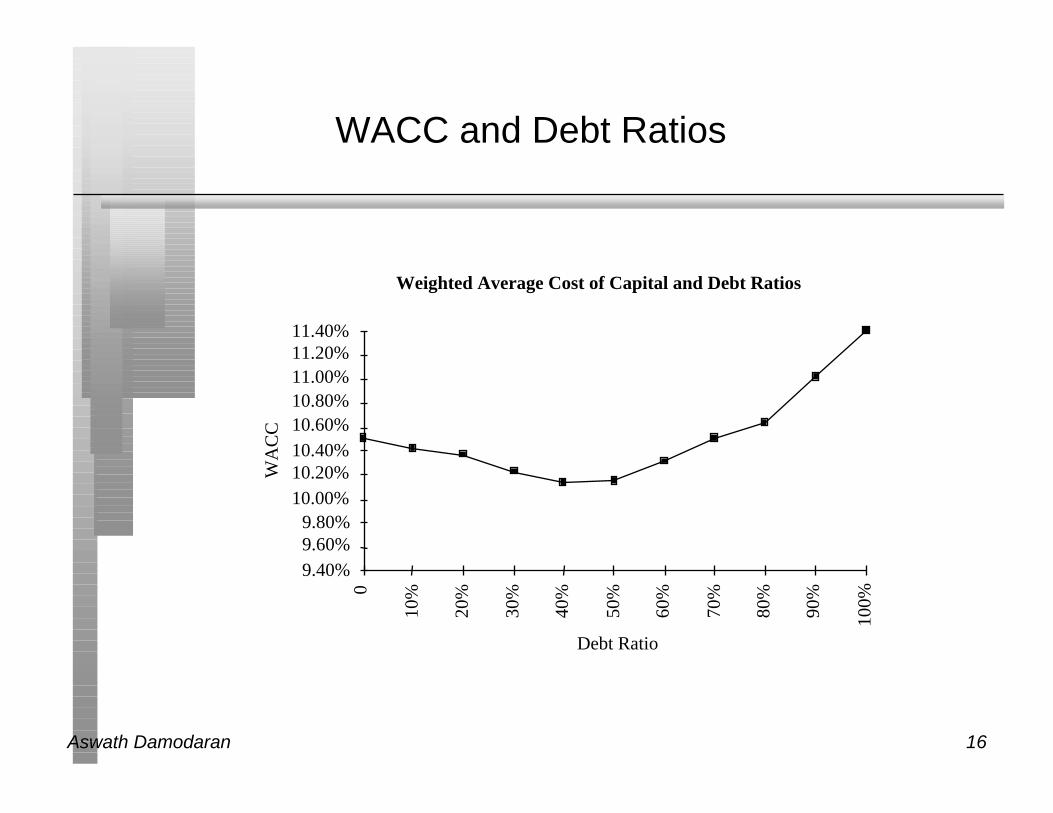
WACC and Debt Ratios
Weighted Average Cost of Capital and Debt Ratios
Debt Ratio
WA
CC
9.40%9.60%9.80%
10.00%10.20%10.40%10.60%10.80%11.00%11.20%11.40%
0
10%
20%
30%
40%
50%
60%
70%
80%
90%
100%
Aswath Damodaran 17
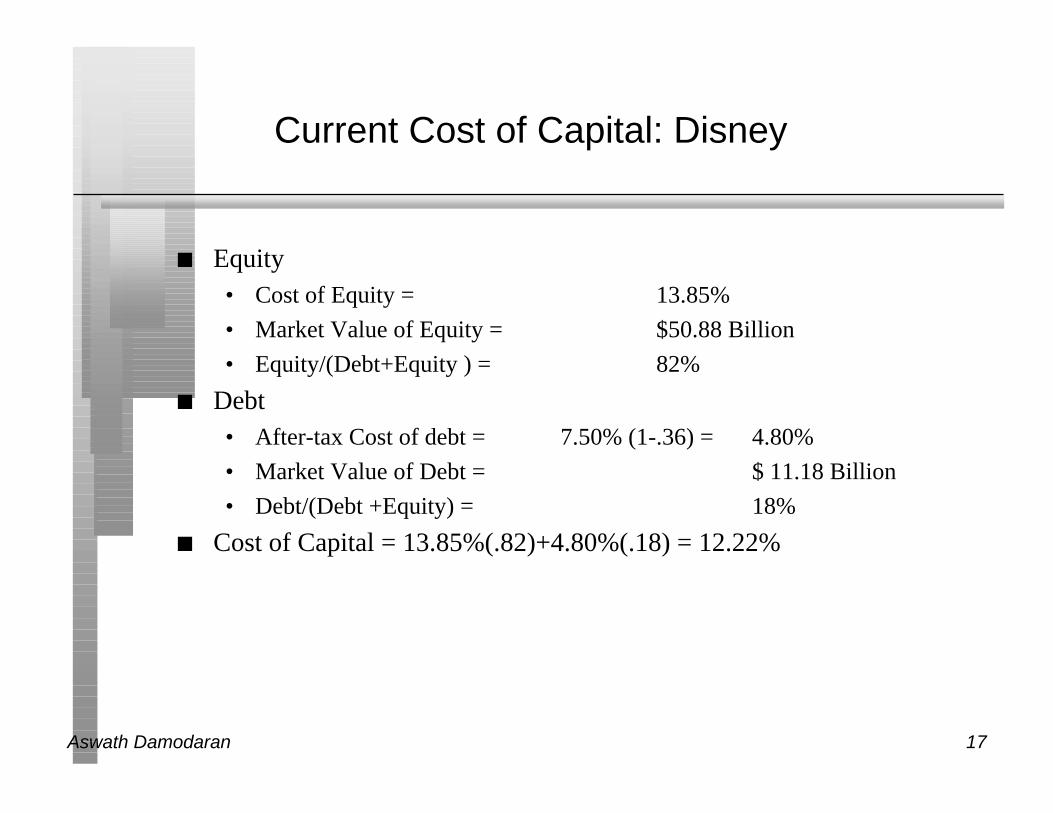
Current Cost of Capital: Disney
n Equity• Cost of Equity = 13.85%
• Market Value of Equity = $50.88 Billion
• Equity/(Debt+Equity ) = 82%
n Debt• After-tax Cost of debt = 7.50% (1-.36) = 4.80%
• Market Value of Debt = $ 11.18 Billion
• Debt/(Debt +Equity) = 18%
n Cost of Capital = 13.85%(.82)+4.80%(.18) = 12.22%
Aswath Damodaran 18
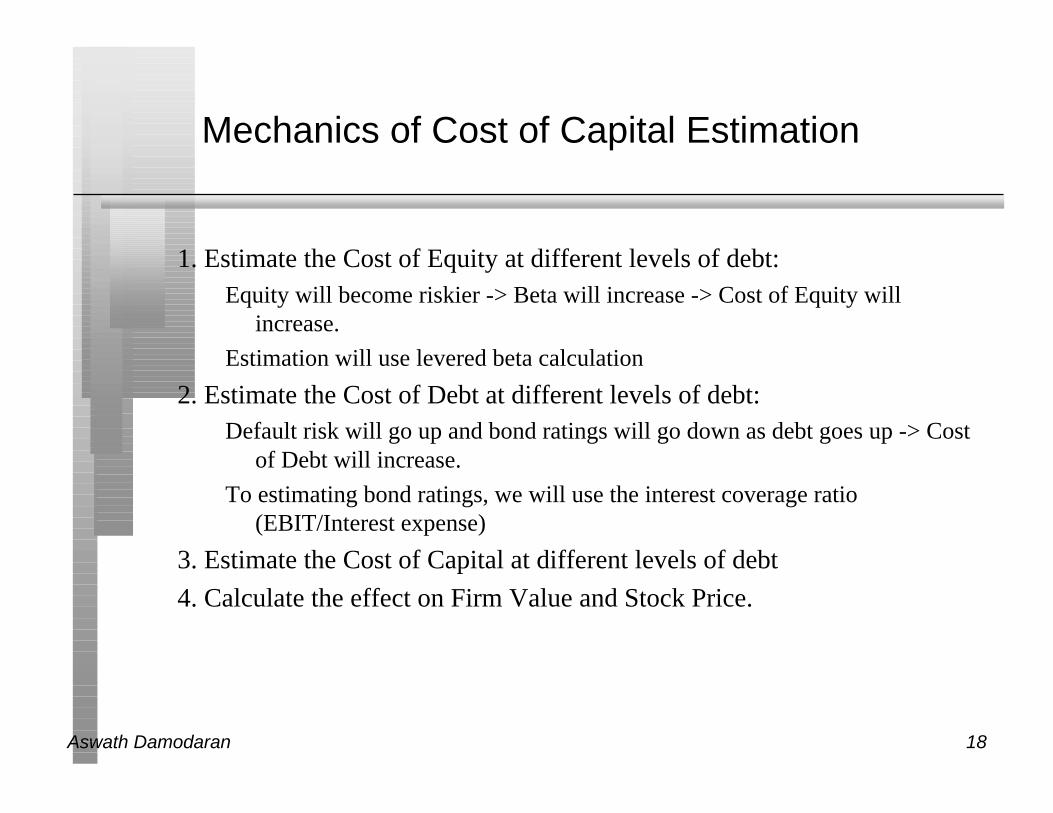
Mechanics of Cost of Capital Estimation
1. Estimate the Cost of Equity at different levels of debt:Equity will become riskier -> Beta will increase -> Cost of Equity will
increase.
Estimation will use levered beta calculation
2. Estimate the Cost of Debt at different levels of debt:Default risk will go up and bond ratings will go down as debt goes up -> Cost
of Debt will increase.
To estimating bond ratings, we will use the interest coverage ratio(EBIT/Interest expense)
3. Estimate the Cost of Capital at different levels of debt
4. Calculate the effect on Firm Value and Stock Price.
Aswath Damodaran 19
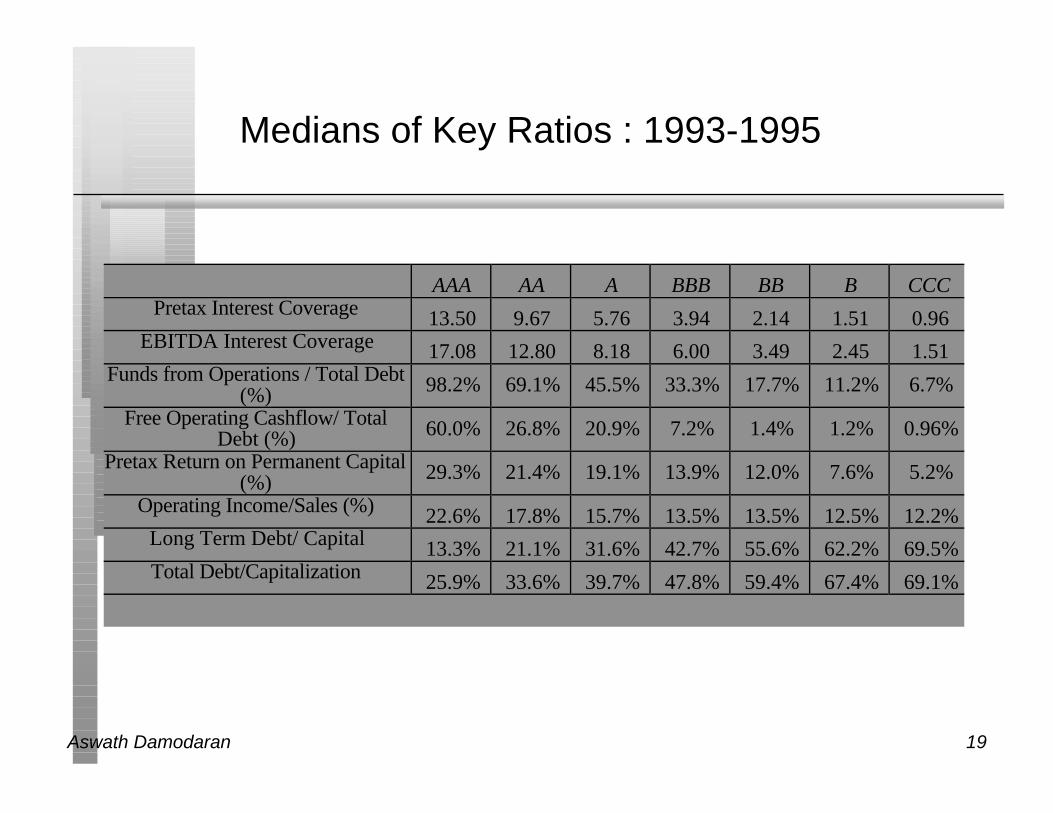
Medians of Key Ratios : 1993-1995
AAA AA A BBB BB B CCCPretax Interest Coverage 13.50 9.67 5.76 3.94 2.14 1.51 0.96
EBITDA Interest Coverage 17.08 12.80 8.18 6.00 3.49 2.45 1.51Funds from Operations / Total Debt
(%) 98.2% 69.1% 45.5% 33.3% 17.7% 11.2% 6.7%
Free Operating Cashflow/ TotalDebt (%) 60.0% 26.8% 20.9% 7.2% 1.4% 1.2% 0.96%
Pretax Return on Permanent Capital(%) 29.3% 21.4% 19.1% 13.9% 12.0% 7.6% 5.2%
Operating Income/Sales (%) 22.6% 17.8% 15.7% 13.5% 13.5% 12.5% 12.2%Long Term Debt/ Capital 13.3% 21.1% 31.6% 42.7% 55.6% 62.2% 69.5%Total Debt/Capitalization 25.9% 33.6% 39.7% 47.8% 59.4% 67.4% 69.1%
Aswath Damodaran 20
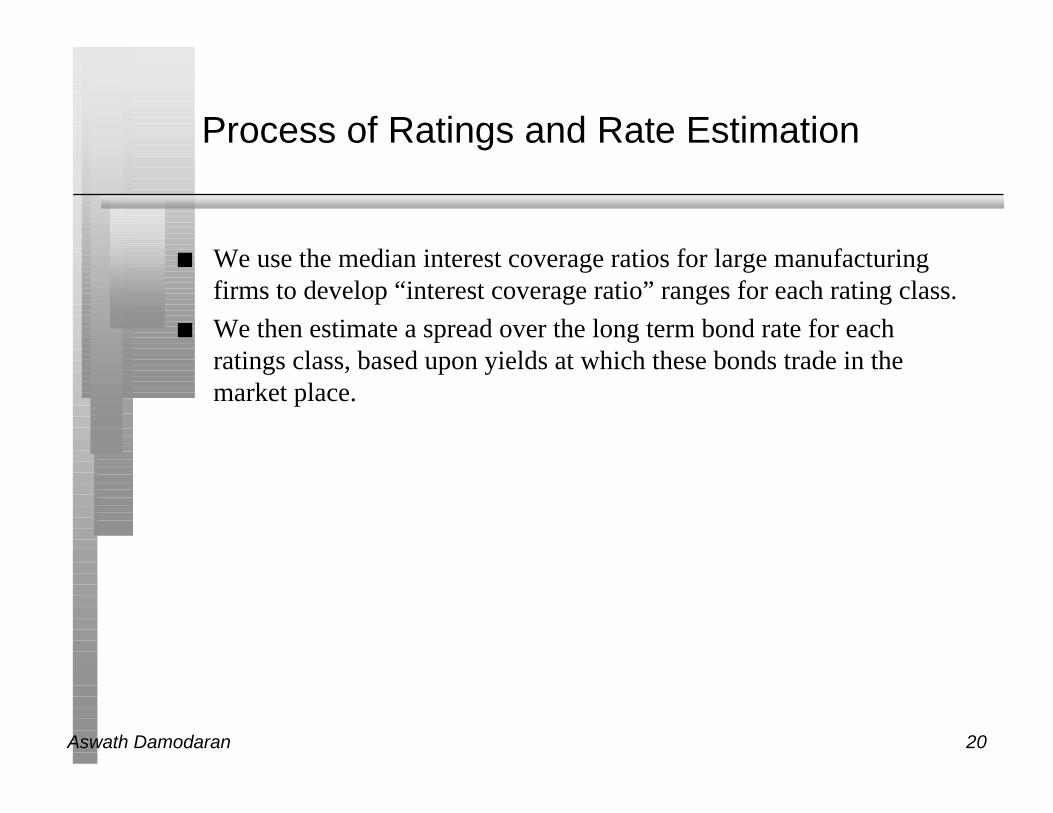
Process of Ratings and Rate Estimation
n We use the median interest coverage ratios for large manufacturingfirms to develop “interest coverage ratio” ranges for each rating class.
n We then estimate a spread over the long term bond rate for eachratings class, based upon yields at which these bonds trade in themarket place.
Aswath Damodaran 21
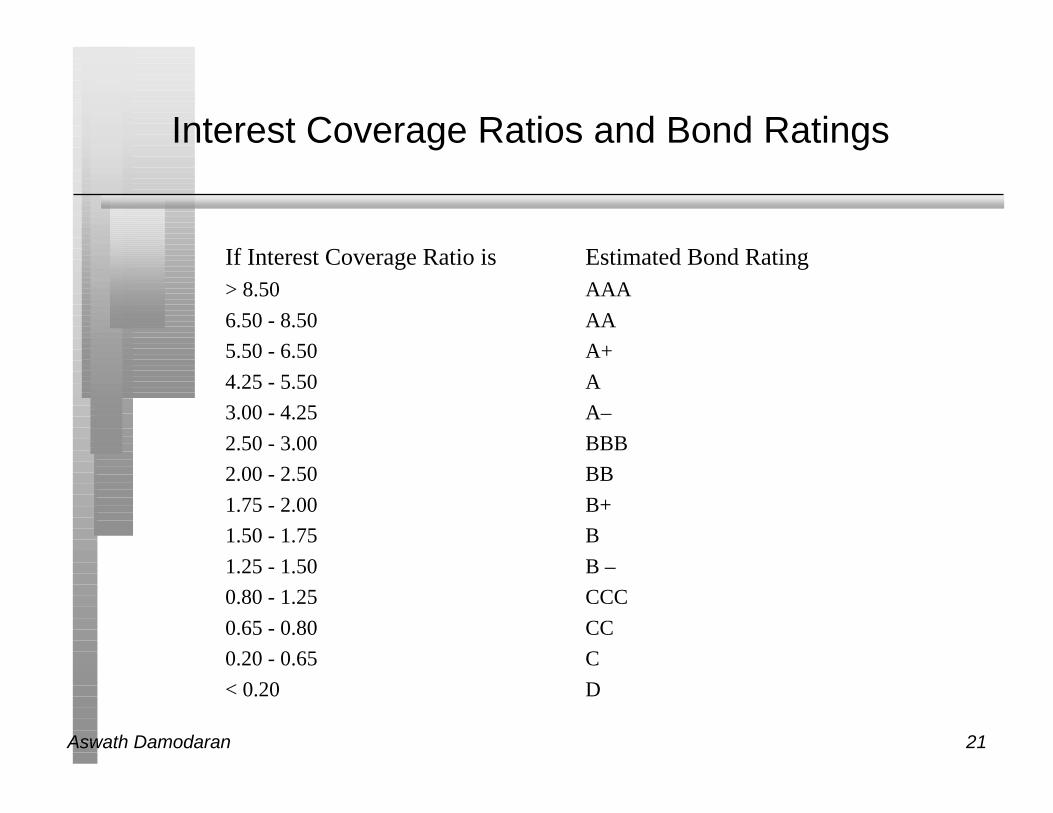
Interest Coverage Ratios and Bond Ratings
If Interest Coverage Ratio is Estimated Bond Rating> 8.50 AAA
6.50 - 8.50 AA
5.50 - 6.50 A+
4.25 - 5.50 A
3.00 - 4.25 A–
2.50 - 3.00 BBB
2.00 - 2.50 BB
1.75 - 2.00 B+
1.50 - 1.75 B
1.25 - 1.50 B –
0.80 - 1.25 CCC
0.65 - 0.80 CC
0.20 - 0.65 C
< 0.20 D
Aswath Damodaran 22
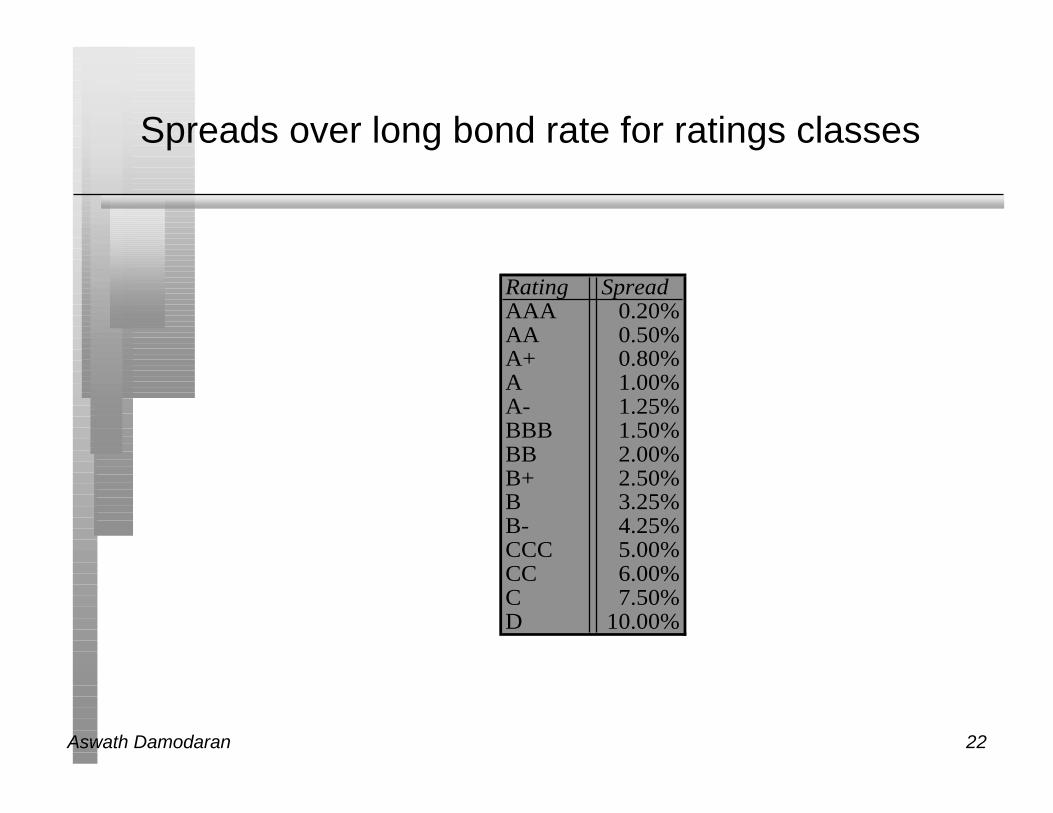
Spreads over long bond rate for ratings classes
Rating Coverage gtSpreadAAA 0.20%AA 0.50%A+ 0.80%A 1.00%A- 1.25%BBB 1.50%BB 2.00%B+ 2.50%B 3.25%B- 4.25%CCC 5.00%CC 6.00%C 7.50%D 10.00%
Aswath Damodaran 23
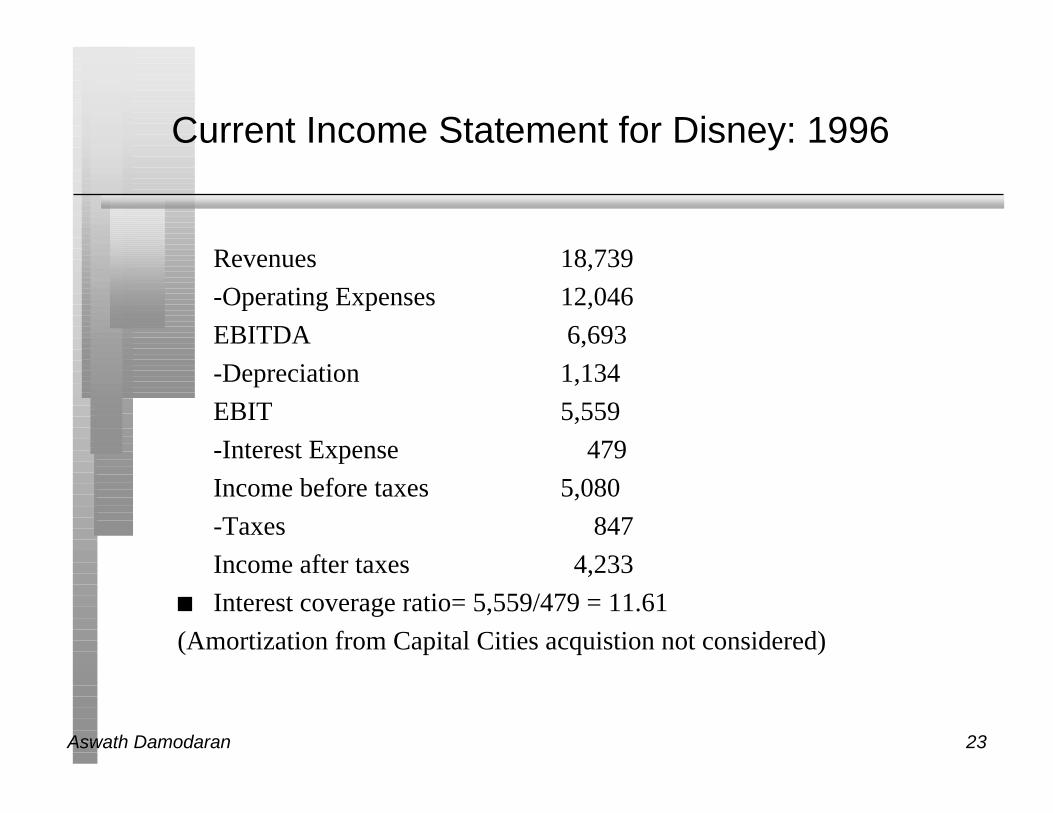
Current Income Statement for Disney: 1996
Revenues 18,739
-Operating Expenses 12,046
EBITDA 6,693
-Depreciation 1,134
EBIT 5,559
-Interest Expense 479
Income before taxes 5,080
-Taxes 847
Income after taxes 4,233
n Interest coverage ratio= 5,559/479 = 11.61
(Amortization from Capital Cities acquistion not considered)
Aswath Damodaran 24
Estimating Cost of Equity
Current Beta = 1.25 Unlevered Beta = 1.09
Market premium = 5.5% T.Bond Rate = 7.00% t=36%Debt Ratio D/E Ratio Beta Cost of Equity
0% 0% 1.09 13.00%
10% 11% 1.17 13.43%
20% 25% 1.27 13.96%
30% 43% 1.39 14.65%
40% 67% 1.56 15.56%
50% 100% 1.79 16.85%
60% 150% 2.14 18.77%
70% 233% 2.72 21.97%
80% 400% 3.99 28.95%
90% 900% 8.21 52.14%
Aswath Damodaran 25
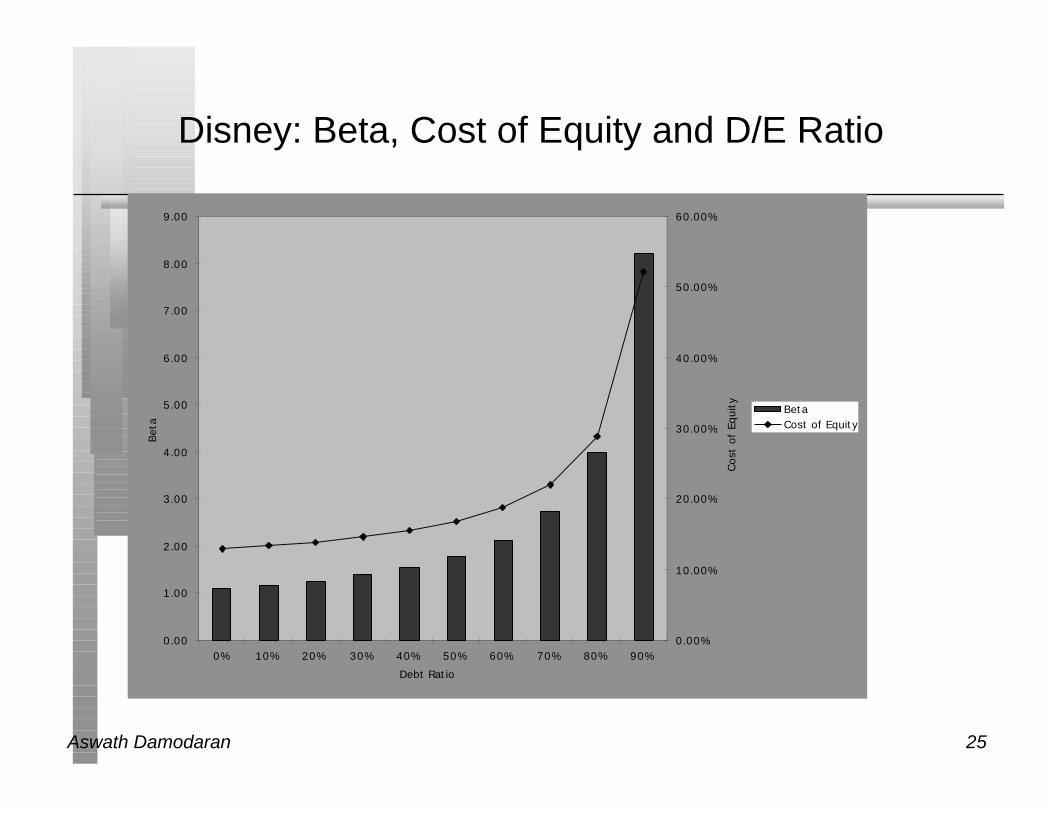
Disney: Beta, Cost of Equity and D/E Ratio
0.00
1.00
2.00
3.00
4.00
5.00
6.00
7.00
8.00
9.00
0% 10% 20% 30% 40% 50% 60% 70% 80% 90%
Debt Ratio
Bet
a
0.00%
10.00%
20.00%
30.00%
40.00%
50.00%
60.00%
Cost
of
Equi
ty BetaCost of Equity
Aswath Damodaran 26
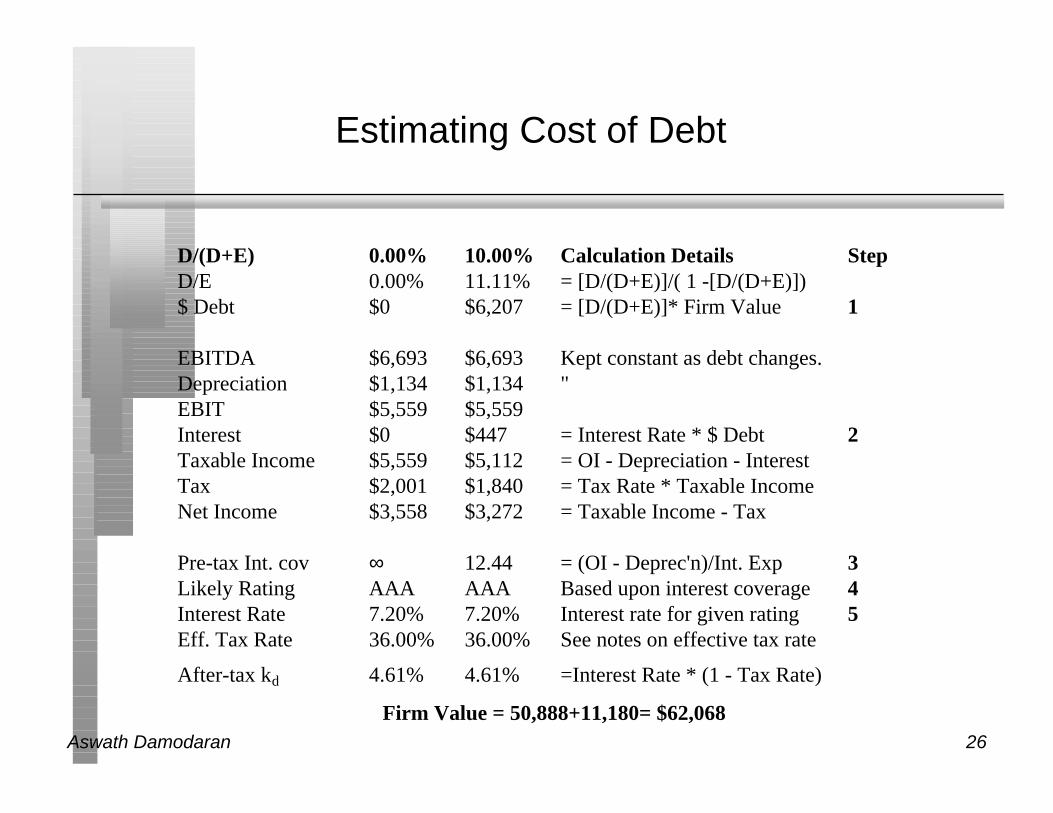
Estimating Cost of Debt
D/(D+E) 0.00% 10.00% Calculation Details StepD/E 0.00% 11.11% = [D/(D+E)]/( 1 -[D/(D+E)])$ Debt $0 $6,207 = [D/(D+E)]* Firm Value 1
EBITDA $6,693 $6,693 Kept constant as debt changes.Depreciation $1,134 $1,134 "EBIT $5,559 $5,559Interest $0 $447 = Interest Rate * $ Debt 2Taxable Income $5,559 $5,112 = OI - Depreciation - InterestTax $2,001 $1,840 = Tax Rate * Taxable IncomeNet Income $3,558 $3,272 = Taxable Income - Tax
Pre-tax Int. cov ∞ 12.44 = (OI - Deprec'n)/Int. Exp 3Likely Rating AAA AAA Based upon interest coverage 4Interest Rate 7.20% 7.20% Interest rate for given rating 5Eff. Tax Rate 36.00% 36.00% See notes on effective tax rate
After-tax kd 4.61% 4.61% =Interest Rate * (1 - Tax Rate)
Firm Value = 50,888+11,180= $62,068
Aswath Damodaran 27
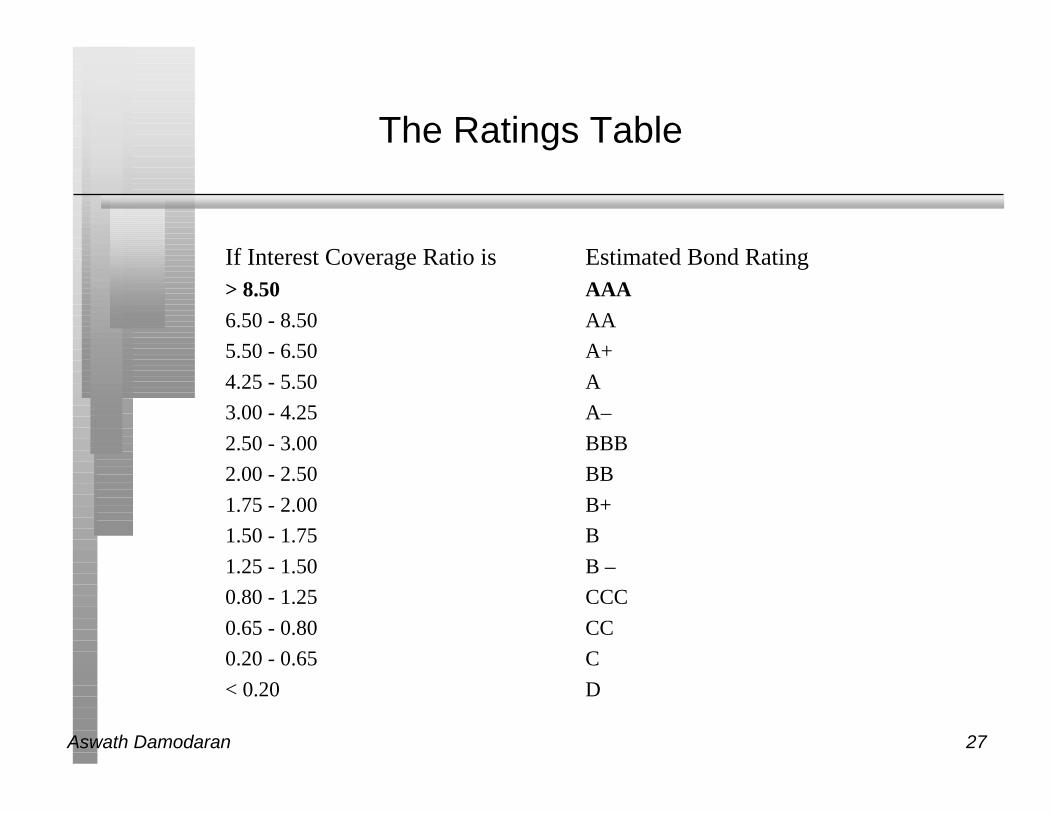
The Ratings Table
If Interest Coverage Ratio is Estimated Bond Rating> 8.50 AAA
6.50 - 8.50 AA
5.50 - 6.50 A+
4.25 - 5.50 A
3.00 - 4.25 A–
2.50 - 3.00 BBB
2.00 - 2.50 BB
1.75 - 2.00 B+
1.50 - 1.75 B
1.25 - 1.50 B –
0.80 - 1.25 CCC
0.65 - 0.80 CC
0.20 - 0.65 C
< 0.20 D
Aswath Damodaran 28
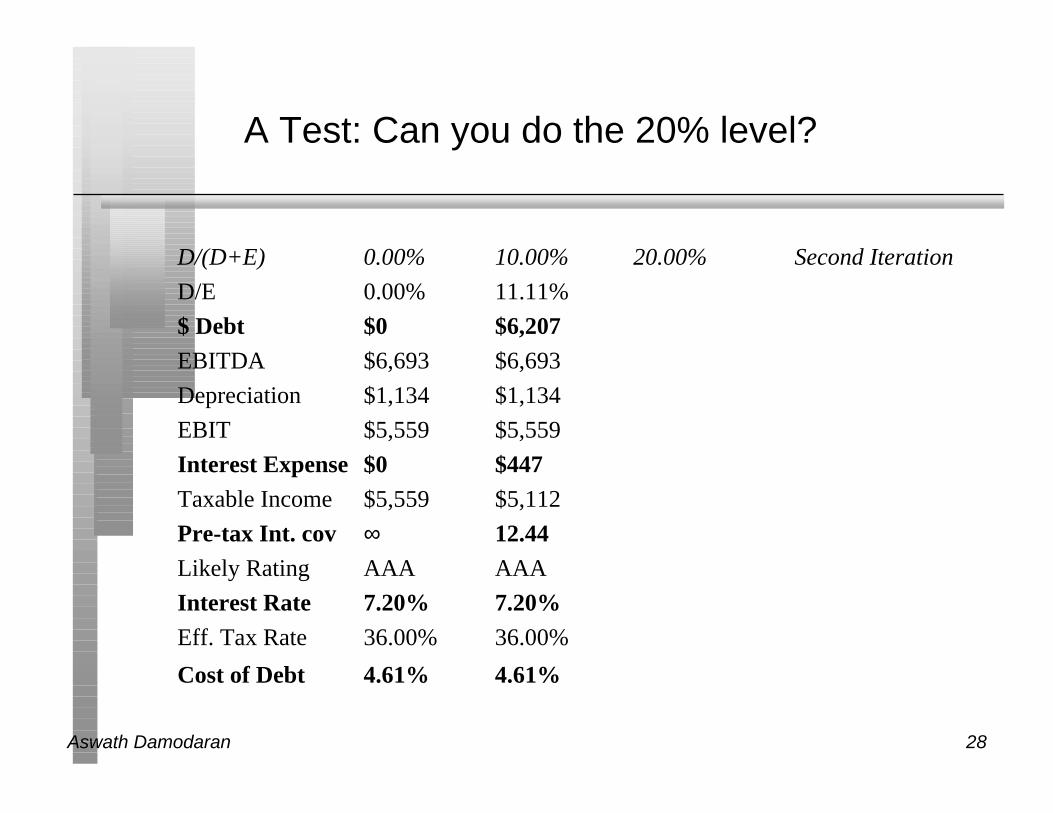
A Test: Can you do the 20% level?
D/(D+E) 0.00% 10.00% 20.00% Second Iteration
D/E 0.00% 11.11%
$ Debt $0 $6,207
EBITDA $6,693 $6,693
Depreciation $1,134 $1,134
EBIT $5,559 $5,559
Interest Expense $0 $447
Taxable Income $5,559 $5,112
Pre-tax Int. cov ∞ 12.44
Likely Rating AAA AAA
Interest Rate 7.20% 7.20%
Eff. Tax Rate 36.00% 36.00%
Cost of Debt 4.61% 4.61%
Aswath Damodaran 29
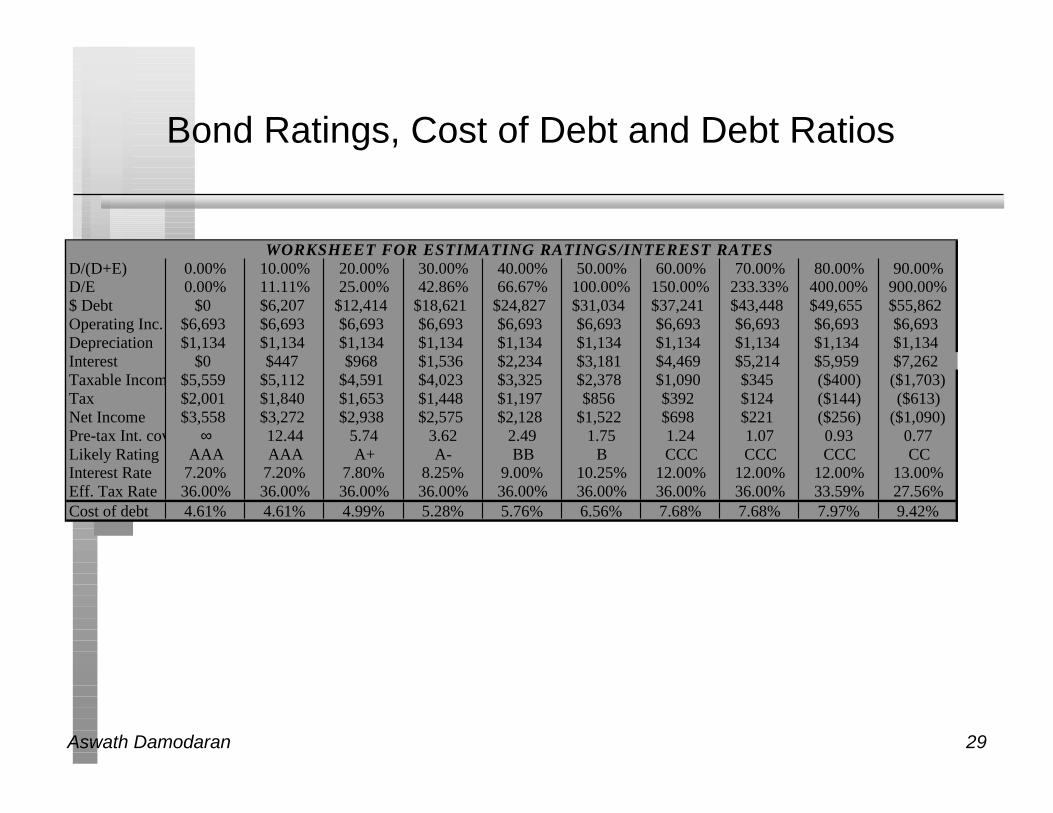
Bond Ratings, Cost of Debt and Debt Ratios
WORKSHEET FOR ESTIMATING RATINGS/INTEREST RATESD/(D+E) 0.00% 10.00% 20.00% 30.00% 40.00% 50.00% 60.00% 70.00% 80.00% 90.00%D/E 0.00% 11.11% 25.00% 42.86% 66.67% 100.00% 150.00% 233.33% 400.00% 900.00%$ Debt $0 $6,207 $12,414 $18,621 $24,827 $31,034 $37,241 $43,448 $49,655 $55,862Operating Inc. $6,693 $6,693 $6,693 $6,693 $6,693 $6,693 $6,693 $6,693 $6,693 $6,693Depreciation $1,134 $1,134 $1,134 $1,134 $1,134 $1,134 $1,134 $1,134 $1,134 $1,134Interest $0 $447 $968 $1,536 $2,234 $3,181 $4,469 $5,214 $5,959 $7,262Taxable Income $5,559 $5,112 $4,591 $4,023 $3,325 $2,378 $1,090 $345 ($400) ($1,703)Tax $2,001 $1,840 $1,653 $1,448 $1,197 $856 $392 $124 ($144) ($613)Net Income $3,558 $3,272 $2,938 $2,575 $2,128 $1,522 $698 $221 ($256) ($1,090)Pre-tax Int. cov ∞ 12.44 5.74 3.62 2.49 1.75 1.24 1.07 0.93 0.77Likely Rating AAA AAA A+ A- BB B CCC CCC CCC CCInterest Rate 7.20% 7.20% 7.80% 8.25% 9.00% 10.25% 12.00% 12.00% 12.00% 13.00%Eff. Tax Rate 36.00% 36.00% 36.00% 36.00% 36.00% 36.00% 36.00% 36.00% 33.59% 27.56%Cost of debt 4.61% 4.61% 4.99% 5.28% 5.76% 6.56% 7.68% 7.68% 7.97% 9.42%
Aswath Damodaran 30
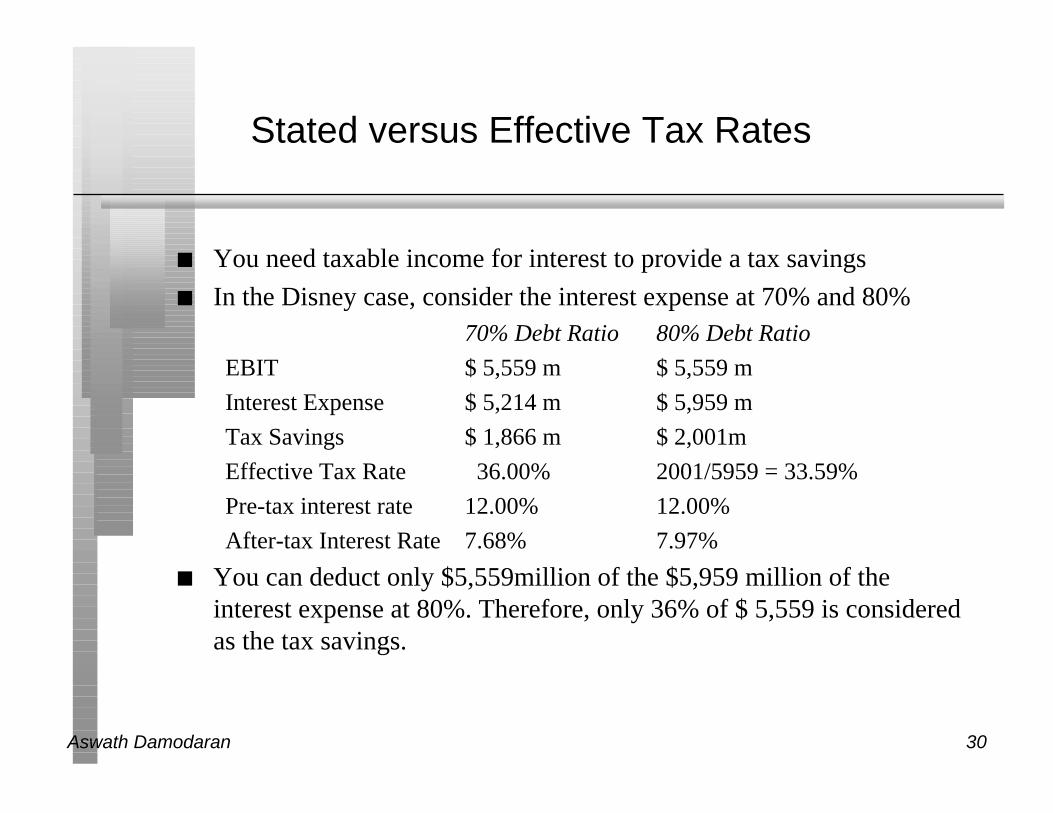
Stated versus Effective Tax Rates
n You need taxable income for interest to provide a tax savings
n In the Disney case, consider the interest expense at 70% and 80%70% Debt Ratio 80% Debt Ratio
EBIT $ 5,559 m $ 5,559 m
Interest Expense $ 5,214 m $ 5,959 m
Tax Savings $ 1,866 m $ 2,001m
Effective Tax Rate 36.00% 2001/5959 = 33.59%
Pre-tax interest rate 12.00% 12.00%
After-tax Interest Rate 7.68% 7.97%
n You can deduct only $5,559million of the $5,959 million of theinterest expense at 80%. Therefore, only 36% of $ 5,559 is consideredas the tax savings.
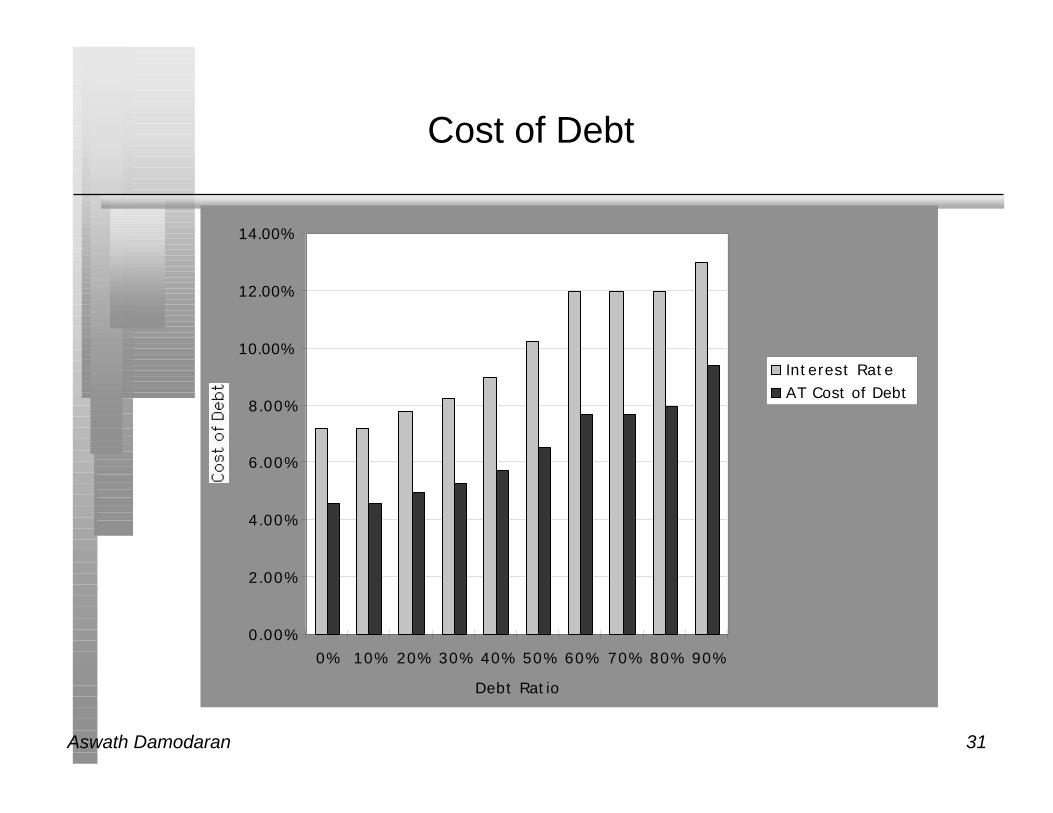
Aswath Damodaran 31
Cost of Debt
0.00%
2.00%
4.00%
6.00%
8.00%
10.00%
12.00%
14.00%
0% 10% 20% 30% 40% 50% 60% 70% 80% 90%
Debt Ratio
Interest RateAT Cost of Debt
Aswath Damodaran 32
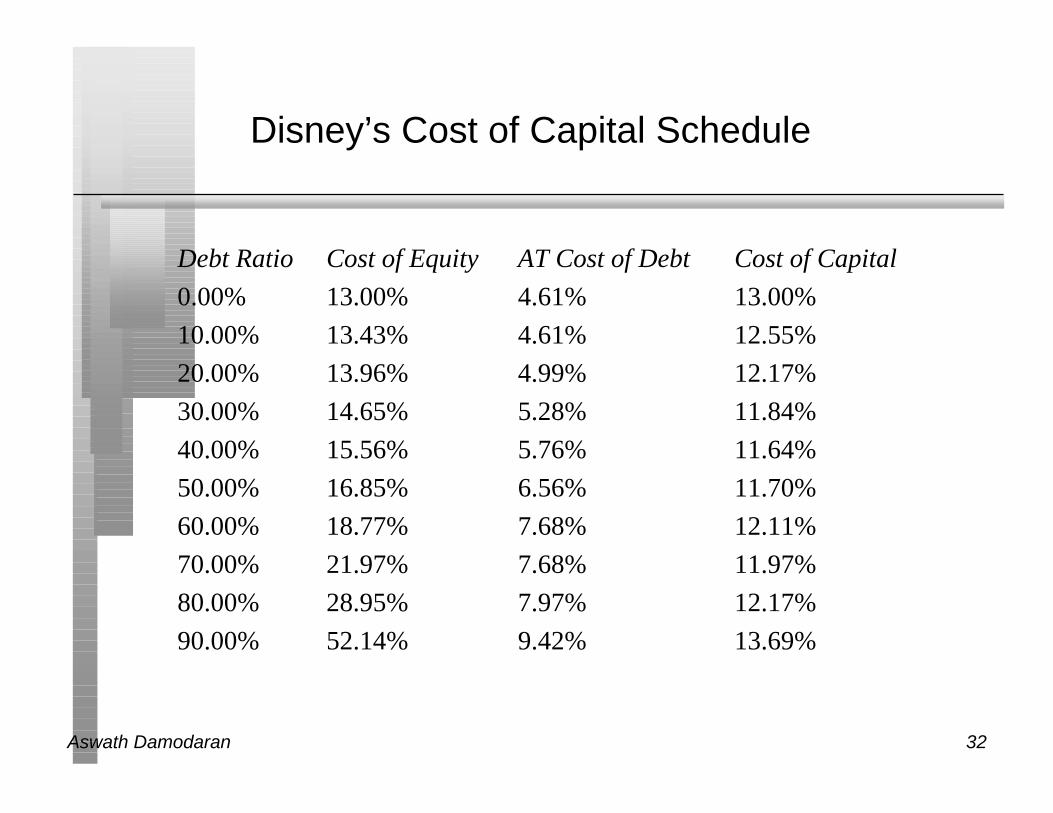
Disney’s Cost of Capital Schedule
Debt Ratio Cost of Equity AT Cost of Debt Cost of Capital
0.00% 13.00% 4.61% 13.00%
10.00% 13.43% 4.61% 12.55%
20.00% 13.96% 4.99% 12.17%
30.00% 14.65% 5.28% 11.84%
40.00% 15.56% 5.76% 11.64%
50.00% 16.85% 6.56% 11.70%
60.00% 18.77% 7.68% 12.11%
70.00% 21.97% 7.68% 11.97%
80.00% 28.95% 7.97% 12.17%
90.00% 52.14% 9.42% 13.69%
Aswath Damodaran 33
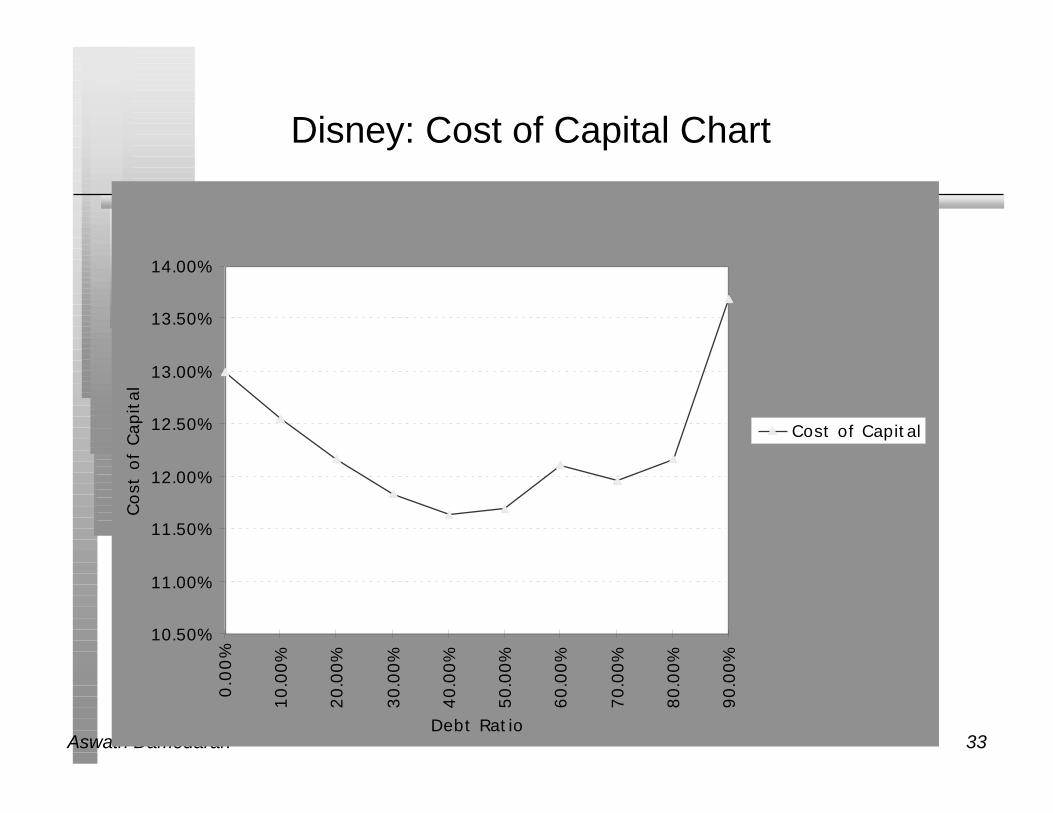
Disney: Cost of Capital Chart
10.50%
11.00%
11.50%
12.00%
12.50%
13.00%
13.50%
14.00%
0.0
0%
10.0
0%
20.0
0%
30.0
0%
40.0
0%
50.0
0%
60.0
0%
70.0
0%
80.0
0%
90.0
0%
Debt Ratio
Cost
of
Cap
ital
Cost of Capital
Aswath Damodaran 34
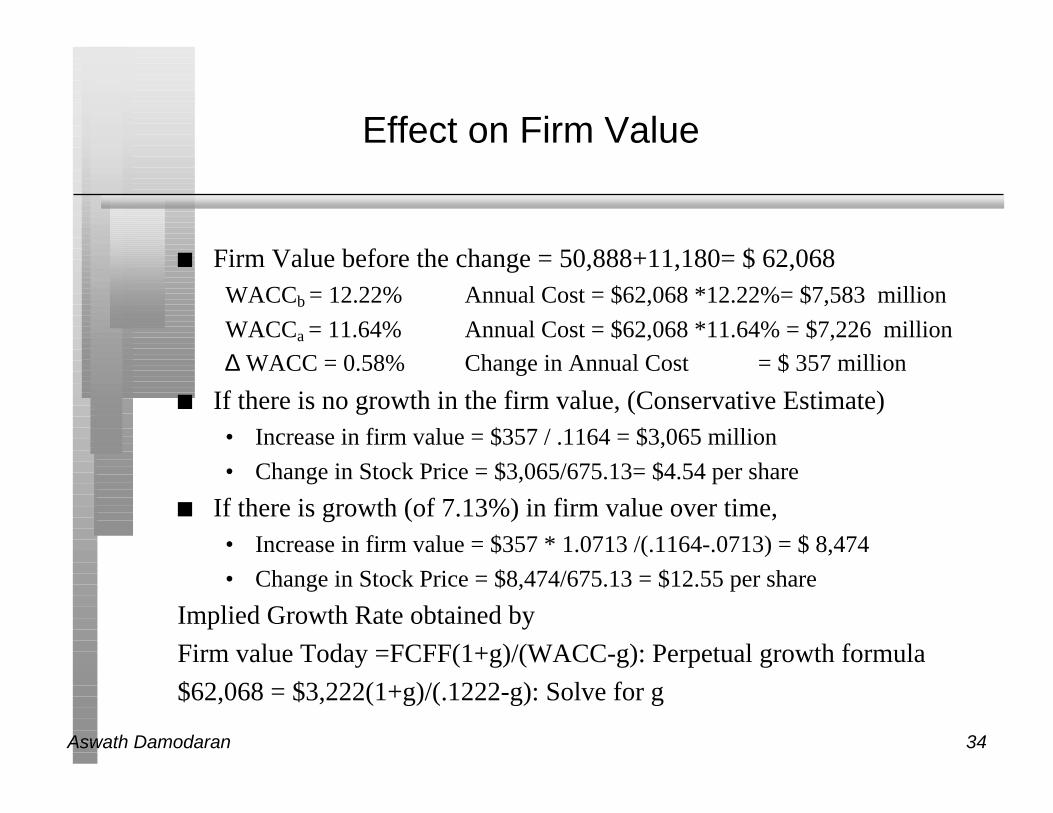
Effect on Firm Value
n Firm Value before the change = 50,888+11,180= $ 62,068WACCb = 12.22% Annual Cost = $62,068 *12.22%= $7,583 million
WACCa = 11.64% Annual Cost = $62,068 *11.64% = $7,226 million
∆ WACC = 0.58% Change in Annual Cost = $ 357 million
n If there is no growth in the firm value, (Conservative Estimate)• Increase in firm value = $357 / .1164 = $3,065 million
• Change in Stock Price = $3,065/675.13= $4.54 per share
n If there is growth (of 7.13%) in firm value over time,• Increase in firm value = $357 * 1.0713 /(.1164-.0713) = $ 8,474
• Change in Stock Price = $8,474/675.13 = $12.55 per share
Implied Growth Rate obtained by
Firm value Today =FCFF(1+g)/(WACC-g): Perpetual growth formula
$62,068 = $3,222(1+g)/(.1222-g): Solve for g
Aswath Damodaran 35
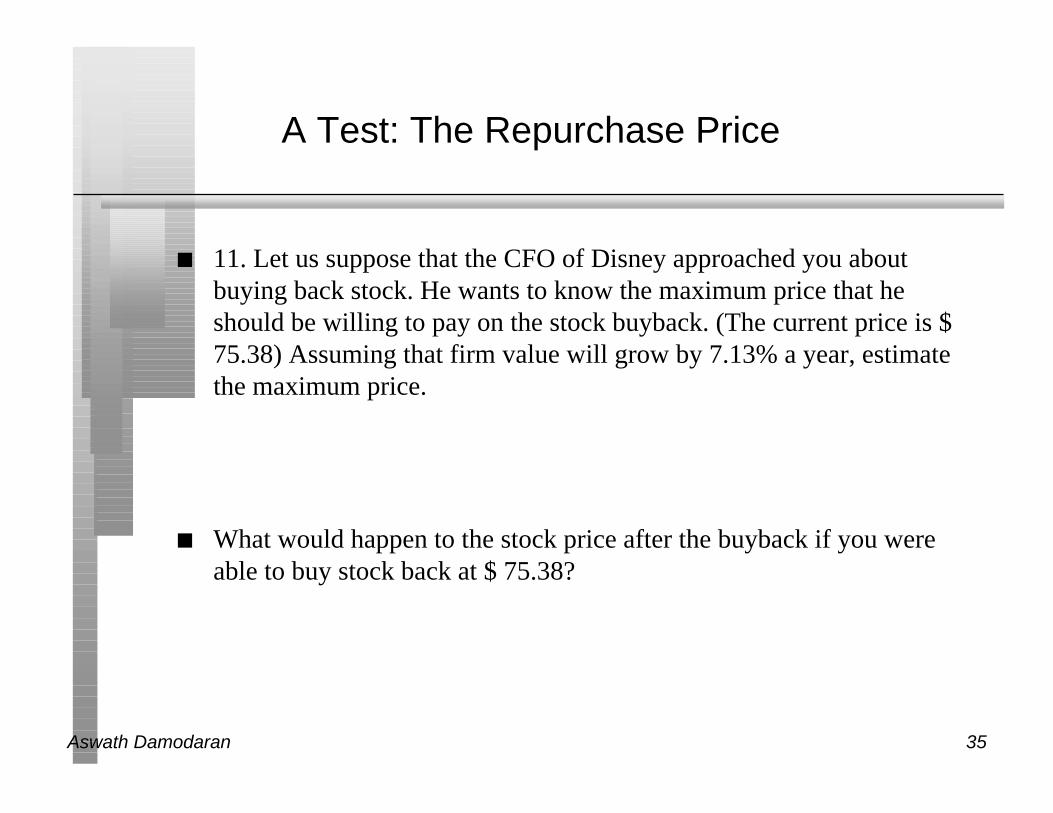
A Test: The Repurchase Price
n 11. Let us suppose that the CFO of Disney approached you aboutbuying back stock. He wants to know the maximum price that heshould be willing to pay on the stock buyback. (The current price is $75.38) Assuming that firm value will grow by 7.13% a year, estimatethe maximum price.
n What would happen to the stock price after the buyback if you wereable to buy stock back at $ 75.38?
Aswath Damodaran 36
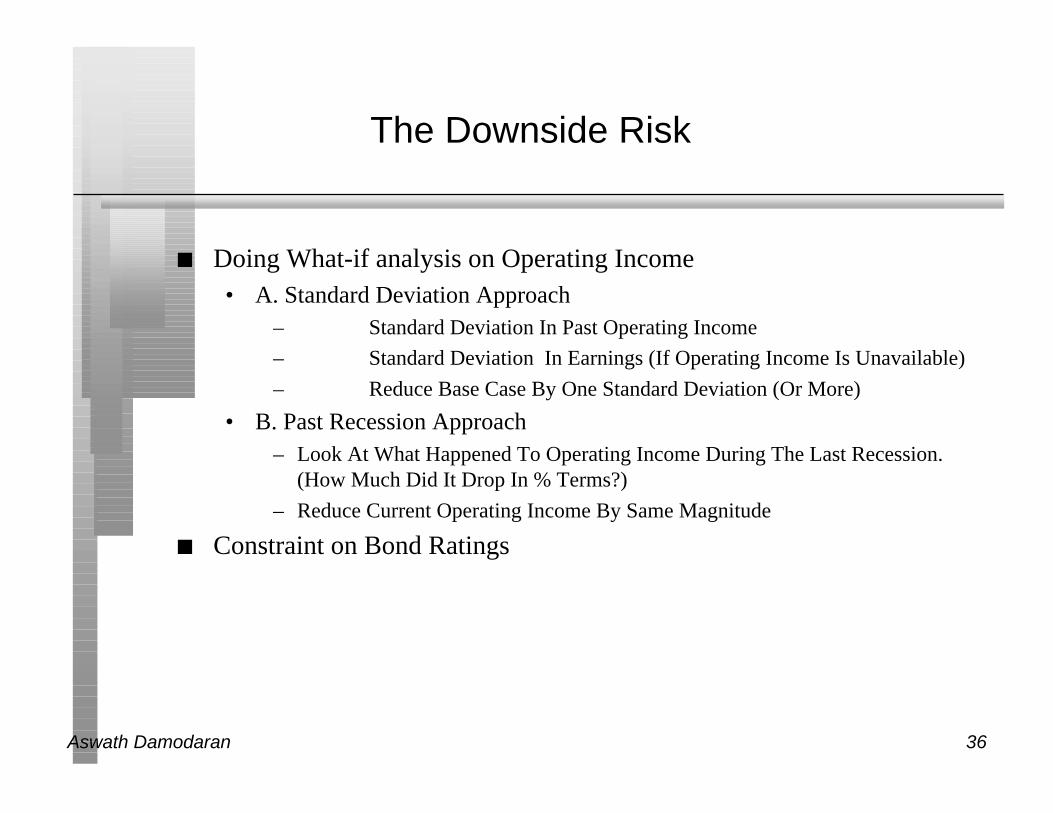
The Downside Risk
n Doing What-if analysis on Operating Income• A. Standard Deviation Approach
– Standard Deviation In Past Operating Income
– Standard Deviation In Earnings (If Operating Income Is Unavailable)
– Reduce Base Case By One Standard Deviation (Or More)
• B. Past Recession Approach– Look At What Happened To Operating Income During The Last Recession.
(How Much Did It Drop In % Terms?)
– Reduce Current Operating Income By Same Magnitude
n Constraint on Bond Ratings
Aswath Damodaran 37
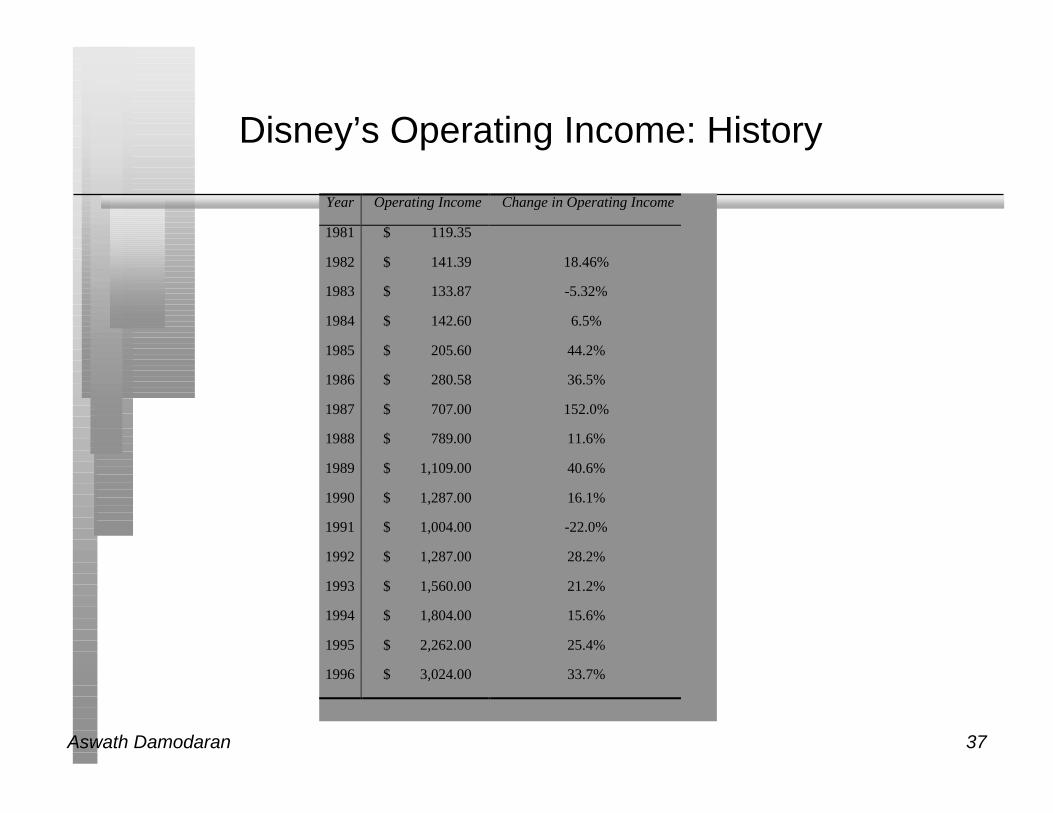
Disney’s Operating Income: History
Year Operating Income Change in Operating Income
1981 $ 119.35
1982 $ 141.39 18.46%
1983 $ 133.87 -5.32%
1984 $ 142.60 6.5%
1985 $ 205.60 44.2%
1986 $ 280.58 36.5%
1987 $ 707.00 152.0%
1988 $ 789.00 11.6%
1989 $ 1,109.00 40.6%
1990 $ 1,287.00 16.1%
1991 $ 1,004.00 -22.0%
1992 $ 1,287.00 28.2%
1993 $ 1,560.00 21.2%
1994 $ 1,804.00 15.6%
1995 $ 2,262.00 25.4%
1996 $ 3,024.00 33.7%
Aswath Damodaran 38
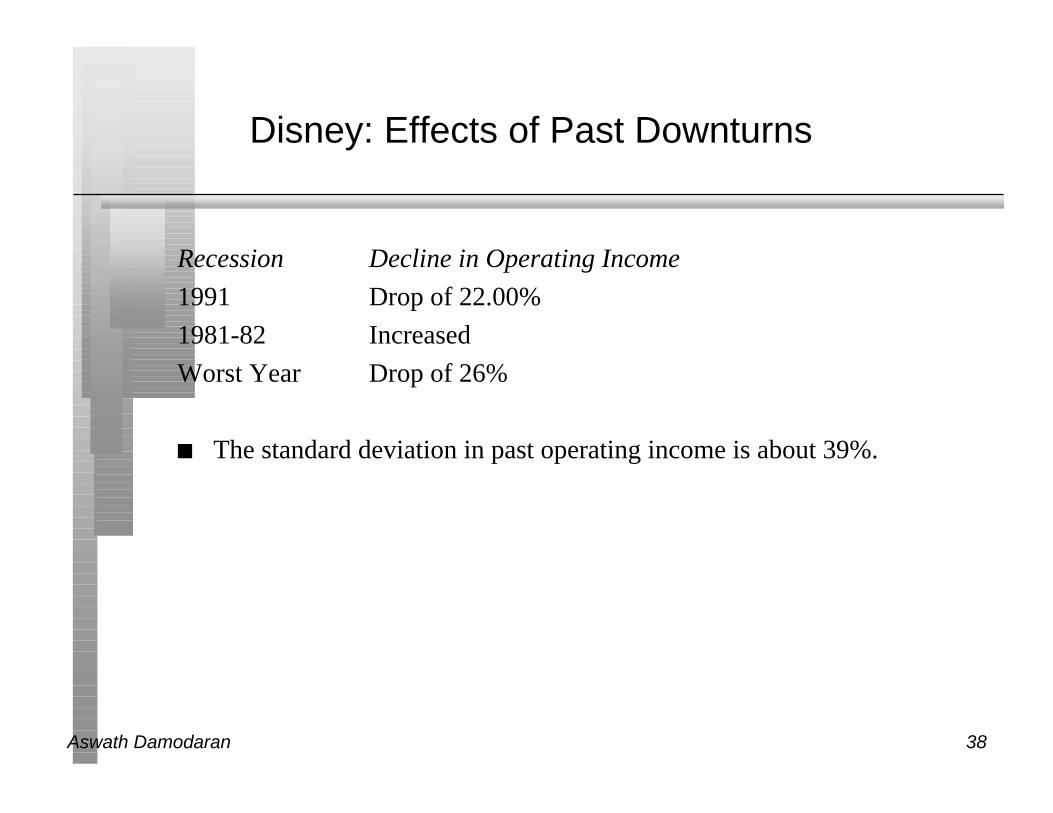
Disney: Effects of Past Downturns
Recession Decline in Operating Income
1991 Drop of 22.00%
1981-82 Increased
Worst Year Drop of 26%
n The standard deviation in past operating income is about 39%.
Aswath Damodaran 39
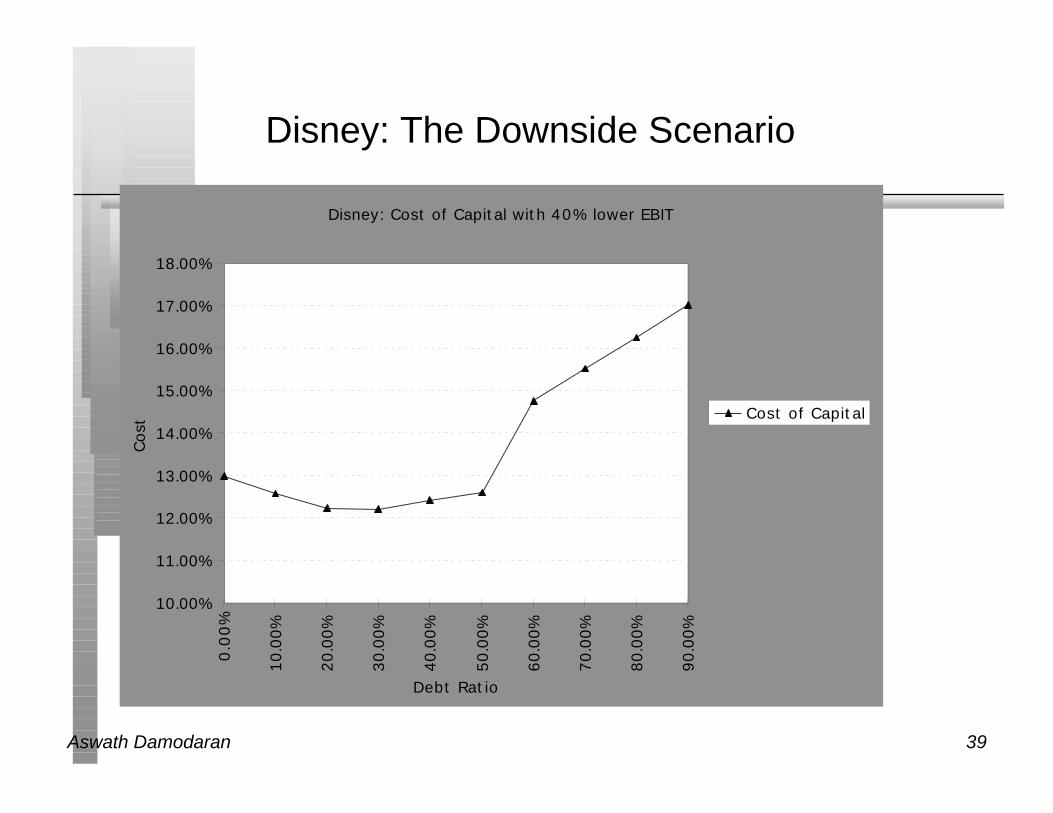
Disney: The Downside Scenario
Disney: Cost of Capital with 40% lower EBIT
10.00%
11.00%
12.00%
13.00%
14.00%
15.00%
16.00%
17.00%
18.00%
0.0
0%
10.0
0%
20.0
0%
30.0
0%
40.0
0%
50.0
0%
60.0
0%
70.0
0%
80.0
0%
90.0
0%
Debt Ratio
Cost
Cost of Capital
Aswath Damodaran 40
Constraints on Ratings
n Management often specifies a 'desired Rating' below which they donot want to fall.
n The rating constraint is driven by three factors• it is one way of protecting against downside risk in operating income (so
do not do both)
• a drop in ratings might affect operating income
• there is an ego factor associated with high ratings
n Caveat: Every Rating Constraint Has A Cost.• Provide Management With A Clear Estimate Of How Much The Rating
Constraint Costs By Calculating The Value Of The Firm Without TheRating Constraint And Comparing To The Value Of The Firm With TheRating Constraint.
Aswath Damodaran 41
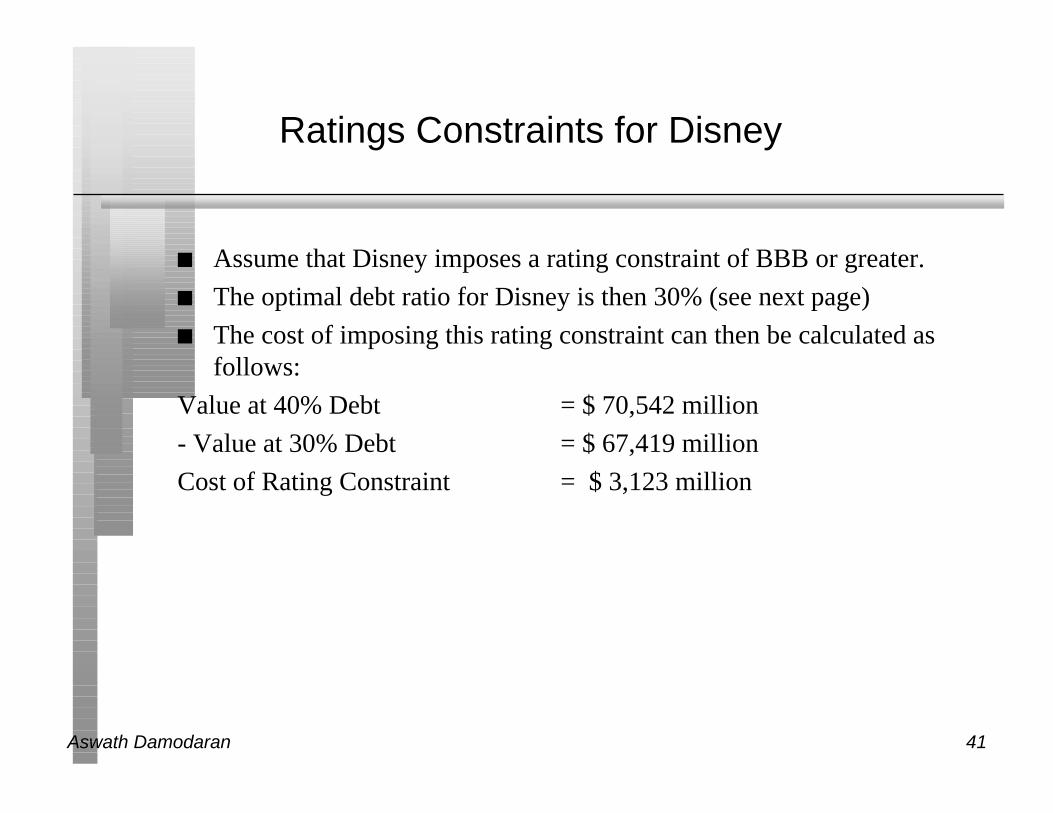
Ratings Constraints for Disney
n Assume that Disney imposes a rating constraint of BBB or greater.
n The optimal debt ratio for Disney is then 30% (see next page)
n The cost of imposing this rating constraint can then be calculated asfollows:
Value at 40% Debt = $ 70,542 million
- Value at 30% Debt = $ 67,419 million
Cost of Rating Constraint = $ 3,123 million
Aswath Damodaran 42
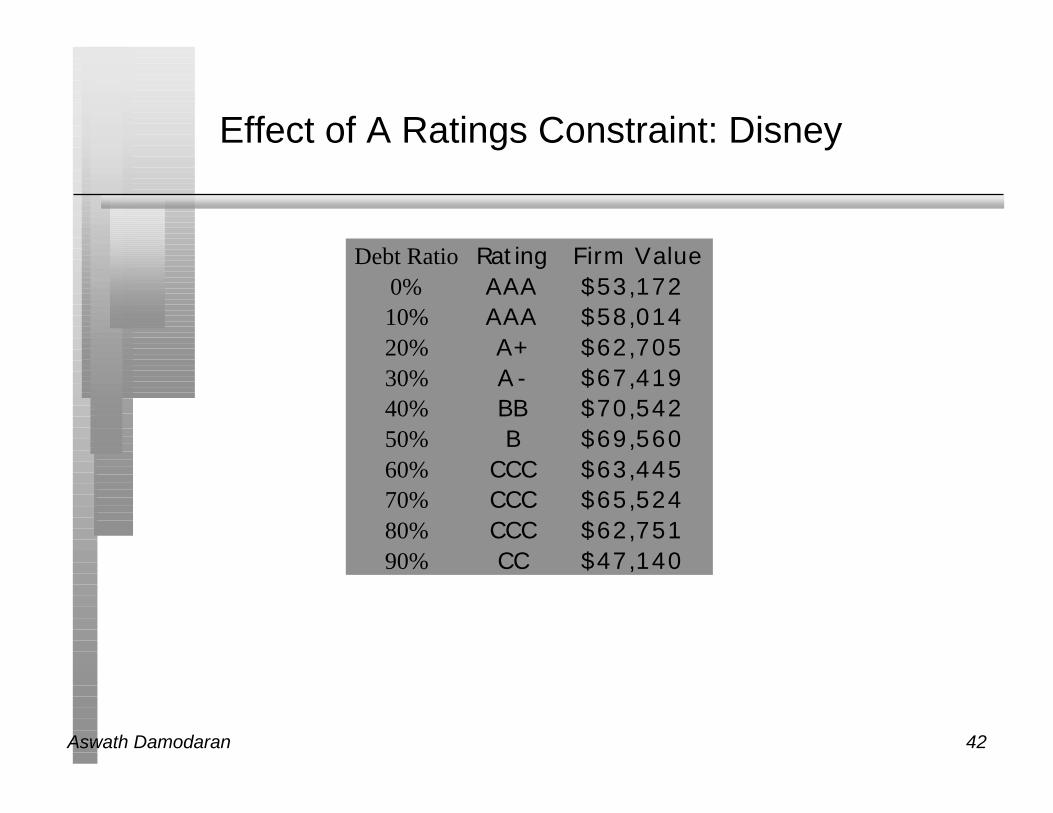
Effect of A Ratings Constraint: Disney
Debt Ratio Rating Firm Value0% AAA $53,17210% AAA $58,01420% A+ $62,70530% A- $67,41940% BB $70,54250% B $69,56060% CCC $63,44570% CCC $65,52480% CCC $62,75190% CC $47,140
Aswath Damodaran 43
Why Is The Rating At The Current Debt RatioIn The Spreadsheet Different From The Firm's
Current Rating?
1. Differences between current market interest rates and rates at whichcompany was able to borrow historically-• If current market rates > Historical interest rates --> Rating will be lower
• If current market rates < Historical interest rates --> Rating will be higher
2. Subjective factors
3. Lags in the rating process
Aswath Damodaran 44
Ways of dealing with this inconsistency
1. Do nothing: This will give you an estimate of the optimal capitalstructure assuming refinancing at current market interest rates.
2. Build in existing interest costs into the analysis, i.e. Allow existing debtto be carried at existing rates for the rest of their maturity.
3. Build in the subjective factors into ratings. For instance, if the companyis currently rated two notches above the rating you get from theinterest coverage ratio, add two notches to each of the calculatedratings in the analysis.
Aswath Damodaran 45
What if you do not buy back stock..
n The optimal debt ratio is ultimately a function of the underlyingriskiness of the business in which you operate and your tax rate
n Will the optimal be different if you took projects instead of buyingback stock?• NO. As long as the projects financed are in the same business mix that
the company has always been in and your tax rate does not changesignificantly.
• YES, if the projects are in entirely different types of businesses or if thetax rate is significantly different.
Aswath Damodaran 46
ANALYZING FINANCIAL SERVICE FIRMS
n The interest coverage ratios/ratings relationship is likely to be differentfor financial service firms.
n The definition of debt is messy for financial service firms. In general,using all debt for a financial service firm will lead to high debt ratios.Use only interest-bearing long term debt in calculating debt ratios.
n The effect of ratings drops will be much more negative for financialservice firms.
n There are likely to regulatory constraints on capital
Aswath Damodaran 47
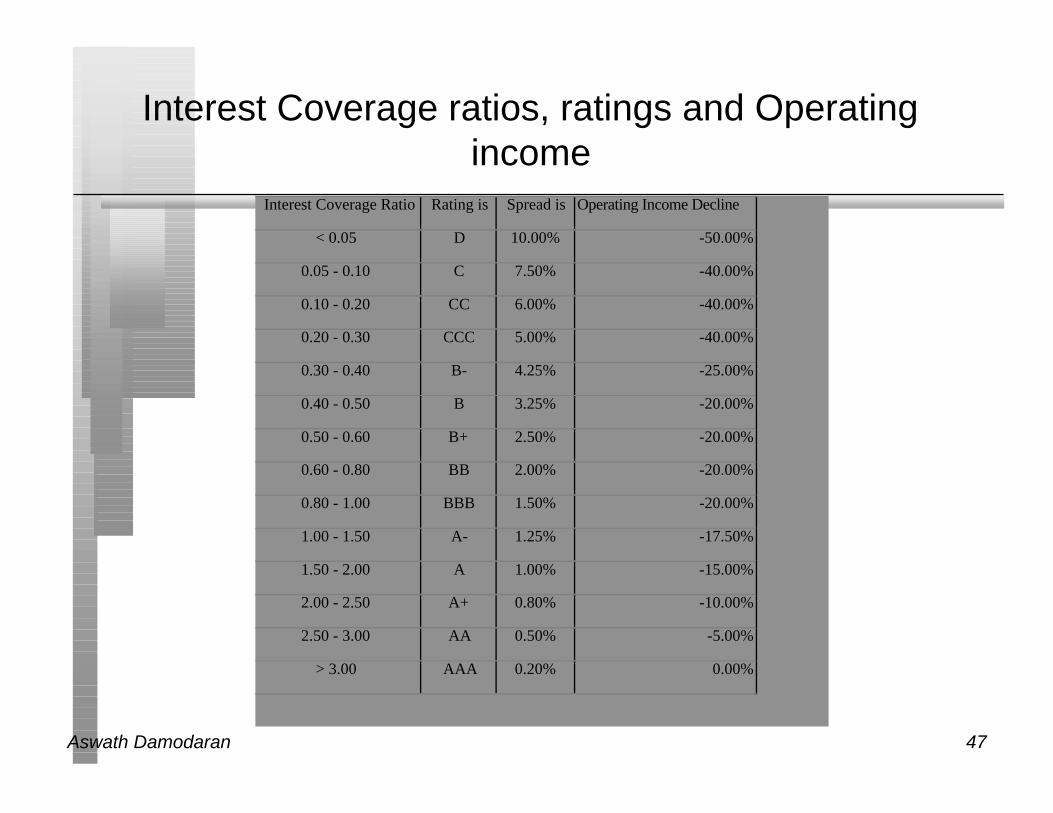
Interest Coverage ratios, ratings and Operatingincome
Interest Coverage Ratio Rating is Spread is Operating Income Decline
< 0.05 D 10.00% -50.00%
0.05 - 0.10 C 7.50% -40.00%
0.10 - 0.20 CC 6.00% -40.00%
0.20 - 0.30 CCC 5.00% -40.00%
0.30 - 0.40 B- 4.25% -25.00%
0.40 - 0.50 B 3.25% -20.00%
0.50 - 0.60 B+ 2.50% -20.00%
0.60 - 0.80 BB 2.00% -20.00%
0.80 - 1.00 BBB 1.50% -20.00%
1.00 - 1.50 A- 1.25% -17.50%
1.50 - 2.00 A 1.00% -15.00%
2.00 - 2.50 A+ 0.80% -10.00%
2.50 - 3.00 AA 0.50% -5.00%
> 3.00 AAA 0.20% 0.00%
Aswath Damodaran 48
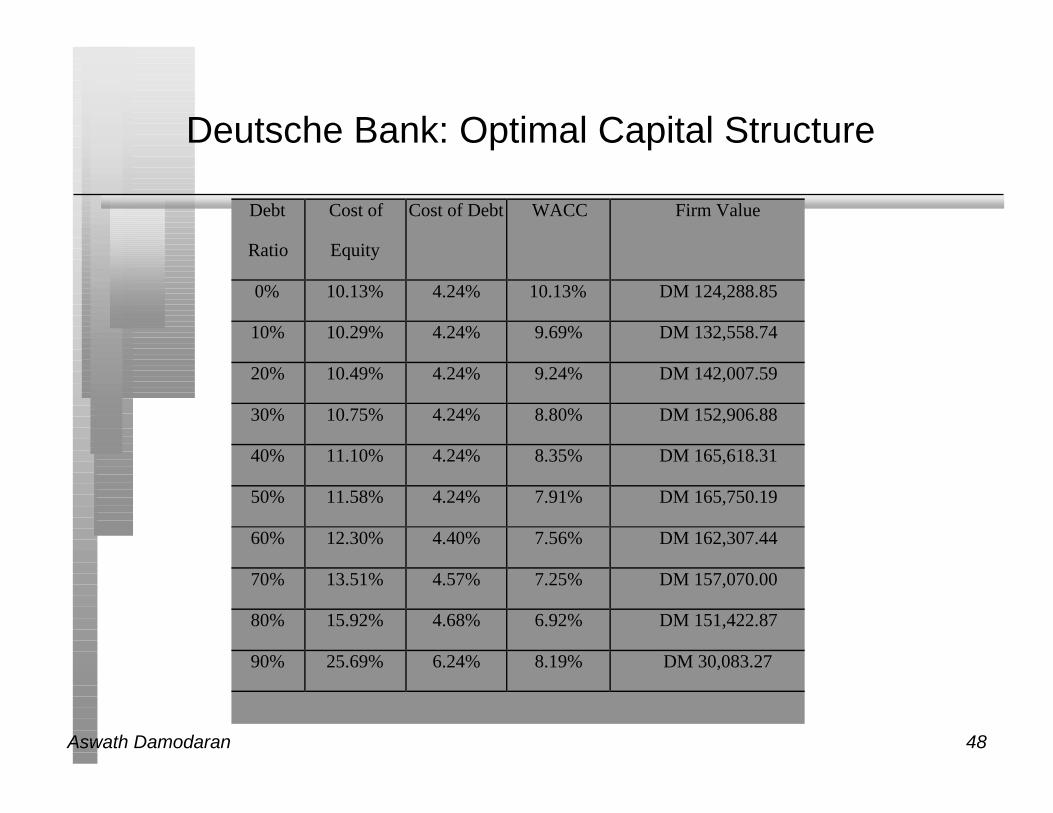
Deutsche Bank: Optimal Capital Structure
Debt
Ratio
Cost of
Equity
Cost of Debt WACC Firm Value
0% 10.13% 4.24% 10.13% DM 124,288.85
10% 10.29% 4.24% 9.69% DM 132,558.74
20% 10.49% 4.24% 9.24% DM 142,007.59
30% 10.75% 4.24% 8.80% DM 152,906.88
40% 11.10% 4.24% 8.35% DM 165,618.31
50% 11.58% 4.24% 7.91% DM 165,750.19
60% 12.30% 4.40% 7.56% DM 162,307.44
70% 13.51% 4.57% 7.25% DM 157,070.00
80% 15.92% 4.68% 6.92% DM 151,422.87
90% 25.69% 6.24% 8.19% DM 30,083.27
Aswath Damodaran 49
Analyzing Companies after Abnormal Years
n The operating income that should be used to arrive at an optimal debtratio is a “normalized” operating income
n A normalized operating income is the income that this firm wouldmake in a normal year.• For a cyclical firm, this may mean using the average operating income
over an economic cycle rather than the latest year’s income
• For a firm which has had an exceptionally bad or good year (due to somefirm-specific event), this may mean using industry average returns oncapital to arrive at an optimal or looking at past years
• For any firm, this will mean not counting one time charges or profits
Aswath Damodaran 50
Analyzing Aracruz Cellulose’s Optimal DebtRatio
n In 1996, Aracruz had earnings before interest and taxes of only 15million BR, and claimed depreciation of 190 million Br. Capitalexpenditures amounted to 250 million BR.
n Aracruz had debt outstanding of 1520 million BR. While the nominalrate on this debt, especially the portion that is in Brazilian Real, ishigh, we will continue to do the analysis in real terms, and use acurrent real cost of debt of 5.5%, which is based upon a real riskfreerate of 5% and a default spread of 0.5%.
n The corporate tax rate in Brazil is estimated to be 32%.
n Aracruz had 976.10 million shares outstanding, trading 2.05 BR pershare. The beta of the stock is estimated, using comparable firms, to be0.71.
Aswath Damodaran 51
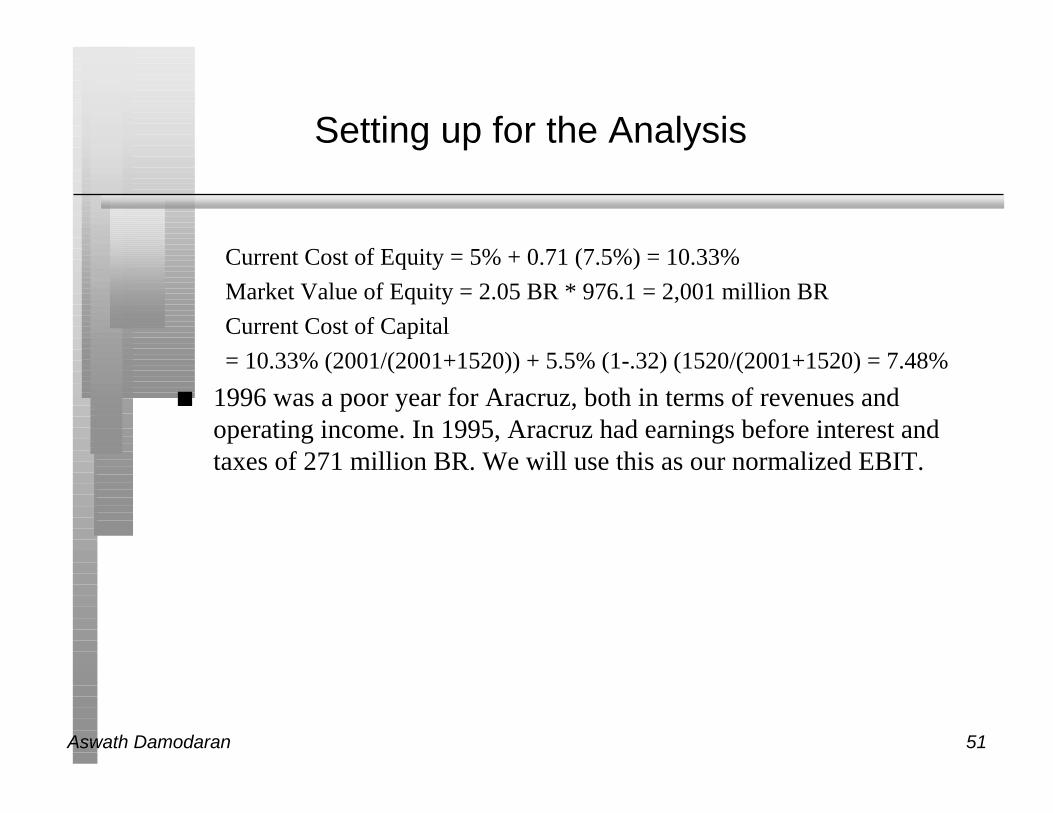
Setting up for the Analysis
Current Cost of Equity = 5% + 0.71 (7.5%) = 10.33%
Market Value of Equity = 2.05 BR * 976.1 = 2,001 million BR
Current Cost of Capital
= 10.33% (2001/(2001+1520)) + 5.5% (1-.32) (1520/(2001+1520) = 7.48%
n 1996 was a poor year for Aracruz, both in terms of revenues andoperating income. In 1995, Aracruz had earnings before interest andtaxes of 271 million BR. We will use this as our normalized EBIT.
Aswath Damodaran 52
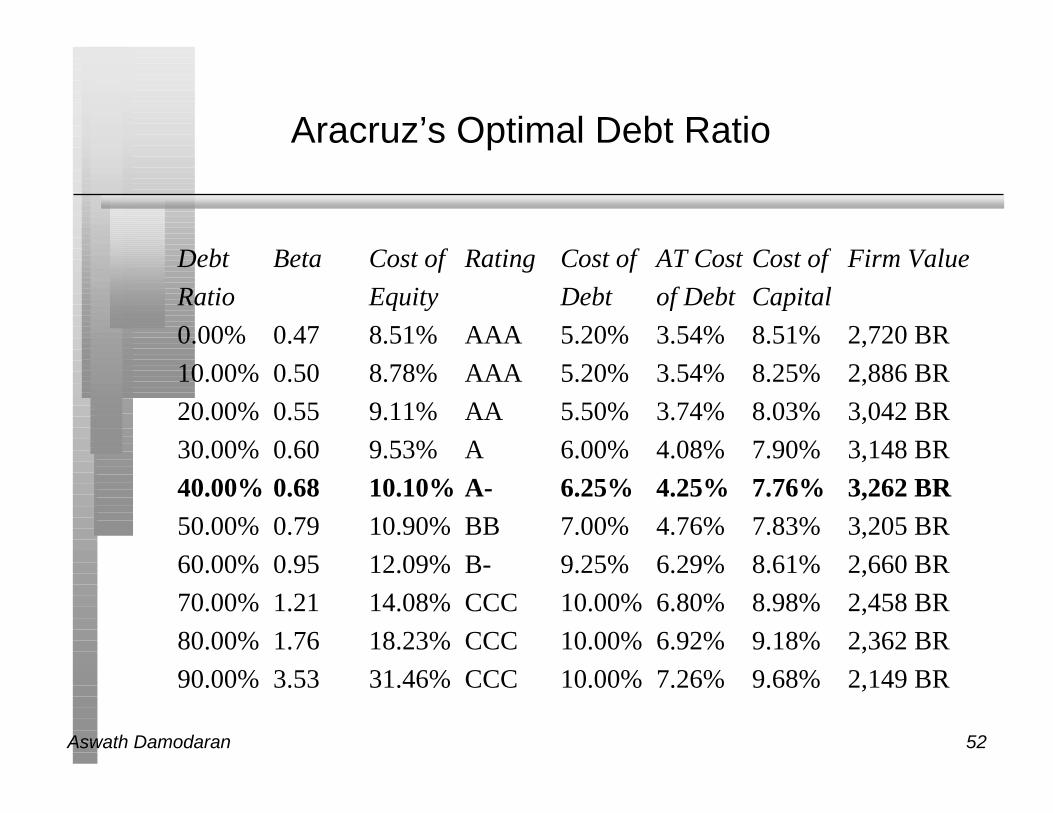
Aracruz’s Optimal Debt Ratio
Debt Beta Cost of Rating Cost of AT Cost Cost of Firm Value
Ratio Equity Debt of Debt Capital
0.00% 0.47 8.51% AAA 5.20% 3.54% 8.51% 2,720 BR
10.00% 0.50 8.78% AAA 5.20% 3.54% 8.25% 2,886 BR
20.00% 0.55 9.11% AA 5.50% 3.74% 8.03% 3,042 BR
30.00% 0.60 9.53% A 6.00% 4.08% 7.90% 3,148 BR
40.00% 0.68 10.10% A- 6.25% 4.25% 7.76% 3,262 BR50.00% 0.79 10.90% BB 7.00% 4.76% 7.83% 3,205 BR
60.00% 0.95 12.09% B- 9.25% 6.29% 8.61% 2,660 BR
70.00% 1.21 14.08% CCC 10.00% 6.80% 8.98% 2,458 BR
80.00% 1.76 18.23% CCC 10.00% 6.92% 9.18% 2,362 BR
90.00% 3.53 31.46% CCC 10.00% 7.26% 9.68% 2,149 BR
Aswath Damodaran 53
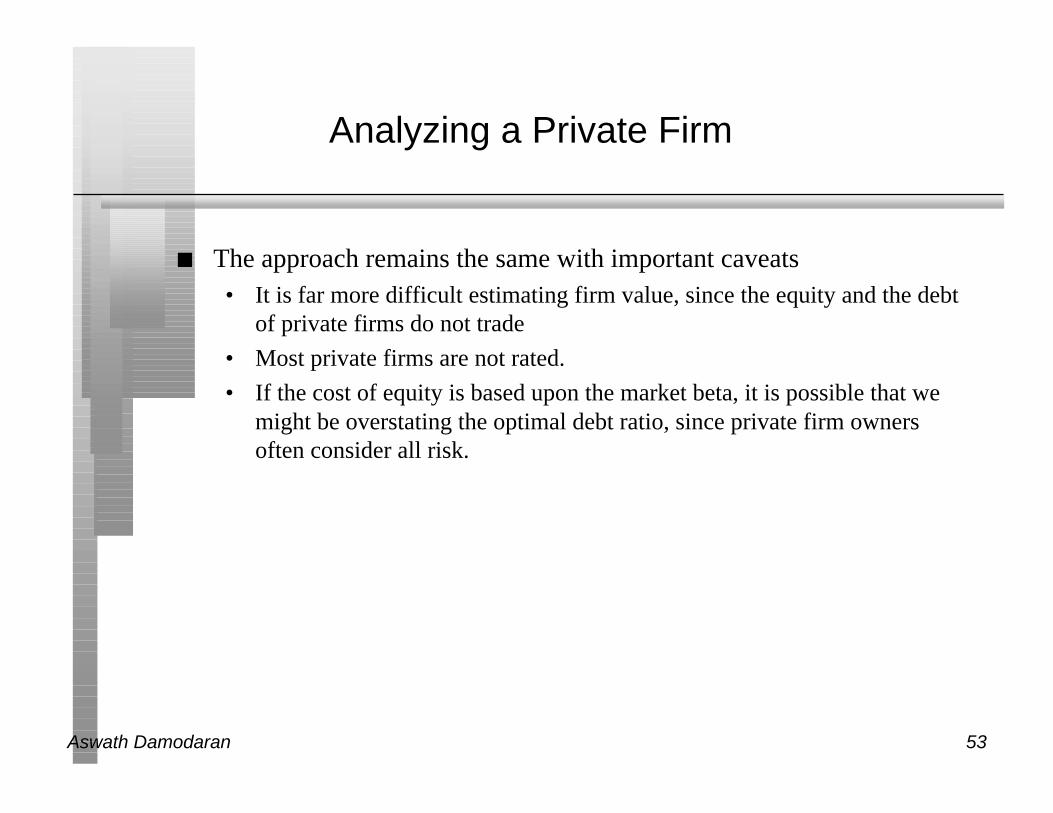
Analyzing a Private Firm
n The approach remains the same with important caveats• It is far more difficult estimating firm value, since the equity and the debt
of private firms do not trade
• Most private firms are not rated.
• If the cost of equity is based upon the market beta, it is possible that wemight be overstating the optimal debt ratio, since private firm ownersoften consider all risk.
Aswath Damodaran 54
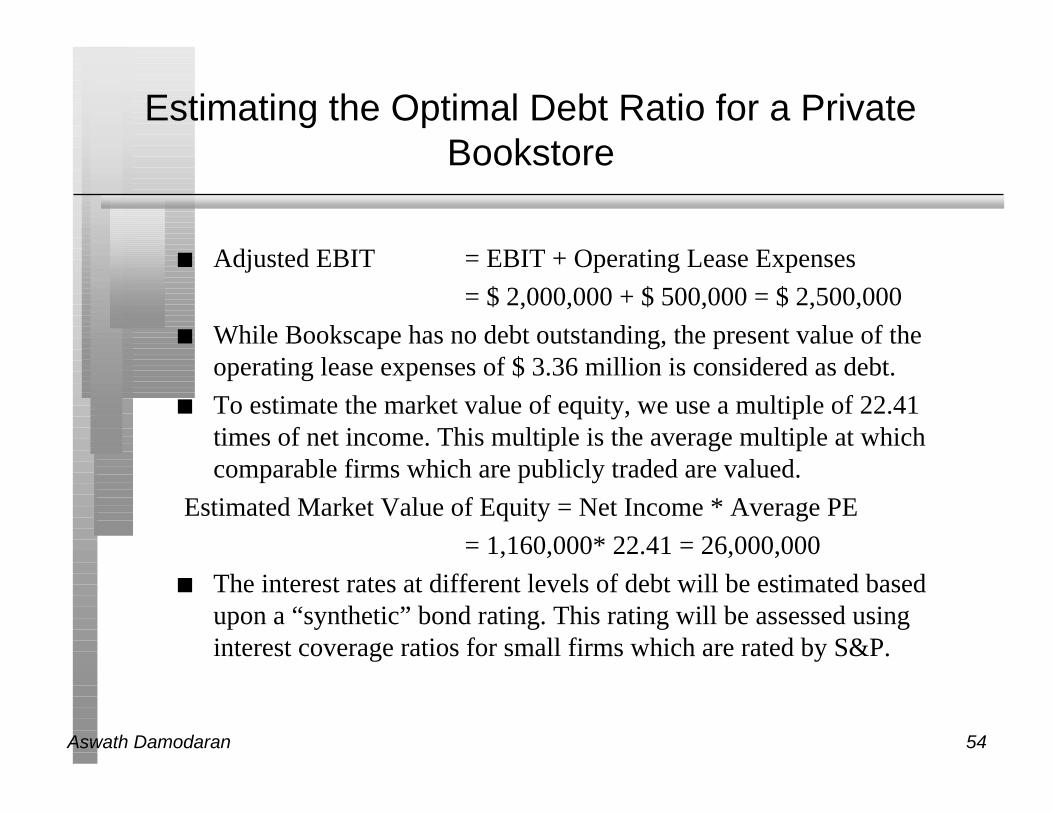
Estimating the Optimal Debt Ratio for a PrivateBookstore
n Adjusted EBIT = EBIT + Operating Lease Expenses
= $ 2,000,000 + $ 500,000 = $ 2,500,000
n While Bookscape has no debt outstanding, the present value of theoperating lease expenses of $ 3.36 million is considered as debt.
n To estimate the market value of equity, we use a multiple of 22.41times of net income. This multiple is the average multiple at whichcomparable firms which are publicly traded are valued.
Estimated Market Value of Equity = Net Income * Average PE
= 1,160,000* 22.41 = 26,000,000
n The interest rates at different levels of debt will be estimated basedupon a “synthetic” bond rating. This rating will be assessed usinginterest coverage ratios for small firms which are rated by S&P.
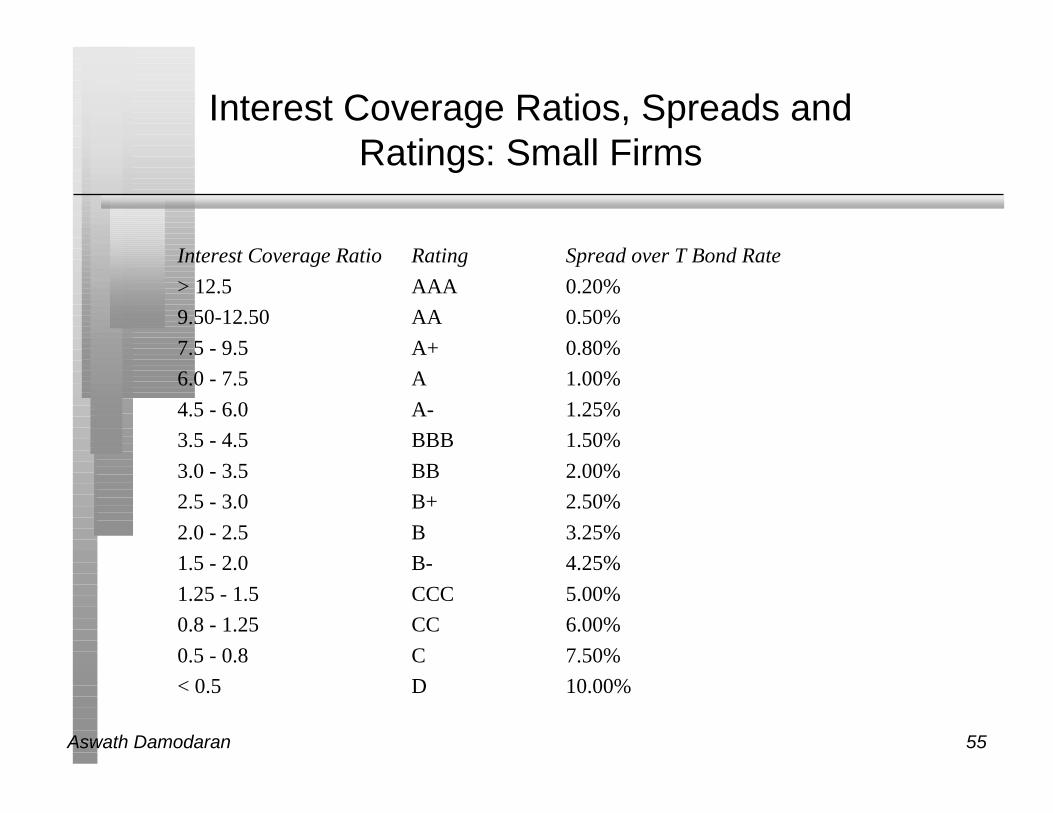
Aswath Damodaran 55
Interest Coverage Ratios, Spreads andRatings: Small Firms
Interest Coverage Ratio Rating Spread over T Bond Rate
> 12.5 AAA 0.20%
9.50-12.50 AA 0.50%
7.5 - 9.5 A+ 0.80%
6.0 - 7.5 A 1.00%
4.5 - 6.0 A- 1.25%
3.5 - 4.5 BBB 1.50%
3.0 - 3.5 BB 2.00%
2.5 - 3.0 B+ 2.50%
2.0 - 2.5 B 3.25%
1.5 - 2.0 B- 4.25%
1.25 - 1.5 CCC 5.00%
0.8 - 1.25 CC 6.00%
0.5 - 0.8 C 7.50%
< 0.5 D 10.00%
Aswath Damodaran 56
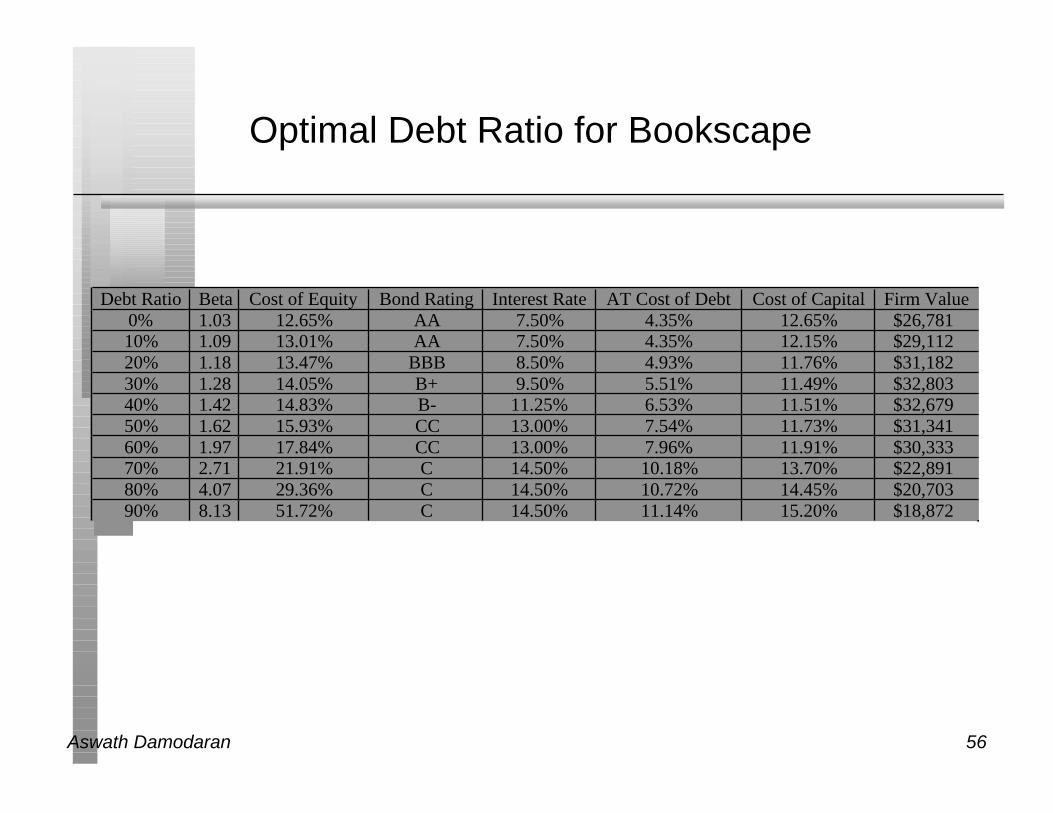
Optimal Debt Ratio for Bookscape
Debt Ratio Beta Cost of Equity Bond Rating Interest Rate AT Cost of Debt Cost of Capital Firm Value0% 1.03 12.65% AA 7.50% 4.35% 12.65% $26,78110% 1.09 13.01% AA 7.50% 4.35% 12.15% $29,11220% 1.18 13.47% BBB 8.50% 4.93% 11.76% $31,18230% 1.28 14.05% B+ 9.50% 5.51% 11.49% $32,80340% 1.42 14.83% B- 11.25% 6.53% 11.51% $32,67950% 1.62 15.93% CC 13.00% 7.54% 11.73% $31,34160% 1.97 17.84% CC 13.00% 7.96% 11.91% $30,33370% 2.71 21.91% C 14.50% 10.18% 13.70% $22,89180% 4.07 29.36% C 14.50% 10.72% 14.45% $20,70390% 8.13 51.72% C 14.50% 11.14% 15.20% $18,872
Aswath Damodaran 57
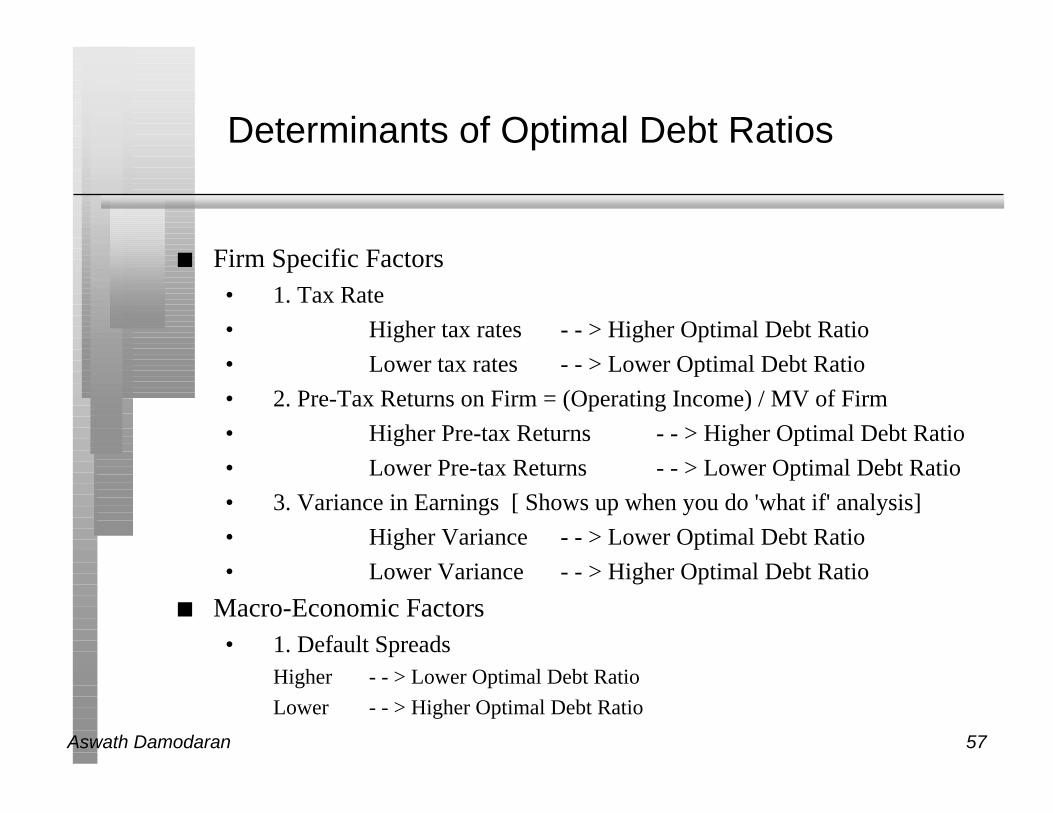
Determinants of Optimal Debt Ratios
n Firm Specific Factors• 1. Tax Rate
• Higher tax rates - - > Higher Optimal Debt Ratio
• Lower tax rates - - > Lower Optimal Debt Ratio
• 2. Pre-Tax Returns on Firm = (Operating Income) / MV of Firm
• Higher Pre-tax Returns - - > Higher Optimal Debt Ratio
• Lower Pre-tax Returns - - > Lower Optimal Debt Ratio
• 3. Variance in Earnings [ Shows up when you do 'what if' analysis]
• Higher Variance - - > Lower Optimal Debt Ratio
• Lower Variance - - > Higher Optimal Debt Ratio
n Macro-Economic Factors• 1. Default Spreads
Higher - - > Lower Optimal Debt Ratio
Lower - - > Higher Optimal Debt Ratio
Aswath Damodaran 58
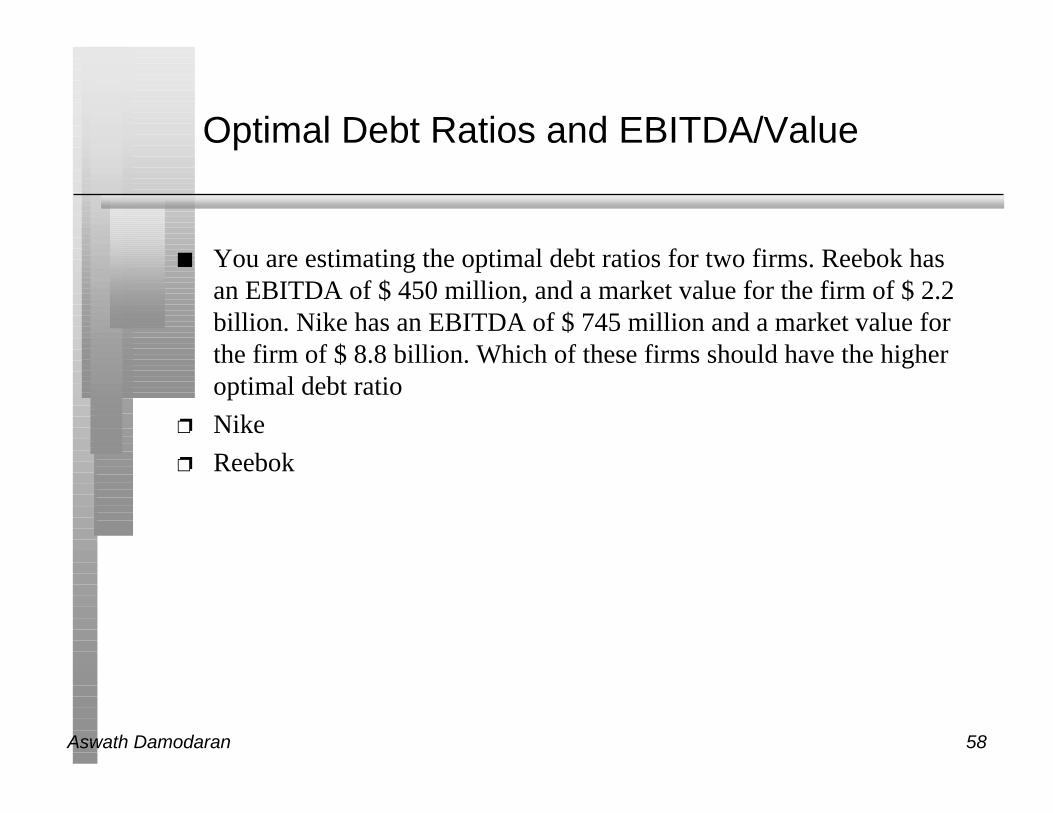
Optimal Debt Ratios and EBITDA/Value
n You are estimating the optimal debt ratios for two firms. Reebok hasan EBITDA of $ 450 million, and a market value for the firm of $ 2.2billion. Nike has an EBITDA of $ 745 million and a market value forthe firm of $ 8.8 billion. Which of these firms should have the higheroptimal debt ratio
p Nike
p Reebok
Aswath Damodaran 59
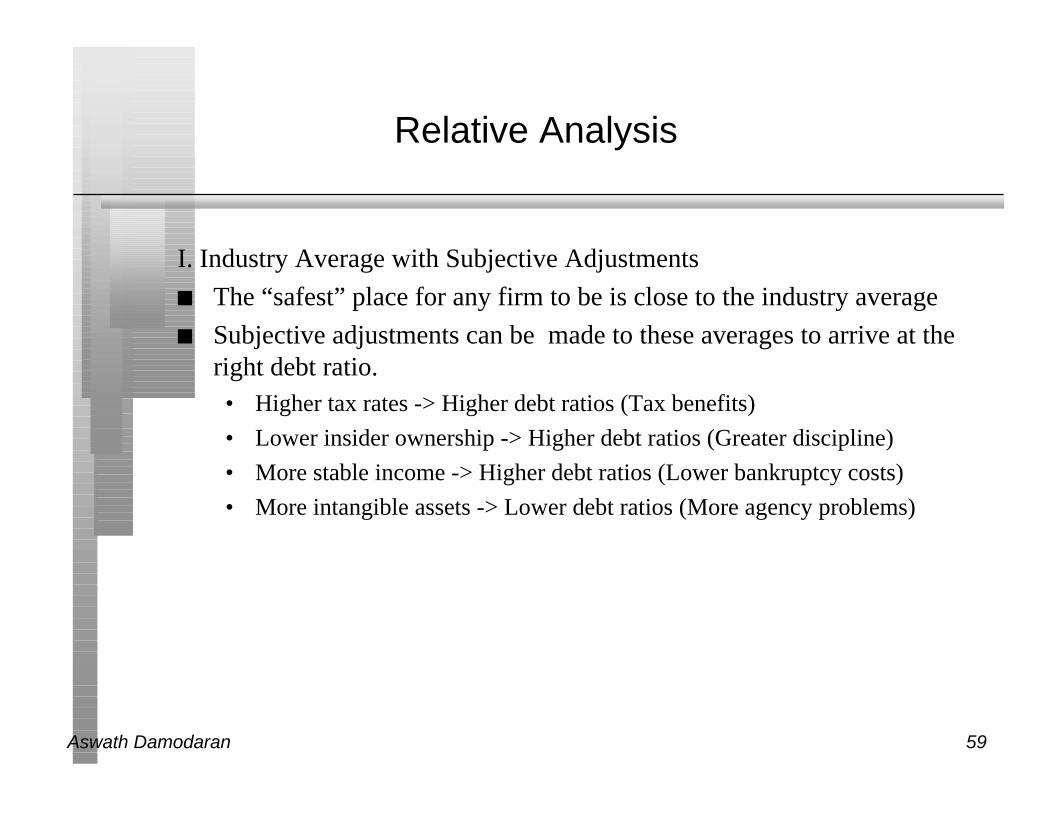
Relative Analysis
I. Industry Average with Subjective Adjustments
n The “safest” place for any firm to be is close to the industry average
n Subjective adjustments can be made to these averages to arrive at theright debt ratio.• Higher tax rates -> Higher debt ratios (Tax benefits)
• Lower insider ownership -> Higher debt ratios (Greater discipline)
• More stable income -> Higher debt ratios (Lower bankruptcy costs)
• More intangible assets -> Lower debt ratios (More agency problems)
Aswath Damodaran 60
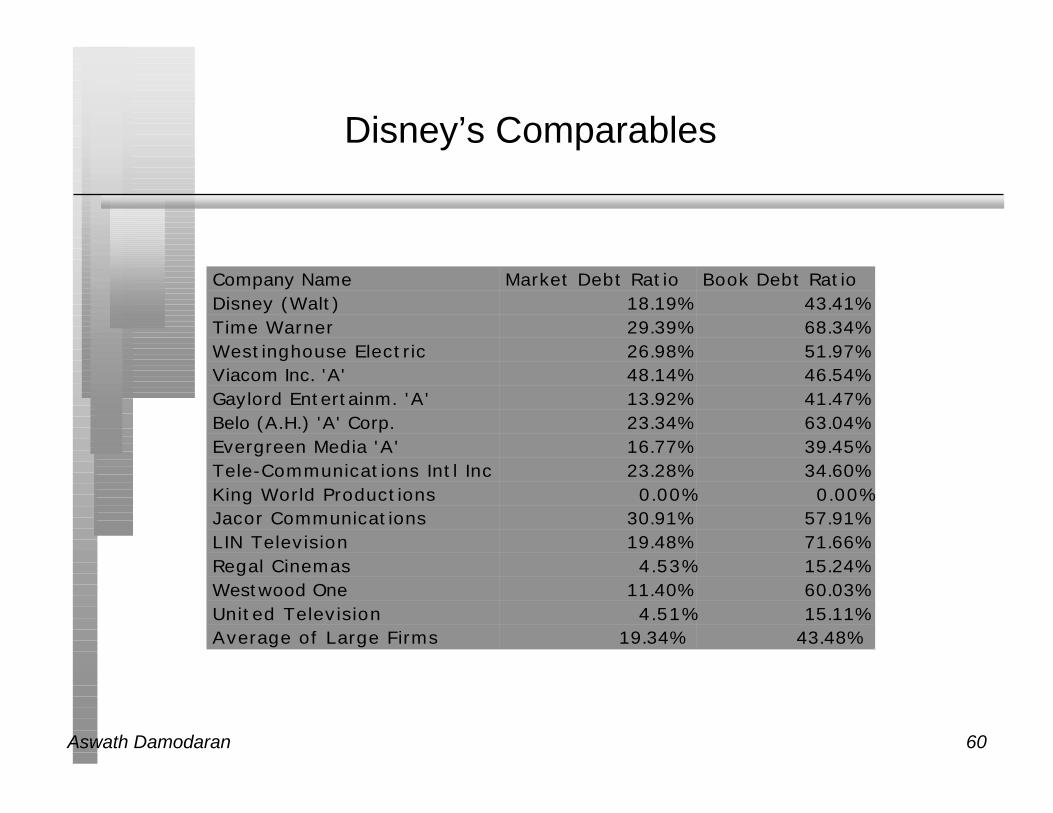
Disney’s Comparables
Company Name Market Debt Ratio Book Debt RatioDisney (Walt) 18.19% 43.41%Time Warner 29.39% 68.34%Westinghouse Electric 26.98% 51.97%Viacom Inc. 'A' 48.14% 46.54%Gaylord Entertainm. 'A' 13.92% 41.47%Belo (A.H.) 'A' Corp. 23.34% 63.04%Evergreen Media 'A' 16.77% 39.45%Tele-Communications Intl Inc 23.28% 34.60%King World Productions 0.00% 0.00%Jacor Communications 30.91% 57.91%LIN Television 19.48% 71.66%Regal Cinemas 4.53% 15.24%Westwood One 11.40% 60.03%United Television 4.51% 15.11%Average of Large Firms 19.34% 43.48%
Aswath Damodaran 61
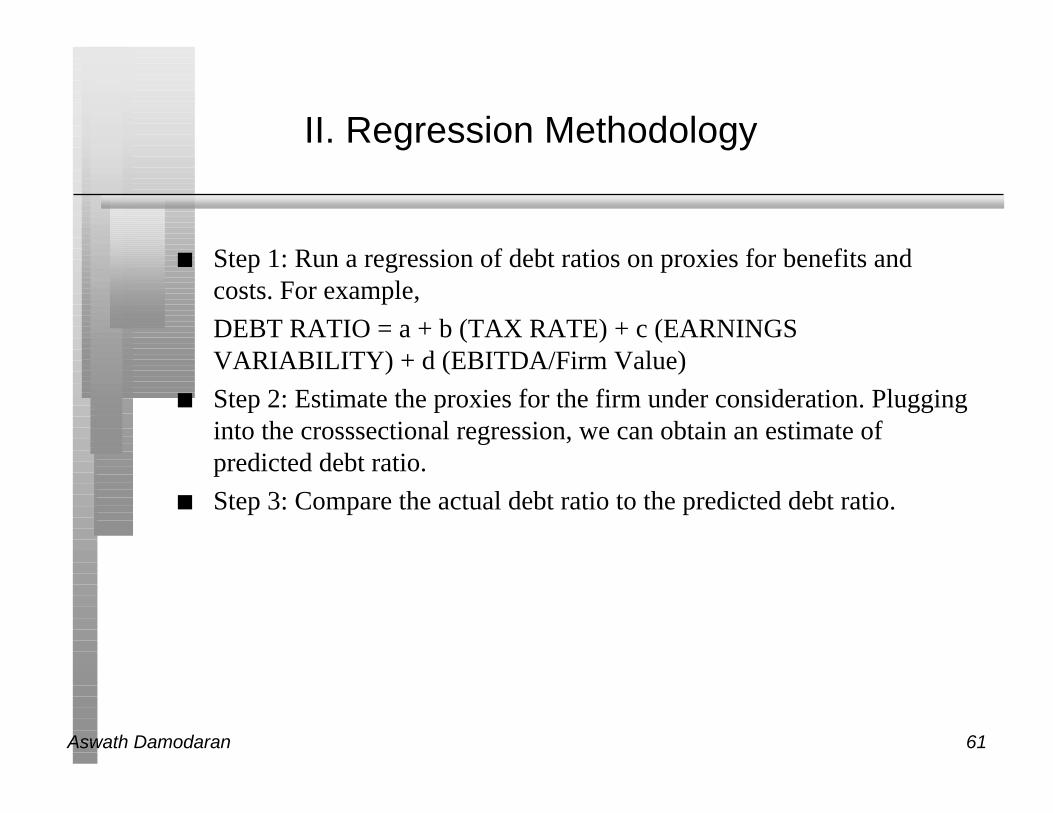
II. Regression Methodology
n Step 1: Run a regression of debt ratios on proxies for benefits andcosts. For example,
DEBT RATIO = a + b (TAX RATE) + c (EARNINGSVARIABILITY) + d (EBITDA/Firm Value)
n Step 2: Estimate the proxies for the firm under consideration. Plugginginto the crosssectional regression, we can obtain an estimate ofpredicted debt ratio.
n Step 3: Compare the actual debt ratio to the predicted debt ratio.
Aswath Damodaran 62
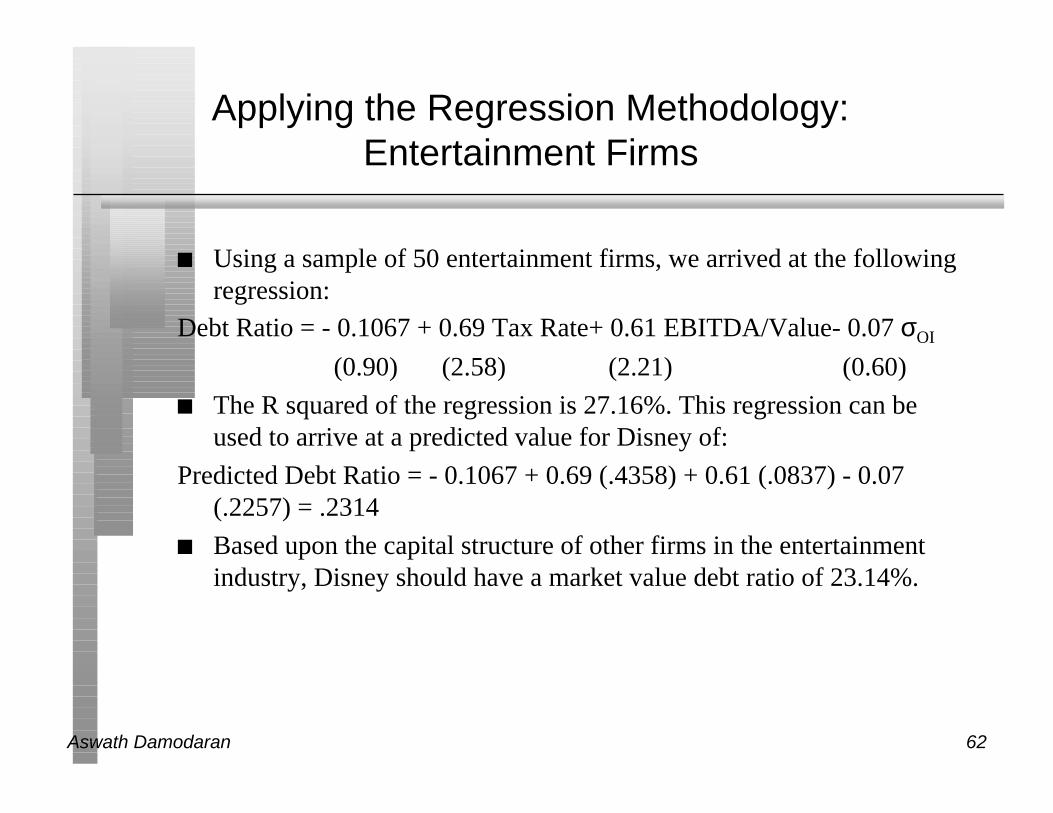
Applying the Regression Methodology:Entertainment Firms
n Using a sample of 50 entertainment firms, we arrived at the followingregression:
Debt Ratio = - 0.1067 + 0.69 Tax Rate+ 0.61 EBITDA/Value- 0.07 σOI
(0.90) (2.58) (2.21) (0.60)
n The R squared of the regression is 27.16%. This regression can beused to arrive at a predicted value for Disney of:
Predicted Debt Ratio = - 0.1067 + 0.69 (.4358) + 0.61 (.0837) - 0.07(.2257) = .2314
n Based upon the capital structure of other firms in the entertainmentindustry, Disney should have a market value debt ratio of 23.14%.
Aswath Damodaran 63
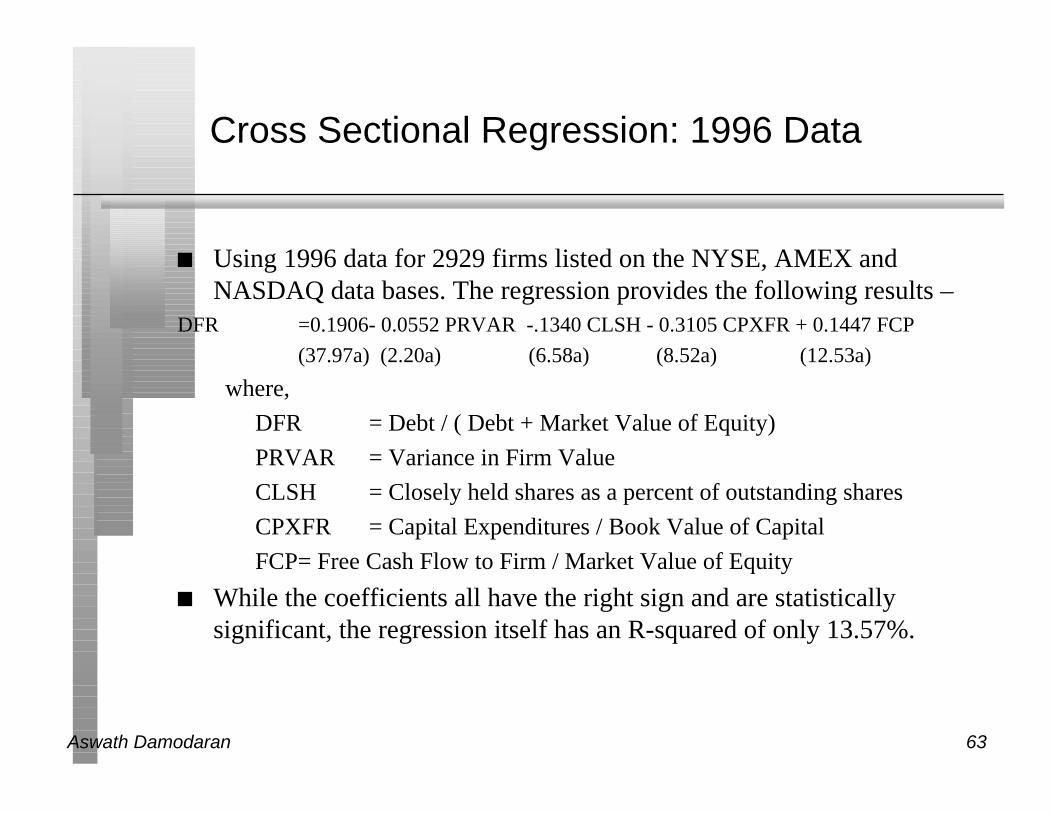
Cross Sectional Regression: 1996 Data
n Using 1996 data for 2929 firms listed on the NYSE, AMEX andNASDAQ data bases. The regression provides the following results –
DFR =0.1906- 0.0552 PRVAR -.1340 CLSH - 0.3105 CPXFR + 0.1447 FCP
(37.97a) (2.20a) (6.58a) (8.52a) (12.53a)
where,
DFR = Debt / ( Debt + Market Value of Equity)
PRVAR = Variance in Firm Value
CLSH = Closely held shares as a percent of outstanding shares
CPXFR = Capital Expenditures / Book Value of Capital
FCP= Free Cash Flow to Firm / Market Value of Equity
n While the coefficients all have the right sign and are statisticallysignificant, the regression itself has an R-squared of only 13.57%.
Aswath Damodaran 64
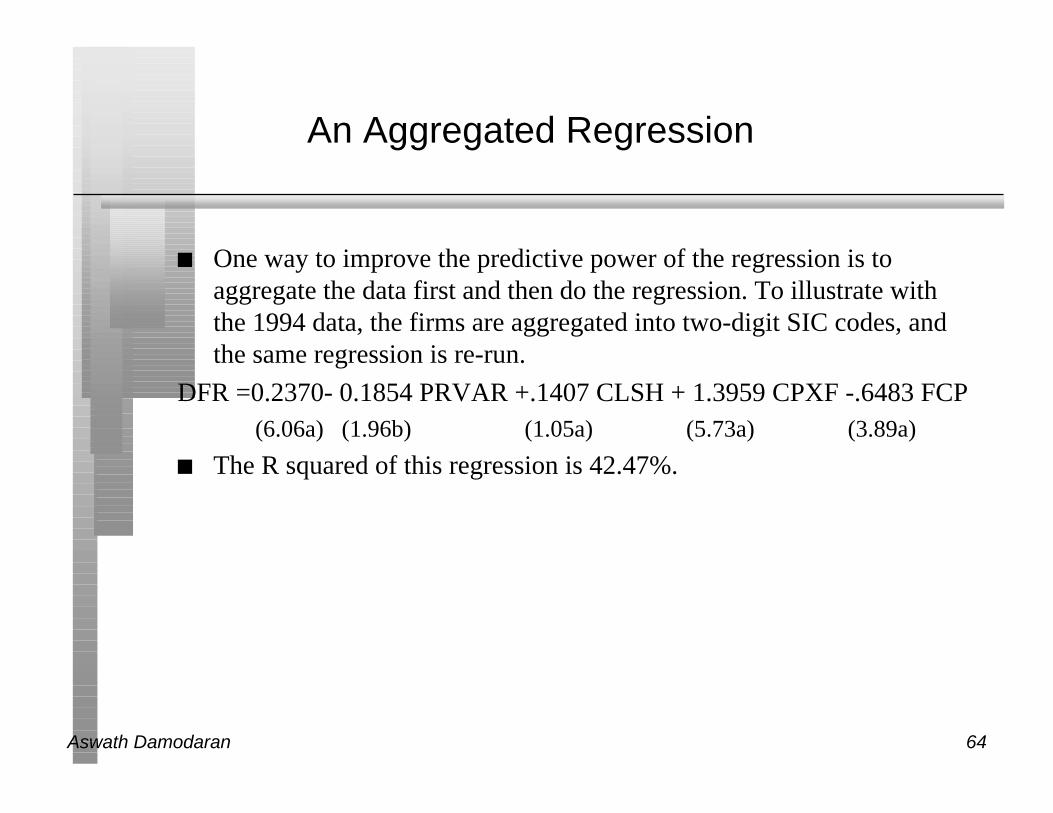
An Aggregated Regression
n One way to improve the predictive power of the regression is toaggregate the data first and then do the regression. To illustrate withthe 1994 data, the firms are aggregated into two-digit SIC codes, andthe same regression is re-run.
DFR =0.2370- 0.1854 PRVAR +.1407 CLSH + 1.3959 CPXF -.6483 FCP(6.06a) (1.96b) (1.05a) (5.73a) (3.89a)
n The R squared of this regression is 42.47%.
Aswath Damodaran 65
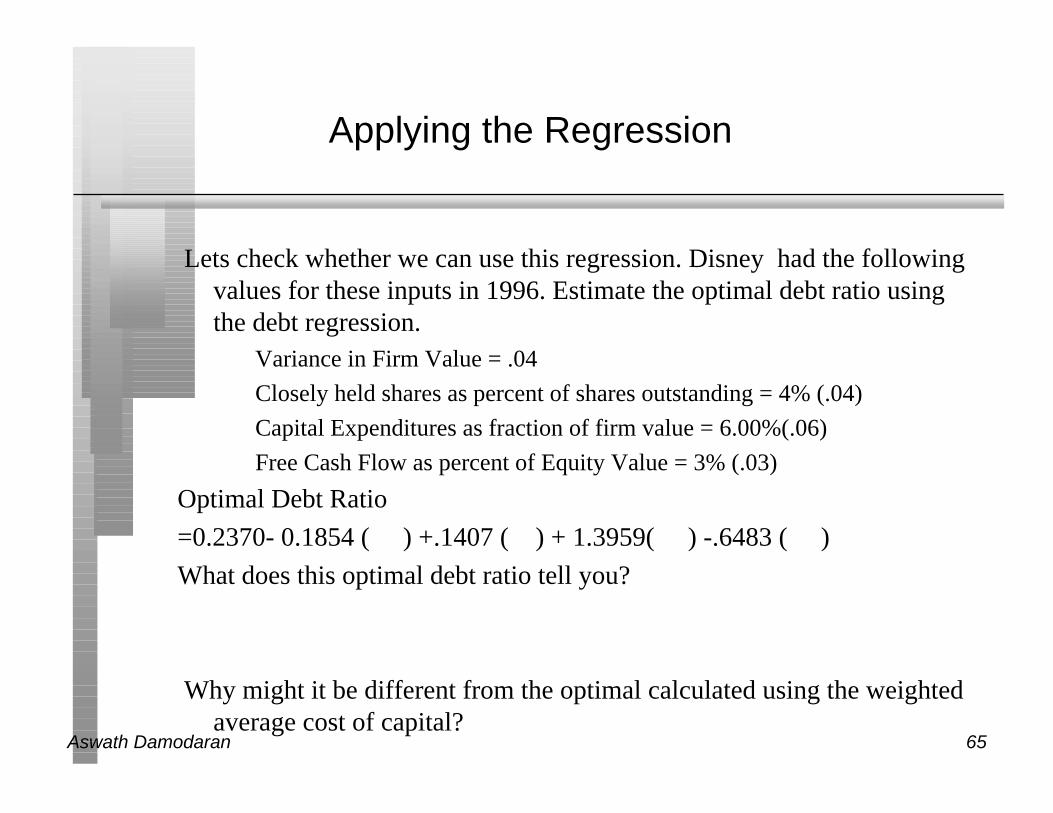
Applying the Regression
Lets check whether we can use this regression. Disney had the followingvalues for these inputs in 1996. Estimate the optimal debt ratio usingthe debt regression.
Variance in Firm Value = .04
Closely held shares as percent of shares outstanding = 4% (.04)
Capital Expenditures as fraction of firm value = 6.00%(.06)
Free Cash Flow as percent of Equity Value = 3% (.03)
Optimal Debt Ratio
=0.2370- 0.1854 ( ) +.1407 ( ) + 1.3959( ) -.6483 ( )
What does this optimal debt ratio tell you?
Why might it be different from the optimal calculated using the weightedaverage cost of capital?