Embed Size (px)
Citation preview
Finding Spatial Patterns in Network Data?
Roland Heilmann, Daniel A. Keim ??, Christian Panse, Jorn Schneidewind,and Mike Sips
University of Konstanz, Germany{heilmann,keim,panse,schneidewind,sips}@dbvis.inf.uni-konstanz.de
Abstract. Data on modern networks are massive and are applied inthe area of monitoring and analyzing activities at the network element,network-wide, and customer and service levels for a heavily increasingnumber of networks since network technology is used in almost every per-sonal computer. This results in very large log-files containing importantdata about the network behavior such as http accesses, e-mail headers,routing information of backbones, firewall alarms, or messages.Finding interesting patterns in network data is an important task fornetwork analysts and managers to recognize and respond to changingconditions quickly; within minutes when possible. This situation createsnew challenges in coping with scale. Firstly, the analysis of the hugeamounts (usually tera-bytes) of the ever-growing network data in detailand the extraction of interesting knowledge or general characteristicsabout the network behavior is a very difficult task. Secondly, in practice,network data with geographic attributes are involved, and it is oftenimportant to find network patterns involving geo-spatial locations.In this paper we address the problem of finding interesting spatial pat-terns in network data. Sharing ideas and techniques from the patternvisualization and geo–spatial visualization areas can help to solve thisproblem. We provide some examples for effective visualizations of net-work data in a important area of application: the analysis of e-mail traffic.
Keywords: Pattern Visualization, Visualization of Geo-Spatial Data,Visualization and Cartography, Spatial Data Mining
1 Analyzing and Visualizing Massive Geo-SpatialNetwork Data
Nowadays, we have to deal with heavily growing networks since network tech-nology is used in almost every personal computer, cellular phone etc. Data com-munication networks such as the internet connect millions of computers, cellular? This work was partially funded by the Information Society Technologies programme
of the European Commission, Future and Emerging Technologies under the IST-2001-33058 PANDA project (2001-2004).
?? Correspondence: Prof. Dr. Daniel A. Keim, Computer Science Institute, Univer-sitat Konstanz Fach D78, Universitatsstr. 10, D-78457 Konstanz, Germany, Phone:(+49) 7531 88 3161, Fax: (+49) 7531 88 3062
8-2 R. Heilmann, D.A. Keim, C. Panse, J. Schneidewind & M. Sips
phones are used in almost every household, and personal communication net-works are in commonplace.
Consider, for example, global telecommunication networks and its services.A voice network handles more than 250 million calls per day. Each call can bedescribed by at least one event, yielding a total of tens of gigabytes of data daily.This means, however, that more network data than ever before are availabletoday. An understanding of these data at full scale is of crucial importance forthe analysis of the behavior of networks, for managing networks, and improvingtheir performance and reliability from a customers viewpoint. There are manyways to analyze these data, including statistical models and techniques in thearea of graph drawing. Unfortunately, these approaches have not kept step withthe data volumes and often fall short of providing completely satisfactory results.Often, they are not better than simple visualizations of the structure of thenetwork itself.
Finding interesting patterns in network data is an important task for networkanalysts and managers to recognize and respond to changing conditions quickly;within minutes when possible. This situation creates new challenges in copingwith scale. Pattern visualization techniques have become increasingly importantfor achieving this goal. Presenting data in an interactive, graphical form oftenfosters new insights, thereby encouraging the formation and validation of newhypotheses, which lead to better problem-solving and gaining deeper knowledgeof the domain.
In practice, network data with geographic attributes are of particular rele-vance to a large number of applications such as the investigation of the load ofa large number of internet nodes at different locations and of the usage of con-necting nodes in telephone networks, the detection of geo-related bottlenecks inglobal telecommunication networks and of geo-specific fraud in networks. Auto-mated data mining algorithms are indispensable for analyzing large geo-spatialdata sets, but often fail to provide completely satisfactory results. Usually, in-teractive data mining based on a synthesis of automatic and visual data miningtechniques does not only yield better results, but also a higher degree of user sat-isfaction and confidence w.r.t. the findings [4, 5]. Although automatic approacheshave been developed for mining geo-spatial data, they often do not outperformsimple visualizations of the geo-spatial data on a map.
1.1 Network Data
A network consist of nodes, links, and geo-spatial information. Statistics, whichmay be the raw data or data summaries and may vary over time, are associatedwith the nodes and the links. Today, the internet is a network of networks. Itcomprises ten thousands of interconnected networks spanning the globe. Thecomputers which form the internet range from huge mainframes in researchestablishments to modern PCs in people’s home.
All these facts result in massive log-files containing important data about thenetwork behavior. Studying log-files is an important but difficult task. Formally,
Finding Spatial Patterns in Network Data 8-3
Logfile (x,y) Pattern VisualizationIP address
Geo-Locator Database
(x,y)IP
IP (x,y)
(x,y) Location
Geo-Locator
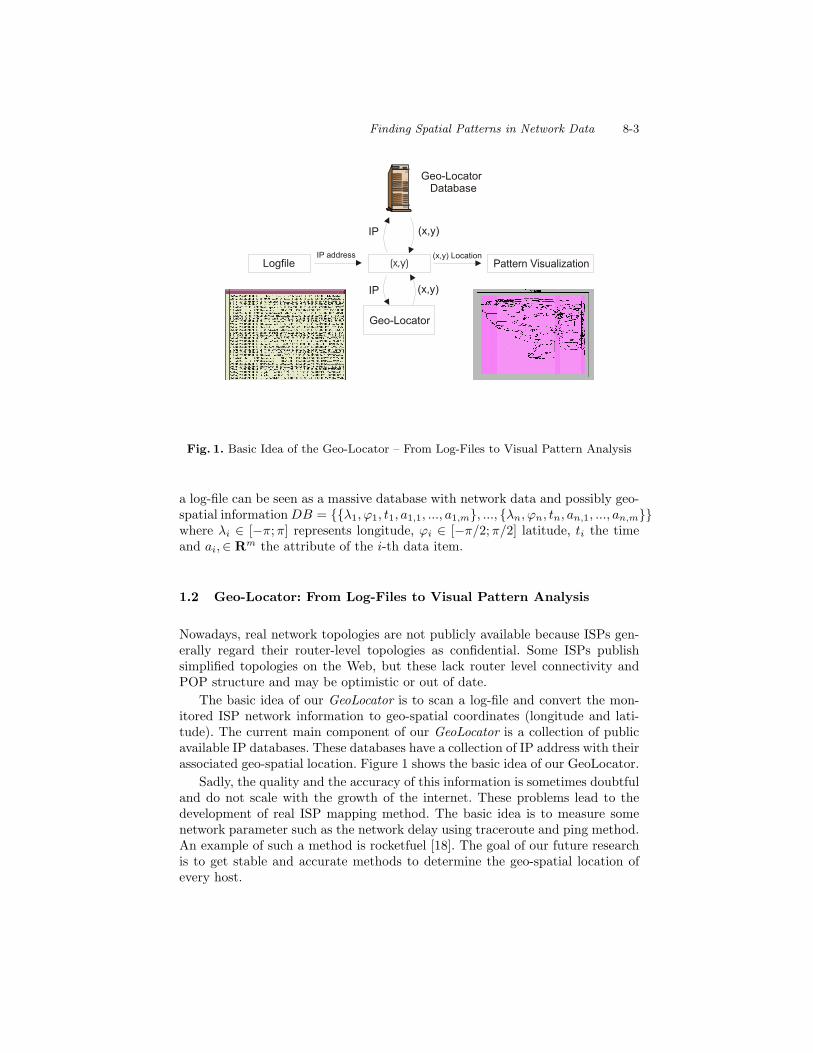
Fig. 1. Basic Idea of the Geo-Locator – From Log-Files to Visual Pattern Analysis
a log-file can be seen as a massive database with network data and possibly geo-spatial information DB = {{λ1, ϕ1, t1, a1,1, ..., a1,m}, ..., {λn, ϕn, tn, an,1, ..., an,m}}where λi ∈ [−π;π] represents longitude, ϕi ∈ [−π/2;π/2] latitude, ti the timeand ai,∈ Rm the attribute of the i-th data item.
1.2 Geo-Locator: From Log-Files to Visual Pattern Analysis
Nowadays, real network topologies are not publicly available because ISPs gen-erally regard their router-level topologies as confidential. Some ISPs publishsimplified topologies on the Web, but these lack router level connectivity andPOP structure and may be optimistic or out of date.
The basic idea of our GeoLocator is to scan a log-file and convert the mon-itored ISP network information to geo-spatial coordinates (longitude and lati-tude). The current main component of our GeoLocator is a collection of publicavailable IP databases. These databases have a collection of IP address with theirassociated geo-spatial location. Figure 1 shows the basic idea of our GeoLocator.
Sadly, the quality and the accuracy of this information is sometimes doubtfuland do not scale with the growth of the internet. These problems lead to thedevelopment of real ISP mapping method. The basic idea is to measure somenetwork parameter such as the network delay using traceroute and ping method.An example of such a method is rocketfuel [18]. The goal of our future researchis to get stable and accurate methods to determine the geo-spatial location ofevery host.
8-4 R. Heilmann, D.A. Keim, C. Panse, J. Schneidewind & M. Sips
1.3 Visualization Challenges
The visualization strategy for geo-spatial data is straightforward. The geo-spatialdata points described by longitude and latitude are displayed on the 2D euclid-ian plain using a 2D projection. The two euclidian plain dimensions x and y aredirectly mapped to the two physical screen dimensions. The resulting visualiza-tion depends on the spatial dimension or extent of the described phenomenaand objects. A nice overview can be found in [13].
The task of geo visualization is to view geo-spatial data and to give insightinto geo-processes and geo-phenomena. One of the challenges today is to findout how to deploy efficient visualization strategies for the representation of geo-spatial data. The major challenges to efficiently visualize geo-spatial data are
Highly non-uniform distribution
Since the geo-spatial locations of the data are highly non-uniformly dis-tributed in a plane, however, the display will usually be sparsely populatedin some regions while, in other regions of the display, a high degree of over-plotting occurs. There are several approaches to cope with dense geo-spatialdata [7, 11, 12].
Overlap/overplot problem
Nowadays, Network Maps are widely used. Some approaches only displaythe structure of networks (usually modeled as graphs) to interpret and un-derstand the general behavior and structure of networks. The goal is to finda good geometric representation of the network on a map. However, the vi-sualization of large networks on maps leads to the problem of overlapping oroverplotting w.r.t. line segments in dense areas.
Highlighting patterns of high importance
Two types of maps, called Thematic Map and Choropleth Map, are usedin cartography and GIS-systems. Thematic Maps are used to emphasize thespatial distribution of one or more geographic attributes. Popular thematicmaps are the Choropleth Map (Greek: choro = area, pleth = value), in whichenumeration units or data collection units are shaded to represent differentmagnitudes of a variable. Often, the statistical values are encoded by coloredregions on the map. For both types of maps, high values are often concen-trated in densely populated areas, and low statistical values are spread oversparsely populated areas. Therefore, these maps tend to highlight patternsin large areas, which, however, may be of low importance.
High dimensionality
Usually network elements contain a high number of working parameters e.g.the load of the system, the number of network packages and of faulty accesses,
Finding Spatial Patterns in Network Data 8-5
or, for the higher OSI-layer, the number of e-mails arrived within a certaintime slot. In this paper, we are going to visualize the score for each senderof an e-mail determined by a spam-filter [15] as SPAM classified e-mail. Ofcourse, these data are characterized by a high number of dimensions andhence are difficult to analyze.
1.4 Connecting Pattern and Geo-Spatial Visualizations
The exploration of large network data sets in order to find interesting spatialpatterns is an important but difficult problem. Our observation is, that singletechniques from the pattern or geo-spatial visualization do not solve the problem.To find spatial patterns, our basic idea is to tightly integrate pattern visualizationtechniques with traditional information visualization techniques (such as parallelcoordinates) and advanced geo-spatial visualization techniques.
1.5 Visual Data Exploration
For the effectiveness of the analysis of large geo-spatial network data sets andfor the extraction of interesting patterns, it is important to include humansin the data exploration process, combining their flexibility, creativity, and do-main knowledge with the storage capacity and computational power of currentcomputer systems. Visual data exploration often follows a three step process:Overview, zoom and filter, and details-on-demand which has been called the In-formation Seeking Mantra [17]. In other words, in the exploratory data analysis(EDA) of a data set, an analyst firstly tries to get an overview. This may revealpotentially interesting patterns or certain subsets of the data that deserve furtherinvestigation. The analyst then focuses on one or more of them by inspectingthe data in more detail.
2 The Scope of Cartogram Techniques for FindingNetwork Patterns
A cartogram can be seen as a generalization of a familiar land-covering choro-pleth map. Here, an arbitrary parameter vector contains the intended sizes ofthe cartogram’s regions Hence, a familiar land-covering choropleth map is sim-ply a cartogram with sizes proportional to land area. In addition to the classicalapplications mentioned above, a key motivation for cartograms as a general in-formation visualization technique is to have a method for trading off shape andarea adjustments. For example, in a conventional choropleth map, high valuesare often concentrated in highly populated areas, and low values may be spreadacross sparsely populated areas. Therefore, such maps tend to highlight patternsin less dense areas where few people live. In contrast, cartograms display areasin relation to an additional parameter, such as population. Patterns may then bedisplayed in proportion to this parameter (e.g. the number of people involved)instead of the raw size of the area involved. Applications include population
8-6 R. Heilmann, D.A. Keim, C. Panse, J. Schneidewind & M. Sips
California
Florida
Illinois
NewJersey
NewMexico
NewYorkPennsylvania
Texas
Washington
Gore Bush
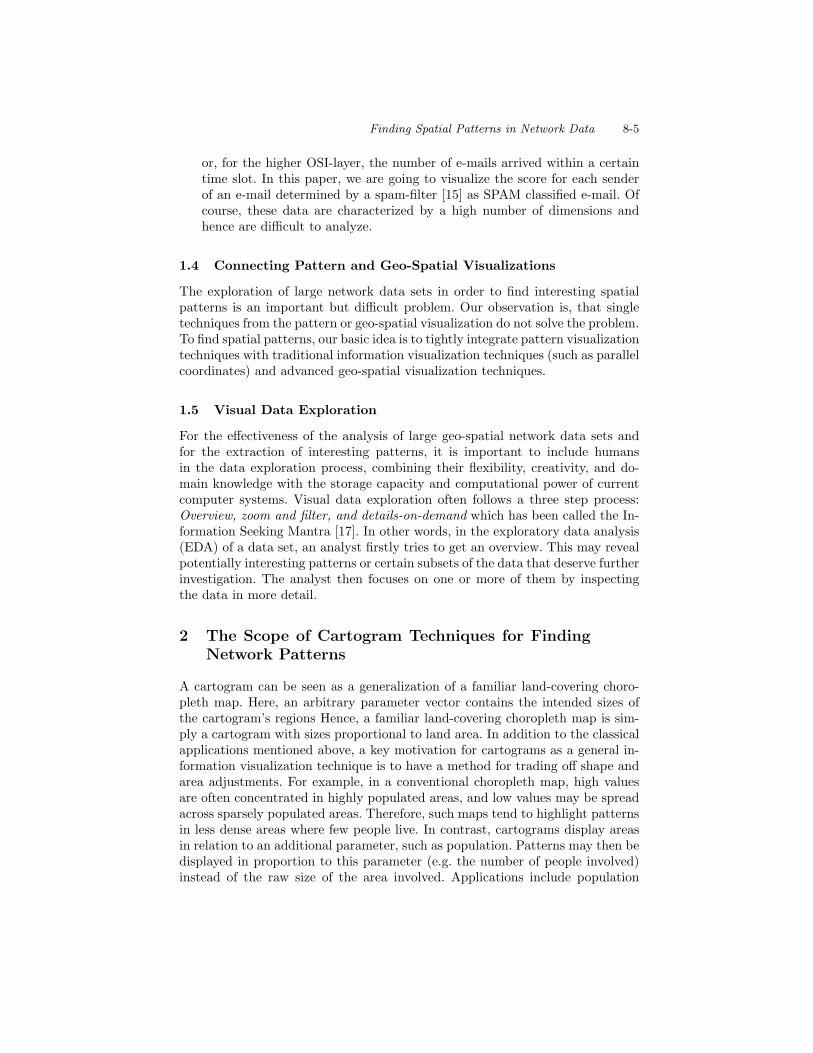
Fig. 2. The Figure displays the U.S. state population cartogram with the presidentialelection result of 2000. The area of the states in the cartograms correspond to theelectoral voters and the color corresponds to the percentage of the votes. A bipolarcolormap depicts which candidate has won each state.
demographics [8, 10, 16, 20], election results [14], and epidemiology [3]. Becausecartograms are difficult to make by hand, the study of automated methods is ofinterest [2].
The basic idea is to compute a distortion of a map w.r.t. to a statistical valueassociated with the network, e.g. the idle time, overload time, or the number ofhosts and other geo-related information such as census demographics (popula-tion, household income). The distortion is coping with dense regions and virtualempty regions on maps and enables us to show more details in potentially inter-esting regions. For example, we can illustrate the connectivity between differentprovider servers in the big cities of the United States.
3 The Scope of Traditional Information VisualizationTechniques for Finding Network Patterns
3.1 Parallel Coordinates
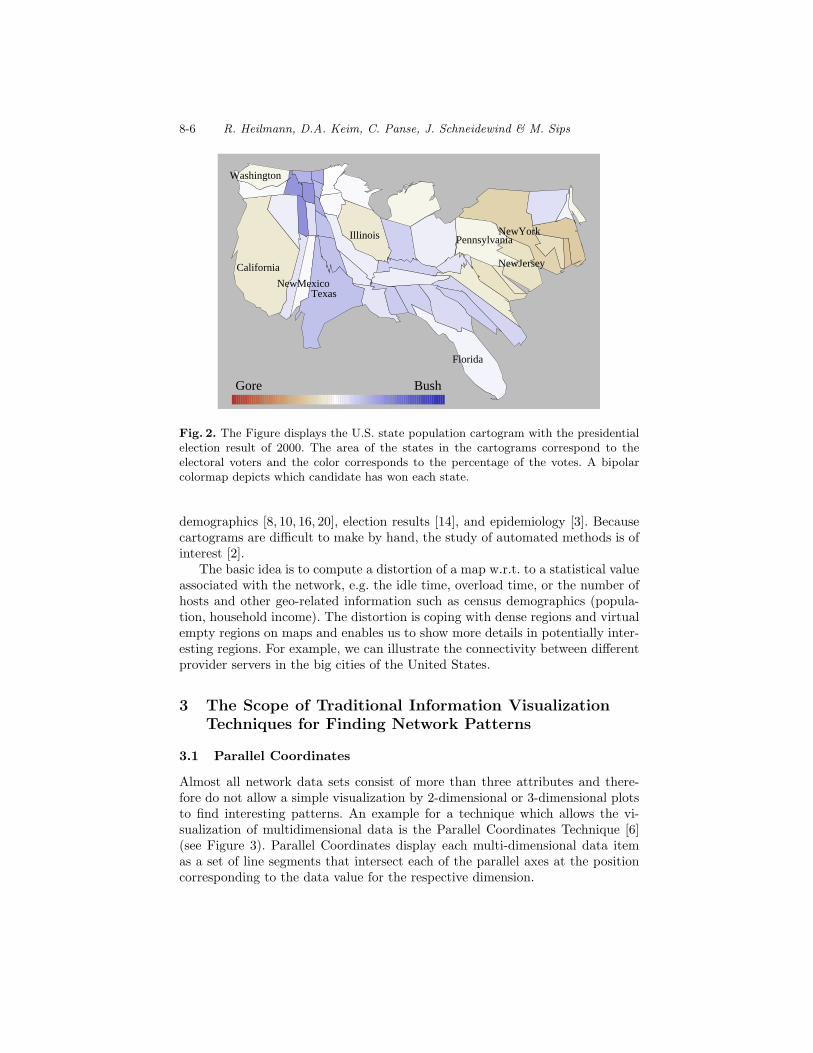
Almost all network data sets consist of more than three attributes and there-fore do not allow a simple visualization by 2-dimensional or 3-dimensional plotsto find interesting patterns. An example for a technique which allows the vi-sualization of multidimensional data is the Parallel Coordinates Technique [6](see Figure 3). Parallel Coordinates display each multi-dimensional data itemas a set of line segments that intersect each of the parallel axes at the positioncorresponding to the data value for the respective dimension.
Finding Spatial Patterns in Network Data 8-7
Comp.1 Comp.2 Comp.3 Comp.4 Comp.5 Comp.6 Comp.7 Comp.8 Comp.9 Comp.10 Comp.11 Comp.12
Fig. 3. The figure displays a sample of 500 SPAM e-mails arrived in 2003. The bipo-lar colormap encodes the Greenwich Mean Time (GMT) and the axis of the parallelcoordinate plot shows 12 attributes of SPAM data (x,y,time zone,Hour,Attr1,Attr2,...)
The parallel coordinate techniques can be used to emphasize network datain such way, that the axis represent longitude, latitude, and other attributes. Inour e-mail traffic analysis example, the parallel coordinates show 12 attributesof SPAM data (x,y,time zone,Hour,Attr1,Attr2,...)
3.2 Level-plot Technique
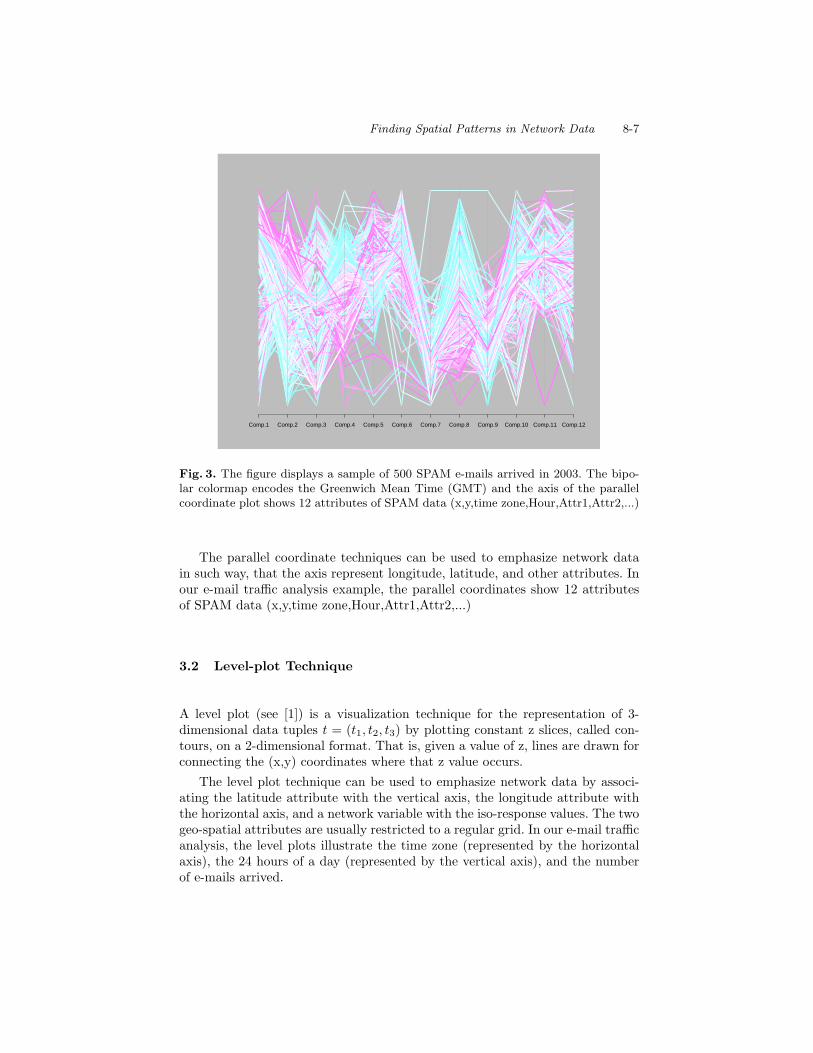
A level plot (see [1]) is a visualization technique for the representation of 3-dimensional data tuples t = (t1, t2, t3) by plotting constant z slices, called con-tours, on a 2-dimensional format. That is, given a value of z, lines are drawn forconnecting the (x,y) coordinates where that z value occurs.
The level plot technique can be used to emphasize network data by associ-ating the latitude attribute with the vertical axis, the longitude attribute withthe horizontal axis, and a network variable with the iso-response values. The twogeo-spatial attributes are usually restricted to a regular grid. In our e-mail trafficanalysis, the level plots illustrate the time zone (represented by the horizontalaxis), the 24 hours of a day (represented by the vertical axis), and the numberof e-mails arrived.
8-8 R. Heilmann, D.A. Keim, C. Panse, J. Schneidewind & M. Sips
Number of e−mails
Time Zone
Gre
enw
ich
Mea
n T
ime
(GM
T)
0
5
10
15
20
−5 0 5 10
1997 1998
−5 0 5 10
1999 2000
2001 2002
−5 0 5 10
2003
−0
−50
−100
−150
−200
−250
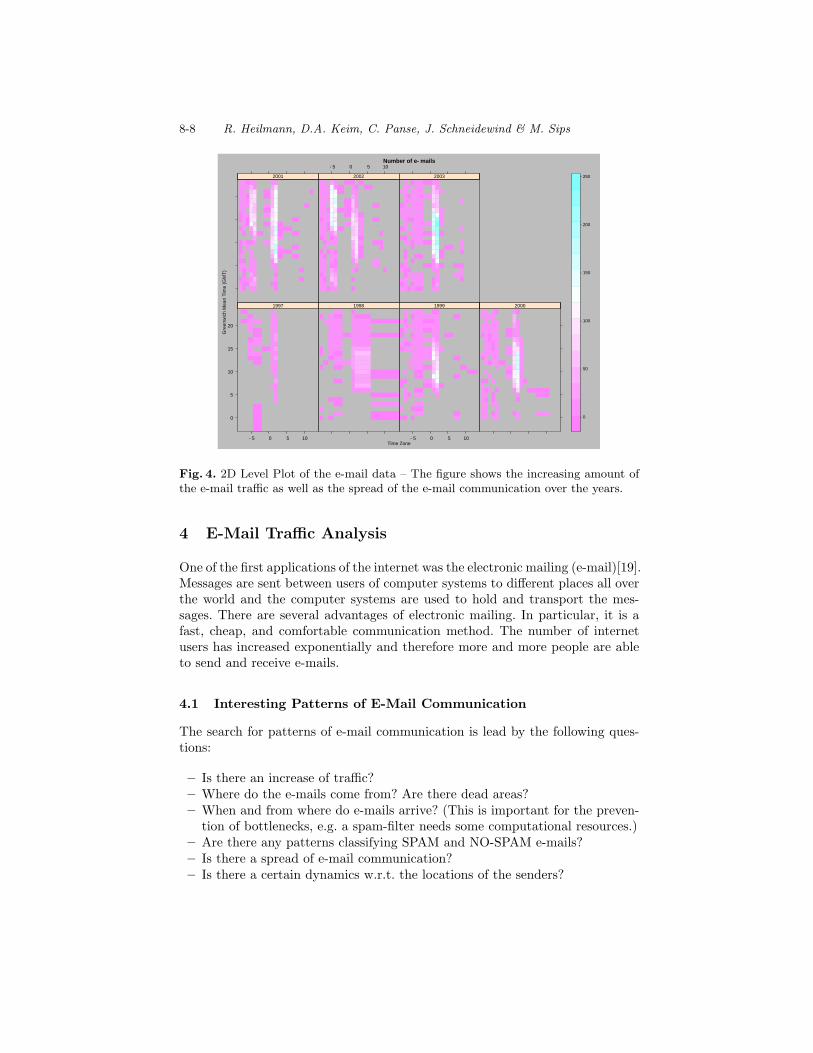
Fig. 4. 2D Level Plot of the e-mail data – The figure shows the increasing amount ofthe e-mail traffic as well as the spread of the e-mail communication over the years.
4 E-Mail Traffic Analysis
One of the first applications of the internet was the electronic mailing (e-mail)[19].Messages are sent between users of computer systems to different places all overthe world and the computer systems are used to hold and transport the mes-sages. There are several advantages of electronic mailing. In particular, it is afast, cheap, and comfortable communication method. The number of internetusers has increased exponentially and therefore more and more people are ableto send and receive e-mails.
4.1 Interesting Patterns of E-Mail Communication
The search for patterns of e-mail communication is lead by the following ques-tions:
– Is there an increase of traffic?– Where do the e-mails come from? Are there dead areas?– When and from where do e-mails arrive? (This is important for the preven-
tion of bottlenecks, e.g. a spam-filter needs some computational resources.)– Are there any patterns classifying SPAM and NO-SPAM e-mails?– Is there a spread of e-mail communication?– Is there a certain dynamics w.r.t. the locations of the senders?
Finding Spatial Patterns in Network Data 8-9
Regular Emails Filtered SPAM Emails
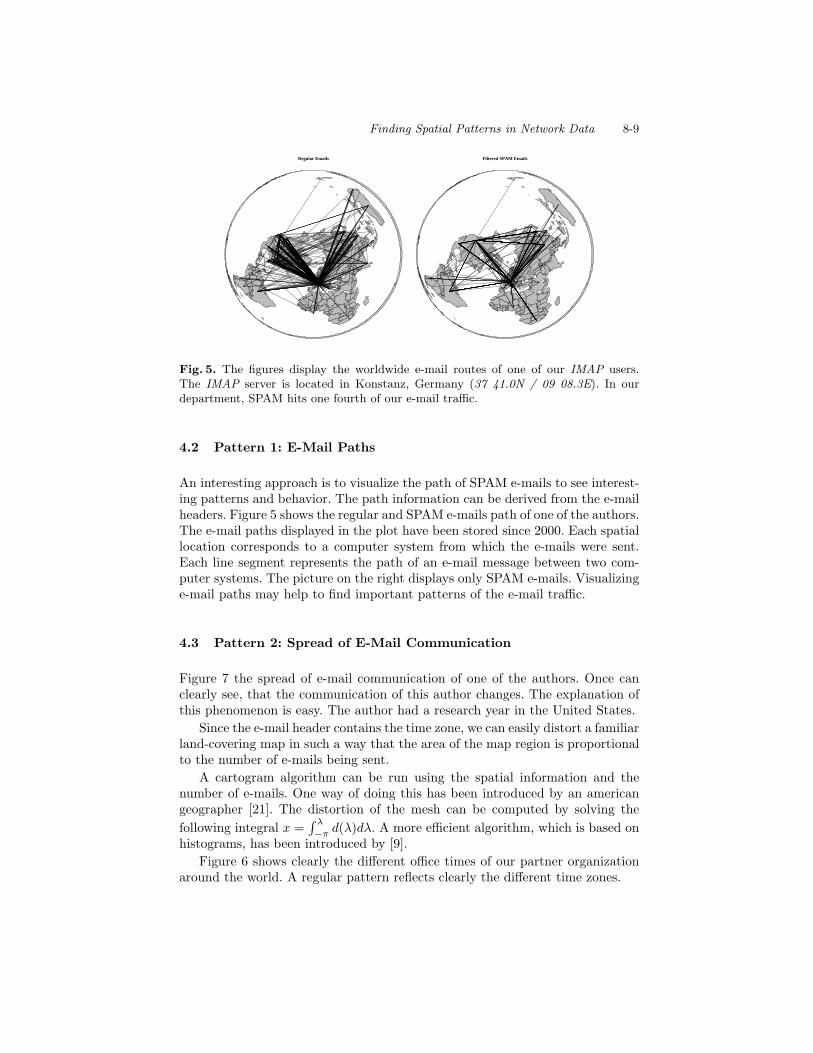
Fig. 5. The figures display the worldwide e-mail routes of one of our IMAP users.The IMAP server is located in Konstanz, Germany (37 41.0N / 09 08.3E). In ourdepartment, SPAM hits one fourth of our e-mail traffic.
4.2 Pattern 1: E-Mail Paths
An interesting approach is to visualize the path of SPAM e-mails to see interest-ing patterns and behavior. The path information can be derived from the e-mailheaders. Figure 5 shows the regular and SPAM e-mails path of one of the authors.The e-mail paths displayed in the plot have been stored since 2000. Each spatiallocation corresponds to a computer system from which the e-mails were sent.Each line segment represents the path of an e-mail message between two com-puter systems. The picture on the right displays only SPAM e-mails. Visualizinge-mail paths may help to find important patterns of the e-mail traffic.
4.3 Pattern 2: Spread of E-Mail Communication
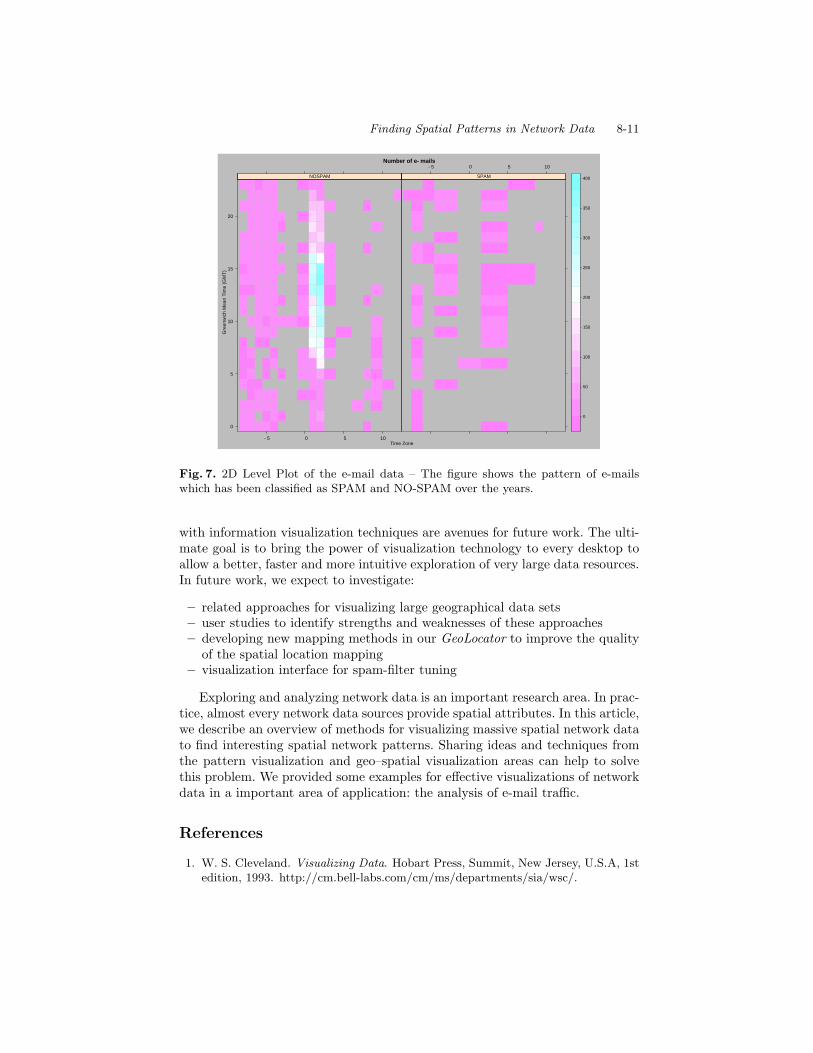
Figure 7 the spread of e-mail communication of one of the authors. Once canclearly see, that the communication of this author changes. The explanation ofthis phenomenon is easy. The author had a research year in the United States.
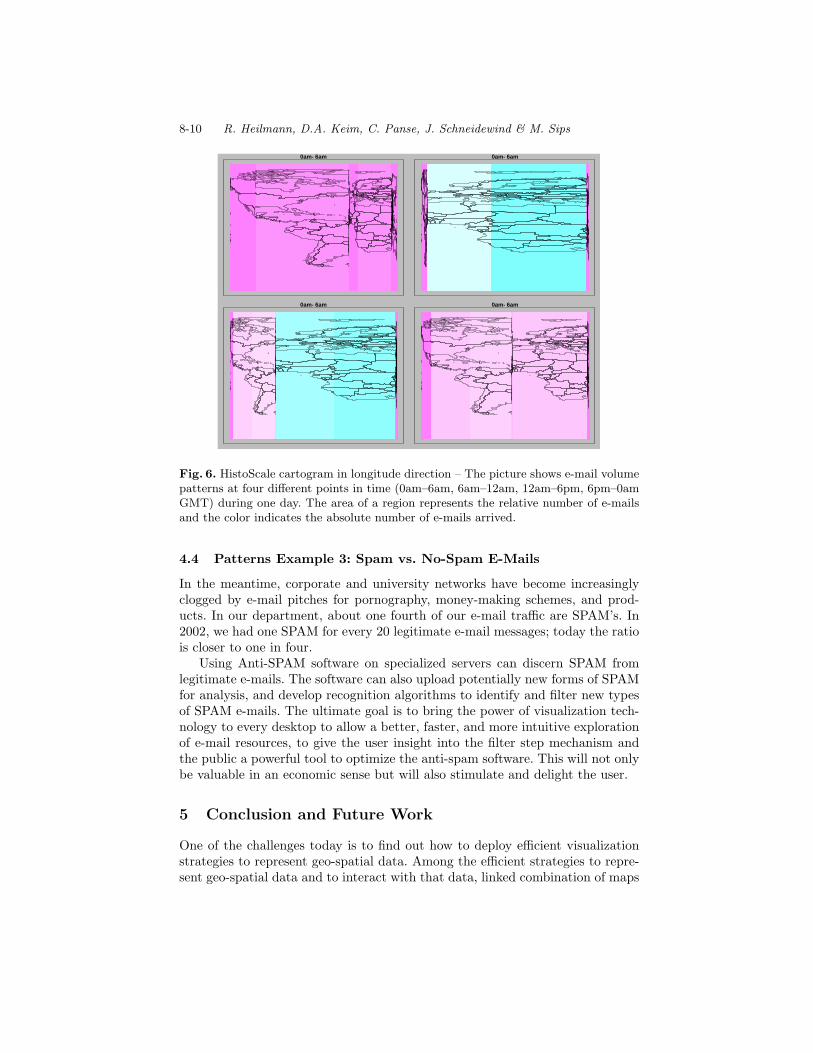
Since the e-mail header contains the time zone, we can easily distort a familiarland-covering map in such a way that the area of the map region is proportionalto the number of e-mails being sent.
A cartogram algorithm can be run using the spatial information and thenumber of e-mails. One way of doing this has been introduced by an americangeographer [21]. The distortion of the mesh can be computed by solving thefollowing integral x =
∫ λ
−πd(λ)dλ. A more efficient algorithm, which is based on
histograms, has been introduced by [9].Figure 6 shows clearly the different office times of our partner organization
around the world. A regular pattern reflects clearly the different time zones.
8-10 R. Heilmann, D.A. Keim, C. Panse, J. Schneidewind & M. Sips
0am−6am 0am−6am
0am−6am 0am−6am
Fig. 6. HistoScale cartogram in longitude direction – The picture shows e-mail volumepatterns at four different points in time (0am–6am, 6am–12am, 12am–6pm, 6pm–0amGMT) during one day. The area of a region represents the relative number of e-mailsand the color indicates the absolute number of e-mails arrived.
4.4 Patterns Example 3: Spam vs. No-Spam E-Mails
In the meantime, corporate and university networks have become increasinglyclogged by e-mail pitches for pornography, money-making schemes, and prod-ucts. In our department, about one fourth of our e-mail traffic are SPAM’s. In2002, we had one SPAM for every 20 legitimate e-mail messages; today the ratiois closer to one in four.
Using Anti-SPAM software on specialized servers can discern SPAM fromlegitimate e-mails. The software can also upload potentially new forms of SPAMfor analysis, and develop recognition algorithms to identify and filter new typesof SPAM e-mails. The ultimate goal is to bring the power of visualization tech-nology to every desktop to allow a better, faster, and more intuitive explorationof e-mail resources, to give the user insight into the filter step mechanism andthe public a powerful tool to optimize the anti-spam software. This will not onlybe valuable in an economic sense but will also stimulate and delight the user.
5 Conclusion and Future Work
One of the challenges today is to find out how to deploy efficient visualizationstrategies to represent geo-spatial data. Among the efficient strategies to repre-sent geo-spatial data and to interact with that data, linked combination of maps
Finding Spatial Patterns in Network Data 8-11
Number of e−mails
Time Zone
Gre
enw
ich
Mea
n T
ime
(GM
T)
0
5
10
15
20
−5 0 5 10
NOSPAM SPAM
−5 0 5 10
−0
−50
−100
−150
−200
−250
−300
−350
−400
Fig. 7. 2D Level Plot of the e-mail data – The figure shows the pattern of e-mailswhich has been classified as SPAM and NO-SPAM over the years.
with information visualization techniques are avenues for future work. The ulti-mate goal is to bring the power of visualization technology to every desktop toallow a better, faster and more intuitive exploration of very large data resources.In future work, we expect to investigate:
– related approaches for visualizing large geographical data sets– user studies to identify strengths and weaknesses of these approaches– developing new mapping methods in our GeoLocator to improve the quality
of the spatial location mapping– visualization interface for spam-filter tuning
Exploring and analyzing network data is an important research area. In prac-tice, almost every network data sources provide spatial attributes. In this article,we describe an overview of methods for visualizing massive spatial network datato find interesting spatial network patterns. Sharing ideas and techniques fromthe pattern visualization and geo–spatial visualization areas can help to solvethis problem. We provided some examples for effective visualizations of networkdata in a important area of application: the analysis of e-mail traffic.
References
1. W. S. Cleveland. Visualizing Data. Hobart Press, Summit, New Jersey, U.S.A, 1stedition, 1993. http://cm.bell-labs.com/cm/ms/departments/sia/wsc/.

8-12 R. Heilmann, D.A. Keim, C. Panse, J. Schneidewind & M. Sips
2. B. D. Dent. Cartography: Thematic Map Design, 4th Ed., Chapter 10. William C.Brown, Dubuque, IA, 1996.
3. S. Gusein-Zade and V. Tikunov. Map transformations. Geography Review, 9(1):19–23, 1995.
4. J. Han and M. Kamber. Data Mining: Concepts and Techniques. Morgan Kauf-mann Publishers, 2001.
5. D. J. Hand, H. Mannila, and P. Smyth. Principles of Data Mining. MIT Press,2001.
6. A. Inselberg and B. Dimsdale. Parallel coordinates: A tool for visualizing multi-dimensional geometry. In Proc. Visualization 90, San Francisco, CA, pages 361–370, 1990.
7. D. A. Keim and A. Herrmann. The gridfit algorithm: An efficient and effectiveapproach to visualizing large amounts of spatial data. Proc. IEEE Visualization,Research Triangle Park, NC, pages 181–188, 1998.
8. D. A. Keim, S. C. North, and C. Panse. CartoDraw: A fast algorithm for generatingcontiguous cartograms. Transactions on Visualization and Computer Graphics,10(1):95–110, January/February 2004.
9. D. A. Keim, S. C. North, C. Panse, M. Schafer, and M. Sips. HistoScale: Anefficient approach for computing pseudo-cartograms. In IEEE Visualization 2003DVD-ROM, Seattle, Washington, USA, pages 28–29, October 2003. IEEE CatalogNumber 03CG37496D, ISBN 0-7803-8121-1.
10. D. A. Keim, S. C. North, C. Panse, and J. Schneidewind. Visualizing geographicinformation: VisualPoints vs CartoDraw. Palgrave Macmillan – Information Vi-sualization, 2(1):58–67, March 2003.
11. D. A. Keim, S. C. North, C. Panse, and M. Sips. PixelMaps: A new visual data min-ing approach for analyzing large spatial data sets. In The Third IEEE InternationalConference on Data Mining (ICDM03), Melbourne, Florida, USA, November 2003.
12. D. A. Keim, C. Panse, J. Schneidewind, and M. Sips. Geo-spatial data viewer:From familiar land-covering to arbitrary distorted geo-spatial quadtree maps. InWSCG 2004, The 12-th International Conference in Central Europe on ComputerGraphics, Visualization and Computer Vision, February 2004.
13. D. A. Keim, C. Panse, and M. Sips. Visual data mining of large spatial data sets.In Databases in Networked Information Systems – Third International Workshop,DNIS 2003, Aizu, Japan, pages 33–36, September 2003. ISBN: 3-540-20111-4.
14. C. J. Kocmoud and D. H. House. Continuous cartogram construction. In IEEEVisualization, Research Triangle Park, NC, pages 197–204, 1998.
15. J. Mason. Spamassassin, Dec. 2003. http://bugzilla.spamassassin.org/.16. E. Raisz. Principles of Cartography. McGraw-Hill, New York, 1962.17. B. Shneiderman. The eyes have it: A task by data type taxonomy for information
visualizations. In Proc. IEEE Visual Languages, pages 336–343, 1996.18. N. Spring, R. Mahajan, and D. Wetherall. Measuring
isp topologies with rocketfuel. In Proc. SIGCOMM, 2002.http://www.acm.org/sigcomm/sigcomm2002/papers/rocketfuel.pdf.
19. W. R. Stevens. TCP/IP Illustrated Volum I. The Protocols. Addison WesleyLongman, 1994.
20. W. Tobler. Cartograms and cartosplines. Proceedings of the 1976 Workshop onAutomated Cartography and Epidemiology, pages 53–58, 1976.
21. W. Tobler. Pseudo-cartograms. The American Cartographer, 13(1):43–40, 1986.