Embed Size (px)
Citation preview
TECNISCHE UNIVERSITEIT OF EINDHOVEN JAN DE RIJK LOGISTICS UNIVERSITY OF TECHNOLOGY
Finding out opportunities in Franciscus Ziekenhuis
The influence of a Third-Party Logistics Service
within the supply chain
Nuria Serrano Benjumea
Master thesis of Industrial Engineering Dept. Operations management & Logistics
Eindhoven, September 2010

ii
Preface
After seven years I am now about to complete my studies in Industrial Engineering.
During these years, I have learnt many skills regarding engineering but, above all, different
ways of thinking and facing problems. As a matter of fact, the best knowledge I have learnt is
that everything is achievable working hard.
Besides, I have challenged myself many times along my studies in order to know my
capabilities and always trying to grow up and become a better person, in all aspects of life.
From now on, a new age starts and I am looking forward to face new challenges, live new
experiences and never stop learning.
I also would like to use this preface to state a word of thanks. In the first place I would like to
thank my parents and sisters- I am really lucky with the incredible family I have. They have
supported me always in everything I have done, taught me very good values and helped me to
grow up really happy.
I would like to thank all my friends from my childhood, from my university in Barcelona and
the ones I met here in Eindhoven. Specially, thanks to Silvia, Cristina, Christian, Maitane, Jose
and Carlos because of forming part into my life and for sharing so many nice moments
together.
Concerning my study, I would like to thank Pr. Nico Dellaert for the supervision of this master’s
project, to Marc Bauwens and Frank Huijbregts for their suggestions and advices and for giving
me the opportunity to live a traineeship experience within Jan de Rijk. And last, but not least a
word of thanks is also made to Marion de Bruijn and Marc Sijsterman for showing kindly to me
the working processes within the hospital and facilitating the available data for this
investigation.
iii
Summary
The continuous increasing of costs and the limited budgets is translated into a significant
operative pressure for the hospitals.
This sector has to deal with patient and material flows every day. Trying not to impair patient
care, several healthcare centres have invested in the development of an infrastructure for
supply chain and logistics technology since logistics’ improvements are translated into quality
improvements (Bakker, 2004).
Nowadays, firms are increasingly thinking in terms of competing as part of a supply chain
against other supply chains, rather than as a single firm against other individual firms and a
good opportunity for improvement is through a better cooperation with their suppliers and
customers (Silver, Pyke, & Peterson, 1998).
During the 1990’s companies start realizing of the benefits of outsourcing part of the logistics
processes to an external service provider. The challenge for Third-Party Logistics providers is to
provide their customers with services that add more value to their customers’ business than
the customers would be able to achieve themselves. In this way, the service provider tries to
improve the supply chain, for example, by introducing cross-docking facilities to eliminate
unnecessary storage of inventories, or by redesigning the distribution network to optimize
customer service levels.
In this thesis it is done an investigation within a hospital –Franciscus Ziekenhuis- in
collaboration with a Third-Party Logistics Service –Jan de Rijk Logistics.
There are two main parts in this thesis: The first one is designated to understand and analyze
the current situation and in the second one different possibilites of improvement are
developed by using a third party logistics service.
From the outcome of these analyses, the reader can realize of the current bottlenecks in the
supply chain, the products and procedures that impact mostly the total costs for the hospital
and the trends of improvement in short and long term.
Table of contents
Preface ..................................................................................................................................... ii
Summary ................................................................................................................................. iii
Table of contents ..................................................................................................................... iv
Chapter I. Introduction ............................................................................................................. 1
Chapter II. Project Cornerstone ................................................................................................. 3
1. Importance of the Inventory .......................................................................................... 3
2. The ABC items ............................................................................................................... 5
3. Warehousing ................................................................................................................. 6
4. Outsourcing ................................................................................................................... 7
5. Hospital’s Alliance ......................................................................................................... 8
Chapter III. Goals ...................................................................................................................... 9
Chapter IV. Products’ delimitation for the investigation .......................................................... 11
1. Creation of products’ categories .................................................................................. 11
2. Parameters to build the criteria for choosing the categories of the investigation ......... 11
3. Study of the viability of the products’ categories chosen ............................................. 12
4. Products in scope ........................................................................................................ 13
5. Union of some categories for their treatment in this report......................................... 14
Chapter V: Data acquisition and Assumptions ......................................................................... 16
1. Data obtained ................................................................................................................. 16
1.1. General data for the products in scope...................................................................... 16
1.2. Data for the household products: WC paper tissues and Kleenex Ultra; and incontinent
material: Tena bed and Tena bed green........................................................................... 16
1.3. Data for Dialyze fluids and paper for wrapping sterile sets for operations ................. 17
2. Data not obtained and Assumptions .................................................................................... 18
2.1. General assumptions ................................................................................................ 18
2.2. Assumptions for the household products and incontinent materials ......................... 19
2.3. Assumptions for sterile and dialyze products ............................................................ 24
Chapter VI. Analysis of the Current situation .......................................................................... 27
1. Current situation in the hospital for the products in study ........................................... 27
2. Mathematical model for the costs’ calculations in the current situation .......................... 28
3. Costs per product ............................................................................................................ 29
3.1. Toilet paper ......................................................................................................... 30
3.2. Kleenex tissues 2LGS................................................................................................. 34
3.3. Onderlegger Tena Bed .............................................................................................. 35
3.4. Onderlegger Tena Bed Green .................................................................................... 36
3.5. Sterile products ........................................................................................................ 37
3.6. Dialysis products....................................................................................................... 37
4. Total costs and observations ........................................................................................... 39
Chapter VII: Possibilities using a Third Party Logistics Service .................................................. 41
Known or Unknown Inventory Level .................................................................................... 41
A. Unknown Inventory Level ................................................................................................ 42
A.1. SCENARIO 1: UNKNOWN INVENTORY LEVEL AND JAN DE RIJK DELIVERS INTO THE
DEPARTMENTS ONCE PER WEEK ..................................................................................... 43
A.2. SCENARIO 2: UNKNOWN INVENTORY LEVEL; JAN DE RIJK RECEIVES PRODUCTS FROM
SUPPLIER TWICE PER YEAR AND DELIVERS INTO THE DEPARTMENTS ONCE PER WEEK .... 61
B. Known Inventory Level .................................................................................................... 73
B.1. SCENARIO 3: KNOWN INVENTORY LEVEL; DELIVERIES FROM THE SUPPLIER INTO JAN
DE RIJK TWICE PER YEAR AND DELIVERIES FROM JAN DE RIJK INTO CENTRAL WAREHOUSE
ONCE PER WEEK. ............................................................................................................. 74
Chapter VIII. Conclusions ........................................................................................................ 84
Chapter IX. Recommendations ................................................................................................ 88
References .............................................................................................................................. 90
Websites ............................................................................................................................. 91
ANNEXES ................................................................................................................................ 92
Annex A. Data obtained .......................................................................................................... 93
Household materials ........................................................................................................... 94
Incontinent material ......................................................................................................... 100
Sterile products ................................................................................................................. 105
Dialyze products................................................................................................................ 111
Annex B. Current distribution of products from the Central warehouse to the departments . 119
Annex C: Parameters definitions and Cost formulas .............................................................. 121
1. Intermediate calculations .............................................................................................. 121
2. Costs formulas .............................................................................................................. 123
Annex D: Costs’ development for the products in current situation ....................................... 128
1. Kleenex tissues 2LGS ..................................................................................................... 128
2. Onderlegger Tena Bed ................................................................................................... 129
3. Onderlegger Tena Bed Green ........................................................................................ 131
4. Sterile products ............................................................................................................. 132
5. Dialysis products ........................................................................................................... 134
Annex E: Intermediate tables for all the products in Scenario 1 ............................................. 136
Annex F: Prices Jan de Rijk Logistics....................................................................................... 148
Annex G: Rate shipments for each supplier ........................................................................... 150
Bunzl ................................................................................................................................. 150
SCA ................................................................................................................................... 151
Kimberly-Clark .................................................................................................................. 152
Gambro............................................................................................................................. 153
Annex H. Procedures for handling and storage of goods in Franciscus Ziekenhuis ................. 154
Nuria Serrano Benjumea Finding out opportunities in Franciscus Ziekenhuis
1
Chapter I. Introduction
The optimization of the logistics flow of goods in the area of the Healthcare means savings in
the total costs of the hospital, but also means a better attention for the patients who are the
final customers.
When we go within the world of the Healthcare logistics we easily realized the main topics we
have to deal with: the patient has a very important role as a final user, the doctors are also our
customers who want to choose their own tools to work with, the demand of some products is
hard to foresee since some of them are only used in urgent occasions and some products
require special conditions of storage and handling.
The aspects mentioned above are only some of the aspects that justify this thesis. Within the
project cornerstone (see Chapter II) we develop the theoretical bases for this investigation.
In this project we look for opportunities of improvement in the supply chain management of
the Franciscus hospital in Roosendaal, by some form of cooperation with Jan de Rijk Logistics.
The outcome of the analysis will probably lead to possibilities where Jan de Rijk logistics can
provide its services, develop new services to add on their service portfolio and cost savings for
the hospital.
Since in this thesis we develop our investigation concerning the two main parties mentioned
above, we give a brief explanation of them:
Franciscus hospital was founded in 1968.
During the next ten years of growing, both the architecture and the specialties areas
grew fast. Around the 2000, St. Franciscus improved the patient care through
collaboration with partners as nursing organizations and home care. Also, in order to
strength the medical specializations St. Franciscus, started relationships with different
hospitals, such as Hospital Lievensberg, Amphia Hospital or cancer centres. These
collaborations were essential in order to create sufficient scale and functions within
the specializations.
Nowadays, St. Franciscus Hospital is in the maturity stage. The continuity of the
organization is assured and on the eve of many new developments. The hospital offers
472 beds, 115 specialist doctors and more than 1500 professionals and support staff
large enough to assist almost all the healthcare in-house. But, also small enough for
reacting fast in front of new developments and technologies.
Jan de Rijk Logistics was founded by J.A.M de Rijk and Mrs. J.G.M de Rijk-Heeren in
1971 and both of them are still the two main shareholders and members of the Board
of Directors.
Nuria Serrano Benjumea Finding out opportunities in Franciscus Ziekenhuis
2
In these 39 years, Jan de Rijk Logistics has become in one of the leading European
logistics service providers, which operates an asset based, Pan- European network for
international transportation and distribution services. The Group’s customer portfolio
consists of many leading global and European companies in the various key industries:
Air Cargo, aerospace, automotive, high tech, fresh logistics, tobacco, retail and
Pharmacy.
The organization is formed by a network of 26 company owned offices in 15 countries,
being one of the largest fleet operators in Europe with a daily deployment of nearly
900 vehicles, a warehouse capacity of 90.000 m2 and state-of-the-art ICT platforms to
increase operational efficiencies and to cater for maximum transparency and customer
connectivity.
As the reader can realize, this project involves all the supply chain of Franciscus Ziekenhuis,
regarding flow of goods, but also information flows and Jan de Rijk Logistics as a third-party
logistics service. Therefore, in the starting point we found a very general scenario where it was
hard to delimitate and structure the area of study. That is why; it is important here to
introduce the structure this thesis follows.
In this report, we explain in a brief way the theoretical bases all the investigation is based in. In
other words, it is also a justification of the reason why this thesis it is done. After that, we
define and explain the goals we want to achieve.
Along this thesis there are to distinctive parts: In the first one, there is a research of the
products which can be analyzed and their data. For those products or parameters from
Franciscus Ziekenhuis that data was not available there have been done some assumptions.
Once, the scope of products and all the information concerning their analysis is clear, starts
the second part of this report, where the analysis is done.
Along the analysis there are also two main parts: One designated for the study of the current
situation and the other, where some scenarios and possibilities of improvement are posed and
analyzed.
Finally, the report contains the conclusions and some recommendations for the hospital, once
the analysis of the results has concluded.
Nuria Serrano Benjumea Finding out opportunities in Franciscus Ziekenhuis
3
Chapter II. Project Cornerstone
In this chapter I develop the theory, based on literature, this thesis is based on. In other words,
it is the justification why this investigation makes sense.
I have divided the chapter in different areas of interest: the first part concerns the importance
of the inventory nowadays and the repercussion a good management of the inventory has
within the supply chain. The second part mentions the ABC items and their influence in the
warehousing logistics. There is also a section designated to talk about warehousing as a basic
concept. Obviously, another section regards outsourcing: the paper the third-party logistics
has in the industry and the add-values it can add in a supply chain. And, last but not least, the
last section talks about the alliance in hospitals’ savings in the total costs.
1. Importance of the Inventory
Inventory management and production planning and scheduling are something common
today. The huge development in information technology and computer networking allows
manufacturers to track consumer demand on a daily basis, and thereby more closely match
production with demand.
But, why is this inventory management and production planning and scheduling so important
within the supply chain? (Viale, 1996), (Coyle, Bardi, & Langley, 2003) and (Silver, Pyke, &
Peterson, 1998)
The answer is plural. One of the important aspects is that changes in inventory levels have an
impact on return on assets (ROA). Reduction in inventory usually improves ROA, which is a
positive indicator of performance for current and potential investors.
When the sales are not as good as expected, it has a double-edged effect on profits since it is
translated into lower sales and more costs due to the increase in the inventory levels; but it
also has a negative impact on ROA, which decreases. (Coyle, Bardi, & Langley, 2003)
During the 1990s the supply chain management orientation brought attention to the
importance of reducing inventory levels in supply chains to reduce landed costs at the end of
the supply chain. An example is Ford motor Company, which estimated that they were carrying
fifteen times as much work-in-process (WIP) as Toyota, which was a remarkable competitive
disadvantage. (Coyle, Bardi, & Langley, 2003)
During the 1990s not only the relative cost of carrying inventory decreased, but also the
relative cost of transportation. This combination was a positive aspect promoting economic
growth and prosperity.
But, why didn´t firms controlled the inventory level before?
Nuria Serrano Benjumea Finding out opportunities in Franciscus Ziekenhuis
4
Because the carrying costs associated with the storage of products were hidden costs and
most of the times, even the companys did not realize the big impact these costs could have at
the end of the supply chain.
It is good to observe the sources which the batching economies or cycle stocks usually arise
from: acquisition, production and/ or transportation. And, a very important aspect regards all
three: Scale economies.
As follows, I explain the importance of inventory in some functional areas, and which can easily
result in the accumulation of stock that will not be used or sold immediately. (Coyle, Bardi, &
Langley, 2003)
In the acquisition area, it is usual to have lower prices for larger quantities purchased.
The price per box is lower but, it will be cycle stock and what it is not used immediately
will be stored
In transportation it occurs the same: if the truck is completely full the price per unit is
cheaper
In production, usually, it is also cheaper to produce in long runs. The handicap is the
storage of all those items that have to be stored
- In other functional areas such as Marketing desires high customer service levels and
well-replenished inventory stocks to assure product availability. In the other side, the
finacial department desires low inventory levels to increase inventory turnover, reduce
current assets, and receive high capital returns on assets
For all the reasons mentioned above, the decision and managing of inventory is a hard task.
But, the major reason to perform it is to reconcile all the following goals: (Coyle, Bardi, &
Langley, 2003), (Silver, Pyke, & Peterson, 1998) and (Viale, 1996).
- Maximizing customer service: innacurate customer forecasts, a multitute of changes to
the original customer orders, and an overall lack of account management are the
major causes of poor customer service performance in terms of on-time delivery- not
suppliers, not purchasing. The result is excessive inventory, which ultimately leads to
inventory write-offs and high product cost and lower profit margins.
The more accurate the individual product-sales forecasting is, the smaller the forecast
error, and the less inventory needs to be carried to maintain a specified level of
customer service.
Maximizing efficiency of purchasing and production: goods may be purchased in
greater quantities than are needed in order to achieve cost efficiencies in purchasing
or transportation. Agreements called “volume purchase orders” (blanket POs) may be
established. These allow for increasing discounts as volumes increase and, at the same
time, specify that deliveries take place as needed.
- Minimizing inventory investment: excess inventory can create a negative cash flow,
something that must be avoided
- Maximizing profit: profit can be maximized by increasing revenue or decreasing cost.
One of the best ways to do this is by proper management of inventory.
Nuria Serrano Benjumea Finding out opportunities in Franciscus Ziekenhuis
5
At this point, the importance of a good forecasting is obvious. Nowadays, thank to the
information technology development some initiatives allow very precise forecasts - even daily.
These initiatives include Electronic Data Interchange (EDI), Efficient Consumer Response (ECR),
and Vendor Managed Inventory (VMI).
But, still the inventory management and production planning and scheduling decisions are a
hard task, due to the following challenges: (Silver, Pyke, & Peterson, 1998)
Some large organizations stock more than 500000 distinct items in inventory
Items produced and held in inventory can differ in many ways: they may be withdrawn
from inventory by the thousands, by the dozen or unit by unit
They may be substituted
Goods also arrived for inventory by a variety of modes and in quantities that can differ
from how they will eventually be demanded
Some goods arrive damaged, others need special conditions and treatments
Delivery of an order may take hours, weeks, or even several months, and the delivery
time may or may not be known in advance
For, all the reasons describe in this section, it is crucial to make a good selection of a model to
approach the pattern of consumption and a good forecasting of the products analyzed in order
to be able to manage the inventory level in a precise way.
2. The ABC items
This ABC item classification is useful in order to take warehousing decisions. This concept was
invented by Pareto, an Italian economist, who discovered that a small percentage of a
population always has the greatest effect. (Viale, 1996) and (Silver, Pyke, & Peterson, 1998).
A items have the highest value. These are relatively few items (15-20 percent) whose value
accounts for 75-80 percent of the total value of the inventory. As a general rule, 20 percent of
the items constitute 80 percent of the annual requirements.
B items have medium value. These are a larger number in the middle of the list, usually about
30-40 percent of the items, accounting for about 15 percent of the value.
C items have low value. These are the bulk of the inventory, usually about 40-50 percent of the
items, whose total inventory value is almost negligible, accounting for only 5-10 percent of the
value.
Nuria Serrano Benjumea Finding out opportunities in Franciscus Ziekenhuis
6
3. Warehousing
This section is related to the first one: the importance of inventory and it is based in (Burton,
1979).
The warehousing organization exists to bridge the gap between the economic methods of
production and the needs of the consumer. The task is to provide what is required, when it is
required, in the condition in which it is required, and to do all these things economically.
From the financial point of view warehousing is just an overhead, and there is quite a lot to be
said to contradict this. It is true that once the warehousing organization has been set up, the
throughput does nothing to affect the cost. The size of the building, the levels of stock and the
work force dictates the cost and not the amount of work done.
Efficiency in the warehouse, therefore, starts with planning for the need, and this presupposes
that the need itself can be forecasted with some accuracy. Clearly, this forecasting process
must be subject to review and to the periodic re-setting of the scale of operations.
Within the supply chain there are many links between operations and all of them have to be
considered before any decision is taken. The links involved are described as follows:
Enquiries are prepared and dispatched with a specification to the suppliers
The suppliers prepare and dispatch their tender, giving a price and a delivery time
Tenders are received
A supplier is selected
An order is placed on the named supplier
The supplier receives the order and plans production
The production run is set up and the articles are produced
Finished goods are dispatched with the invoice
Goods are received
Goods are checked for correctness against the invocie and the specification
Goods are taken on charge and are available for issue
The bill is paid
Each of the headings represent the passage of time in the supply of the goods.
Another topic that has to be faced is that the warehouse does not want to place orders daily as
this takes a lot of time, which is translated into a lot of money. So, orders usually are placed
monthly.
However, although we can establish a practical average supply period and can multiply this by
an average consumption over a period, these averages, do not exist in practice. Mathematics
based upon them, therefore, are themselves doubtful. A safety margin may be required to
cover the risk of running out and this too can be expressed in terms of days of average usage.
Lastly, since things can go wrong with the process, for instance when strikes disrupt the
supplier’s schedule or the transport system a further safety stock may be held as an insurance.
Nuria Serrano Benjumea Finding out opportunities in Franciscus Ziekenhuis
7
4. Outsourcing
Many firms have directed significant attention toward working more closely with supply chain
partners, including not only customers and suppliers but also various types of logistics
suppliers. Considering that one of the fundamental objectives of effective supply chain
management is to achieve coordination and integration among participating organizations, the
development of more meaningful “ relationships” through the supply chain has become a high
priority.
One way of extending the logistics organization beyond the boundaries of the company is
through the use of a supplier of third-party or contract logistics services.
A third-party-logistics firm may be defined as an external supplier that performs all or part of a
company’s logistics functions.
Third-party logistcs may be thought of as an ·external supplier that performs all or part of a
company’s logistics functions.” It is desirable that these suppliers provide multiple services and
that these services are integrated in the way they are managed and delivered.
Based on the results of a study of users of 3PL services in the United States, over 70 percent of
the firms studied are, to some extent, users of 3PL services. Approximately two-thirds of the
customers suggest 3PL involvement in their global supply chain activities.
But, why does it appear the idea of outsourcing?
The drivers for outsourcing are the following ones: (Berglund, Laarhoven, Sharman, & Wandel,
1999)
On the demand side: reduction of asset intensity; restructuring of the distribution
structure, triggered by a restructuring of the production structure; and, reduction of
labour costs by switching to a non-unionized labor force.
And on the supply side: deregulation of the transportation industry, which made it
possible to provide TPL services; declining profit margins in basic services (i.e freight
transport); and, availability of capital.
There are two different strategies for the providers: the ones who offer a specific service, for
example distribution of spare parts, versus providers that cover a complete range of services
and offer their customer logistics solutions; and, the providers that carry out traditional
transportation and warehousing activities, such as value-added services.
The two providers’ types have different qualities within the industry: the value-added
providers have a higher percentage of personnel working in general management and business
development and have a higher percentage of value-added services.
Although, the difference with the two types is very big, the difference in each growth
expectancy is remarkable: the value-added providers expect their revenues to increase
Nuria Serrano Benjumea Finding out opportunities in Franciscus Ziekenhuis
8
annually by more than 50%; whereas the basic providers expect their annual growth to be less
than 30%. (Berglund, Laarhoven, Sharman, & Wandoel, 1999)
The challenge for TPL providers is to provide their customers with services that add more value
to their customers’ business than the customers would be able to achieve themselves.
Service providers need to find customers whose requirements neaty fit into the standardized
services they offer. This will enable the provider to benefit from increased economies of scale,
risk-sharing and volatility smoothing. The new resources from additional clients can be used to
improve efficiency and to further improve profit margins and the delivered perfromance/cost
ratio.
TPL providers can also add value by sharing resources between customers, for example by
running a warehouse for several customers or by operating joint transportation networks for a
set of customers. Thus, the driver for value creation is predominantly economies of scale.
Another way to create value for customers is to use conceptual logistics skills to improve the
customers’ supply chains, for example by introducing cross-docking facilities to eliminate
unnecessary storage of inventories, or by redesigning the distribtuion network to optimize
customer service levels.
Roughly, half of the providers plan to take ownership of inventories so as to be able to earn
money by reducing inventory levels and increase their power in the supply chain.
5. Hospital’s Alliance
In June, 2009, an association of hospitals was founded. It is called Hospital Purchasing Alliance
and is formed by 14 members (one of them is Franciscus Ziekenhuis). The goal of this alliance is
to achieve synergy and cost savings in hospitals for needed facility services and goods.
Haga Ziekenhuis (in Den Haag), Reinier de Graaf Gasthuis (in Delft) and Sint Franciscus Gasthuis
(in Rooterdam) work together in the association Service XL, by means of which they expect to
save 10 million euros per year joining their logistics’ activities and joining their demand orders.
These are only two examples of hospitals in the Netherlands which are doing recently efforts in
order to save money in their logistics’ processes using the power of the alliance with other
hospitals. See (Hoegsma, 2010).
Nuria Serrano Benjumea Finding out opportunities in Franciscus Ziekenhuis
9
Chapter III. Goals
In an institution like a hospital there are thousands of products, services and tasks that are
being developed in parallel and it is hard to define the area we want the project to be focused
on. That is why; here is a chapter designated to describe precisely the goals I want to achieve
in this thesis and they are described as follows:
To do a market research in order to know how the different supply chain in some
hospitals in Netherlands is working, an investigation about the services that other
suppliers are offering to Healthcare and literature review for logistics’ solutions, such
as outsourcing. Also, it is important on this level to understand the trend of the new
methods that are being applied in different hospitals
To know and understand the current situation in Franciscus Ziekenhuis
In this goal there are many aspects involved:
The way the products are stored: rooms for storage, employees implied, flows
of goods through all the storage rooms
Which products are stored: products’ characteristics that are required to be
stored in the same area, the area the products that require special conditions
are stored and the treatments these products have to receive
Policies established in the storage, inbound and outbound of products
Develop a mathematical model, based on literature, which can approach the
costs in the reality
The calculation of the costs per product within the supply chain
Choose the most proper products for this investigation
Choose categories of products
Classify products into categories by means of similar characteristics
Define fundamental parameters in order to define criteria to choose the
categories under study
Define the criteria and choose the products’ categories for this investigation
Explore the information sources to realize the data possible to obtain
In the study of the possible improvements in the supply chain of Franciscus Ziekenhuis
we have to deal with the fact that is not that easy to work with a real situation
compared with a theoretical one, since for example, in some cases historical data is
Nuria Serrano Benjumea Finding out opportunities in Franciscus Ziekenhuis
10
not available and it is really hard to do good stimations. Therefore, it has been needed
to redefine the scope of the project several times due to the impossibility to do a
precise analysis with real data
Obtain the data available by means of interviews with the responsible of
Logistics within the hospital and observation of the working methodologies
Develop assumptions for the data we cannot obtain and which is required for the
investigation
Based on literature and our criteria: creation of assumptions
Look for ways of improvement within the supply chain of Franciscus Ziekenhuis by
using a third Party Logistics service
Create different scenarios modifying parameters from the current situation in
order to compare costs and to realize of possibilities of improvement
Create assumptions to approach the mathematical model chosen to the
different situations in each scenario
Realize the impact of every parameter on the supply chain
Be able to find out possible benefits for Franciscus Ziekenhuis and Jan de Rijk Logistics
From the outcome of the analysis and the literature studied, be able to
conclude with the possible trends of improvement in short and long term
11
Chapter IV. Products’ delimitation for the investigation
1. Creation of products’ categories
The goal of this chapter is to determine the products in scope for this study because the
hospital is supplied with thousands of products and it is not possible to study all of them in this
investigation. Therefore, the first decision taken is to create categories of products since we
want to have a general perspective. Also this methodology helps to have a clearer picture of
the situation and a guideline for further possible studies.
We split the products in the next categories, after paying visits to the hospital and observe the
way the products are stored:
Food: The food used in the kitchen and in the different departments
Textiles: Regarding the medical, nursery and patient clothes and sheets,
curtains and all the clothes used in the patient´s accommodation
Office material: Including all the material such pens, documents, envelops,
prescriptions, folders, etc.
Operation theatre products: This group refers to all the products that are used
in the surgeries like: needles, thread, sterile gauzes, etc.
Pharmacy: Group that includes medicaments and antibiotics used in the
hospital
Auxiliary products for the attendance of the patient: sterile products,
specialized fluids, incontinent materials, etc.
Cleaning products: Basically, the products used by the cleaning department for
the maintenance of the hospital, like detergents, soaps, gloves and others
Household materials: Such as the toilet paper, paper towels, etc.
2. Parameters to build the criteria for choosing the categories of the
investigation
Soon, we realized we had to start filtering products for our study. The most important aspects
we considered for building the criteria used for the selection of the categories studied, are
described as follows:
No urgent need: The hospital does not collect any historical data about products which require
urgent needs, so, it makes hard to do their analysis
Long expiry dates: We consider the products which have long expiry dates in scope because it
is a required condition in order to analyze some of the scenarios described in chapter VII.
Products that have short expire dates cannot be stored for long time, so their treatment has to
be different.
12
No special conditions required: The products which require special conditions are treated
different than the others during all the supply chain. This group of products can be included
later depending on the outcome of the study. As in the case above, these products need a
different treatment from the employees and a distinctive attention.
Products which can be included into a category: It is not interesting for a first analysis to
consider a product which cannot be classified into a group because in a hospital we are talking
about thousands of products, so, it does not add value in this stage of the analysis to find out
an improvement for a product which will represents a very little benefit for the hospital, since
this study represents a first approach for the situation within the hospital.
Products which represent a high volume it is related with the case above. In this case as well,
we consider more interesting to investigate in the optimization of the products that represent
a higher level of improvement regarding volume used for storage and costs savings. We will
call these products A items. (See chapter II)
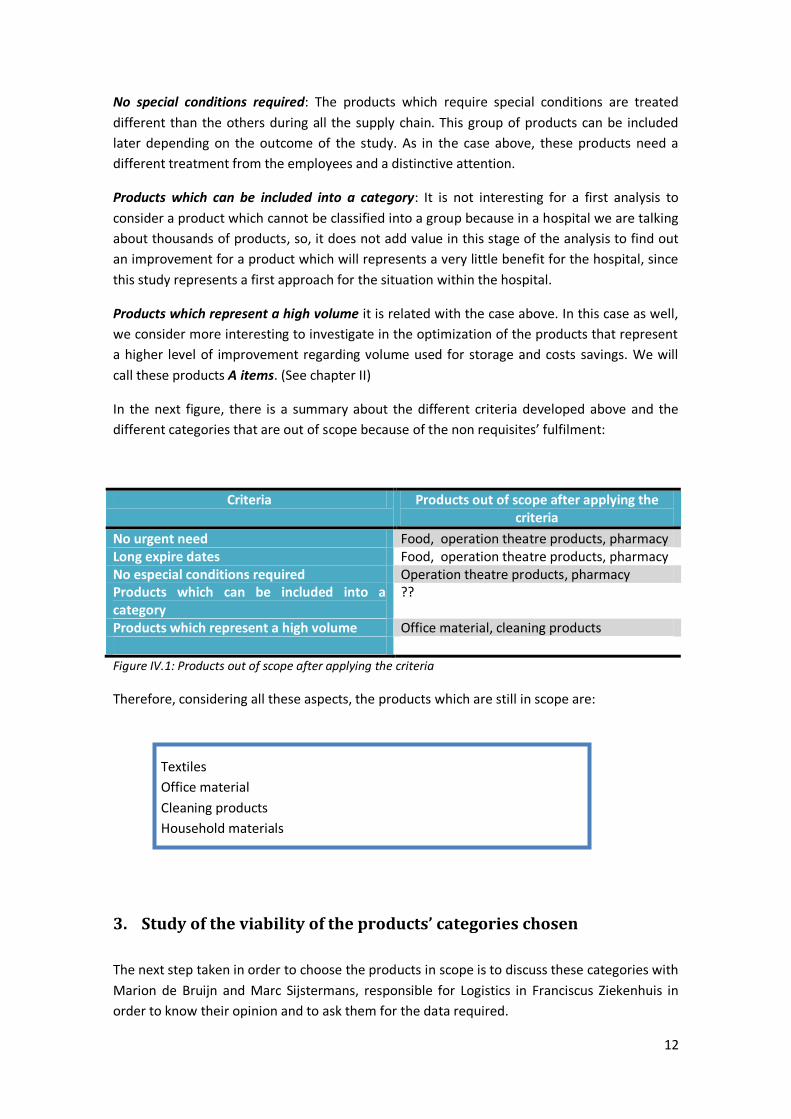
In the next figure, there is a summary about the different criteria developed above and the
different categories that are out of scope because of the non requisites’ fulfilment:
Criteria Products out of scope after applying the criteria
No urgent need Food, operation theatre products, pharmacy Long expire dates Food, operation theatre products, pharmacy No especial conditions required Operation theatre products, pharmacy Products which can be included into a category
??
Products which represent a high volume Office material, cleaning products
Figure IV.1: Products out of scope after applying the criteria
Therefore, considering all these aspects, the products which are still in scope are:
Textiles
Office material
Cleaning products
Household materials
3. Study of the viability of the products’ categories chosen
The next step taken in order to choose the products in scope is to discuss these categories with
Marion de Bruijn and Marc Sijstermans, responsible for Logistics in Franciscus Ziekenhuis in
order to know their opinion and to ask them for the data required.
13
As an outcome of this meeting, we consider more criteria suggested doing a step more to filter
the products in scope:
The textile products are reusable products, which are cleaned within the hospital and
distributed into the departments in roll containers. So these products could not be
stored in an external storage. I could not analyze the scenarios where Jan de Rijk
Logistics can play a role with these products.
The office material is a big group that does represent a big volume. In addition, the
storage is difficult to modify since it is directly in the drawers in each office or
department. So, it would be difficult to optimize for a first analysis and without data
about its process of distribution.
Alternatively, we have added two product types in scope after we have been talking to the
responsible of logistics in the hospital:
Dialysis fluids: these products are stored in high volumes in the department where
they are used, being the dialysis centre. The demand of these products is quite regular
and high
Sterile products: as in the case above, these products are only stored in one
department, the sterile centre and used for wrapping sterile sets for operations. They
are also stored in high volumes and their demands are regular and predictable
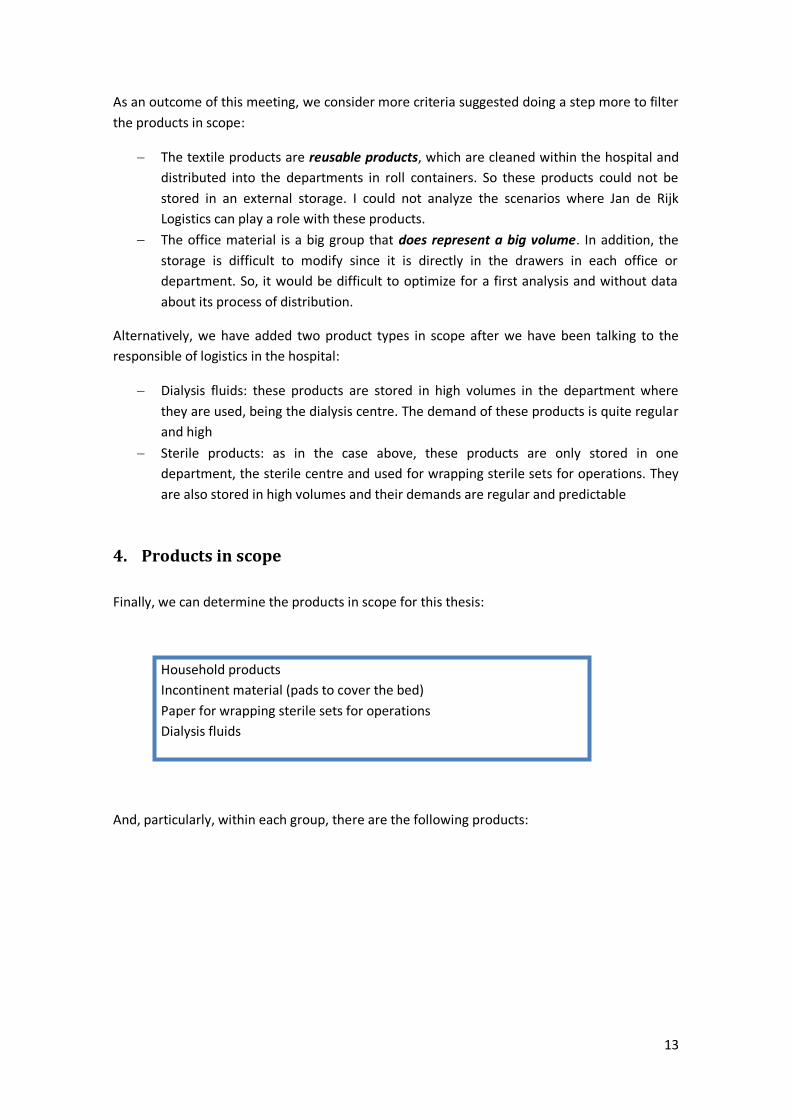
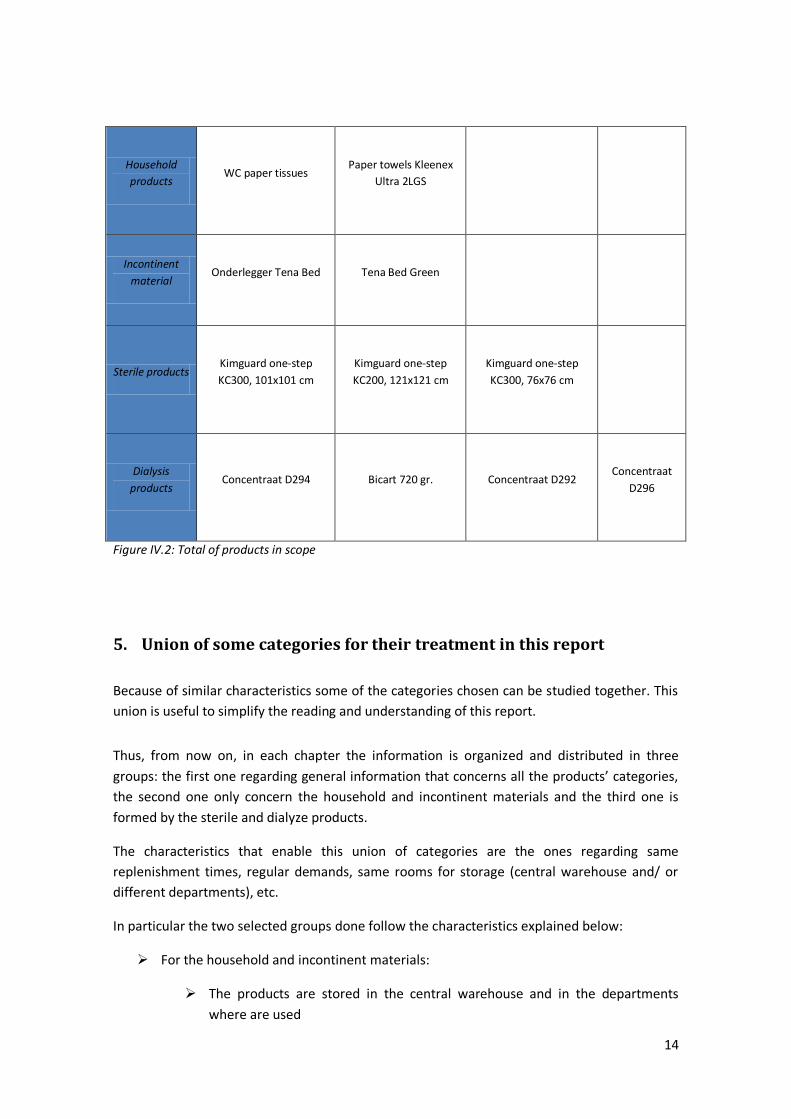
4. Products in scope
Finally, we can determine the products in scope for this thesis:
Household products
Incontinent material (pads to cover the bed)
Paper for wrapping sterile sets for operations
Dialysis fluids
And, particularly, within each group, there are the following products:
14
Household
products
WC paper tissues
Paper towels Kleenex
Ultra 2LGS
Incontinent
material
Onderlegger Tena Bed
Tena Bed Green
Sterile products
Kimguard one-step
KC300, 101x101 cm
Kimguard one-step
KC200, 121x121 cm
Kimguard one-step
KC300, 76x76 cm
Dialysis
products
Concentraat D294
Bicart 720 gr.
Concentraat D292
Concentraat
D296
Figure IV.2: Total of products in scope
5. Union of some categories for their treatment in this report
Because of similar characteristics some of the categories chosen can be studied together. This
union is useful to simplify the reading and understanding of this report.
Thus, from now on, in each chapter the information is organized and distributed in three
groups: the first one regarding general information that concerns all the products’ categories,
the second one only concern the household and incontinent materials and the third one is
formed by the sterile and dialyze products.
The characteristics that enable this union of categories are the ones regarding same
replenishment times, regular demands, same rooms for storage (central warehouse and/ or
different departments), etc.
In particular the two selected groups done follow the characteristics explained below:
For the household and incontinent materials:
The products are stored in the central warehouse and in the departments
where are used
15
The replenishments from the supplier are received once per month
The replenishments from the central warehouse to the departments are done
once per week
The safety stock is one week demand
For the sterile and dialyze products:
Both type of products are only stored in the department where they are used,
sterile and dialyze department respectively
The deliveries from the supplier to the central warehouse are once per month
The safety stock is one week demand
For these reasons, we assume the products within these two groups mentioned to follow the
same patterns of consumption and therefore, they can be managed all together and we can
establish the same parameters for the products within each group.
16
Chapter V: Data acquisition and Assumptions
1. Data obtained
After several visits to the hospital the data obtained for each product is shown as follows and it
can be found in tables in the Annex A of this report. All the information is distinguished by
colours and different tables, and everything is described at the beginning of the mentioned
annex. As an observation we would like to add, that those tables also contain the results from
the assumptions done and which are explained in the section 2 of this chapter.
In this section we explain the utility of the data obtained during further analysis.
1.1. General data for the products in scope
These data is used for all the products because it regards general information from the
hospital:
Rooms for storage in the hospital: to be aware of the number of rooms currently being
used as a storage room and their location
Schedule of the replenishments from the central warehouse to all the departments:
this information is used in order to do assumptions of the handling times and other
assumptions regarding the employees tasks
Price of the square meter in the nursery departments, central warehouse and
underground storages: information required to calculate costs in every situation
Cost of men power per hour: Also required to calculate costs in all the different
scenarios
1.2. Data for the household products: WC paper tissues and Kleenex Ultra; and
incontinent material: Tena bed and Tena bed green
The data available for these products’ groups is:
Supplier: information used to know the distance from the supplier to the hospital
The last six lead time values: to know the lead time demand on average
Order quantities per month for the last six months: to get to know the demand of the
products
Net price per item: to understand the products costs’ weights throughout the supply
chain
Total consumption per department for last year and two years ago: to know the
demand of the products
17
Detailed consumption for the last year per month: to be more precise in the
approaching of the average demand per product
Order up to level in each department (S): to know the safety stock in the current
situation
Volume of each box: to calculate the total volume occupied in each storage room per
product
Pallets per year: to confirm the order quantities, the replenishments and the average
demands
Number of boxes per pallet: to know the volume occupied in the case the product is
stored in pallets
Number of items per box: to be able to do calculations with both, boxes and items, it
depends on the circumstances and needs
Handling cost for all the products of the hospital: to calculate the costs in every
situation (see next section: assumptions, for the prediction of the handling cost per
each product)
1.3. Data for Dialyze fluids and paper for wrapping sterile sets for operations
The data obtained for these products are the same as mentioned in 1.2 with the only
exception regarding:
Lead time: only an approximate average
Order quantity: only an approximate average
Detailed consumption for the last year per month
We do not have in this situation the volume per box, but we can assume the volume
occupied by using the demand per month, the number of pallets per month/year and
the number of boxes per pallet, as we see in section 2.2.3 of this chapter
18
2. Data not obtained and Assumptions
Before starting with the analysis it is very important to explain all the assumptions that have
been required to do because of: missing data from the hospital, a bad approaching of the
reality to the models or just because of the complexity of the information obtained.
This chapter contains general assumptions regarding all the products and specific ones
regarding some categories of them. All these assumptions are used in both, the current
situation’s analysis and in the different scenarios’ analysis.
As we mentioned earlier, the assumptions regarding the current situation are enclosed in the
tables of Annex A.
2.1. General assumptions
Some of the assumptions done are used for all the products in study; so, we explain them in
this first part of the analysis. These assumptions are general because mostly refer to aspects
about the central warehouse in the hospital, where almost all the products are stored.
All the results of these assumptions can be found in the Annex A of this report, distinguished
by the colour:
Below a detailed description of the assumptions made.
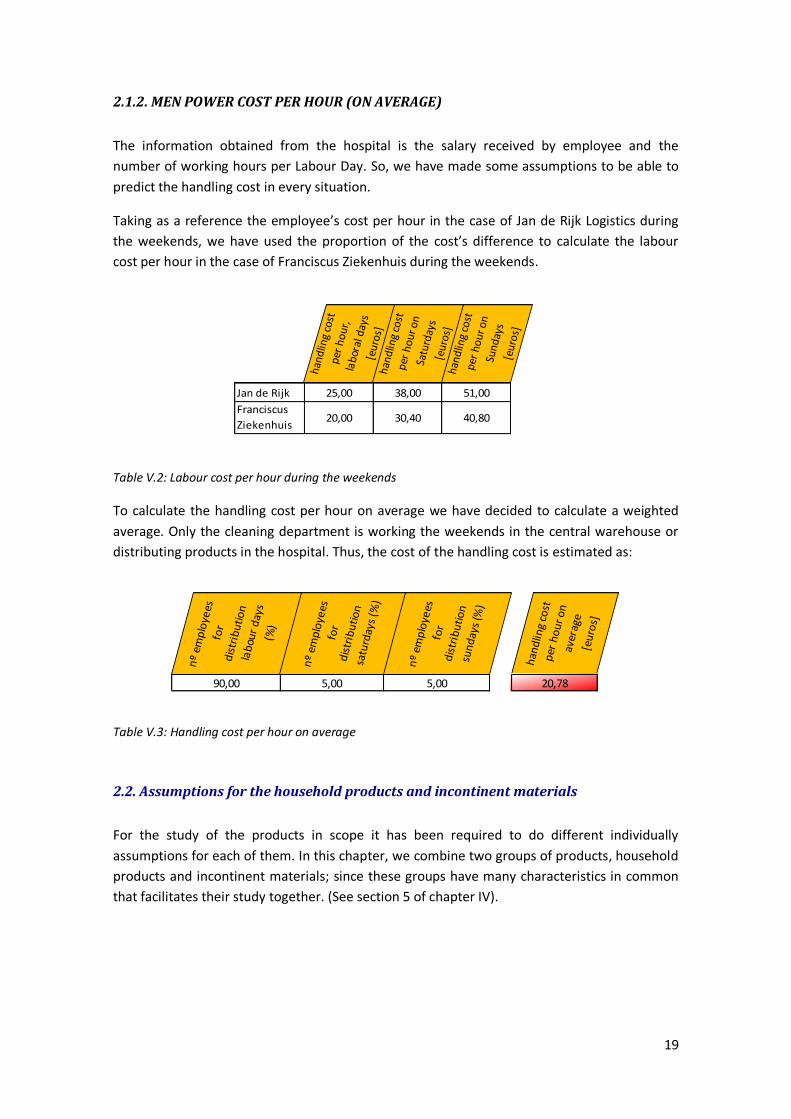
2.1.1. SQUARE METER’S DEPRECIATION RATE
The square meter’s depreciation rate is assumed as an 8% of the building price per year taking
as a reference other examples in the health care market in Netherlands. Thus, the final cost
per square meter, making use of the depreciation rate, is:
Dep
reci
atio
n ra
te
euro
s/m
2 at
th
e nu
rser
y de
part
men
ts
euro
s/m
2 at
th
e ce
ntra
l w
areh
ous
eeu
ros/
m2
at
the
unde
rgro
und
stor
age
Cost per square meter
per 20 years only taking
in account the original
price of the building.
0,00 1620,00 1150,00 1150,00
Cost per square meter
per year, taking in
account renewals, bank
interests,… .
0,08 129,60 92,00 92,00
Table V.1: Costs per square meter in each location room taking in account the square meter’s
depreciation rate
19
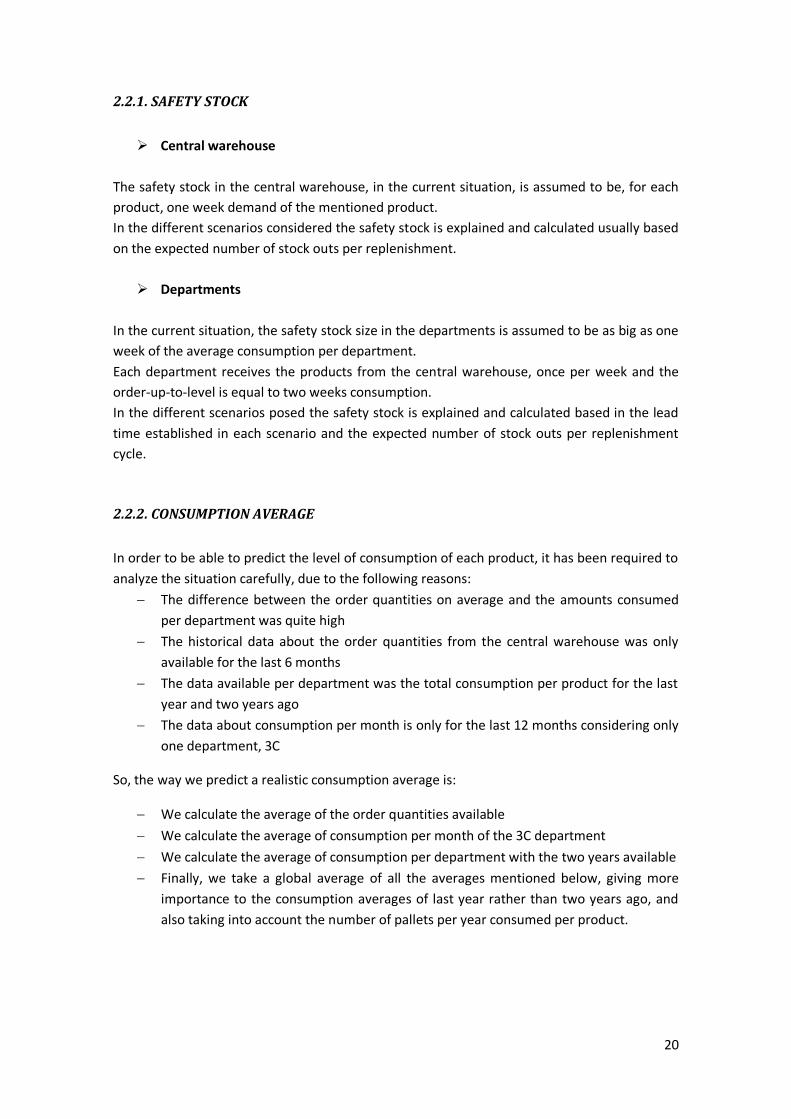
2.1.2. MEN POWER COST PER HOUR (ON AVERAGE)
The information obtained from the hospital is the salary received by employee and the
number of working hours per Labour Day. So, we have made some assumptions to be able to
predict the handling cost in every situation.
Taking as a reference the employee’s cost per hour in the case of Jan de Rijk Logistics during
the weekends, we have used the proportion of the cost’s difference to calculate the labour
cost per hour in the case of Franciscus Ziekenhuis during the weekends.
hand
ling
cost
pe
r ho
ur,
labo
ral d
ays
[eur
os]
hand
ling
cost
pe
r ho
ur o
n Sa
turd
ays
[eur
os]
hand
ling
cost
pe
r ho
ur o
n Su
nday
s [e
uros
]
Jan de Rijk 25,00 38,00 51,00
Franciscus
Ziekenhuis20,00 30,40 40,80
Table V.2: Labour cost per hour during the weekends
To calculate the handling cost per hour on average we have decided to calculate a weighted
average. Only the cleaning department is working the weekends in the central warehouse or
distributing products in the hospital. Thus, the cost of the handling cost is estimated as:
nº
emp
loye
es
for
dis
trib
uti
on
la
bou
r d
ays
(%)
nº
emp
loye
es
for
dis
trib
uti
on
sa
turd
ays
(%)
nº
emp
loye
es
for
dis
trib
uti
on
su
nd
ays
(%)
han
dlin
g co
st
per
ho
ur
on
av
erag
e [e
uro
s]
90,00 5,00 5,00 20,78
Table V.3: Handling cost per hour on average
2.2. Assumptions for the household products and incontinent materials
For the study of the products in scope it has been required to do different individually
assumptions for each of them. In this chapter, we combine two groups of products, household
products and incontinent materials; since these groups have many characteristics in common
that facilitates their study together. (See section 5 of chapter IV).
20
2.2.1. SAFETY STOCK
Central warehouse
The safety stock in the central warehouse, in the current situation, is assumed to be, for each
product, one week demand of the mentioned product.
In the different scenarios considered the safety stock is explained and calculated usually based
on the expected number of stock outs per replenishment.
Departments
In the current situation, the safety stock size in the departments is assumed to be as big as one
week of the average consumption per department.
Each department receives the products from the central warehouse, once per week and the
order-up-to-level is equal to two weeks consumption.
In the different scenarios posed the safety stock is explained and calculated based in the lead
time established in each scenario and the expected number of stock outs per replenishment
cycle.
2.2.2. CONSUMPTION AVERAGE
In order to be able to predict the level of consumption of each product, it has been required to
analyze the situation carefully, due to the following reasons:
The difference between the order quantities on average and the amounts consumed
per department was quite high
The historical data about the order quantities from the central warehouse was only
available for the last 6 months
The data available per department was the total consumption per product for the last
year and two years ago
The data about consumption per month is only for the last 12 months considering only
one department, 3C
So, the way we predict a realistic consumption average is:
We calculate the average of the order quantities available
We calculate the average of consumption per month of the 3C department
We calculate the average of consumption per department with the two years available
Finally, we take a global average of all the averages mentioned below, giving more
importance to the consumption averages of last year rather than two years ago, and
also taking into account the number of pallets per year consumed per product.

21
2.2.3. VOLUME OCCUPIED
Central warehouse
In the central warehouse the products are stored in pallets. We use the next formula to
calculate the volume occupied:
Where,
Q: order quantity per month, on average
s: safety stock
bp: boxes per pallet
ps: pallet size
The variables implied in this formula, can be described as follows:
The order quantities per product is based on an average consumption of the monthly
demands
The safety stock in the central warehouse is estimated as the same size as one week
demand
In each scenario we can change the time of replenishments, the order quantities, and
consequently the safety stock, or all of them
The maximum stock level is estimated as the sum of the order quantity received and
the safety stock
In this case, it is not needed to add a safety stock factor because the areas around the
pallets do not have to be used to manipulate the products
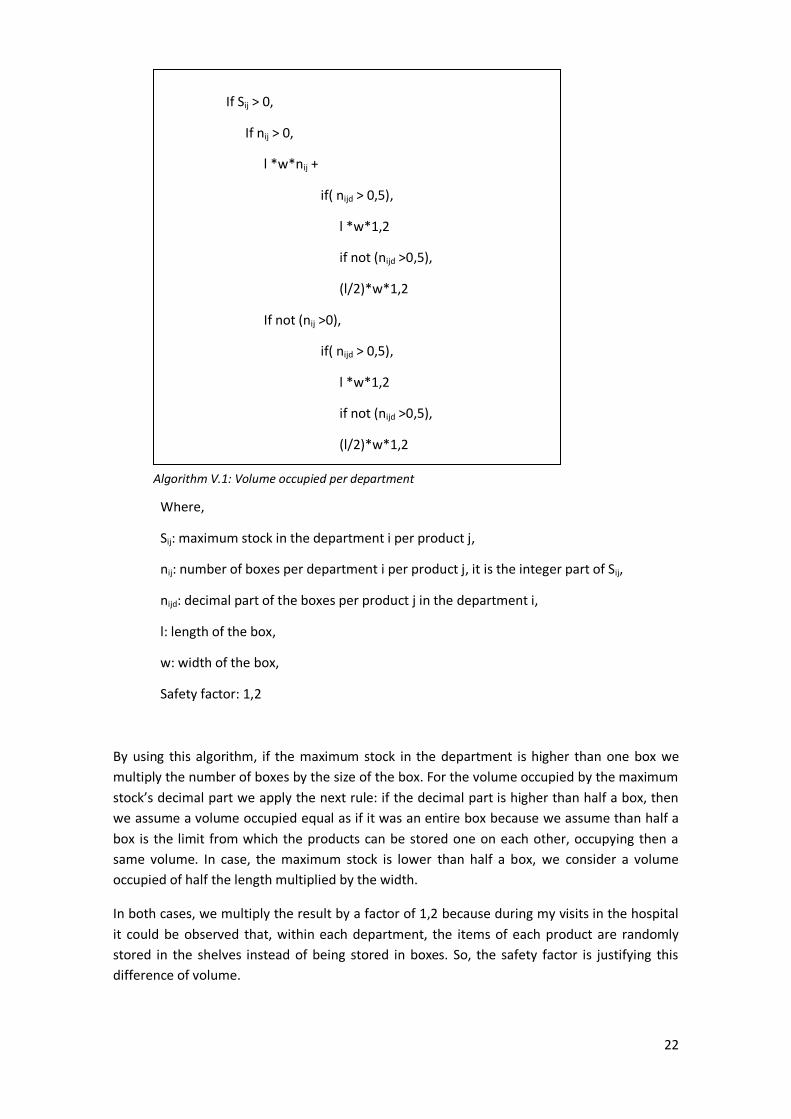
Departments
For each department and product we have calculated the volume occupied using the next
algorithm V.1 showed in the next page.
22
If Sij > 0,
If nij > 0,
l *w*nij +
if( nijd > 0,5),
l *w*1,2
if not (nijd >0,5),
(l/2)*w*1,2
If not (nij >0),
if( nijd > 0,5),
l *w*1,2
if not (nijd >0,5),
(l/2)*w*1,2
Where,
Sij: maximum stock in the department i per product j,
nij: number of boxes per department i per product j, it is the integer part of Sij,
nijd: decimal part of the boxes per product j in the department i,
l: length of the box,
w: width of the box,
Safety factor: 1,2
By using this algorithm, if the maximum stock in the department is higher than one box we
multiply the number of boxes by the size of the box. For the volume occupied by the maximum
stock’s decimal part we apply the next rule: if the decimal part is higher than half a box, then
we assume a volume occupied equal as if it was an entire box because we assume than half a
box is the limit from which the products can be stored one on each other, occupying then a
same volume. In case, the maximum stock is lower than half a box, we consider a volume
occupied of half the length multiplied by the width.
In both cases, we multiply the result by a factor of 1,2 because during my visits in the hospital
it could be observed that, within each department, the items of each product are randomly
stored in the shelves instead of being stored in boxes. So, the safety factor is justifying this
difference of volume.
Algorithm V.1: Volume occupied per department
23
The last assumption related with the volume is that: the volume occupied, in all the cases, is
measured with the maximum volume occupied.
The reason that explains this assumption is that the volume designated for a product cannot
be used for another purpose or product. Even when the total stock left of that product is the
safety stock, the area designated for the product has to be empty and available for the
receiving of future replenishments.
2.2.4. HANDLING COST
The estimation of the handling cost is not an easy task. Due to the current situation of
distributing the products from the central warehouse to the departments it is very hard to
assess the time spent in the management of each product individually.
In the Annex B of this report there is the weekly schedule of goods’ distribution per
departments. And it is here the handicap for the handling cost prediction: every day each
department is replenished until the order-up-to-level for all the products.
The ideal situation to predict in a precise way the handling cost would be that one day of the
week is chosen to replenish all the departments by one product. So, you can measure the time
required from the beginning to the end of the replenishing, multiplied by the number of
employees who are doing the mentioned replenishment.
But, the real situation is quite different. The distribution is made by departments instead of by
products. So, every day, there are different groups of employees and each group is the
responsible of the replenishment of some departments and with a high probability that all of
them are replenishing toilet paper.
So, we paid another visit to the hospital to follow and time one of the employees during all the
process of replenishing. The purpose was to predict the proportion of time spent for the
products in our study within the hundreds of products that are replenished every day. Once,
we had the prediction of the time in those days and those departments we extrapolated the
results to all the departments in order to do a closer approximation of the reality on average,
using the consumption of all the departments and the schedule of distribution per day found
in the Annex B.
Once we calculated the total time spent for the household and incontinent materials, we split
up the total time in the individual times for each product taking in account the consumption’s
weight of each product within the total.
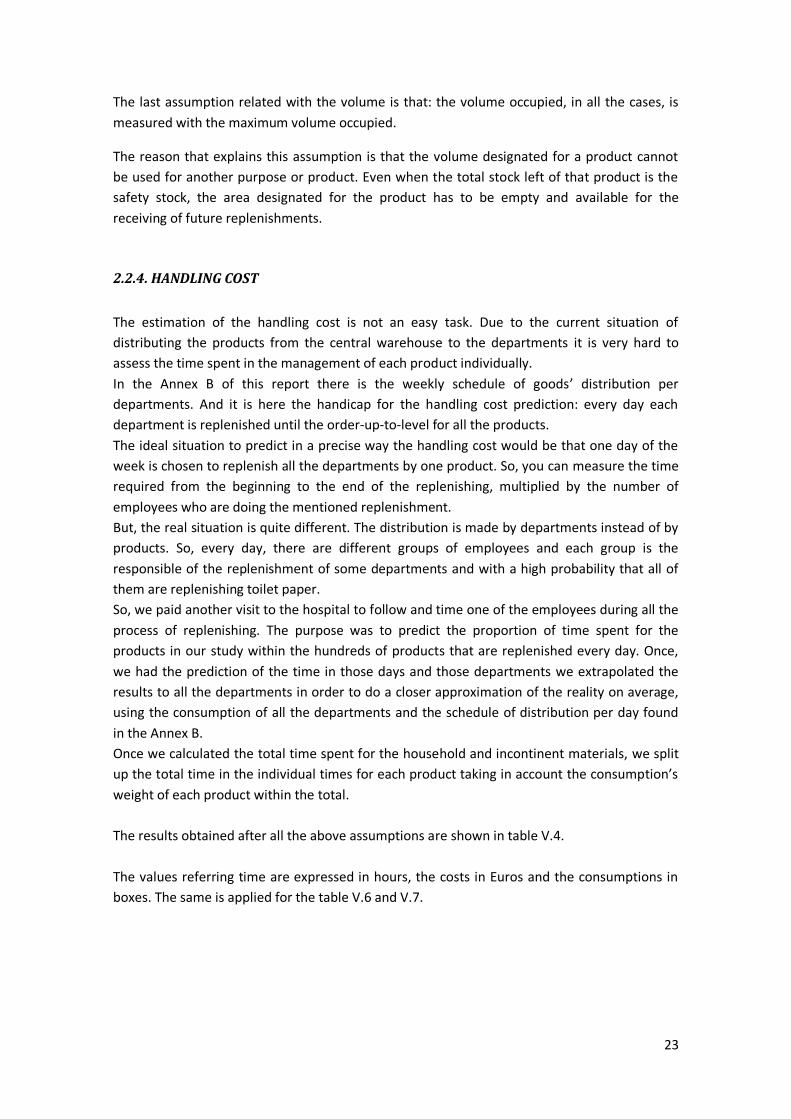
The results obtained after all the above assumptions are shown in table V.4.
The values referring time are expressed in hours, the costs in Euros and the consumptions in
boxes. The same is applied for the table V.6 and V.7.
24
Pro
du
ct
Per
cen
tage
of
the
tota
l h
and
ling
[%]
Tim
e fo
r u
nlo
adin
g th
e tr
uck
per
m
on
th
Tim
e fo
r h
and
ling:
sc
ann
ing,
p
icki
ng,
re
ple
nis
hin
g p
er m
on
th
Tota
l tim
e fo
r h
and
ling
per
m
on
th
Tota
l tim
e fo
r h
and
ling
per
ye
ar
Han
dlin
g co
st
per
mo
nth
han
dlin
g co
st
per
yea
r an
d
un
it
Ave
rage
C
on
sum
pti
on
p
er y
ear
Total 4
products1,00 0,69 7,00 7,69 92,25 159,75
WC paper
tissues0,35 0,24 2,45 2,69 32,29 55,91 0,90 744,00
Kleenex 0,20 0,14 1,40 1,54 18,45 31,95 0,45 852,00
Tena Bed 0,30 0,21 2,10 2,31 27,68 47,92 1,45 396,00
Tena Bed
Green0,15 0,10 1,05 1,15 13,84 23,96 2,66 108,00
Table V.4: Handling cost per year and unit per product in the current situation
*Obs. - The handling cost is calculated multiplying the handling time by the handling cost per hour,
explained in section 2.1.2.
2.3. Assumptions for sterile and dialyze products
We can also study together the two groups of products left due to their common
characteristics.
The assumptions done for this kind of products are explained as follows:
2.3.1. SAFETY STOCK
Departments
In the current situation, the safety´s stock size is one week demand
Central warehouse
These products are not stored in the central warehouse
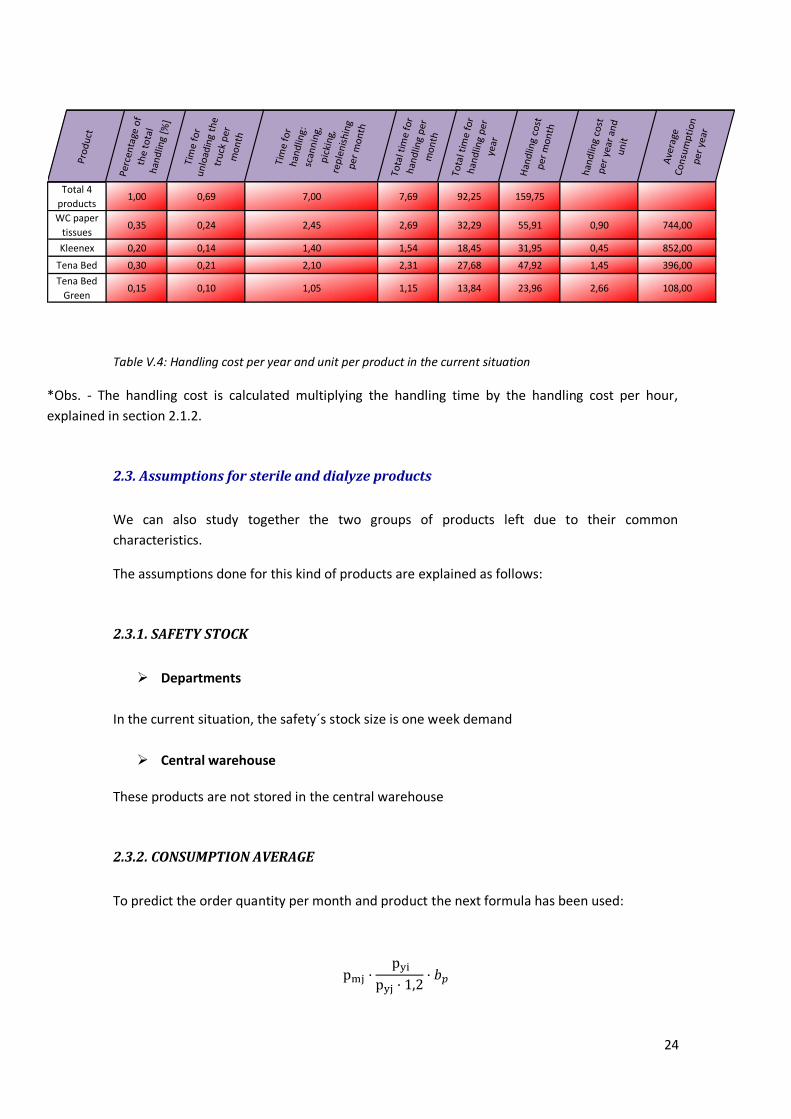
2.3.2. CONSUMPTION AVERAGE
To predict the order quantity per month and product the next formula has been used:
25
Where,
pmj: number of pallets per month for the group j; j: sterile or dialyze products
pyi: number of pallets per year per product i; i: products within the categories sterile
or dialyze
pyj: number of pallets per year ordered per all the category sterile or dialyze
bp: number of boxes per pallet
Safety factor: 1,2
Obs. - The safety factor in this case is required to make the result more realistic since the
pallets are not always full and it is determined after observations of the order quantities and
the consumptions of several months.
2.3.3. VOLUME OCCUPIED
As we mentioned before, in this group category the products are only stored in their
respective department, sterile or dialyze centre. Therefore, in each of these departments there
are the pallets of products for one month consumption and the safety stock.
The formula used to predict the volume occupied is the following one:
Where,
Q: order quantity per month, on average
s: safety stock
bp: boxes per pallet
ps: pallet size
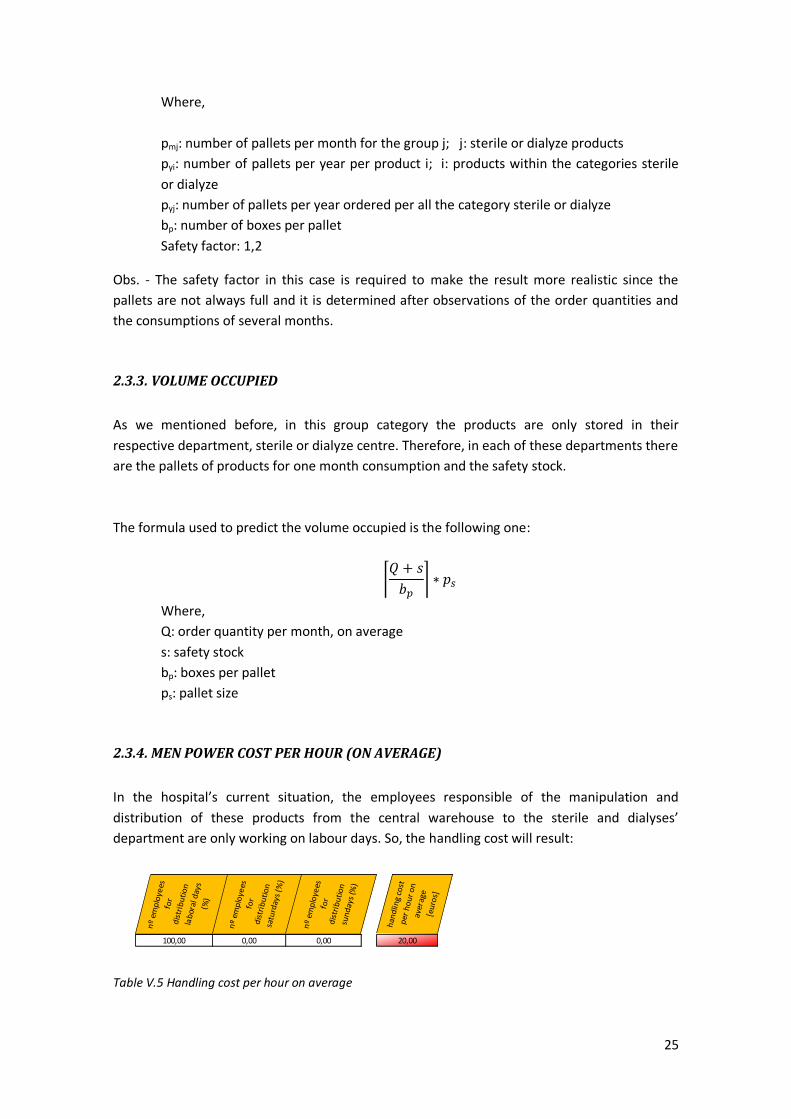
2.3.4. MEN POWER COST PER HOUR (ON AVERAGE)
In the hospital’s current situation, the employees responsible of the manipulation and
distribution of these products from the central warehouse to the sterile and dialyses’
department are only working on labour days. So, the handling cost will result:
nº
emp
loye
es
for
dis
trib
uti
on
la
bor
al d
ays
(%)
nº
emp
loye
es
for
dis
trib
uti
on
sa
turd
ays
(%)
nº
emp
loye
es
for
dis
trib
uti
on
su
nd
ays
(%)
han
dlin
g co
st
per
ho
ur
on
av
erag
e [e
uro
s]
100,00 0,00 0,00 20,00
Table V.5 Handling cost per hour on average
26
2.3.5. HANDLING COST
As we explained in the section 2.2.4 to predict the handling cost, some assumptions have to be
done because its approximation is not an easy task.
For this group category we use the same method explained in section 2.2.4 but taking in
account the times associated to dialyze and sterile products. In these times we consider that
the handling of the products includes the unloading of the truck and the replenishment from
the central warehouse to the department. Also, we have to add some time for scanning once
per week and the respective time to order the product quantities, but it is important to realize
that in this situation the products are not stored in the central warehouse, so, the
replenishments once per week are not needed. In this case, on the one hand the handling cost
decrease, but on the other the volume occupied in the departments increase.
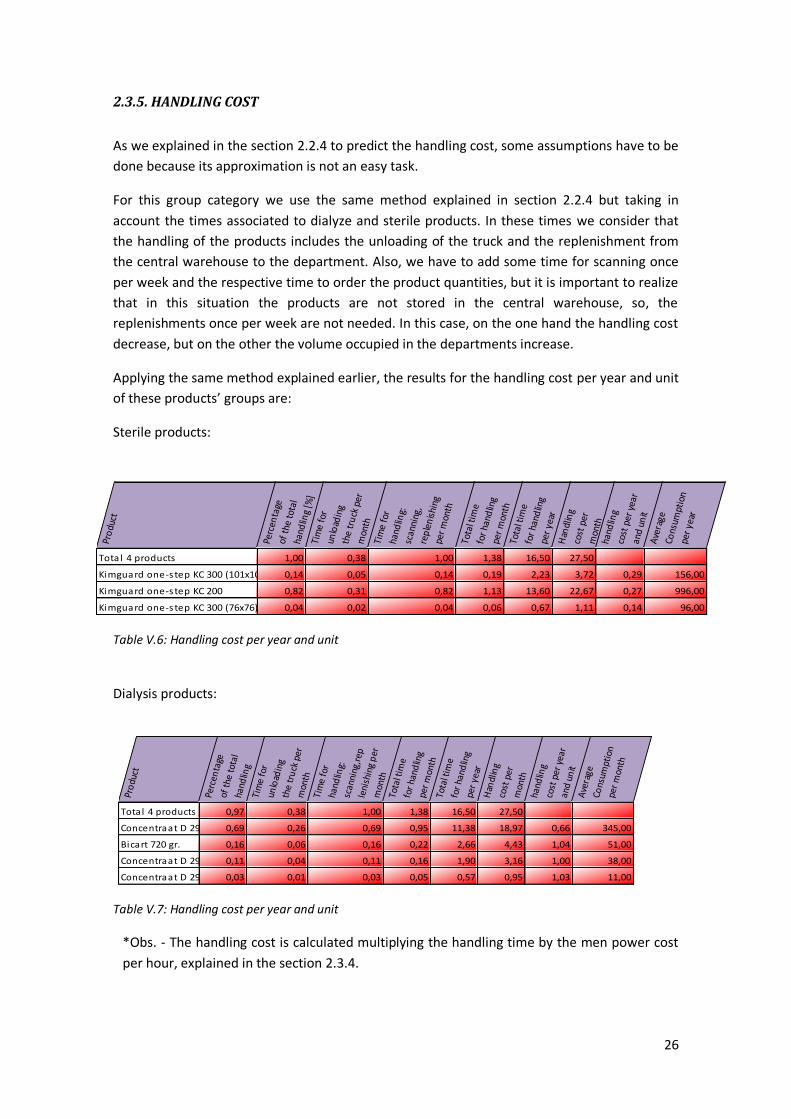
Applying the same method explained earlier, the results for the handling cost per year and unit
of these products’ groups are:
Sterile products:
Table V.6: Handling cost per year and unit
Dialysis products:
Table V.7: Handling cost per year and unit
*Obs. - The handling cost is calculated multiplying the handling time by the men power cost
per hour, explained in the section 2.3.4.
Pro
duct
Perc
enta
ge
of t
he t
otal
ha
ndlin
g [%
]Ti
me
for
unlo
adin
g th
e tr
uck
per
m
onth
Tim
e fo
r ha
ndlin
g:
scan
ning
, re
ple
nis
hing
pe
r m
onth
Tota
l tim
e fo
r ha
ndlin
g pe
r m
onth
To
tal t
ime
for
hand
ling
per
year
H
andl
ing
cost
per
m
onth
hand
ling
cost
per
yea
r an
d un
it A
vera
ge
Cons
umpt
ion
per
year
Tota l 4 products 1,00 0,38 1,00 1,38 16,50 27,50
Kimguard one-step KC 300 (101x101) 0,14 0,05 0,14 0,19 2,23 3,72 0,29 156,00
Kimguard one-step KC 200 0,82 0,31 0,82 1,13 13,60 22,67 0,27 996,00
Kimguard one-step KC 300 (76x76) 0,04 0,02 0,04 0,06 0,67 1,11 0,14 96,00
Pro
duct
Perc
enta
ge
of t
he t
otal
ha
ndlin
g Ti
me
for
unlo
adin
g th
e tr
uck
per
m
onth
Ti
me
for
hand
ling:
sc
anni
ng,r
eple
nish
ing
per
m
onth
To
tal t
ime
for
hand
ling
per
mon
thTo
tal t
ime
for
hand
ling
per
year
H
andl
ing
cost
per
m
onth
ha
ndlin
g co
st p
er y
ear
and
unit
Ave
rage
Co
nsum
ptio
n pe
r m
onth
Tota l 4 products 0,97 0,38 1,00 1,38 16,50 27,50
Concentraat D 294 0,69 0,26 0,69 0,95 11,38 18,97 0,66 345,00
Bicart 720 gr. 0,16 0,06 0,16 0,22 2,66 4,43 1,04 51,00
Concentraat D 292 0,11 0,04 0,11 0,16 1,90 3,16 1,00 38,00
Concentraat D 296 0,03 0,01 0,03 0,05 0,57 0,95 1,03 11,00
27
Chapter VI. Analysis of the Current situation
The goal of this chapter is to analyze the costs in the current situation of the products in scope
within the hospital. There are several reasons why these calculations are important, such as
realizing how the improvements in the supply chain of the products in study will affect the
entire hospital and being able to analyze the results of all the scenarios studied in further
chapters. The outcomes of this chapter are the inventory costs per year of all the products in
the current situation.
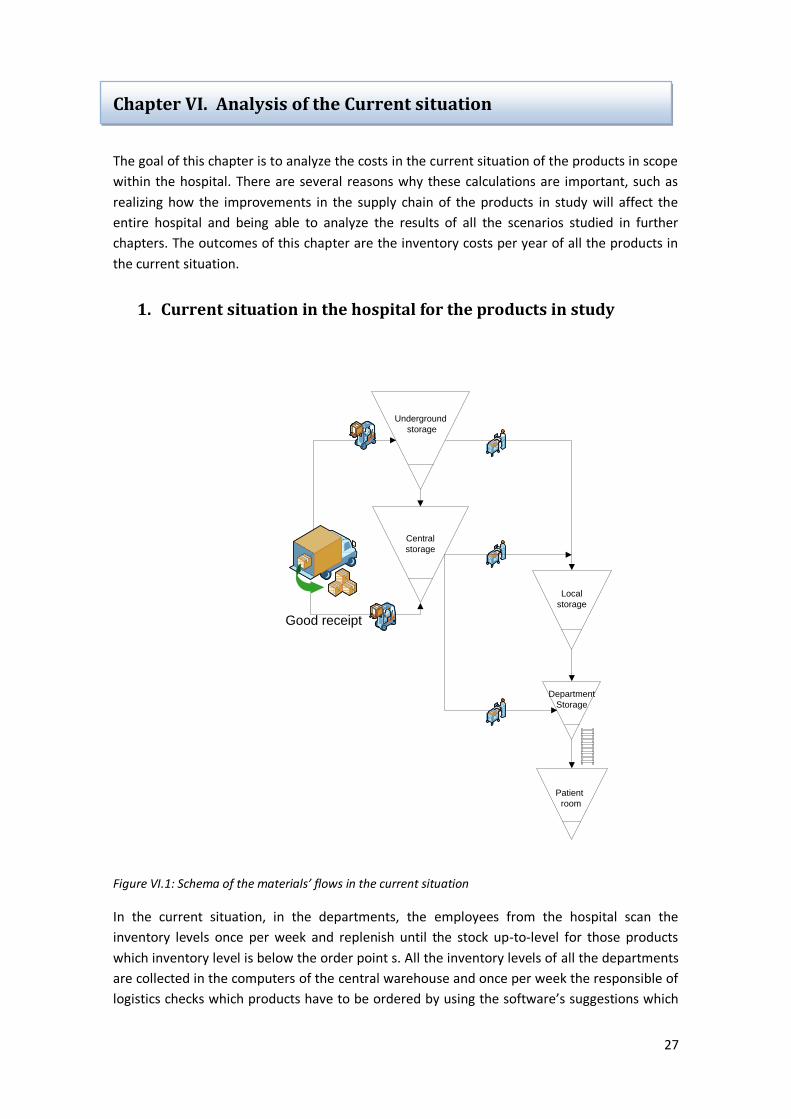
1. Current situation in the hospital for the products in study
Good receipt
Underground
storage
Central
storage
Local
storage
Patient
room
Department
Storage
Figure VI.1: Schema of the materials’ flows in the current situation
In the current situation, in the departments, the employees from the hospital scan the
inventory levels once per week and replenish until the stock up-to-level for those products
which inventory level is below the order point s. All the inventory levels of all the departments
are collected in the computers of the central warehouse and once per week the responsible of
logistics checks which products have to be ordered by using the software’s suggestions which
28
informs about the products which inventory levels are below the reorder point in the central
warehouse.
Usually for the products in this study the demand is pretty stable and the replenishment cycle
in the central warehouse uses to be one month.
Only for the sterile and dialyze products the procedure is different. The reason is that these
products are only stored in the department where they are used. So, the replenishments are
done once per month, when the shipment from the supplier arrives. The review period,
scanning, in the departments for these products, is also one week, but since the demand is
quite stable the orders are usually done once per month. Therefore, a big stock is stored in
those departments.
2. Mathematical model for the costs’ calculations in the current
situation
In this section we explain the methods used for the costs’ calculations in the analysis in a
general way and based on literature (Silver, Pyke, & Peterson, 1998) (Coyle, Bardi, & Langley,
2003) (Viale, 1996) (Witzier, 1986)
Since the real cases always differ from the theoretical models the first challenge for the
analysis is to look for a way to approximate the costs in the reality as best as possible.
The supply chain of the products in study follows an arborescent situation with stock at the
Central warehouse (Silver, Pyke, & Peterson, 1998), where there are three types of decisions:
the amount the warehouse should order from its supplier, the amount to ship from the
warehouse to the departments each period, and the amount to allocate to each department
when stock runs short.
We assume that each department (i) orders from a single warehouse according to an (Ri, si, Si)
policy, and that the warehouse employs also an (Rw,sw, Sw). All the locations use the same
review period, R. These policies are reasonable because the warehouse orders on a regular
basis from their supplier. In the current situation, trucks are dispatched every month
approximately, and the departments must determine how much to order each week. Demand
is assumed to follow a Gamma distribution and a shortage cost is applied.
We would like to clarify that the (R,s,S) system is a combination of (s,S) and (R,S) systems. The
concept is that every R units of time the inventory position is checked. If it is at or below the
order point s, it is ordered enough to rise to S. If the position is above s, nothing is done until at
least the next review.
Throughout this report we consider different models of calculations according the different
scenarios posed. In each scenario we fix some variables and we modify others. In the case of
the current situation, we are facing a fixed reorder cycle inventory model.
29
We establish this model to approach the current situation because the replenishments follow
fixed time periods (R). That is to say, the replenishments are always done once per week and
the order quantity is the variable which amount varies to achieve the order-up-to-level in each
review period.
3. Costs per product
In order to calculate the inventory costs for all the products, some intermediate calculations
are required for obtaining some variables implied in the formulas. The rest of the values used
in the formulas are the result of the assumptions explained in chapter 4 and shown in tables in
the Annex A.
Obviously, next to the tables expressed in this chapter we write the basic steps done in the
calculations in order to clarify the process. However, since the process followed is the same for
all the products we only explain the steps done in the case of the first product: WC toilet
paper, for the rest we only mention some information if it is needed. Moreover the
development of the costs is only developed in the case of the toilet paper in the report, for the
developments of the rest of the products see Annex D.
The intermediate calculations are done to calculate the lead times, the probability of stock
outs and the reorders points for all the locations, which are used in the costs formulas.
We would like to remind that the models are approached by a (R,s,S) system, explained in the
section above and in general all the variables that appear in this chapter are explained in the
chapter above.
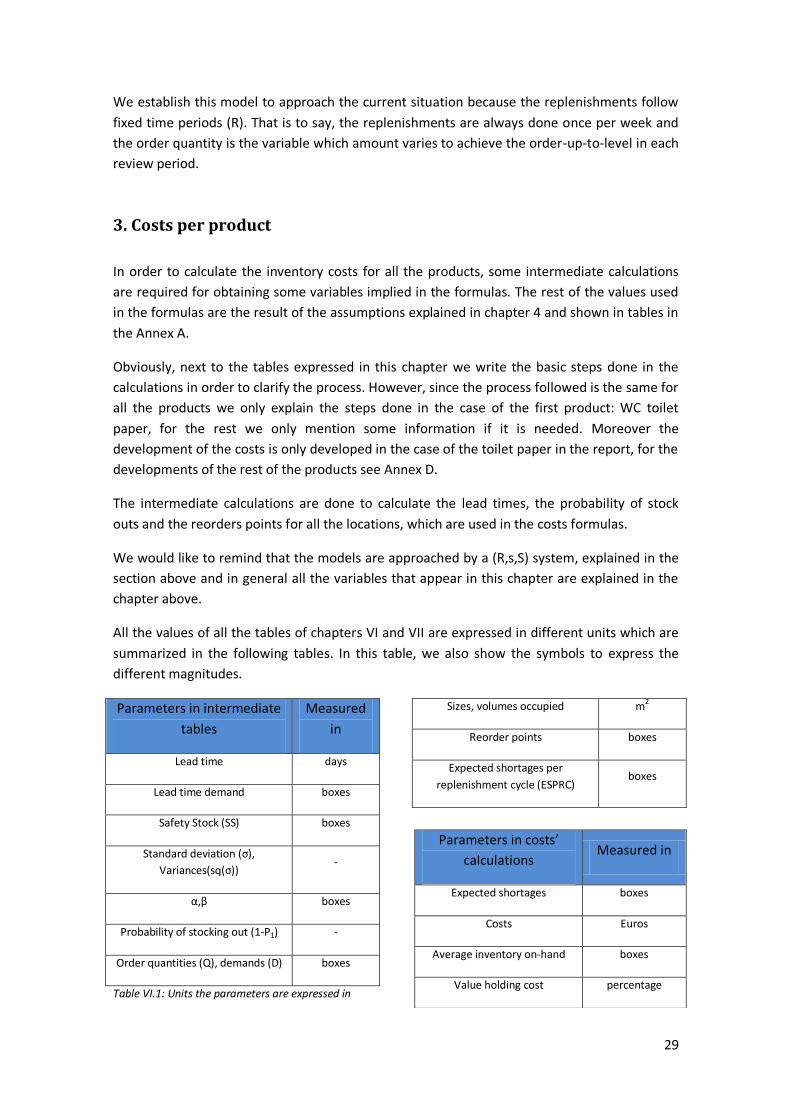
All the values of all the tables of chapters VI and VII are expressed in different units which are
summarized in the following tables. In this table, we also show the symbols to express the
different magnitudes.
Parameters in intermediate
tables
Measured
in
Lead time days
Lead time demand boxes
Safety Stock (SS) boxes
Standard deviation (σ),
Variances(sq(σ)) -
α,β boxes
Probability of stocking out (1-P1) -
Order quantities (Q), demands (D) boxes
Sizes, volumes occupied m2
Reorder points boxes
Expected shortages per
replenishment cycle (ESPRC) boxes
Table VI.1: Units the parameters are expressed in
Parameters in costs’
calculations Measured in
Expected shortages boxes
Costs Euros
Average inventory on-hand boxes
Value holding cost percentage
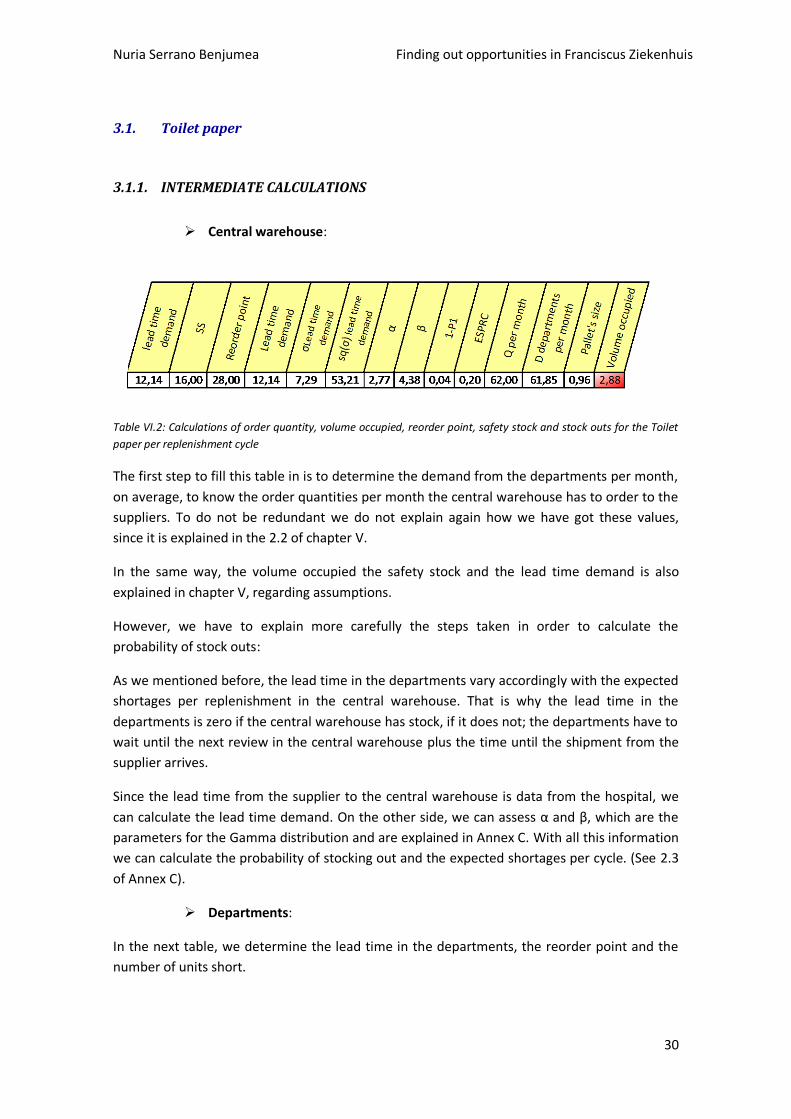
Nuria Serrano Benjumea Finding out opportunities in Franciscus Ziekenhuis
30
3.1. Toilet paper
3.1.1. INTERMEDIATE CALCULATIONS
Central warehouse:
Table VI.2: Calculations of order quantity, volume occupied, reorder point, safety stock and stock outs for the Toilet
paper per replenishment cycle
The first step to fill this table in is to determine the demand from the departments per month,
on average, to know the order quantities per month the central warehouse has to order to the
suppliers. To do not be redundant we do not explain again how we have got these values,
since it is explained in the 2.2 of chapter V.
In the same way, the volume occupied the safety stock and the lead time demand is also
explained in chapter V, regarding assumptions.
However, we have to explain more carefully the steps taken in order to calculate the
probability of stock outs:
As we mentioned before, the lead time in the departments vary accordingly with the expected
shortages per replenishment in the central warehouse. That is why the lead time in the
departments is zero if the central warehouse has stock, if it does not; the departments have to
wait until the next review in the central warehouse plus the time until the shipment from the
supplier arrives.
Since the lead time from the supplier to the central warehouse is data from the hospital, we
can calculate the lead time demand. On the other side, we can assess α and β, which are the
parameters for the Gamma distribution and are explained in Annex C. With all this information
we can calculate the probability of stocking out and the expected shortages per cycle. (See 2.3
of Annex C).
Departments:
In the next table, we determine the lead time in the departments, the reorder point and the
number of units short.
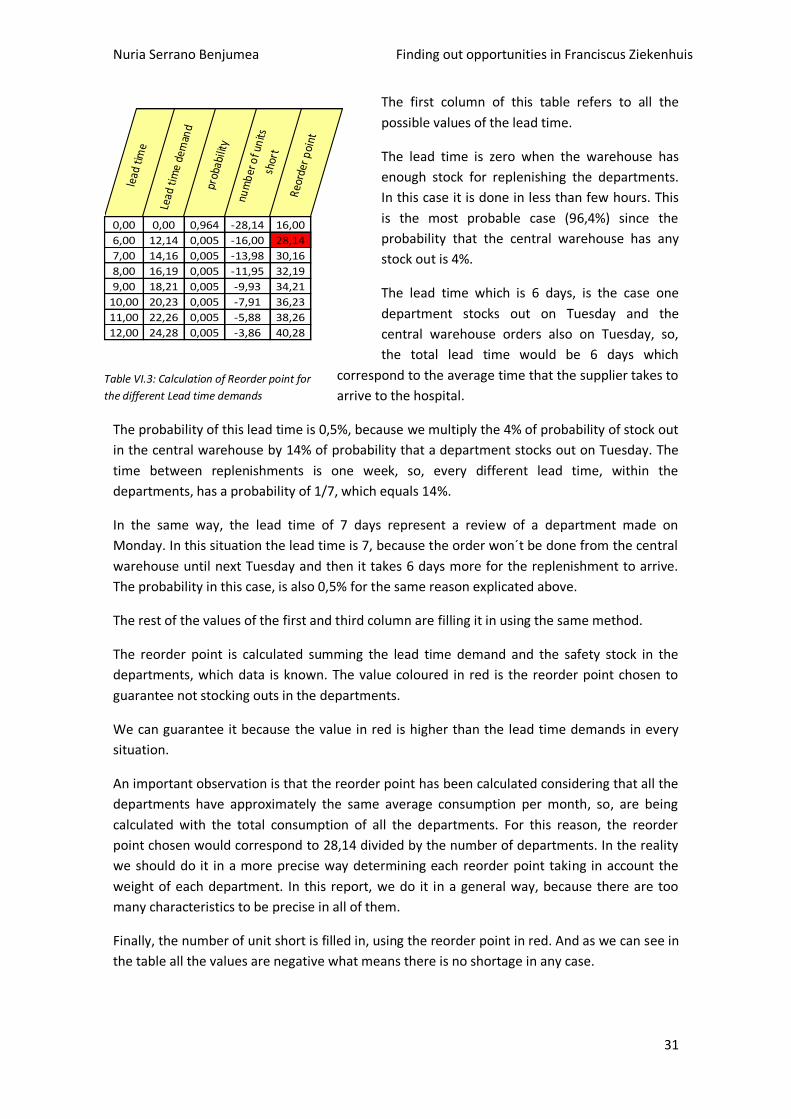
Nuria Serrano Benjumea Finding out opportunities in Franciscus Ziekenhuis
31
The first column of this table refers to all the
possible values of the lead time.
The lead time is zero when the warehouse has
enough stock for replenishing the departments.
In this case it is done in less than few hours. This
is the most probable case (96,4%) since the
probability that the central warehouse has any
stock out is 4%.
The lead time which is 6 days, is the case one
department stocks out on Tuesday and the
central warehouse orders also on Tuesday, so,
the total lead time would be 6 days which
correspond to the average time that the supplier takes to
arrive to the hospital.
The probability of this lead time is 0,5%, because we multiply the 4% of probability of stock out
in the central warehouse by 14% of probability that a department stocks out on Tuesday. The
time between replenishments is one week, so, every different lead time, within the
departments, has a probability of 1/7, which equals 14%.
In the same way, the lead time of 7 days represent a review of a department made on
Monday. In this situation the lead time is 7, because the order won´t be done from the central
warehouse until next Tuesday and then it takes 6 days more for the replenishment to arrive.
The probability in this case, is also 0,5% for the same reason explicated above.
The rest of the values of the first and third column are filling it in using the same method.
The reorder point is calculated summing the lead time demand and the safety stock in the
departments, which data is known. The value coloured in red is the reorder point chosen to
guarantee not stocking outs in the departments.
We can guarantee it because the value in red is higher than the lead time demands in every
situation.
An important observation is that the reorder point has been calculated considering that all the
departments have approximately the same average consumption per month, so, are being
calculated with the total consumption of all the departments. For this reason, the reorder
point chosen would correspond to 28,14 divided by the number of departments. In the reality
we should do it in a more precise way determining each reorder point taking in account the
weight of each department. In this report, we do it in a general way, because there are too
many characteristics to be precise in all of them.
Finally, the number of unit short is filled in, using the reorder point in red. And as we can see in
the table all the values are negative what means there is no shortage in any case.
lead
tim
e
Lead
tim
e de
man
d
prob
abili
ty
num
ber
of u
nits
sh
ort
Reo
rder
poi
nt
0,00 0,00 0,964 -28,14 16,00
6,00 12,14 0,005 -16,00 28,14
7,00 14,16 0,005 -13,98 30,16
8,00 16,19 0,005 -11,95 32,19
9,00 18,21 0,005 -9,93 34,21
10,00 20,23 0,005 -7,91 36,23
11,00 22,26 0,005 -5,88 38,26
12,00 24,28 0,005 -3,86 40,28
Table VI.3: Calculation of Reorder point for
the different Lead time demands
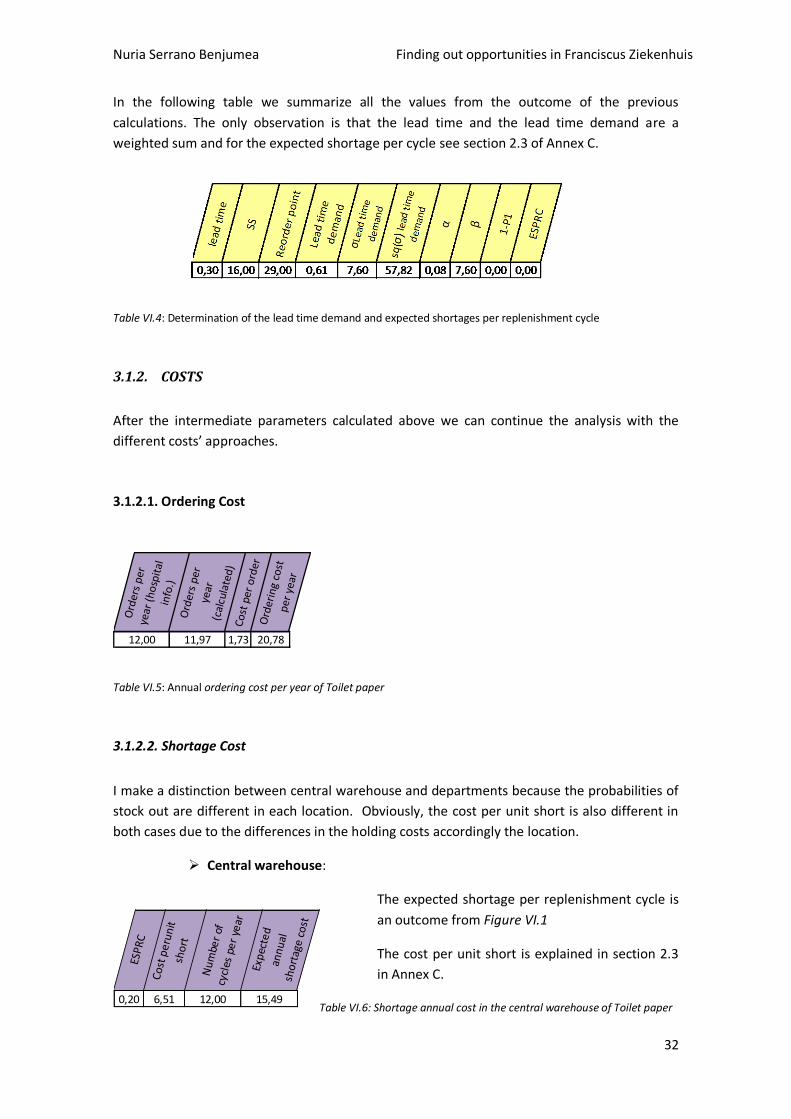
Nuria Serrano Benjumea Finding out opportunities in Franciscus Ziekenhuis
32
In the following table we summarize all the values from the outcome of the previous
calculations. The only observation is that the lead time and the lead time demand are a
weighted sum and for the expected shortage per cycle see section 2.3 of Annex C.
Table VI.4: Determination of the lead time demand and expected shortages per replenishment cycle
3.1.2. COSTS
After the intermediate parameters calculated above we can continue the analysis with the
different costs’ approaches.
3.1.2.1. Ordering Cost
Ord
ers
per
ye
ar (
ho
spit
al
info
.)O
rder
s p
er
year
(c
alcu
late
d)
Co
st p
er o
rder
Ord
erin
g co
st
per
yea
r
12,00 11,97 1,73 20,78
Table VI.5: Annual ordering cost per year of Toilet paper
3.1.2.2. Shortage Cost
I make a distinction between central warehouse and departments because the probabilities of
stock out are different in each location. Obviously, the cost per unit short is also different in
both cases due to the differences in the holding costs accordingly the location.
Central warehouse:
The expected shortage per replenishment cycle is
an outcome from Figure VI.1
The cost per unit short is explained in section 2.3
in Annex C.
ESP
RC
Co
st p
eru
nit
sh
ort
Nu
mbe
r of
cy
cles
pe
r ye
ar
Exp
ecte
d
ann
ual
sh
ort
age
co
st
0,20 6,51 12,00 15,49Table VI.6: Shortage annual cost in the central warehouse of Toilet paper
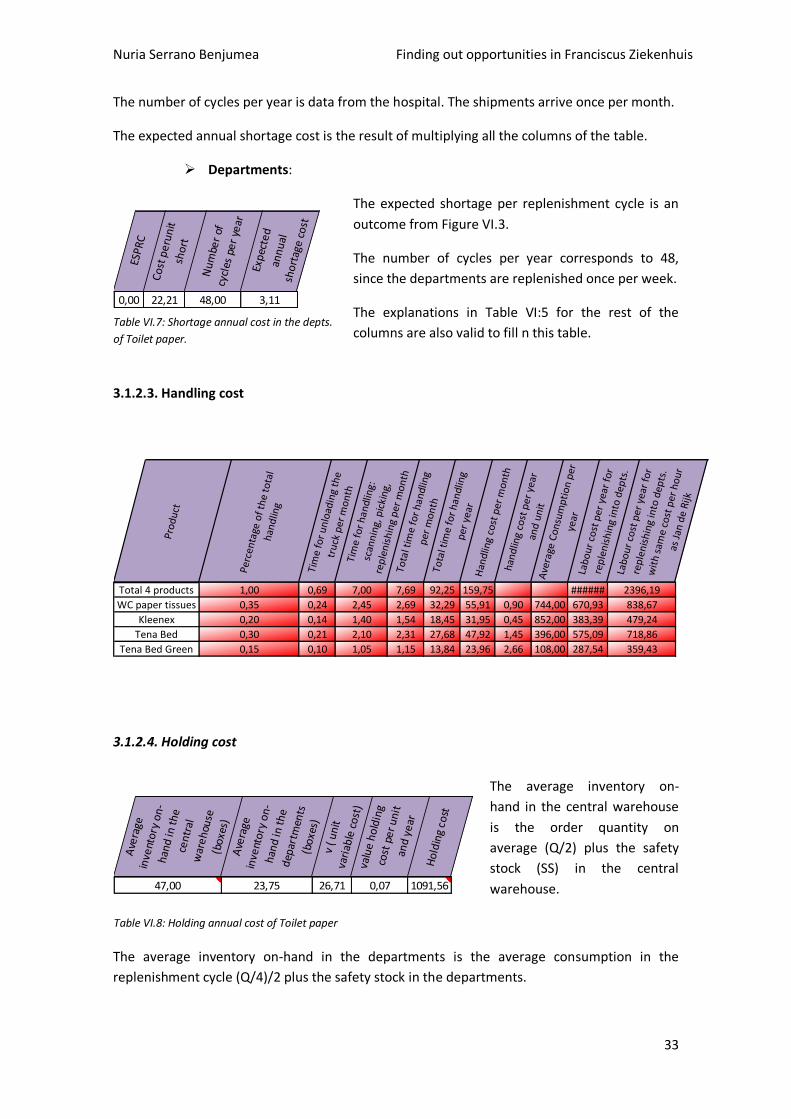
Nuria Serrano Benjumea Finding out opportunities in Franciscus Ziekenhuis
33
The number of cycles per year is data from the hospital. The shipments arrive once per month.
The expected annual shortage cost is the result of multiplying all the columns of the table.
Departments:
The expected shortage per replenishment cycle is an
outcome from Figure VI.3.
The number of cycles per year corresponds to 48,
since the departments are replenished once per week.
The explanations in Table VI:5 for the rest of the
columns are also valid to fill n this table.
3.1.2.3. Handling cost
Pro
du
ct
Per
cen
tage
of
the
tota
l h
and
ling
Tim
e fo
r u
nlo
adin
g th
e tr
uck
per
mo
nth
Tim
e fo
r h
andl
ing:
sc
ann
ing,
pic
kin
g,
rep
len
ish
ing
per
mo
nth
Tota
l tim
e fo
r h
andl
ing
per
mo
nth
Tota
l tim
e fo
r h
andl
ing
per
yea
rH
and
ling
cost
per
mo
nth
han
dlin
g co
st p
er y
ear
and
un
itA
vera
ge C
on
sum
pti
on
per
ye
ar
Lab
ou
r co
st p
er y
ear
for
rep
len
ish
ing
into
dep
ts.
Lab
ou
r co
st p
er y
ear
for
rep
len
ish
ing
into
dep
ts.
wit
h s
ame
cost
per
ho
ur
as J
an d
e R
ijk
Total 4 products 1,00 0,69 7,00 7,69 92,25 159,75 ###### 2396,19
WC paper tissues 0,35 0,24 2,45 2,69 32,29 55,91 0,90 744,00 670,93 838,67
Kleenex 0,20 0,14 1,40 1,54 18,45 31,95 0,45 852,00 383,39 479,24
Tena Bed 0,30 0,21 2,10 2,31 27,68 47,92 1,45 396,00 575,09 718,86
Tena Bed Green 0,15 0,10 1,05 1,15 13,84 23,96 2,66 108,00 287,54 359,43
3.1.2.4. Holding cost
The average inventory on-
hand in the central warehouse
is the order quantity on
average (Q/2) plus the safety
stock (SS) in the central
warehouse.
The average inventory on-hand in the departments is the average consumption in the
replenishment cycle (Q/4)/2 plus the safety stock in the departments.
Ave
rage
in
vent
ory
on
-h
and
in t
he
cen
tral
w
are
hou
se
(bo
xes)
Ave
rage
in
vent
ory
on
-h
and
in t
he
dep
artm
ents
(b
oxe
s)v
( u
nit
va
riab
le c
ost
)va
lue
ho
ldin
g co
st p
er
un
it
and
ye
ar
Ho
ldin
g co
st
47,00 23,75 26,71 0,07 1091,56
ESP
RC
Co
st p
eru
nit
sh
ort
Nu
mbe
r of
cy
cles
pe
r ye
ar
Exp
ecte
d
ann
ual
sh
ort
age
co
st0,00 22,21 48,00 3,11
Table VI.7: Shortage annual cost in the depts.
of Toilet paper.
Table VI.8: Holding annual cost of Toilet paper
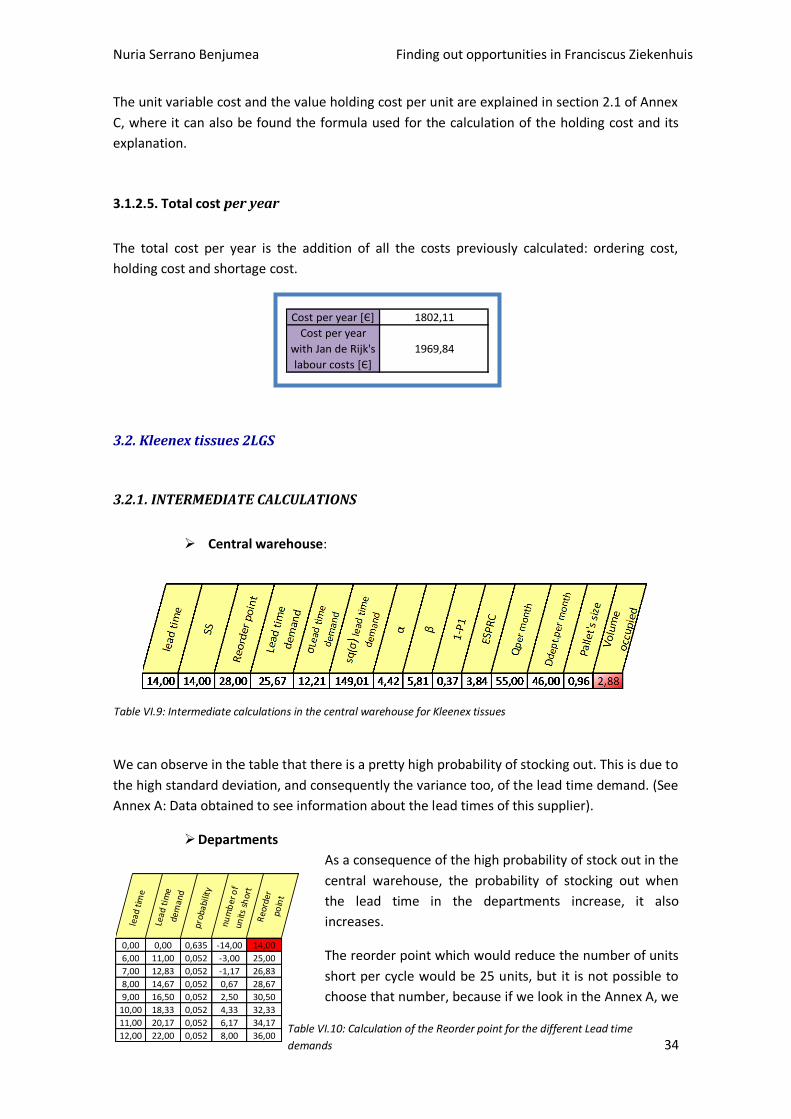
Nuria Serrano Benjumea Finding out opportunities in Franciscus Ziekenhuis
34
The unit variable cost and the value holding cost per unit are explained in section 2.1 of Annex
C, where it can also be found the formula used for the calculation of the holding cost and its
explanation.
3.1.2.5. Total cost per year
The total cost per year is the addition of all the costs previously calculated: ordering cost,
holding cost and shortage cost.
Cost per year *Є+ 1802,11
Cost per year
with Jan de Rijk's
labour costs *Є+
1969,84
3.2. Kleenex tissues 2LGS
3.2.1. INTERMEDIATE CALCULATIONS
Central warehouse:
We can observe in the table that there is a pretty high probability of stocking out. This is due to
the high standard deviation, and consequently the variance too, of the lead time demand. (See
Annex A: Data obtained to see information about the lead times of this supplier).
Departments
As a consequence of the high probability of stock out in the
central warehouse, the probability of stocking out when
the lead time in the departments increase, it also
increases.
The reorder point which would reduce the number of units
short per cycle would be 25 units, but it is not possible to
choose that number, because if we look in the Annex A, we
lead
tim
e
Lead
tim
e de
man
d
prob
abili
ty
num
ber
of
units
sh
ort
Reo
rder
po
int
0,00 0,00 0,635 -14,00 14,00
6,00 11,00 0,052 -3,00 25,00
7,00 12,83 0,052 -1,17 26,83
8,00 14,67 0,052 0,67 28,67
9,00 16,50 0,052 2,50 30,50
10,00 18,33 0,052 4,33 32,33
11,00 20,17 0,052 6,17 34,17
12,00 22,00 0,052 8,00 36,00
Table VI.9: Intermediate calculations in the central warehouse for Kleenex tissues
Table VI.10: Calculation of the Reorder point for the different Lead time
demands
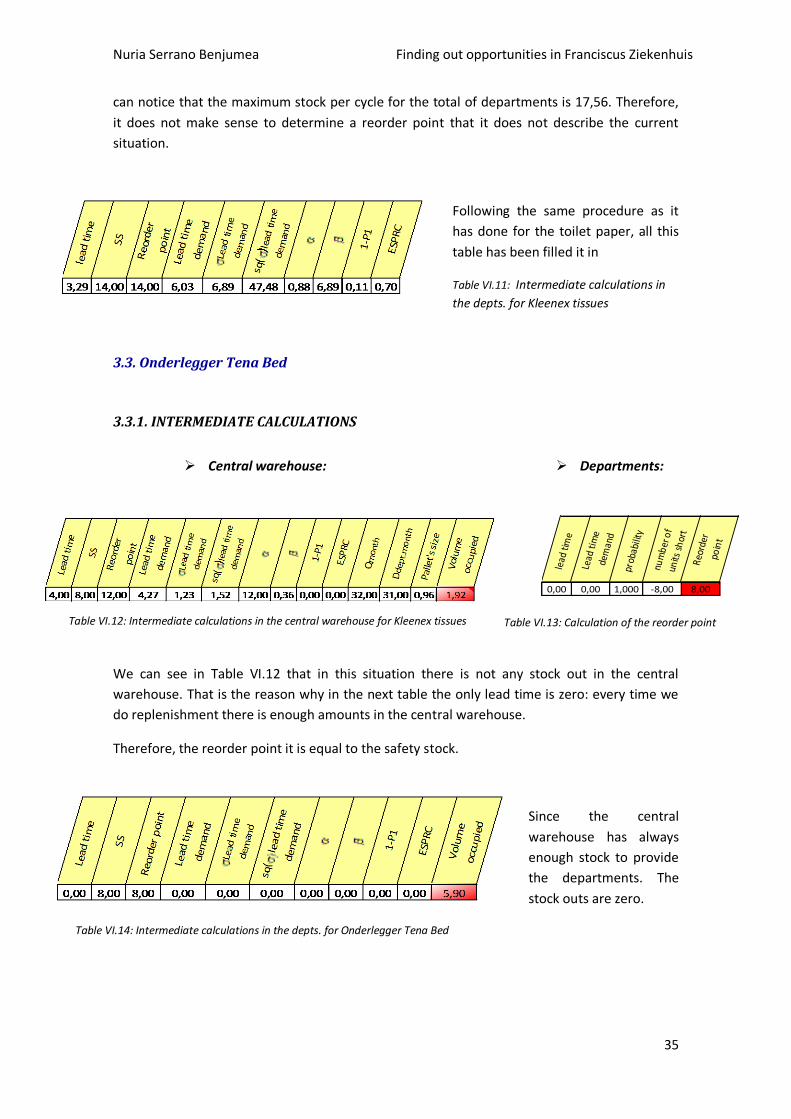
Nuria Serrano Benjumea Finding out opportunities in Franciscus Ziekenhuis
35
can notice that the maximum stock per cycle for the total of departments is 17,56. Therefore,
it does not make sense to determine a reorder point that it does not describe the current
situation.
Following the same procedure as it
has done for the toilet paper, all this
table has been filled it in
Table VI.11: Intermediate calculations in
the depts. for Kleenex tissues
3.3. Onderlegger Tena Bed
3.3.1. INTERMEDIATE CALCULATIONS
Central warehouse:
Departments:
Table VI.12: Intermediate calculations in the central warehouse for Kleenex tissues
We can see in Table VI.12 that in this situation there is not any stock out in the central
warehouse. That is the reason why in the next table the only lead time is zero: every time we
do replenishment there is enough amounts in the central warehouse.
Therefore, the reorder point it is equal to the safety stock.
Since the central
warehouse has always
enough stock to provide
the departments. The
stock outs are zero.
Table VI.14: Intermediate calculations in the depts. for Onderlegger Tena Bed
lead
tim
e
Lead
tim
e de
man
d
prob
abili
ty
num
ber
of
units
sh
ort
Reo
rder
po
int
0,00 0,00 1,000 -8,00 8,00
Table VI.13: Calculation of the reorder point
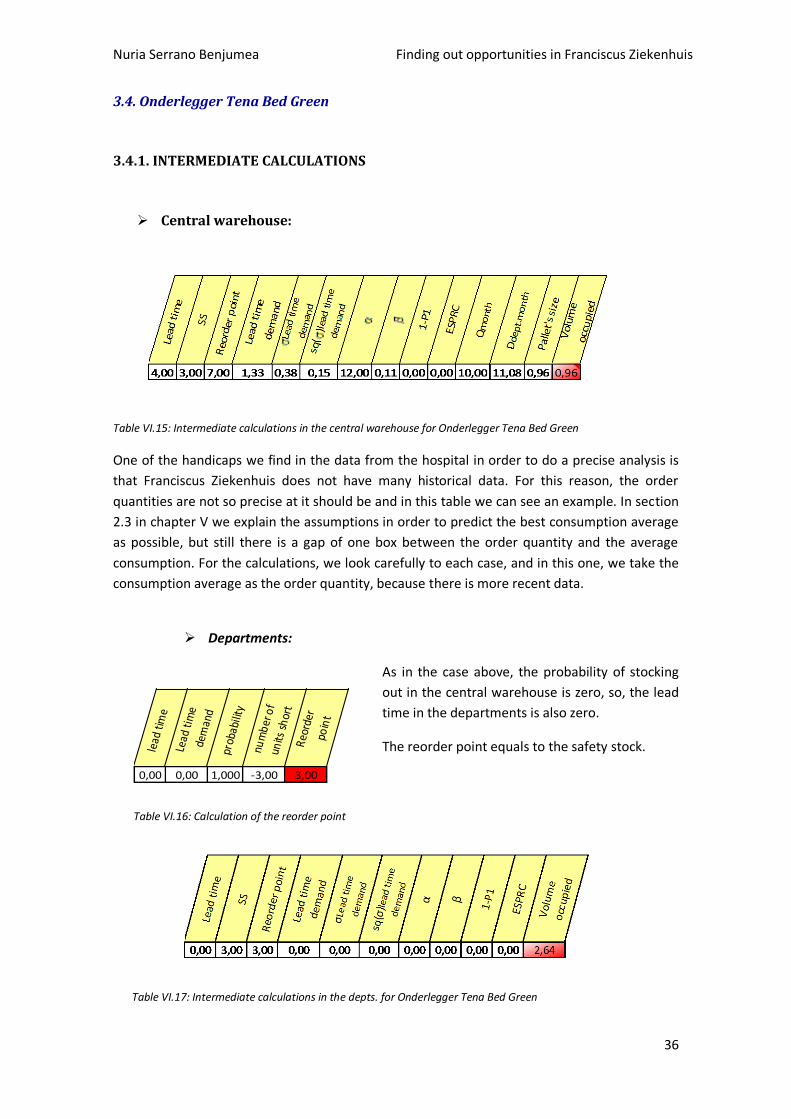
Nuria Serrano Benjumea Finding out opportunities in Franciscus Ziekenhuis
36
3.4. Onderlegger Tena Bed Green
3.4.1. INTERMEDIATE CALCULATIONS
Central warehouse:
Table VI.15: Intermediate calculations in the central warehouse for Onderlegger Tena Bed Green
One of the handicaps we find in the data from the hospital in order to do a precise analysis is
that Franciscus Ziekenhuis does not have many historical data. For this reason, the order
quantities are not so precise at it should be and in this table we can see an example. In section
2.3 in chapter V we explain the assumptions in order to predict the best consumption average
as possible, but still there is a gap of one box between the order quantity and the average
consumption. For the calculations, we look carefully to each case, and in this one, we take the
consumption average as the order quantity, because there is more recent data.
Departments:
As in the case above, the probability of stocking
out in the central warehouse is zero, so, the lead
time in the departments is also zero.
The reorder point equals to the safety stock.
Table VI.17: Intermediate calculations in the depts. for Onderlegger Tena Bed Green
lead
tim
e
Lead
tim
e de
man
d
prob
abili
ty
num
ber
of
units
sh
ort
Reo
rder
po
int
0,00 0,00 1,000 -3,00 3,00
Table VI.16: Calculation of the reorder point
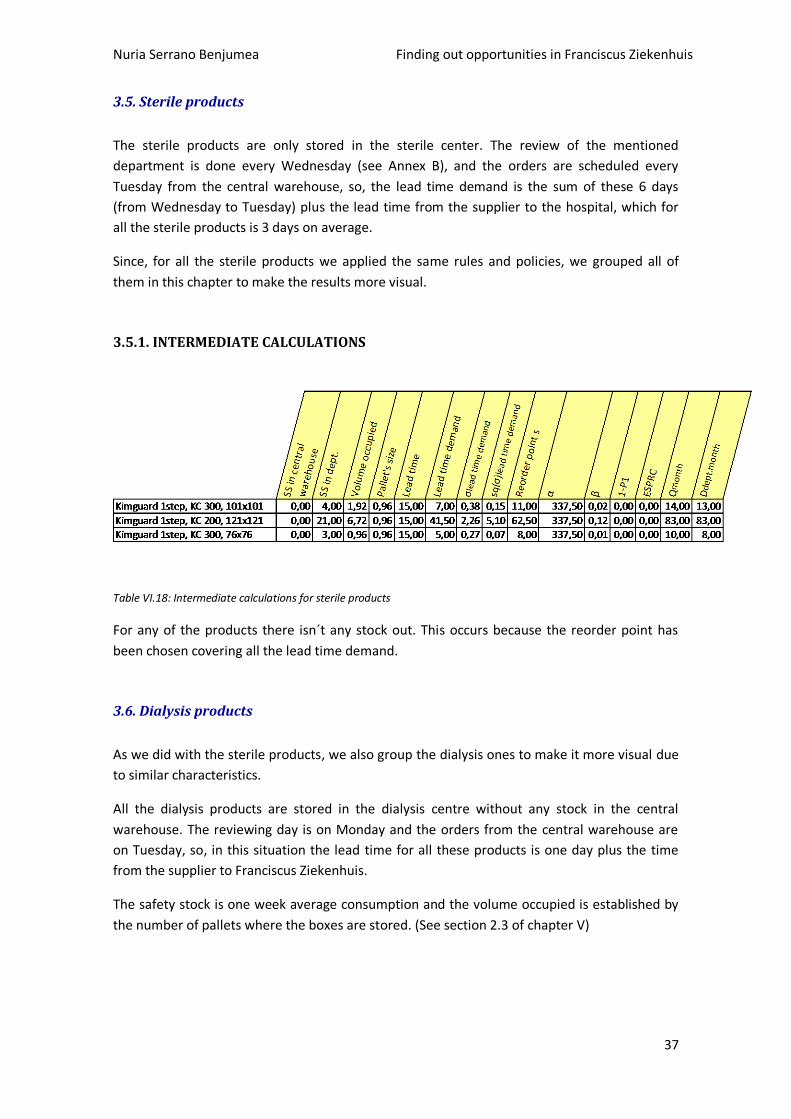
Nuria Serrano Benjumea Finding out opportunities in Franciscus Ziekenhuis
37
3.5. Sterile products
The sterile products are only stored in the sterile center. The review of the mentioned
department is done every Wednesday (see Annex B), and the orders are scheduled every
Tuesday from the central warehouse, so, the lead time demand is the sum of these 6 days
(from Wednesday to Tuesday) plus the lead time from the supplier to the hospital, which for
all the sterile products is 3 days on average.
Since, for all the sterile products we applied the same rules and policies, we grouped all of
them in this chapter to make the results more visual.
3.5.1. INTERMEDIATE CALCULATIONS
Table VI.18: Intermediate calculations for sterile products
For any of the products there isn´t any stock out. This occurs because the reorder point has
been chosen covering all the lead time demand.
3.6. Dialysis products
As we did with the sterile products, we also group the dialysis ones to make it more visual due
to similar characteristics.
All the dialysis products are stored in the dialysis centre without any stock in the central
warehouse. The reviewing day is on Monday and the orders from the central warehouse are
on Tuesday, so, in this situation the lead time for all these products is one day plus the time
from the supplier to Franciscus Ziekenhuis.
The safety stock is one week average consumption and the volume occupied is established by
the number of pallets where the boxes are stored. (See section 2.3 of chapter V)
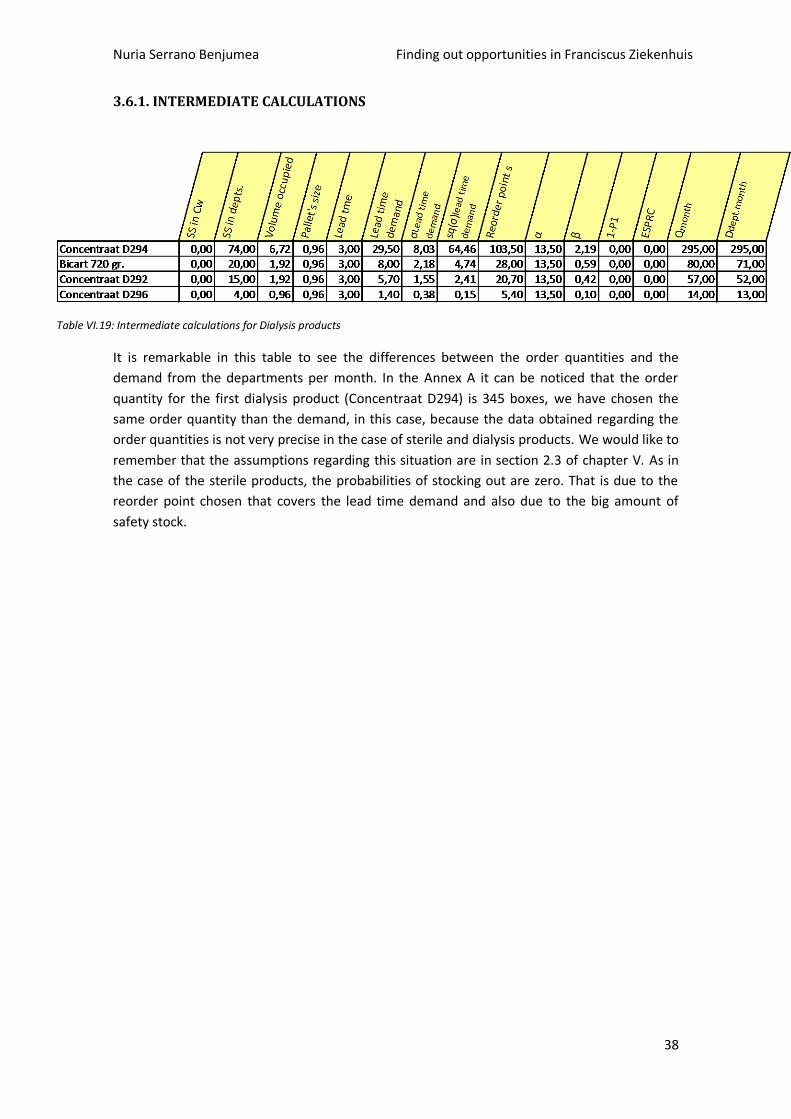
Nuria Serrano Benjumea Finding out opportunities in Franciscus Ziekenhuis
38
3.6.1. INTERMEDIATE CALCULATIONS
Table VI.19: Intermediate calculations for Dialysis products
It is remarkable in this table to see the differences between the order quantities and the
demand from the departments per month. In the Annex A it can be noticed that the order
quantity for the first dialysis product (Concentraat D294) is 345 boxes, we have chosen the
same order quantity than the demand, in this case, because the data obtained regarding the
order quantities is not very precise in the case of sterile and dialysis products. We would like to
remember that the assumptions regarding this situation are in section 2.3 of chapter V. As in
the case of the sterile products, the probabilities of stocking out are zero. That is due to the
reorder point chosen that covers the lead time demand and also due to the big amount of
safety stock.
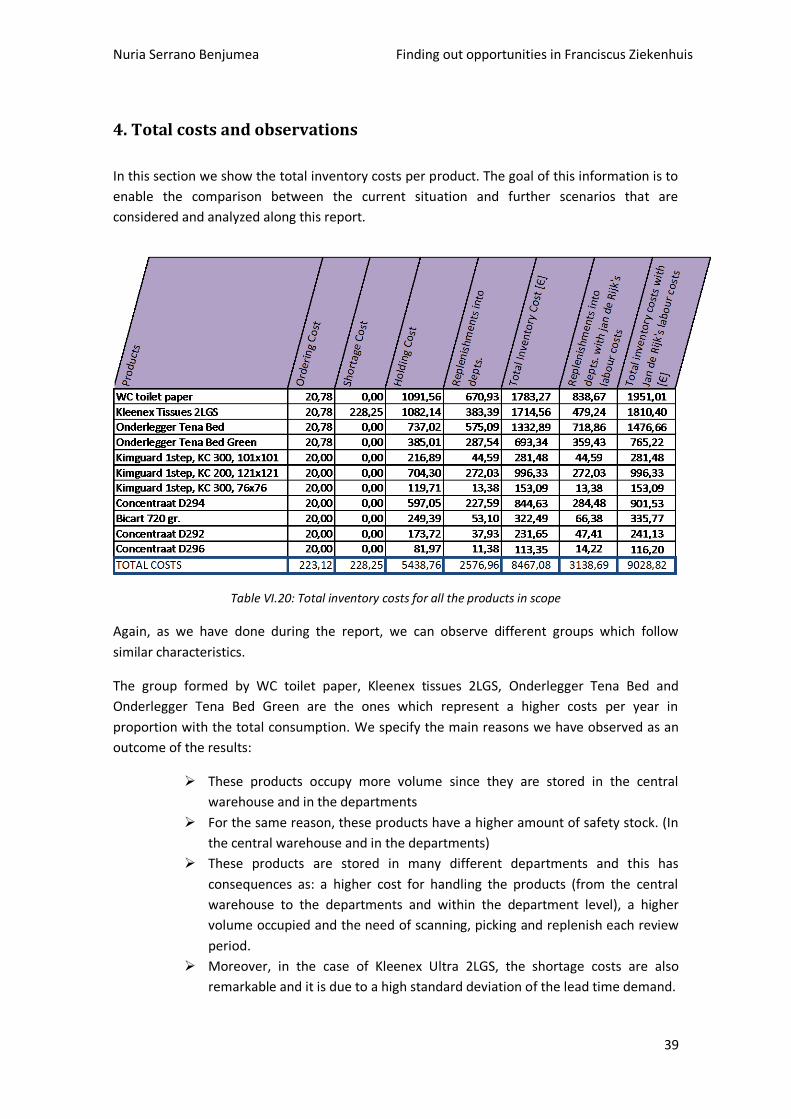
Nuria Serrano Benjumea Finding out opportunities in Franciscus Ziekenhuis
39
4. Total costs and observations
In this section we show the total inventory costs per product. The goal of this information is to
enable the comparison between the current situation and further scenarios that are
considered and analyzed along this report.
Table VI.20: Total inventory costs for all the products in scope
Again, as we have done during the report, we can observe different groups which follow
similar characteristics.
The group formed by WC toilet paper, Kleenex tissues 2LGS, Onderlegger Tena Bed and
Onderlegger Tena Bed Green are the ones which represent a higher costs per year in
proportion with the total consumption. We specify the main reasons we have observed as an
outcome of the results:
These products occupy more volume since they are stored in the central
warehouse and in the departments
For the same reason, these products have a higher amount of safety stock. (In
the central warehouse and in the departments)
These products are stored in many different departments and this has
consequences as: a higher cost for handling the products (from the central
warehouse to the departments and within the department level), a higher
volume occupied and the need of scanning, picking and replenish each review
period.
Moreover, in the case of Kleenex Ultra 2LGS, the shortage costs are also
remarkable and it is due to a high standard deviation of the lead time demand.
Nuria Serrano Benjumea Finding out opportunities in Franciscus Ziekenhuis
40
Alternatively, the group formed by the sterile and dialysis products represents lower costs
regarding the total costs due to the next observations:
These products are only stored in the department where are used: sterile and
dialysis respectively. This means a lower volume occupied and less effort from
the employees of Franciscus Ziekenhuis for their handling
The lead time is more precise since only one department has to be controlled.
For the same reason, the safety stock is more precise and covers the lead time
demand which does not have much deviation and the combination of all this,
also implies no shortage costs
Nuria Serrano Benjumea Finding out opportunities in Franciscus Ziekenhuis
41
Chapter VII: Possibilities using a Third Party Logistics Service
In this chapter we describe and analyze different possibilities using a third party logistics
service: Jan de Rijk Logistics. The goal of this analysis is to consider different ways of
optimization changing different variables and applying different models to see how they
impact the total costs per year.
The structure used during this process follows a tree shape. We pose different scenarios and
for all of them we do a description, we calculate the variables bounded and we analyze the
results. So, why does it have a tree shape? Because all the scenarios are related between
them, and each of it, gives you many other possibilities, branches, to continue investigating.
In this investigation we have to delimitate the scenarios posed since we have limited time to
finish the report. But, all our analysis can give a general idea of how can be the way of
improvement within the supply chain of the hospital and keys for further studies.
We try to be as much precise as possible with our analysis and that is why in all the scenarios
we compare each one with the current situation splitting the costs which are clearer from
those ones which are more subjective.
In section A.2.1 of this chapter, we made hypothesis to try to approximate some costs to the
reality, once chosen the best approximation we add the result to the inventory costs to have
the total costs. But, it is shown in a separate way to distinguish the more objective parts to the
other that can be more subjective. In this way, the reader can realize which would be the
impact applying these scenarios to the reality.
Along these scenarios we use several times the prices established by Jan de Rijk and they can
be found in the Annex F of this report.
Known or Unknown Inventory Level
These scenarios represent the starting point and determine the way Jan de Rijk can do the
replenishments. This is the first node of the tree and within each scenario there are many
other scenarios. Therefore, we start with the scenario which represents the global idea,
unknown or known inventories, and within it we study different branches where we change
different variables to compare the final costs. Known inventory implies that the inventory level
is measured before the replenishment takes place (either by a hospital employee or by a Jan
de Rijk employee) and unknown inventory implies that the inventory level is measured only
when replenishing.
Nuria Serrano Benjumea Finding out opportunities in Franciscus Ziekenhuis
42
A. Unknown Inventory Level
This case is based in the idea that Jan de Rijk making use of the historical data available assume
an average quantity of consumption each T units of time and go to the hospital with the
mentioned amounts of products to supply for the next T units of time.
The same employee from Jan de Rijk, carry the products into the departments and in each
department scan the stock level of the products and replenish the quantity enough to the
stock up-to-level, S. When, the employee has finished replenishing the last department comes
back to Jan de Rijk with the products left.
In this scenario the replenishments can only be considered by product. It does not make sense
to do this kind of replenishments by departments because it would be a huge waste of time.
Furthermore, within the same department the products there are stored have different
replenishment times.
We have to consider that in this situation, a pretty big safety stock is required because the
stock level has the opportunity to drop appreciably between review instants without any
reordering action being possible in the interim. Another reason that supports the idea of a big
safety stock is that the replenishments are based on averages, so if one month the
consumption increases suddenly, the safety stock has to cover, at least partially, this peak of
demand.
This scenario is quite close to the current situation, but with the next advantages:
- No more volume occupied in the central warehouse
- No need of an employee to scan, order, pick and replenish. Therefore, there is
a reduction of the handling time within Franciscus Ziekenhuis.
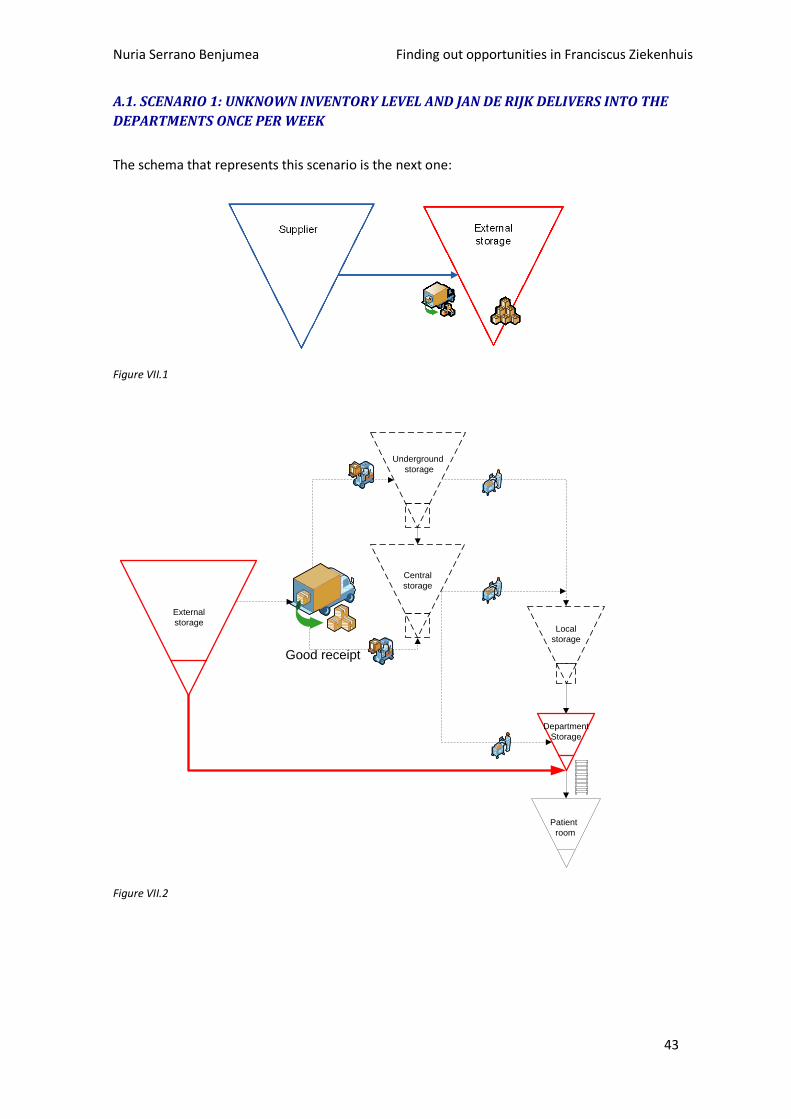
Nuria Serrano Benjumea Finding out opportunities in Franciscus Ziekenhuis
43
A.1. SCENARIO 1: UNKNOWN INVENTORY LEVEL AND JAN DE RIJK DELIVERS INTO THE
DEPARTMENTS ONCE PER WEEK
The schema that represents this scenario is the next one:
Figure VII.1
Good receipt
External
storage
Underground
storage
Central
storage
Local
storage
Patient
room
Department
Storage
Figure VII.2
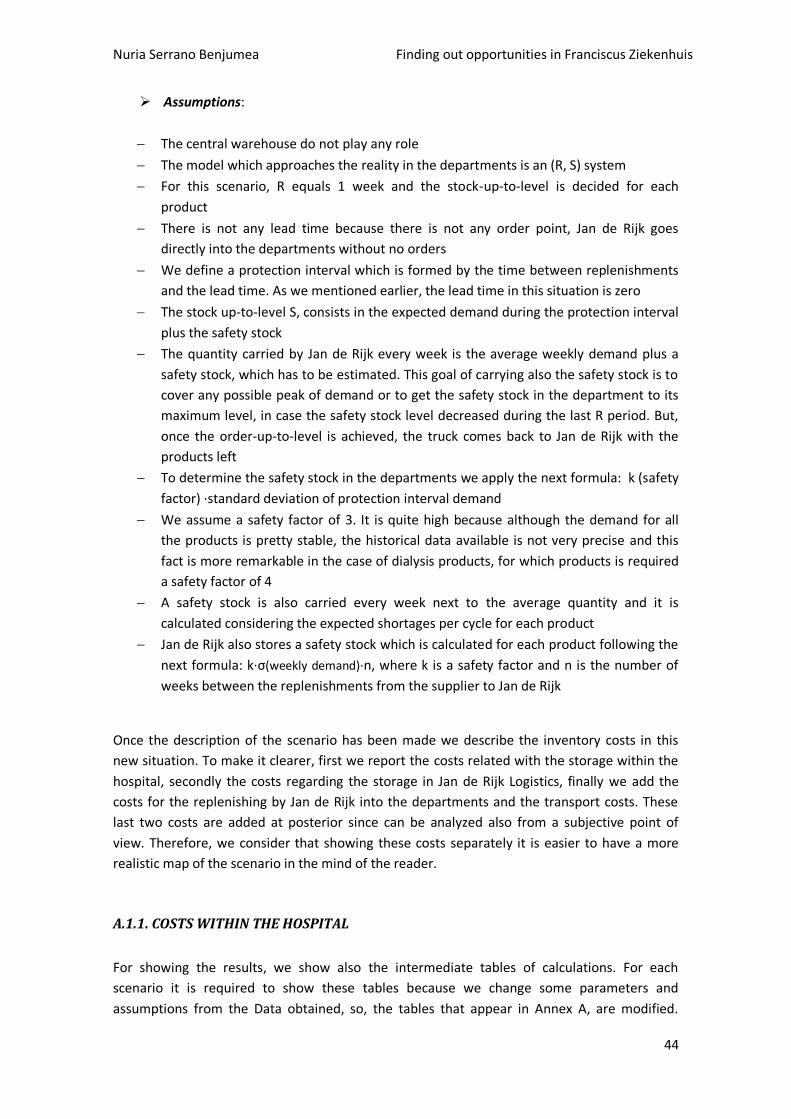
Nuria Serrano Benjumea Finding out opportunities in Franciscus Ziekenhuis
44
Assumptions:
The central warehouse do not play any role
The model which approaches the reality in the departments is an (R, S) system
For this scenario, R equals 1 week and the stock-up-to-level is decided for each
product
There is not any lead time because there is not any order point, Jan de Rijk goes
directly into the departments without no orders
We define a protection interval which is formed by the time between replenishments
and the lead time. As we mentioned earlier, the lead time in this situation is zero
The stock up-to-level S, consists in the expected demand during the protection interval
plus the safety stock
The quantity carried by Jan de Rijk every week is the average weekly demand plus a
safety stock, which has to be estimated. This goal of carrying also the safety stock is to
cover any possible peak of demand or to get the safety stock in the department to its
maximum level, in case the safety stock level decreased during the last R period. But,
once the order-up-to-level is achieved, the truck comes back to Jan de Rijk with the
products left
To determine the safety stock in the departments we apply the next formula: k (safety
factor) ·standard deviation of protection interval demand
We assume a safety factor of 3. It is quite high because although the demand for all
the products is pretty stable, the historical data available is not very precise and this
fact is more remarkable in the case of dialysis products, for which products is required
a safety factor of 4
A safety stock is also carried every week next to the average quantity and it is
calculated considering the expected shortages per cycle for each product
Jan de Rijk also stores a safety stock which is calculated for each product following the
next formula: k·σ(weekly demand)·n, where k is a safety factor and n is the number of
weeks between the replenishments from the supplier to Jan de Rijk
Once the description of the scenario has been made we describe the inventory costs in this
new situation. To make it clearer, first we report the costs related with the storage within the
hospital, secondly the costs regarding the storage in Jan de Rijk Logistics, finally we add the
costs for the replenishing by Jan de Rijk into the departments and the transport costs. These
last two costs are added at posterior since can be analyzed also from a subjective point of
view. Therefore, we consider that showing these costs separately it is easier to have a more
realistic map of the scenario in the mind of the reader.
A.1.1. COSTS WITHIN THE HOSPITAL
For showing the results, we show also the intermediate tables of calculations. For each
scenario it is required to show these tables because we change some parameters and
assumptions from the Data obtained, so, the tables that appear in Annex A, are modified.
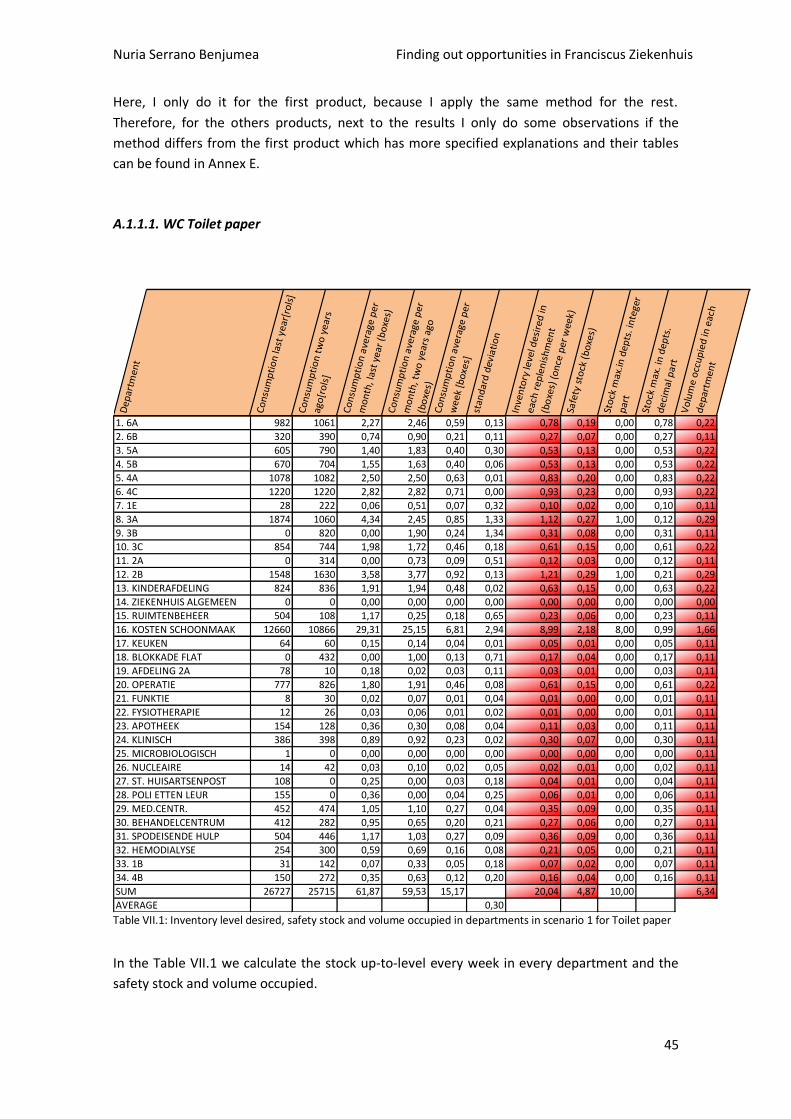
Nuria Serrano Benjumea Finding out opportunities in Franciscus Ziekenhuis
45
Here, I only do it for the first product, because I apply the same method for the rest.
Therefore, for the others products, next to the results I only do some observations if the
method differs from the first product which has more specified explanations and their tables
can be found in Annex E.
A.1.1.1. WC Toilet paper
Dep
artm
ent
Co
nsu
mp
tio
n la
st y
ear[
rols
]C
on
sum
pti
on
tw
o y
ears
ag
o[r
ols
]
Co
nsu
mp
tio
n a
vera
ge p
er
mo
nth
, las
t ye
ar (
bo
xes)
Co
nsu
mp
tio
n a
vera
ge p
er
mo
nth
, tw
o y
ears
ago
(b
oxe
s)C
on
sum
pti
on
ave
rage
per
wee
k [b
oxe
s]st
and
ard
dev
iati
on
Inve
nto
ry le
vel d
esir
ed in
each
rep
len
ish
men
t (b
oxe
s) (
on
ce p
er w
eek)
Safe
ty s
tock
(b
oxe
s)
Sto
ck m
ax.in
dep
ts. i
nte
ger
par
t
Sto
ck m
ax. i
n d
epts
. d
ecim
al p
art
Vo
lum
e o
ccu
pie
d in
eac
h
dep
artm
ent
1. 6A 982 1061 2,27 2,46 0,59 0,13 0,78 0,19 0,00 0,78 0,22
2. 6B 320 390 0,74 0,90 0,21 0,11 0,27 0,07 0,00 0,27 0,11
3. 5A 605 790 1,40 1,83 0,40 0,30 0,53 0,13 0,00 0,53 0,22
4. 5B 670 704 1,55 1,63 0,40 0,06 0,53 0,13 0,00 0,53 0,22
5. 4A 1078 1082 2,50 2,50 0,63 0,01 0,83 0,20 0,00 0,83 0,22
6. 4C 1220 1220 2,82 2,82 0,71 0,00 0,93 0,23 0,00 0,93 0,22
7. 1E 28 222 0,06 0,51 0,07 0,32 0,10 0,02 0,00 0,10 0,11
8. 3A 1874 1060 4,34 2,45 0,85 1,33 1,12 0,27 1,00 0,12 0,29
9. 3B 0 820 0,00 1,90 0,24 1,34 0,31 0,08 0,00 0,31 0,11
10. 3C 854 744 1,98 1,72 0,46 0,18 0,61 0,15 0,00 0,61 0,22
11. 2A 0 314 0,00 0,73 0,09 0,51 0,12 0,03 0,00 0,12 0,11
12. 2B 1548 1630 3,58 3,77 0,92 0,13 1,21 0,29 1,00 0,21 0,29
13. KINDERAFDELING 824 836 1,91 1,94 0,48 0,02 0,63 0,15 0,00 0,63 0,22
14. ZIEKENHUIS ALGEMEEN 0 0 0,00 0,00 0,00 0,00 0,00 0,00 0,00 0,00 0,00
15. RUIMTENBEHEER 504 108 1,17 0,25 0,18 0,65 0,23 0,06 0,00 0,23 0,11
16. KOSTEN SCHOONMAAK 12660 10866 29,31 25,15 6,81 2,94 8,99 2,18 8,00 0,99 1,66
17. KEUKEN 64 60 0,15 0,14 0,04 0,01 0,05 0,01 0,00 0,05 0,11
18. BLOKKADE FLAT 0 432 0,00 1,00 0,13 0,71 0,17 0,04 0,00 0,17 0,11
19. AFDELING 2A 78 10 0,18 0,02 0,03 0,11 0,03 0,01 0,00 0,03 0,11
20. OPERATIE 777 826 1,80 1,91 0,46 0,08 0,61 0,15 0,00 0,61 0,22
21. FUNKTIE 8 30 0,02 0,07 0,01 0,04 0,01 0,00 0,00 0,01 0,11
22. FYSIOTHERAPIE 12 26 0,03 0,06 0,01 0,02 0,01 0,00 0,00 0,01 0,11
23. APOTHEEK 154 128 0,36 0,30 0,08 0,04 0,11 0,03 0,00 0,11 0,11
24. KLINISCH 386 398 0,89 0,92 0,23 0,02 0,30 0,07 0,00 0,30 0,11
25. MICROBIOLOGISCH 1 0 0,00 0,00 0,00 0,00 0,00 0,00 0,00 0,00 0,11
26. NUCLEAIRE 14 42 0,03 0,10 0,02 0,05 0,02 0,01 0,00 0,02 0,11
27. ST. HUISARTSENPOST 108 0 0,25 0,00 0,03 0,18 0,04 0,01 0,00 0,04 0,11
28. POLI ETTEN LEUR 155 0 0,36 0,00 0,04 0,25 0,06 0,01 0,00 0,06 0,11
29. MED.CENTR. 452 474 1,05 1,10 0,27 0,04 0,35 0,09 0,00 0,35 0,11
30. BEHANDELCENTRUM 412 282 0,95 0,65 0,20 0,21 0,27 0,06 0,00 0,27 0,11
31. SPODEISENDE HULP 504 446 1,17 1,03 0,27 0,09 0,36 0,09 0,00 0,36 0,11
32. HEMODIALYSE 254 300 0,59 0,69 0,16 0,08 0,21 0,05 0,00 0,21 0,11
33. 1B 31 142 0,07 0,33 0,05 0,18 0,07 0,02 0,00 0,07 0,11
34. 4B 150 272 0,35 0,63 0,12 0,20 0,16 0,04 0,00 0,16 0,11
SUM 26727 25715 61,87 59,53 15,17 20,04 4,87 10,00 6,34
AVERAGE 0,30
Table VII.1: Inventory level desired, safety stock and volume occupied in departments in scenario 1 for Toilet paper
In the Table VII.1 we calculate the stock up-to-level every week in every department and the
safety stock and volume occupied.
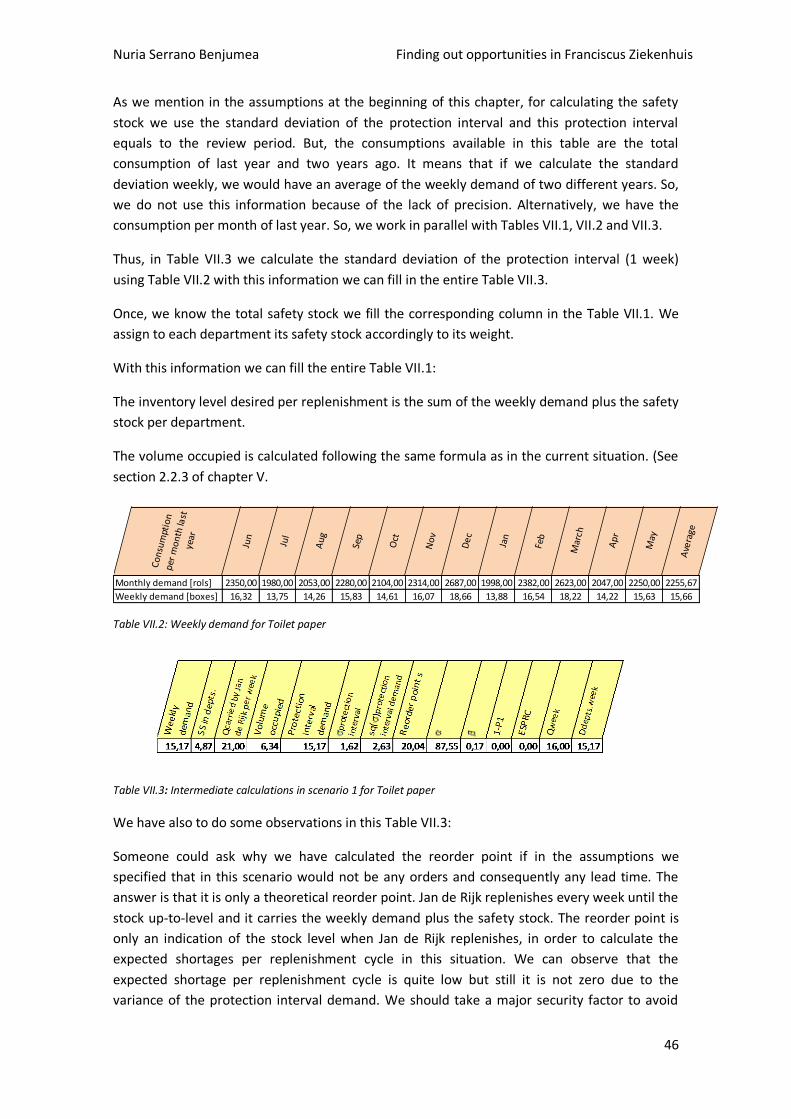
Nuria Serrano Benjumea Finding out opportunities in Franciscus Ziekenhuis
46
As we mention in the assumptions at the beginning of this chapter, for calculating the safety
stock we use the standard deviation of the protection interval and this protection interval
equals to the review period. But, the consumptions available in this table are the total
consumption of last year and two years ago. It means that if we calculate the standard
deviation weekly, we would have an average of the weekly demand of two different years. So,
we do not use this information because of the lack of precision. Alternatively, we have the
consumption per month of last year. So, we work in parallel with Tables VII.1, VII.2 and VII.3.
Thus, in Table VII.3 we calculate the standard deviation of the protection interval (1 week)
using Table VII.2 with this information we can fill in the entire Table VII.3.
Once, we know the total safety stock we fill the corresponding column in the Table VII.1. We
assign to each department its safety stock accordingly to its weight.
With this information we can fill the entire Table VII.1:
The inventory level desired per replenishment is the sum of the weekly demand plus the safety
stock per department.
The volume occupied is calculated following the same formula as in the current situation. (See
section 2.2.3 of chapter V.
Co
nsu
mpt
ion
p
er m
on
th la
st
year
Jun
Jul
Au
g
Sep
Oct
No
v
De
c
Jan
Feb
Mar
ch
Ap
r
May
Ave
rage
Monthly demand [rols] 2350,00 1980,00 2053,00 2280,00 2104,00 2314,00 2687,00 1998,00 2382,00 2623,00 2047,00 2250,00 2255,67
Weekly demand [boxes] 16,32 13,75 14,26 15,83 14,61 16,07 18,66 13,88 16,54 18,22 14,22 15,63 15,66
Table VII.2: Weekly demand for Toilet paper
Table VII.3: Intermediate calculations in scenario 1 for Toilet paper
We have also to do some observations in this Table VII.3:
Someone could ask why we have calculated the reorder point if in the assumptions we
specified that in this scenario would not be any orders and consequently any lead time. The
answer is that it is only a theoretical reorder point. Jan de Rijk replenishes every week until the
stock up-to-level and it carries the weekly demand plus the safety stock. The reorder point is
only an indication of the stock level when Jan de Rijk replenishes, in order to calculate the
expected shortages per replenishment cycle in this situation. We can observe that the
expected shortage per replenishment cycle is quite low but still it is not zero due to the
variance of the protection interval demand. We should take a major security factor to avoid
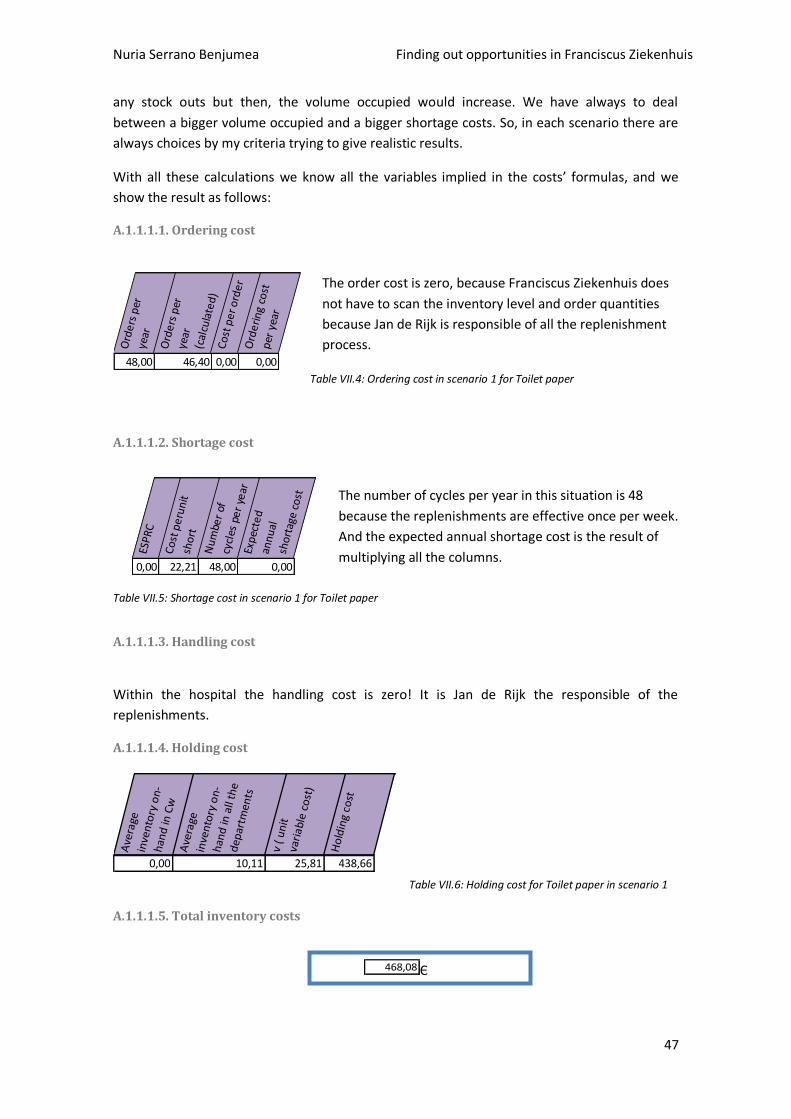
Nuria Serrano Benjumea Finding out opportunities in Franciscus Ziekenhuis
47
any stock outs but then, the volume occupied would increase. We have always to deal
between a bigger volume occupied and a bigger shortage costs. So, in each scenario there are
always choices by my criteria trying to give realistic results.
With all these calculations we know all the variables implied in the costs’ formulas, and we
show the result as follows:
A.1.1.1.1. Ordering cost
The order cost is zero, because Franciscus Ziekenhuis does
not have to scan the inventory level and order quantities
because Jan de Rijk is responsible of all the replenishment
process.
A.1.1.1.2. Shortage cost
The number of cycles per year in this situation is 48
because the replenishments are effective once per week.
And the expected annual shortage cost is the result of
multiplying all the columns.
A.1.1.1.3. Handling cost
Within the hospital the handling cost is zero! It is Jan de Rijk the responsible of the
replenishments.
A.1.1.1.4. Holding cost
Ave
rage
in
ven
tory
on-
han
d in
Cw
A
vera
ge
inve
nto
ry o
n-h
and
in a
ll th
e d
epar
tmen
ts
v (
un
it
vari
able
co
st)
Ho
ldin
g co
st
0,00 10,11 25,81 438,66
Table VII.6: Holding cost for Toilet paper in scenario 1
A.1.1.1.5. Total inventory costs
468,08 Є
Ord
ers
per
ye
ar
Ord
ers
per
ye
ar
(cal
cula
ted
)C
ost
pe
r o
rde
rO
rde
rin
g co
st
per
yea
r
48,00 46,40 0,00 0,00
Table VII.4: Ordering cost in scenario 1 for Toilet paper
Table VII.5: Shortage cost in scenario 1 for Toilet paper
Exp
ecte
d
ann
ual
sh
ort
age
co
st
ESP
RC
Co
st p
eru
nit
sh
ort
Nu
mbe
r of
cy
cles
pe
r ye
arEx
pec
ted
an
nu
al
sho
rtag
e c
ost
0,00 22,21 48,00 0,00
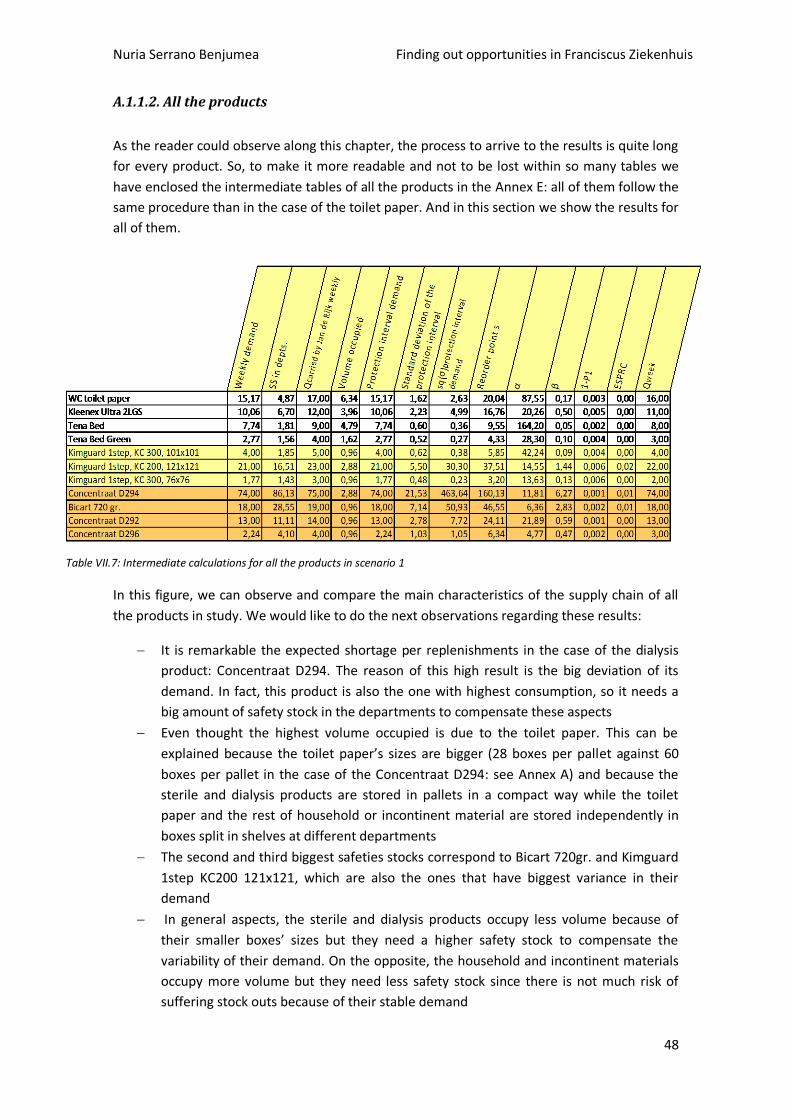
Nuria Serrano Benjumea Finding out opportunities in Franciscus Ziekenhuis
48
A.1.1.2. All the products
As the reader could observe along this chapter, the process to arrive to the results is quite long
for every product. So, to make it more readable and not to be lost within so many tables we
have enclosed the intermediate tables of all the products in the Annex E: all of them follow the
same procedure than in the case of the toilet paper. And in this section we show the results for
all of them.
Table VII.7: Intermediate calculations for all the products in scenario 1
In this figure, we can observe and compare the main characteristics of the supply chain of all
the products in study. We would like to do the next observations regarding these results:
It is remarkable the expected shortage per replenishments in the case of the dialysis
product: Concentraat D294. The reason of this high result is the big deviation of its
demand. In fact, this product is also the one with highest consumption, so it needs a
big amount of safety stock in the departments to compensate these aspects
Even thought the highest volume occupied is due to the toilet paper. This can be
explained because the toilet paper’s sizes are bigger (28 boxes per pallet against 60
boxes per pallet in the case of the Concentraat D294: see Annex A) and because the
sterile and dialysis products are stored in pallets in a compact way while the toilet
paper and the rest of household or incontinent material are stored independently in
boxes split in shelves at different departments
The second and third biggest safeties stocks correspond to Bicart 720gr. and Kimguard
1step KC200 121x121, which are also the ones that have biggest variance in their
demand
In general aspects, the sterile and dialysis products occupy less volume because of
their smaller boxes’ sizes but they need a higher safety stock to compensate the
variability of their demand. On the opposite, the household and incontinent materials
occupy more volume but they need less safety stock since there is not much risk of
suffering stock outs because of their stable demand
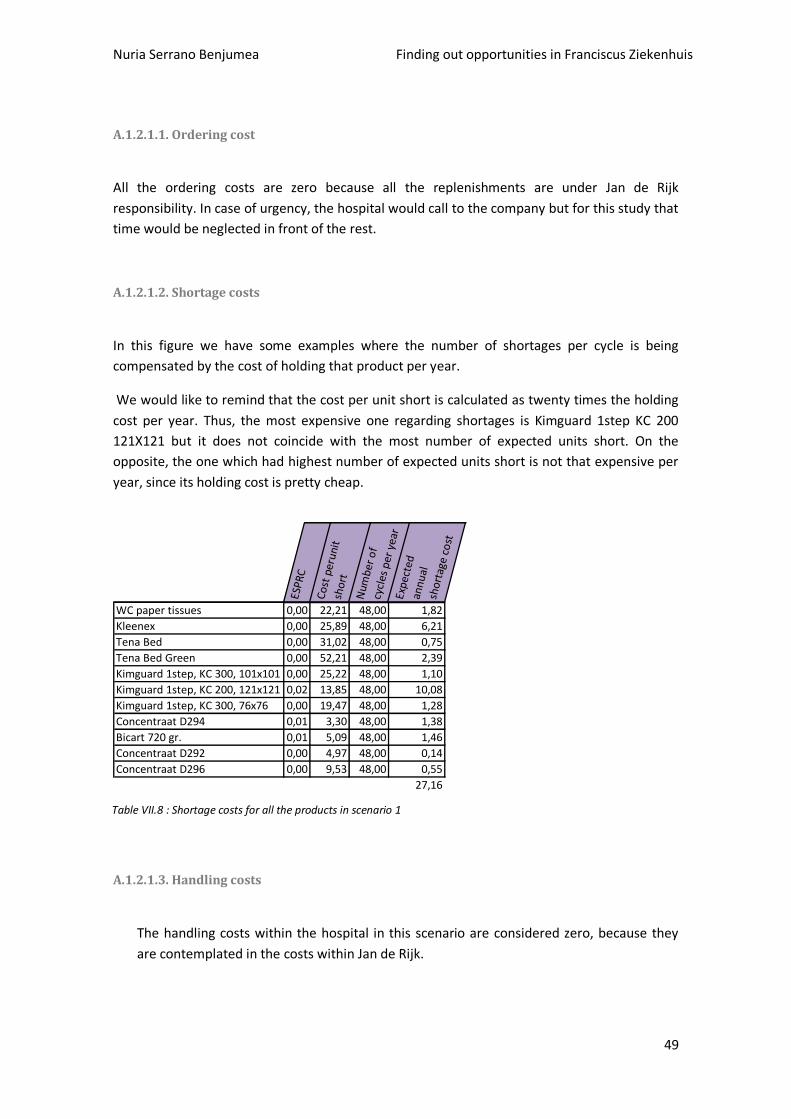
Nuria Serrano Benjumea Finding out opportunities in Franciscus Ziekenhuis
49
A.1.2.1.1. Ordering cost
All the ordering costs are zero because all the replenishments are under Jan de Rijk
responsibility. In case of urgency, the hospital would call to the company but for this study that
time would be neglected in front of the rest.
A.1.2.1.2. Shortage costs
In this figure we have some examples where the number of shortages per cycle is being
compensated by the cost of holding that product per year.
We would like to remind that the cost per unit short is calculated as twenty times the holding
cost per year. Thus, the most expensive one regarding shortages is Kimguard 1step KC 200
121X121 but it does not coincide with the most number of expected units short. On the
opposite, the one which had highest number of expected units short is not that expensive per
year, since its holding cost is pretty cheap.
ESP
RC
Co
st p
eru
nit
sho
rt
Num
ber
of
cycl
es p
er y
ear
Exp
ecte
d an
nu
al
sho
rtag
e co
st
WC paper tissues 0,00 22,21 48,00 1,82
Kleenex 0,00 25,89 48,00 6,21
Tena Bed 0,00 31,02 48,00 0,75
Tena Bed Green 0,00 52,21 48,00 2,39
Kimguard 1step, KC 300, 101x101 0,00 25,22 48,00 1,10
Kimguard 1step, KC 200, 121x121 0,02 13,85 48,00 10,08
Kimguard 1step, KC 300, 76x76 0,00 19,47 48,00 1,28
Concentraat D294 0,01 3,30 48,00 1,38
Bicart 720 gr. 0,01 5,09 48,00 1,46
Concentraat D292 0,00 4,97 48,00 0,14
Concentraat D296 0,00 9,53 48,00 0,55
27,16
A.1.2.1.3. Handling costs
The handling costs within the hospital in this scenario are considered zero, because they
are contemplated in the costs within Jan de Rijk.
Table VII.8 : Shortage costs for all the products in scenario 1
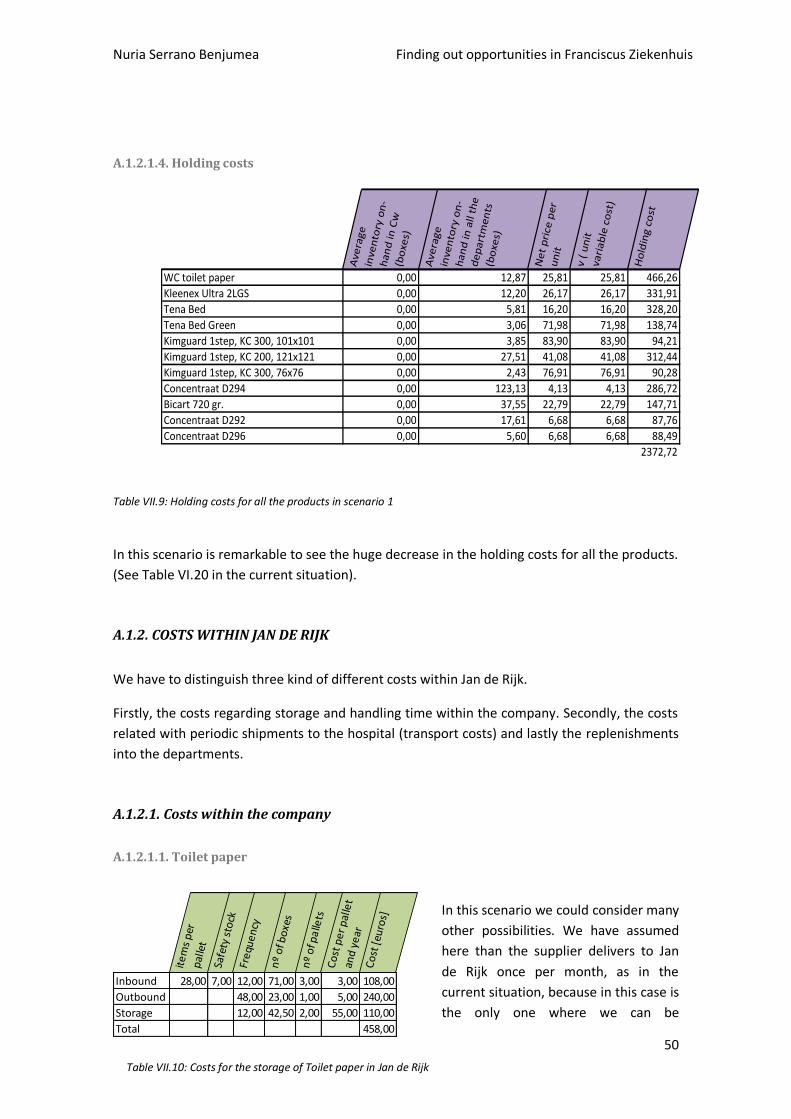
Nuria Serrano Benjumea Finding out opportunities in Franciscus Ziekenhuis
50
A.1.2.1.4. Holding costs
Ave
rage
in
ven
tory
on
-h
an
d in
Cw
(b
oxe
s)
Ave
rage
in
ven
tory
on
-h
an
d in
all
the
d
ep
art
me
nts
(b
oxe
s)
Ne
t p
rice
pe
r u
nit
v (
un
it
vari
ab
le c
ost
)
Ho
ldin
g c
ost
WC toilet paper 0,00 12,87 25,81 25,81 466,26
Kleenex Ultra 2LGS 0,00 12,20 26,17 26,17 331,91
Tena Bed 0,00 5,81 16,20 16,20 328,20
Tena Bed Green 0,00 3,06 71,98 71,98 138,74
Kimguard 1step, KC 300, 101x101 0,00 3,85 83,90 83,90 94,21
Kimguard 1step, KC 200, 121x121 0,00 27,51 41,08 41,08 312,44
Kimguard 1step, KC 300, 76x76 0,00 2,43 76,91 76,91 90,28
Concentraat D294 0,00 123,13 4,13 4,13 286,72
Bicart 720 gr. 0,00 37,55 22,79 22,79 147,71
Concentraat D292 0,00 17,61 6,68 6,68 87,76
Concentraat D296 0,00 5,60 6,68 6,68 88,49
2372,72
Table VII.9: Holding costs for all the products in scenario 1
In this scenario is remarkable to see the huge decrease in the holding costs for all the products.
(See Table VI.20 in the current situation).
A.1.2. COSTS WITHIN JAN DE RIJK
We have to distinguish three kind of different costs within Jan de Rijk.
Firstly, the costs regarding storage and handling time within the company. Secondly, the costs
related with periodic shipments to the hospital (transport costs) and lastly the replenishments
into the departments.
A.1.2.1. Costs within the company
A.1.2.1.1. Toilet paper
In this scenario we could consider many
other possibilities. We have assumed
here than the supplier delivers to Jan
de Rijk once per month, as in the
current situation, because in this case is
the only one where we can be
Table VII.10: Costs for the storage of Toilet paper in Jan de Rijk
ite
ms
per
p
alle
t
Safe
ty s
tock
Fre
que
ncy
nº
of b
oxe
s
nº
of p
alle
tsC
ost
pe
r p
alle
t an
d y
ear
Co
st [
euro
s]
Inbound 28,00 7,00 12,00 71,00 3,00 3,00 108,00
Outbound 48,00 23,00 1,00 5,00 240,00
Storage 12,00 42,50 2,00 55,00 110,00
Total 458,00
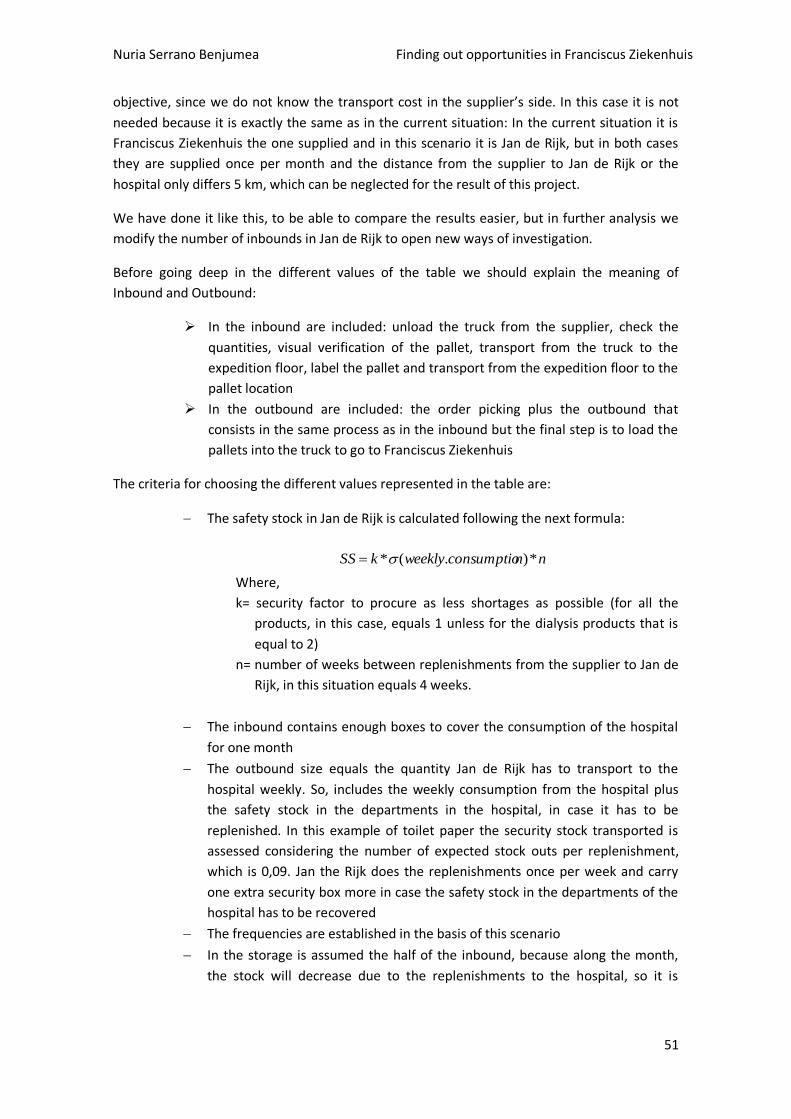
Nuria Serrano Benjumea Finding out opportunities in Franciscus Ziekenhuis
51
objective, since we do not know the transport cost in the supplier’s side. In this case it is not
needed because it is exactly the same as in the current situation: In the current situation it is
Franciscus Ziekenhuis the one supplied and in this scenario it is Jan de Rijk, but in both cases
they are supplied once per month and the distance from the supplier to Jan de Rijk or the
hospital only differs 5 km, which can be neglected for the result of this project.
We have done it like this, to be able to compare the results easier, but in further analysis we
modify the number of inbounds in Jan de Rijk to open new ways of investigation.
Before going deep in the different values of the table we should explain the meaning of
Inbound and Outbound:
In the inbound are included: unload the truck from the supplier, check the
quantities, visual verification of the pallet, transport from the truck to the
expedition floor, label the pallet and transport from the expedition floor to the
pallet location
In the outbound are included: the order picking plus the outbound that
consists in the same process as in the inbound but the final step is to load the
pallets into the truck to go to Franciscus Ziekenhuis
The criteria for choosing the different values represented in the table are:
The safety stock in Jan de Rijk is calculated following the next formula:
nnconsumptioweeklykSS *).(*
Where,
k= security factor to procure as less shortages as possible (for all the
products, in this case, equals 1 unless for the dialysis products that is
equal to 2)
n= number of weeks between replenishments from the supplier to Jan de
Rijk, in this situation equals 4 weeks.
The inbound contains enough boxes to cover the consumption of the hospital
for one month
The outbound size equals the quantity Jan de Rijk has to transport to the
hospital weekly. So, includes the weekly consumption from the hospital plus
the safety stock in the departments in the hospital, in case it has to be
replenished. In this example of toilet paper the security stock transported is
assessed considering the number of expected stock outs per replenishment,
which is 0,09. Jan the Rijk does the replenishments once per week and carry
one extra security box more in case the safety stock in the departments of the
hospital has to be recovered
The frequencies are established in the basis of this scenario
In the storage is assumed the half of the inbound, because along the month,
the stock will decrease due to the replenishments to the hospital, so it is
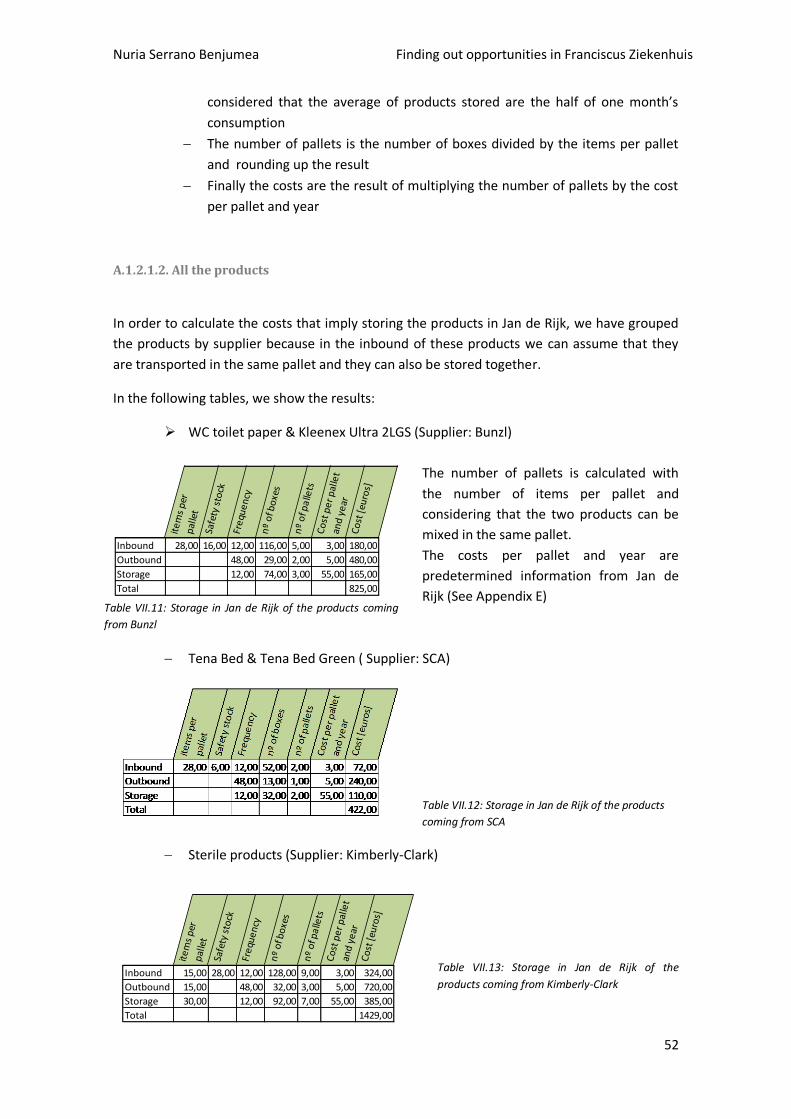
Nuria Serrano Benjumea Finding out opportunities in Franciscus Ziekenhuis
52
considered that the average of products stored are the half of one month’s
consumption
The number of pallets is the number of boxes divided by the items per pallet
and rounding up the result
Finally the costs are the result of multiplying the number of pallets by the cost
per pallet and year
A.1.2.1.2. All the products
In order to calculate the costs that imply storing the products in Jan de Rijk, we have grouped
the products by supplier because in the inbound of these products we can assume that they
are transported in the same pallet and they can also be stored together.
In the following tables, we show the results:
WC toilet paper & Kleenex Ultra 2LGS (Supplier: Bunzl)
The number of pallets is calculated with
the number of items per pallet and
considering that the two products can be
mixed in the same pallet.
The costs per pallet and year are
predetermined information from Jan de
Rijk (See Appendix E)
Tena Bed & Tena Bed Green ( Supplier: SCA)
Table VII.12: Storage in Jan de Rijk of the products
coming from SCA
Sterile products (Supplier: Kimberly-Clark)
Table VII.13: Storage in Jan de Rijk of the
products coming from Kimberly-Clark
Table VII.11: Storage in Jan de Rijk of the products coming
from Bunzl
ite
ms
per
p
alle
t
Safe
ty s
tock
Fre
que
ncy
nº
of b
oxe
s
nº
of p
alle
tsC
ost
pe
r p
alle
t an
d y
ear
Co
st [
euro
s]
Inbound 28,00 16,00 12,00 116,00 5,00 3,00 180,00
Outbound 48,00 29,00 2,00 5,00 480,00
Storage 12,00 74,00 3,00 55,00 165,00
Total 825,00
item
s pe
r pa
llet
Safe
ty s
tock
Freq
uenc
y
nº o
f box
es
nº o
f pal
lets
Cos
t pe
r pa
llet
and
year
Cos
t [e
uros
]
Inbound 15,00 28,00 12,00 128,00 9,00 3,00 324,00
Outbound 15,00 48,00 32,00 3,00 5,00 720,00
Storage 30,00 12,00 92,00 7,00 55,00 385,00
Total 1429,00
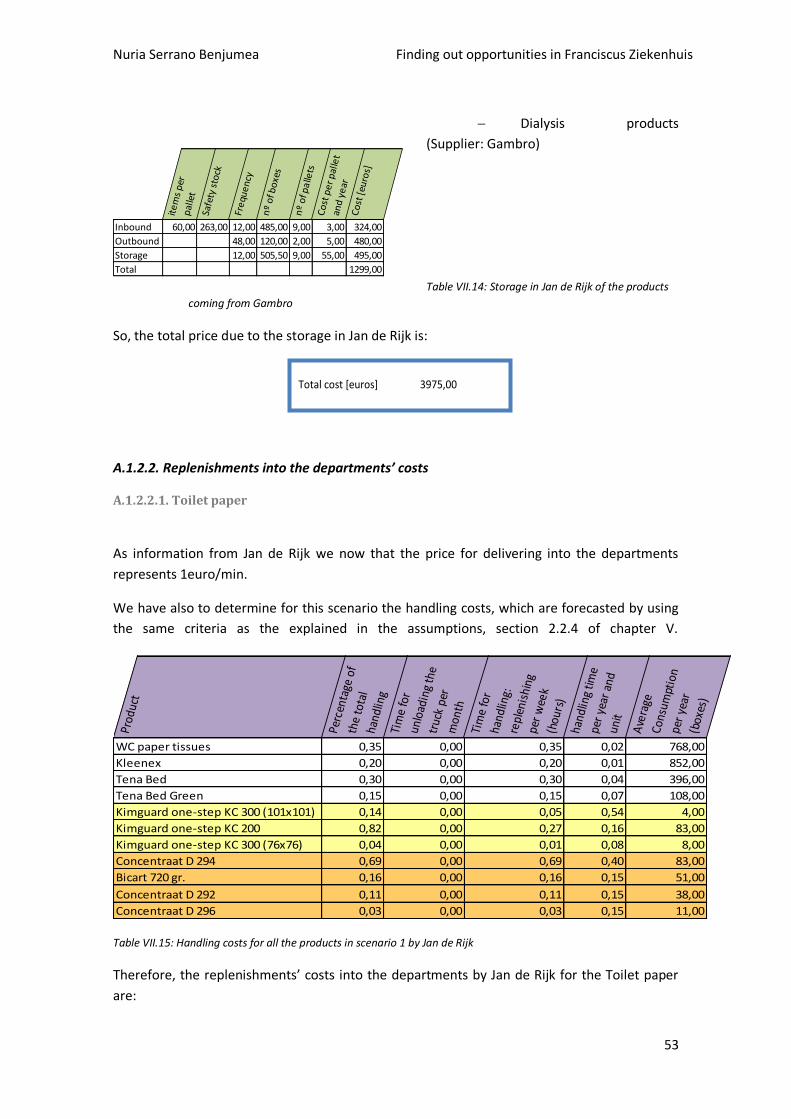
Nuria Serrano Benjumea Finding out opportunities in Franciscus Ziekenhuis
53
Dialysis products
(Supplier: Gambro)
Table VII.14: Storage in Jan de Rijk of the products
coming from Gambro
So, the total price due to the storage in Jan de Rijk is:
Total cost [euros] 3975,00
A.1.2.2. Replenishments into the departments’ costs
A.1.2.2.1. Toilet paper
As information from Jan de Rijk we now that the price for delivering into the departments
represents 1euro/min.
We have also to determine for this scenario the handling costs, which are forecasted by using
the same criteria as the explained in the assumptions, section 2.2.4 of chapter V.
Prod
uct
Perc
enta
ge o
f th
e to
tal
hand
ling
Tim
e fo
r un
load
ing
the
truc
k pe
r m
onth
Tim
e fo
r ha
ndlin
g:
repl
enis
hing
pe
r w
eek
(hou
rs)
hand
ling
time
per
year
and
un
it
Ave
rage
Co
nsum
ptio
n pe
r ye
ar
(box
es)
WC paper tissues 0,35 0,00 0,35 0,02 768,00
Kleenex 0,20 0,00 0,20 0,01 852,00
Tena Bed 0,30 0,00 0,30 0,04 396,00
Tena Bed Green 0,15 0,00 0,15 0,07 108,00
Kimguard one-step KC 300 (101x101) 0,14 0,00 0,05 0,54 4,00
Kimguard one-step KC 200 0,82 0,00 0,27 0,16 83,00
Kimguard one-step KC 300 (76x76) 0,04 0,00 0,01 0,08 8,00
Concentraat D 294 0,69 0,00 0,69 0,40 83,00
Bicart 720 gr. 0,16 0,00 0,16 0,15 51,00
Concentraat D 292 0,11 0,00 0,11 0,15 38,00
Concentraat D 296 0,03 0,00 0,03 0,15 11,00
Table VII.15: Handling costs for all the products in scenario 1 by Jan de Rijk
Therefore, the replenishments’ costs into the departments by Jan de Rijk for the Toilet paper
are:
ite
ms
per
p
alle
t
Safe
ty s
tock
Fre
que
ncy
nº
of b
oxe
s
nº
of p
alle
tsC
ost
pe
r p
alle
t an
d y
ear
Co
st [
euro
s]
Inbound 60,00 263,00 12,00 485,00 9,00 3,00 324,00
Outbound 48,00 120,00 2,00 5,00 480,00
Storage 12,00 505,50 9,00 55,00 495,00
Total 1299,00
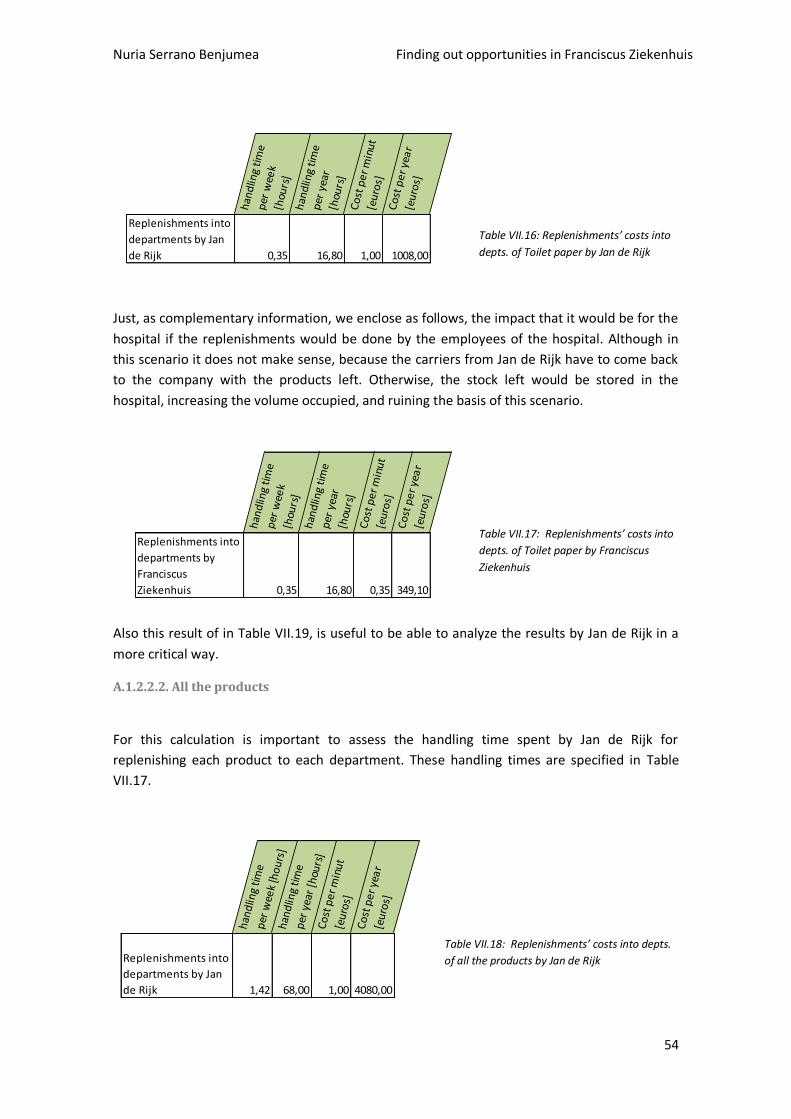
Nuria Serrano Benjumea Finding out opportunities in Franciscus Ziekenhuis
54
Table VII.16: Replenishments’ costs into
depts. of Toilet paper by Jan de Rijk
Just, as complementary information, we enclose as follows, the impact that it would be for the
hospital if the replenishments would be done by the employees of the hospital. Although in
this scenario it does not make sense, because the carriers from Jan de Rijk have to come back
to the company with the products left. Otherwise, the stock left would be stored in the
hospital, increasing the volume occupied, and ruining the basis of this scenario.
Table VII.17: Replenishments’ costs into
depts. of Toilet paper by Franciscus
Ziekenhuis
Also this result of in Table VII.19, is useful to be able to analyze the results by Jan de Rijk in a
more critical way.
A.1.2.2.2. All the products
For this calculation is important to assess the handling time spent by Jan de Rijk for
replenishing each product to each department. These handling times are specified in Table
VII.17.
Table VII.18: Replenishments’ costs into depts.
of all the products by Jan de Rijk
han
dlin
g ti
me
p
er w
eek
[hou
rs]
han
dlin
g ti
me
p
er y
ear
[hou
rs]
Co
st p
er
min
ut
[eu
ros]
Co
st p
er
yea
r [e
uro
s]
Replenishments into
departments by Jan
de Rijk 0,35 16,80 1,00 1008,00h
and
ling
tim
e
per
wee
k [h
ours
]h
and
ling
tim
e
per
yea
r [h
ours
]C
ost
pe
r m
inu
t [e
uro
s]C
ost
pe
r ye
ar
[eu
ros]
Replenishments into
departments by
Franciscus
Ziekenhuis 0,35 16,80 0,35 349,10
han
dlin
g ti
me
p
er w
eek
[ho
urs
]h
and
ling
tim
e
per
yea
r [h
ours
]C
ost
pe
r min
ut
[eu
ros]
Co
st p
er y
ear
[eu
ros]
Replenishments into
departments by Jan
de Rijk 1,42 68,00 1,00 4080,00
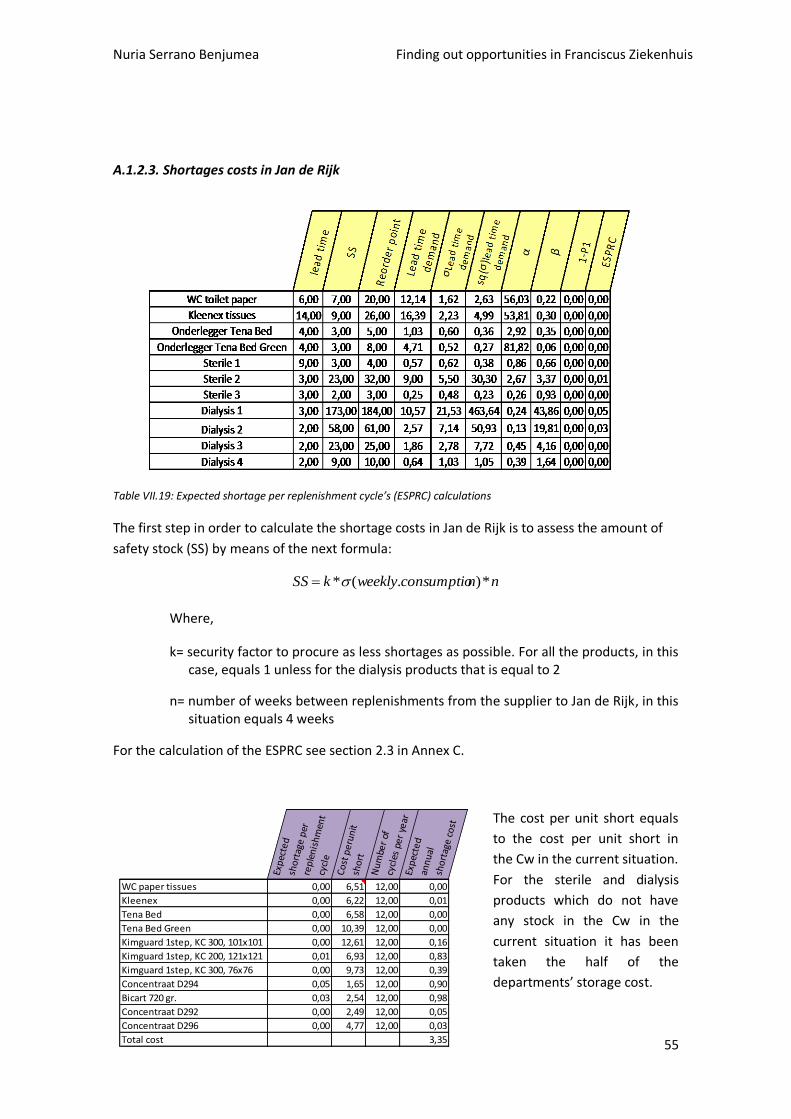
Nuria Serrano Benjumea Finding out opportunities in Franciscus Ziekenhuis
55
A.1.2.3. Shortages costs in Jan de Rijk
Table VII.19: Expected shortage per replenishment cycle’s (ESPRC) calculations
The first step in order to calculate the shortage costs in Jan de Rijk is to assess the amount of
safety stock (SS) by means of the next formula:
nnconsumptioweeklykSS *).(*
Where,
k= security factor to procure as less shortages as possible. For all the products, in this case, equals 1 unless for the dialysis products that is equal to 2
n= number of weeks between replenishments from the supplier to Jan de Rijk, in this situation equals 4 weeks
For the calculation of the ESPRC see section 2.3 in Annex C.
The cost per unit short equals
to the cost per unit short in
the Cw in the current situation.
For the sterile and dialysis
products which do not have
any stock in the Cw in the
current situation it has been
taken the half of the
departments’ storage cost.
Exp
ecte
d
sho
rtag
e p
er
rep
len
ish
men
t cy
cle
Co
st p
eru
nit
sh
ort
Nu
mbe
r of
cy
cles
pe
r ye
arEx
pec
ted
an
nu
al
sho
rtag
e c
ost
WC paper tissues 0,00 6,51 12,00 0,00
Kleenex 0,00 6,22 12,00 0,01
Tena Bed 0,00 6,58 12,00 0,00
Tena Bed Green 0,00 10,39 12,00 0,00
Kimguard 1step, KC 300, 101x101 0,00 12,61 12,00 0,16
Kimguard 1step, KC 200, 121x121 0,01 6,93 12,00 0,83
Kimguard 1step, KC 300, 76x76 0,00 9,73 12,00 0,39
Concentraat D294 0,05 1,65 12,00 0,90
Bicart 720 gr. 0,03 2,54 12,00 0,98
Concentraat D292 0,00 2,49 12,00 0,05
Concentraat D296 0,00 4,77 12,00 0,03
Total cost 3,35
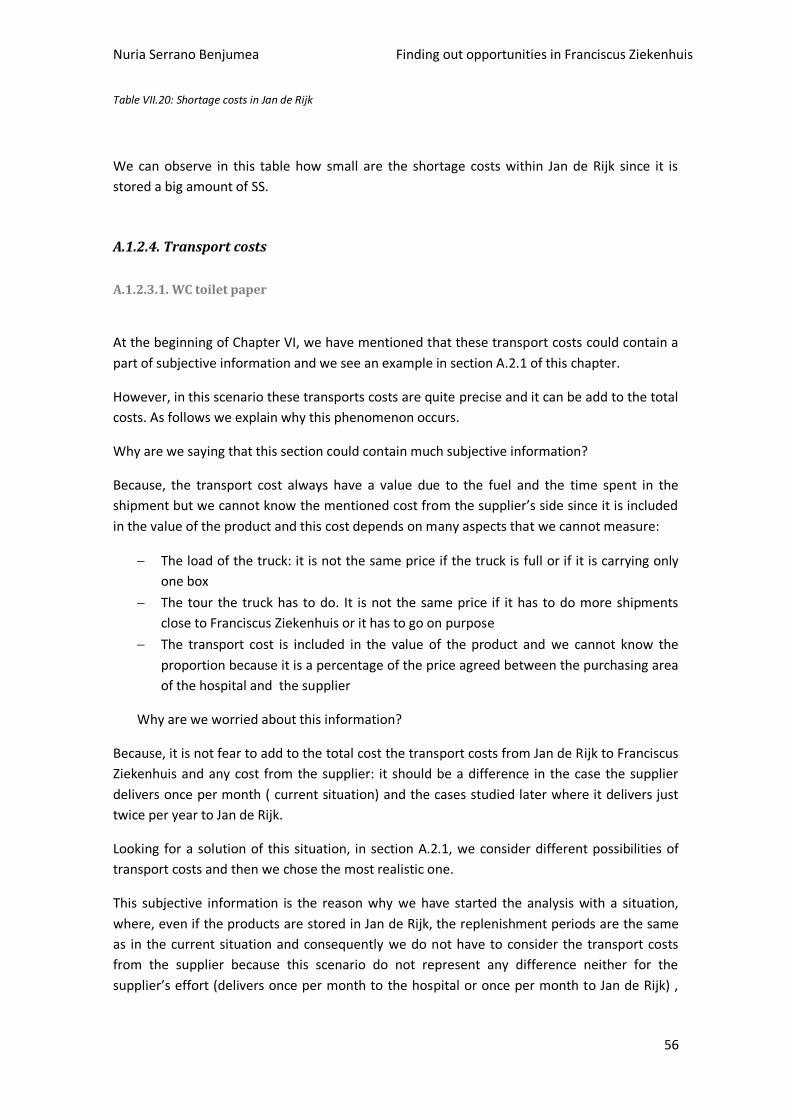
Nuria Serrano Benjumea Finding out opportunities in Franciscus Ziekenhuis
56
Table VII.20: Shortage costs in Jan de Rijk
We can observe in this table how small are the shortage costs within Jan de Rijk since it is
stored a big amount of SS.
A.1.2.4. Transport costs
A.1.2.3.1. WC toilet paper
At the beginning of Chapter VI, we have mentioned that these transport costs could contain a
part of subjective information and we see an example in section A.2.1 of this chapter.
However, in this scenario these transports costs are quite precise and it can be add to the total
costs. As follows we explain why this phenomenon occurs.
Why are we saying that this section could contain much subjective information?
Because, the transport cost always have a value due to the fuel and the time spent in the
shipment but we cannot know the mentioned cost from the supplier’s side since it is included
in the value of the product and this cost depends on many aspects that we cannot measure:
The load of the truck: it is not the same price if the truck is full or if it is carrying only
one box
The tour the truck has to do. It is not the same price if it has to do more shipments
close to Franciscus Ziekenhuis or it has to go on purpose
The transport cost is included in the value of the product and we cannot know the
proportion because it is a percentage of the price agreed between the purchasing area
of the hospital and the supplier
Why are we worried about this information?
Because, it is not fear to add to the total cost the transport costs from Jan de Rijk to Franciscus
Ziekenhuis and any cost from the supplier: it should be a difference in the case the supplier
delivers once per month ( current situation) and the cases studied later where it delivers just
twice per year to Jan de Rijk.
Looking for a solution of this situation, in section A.2.1, we consider different possibilities of
transport costs and then we chose the most realistic one.
This subjective information is the reason why we have started the analysis with a situation,
where, even if the products are stored in Jan de Rijk, the replenishment periods are the same
as in the current situation and consequently we do not have to consider the transport costs
from the supplier because this scenario do not represent any difference neither for the
supplier’s effort (delivers once per month to the hospital or once per month to Jan de Rijk) ,
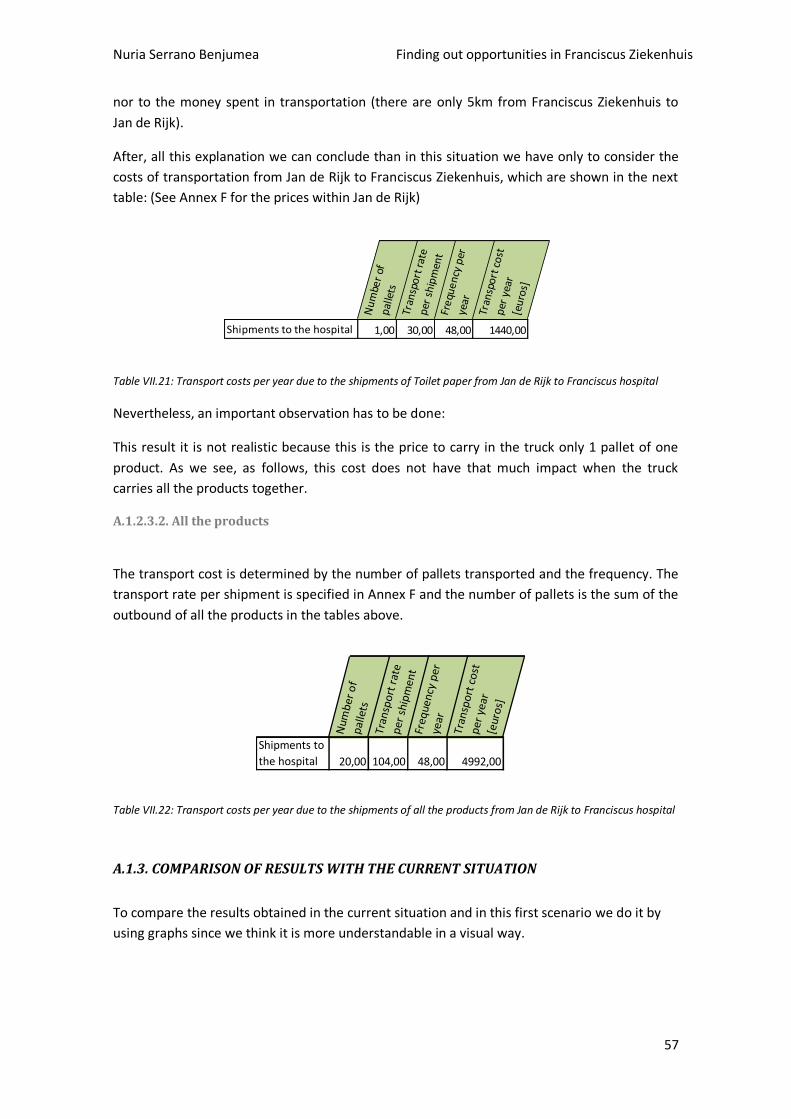
Nuria Serrano Benjumea Finding out opportunities in Franciscus Ziekenhuis
57
nor to the money spent in transportation (there are only 5km from Franciscus Ziekenhuis to
Jan de Rijk).
After, all this explanation we can conclude than in this situation we have only to consider the
costs of transportation from Jan de Rijk to Franciscus Ziekenhuis, which are shown in the next
table: (See Annex F for the prices within Jan de Rijk)
Nu
mbe
r of
p
alle
tsTr
ansp
ort
rat
e
per
sh
ipm
ent
Fre
que
ncy
per
ye
ar
Tran
spo
rt c
ost
p
er y
ear
[eu
ros]
Shipments to the hospital 1,00 30,00 48,00 1440,00
Table VII.21: Transport costs per year due to the shipments of Toilet paper from Jan de Rijk to Franciscus hospital
Nevertheless, an important observation has to be done:
This result it is not realistic because this is the price to carry in the truck only 1 pallet of one
product. As we see, as follows, this cost does not have that much impact when the truck
carries all the products together.
A.1.2.3.2. All the products
The transport cost is determined by the number of pallets transported and the frequency. The
transport rate per shipment is specified in Annex F and the number of pallets is the sum of the
outbound of all the products in the tables above.
Num
ber
of
pal
lets
Tran
spo
rt r
ate
per
shi
pm
ent
Freq
uen
cy p
er
year
Tran
spo
rt c
ost
p
er y
ear
[eur
os]
Shipments to
the hospital 20,00 104,00 48,00 4992,00
Table VII.22: Transport costs per year due to the shipments of all the products from Jan de Rijk to Franciscus hospital
A.1.3. COMPARISON OF RESULTS WITH THE CURRENT SITUATION
To compare the results obtained in the current situation and in this first scenario we do it by
using graphs since we think it is more understandable in a visual way.
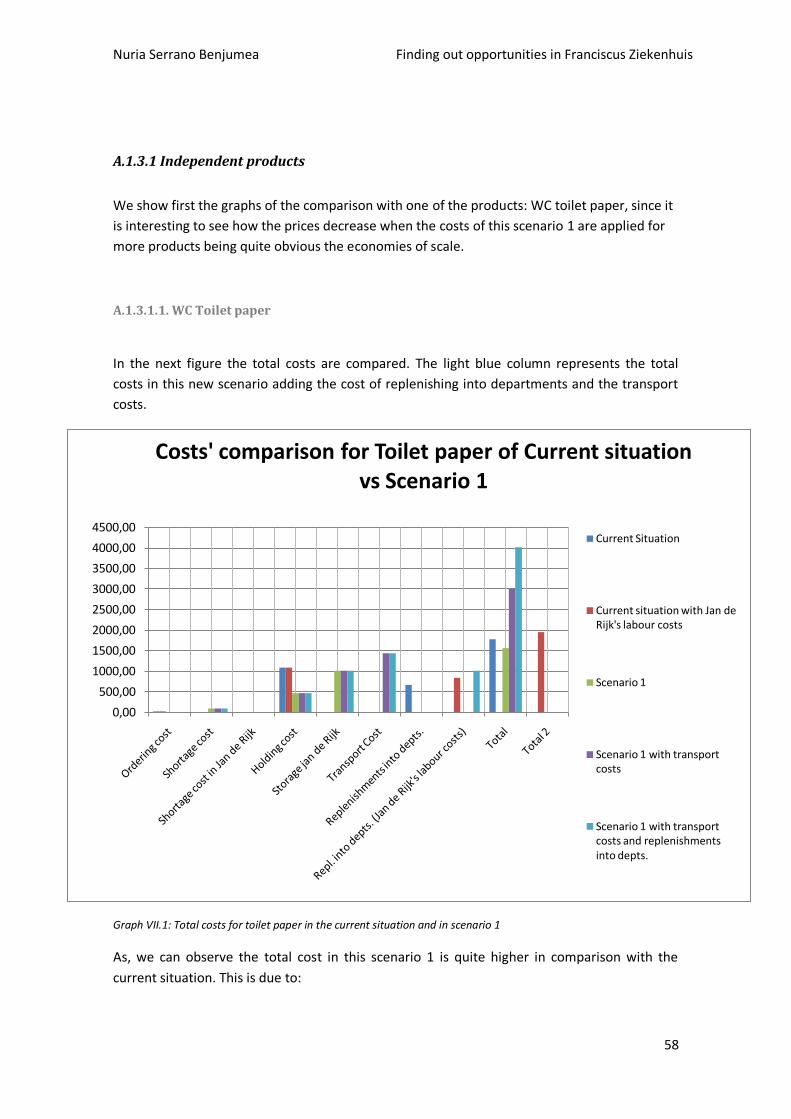
Nuria Serrano Benjumea Finding out opportunities in Franciscus Ziekenhuis
58
A.1.3.1 Independent products
We show first the graphs of the comparison with one of the products: WC toilet paper, since it
is interesting to see how the prices decrease when the costs of this scenario 1 are applied for
more products being quite obvious the economies of scale.
A.1.3.1.1. WC Toilet paper
In the next figure the total costs are compared. The light blue column represents the total
costs in this new scenario adding the cost of replenishing into departments and the transport
costs.
Graph VII.1: Total costs for toilet paper in the current situation and in scenario 1
As, we can observe the total cost in this scenario 1 is quite higher in comparison with the
current situation. This is due to:
0,00
500,00
1000,00
1500,00
2000,00
2500,00
3000,00
3500,00
4000,00
4500,00
Costs' comparison for Toilet paper of Current situation vs Scenario 1
Current Situation
Current situation with Jan de Rijk's labour costs
Scenario 1
Scenario 1 with transport costs
Scenario 1 with transport costs and replenishments into depts.
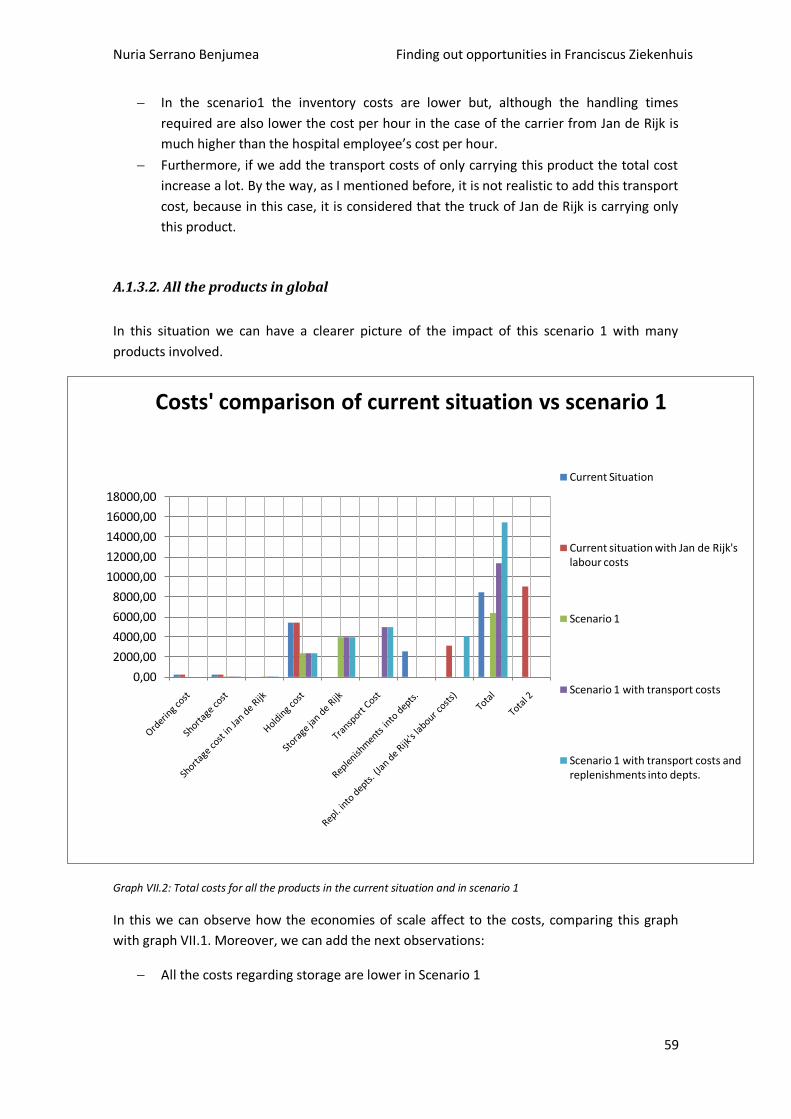
Nuria Serrano Benjumea Finding out opportunities in Franciscus Ziekenhuis
59
In the scenario1 the inventory costs are lower but, although the handling times
required are also lower the cost per hour in the case of the carrier from Jan de Rijk is
much higher than the hospital employee’s cost per hour.
Furthermore, if we add the transport costs of only carrying this product the total cost
increase a lot. By the way, as I mentioned before, it is not realistic to add this transport
cost, because in this case, it is considered that the truck of Jan de Rijk is carrying only
this product.
A.1.3.2. All the products in global
In this situation we can have a clearer picture of the impact of this scenario 1 with many
products involved.
Graph VII.2: Total costs for all the products in the current situation and in scenario 1
In this we can observe how the economies of scale affect to the costs, comparing this graph
with graph VII.1. Moreover, we can add the next observations:
All the costs regarding storage are lower in Scenario 1
0,00
2000,00
4000,00
6000,00
8000,00
10000,00
12000,00
14000,00
16000,00
18000,00
Costs' comparison of current situation vs scenario 1
Current Situation
Current situation with Jan de Rijk's labour costs
Scenario 1
Scenario 1 with transport costs
Scenario 1 with transport costs and replenishments into depts.
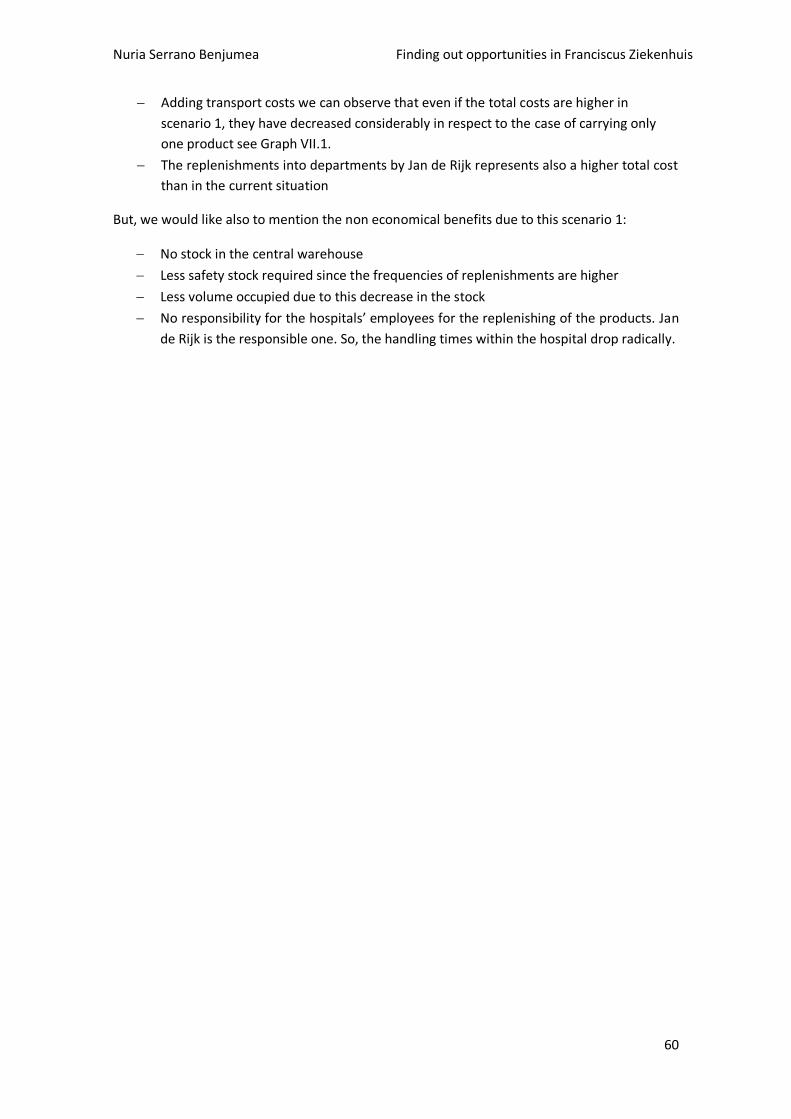
Nuria Serrano Benjumea Finding out opportunities in Franciscus Ziekenhuis
60
Adding transport costs we can observe that even if the total costs are higher in
scenario 1, they have decreased considerably in respect to the case of carrying only
one product see Graph VII.1.
The replenishments into departments by Jan de Rijk represents also a higher total cost
than in the current situation
But, we would like also to mention the non economical benefits due to this scenario 1:
No stock in the central warehouse
Less safety stock required since the frequencies of replenishments are higher
Less volume occupied due to this decrease in the stock
No responsibility for the hospitals’ employees for the replenishing of the products. Jan
de Rijk is the responsible one. So, the handling times within the hospital drop radically.
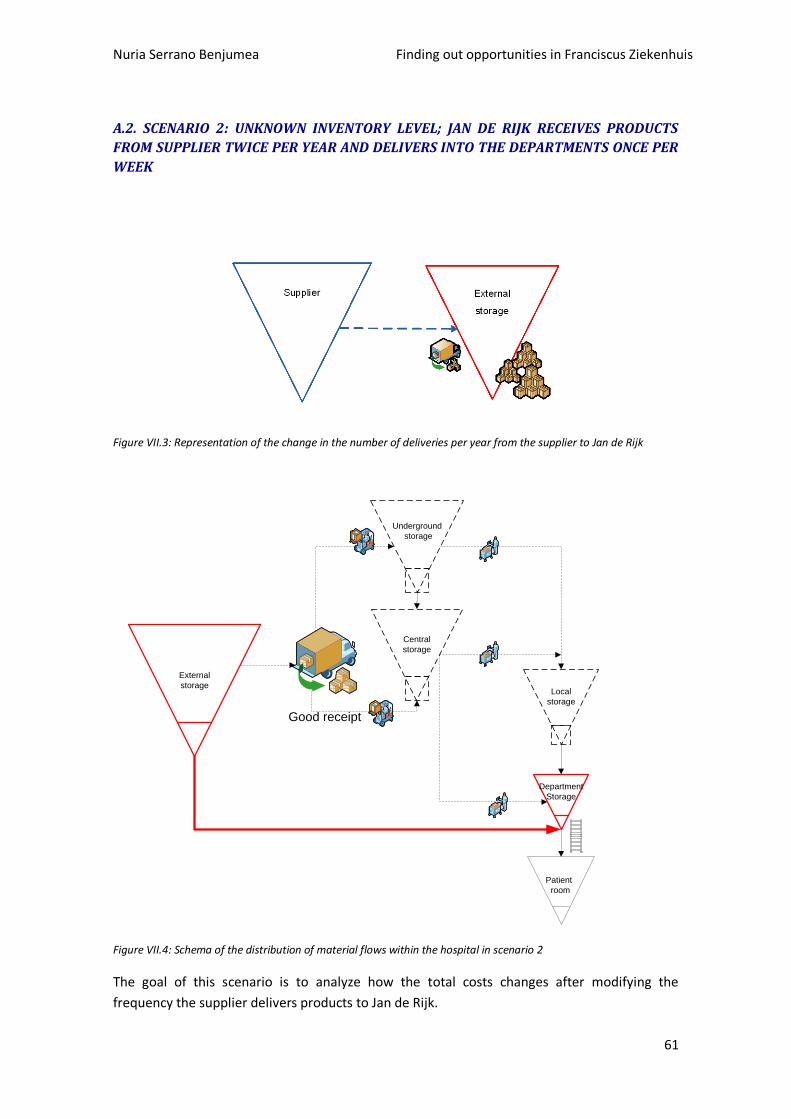
Nuria Serrano Benjumea Finding out opportunities in Franciscus Ziekenhuis
61
A.2. SCENARIO 2: UNKNOWN INVENTORY LEVEL; JAN DE RIJK RECEIVES PRODUCTS
FROM SUPPLIER TWICE PER YEAR AND DELIVERS INTO THE DEPARTMENTS ONCE PER
WEEK
Figure VII.3: Representation of the change in the number of deliveries per year from the supplier to Jan de Rijk
Good receipt
External
storage
Underground
storage
Central
storage
Local
storage
Patient
room
Department
Storage
Figure VII.4: Schema of the distribution of material flows within the hospital in scenario 2
The goal of this scenario is to analyze how the total costs changes after modifying the
frequency the supplier delivers products to Jan de Rijk.
Nuria Serrano Benjumea Finding out opportunities in Franciscus Ziekenhuis
62
This idea is based on the fact that the storage in Jan de Rijk is cheaper than in the hospital. So,
a bigger amount of products can be stored there reducing the transportation costs from the
supplier to Jan the Rijk.
As we mentioned earlier it is hard to assess this costs reduction in transportation from the
supplier’s side. So, in this chapter we predict the possible wideness of the effect of this
scenario.
Assumptions:
All the assumptions made for scenario 1 are also valid for this scenario since the
methodology of replenishments established within the hospital does not change (see
section A.1 of this chapter). Therefore, the quantities of replenishment and safety
stocks are also invariable for this scenario in reference with scenario 1
Within Jan de Rijk, it changes the frequency of inbounds: twice per year
Since Jan de Rijk is only supplied twice per year the amount of products stored is much
bigger
The safety stock in Jan de Rijk also increases because it has to cover the deviation of
the consumption during the period between deliveries in Jan de Rijk from the supplier.
That is why; the safety stock in Jan de Rijk is calculated as:
k·σ(6 months consumption); where, k is the safety factor that in this situation can be neglected
since the SS is big enough in order to do not have shortages
The first consequence of this scenario is that the value of the product change since a
percentage of this value is due to transportation costs from the supplier’s side and these costs
should decrease.
That is why in the next section we try to assess the effect this scenario will have in the price of
the product.
A.2.1. THE REPERCUSSION OF THE TRANSPORT COSTS IN THE VALUE OF THE PRODUCT
As we mentioned in some occasions earlier, how are we going to assess the transportation
costs if they are a part of the price of the product?
The methodology tries to approach the reality basing the calculations in the differences
between the benefits in the transportation costs’ in this scenario regarding the current
situation.
To be aware of the mentioned differences, we classify them in the next table:
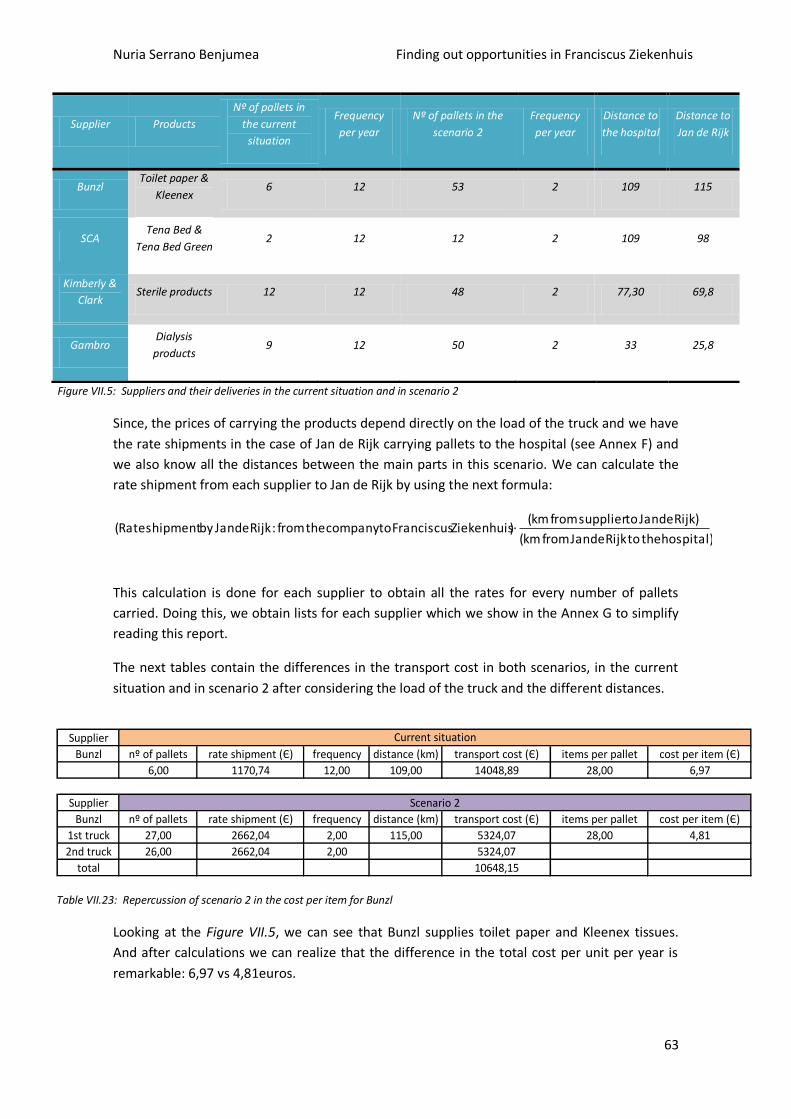
Nuria Serrano Benjumea Finding out opportunities in Franciscus Ziekenhuis
63
Since, the prices of carrying the products depend directly on the load of the truck and we have
the rate shipments in the case of Jan de Rijk carrying pallets to the hospital (see Annex F) and
we also know all the distances between the main parts in this scenario. We can calculate the
rate shipment from each supplier to Jan de Rijk by using the next formula:
hospital) the to Rijk de Janfrom (km
Rijk) de Janto supplier from (km )·Ziekenhuis Franciscus to company the from :Rijk de Janby shipment (Rate
This calculation is done for each supplier to obtain all the rates for every number of pallets
carried. Doing this, we obtain lists for each supplier which we show in the Annex G to simplify
reading this report.
The next tables contain the differences in the transport cost in both scenarios, in the current
situation and in scenario 2 after considering the load of the truck and the different distances.
Supplier
Bunzl nº of pallets rate shipment (Є) frequency distance (km) transport cost (Є) items per pallet cost per item (Є)
6,00 1170,74 12,00 109,00 14048,89 28,00 6,97
Supplier
Bunzl nº of pallets rate shipment (Є) frequency distance (km) transport cost (Є) items per pallet cost per item (Є)
1st truck 27,00 2662,04 2,00 115,00 5324,07 28,00 4,81
2nd truck 26,00 2662,04 2,00 5324,07
total 10648,15
Current situation
Scenario 2
Table VII.23: Repercussion of scenario 2 in the cost per item for Bunzl
Looking at the Figure VII.5, we can see that Bunzl supplies toilet paper and Kleenex tissues.
And after calculations we can realize that the difference in the total cost per unit per year is
remarkable: 6,97 vs 4,81euros.
Supplier Products
Nº of pallets in
the current
situation
Frequency
per year
Nº of pallets in the
scenario 2
Frequency
per year
Distance to
the hospital
Distance to
Jan de Rijk
Bunzl Toilet paper &
Kleenex 6 12 53 2 109 115
SCA Tena Bed &
Tena Bed Green 2 12 12 2 109 98
Kimberly &
Clark Sterile products 12 12 48 2 77,30 69,8
Gambro Dialysis
products 9 12 50 2 33 25,8
Figure VII.5: Suppliers and their deliveries in the current situation and in scenario 2
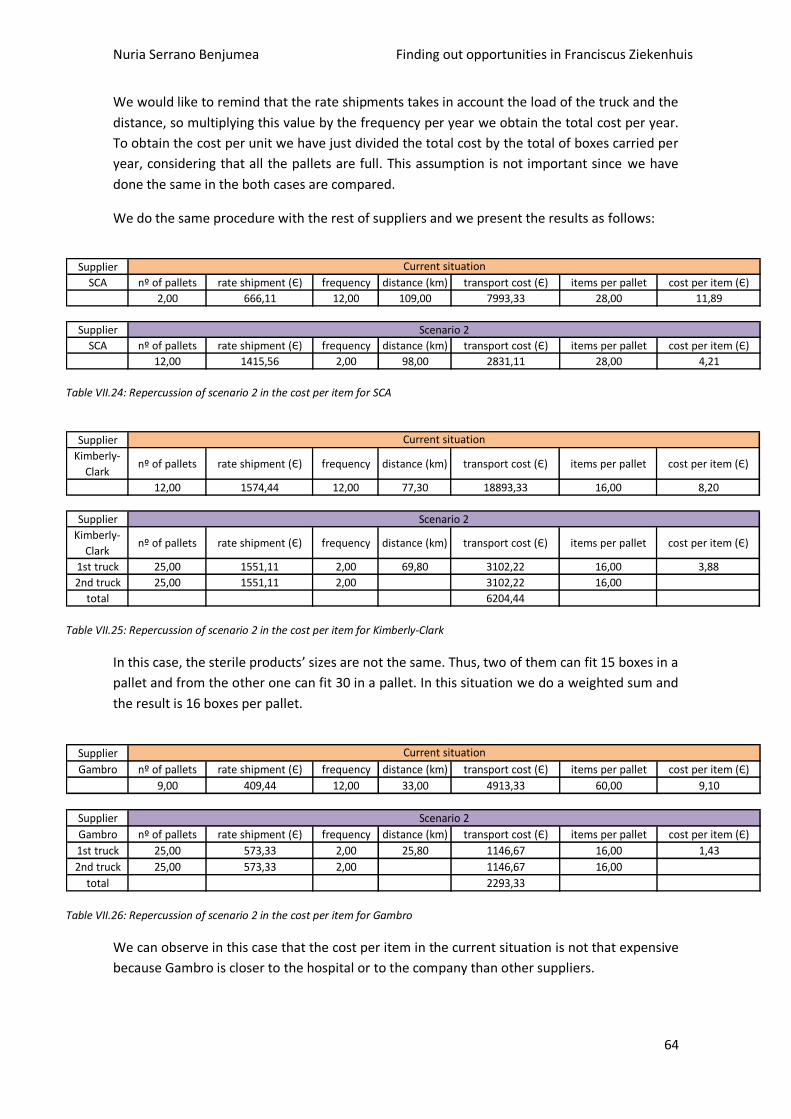
Nuria Serrano Benjumea Finding out opportunities in Franciscus Ziekenhuis
64
We would like to remind that the rate shipments takes in account the load of the truck and the
distance, so multiplying this value by the frequency per year we obtain the total cost per year.
To obtain the cost per unit we have just divided the total cost by the total of boxes carried per
year, considering that all the pallets are full. This assumption is not important since we have
done the same in the both cases are compared.
We do the same procedure with the rest of suppliers and we present the results as follows:
Supplier
SCA nº of pallets rate shipment (Є) frequency distance (km) transport cost (Є) items per pallet cost per item (Є)
2,00 666,11 12,00 109,00 7993,33 28,00 11,89
Supplier
SCA nº of pallets rate shipment (Є) frequency distance (km) transport cost (Є) items per pallet cost per item (Є)
12,00 1415,56 2,00 98,00 2831,11 28,00 4,21
Current situation
Scenario 2
Table VII.24: Repercussion of scenario 2 in the cost per item for SCA
Supplier
Kimberly-
Clarknº of pallets rate shipment (Є) frequency distance (km) transport cost (Є) items per pallet cost per item (Є)
12,00 1574,44 12,00 77,30 18893,33 16,00 8,20
Supplier
Kimberly-
Clarknº of pallets rate shipment (Є) frequency distance (km) transport cost (Є) items per pallet cost per item (Є)
1st truck 25,00 1551,11 2,00 69,80 3102,22 16,00 3,88
2nd truck 25,00 1551,11 2,00 3102,22 16,00
total 6204,44
Current situation
Scenario 2
Table VII.25: Repercussion of scenario 2 in the cost per item for Kimberly-Clark
In this case, the sterile products’ sizes are not the same. Thus, two of them can fit 15 boxes in a
pallet and from the other one can fit 30 in a pallet. In this situation we do a weighted sum and
the result is 16 boxes per pallet.
Supplier
Gambro nº of pallets rate shipment (Є) frequency distance (km) transport cost (Є) items per pallet cost per item (Є)
9,00 409,44 12,00 33,00 4913,33 60,00 9,10
Supplier
Gambro nº of pallets rate shipment (Є) frequency distance (km) transport cost (Є) items per pallet cost per item (Є)
1st truck 25,00 573,33 2,00 25,80 1146,67 16,00 1,43
2nd truck 25,00 573,33 2,00 1146,67 16,00
total 2293,33
Current situation
Scenario 2
Table VII.26: Repercussion of scenario 2 in the cost per item for Gambro
We can observe in this case that the cost per item in the current situation is not that expensive
because Gambro is closer to the hospital or to the company than other suppliers.
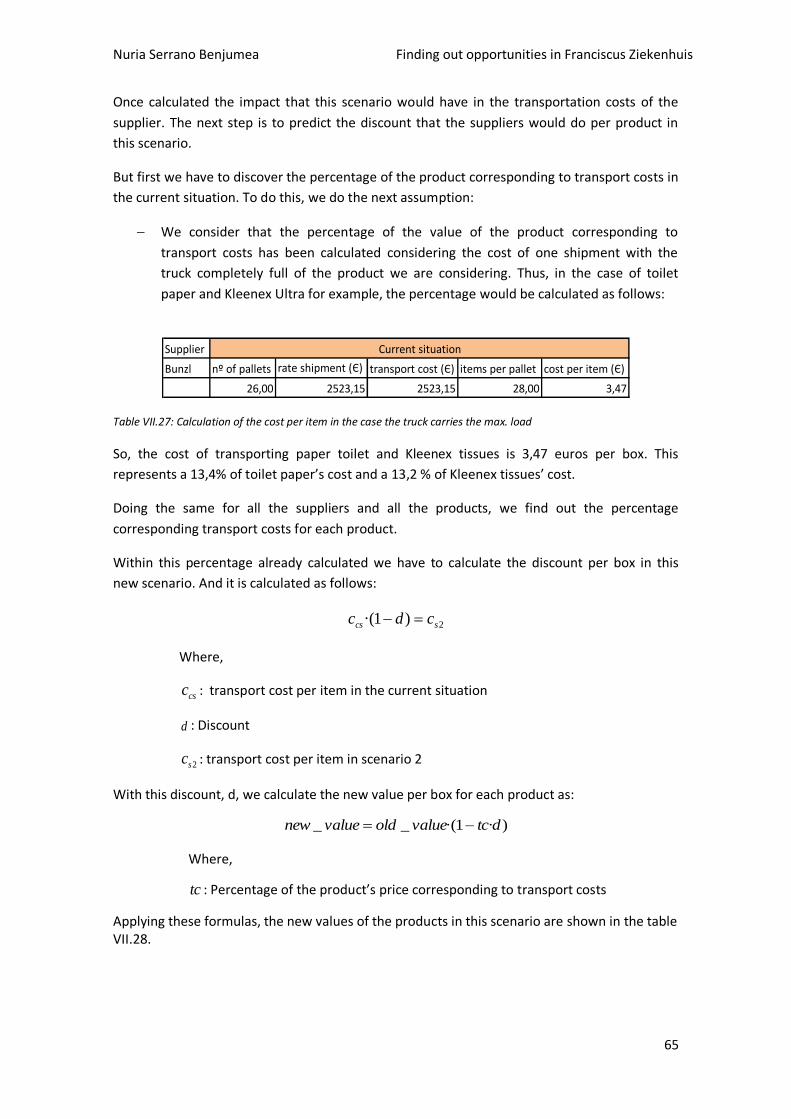
Nuria Serrano Benjumea Finding out opportunities in Franciscus Ziekenhuis
65
Once calculated the impact that this scenario would have in the transportation costs of the
supplier. The next step is to predict the discount that the suppliers would do per product in
this scenario.
But first we have to discover the percentage of the product corresponding to transport costs in
the current situation. To do this, we do the next assumption:
We consider that the percentage of the value of the product corresponding to
transport costs has been calculated considering the cost of one shipment with the
truck completely full of the product we are considering. Thus, in the case of toilet
paper and Kleenex Ultra for example, the percentage would be calculated as follows:
Supplier
Bunzl nº of pallets rate shipment (Є) transport cost (Є) items per pallet cost per item (Є)
26,00 2523,15 2523,15 28,00 3,47
Current situation
Table VII.27: Calculation of the cost per item in the case the truck carries the max. load
So, the cost of transporting paper toilet and Kleenex tissues is 3,47 euros per box. This
represents a 13,4% of toilet paper’s cost and a 13,2 % of Kleenex tissues’ cost.
Doing the same for all the suppliers and all the products, we find out the percentage
corresponding transport costs for each product.
Within this percentage already calculated we have to calculate the discount per box in this
new scenario. And it is calculated as follows:
2)1·( scs cdc
Where,
csc : transport cost per item in the current situation
d : Discount
2sc : transport cost per item in scenario 2
With this discount, d, we calculate the new value per box for each product as:
)·1·(__ dtcvalueoldvaluenew
Where,
tc : Percentage of the product’s price corresponding to transport costs
Applying these formulas, the new values of the products in this scenario are shown in the table VII.28.
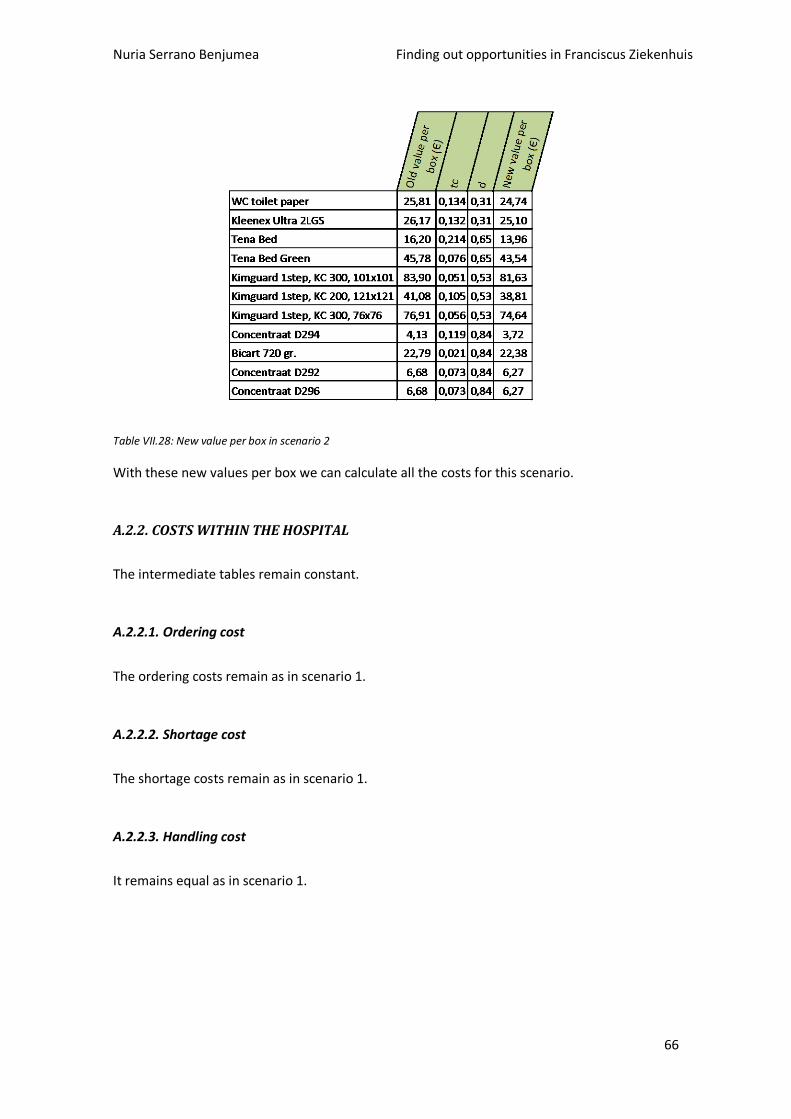
Nuria Serrano Benjumea Finding out opportunities in Franciscus Ziekenhuis
66
Table VII.28: New value per box in scenario 2
With these new values per box we can calculate all the costs for this scenario.
A.2.2. COSTS WITHIN THE HOSPITAL
The intermediate tables remain constant.
A.2.2.1. Ordering cost
The ordering costs remain as in scenario 1.
A.2.2.2. Shortage cost
The shortage costs remain as in scenario 1.
A.2.2.3. Handling cost
It remains equal as in scenario 1.
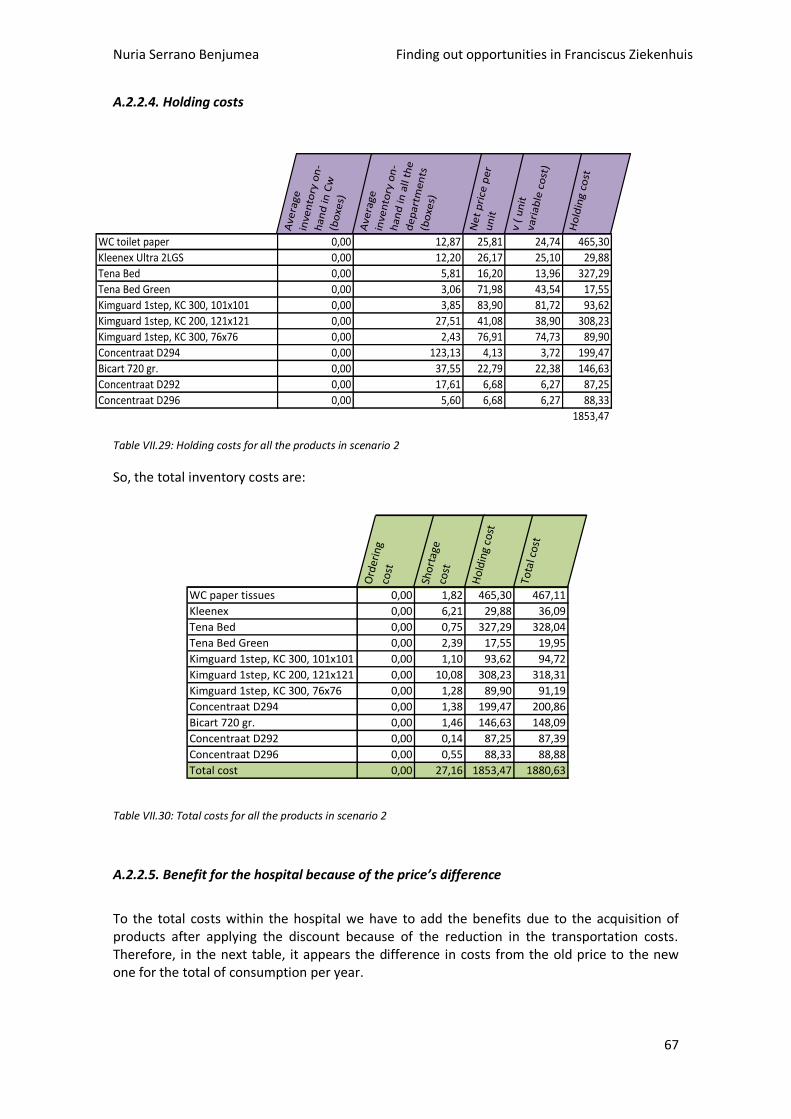
Nuria Serrano Benjumea Finding out opportunities in Franciscus Ziekenhuis
67
A.2.2.4. Holding costs
Ave
rage
in
ven
tory
on
-h
an
d in
Cw
(b
oxe
s)
Ave
rage
in
ven
tory
on
-h
an
d in
all
the
d
ep
art
me
nts
(b
oxe
s)
Ne
t p
rice
pe
r u
nit
v (
un
it
vari
ab
le c
ost
)
Ho
ldin
g c
ost
WC toilet paper 0,00 12,87 25,81 24,74 465,30
Kleenex Ultra 2LGS 0,00 12,20 26,17 25,10 29,88
Tena Bed 0,00 5,81 16,20 13,96 327,29
Tena Bed Green 0,00 3,06 71,98 43,54 17,55
Kimguard 1step, KC 300, 101x101 0,00 3,85 83,90 81,72 93,62
Kimguard 1step, KC 200, 121x121 0,00 27,51 41,08 38,90 308,23
Kimguard 1step, KC 300, 76x76 0,00 2,43 76,91 74,73 89,90
Concentraat D294 0,00 123,13 4,13 3,72 199,47
Bicart 720 gr. 0,00 37,55 22,79 22,38 146,63
Concentraat D292 0,00 17,61 6,68 6,27 87,25
Concentraat D296 0,00 5,60 6,68 6,27 88,33
1853,47
Table VII.29: Holding costs for all the products in scenario 2
So, the total inventory costs are:
Ord
erin
g co
st
Sho
rtag
e co
st
Ho
ldin
g co
st
Tota
l co
st
WC paper tissues 0,00 1,82 465,30 467,11
Kleenex 0,00 6,21 29,88 36,09
Tena Bed 0,00 0,75 327,29 328,04
Tena Bed Green 0,00 2,39 17,55 19,95
Kimguard 1step, KC 300, 101x101 0,00 1,10 93,62 94,72
Kimguard 1step, KC 200, 121x121 0,00 10,08 308,23 318,31
Kimguard 1step, KC 300, 76x76 0,00 1,28 89,90 91,19
Concentraat D294 0,00 1,38 199,47 200,86
Bicart 720 gr. 0,00 1,46 146,63 148,09
Concentraat D292 0,00 0,14 87,25 87,39
Concentraat D296 0,00 0,55 88,33 88,88
Total cost 0,00 27,16 1853,47 1880,63
Table VII.30: Total costs for all the products in scenario 2
A.2.2.5. Benefit for the hospital because of the price’s difference
To the total costs within the hospital we have to add the benefits due to the acquisition of products after applying the discount because of the reduction in the transportation costs. Therefore, in the next table, it appears the difference in costs from the old price to the new one for the total of consumption per year.
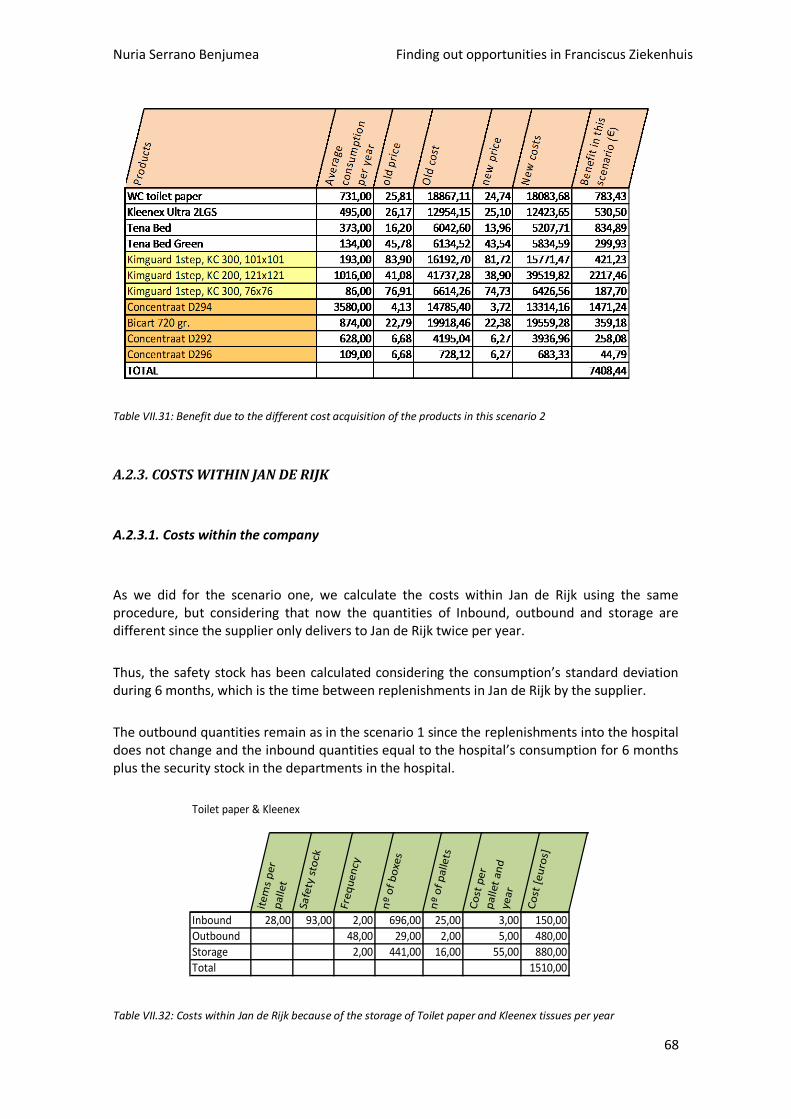
Nuria Serrano Benjumea Finding out opportunities in Franciscus Ziekenhuis
68
Table VII.31: Benefit due to the different cost acquisition of the products in this scenario 2
A.2.3. COSTS WITHIN JAN DE RIJK
A.2.3.1. Costs within the company
As we did for the scenario one, we calculate the costs within Jan de Rijk using the same procedure, but considering that now the quantities of Inbound, outbound and storage are different since the supplier only delivers to Jan de Rijk twice per year.
Thus, the safety stock has been calculated considering the consumption’s standard deviation during 6 months, which is the time between replenishments in Jan de Rijk by the supplier.
The outbound quantities remain as in the scenario 1 since the replenishments into the hospital does not change and the inbound quantities equal to the hospital’s consumption for 6 months plus the security stock in the departments in the hospital.
Toilet paper & Kleenex
ite
ms
pe
r p
alle
t
Safe
ty s
tock
Fre
qu
en
cy
nº
of
bo
xes
nº
of
pal
lets
Co
st p
er
pal
let
and
ye
ar
Co
st [
eu
ros]
Inbound 28,00 93,00 2,00 696,00 25,00 3,00 150,00
Outbound 48,00 29,00 2,00 5,00 480,00
Storage 2,00 441,00 16,00 55,00 880,00
Total 1510,00
Table VII.32: Costs within Jan de Rijk because of the storage of Toilet paper and Kleenex tissues per year
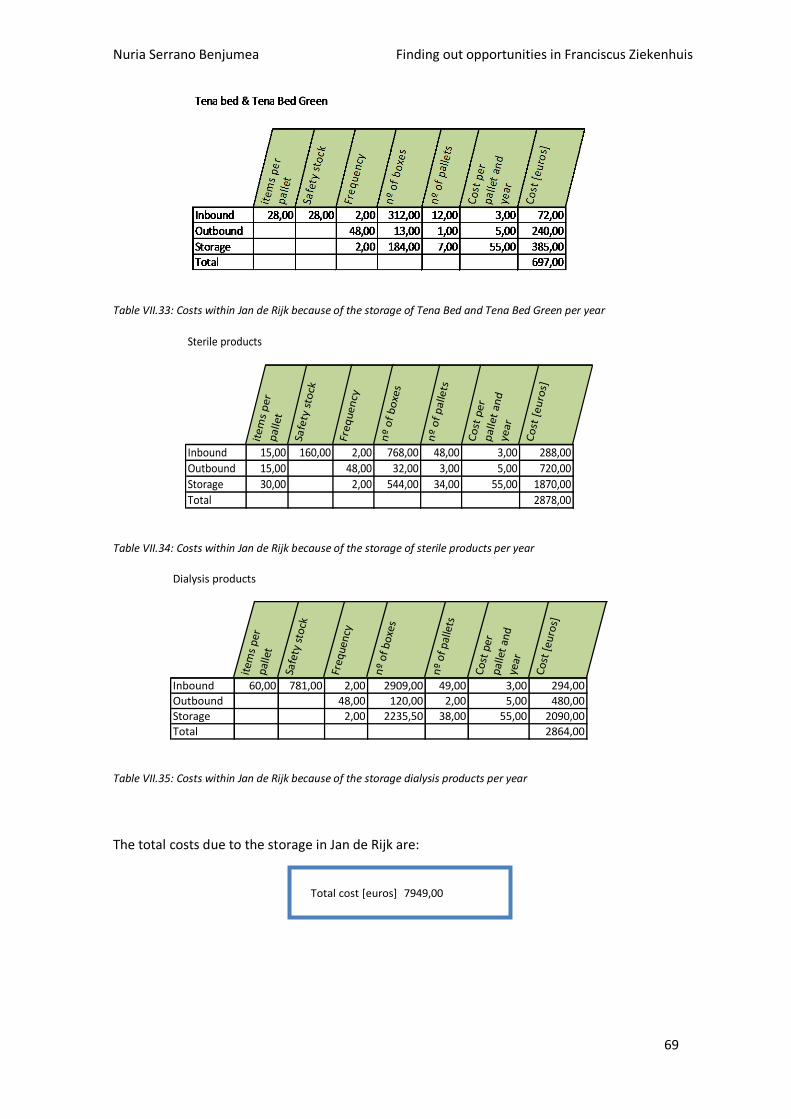
Nuria Serrano Benjumea Finding out opportunities in Franciscus Ziekenhuis
69
Table VII.33: Costs within Jan de Rijk because of the storage of Tena Bed and Tena Bed Green per year
Sterile products
ite
ms
pe
r p
alle
t
Safe
ty s
tock
Fre
qu
en
cy
nº
of
bo
xes
nº
of
pal
lets
Co
st p
er
pal
let
and
ye
ar
Co
st [
eu
ros]
Inbound 15,00 160,00 2,00 768,00 48,00 3,00 288,00
Outbound 15,00 48,00 32,00 3,00 5,00 720,00
Storage 30,00 2,00 544,00 34,00 55,00 1870,00
Total 2878,00
Table VII.34: Costs within Jan de Rijk because of the storage of sterile products per year
Dialysis products
item
s p
er
pal
let
Safe
ty s
tock
Freq
uen
cy
nº
of
bo
xes
nº
of
pal
lets
Co
st p
er
pal
let
and
ye
ar
Co
st [
euro
s]
Inbound 60,00 781,00 2,00 2909,00 49,00 3,00 294,00
Outbound 48,00 120,00 2,00 5,00 480,00
Storage 2,00 2235,50 38,00 55,00 2090,00
Total 2864,00
Table VII.35: Costs within Jan de Rijk because of the storage dialysis products per year
The total costs due to the storage in Jan de Rijk are:
Total cost [euros] 7949,00
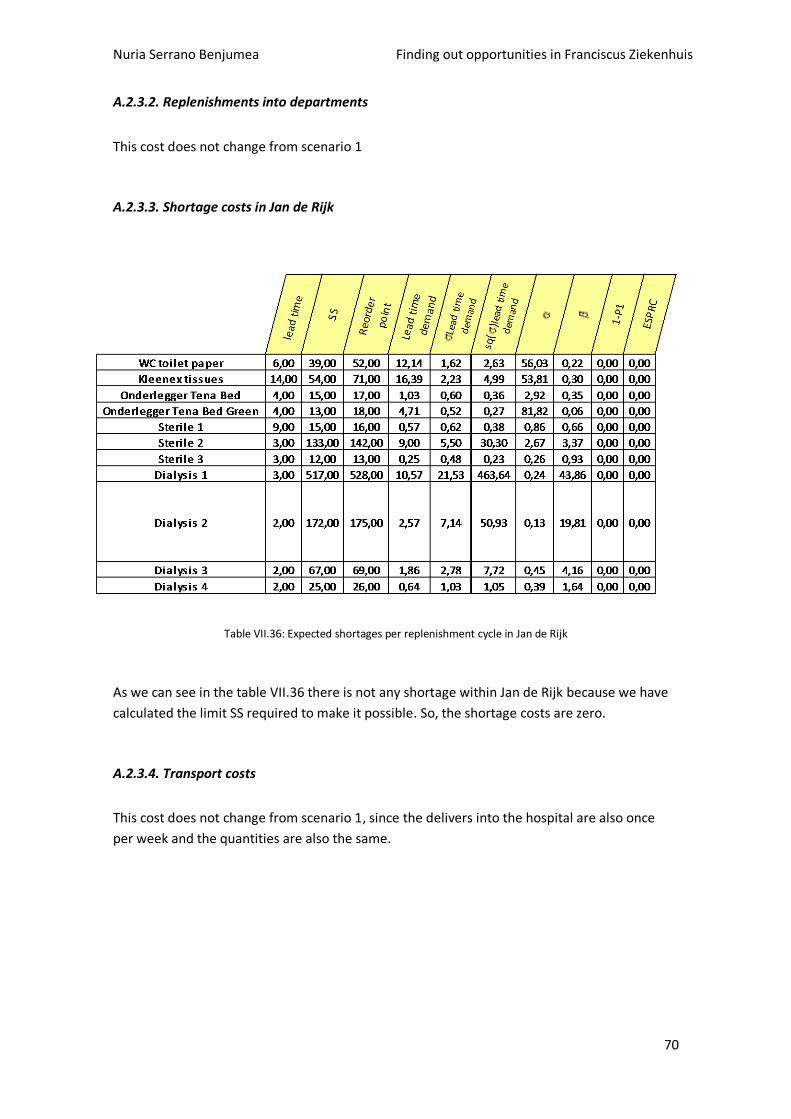
Nuria Serrano Benjumea Finding out opportunities in Franciscus Ziekenhuis
70
A.2.3.2. Replenishments into departments
This cost does not change from scenario 1
A.2.3.3. Shortage costs in Jan de Rijk
Table VII.36: Expected shortages per replenishment cycle in Jan de Rijk
As we can see in the table VII.36 there is not any shortage within Jan de Rijk because we have
calculated the limit SS required to make it possible. So, the shortage costs are zero.
A.2.3.4. Transport costs
This cost does not change from scenario 1, since the delivers into the hospital are also once
per week and the quantities are also the same.
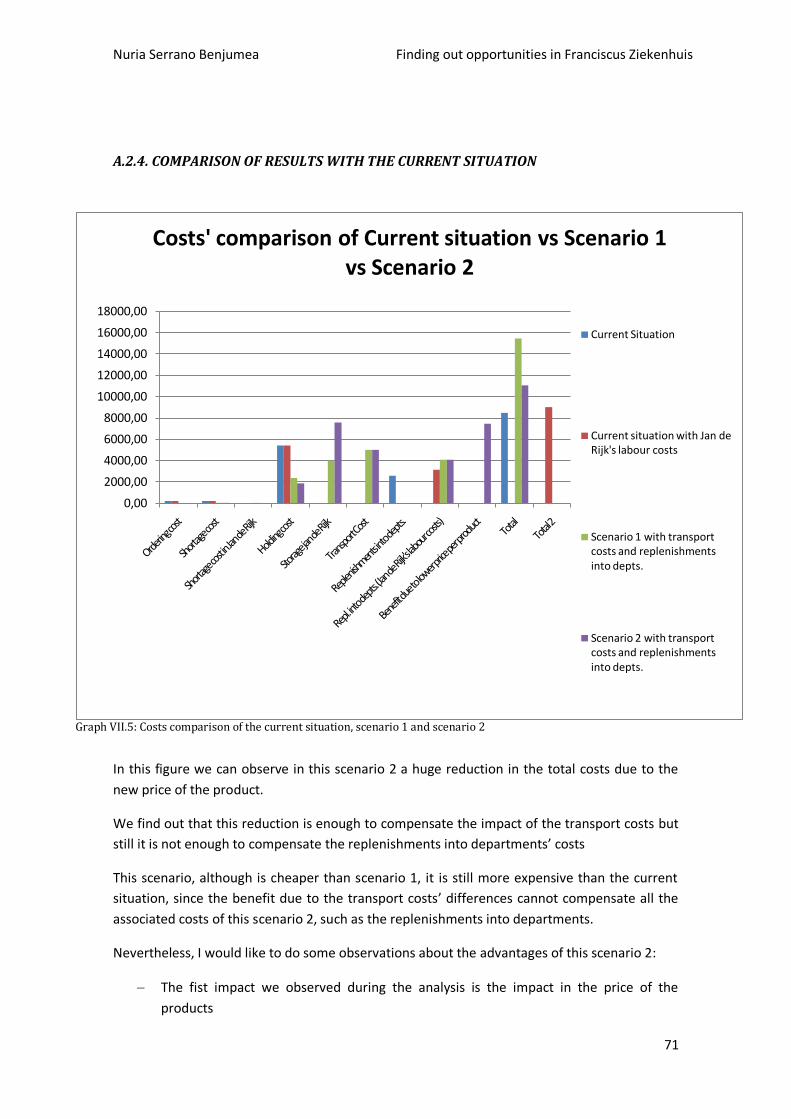
Nuria Serrano Benjumea Finding out opportunities in Franciscus Ziekenhuis
71
A.2.4. COMPARISON OF RESULTS WITH THE CURRENT SITUATION
Graph VII.5: Costs comparison of the current situation, scenario 1 and scenario 2
In this figure we can observe in this scenario 2 a huge reduction in the total costs due to the
new price of the product.
We find out that this reduction is enough to compensate the impact of the transport costs but
still it is not enough to compensate the replenishments into departments’ costs
This scenario, although is cheaper than scenario 1, it is still more expensive than the current
situation, since the benefit due to the transport costs’ differences cannot compensate all the
associated costs of this scenario 2, such as the replenishments into departments.
Nevertheless, I would like to do some observations about the advantages of this scenario 2:
The fist impact we observed during the analysis is the impact in the price of the
products
0,00
2000,00
4000,00
6000,00
8000,00
10000,00
12000,00
14000,00
16000,00
18000,00
Costs' comparison of Current situation vs Scenario 1 vs Scenario 2
Current Situation
Current situation with Jan de Rijk's labour costs
Scenario 1 with transport costs and replenishments into depts.
Scenario 2 with transport costs and replenishments into depts.
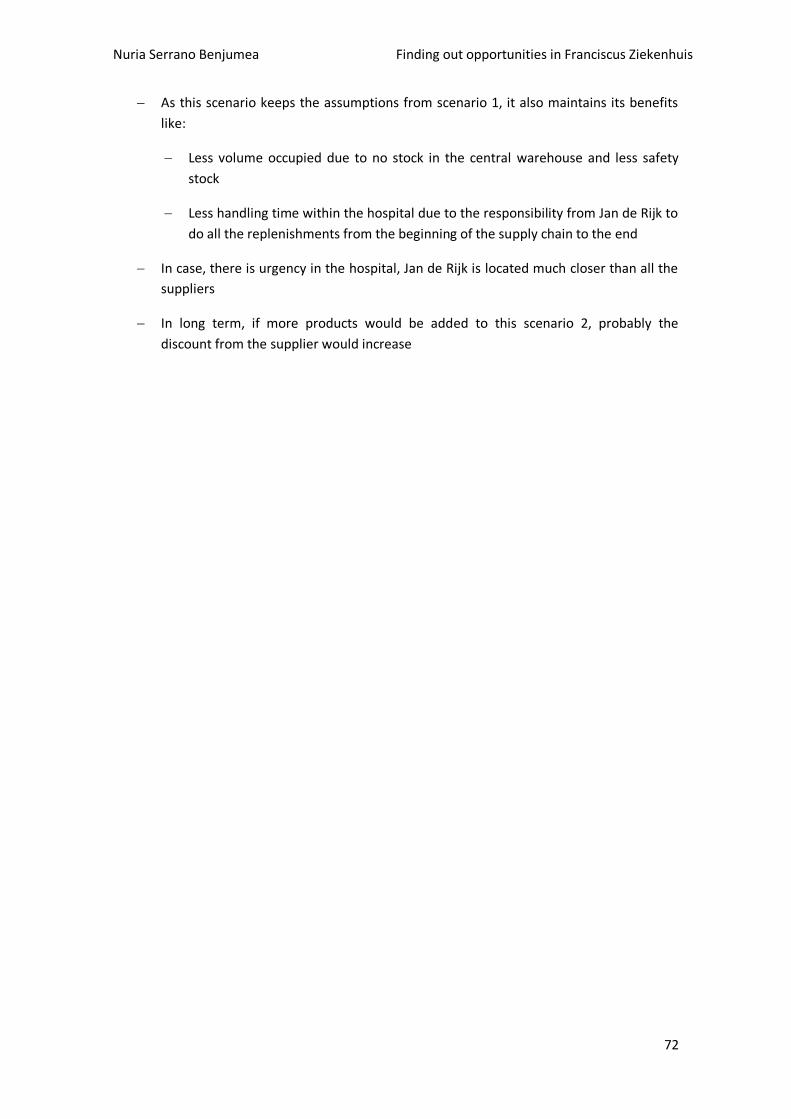
Nuria Serrano Benjumea Finding out opportunities in Franciscus Ziekenhuis
72
As this scenario keeps the assumptions from scenario 1, it also maintains its benefits
like:
Less volume occupied due to no stock in the central warehouse and less safety
stock
Less handling time within the hospital due to the responsibility from Jan de Rijk to
do all the replenishments from the beginning of the supply chain to the end
In case, there is urgency in the hospital, Jan de Rijk is located much closer than all the
suppliers
In long term, if more products would be added to this scenario 2, probably the
discount from the supplier would increase
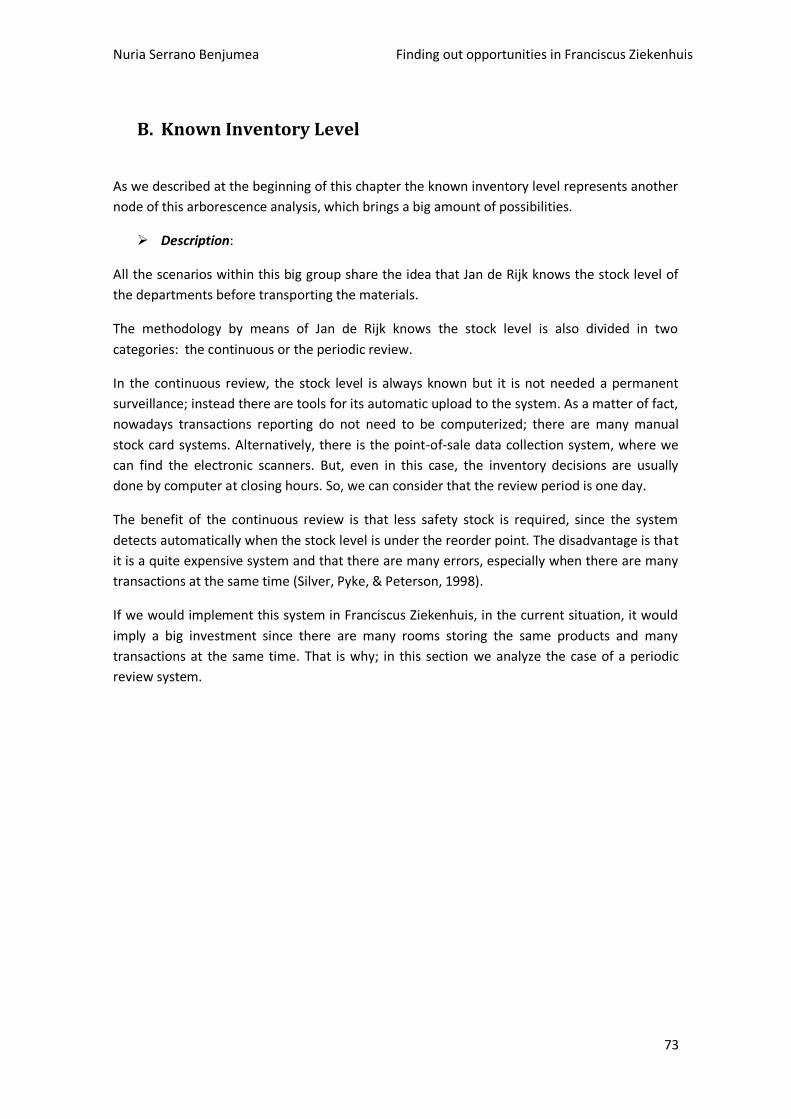
Nuria Serrano Benjumea Finding out opportunities in Franciscus Ziekenhuis
73
B. Known Inventory Level
As we described at the beginning of this chapter the known inventory level represents another
node of this arborescence analysis, which brings a big amount of possibilities.
Description:
All the scenarios within this big group share the idea that Jan de Rijk knows the stock level of
the departments before transporting the materials.
The methodology by means of Jan de Rijk knows the stock level is also divided in two
categories: the continuous or the periodic review.
In the continuous review, the stock level is always known but it is not needed a permanent
surveillance; instead there are tools for its automatic upload to the system. As a matter of fact,
nowadays transactions reporting do not need to be computerized; there are many manual
stock card systems. Alternatively, there is the point-of-sale data collection system, where we
can find the electronic scanners. But, even in this case, the inventory decisions are usually
done by computer at closing hours. So, we can consider that the review period is one day.
The benefit of the continuous review is that less safety stock is required, since the system
detects automatically when the stock level is under the reorder point. The disadvantage is that
it is a quite expensive system and that there are many errors, especially when there are many
transactions at the same time (Silver, Pyke, & Peterson, 1998).
If we would implement this system in Franciscus Ziekenhuis, in the current situation, it would
imply a big investment since there are many rooms storing the same products and many
transactions at the same time. That is why; in this section we analyze the case of a periodic
review system.
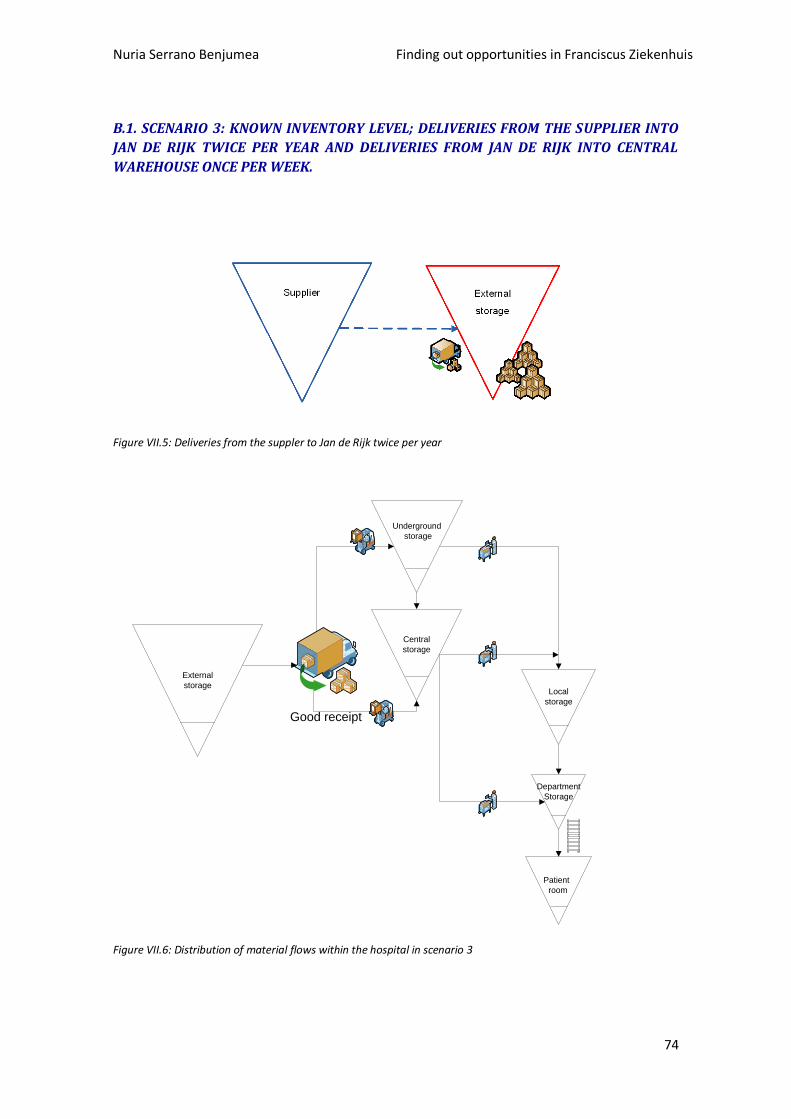
Nuria Serrano Benjumea Finding out opportunities in Franciscus Ziekenhuis
74
B.1. SCENARIO 3: KNOWN INVENTORY LEVEL; DELIVERIES FROM THE SUPPLIER INTO
JAN DE RIJK TWICE PER YEAR AND DELIVERIES FROM JAN DE RIJK INTO CENTRAL
WAREHOUSE ONCE PER WEEK.
Figure VII.5: Deliveries from the suppler to Jan de Rijk twice per year
Good receipt
External
storage
Underground
storage
Central
storage
Local
storage
Patient
room
Department
Storage
Figure VII.6: Distribution of material flows within the hospital in scenario 3
Nuria Serrano Benjumea Finding out opportunities in Franciscus Ziekenhuis
75
Assumptions:
- Since the consumption is quite stable, the review period (R) established is one week
- The model that approaches the reality in the departments is a (R,s,S) system. Each R
units of time the stock level is controlled, if it is under the reorder point s, the
replenishment has to be enough to replenish until the stock-up-to-level S
- Jan the Rijk makes use of the Vendor Management System (VMS) by means of when
the stock level drops the reorder point s, Jan the Rijk delivers the corresponding
products to the hospital. Since the reviews in the hospital are once per week. The
stock up-to-level established is one week’s consumption. In this situation the ordering
cost per year is zero, since no orders are needed
- In this scenario, Jan de Rijk delivers into the Central Warehouse and then employees
from Franciscus Ziekenhuis deliver the products into departments by use of
rolcontainers. Therefore, the handling times have to be recalculated for this new
situation.
- The safety stock in the departments is enough to cover the expected shortages per
cycle
- Since, the supplier delivers into Jan de Rijk twice per year and it saves a lot of money in
transport costs, the discounts due to this situation and calculated in section A.2.1, are
also used in this scenario
- The lead time considered is zero: Franciscus Ziekenhuis and Jan de Rijk agree one day
of the week for the stock reviewing. A employee from the hospital scan the products in
the departments, the mentioned day in the morning, and Jan de Rijk check from their
computer the quantities needed doing the replenishment that same day.
B.1.1. COSTS WITHIN THE HOSPITAL
In this scenario, we have to recalculate the handling times within the hospital: the person
responsible has to scan the products and distributing them into the departments when Jan de
Rijk arrives, using a rolcontainer.
Moreover, we also have to recalculate the safety stock required since the lead time in this
situation has changed. The protector interval in this scenario is R+L= 7 + 0 days= 7 days.
On the opposite, we can use the same amounts to carry per replenishment than in scenario 1
and 2 since this analysis is made using average quantities and the consumption is quite regular.
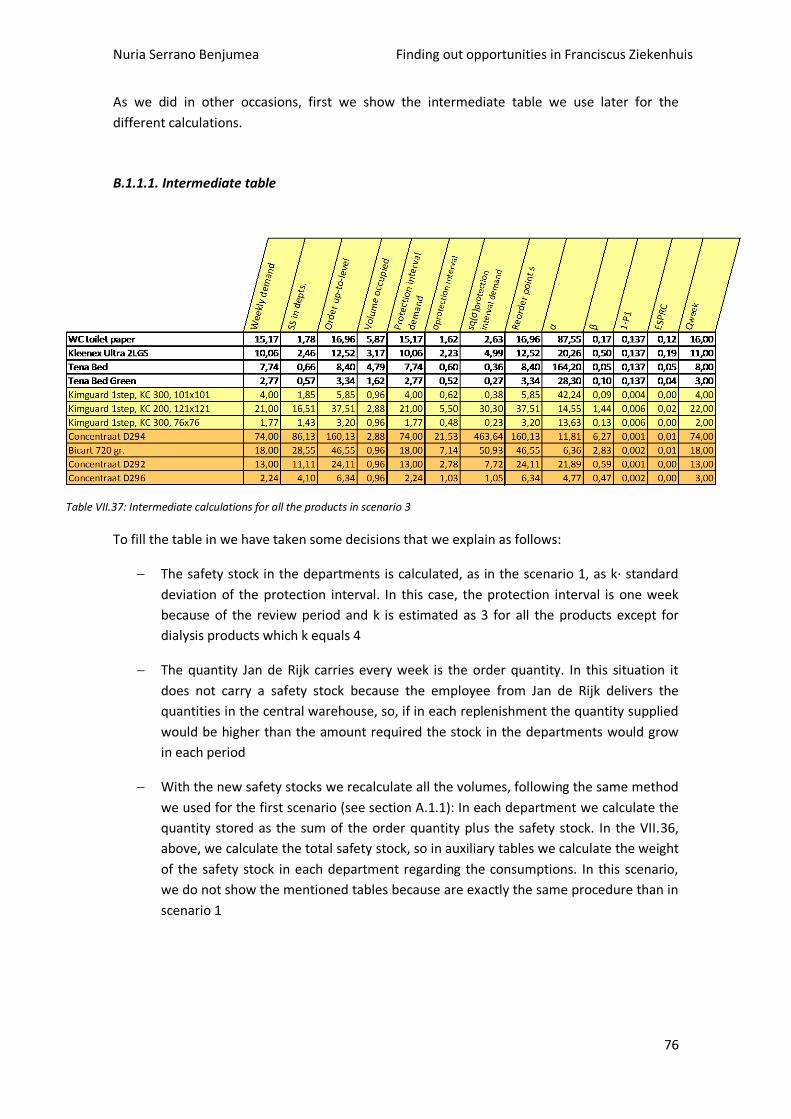
Nuria Serrano Benjumea Finding out opportunities in Franciscus Ziekenhuis
76
As we did in other occasions, first we show the intermediate table we use later for the
different calculations.
B.1.1.1. Intermediate table
Table VII.37: Intermediate calculations for all the products in scenario 3
To fill the table in we have taken some decisions that we explain as follows:
The safety stock in the departments is calculated, as in the scenario 1, as k· standard
deviation of the protection interval. In this case, the protection interval is one week
because of the review period and k is estimated as 3 for all the products except for
dialysis products which k equals 4
The quantity Jan de Rijk carries every week is the order quantity. In this situation it
does not carry a safety stock because the employee from Jan de Rijk delivers the
quantities in the central warehouse, so, if in each replenishment the quantity supplied
would be higher than the amount required the stock in the departments would grow
in each period
With the new safety stocks we recalculate all the volumes, following the same method
we used for the first scenario (see section A.1.1): In each department we calculate the
quantity stored as the sum of the order quantity plus the safety stock. In the VII.36,
above, we calculate the total safety stock, so in auxiliary tables we calculate the weight
of the safety stock in each department regarding the consumptions. In this scenario,
we do not show the mentioned tables because are exactly the same procedure than in
scenario 1
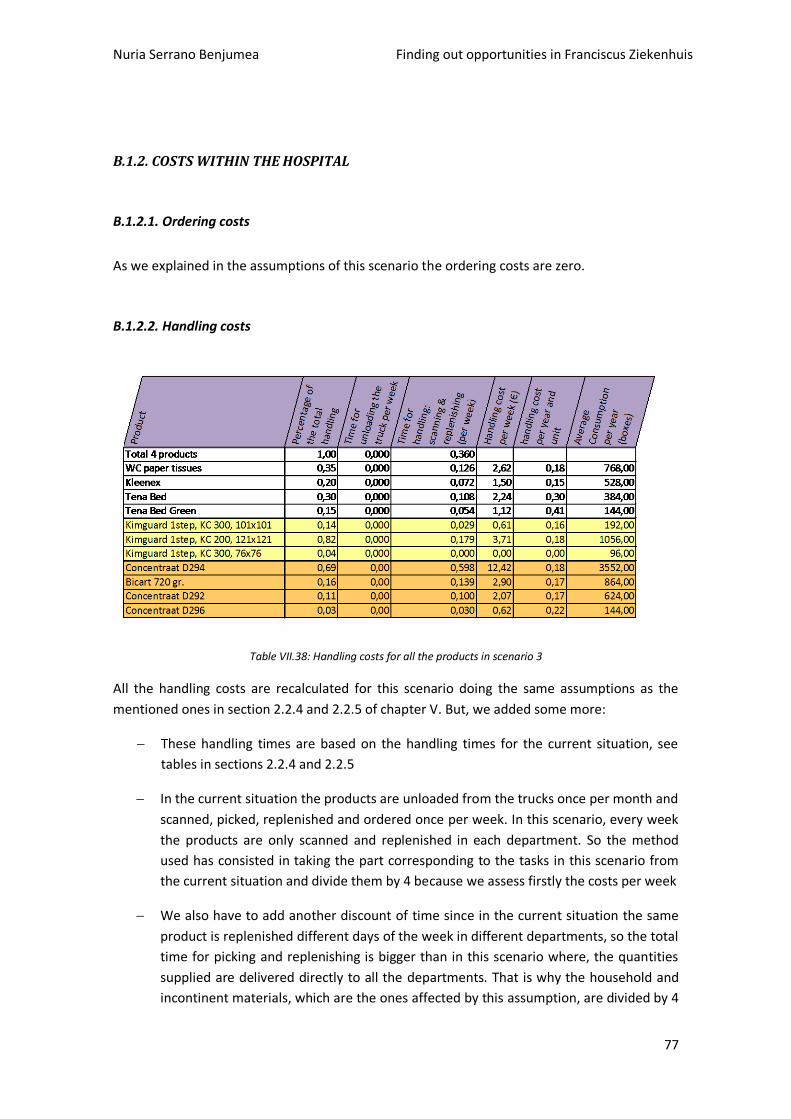
Nuria Serrano Benjumea Finding out opportunities in Franciscus Ziekenhuis
77
B.1.2. COSTS WITHIN THE HOSPITAL
B.1.2.1. Ordering costs
As we explained in the assumptions of this scenario the ordering costs are zero.
B.1.2.2. Handling costs
Table VII.38: Handling costs for all the products in scenario 3
All the handling costs are recalculated for this scenario doing the same assumptions as the
mentioned ones in section 2.2.4 and 2.2.5 of chapter V. But, we added some more:
These handling times are based on the handling times for the current situation, see
tables in sections 2.2.4 and 2.2.5
In the current situation the products are unloaded from the trucks once per month and
scanned, picked, replenished and ordered once per week. In this scenario, every week
the products are only scanned and replenished in each department. So the method
used has consisted in taking the part corresponding to the tasks in this scenario from
the current situation and divide them by 4 because we assess firstly the costs per week
We also have to add another discount of time since in the current situation the same
product is replenished different days of the week in different departments, so the total
time for picking and replenishing is bigger than in this scenario where, the quantities
supplied are delivered directly to all the departments. That is why the household and
incontinent materials, which are the ones affected by this assumption, are divided by 4
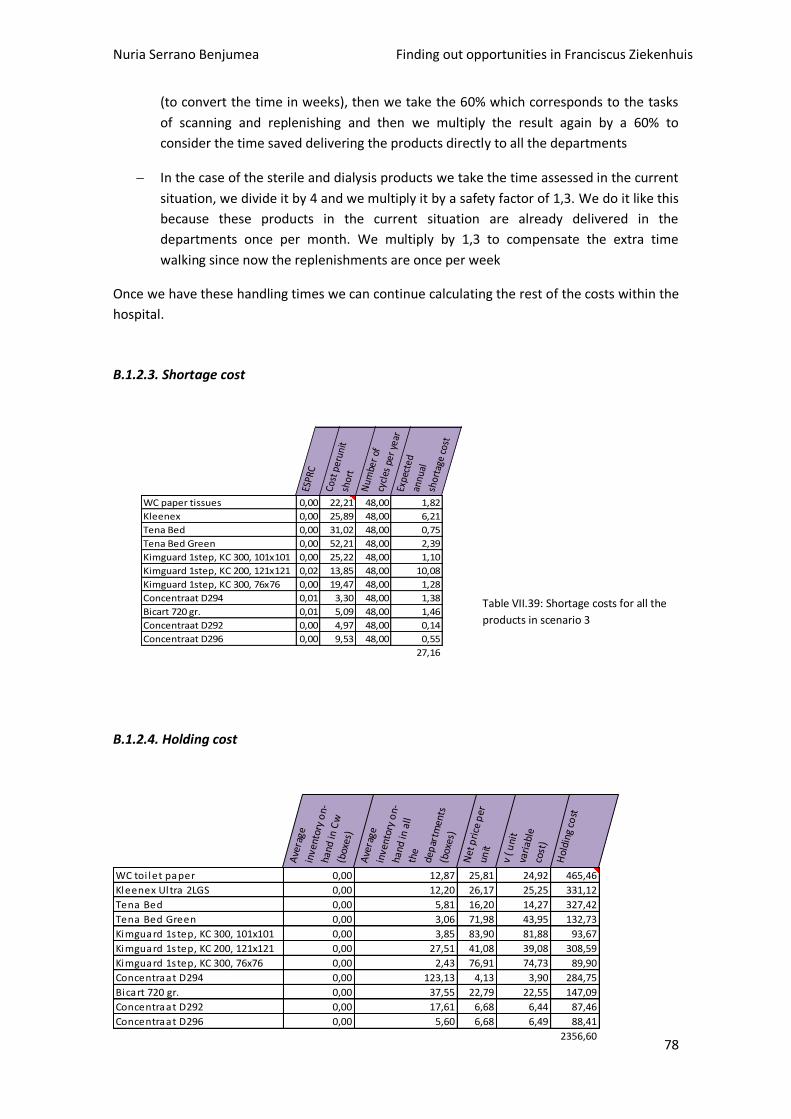
Nuria Serrano Benjumea Finding out opportunities in Franciscus Ziekenhuis
78
(to convert the time in weeks), then we take the 60% which corresponds to the tasks
of scanning and replenishing and then we multiply the result again by a 60% to
consider the time saved delivering the products directly to all the departments
In the case of the sterile and dialysis products we take the time assessed in the current
situation, we divide it by 4 and we multiply it by a safety factor of 1,3. We do it like this
because these products in the current situation are already delivered in the
departments once per month. We multiply by 1,3 to compensate the extra time
walking since now the replenishments are once per week
Once we have these handling times we can continue calculating the rest of the costs within the
hospital.
B.1.2.3. Shortage cost
Table VII.39: Shortage costs for all the
products in scenario 3
B.1.2.4. Holding cost
ESPR
C
Cost
per
unit
shor
t
Num
ber
of
cycl
es p
er y
ear
Expe
cted
an
nual
sh
orta
ge c
ost
WC paper tissues 0,00 22,21 48,00 1,82
Kleenex 0,00 25,89 48,00 6,21
Tena Bed 0,00 31,02 48,00 0,75
Tena Bed Green 0,00 52,21 48,00 2,39
Kimguard 1step, KC 300, 101x101 0,00 25,22 48,00 1,10
Kimguard 1step, KC 200, 121x121 0,02 13,85 48,00 10,08
Kimguard 1step, KC 300, 76x76 0,00 19,47 48,00 1,28
Concentraat D294 0,01 3,30 48,00 1,38
Bicart 720 gr. 0,01 5,09 48,00 1,46
Concentraat D292 0,00 4,97 48,00 0,14
Concentraat D296 0,00 9,53 48,00 0,55
27,16
Ave
rage
in
vent
ory
on-
hand
in C
w
(box
es)
Ave
rage
in
vent
ory
on-
hand
in a
ll th
e de
par
tmen
ts
(box
es)
Net
pri
ce p
er
unit
v ( u
nit
vari
able
co
st)
Hol
ding
co
st
WC toi let paper 0,00 12,87 25,81 24,92 465,46
Kleenex Ultra 2LGS 0,00 12,20 26,17 25,25 331,12
Tena Bed 0,00 5,81 16,20 14,27 327,42
Tena Bed Green 0,00 3,06 71,98 43,95 132,73
Kimguard 1step, KC 300, 101x101 0,00 3,85 83,90 81,88 93,67
Kimguard 1step, KC 200, 121x121 0,00 27,51 41,08 39,08 308,59
Kimguard 1step, KC 300, 76x76 0,00 2,43 76,91 74,73 89,90
Concentraat D294 0,00 123,13 4,13 3,90 284,75
Bicart 720 gr. 0,00 37,55 22,79 22,55 147,09
Concentraat D292 0,00 17,61 6,68 6,44 87,46
Concentraat D296 0,00 5,60 6,68 6,49 88,41
2356,60
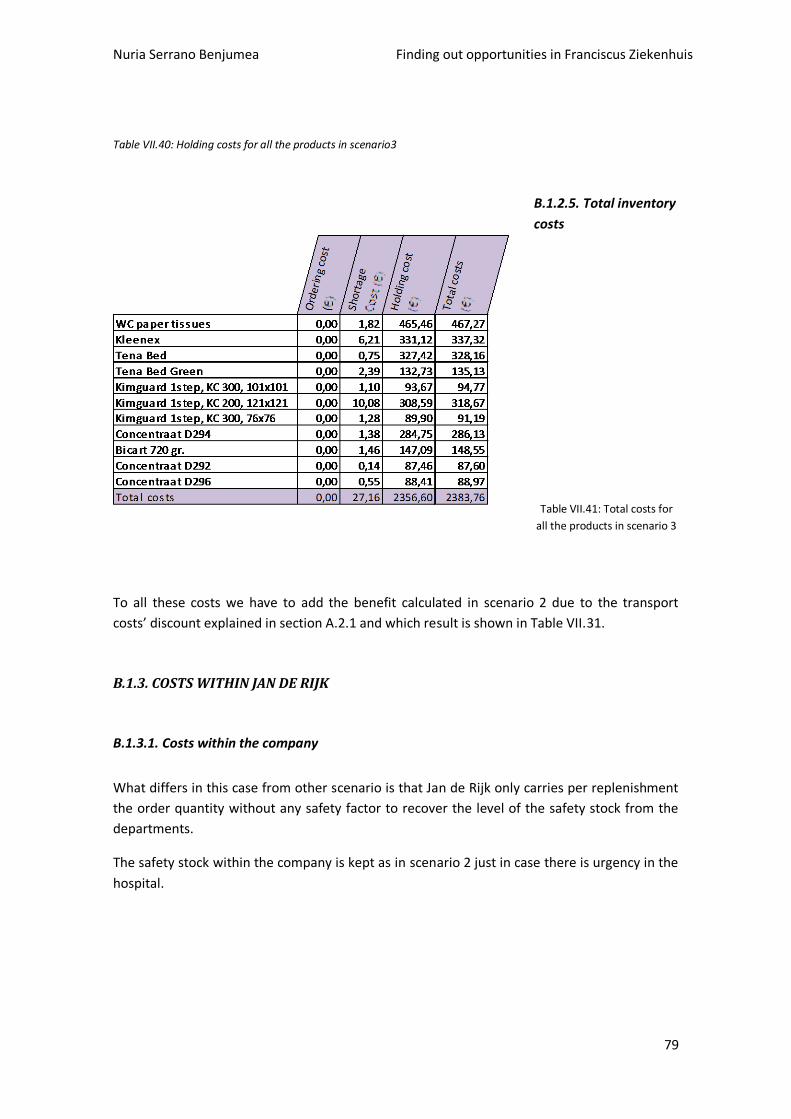
Nuria Serrano Benjumea Finding out opportunities in Franciscus Ziekenhuis
79
Table VII.40: Holding costs for all the products in scenario3
B.1.2.5. Total inventory
costs
Table VII.41: Total costs for
all the products in scenario 3
To all these costs we have to add the benefit calculated in scenario 2 due to the transport
costs’ discount explained in section A.2.1 and which result is shown in Table VII.31.
B.1.3. COSTS WITHIN JAN DE RIJK
B.1.3.1. Costs within the company
What differs in this case from other scenario is that Jan de Rijk only carries per replenishment
the order quantity without any safety factor to recover the level of the safety stock from the
departments.
The safety stock within the company is kept as in scenario 2 just in case there is urgency in the
hospital.
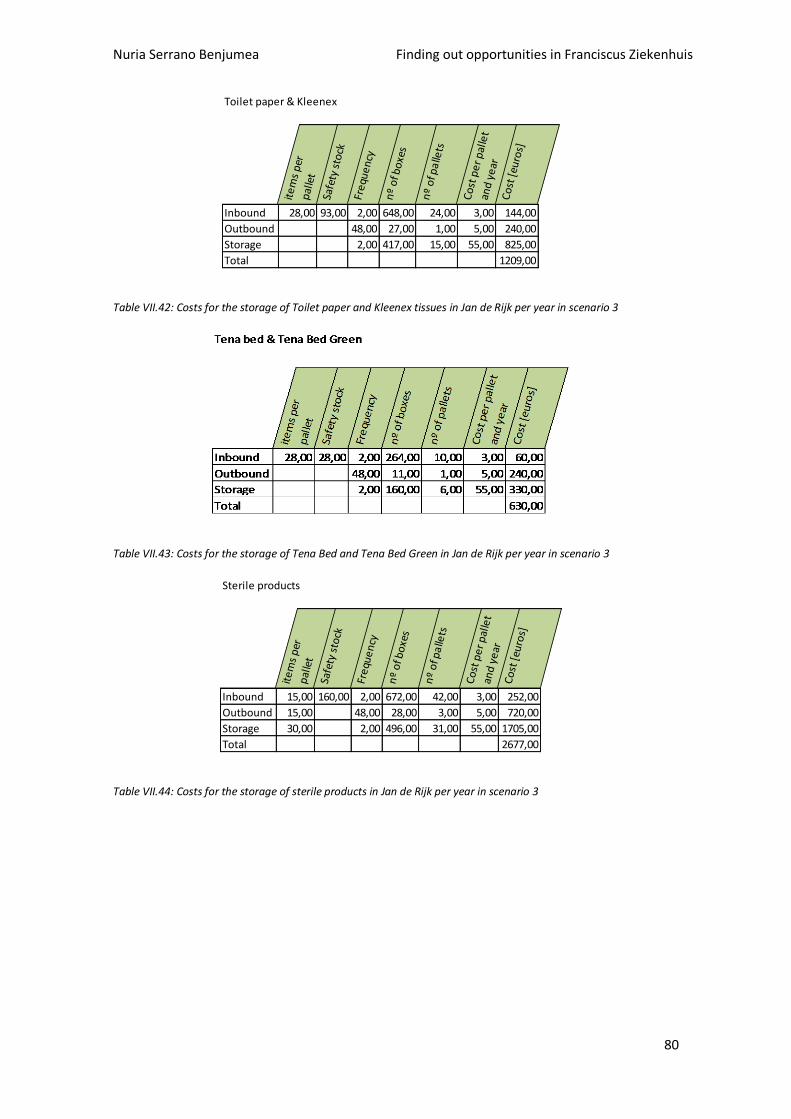
Nuria Serrano Benjumea Finding out opportunities in Franciscus Ziekenhuis
80
Toilet paper & Kleenex
ite
ms
per
p
alle
t
Safe
ty s
tock
Fre
que
ncy
nº
of b
oxe
s
nº
of p
alle
ts
Co
st p
er
pal
let
and
ye
arC
ost
[eu
ros]
Inbound 28,00 93,00 2,00 648,00 24,00 3,00 144,00
Outbound 48,00 27,00 1,00 5,00 240,00
Storage 2,00 417,00 15,00 55,00 825,00
Total 1209,00
Table VII.42: Costs for the storage of Toilet paper and Kleenex tissues in Jan de Rijk per year in scenario 3
Table VII.43: Costs for the storage of Tena Bed and Tena Bed Green in Jan de Rijk per year in scenario 3
Sterile products
ite
ms
per
p
alle
t
Safe
ty s
tock
Fre
que
ncy
nº
of b
oxe
s
nº
of p
alle
ts
Co
st p
er
pal
let
and
ye
arC
ost
[eu
ros]
Inbound 15,00 160,00 2,00 672,00 42,00 3,00 252,00
Outbound 15,00 48,00 28,00 3,00 5,00 720,00
Storage 30,00 2,00 496,00 31,00 55,00 1705,00
Total 2677,00
Table VII.44: Costs for the storage of sterile products in Jan de Rijk per year in scenario 3
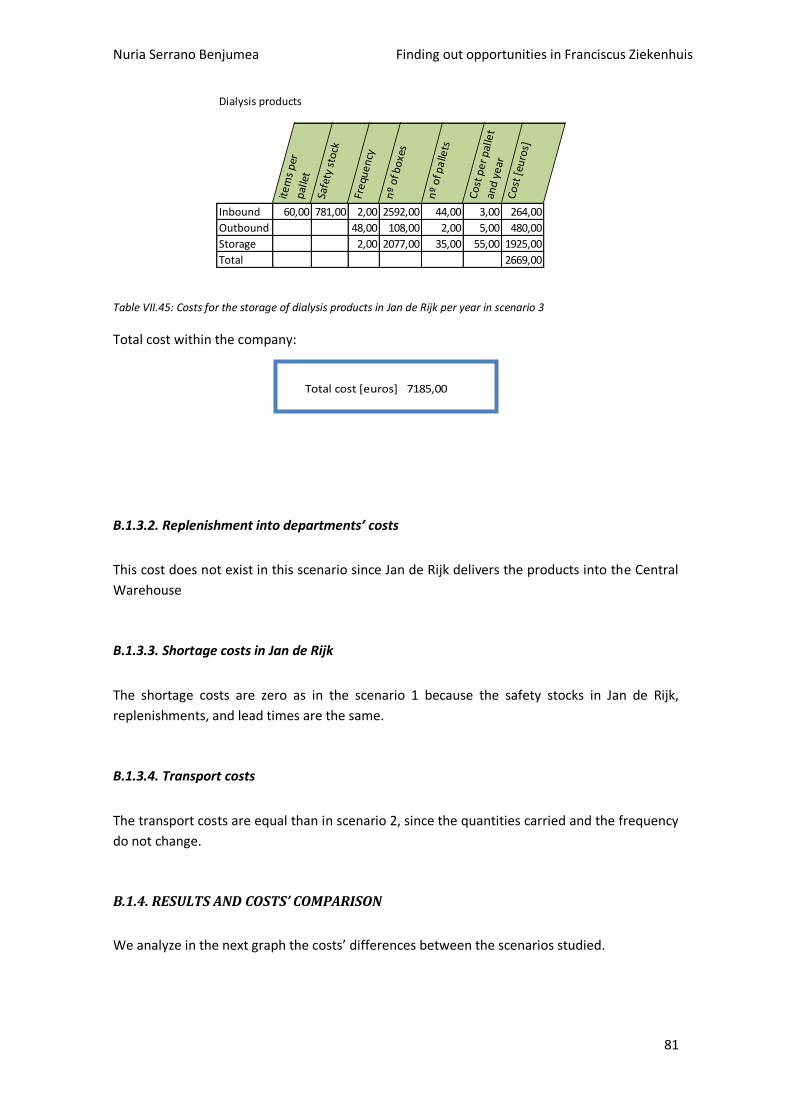
Nuria Serrano Benjumea Finding out opportunities in Franciscus Ziekenhuis
81
Dialysis products
ite
ms
per
p
alle
t
Safe
ty s
tock
Fre
que
ncy
nº
of b
oxe
s
nº
of p
alle
ts
Co
st p
er
pal
let
and
ye
arC
ost
[eu
ros]
Inbound 60,00 781,00 2,00 2592,00 44,00 3,00 264,00
Outbound 48,00 108,00 2,00 5,00 480,00
Storage 2,00 2077,00 35,00 55,00 1925,00
Total 2669,00
Table VII.45: Costs for the storage of dialysis products in Jan de Rijk per year in scenario 3
Total cost within the company:
Total cost [euros] 7185,00
B.1.3.2. Replenishment into departments’ costs
This cost does not exist in this scenario since Jan de Rijk delivers the products into the Central
Warehouse
B.1.3.3. Shortage costs in Jan de Rijk
The shortage costs are zero as in the scenario 1 because the safety stocks in Jan de Rijk,
replenishments, and lead times are the same.
B.1.3.4. Transport costs
The transport costs are equal than in scenario 2, since the quantities carried and the frequency
do not change.
B.1.4. RESULTS AND COSTS’ COMPARISON
We analyze in the next graph the costs’ differences between the scenarios studied.
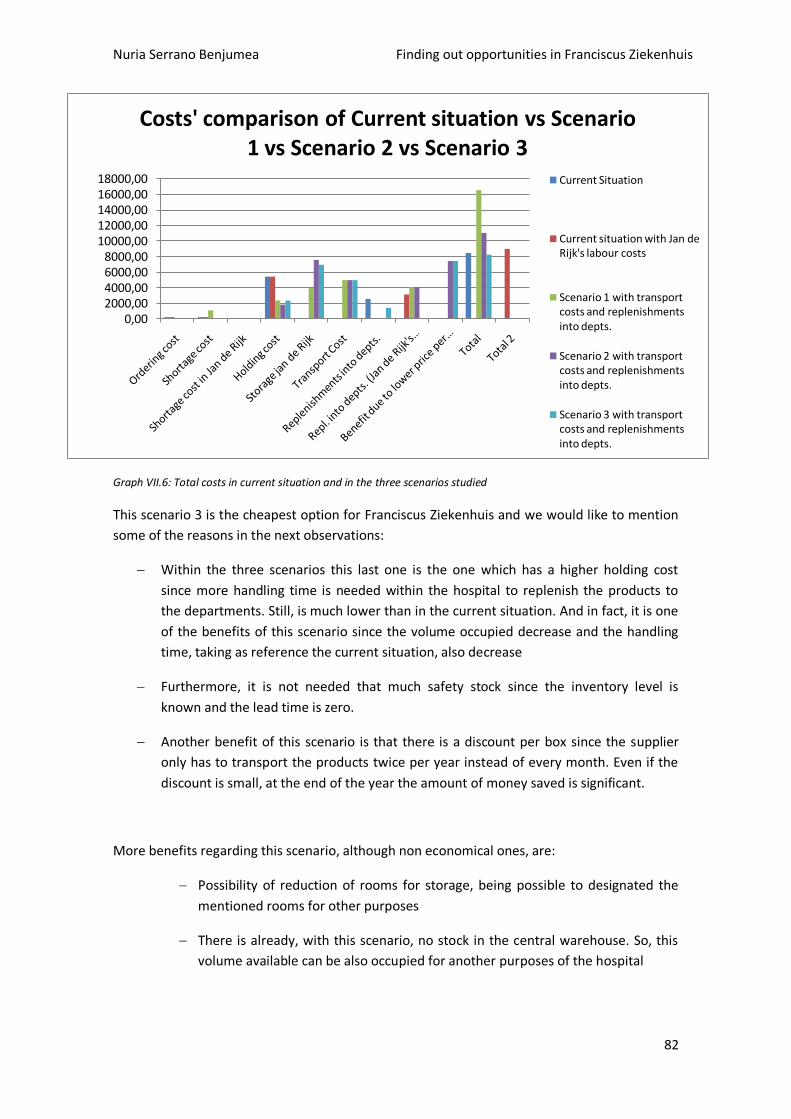
Nuria Serrano Benjumea Finding out opportunities in Franciscus Ziekenhuis
82
Graph VII.6: Total costs in current situation and in the three scenarios studied
This scenario 3 is the cheapest option for Franciscus Ziekenhuis and we would like to mention
some of the reasons in the next observations:
Within the three scenarios this last one is the one which has a higher holding cost
since more handling time is needed within the hospital to replenish the products to
the departments. Still, is much lower than in the current situation. And in fact, it is one
of the benefits of this scenario since the volume occupied decrease and the handling
time, taking as reference the current situation, also decrease
Furthermore, it is not needed that much safety stock since the inventory level is
known and the lead time is zero.
Another benefit of this scenario is that there is a discount per box since the supplier
only has to transport the products twice per year instead of every month. Even if the
discount is small, at the end of the year the amount of money saved is significant.
More benefits regarding this scenario, although non economical ones, are:
Possibility of reduction of rooms for storage, being possible to designated the
mentioned rooms for other purposes
There is already, with this scenario, no stock in the central warehouse. So, this
volume available can be also occupied for another purposes of the hospital
0,002000,004000,006000,008000,00
10000,0012000,0014000,0016000,0018000,00
Costs' comparison of Current situation vs Scenario 1 vs Scenario 2 vs Scenario 3
Current Situation
Current situation with Jan de Rijk's labour costs
Scenario 1 with transport costs and replenishments into depts.
Scenario 2 with transport costs and replenishments into depts.
Scenario 3 with transport costs and replenishments into depts.
Nuria Serrano Benjumea Finding out opportunities in Franciscus Ziekenhuis
83
The handling time in the hospital is reduced, so, the employees can also
designate that time for other tasks required
The effort and costs for the supplier are also reduced. So, in long term it could
also imply bigger discounts
Nuria Serrano Benjumea Finding out opportunities in Franciscus Ziekenhuis
84
Chapter VIII. Conclusions
This investigation within the healthcare sector and particularly within Franciscus Ziekenhuis has given many outcomes and answers to our initial questions. That is why; we would like to structure these conclusions doing a parallelism between the proposed Goals at the beginning of the thesis and the results as an outcome of the study. To do a market research in order to know how the different supply chain in some hospitals in
Netherlands is working....
During the literature researched we have found out many important concepts for the
development of this investigation.
Thus, we have learnt the importance of a good management of the inventory, since there are
many associated costs that sometimes are hard to assess and many organizations do not even
know the weight these carrying inventory costs have within their supply chain.
We have also understood that the managing of the inventory has to deal with many
challenges, since many parties are linked within the supply chain and also because some
functional areas desire high stocks, as a result of economies of scale.
Many other concepts are involved along this report, but we would also like to mention the
importance of the trend the healthcare is taking by using outsourcing and alliances between
hospitals.
Choose the most proper products for this investigation...
The products chosen follow the theory of ABC items, explained in chapter II, by means of, we
took few products represents a big impact for the supply chain.
With the products in scope we have been able to observe the changes´ repercussion within the
total inventory costs within the supply chain.
Also it is important to mention that the long expiry date was essential in order to consider the
possibility of using an external storage being replenished just twice per year from the supplier.
For further analysis, it would be interesting to add more categories, as we will see later in
these conclusions.
Explore the information sources to realize the data possible to obtain and develop
assumptions for the data that is not available...
At this point we warn one of the bottlenecks in the supply chain of Franciscus Ziekenhuis and it
is: a bad forecasting of the consumption demand.
Looking at the Data obtained in Annex A and the Assumptions we have done in chapter V, it is
easy to realize that the hospital does not have many historical data from the products.
Nuria Serrano Benjumea Finding out opportunities in Franciscus Ziekenhuis
85
So the consumption patterns are calculated based on averages from very few data and this
represents a bad forecasting which has to be compensated with higher stocks in the hospital.
What means higher probabilities of stocking out and higher carrying costs.
Regarding the assumptions done, we have tried to be as much realistic and precise as possible.
By the way, for some assumptions it is almost impossible to be precise with the data available,
such as the depreciation ratio per square meter or the value holding cost, since for their
determination it is required to know the opportunity cost, bank loans, the reparations have
been done in the building or future investments, between others.
But, in fact, this lack of precision in these parameters does not influence the goal of our study,
since the same criteria is applied in all the scenarios. Thus, the relative result, which is the
most interesting, is correct.
To know and understand the current situation in Franciscus Ziekenhuis....
In the analysis of the costs in the current situation we have assess the costs by product and we
have also split these costs in order to have a detailed analysis. Thus, from the outcome of the
analysis we could observe the following aspects, which were important in order to find out the
scenarios analyzed, but also as starting point for future studies:
The group formed by WC toilet paper, Kleenex tissues 2LGS, Onderlegger Tena Bed
and Onderlegger Tena Bed Green are the ones which represent a higher costs per year
in proportion with the total consumption. This is because these products are stored in
the central warehouse and in the departments; They have a big amount of safety stock
due to a bad forecasting of the demand and big standard deviation of the lead time;
Moreover the volume occupied is quite high since the stock level is also high, but also
because of the storage in the departments – the products are stored in shelves, out of
the boxes. Furthermore, in the case of the Toilet paper and Kleenex tissues even
having a huge safety stock their units short per cycle are quite high due to the
suppliers variance’s lead time
Alternatively, the group formed by the sterile and dialysis products represents lower
costs regarding the total costs because these products are only stored in the
department where are used, sterile and dialysis respectively. This means a lower
volume occupied and less effort from the employees of Franciscus Ziekenhuis for their
handling. Moreover, the lead time is more precise since only one department has to be
controlled. For the same reason, the safety stock is smaller and covers the lead time
demand which does not have much deviation and the combination of all this, also
implies no shortage costs
Look for ways of improvement within the supply chain of Franciscus Ziekenhuis by using a
third Party Logistics service...
In chapter VII we work out different possibilities of improvement by using Jan de Rijk’s
services.
Nuria Serrano Benjumea Finding out opportunities in Franciscus Ziekenhuis
86
The possibilities posed were based in the literature review and in the results from the study of
the current situation. We modified different parameters in order to observe their effect in the
total costs.
In all the scenarios posed, the products’ volume occupied is lower since the storage is only in
department level and the safety stock required is also lower due to a higher frequency of
replenishments (Jan de Rijk instead of the respective supplier). The lead time variance is much
smaller because of the few distance between Jan de Rijk and the hospital.
The handling time within the hospital has also decreased in all the scenarios analyzed since in
the current situation every week the employees had to scan, pick, replenish and order from
the central warehouse to the departments. Alternatively in the three scenarios posed: in the
first two scenarios, the handling time within the hospital is zero, since Jan de Rijk is the
responsible of the entire process of replenishments into departments, in the third one,
although Jan de Rijk delivers into the central warehouse, the handling cost is still smaller due
to savings in the different way of replenishments (by product instead of by department), and
no time required for ordering.
Due to this lower volume occupied and less handling time required, in all the scenarios the
carrying costs of inventory are much lower than in the current situation.
But, as a matter of fact, this decrease in the inventory costs within the hospital cannot
compensate other costs associated with each scenario:
- The storage within Jan de Rijk
- The transport costs from Jan de Rijk to Franciscus Ziekenhuis, every week
- The replenishments into departments is quite expensive
Except in the third scenario, where even considering all these costs, is the cheapest option for
Franciscus Ziekenhuis and that is why; we summarize here the benefits:
Within the three scenarios this last one is the one which has a higher holding cost since
more handling time is needed within the hospital to replenish the products to the
departments. Still, is much lower than in the current situation. And in fact, it is one of
the benefits of this scenario since the volume occupied and the handling time decrease
Furthermore, it is not needed that much safety stock since the inventory level is known
and the lead time from Jan de Rijk is zero.
Another benefit of this scenario is that there is a discount per box since the supplier
only has to transport the products twice per year instead of every month. Even if the
discount is small, at the end of the year the amount of money saved is really significant
(see section A.2.1). We would like to add here that the supplier part has also benefits
with this scenario, since they can produce long runs that are cheaper without storing
the products later, since it is Jan de Rijk who does that task. Thus, in long term it could
be easy to achieve bigger discounts per item. Also, considering the economies of scale,
if the products would increase in type and number, the discounts would also be bigger.
Nuria Serrano Benjumea Finding out opportunities in Franciscus Ziekenhuis
87
Be able to find out possible benefits...
We have already mentioned a lot of benefits that Jan de Rijk’s services could offer to the supply chain in Franciscus Ziekenhuis in the paragraphs above. But we would like to add, a final observation. Along this report we have been discussing the importance of dealing with the amount of stock to avoid the stock outs per cycle but occupying the less possible volume at the same time. We have also deal with the uncertainty of the consumption patterns and with the lower price for larger quantities- what means much stock stored. And we have found a solution for reconciling all these aspects:
- We can take the profit of buying in larger quantities taking advantage of the discounts,
but the carrying costs do not increase that much because they are stored in a place
(Jan de Rijk) where the storage is cheaper
- In fact, traditionally, companies rationalized long production runs to lower unit costs
without really evaluating their inventory carrying costs, which can be high for finished
goods. So, for the supplier is also beneficial to produce in long runs, lower costs, and
transport it to Jan de Rijk, to be stored there.
- Eliminate uncertainty, reduces costs. Collaboration in the sharing of information in the
supply chain between Jan de Rijk and Franciscus Ziekenhuis has results in reducing
inventory cost and actually improving service at the same time.
To conclude we would like to add, that all these benefits represent an improvement for the
supply chain within Franciscus Ziekenhuis, but also a possibility of increase the service’
portfolio for Jan de Rijk taking part of its supply chain.
This investigation is only the starting point for many opportunities. Further studies should
observe the results doing the same analysis but in a big scale: adding more products’
categories and considering the alliance of different hospitals. The outcome would be a huge
increase in the saving costs’ due to economies of scale.
Nuria Serrano Benjumea Finding out opportunities in Franciscus Ziekenhuis
88
Chapter IX. Recommendations
Which should be the next steps for improving the supply chain of Franciscus Ziekenhuis? Is it
proper to start storing products in Jan de Rijk logistics based on the outcome of this analysis?
Which should be the trend of improvement in short and long term? Which decisions should be
taken within the hospital?
In this chapter we answer these questions as matter of recommendations for the parties
involved: Franciscus Ziekenhuis and Jan de Rijk logistics.
From the outcome of this thesis we could observed that the storage in Jan de Rijk in the third
scenario, receiving the products twice per year and delivering into the hospital every week, has
multiple benefits such as less volume occupied, less handling time within the hospital, the
union of internal distributions, the centralization of information, and all these is summarized in
less costs for the hospital.
Nevertheless, we do not consider that this outcome is enough in order to be applied yet in the
supply chain of Franciscus Ziekenhuis. It should be required, at least, an intermediate step to
involve more products. We should remind that this thesis has studied 4 categories of products,
which means 11 products in total, so the benefit of storing just these products in an external
storage will not compensate the effort of making the change.
By the way, this intermediate step could be quite simple, since we have found out a
remarkable benefit reducing the frequency the supplier delivers into Jan de Rijk. Thus, we
could add more products from the same supplier in the external storage even though they are
not A items in order to increase the discount from the supplier and increase the products that
Jan de Rijk would be responsible of. Moreover, in this way, we would take profit of economies
of scale.
Also it is very important in order to improve the supply chain within Franciscus Ziekenhuis to
be more precise collecting data and to have more historical information. As we saw, along the
report, it is basic in order to do a good forecast of the consumption and it allows to decrease
the stock within the hospital and to be precise with the order quantities and the frequencies to
do not have shortages.
Indeed, it would be really beneficial for an improvement in the management of the materials’
flows to invest in mechanisms for a continuous review, such scanners, so making use of the
Vendor Management system (VMI) which Jan de Rijk has available, the hole process would be
much more precise with all the good consequences it implies.
Nuria Serrano Benjumea Finding out opportunities in Franciscus Ziekenhuis
89
Regarding possible steps to be taken within the hospital we should add the reduction and
redistribution of the rooms for storage. Nowadays, the same products are stored in many
rooms around the hospital, what implies an increase in the handling time of those products, a
loss of precision in the stock required and many rooms occupied that could be used with
another purposes within the hospital. Therefore, a further study could contemplate the
possibility of redistribution of the rooms for storage and the change of the way of
replenishment: by products instead of by departments.
Also, related with the concept above, we should add that if the rooms for storage would be
reduced also it could be considered the possibility of the replenishment into departments by
Jan de Rijk.
And, last but not least, it should be analysed for a long term improvement, the possibility of
alliance with other hospitals. This union of the supply chains would increase the efficiency,
reducing costs by concentration of activities and collaboration. Also, the economies of scale
would also have a big beneficial impact in the centralization in an external storage.
Nuria Serrano Benjumea Finding out opportunities in Franciscus Ziekenhuis
90
References
Bakker, P., (2004). “Sneller Beter. De logistiek in de zorg”. Eindrapportage TPG.
Berglund, M., Van Laarhoven, P., Sharman, G., and Wandsel, S. (1999). “Third- party logistics: Is
there a future?” International Journal of Logistics Management, Vol. 10 No.1, p. 59 – 70.
Burton, J.A., (1979). “Effective warehousing”. 2nd edition. Plymouth and London: Macdonald
and Evans limited.
Coyle, J.J., Bardi, E.J.,Langley, C.J., ( 2003). “The management of Business Logistics- A supply
Chain Perspective”. South-Western Publising, Mason.
Chorafas, D.N, (1974). “Warehousing”. London: The Macmillan Press LTD.
Fransoo, J.C., Boulaksil, Y., (2008). “Strategic and operational outsourcing- Decisions in the
pharmaceutical Industry”. Master’s thesis, Eindhoven University of Technology, Department of
Technology Management.
Hoegsma, H., (2010). “Dutch allied hospitals on procurement collaboration”. Conference in
Eindhoven University of Technology.
Hubertus, J.M., (1994). “Patient flow based allocation of hospital resources”. Master’s thesis,
Eindhoven University of Technology.
Post, P., and Stal, P., (2000). “Cross-Border urgent medical assistance. Belgium-Germany-The
Netherlands”. Journal of the University of Nijmegen Foundation, ITS.
Rob, J.B., (2005). “Business process redesign in healthcare: Facing the technical challenge”.
Master’s thesis, Eindhoven University of Technology, Department of Operations Management
and Logistics.
Silver, E.; Pyke, D., and Peterson, R., (1998). “Inventory Management and Production Planning
and Scheduling”. 3rd edition. United States of America: John Wiley & sons.
Schiffelers, W., ( 2004). “Design of a simulation model for the storage process in warehousing”.
Master’s thesis, Eindhoven University of Technology, Department of Mechanical Engineering,
Systems Engineering Group.
Schut, F.T., (1995). “Competition in the Dutch Health Care Sector”. Den Haag: Cip-Gegevens
Koninklijke bibliotheek.
Vinesh, D., (2007). “The development of a balanced and transparent pricing policy for third
party logistics services”. Master’s thesis, Eindhoven University of Technology, Department of
Operations Management and Logistics.
Nuria Serrano Benjumea Finding out opportunities in Franciscus Ziekenhuis
91
Vaan Laarhoven, P., Berglund, M., and Peters, M. ( 2000), “ Third party logistics in Europe- five
years later”. (2000). Int. Journal of Physical Distribution & Logistics Mgmt., Vol.30 No.5, p. 425-
442.
Viale, D.J., (1996). “ Inventory management: from warehouse to distribution center”. United
States of America: Crisp publications, Inc.
Vissers, J., “Patient Flow: reducing delay in healthcare delivery”. p. 393 - 427.
Witzier, v.P., (1986). “Cost control in warehouse and store”. Eindhoven: note 75e, O & E
information centre.
World Health Organization, (2005). “Good distribution practices (GDP) for pharmaceutical
products”.
Websites
Websites last checked in July 2010:
http://www.franciscusziekenhuis.nl/
http://www.swisslog.com/index/hcs-index/hcs-systems.htm
http://www.webpicking.com/casos/tecsys04.htm
http://www.dhl.com/publish/g0/en/services/log_services/solutions.high.html
http://www.benelux.geodis.com/geodis/benelux.nsf/vwAffPages/63A415C06D107211C1256F
B60043DB88
http://www.kn-portal.com/services/leadlogistics/
http://www.dsv.com/irj/servlet/prt/portal/prtroot/ExternalWebGui.IntegratedInternet?conte
nt=/documents/DSV_DFDS%20Transport/Integrated%20Internet/External%20Web%20Site%2
0Repository/COM/ENG
http://www.ups-scs.com/solutions/pharmaceuticals.html
http://hospitals.webometrics.info/hospital_by_country_es.asp?country=nl
http://www.iaz.nl/bestuur.html
Nuria Serrano Benjumea Finding out opportunities in Franciscus Ziekenhuis
92
ANNEXES
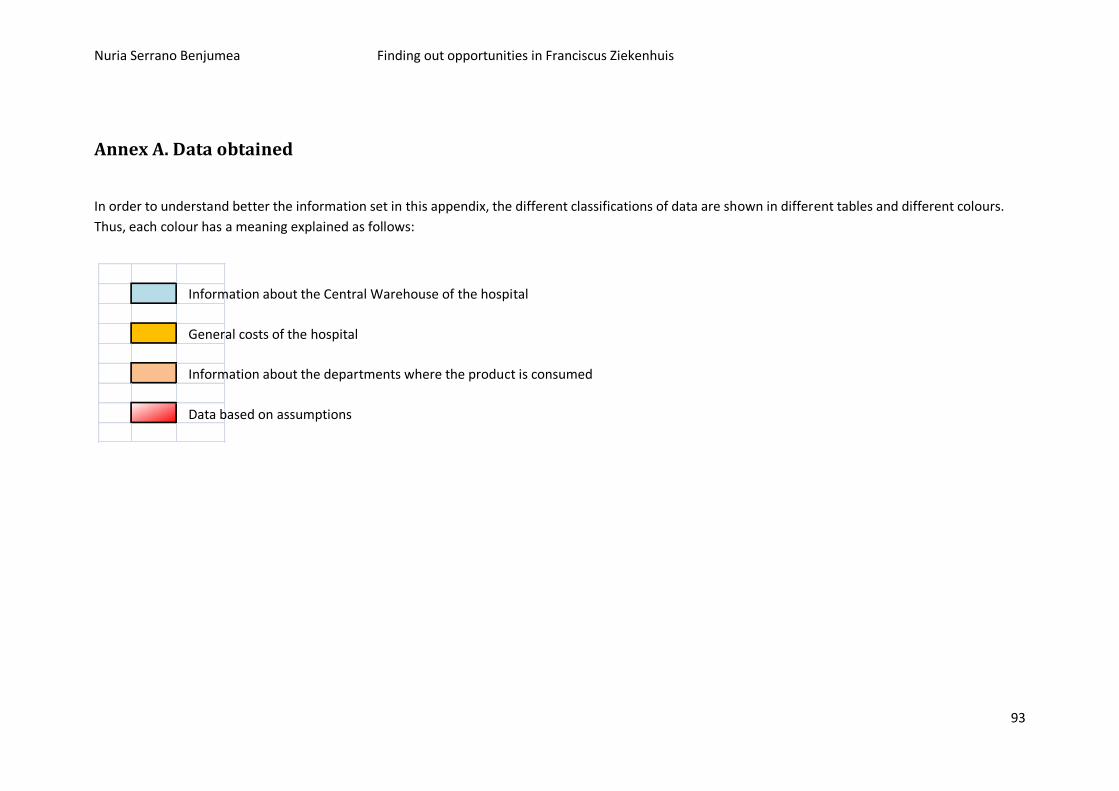
Nuria Serrano Benjumea Finding out opportunities in Franciscus Ziekenhuis
93
Annex A. Data obtained
In order to understand better the information set in this appendix, the different classifications of data are shown in different tables and different colours.
Thus, each colour has a meaning explained as follows:
Information about the Central Warehouse of the hospital
General costs of the hospital
Information about the departments where the product is consumed
Data based on assumptions
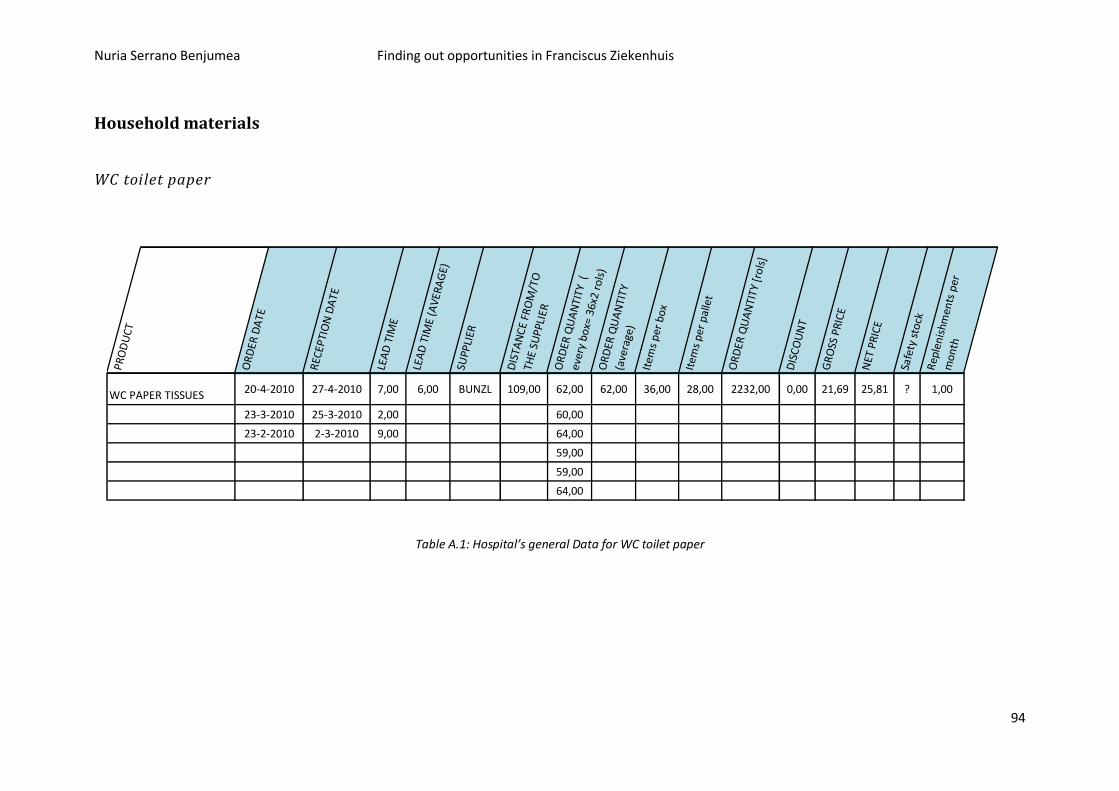
Nuria Serrano Benjumea Finding out opportunities in Franciscus Ziekenhuis
94
Household materials
WC toilet paper
PR
OD
UC
T
OR
DER
DA
TE
REC
EPTI
ON
DA
TE
LEA
D T
IME
LEA
D T
IME
(AV
ERA
GE)
SUPP
LIER
DIS
TAN
CE
FRO
M/T
O
THE
SUP
PLIE
R
OR
DER
QU
AN
TITY
(
ever
y b
ox=
36x
2 ro
ls)
OR
DER
QU
AN
TITY
(a
vera
ge)
Item
s p
er b
ox
Item
s p
er p
alle
t
OR
DER
QU
AN
TITY
[ro
ls]
DIS
CO
UN
T
GR
OSS
PR
ICE
NET
PR
ICE
Safe
ty s
tock
Rep
len
ishm
ents
per
m
on
th
WC PAPER TISSUES20-4-2010 27-4-2010 7,00 6,00 BUNZL 109,00 62,00 62,00 36,00 28,00 2232,00 0,00 21,69 25,81 ? 1,00
23-3-2010 25-3-2010 2,00 60,00
23-2-2010 2-3-2010 9,00 64,00
59,00
59,00
64,00
Table A.1: Hospital’s general Data for WC toilet paper
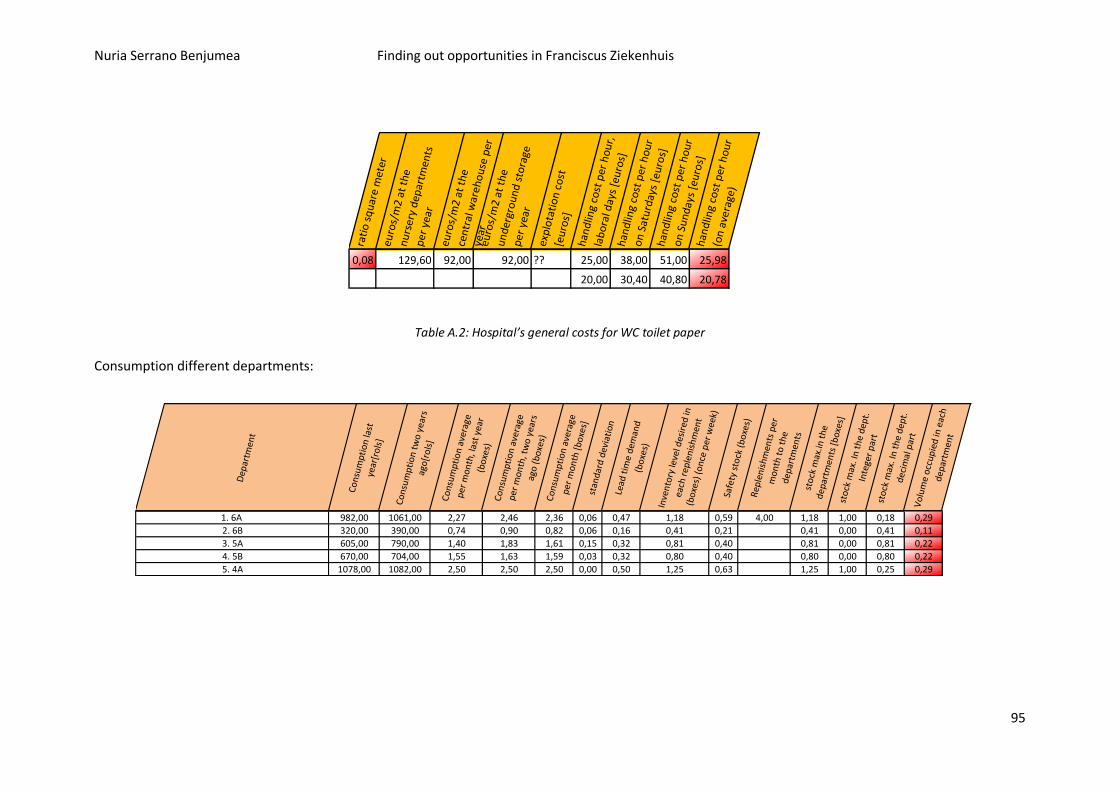
Nuria Serrano Benjumea Finding out opportunities in Franciscus Ziekenhuis
95
rati
o s
qu
are
met
ereu
ros/
m2
at t
he
nu
rser
y d
epar
tmen
ts
per
yea
r
euro
s/m
2 at
th
e ce
ntr
al w
areh
ou
se p
er
year
euro
s/m
2 at
th
e u
nd
ergr
ou
nd
sto
rage
p
er y
ear
exp
lota
tio
n c
ost
[e
uro
s]
han
dlin
g co
st p
er h
ou
r,
lab
ora
l day
s [e
uro
s]h
and
ling
cost
per
ho
ur
on
Sat
urd
ays
[eu
ros]
han
dlin
g co
st p
er h
ou
r o
n S
un
day
s [e
uro
s]h
and
ling
cost
per
ho
ur
(on
ave
rage
)
0,08 129,60 92,00 92,00 ?? 25,00 38,00 51,00 25,98
20,00 30,40 40,80 20,78
Table A.2: Hospital’s general costs for WC toilet paper
Consumption different departments:
Dep
artm
ent
Co
nsu
mp
tio
n la
st
year
[ro
ls]
Co
nsu
mp
tio
n t
wo
yea
rs
ago
[ro
ls]
Co
nsu
mp
tio
n a
vera
ge
per
mon
th, l
ast
year
(b
oxe
s)C
on
sum
pti
on
ave
rage
p
er m
onth
, tw
o y
ears
ag
o (
bo
xes)
Co
nsu
mp
tio
n a
vera
ge
per
mon
th [
bo
xes]
stan
dar
d d
evia
tio
nLe
ad t
ime
dem
and
(b
oxe
s)
Inve
nto
ry le
vel d
esir
ed in
ea
ch r
eple
nis
hm
ent
(bo
xes)
(o
nce
per
wee
k)Sa
fety
sto
ck (
bo
xes)
Rep
len
ish
men
ts p
er
mo
nth
to
the
d
epar
tmen
tsst
ock
max
.in t
he
dep
artm
ents
[b
oxe
s]st
ock
max
. In
th
e d
ept.
In
tege
r p
art
sto
ck m
ax. I
n t
he
dep
t.
dec
imal
par
tV
olu
me
occ
up
ied
in e
ach
d
epar
tmen
t
1. 6A 982,00 1061,00 2,27 2,46 2,36 0,06 0,47 1,18 0,59 4,00 1,18 1,00 0,18 0,29
2. 6B 320,00 390,00 0,74 0,90 0,82 0,06 0,16 0,41 0,21 0,41 0,00 0,41 0,11
3. 5A 605,00 790,00 1,40 1,83 1,61 0,15 0,32 0,81 0,40 0,81 0,00 0,81 0,22
4. 5B 670,00 704,00 1,55 1,63 1,59 0,03 0,32 0,80 0,40 0,80 0,00 0,80 0,22
5. 4A 1078,00 1082,00 2,50 2,50 2,50 0,00 0,50 1,25 0,63 1,25 1,00 0,25 0,29
Don´t consider
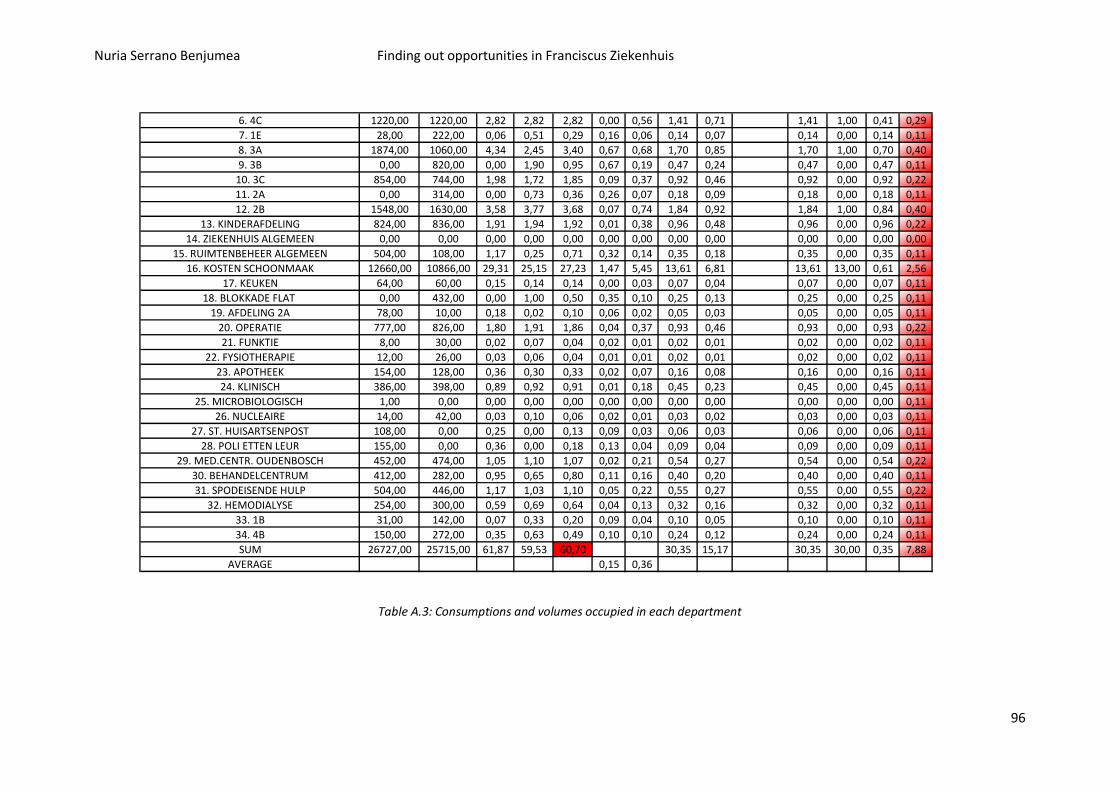
Nuria Serrano Benjumea Finding out opportunities in Franciscus Ziekenhuis
96
6. 4C 1220,00 1220,00 2,82 2,82 2,82 0,00 0,56 1,41 0,71 1,41 1,00 0,41 0,29
7. 1E 28,00 222,00 0,06 0,51 0,29 0,16 0,06 0,14 0,07 0,14 0,00 0,14 0,11
8. 3A 1874,00 1060,00 4,34 2,45 3,40 0,67 0,68 1,70 0,85 1,70 1,00 0,70 0,40
9. 3B 0,00 820,00 0,00 1,90 0,95 0,67 0,19 0,47 0,24 0,47 0,00 0,47 0,11
10. 3C 854,00 744,00 1,98 1,72 1,85 0,09 0,37 0,92 0,46 0,92 0,00 0,92 0,22
11. 2A 0,00 314,00 0,00 0,73 0,36 0,26 0,07 0,18 0,09 0,18 0,00 0,18 0,11
12. 2B 1548,00 1630,00 3,58 3,77 3,68 0,07 0,74 1,84 0,92 1,84 1,00 0,84 0,40
13. KINDERAFDELING 824,00 836,00 1,91 1,94 1,92 0,01 0,38 0,96 0,48 0,96 0,00 0,96 0,22
14. ZIEKENHUIS ALGEMEEN 0,00 0,00 0,00 0,00 0,00 0,00 0,00 0,00 0,00 0,00 0,00 0,00 0,00
15. RUIMTENBEHEER ALGEMEEN 504,00 108,00 1,17 0,25 0,71 0,32 0,14 0,35 0,18 0,35 0,00 0,35 0,11
16. KOSTEN SCHOONMAAK 12660,00 10866,00 29,31 25,15 27,23 1,47 5,45 13,61 6,81 13,61 13,00 0,61 2,56
17. KEUKEN 64,00 60,00 0,15 0,14 0,14 0,00 0,03 0,07 0,04 0,07 0,00 0,07 0,11
18. BLOKKADE FLAT 0,00 432,00 0,00 1,00 0,50 0,35 0,10 0,25 0,13 0,25 0,00 0,25 0,11
19. AFDELING 2A 78,00 10,00 0,18 0,02 0,10 0,06 0,02 0,05 0,03 0,05 0,00 0,05 0,11
20. OPERATIE 777,00 826,00 1,80 1,91 1,86 0,04 0,37 0,93 0,46 0,93 0,00 0,93 0,22
21. FUNKTIE 8,00 30,00 0,02 0,07 0,04 0,02 0,01 0,02 0,01 0,02 0,00 0,02 0,11
22. FYSIOTHERAPIE 12,00 26,00 0,03 0,06 0,04 0,01 0,01 0,02 0,01 0,02 0,00 0,02 0,11
23. APOTHEEK 154,00 128,00 0,36 0,30 0,33 0,02 0,07 0,16 0,08 0,16 0,00 0,16 0,11
24. KLINISCH 386,00 398,00 0,89 0,92 0,91 0,01 0,18 0,45 0,23 0,45 0,00 0,45 0,11
25. MICROBIOLOGISCH 1,00 0,00 0,00 0,00 0,00 0,00 0,00 0,00 0,00 0,00 0,00 0,00 0,11
26. NUCLEAIRE 14,00 42,00 0,03 0,10 0,06 0,02 0,01 0,03 0,02 0,03 0,00 0,03 0,11
27. ST. HUISARTSENPOST 108,00 0,00 0,25 0,00 0,13 0,09 0,03 0,06 0,03 0,06 0,00 0,06 0,11
28. POLI ETTEN LEUR 155,00 0,00 0,36 0,00 0,18 0,13 0,04 0,09 0,04 0,09 0,00 0,09 0,11
29. MED.CENTR. OUDENBOSCH 452,00 474,00 1,05 1,10 1,07 0,02 0,21 0,54 0,27 0,54 0,00 0,54 0,22
30. BEHANDELCENTRUM 412,00 282,00 0,95 0,65 0,80 0,11 0,16 0,40 0,20 0,40 0,00 0,40 0,11
31. SPODEISENDE HULP 504,00 446,00 1,17 1,03 1,10 0,05 0,22 0,55 0,27 0,55 0,00 0,55 0,22
32. HEMODIALYSE 254,00 300,00 0,59 0,69 0,64 0,04 0,13 0,32 0,16 0,32 0,00 0,32 0,11
33. 1B 31,00 142,00 0,07 0,33 0,20 0,09 0,04 0,10 0,05 0,10 0,00 0,10 0,11
34. 4B 150,00 272,00 0,35 0,63 0,49 0,10 0,10 0,24 0,12 0,24 0,00 0,24 0,11
SUM 26727,00 25715,00 61,87 59,53 60,70 30,35 15,17 30,35 30,00 0,35 7,88
AVERAGE 0,15 0,36
Don´t consider
Table A.3: Consumptions and volumes occupied in each department
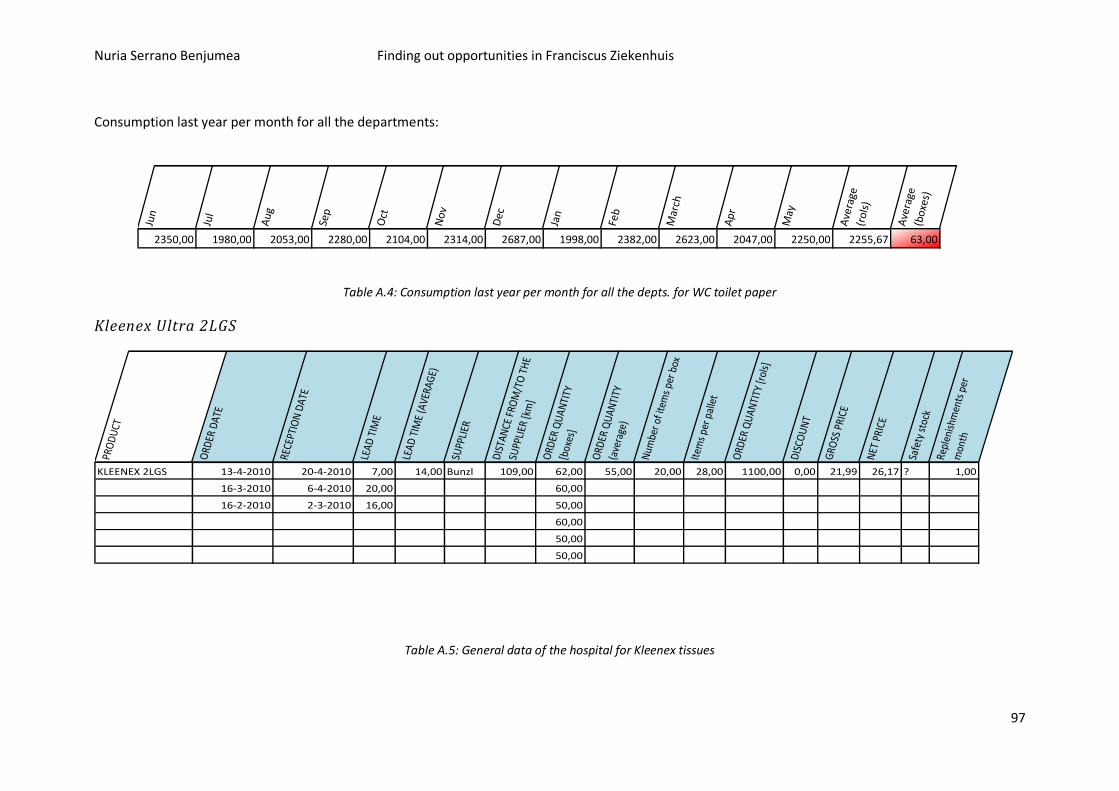
Nuria Serrano Benjumea Finding out opportunities in Franciscus Ziekenhuis
97
Consumption last year per month for all the departments:
Jun
Jul
Au
g
Sep
Oct
No
v
Dec
Jan
Feb
Mar
ch
Ap
r
May
Ave
rage
(r
ols)
Ave
rage
(b
oxe
s)
2350,00 1980,00 2053,00 2280,00 2104,00 2314,00 2687,00 1998,00 2382,00 2623,00 2047,00 2250,00 2255,67 63,00
Don´t consider shortage cost, because there won´t be any shortage!
Table A.4: Consumption last year per month for all the depts. for WC toilet paper
Kleenex Ultra 2LGS
PRO
DU
CT
ORD
ER D
ATE
RECE
PTIO
N D
ATE
LEAD
TIM
E
LEAD
TIM
E (A
VERA
GE)
SUPP
LIER
DIS
TAN
CE F
ROM
/TO
TH
E
SUPP
LIER
[km
]
ORD
ER Q
UAN
TITY
[b
oxes
]
ORD
ER Q
UAN
TITY
(a
vera
ge)
Num
ber o
f ite
ms
per b
ox
Item
s pe
r pal
let
ORD
ER Q
UAN
TITY
[rol
s]
DIS
COU
NT
GRO
SS P
RICE
NET
PRI
CE
Safe
ty s
tock
Repl
enis
hmen
ts p
er
mon
th
KLEENEX 2LGS 13-4-2010 20-4-2010 7,00 14,00 Bunzl 109,00 62,00 55,00 20,00 28,00 1100,00 0,00 21,99 26,17 ? 1,00
16-3-2010 6-4-2010 20,00 60,00
16-2-2010 2-3-2010 16,00 50,00
60,00
50,00
50,00
Table A.5: General data of the hospital for Kleenex tissues
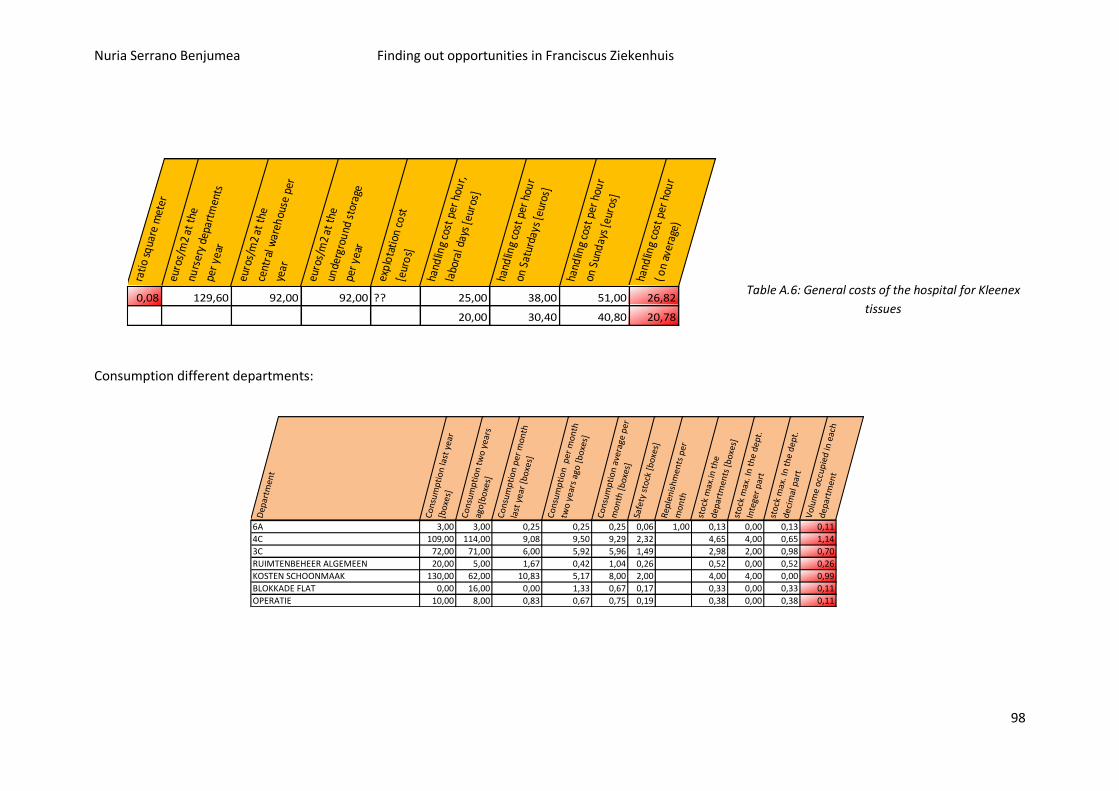
Nuria Serrano Benjumea Finding out opportunities in Franciscus Ziekenhuis
98
Table A.6: General costs of the hospital for Kleenex
tissues
Consumption different departments:
Dep
artm
ent
Co
nsu
mp
tio
n la
st y
ear
[bo
xes]
Co
nsu
mp
tio
n t
wo
yea
rs
ago
[bo
xes]
Co
nsu
mp
tio
n p
er m
on
th
last
yea
r [b
oxe
s]
Co
nsu
mp
tio
n p
er m
on
th
two
yea
rs a
go [
bo
xes]
Co
nsu
mp
tio
n a
vera
ge p
er
mo
nth
[b
oxe
s]Sa
fety
sto
ck [
bo
xes]
Rep
len
ish
men
ts p
er
mo
nth
sto
ck m
ax.in
th
e d
epar
tmen
ts [
bo
xes]
sto
ck m
ax. I
n t
he
dep
t.
Inte
ger
par
tst
ock
max
. In
th
e d
ept.
d
ecim
al p
art
Vo
lum
e o
ccu
pie
d in
eac
h
dep
artm
ent
6A 3,00 3,00 0,25 0,25 0,25 0,06 1,00 0,13 0,00 0,13 0,11
4C 109,00 114,00 9,08 9,50 9,29 2,32 4,65 4,00 0,65 1,14
3C 72,00 71,00 6,00 5,92 5,96 1,49 2,98 2,00 0,98 0,70
RUIMTENBEHEER ALGEMEEN 20,00 5,00 1,67 0,42 1,04 0,26 0,52 0,00 0,52 0,26
KOSTEN SCHOONMAAK 130,00 62,00 10,83 5,17 8,00 2,00 4,00 4,00 0,00 0,99
BLOKKADE FLAT 0,00 16,00 0,00 1,33 0,67 0,17 0,33 0,00 0,33 0,11
OPERATIE 10,00 8,00 0,83 0,67 0,75 0,19 0,38 0,00 0,38 0,11
rati
o sq
uare
met
ereu
ros/
m2
at t
he
nurs
ery
depa
rtm
ents
pe
r ye
ar
euro
s/m
2 at
the
ce
ntra
l war
ehou
se p
er
year
euro
s/m
2 at
the
un
derg
rou
nd s
tora
ge
per
year
exp
lota
tion
co
st
[eur
os]
hand
ling
cost
per
hou
r,
labo
ral d
ays
[eur
os]
hand
ling
cost
per
hou
r on
Sat
urda
ys [
euro
s]
hand
ling
cost
per
hou
r on
Sun
day
s [e
uros
]
hand
ling
cost
per
hou
r ( o
n av
erag
e)
0,08 129,60 92,00 92,00 ?? 25,00 38,00 51,00 26,82
20,00 30,40 40,80 20,78
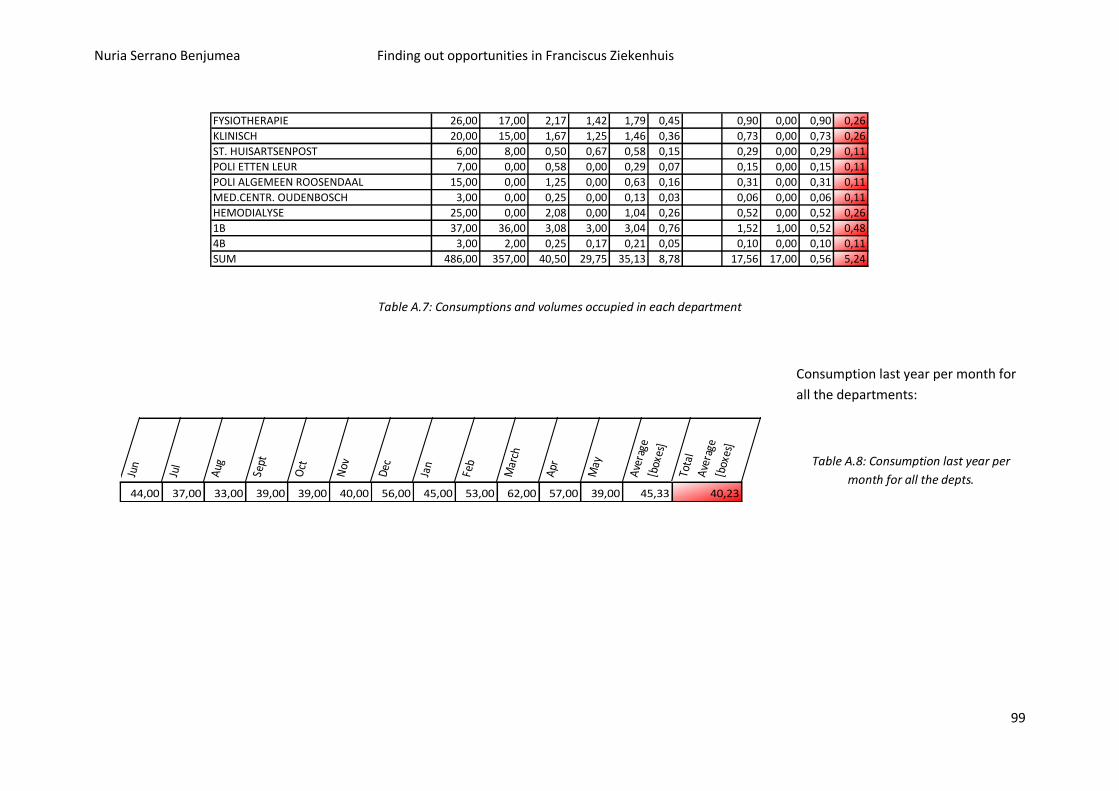
Nuria Serrano Benjumea Finding out opportunities in Franciscus Ziekenhuis
99
FYSIOTHERAPIE 26,00 17,00 2,17 1,42 1,79 0,45 0,90 0,00 0,90 0,26
KLINISCH 20,00 15,00 1,67 1,25 1,46 0,36 0,73 0,00 0,73 0,26
ST. HUISARTSENPOST 6,00 8,00 0,50 0,67 0,58 0,15 0,29 0,00 0,29 0,11
POLI ETTEN LEUR 7,00 0,00 0,58 0,00 0,29 0,07 0,15 0,00 0,15 0,11
POLI ALGEMEEN ROOSENDAAL 15,00 0,00 1,25 0,00 0,63 0,16 0,31 0,00 0,31 0,11
MED.CENTR. OUDENBOSCH 3,00 0,00 0,25 0,00 0,13 0,03 0,06 0,00 0,06 0,11
HEMODIALYSE 25,00 0,00 2,08 0,00 1,04 0,26 0,52 0,00 0,52 0,26
1B 37,00 36,00 3,08 3,00 3,04 0,76 1,52 1,00 0,52 0,48
4B 3,00 2,00 0,25 0,17 0,21 0,05 0,10 0,00 0,10 0,11
SUM 486,00 357,00 40,50 29,75 35,13 8,78 17,56 17,00 0,56 5,24
Table A.7: Consumptions and volumes occupied in each department
Consumption last year per month for
all the departments:
Table A.8: Consumption last year per
month for all the depts.
Jun
Jul
Aug
Sept
Oct
Nov
Dec
Jan
Feb
Mar
ch
Apr
May
Ave
rage
[b
oxes
]
Tota
l A
vera
ge
[box
es]
44,00 37,00 33,00 39,00 39,00 40,00 56,00 45,00 53,00 62,00 57,00 39,00 45,33 40,23
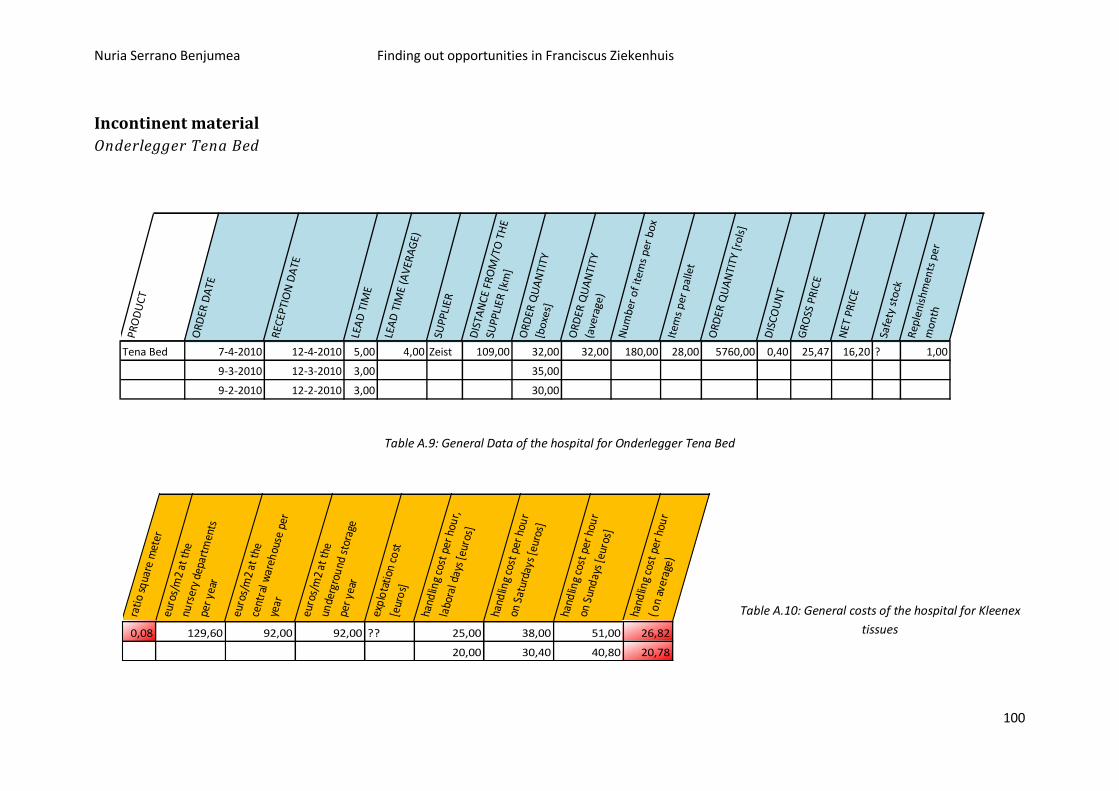
Nuria Serrano Benjumea Finding out opportunities in Franciscus Ziekenhuis
100
Incontinent material
Onderlegger Tena Bed PR
OD
UC
T
OR
DER
DA
TE
REC
EPTI
ON
DA
TE
LEA
D T
IME
LEA
D T
IME
(AV
ERA
GE)
SUPP
LIER
DIS
TAN
CE
FRO
M/T
O T
HE
SUPP
LIER
[km
]
OR
DER
QU
AN
TITY
[b
oxe
s]
OR
DER
QU
AN
TITY
(a
vera
ge)
Nu
mb
er o
f it
ems
per
bo
x
Item
s p
er p
alle
t
OR
DER
QU
AN
TITY
[ro
ls]
DIS
CO
UN
T
GR
OSS
PR
ICE
NET
PR
ICE
Safe
ty s
tock
Rep
len
ish
men
ts p
er
mo
nth
Tena Bed 7-4-2010 12-4-2010 5,00 4,00 Zeist 109,00 32,00 32,00 180,00 28,00 5760,00 0,40 25,47 16,20 ? 1,00
9-3-2010 12-3-2010 3,00 35,00
9-2-2010 12-2-2010 3,00 30,00
Table A.9: General Data of the hospital for Onderlegger Tena Bed
Table A.10: General costs of the hospital for Kleenex
tissues
rati
o sq
uare
met
ereu
ros/
m2
at t
he
nurs
ery
depa
rtm
ents
pe
r ye
ar
euro
s/m
2 at
the
ce
ntra
l war
ehou
se p
er
year
euro
s/m
2 at
the
un
derg
rou
nd s
tora
ge
per
year
exp
lota
tion
co
st
[eur
os]
hand
ling
cost
per
hou
r,
labo
ral d
ays
[eur
os]
hand
ling
cost
per
hou
r on
Sat
urda
ys [
euro
s]
hand
ling
cost
per
hou
r on
Sun
day
s [e
uros
]
hand
ling
cost
per
hou
r ( o
n av
erag
e)
0,08 129,60 92,00 92,00 ?? 25,00 38,00 51,00 26,82
20,00 30,40 40,80 20,78
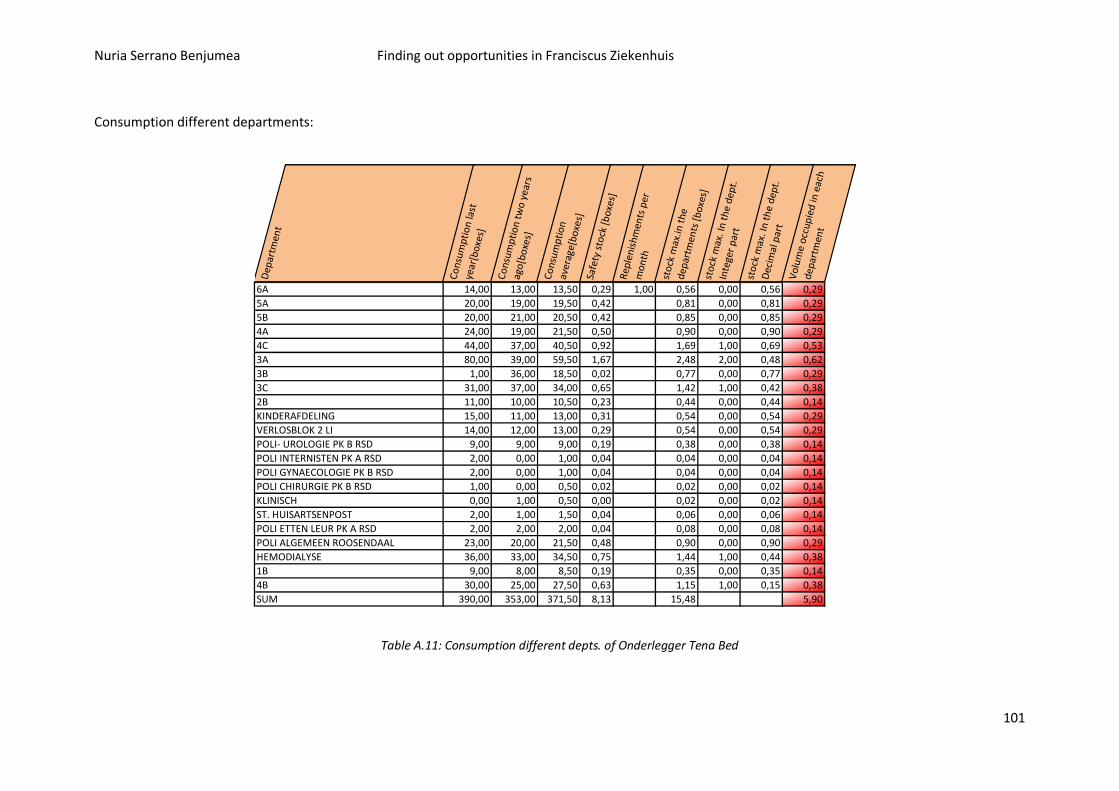
Nuria Serrano Benjumea Finding out opportunities in Franciscus Ziekenhuis
101
Consumption different departments:
Dep
artm
ent
Co
nsu
mp
tio
n la
st
year
[bo
xes]
Co
nsu
mp
tio
n t
wo
yea
rs
ago
[bo
xes]
Co
nsu
mp
tio
n
aver
age[
bo
xes]
Safe
ty s
tock
[b
oxe
s]R
eple
nis
hm
ents
per
m
on
th
sto
ck m
ax.in
th
e d
epar
tmen
ts [
bo
xes]
sto
ck m
ax. I
n t
he
dep
t.
Inte
ger
par
t
sto
ck m
ax. I
n t
he
dep
t.
Dec
imal
par
tV
olu
me
occ
up
ied
in e
ach
dep
artm
ent
6A 14,00 13,00 13,50 0,29 1,00 0,56 0,00 0,56 0,29
5A 20,00 19,00 19,50 0,42 0,81 0,00 0,81 0,29
5B 20,00 21,00 20,50 0,42 0,85 0,00 0,85 0,29
4A 24,00 19,00 21,50 0,50 0,90 0,00 0,90 0,29
4C 44,00 37,00 40,50 0,92 1,69 1,00 0,69 0,53
3A 80,00 39,00 59,50 1,67 2,48 2,00 0,48 0,62
3B 1,00 36,00 18,50 0,02 0,77 0,00 0,77 0,29
3C 31,00 37,00 34,00 0,65 1,42 1,00 0,42 0,38
2B 11,00 10,00 10,50 0,23 0,44 0,00 0,44 0,14
KINDERAFDELING 15,00 11,00 13,00 0,31 0,54 0,00 0,54 0,29
VERLOSBLOK 2 LI 14,00 12,00 13,00 0,29 0,54 0,00 0,54 0,29
POLI- UROLOGIE PK B RSD 9,00 9,00 9,00 0,19 0,38 0,00 0,38 0,14
POLI INTERNISTEN PK A RSD 2,00 0,00 1,00 0,04 0,04 0,00 0,04 0,14
POLI GYNAECOLOGIE PK B RSD 2,00 0,00 1,00 0,04 0,04 0,00 0,04 0,14
POLI CHIRURGIE PK B RSD 1,00 0,00 0,50 0,02 0,02 0,00 0,02 0,14
KLINISCH 0,00 1,00 0,50 0,00 0,02 0,00 0,02 0,14
ST. HUISARTSENPOST 2,00 1,00 1,50 0,04 0,06 0,00 0,06 0,14
POLI ETTEN LEUR PK A RSD 2,00 2,00 2,00 0,04 0,08 0,00 0,08 0,14
POLI ALGEMEEN ROOSENDAAL 23,00 20,00 21,50 0,48 0,90 0,00 0,90 0,29
HEMODIALYSE 36,00 33,00 34,50 0,75 1,44 1,00 0,44 0,38
1B 9,00 8,00 8,50 0,19 0,35 0,00 0,35 0,14
4B 30,00 25,00 27,50 0,63 1,15 1,00 0,15 0,38
SUM 390,00 353,00 371,50 8,13 15,48 5,90
Do not add shortage cost, since with the
Table A.11: Consumption different depts. of Onderlegger Tena Bed
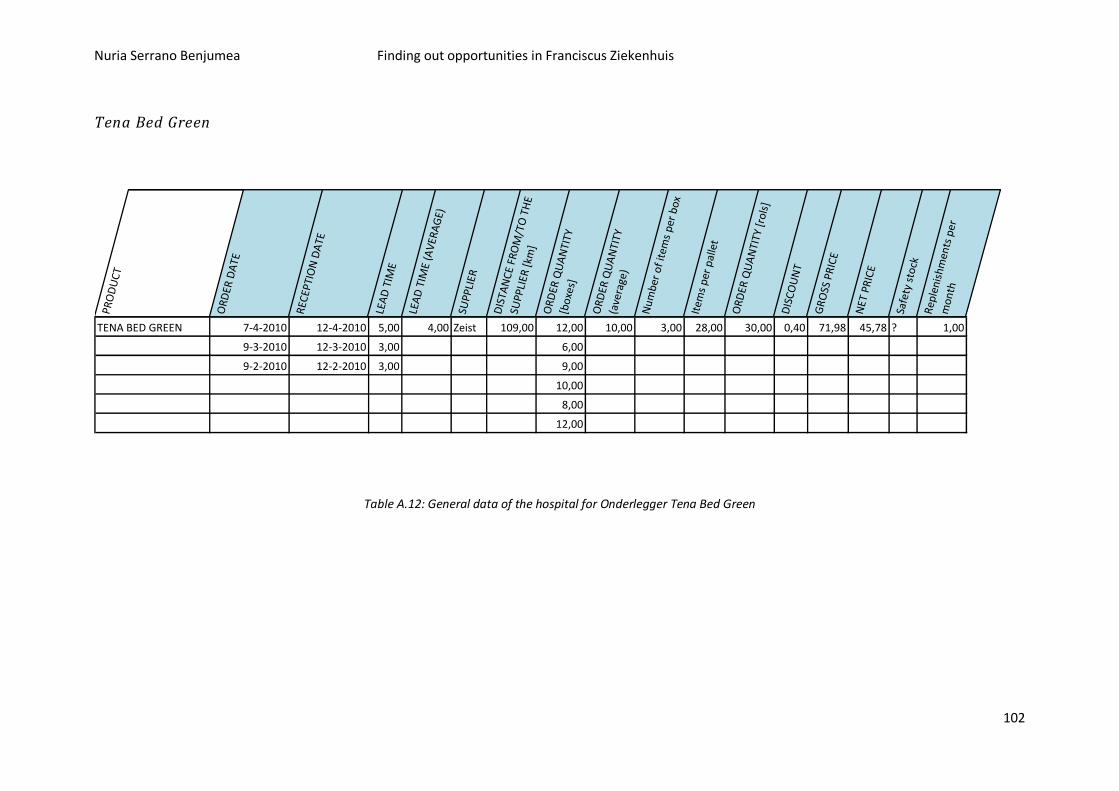
Nuria Serrano Benjumea Finding out opportunities in Franciscus Ziekenhuis
102
Tena Bed Green PR
OD
UC
T
OR
DER
DA
TE
REC
EPTI
ON
DA
TE
LEA
D T
IME
LEA
D T
IME
(AV
ERA
GE)
SUPP
LIER
DIS
TAN
CE
FRO
M/T
O T
HE
SUPP
LIER
[km
]
OR
DER
QU
AN
TITY
[b
oxe
s]
OR
DER
QU
AN
TITY
(a
vera
ge)
Nu
mb
er o
f it
ems
per
bo
x
Item
s p
er p
alle
t
OR
DER
QU
AN
TITY
[ro
ls]
DIS
CO
UN
T
GR
OSS
PR
ICE
NET
PR
ICE
Safe
ty s
tock
Rep
len
ish
men
ts p
er
mo
nth
TENA BED GREEN 7-4-2010 12-4-2010 5,00 4,00 Zeist 109,00 12,00 10,00 3,00 28,00 30,00 0,40 71,98 45,78 ? 1,00
9-3-2010 12-3-2010 3,00 6,00
9-2-2010 12-2-2010 3,00 9,00
10,00
8,00
12,00
Table A.12: General data of the hospital for Onderlegger Tena Bed Green
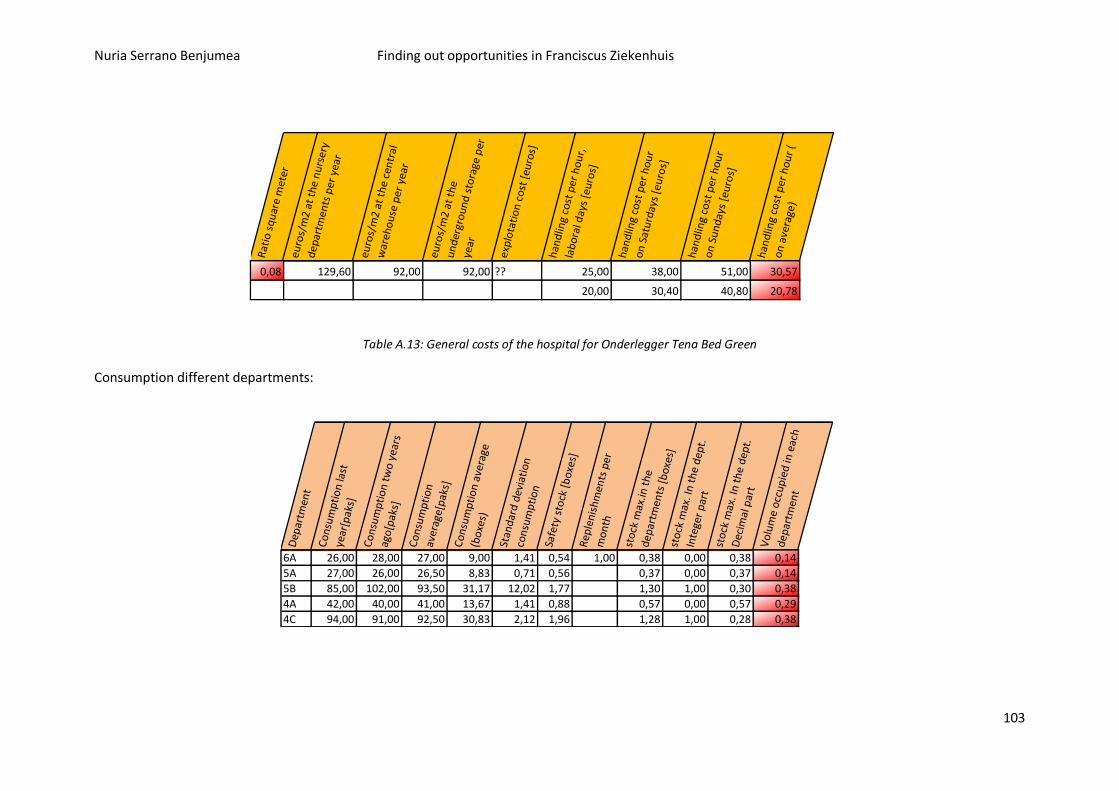
Nuria Serrano Benjumea Finding out opportunities in Franciscus Ziekenhuis
103
Rat
io s
qu
are
met
ereu
ros/
m2
at t
he
nu
rser
y d
epar
tmen
ts p
er y
ear
euro
s/m
2 at
th
e ce
ntr
al
war
eho
use
per
yea
r
euro
s/m
2 at
th
e u
nd
ergr
ou
nd
sto
rage
per
year
exp
lota
tio
n c
ost
[eu
ros]
han
dlin
g co
st p
er h
ou
r,
lab
ora
l day
s [e
uro
s]
han
dlin
g co
st p
er h
ou
r o
n S
atu
rday
s [e
uro
s]
han
dlin
g co
st p
er h
ou
r o
n S
un
day
s [e
uro
s]
han
dlin
g co
st p
er h
ou
r (
on
ave
rage
)
0,08 129,60 92,00 92,00 ?? 25,00 38,00 51,00 30,57
20,00 30,40 40,80 20,78
Table A.13: General costs of the hospital for Onderlegger Tena Bed Green
Consumption different departments:
Dep
artm
ent
Co
nsu
mp
tio
n la
st
year
[pak
s]
Co
nsu
mp
tio
n t
wo
yea
rs
ago
[pak
s]
Co
nsu
mp
tio
n
aver
age[
pak
s]C
on
sum
pti
on
ave
rage
(b
oxe
s)
Stan
dar
d d
evia
tio
n
con
sum
pti
on
Safe
ty s
tock
[b
oxe
s]R
eple
nis
hm
ents
per
m
on
th
sto
ck m
ax.in
th
e d
epar
tmen
ts [
bo
xes]
sto
ck m
ax. I
n t
he
dep
t.
Inte
ger
par
tst
ock
max
. In
th
e d
ept.
D
ecim
al p
art
Vo
lum
e o
ccu
pie
d in
eac
h
dep
artm
ent
6A 26,00 28,00 27,00 9,00 1,41 0,54 1,00 0,38 0,00 0,38 0,14
5A 27,00 26,00 26,50 8,83 0,71 0,56 0,37 0,00 0,37 0,14
5B 85,00 102,00 93,50 31,17 12,02 1,77 1,30 1,00 0,30 0,38
4A 42,00 40,00 41,00 13,67 1,41 0,88 0,57 0,00 0,57 0,29
4C 94,00 91,00 92,50 30,83 2,12 1,96 1,28 1,00 0,28 0,38
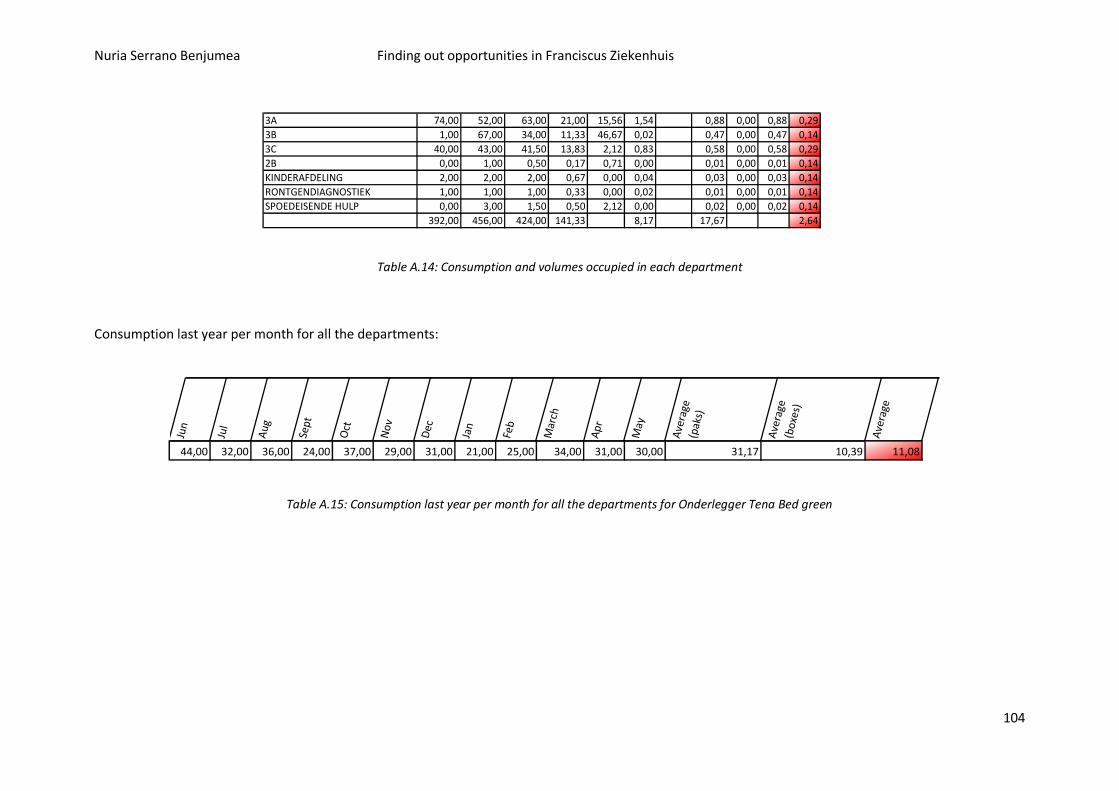
Nuria Serrano Benjumea Finding out opportunities in Franciscus Ziekenhuis
104
3A 74,00 52,00 63,00 21,00 15,56 1,54 0,88 0,00 0,88 0,29
3B 1,00 67,00 34,00 11,33 46,67 0,02 0,47 0,00 0,47 0,14
3C 40,00 43,00 41,50 13,83 2,12 0,83 0,58 0,00 0,58 0,29
2B 0,00 1,00 0,50 0,17 0,71 0,00 0,01 0,00 0,01 0,14
KINDERAFDELING 2,00 2,00 2,00 0,67 0,00 0,04 0,03 0,00 0,03 0,14
RONTGENDIAGNOSTIEK 1,00 1,00 1,00 0,33 0,00 0,02 0,01 0,00 0,01 0,14
SPOEDEISENDE HULP 0,00 3,00 1,50 0,50 2,12 0,00 0,02 0,00 0,02 0,14
392,00 456,00 424,00 141,33 8,17 17,67 2,64
Table A.14: Consumption and volumes occupied in each department
Consumption last year per month for all the departments:
Jun
Jul
Au
g
Sept
Oct
No
v
Dec
Jan
Feb
Mar
ch
Ap
r
May
Ave
rage
(p
aks)
Ave
rage
(b
oxe
s)
Ave
rage
44,00 32,00 36,00 24,00 37,00 29,00 31,00 21,00 25,00 34,00 31,00 30,00 31,17 10,39 11,08
Table A.15: Consumption last year per month for all the departments for Onderlegger Tena Bed green

Nuria Serrano Benjumea Finding out opportunities in Franciscus Ziekenhuis
105
Sterile products
Kimguard one-step KC 300, 101x101cm
Table A.16: General data of
the hospital for Kimguard
one-step KC 300, 101x101cm
Table A.17: General costs of the hospital for
sterile products
PRO
DU
CT
LEA
D T
IME
(AV
ERA
GE)
SUPP
LIER
DIS
TAN
CE
FRO
M/T
O T
HE
SUPP
LIER
[km
]O
RDER
QU
AN
TITY
[b
oxes
]
ORD
ER Q
UA
NTI
TY
(ave
rage
)
Num
ber
of it
ems
per
bo
x
Item
s pe
r pa
llet
ORD
ER Q
UA
NTI
TY [r
ols]
DIS
COU
NT
GRO
SS P
RIC
E
NET
PR
ICE
Safe
ty s
tock
Rep
leni
shm
ents
per
m
onth
STERILE 1 3,00 Kimberly-Clark 77,30 13,51 14,00 96,00 15,00 1344,00 1,00 1,00 83,90 1,00 1,00
rati
o sq
uare
met
ereu
ros/
m2
at t
he
nurs
ery
depa
rtm
ents
pe
r ye
ar
euro
s/m
2 at
the
ce
ntra
l war
ehou
se p
er
year
euro
s/m
2 at
the
un
derg
rou
nd s
tora
ge
per
year
exp
lota
tion
co
st
[eur
os]
hand
ling
cost
per
hou
r,
labo
ral d
ays
[eur
os]
hand
ling
cost
per
hou
r on
Sat
urda
ys [
euro
s]
hand
ling
cost
per
hou
r on
Sun
day
s [e
uros
]
hand
ling
cost
per
hou
r ( o
n av
erag
e)
0,08 129,60 92,00 92,00 ?? 25,00 38,00 51,00 30,57
20,00 30,40 40,80 20,78
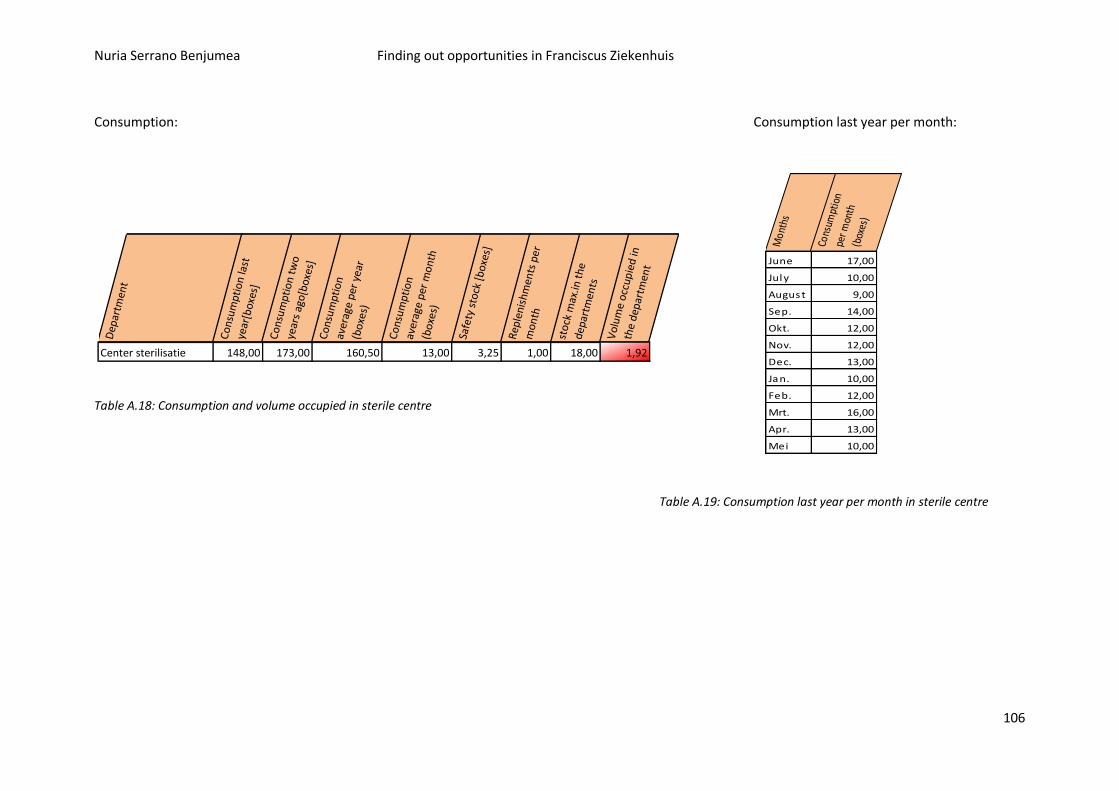
Nuria Serrano Benjumea Finding out opportunities in Franciscus Ziekenhuis
106
Consumption: Consumption last year per month:
Dep
artm
ent
Co
nsu
mpt
ion
last
ye
ar[b
oxes
]
Co
nsu
mpt
ion
two
year
s ag
o[b
oxes
]C
ons
um
ptio
n av
erag
e pe
r ye
ar
(bo
xes)
Co
nsu
mpt
ion
aver
age
per
mo
nth
(b
oxe
s)
Safe
ty s
tock
[b
oxes
]
Rep
leni
shm
ents
per
m
onth
sto
ck m
ax.in
the
de
part
men
ts
Vol
um
e oc
cup
ied
in
the
dep
artm
ent
Center sterilisatie 148,00 173,00 160,50 13,00 3,25 1,00 18,00 1,92
Table A.18: Consumption and volume occupied in sterile centre
Table A.19: Consumption last year per month in sterile centre
Mon
ths
Cons
umpt
ion
per m
onth
(b
oxes
)
June 17,00
July 10,00
August 9,00
Sep. 14,00
Okt. 12,00
Nov. 12,00
Dec. 13,00
Jan. 10,00
Feb. 12,00
Mrt. 16,00
Apr. 13,00
Mei 10,00
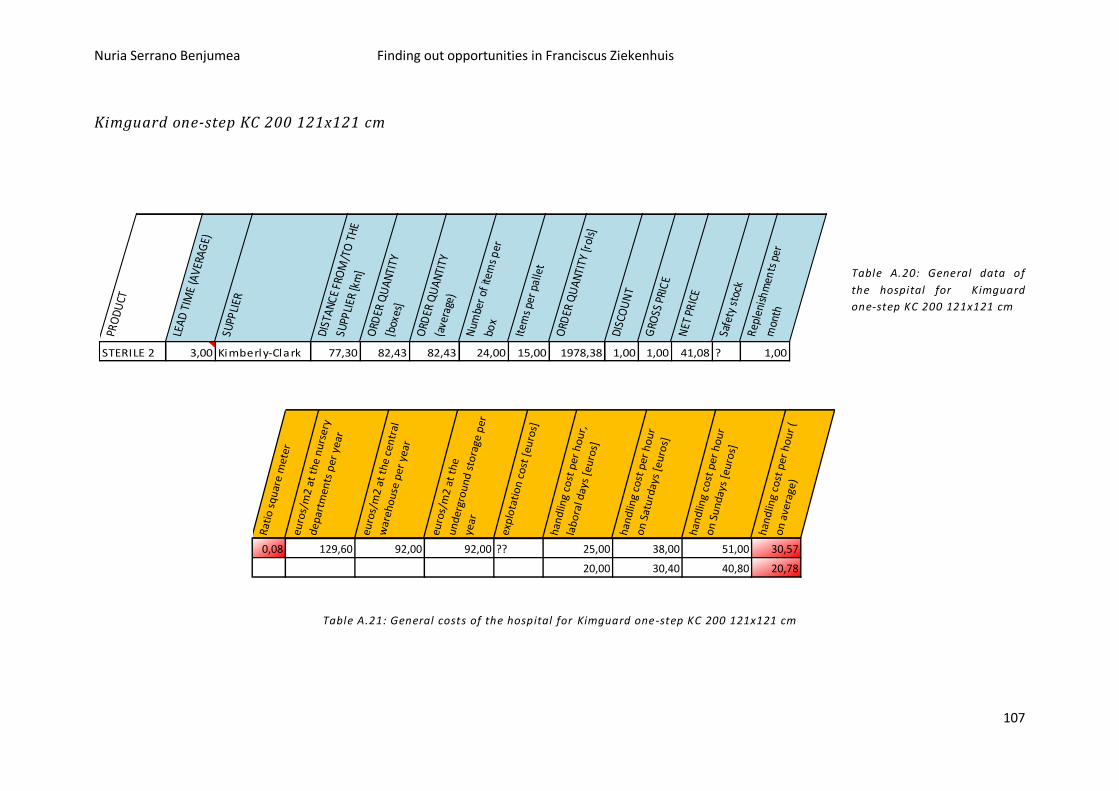
Nuria Serrano Benjumea Finding out opportunities in Franciscus Ziekenhuis
107
Kimguard one-step KC 200 121x121 cm
Table A.20: General data of
the hospital for Kimguard
one-step KC 200 121x121 cm
Rat
io s
qu
are
met
ereu
ros/
m2
at t
he
nu
rser
y d
epar
tmen
ts p
er y
ear
euro
s/m
2 at
th
e ce
ntr
al
war
eho
use
per
yea
r
euro
s/m
2 at
th
e u
nd
ergr
ou
nd
sto
rage
per
year
exp
lota
tio
n c
ost
[eu
ros]
han
dlin
g co
st p
er h
ou
r,
lab
ora
l day
s [e
uro
s]
han
dlin
g co
st p
er h
ou
r o
n S
atu
rday
s [e
uro
s]
han
dlin
g co
st p
er h
ou
r o
n S
un
day
s [e
uro
s]
han
dlin
g co
st p
er h
ou
r (
on
ave
rage
)
0,08 129,60 92,00 92,00 ?? 25,00 38,00 51,00 30,57
20,00 30,40 40,80 20,78
Table A.21: General costs of the hospital for Kimguard one-step KC 200 121x121 cm
PRO
DU
CT
LEA
D T
IME
(AV
ERA
GE)
SUPP
LIER
DIS
TAN
CE
FRO
M/T
O T
HE
SUPP
LIER
[km
]O
RDER
QU
AN
TITY
[b
oxes
]
ORD
ER Q
UA
NTI
TY
(ave
rage
)
Num
ber
of it
ems
per
bo
x
Item
s pe
r pa
llet
ORD
ER Q
UA
NTI
TY [r
ols]
DIS
COU
NT
GRO
SS P
RIC
E
NET
PR
ICE
Safe
ty s
tock
Rep
leni
shm
ents
per
m
onth
STERILE 2 3,00 Kimberly-Clark 77,30 82,43 82,43 24,00 15,00 1978,38 1,00 1,00 41,08 ? 1,00
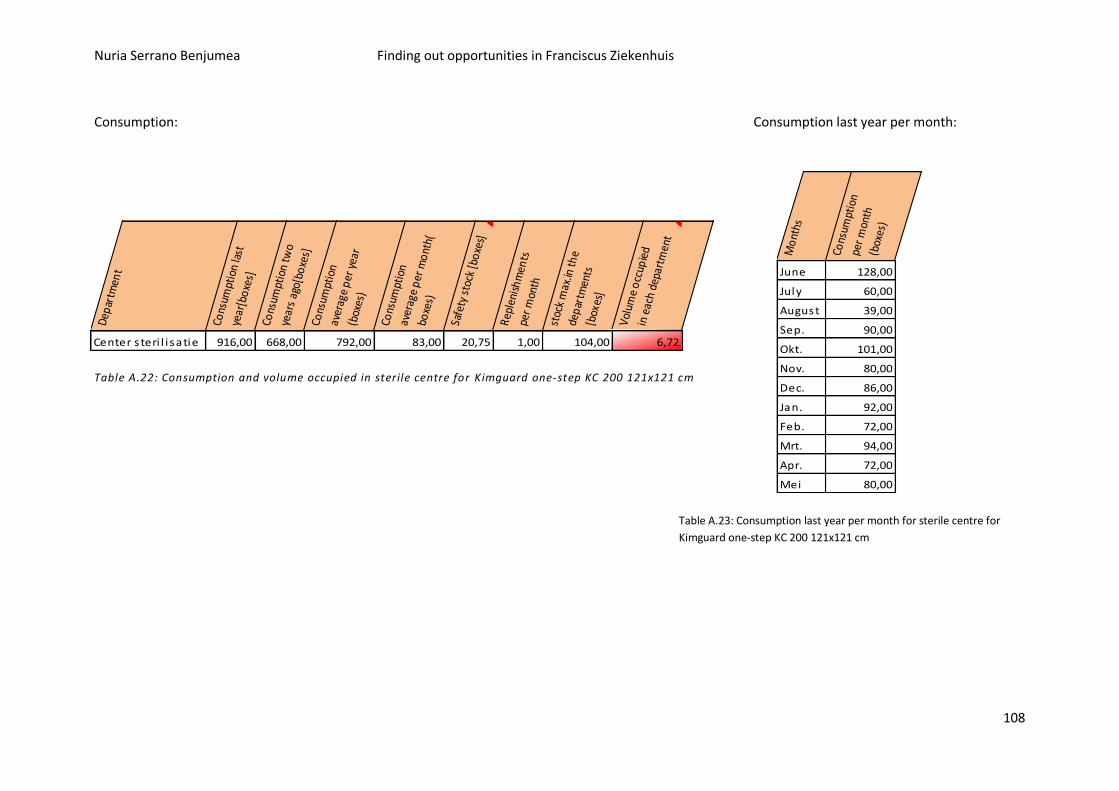
Nuria Serrano Benjumea Finding out opportunities in Franciscus Ziekenhuis
108
Mo
nths
Cons
umpt
ion
per
mon
th
(box
es)
June 128,00
July 60,00
August 39,00
Sep. 90,00
Okt. 101,00
Nov. 80,00
Dec. 86,00
Jan. 92,00
Feb. 72,00
Mrt. 94,00
Apr. 72,00
Mei 80,00
Consumption: Consumption last year per month:
Table A.22: Consumption and volume occupied in sterile centre for Kimguard one-step KC 200 121x121 cm
Table A.23: Consumption last year per month for sterile centre for
Kimguard one-step KC 200 121x121 cm
Dep
artm
ent
Cons
umpt
ion
last
ye
ar[b
oxe
s]
Cons
umpt
ion
two
year
s ag
o[bo
xes]
Cons
umpt
ion
aver
age
per
yea
r (b
oxes
)
Cons
umpt
ion
aver
age
per
mo
nth(
bo
xes)
Safe
ty s
tock
[bo
xes]
Rep
leni
shm
ents
pe
r m
onth
stoc
k m
ax.in
the
dep
artm
ents
[b
oxes
]
Vol
ume
occ
upie
d
in e
ach
depa
rtm
ent
Center s teri l i satie 916,00 668,00 792,00 83,00 20,75 1,00 104,00 6,72
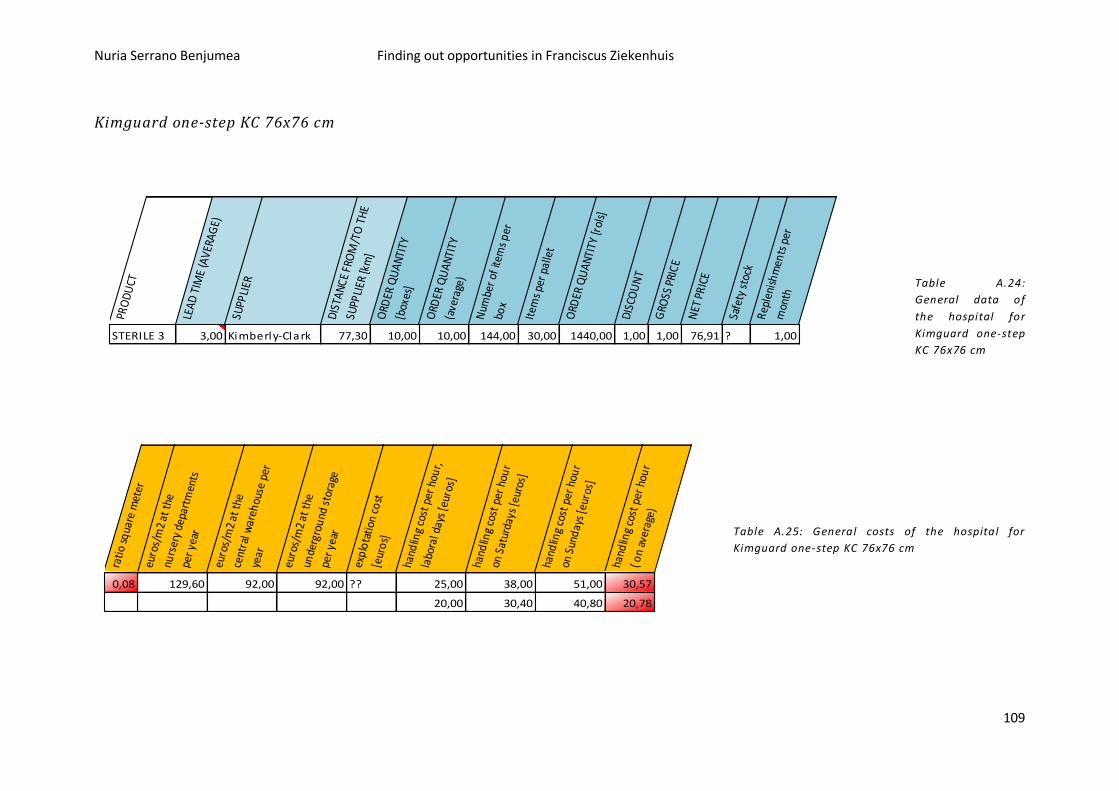
Nuria Serrano Benjumea Finding out opportunities in Franciscus Ziekenhuis
109
Kimguard one-step KC 76x76 cm
Table A.24:
General data of
the hospital for
Kimguard one-step
KC 76x76 cm
Table A.25: General costs of the hospital for
Kimguard one-step KC 76x76 cm
PRO
DU
CT
LEA
D T
IME
(AV
ERA
GE)
SUPP
LIER
DIS
TAN
CE
FRO
M/T
O T
HE
SUPP
LIER
[km
]O
RDER
QU
AN
TITY
[b
oxes
]
ORD
ER Q
UA
NTI
TY
(ave
rage
)
Num
ber
of it
ems
per
bo
x
Item
s pe
r pa
llet
ORD
ER Q
UA
NTI
TY [r
ols]
DIS
COU
NT
GRO
SS P
RIC
E
NET
PR
ICE
Safe
ty s
tock
Rep
leni
shm
ents
per
m
onth
STERILE 3 3,00 Kimberly-Clark 77,30 10,00 10,00 144,00 30,00 1440,00 1,00 1,00 76,91 ? 1,00
rati
o sq
uare
met
ereu
ros/
m2
at t
he
nurs
ery
depa
rtm
ents
pe
r ye
ar
euro
s/m
2 at
the
ce
ntra
l war
ehou
se p
er
year
euro
s/m
2 at
the
un
derg
rou
nd s
tora
ge
per
year
exp
lota
tion
co
st
[eur
os]
hand
ling
cost
per
hou
r,
labo
ral d
ays
[eur
os]
hand
ling
cost
per
hou
r on
Sat
urda
ys [
euro
s]
hand
ling
cost
per
hou
r on
Sun
day
s [e
uros
]
hand
ling
cost
per
hou
r ( o
n av
erag
e)
0,08 129,60 92,00 92,00 ?? 25,00 38,00 51,00 30,57
20,00 30,40 40,80 20,78
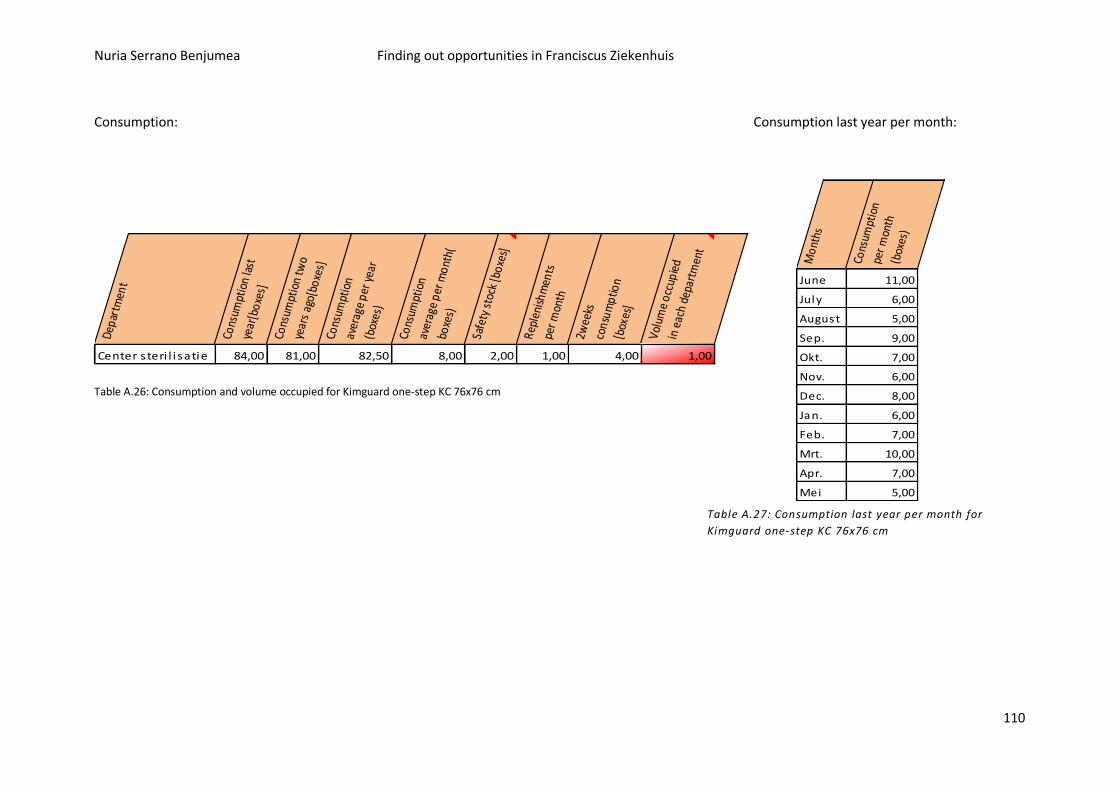
Nuria Serrano Benjumea Finding out opportunities in Franciscus Ziekenhuis
110
Mo
nths
Cons
umpt
ion
per
mon
th
(box
es)
June 11,00
July 6,00
August 5,00
Sep. 9,00
Okt. 7,00
Nov. 6,00
Dec. 8,00
Jan. 6,00
Feb. 7,00
Mrt. 10,00
Apr. 7,00
Mei 5,00
Consumption: Consumption last year per month:
Table A.26: Consumption and volume occupied for Kimguard one-step KC 76x76 cm
Table A.27: Consumption last year per month for
Kimguard one-step KC 76x76 cm
Depa
rtm
ent
Cons
umpt
ion
last
ye
ar[b
oxes
]
Cons
umpt
ion
two
year
s ag
o[bo
xes]
Cons
umpt
ion
aver
age
per y
ear
(box
es)
Cons
umpt
ion
aver
age
per m
onth
( bo
xes)
Safe
ty s
tock
[box
es]
Repl
enish
men
ts
per m
onth
2wee
ks
cons
umpt
ion
[box
es]
Volu
me
occu
pied
in
eac
h de
part
men
t
Center s teri l i satie 84,00 81,00 82,50 8,00 2,00 1,00 4,00 1,00
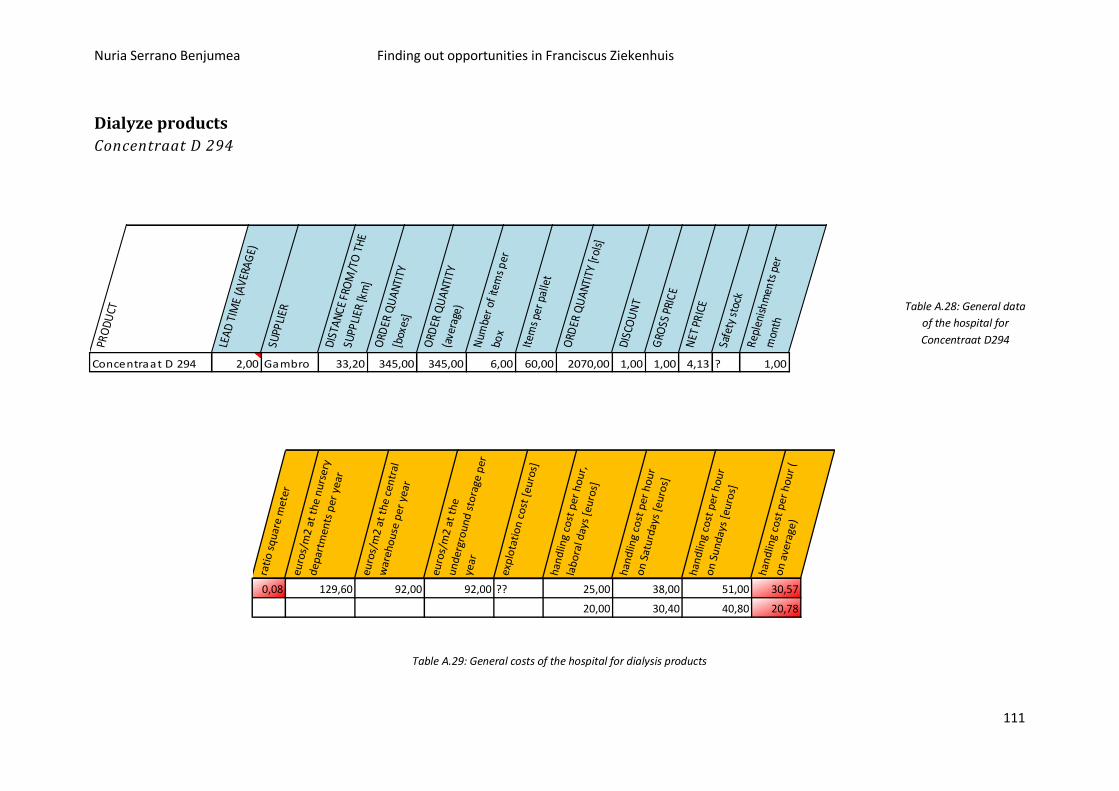
Nuria Serrano Benjumea Finding out opportunities in Franciscus Ziekenhuis
111
Dialyze products
Concentraat D 294
Table A.28: General data
of the hospital for
Concentraat D294
rati
o s
qu
are
met
ereu
ros/
m2
at t
he
nu
rser
y d
epar
tmen
ts p
er y
ear
euro
s/m
2 at
th
e ce
ntr
al
war
eho
use
per
yea
r
euro
s/m
2 at
th
e u
nd
ergr
ou
nd
sto
rage
per
year
exp
lota
tio
n c
ost
[eu
ros]
han
dlin
g co
st p
er h
ou
r,
lab
ora
l day
s [e
uro
s]
han
dlin
g co
st p
er h
ou
r o
n S
atu
rday
s [e
uro
s]
han
dlin
g co
st p
er h
ou
r o
n S
un
day
s [e
uro
s]
han
dlin
g co
st p
er h
ou
r (
on
ave
rage
)
0,08 129,60 92,00 92,00 ?? 25,00 38,00 51,00 30,57
20,00 30,40 40,80 20,78
Table A.29: General costs of the hospital for dialysis products
PRO
DU
CT
LEA
D T
IME
(AV
ERA
GE)
SUPP
LIER
DIS
TAN
CE
FRO
M/T
O T
HE
SUPP
LIER
[km
]O
RDER
QU
AN
TITY
[b
oxes
]
ORD
ER Q
UA
NTI
TY
(ave
rage
)
Num
ber
of it
ems
per
bo
x
Item
s pe
r pa
llet
ORD
ER Q
UA
NTI
TY [r
ols]
DIS
COU
NT
GRO
SS P
RIC
E
NET
PR
ICE
Safe
ty s
tock
Rep
leni
shm
ents
per
m
onth
Concentraat D 294 2,00 Gambro 33,20 345,00 345,00 6,00 60,00 2070,00 1,00 1,00 4,13 ? 1,00
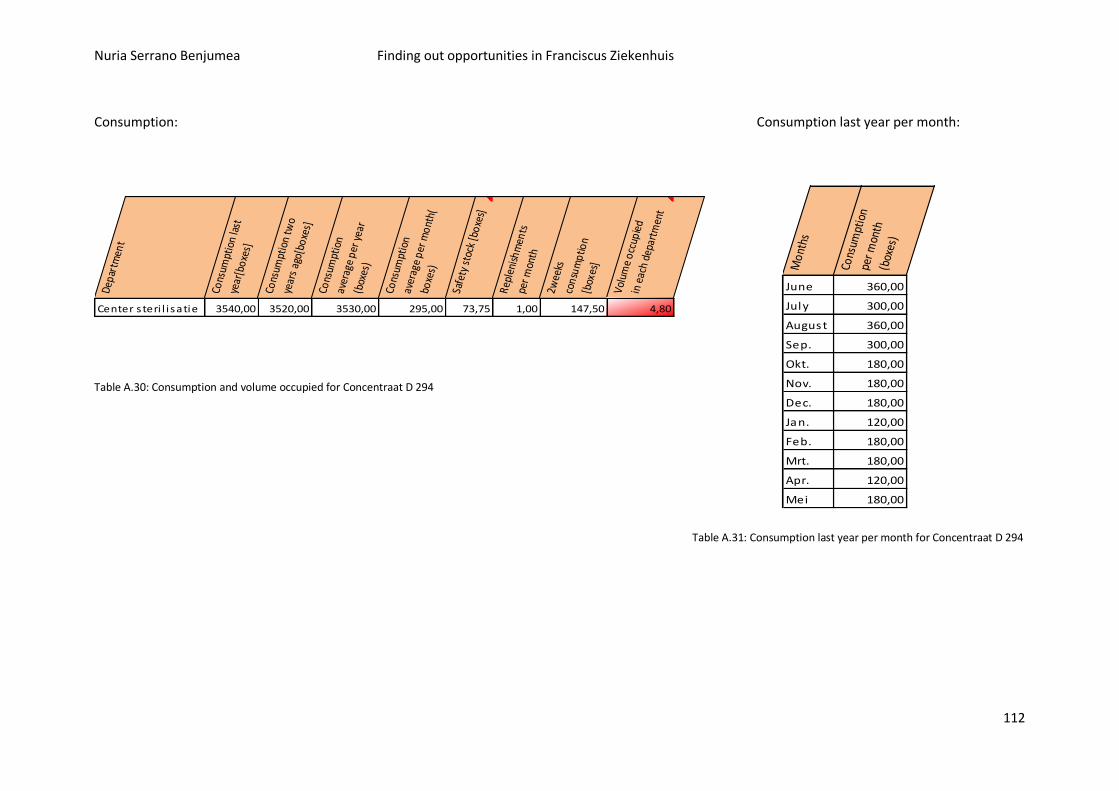
Nuria Serrano Benjumea Finding out opportunities in Franciscus Ziekenhuis
112
Consumption: Consumption last year per month:
Table A.30: Consumption and volume occupied for Concentraat D 294
Table A.31: Consumption last year per month for Concentraat D 294
Mon
ths
Cons
umpt
ion
per m
onth
(b
oxes
)
June 360,00
July 300,00
August 360,00
Sep. 300,00
Okt. 180,00
Nov. 180,00
Dec. 180,00
Jan. 120,00
Feb. 180,00
Mrt. 180,00
Apr. 120,00
Mei 180,00
Depa
rtm
ent
Cons
umpt
ion
last
ye
ar[b
oxes
]
Cons
umpt
ion
two
year
s ag
o[bo
xes]
Cons
umpt
ion
aver
age
per y
ear
(box
es)
Cons
umpt
ion
aver
age
per m
onth
( bo
xes)
Safe
ty s
tock
[box
es]
Repl
enish
men
ts
per m
onth
2wee
ks
cons
umpt
ion
[box
es]
Volu
me
occu
pied
in
eac
h de
part
men
t
Center s teri l i satie 3540,00 3520,00 3530,00 295,00 73,75 1,00 147,50 4,80
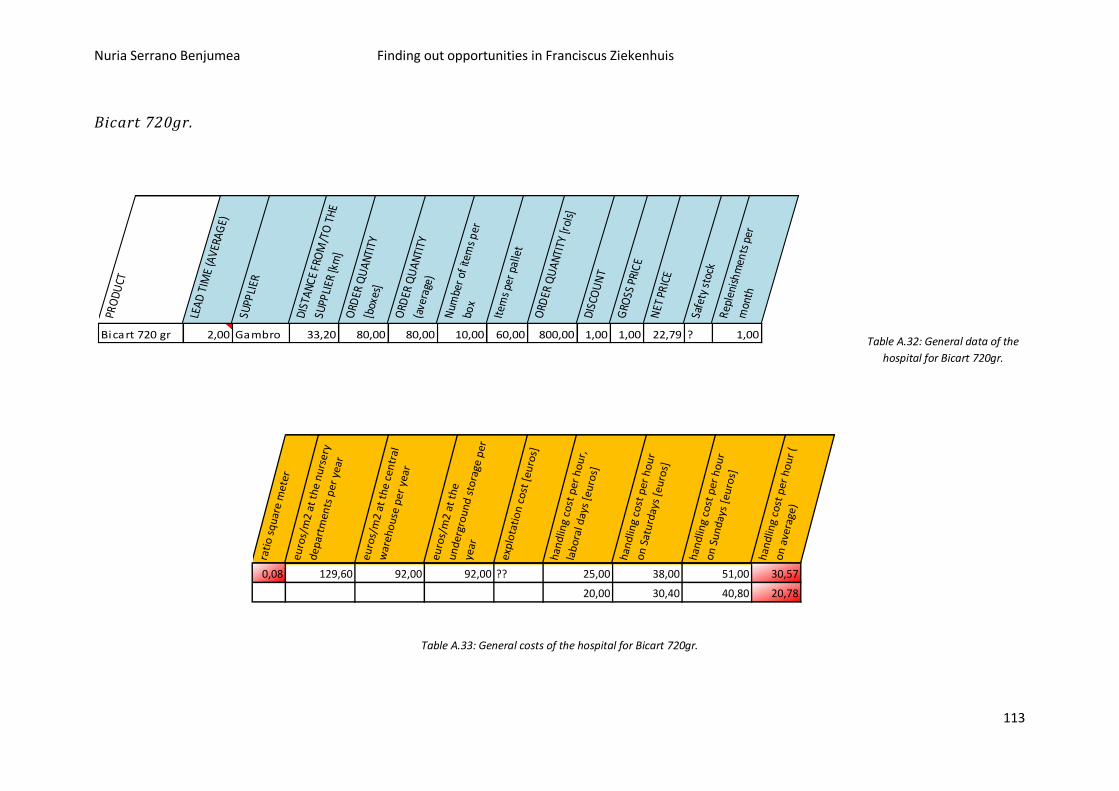
Nuria Serrano Benjumea Finding out opportunities in Franciscus Ziekenhuis
113
Bicart 720gr.
Table A.32: General data of the
hospital for Bicart 720gr.
rati
o s
qu
are
met
ereu
ros/
m2
at t
he
nu
rser
y d
epar
tmen
ts p
er y
ear
euro
s/m
2 at
th
e ce
ntr
al
war
eho
use
per
yea
r
euro
s/m
2 at
th
e u
nd
ergr
ou
nd
sto
rage
per
year
exp
lota
tio
n c
ost
[eu
ros]
han
dlin
g co
st p
er h
ou
r,
lab
ora
l day
s [e
uro
s]
han
dlin
g co
st p
er h
ou
r o
n S
atu
rday
s [e
uro
s]
han
dlin
g co
st p
er h
ou
r o
n S
un
day
s [e
uro
s]
han
dlin
g co
st p
er h
ou
r (
on
ave
rage
)
0,08 129,60 92,00 92,00 ?? 25,00 38,00 51,00 30,57
20,00 30,40 40,80 20,78
Table A.33: General costs of the hospital for Bicart 720gr.
PRO
DU
CT
LEA
D T
IME
(AV
ERA
GE)
SUPP
LIER
DIS
TAN
CE
FRO
M/T
O T
HE
SUPP
LIER
[km
]O
RDER
QU
AN
TITY
[b
oxes
]
ORD
ER Q
UA
NTI
TY
(ave
rage
)
Num
ber
of it
ems
per
bo
x
Item
s pe
r pa
llet
ORD
ER Q
UA
NTI
TY [r
ols]
DIS
COU
NT
GRO
SS P
RIC
E
NET
PR
ICE
Safe
ty s
tock
Rep
leni
shm
ents
per
m
onth
Bicart 720 gr 2,00 Gambro 33,20 80,00 80,00 10,00 60,00 800,00 1,00 1,00 22,79 ? 1,00
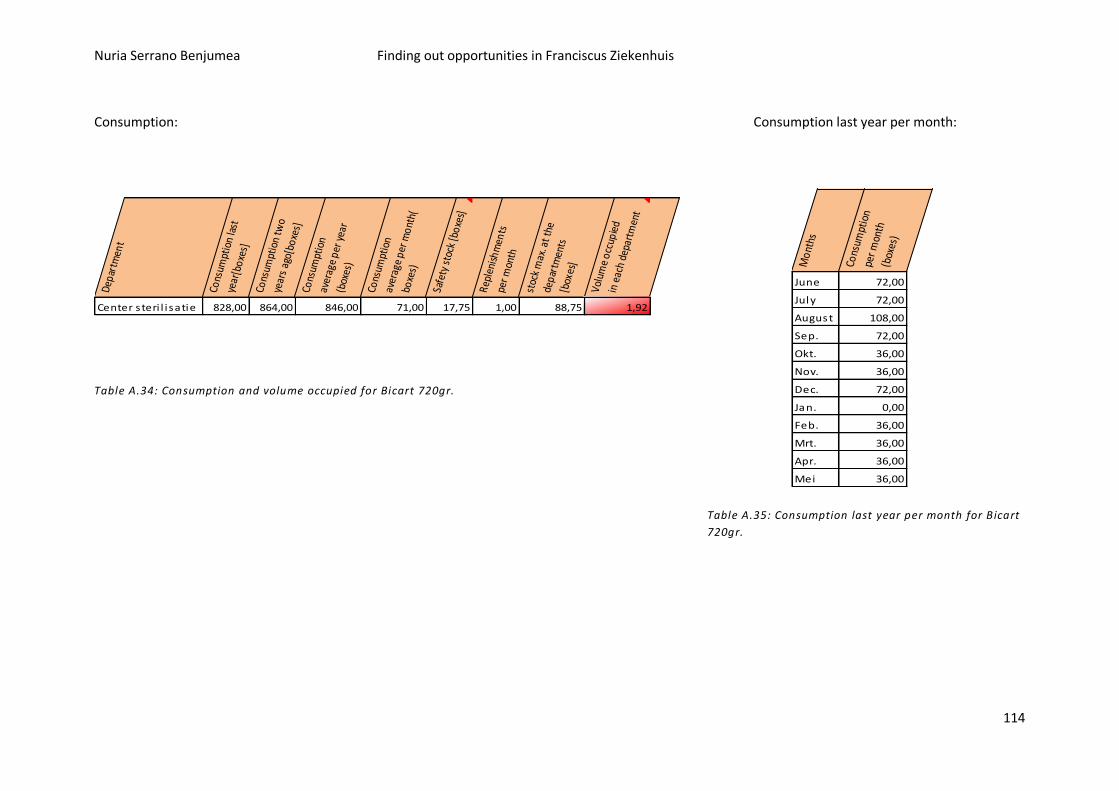
Nuria Serrano Benjumea Finding out opportunities in Franciscus Ziekenhuis
114
Consumption: Consumption last year per month:
Table A.34: Consumption and volume occupied for Bicart 720gr.
Table A.35: Consumption last year per month for Bicart
720gr.
Mon
ths
Cons
umpt
ion
per m
onth
(b
oxes
)
June 72,00
July 72,00
August 108,00
Sep. 72,00
Okt. 36,00
Nov. 36,00
Dec. 72,00
Jan. 0,00
Feb. 36,00
Mrt. 36,00
Apr. 36,00
Mei 36,00
Depa
rtm
ent
Cons
umpt
ion
last
ye
ar[b
oxes
]
Cons
umpt
ion
two
year
s ag
o[bo
xes]
Cons
umpt
ion
aver
age
per y
ear
(box
es)
Cons
umpt
ion
aver
age
per m
onth
( bo
xes)
Safe
ty s
tock
[box
es]
Repl
enish
men
ts
per m
onth
stoc
k m
ax. a
t the
de
part
men
ts
[box
es]
Volu
me
occu
pied
in
eac
h de
part
men
t
Center s teri l i satie 828,00 864,00 846,00 71,00 17,75 1,00 88,75 1,92
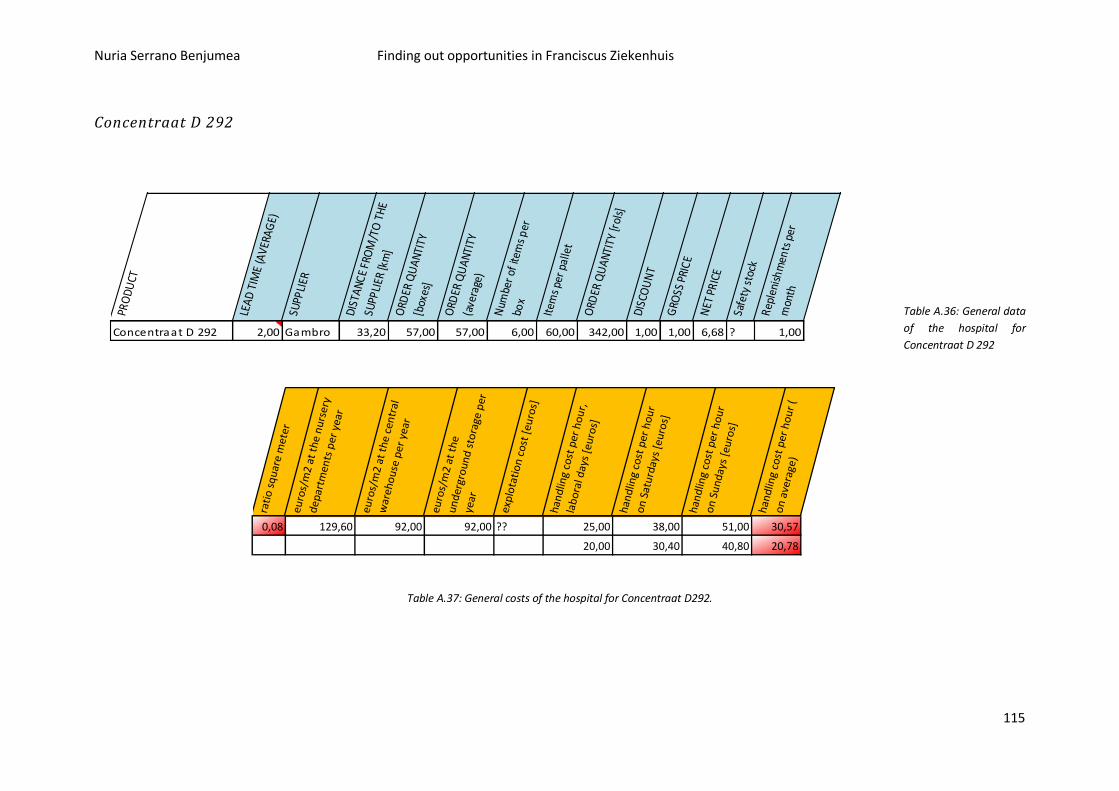
Nuria Serrano Benjumea Finding out opportunities in Franciscus Ziekenhuis
115
Concentraat D 292
Table A.36: General data
of the hospital for
Concentraat D 292
rati
o s
qu
are
met
ereu
ros/
m2
at t
he
nu
rser
y d
epar
tmen
ts p
er y
ear
euro
s/m
2 at
th
e ce
ntr
al
war
eho
use
per
yea
r
euro
s/m
2 at
th
e u
nd
ergr
ou
nd
sto
rage
per
year
exp
lota
tio
n c
ost
[eu
ros]
han
dlin
g co
st p
er h
ou
r,
lab
ora
l day
s [e
uro
s]
han
dlin
g co
st p
er h
ou
r o
n S
atu
rday
s [e
uro
s]
han
dlin
g co
st p
er h
ou
r o
n S
un
day
s [e
uro
s]
han
dlin
g co
st p
er h
ou
r (
on
ave
rage
)
0,08 129,60 92,00 92,00 ?? 25,00 38,00 51,00 30,57
20,00 30,40 40,80 20,78
Table A.37: General costs of the hospital for Concentraat D292.
PRO
DU
CT
LEA
D T
IME
(AV
ERA
GE)
SUPP
LIER
DIS
TAN
CE
FRO
M/T
O T
HE
SUPP
LIER
[km
]O
RDER
QU
AN
TITY
[b
oxes
]
ORD
ER Q
UA
NTI
TY
(ave
rage
)
Num
ber
of it
ems
per
bo
x
Item
s pe
r pa
llet
ORD
ER Q
UA
NTI
TY [r
ols]
DIS
COU
NT
GRO
SS P
RIC
E
NET
PR
ICE
Safe
ty s
tock
Rep
leni
shm
ents
per
m
onth
Concentraat D 292 2,00 Gambro 33,20 57,00 57,00 6,00 60,00 342,00 1,00 1,00 6,68 ? 1,00
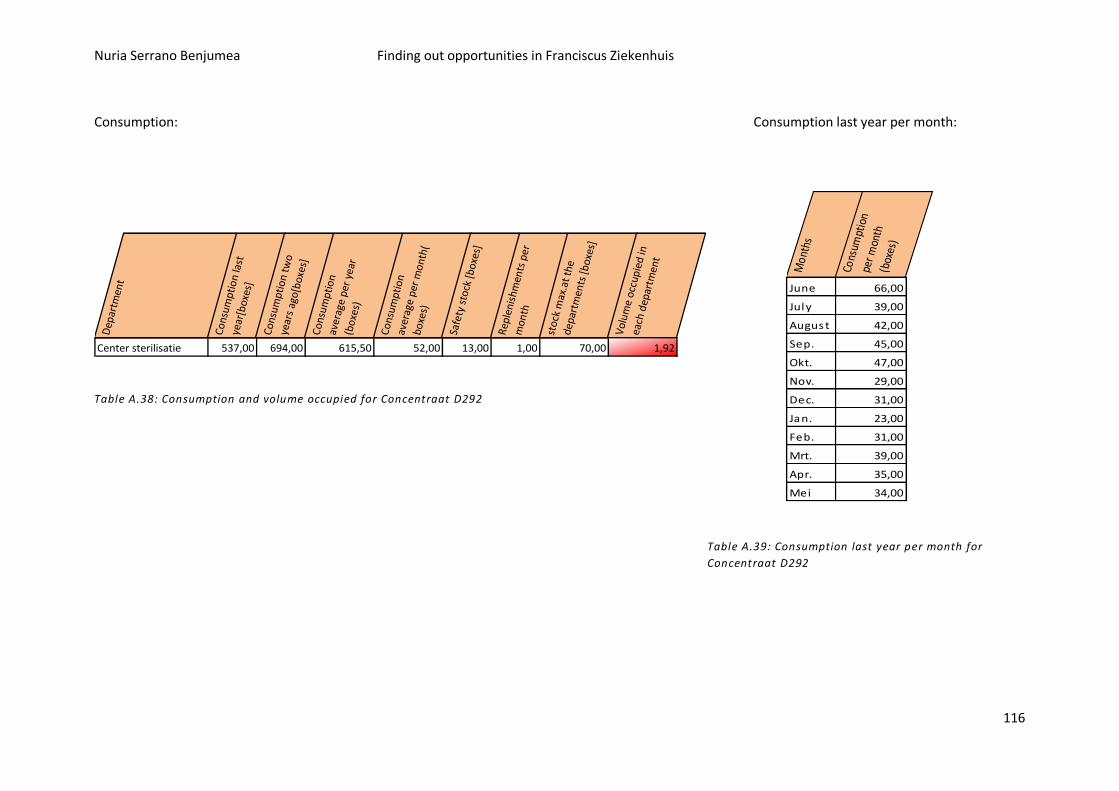
Nuria Serrano Benjumea Finding out opportunities in Franciscus Ziekenhuis
116
Consumption: Consumption last year per month:
Dep
artm
ent
Co
nsum
ptio
n la
st
year
[box
es]
Co
nsum
ptio
n tw
o ye
ars
ago[
boxe
s]C
ons
umpt
ion
aver
age
per
year
(b
oxes
)
Co
nsum
ptio
n av
erag
e pe
r m
onth
( bo
xes)
Safe
ty s
tock
[bo
xes]
Rep
leni
shm
ents
per
m
onth
stoc
k m
ax.a
t th
e de
part
men
ts [
box
es]
Vol
ume
occu
pied
in
each
dep
artm
ent
Center sterilisatie 537,00 694,00 615,50 52,00 13,00 1,00 70,00 1,92
Table A.38: Consumption and volume occupied for Concentraat D292
Table A.39: Consumption last year per month for
Concentraat D292
Mon
ths
Cons
umpt
ion
per m
onth
(b
oxes
)
June 66,00
July 39,00
August 42,00
Sep. 45,00
Okt. 47,00
Nov. 29,00
Dec. 31,00
Jan. 23,00
Feb. 31,00
Mrt. 39,00
Apr. 35,00
Mei 34,00
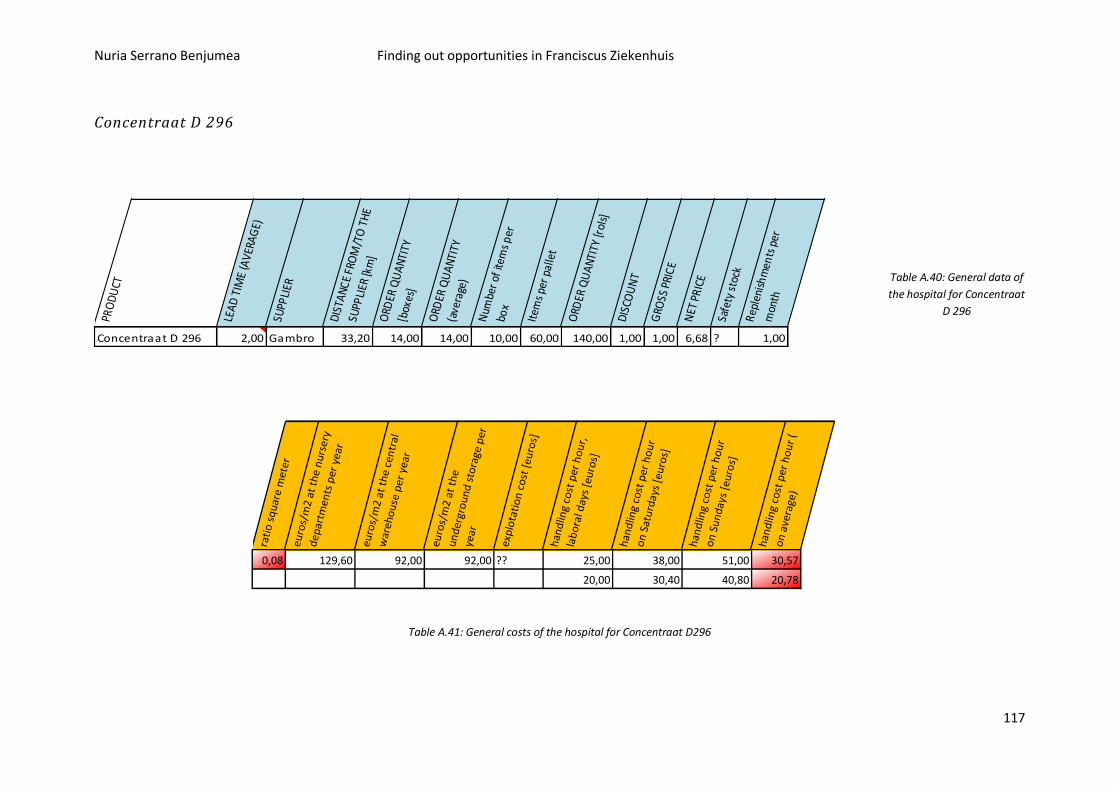
Nuria Serrano Benjumea Finding out opportunities in Franciscus Ziekenhuis
117
Concentraat D 296
Table A.40: General data of
the hospital for Concentraat
D 296
rati
o s
qu
are
met
ereu
ros/
m2
at t
he
nu
rser
y d
epar
tmen
ts p
er y
ear
euro
s/m
2 at
th
e ce
ntr
al
war
eho
use
per
yea
r
euro
s/m
2 at
th
e u
nd
ergr
ou
nd
sto
rage
per
year
exp
lota
tio
n c
ost
[eu
ros]
han
dlin
g co
st p
er h
ou
r,
lab
ora
l day
s [e
uro
s]
han
dlin
g co
st p
er h
ou
r o
n S
atu
rday
s [e
uro
s]
han
dlin
g co
st p
er h
ou
r o
n S
un
day
s [e
uro
s]
han
dlin
g co
st p
er h
ou
r (
on
ave
rage
)
0,08 129,60 92,00 92,00 ?? 25,00 38,00 51,00 30,57
20,00 30,40 40,80 20,78
Table A.41: General costs of the hospital for Concentraat D296
PRO
DU
CT
LEA
D T
IME
(AV
ERA
GE)
SUPP
LIER
DIS
TAN
CE
FRO
M/T
O T
HE
SUPP
LIER
[km
]O
RDER
QU
AN
TITY
[b
oxes
]
ORD
ER Q
UA
NTI
TY
(ave
rage
)
Num
ber
of it
ems
per
bo
x
Item
s pe
r pa
llet
ORD
ER Q
UA
NTI
TY [r
ols]
DIS
COU
NT
GRO
SS P
RIC
E
NET
PR
ICE
Safe
ty s
tock
Rep
leni
shm
ents
per
m
onth
Concentraat D 296 2,00 Gambro 33,20 14,00 14,00 10,00 60,00 140,00 1,00 1,00 6,68 ? 1,00
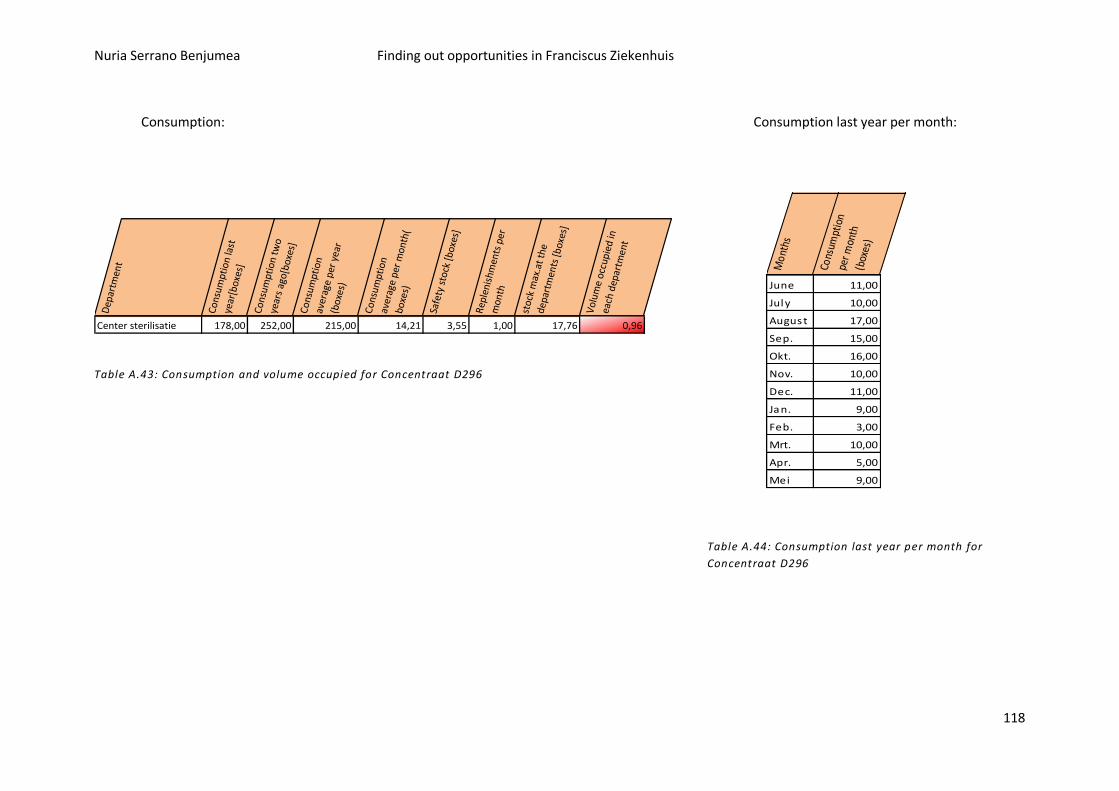
Nuria Serrano Benjumea Finding out opportunities in Franciscus Ziekenhuis
118
Consumption: Consumption last year per month:
Dep
artm
ent
Cons
umpt
ion
last
ye
ar[b
oxes
]
Cons
umpt
ion
two
year
s ag
o[bo
xes]
Cons
umpt
ion
aver
age
per
year
(b
oxes
)
Cons
umpt
ion
aver
age
per
mon
th(
boxe
s)
Safe
ty s
tock
[box
es]
Rep
leni
shm
ents
per
m
onth
stoc
k m
ax.a
t th
e de
part
men
ts [b
oxes
]
Vol
ume
occu
pied
in
each
dep
artm
ent
Center sterilisatie 178,00 252,00 215,00 14,21 3,55 1,00 17,76 0,96
Table A.43: Consumption and volume occupied for Concentraat D296
Table A.44: Consumption last year per month for
Concentraat D296
Mon
ths
Cons
umpt
ion
per m
onth
(b
oxes
)
June 11,00
July 10,00
August 17,00
Sep. 15,00
Okt. 16,00
Nov. 10,00
Dec. 11,00
Jan. 9,00
Feb. 3,00
Mrt. 10,00
Apr. 5,00
Mei 9,00
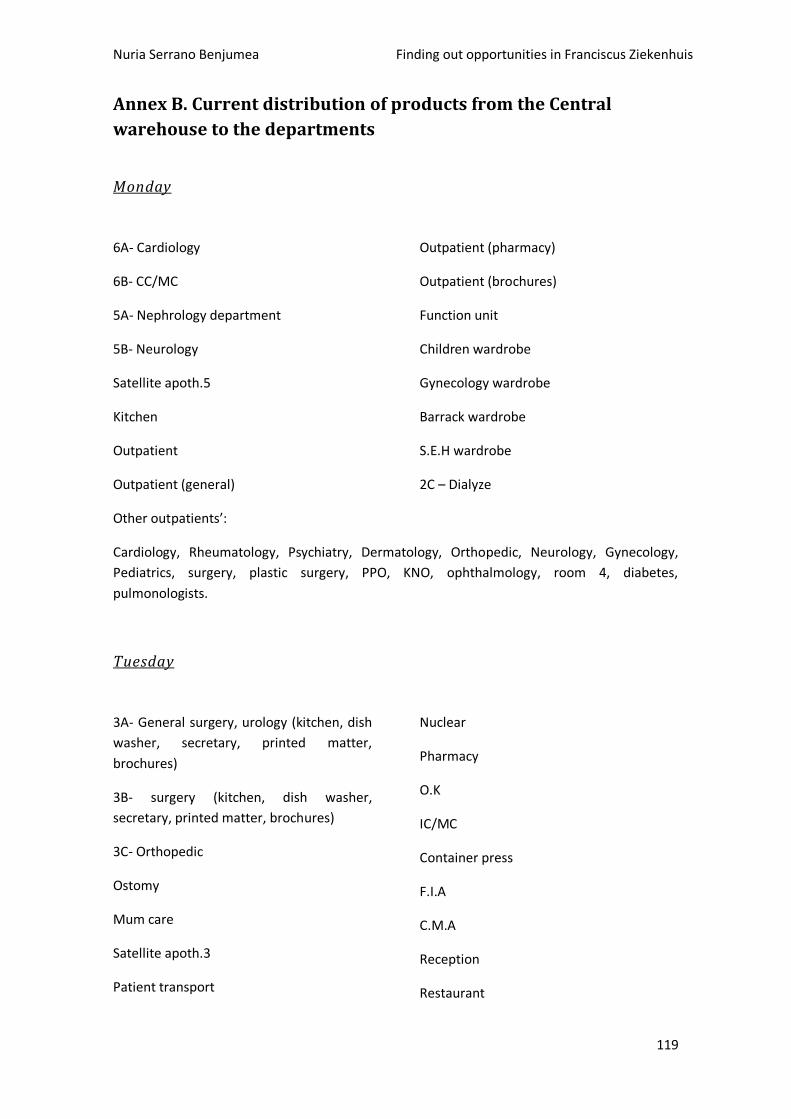
Nuria Serrano Benjumea Finding out opportunities in Franciscus Ziekenhuis
119
Annex B. Current distribution of products from the Central
warehouse to the departments
Monday
6A- Cardiology
6B- CC/MC
5A- Nephrology department
5B- Neurology
Satellite apoth.5
Kitchen
Outpatient
Outpatient (general)
Outpatient (pharmacy)
Outpatient (brochures)
Function unit
Children wardrobe
Gynecology wardrobe
Barrack wardrobe
S.E.H wardrobe
2C – Dialyze
Other outpatients’:
Cardiology, Rheumatology, Psychiatry, Dermatology, Orthopedic, Neurology, Gynecology,
Pediatrics, surgery, plastic surgery, PPO, KNO, ophthalmology, room 4, diabetes,
pulmonologists.
Tuesday
3A- General surgery, urology (kitchen, dish
washer, secretary, printed matter,
brochures)
3B- surgery (kitchen, dish washer,
secretary, printed matter, brochures)
3C- Orthopedic
Ostomy
Mum care
Satellite apoth.3
Patient transport
Nuclear
Pharmacy
O.K
IC/MC
Container press
F.I.A
C.M.A
Reception
Restaurant
Nuria Serrano Benjumea Finding out opportunities in Franciscus Ziekenhuis
120
Snack bar Refrigerator
Wednesday
Chemical Laboratories
Micro biology laboratories
Sterile center
Flat
Flat (restaurant)
Drinks (flat)
Thrombosis
Radiology
Physiotherapy
S.E.H
Plaster room
Treatment center
1B-nursing behavior
Automation
Thursday
2A- Short stay
2B- Gynecology
2C- Dialyze
Satellite apoth.2
Kitchen
4A- Pulmonary department
4B- Day care
4C- Intern
Satellite apoth.4
Friday
O.K.
Children’s block
Treatment center
IC/ MC+
Copy room
GP post
Restaurant
Snack bar
Refrigerator
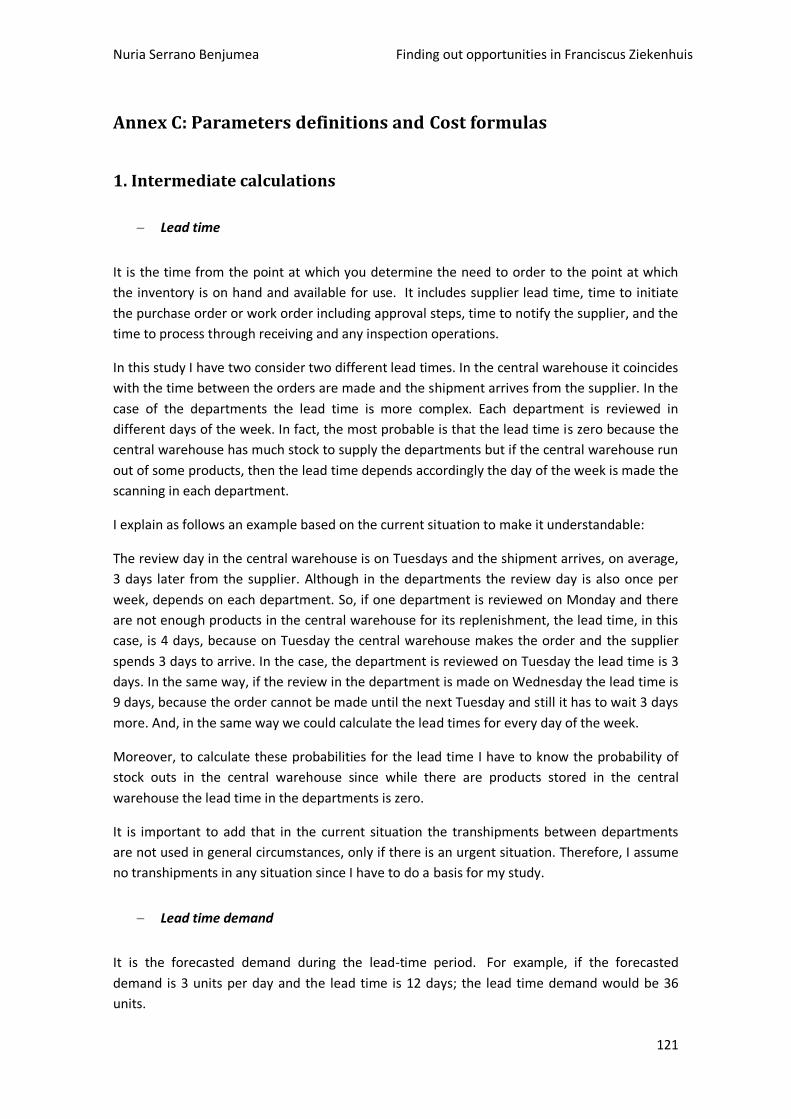
Nuria Serrano Benjumea Finding out opportunities in Franciscus Ziekenhuis
121
Annex C: Parameters definitions and Cost formulas
1. Intermediate calculations
Lead time
It is the time from the point at which you determine the need to order to the point at which
the inventory is on hand and available for use. It includes supplier lead time, time to initiate
the purchase order or work order including approval steps, time to notify the supplier, and the
time to process through receiving and any inspection operations.
In this study I have two consider two different lead times. In the central warehouse it coincides
with the time between the orders are made and the shipment arrives from the supplier. In the
case of the departments the lead time is more complex. Each department is reviewed in
different days of the week. In fact, the most probable is that the lead time is zero because the
central warehouse has much stock to supply the departments but if the central warehouse run
out of some products, then the lead time depends accordingly the day of the week is made the
scanning in each department.
I explain as follows an example based on the current situation to make it understandable:
The review day in the central warehouse is on Tuesdays and the shipment arrives, on average,
3 days later from the supplier. Although in the departments the review day is also once per
week, depends on each department. So, if one department is reviewed on Monday and there
are not enough products in the central warehouse for its replenishment, the lead time, in this
case, is 4 days, because on Tuesday the central warehouse makes the order and the supplier
spends 3 days to arrive. In the case, the department is reviewed on Tuesday the lead time is 3
days. In the same way, if the review in the department is made on Wednesday the lead time is
9 days, because the order cannot be made until the next Tuesday and still it has to wait 3 days
more. And, in the same way we could calculate the lead times for every day of the week.
Moreover, to calculate these probabilities for the lead time I have to know the probability of
stock outs in the central warehouse since while there are products stored in the central
warehouse the lead time in the departments is zero.
It is important to add that in the current situation the transhipments between departments
are not used in general circumstances, only if there is an urgent situation. Therefore, I assume
no transhipments in any situation since I have to do a basis for my study.
Lead time demand
It is the forecasted demand during the lead-time period. For example, if the forecasted
demand is 3 units per day and the lead time is 12 days; the lead time demand would be 36
units.
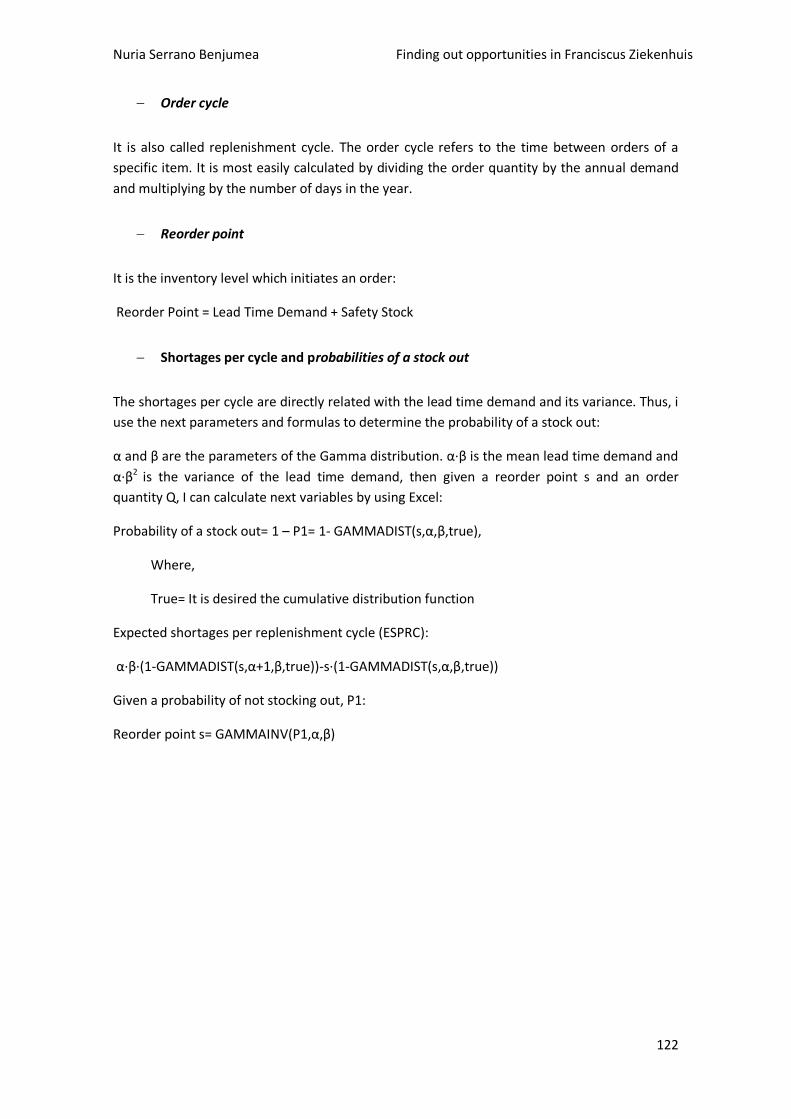
Nuria Serrano Benjumea Finding out opportunities in Franciscus Ziekenhuis
122
Order cycle
It is also called replenishment cycle. The order cycle refers to the time between orders of a
specific item. It is most easily calculated by dividing the order quantity by the annual demand
and multiplying by the number of days in the year.
Reorder point
It is the inventory level which initiates an order:
Reorder Point = Lead Time Demand + Safety Stock
Shortages per cycle and probabilities of a stock out
The shortages per cycle are directly related with the lead time demand and its variance. Thus, i
use the next parameters and formulas to determine the probability of a stock out:
α and β are the parameters of the Gamma distribution. α·β is the mean lead time demand and
α·β2 is the variance of the lead time demand, then given a reorder point s and an order
quantity Q, I can calculate next variables by using Excel:
Probability of a stock out= 1 – P1= 1- GAMMADIST(s,α,β,true),
Where,
True= It is desired the cumulative distribution function
Expected shortages per replenishment cycle (ESPRC):
α·β·(1-GAMMADIST(s,α+1,β,true))-s·(1-GAMMADIST(s,α,β,true))
Given a probability of not stocking out, P1:
Reorder point s= GAMMAINV(P1,α,β)
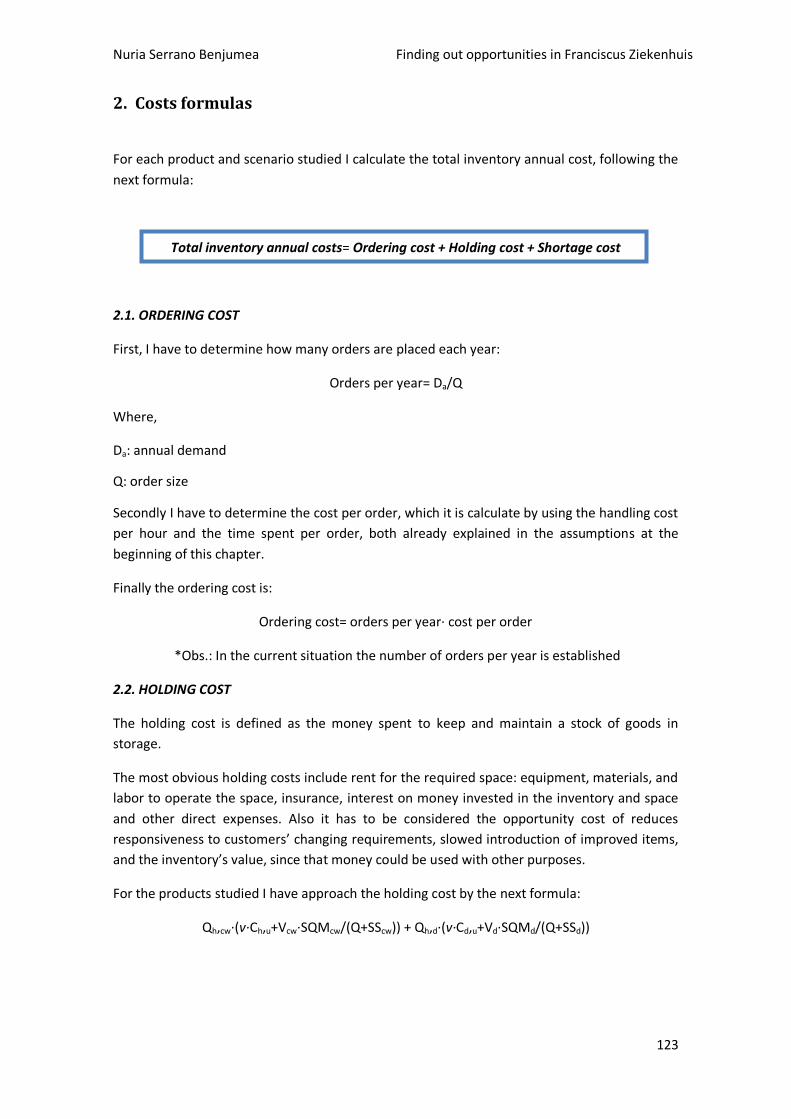
Nuria Serrano Benjumea Finding out opportunities in Franciscus Ziekenhuis
123
2. Costs formulas
For each product and scenario studied I calculate the total inventory annual cost, following the
next formula:
Total inventory annual costs= Ordering cost + Holding cost + Shortage cost
2.1. ORDERING COST
First, I have to determine how many orders are placed each year:
Orders per year= Da/Q
Where,
Da: annual demand
Q: order size
Secondly I have to determine the cost per order, which it is calculate by using the handling cost
per hour and the time spent per order, both already explained in the assumptions at the
beginning of this chapter.
Finally the ordering cost is:
Ordering cost= orders per year· cost per order
*Obs.: In the current situation the number of orders per year is established
2.2. HOLDING COST
The holding cost is defined as the money spent to keep and maintain a stock of goods in
storage.
The most obvious holding costs include rent for the required space: equipment, materials, and
labor to operate the space, insurance, interest on money invested in the inventory and space
and other direct expenses. Also it has to be considered the opportunity cost of reduces
responsiveness to customers’ changing requirements, slowed introduction of improved items,
and the inventory’s value, since that money could be used with other purposes.
For the products studied I have approach the holding cost by the next formula:
Qh,cw·(v·Ch,u+Vcw·SQMcw/(Q+SScw)) + Qh,d·(v·Cd,u+Vd·SQMd/(Q+SSd))
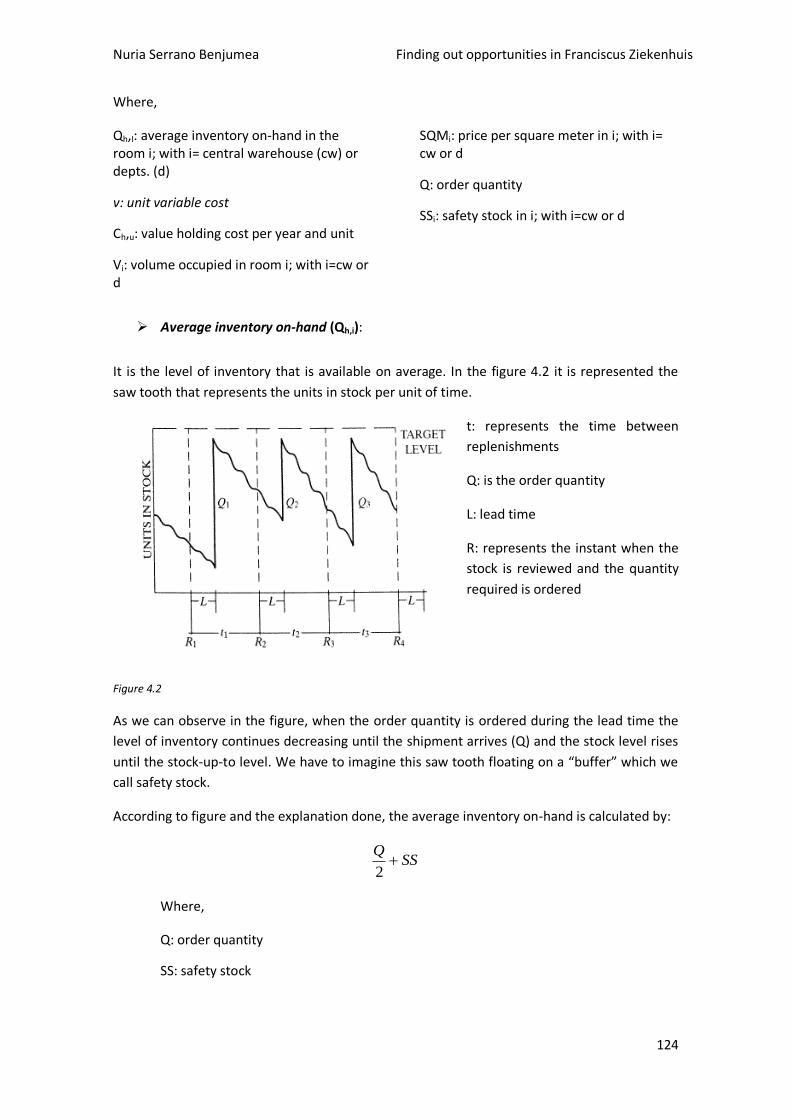
Nuria Serrano Benjumea Finding out opportunities in Franciscus Ziekenhuis
124
Where,
Qh,I: average inventory on-hand in the room i; with i= central warehouse (cw) or depts. (d)
v: unit variable cost
Ch,u: value holding cost per year and unit
Vi: volume occupied in room i; with i=cw or d
SQMi: price per square meter in i; with i= cw or d
Q: order quantity
SSi: safety stock in i; with i=cw or d
Average inventory on-hand (Qh,i):
It is the level of inventory that is available on average. In the figure 4.2 it is represented the
saw tooth that represents the units in stock per unit of time.
t: represents the time between
replenishments
Q: is the order quantity
L: lead time
R: represents the instant when the
stock is reviewed and the quantity
required is ordered
Figure 4.2
As we can observe in the figure, when the order quantity is ordered during the lead time the
level of inventory continues decreasing until the shipment arrives (Q) and the stock level rises
until the stock-up-to level. We have to imagine this saw tooth floating on a “buffer” which we
call safety stock.
According to figure and the explanation done, the average inventory on-hand is calculated by:
SSQ
2
Where,
Q: order quantity
SS: safety stock
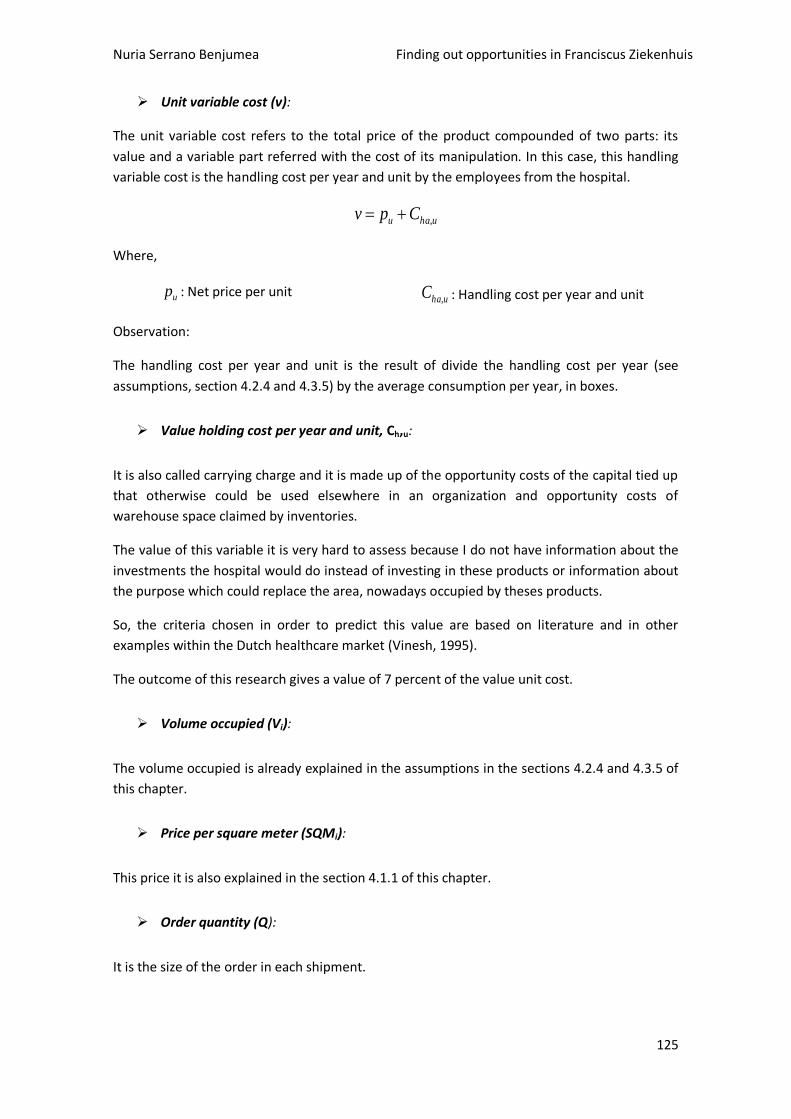
Nuria Serrano Benjumea Finding out opportunities in Franciscus Ziekenhuis
125
Unit variable cost (v):
The unit variable cost refers to the total price of the product compounded of two parts: its
value and a variable part referred with the cost of its manipulation. In this case, this handling
variable cost is the handling cost per year and unit by the employees from the hospital.
uhau Cpv ,
Where,
up : Net price per unit uhaC , : Handling cost per year and unit
Observation:
The handling cost per year and unit is the result of divide the handling cost per year (see
assumptions, section 4.2.4 and 4.3.5) by the average consumption per year, in boxes.
Value holding cost per year and unit, Ch,u:
It is also called carrying charge and it is made up of the opportunity costs of the capital tied up
that otherwise could be used elsewhere in an organization and opportunity costs of
warehouse space claimed by inventories.
The value of this variable it is very hard to assess because I do not have information about the
investments the hospital would do instead of investing in these products or information about
the purpose which could replace the area, nowadays occupied by theses products.
So, the criteria chosen in order to predict this value are based on literature and in other
examples within the Dutch healthcare market (Vinesh, 1995).
The outcome of this research gives a value of 7 percent of the value unit cost.
Volume occupied (Vi):
The volume occupied is already explained in the assumptions in the sections 4.2.4 and 4.3.5 of
this chapter.
Price per square meter (SQMi):
This price it is also explained in the section 4.1.1 of this chapter.
Order quantity (Q):
It is the size of the order in each shipment.
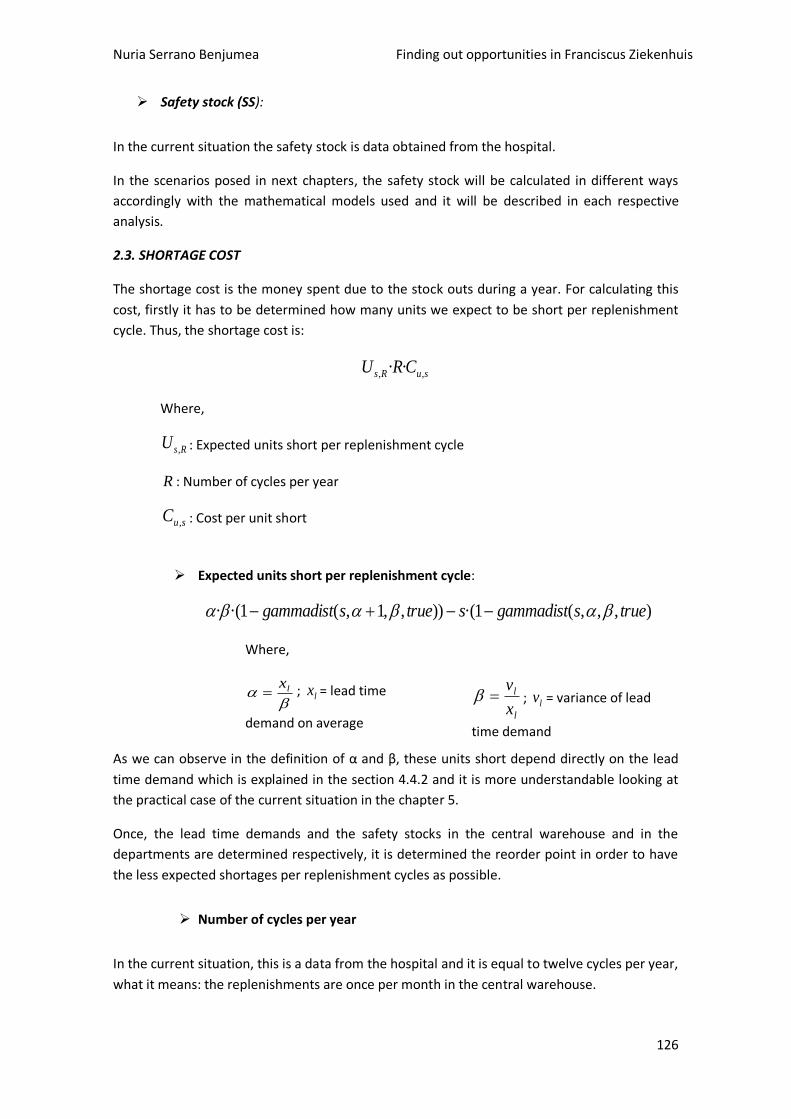
Nuria Serrano Benjumea Finding out opportunities in Franciscus Ziekenhuis
126
Safety stock (SS):
In the current situation the safety stock is data obtained from the hospital.
In the scenarios posed in next chapters, the safety stock will be calculated in different ways
accordingly with the mathematical models used and it will be described in each respective
analysis.
2.3. SHORTAGE COST
The shortage cost is the money spent due to the stock outs during a year. For calculating this
cost, firstly it has to be determined how many units we expect to be short per replenishment
cycle. Thus, the shortage cost is:
suRs CRU ,, ··
Where,
RsU , : Expected units short per replenishment cycle
R : Number of cycles per year
suC , : Cost per unit short
Expected units short per replenishment cycle:
),,,(1·()),,1,(1·(· truesgammadiststruesgammadist
Where,
lx ; lx = lead time
demand on average l
l
x
v ; lv = variance of lead
time demand
As we can observe in the definition of α and β, these units short depend directly on the lead
time demand which is explained in the section 4.4.2 and it is more understandable looking at
the practical case of the current situation in the chapter 5.
Once, the lead time demands and the safety stocks in the central warehouse and in the
departments are determined respectively, it is determined the reorder point in order to have
the less expected shortages per replenishment cycles as possible.
Number of cycles per year
In the current situation, this is a data from the hospital and it is equal to twelve cycles per year,
what it means: the replenishments are once per month in the central warehouse.
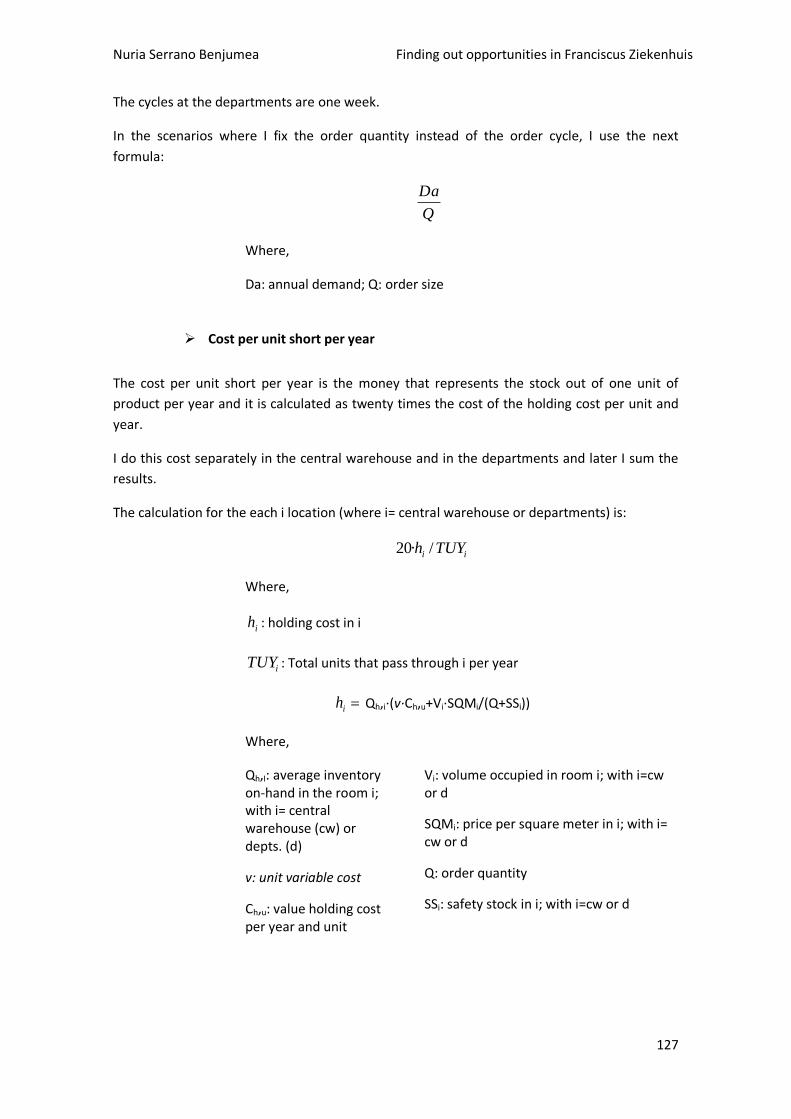
Nuria Serrano Benjumea Finding out opportunities in Franciscus Ziekenhuis
127
The cycles at the departments are one week.
In the scenarios where I fix the order quantity instead of the order cycle, I use the next
formula:
Q
Da
Where,
Da: annual demand; Q: order size
Cost per unit short per year
The cost per unit short per year is the money that represents the stock out of one unit of
product per year and it is calculated as twenty times the cost of the holding cost per unit and
year.
I do this cost separately in the central warehouse and in the departments and later I sum the
results.
The calculation for the each i location (where i= central warehouse or departments) is:
ii TUYh /·20
Where,
ih : holding cost in i
iTUY : Total units that pass through i per year
ih Qh,i·(v·Ch,u+Vi·SQMi/(Q+SSi))
Where,
Qh,I: average inventory on-hand in the room i; with i= central warehouse (cw) or depts. (d)
v: unit variable cost
Ch,u: value holding cost per year and unit
Vi: volume occupied in room i; with i=cw or d
SQMi: price per square meter in i; with i= cw or d
Q: order quantity
SSi: safety stock in i; with i=cw or d
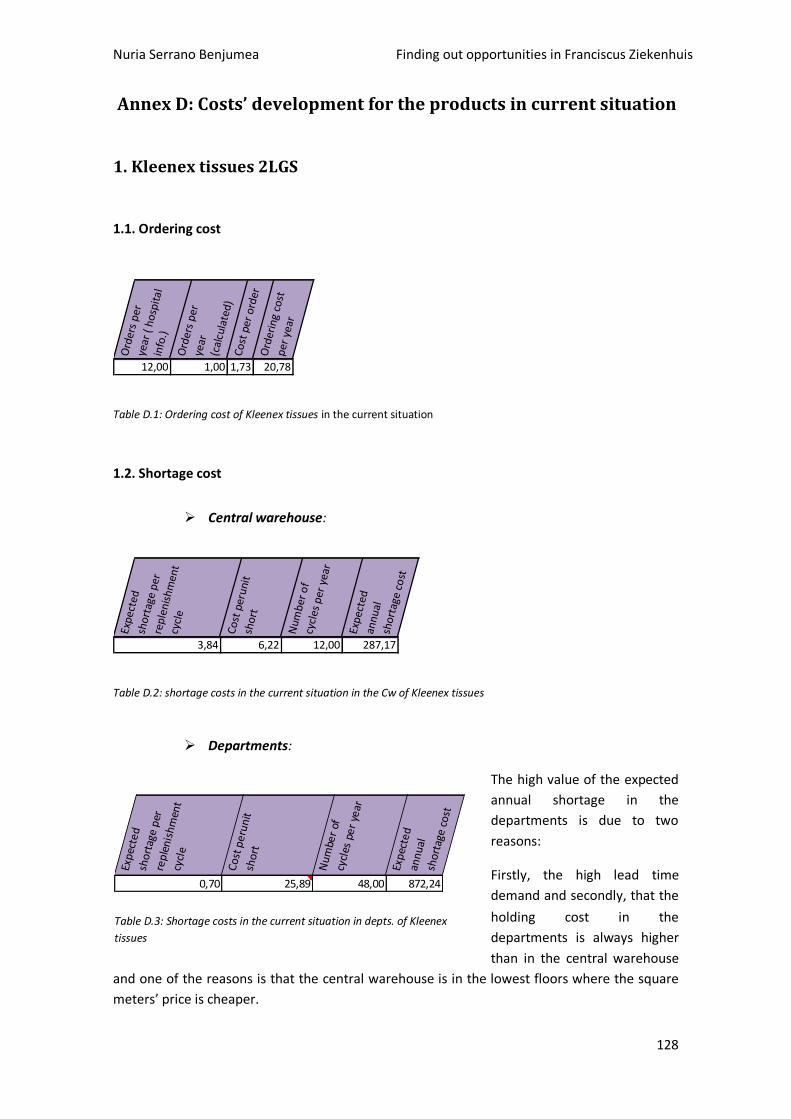
Nuria Serrano Benjumea Finding out opportunities in Franciscus Ziekenhuis
128
Annex D: Costs’ development for the products in current situation
1. Kleenex tissues 2LGS
1.1. Ordering cost
Ord
ers
per
ye
ar (
ho
spit
al
info
.)
Ord
ers
per
ye
ar
(cal
cula
ted
)C
ost
per
ord
erO
rder
ing
cost
p
er y
ear
12,00 1,00 1,73 20,78
Table D.1: Ordering cost of Kleenex tissues in the current situation
1.2. Shortage cost
Central warehouse:
Exp
ecte
d sh
ort
age
per
re
ple
nis
hm
ent
cycl
e
Co
st p
eru
nit
sho
rt
Num
ber
of
cycl
es p
er y
ear
Exp
ecte
d an
nu
al
sho
rtag
e co
st
3,84 6,22 12,00 287,17
Table D.2: shortage costs in the current situation in the Cw of Kleenex tissues
Departments:
The high value of the expected
annual shortage in the
departments is due to two
reasons:
Firstly, the high lead time
demand and secondly, that the
holding cost in the
departments is always higher
than in the central warehouse
and one of the reasons is that the central warehouse is in the lowest floors where the square
meters’ price is cheaper.
Expe
cted
sh
orta
ge p
er
repl
enis
hmen
t cy
cle
Cos
t pe
runi
t sh
ort
Num
ber
of
cycl
es p
er y
ear
Expe
cted
an
nual
sh
orta
ge c
ost
0,70 25,89 48,00 872,24
Table D.3: Shortage costs in the current situation in depts. of Kleenex
tissues
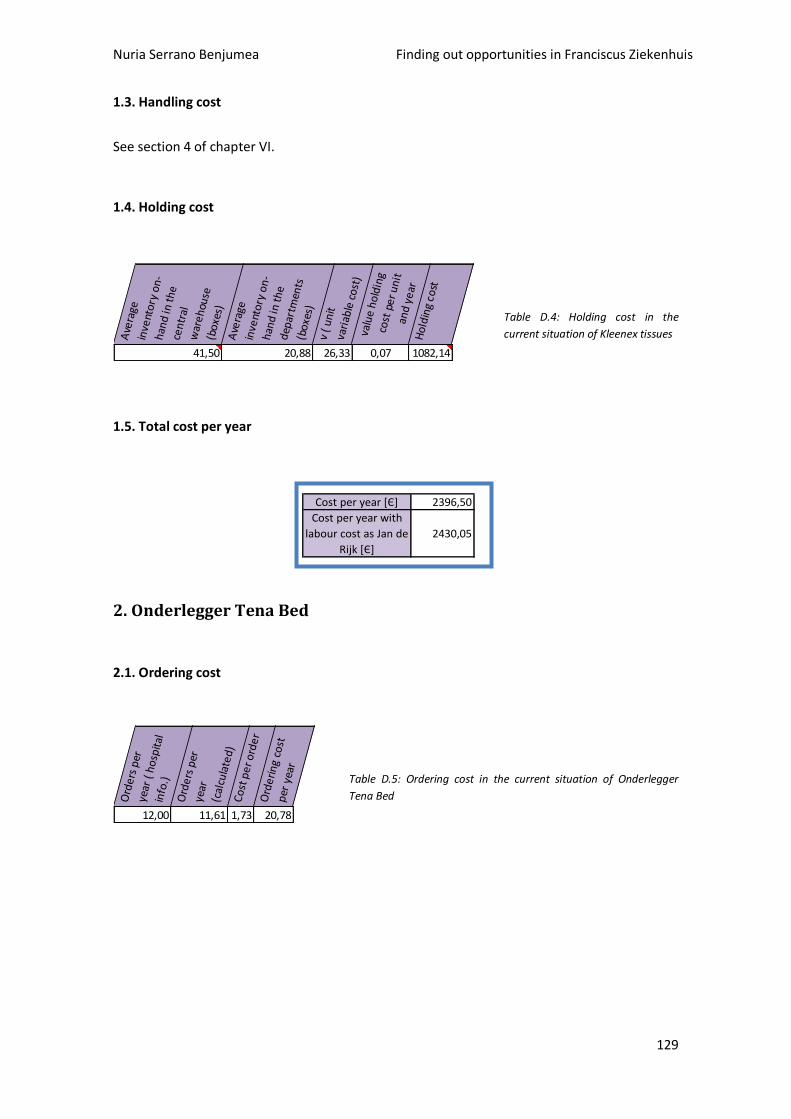
Nuria Serrano Benjumea Finding out opportunities in Franciscus Ziekenhuis
129
1.3. Handling cost
See section 4 of chapter VI.
1.4. Holding cost
Table D.4: Holding cost in the
current situation of Kleenex tissues
1.5. Total cost per year
Cost per year *Є+ 2396,50
Cost per year with
labour cost as Jan de
Rijk *Є+
2430,05
2. Onderlegger Tena Bed
2.1. Ordering cost
Table D.5: Ordering cost in the current situation of Onderlegger
Tena Bed
Ord
ers
per
ye
ar (
ho
spita
l in
fo.)
Ord
ers
per
ye
ar
(cal
cula
ted
)C
ost
pe
r ord
er
Ord
erin
g co
st
per
yea
r
12,00 11,61 1,73 20,78
Ave
rage
in
vent
ory
on-
hand
in th
e ce
ntra
l w
areh
ouse
(b
oxes
)A
vera
ge
inve
ntor
y on
-ha
nd in
the
depa
rtm
ents
(b
oxes
)v
( uni
t va
riab
le c
ost)
valu
e ho
ldin
g co
st p
er u
nit
and
year
Hol
ding
cos
t
41,50 20,88 26,33 0,07 1082,14
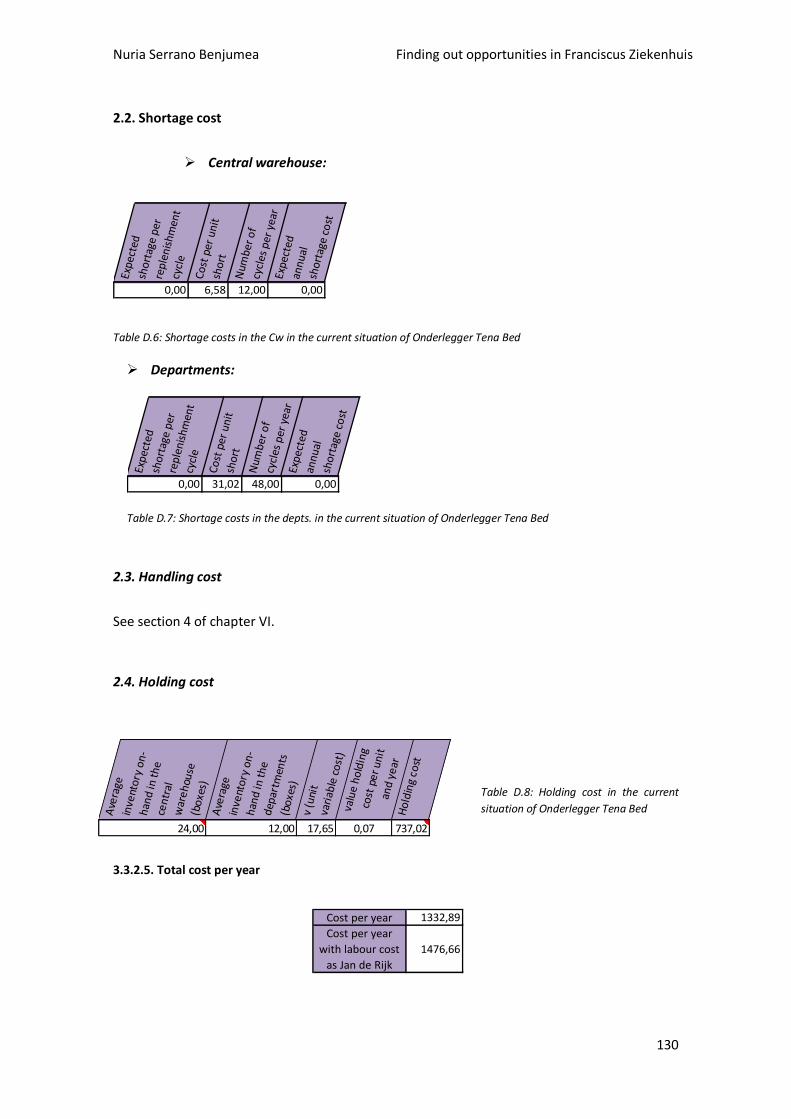
Nuria Serrano Benjumea Finding out opportunities in Franciscus Ziekenhuis
130
2.2. Shortage cost
Central warehouse:
Expe
cted
sh
orta
ge p
er
repl
enis
hmen
t cy
cle
Cost
per
uni
t sh
ort
Num
ber
of
cycl
es p
er y
ear
Expe
cted
an
nual
sh
orta
ge c
ost
0,00 6,58 12,00 0,00
Table D.6: Shortage costs in the Cw in the current situation of Onderlegger Tena Bed
Departments:
Expe
cted
sh
orta
ge p
er
repl
enis
hmen
t cy
cle
Cost
per
uni
t sh
ort
Num
ber
of
cycl
es p
er y
ear
Expe
cted
an
nual
sh
orta
ge c
ost
0,00 31,02 48,00 0,00
Table D.7: Shortage costs in the depts. in the current situation of Onderlegger Tena Bed
2.3. Handling cost
See section 4 of chapter VI.
2.4. Holding cost
Table D.8: Holding cost in the current
situation of Onderlegger Tena Bed
3.3.2.5. Total cost per year
Cost per year 1332,89
Cost per year
with labour cost
as Jan de Rijk
1476,66
Ave
rage
in
vent
ory
on
-h
and
in t
he
cen
tral
w
are
hou
se
(bo
xes)
Ave
rage
in
vent
ory
on
-h
and
in t
he
dep
artm
ents
(b
oxe
s)v
(uni
t va
riab
le c
ost
)va
lue
ho
ldin
g co
st p
er
un
it
and
ye
arH
old
ing
cost
24,00 12,00 17,65 0,07 737,02
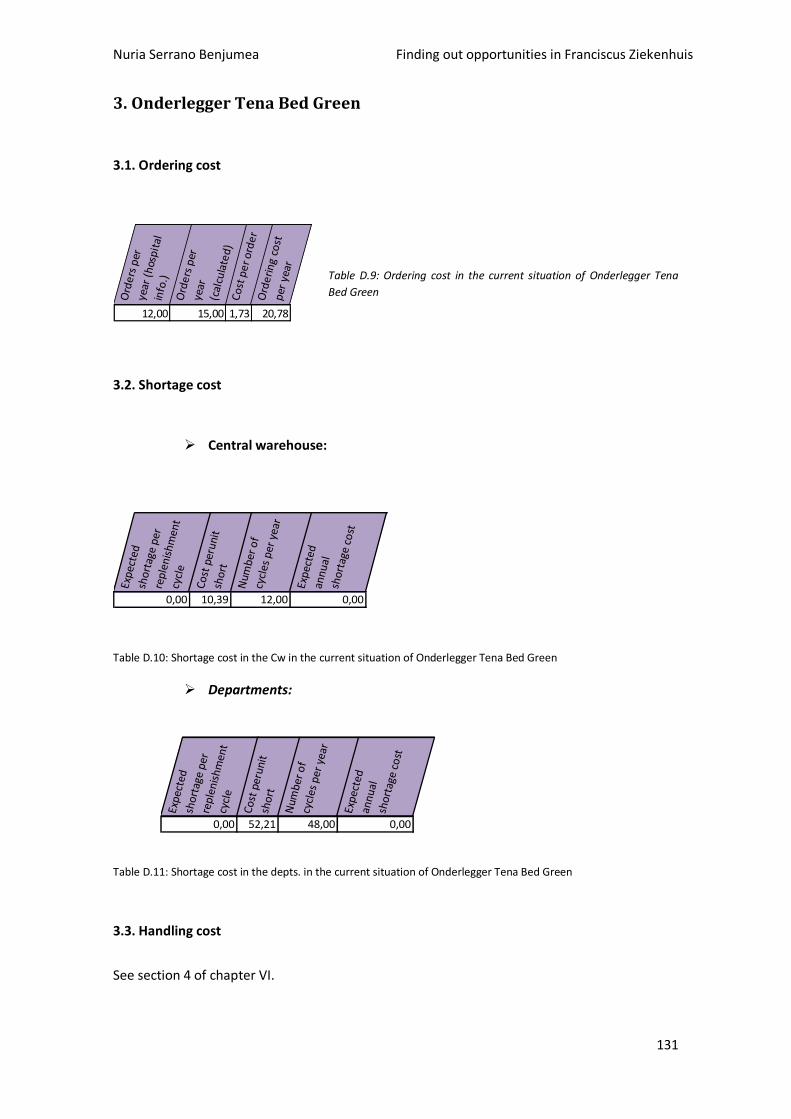
Nuria Serrano Benjumea Finding out opportunities in Franciscus Ziekenhuis
131
3. Onderlegger Tena Bed Green
3.1. Ordering cost
Table D.9: Ordering cost in the current situation of Onderlegger Tena
Bed Green
3.2. Shortage cost
Central warehouse:
Expe
cted
sh
orta
ge p
er
repl
enis
hmen
t cy
cle
Cost
per
unit
sh
ort
Num
ber
of
cycl
es p
er y
ear
Expe
cted
an
nual
sh
orta
ge c
ost
0,00 10,39 12,00 0,00
Table D.10: Shortage cost in the Cw in the current situation of Onderlegger Tena Bed Green
Departments:
Expe
cted
sh
orta
ge p
er
repl
enis
hmen
t cy
cle
Cost
per
unit
sh
ort
Num
ber
of
cycl
es p
er y
ear
Expe
cted
an
nual
sh
orta
ge c
ost
0,00 52,21 48,00 0,00
Table D.11: Shortage cost in the depts. in the current situation of Onderlegger Tena Bed Green
3.3. Handling cost
See section 4 of chapter VI.
Ord
ers
per
ye
ar (
hos
pit
al
info
.)
Ord
ers
per
ye
ar
(cal
cula
ted
)C
ost
pe
r o
rde
rO
rde
rin
g co
st
per
yea
r
12,00 15,00 1,73 20,78
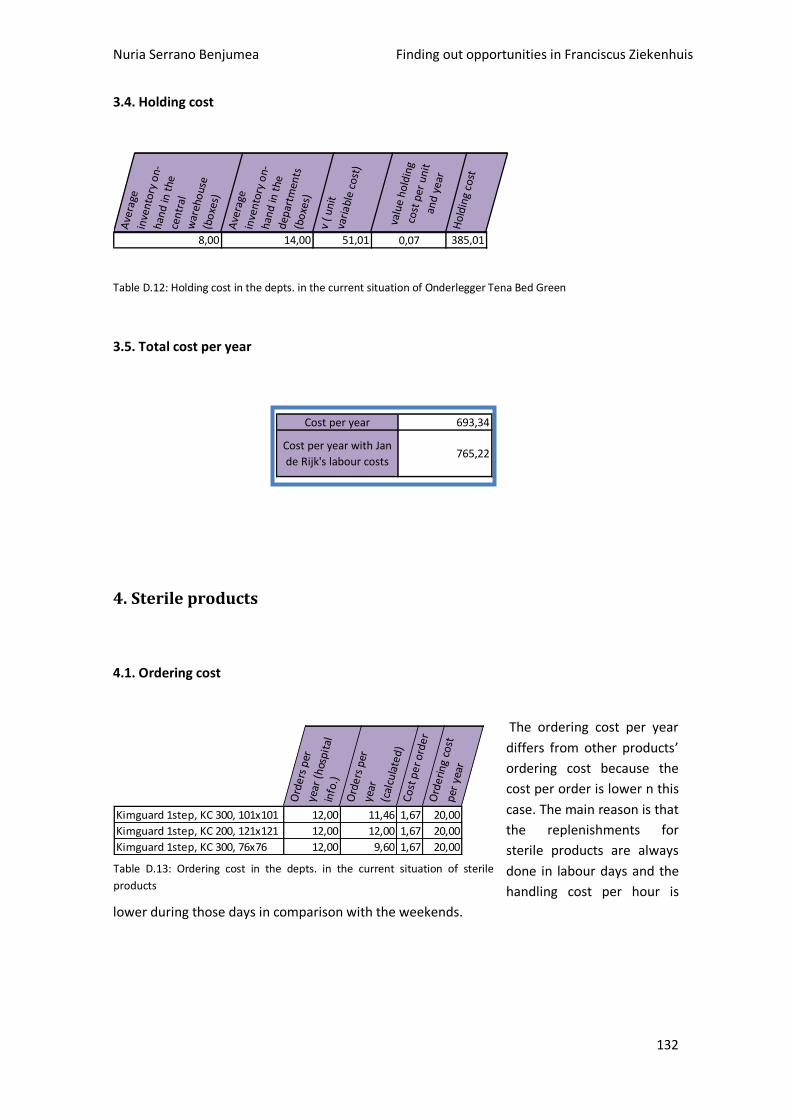
Nuria Serrano Benjumea Finding out opportunities in Franciscus Ziekenhuis
132
3.4. Holding cost
Ave
rage
in
ven
tory
on-
han
d in
the
ce
ntr
al
war
eho
use
(bo
xes)
Ave
rage
in
ven
tory
on-
han
d in
the
d
epar
tmen
ts
(bo
xes)
v (
un
it
vari
able
co
st)
valu
e h
old
ing
cost
per
un
it
and
yea
r
Ho
ldin
g co
st
8,00 14,00 51,01 0,07 385,01
Table D.12: Holding cost in the depts. in the current situation of Onderlegger Tena Bed Green
3.5. Total cost per year
Cost per year 693,34
Cost per year with Jan
de Rijk's labour costs765,22
4. Sterile products
4.1. Ordering cost
The ordering cost per year
differs from other products’
ordering cost because the
cost per order is lower n this
case. The main reason is that
the replenishments for
sterile products are always
done in labour days and the
handling cost per hour is
lower during those days in comparison with the weekends.
Ord
ers
per
ye
ar (
hos
pit
al
info
.)
Ord
ers
per
ye
ar
(cal
cula
ted
)C
ost
pe
r o
rde
rO
rde
rin
g co
st
per
yea
r
Kimguard 1step, KC 300, 101x101 12,00 11,46 1,67 20,00
Kimguard 1step, KC 200, 121x121 12,00 12,00 1,67 20,00
Kimguard 1step, KC 300, 76x76 12,00 9,60 1,67 20,00
Table D.13: Ordering cost in the depts. in the current situation of sterile
products
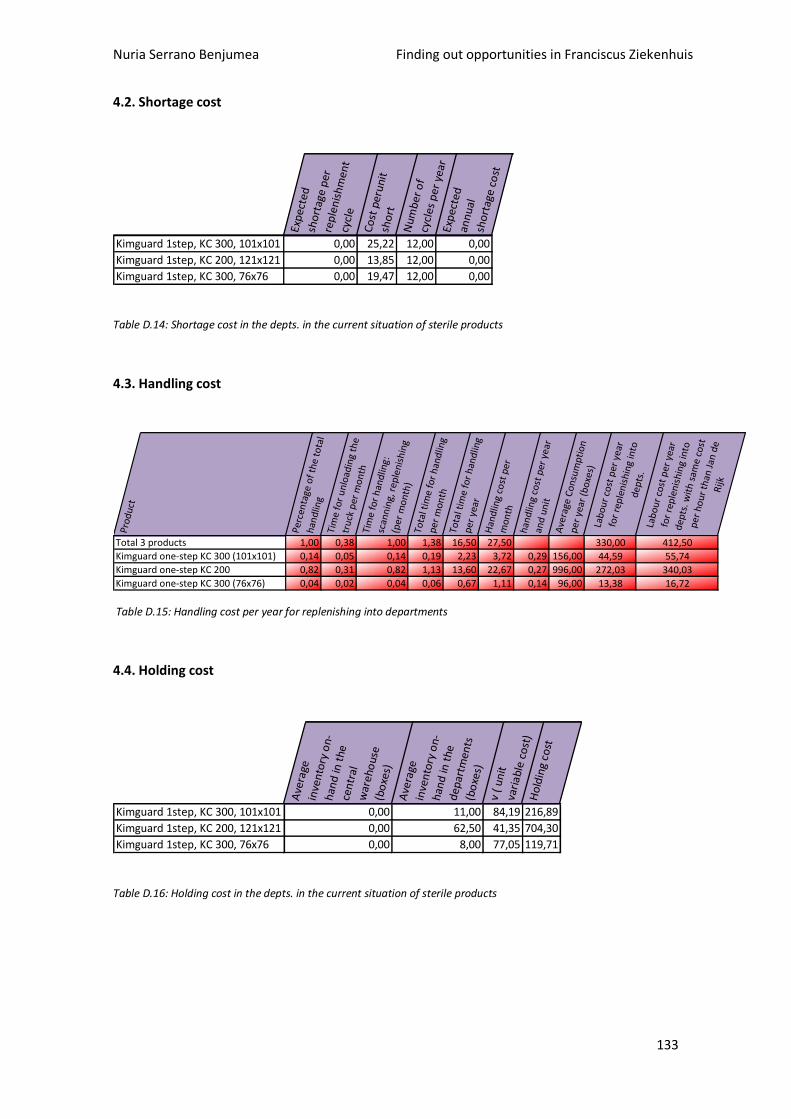
Nuria Serrano Benjumea Finding out opportunities in Franciscus Ziekenhuis
133
4.2. Shortage cost
Exp
ecte
d sh
ort
age
per
re
ple
nis
hm
ent
cycl
e
Co
st p
eru
nit
sho
rt
Num
ber
of
cycl
es p
er y
ear
Exp
ecte
d an
nu
al
sho
rtag
e co
st
Kimguard 1step, KC 300, 101x101 0,00 25,22 12,00 0,00
Kimguard 1step, KC 200, 121x121 0,00 13,85 12,00 0,00
Kimguard 1step, KC 300, 76x76 0,00 19,47 12,00 0,00
Table D.14: Shortage cost in the depts. in the current situation of sterile products
4.3. Handling cost
Pro
du
ct
Perc
enta
ge o
f th
e to
tal
han
dlin
gTi
me
for
un
load
ing
the
tru
ck p
er m
on
thTi
me
for
han
dlin
g:
scan
nin
g, r
eple
nis
hin
g (p
er m
on
th)
Tota
l tim
e fo
r h
and
ling
per
mon
thTo
tal t
ime
for
han
dlin
g p
er y
ear
Han
dlin
g co
st p
er
mo
nth
han
dlin
g co
st p
er y
ear
and
un
itA
vera
ge C
on
sum
pti
on
p
er y
ear
(bo
xes)
La
bo
ur
cost
per
yea
r fo
r re
ple
nis
hin
g in
to
dep
ts.
Lab
ou
r co
st p
er y
ear
for
rep
len
ish
ing
into
d
epts
. wit
h s
ame
cost
p
er h
ou
r th
an J
an d
e R
ijk
Total 3 products 1,00 0,38 1,00 1,38 16,50 27,50 330,00 412,50
Kimguard one-step KC 300 (101x101) 0,14 0,05 0,14 0,19 2,23 3,72 0,29 156,00 44,59 55,74
Kimguard one-step KC 200 0,82 0,31 0,82 1,13 13,60 22,67 0,27 996,00 272,03 340,03
Kimguard one-step KC 300 (76x76) 0,04 0,02 0,04 0,06 0,67 1,11 0,14 96,00 13,38 16,72
Table D.15: Handling cost per year for replenishing into departments
4.4. Holding cost
Ave
rage
in
ven
tory
on-
han
d in
the
ce
ntr
al
war
eho
use
(bo
xes)
Ave
rage
in
ven
tory
on-
han
d in
the
d
epar
tmen
ts
(bo
xes)
v (
un
it
vari
able
co
st)
Ho
ldin
g co
st
Kimguard 1step, KC 300, 101x101 0,00 11,00 84,19 216,89
Kimguard 1step, KC 200, 121x121 0,00 62,50 41,35 704,30
Kimguard 1step, KC 300, 76x76 0,00 8,00 77,05 119,71
Table D.16: Holding cost in the depts. in the current situation of sterile products
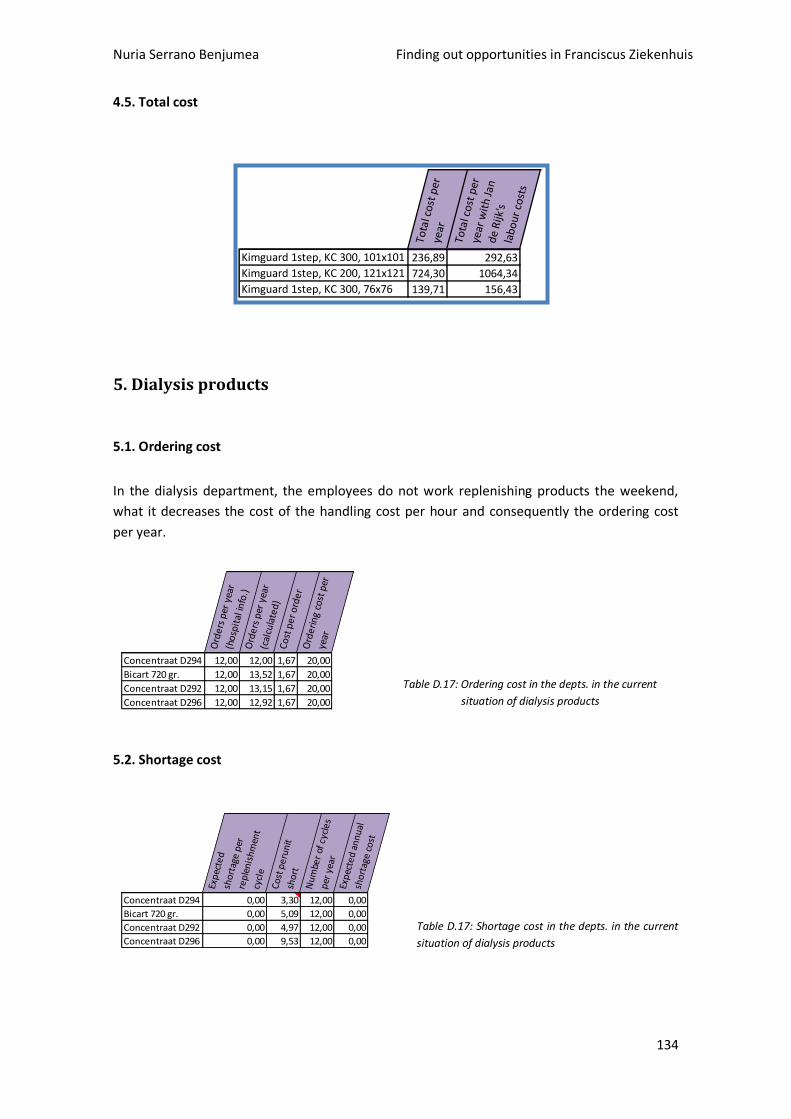
Nuria Serrano Benjumea Finding out opportunities in Franciscus Ziekenhuis
134
4.5. Total cost
Tota
l co
st p
er
year
Tota
l co
st p
er
year
wit
h J
an
de
Rijk
's
lab
ou
r co
sts
Kimguard 1step, KC 300, 101x101 236,89 292,63
Kimguard 1step, KC 200, 121x121 724,30 1064,34
Kimguard 1step, KC 300, 76x76 139,71 156,43
5. Dialysis products
5.1. Ordering cost
In the dialysis department, the employees do not work replenishing products the weekend,
what it decreases the cost of the handling cost per hour and consequently the ordering cost
per year.
Table D.17: Ordering cost in the depts. in the current
situation of dialysis products
5.2. Shortage cost
Table D.17: Shortage cost in the depts. in the current
situation of dialysis products
Ord
ers
per
year
(h
ospi
tal i
nfo.
)O
rder
s pe
r ye
ar
(cal
cula
ted)
Cost
per
ord
erO
rder
ing
cost
per
ye
ar
Concentraat D294 12,00 12,00 1,67 20,00
Bicart 720 gr. 12,00 13,52 1,67 20,00
Concentraat D292 12,00 13,15 1,67 20,00
Concentraat D296 12,00 12,92 1,67 20,00
Expe
cted
sh
orta
ge p
er
repl
enis
hmen
t cy
cle
Cost
per
unit
shor
t
Num
ber
of c
ycle
s pe
r ye
arEx
pect
ed a
nnua
l sh
orta
ge c
ost
Concentraat D294 0,00 3,30 12,00 0,00
Bicart 720 gr. 0,00 5,09 12,00 0,00
Concentraat D292 0,00 4,97 12,00 0,00
Concentraat D296 0,00 9,53 12,00 0,00
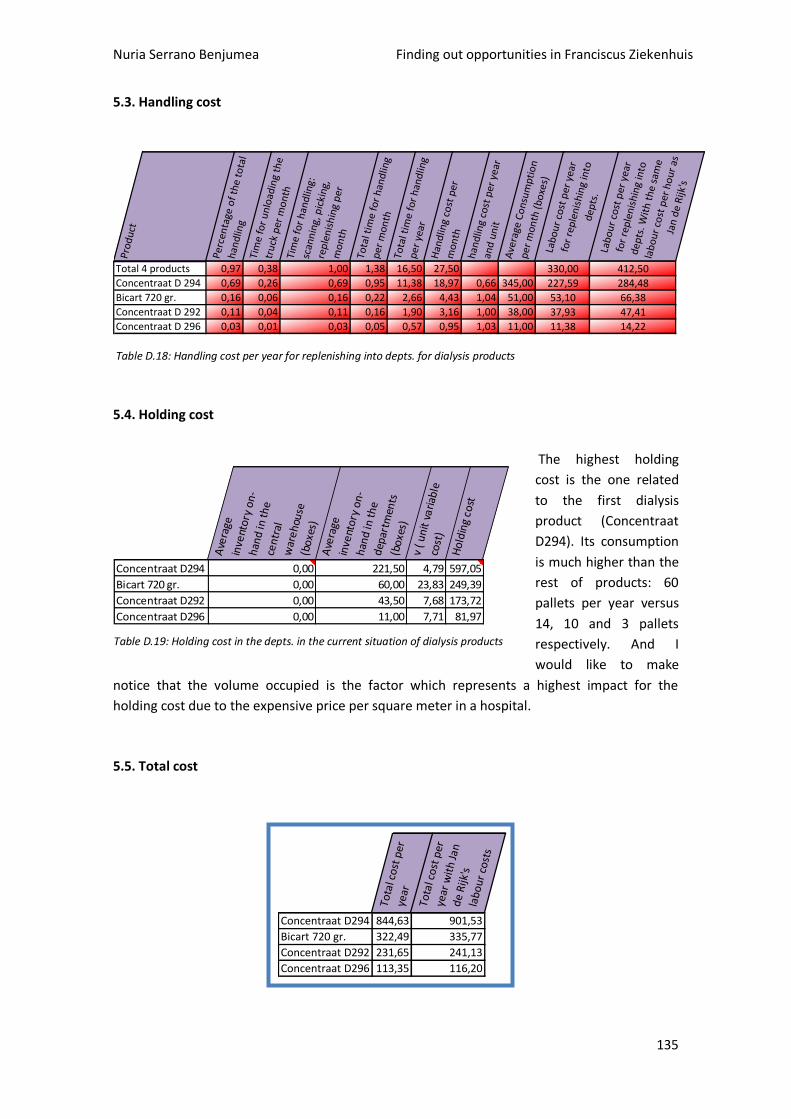
Nuria Serrano Benjumea Finding out opportunities in Franciscus Ziekenhuis
135
5.3. Handling cost
Pro
du
ct
Per
cen
tage
of
the
tota
l h
and
ling
Tim
e fo
r u
nlo
adin
g th
e tr
uck
per
mo
nth
Tim
e fo
r h
and
ling:
sc
ann
ing,
pic
kin
g,
rep
len
ish
ing
per
m
on
th
Tota
l tim
e fo
r h
and
ling
per
mo
nth
Tota
l tim
e fo
r h
and
ling
per
yea
rH
and
ling
cost
per
m
on
th
han
dlin
g co
st p
er y
ear
and
un
itA
vera
ge C
on
sum
pti
on
p
er m
on
th (
bo
xes)
La
bo
ur
cost
per
yea
r fo
r re
ple
nis
hin
g in
to
dep
ts.
Lab
ou
r co
st p
er y
ear
for
rep
len
ish
ing
into
d
epts
. Wit
h t
he
sam
e la
bo
ur
cost
per
ho
ur
as
Jan
de
Rijk
's
Total 4 products 0,97 0,38 1,00 1,38 16,50 27,50 330,00 412,50
Concentraat D 294 0,69 0,26 0,69 0,95 11,38 18,97 0,66 345,00 227,59 284,48
Bicart 720 gr. 0,16 0,06 0,16 0,22 2,66 4,43 1,04 51,00 53,10 66,38
Concentraat D 292 0,11 0,04 0,11 0,16 1,90 3,16 1,00 38,00 37,93 47,41
Concentraat D 296 0,03 0,01 0,03 0,05 0,57 0,95 1,03 11,00 11,38 14,22
Table D.18: Handling cost per year for replenishing into depts. for dialysis products
5.4. Holding cost
The highest holding
cost is the one related
to the first dialysis
product (Concentraat
D294). Its consumption
is much higher than the
rest of products: 60
pallets per year versus
14, 10 and 3 pallets
respectively. And I
would like to make
notice that the volume occupied is the factor which represents a highest impact for the
holding cost due to the expensive price per square meter in a hospital.
5.5. Total cost
Tota
l co
st p
er
year
Tota
l co
st p
er
year
wit
h J
an
de
Rijk
's
lab
ou
r co
sts
Concentraat D294 844,63 901,53
Bicart 720 gr. 322,49 335,77
Concentraat D292 231,65 241,13
Concentraat D296 113,35 116,20
Ave
rage
in
vent
ory
on-
hand
in t
he
cent
ral
war
ehou
se
(box
es)
Ave
rage
in
vent
ory
on-
hand
in t
he
depa
rtm
ents
(b
oxes
)v
( uni
t va
riab
le
cost
)
Hol
ding
cos
t
Concentraat D294 0,00 221,50 4,79 597,05
Bicart 720 gr. 0,00 60,00 23,83 249,39
Concentraat D292 0,00 43,50 7,68 173,72
Concentraat D296 0,00 11,00 7,71 81,97
Table D.19: Holding cost in the depts. in the current situation of dialysis products
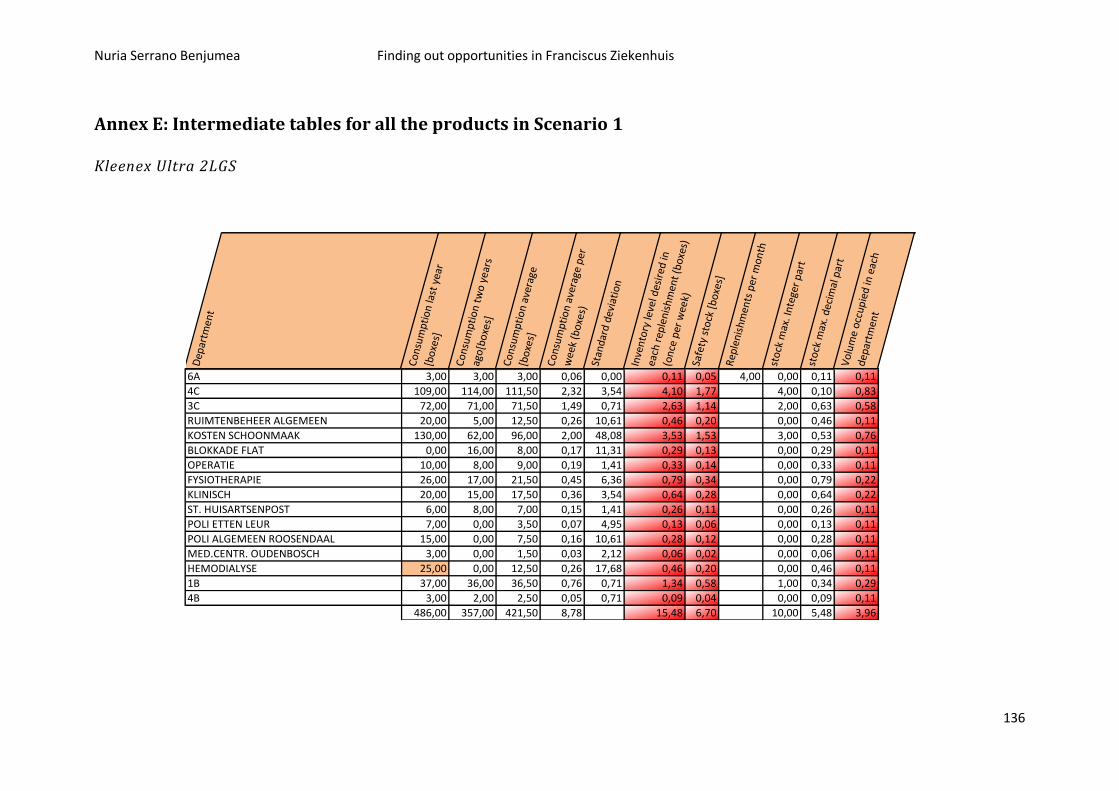
Nuria Serrano Benjumea Finding out opportunities in Franciscus Ziekenhuis
136
Annex E: Intermediate tables for all the products in Scenario 1
Kleenex Ultra 2LGS
Dep
artm
ent
Co
nsu
mpt
ion
last
yea
r [b
oxe
s]
Co
nsu
mpt
ion
two
year
s ag
o[b
oxe
s]
Co
nsu
mpt
ion
aver
age
[bo
xes]
Co
nsu
mpt
ion
aver
age
per
wee
k (b
oxe
s)St
anda
rd d
evia
tion
Inve
nto
ry le
vel d
esir
ed in
each
rep
leni
shm
ent
(box
es)
(on
ce p
er w
eek)
Safe
ty s
tock
[b
oxes
]R
eple
nish
men
ts p
er m
onth
sto
ck m
ax. I
nteg
er p
art
sto
ck m
ax. d
ecim
al p
art
Vol
um
e oc
cup
ied
in e
ach
depa
rtm
ent
6A 3,00 3,00 3,00 0,06 0,00 0,11 0,05 4,00 0,00 0,11 0,11
4C 109,00 114,00 111,50 2,32 3,54 4,10 1,77 4,00 0,10 0,83
3C 72,00 71,00 71,50 1,49 0,71 2,63 1,14 2,00 0,63 0,58
RUIMTENBEHEER ALGEMEEN 20,00 5,00 12,50 0,26 10,61 0,46 0,20 0,00 0,46 0,11
KOSTEN SCHOONMAAK 130,00 62,00 96,00 2,00 48,08 3,53 1,53 3,00 0,53 0,76
BLOKKADE FLAT 0,00 16,00 8,00 0,17 11,31 0,29 0,13 0,00 0,29 0,11
OPERATIE 10,00 8,00 9,00 0,19 1,41 0,33 0,14 0,00 0,33 0,11
FYSIOTHERAPIE 26,00 17,00 21,50 0,45 6,36 0,79 0,34 0,00 0,79 0,22
KLINISCH 20,00 15,00 17,50 0,36 3,54 0,64 0,28 0,00 0,64 0,22
ST. HUISARTSENPOST 6,00 8,00 7,00 0,15 1,41 0,26 0,11 0,00 0,26 0,11
POLI ETTEN LEUR 7,00 0,00 3,50 0,07 4,95 0,13 0,06 0,00 0,13 0,11
POLI ALGEMEEN ROOSENDAAL 15,00 0,00 7,50 0,16 10,61 0,28 0,12 0,00 0,28 0,11
MED.CENTR. OUDENBOSCH 3,00 0,00 1,50 0,03 2,12 0,06 0,02 0,00 0,06 0,11
HEMODIALYSE 25,00 0,00 12,50 0,26 17,68 0,46 0,20 0,00 0,46 0,11
1B 37,00 36,00 36,50 0,76 0,71 1,34 0,58 1,00 0,34 0,29
4B 3,00 2,00 2,50 0,05 0,71 0,09 0,04 0,00 0,09 0,11
486,00 357,00 421,50 8,78 15,48 6,70 10,00 5,48 3,96
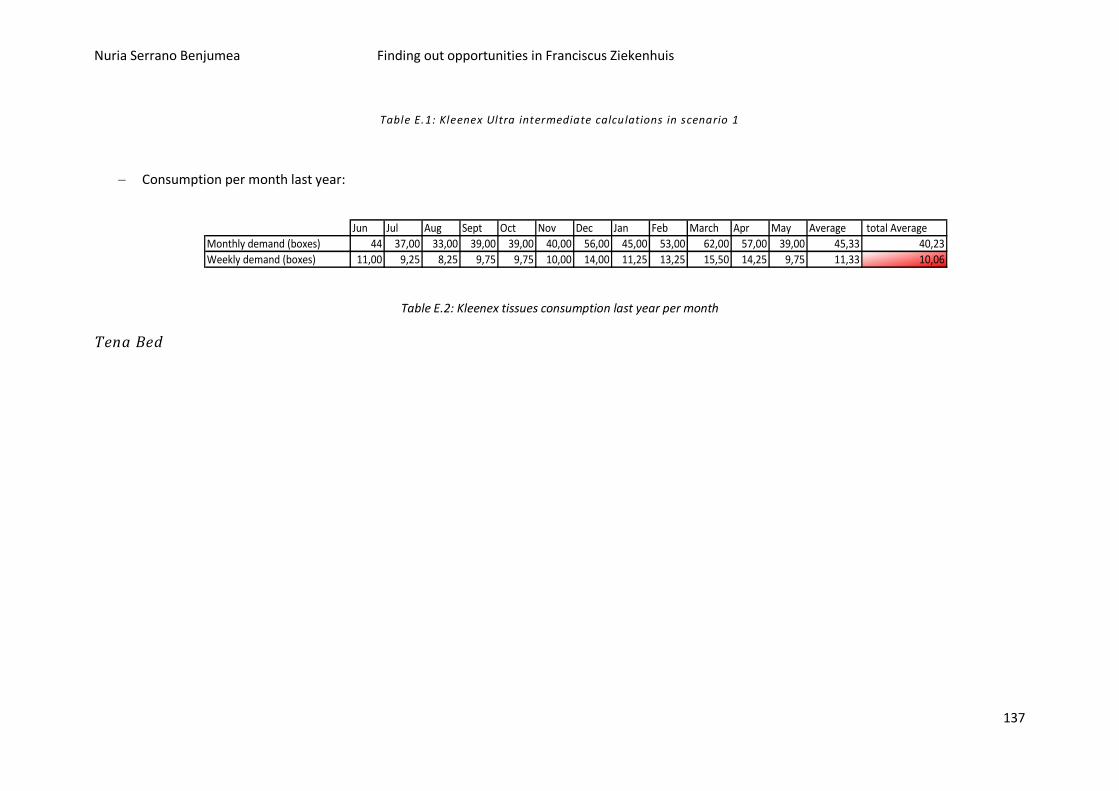
Nuria Serrano Benjumea Finding out opportunities in Franciscus Ziekenhuis
137
Table E.1: Kleenex Ultra intermediate calculations in scenario 1
Consumption per month last year:
Jun Jul Aug Sept Oct Nov Dec Jan Feb March Apr May Average total Average
Monthly demand (boxes) 44 37,00 33,00 39,00 39,00 40,00 56,00 45,00 53,00 62,00 57,00 39,00 45,33 40,23
Weekly demand (boxes) 11,00 9,25 8,25 9,75 9,75 10,00 14,00 11,25 13,25 15,50 14,25 9,75 11,33 10,06
Table E.2: Kleenex tissues consumption last year per month
Tena Bed
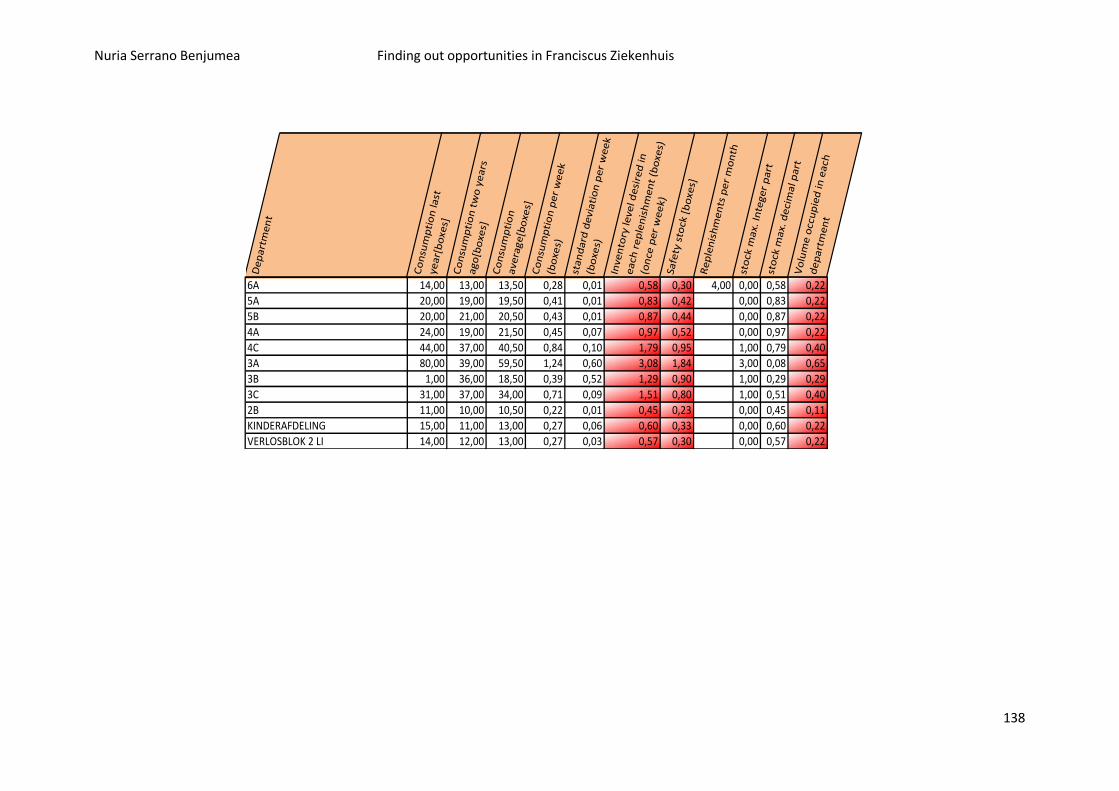
Nuria Serrano Benjumea Finding out opportunities in Franciscus Ziekenhuis
138
De
pa
rtm
en
t
Co
nsu
mp
tio
n la
st
yea
r[b
oxe
s]C
on
sum
pti
on
tw
o y
ea
rs
ago
[bo
xes]
Co
nsu
mp
tio
n
ave
rag
e[b
oxe
s]C
on
sum
pti
on
pe
r w
ee
k (b
oxe
s)
sta
nd
ard
de
via
tio
n p
er
we
ek
(bo
xes)
Inve
nto
ry le
vel d
esi
red
in
ea
ch r
ep
len
ish
me
nt
(bo
xes)
(on
ce p
er
we
ek)
Safe
ty s
tock
[b
oxe
s]R
ep
len
ish
me
nts
pe
r m
on
thst
ock
ma
x. I
nte
ger
pa
rtst
ock
ma
x. d
eci
ma
l pa
rtV
olu
me
occ
up
ied
in e
ach
de
pa
rtm
en
t
6A 14,00 13,00 13,50 0,28 0,01 0,58 0,30 4,00 0,00 0,58 0,22
5A 20,00 19,00 19,50 0,41 0,01 0,83 0,42 0,00 0,83 0,22
5B 20,00 21,00 20,50 0,43 0,01 0,87 0,44 0,00 0,87 0,22
4A 24,00 19,00 21,50 0,45 0,07 0,97 0,52 0,00 0,97 0,22
4C 44,00 37,00 40,50 0,84 0,10 1,79 0,95 1,00 0,79 0,40
3A 80,00 39,00 59,50 1,24 0,60 3,08 1,84 3,00 0,08 0,65
3B 1,00 36,00 18,50 0,39 0,52 1,29 0,90 1,00 0,29 0,29
3C 31,00 37,00 34,00 0,71 0,09 1,51 0,80 1,00 0,51 0,40
2B 11,00 10,00 10,50 0,22 0,01 0,45 0,23 0,00 0,45 0,11
KINDERAFDELING 15,00 11,00 13,00 0,27 0,06 0,60 0,33 0,00 0,60 0,22
VERLOSBLOK 2 LI 14,00 12,00 13,00 0,27 0,03 0,57 0,30 0,00 0,57 0,22
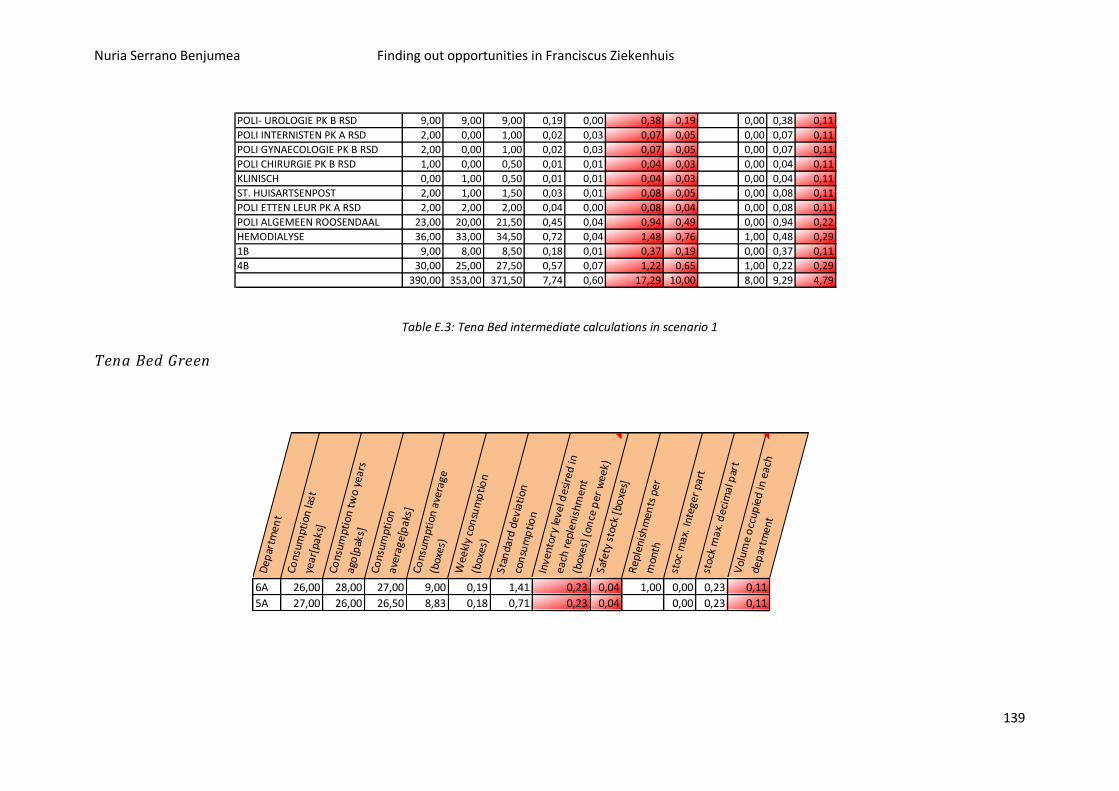
Nuria Serrano Benjumea Finding out opportunities in Franciscus Ziekenhuis
139
POLI- UROLOGIE PK B RSD 9,00 9,00 9,00 0,19 0,00 0,38 0,19 0,00 0,38 0,11
POLI INTERNISTEN PK A RSD 2,00 0,00 1,00 0,02 0,03 0,07 0,05 0,00 0,07 0,11
POLI GYNAECOLOGIE PK B RSD 2,00 0,00 1,00 0,02 0,03 0,07 0,05 0,00 0,07 0,11
POLI CHIRURGIE PK B RSD 1,00 0,00 0,50 0,01 0,01 0,04 0,03 0,00 0,04 0,11
KLINISCH 0,00 1,00 0,50 0,01 0,01 0,04 0,03 0,00 0,04 0,11
ST. HUISARTSENPOST 2,00 1,00 1,50 0,03 0,01 0,08 0,05 0,00 0,08 0,11
POLI ETTEN LEUR PK A RSD 2,00 2,00 2,00 0,04 0,00 0,08 0,04 0,00 0,08 0,11
POLI ALGEMEEN ROOSENDAAL 23,00 20,00 21,50 0,45 0,04 0,94 0,49 0,00 0,94 0,22
HEMODIALYSE 36,00 33,00 34,50 0,72 0,04 1,48 0,76 1,00 0,48 0,29
1B 9,00 8,00 8,50 0,18 0,01 0,37 0,19 0,00 0,37 0,11
4B 30,00 25,00 27,50 0,57 0,07 1,22 0,65 1,00 0,22 0,29
390,00 353,00 371,50 7,74 0,60 17,29 10,00 8,00 9,29 4,79
Table E.3: Tena Bed intermediate calculations in scenario 1
Tena Bed Green
Dep
artm
ent
Cons
umpt
ion
last
ye
ar[p
aks]
Cons
umpt
ion
two
year
s ag
o[p
aks]
Cons
umpt
ion
aver
age[
pak
s]Co
nsum
ptio
n av
erag
e (b
oxes
)
Wee
kly
con
sum
ptio
n (b
oxes
)
Stan
dard
dev
iati
on
con
sum
ptio
nIn
vent
ory
leve
l des
ired
in
each
rep
leni
shm
ent
(box
es) (
once
per
wee
k)Sa
fety
sto
ck [b
oxe
s]R
eple
nish
men
ts p
er
mon
th
stoc
max
. Int
eger
par
tst
ock
max
. dec
imal
par
tV
olum
e o
ccup
ied
in e
ach
dep
artm
ent
6A 26,00 28,00 27,00 9,00 0,19 1,41 0,23 0,04 1,00 0,00 0,23 0,11
5A 27,00 26,00 26,50 8,83 0,18 0,71 0,23 0,04 0,00 0,23 0,11
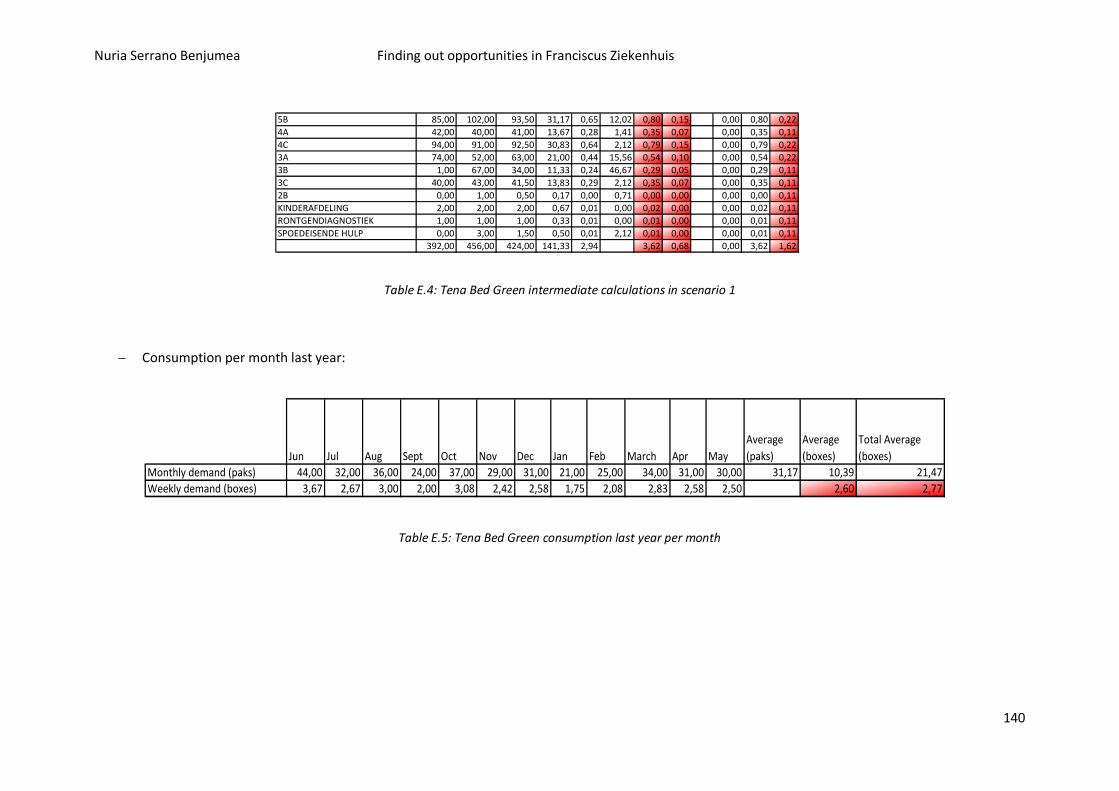
Nuria Serrano Benjumea Finding out opportunities in Franciscus Ziekenhuis
140
5B 85,00 102,00 93,50 31,17 0,65 12,02 0,80 0,15 0,00 0,80 0,22
4A 42,00 40,00 41,00 13,67 0,28 1,41 0,35 0,07 0,00 0,35 0,11
4C 94,00 91,00 92,50 30,83 0,64 2,12 0,79 0,15 0,00 0,79 0,22
3A 74,00 52,00 63,00 21,00 0,44 15,56 0,54 0,10 0,00 0,54 0,22
3B 1,00 67,00 34,00 11,33 0,24 46,67 0,29 0,05 0,00 0,29 0,11
3C 40,00 43,00 41,50 13,83 0,29 2,12 0,35 0,07 0,00 0,35 0,11
2B 0,00 1,00 0,50 0,17 0,00 0,71 0,00 0,00 0,00 0,00 0,11
KINDERAFDELING 2,00 2,00 2,00 0,67 0,01 0,00 0,02 0,00 0,00 0,02 0,11
RONTGENDIAGNOSTIEK 1,00 1,00 1,00 0,33 0,01 0,00 0,01 0,00 0,00 0,01 0,11
SPOEDEISENDE HULP 0,00 3,00 1,50 0,50 0,01 2,12 0,01 0,00 0,00 0,01 0,11
392,00 456,00 424,00 141,33 2,94 3,62 0,68 0,00 3,62 1,62
Table E.4: Tena Bed Green intermediate calculations in scenario 1
Consumption per month last year:
Jun Jul Aug Sept Oct Nov Dec Jan Feb March Apr May
Average
(paks)
Average
(boxes)
Total Average
(boxes)
Monthly demand (paks) 44,00 32,00 36,00 24,00 37,00 29,00 31,00 21,00 25,00 34,00 31,00 30,00 31,17 10,39 21,47
Weekly demand (boxes) 3,67 2,67 3,00 2,00 3,08 2,42 2,58 1,75 2,08 2,83 2,58 2,50 2,60 2,77
Table E.5: Tena Bed Green consumption last year per month
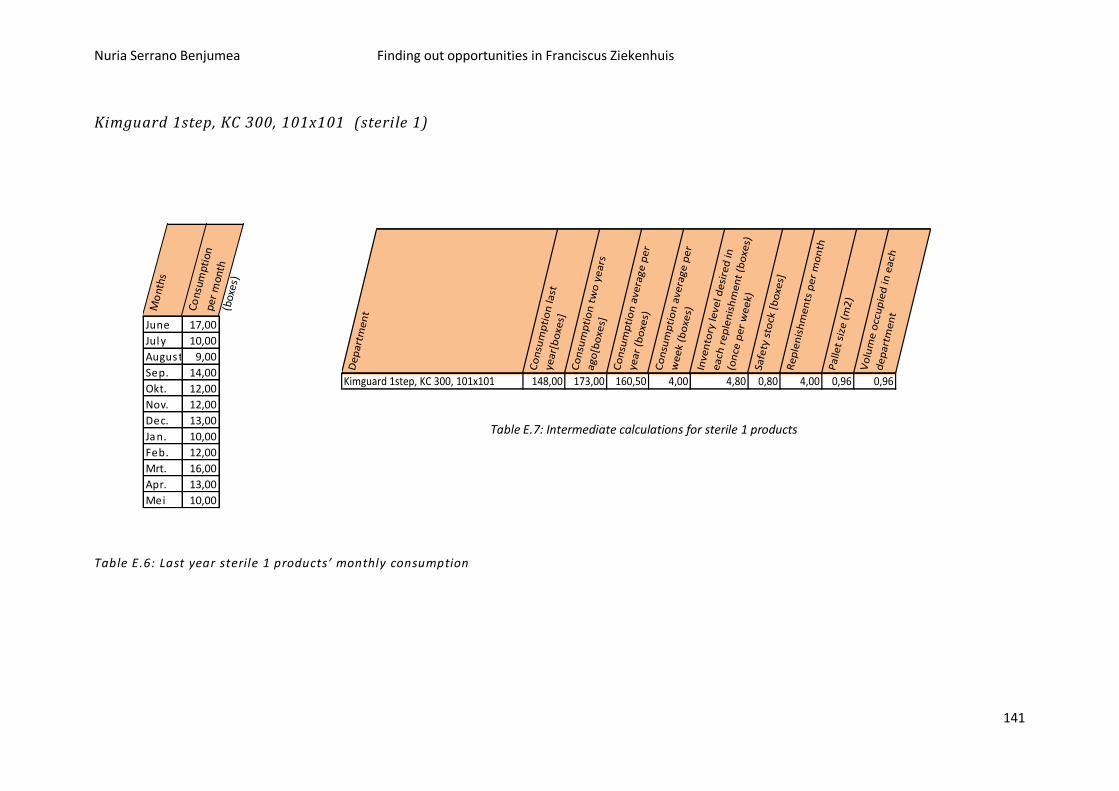
Nuria Serrano Benjumea Finding out opportunities in Franciscus Ziekenhuis
141
Kimguard 1step, KC 300, 101x101 (sterile 1)
De
pa
rtm
en
t
Co
nsu
mp
tio
n la
st
yea
r[b
oxe
s]C
on
sum
pti
on
tw
o y
ea
rs
ago
[bo
xes]
Co
nsu
mp
tio
n a
vera
ge
pe
r
yea
r (b
oxe
s)C
on
sum
pti
on
ave
rag
e p
er
we
ek
(bo
xes)
Inve
nto
ry le
vel d
esi
red
in
ea
ch r
ep
len
ish
me
nt
(bo
xes)
(on
ce p
er
we
ek)
Safe
ty s
tock
[b
oxe
s]R
ep
len
ish
me
nts
pe
r m
on
thP
alle
t si
ze (
m2
)
Vo
lum
e o
ccu
pie
d in
ea
ch
de
pa
rtm
en
t
Kimguard 1step, KC 300, 101x101 148,00 173,00 160,50 4,00 4,80 0,80 4,00 0,96 0,96
Table E.7: Intermediate calculations for sterile 1 products
Table E.6: Last year sterile 1 products’ monthly consumption
Mo
nths
Cons
umpt
ion
per
mon
th
(box
es)
June 17,00
July 10,00
August 9,00
Sep. 14,00
Okt. 12,00
Nov. 12,00
Dec. 13,00
Jan. 10,00
Feb. 12,00
Mrt. 16,00
Apr. 13,00
Mei 10,00
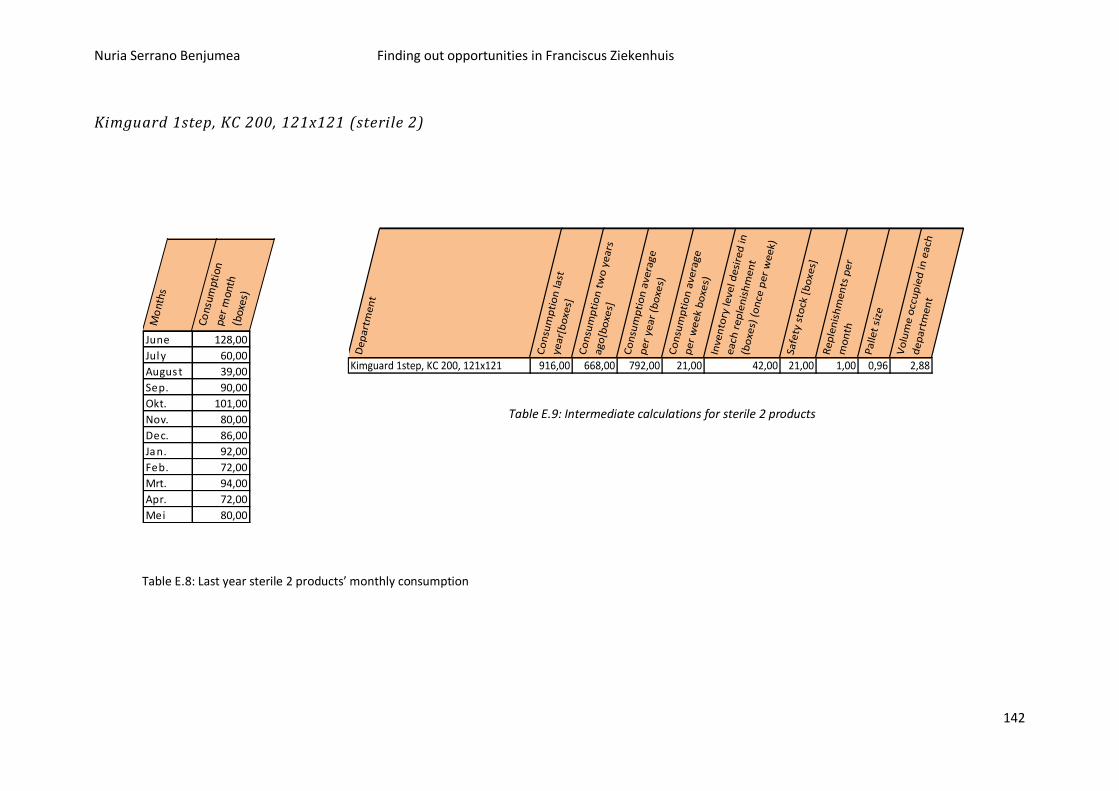
Nuria Serrano Benjumea Finding out opportunities in Franciscus Ziekenhuis
142
Kimguard 1step, KC 200, 121x121 (sterile 2)
De
par
tme
nt
Co
nsu
mp
tio
n la
st
year
[bo
xes]
Co
nsu
mp
tio
n t
wo
ye
ars
ago
[bo
xes]
Co
nsu
mp
tio
n a
vera
ge
pe
r ye
ar (
bo
xes)
Co
nsu
mp
tio
n a
vera
ge
pe
r w
ee
k b
oxe
s)In
ven
tory
leve
l de
sire
d in
eac
h r
ep
len
ish
me
nt
(bo
xes)
(o
nce
pe
r w
ee
k)
Safe
ty s
tock
[b
oxe
s]R
ep
len
ish
me
nts
pe
r m
on
th
Pa
llet
size
Vo
lum
e o
ccu
pie
d in
eac
h
de
par
tme
nt
Kimguard 1step, KC 200, 121x121 916,00 668,00 792,00 21,00 42,00 21,00 1,00 0,96 2,88
Table E.9: Intermediate calculations for sterile 2 products
Table E.8: Last year sterile 2 products’ monthly consumption
Mo
nths
Cons
umpt
ion
per
mon
th
(box
es)
June 128,00
July 60,00
August 39,00
Sep. 90,00
Okt. 101,00
Nov. 80,00
Dec. 86,00
Jan. 92,00
Feb. 72,00
Mrt. 94,00
Apr. 72,00
Mei 80,00
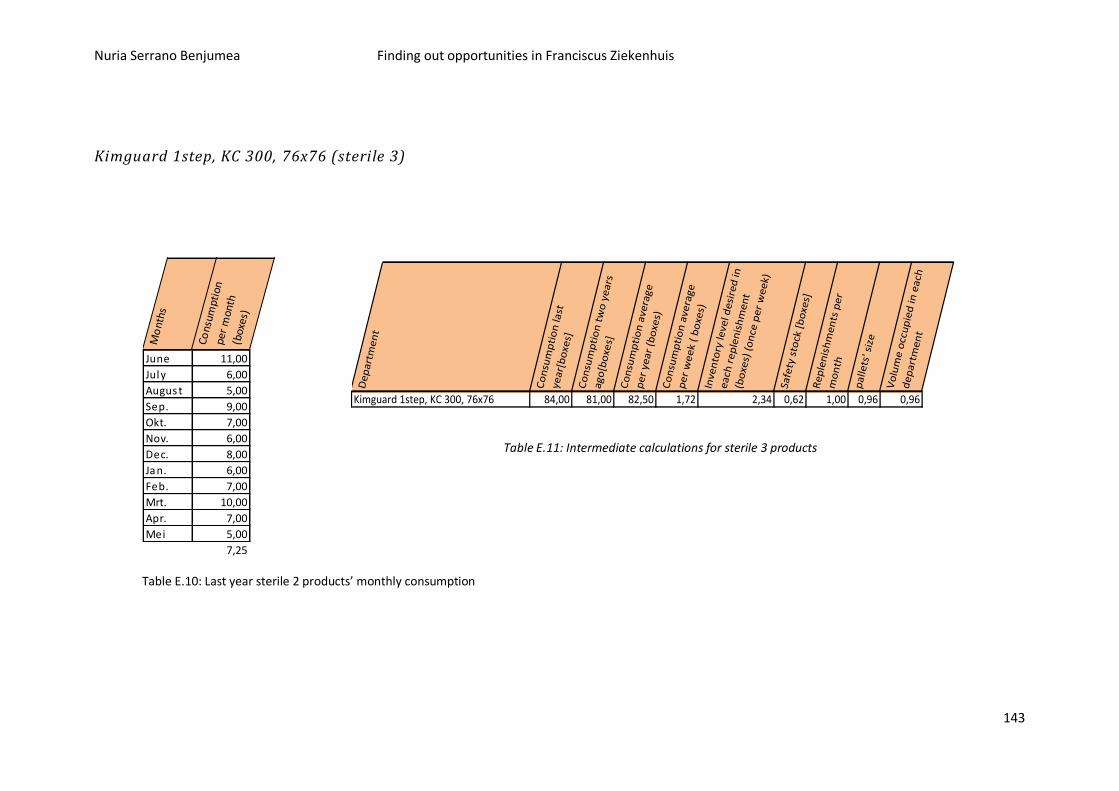
Nuria Serrano Benjumea Finding out opportunities in Franciscus Ziekenhuis
143
Kimguard 1step, KC 300, 76x76 (sterile 3)
De
par
tme
nt
Co
nsu
mp
tio
n la
st
year
[bo
xes]
Co
nsu
mp
tio
n t
wo
ye
ars
ago
[bo
xes]
Co
nsu
mp
tio
n a
vera
ge
pe
r ye
ar (
bo
xes)
Co
nsu
mp
tio
n a
vera
ge
pe
r w
ee
k (
bo
xes)
Inve
nto
ry le
vel d
esi
red
in
eac
h r
ep
len
ish
me
nt
(bo
xes)
(o
nce
pe
r w
ee
k)
Safe
ty s
tock
[b
oxe
s]R
ep
len
ish
me
nts
pe
r m
on
th
pal
lets
' siz
e
Vo
lum
e o
ccu
pie
d in
eac
h
de
par
tme
nt
Kimguard 1step, KC 300, 76x76 84,00 81,00 82,50 1,72 2,34 0,62 1,00 0,96 0,96
Table E.11: Intermediate calculations for sterile 3 products
Table E.10: Last year sterile 2 products’ monthly consumption
Mo
nths
Cons
umpt
ion
per
mon
th
(box
es)
June 11,00
July 6,00
August 5,00
Sep. 9,00
Okt. 7,00
Nov. 6,00
Dec. 8,00
Jan. 6,00
Feb. 7,00
Mrt. 10,00
Apr. 7,00
Mei 5,00
7,25
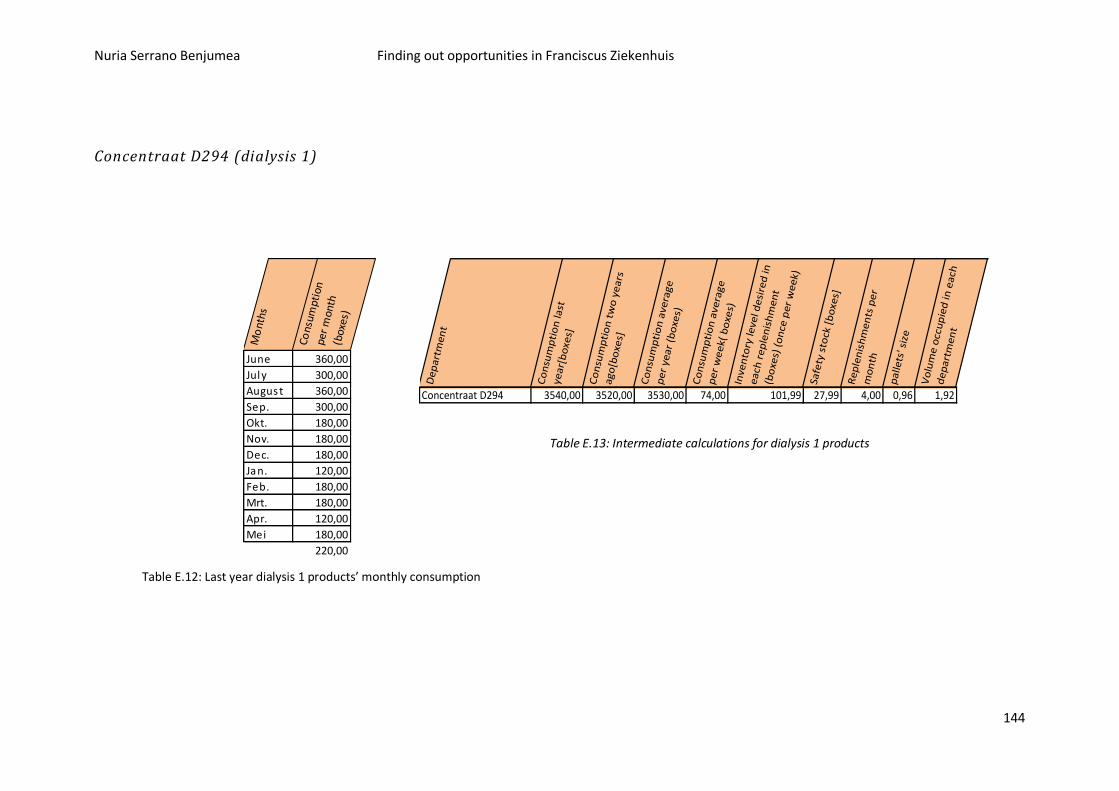
Nuria Serrano Benjumea Finding out opportunities in Franciscus Ziekenhuis
144
Concentraat D294 (dialysis 1)
De
pa
rtm
en
t
Co
nsu
mp
tio
n la
st
yea
r[b
oxe
s]
Co
nsu
mp
tio
n t
wo
ye
ars
a
go[b
oxe
s]
Co
nsu
mp
tio
n a
vera
ge
pe
r ye
ar
(bo
xes)
Co
nsu
mp
tio
n a
vera
ge
pe
r w
ee
k( b
oxe
s)In
ven
tory
leve
l de
sire
d in
ea
ch r
ep
len
ish
me
nt
(bo
xes)
(o
nce
pe
r w
ee
k)
Safe
ty s
tock
[b
oxe
s]
Re
ple
nis
hm
en
ts p
er
mo
nth
pa
llets
' siz
e
Vo
lum
e o
ccu
pie
d in
ea
ch
de
pa
rtm
en
t
Concentraat D294 3540,00 3520,00 3530,00 74,00 101,99 27,99 4,00 0,96 1,92
Table E.13: Intermediate calculations for dialysis 1 products
Table E.12: Last year dialysis 1 products’ monthly consumption
Mo
nths
Cons
umpt
ion
per
mon
th
(box
es)
June 360,00
July 300,00
August 360,00
Sep. 300,00
Okt. 180,00
Nov. 180,00
Dec. 180,00
Jan. 120,00
Feb. 180,00
Mrt. 180,00
Apr. 120,00
Mei 180,00
220,00
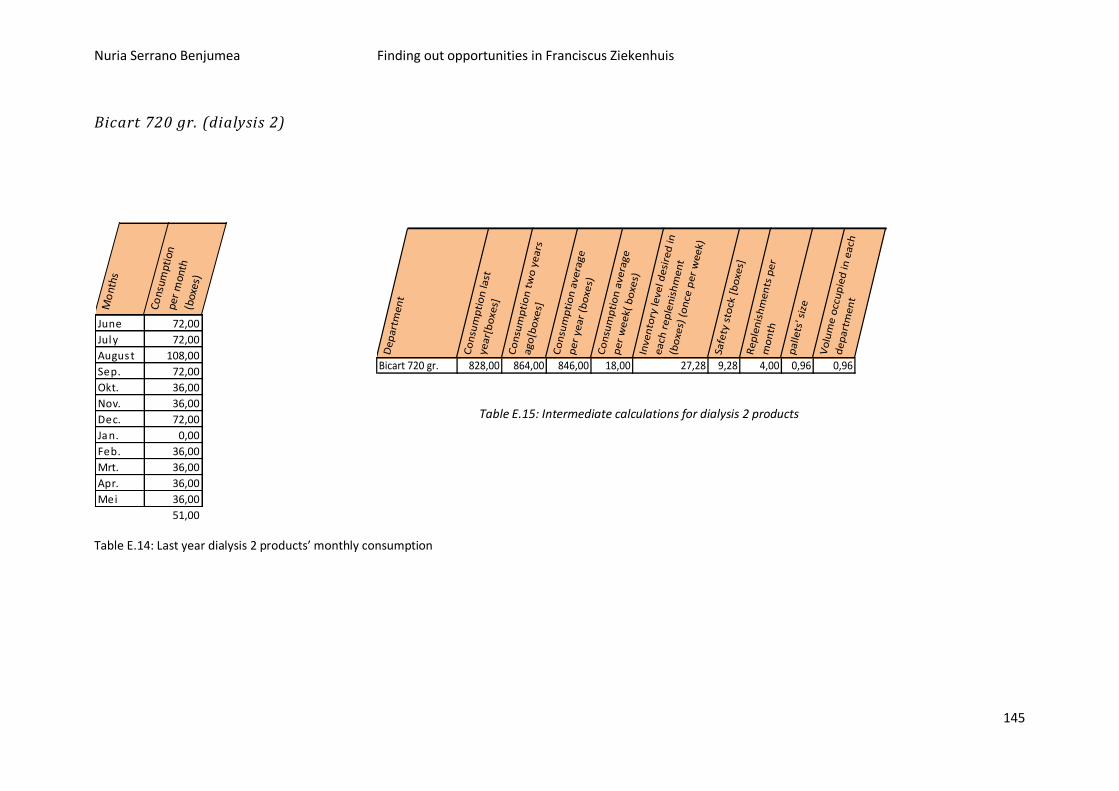
Nuria Serrano Benjumea Finding out opportunities in Franciscus Ziekenhuis
145
Bicart 720 gr. (dialysis 2)
De
pa
rtm
en
t
Co
nsu
mp
tio
n la
st
yea
r[b
oxe
s]
Co
nsu
mp
tio
n t
wo
ye
ars
a
go[b
oxe
s]
Co
nsu
mp
tio
n a
vera
ge
p
er
yea
r (b
oxe
s)C
on
sum
pti
on
ave
rag
e
pe
r w
ee
k( b
oxe
s)In
ven
tory
leve
l de
sire
d in
ea
ch r
ep
len
ish
me
nt
(bo
xes)
(o
nce
pe
r w
ee
k)
Safe
ty s
tock
[b
oxe
s]R
ep
len
ish
me
nts
pe
r m
on
th
pa
llets
' siz
e
Vo
lum
e o
ccu
pie
d in
ea
ch
de
pa
rtm
en
t
Bicart 720 gr. 828,00 864,00 846,00 18,00 27,28 9,28 4,00 0,96 0,96
Table E.15: Intermediate calculations for dialysis 2 products
Table E.14: Last year dialysis 2 products’ monthly consumption
Mo
nths
Cons
umpt
ion
per
mon
th
(box
es)
June 72,00
July 72,00
August 108,00
Sep. 72,00
Okt. 36,00
Nov. 36,00
Dec. 72,00
Jan. 0,00
Feb. 36,00
Mrt. 36,00
Apr. 36,00
Mei 36,00
51,00
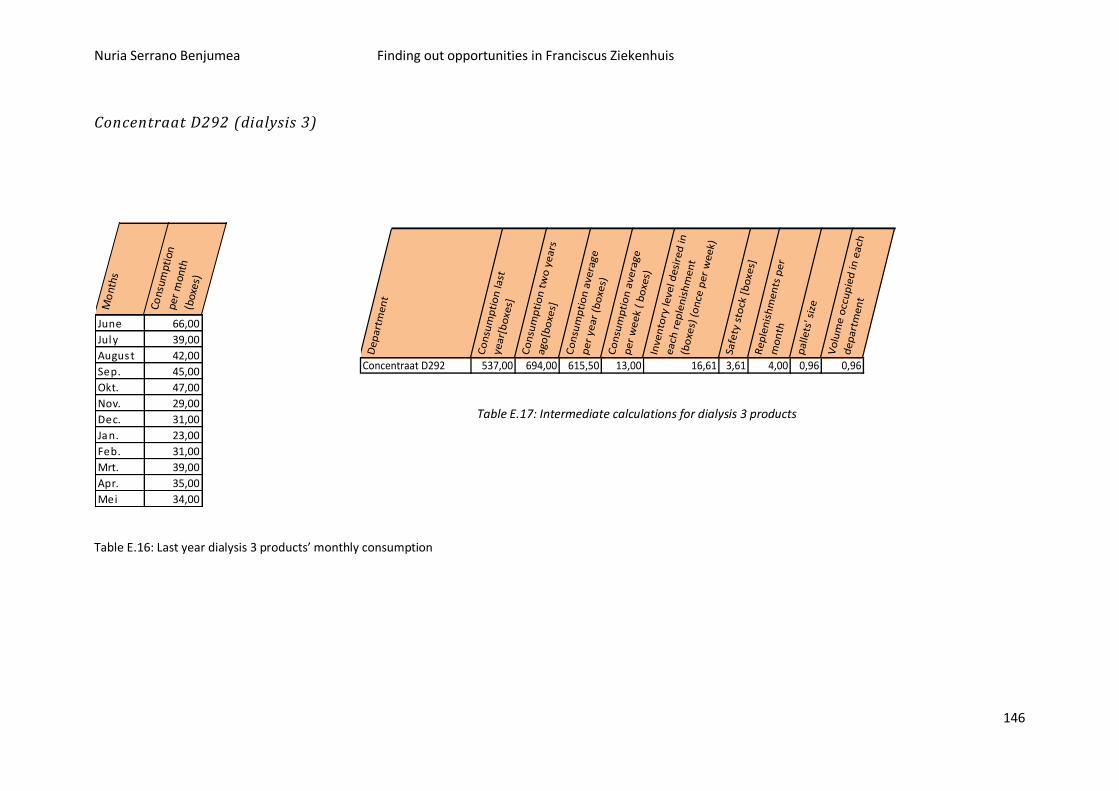
Nuria Serrano Benjumea Finding out opportunities in Franciscus Ziekenhuis
146
Concentraat D292 (dialysis 3)
De
par
tme
nt
Co
nsu
mp
tio
n la
st
year
[bo
xes]
Co
nsu
mp
tio
n t
wo
ye
ars
ago
[bo
xes]
Co
nsu
mp
tio
n a
vera
ge
pe
r ye
ar (
bo
xes)
Co
nsu
mp
tio
n a
vera
ge
pe
r w
ee
k (
bo
xes)
Inve
nto
ry le
vel d
esi
red
in
eac
h r
ep
len
ish
me
nt
(bo
xes)
(o
nce
pe
r w
ee
k)
Safe
ty s
tock
[b
oxe
s]R
ep
len
ish
me
nts
pe
r m
on
th
pal
lets
' siz
e
Vo
lum
e o
ccu
pie
d in
eac
h
de
par
tme
nt
Concentraat D292 537,00 694,00 615,50 13,00 16,61 3,61 4,00 0,96 0,96
Table E.17: Intermediate calculations for dialysis 3 products
Table E.16: Last year dialysis 3 products’ monthly consumption
Mo
nths
Cons
umpt
ion
per
mon
th
(box
es)
June 66,00
July 39,00
August 42,00
Sep. 45,00
Okt. 47,00
Nov. 29,00
Dec. 31,00
Jan. 23,00
Feb. 31,00
Mrt. 39,00
Apr. 35,00
Mei 34,00
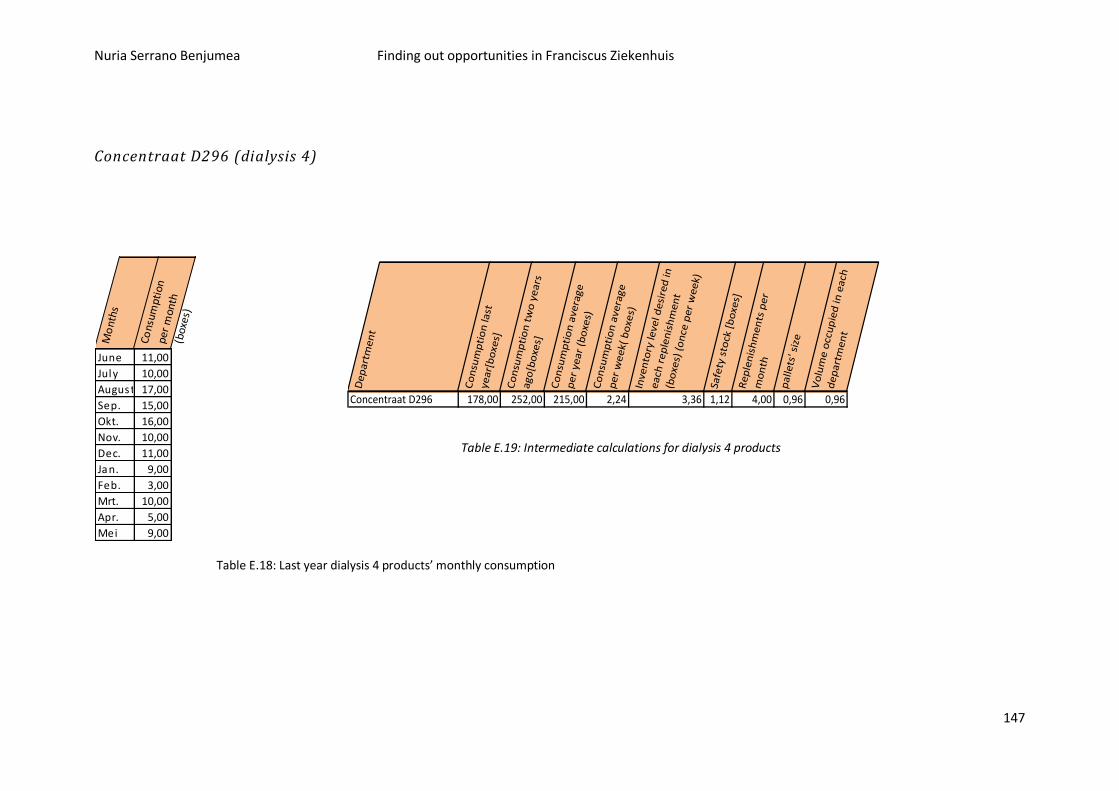
Nuria Serrano Benjumea Finding out opportunities in Franciscus Ziekenhuis
147
Concentraat D296 (dialysis 4)
De
par
tme
nt
Co
nsu
mp
tio
n la
st
year
[bo
xes]
Co
nsu
mp
tio
n t
wo
ye
ars
ago
[bo
xes]
Co
nsu
mp
tio
n a
vera
ge
pe
r ye
ar (
bo
xes)
Co
nsu
mp
tio
n a
vera
ge
pe
r w
ee
k( b
oxe
s)In
ven
tory
leve
l de
sire
d in
eac
h r
ep
len
ish
me
nt
(bo
xes)
(o
nce
pe
r w
ee
k)
Safe
ty s
tock
[b
oxe
s]R
ep
len
ish
me
nts
pe
r m
on
th
pal
lets
' siz
e
Vo
lum
e o
ccu
pie
d in
eac
h
de
par
tme
nt
Concentraat D296 178,00 252,00 215,00 2,24 3,36 1,12 4,00 0,96 0,96
Table E.19: Intermediate calculations for dialysis 4 products
Table E.18: Last year dialysis 4 products’ monthly consumption
Mo
nths
Cons
umpt
ion
per
mon
th
(box
es)
June 11,00
July 10,00
August 17,00
Sep. 15,00
Okt. 16,00
Nov. 10,00
Dec. 11,00
Jan. 9,00
Feb. 3,00
Mrt. 10,00
Apr. 5,00
Mei 9,00
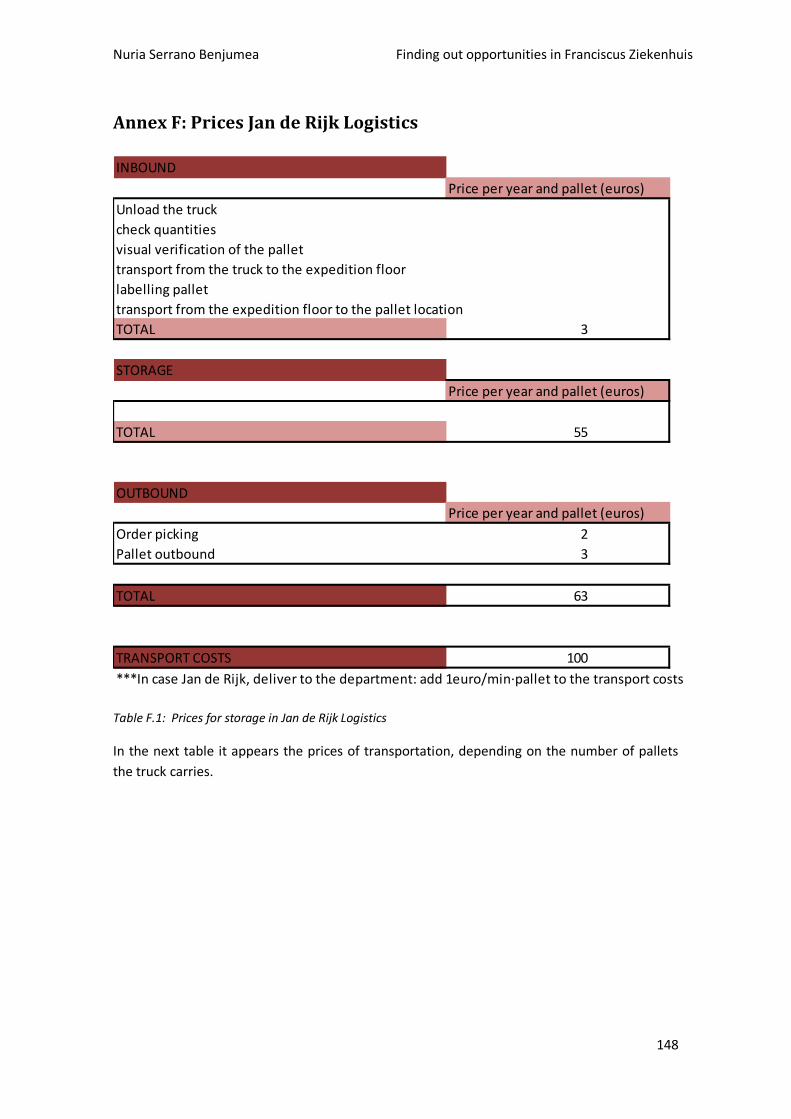
Nuria Serrano Benjumea Finding out opportunities in Franciscus Ziekenhuis
148
Annex F: Prices Jan de Rijk Logistics
INBOUND
Price per year and pallet (euros)
Unload the truck
check quantities
visual verification of the pallet
transport from the truck to the expedition floor
labelling pallet
transport from the expedition floor to the pallet location
TOTAL 3
STORAGE
Price per year and pallet (euros)
TOTAL 55
OUTBOUND
Price per year and pallet (euros)
Order picking 2
Pallet outbound 3
TOTAL 63
TRANSPORT COSTS 100
***In case Jan de Rijk, deliver to the department: add 1euro/min·pallet to the transport costs
Table F.1: Prices for storage in Jan de Rijk Logistics
In the next table it appears the prices of transportation, depending on the number of pallets
the truck carries.
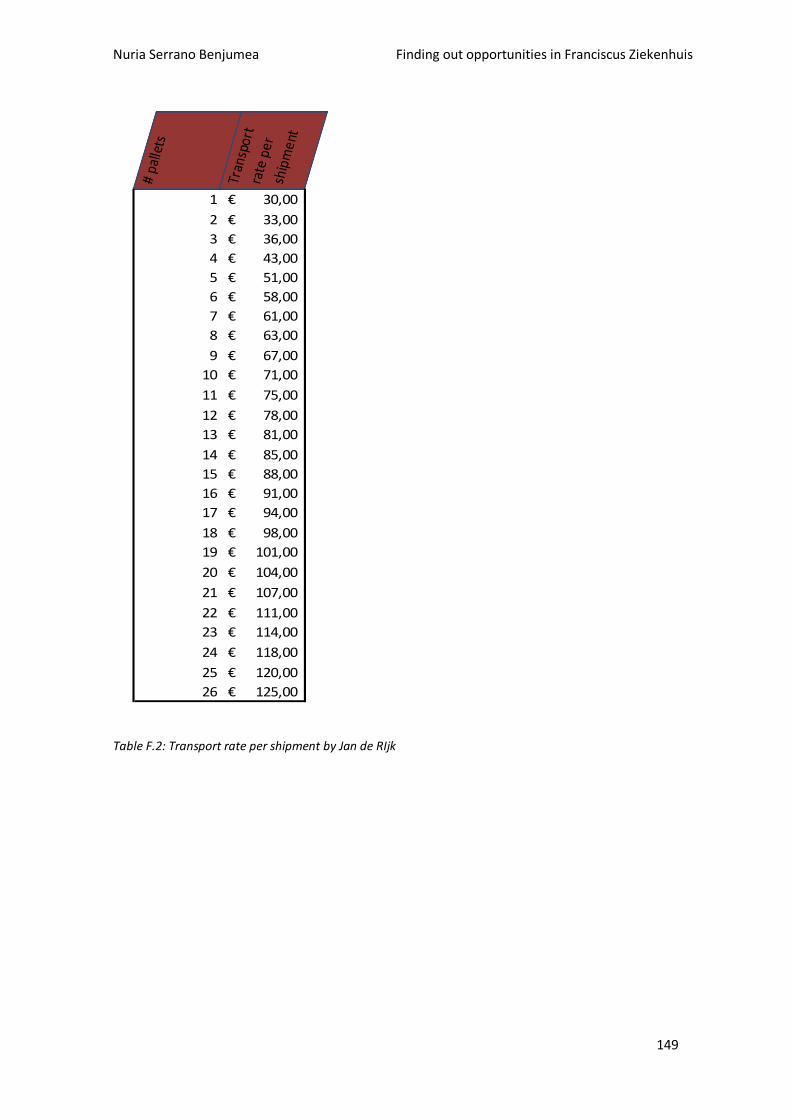
Nuria Serrano Benjumea Finding out opportunities in Franciscus Ziekenhuis
149
# pa
llets
Tran
spor
t ra
te p
er
ship
men
t
1 30,00€
2 33,00€
3 36,00€
4 43,00€
5 51,00€
6 58,00€
7 61,00€
8 63,00€
9 67,00€
10 71,00€
11 75,00€
12 78,00€
13 81,00€
14 85,00€
15 88,00€
16 91,00€
17 94,00€
18 98,00€
19 101,00€
20 104,00€
21 107,00€
22 111,00€
23 114,00€
24 118,00€
25 120,00€
26 125,00€
Table F.2: Transport rate per shipment by Jan de RIjk
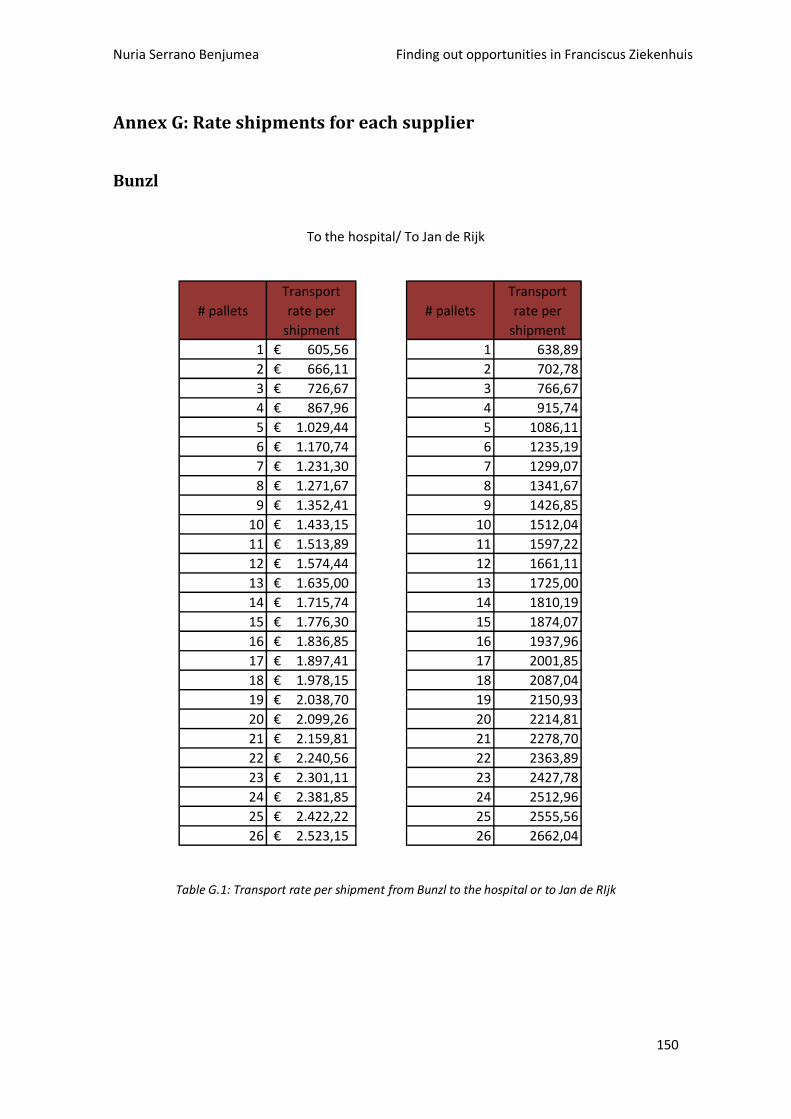
Nuria Serrano Benjumea Finding out opportunities in Franciscus Ziekenhuis
150
Annex G: Rate shipments for each supplier
Bunzl
To the hospital/ To Jan de Rijk
# pallets
Transport
rate per
shipment
# pallets
Transport
rate per
shipment
1 605,56€ 1 638,89
2 666,11€ 2 702,78
3 726,67€ 3 766,67
4 867,96€ 4 915,74
5 1.029,44€ 5 1086,11
6 1.170,74€ 6 1235,19
7 1.231,30€ 7 1299,07
8 1.271,67€ 8 1341,67
9 1.352,41€ 9 1426,85
10 1.433,15€ 10 1512,04
11 1.513,89€ 11 1597,22
12 1.574,44€ 12 1661,11
13 1.635,00€ 13 1725,00
14 1.715,74€ 14 1810,19
15 1.776,30€ 15 1874,07
16 1.836,85€ 16 1937,96
17 1.897,41€ 17 2001,85
18 1.978,15€ 18 2087,04
19 2.038,70€ 19 2150,93
20 2.099,26€ 20 2214,81
21 2.159,81€ 21 2278,70
22 2.240,56€ 22 2363,89
23 2.301,11€ 23 2427,78
24 2.381,85€ 24 2512,96
25 2.422,22€ 25 2555,56
26 2.523,15€ 26 2662,04
Table G.1: Transport rate per shipment from Bunzl to the hospital or to Jan de RIjk
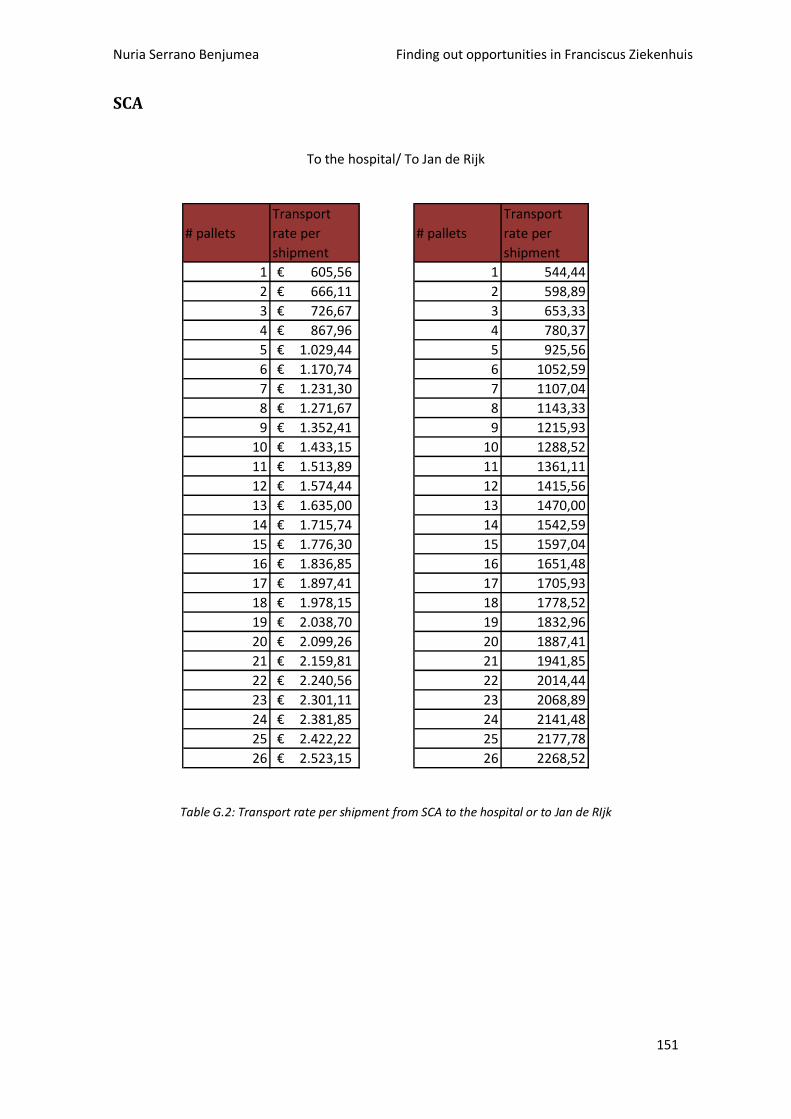
Nuria Serrano Benjumea Finding out opportunities in Franciscus Ziekenhuis
151
SCA
To the hospital/ To Jan de Rijk
# pallets
Transport
rate per
shipment
# pallets
Transport
rate per
shipment
1 605,56€ 1 544,44
2 666,11€ 2 598,89
3 726,67€ 3 653,33
4 867,96€ 4 780,37
5 1.029,44€ 5 925,56
6 1.170,74€ 6 1052,59
7 1.231,30€ 7 1107,04
8 1.271,67€ 8 1143,33
9 1.352,41€ 9 1215,93
10 1.433,15€ 10 1288,52
11 1.513,89€ 11 1361,11
12 1.574,44€ 12 1415,56
13 1.635,00€ 13 1470,00
14 1.715,74€ 14 1542,59
15 1.776,30€ 15 1597,04
16 1.836,85€ 16 1651,48
17 1.897,41€ 17 1705,93
18 1.978,15€ 18 1778,52
19 2.038,70€ 19 1832,96
20 2.099,26€ 20 1887,41
21 2.159,81€ 21 1941,85
22 2.240,56€ 22 2014,44
23 2.301,11€ 23 2068,89
24 2.381,85€ 24 2141,48
25 2.422,22€ 25 2177,78
26 2.523,15€ 26 2268,52
Table G.2: Transport rate per shipment from SCA to the hospital or to Jan de RIjk
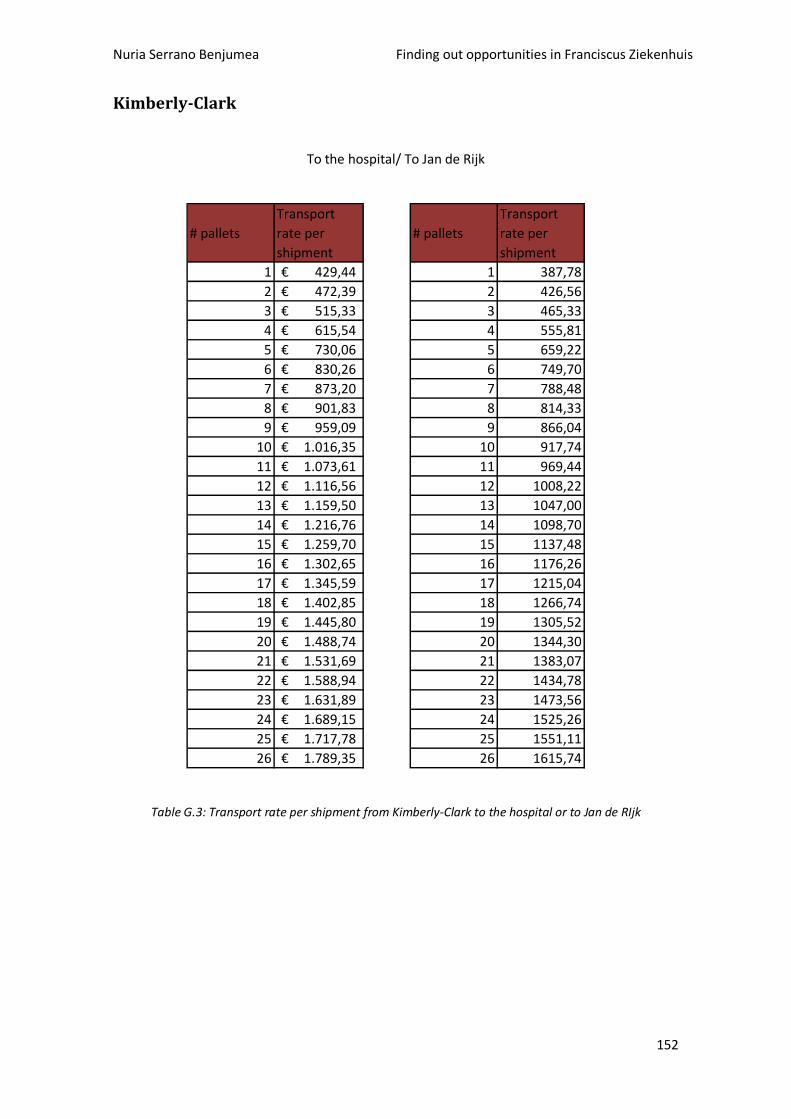
Nuria Serrano Benjumea Finding out opportunities in Franciscus Ziekenhuis
152
Kimberly-Clark
To the hospital/ To Jan de Rijk
# pallets
Transport
rate per
shipment
# pallets
Transport
rate per
shipment
1 429,44€ 1 387,78
2 472,39€ 2 426,56
3 515,33€ 3 465,33
4 615,54€ 4 555,81
5 730,06€ 5 659,22
6 830,26€ 6 749,70
7 873,20€ 7 788,48
8 901,83€ 8 814,33
9 959,09€ 9 866,04
10 1.016,35€ 10 917,74
11 1.073,61€ 11 969,44
12 1.116,56€ 12 1008,22
13 1.159,50€ 13 1047,00
14 1.216,76€ 14 1098,70
15 1.259,70€ 15 1137,48
16 1.302,65€ 16 1176,26
17 1.345,59€ 17 1215,04
18 1.402,85€ 18 1266,74
19 1.445,80€ 19 1305,52
20 1.488,74€ 20 1344,30
21 1.531,69€ 21 1383,07
22 1.588,94€ 22 1434,78
23 1.631,89€ 23 1473,56
24 1.689,15€ 24 1525,26
25 1.717,78€ 25 1551,11
26 1.789,35€ 26 1615,74
Table G.3: Transport rate per shipment from Kimberly-Clark to the hospital or to Jan de RIjk
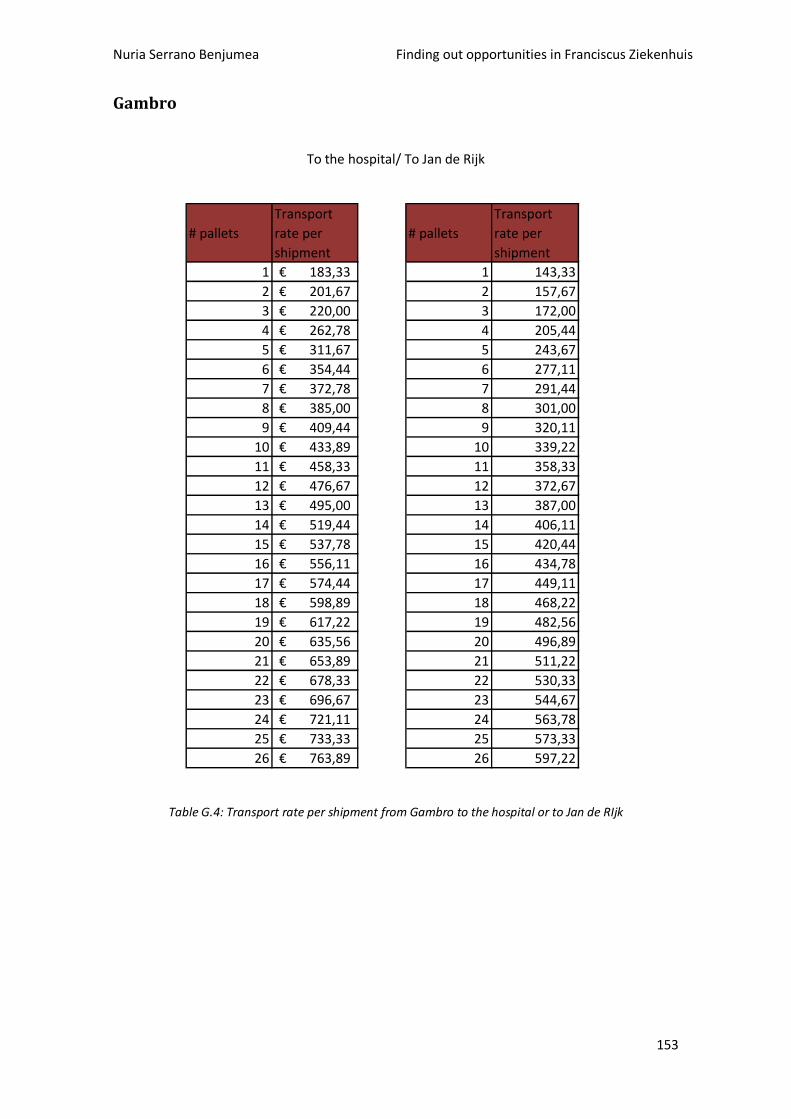
Nuria Serrano Benjumea Finding out opportunities in Franciscus Ziekenhuis
153
Gambro
To the hospital/ To Jan de Rijk
# pallets
Transport
rate per
shipment
# pallets
Transport
rate per
shipment
1 183,33€ 1 143,33
2 201,67€ 2 157,67
3 220,00€ 3 172,00
4 262,78€ 4 205,44
5 311,67€ 5 243,67
6 354,44€ 6 277,11
7 372,78€ 7 291,44
8 385,00€ 8 301,00
9 409,44€ 9 320,11
10 433,89€ 10 339,22
11 458,33€ 11 358,33
12 476,67€ 12 372,67
13 495,00€ 13 387,00
14 519,44€ 14 406,11
15 537,78€ 15 420,44
16 556,11€ 16 434,78
17 574,44€ 17 449,11
18 598,89€ 18 468,22
19 617,22€ 19 482,56
20 635,56€ 20 496,89
21 653,89€ 21 511,22
22 678,33€ 22 530,33
23 696,67€ 23 544,67
24 721,11€ 24 563,78
25 733,33€ 25 573,33
26 763,89€ 26 597,22
Table G.4: Transport rate per shipment from Gambro to the hospital or to Jan de RIjk
Nuria Serrano Benjumea Finding out opportunities in Franciscus Ziekenhuis
154
Annex H. Procedures for handling and storage of goods in
Franciscus Ziekenhuis
This procedure shows the criteria for establishment of a warehouse stock item in a
decentralized department store and how a customer can ask for
Scope
Warehouse employees and its customers.
Method
Not all items in stock at the central warehouse also put stock in any local department stores.
This is because a number of departmental items are. The criteria for a magazine article in the
range of a decentralized department store to take are:
The article must by multiple departments within the hospital used, or
The article should be an article where one may never get caught without, or
The article has been boxed in on the department store cannot in decentralized
locations.
An article in the set is included, provides a more limited administrative processing for both the
customer and the central warehouse than any time by purchasing the item to be ordered.
When a customer finds an article that is increasingly used, it may consider this item in the
department decentralized warehouse to stock. It should, however, thought that it affects the
department budget and available space in the local department store. If ultimately the
decision is made to the article actually decentralized stock interest may contact the team
leader warehouse or the warehouse employee who has contact with the relevant department.
This should only by or with the consent of the head of the department, in order to avoid
misunderstandings.
This procedure describes how the stock level of items is determined and monitored;
this applies both to the central warehouse and for the local warehouses.
Target
Clarity with respect to the establishment and monitoring of stock levels of items.
Definitions and concepts
Job inventory in the computer, this information can be obtained for example, consumption,
purchase, etc.
Scope
Nuria Serrano Benjumea Finding out opportunities in Franciscus Ziekenhuis
155
This procedure applies to the warehouse and all its employees (internal) customers.
Method
Below is a breakdown between the central and local warehouses.
Central Warehouse
Once four weeks makes a computer system advice for a particular product. The 'Vover' states
on the basis of consumption to order the numbers. The stock level should be determined by
the past consumption, and work with an average stock to be added. Prolonged consumption
will therefore provide higher inventory levels over time.
Despite the automatic inventory, it can sometimes happen that the stock early deflates, for
example problems with supply or a sudden increase in consumption. In this case, the
warehousemen themselves intervened by contacting the purchasing department. There can be
decided for an alternative use for the item or an early delivery to take place. In this way, the
stock levels in the central warehouse guarded.
Decentralized warehouses
Determining the inventory level of the articles applies when a new decentralized warehouse of
a whole new department should be organized. It is as following procedure: the head of the
department receives a product list of the warehouse. Then the team leader in consultation
with the department store assortment with additional inventory level determined. This is used
as the starting level. Over time it appears that this level should be adjusted.
Monitoring the stock level is not only applicable for new local stores when they start up, but
also at existing warehouses. This monitoring and changes to the stock level are two different
ways. One possibility is that the head of a department itself indicates that the stock level of a
particular item to be adjusted. The other possibility is that from the warehouse stock levels are
advised to adapt. This will be discussed during the annual talks between the head of a
department, the responsible warehouse worker and possibly the warehouse team leader. The
advice is a list of the average annual range of the department.
Points
From the Department only by the main decision taken at the stock level of an item to adjust.
It's common for employees of a department store to ask employees whether they want to
adjust the level, but can only by or the consent of the head of the department. The warehouse
workers to the staff of the department to this point when demand emerges.
In this procedure describes how to control on physical and administrative inventory
data and during the storage of goods.
Target
Clarity with regard to physical and administrative control of inventory data and during storage.
Nuria Serrano Benjumea Finding out opportunities in Franciscus Ziekenhuis
156
Powers
All warehouse employees are empowered to carry out controls during storage of goods, but
also to verify the physical and administrative stock data in line. They were also responsible for
changes which are hereby discovered to be processed.
Method
Storage (of stock goods / D-goods)
Upon receipt of the goods are checked against those of the packing list to include quality,
quantity, expiry date and date of sterilization. When the order does not comply, for example
when the goods already on the date is contacted by an employee of the magazine with the
purchasing department. They provide further processing of the issue by contacting the vendor.
When the transaction has approved, the goods shall be entered into the inventory program
and disposed of in the propositions. This cleaning is done by a number of warehouse lines such
as the FIFO system, laws and regulations regarding food, from left to right tackle system and
ABC analysis. Where it is found that the shelf life has expired, the goods are disposed of and
charged against the cost centre Scrapping (6980/01). Checking for expiration date is especially
important for food and sterile products. For storage in local warehouses, we try to maintain
stock of two weeks. These two weekly stocks 1 time per year with the department discussed
and possibly amended. The establishment of decentralized warehouses of the wards, we try to
maintain a uniform format.
Physical and administrative stock data
The administrative records are kept in stock inventory program. This program can be booked in
goods and retired and all the other actions that are required to be performed. Ex: notes
accompanying printouts, and orders authorizing consulting inventory. For administrative stock
tune with the physical inventory is 2 times a year. Here, the current inventory counted and
compared to a printout of the inventory program. The program through a list of inventory
items turned in a certain position. After checking their differences credited or debited to the
cost centre Inventory Differences (6980/00). Articles have 1 or 2 years have not diminished
(shop girls) is entered and removed from the central warehouse.
Reporting
To the passage of goods and ex-stock additions or differences are written off, a survey tracked.
This is a directory present in the warehouse, which stored 5 years.
In this procedure are the objectives and tasks of the warehouse.
# Doel* Target
The objective of the warehouse is:
Nuria Serrano Benjumea Finding out opportunities in Franciscus Ziekenhuis
157
Voor klanten de juiste goederen op het juiste tijdstip en in de gewenste kwaliteit en kwantiteit
leveren. For customers the right goods at the right time and deliver the desired quality and
quantity. Om dit te kunnen realiseren ontvangt en controleert het magazijn alle goederen die
worden aangeleverd en beheren zij zowel het centraal magazijn als decentrale magazijnen
(wanneer de klant dit wenst). To realize the warehouse receives and verifies all goods being
delivered and they manage both the central warehouse and local stores (if the customer so
wishes).
# Definities en begrippen Definitions and concepts
Fifo: First-in-first-out: De goederen met de kortste houdbaarheidsdatum worden het eerst
gepakt. FIFO: First-in-first out: The goods with the shortest expiry date first caught.
Scope
Deze procedure heeft betrekking op alle betrokkenen bij het magazijn. This procedure applies
to all those involved in the warehouse. Dit zijn het unithoofd logistiek, teamleider
magazijn/csa, medewerkers magazijn, medewerkers inkoop en alle afdelingen en
ondersteunende diensten die goederen krijgen aangeleverd via het magazijn. These are the
main unit logistics, warehouse team leader / csa, warehouse staff, purchasing staff and all
departments and support services that get goods delivered from the warehouse.
Taken Tasks
De volgende taken worden door de medewerkers van het magazijn uitgevoerd: The following
tasks by the staff of the magazine carried out:
1. Goods Receipt, storage and processing returned goods.
Het in ontvangst nemen van goederen en het tekenen van ontvangstbewijzen en
verzenddocumeThe receipt of goods and the signing of receipts and shipping documents.
Unpacking goods and check on quantity, quality, durability, sterility and state where the
product finds.
The daily delivery of non-stock items.
Saving in the appropriate location in the warehouse using the FIFO system. For distribution
and storage of sterile items, separate guidelines are followed.
Sending return items to suppliers.
2. Recording and goods issue
The handheld terminal with a record of the order of several departments.
With the purchase orders turned out orders to prepare and clean up the various departments
under the FIFO system. While recording and clearing checks the employee keeping the goods
and quantity.
The issuance of goods to the warehouse office.
Nuria Serrano Benjumea Finding out opportunities in Franciscus Ziekenhuis
158
3. Administration and Information
Entering inventory items into the computerized inventory system after the goods have been
received and stored.
Het invoeren van de uitgifte van goederen in het systeem; de medewerker verzorgt dus de
gehele administratie van de goederenstroPutting the issue of goods in the system, so the
employee handles the entire administration of the commodity. Voor niet-voorraadgoederen
bestaat een handmatige en een geautomatiseerde administratie. For non-stock goods is a
manual and automated records.
Providing information about items to departments through the stock system.
4. Establishment, maintenance and inventory control
The logical setting of local magazines, including the creation of barcode labels and a site survey
of the property.
Moving local warehouses and re-decorating.
Neatly into the central warehouse (cleaning, cleaning) and frequent surveys of the stocks
(exact number, location, durability).
Points
Het magazijn ontvangt en controleert alle goederen die worden aangeleverd, behalve de
goederen die op basis van wet- en regelgeving door derden dienen te worden ontvangen The
warehouse receives and checks all the goods were delivered, but the goods on the basis of
laws and regulations by third parties must be received
Reference # / reference / literature
"The Compass", internal publication of the magazine.
In this procedure, all processing times are shown.
Target
Inzicht geven in de verschillende doorlooptijden. Insight into the different times.
Definitions and concepts
Scope
Deze procedure is van toepassing op het magazijn en al haar klanten. This procedure applies to
the warehouse and its clients.
Method
Nuria Serrano Benjumea Finding out opportunities in Franciscus Ziekenhuis
159
Voor het weergeven van de verschillende doorlooptijden is onderscheid gemaakt tussen
voorraadartikelen en niet-voorraadartikelen. To display the different lead times is a distinction
between inventory items and non-stock items.
Niet-voorraadartikelen Non-stock items
Na binnenkomst van de order worden de artikelen altijd dezelfde dag nog afgeleverd
bij de kAfter entry of the order, the items always same day delivery to the customer.
Mocht de klant niet aanwezig zijn op dat moment, worden de artikelen mee terug
genomen en later op de dag of de volgende dag opnieuw aan de klant aangeboden. If
the customer is not present at that time, the articles brought back and later in the day
or the next day to the customer.
If the order includes refrigerated or frozen products are directly delivered to the
customer.
Also urgently needed items are directly delivered to the customer. The magazine is
accordingly informed by the purchasing department or by the customer.
Voorraadartikelen Stock Items
Stock Items urgently needed, can be picked up at the counter. For more information
about warehouse and office opening times see the process customer information
warehouse facility .
stock items. Na het opnemen van de behoefte worden de benodigde artikelen
klaargezet en dezelfde dag nog afgeleverd bij de betreffende afdeling. After recording
of the necessary items need to be prepared and put on the same day delivered to the
appropriate department.
For items that are in deficit, the following applies: after receipt of the order with the
goods receipt of the warehouse, the items the same day delivered to the customer.
Points
Reference # / reference / literature
M. de Bruijn, unit head logistics.
# Einde document
These instructions describe how the receipt and storage of goods takes place.
# Doel* Target
Duidelijkheid verschaffen met betrekking tot de wijze waarop ontvangst en opslag van
goederen door het magazijn plaatsvindt. Clarity concerning how receipt and storage of goods
carried by the warehouse.
Powers
Nuria Serrano Benjumea Finding out opportunities in Franciscus Ziekenhuis
160
Alle magazijnmedewerkers zijn bevoegd om een vrachtbrief van een vervoerder te tekenen
voor ontvangst. All warehouse employees are entitled to a consignment of one carrier to sign
for receipt.
Method
Voor het beschrijven van de werkwijze van ontvangst en opslag van goederen door het
magazijn wordt onderscheid gemaakt tussen voorraadartikelen (D-orders) en niet-
voorraadartikelen (A-orders en TEAL-orders). To describe the process of receiving and storage
of goods through the warehouse is a distinction between inventory items (D-orders) and non-
inventory items (A-Teal-orders and orders). Voorraadartikelen worden in het magazijn
opgeslagen, niet-voorraadartikelen worden na ontvangst en controle vrijwel direct naar de
klant gebracht. Inventory items are stored in the warehouse, non-stock items upon receipt and
inspection almost directly to the customer.
Voor elke eigendomsoverdracht moet er zowel getekend - als een leesbare naam op het
document geplaatst worden. For any transfer of ownership must be signed both - as a
readable name placed on the document.
Voorraadartikelen: ontvangst en opslag Stock Items: receipt and storage
D-orders
Nadat de afdeling inkoop een bestelling bij een leverancier geplaatst heeft, staat deze order in
het systeemonderdeel 'Verpli' als een order vermeld met een eigen ordernummer. After
purchasing department placed an order with a supplier has is that order in the system
component "Verpli 'as an order given by an individual order number. De leverancier stuurt
vervolgens de goederen inclusief de vrachtbrief en de pakbon naar het magazijn. De
vrachtbrief wordt door een magazijnmedewerker afgetekend en vervolgens met de chauffeur
geretourneerd naar de leverancier. The supplier sends the goods including the bill of lading
and packing list to the warehouse. The bill of lading is a warehouse worker and then signed off
with the driver returned to the supplier. Wanneer de vrachtbrief getekend wordt, vindt ook de
eigendomsoverdracht plaats. If the consignment is signed, the transfer of ownership takes
place. Vanaf dat moment zijn de magazijnmedewerkers verantwoordelijk voor de order. From
that moment on, the warehouse workers responsible for the order. Met behulp van de pakbon
worden de goederen gecontroleerd. Using the packing slip the goods inspected. Vervolgens
worden de goederen opgeruimd in het magazijn via het fifo-systeem. Subsequently, the goods
are cleared through the FIFO in the warehouse system. Daarnaast wordt aan de hand van de
pakbon de gegevens in het systeem goederenontvangst “Verpli' ingevoerd. In addition, based
on the packing slip data in the goods receipt system "Verpli 'was introduced. Nadat de pakbon
is gecontroleerd met de geleidebon, op bijvoorbeeld de omzetting van doos naar aantal stuks
per doos, wordt de order geautoriseerd. Once the packing is controlled by the consignment
note, eg on the transposition of pieces per box to box, the order authorized. Op dat moment
wordt de voorraad pas daadwerkelijk bijgeboekt in het magazijn en kan de administratie de
inmiddels ontvangen factuur afhandelen. At that time, the stock not actually booked in the
warehouse and the administration can now receive the invoice handling.
Nuria Serrano Benjumea Finding out opportunities in Franciscus Ziekenhuis
161
Het kan ook voorkomen dat er goederen met spoed nodig zijn, deze worden dan uit de stad
gehaald. It can also prevent the goods urgently needed, they are then removed from the city.
Dit kunnen zowel voorraad als niet-voorraadartikelen zijn. This can be both stock and non-
stock items are.
Sterile products
Voor steriele artikelen gelden specifieke voorschriften waar medewerkers magazijn rekening
mee dienen te houden. For sterile products subject to specific rules that employees should
take into account stock. Zie hiervoor de procedure wettelijke voorschriften vervoer en opslag
magazijn . See the procedure regulations transportation and storage warehouse .
City
Het komt soms voor dat goederen met spoed nodig zijn, deze worden dan uit de stad gehaald.
Occasionally, the goods urgently needed, they are then removed from the city.
Voorraadgoederen uit de stad moeten worden bijgeboekt via een voorraad mutatieformulier.
Stock Goods from the city must be booked through a stock movement form. Deze formulieren
bestaan uit drie exemplaren waarbij de witte voor de administratie van het magazijn is, de
roze en het gele exemplaar zijn voor de FIA. These forms consist of three units where the
white of the administration of the warehouse, the pink and yellow copy to the FIA. Daarnaast
worden ook de factuur en de prijsaanpassing in Voink naar de administratie gestuurd. In
addition the invoice and the price adjustment Voink sent to the administration.
Niet-voorraadartikelen: ontvangst Non-stock items: receipt
A-orders
Ook hierbij geldt dat wanneer de afdeling inkoop een bestelling geplaatst heeft dat de order
met bijbehorend ordernummer in het computersysteem staat vermeld. Again, is that when the
purchasing department has placed an order with the order corresponding order number in the
computer below. Na het aftekenen van de vrachtbrief, worden ook nu de goederen
gecontroleerd aan de hand van de pakbon. Daarna worden de goederen ingevoerd in het
verpli-systeem en wordt een geleidebon uitgedraaid. After outlining the consignment, the
goods are also now monitored using the packing list. Then the goods imported verpli system
and is turned a consignment note. De geleidebon en de goederen gaan vervolgens naar de
interne klant. The consignment note and the goods are then shipped to the internal customer.
De geleidebon is in tweevoud, na ondertekening van het origineel mag de klant de kopie
houden. The consignment note in duplicate, after signing the original copy of the customer
may keep. De pakbon blijft in het magazijn totdat de ondertekende geleidebon terugkomt,
vervolgens wordt de order goedgekeurd in het computersysteem. The packing list remains in
the warehouse until the signed consignment note comes back, then the order is approved in
the computer system. Na goedkeuring worden de pakbon en de geleidebon in de A-kast bij de
desbetreffende leverancier opgeruimd. Once approved, the delivery note and the consignment
note in the A case cleared by the relevant supplier.
Teal-orders
Nuria Serrano Benjumea Finding out opportunities in Franciscus Ziekenhuis
162
Omdat deze goederenstroom niet geautomatiseerd is, krijgt het magazijn van de afdeling
inkoop een blauwe en witte doorslag van de order. Because these goods are not automated,
the warehouse receives the purchasing department of a blue and white carbon copy of the
order. Ter bevestiging van ontvangst worden deze orders eerst ingeschreven op nummer in
een apart boek waarna ze op alfabetische volgorde worden opgeruimd in een dossierkast. To
confirm receipt of these orders are entered on first number in a separate book in alphabetical
order before they are disposed of in a file cabinet. Bij binnenkomst van de goederen wordt
eerst de bestelorder uit deze kast gehaald. Upon entering the property is the first purchase
orders from the closet. Aan de hand van deze order wordt de pakbon gecontroleerd. On the
basis of this order, the packing list checked. Op de pakbon wordt vervolgens een
ontvangststempel gezet. On the packing list is then put a receipt stamp. Hierop wordt de
ontvangstdatum, de paraaf van de ontvanger en de klant vermeld. This is the receipt date, the
initials of the recipient and the client specified. Vervolgens worden de goederen aan de
(interne) klant aangeboden, waarbij de pakbon getekend dient te worden. Then the goods to
the (internal) customer offered, the delivery note should be signed. Als het om een
deellevering gaat, wordt bij iedere levering een opvolgende letter gebruikt (a=, b=, c=,
enzovoorts). If it is a partial delivery, any transfer is a subsequent letter used (a = b =, = c, etc.).
Als de bestelorder niet in zijn geheel is uitgeleverd worden er twee kopieën gemaakt, waarvan
1 exemplaar voor de inkoop is en 1 voor de FIA. If the purchase orders is not completely
delivered, two copies made, including 1 copy of the purchase and 1 for the FIA. Als de order
wel in zijn geheel geleverd is, gaat de pakbon en het blauwe exemplaar van de order naar de
FIA, het witte exemplaar gaat terug naar de afdeling inkoop. If the order or in whole is
delivered, the delivery note and the blue copy of the order to the FIA, the white copy goes
back to the purchasing department.
City
Soms worden ook niet-voorraadartikelen uit de stad gehaald, het magazijn krijgt dan een
haalbon. Sometimes even non-inventory items removed from the city, the magazine will get a
haalbon. De medewerker van het magazijn zet een ontvangststempel op deze bon en levert de
goederen af bij de betreffende klant. The employee of the warehouse receipt puts a stamp on
the voucher and deliver the goods on to the customer. Na ondertekening van de klant gaat de
haalbon naar de FIA. After signing the client, the haalbon to the FIA.
# Complicaties Complications
Er zijn diverse soorten afwijkingen mogelijk, hieronder worden enkele afwijkingen
weergegeven met bijbehorende handelswijze. There are several types of defects possible, here
are some deviations appear related to behavior. Bij twijfel wordt door de
magazijnmedewerker contact opgenomen met de teamleider en / of de afdeling inkoop. In
doubt by the warehouse employee contacted the team leader and / or the purchasing
department.
Handelswijze bij afwijkingen tijdens ontvangst Dealing with deviations during reception
Beschadigde verpakkingen (geconstateerd vóór tekenen van de vrachtbrief) Damaged
containers (noted before signing the bill of lading)
Nuria Serrano Benjumea Finding out opportunities in Franciscus Ziekenhuis
163
Wanneer een medewerker constateert dat een straatverpakking én de artikelen beschadigd
zijn, wordt de levering niet geaccepteerd door het niet tekenen van de vrachtbrief en het
direct retour geven van de levering met de vervoerder. Indien alleen de straatverpakking
beschadigd is, wordt hiervan een aantekening gemaakt op de vrachtbrief en wordt de
vrachtbrief wel getekend. When an employee finds a street packaging and items are damaged,
the delivery is not accepted by not signing the consignment note and promptly return all of the
delivery to the carrier. If only the street package is damaged, you receive a note made the
consignment and the consignment will be drawn. Als later blijkt dat toch de artikelen
beschadigd zijn, kan alsnog actie worden ondernomen. If it later appears that the items are
damaged, can still be action taken.
Beschadigde verpakkingen (geconstateerd na het tekenen van de vrachtbrief) Damaged
packaging (detected after signing the bill of lading)
Na het tekenen voor ontvangst van de levering kan alsnog geconstateerd worden dat een
verpakking en / of artikelen beschadigd zijn. After signing for receipt of delivery can still be
noted that packaging and / or damaged items. In dit geval wordt contact opgenomen door de
medewerker van het magazijn met de afdeling inkoop om de betreffende verpakking alsnog
retour te sturen. In this case, contacted by the staff of the magazine with the purchasing
department for the return on packaging yet to send.
Handelswijze bij afwijkingen tijdens opslag Dealing with deviations during storage
Alternative supplies
Wanneer een bepaald artikel tijdelijk niet leverbaar is, wordt er soms voor gekozen om een
alternatief te bestellen. If an item is temporarily not available, is sometimes chosen to be an
alternative to order. Bij ontvangst van deze goederen wordt het vervangende artikel ingeboekt
als het 'normale' artikel. Upon receipt of such goods, the replacement article be booked as
'normal' article.
Change of brand and / or supplier
An article can make or change suppliers by purchasing procurement documentation will be
updated. The behavior of the magazine remains the same, the article remains the same article
number to.
Points
Bij een aantal afdelingen kan de geleidebon, de pakbon of de haalbon niet direct getekend
worden vanwege de afdelingsorganisatie. In some departments, the consignment note,
delivery note or haalbon not immediately be drawn because of the organization department.
Hierover zijn met de betreffende afdelingen afspraken gemaakt. Matter with the relevant
departments agreed. Dit geldt voor: Klinisch Chemisch Laboratorium, röntgenafdeling en soms
de polikliniek. This applies to: Clinical Chemistry Laboratory, X-ray department and sometimes
the clinic.
References / links / literature
"The Compass", internal publication of the magazine.
Nuria Serrano Benjumea Finding out opportunities in Franciscus Ziekenhuis
164
Diverse magazijnmedewerkers. Several store employees.
In deze procedure wordt de plaats van het magazijn in de organisatie
weergegeven. In this procedure, the location of the warehouse organization listed.
# Doel* Target
Duidelijkheid verschaffen over de plaats van het magazijn binnen de organisatie. Clarify the
location of the warehouse within the organization.
# Definities en begrippen
Scope
Deze procedure heeft betrekking op alle betrokkenen bij het magazijn. This procedure applies
to all those involved in the warehouse. Dit zijn het unithoofd logistiek, medewerkers magazijn,
medewerkers inkoop en alle afdelingen en ondersteunende diensten die goederen krijgen
aangeleverd via het magazijn. These are the main unit logistics, warehouse staff, purchasing
staff and all departments and support services that get goods delivered from the warehouse.
Method
Om de plaats van het magazijn binnen de organisatie duidelijk te maken, staat hieronder het
organigram. To replace the warehouse within the organization to make clear, is below the
plan.
De teamleider magazijn wordt functioneel en operationeel aangestuurd door het unithoofd
logistiek. The team leader warehouse is functionally and operationally driven by the logistics
unit head. De medewerkers magazijn worden functioneel en operationeel aangestuurd door
de teamleider. The warehouse employees are functionally and operationally controlled by the
team leader. Bij afwezigheid van de teamleider neemt een van de medewerkers de taak op
zich om de dagelijkse werkzaamheden te coördineren. In the absence of team leader, one of
the employees on the task to coordinate the daily activities. De bevoegdheden en
verantwoordelijkheden zijn voor alle medewerkers vastgelegd in hun taakfunctieomschrijving.
The powers and responsibilities are established for all employees in their job duties. De
taakfunctieomschrijvingen zijn opgesteld door het unithoofd en worden onderhouden door
PO&O. The task job descriptions prepared by the Unit Head and maintained by RD & D.
# Referentie / verwijzing / literatuur Reference / literature
"The Compass", internal publication of the magazine.
Nuria Serrano Benjumea Finding out opportunities in Franciscus Ziekenhuis
165


![Franciscus Mercurius van Helmont’s Cabbalistical Dialogue · [Franciscus Mercurius van Helmont, 1614-1699] A Cabbalistical DIALOGUE IN ANSWER To the Opinion of a Learned Doctor](https://img.pdfslide.us/doc/110x75/5e67b0ac9f9c9e2a5c4a3857/franciscus-mercurius-van-helmontas-cabbalistical-franciscus-mercurius-van-helmont.jpg)


![[Franciscus Mercurius van Helmont] SEDER OLAM · [Franciscus Mercurius van Helmont] SEDER OLAM : O R, T H E Order, Series, or Succession O F A L L T H E Ages, Periods, and Times O](https://img.pdfslide.us/doc/110x75/5fc28158b03781560345d3b3/franciscus-mercurius-van-helmont-seder-franciscus-mercurius-van-helmont-seder.jpg)