Embed Size (px)
Citation preview

7/28/2019 Finding and Fixing Bad SQL in Microsoft SQL Server 2000
http://slidepdf.com/reader/full/finding-and-fixing-bad-sql-in-microsoft-sql-server-2000 1/44
written
Kevin Kl
Quest Software, I
Finding and Fixing Bad SQL
in Microsoft SQL Server 2000
White Paper

7/28/2019 Finding and Fixing Bad SQL in Microsoft SQL Server 2000
http://slidepdf.com/reader/full/finding-and-fixing-bad-sql-in-microsoft-sql-server-2000 2/44
WPD_FindingFixingBadSQL_083106_NH
© Copyright Quest® Software, Inc. 2006. All rights reserved.
This guide contains proprietary information, which is protected by copyright. The
software described in this guide is furnished under a software license ornondisclosure agreement. This software may be used or copied only in accordancewith the terms of the applicable agreement. No part of this guide may be
reproduced or transmitted in any form or by any means, electronic or mechanical,including photocopying and recording for any purpose other than the purchaser's
personal use without the written permission of Quest Software, Inc.
WARRANTY
The information contained in this document is subject to change without notice.
Quest Software makes no warranty of any kind with respect to this information.QUEST SOFTWARE SPECIFICALLY DISCLAIMS THE IMPLIED WARRANTY OF THEMERCHANTABILITY AND FITNESS FOR A PARTICULAR PURPOSE. Quest Software
shall not be liable for any direct, indirect, incidental, consequential, or other
damage alleged in connection with the furnishing or use of this information.
TRADEMARKS
All trademarks and registered trademarks used in this guide are property of their
respective owners.
World Headquarters5 Polaris Way
Aliso Viejo, CA 92656www.quest.com
e-mail: [email protected]
U.S. and Canada: 949.754.8000
Please refer to our Web site for regional and international office information.
Updated—April 2005

7/28/2019 Finding and Fixing Bad SQL in Microsoft SQL Server 2000
http://slidepdf.com/reader/full/finding-and-fixing-bad-sql-in-microsoft-sql-server-2000 3/44
i
CONTENTS
INTRODUCTION ..........................................................................................1 FINDING AND FIXING BAD SQL USING THE MICROSOFT NATIVE TOOLS ....2 MICROSOFT WINDOWS PERFORMANCE MONITOR (PERFMON)...................3 MICROSOFT SQL PROFILER.........................................................................5 TUNING SQL WITH MICROSOFT QUERY ANALYZER .......................................7
SET STATISTICS IO ....................................................................................7 SET STATISTICS TIME ................................................................................9 SHOWPLAN OUTPUT AND ANALYSIS ................................................................ 11
SHOWPLAN Output................................................................................ 11 SHOWPLAN Operations .......................................................................... 14
READING THE QUERY PLAN ............................................................................. 14 Getting Started..................................................................................... 14
SEEK Versus SCAN ................................................................................ 15 Branching Steps Illustrated by Comparing Joins and Subqueries .................. 18 Comparing Query Plans.......................................................................... 19
UNDERSTANDING THE IMPACT OF JOINS.............................................................. 20 USING GRAPHIC EXPLAIN PLAIN IN MICROSOFT QUERY ANALYZER ........23
LIMITATIONS OF NATIVE TOOL TUNING............................................................... 24 FINDING AND FIXING BAD SQL USING THE QUEST TOOLS .......................25
DETECTING BAD SQL WITH QUEST’ S SPOTLIGHT ON SQL SERVER .............................. 25 DETECTING AND DIAGNOSING BAD SQL WITH QUEST’ S PERFORMANCE ANALYSIS ON
SQL SERVER ............................................................................................. 26 Real-time and History Performance Analysis.............................................. 28 Change Tracking and Troubleshooting ...................................................... 31
RESOLVING BAD SQL WITH QUEST CENTRAL FOR SQL SERVER—SQL TUNING ............... 33 Graphical Execution Plan ........................................................................ 33 SQL Scanner: Analyzing Multiple SQL Statements for
Performance Inefficiencies ...................................................................... 34 SQL Optimizer: Rewriting and Benchmarking SQL Statements ..................... 35
CONCLUSION ............................................................................................38 ABOUT THE AUTHOR .................................................................................39 ABOUT QUEST SOFTWARE, INC. ................................................................40
CONTACTING QUEST SOFTWARE....................................................................... 40 CONTACTING QUEST SUPPORT......................................................................... 40
NOTES.......................................................................................................41

7/28/2019 Finding and Fixing Bad SQL in Microsoft SQL Server 2000
http://slidepdf.com/reader/full/finding-and-fixing-bad-sql-in-microsoft-sql-server-2000 4/44
White Paper
1
INTRODUCTION
This article will teach you the basic techniques used to find and fix poorlyperforming SQL statements (usually SELECT statements, but also INSERT, UPDATE
and DELETE statements) on Microsoft’s SQL Server 2000 relational databasemanagement system. We will teach you the techniques available using Microsoft’s
native tools, such as Microsoft SQL Profiler, Microsoft Query Analyzer and MicrosoftPerformance Monitor. We will then compare and contrast these techniques to Quest
Software’s performance management and query tuning tools, Performance Analysisand SQL Tuning.1
Gartner Research indicates that almost 80 percent of performance problems in
database applications can be traced back to poorly or improperly coded SQL
statements. (The remaining 20 percent breaks down as follows: 15 percent of performance problems are attributed to database design and 5 percent areattributed to inadequate or poor hardware configurations.) Consequently, you need
to ensure that all of the SQL statements used in your application maxmized for
performance.
All examples and syntax are verified for Microsoft SQL Server 2000. After readingthis paper, you should have a basic understanding of:
1. Query tuning tools and techniques available with the Microsoft tool kit.
2. How Quest tools can make the detection of bad queries easier and how to
make the query tuning process faster, easier and more accurate.
Microsoft SQL Server provides you with capabilities to benchmark transactions by
sampling I/O activity and elapsed execution time using certain SET and DBCC
commands. In addition, some DBCC commands may be used to obtain a verydetailed explanation of any index statistic, estimate the cost of every possibleexecution plan and boost performance. The SET and DBCC commands are fully
detailed in the Quest white paper entitled “ Analyzing and Optimizing T-SQL Query
Performance on Microsoft SQL Server using SET and DBCC” , the first white paper ina four-part series on performance tuning. Because that white paper describes, in
great detail, code based methods for detecting and fixing poorly performingqueries, this white paper focuses on the graphic tools available in the Microsoft
native tool kit.

7/28/2019 Finding and Fixing Bad SQL in Microsoft SQL Server 2000
http://slidepdf.com/reader/full/finding-and-fixing-bad-sql-in-microsoft-sql-server-2000 5/44
Finding and Fixing Bad SQL in Microsoft SQL Server 2000
2
FINDING AND FIXING BAD SQL USING THE
MICROSOFT NATIVE TOOLS
Microsoft provides you with three primary means for finding and fixing poorlyperforming SQL statements:
3. Microsoft Performance Monitor (PerfMon) provides you with an overall viewof SQL Server’s performance. When performance on the server dips, you
can then investigate for a root cause. However, PerfMon may not detect a
problem when poorly performing SQL queries run on SQL Server with anoverabundance of hardware resources or when little activity is occurring onthe server.
4. Microsoft SQL Profiler enables you to trace all of the SQL query activity
within SQL Server, as well as other tell-tale signs of poorly performing SQLqueries, such as excessive query plan recompiles.
5. Microsoft Query Analyzer allows you to see the exact query plan of a poorlyperforming SQL query, where you can manually try alternative SELECT
statements or schema problems, like inadequate or missing indexes.
This paper will first show you how to use all three of these Microsoft-centrictechniques. Then, we will show you expert and time saving techniques available
only with Quest's performance management and query tuning tools.

7/28/2019 Finding and Fixing Bad SQL in Microsoft SQL Server 2000
http://slidepdf.com/reader/full/finding-and-fixing-bad-sql-in-microsoft-sql-server-2000 6/44
White Paper
3
MICROSOFT WINDOWS PERFORMANCE MONITOR
(PERFMON)
In general, you or your SQL Server DBA should perform on-going SQL Servermonitoring to ensure application performance by using PerfMon or another
monitoring tool such as Microsoft Operations Manager (MOM 2005) or Quest’sFoglight. These tools alert you whenever there are performance issues or system
errors on your SQL Server.
PerfMon is a tool that graphically depicts the numeric values returned by Windowsfor a variety of performance objects over time. Performance objects are broad
categories of performance on a Windows server, including things like CPU (called ‘Processor’ in PerfMon) or SQL Server Locks, for example. With a performance
object, there are a variety of specific counters. Figure 1, below, shows an example
of PerfMon in action.
Figure 1: Example of PerfMon
Whenever you see a spike or plateau in a particular PerfMon counter, you know that
the specific server resource monitored by PerfMon is being heavily utilized perhapsto the point of constraining system performance.2
7/28/2019 Finding and Fixing Bad SQL in Microsoft SQL Server 2000
http://slidepdf.com/reader/full/finding-and-fixing-bad-sql-in-microsoft-sql-server-2000 7/44
Finding and Fixing Bad SQL in Microsoft SQL Server 2000
4
A typical approach to detecting heavy load on a SQl Server is to watch the I/O usageof the server, especially during the execution of long running SQL statements. If a
performance slowdown occurs within SQL Server and correlates with a spike in I/Ocounters like Physical Reads, Logical Reads and Read-ahead reads, or processor-
related counters like Compile CPU time, or Execution CPU time, then you probablyhave a poorly performing SQL statement(s) at work on the server.
By using PerfMon to pin down exactly when the performance slow downs occur, you
can better correlate them to specific SQL statements and SPIDs using Microsoft SQLProfiler or the sp_who system stored procedure in the Microsoft Query Analyzer. In
addition, PerfMon can help you better determine the type of problem the SQLstatement is causing. For example, I/O counter problems in SQL statements are
usually caused by either a failure to somehow find or use effective indexes on thetable being affected by the SQL statements, table fragmentation, fetching or
otherwise impacting large amounts of data, or poorly constructed joins or
subqueries. On the other hand, SQL statements that utilize CPU-intensive functioncalls, calculate mathematically intensive calculations or have poorly constructed
calculations often cause CPU consumption problems.
So once you have quantitatively measured that SQL Server is experiencing a
problem (and fielded a few calls from unhappy users), you can move on to the next
step of finding exactly which SQL statement is causing the trouble. You canaccomplish this using Microsoft SQL Profiler.

7/28/2019 Finding and Fixing Bad SQL in Microsoft SQL Server 2000
http://slidepdf.com/reader/full/finding-and-fixing-bad-sql-in-microsoft-sql-server-2000 8/44
White Paper
5
MICROSOFT SQL PROFILER
Microsoft SQL Profiler collects performance information about SQL Server 2000 bymonitoring the database server for any events. An event is a notification that an
action of significance has occurred on SQL Server 2000. SQL Profiler has a largevariety of events that you may trace. The events are then saved to a trace file that
can be analyzed or replayed as you troubleshoot. SQL Profiler is especially useful for:
• Finding and diagnosing slow-running queries.
• Capturing the series of SQL statements that lead to a problem.
• Stepping through problem queries to find the cause of the problem.
• Replaying the saved trace to reproduce the problem on a test server where
the problem can be diagnosed without impacting a production environment.
• Monitoring the general performance of SQL Server to tune workloads.
SQL Profiler is also very useful for auditing the behavior of a SQL Server. Audits canbe used to record any security-related action (such as those governed by Sarbanes-
Oxley or HIPAA regulations), for later review by a security administrator.Incidentally, when SQL Profiler is auditing, SQL Server 2000 meets C2 security
certification requirements of the U.S. government. Figure 2, shown below, providesan example of SQL Profiler:
Figure 2: Example of SQL Profiler
7/28/2019 Finding and Fixing Bad SQL in Microsoft SQL Server 2000
http://slidepdf.com/reader/full/finding-and-fixing-bad-sql-in-microsoft-sql-server-2000 9/44
Finding and Fixing Bad SQL in Microsoft SQL Server 2000
6
When using SQL Profiler to identify bad SQL (i.e. SQL statements that performpoorly), the first is to create a profiler trace where captured events and SQL
statements that may be causing performance problems can all be recorded. SQLProfiler is very flexible, so you can set up filtering criteria that limit the traced
events or SQL statements to specific databases, users, logins, etc. (An actualdiscussion of the use of SQL Profiler would be extremely lengthy. Refer to the
Microsoft SQL Server Books On-Line for more details on how to use SQL Profiler).
The most difficult aspect of using SQL Profiler traces is that it is not always clearand easy to identify the problem. It often takes time and effort to sort through
“noise” in order to find SQL statements that might actually be consuminginappropriate amounts of server resources.

7/28/2019 Finding and Fixing Bad SQL in Microsoft SQL Server 2000
http://slidepdf.com/reader/full/finding-and-fixing-bad-sql-in-microsoft-sql-server-2000 10/44
White Paper
7
TUNING SQL WITH MICROSOFT QUERY ANALYZER
Once you have found a specific and poorly performing SQL statement with SQLProfiler, you must then use the Microsoft Query Analyzer to tune the statement.
This is an arduous process of trying alternative query syntax that (hopefully)produces the exact same result set. Using Query Analyzer tools, you may also be
able to determine if indexes are properly used by the query. In a nutshell, you mustfollow this pattern to tune bad SQL when using the native tools:
• Reformulate the bad SQL
• Time the new statement
• Compare the query plans
• Repeat until a suitable replacement is found for the bad SQL
This section explains how to use the SET Transact-SQL command to tune poorlyperforming SQL statements.
SET STATISTICS IO
The command SET STATISTICS IO ON forces SQL Server to report actual I/O activity
on executed transactions. It cannot be paired with SET NOEXEC ON option, because
it only makes sense to monitor I/O activity on commands that actually execute. Once
the option is enabled every query produces additional output that contains I/Ostatistics. In order to disable the option, execute SET STATISTICS IO OFF .3
For example, the following script obtains I/O statistics for a simple query counting
rows of the employees’ table in the northwind database:
SET STATISTICS IO ON
GO
SELECT COUNT(*) FROM employees
GO
SET STATISTICS IO OFF
GO
Results:
-----------
2977
Table 'Employees'. Scan count 1, logical reads 53, physical reads 0, read-ahead reads 0.

7/28/2019 Finding and Fixing Bad SQL in Microsoft SQL Server 2000
http://slidepdf.com/reader/full/finding-and-fixing-bad-sql-in-microsoft-sql-server-2000 11/44
Finding and Fixing Bad SQL in Microsoft SQL Server 2000
8
The scan count tells us the number of scans performed. Logical reads show thenumber of pages read from the cache. Physical reads show the number of pages
read from the disk. Read-ahead reads indicate the number of pages placed in thecache in anticipation of future reads.
Additionally, we execute a system -stored procedure to obtain table size statistics
for our analysis:
sp_spaceused employees
Results:
name rows reserved data index_size unused
---------- ---- --------- ------- ----------- -------
Employees 2977 2008 KB 1504 KB 448 KB 56 KB
What can we tell by looking at this information?
• The query did not have to scan the whole table. The number of data in the
table is more than 1.5 megabytes, yet it took only 53 logical I/O operationsto obtain the result. It indicates that the query has found an index that
could be used to compute the result, and scanning the index took fewerI/O than it would take to scan all data pages.
• Index pages were mostly found in data cache since the physical readsvalue is zero. This is because we executed the query shortly after other
queries on employees and the table and its index were already cached.
Your mileage may vary.
• Microsoft has reported no read-ahead activity. In this case data and indexpages were already cached. For a table scan on a large table read-aheadwould probably kick in and cache necessary pages before your query
requested them. Read-ahead turns on automatically when SQL Serverdetermines that your transaction is reading database pages sequentially
and believes that it can predict which pages you’ll need next. A separateSQL Server connection virtually runs ahead of your process and caches
data pages for it. Configuration and tuning of read-ahead parameters isbeyond the scope of this book.
In this example, the query was executed as efficiently as possible. No further
tuning is required.

7/28/2019 Finding and Fixing Bad SQL in Microsoft SQL Server 2000
http://slidepdf.com/reader/full/finding-and-fixing-bad-sql-in-microsoft-sql-server-2000 12/44
White Paper
9
SET STATISTICS TIME
Elapsed time of a transaction is a volatile measurement, since it depends on otherusers’ activity on the server. However, it provides some real measurement. Users
are concerned about the seconds and minutes they spend waiting for a query tocome back, not about data caches and read-ahead efficiency. The SET STATISTICS
TIME ON command reports the actual elapsed time and CPU utilization for everyquery that follows. Executing SET STATISTICS TIME OFF suppresses the option.
SET STATISTICS TIME ON
GO
SELECT COUNT(*) FROM titleauthors
GO
SET STATISTICS TIME OFF
GO
Results:
SQL Server Execution Times:
cpu time = 0 ms. elapsed time = 8672 ms.
SQL Server Parse and Compile Time:
cpu time = 10 ms.
-----------
25
(1 row(s) affected)
SQL Server Execution Times:
cpu time = 0 ms. elapsed time = 10 ms.
SQL Server Parse and Compile Time:
cpu time = 0 ms.
The first message reports a somewhat confusing elapsed time value of 8,672milliseconds. This number is not related to our script and indicates the amount of
time that has passed since the previous command execution. You may disregard this
first message. It took SQL Server only 10 milliseconds to parse and compile thequery. It took 0 milliseconds to execute it (shown after the result of the query). Whatthis really means is that the duration of the query was too short to measure. The last
message that reports parse and compile time of 0 ms refers to the SET STATISTICSTIME OFF command (that’s what it took to compile it). You may disregard this
message since the most important messages in the output are highlighted.

7/28/2019 Finding and Fixing Bad SQL in Microsoft SQL Server 2000
http://slidepdf.com/reader/full/finding-and-fixing-bad-sql-in-microsoft-sql-server-2000 13/44
Finding and Fixing Bad SQL in Microsoft SQL Server 2000
10
Note that elapsed and CPU time are shown in milliseconds. The numbers may varyon your computer (but don’t try to compare your machine’s performance to our
notebook PC’s, because this is not a representative benchmark). Moreover, everytime you execute this script, you may get slightly different statistics depending on
what else your SQL Server was processing at the same time.
If you need to measure the elapsed duration of a set of queries or a storedprocedure, it may be more practical to implement it programmatically (shown
below). The reason is that the STATISICS TIME reports duration of every singlequery and you have to add things up manually when you run multiple commands.
Imagine the size of the output and the amount of manual work in cases when youtime a script that executes a set of queries thousands of times in a loop!
Instead, consider the following script to capture time before and after the
transaction and report the total duration in seconds (you may use milliseconds if you prefer):
DECLARE @start_time DATETIME
SELECT @start_time = GETDATE()
< any query or a script that you want to time, without a GO >
SELECT ‘Elapsed Time, sec’ = DATEDIFF( second, @start_time, GETDATE() )
GO
If your script consists of several steps separated by GO, you can’t use a localvariable to save the start time. A variable is destroyed at the end of the step,
defined by the GO command where it was created. But you can preserve start timein a temporary table like this:
CREATE TABLE #save_time ( start_time DATETIME NOT NULL )
INSERT #save_time VALUES ( GETDATE() )
GO
< any script that you want to time (may include GO) >
GO
SELECT ‘Elapsed Time, sec’ = DATEDIFF( second, start_time, GETDATE() )
FROM #save_time
DROP TABLE #save_time
GO
Remember that SQL Server’s DATETIME datatype stores time values in 3millisecond increments. It is impossible to get more granular time values using the
DATETIME datatype.

7/28/2019 Finding and Fixing Bad SQL in Microsoft SQL Server 2000
http://slidepdf.com/reader/full/finding-and-fixing-bad-sql-in-microsoft-sql-server-2000 14/44
White Paper
11
SHOWPLAN Output and Analysis
This article illustrates, through example explain plans, the meaning and usefulnessof the output produced using SET SHOWPLAN_TEXT ON in Microsoft SQL Server
2000. An explain plan (also called query plans, execution plans, or optimizer plans)provides the exact details of the steps the database query engine uses to execute a
SQL transaction. Knowing how to read explain plans expands your ability to performhigh-end query tuning and optimization.4
As an FYI, much of Sybase Adaptive Server’s query plans are similar SQL Server
query plans. They were nearly identical through versions of SQL Server 6.5 andAdaptive Server 11.5. With SQL Server 2000 and Adaptive Server 12, they are nowdifferent, but still comprehensible.
SHOWPLAN Output
One of the things that I like about the query optimizer is that it provides feedback inthe form of a query execution plan. In previous white papers discussing performancetuning and available from the Quest Web site, the author used SHOWPLAN output to
analyze queries. Now we I am going to explain it in more detail and describe
messages that you may encounter in query plans. Understanding this output bringsyour optimization efforts to a new level. You no longer treat the optimizer as a “blackbox” that touches your queries with a magic wand.
The following command instructs SQL Server to show the execution plan for every
query that follows in the same connection (or process), or turns this option off:
SET SHOWPLAN_TEXT { ON | OFF }
By default, SHOWPLAN_TEXT ON causes the code you are examining to notexecute. Instead, SQL Server compiles the code and displays the query execution
plan for that code. It continues with this behavior until you issue the command SET SHOWPLAN_TEXT OFF .
Other Useful SET Commands
There are a variety of SET commands that are useful for tuning and debugging. We covered SET STATISTICS earlier in this document. You might find these other SET commands useful in certainsituations:
1. SET NOEXEC { ON | OFF }: checks the syntax of your Transact-SQL code, including compiling the codebut not executing it. This is useful for checking the syntax of a query while taking advantage of deferred-name resolution. That is, you can check a query’s syntax on a table that hasn’t been created yet.
2. SET FMTONLY { ON | OFF }: returns only the metadata of a query to the client. For SELECT statements,this usually means it returns only the column headers.
3. SET PARSEONLY { ON | OFF }: checks the syntax of your Transact-SQL code, but does not compile orexecute the code.
All of these commands remain in effect once set ON until you manually turn them OFF . Thesesettings do not take effect immediately, but they start working from the next step. In otherwords, you have to issue a GO command before the SHOWPLAN or NOEXEC setting is enabled.

7/28/2019 Finding and Fixing Bad SQL in Microsoft SQL Server 2000
http://slidepdf.com/reader/full/finding-and-fixing-bad-sql-in-microsoft-sql-server-2000 15/44
Finding and Fixing Bad SQL in Microsoft SQL Server 2000
12
Typical T-SQL code that is used to obtain an execution plan for a query withoutactually running it follows:
SET SHOWPLAN_TEXT ON
GO
<query>
GO
SET SHOWPLAN_TEXT OFF
GO
I’ll discuss SHOWPLAN_TEXT output on several examples. In order to avoid an
annoying redundancy, we will not repeat the SET commands shown above. Everyexample in this section provides a query that should be substituted for the <query>tag in this script and assumes “wrapping” shown above.
There are actually two versions of SHOWPLAN : SHOWPLAN_ALL and
SHOWPLAN_TEXT . The information they provide is essentially the same. However,
the results of SHOWPLAN_ALL are intended for graphic query tools rather than ahuman audience. SHOWPLAN_TEXT , which we use throughout this article, isformatted for a more readable output. All the same, you might like to look at the
differing information returned by the two settings.
The following simple query selects all rows from table authors. It has no choice but
to scan the whole table because we don‘t provide any WHERE clause:
SELECT * FROM authors

7/28/2019 Finding and Fixing Bad SQL in Microsoft SQL Server 2000
http://slidepdf.com/reader/full/finding-and-fixing-bad-sql-in-microsoft-sql-server-2000 16/44
White Paper
13
SHOWPLAN_TEXT results are not formatted, but we had to greatly massage theoutput from SHOWPLAN_ALL to make it readable in the table below:
A) SHOWPLAN_TEXT B) SHOWPLAN_ALL
StmtText
------------------------
|--Clustered Index Scan
(OBJECT:([pubs].[dbo].
[authors].[UPKCL_auidind]))
StmtText
-----------------------------
|--Clustered Index Scan
(OBJECT:([pubs].[dbo].
[authors].[UPKCL_auidind]))
StmtID NodeID Parent
------ ------ ------
2 1 0
PhysicalOp LogicalOp
--------------- ----------------------
NULL NULL
Clustered Index Scan Clustered Index Scan
Argument
-----------------------------------------
1
OBJECT:([pubs].[dbo].[authors].[UPKCL_auidind])
DefinedValues
----------------------------------------
23
…<all columns in table>…
EstimatedRows EstimatedIO EstimatedCPU
------------- ------------ --------------23 NULL NULL
23 0.01878925 5.1899999E-5
AvgRowSize TotalSubtreeCost
---------- -----------------
NULL 3.7682299E-2
111 3.7682299E-2
OutputList
----------------------------------------
NULL
…<all columns in table>…
Warnings Type Parallel EstimateExecutions
-- --------- -------- ------------------
NULL SELECT 0 NULL
NULL PLAN_ROW 0 1.0
There’s a big difference in the two, eh? The SHOWPLAN_ALL statement returns a lotof useful tuning information, but it is hard to understand and apply. (If there is
enough interest, we might cover this command in a future white paper).

7/28/2019 Finding and Fixing Bad SQL in Microsoft SQL Server 2000
http://slidepdf.com/reader/full/finding-and-fixing-bad-sql-in-microsoft-sql-server-2000 17/44
Finding and Fixing Bad SQL in Microsoft SQL Server 2000
14
SHOWPLAN Operations
Some of the SHOWPLAN operations, sometimes called tags, use plain English toexplain what SQL Server is doing, while others are puzzling. These operations are
divided into physical operations or logical operations. Physical operators describethe physical algorithm used to process the query, for example, performing an index
seek. Logical operators describe the relational algebra operation used by thestatement, such as an aggregation. SHOWPLAN results are broken down into steps.
Each physical operation of a query is represented as a separate step. Steps usuallyhave an accompanying logical operator, but not all steps involve logical operations.
In addition, most steps have an operations (either logical or physical) and anargument . Arguments are the component of the query that the operation affects.
A discussion of all of the execution plans steps would be prohibitively large. Instead
of reviewing them all here, please refer to the Quest white paper “SHOWPLAN Outputand Analysis” available at the URLs sited at the beginning of the white paper.
Reading the Query Plan
Rather than show examples embedded within the descriptions of the logical and
physical operations, I’ve broken them out separately. That’s because a single
example might illustrate the use and effectiveness of several operators at once.
Getting Started
Let’s start with some simple examples to help you understand how to read the
query plan that is returned when you either issue the command SET SHOWPLAN_TEXT ON or enable the option of the same name in the SQL QueryAnalyzer configuration properties. (I’ll be using pubs..big_sales, an identical copyof the pubs..sales table except with about 80,000 records, as the main source for
examples of simple explain plans.)
The simplest query, as shown below, will scan the entire clustered index if one
exists. Remember that the clustered key is the physical order in which the data iswritten. Consequently, if a clustered key exists, you’ll be able to avoid the dreadedtable scan. Even if you select a column that is not specifically mentioned in the
clustered key, such as ord_date, the query engine will use a clustered index scan to
return the result set.
SELECT *
FROM big_sales
SELECT ord_date
FROM big_sales
StmtText
-----------------------------------------------------------------------------
|--Clustered Index Scan(OBJECT:([pubs].[dbo].[big_sales].[UPKCL_big_sales]))

7/28/2019 Finding and Fixing Bad SQL in Microsoft SQL Server 2000
http://slidepdf.com/reader/full/finding-and-fixing-bad-sql-in-microsoft-sql-server-2000 18/44
White Paper
15
The queries shown above return very different quantities of data, so the query withthe smaller result set (ord_date) will perform faster than the other query simply
because of much lower I/O. However, the query plans are virtually identical.
You can improve performance by utilizing alternate indexes. For example, a non-clustered index exists on the title_id column:
SELECT title_id
FROM big_sales
StmtText
---------------------------------------------------------------------
|--Index Scan(OBJECT:([pubs].[dbo].[big_sales].[ndx_sales_ttlID]))
The above query performs in a fraction of the time of the SELECT * query because itcan answer its needs entirely from the non-clustered index. This type of query is called
a covering query because the entire result set is covered by a non-clustered index.
SEEK Versus SCAN
One of the first things you’ll need to distinguish in a query plan is the differencebetween a SEEK and a SCAN operation.
A very simple but useful rule of thumb is that SEEK operations are good while SCAN operations are less-than-good, if not downright bad. Seeks go directly, or at least veryquickly, to the needed records while scans read the whole object (either table, clusteredindex, or non-clustered index). Thus, scans usually consume more resources than seeks.
If your query plan shows only scans, then you should consider tuning the query.
The WHERE clause can make a huge difference in query performance, asshown below:
SELECT *
FROM big_sales
WHERE stor_id = '6380'
StmtText
-----------------------------------------------------------------------------
|--Clustered Index Seek(OBJECT:([pubs].[dbo].[big_sales].[UPKCL_big_sales]),
SEEK:([big_sales].[stor_id]=[@1]) ORDERED FORWARD)

7/28/2019 Finding and Fixing Bad SQL in Microsoft SQL Server 2000
http://slidepdf.com/reader/full/finding-and-fixing-bad-sql-in-microsoft-sql-server-2000 19/44
Finding and Fixing Bad SQL in Microsoft SQL Server 2000
16
The query above is now able perform a SEEK rather than a SCAN on the clusteredindex. The SHOWPLAN describes exactly what the seek operation is based upon
(stor_id) and that the results are ORDERED according to how they are currently
stored in the index mentioned. Since SQL Server 2000 now supports forward andbackware scrolling through indexes with equal performance, you may see ORDERED
FORWARD or ORDERED BACKWARD in the query plan. This merely tells you whichdirection the table or index was read. You can even manipulate this behavior by
using the ASC and DESC keywords in your ORDER BY clauses.
Range query return query plans that look very similar to the direct query shownbefore. The following two range queries give you an idea:
SELECT *
FROM big_sales
WHERE stor_id >= '7131'
StmtText
-----------------------------------------------------------------------------
|--Clustered Index Seek(OBJECT:([pubs].[dbo].[big_sales].[UPKCL_big_sales]),
SEEK:([big_sales].[stor_id] >= '7131') ORDERED FORWARD)
The above query looks a lot like the previous example, except the SEEK predicate is
somewhat different.
SELECT *
FROM big_sales
WHERE stor_id BETWEEN '7066' AND '7131'
StmtText
-----------------------------------------------------------------------------
|--Clustered Index Seek(OBJECT:([pubs].[dbo].[big_sales].[UPKCL_big_sales]),
SEEK:([big_sales].[stor_id] >= '7066' AND [big_sales].[stor_id] <= '7131')
ORDERED FORWARD)
This one also looks about the same. Only the SEEK predicate has changed. Because
the SEEK is a very rapid operation, this query is a pretty good one.
SEEK and SCAN operations may also involve a WHERE predicate. In this case, thepredicate tells you what records the WHERE clause filters from the result set.
Because this is done as a component of the SEEK or SCAN operation, the WHEREpredicate often neither hurts nor helps performance of the operation itself. What
the WHERE clause does do is help the query optimizer find the best possibleindexes to apply to the query.

7/28/2019 Finding and Fixing Bad SQL in Microsoft SQL Server 2000
http://slidepdf.com/reader/full/finding-and-fixing-bad-sql-in-microsoft-sql-server-2000 20/44
White Paper
17
An important part of query tuning is figuring out if you are performing SEEK operations on any indexes and, if so, if you are hitting the best indexes possible.
Most of the time, the query engine will do an excellent job of hitting the indexesthat exist. But three common issues arise involving indexes:
1. The database architect, often the application developer, did not put any indexes on the tables.
2. The database architect did not make good guesses as to the type of queries or transactions that would commonly go against the tables, so any
indexes or primary keys on the table are not effective.
3. The database architect made good guesses at indexing tables when theywere created, but the transaction load has changed over time rendering
the indexes less effective.
If you see a lot of scans in your query plan and not many seeks, you shouldreevaluate your indexes. (Refer to the white paper entitled "Indexing Strategies"
for more details on Index Tuning.) For example, look at the query below:
SELECT ord_num
FROM sales
WHERE ord_date IS NOT NULL
AND ord_date > 'Jan 01, 2002 12:00:00 AM'
StmtText
-----------------------------------------------------------------------------
|--Clustered Index Scan(OBJECT:([pubs].[dbo].[sales].[UPKCL_sales]),
WHERE:([sales].[ord_date]>'Jan 1 2002 12:00AM'))
The query above has a WHERE clause against the ord_date column, yet no index
seek operation takes place! When looking at the table, we see that there is no index
on the ord_date column but there probably should be. If we add one, the queryplan looks like this:
StmtText
-----------------------------------------------------------------------------
|--Index Seek(OBJECT:([pubs].[dbo].[sales].[sales_ord_date]),
SEEK:([sales].[ord_date] > 'Jan 1 2002 12:00AM') ORDERED FORWARD)
Much better! Now the query is performing an INDEX SEEK operation on the
sales_ord_date index that we just created.

7/28/2019 Finding and Fixing Bad SQL in Microsoft SQL Server 2000
http://slidepdf.com/reader/full/finding-and-fixing-bad-sql-in-microsoft-sql-server-2000 21/44
Finding and Fixing Bad SQL in Microsoft SQL Server 2000
18
Branching Steps Illustrated by Comparing Joins andSubqueries
An old rule of thumb says that joins are much better performing than a subquery
that achieves the same result set. Let’s see!
SELECT au_fname, au_lname
FROM authors
WHERE au_id IN
(SELECT au_id FROM titleauthor)
StmtText
-----------------------------------------------------------------------------
|--Nested Loops(Inner Join, OUTER REFERENCES:([titleauthor].[au_id]))
|--Stream Aggregate(GROUP BY:([titleauthor].[au_id]))
| |--Index Scan(OBJECT:([pubs].[dbo].[titleauthor].[auidind]), ORDERED FORWARD)
|--Clustered Index Seek(OBJECT:([pubs].[dbo].[authors].[UPKCL_auidind]),
SEEK:([authors].[au_id]=[titleauthor].[au_id]) ORDERED FORWARD)
Table 'authors'. Scan count 38, logical reads 76, physical reads 0, read-ahead reads 0.
Table 'titleauthor'. Scan count 2, logical reads 2, physical reads 1, read-ahead reads 0.
In this case, the query engine chooses a nested loop operation. The query is forced
to read the entire authors table using a clustered index seek, chalking up quite a
logical page reads in the process. Note that in queries with branching steps, the
indented lines show you which steps are branches off of other steps.
Now, let’s look at a join.
SELECT DISTINCT au_fname, au_lname
FROM authors AS a
JOIN titleauthor AS t ON a.au_id = t.au_id
StmtText
-----------------------------------------------------------------------------
|--Stream Aggregate(GROUP BY:([a].[au_lname], [a].[au_fname]))
|--Nested Loops(Inner Join, OUTER REFERENCES:([a].[au_id]))
|--Index Scan(OBJECT:([pubs].[dbo].[authors].[aunmind] AS [a]), ORDERED FORWARD)
|--Index Seek(OBJECT:([pubs].[dbo].[titleauthor].[auidind] AS [t]),
SEEK:([t].[au_id]=[a].[au_id]) ORDERED FORWARD)
Table 'titleauthor'. Scan count 23, logical reads 23, physical reads 0, read-aheadreads 0.
Table 'authors'. Scan count 1, logical reads 1, physical reads 0, read-ahead reads 0.

7/28/2019 Finding and Fixing Bad SQL in Microsoft SQL Server 2000
http://slidepdf.com/reader/full/finding-and-fixing-bad-sql-in-microsoft-sql-server-2000 22/44
White Paper
19
With the above query, the number of logical reads goes up against the titleauthorstable but goes down for the author’s table. You’ll also notice that the stream
aggregation occurs higher (later) in the query plan.
Comparing Query Plans
You’ll use query plans to compare the relative effectiveness of two separatequeries. For example, you might want to see if one query, compared to another,
adds extra layers of overhead or chooses a different indexing strategy.
In this example, we compare two queries. The first uses SUBSTRING and thesecond uses LIKE :
SELECT *
FROM authors
WHERE SUBSTRING( au_lname, 1, 2 )= 'Wh'
StmtText
-----------------------------------------------------------------------------
|--Clustered Index Scan(OBJECT:([pubs].[dbo].[authors].[UPKCL_auidind]),
WHERE:(substring([authors].[au_lname], 1, 2)='Wh'))
Compare this to a similar query that uses LIKE :
SELECT *
FROM authors
WHERE au_lname LIKE 'Wh%'
StmtText
-----------------------------------------------------------------------------
|--Bookmark Lookup(BOOKMARK:([Bmk1000]), OBJECT:([pubs].[dbo].[authors]))
|--Index Seek(OBJECT:([pubs].[dbo].[authors].[aunmind]),
SEEK:([authors].[au_lname] >= 'WGþ' AND [authors].[au_lname] < 'WI'),
WHERE:(like([authors].[au_lname], 'Wh%', NULL)) ORDERED FORWARD)
Obviously, the second query with its simple INDEX SEEK operation is a simplerquery plan than the first query with its CLUSTERED INDEX SCAN .5

7/28/2019 Finding and Fixing Bad SQL in Microsoft SQL Server 2000
http://slidepdf.com/reader/full/finding-and-fixing-bad-sql-in-microsoft-sql-server-2000 23/44
Finding and Fixing Bad SQL in Microsoft SQL Server 2000
20
Understanding the Impact of Joins
If you read through the different Query Steps earlier in this paper, you saw howmany operations are dedicated to explaining what happens with joins in SQL Server
2000. Every join strategy has its strengths as well as its weaknesses. However,there are certain rare circumstances where the query engine chooses a less efficient
join, usually using a hash or merge strategy when a simple nested loop offersbetter performance.
SQL Server uses three join strategies. They are listed here from least to most
complex:
how much processing, as a percentage, was consumed by each step of the query
plan. This enables you to tell which alternatives are more, or less, costly to the
query engine. You can also run two (or more) queries at once and see which wasthe best performing.
It is also important use SET STATISTICS IO and SET STATISTICS TIME for the mostcomplete metrics performance possible.
Nested Loop
The best strategy for small tables with simple inner joins. It works best
where one table has relatively few records compared to a second table witha fairly large number of records, AND they are both indexed on the joined
columns. Nested loop joins require the least I/O and the fewest
comparisons.
A nested loop cycles through each record in the outer table (hopefully, a small
table) once, then searches the inner table for matches each time to producethe output. There are multiple names for specific nested loop strategies. Forexample, a naïve nested loop join occurs when an entire table or index is
searched. It is called an index nested loop join or a temporary index nested loop join when a regular index or temporary index is used.
Merge
The best strategy for large, similarly sized tables with sorted join columns.
Merge operations sort and then cycle through all of the data to produce theoutput. Good merge join performance is based on having indexes on theproper set of columns, almost always the columns mentioned in the
equality clause of the join predicate.
Merge joins take advantage of the pre-existing sorts by taking a row fromeach input and performing a direct comparison. For example, inner joins
return records where the join predicates are equal. If they aren’t equal, the
record with the lower value is discarded and the next record is picked upand compared. This process continues until all records have been
examined. Sometimes merge joins are used to compare tables in many-to-many relationships. When that happens, SQL Server uses a temporary
table to store rows.

7/28/2019 Finding and Fixing Bad SQL in Microsoft SQL Server 2000
http://slidepdf.com/reader/full/finding-and-fixing-bad-sql-in-microsoft-sql-server-2000 24/44
White Paper
21
If a WHERE clause also exists on a query using a merge join, then themerge join predicate is evaluated first. Then, any records that make it past
the merge join predicate are then evaluated by the other predicates in theWHERE clause. Microsoft calls this a residual predicate.
Hash
The best strategies for large, dissimilarly sized tables, or complex joinrequirements where the join columns are not indexed or sorted is a
hashing join. Hashing is used for UNION, INTERSECT, INNER, LEFT, RIGHT,
and FULL OUTER JOIN, as well as set matching and difference operations.Hashing is also used for joining tables where no useful indexes exist. Hash
operations build a temporary hashing table and then cycle through all of the data to produce the output.
Hashes use a build input (always the smaller table) and a probe input. The
hash key (that is, the columns in the join predicate or sometimes in theGROUP BY list) is what the query uses to process the join. A residual
predicate is any evaluations in the WHERE clause that do not apply to the join itself. Residual predicates are evaluated after the join predicates.
There are several different options that SQL Server may choose from whenconstructing a hash join, in order of precedence:
In-memory Hash: In-memory hash joins build a temporary hash table in
memory by first scanning the entire build input into memory. Each record
is inserted into a hash bucket based on the hash value computed for thehash key. Next, the probe input is scanned record by record. Each probe
input is compared to the corresponding hash bucket and, where a match isfound, returned in the result set.
Hybrid Hash: If the hash is only slightly larger than available memory,SQL Server may combine aspects of the in-memory hash join with thegrace hash join in what is called a hybrid hash join.
Grace Hash: The grace hash option is used when the hash join is too large
to be processed in memory. In that case, the whole build input and probe
input are read in. They are then pumped out into multiple, temporaryworktables in a step called partitioning fan-out. The hash function on thehash keys ensures that all joining records are in the same pair of
partitioned worktables. Partition fan-out basically chops two long steps intomany small steps that can be processed concurrently. The hash join is then
applied to each pair of worktables and any matches are returned in the
result set.Recursive Hash: Sometimes the partitioned fan-out tables produced bythe grace hash are still so large that they require further re-partitioning.This is called a recursive hash.
Note that hash and merge joins process through each table once. So you may getdeceptively low I/O metrics should you use SET STATISTICS IO ON with queries of this
nature. However, the low I/O does not mean these join strategies are inherently fasterthan nested loop joins because of their enormous computational requirements.6

7/28/2019 Finding and Fixing Bad SQL in Microsoft SQL Server 2000
http://slidepdf.com/reader/full/finding-and-fixing-bad-sql-in-microsoft-sql-server-2000 25/44
Finding and Fixing Bad SQL in Microsoft SQL Server 2000
22
In the following example, we show both a standard nested loop (using the defaultquery plan) and hash and merge joins (forced through the use of hints):
SELECT a.au_fname, a.au_lname, t.title
FROM authors AS a
INNER JOIN titleauthor taON a.au_id = ta.au_id
INNER JOIN titles t
ON t.title_id = ta.title_id
ORDER BY au_lname ASC, au_fname ASC
StmtText
-----------------------------------------------------------------------------
|--Nested Loops(Inner Join, OUTER REFERENCES:([ta].[title_id]))
|--Nested Loops(Inner Join, OUTER REFERENCES:([a].[au_id]))
| |--Index Scan(OBJECT:([pubs].[dbo].[authors].[aunmind] AS [a]), ORDERED FORWARD)
| |--Index Seek(OBJECT:([pubs].[dbo].[titleauthor].[auidind] AS [ta]),
SEEK:([ta].[au_id]=[a].[au_id]) ORDERED FORWARD)
|--Clustered Index Seek(OBJECT:([pubs].[dbo].[titles].[UPKCL_titleidind] AS [t]),SEEK:([t].[title_id]=[ta].[title_id]) ORDERED FORWARD)
The showplan displayed above is the standard query plan produced by SQL Server.We can force SQL Server to show us how it would handle these as merge and hash
joins using hints:
SELECT a.au_fname, a.au_lname, t.title
FROM authors AS a
INNER MERGE JOIN titleauthor ta
ON a.au_id = ta.au_id
INNER HASH JOIN titles t
ON t.title_id = ta.title_id
ORDER BY au_lname ASC, au_fname ASC
Warning: The join order has been enforced because a local join hint is used.
StmtText
-----------------------------------------------------------------------------
|--Sort(ORDER BY:([a].[au_lname] ASC, [a].[au_fname] ASC))
|--Hash Match(Inner Join, HASH:([ta].[title_id])=([t].[title_id]),
RESIDUAL:([ta].[title_id]=[t].[title_id]))
|--Merge Join(Inner Join, MERGE:([a].[au_id])=([ta].[au_id]),
RESIDUAL:([ta].[au_id]=[a].[au_id]))
| |--Clustered Index Scan(OBJECT:([pubs].[dbo].[authors].[UPKCL_auidind]AS [a]), ORDERED FORWARD)
| |--Index Scan(OBJECT:([pubs].[dbo].[titleauthor].[auidind] AS [ta]),
ORDERED FORWARD)
|--Index Scan(OBJECT:([pubs].[dbo].[titles].[titleind] AS [t]))
In this example, you can clearly see that each join considers the join predicate of
the other join to be a residual predicate. (You’ll also note that the use of a hintcaused SQL Server to issue a warning.) This query was also forced to use a SORT
operation to support the hash and merge joins.

7/28/2019 Finding and Fixing Bad SQL in Microsoft SQL Server 2000
http://slidepdf.com/reader/full/finding-and-fixing-bad-sql-in-microsoft-sql-server-2000 26/44
White Paper
23
USING GRAPHIC EXPLAIN PLAIN IN MICROSOFT
QUERY ANALYZER
In the previous sections, you have learned how you can apply different MicrosoftSQL Server techniques to tune SQL statements. The use of tools when tuning SQL
statements is crucial to improve productivity and eliminate user errors. This sectionwill explain how you can use different tools to boost SQL performance and your
productivity.
Microsoft SQL Server includes the Query Analyzer tool that enables users to writeand execute SQL statements and T-SQL scripts. The Query Analyzer graphically
displays execution plans before executing the SQL statements or after SQLexecution. The Display Estimated Execution Plan option under the Query menu
displays the query plan that SQL Server will use to execute the SQL statement. The
Show Execution Plan option under the Query menu displays the query plan used by
SQL Server during SQL execution. The graphical execution plan uses icons torepresent the steps and data retrieval methods that SQL Server chose to execute
the SQL statement. The execution plan is the graphical representation of the
tabular output produced by the SET SHOWPLAN_ALL or SET SHOWPLAN_TEXT statements as illustrated in Figure 3.
Figure 3. Query Analyzer’s graphical execution plan.

7/28/2019 Finding and Fixing Bad SQL in Microsoft SQL Server 2000
http://slidepdf.com/reader/full/finding-and-fixing-bad-sql-in-microsoft-sql-server-2000 27/44
Finding and Fixing Bad SQL in Microsoft SQL Server 2000
24
By looking at the execution plan operations, you can get an understanding on theperformance characteristics of a SQL statement and identify the need for tuning.
Execution plans can get very complicated when working with complex SQLstatements. This increases the difficulty for a user to read and locate performance
inefficiencies in the execution plan. If you determine that the SQL statement needstuning, you can use the Query Analyzer to manually tune the SQL statement. To
manually tune the SQL statement, you will need to open a new window inside theQuery Analyzer, reformulate the SQL statement using some of the techniques
presented in this document, review the execution plan and execute the SQL to
obtain the run time. You can repeat this process manually until you find analternative SQL statement with satisfactory performance.
Limitations of Native Tool Tuning
There are a number of limitations you may encounter when using native tools such
as Windows PerfMon, SQL Profiler and Query Analyzer:
• Extra overhead imposed on the SQL Server by SQL Profiler and byWindows PerfMon.
• Requires deep expertise in Windows PerfMon, SQL Profiler, and reading
SQL query execution plans on the part of the tuner.
• Time consuming process at each step.
• Requires guesswork that may inject unintentional errors into the process.
The native tools used to tune bad SQL have many limitations. For example, it isessential that the person performing the tuning have a deep expertise in SQLcoding to ensure good decisions about reforming a complex SQL statement.
Furthermore, when changing the SQL code, the human expert can make mistakesthat can lead to an alternative SQL statement that does not return the same result
set as the original SQL statement. In addition, since the process is manuallyintensive, the number of SQL alternatives that the user can try is limited by the
time the user can spend figuring out new ways to write the SQL statement.
To make the whole process of finding and fixing bad SQL, avoid user errors, andsave time it is essential to use a tool that automates the entire SQL tuning process.

7/28/2019 Finding and Fixing Bad SQL in Microsoft SQL Server 2000
http://slidepdf.com/reader/full/finding-and-fixing-bad-sql-in-microsoft-sql-server-2000 28/44
White Paper
25
FINDING AND FIXING BAD SQL USING THE
QUEST TOOLS
Quest’s methodology is to close the gaps in the native tool kit by offering acomplete solution to simplify the process, make it more efficient, and reduce the
total amount of manual work involved. The Quest methodology also allows even a junior person to perform the tasks that would normally be assigned to a more
senior DBA or developer. Quest’s methodology focuses on three steps:
• Detect
• Diagnose
• Resolve
The three-step process is direct and simple. Detect that there is a problemsituation. Diagnose the cause of the problem quickly and efficiently without
imposing high overhead on the system. Resolve the problem rapidly and withminimal impact to SQL Server’s performance.
Detecting Bad SQL with Quest’s Spotlight onSQL Server
By using Windows Performance Monitor, it can take a long time to find quantitativeproof that your server is performing poorly due to bad SQL. In addition, it takes
extensive knowledge of which performance counters to use and what valuesindicate poor performance. Quest takes all of that guesswork out of the situation
with Spotlight for SQL Server.
Spotlight for SQL Server, as shown in Figure 4, provides historical and real-timediagnostics for all critical SQL Server components in a single simple interface,
alerting you to potential bottlenecks and problem areas, as well as their causes. In
addition, Spotlight for SQL Server provides detailed best practices and informationfor almost every problem area so that you can resolve issue squickly and efficiently.
For example, Spotlight on SQL Server makes it easy to see which users (SPIDs) areconsuming the most CPU and/or IO resources. You could then example the SQL of
those SPIDs and, if you choose, tune the SQL statement using Quest Central for
SQL Server—SQL Tuning (described later).

7/28/2019 Finding and Fixing Bad SQL in Microsoft SQL Server 2000
http://slidepdf.com/reader/full/finding-and-fixing-bad-sql-in-microsoft-sql-server-2000 29/44
Finding and Fixing Bad SQL in Microsoft SQL Server 2000
26
Figure 4: Example of Quest’s Spotlight on SQL Server
Using the metaphor of a dashboard, Spotlight instantaneously conveys the status of
every major area of SQL Server using the “green is good, yellow is caution, red isbad” paradigm. Users can then drill down to locate in-depth information about the
source of a problem. And because the run-time nature of each SQL Server isunique, Spotlight calibrates itself to ‘normal’ activity for each server. This allowsSpotlight to automatically set the speed of the internal flows and other activity
indicators. When a threshold is exceeded, Spotlight sends a visual or audible alert.
Detecting and Diagnosing Bad SQL withQuest’s Performance Analysis on SQL Server
Quest Central Performance Analysis for SQL Server is the industry’s best tool for
finding and fixing bad SQL on the Microsoft SQL Server platform. Performance
Analysis does this by capturing performance data for SQL statements and other keyevents through our StealthCollect® technology, which enables the user to quicklyidentify the root cause of performance problems and take corrective action.
Performance Analysis then saves all performance data to a repository so that you
can analyze both real-time and historic performance for any monitored SQL Server.

7/28/2019 Finding and Fixing Bad SQL in Microsoft SQL Server 2000
http://slidepdf.com/reader/full/finding-and-fixing-bad-sql-in-microsoft-sql-server-2000 30/44
White Paper
27
StealthCollect gathers performance data from the SQL Server memory workspaceof Windows by sampling at sub-second intervals. The general process is called
“memory scraping”, and is completely non-intrusive to the SQL Server instance.The DBA can set the sampling rate at high as 20 times per second, or by specifying
a minimum sampling rate or a maximum percentage of CPU resource to be used.
In general, the overhead of the StealthCollect process is less than 1 percent.StealthCollect samples a number of performance metrics, all based on SQL Server
waitstates:
• CPU Usage
• CPU Wait
• Cursor Synchronization
• I/O Wait
• Lock Wait
• Latch Wait
• Log Wait
• Network Wait
• Parallel Coordination
• Remote Provider
• Other Wait
In addition to capturing performance metrics for each SQL Statement, a another
important feature of QC Performance Analysis for SQL Server, “change tracking”,captures key changes in your SQL Server database including changes including:
• Changes in SQL Server configuration parameters
• Changes in Schema
• Changes in System Configuration
• Changes in query execution plans
• User defined changes
All of these changes can impact the performance of the overall performance of SQL
Server instance and SQL Statements specifically. Captured performance data isretained in a long-term repository of historical performance data on a remote SQL
Server instance.

7/28/2019 Finding and Fixing Bad SQL in Microsoft SQL Server 2000
http://slidepdf.com/reader/full/finding-and-fixing-bad-sql-in-microsoft-sql-server-2000 31/44
Finding and Fixing Bad SQL in Microsoft SQL Server 2000
28
Real-time and History Performance Analysis
A GUI interface is provided for the user to view real-time and historic performancedata. The versatile GUI helps the user quickly identify the root cause of
performance problems. The user can view performance from a variety of dimensions, such as by specific SQL statements, T-SQL batches, programs,
databases, OS users, database users or even command types (such as MS-Access,
MS SQL Enterprise Manager, or a middleware application).
To use the interface, the user first selects a time period of interest, then theresource they wish to look at, such as All Resources, Disk I/O, Locks, Latches, Logs
and so forth. These resource perspectives allow the DBA to view historical datafrom different perspective and identify the biggest performance problems in that
area, such as Latches.
Figure 5 shows current sessions for an instance of SQL Server, as well as all of the
SQL statements and the amount of server resources those statements haveconsumed. At the top right, the DBA selects a time period and resource type they
wish to look at. In this case, it is “Workload” which summarizes all wait events forthe session and time period. The graph shown gives a breakdown by wait event for
the time period selected.
Figure 5: Performance Analysis Current Sessions View
Figure 5 represents the “Current” view, which is in real time. Every executed SQL
Statement is tracked by various wait states, for example CPU waits, IO waits,network waits, lock waits, latch waits, log waits, and so on. As you can see in
Figure 5, there is an activity that has triggered increase in the wait states, andconsequently degraded system performance. At this point, by clicking on the
“Current Sessions” node, we can easily find more about the session or sessions that
are contributing to this problem.

7/28/2019 Finding and Fixing Bad SQL in Microsoft SQL Server 2000
http://slidepdf.com/reader/full/finding-and-fixing-bad-sql-in-microsoft-sql-server-2000 32/44

7/28/2019 Finding and Fixing Bad SQL in Microsoft SQL Server 2000
http://slidepdf.com/reader/full/finding-and-fixing-bad-sql-in-microsoft-sql-server-2000 33/44
Finding and Fixing Bad SQL in Microsoft SQL Server 2000
30
We can also get a detailed breakdown of resource consumption for that session,sorted by percentage of total, as shown in Figure 7. For example, Figure 7 shows us
that our resources are spent on the following:
• Lock wait is 43 percent
• Network wait is about 29 percent
• CPU Usage is 11.5 percent
• And so on
Figure 7: Performance Analysis Shows Exact Resource Consumption
At this point, we have identified a bad SQL Statement and can move forward with
fixing it. However, Performance Analysis also accommodates the same set of research tools for performance problems that have occurred in the past. We’ll
demonstrate these capabilities here as well.

7/28/2019 Finding and Fixing Bad SQL in Microsoft SQL Server 2000
http://slidepdf.com/reader/full/finding-and-fixing-bad-sql-in-microsoft-sql-server-2000 34/44
White Paper
31
Figure 8: Performance Analysis Diagnostic History
The user can select from several different “dimensions” to view historical
performance data, as shown in Figure 8. Figure 8 shows a specific time periodselected by the user, and within that time period, there is a spike on the graph
showing an inordinant consumption of resources. The investigation starts by lookingat SQL statements that were executed by a certain user, during that time period. By
default, everything is sorted by “Activity Time” and the most offensive SQLStatement is at the top of the list. The data that populates this screen comes from
the Performance Analysis repository, which is a data warehouse. (Note thatPerformance Analysis is flexible enough to provide several ways for the user to reach
this data. For example: the investigation could have started by looking at SQLstatements that were executed during that time period, then drilled down to look at
Database Users or OS users that were connected during that time period.) Again, we
can quickly identify the most offensive SQL Statement, and move on to tuning it.
Change Tracking and Troubleshooting
Have you ever wondered what impact a particular event, such as adding or deleting
an index, had on the performance of an SQL statement? Performance Analysis’ change tracking feature enables the user to quickly correlate these events withchanges in performance. Figure 9 shows the SQL statement dimension view with
Change Tracking colored “dots” in the top graph, along with a legend, to showwhen these types of events occurred and what effect they had on overall
performance. The text area in the lower right hand side gives the date and
explanation of the “change tracking event”, such as: adding or deleting an index,change in execution plan, change in system or database configuration or a user-defined event This view will help the DBA to associate a particular event with a
change in performance.
7/28/2019 Finding and Fixing Bad SQL in Microsoft SQL Server 2000
http://slidepdf.com/reader/full/finding-and-fixing-bad-sql-in-microsoft-sql-server-2000 35/44
Finding and Fixing Bad SQL in Microsoft SQL Server 2000
32
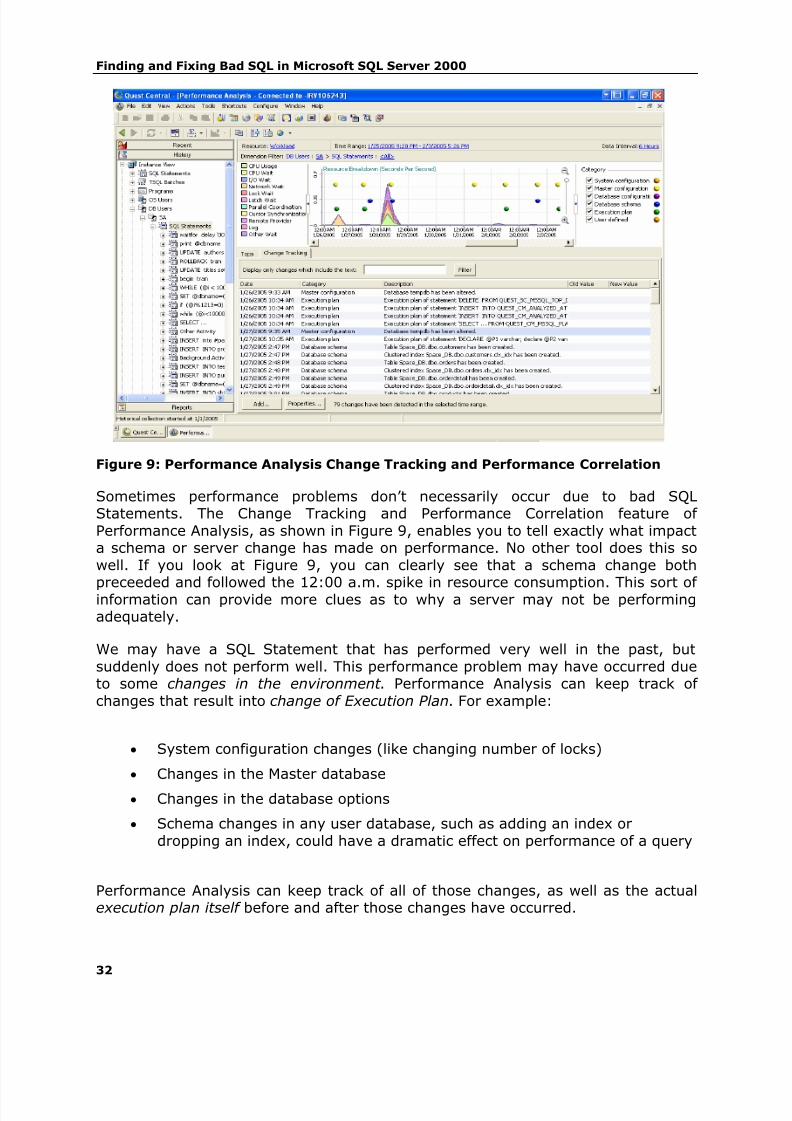
Figure 9: Performance Analysis Change Tracking and Performance Correlation
Sometimes performance problems don’t necessarily occur due to bad SQLStatements. The Change Tracking and Performance Correlation feature of
Performance Analysis, as shown in Figure 9, enables you to tell exactly what impacta schema or server change has made on performance. No other tool does this so
well. If you look at Figure 9, you can clearly see that a schema change both
preceeded and followed the 12:00 a.m. spike in resource consumption. This sort of information can provide more clues as to why a server may not be performingadequately.
We may have a SQL Statement that has performed very well in the past, but
suddenly does not perform well. This performance problem may have occurred dueto some changes in the environment . Performance Analysis can keep track of
changes that result into change of Execution Plan. For example:
• System configuration changes (like changing number of locks)
• Changes in the Master database
• Changes in the database options
• Schema changes in any user database, such as adding an index or
dropping an index, could have a dramatic effect on performance of a query
Performance Analysis can keep track of all of those changes, as well as the actualexecution plan itself before and after those changes have occurred.

7/28/2019 Finding and Fixing Bad SQL in Microsoft SQL Server 2000
http://slidepdf.com/reader/full/finding-and-fixing-bad-sql-in-microsoft-sql-server-2000 36/44
White Paper
33
Resolving Bad SQL with Quest Central for SQLServer—SQL Tuning
Quest Central for SQL Server (QCSS) is an integrated database management
solution that simplifies everyday tasks and incorporates a set of tools that enableusers to achieve higher levels of availability and reliability. Quest Central for SQLServer includes components for Database Administration, Space Management,
Database Analysis and SQL Tuning.
QCSS SQL Tuning integrates a graphical execution plan display, a SQL Scanner thatproactively identifies problematic SQL statements directly from database objects or
source code, and a SQL Optimizer that automatically rewrites the SQL statement inevery possible alternative, making it possible to identify the most-efficient SQL for a
specific database environment.
Graphical Execution Plan
QCSS SQL Tuning offers graphical execution plans in different formats including:tree plan, plain, English plan, graph plan and MS graphic plan (Figure 10). Detailed
information on tables, indexes and columns is displayed. This information enables
you to quickly understand how SQL Server will execute the SQL statement.
Figure 10: Graphical execution plan in Quest Central—SQL Tuning

7/28/2019 Finding and Fixing Bad SQL in Microsoft SQL Server 2000
http://slidepdf.com/reader/full/finding-and-fixing-bad-sql-in-microsoft-sql-server-2000 37/44
Finding and Fixing Bad SQL in Microsoft SQL Server 2000
34
SQL Scanner: Analyzing Multiple SQL Statements forPerformance Inefficiencies
Database applications typically contain thousands of SQL statements. The SQLstatements can be located in database objects such as views and stored
procedures, or application source codes. Without an automated tool the process of extracting and reviewing each SQL statement manually is very tedious and timeconsuming. The SQL Scanner module in QCSS SQL Tuning automates the process
of extracting and reviewing SQL statements directly from source code and offers aproactive approach of identifying potential SQL performance problems (Figure 11).
The SQL Scanner extracts SQL statements embedded in database objects, sourcecode, and Microsoft SQL Server Profiler trace files/tables without any program
execution. The SQL Scanner can extract SELECT, SELECT..INTO, INSERT, DELETE and
UPDATE statements. Once the SQL statements have been extracted, the SQL Scanneranalyzes, in batch, the execution plans of each SQL statement and categorizes themaccording to different levels of complexity and suspected levels of performance
problems. Execution plans with inefficiencies and operations that can cause high I/Osuch as full tables scans on large tables, full tables scans in nested loops or many tablescans are classified as Problematic. The user can specify different thresholds to specifyto the SQL Scanner how to categorize execution plans.7
With this approach, the SQL Scanner allows you to be proactive in the detection of
SQL performance problems. The task of extracting, reviewing and analyzing manySQL statements is simplified and automated with QCSS SQL Tuning.
Figure 11. SQL Scanner, analyzing multiple SQL statements to identifyperformance problems.

7/28/2019 Finding and Fixing Bad SQL in Microsoft SQL Server 2000
http://slidepdf.com/reader/full/finding-and-fixing-bad-sql-in-microsoft-sql-server-2000 38/44
White Paper
35
SQL Optimizer: Rewriting and Benchmarking SQLStatements
Due to the complexity of SQL language, there are many ways to write a SQLstatement to return the same result set. Small SQL code variations can have great
impact on performance. QCSS SQL Tuning’s SQL Optimizer uses a SQLtransformation engine that completely transforms a SQL statement in everypossible equivalent SQL variation, preserving the same logic in each alternative
statement. The SQL rewrite process includes the use of syntactical SQLtransformations and SQL Server hints which are optional for the user. Once the SQL
statement has been transformed, SQL Optimizer obtains the execution plan foreach SQL statement and narrows the optimized statements to those with unique
execution plan (an execution plan is what determines the performance of a SQLstatement). This comprehensive SQL transformation process occurs in the PC, and
does not affect database server resources (Figure 12).
Figure 12. SQL Optimizer automatically rewrites SQL statements8
Upon completion of the optimization process, the SQL optimizer displays a list of SQL alternatives, execution plans and the SQL Server Cost associated with each
execution plan. The user can review the SQL alternatives and determine which toexecute in the database to obtain the run times, I/O information and prove which
statement is the fastest for the database environment.

7/28/2019 Finding and Fixing Bad SQL in Microsoft SQL Server 2000
http://slidepdf.com/reader/full/finding-and-fixing-bad-sql-in-microsoft-sql-server-2000 39/44
Finding and Fixing Bad SQL in Microsoft SQL Server 2000
36
Figure 13. Batch Run, offers a variety of termination and run time selections
The Batch Run function (Figure 13) in the SQL Optimizer allows users to filter SQLstatements to run based on SQL Sever cost. For instance the user may want to run
just the SQL alternatives with a low SQL Server cost. The Batch Run allows the user toestablish how the statements being tested should be terminated if they do not satisfy
performance requirements. The user can also set the test to retrieve all records or firstrecord run time and set the number of executions per SQL statement. Once the batch
run process is started each of the selected SQL statements are executed one by oneand run time information is retrieved. When the process is complete, run time
statistics are displayed (Figure 14).9
Figure14. SQL Optimizer, displays run time statistics

7/28/2019 Finding and Fixing Bad SQL in Microsoft SQL Server 2000
http://slidepdf.com/reader/full/finding-and-fixing-bad-sql-in-microsoft-sql-server-2000 40/44
White Paper
37
Once the most efficient SQL statements have been identified, users can activate theSQL Comparer to view the SQL alternatives side-by-side in order to display the
statistical difference in syntax, execution plan and run time (Figure 15).
Figure 15. SQL Comparer, compare SQL alternatives to understand syntax changes
and performance differences.
Figure 15 shows that you can quickly and efficiently use Quest Central for SQlServer—SQL Tuning to find and implement an alternative SQL statement thatreturns (or otherwise affects) the same data with better performance. All you have
to do at this point is replace the older, bad SQL statement with the new and
improved SQL statement.

7/28/2019 Finding and Fixing Bad SQL in Microsoft SQL Server 2000
http://slidepdf.com/reader/full/finding-and-fixing-bad-sql-in-microsoft-sql-server-2000 41/44
Finding and Fixing Bad SQL in Microsoft SQL Server 2000
38
CONCLUSION
Application performance in a Microsoft SQL Server environment is directly related tothe efficiency of the SQL statements involved. This article exposed several Microsoft
SQL Server techniques employed to tune SQL statements. Tuning SQL statementsby hand or by using SQL Server native utilities is a labor and knowledge-intensive
task. Quest Central for SQL Server—SQL Tuning offers a solution that automatesthe process of SQL tuning, saving DBAs and developers time, decreasing the
amount of experience and knowledge required, increasing their productivity andmaximizing the performance of SQL statements throughout your Microsoft SQL
Server systems.

7/28/2019 Finding and Fixing Bad SQL in Microsoft SQL Server 2000
http://slidepdf.com/reader/full/finding-and-fixing-bad-sql-in-microsoft-sql-server-2000 42/44
White Paper
39
ABOUT THE AUTHOR
Kevin Kline serves as the Director of Technology for SQL Server products at QuestSoftware, designing products for SQL Server DBAs and database developers. Kevin
is author of five books, including the very popular "SQL in a Nutshell, 2nd Edition"and "Transact-SQL Programming" (both published by O'Reilly & Associates
www.oreilly.com), and numerous magazine and online articles. Kevin is also aMicrosoft MVP (www.microsoft.com/mvp) for SQL Server. Kevin is active in the SQL
Server community, serving as President of the Professional Association for SQLServer (www.sqlpass.org), an international professional association for individuals
working with Microsoft SQL Server. When he's not spending time on database
technology, Kevin enjoys romancing his wife, spending time with his four children,practicing classical guitar (very badly) and gardening.
Claudia Fernandez is a Product Manager of SQL Tuning products at QuestSoftware. Claudia has contributed to the strategic direction of SQL tuning products
for multiple RDBMS since early 2000. She has presented at several technical
conferences on RDBMS and Application Performance Tuning topics. Claudia holds aMS in Computer Science and has several years of industry experience working withSQL Server, Sybase ASE, Oracle, DB2 UDB and other associated technologies. She
enjoys movies and traveling.
William Davis, Product Manager for Quest’s Performance Analysis, and Hassan Fahimi,
SQL Server Domain Expert, contributed additional material for this white paper.
Some materials adapted from "Transact-SQL Programming" (O'Reilly & Associates, ISBN:1565924010) by Kevin Kline, Lee Gould, and Andrew Zanevsky,http://www.oreilly.com/catalog/wintrnssql/ .

7/28/2019 Finding and Fixing Bad SQL in Microsoft SQL Server 2000
http://slidepdf.com/reader/full/finding-and-fixing-bad-sql-in-microsoft-sql-server-2000 43/44
Finding and Fixing Bad SQL in Microsoft SQL Server 2000
40
ABOUT QUEST SOFTWARE, INC.
Quest Software, Inc. delivers innovative products that help organizations get moreperformance and productivity from their applications, databases and Windows
infrastructure. Through a deep expertise in IT operations and a continued focus onwhat works best, Quest helps more than 18,000 customers worldwide meet higher
expectations for enterprise IT. Quest Software can be found in offices around theglobe and at www.quest.com.
Contacting Quest Software
Phone: 949.754.8000 (United States and Canada)
Email: [email protected]
Mail: Quest Software, Inc.World Headquarters5 Polaris Way
Aliso Viejo, CA 92656
USA
Web site www.quest.com
Please refer to our Web site for regional and international office information.
Contacting Quest Support
Quest Support is available to customers who have a trial version of a Quest product
or who have purchased a commercial version and have a valid maintenancecontract. Quest Support provides around the clock coverage with SupportLink, ourweb self-service. Visit SupportLink at http://support.quest.com
From SupportLink, you can do the following:
• Quickly find thousands of solutions (Knowledgebase articles/documents).
• Download patches and upgrades.
• Seek help from a Support engineer.
• Log and update your case, and check its status.
View the Global Support Guide for a detailed explanation of support programs,online services, contact information, and policy and procedures. The guide is
available at: http://support.quest.com/pdfs/Global Support Guide.pdf

7/28/2019 Finding and Fixing Bad SQL in Microsoft SQL Server 2000
http://slidepdf.com/reader/full/finding-and-fixing-bad-sql-in-microsoft-sql-server-2000 44/44
White Paper
NOTES
1 Other white papers are referenced from time to time throughout this document. For
example, there are a large number of white papers and Webcast archives available for
download that describe specific best practices and coding techniques for writing high-performance SQL statements.
Unless otherwise noted, please refer to http://www.quest.com/whitepapers/#ms_sql_server
to download the additional white papers. In addition to the white papers, you can listen to avariety of pre-recorded Webcasts, presented by Kevin Kline, available at
http://www.quest.com/events/list.aspx?searchoff=true&contenttypeid=15
2 The Quest white paper entitled “Performance Baselining, Benchmarking, and Monitoring” gives a detailed discussion of the best PerfMon counters to use when monitoring SQL Server
2000. This white paper also provides a great deal of information about how best to useWindows PerfMon.
3 These commands also work on Sybase Adaptive Server, though some results sets maylook somewhat different.
4 Most examples are based on either the PUBS database or on SQL Server system tables.
For my examples, we added tens of thousands of rows to many tables so that the queryoptimizer has some real work to do when evaluating query plans.
5 When comparing query plans to find the best one, we actually prefer to use either SET
STATISTICS PROFILE ON or the Graphic Execution Plan feature of SQL Query Analyzerrather than SET SHOWPLAN_TEXT ON . These tools will show you exactly.
6 Hash joins, in particular, are computationally expensive. If you find certain queries in a
production application consistently using hash joins, this is your clue to tune the query oradd indexes to the underlying tables.
7 The SQL Scanner can extract SQL statements from database objects such as stored
procedures, views and triggers, Microsoft SQL Server Profiler trace files and tables, and anyfile in text or binary format with embedded SQL such as Visual Basic, COBOL, T-SQL scripts,
HTML, and others.
8 The SQL Optimizer completely transforms a SQL statement by applying SQL code changes
and SQL Server hints. You can enable or disable the use of hints. You can control theintensity of the SQL transformation process by increasing or decreasing the Optimizer’s
Intelligence Level.
9
The SQL Optimizer can optimize SELECT, SELECT..INTO, INSERT, DELETE and UPDATEstatements. In the Batch Run, the SQL alternatives are executed inside a transaction that is
rolled back.