Embed Size (px)
Citation preview
Finding Analogies in Semantic Networks using the
Singular Value Decomposition
by
Jayant Krishnamurthy
Submitted to the Department of Electrical Engineering and ComputerScience
in partial fulfillment of the requirements for the degree of
Master of Engineering in Computer Science and Engineering
at the
MASSACHUSETTS INSTITUTE OF TECHNOLOGY
June 2009
c© Massachusetts Institute of Technology 2009. All rights reserved.
Author . . . . . . . . . . . . . . . . . . . . . . . . . . . . . . . . . . . . . . . . . . . . . . . . . . . . . . . . . . . . . .Department of Electrical Engineering and Computer Science
May 22, 2009
Certified by. . . . . . . . . . . . . . . . . . . . . . . . . . . . . . . . . . . . . . . . . . . . . . . . . . . . . . . . . .Henry LiebermanResearch ScientistThesis Supervisor
Accepted by . . . . . . . . . . . . . . . . . . . . . . . . . . . . . . . . . . . . . . . . . . . . . . . . . . . . . . . . .Arthur C. Smith
Chairman, Department Committee on Graduate Theses

2
Finding Analogies in Semantic Networks using the Singular
Value Decomposition
by
Jayant Krishnamurthy
Submitted to the Department of Electrical Engineering and Computer Scienceon May 22, 2009, in partial fulfillment of the
requirements for the degree ofMaster of Engineering in Computer Science and Engineering
Abstract
We present CrossBridge, an algorithm for finding analogies in large, sparse se-mantic networks. We treat analogies as comparisons between domains of knowledge.A domain is a small semantic network, i.e., a set of concepts and binary relationsbetween concepts. We treat our knowledge base (the large semantic network) asif it contained many domains of knowledge, then apply dimensionality reduction tofind the most salient relation structures among the domains. Relation structures aresystems of relations similar to the structures mapped between domains in structuremapping[6]. These structures are effectively n-ary relations formed by combiningmultiple pairwise relations. The most salient relation structures form the basis ofdomain space, a space containing all domains of knowledge from the large seman-tic network. The construction of domain space places analogous domains near eachother in domain space. CrossBridge finds analogies using similarity informationfrom domain space and a heuristic search process.
We evaluate our method on ConceptNet[10], a large semantic network of commonsense knowledge. We compare our approach with an implementation of structuremapping and show that our algorithm is more efficient and has superior analogyrecall.
Thesis Supervisor: Henry LiebermanTitle: Research Scientist
3

4

Acknowledgments
I would like to thank my adviser, Henry Lieberman, for suggesting this line of research
and encouraging me along the way. I would also like to thank the members of the
Common Sense Computing group at the MIT Media Lab. This thesis would not have
been possible without the hard work of Catherine Havasi, Rob Speer, Ken Arnold,
Dustin Smith, Jason Alonso, Jesse Mueller and the other members of the group. Ken
Arnold deserves special recognition for the almost daily discussions about the future
of AI and for some really useful Emacs tricks. Catherine Havasi and Rob Speer have
both been great sources of research ideas. I would also like to thank Dustin Smith,
who introduced me to the Common Sense Computing group, and without whom I
never would have found such an interesting area of research. Finally, I would like to
thank Andrew Farrell for coming up with the name “CrossBridge,” which is quite apt
for an analogy algorithm.
I would also like to thank my family for pushing me to do all those important
things (specifically “networking”) that I dislike doing. Although I probably didn’t
seem appreciative at the time, I do appreciate your effort. Thank you.
5

6
Contents
1 Introduction 13
2 Prior Work 17
3 System Design and Implementation 21
3.1 Analogies and Graph Similarity . . . . . . . . . . . . . . . . . . . . . 23
3.1.1 Relation Structures . . . . . . . . . . . . . . . . . . . . . . . . 25
3.1.2 Computing Graph Similarity with Principal Component Analysis 26
3.2 L-Analogies . . . . . . . . . . . . . . . . . . . . . . . . . . . . . . . 32
3.3 CrossBridge . . . . . . . . . . . . . . . . . . . . . . . . . . . . . . 35
3.4 Running Time of CrossBridge . . . . . . . . . . . . . . . . . . . . 36
3.5 Implementation . . . . . . . . . . . . . . . . . . . . . . . . . . . . . . 39
4 Evaluation 41
4.1 ConceptNet . . . . . . . . . . . . . . . . . . . . . . . . . . . . . . . . 41
4.2 Comparison with Structure Mapping . . . . . . . . . . . . . . . . . . 43
4.2.1 Structure Mapping Implementation . . . . . . . . . . . . . . . 43
4.2.2 Running Time Comparison . . . . . . . . . . . . . . . . . . . . 45
4.2.3 Result Comparison . . . . . . . . . . . . . . . . . . . . . . . . 47
4.3 Sensitivity Analysis . . . . . . . . . . . . . . . . . . . . . . . . . . . . 48
5 An Application of CrossBridge 51
5.1 Design . . . . . . . . . . . . . . . . . . . . . . . . . . . . . . . . . . . 51
5.2 Sample User Interaction . . . . . . . . . . . . . . . . . . . . . . . . . 53
7

6 Discussion and Future Work 55
8

List of Figures
3-1 Matching a configured graph with a relation structure. The relation
structure is on the left, and its vertices are labeled with numbers.
The vertices of the graph on the right are mapped to numbers by a
graph configuration. The relation structure only matches when its
vertex labels correspond directly to the graph’s mapped vertex labels.
Therefore there is a match in the top example but not in the bottom
example. . . . . . . . . . . . . . . . . . . . . . . . . . . . . . . . . . . 27
3-2 A plot of the height and weight of 5 people. . . . . . . . . . . . . . . 28
3-3 Projecting height and weight on to the line of best fit. The line of
best fit is the “size” axis, and the projection lines are along the “over-
weight/underweight” axis. The blue points are the locations of each
original point on the “size” axis. . . . . . . . . . . . . . . . . . . . . . 29
3-4 Using the size axis to predict a person’s weight given only their height.
We first choose the size that most accurately describes the person’s
height, then predict their weight from their size. In this case, the
person’s height is 57 inches, resulting in the size indicated by the green
point. From this size, we predict that the person weighs 171 pounds. 30
3-5 A section of the structure matrix M using concepts and relations from
ConceptNet. The rows are configured subgraphs of S and the columns
are relation structures. Each entry of the matrix stores the result of
matching the corresponding relation structure with the corresponding
graph. . . . . . . . . . . . . . . . . . . . . . . . . . . . . . . . . . . . 33
3-6 Pseudocode for the L-Analogies-Online procedure. . . . . . . . . 35
9
3-7 Psuedocode to combine l-vertex analogies into larger analogies. CrossBridge
repeatedly merges smaller analogies with common vertex mappings to
form larger analogies. . . . . . . . . . . . . . . . . . . . . . . . . . . . 37
4-1 A portion of the ConceptNet semantic network. . . . . . . . . . . . . 42
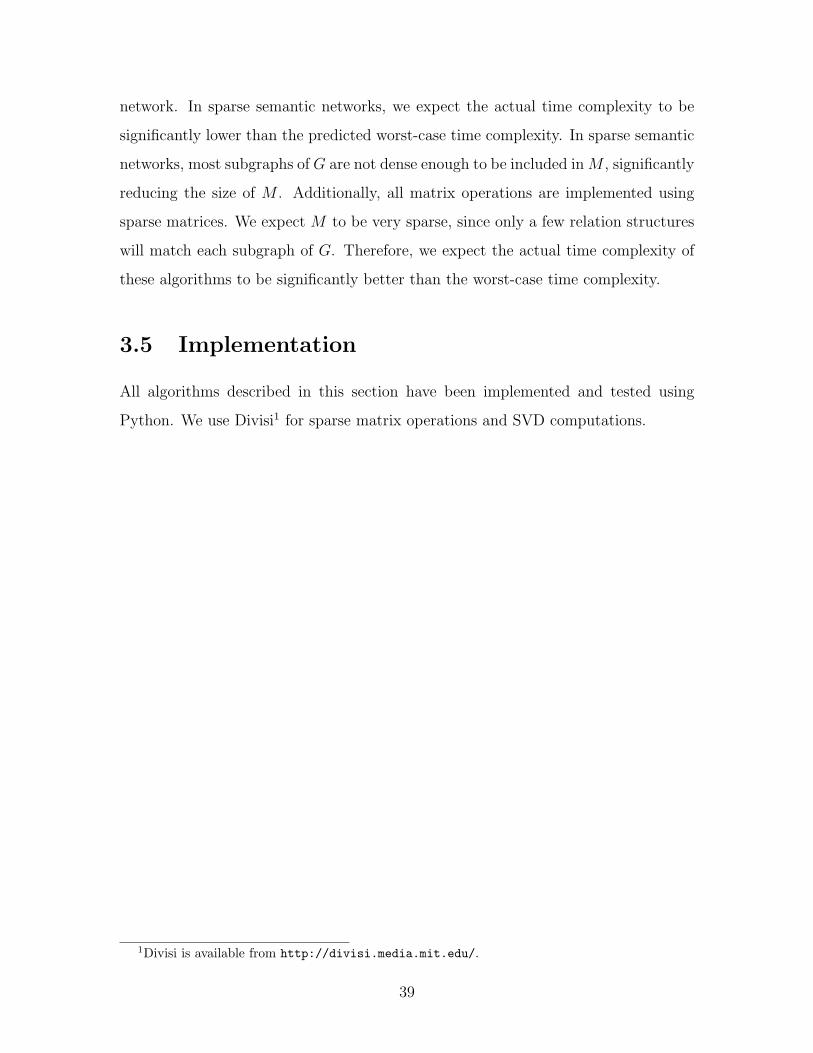
4-2 Some analogies discovered in ConceptNet. Examples were selected
from the top 10 results (in different domains) of CrossBridge. (The
top results typically include many analogies to the same domain, e.g.
{sleep, pillow case, bed, person} and {sleep, pillow case, bed, human}.
We show only one example from each domain here.) . . . . . . . . . . 43
4-3 The average running time of three analogy algorithms as a function of
analogy size. This test was run on the conceptnet-small data set. . 46
5-1 A screenshot of the CrossBridge website before the user enters a query. 53
5-2 A screenshot of the CrossBridge website after the user has entered a
query. In this case, the user has searched for analogies for “atom”. . . 54
10
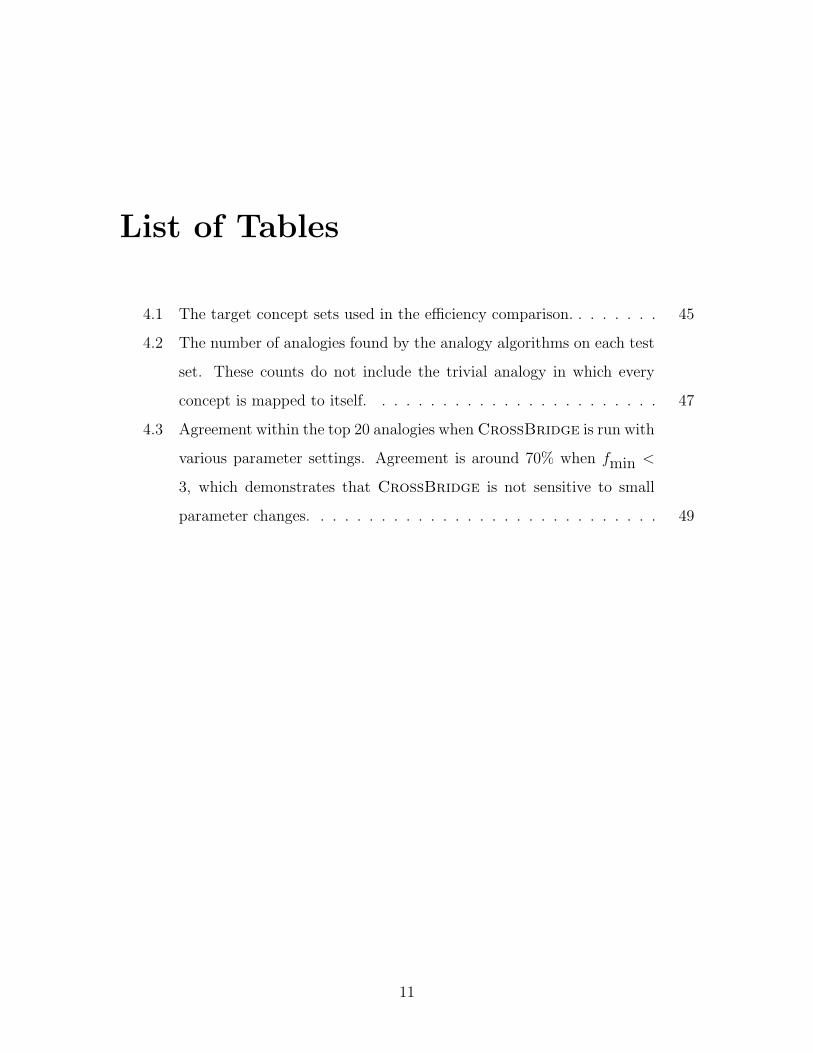
List of Tables
4.1 The target concept sets used in the efficiency comparison. . . . . . . . 45
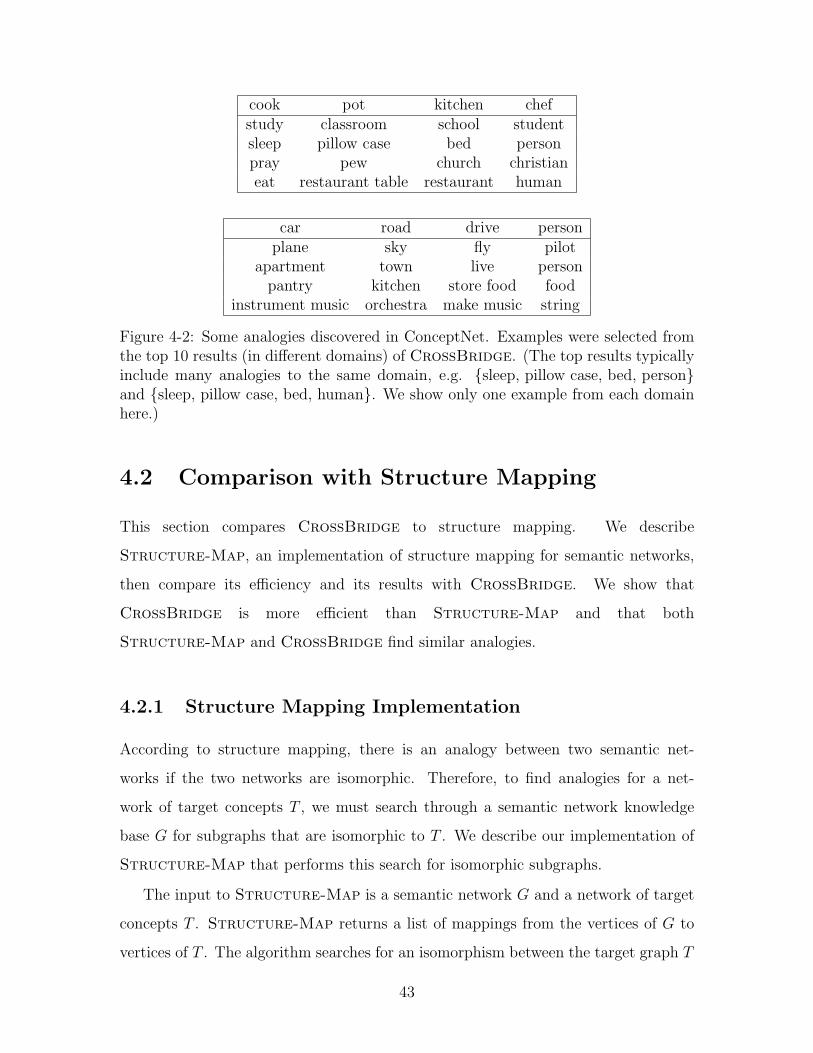
4.2 The number of analogies found by the analogy algorithms on each test
set. These counts do not include the trivial analogy in which every
concept is mapped to itself. . . . . . . . . . . . . . . . . . . . . . . . 47
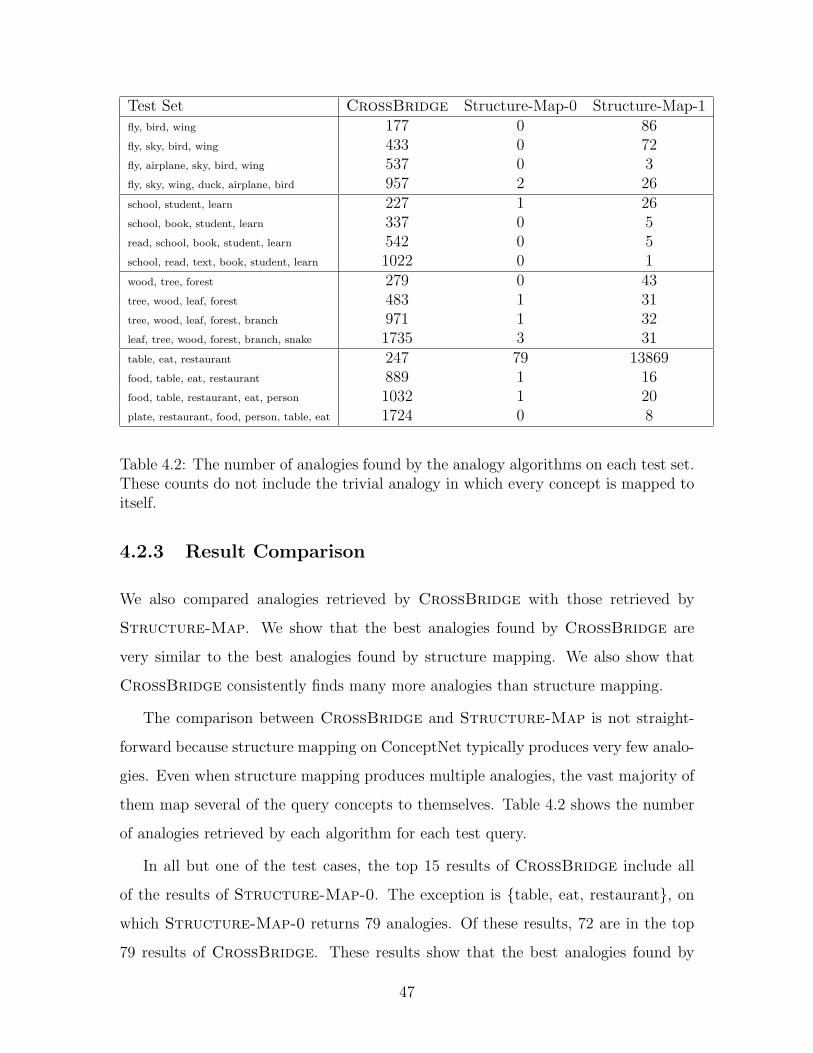
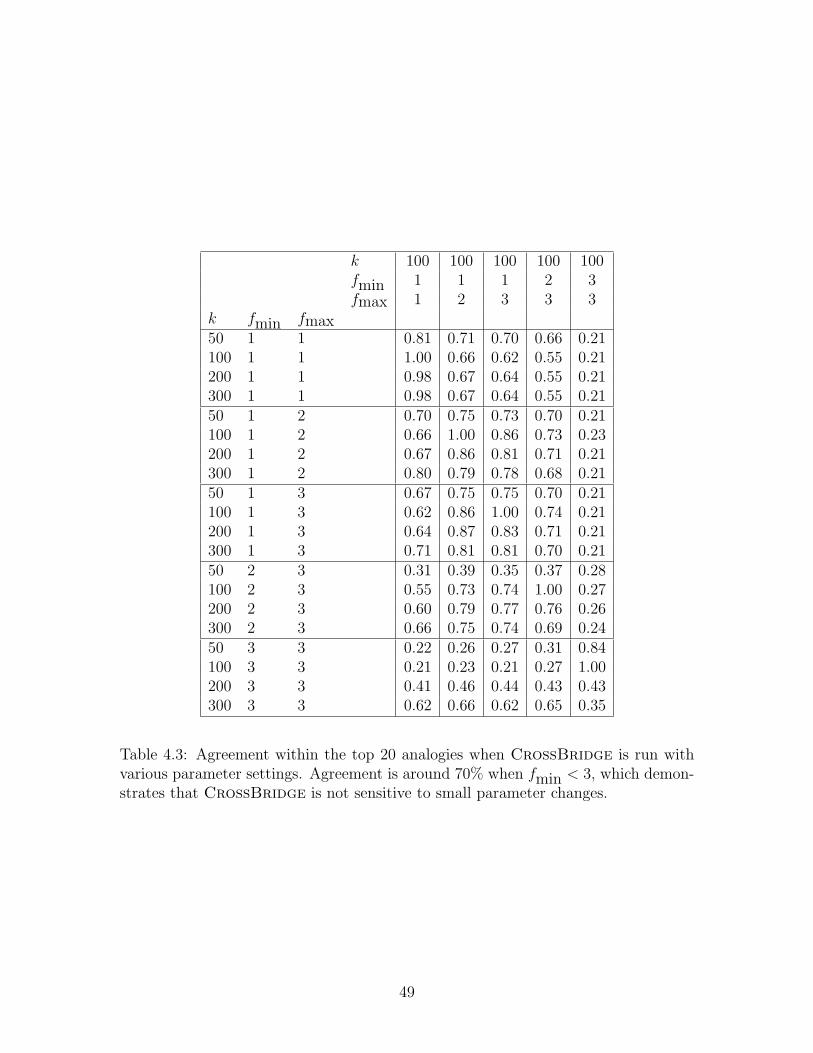
4.3 Agreement within the top 20 analogies when CrossBridge is run with
various parameter settings. Agreement is around 70% when fmin <
3, which demonstrates that CrossBridge is not sensitive to small
parameter changes. . . . . . . . . . . . . . . . . . . . . . . . . . . . . 49
11

12
Chapter 1
Introduction
Analogies are comparisons like “an atom is like the solar system” that highlight
the commonalities between two seemingly dissimilar ideas. People frequently use
analogies to teach others, to solve problems, and to understand unfamiliar situations.
For example, the analogy “an atom is like the solar system” enables us to reason
about protons and electrons using knowledge about the Sun and the Earth. The
prevalence of analogies in human thought makes them an interesting topic for AI
research, and many AI researchers believe that analogies are an important part of
human cognition[20].
Metaphors we Live By [16] examines analogies in everyday human speech and
concludes that our understanding of abstract concepts is largely based on analogies
to concrete concepts. The book calls these pervasive analogies “metaphors,” and the
book provides several examples of common metaphors. An example of a metaphor is
“an argument is like a war.” This metaphor is supported by the expressions we use to
describe arguments: we “defend our position”, we “attack” the opponent’s argument,
we “search for weaknesses” in the opponent’s reasoning and we “marshal” our points.
These pervasive metaphors suggest that analogies are a significant component of
human thought.
Since analogies are such a central part of human cognition, it is interesting to ask
whether computers can find analogies and whether analogies can make computers
behave more intelligently. There is a vast body of work in this area. Structure
13
mapping theory[6] provides a precise definition for analogy, and the definition has
been affirmed by several cognitive studies[7, 8]. Several systems that explore analogies
based on structure mapping have been built[4, 25]. Other analogy programs have
used connectionist models[14] and randomized searches[13, 5]. Applications have
used analogies to solve problems[15] and to explain technical concepts[17].
Analogies are typically described as a mapping from a base domain (sometimes
referred to as the source domain) to a target domain. Each domain consists of a set
of concepts, properties, and relations. A concept is a noun phrase, like “electron” or
“nucleus.” Properties describe attributes of concepts, for example, IsSmall(electron)
says that electrons are small. Relations describe relationships between concepts, for
example, the Orbits(electron, nucleus) says that electrons orbit around the nucleus.
The difference between properties and relations is that properties are functions of
exactly one concept, whereas relations are functions of multiple concepts. Rela-
tions and properties are closely related: we could easily express IsSmall(electron)
as Is(electron, small). This rearrangement is only possible if “small” is one of the
concepts in the domain, however.
An analogy is a correspondence between the concepts of two domains. Depending
on the model, various constraints are placed on the mapping. These constraints fall
into two broad categories: similarity constraints and structural constraints. Similar-
ity constraints attempt to map objects with similar properties to each other, while
structural constraints attempt to preserve relations between concepts. For example, a
similarity constraint would encourage a mapping between “atom” and another small
object because this mapping preserves the IsSmall property. On the other hand,
a structural constraint would encourage a mapping from “electron” to “planet” and
from “nucleus” to “sun” because this mapping preserves the Orbits relation: Or-
bits(electron, nucleus) maps to Orbits(planet, sun).
In the past, the term “analogy” has been used to refer to many different types
of comparisons with different combinations of constraints. The appropriate choice of
constraints depends on the application: simple applications may find that similarity
constraints are sufficient, while complex applications, like case-based reasoning sys-
14
tems, may have much more stringent requirements. In this thesis, we use the term
“analogy” to refer to comparisons with structural constraints. However, we believe
our approach can be extended to more complex constraints. We further discuss this
issue in section 6.
Prior work in this area has typically separated the problem of finding an anal-
ogy for a given concept into four subproblems: retrieval, mapping, elaboration and
evaluation. The retrieval process searches a corpus for promising candidate analo-
gies. These candidates are given to the mapping process, which takes two potentially
analogous concept sets and computes a correspondence between the concepts. Elab-
oration uses the correspondence to infer new knowledge, and evaluation determines
the overall quality of the retrieved analogy.
The body of prior work has focused on the mapping subproblem, which has made
it somewhat impractical for real-world applications. In many practical applications,
retrieval is a large component of the analogy process. For example, when solving a
problem by analogy, we are given only the target domain for the analogy. Finding
an analogy requires searching through a large knowledge base of source domains.
Although the search could be performed by applying the mapping algorithm to every
candidate analogy, this procedure is typically too inefficient to be practical.
Previous analogy algorithms have also operated in completely specified domains.
Real world data sets are typically sparse and noisy, and analogy algorithms should
be designed to handle these issues.
We present an analogy mechanism loosely based on structure mapping that ad-
dresses these limitations of previous approaches. Our method simultaneously ad-
dresses both retrieval and mapping, and is capable of finding analogies in sparse
semantic networks with thousands of vertices. Our approach first uses dimensionality
reduction to find salient systems of relationships (called relation structures) within
the possible source domains. Intuitively, each salient relation structure is a common
way that concepts are related. These salient relation structures form the basis of
domain space. In domain space, every source domain is represented by a point and
the points for analogous domains are located near each other. Our algorithm takes
15

advantage of this property to find analogies.
16
Chapter 2
Prior Work
Analogy has been studied extensively by AI researchers. The first work on analogy is
Evans’ ANALOGY program[3]. ANALOGY solves geometric analogy questions. In
these questions, the program is given three figures a, b, c and a set of candidates figures
D. The goal is to select a figure d ∈ D such that a is to b as c is to d. ANALOGY first
analyzes the geometric figures and computes some relationships between the figures.
The program then generates transformation rules that transform a into b and applies
these rules to c to determine the best match amongst the candidate figures.
Structure mapping[6] is a well-known theory of analogy that defines an analogy
as a comparison between two domains that preserves the relationships between the
objects in each domain. For example, the analogy “an atom is like the solar system”
preserves many relationships: electrons orbit around the nucleus like planets orbit
around the sun, and electricity attracts electrons to the nucleus like gravity attracts
the planets to the sun. Several studies have confirmed that structure mapping cor-
responds to our intuitive notion of analogy[7, 9]. In these cognitive studies, adults
were shown to prefer analogies that preserved relational structure over analogies that
preserved concept properties.
The structure mapping paper uses propositional logic to represent the objects and
relationships in the domains being mapped, but the general principle in the paper
extends to other representations. If the relation types are limited to relations between
two objects, each domain becomes a semantic network, and an analogy becomes an
17
isomorphism between two semantic networks. Two semantic networks are isomorphic
if it is possible to transform one of the graphs into the other graph simply by relabeling
its vertices. Our definition of analogy is closely related to structure mapping in this
simpler domain.
Structure mapping also proposes the criterion of systematicity to evaluate the
quality of an analogy. Systematicity means that higher-order relations are more
important than relations between concepts. In our previous example, this means
the fact that gravity causes the the planets to orbit is more important than the fact
that the planets orbit around the sun. Intuitively, higher-order relations reflect the
fundamental structure of the domain, and this structure is preserved by analogies.
The Structure Mapping Engine[4] implements structure mapping theory in LISP.
The structure mapping engine focuses on the mapping portion of analogy; given two
possibly analogous domains of knowledge, the structure mapping engine finds possible
mappings between the objects of each domain. Domains are represented as logical
propositions. The structure mapping engine algorithm effectively searches for possible
consistent mappings between the two domains (albeit in a smart way), then assigns
each mapping a score using a heuristic. The Structure Mapping Engine has been used
to find analogies between various physical concepts[4] and to find analogies between
shapes[25]. Our work extends the Structure Mapping Engine in several ways. Most
importantly, our algorithm includes the retrieval step of finding an analogy. Many
applications require a program to find a source domain and a mapping for a given
target domain, not just to compute an analogical mapping between two situations.
We believe that retrieval is an important aspect of the problem since naively searching
over all possible base domains and is very expensive.
There are several other programs that implement structure mapping in various
forms. The VivoMind Analogy Engine[23] implements structure mapping as subgraph
isomorphism in conceptual graphs. The VivoMind Analogy Engine also generalizes
structure mapping by searching for graph transformations that aid the mapping pro-
cess. The actual implementation details of this analogy algorithm are proprietary,
which prevents us from making an accurate comparison with our algorithm.
18

Another important class of analogy programs are based on high-level perception[1].
In this paper, the authors criticize the Structure Mapping Engine because the hand-
coded knowledge representation effectively gives away the answer. That is, the anal-
ogy between atoms and solar systems is somewhat obvious because the knowledge
representation encodes the relationships between their parts in the same way. The
paper goes on to criticize any AI technique that separates perception (constructing
representations of data) from cognition (performing inference). Although our algo-
rithm does not construct its own knowledge representation, we believe that our work
avoids the major criticism of the Structure Mapping Engine since our data was not
specifically created for analogy-finding.
High-level perception inspired the construction of several analogy programs. These
programs have a common basic structure that combines a randomized search over
possible representations with a mapping mechanism that identifies common elements
between the representations. The search and mapping processes run in parallel and
influence each other. A notable example is COPYCAT[13], which finds analogies
between strings of letters. Other programs can play simple analogy games[5] and
design fonts[18].
Another class of analogy programs are based on connectionist models. ACME[14]
finds analogies by constructing a network of competing hypotheses, then using an
activation algorithm to settle the state of the network and find the best mapping.
The competing hypotheses are connected by excitatory and inhibitory links. These
links are formed by various guidelines for valid analogies. For example, one of these
guidelines creates an inhibitory link between hypotheses that map the same source
concept to different target concepts. ACME includes both structural and similarity
constraints on the mapped concepts.
AnalogySpace[24] uses the singular value decomposition (SVD) to find similar
concepts in ConceptNet[10]. The similarity of two concepts is based on their shared
properties. Structure mapping calls this type of comparison “superficial similarity”
and distinguishes it from true analogy. For example, a dog is superficially similar to a
cat since they have many attributes in common. AnalogySpace can make these types
19
of similarity comparisons, but cannot perform structure mapping. Our method is
similar to AnalogySpace’s method, but finds analogies according to structure mapping
theory.
The Latent Relational Mapping Engine (LRME)[26] solves SAT analogy questions
using a corpus of websites. The program determines the relationship between two
words by searching the corpus for phrases where the two words occur near each other.
The surrounding words are extracted as the context for the co-ocurrence. Because
the corpus is very large, multiple pairs of words occur in many of the same contexts.
LRME also uses a SVD to find relationships by correlating word contexts and word
pairs. To solve an analogy, LRME finds the pair of target words that is most similar
to the source words. LRME is only capable of finding analogies between two concepts
whereas our method is capable of finding analogies between arbitrarily-sized sets of
concepts.
There is also an extensive body of work not mentioned here. For a more thorough
discussion of analogy in AI, see [19].
20

Chapter 3
System Design and
Implementation
This section presents CrossBridge, an algorithm for efficiently finding analogies in
large, sparse semantic networks. CrossBridge is designed to find analogies similar
to those found by structure mapping[6]. CrossBridge simultaneously performs
both analogical retrieval and analogical mapping, and is designed to robustly handle
sparse data.
Structure mapping describes an analogy as a mapping between the concepts of
two domains that preserves the relationships between the concepts. In a semantic
network, vertices represent concepts and edges represent relationships. Therefore, if
each domain is represented by a semantic network, structure mapping suggests that
two domains are analogous if their semantic networks are isomorphic.
Unfortunately, graph isomorphism is an NP-complete problem, meaning that an
efficient structure mapping algorithm is unlikely to exist. Searching for isomorphic
graphs is also brittle, since a single missing edge will cause the search to skip a
potential analogy. Structure mapping will therefore miss many promising analogies
in sparse data sets. These two problems reduce the effectiveness of structure mapping
on real-world data sets.
CrossBridge addresses both of these issues by searching for similar graphs
instead of isomorphic graphs. The design of the similarity measure ensures that
21

CrossBridge finds analogies that are similar to those found by structure mapping.
The similarity measure compares graphs based on the set of relation structures con-
tained in each graph. A relation structure is a system of relations, similar to the
“structures” mapped by structure mapping. The set of relation structures in a graph
is described by the graph’s structure vector. Isomorphic graphs contain identical re-
lation structures, and therefore have identical structure vectors. The relationship
between graph similarity and graph isomorphism is what relates CrossBridge to
structure mapping. The motivation behind our choice of graph similarity metric is
discussed in section 3.1.
The graph similarity measure operates on graphs with a fixed number of vertices.
Our relation structures describe a system of relations between l concepts; testing
an l-vertex graph for a relation structure essentially amounts to testing the graph
for the presence of certain edges. Section 3.1.1 describes relation structures and the
construction of a graph’s structure vector.
We use principal component analysis (PCA) to improve the robustness and ef-
ficiency of the structure vector comparison. PCA creates domain space, a space in
which all l-concept source domains are represented by vectors. The axes of domain
space are defined by significant relation structures, which correspond to fundamental
relations of l concepts. The similarity of two domains is defined as the cosine sim-
ilarity of their vectors in domain space. PCA also reduces the size of each graph’s
structure vectors, which improves the efficiency of graph similarity computations.
Section 3.1.2 explains PCA and how to construct domain space using the singular
value decomposition.
The similarity measure only operates on graphs with a fixed number of vertices.
We use the similarity measure to define a subroutine, L-Analogies, that finds analo-
gies between l-vertex semantic networks. L-Analogies has both an offline and an on-
line component. The offline portion of the algorithm effectively indexes the l-concept
source domains of a semantic network. It computes structure vectors for “dense” l-
vertex subgraphs, then constructs domain space by performing principal component
analysis on the structure vectors. The online procedure searches for analogies using
22

domain space. Section 3.2 describes L-Analogies in detail.
CrossBridge uses L-Analogies and a heuristic search to find arbitrarily-sized
analogies in a semantic network. The search process combines many l-vertex analogies
into larger analogies. Section 3.3 describes this heuristic search process.
Finally, section 3.4 analyzes the running time of CrossBridge and shows that
CrossBridge runs in polynomial time.
3.1 Analogies and Graph Similarity
A graph similarity measure must meet several criteria before we can use it in
CrossBridge. The primary requirement is that similar graphs should represent
analogous concept sets, and vice versa. That is, graph similarity should indicate
analogy quality. Additionally, the metric should be robust and make reasonable in-
ferences when presented with sparse data. Finally, our similarity metric should be
efficiently computable. These are the three primary factors that influence our choice
of similarity measure.
Before a graph similarity measure can meet the first criterion, we must define what
makes two semantic networks analogous. According to structure mapping theory [6],
an analogy is a mapping from a source domain S to a target domain T that preserves
the relationships between the concepts in S. If T and S are both semantic networks,
an analogy is a mapping from the vertices of S to the vertices of T that preserves
the edges between the concepts in S. That is, if edge (v0, v1, r) is part of S and the
analogy maps v0 to t0 and v1 to t1, then T should contain the edge (t0, t1, r). This
definition means that T and S share a common relationship structure.
We formally define a structure mapping analogy for semantic networks. A se-
mantic network N = (V,R,E) is a directed graph with typed edges. The network
has a set of vertices V , a set of relationships (edge types) R, and a set of edges
E ⊆ V × V × R. It is occasionally convenient to treat the set of edges as a func-
tion of the form E : V × V → P(R), where P(R) is the power set of R; this usage
should be clear from context. Given two semantic networks S = (VS, R,ES) and
23
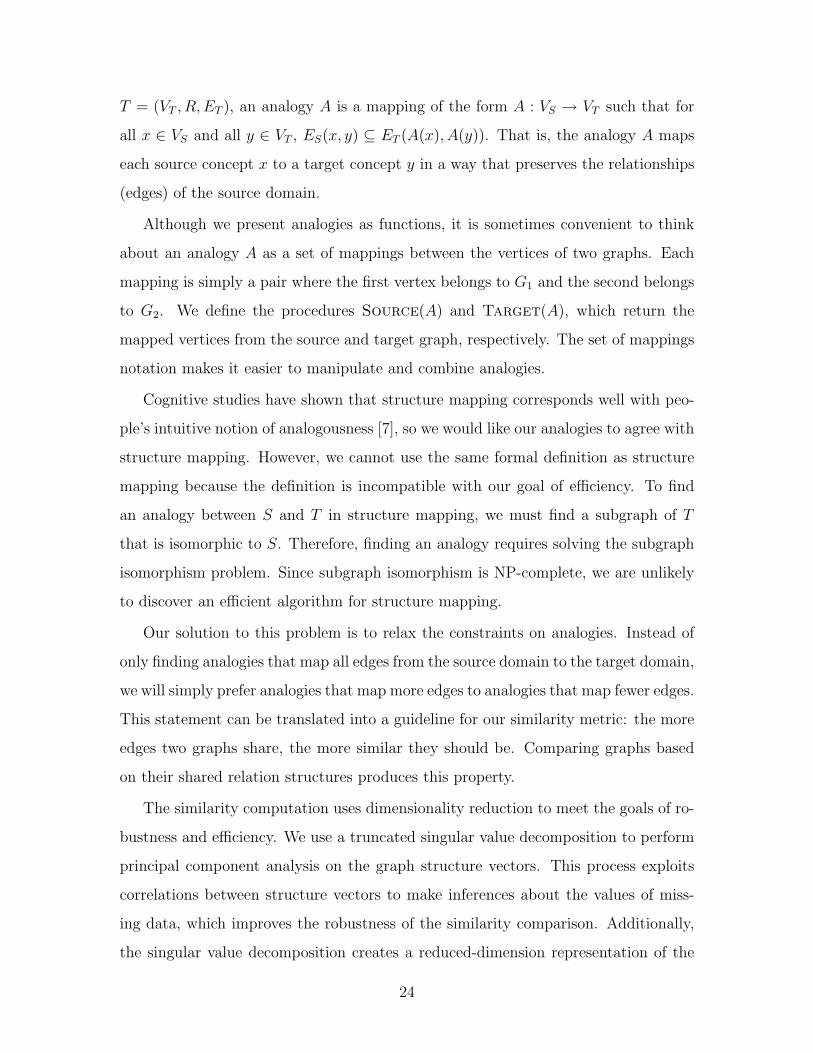
T = (VT , R,ET ), an analogy A is a mapping of the form A : VS → VT such that for
all x ∈ VS and all y ∈ VT , ES(x, y) ⊆ ET (A(x), A(y)). That is, the analogy A maps
each source concept x to a target concept y in a way that preserves the relationships
(edges) of the source domain.
Although we present analogies as functions, it is sometimes convenient to think
about an analogy A as a set of mappings between the vertices of two graphs. Each
mapping is simply a pair where the first vertex belongs to G1 and the second belongs
to G2. We define the procedures Source(A) and Target(A), which return the
mapped vertices from the source and target graph, respectively. The set of mappings
notation makes it easier to manipulate and combine analogies.
Cognitive studies have shown that structure mapping corresponds well with peo-
ple’s intuitive notion of analogousness [7], so we would like our analogies to agree with
structure mapping. However, we cannot use the same formal definition as structure
mapping because the definition is incompatible with our goal of efficiency. To find
an analogy between S and T in structure mapping, we must find a subgraph of T
that is isomorphic to S. Therefore, finding an analogy requires solving the subgraph
isomorphism problem. Since subgraph isomorphism is NP-complete, we are unlikely
to discover an efficient algorithm for structure mapping.
Our solution to this problem is to relax the constraints on analogies. Instead of
only finding analogies that map all edges from the source domain to the target domain,
we will simply prefer analogies that map more edges to analogies that map fewer edges.
This statement can be translated into a guideline for our similarity metric: the more
edges two graphs share, the more similar they should be. Comparing graphs based
on their shared relation structures produces this property.
The similarity computation uses dimensionality reduction to meet the goals of ro-
bustness and efficiency. We use a truncated singular value decomposition to perform
principal component analysis on the graph structure vectors. This process exploits
correlations between structure vectors to make inferences about the values of miss-
ing data, which improves the robustness of the similarity comparison. Additionally,
the singular value decomposition creates a reduced-dimension representation of the
24

structure vectors, which improves the efficiency of the similarity comparison.
3.1.1 Relation Structures
Comparing graphs using relation structures guarantees that nearly-isomorphic graphs
have similar structure vectors. A relation structure is a relation among l concepts
formed by combining many binary relations. We can represent a relation structure
as a semantic network with numbered vertices, where each number corresponds to
an argument to the relation structure. To check if an l-concept domain (that is, an
l-vertex semantic network) contains a relation structure, we first choose a “config-
uration,” which dictates which concept from the domain fills each argument of the
relation structure. A configuration is simply an ordering of the concepts in a domain;
configurations also make it easier to retrieve analogies later in the process.
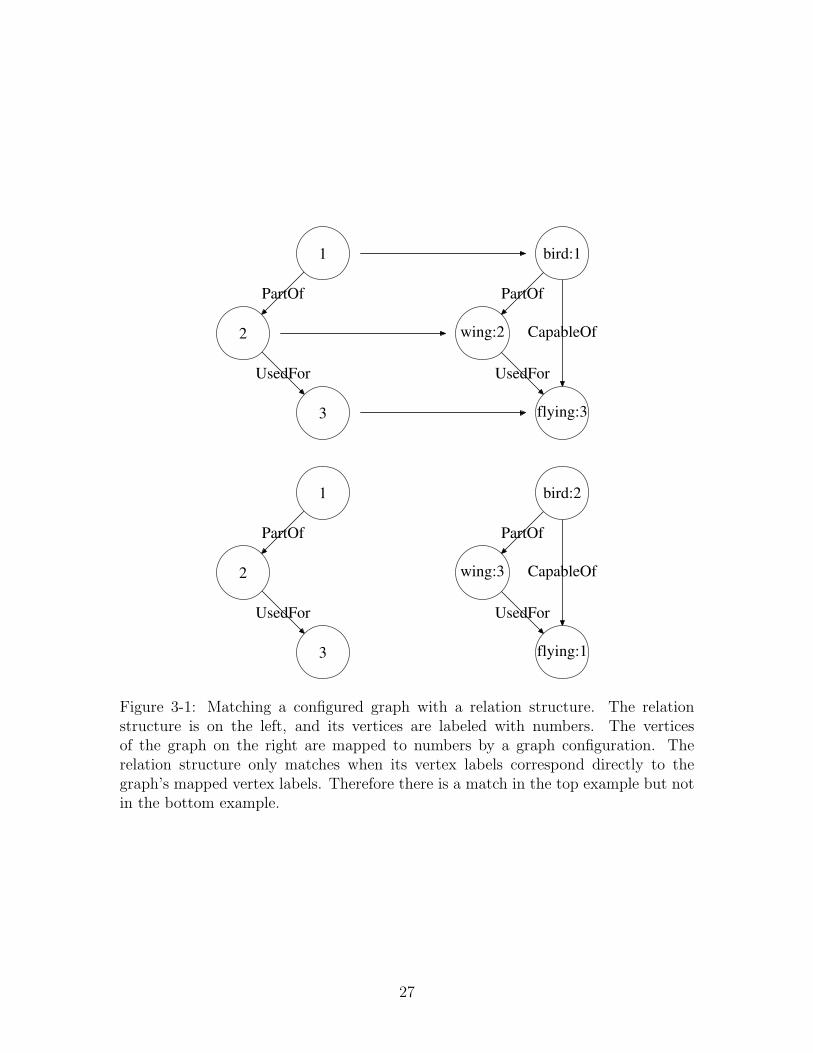
To match a relation structure to a graph, we use the configuration to number the
vertices of the graph, then pair up the numbered vertices with the relation structure’s
vertices. The relation structure matches if the edges of the relation structure are also
present in the graph. This process amounts to fixing a mapping between the graph
and the relation structure, then checking if the relation structure’s edges are a subset
of the graph’s edges. Figure 3-1 shows the process of matching a relation structure
to a configured graph.
More formally, a relation structure is an l-vertex semantic network
G′ = ({1, 2, ..., l}, R,E ′) with numbered vertices. A relation structure can be com-
pared to a graph G = (V,R,E) in configuration P . The relation structure is found
in the graph if the edges E ′ are a subset of the edges of P (G), the graph created
by replacing each vertex in G with its value in P . The configuration P specifies a
mapping between the vertices of G and the vertices of G′, and the relation structure
matches if P is an isomorphism between G′ and a subgraph of G.
The graph configuration P is used to construct a mapping between the vertices
of similar graphs. We want to be able to easily compute analogies between similar
graphs, that is a mapping between the vertices of two semantic networks. Without
the graph configurations, even if two graphs are similar, we have no way of knowing
25

which vertices of the first graph should map to which vertices of the second. With
the graph configurations, however, we can map the vertices of both graphs to the set
{1, 2, ..., l}, and therefore we can map the vertices to each other. Specifically, if two
graphs G1 and G2 are similar in configurations P1 and P2, then P−12 ◦P1 is an analogy
from G1 to G2. This mapping first applies P1 to map the vertices of G1 to the set
{1, 2, ..., l}, then applies P−12 to map {1, 2, ..., l} to the vertices of G2.
Three parameters, l, fmin and fmax, control the size of relation structures. The
graph G′ for each relation structure has exactly l vertices and between fmin and
fmax edges (i.e., fmin ≤ |E ′| ≤ fmax). Intuitively, relation structures with too
many edges will match very few graphs, and relation structures with too few edges
will match too many graphs. Neither rare nor common structures are likely to help
during the matching process. The size limits also improve efficiency since the number
of possible structures grows exponentially in both the number of vertices l and in the
maximum structure size fmax. We found that l = 3, fmin = 2, and fmax = 3 are
reasonable parameter choices for ConceptNet.
Given a set of relation structures F , we can define a structure vector for an l-
vertex graph in configuration P . A structure vector contains |F | binary values and
represents the result of matching every structure f ∈ F against the graph in the
specified configuration. If structure f is found in the graph, then the structure vector
contains a 1 in the location corresponding to f . Otherwise, the location corresponding
to f contains a 0. Two graphs that share many edges will share many of the same
relation structures, and therefore have similar structure vectors. Isomorphic graphs
will have identical structure vectors. Structure vectors are the basis for the graph
similarity computation.
3.1.2 Computing Graph Similarity with Principal Compo-
nent Analysis
We use the singular value decomposition (SVD) to perform principal component
analysis (PCA) on the graph structure vectors. PCA uses global correlations between
26
PartOf PartOf
UsedFor UsedFor
CapableOf
PartOf PartOf
UsedFor UsedFor
CapableOf
1
2
3
bird:1
wing:2
flying:3
1
2
3
bird:2
wing:3
flying:1
Figure 3-1: Matching a configured graph with a relation structure. The relationstructure is on the left, and its vertices are labeled with numbers. The verticesof the graph on the right are mapped to numbers by a graph configuration. Therelation structure only matches when its vertex labels correspond directly to thegraph’s mapped vertex labels. Therefore there is a match in the top example but notin the bottom example.
27
relation structures to smooth over sparsity in the observed relation structures. PCA
also projects each structure vector into a lower-dimensional space, which improves
computational efficiency. We define a similarity metric using PCA that forms the
basis for the L-Analogies procedure. The overall approach is closely related to
Latent Semantic Analysis [2].
Performing Principal Component Analysis
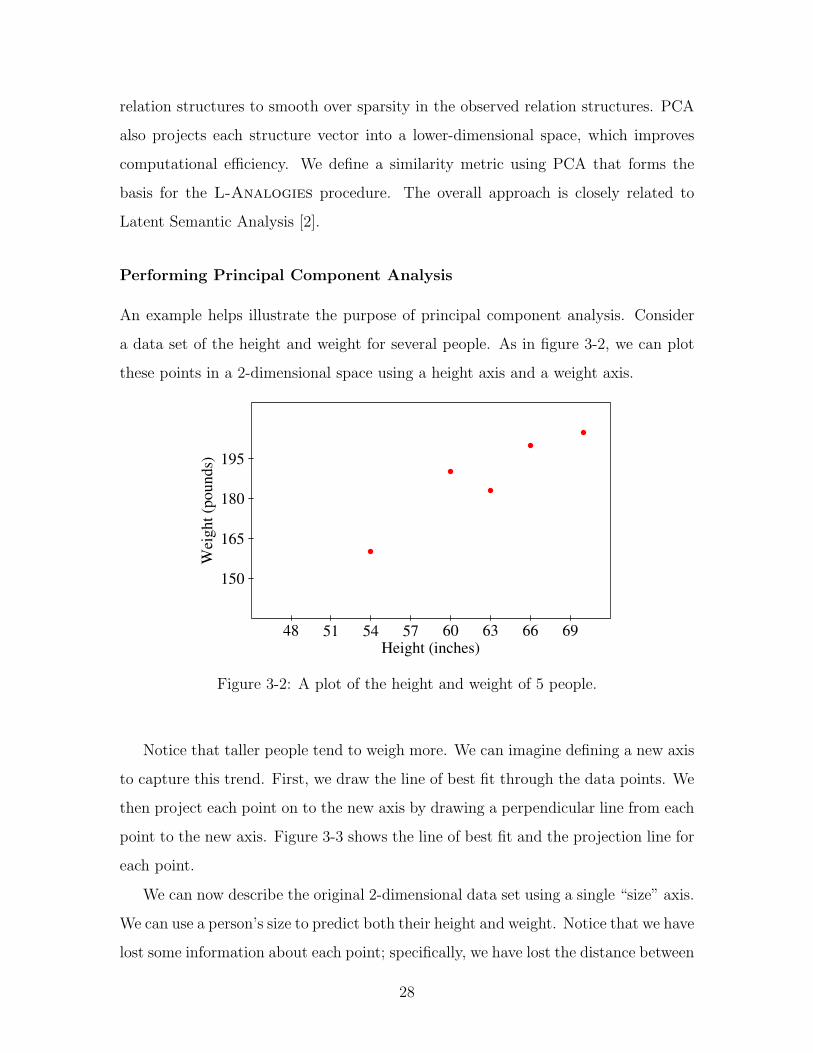
An example helps illustrate the purpose of principal component analysis. Consider
a data set of the height and weight for several people. As in figure 3-2, we can plot
these points in a 2-dimensional space using a height axis and a weight axis.
150
165
180
195
48 51 54 57 60 63 66 69Height (inches)
Wei
ght (
poun
ds)
Figure 3-2: A plot of the height and weight of 5 people.
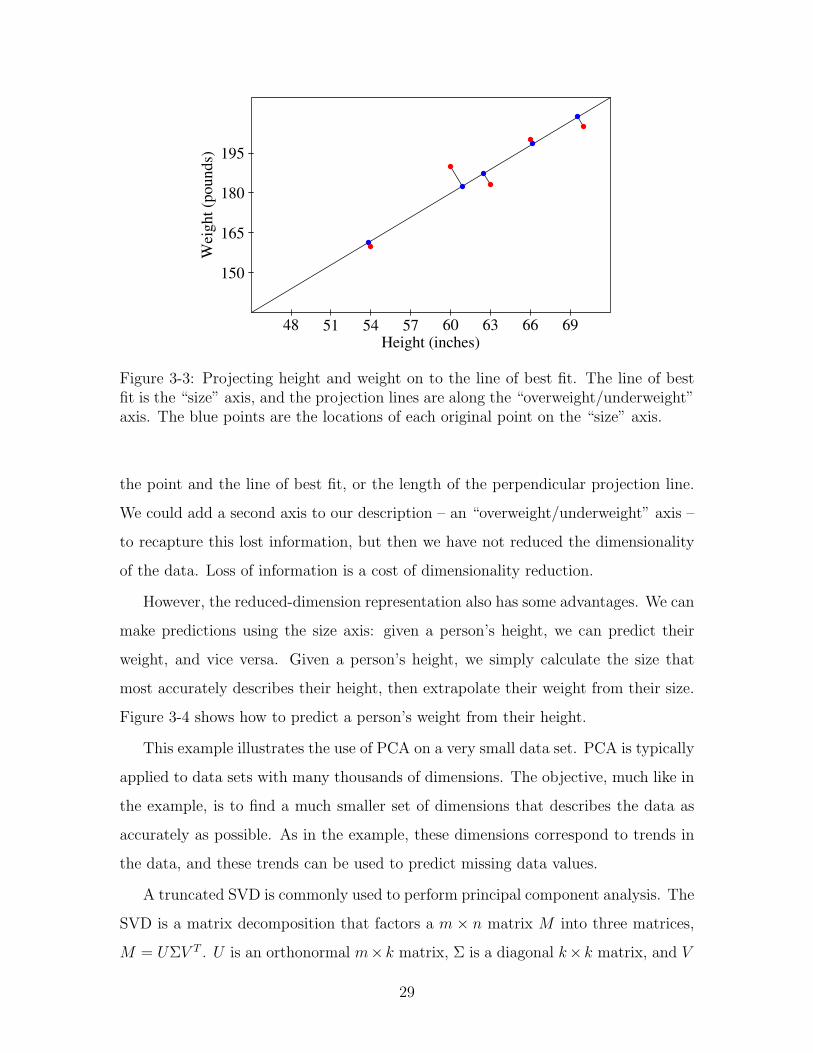
Notice that taller people tend to weigh more. We can imagine defining a new axis
to capture this trend. First, we draw the line of best fit through the data points. We
then project each point on to the new axis by drawing a perpendicular line from each
point to the new axis. Figure 3-3 shows the line of best fit and the projection line for
each point.
We can now describe the original 2-dimensional data set using a single “size” axis.
We can use a person’s size to predict both their height and weight. Notice that we have
lost some information about each point; specifically, we have lost the distance between
28
150
165
180
195
48 51 54 57 60 63 66 69Height (inches)
Wei
ght (
poun
ds)
Figure 3-3: Projecting height and weight on to the line of best fit. The line of bestfit is the “size” axis, and the projection lines are along the “overweight/underweight”axis. The blue points are the locations of each original point on the “size” axis.
the point and the line of best fit, or the length of the perpendicular projection line.
We could add a second axis to our description – an “overweight/underweight” axis –
to recapture this lost information, but then we have not reduced the dimensionality
of the data. Loss of information is a cost of dimensionality reduction.
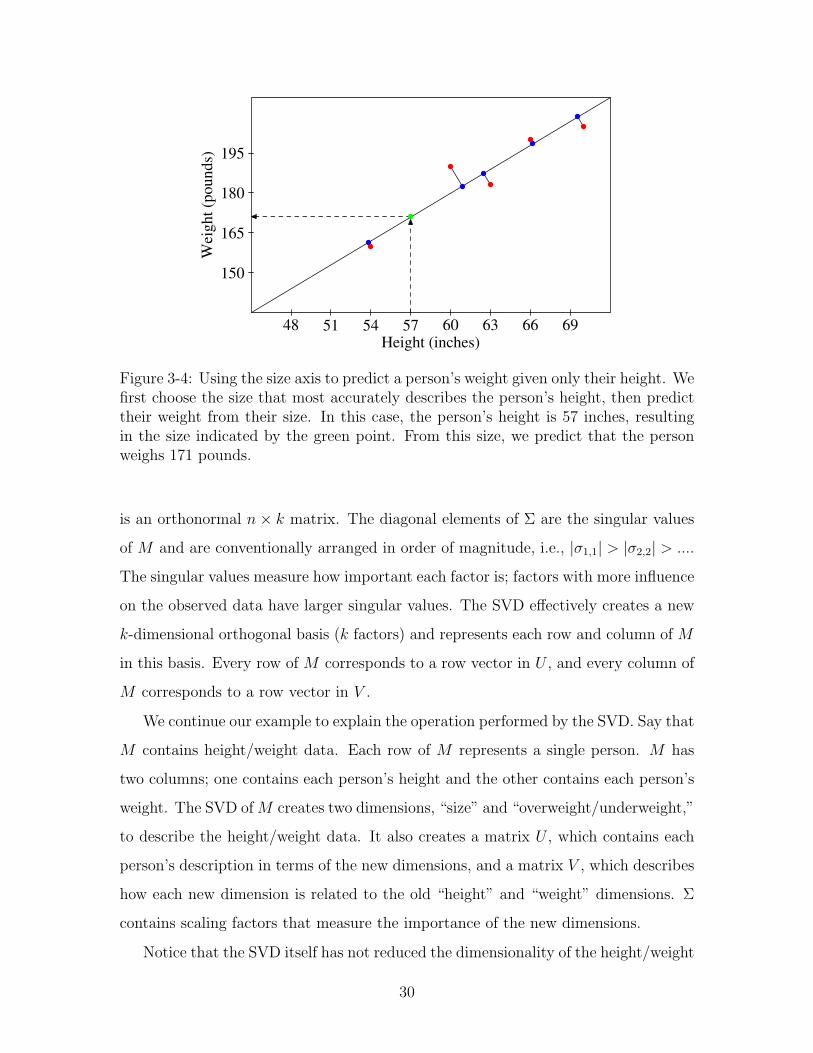
However, the reduced-dimension representation also has some advantages. We can
make predictions using the size axis: given a person’s height, we can predict their
weight, and vice versa. Given a person’s height, we simply calculate the size that
most accurately describes their height, then extrapolate their weight from their size.
Figure 3-4 shows how to predict a person’s weight from their height.
This example illustrates the use of PCA on a very small data set. PCA is typically
applied to data sets with many thousands of dimensions. The objective, much like in
the example, is to find a much smaller set of dimensions that describes the data as
accurately as possible. As in the example, these dimensions correspond to trends in
the data, and these trends can be used to predict missing data values.
A truncated SVD is commonly used to perform principal component analysis. The
SVD is a matrix decomposition that factors a m × n matrix M into three matrices,
M = UΣV T . U is an orthonormal m×k matrix, Σ is a diagonal k×k matrix, and V
29
150
165
180
195
48 51 54 57 60 63 66 69Height (inches)
Wei
ght (
poun
ds)
Figure 3-4: Using the size axis to predict a person’s weight given only their height. Wefirst choose the size that most accurately describes the person’s height, then predicttheir weight from their size. In this case, the person’s height is 57 inches, resultingin the size indicated by the green point. From this size, we predict that the personweighs 171 pounds.
is an orthonormal n× k matrix. The diagonal elements of Σ are the singular values
of M and are conventionally arranged in order of magnitude, i.e., |σ1,1| > |σ2,2| > ....
The singular values measure how important each factor is; factors with more influence
on the observed data have larger singular values. The SVD effectively creates a new
k-dimensional orthogonal basis (k factors) and represents each row and column of M
in this basis. Every row of M corresponds to a row vector in U , and every column of
M corresponds to a row vector in V .
We continue our example to explain the operation performed by the SVD. Say that
M contains height/weight data. Each row of M represents a single person. M has
two columns; one contains each person’s height and the other contains each person’s
weight. The SVD of M creates two dimensions, “size” and “overweight/underweight,”
to describe the height/weight data. It also creates a matrix U , which contains each
person’s description in terms of the new dimensions, and a matrix V , which describes
how each new dimension is related to the old “height” and “weight” dimensions. Σ
contains scaling factors that measure the importance of the new dimensions.
Notice that the SVD itself has not reduced the dimensionality of the height/weight
30
data. The SVD has changed the axes used to describe the data, but there are still two
axes. To perform dimensionality reduction, we ignore some of the less important axes
created by the SVD. In our example, we would ignore the “overweight/underweight”
axis, leaving us with the “size” axis. This process is called truncation because it
involves chopping off the portions of the U , Σ and V that correspond to the ignored
axes.
More formally, the number of factors k in an exact SVD is equal to the number
of singular values of the matrix M . k can therefore be as large as min(m,n), which
is potentially very large. A truncated SVD limits the number of factors by setting
k to a fixed value, k << min(m,n). The truncated SVD retains only the k most
significant singular values of the matrix M . We denote a matrix X truncated to only
the first k SVD dimensions as Xk. For a truncated SVD, M̃ = UkΣk(Vk)T , where M̃
is an approximation of the original matrix M .
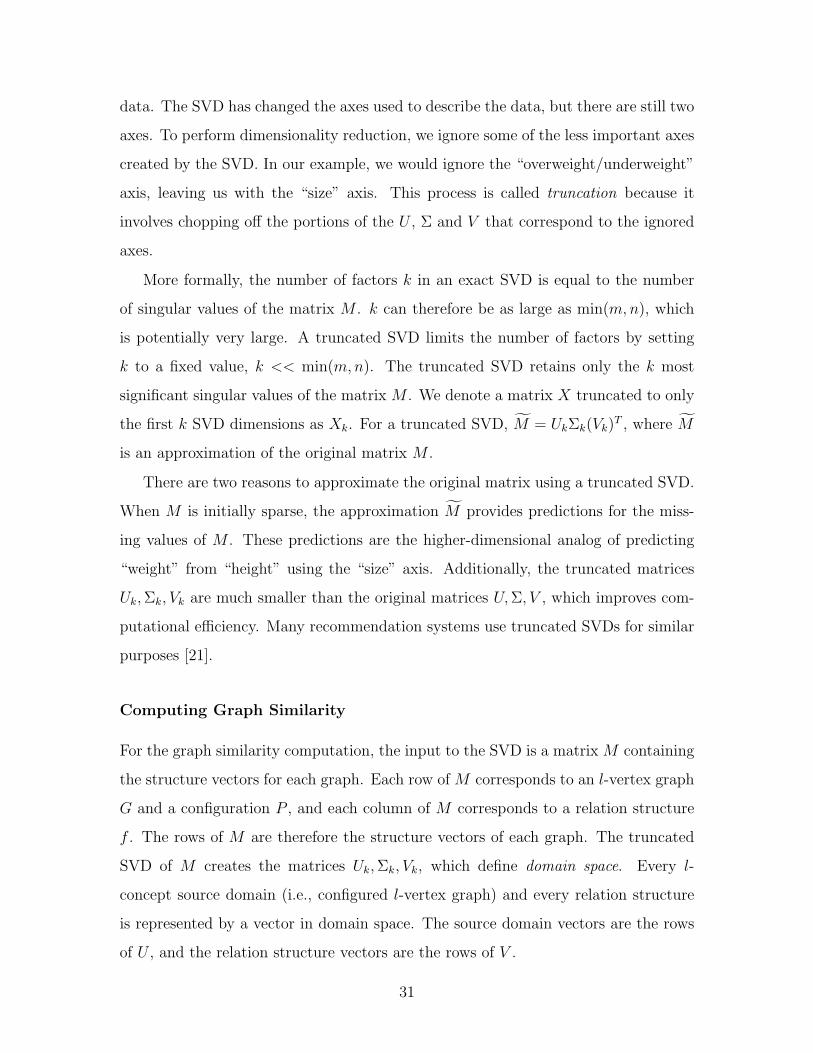
There are two reasons to approximate the original matrix using a truncated SVD.
When M is initially sparse, the approximation M̃ provides predictions for the miss-
ing values of M . These predictions are the higher-dimensional analog of predicting
“weight” from “height” using the “size” axis. Additionally, the truncated matrices
Uk,Σk, Vk are much smaller than the original matrices U,Σ, V , which improves com-
putational efficiency. Many recommendation systems use truncated SVDs for similar
purposes [21].
Computing Graph Similarity
For the graph similarity computation, the input to the SVD is a matrix M containing
the structure vectors for each graph. Each row of M corresponds to an l-vertex graph
G and a configuration P , and each column of M corresponds to a relation structure
f . The rows of M are therefore the structure vectors of each graph. The truncated
SVD of M creates the matrices Uk,Σk, Vk, which define domain space. Every l-
concept source domain (i.e., configured l-vertex graph) and every relation structure
is represented by a vector in domain space. The source domain vectors are the rows
of U , and the relation structure vectors are the rows of V .
31

The truncated SVD of M provides a simple way to compute the similarity of two
l-vertex graphs. Every l-vertex configured graph (G,P ) is represented by a row vector
uG,P in Uk. The similarity of two graphs is related to the angle between their vectors,
which we can measure with the cosine similarity:
Cosine-Similarity((G1, P1), (G2, P2)) =uG1,P1ΣkΣku
TG2,P2
||uG1,P1Σk|| × ||uG2,P2Σk||(3.1)
The cosine similarity of two vectors is their dot product divided by the magnitude of
each vector. This calculation computes the cosine of the angle between the vectors.
L-Analogies uses the cosine similarity to find analogies for l-vertex graphs.
3.2 L-Analogies
L-Analogies is a procedure that searches a large source semantic network S to find
analogies for a semantic network of target concepts T . Due to limitations of the sim-
ilarity measure, L-Analogies can only find analogies involving exactly l target con-
cepts. L-Analogies has both an offline and an online component. The offline com-
ponent, L-Analogies-Offline, computes structure vectors for subgraphs of S and
computes the SVD of these vectors. The online component, L-Analogies-Online
uses the SVD to compute the similarity between subgraphs of S and the target graph
T . The results of this similarity computation are turned into analogies and returned.
L-Analogies-Offline is responsible for computing structure vectors and taking
their SVD. The algorithm first constructs a sparse matrixM out of a semantic network
S. The rows of M are the structure vectors for every dense l-vertex subgraph of S.
Each row of M is labeled with an l-vertex subgraph G and a configuration P . Each
column of M is labeled with a relation structure f . M [(G,P ), f ] = 1 if structure f is
part of subgraph G in configuration P . Figure 3-5 shows what a section of M looks
like.
To construct M , L-Analogies-Offline first finds every dense subgraph of S.
A dense subgraph is an l-vertex graph with at least a threshold number of edges t.
32

PartOfPartOf
UsedForUsedFor
CapableOf
PartOf
UsedFor
CapableOf
PartOf
UsedFor
UsedFor
PartOf
UsedFor
CapableOf
UsedFor
UsedFor
UsedFor
PartOf
1
2
3
1
2
3
bird:1
wing:2
fly:3
knife:1
blade:2
cut:3
wing:1
fly:2
bird:3
1
2
3
1
2
3
1
1 1
1 1
0 0 0
0 0
0 0
Figure 3-5: A section of the structure matrix M using concepts and relations fromConceptNet. The rows are configured subgraphs of S and the columns are relationstructures. Each entry of the matrix stores the result of matching the correspondingrelation structure with the corresponding graph.
33
(For ConceptNet with l = 3, we set t = 3.) Dense subgraphs must also be maximal,
that is they must contain as many edges as possible for the given set of vertices. The
purpose of choosing only dense subgraphs is to avoid indexing every single l-vertex
subgraph of S. Intuitively, a dense subgraph corresponds to a possible source domain
for an analogy. Since we expect analogies to map relatively dense graphs, we can
safely ignore sparsely connected regions.
L-Analogies-Offline creates a row in M for each dense subgraph in each
configuration. The algorithm puts every dense subgraph G into every possible con-
figuration P , then matches the pair against every relation structure. The matching
process simply enumerates all subsets of G’s edges; each subset corresponds to a rela-
tion structure. Finally, L-Analogies-Offline computes the truncated SVD of M
using the Lanczos algorithm, and returns the resulting matrices Uk,Σk, Vk.
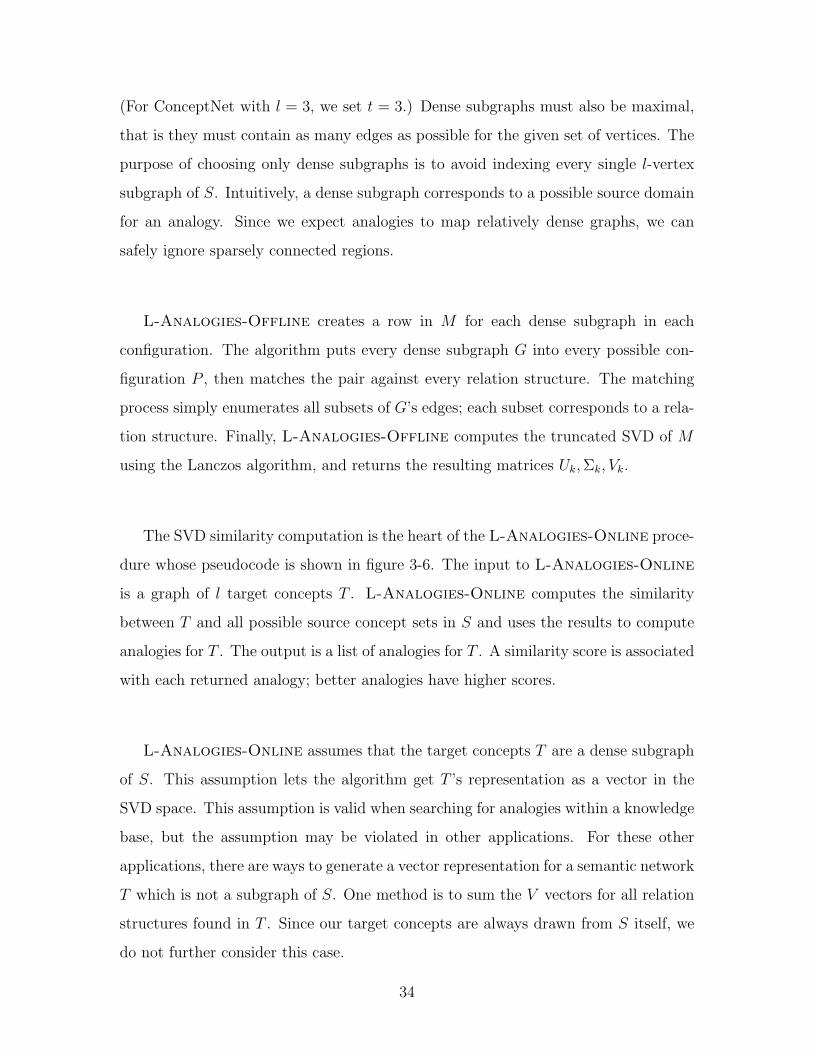
The SVD similarity computation is the heart of the L-Analogies-Online proce-
dure whose pseudocode is shown in figure 3-6. The input to L-Analogies-Online
is a graph of l target concepts T . L-Analogies-Online computes the similarity
between T and all possible source concept sets in S and uses the results to compute
analogies for T . The output is a list of analogies for T . A similarity score is associated
with each returned analogy; better analogies have higher scores.
L-Analogies-Online assumes that the target concepts T are a dense subgraph
of S. This assumption lets the algorithm get T ’s representation as a vector in the
SVD space. This assumption is valid when searching for analogies within a knowledge
base, but the assumption may be violated in other applications. For these other
applications, there are ways to generate a vector representation for a semantic network
T which is not a subgraph of S. One method is to sum the V vectors for all relation
structures found in T . Since our target concepts are always drawn from S itself, we
do not further consider this case.
34
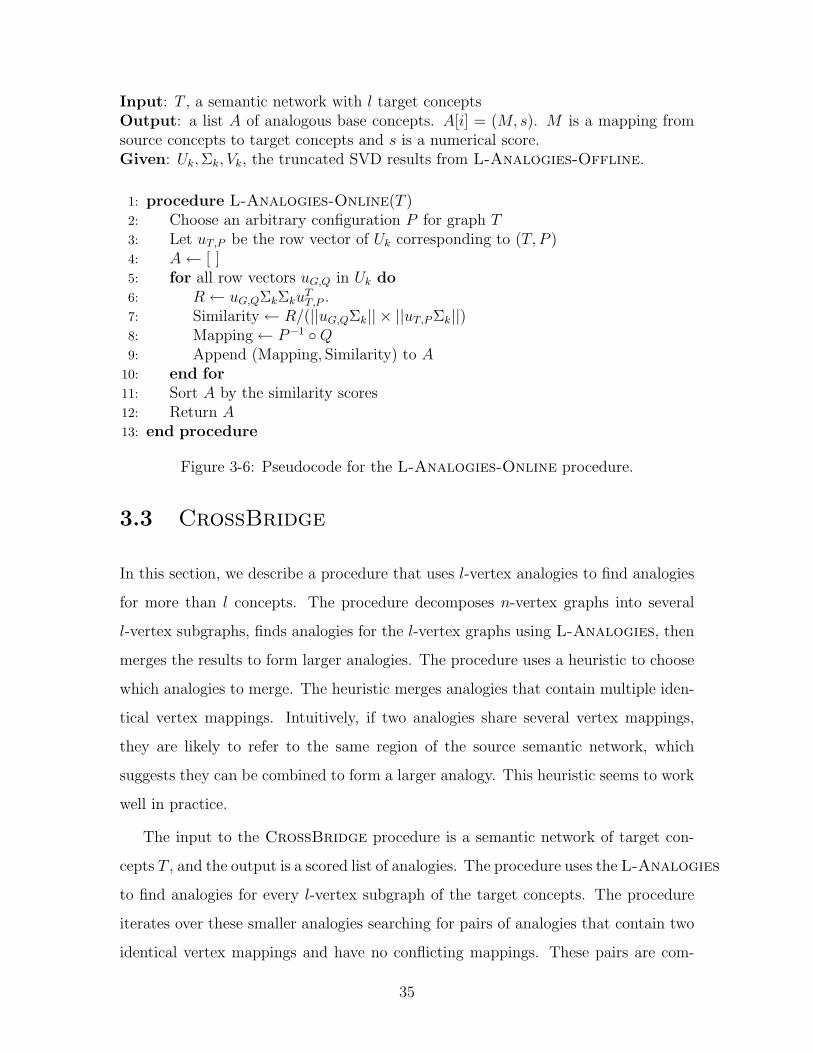
Input: T , a semantic network with l target conceptsOutput: a list A of analogous base concepts. A[i] = (M, s). M is a mapping fromsource concepts to target concepts and s is a numerical score.Given: Uk,Σk, Vk, the truncated SVD results from L-Analogies-Offline.
1: procedure L-Analogies-Online(T )2: Choose an arbitrary configuration P for graph T3: Let uT,P be the row vector of Uk corresponding to (T, P )4: A← [ ]5: for all row vectors uG,Q in Uk do6: R← uG,QΣkΣku
TT,P .
7: Similarity← R/(||uG,QΣk|| × ||uT,P Σk||)8: Mapping← P−1 ◦Q9: Append (Mapping, Similarity) to A
10: end for11: Sort A by the similarity scores12: Return A13: end procedure
Figure 3-6: Pseudocode for the L-Analogies-Online procedure.
3.3 CrossBridge
In this section, we describe a procedure that uses l-vertex analogies to find analogies
for more than l concepts. The procedure decomposes n-vertex graphs into several
l-vertex subgraphs, finds analogies for the l-vertex graphs using L-Analogies, then
merges the results to form larger analogies. The procedure uses a heuristic to choose
which analogies to merge. The heuristic merges analogies that contain multiple iden-
tical vertex mappings. Intuitively, if two analogies share several vertex mappings,
they are likely to refer to the same region of the source semantic network, which
suggests they can be combined to form a larger analogy. This heuristic seems to work
well in practice.
The input to the CrossBridge procedure is a semantic network of target con-
cepts T , and the output is a scored list of analogies. The procedure uses the L-Analogies
to find analogies for every l-vertex subgraph of the target concepts. The procedure
iterates over these smaller analogies searching for pairs of analogies that contain two
identical vertex mappings and have no conflicting mappings. These pairs are com-
35

bined to form a new, larger analogy. The combining process is then repeatedly applied
to the newly-generated analogies until no new analogies are generated. The score for
each newly-generated analogy is the sum of the scores of its component analogies.
Figure 3-7 provides pseudocode for the CrossBridge procedure.
CrossBridge uses a beam search to improve its efficiency. Only the top r results
from each call to L-Analogies are used in the merging process. Additionally, after
each round of merging, the new candidate analogies are pruned to the b analogies
with the highest score.
3.4 Running Time of CrossBridge
In this section we analyze the running time of using CrossBridge to find analogies
for a target concept set T in a semantic network G = (V,R,E). We first consider
the running time of L-Analogies-Offline: we determine the size of the structure
matrix M , then consider constructing M and computing its SVD. We show that
the running time of L-Analogies-Offline is dominated by the SVD computation,
which takesO(k×V l×(Rl2)fmax×lfmax log(V Rl)) time using the Lanczos algorithm.
We then analyze CrossBridge and show that its running time is O(T lV lk) when
the source semantic network G is much larger than T . Note that the running times
for both portions of the algorithm are polynomial in the size of the input G and T ,
but exponential in the algorithm parameters l and fmax. Finally, we point out that
these worst-case time complexities are unlikely to occur in practice since real semantic
networks are sparse.
We first consider the size of the structure matrix M . The rows of M can be
represented as ordered l-tuples of vertices from G since l vertices define a dense,
maximal subgraph of G and the ordering defines a graph configuration. Hence M has
at most V l rows. The columns of M correspond to relation structures. The number
of relation structures is equal to the number of semantic networks with l distinct
vertices and between fmin and fmax edges. In an l-vertex network, there are Rl2
unique edges. Each structure contains at most fmax of these edges, so there are
36
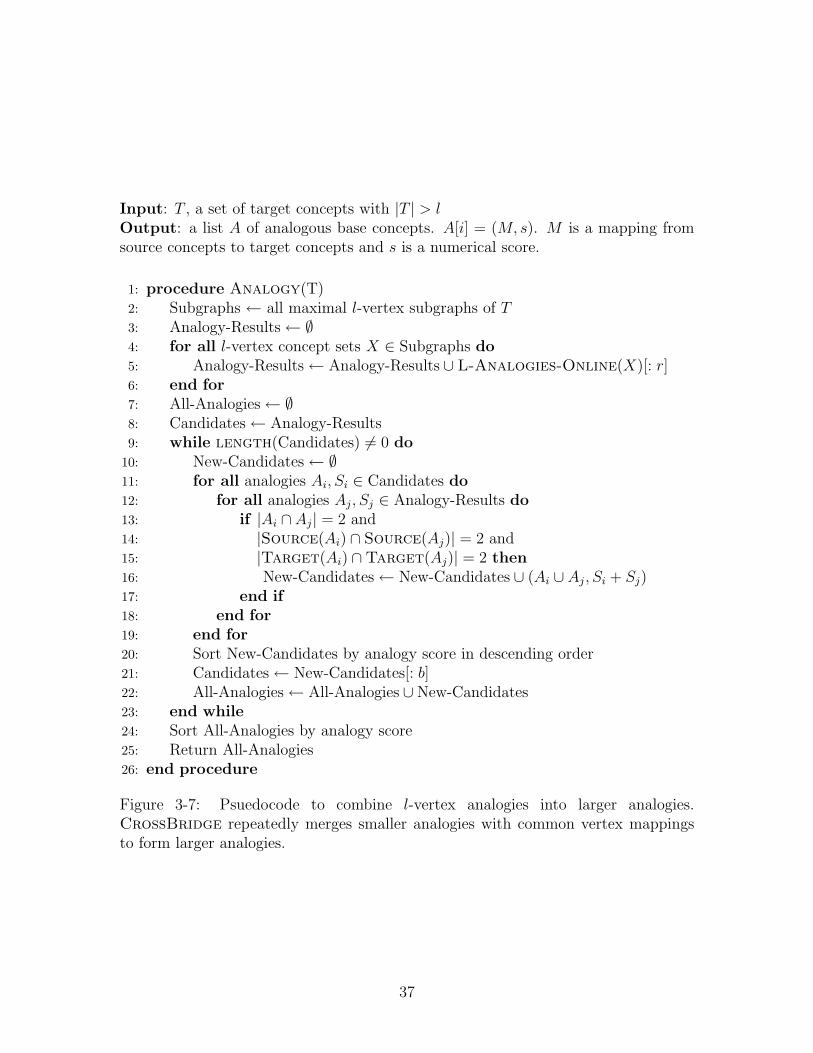
Input: T , a set of target concepts with |T | > lOutput: a list A of analogous base concepts. A[i] = (M, s). M is a mapping fromsource concepts to target concepts and s is a numerical score.
1: procedure Analogy(T)2: Subgraphs ← all maximal l-vertex subgraphs of T3: Analogy-Results← ∅4: for all l-vertex concept sets X ∈ Subgraphs do5: Analogy-Results← Analogy-Results ∪ L-Analogies-Online(X)[: r]6: end for7: All-Analogies← ∅8: Candidates← Analogy-Results9: while length(Candidates) 6= 0 do
10: New-Candidates← ∅11: for all analogies Ai, Si ∈ Candidates do12: for all analogies Aj, Sj ∈ Analogy-Results do13: if |Ai ∩ Aj| = 2 and14: |Source(Ai) ∩ Source(Aj)| = 2 and15: |Target(Ai) ∩Target(Aj)| = 2 then16: New-Candidates← New-Candidates ∪ (Ai ∪ Aj, Si + Sj)17: end if18: end for19: end for20: Sort New-Candidates by analogy score in descending order21: Candidates← New-Candidates[: b]22: All-Analogies← All-Analogies ∪ New-Candidates23: end while24: Sort All-Analogies by analogy score25: Return All-Analogies26: end procedure
Figure 3-7: Psuedocode to combine l-vertex analogies into larger analogies.CrossBridge repeatedly merges smaller analogies with common vertex mappingsto form larger analogies.
37

O((
Rl2
fmax
)) = O((Rl2)fmax) possible relation structures. Therefore, M has O(V l)
rows and O((Rl2)fmax) columns.
L-Analogies-Offline builds the structure matrix M and computes its SVD.
Building M requires enumerating all l-vertex subgraphs of G, and matching each
relation structure against each subgraph. Determining if a relation structure matches
a graph requires a constant number of operations per vertex and edge of the graph,
so each check runs in O(l2) time. Therefore, building M takes O(l2×V l×(Rl2)fmax)
time.
We use the Lanczos algorithm to compute the SVD ofM . To find the k most signif-
icant singular values of an m× n matrix, Lanczos requires roughly O(kmn log(mn))
time [27]. Therefore, computing the SVD of M requires O(k × V l × (Rl2)fmax ×
lfmax log(V Rl)) time.
L-Analogies-Online is a simple procedure whose major computation is the
matrix multiplication UkΣkuT . Assuming we use a naive matrix multiplication al-
gorithm, the time complexity of this multiplication is O(V lk) since Uk is a V l × k
matrix.
CrossBridge’s running time depends on the size of the target concept set T ,
the number of candidates r and the beam width b. The procedure first makes up to
O(T l) queries to L-Analogies-Online to retrieve the initial set of O(rT l) candidate
analogies. In total, all of these queries incur O(T lV lk) operations. In any round of
the merging process, there are at most max(b, rT l) candidate analogies. During each
round, each of these candidates is compared against every one of the initial candi-
dates, so each round runs in O(rT l max(b, rT l)). There are at most |T | rounds because
the size of the candidate analogies increases during every round. Therefore, the time
complexity for the merging portion of CrossBridge is O(rT l+1 max(b, rT l)). In to-
tal, the time complexity of CrossBridge is O(T lV lk+rT l+1 max(b, rT l)). However,
the first term of the time complexity is by far the most significant because we ex-
pect |V | >> |T |. Therefore, the time complexity of CrossBridge is approximately
O(T lV lk).
The above analysis assumes that CrossBridge is running on a dense semantic
38
network. In sparse semantic networks, we expect the actual time complexity to be
significantly lower than the predicted worst-case time complexity. In sparse semantic
networks, most subgraphs of G are not dense enough to be included in M , significantly
reducing the size of M . Additionally, all matrix operations are implemented using
sparse matrices. We expect M to be very sparse, since only a few relation structures
will match each subgraph of G. Therefore, we expect the actual time complexity of
these algorithms to be significantly better than the worst-case time complexity.
3.5 Implementation
All algorithms described in this section have been implemented and tested using
Python. We use Divisi1 for sparse matrix operations and SVD computations.
1Divisi is available from http://divisi.media.mit.edu/.
39

40

Chapter 4
Evaluation
This chapter evaluates the performance of CrossBridge on a real data set. Our eval-
uation uses ConceptNet [10], a large semantic network of common sense knowledge.
We compare CrossBridge to an implementation of structure mapping and show
that CrossBridge is more efficient. We also show that both structure mapping and
CrossBridge produce similar analogies, and that CrossBridge has better analogy
recall than structure mapping. Finally, we measure the sensitivity of CrossBridge
to various parameter choices and show that its results remain relatively similar for
reasonable parameter settings.
All tests in this chapter were run on a 2.8 GHz computer with 20 GB of RAM.
The processor is the limiting factor for all of the reported running times; none of the
tests use more than 2GB of RAM.
4.1 ConceptNet
ConceptNet [10] is a semantic network of common sense knowledge. ConceptNet is
constructed from over 800,000 simple sentences such as “a dog is a pet” and “a pen
is used for writing.” Each sentence was contributed by a volunteer to the Open Mind
Commons website [22]. These sentences are parsed into assertions like “dog / IsA /
pet.” Each assertion is composed of two concepts (“dog” and “pet”) connected by
a relation (“IsA”). ConceptNet has 21 different types of relations including “IsA”,
41

Figure 4-1: A portion of the ConceptNet semantic network.
“PartOf” and “UsedFor.” In all, ConceptNet contains over 150,000 concepts (ver-
tices) and over 800,000 assertions (edges). However, many of these concepts are only
involved in a handful of assertions. Users of ConceptNet typically restrict Concept-
Net to concepts in at least 5 assertions. This subset of ConceptNet contains around
8,000 vertices and 17,000 edges.
Users can also vote on the quality of assertions; these votes are compiled into a
numerical quality score for each assertion. The higher an assertion’s score, the more
likely it is to be true. We created a smaller semantic network, conceptnet-small,
from ConceptNet by removing all assertions with a score lower than 2. This smaller
data set contains less noise than the original data set, which makes it easier to judge
the quality of retrieved analogies. The reduced size also makes the data set easier to
work with. conceptnet-small has around 4,500 vertices and 9,000 edges.
We ran L-Analogies-Offline on ConceptNet with the parameters l = 3, t = 3,
fmin = 2, fmax = 3 and k = 100. L-Analogies-Offline runs in approximately
20 seconds on conceptnet-small and in 30 minutes on the full ConceptNet.
The analogies found by CrossBridge are quite reasonable, and we present some
of them in figure 4.1.
42
cook pot kitchen chefstudy classroom school studentsleep pillow case bed personpray pew church christianeat restaurant table restaurant human
car road drive personplane sky fly pilot
apartment town live personpantry kitchen store food food
instrument music orchestra make music string
Figure 4-2: Some analogies discovered in ConceptNet. Examples were selected fromthe top 10 results (in different domains) of CrossBridge. (The top results typicallyinclude many analogies to the same domain, e.g. {sleep, pillow case, bed, person}and {sleep, pillow case, bed, human}. We show only one example from each domainhere.)
4.2 Comparison with Structure Mapping
This section compares CrossBridge to structure mapping. We describe
Structure-Map, an implementation of structure mapping for semantic networks,
then compare its efficiency and its results with CrossBridge. We show that
CrossBridge is more efficient than Structure-Map and that both
Structure-Map and CrossBridge find similar analogies.
4.2.1 Structure Mapping Implementation
According to structure mapping, there is an analogy between two semantic net-
works if the two networks are isomorphic. Therefore, to find analogies for a net-
work of target concepts T , we must search through a semantic network knowledge
base G for subgraphs that are isomorphic to T . We describe our implementation of
Structure-Map that performs this search for isomorphic subgraphs.
The input to Structure-Map is a semantic network G and a network of target
concepts T . Structure-Map returns a list of mappings from the vertices of G to
vertices of T . The algorithm searches for an isomorphism between the target graph T
43

and a subgraph of G by searching over possible mappings from T to G. Note that the
isomorphism we search for is the opposite of the isomorphism required by structure
mapping. In structure mapping, a subgraph of the target domain must be must be
isomorphic to the base domain, yet Structure-Map searches for subgraphs of the
base domain that are isomorphic to the target domain. This reversal corresponds
to searching for only the best matching analogies, that is analogies in which every
relation from the base domain can be mapped to the target domain.
The mapping is constructed one vertex at a time by guessing that an unmapped
target vertex t maps to some vertex of G. After each guess, the algorithm checks if the
edge mappings are consistent, which means that G contains all of the edges in T that
can be mapped into G. If the mapping is not consistent, the algorithm tries another
vertex mapping for t. If the mapping is consistent, the algorithm continues increasing
the size of the current mapping. If all the vertices of t are mapped, then the algorithm
has found a subgraph of G that is isomorphic to T . Each isomorphic subgraph is saved
and all isomorphic subgraphs are returned when the search completes.
The algorithm sketched above only finds source domains that are exactly analo-
gous to the target domain, whereas CrossBridge is capable of finding nearly anal-
ogous source domains. We created variants of Structure-Map that find nearly
analogous source domains by modifying the consistency check to allow up to q un-
mapped edges. These unmapped edges are edges in the target graph that are not part
of the source graph. We name the modified variants Structure-Map-q, where q is
the number of allowed unmapped edges. Each of these variants effectively performs
structure mapping with a quality threshold on the retrieved analogies. As q increases,
the quality of the retrieved analogies decreases. The results, of these variants are more
directly comparable to CrossBridge because they return nearly analogous source
domains.
We implemented Structure-Map in Python.
44

Test Setfly, bird, wingfly, sky, bird, wingfly, airplane, sky, bird, wingfly, sky, wing, duck, airplane, birdschool, student, learnschool, book, student, learnread, school, book, student, learnschool, read, text, book, student, learnwood, tree, foresttree, wood, leaf, foresttree, wood, leaf, forest, branchleaf, tree, wood, forest, branch, snaketable, eat, restaurantfood, table, eat, restaurantfood, table, restaurant, eat, personplate, restaurant, food, person, table, eat
Table 4.1: The target concept sets used in the efficiency comparison.
4.2.2 Running Time Comparison
To compare CrossBridge and Structure-Map, we created a test set of analogies.
The test set contains four sets of 6 target concepts; each set of target concepts is
further subdivided into four target domains of differing sizes. The test set of analogies
is shown in table 4.1.
Our first test compared the running time of CrossBridge and Structure-Map.
We tested two variants of Structure-Map: Structure-Map-0 does not tolerate
unmapped edges and Structure-Map-1 tolerates 1 unmapped edge. We measured
the running time of each algorithm on each test set using the conceptnet-small
semantic network. Figure 4-3 shows the average running time of each algorithm as a
function of the number of target concepts. The figure shows that CrossBridge is
somewhat faster than Structure-Map-0 and significantly faster than
Structure-Map-1.
45

Figure 4-3: The average running time of three analogy algorithms as a function ofanalogy size. This test was run on the conceptnet-small data set.
46
Test Set CrossBridge Structure-Map-0 Structure-Map-1fly, bird, wing 177 0 86fly, sky, bird, wing 433 0 72fly, airplane, sky, bird, wing 537 0 3fly, sky, wing, duck, airplane, bird 957 2 26school, student, learn 227 1 26school, book, student, learn 337 0 5read, school, book, student, learn 542 0 5school, read, text, book, student, learn 1022 0 1wood, tree, forest 279 0 43tree, wood, leaf, forest 483 1 31tree, wood, leaf, forest, branch 971 1 32leaf, tree, wood, forest, branch, snake 1735 3 31table, eat, restaurant 247 79 13869food, table, eat, restaurant 889 1 16food, table, restaurant, eat, person 1032 1 20plate, restaurant, food, person, table, eat 1724 0 8
Table 4.2: The number of analogies found by the analogy algorithms on each test set.These counts do not include the trivial analogy in which every concept is mapped toitself.
4.2.3 Result Comparison
We also compared analogies retrieved by CrossBridge with those retrieved by
Structure-Map. We show that the best analogies found by CrossBridge are
very similar to the best analogies found by structure mapping. We also show that
CrossBridge consistently finds many more analogies than structure mapping.
The comparison between CrossBridge and Structure-Map is not straight-
forward because structure mapping on ConceptNet typically produces very few analo-
gies. Even when structure mapping produces multiple analogies, the vast majority of
them map several of the query concepts to themselves. Table 4.2 shows the number
of analogies retrieved by each algorithm for each test query.
In all but one of the test cases, the top 15 results of CrossBridge include all
of the results of Structure-Map-0. The exception is {table, eat, restaurant}, on
which Structure-Map-0 returns 79 analogies. Of these results, 72 are in the top
79 results of CrossBridge. These results show that the best analogies found by
47

CrossBridge are very similar to the best analogies found by structure mapping.
Comparing CrossBridge with Structure-Map-1 is more subjective since
analogy quality plays a role in the comparison. On the test sets, agreement between
Structure-Map-1 and the top 100 results of CrossBridge averages 52%, showing
that both algorithms return relatively similar results. The target domain seems to
influence whether agreement is high or not. Agreement is around 80% on all test sets
including {forest, tree, wood}, and agreement is close to 20% on all test sets including
{bird, fly, wing}. Subjectively, both result sets make intuitive sense. However, the
analogies returned by Structure-Map-1 are rather repetitive; most of the retrieved
source domains share many concepts with the target domain. CrossBridge tends
to return many more analogies to novel source domains.
4.3 Sensitivity Analysis
We investigated the effects of different parameter choices on the performance of
CrossBridge and found that the parameter values do not drastically affect the
results of CrossBridge. We ran CrossBridge on conceptnet-small while vary-
ing the number of SVD dimensions and the size of relation structures. For each choice
of parameters, we computed the top 20 analogies for each of the test sets shown in
figure 4.1. We compared each pair of parameter settings by measuring the agreement
between the top 20 analogies, that is the percent of top 20 analogies returned by
both algorithms. The results are presented in table 4.3, which shows that as long as
the minimum structure size is less than 3, CrossBridge does not appear to be too
sensitive to parameter changes.
48
k 100 100 100 100 100fmin 1 1 1 2 3fmax 1 2 3 3 3
k fmin fmax50 1 1 0.81 0.71 0.70 0.66 0.21100 1 1 1.00 0.66 0.62 0.55 0.21200 1 1 0.98 0.67 0.64 0.55 0.21300 1 1 0.98 0.67 0.64 0.55 0.2150 1 2 0.70 0.75 0.73 0.70 0.21100 1 2 0.66 1.00 0.86 0.73 0.23200 1 2 0.67 0.86 0.81 0.71 0.21300 1 2 0.80 0.79 0.78 0.68 0.2150 1 3 0.67 0.75 0.75 0.70 0.21100 1 3 0.62 0.86 1.00 0.74 0.21200 1 3 0.64 0.87 0.83 0.71 0.21300 1 3 0.71 0.81 0.81 0.70 0.2150 2 3 0.31 0.39 0.35 0.37 0.28100 2 3 0.55 0.73 0.74 1.00 0.27200 2 3 0.60 0.79 0.77 0.76 0.26300 2 3 0.66 0.75 0.74 0.69 0.2450 3 3 0.22 0.26 0.27 0.31 0.84100 3 3 0.21 0.23 0.21 0.27 1.00200 3 3 0.41 0.46 0.44 0.43 0.43300 3 3 0.62 0.66 0.62 0.65 0.35
Table 4.3: Agreement within the top 20 analogies when CrossBridge is run withvarious parameter settings. Agreement is around 70% when fmin < 3, which demon-strates that CrossBridge is not sensitive to small parameter changes.
49

50
Chapter 5
An Application of CrossBridge
In this chapter we present CrossBridge, a simple application that helps teachers find
analogies to use as teaching aids. Analogies are useful teaching aids, but it is some-
times difficult to find an analogy for a subject. CrossBridge is designed to help
teachers in this situation by searching for helpful analogies in a knowledge base.
Teachers use CrossBridge by entering a concept they wish to teach (e.g. “circuits”)
into CrossBridge’s search box. CrossBridge transforms this single concept into a
target domain for an analogy using common sense knowledge from ConceptNet. The
target domain is used as input to CrossBridge, which returns a set of analogies
from its knowledge base. These analogies are presented to the user, who hopefully
finds them useful.
CrossBridge is implemented as a web application using Python and the Django
web framework1. CrossBridge also uses Divisi2 to represent sparse matrices and per-
form matrix operations.
5.1 Design
CrossBridge is basically a wrapper around the CrossBridge algorithm that im-
proves its usability. It uses a simple algorithm to expand the user’s single-concept
1Django is available from http://www.djangoproject.com/.2Divisi is available from http://divisi.media.mit.edu/.
51
query into a target domain, then uses CrossBridge to find analogies. CrossBridge
queries a knowledge base consisting of ConceptNet and some additional knowledge of
physics concepts. All offline processing for this data set is precomputed and cached,
improving the responsiveness of the website.
The input to CrossBridge is a single concept like “circuit” or “solar system.”
Using ConceptNet, CrossBridge expands this concept into a target domain for an
analogy. This query expansion process takes advantage of the fact that an analogy
between two single concepts is really an analogy between the parts of each domain.
For example, the analogy “an atom is like the solar system,” is really a mapping from
electrons and electricity to planets and gravity. To expand a query for concept x,
CrossBridge finds all concepts y that are a part of x by following “PartOf” relations
in the knowledge base. The query to CrossBridge is the maximal subgraph of the
knowledge base whose vertices are x and all of the ys.
The knowledge base used by CrossBridge is ConceptNet augmented with some
additional assertions about common physics concepts. We added the knowledge of
physics concepts by hand to help illustrate the purpose of CrossBridge. We precom-
pute and cache the results of L-Analogies-Offline on this semantic network. As
in the evaluation section, we use the parameters l = 3, t = 3, fmin = 2, fmax = 3
and k = 100.
CrossBridge returns a list of analogies which are minimally processed and pre-
sented to the user. The processing filters out analogies from the same source domain
by removing analogies whose source concept set is a subset of a higher-ranked anal-
ogy. The processing makes the presented results more interesting because it prevents
the user from seeing several similar analogies.
52
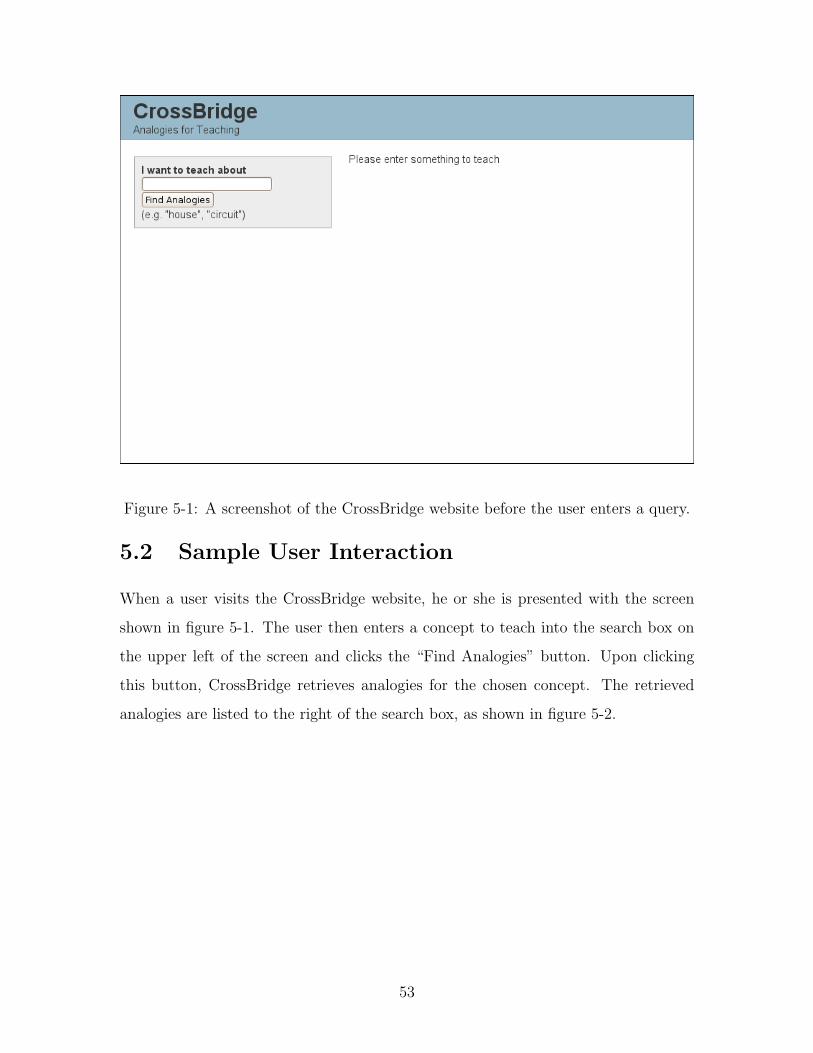
Figure 5-1: A screenshot of the CrossBridge website before the user enters a query.
5.2 Sample User Interaction
When a user visits the CrossBridge website, he or she is presented with the screen
shown in figure 5-1. The user then enters a concept to teach into the search box on
the upper left of the screen and clicks the “Find Analogies” button. Upon clicking
this button, CrossBridge retrieves analogies for the chosen concept. The retrieved
analogies are listed to the right of the search box, as shown in figure 5-2.
53
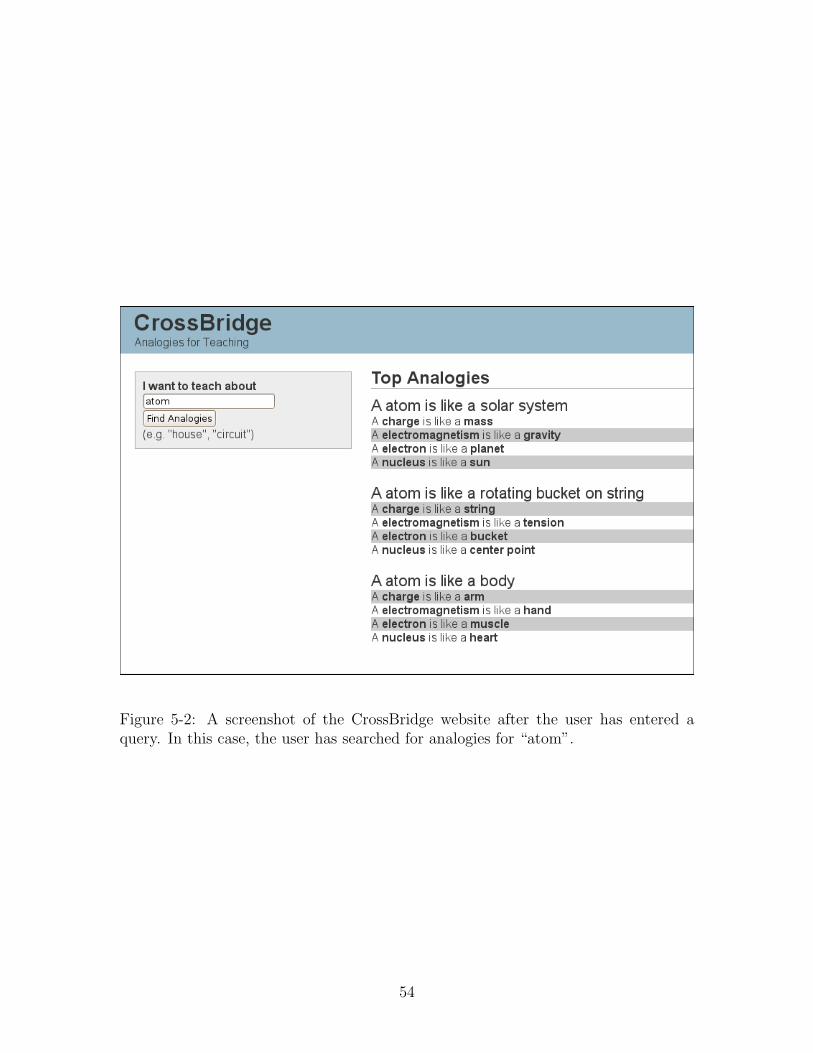
Figure 5-2: A screenshot of the CrossBridge website after the user has entered aquery. In this case, the user has searched for analogies for “atom”.
54
Chapter 6
Discussion and Future Work
CrossBridge differs from previous analogy algorithms in one significant aspect:
CrossBridge simultaneously addresses both the retrieval and mapping subproblems
of finding analogies. An advantage of this approach is that statistical information from
the entire source corpus can be used while finding analogies. In contrast, algorithms
that only address the mapping problem do not have access to this information. This
statistical information improves the quality of results by allowing CrossBridge to
make inferences about missing data.
CrossBridge uses statistical information to improve the robustness of analogy
finding. The truncated singular value decomposition (SVD) used by CrossBridge
automatically accounts for correlations between similar relation structures. These
correlations are exploited during the matching process and lead to improved analogy
recall.
Global statistical information may also improve the evaluation portion of the
analogy process. Typically, analogy algorithms use a heuristic to rate the quality
of an analogy. The statistical information can be used to rank the analogies in a
principled way. For example, the score for an analogy can be related to the SVD
similarity score between the two domains. The SVD may not be the best option in
this case because its similarity scores have no inherent meaning. This problem could
be addressed by using Probabilistic Latent Semantic Indexing[12], which constructs
a proper probabilistic model that resembles the SVD.
55
Simultaneously addressing retrieval and mapping does have some issues, however.
It is challenging to design an efficient algorithm that addresses both problems without
resorting to heuristics. CrossBridge uses heuristics to reduce the size of the SVD
matrix and to form large analogies from small analogies. Without these heuristics,
the running time of CrossBridge would be significantly larger. In general, retrieval
is challenging because there are a large number of possible source domains for an
analogy. The inefficiency of analogical retrieval makes it an important consideration
for future analogy algorithms.
We made some ad-hoc decisions while designing CrossBridge, and it may be
beneficial to revisit some of these choices. One possible area for improvement is the
analogy composition process. In some situations, the current process does not score
analogies fairly. For example, if there are two different ways to form an analogy A
from candidate analogies, this improves our confidence that A is a good analogy. The
current scoring method does not account for this case.
Another possible area for future work is to adapt CrossBridge to operate on
semantic networks with a richer set of relationships. The quality of the analogies
found in a network is very dependent on the available set of relationships. ConceptNet
has only 21 relationships; as a result the found analogies sometimes miss important
distinctions. For example, ConceptNet only has one relationship, “AtLocation”, to
denote that two objects are found together. This occasionally leads to noticeably odd
analogies.
It should be possible to adapt CrossBridge to operate on a data set with richer
relationships such as the corpus of websites used by Turney’s Latent Relational Map-
ping Engine[26]. The only reason this may be challenging is that the number of
relation structures grows very rapidly in the number of possible relationships. For
data sets with a large number of relationships, it may be necessary to modify the
choice of relation structures.
Blending[11] is another possible approach to extending the available set of rela-
tions. Blending is a technique for combining domain-specific knowledge with common
sense knowledge. Using this technique, we may be able to import more specific rela-
56
tionships into ConceptNet. Using this technique, we may be able to make analogies
from complex domains to common sense knowledge; these analogies could be helpful
as teaching aids.
Another limitation CrossBridge is that it operates on semantic networks in-
stead of on propositional logic. Semantic networks cannot represent statements about
statements. For example, a semantic network cannot represent “people think dogs
are pets,” because the statement “dogs are pets” is not a first-class object. The
lack of descriptive power makes it difficult to find analogies between domains with
complex structure. This problem also prevents CrossBridge from applying the
systematicity criterion of structure mapping theory[6]. Extending CrossBridge to
either propositional logic or to reified semantic networks would address this issue.
In this thesis we have only considered structural constraints on analogies. In
practice, other types of constraints may be useful. For example, in case-based rea-
soning or information retrieval applications, we may only want analogies that contain
a specific vertex mapping. These hard mapping constraints are easy to implement
with CrossBridge; simply filter out any of results that do not meet the hard con-
straint. This method, though simple, is somewhat inefficient because CrossBridge
will consider many invalid analogies. The efficiency could be improved by construct-
ing an index that, for every concept, stores the rows of U the concept appears in.
CrossBridge could use this index to limit the analogy search to plausible analogies.
Similarity constraints may also be useful in applications[5]. We think these con-
straints could be included in CrossBridge using blending[11], which is a technique
for combining multiple knowledge bases using the SVD. A blend of the structure
matrix M with a matrix containing the properties of each concept would incorpo-
rate similarity constraints into the graph similarity metric. Blending also allows us
to configure the importance of the two types of constraints by selecting a blending
factor. We believe this technique is a promising possibility for applications requiring
similarity constraints.
The ultimate goal for analogy mechanisms is to solve real problems. We may
be able to use CrossBridge in a case-based reasoning system[15]. CrossBridge
57
mechanism could be used in both the problem matching step and the solution mod-
ification steps of case-based reasoning. The major difficulty in designing such an
application is obtaining an appropriate data set.
In this thesis, we present CrossBridge, a novel algorithm for finding analogies
in large semantic networks. CrossBridge uses dimensionality reduction to find the
most salient systems of relationships within domains of knowledge. Dimensionality
reduction creates a space of domains in which nearby domains are analogous. The
construction of domain space uses statistical trends from a large corpus to smooth
over sparsity. CrossBridge finds analogies by combining similarity information
from domain space with a heuristic search process. Our approach is unique because
the quality of an analogy between two domains is dependent not only on the domains,
but also on global statistical information from the entire semantic network. These
global statistics improve the robustness of CrossBridge’s analogy comparisons.
58
Bibliography
[1] D. Chalmers, R. French, and D. Hofstadter. High-level perception, representa-tion, and analogy: A critique of artificial intelligence methodology, 1991.
[2] Scott Deerwester, Susan T. Dumais, George W. Furnas, Thomas, and RichardHarshman. Indexing by latent semantic analysis. Journal of the American Societyfor Information Science, 41:391–407, 1990.
[3] Thomas G. Evans. A program for the solution of geometric-analogy intelligencetest questions. In Marvin M. Minsky, editor, Semantic Information Processing,pages 271–353. The MIT Press, Cambridge, MA, USA, 1968.
[4] Brian Falkenhainer, Kenneth D. Forbus, and Dedre Gentner. The structure-mapping engine: Algorithm and examples. Artificial Intelligence, 41(1):1–63,1989.
[5] Robert M. French. The Subtlety of Sameness: A Theory and Computer Modelof Analogy-Making. The MIT Press, October 1995.
[6] Dedre Gentner. Structure-mapping: A theoretical framework for analogy. Cog-nitive Science, 7(2):155–170, 1983.
[7] Dedre Gentner. Metaphor as structure mapping: The relational shift. ChildDevelopment, 59(1):47–59, 1988.
[8] Dedre Gentner and Russell Landers. Analogical reminding : A good match ishard to find. In Proceedings of the International Conference on Systems, Manand Cybernetics, Tucson, Arizona, 1985.
[9] Dedre Gentner and Arthur B. Markman. Structure mapping in analogy andsimilarity. American Psychologist, 52:45–56, 1997.
[10] C. Havasi, R. Speer, and J. Alonso. Conceptnet 3: a flexible, multilingual se-mantic network for common sense knowledge. In Proceedings of Recent Advancesin Natural Languge Processing 2007, 2007.
[11] Catherine Havasi, Robert Speer, James Pustejovsky, and Henry Lieberman. Dig-ital intuition: Applying common sense using dimensionality reduction. To appearin IEEE Intelligent Systems, July 2009.
59

[12] Thomas Hofmann. Probabilistic latent semantic indexing, 1999.
[13] Douglas Hofstadter and Melanie Mitchell. The copycat project: a model ofmental fluidity and analogy-making. In Fluid Concepts and Creative Analogies,pages 205–267. Basic Books, Inc., New York, NY, USA, 1995.
[14] Keith J. Holyoak and Paul Thagard. Analogical mapping by constraint satisfac-tion. Cognitive Science, 13:295–355, 1989.
[15] Janet Kolodner. Case-Based Reasoning. Morgan Kaufmann, San Mateo, 1993.
[16] George Lakoff and Mark Johnson. Metaphors We Live by. University of ChicagoPress, April 2003.
[17] Henry Lieberman and Ashwani Kumar. Providing expert advice by analogy foron-line help. Intelligent Agent Technology, IEEE / WIC / ACM InternationalConference on, 0:26–32, 2005.
[18] Gary Mcgraw. Letter spirit: Recognition and creation of letterforms based onfluid concepts. Technical report, Center for, 1992.
[19] Erica Melis and Manuela Veloso. Analogy in problem solving. In Handbook ofPractical Reasoning: Computational and Theoretical Aspects. Oxford UniversityPress, 1998.
[20] Marvin Minsky. Society of Mind. Simon & Schuster, March 1988.
[21] Badrul M. Sarwar, George Karypis, Joseph A. Konstan, and John T. Riedl.Application of dimensionality reduction in recommender system - a case study.In In ACM WebKDD Workshop, 2000.
[22] P. Singh, T. Lin, E. Mueller, G. Lim, T. Perkins, and W. Zhu. Open mindcommon sense: Knowledge acquisition from the general public. In Proceedings ofthe First International Conference on Ontologies, Databases, and Applicationsof Semantics for Large Scale Information Systems, 2002.
[23] John Sowa and Arun Majumdar. Analogical reasoning. In Conceptual Structuresfor Knowledge Creation and Communication: Proceedings of ICCS 2003, pages16–36, 2003.
[24] Robert Speer, Catherine Havasi, and Henry Lieberman. Analogyspace: Reducingthe dimensionality of common sense knowledge. In Dieter Fox and Carla P.Gomes, editors, AAAI, pages 548–553. AAAI Press, 2008.
[25] Emmett Tomai, Andrew Lovett, Kenneth D. Forbus, and Jeffrey Usher. A stru-cture mapping model for solving geometric analogy problems.
[26] Peter D. Turney. The latent relation mapping engine: Algorithm and experi-ments, December 2008. NRC-50738.
60

[27] Sheng Zhang, Weihong Wang, J. Ford, F. Makedon, and J. Pearlman. Usingsingular value decomposition approximation for collaborative filtering. pages257–264, 2005.
61