Embed Size (px)
Citation preview
Finding a Better k: A psychophysical investigation ofclustering
Joshua M. LewisDepartment of Cognitive Science
University of California, San DiegoSan Diego, CA 92093
Abstract
Finding the number of groups in a data set, k, is an important problem in thefield of unsupervised machine learning with applications across many scientificdomains. The problem is difficult however, because it is ambiguous and hierar-chical, and current techniques for finding k often produce unsatisfying results.Humans are adept at navigating ambiguous and hierarchical situations, and thispaper measures human performance on the problem of finding k across a widevariety of data sets. We find that humans employ multiple strategies for choosingk, often simultaneously, and the number of possible interpretations of even simpledata sets with very few (N < 20) samples can be quite high. In addition, twoleading machine learning algorithms are compared to the human results.Keywords: machine learning; clustering; psychophysics.
1 Human Data
Eighteen undergraduate human subjects were recruited for this project, 11 female and 7 male, todetermine the number of groups present in 50 distinct point light displays. Each point light displaywas presented at two different scales and two different rotations, for a total of four presentations perdisplay and 200 trials per subject. Subjects were asked to determine the number of groups in eachdisplay and were encouraged to give more than one answer if appropriate. There was no time limitfor response. Subjects were told to ignore answers above 20 and to focus on “the bigger picture” tofind a reasonable answer less than 20. The sequence of trial presentations was structured into fourblocks of 50 randomly ordered trials each, with each block consisting of a unique permutation ofevery point light display. After the subjects completed all 200 trials, they were interviewed in orderto gain insight into their techniques. The human data were analyzed and will be presented collapsedacross subjects, scales and rotations. The results are presented in normalized bar plots meant torepresent a probability distribution over k, based on the number of responses at each particular k.For each display there are at least 72 responses represented, assuming one answer per subject pertrial. The actual number of responses might be larger if subjects were inclined to give multipleanswers.
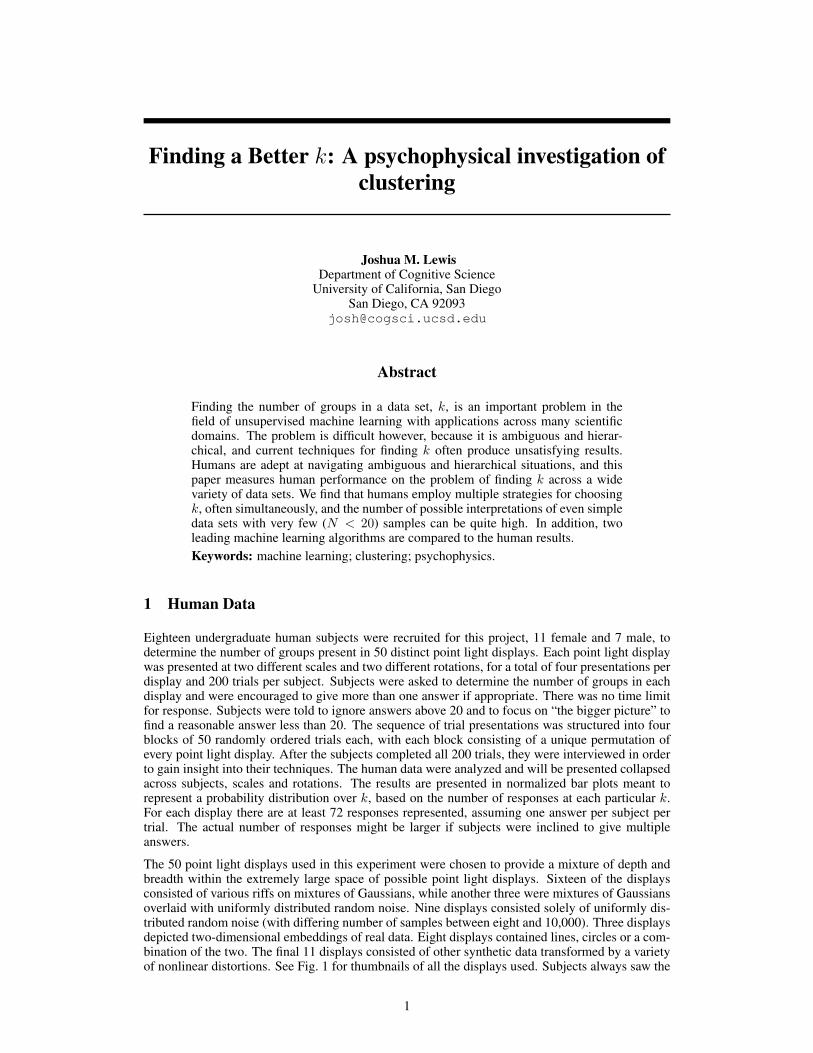
The 50 point light displays used in this experiment were chosen to provide a mixture of depth andbreadth within the extremely large space of possible point light displays. Sixteen of the displaysconsisted of various riffs on mixtures of Gaussians, while another three were mixtures of Gaussiansoverlaid with uniformly distributed random noise. Nine displays consisted solely of uniformly dis-tributed random noise (with differing number of samples between eight and 10,000). Three displaysdepicted two-dimensional embeddings of real data. Eight displays contained lines, circles or a com-bination of the two. The final 11 displays consisted of other synthetic data transformed by a varietyof nonlinear distortions. See Fig. 1 for thumbnails of all the displays used. Subjects always saw the
1
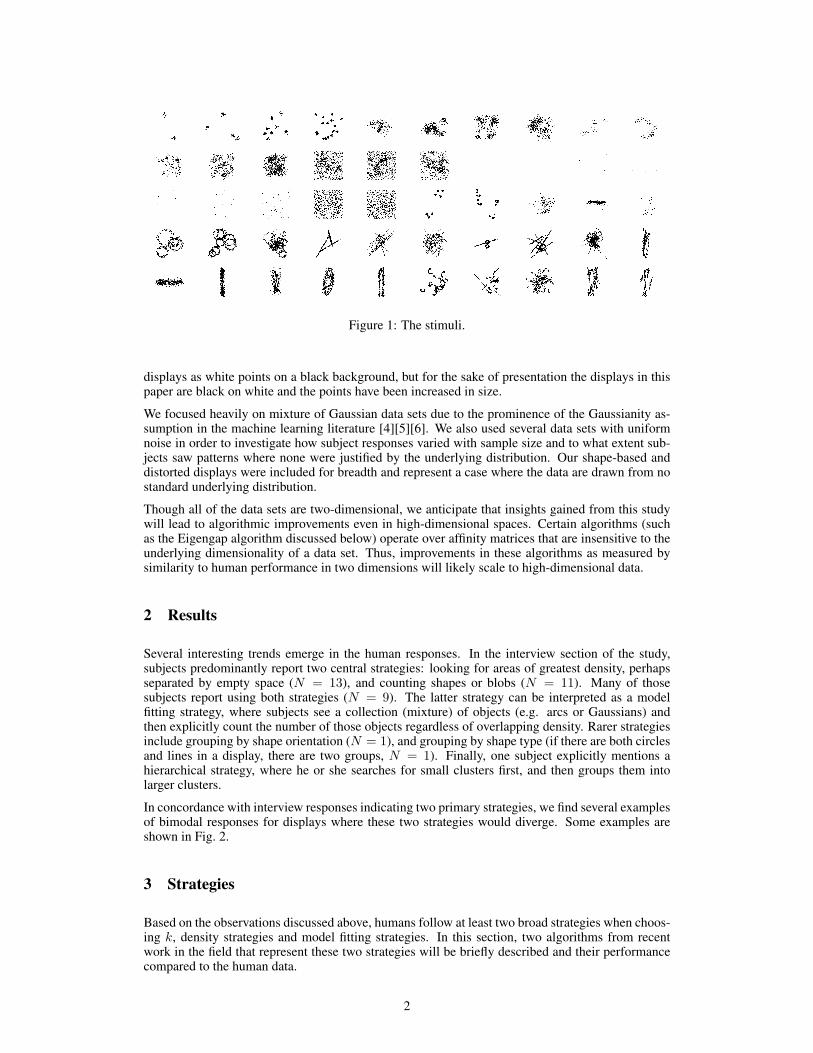
Figure 1: The stimuli.
displays as white points on a black background, but for the sake of presentation the displays in thispaper are black on white and the points have been increased in size.
We focused heavily on mixture of Gaussian data sets due to the prominence of the Gaussianity as-sumption in the machine learning literature [4][5][6]. We also used several data sets with uniformnoise in order to investigate how subject responses varied with sample size and to what extent sub-jects saw patterns where none were justified by the underlying distribution. Our shape-based anddistorted displays were included for breadth and represent a case where the data are drawn from nostandard underlying distribution.
Though all of the data sets are two-dimensional, we anticipate that insights gained from this studywill lead to algorithmic improvements even in high-dimensional spaces. Certain algorithms (suchas the Eigengap algorithm discussed below) operate over affinity matrices that are insensitive to theunderlying dimensionality of a data set. Thus, improvements in these algorithms as measured bysimilarity to human performance in two dimensions will likely scale to high-dimensional data.
2 Results
Several interesting trends emerge in the human responses. In the interview section of the study,subjects predominantly report two central strategies: looking for areas of greatest density, perhapsseparated by empty space (N = 13), and counting shapes or blobs (N = 11). Many of thosesubjects report using both strategies (N = 9). The latter strategy can be interpreted as a modelfitting strategy, where subjects see a collection (mixture) of objects (e.g. arcs or Gaussians) andthen explicitly count the number of those objects regardless of overlapping density. Rarer strategiesinclude grouping by shape orientation (N = 1), and grouping by shape type (if there are both circlesand lines in a display, there are two groups, N = 1). Finally, one subject explicitly mentions ahierarchical strategy, where he or she searches for small clusters first, and then groups them intolarger clusters.
In concordance with interview responses indicating two primary strategies, we find several examplesof bimodal responses for displays where these two strategies would diverge. Some examples areshown in Fig. 2.
3 Strategies
Based on the observations discussed above, humans follow at least two broad strategies when choos-ing k, density strategies and model fitting strategies. In this section, two algorithms from recentwork in the field that represent these two strategies will be briefly described and their performancecompared to the human data.
2
3.1 Density Strategies
Density strategies discover clusters by looking for regions of low density between groups of points,following density within groups to find all the points that belong to them, and attempting to ignorelow density noise. A recent algorithm [8], which this paper will refer to as the Eigengap algorithm,brings these strategies for finding k under the spectral clustering umbrella. The Eigengap algorithmtreats each data point as a node on a graph, and then performs a random walk between the nodes,with the probability of transitioning between any two nodes weighted by the distance between them.If two nodes are close together then the probability of transitioning from one to the other will behigh and if two nodes are far apart then the probability of transitioning from one to the other will below. Thus, if a group of points is separated by a large distance from the rest of the data, a randomwalk will be unlikely to transition across that gap. In this case, all the points within the group willhave a high probability of ending up on other points in the group and little probability of ending upoutside the group.
A matrix, P , representing the probability of any point ending up at any other point in the data setwill therefore be block diagonal if there are distinct groups within the data set that are separated bysufficient distance. This block diagonal structure is represented by the n largest eigenvalues of P ,and eigenvalues greater than the nth will generally be much smaller than the first n eigenvalues. Byfinding the largest difference between neighboring eigenvalues sorted in descending order, one canfind a useful estimate of the number of groups in the data. For example, if the difference betweenthe third and fourth eigenvalues is 0.4 and that distance is greater than the distance between all otheradjacent eigenvalues, then there are likely to be three groups in the data.
Figure 2: A sample of displays thatelicited bimodal responses from sub-jects.
As the random walk progresses the Eigengap algorithmnaturally finds groups of coarser and coarser structure.Over an increasing number of steps, a random walk willbecome more and more likely to cross over low densitysections of the data set, and thus two groups that initiallymight be separated will over time merge and lower val-ues for k will be discovered. In this way the Eigengapalgorithm can respond well to hierarchical data given asufficiently long random walk.
3.2 Model Fitting Strategies
Several model fitting strategies based on an assumption ofmixture of Gaussian distributed data have been proposedin the past [4] [5]. This section describes a recent variantcalled PG-means [6]. PG-means searches for Gaussianclusters in a data set using an iterative process. The al-gorithm is initialized with k = 1 and it attempts to findan appropriate centroid and covariance matrix for a sin-gle Gaussian cluster given the data using the Expectation-Maximization (EM) algorithm. PG-means then randomlyprojects the data set and the Gaussian model down to onedimension n times (we used n = 10). The Kolmogorov-Smirnov (KS) test is applied to each projection and if ev-ery KS test indicates a sufficiently good fit (as measuredby a parameter α that was set to 0.001) then the currentvalue for k is accepted. Otherwise, k is incremented byone and the entire process is repeated.
If PG-means did not find an answer less than k = 20, the algorithm was halted and its responseconsidered to be k = 1. Note that unlike the Eigengap algorithm, PG-means will only give onepossible value for k.
3.3 Comparison with Human Data
3
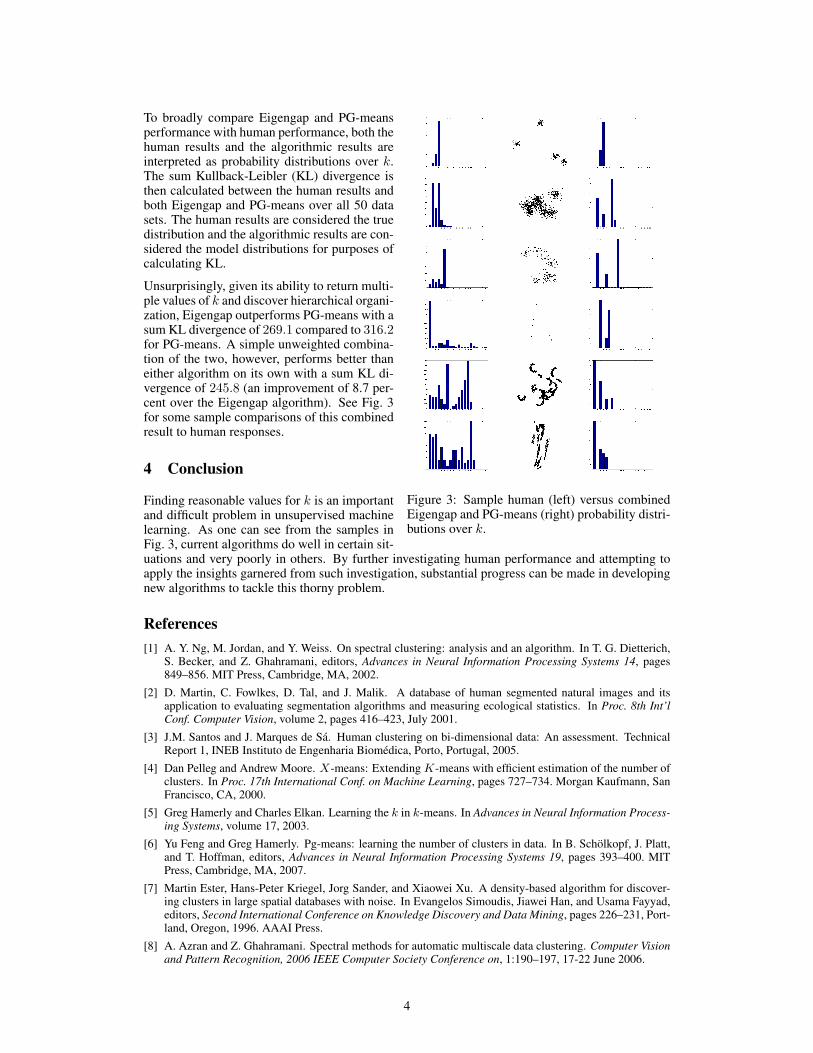
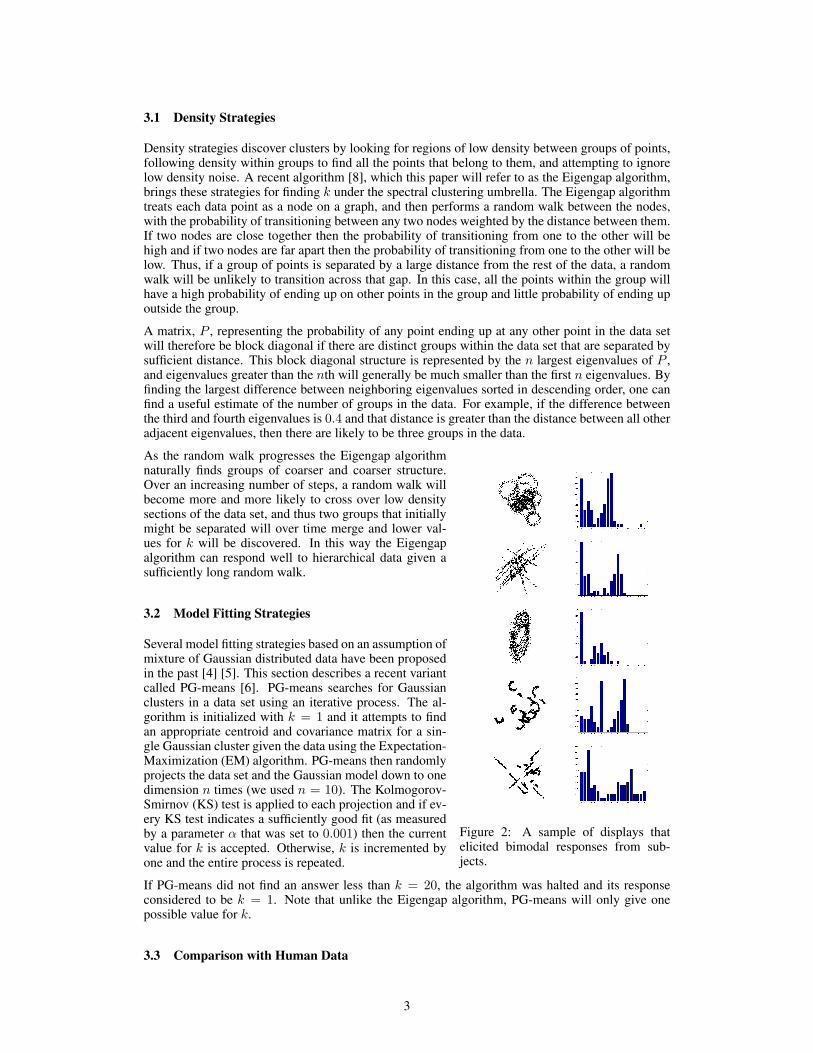
Figure 3: Sample human (left) versus combinedEigengap and PG-means (right) probability distri-butions over k.
To broadly compare Eigengap and PG-meansperformance with human performance, both thehuman results and the algorithmic results areinterpreted as probability distributions over k.The sum Kullback-Leibler (KL) divergence isthen calculated between the human results andboth Eigengap and PG-means over all 50 datasets. The human results are considered the truedistribution and the algorithmic results are con-sidered the model distributions for purposes ofcalculating KL.
Unsurprisingly, given its ability to return multi-ple values of k and discover hierarchical organi-zation, Eigengap outperforms PG-means with asum KL divergence of 269.1 compared to 316.2for PG-means. A simple unweighted combina-tion of the two, however, performs better thaneither algorithm on its own with a sum KL di-vergence of 245.8 (an improvement of 8.7 per-cent over the Eigengap algorithm). See Fig. 3for some sample comparisons of this combinedresult to human responses.
4 Conclusion
Finding reasonable values for k is an importantand difficult problem in unsupervised machinelearning. As one can see from the samples inFig. 3, current algorithms do well in certain sit-uations and very poorly in others. By further investigating human performance and attempting toapply the insights garnered from such investigation, substantial progress can be made in developingnew algorithms to tackle this thorny problem.
References[1] A. Y. Ng, M. Jordan, and Y. Weiss. On spectral clustering: analysis and an algorithm. In T. G. Dietterich,
S. Becker, and Z. Ghahramani, editors, Advances in Neural Information Processing Systems 14, pages849–856. MIT Press, Cambridge, MA, 2002.
[2] D. Martin, C. Fowlkes, D. Tal, and J. Malik. A database of human segmented natural images and itsapplication to evaluating segmentation algorithms and measuring ecological statistics. In Proc. 8th Int’lConf. Computer Vision, volume 2, pages 416–423, July 2001.
[3] J.M. Santos and J. Marques de Sa. Human clustering on bi-dimensional data: An assessment. TechnicalReport 1, INEB Instituto de Engenharia Biomedica, Porto, Portugal, 2005.
[4] Dan Pelleg and Andrew Moore. X-means: Extending K-means with efficient estimation of the number ofclusters. In Proc. 17th International Conf. on Machine Learning, pages 727–734. Morgan Kaufmann, SanFrancisco, CA, 2000.
[5] Greg Hamerly and Charles Elkan. Learning the k in k-means. In Advances in Neural Information Process-ing Systems, volume 17, 2003.
[6] Yu Feng and Greg Hamerly. Pg-means: learning the number of clusters in data. In B. Scholkopf, J. Platt,and T. Hoffman, editors, Advances in Neural Information Processing Systems 19, pages 393–400. MITPress, Cambridge, MA, 2007.
[7] Martin Ester, Hans-Peter Kriegel, Jorg Sander, and Xiaowei Xu. A density-based algorithm for discover-ing clusters in large spatial databases with noise. In Evangelos Simoudis, Jiawei Han, and Usama Fayyad,editors, Second International Conference on Knowledge Discovery and Data Mining, pages 226–231, Port-land, Oregon, 1996. AAAI Press.
[8] A. Azran and Z. Ghahramani. Spectral methods for automatic multiscale data clustering. Computer Visionand Pattern Recognition, 2006 IEEE Computer Society Conference on, 1:190–197, 17-22 June 2006.
4