Embed Size (px)
Citation preview
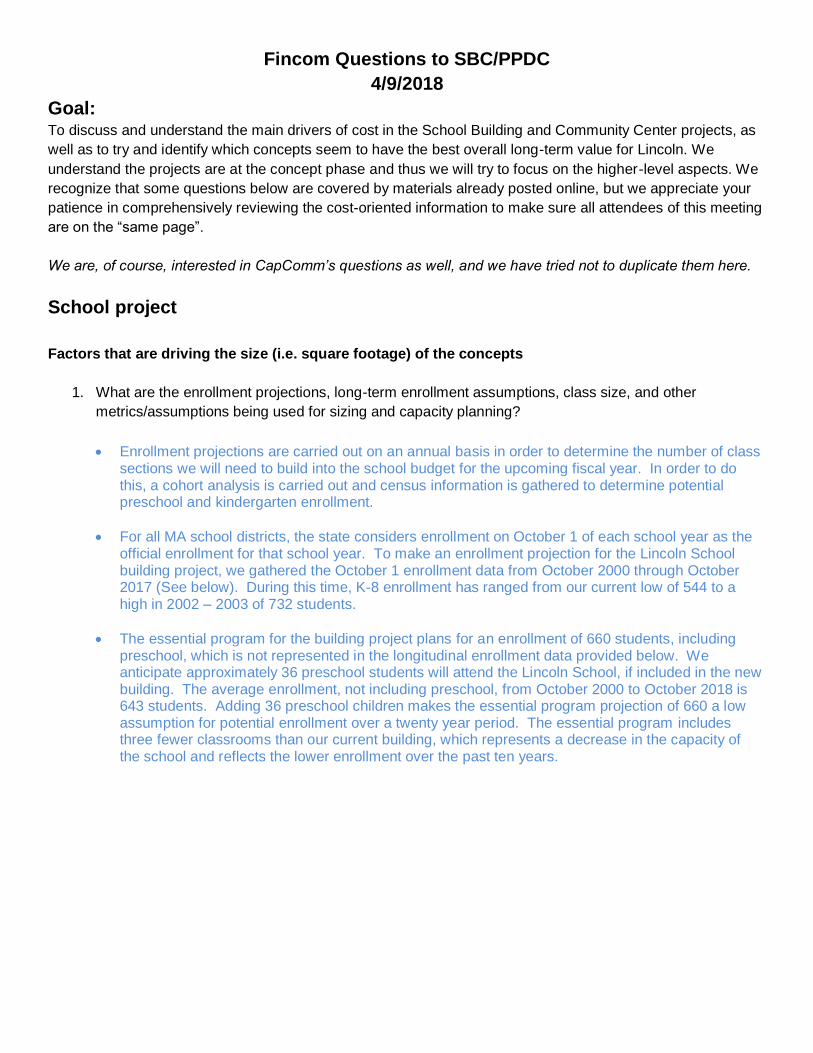
Fincom Questions to SBC/PPDC
4/9/2018
Goal: To discuss and understand the main drivers of cost in the School Building and Community Center projects, as
well as to try and identify which concepts seem to have the best overall long-term value for Lincoln. We
understand the projects are at the concept phase and thus we will try to focus on the higher-level aspects. We
recognize that some questions below are covered by materials already posted online, but we appreciate your
patience in comprehensively reviewing the cost-oriented information to make sure all attendees of this meeting
are on the “same page”.
We are, of course, interested in CapComm’s questions as well, and we have tried not to duplicate them here.
School project
Factors that are driving the size (i.e. square footage) of the concepts
1. What are the enrollment projections, long-term enrollment assumptions, class size, and other
metrics/assumptions being used for sizing and capacity planning?
• Enrollment projections are carried out on an annual basis in order to determine the number of class sections we will need to build into the school budget for the upcoming fiscal year. In order to do this, a cohort analysis is carried out and census information is gathered to determine potential preschool and kindergarten enrollment.
• For all MA school districts, the state considers enrollment on October 1 of each school year as the official enrollment for that school year. To make an enrollment projection for the Lincoln School building project, we gathered the October 1 enrollment data from October 2000 through October 2017 (See below). During this time, K-8 enrollment has ranged from our current low of 544 to a high in 2002 – 2003 of 732 students.
• The essential program for the building project plans for an enrollment of 660 students, including preschool, which is not represented in the longitudinal enrollment data provided below. We anticipate approximately 36 preschool students will attend the Lincoln School, if included in the new building. The average enrollment, not including preschool, from October 2000 to October 2018 is 643 students. Adding 36 preschool children makes the essential program projection of 660 a low assumption for potential enrollment over a twenty year period. The essential program includes three fewer classrooms than our current building, which represents a decrease in the capacity of the school and reflects the lower enrollment over the past ten years.
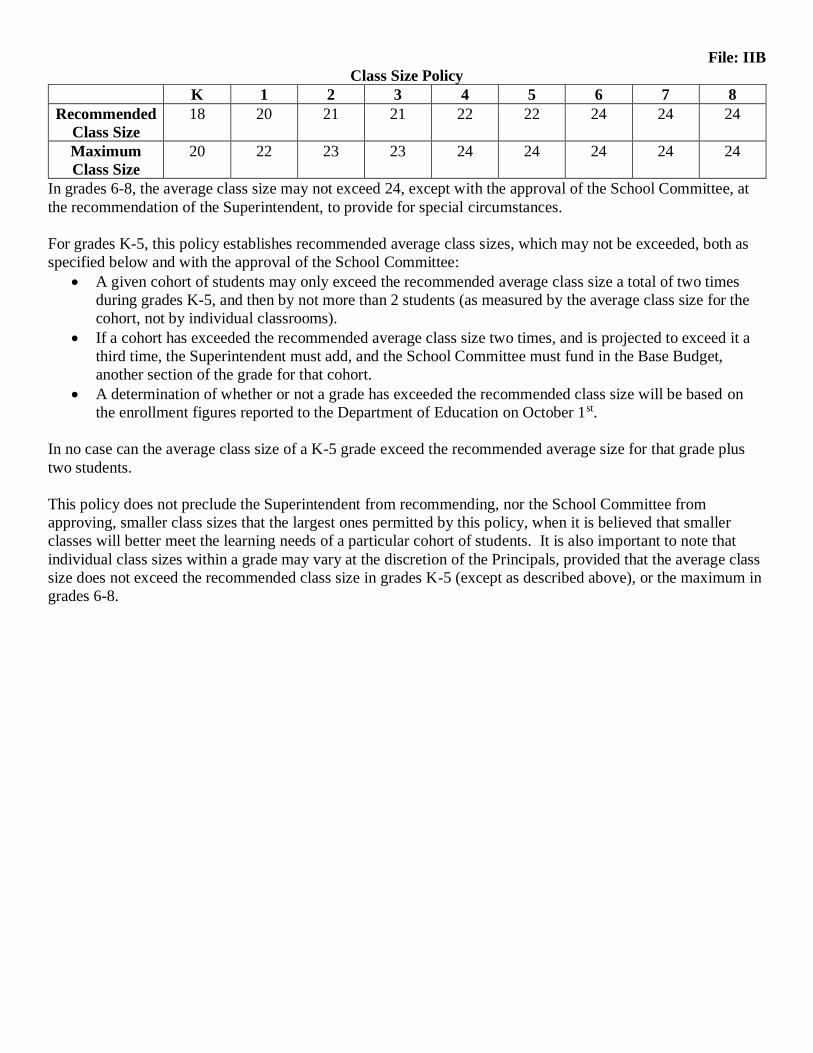
File: IIB
Class Size Policy
K 1 2 3 4 5 6 7 8
Recommended
Class Size
18 20 21 21 22 22 24 24 24
Maximum
Class Size
20 22 23 23 24 24 24 24 24
In grades 6-8, the average class size may not exceed 24, except with the approval of the School Committee, at
the recommendation of the Superintendent, to provide for special circumstances.
For grades K-5, this policy establishes recommended average class sizes, which may not be exceeded, both as
specified below and with the approval of the School Committee:
• A given cohort of students may only exceed the recommended average class size a total of two times
during grades K-5, and then by not more than 2 students (as measured by the average class size for the
cohort, not by individual classrooms).
• If a cohort has exceeded the recommended average class size two times, and is projected to exceed it a
third time, the Superintendent must add, and the School Committee must fund in the Base Budget,
another section of the grade for that cohort.
• A determination of whether or not a grade has exceeded the recommended class size will be based on
the enrollment figures reported to the Department of Education on October 1st.
In no case can the average class size of a K-5 grade exceed the recommended average size for that grade plus
two students.
This policy does not preclude the Superintendent from recommending, nor the School Committee from
approving, smaller class sizes that the largest ones permitted by this policy, when it is believed that smaller
classes will better meet the learning needs of a particular cohort of students. It is also important to note that
individual class sizes within a grade may vary at the discretion of the Principals, provided that the average class
size does not exceed the recommended class size in grades K-5 (except as described above), or the maximum in
grades 6-8.
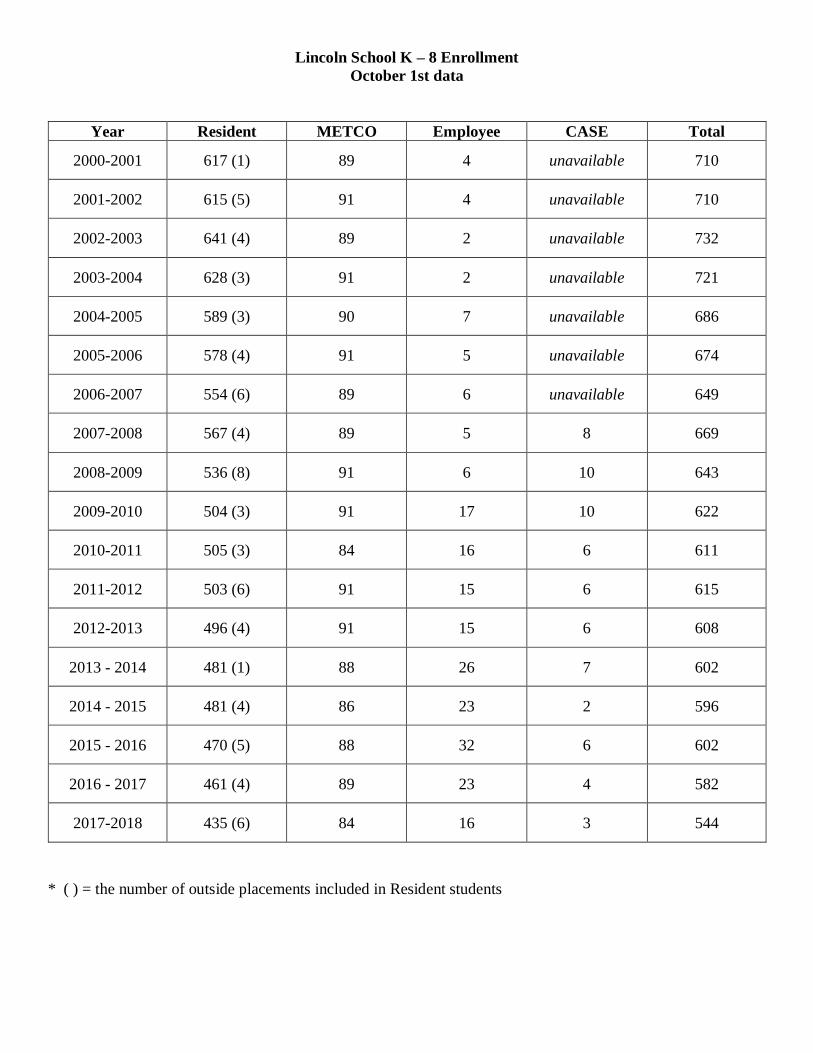
Lincoln School K – 8 Enrollment
October 1st data
Year Resident METCO Employee CASE Total
2000-2001 617 (1) 89 4 unavailable 710
2001-2002 615 (5) 91 4 unavailable 710
2002-2003 641 (4) 89 2 unavailable 732
2003-2004 628 (3) 91 2 unavailable 721
2004-2005 589 (3) 90 7 unavailable 686
2005-2006 578 (4) 91 5 unavailable 674
2006-2007 554 (6) 89 6 unavailable 649
2007-2008 567 (4) 89 5 8 669
2008-2009 536 (8) 91 6 10 643
2009-2010 504 (3) 91 17 10 622
2010-2011 505 (3) 84 16 6 611
2011-2012 503 (6) 91 15 6 615
2012-2013 496 (4) 91 15 6 608
2013 - 2014 481 (1) 88 26 7 602
2014 - 2015 481 (4) 86 23 2 596
2015 - 2016 470 (5) 88 32 6 602
2016 - 2017 461 (4) 89 23 4 582
2017-2018 435 (6) 84 16 3 544
* ( ) = the number of outside placements included in Resident students
2. Is there a set of such assumptions worth considering that would lead to a smaller school building,
perhaps with cost effective options for expansion later?
The building size is based upon student enrollment, projected class sizes and the educational program
developed by the School District. The School Administration went through an extensive educational
programming exercise to arrive at the current options and their sizes. The School Administration has
been very sensitive to the correlation between school size and project cost and has pared down the
initial desired (optimal) program to those spaces that were deemed “essential,” from which the L2, L3
and C Options are based. These options reduce the total number of classrooms to three less than the
current building.
3. What assumptions or guidelines are you following for how many sqft/student are being proposed for
each type of space (i.e. classroom vs gym vs cafeteria etc) in the concepts?
The educational programming and planning process commenced utilizing the MSBA space guidelines
for sizing of spaces. Existing spaces that were educationally appropriate to remain in their current
locations generally remained the same size (with potential minor variations depending upon the specific
option). The Hub spaces were originally planned to match the Hanscom school model, but
subsequently reduced in size as part of the essential program discussion. Pre K classrooms have been
sized based on the MSBA guidelines. The Commons space (cafeteria dining) in the MSBA guidelines is
sized for three seatings (slightly smaller size) but in the case of a combined Elementary and Middle
School, a two seating scenario is very desirable and for this project, the Commons has been sized for
two seatings. The MSBA guidelines indicate only one gymnasium for a project of this size – but due to
schedule challenges, their history on the site and the benefits of community use, two gyms are included
in the project. The MSBA guidelines do not include Auditorium spaces for elementary schools.
4. How do such assumptions or guidelines differ (if at all) from other comparable projects and MSBA
guidelines?
The Lincoln School project is consistent with MSBA guidelines.
5. How does the overall sqft / student of these concepts compare to comparable projects?
Project size is comparable to other projects by the SMMA and Ewing Cole teams. It is less than the
Hanscom School.
6. If higher, what elements of the concepts primarily cause the higher square footage?
The second gymnasium, Auditorium, Hubs, slightly larger cafeteria, longer corridors of the existing and
“L” shaped footprint are areas which increase the total building area.
7. What are the approximate incremental costs for each of those elements?
New second Gymnasium: 6,905 SF X $585 PSF = $4.04 M*
OR
Renovation to Smith Gym: 6,905 SF X $340 PSF = $2.35 M*
Auditorium Renovation: 8,299 SF X $340 PSF = $2.82 M*
Hubs (Grades 3-8 only): 7,140 SF X $585 PSF = $4.17 M*
Corridors: Indeterminate at this stage
* Total project cost- includes escalation/soft costs
8. And how might that extra cost be justified by residents?
The community has used the existing auditorium and gymnasium spaces heavily over the many
decades of their existence, and each option preserves and extends that usage for decades more to
come. The Hub spaces provide extended learning areas that foster collaboration, small and large group
teaching and project-based learning.
9. Of our comparable communities that have recently done school building projects on existing K-8
buildings, which chose more comprehensive renovations & built more new structure, and which chose
less comprehensive renovations & more repair?
K-8 is now a relatively rare grade configuration and not used by surrounding towns. Belmont, Weston
and Lexington have each had an elementary school project since 2010.
- Belmont Wellington Elementary School. All New Construction.
- Weston Field Elementary School. All New Construction.
- Lexington Estabrook Elementary School. All New Construction.
The factors that lead a decision towards renovation or new construction can be very complicated. The
general age, condition, building system functionality, and size can be key factors.
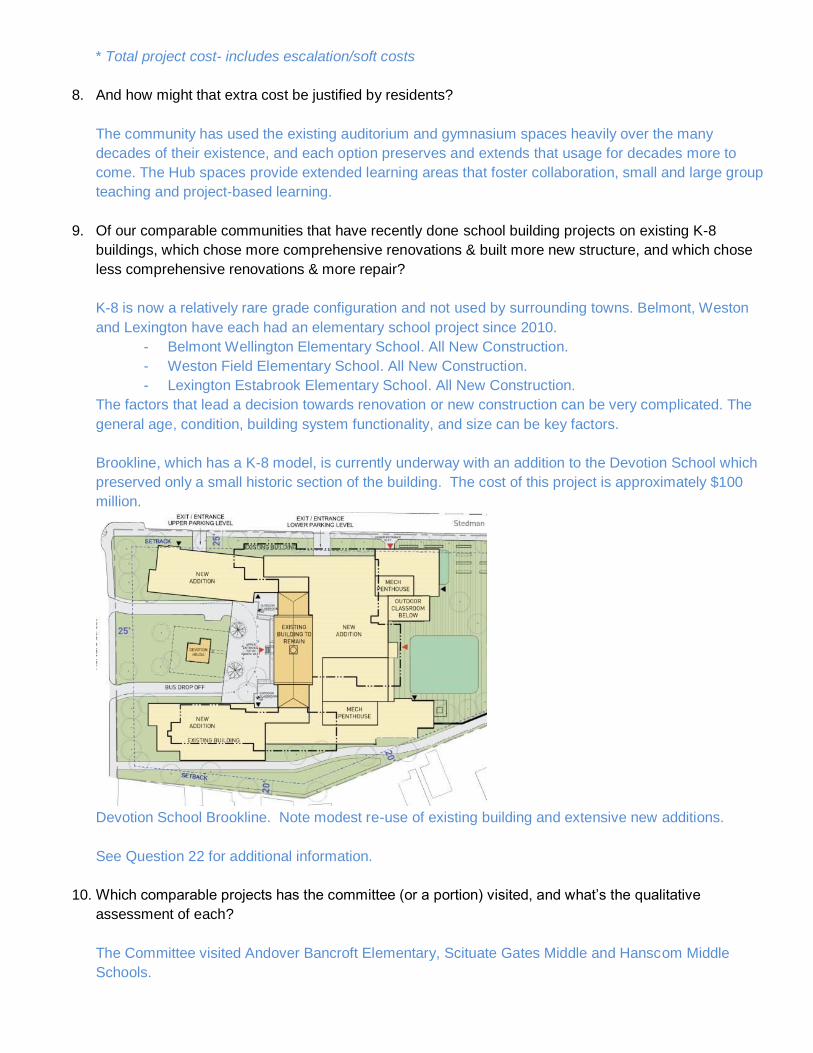
Brookline, which has a K-8 model, is currently underway with an addition to the Devotion School which
preserved only a small historic section of the building. The cost of this project is approximately $100
million.
Devotion School Brookline. Note modest re-use of existing building and extensive new additions.
See Question 22 for additional information.
10. Which comparable projects has the committee (or a portion) visited, and what’s the qualitative
assessment of each?
The Committee visited Andover Bancroft Elementary, Scituate Gates Middle and Hanscom Middle
Schools.
• Bancroft Elementary. New Construction. The hub space equivalent were considered too small to be
truly functional or effective.
• Gates Middle. New (Middle School) Construction added to adjacent High School. The hub spaces
and teaming spaces were identified as functionally useful, advantageous and attractive spaces.
• Hanscom School. New Construction. The hub spaces were identified as being appropriate and
serve the educational needs well.
Factors that are driving the cost per square foot of the concepts
11. We understand that the projected cost estimates use various $/sqft costs for different spaces in each
concept depending on how much renovation vs new construction is involved. Please review the levels
of $/sqft costs used, and describe how they compare to comparable projects.
SMMA and Daedalus did an extensive survey of the current school and made a complete assessment
of how much work would be necessary to renovate each section of the school. For purposes of cost
estimating, the sections of the school were then classified as needing Modest Renovation, Medium
Renovation, or Heavy Renovation. So, for instance, the design team has made the judgment that in
any concept in which we retain the 1994 Smith Addition, that space (8518 square feet) would need
modest renovation. The square foot cost for modest renovation, derived from other current school
projects in Massachusetts and escalated to the likely construction timeframe for the Lincoln project, is
$250, so the conceptual cost for the renovation of the 1994 Smith Addition is $2,129,500. The
conceptual cost for Medium Renovation is $300 per square foot, and this would apply to the Reed Gym
Locker Rooms, the 1955 Second Grade Wing, and the 1953 Smith Addition. The conceptual cost for
Heavy Renovation is $500 per square foot — this applies only in very limited cases, as new
construction would be less expensive than this level of renovation.
12. We understand that costs of recent MSBA school building projects were used to determine some of the
cost estimates for our projects, and that the inflation implicit in the MSBA data is approximately
6.9%/year for 2013-2020, i.e. roughly the time period between when we had hoped to start construction
on the 2012 project vs when we hope to start this project. What factors are driving this high rate of
inflation?
Yes, the estimate database used encompasses all building types. But yes, MSBA and Non-MSBA
school projects are exceeding the current rate of inflation for the general economy. This is primarily due
to the limited pool of available contractors and sub-contractors willing to perform public projects, along
with prevailing wage increases of 2-3% per year.
13. As shown here, the RLB Construction Cost Report - Boston shows a much lower inflation rate (~3%)
than implied by the MSBA data. Why is that, and does it have any relevance or implications for our
project?
There are other Cost Reports which show different results. For example, see Attachment A from ENR
Magazine which indicates a 3.9%+ rate of inflation. Schools are a more expensive building type (See
answer to Question 8).
14. How close is the mix of elements in our proposed concepts to the mix in recent MSBA projects? How
valid is the pricing data from those MSBA projects for our estimation purposes, and is it the best
available choice? If used, is any adjustment to the MSBA pricing appropriate?
The proposed program / mix of elements is similar to an MSBA-funded project. The pricing data for
MSBA projects is valid as the building types are the same. No adjustments to the MSBA pricing is
appropriate.
In a typical MSBA elementary or middle school with this design enrollment, a second gym nor an
auditorium would be included.
15. What escalation rate are you using to inflate costs to the targeted start year, and if lower than the past
inflation rate observed, why?
An escalation rate of 5% per year is being used with a projected Spring of 2020 start date. It is simply a
guess, no one really knows what the future rate will be.
16. What is the “design and pricing contingency” cost, and how does the rate (10% of total construction
costs) used in your cost estimation compare to comparable projects?
A 10% design and pricing contingency is comparable for other projects at a conceptual level of design.
It is to cover development of additional detail in the design.
17. What are included in “soft costs”, and how does the rate (i.e. 24%) and base of calculation ( i.e. total of
construction costs plus escalation and temporary space costs) used in your cost estimation compare
with comparable projects?
The following are included in Soft Costs:
Administration Costs Legal Fees Owners Project Manager Fees Advertising and Printing Permitting Owners Insurance Other Administration Costs Architectural fees Reimbursable Services Hazardous Materials Geotech & Environmental Site Survey Wetlands flagging and studies Traffic Studies Other Reimbursable Costs Utility Company Fees Construction Testing Services Commissioning Costs Swing Space/Modulars/Temp Relocation Moving Costs Furniture & Equipment Computer Equipment Soft cost contingency Construction Contingency
18. I would like to get a bit more clarity about the value of the items that the Full Program Concept has that the others do not. Namely - E classrooms, Optimal Square Footage and Hubs Spaces.
Three Additional Classrooms, Hubs at all Grade levels
19. Are there differences in expected life between the options? When will the next major renovation be expected for each option?
Comprehensive addition and renovation projects where all new systems are provided would be considered at least a 50 year building – HVAC and major equipment items are generally considered to have a service life of 30-35 years. Roofs have a 25-30 year service life.
The Repair Only option will require ongoing and immediate updates depending upon individual systems life expectancy.
20. What are the total estimated costs projected to build, finance and operate (maintenance, repairs & capital replacements) for each of the current concepts for the entire stated 30 year bonded or projected lifetime of the school. This should include a separate line for the potential modifications of the buildings for energy enhancements, and to meet changing educational programmatic and capacity needs.
See Question 24.
21. Do we have a simple 1 page table or bar graph that shows the comparative additive costs and benefits of the various building concepts starting at the repair at $49M adding each of the higher cost versions over that minimum base.
See previous SMMA presentations and concept handouts from Community Forum #4 on 4/10/2018
See Attachment C – Comparison of Campus Project Concepts
22. School: cost per sqft is high. What are comparable new school buildings (comped to MA, community size, school program) and what is their cost/sqft? Which Lincoln project plan does each comp most closely parallel? What is your qualitative assessment of those good comps, assuming you have visited?
Belmont Wellington Elementary School. All New Construction. $313/sf completed in 2010
Weston Field Elementary School. All New Construction. $375/sf completed in 2013
Lexington Estabrook Elementary School. All New Construction. $357/sf completed in 2013
Andover Bancroft Elementary School. All New Construction. $375/sf completed in 2013
Scituate Gates Middle School. New Construction. $319/sf completed in 2016
Lexington Maria Hastings Elementary School. $483/sf Projected Completion 2019.
Some Schematic Design estimates for projects of similar enrollment:
Worcester Nelson Place Elementary. All New Construction. 600 enrollment. $418/sf. Estimated in 2015
Quincy Sterling Middle. All New Construction. 430 enrollment. $486/sf. Estimated 2016
Lynn Pickering Middle. All New Construction. 652 enrollment, $508/sf. Estimated 2017
Millis Brown Elementary. All New Construction. 515 enrollment. $474/sf. Estimate 2017
Taunton Mulcahey Elementary. All New Construction. 735 enrollment. $418/sf. Estimated 2018
Below is a link to the MSBA web site of their Cost Data Chart. It is interactive and should be looked at
online:
http://info.massschoolbuildings.org/TabPub/TableauCostData.aspx
23. School: let’s look at comparable communities from the other direction. Of our comparable communities that have recently done school building projects on existing K-8 buildings, which chose more comprehensive renovations/built more new structure, and which chose less comprehensive renovations/more repair?
See Question 9.
Operations and Maintenance Costs [mostly covered by CapComm Questions]
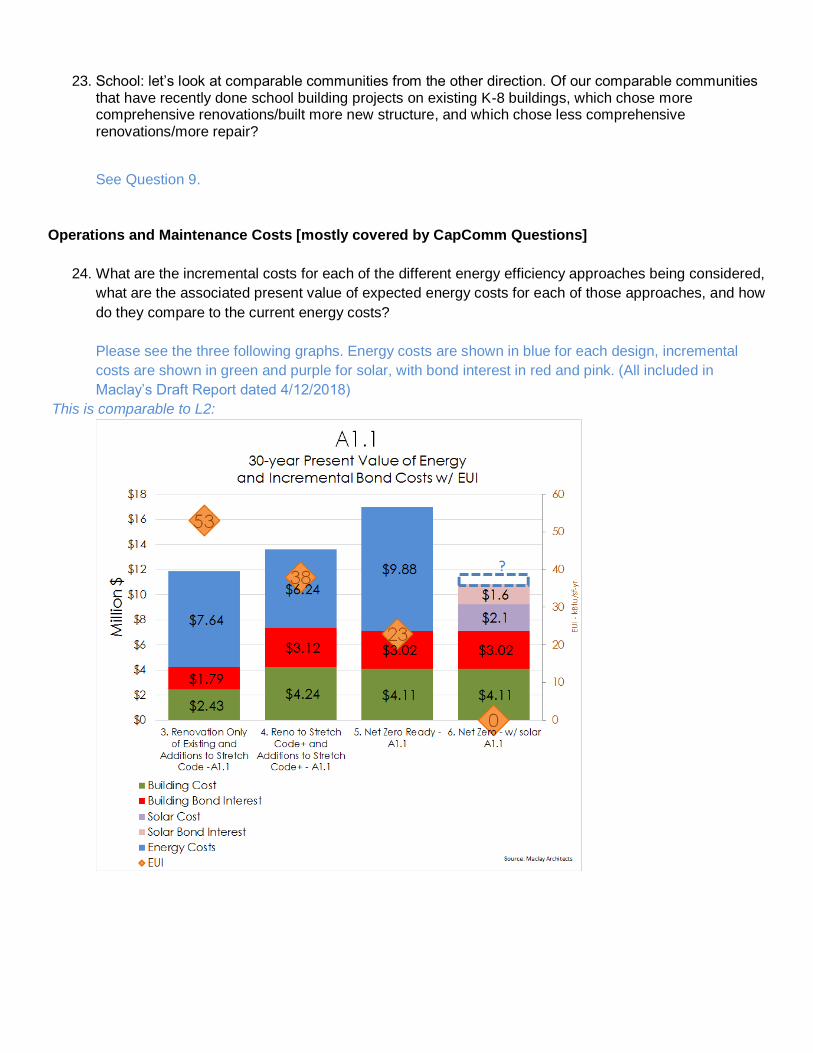
24. What are the incremental costs for each of the different energy efficiency approaches being considered,
what are the associated present value of expected energy costs for each of those approaches, and how
do they compare to the current energy costs?
Please see the three following graphs. Energy costs are shown in blue for each design, incremental
costs are shown in green and purple for solar, with bond interest in red and pink. (All included in
Maclay’s Draft Report dated 4/12/2018)
This is comparable to L2:
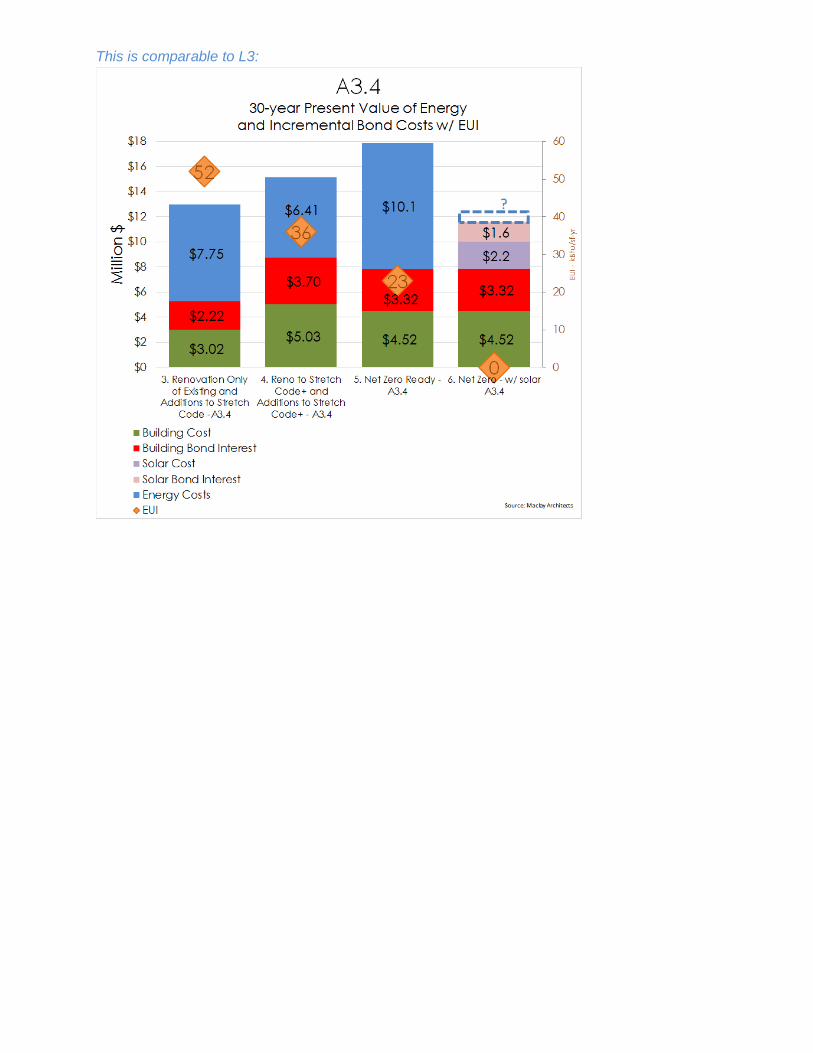
This is comparable to L3:
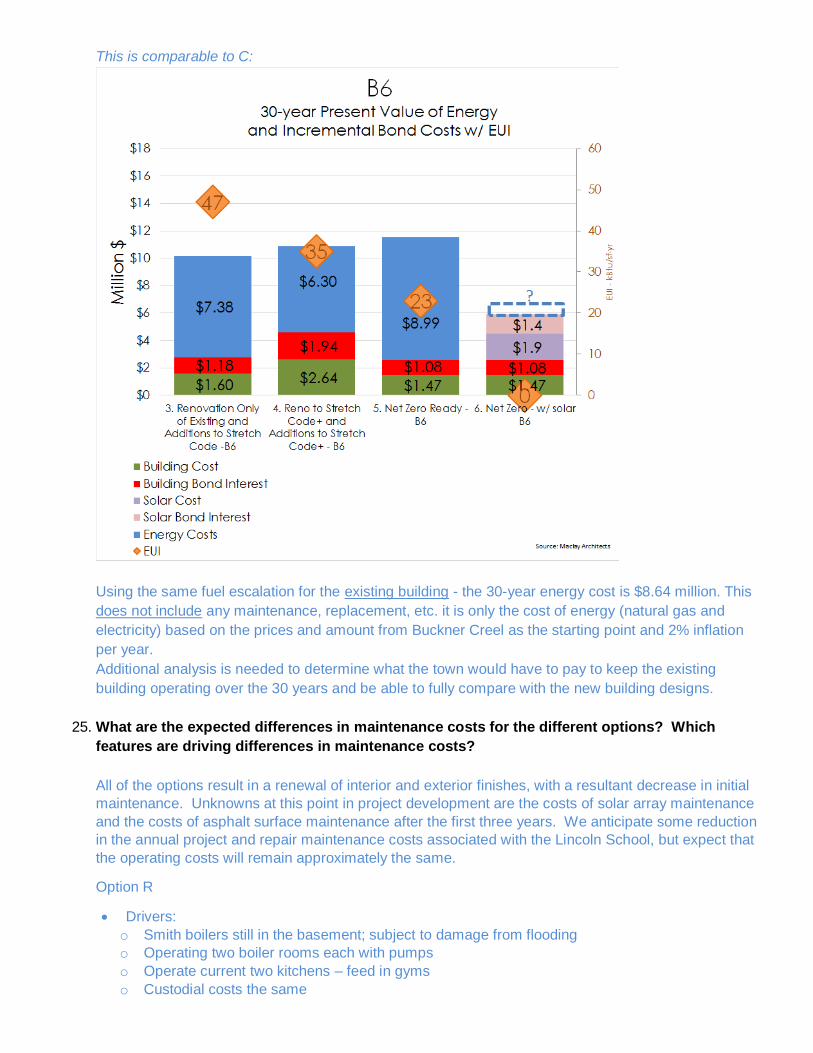
This is comparable to C:
Using the same fuel escalation for the existing building - the 30-year energy cost is $8.64 million. This
does not include any maintenance, replacement, etc. it is only the cost of energy (natural gas and
electricity) based on the prices and amount from Buckner Creel as the starting point and 2% inflation
per year.
Additional analysis is needed to determine what the town would have to pay to keep the existing
building operating over the 30 years and be able to fully compare with the new building designs.
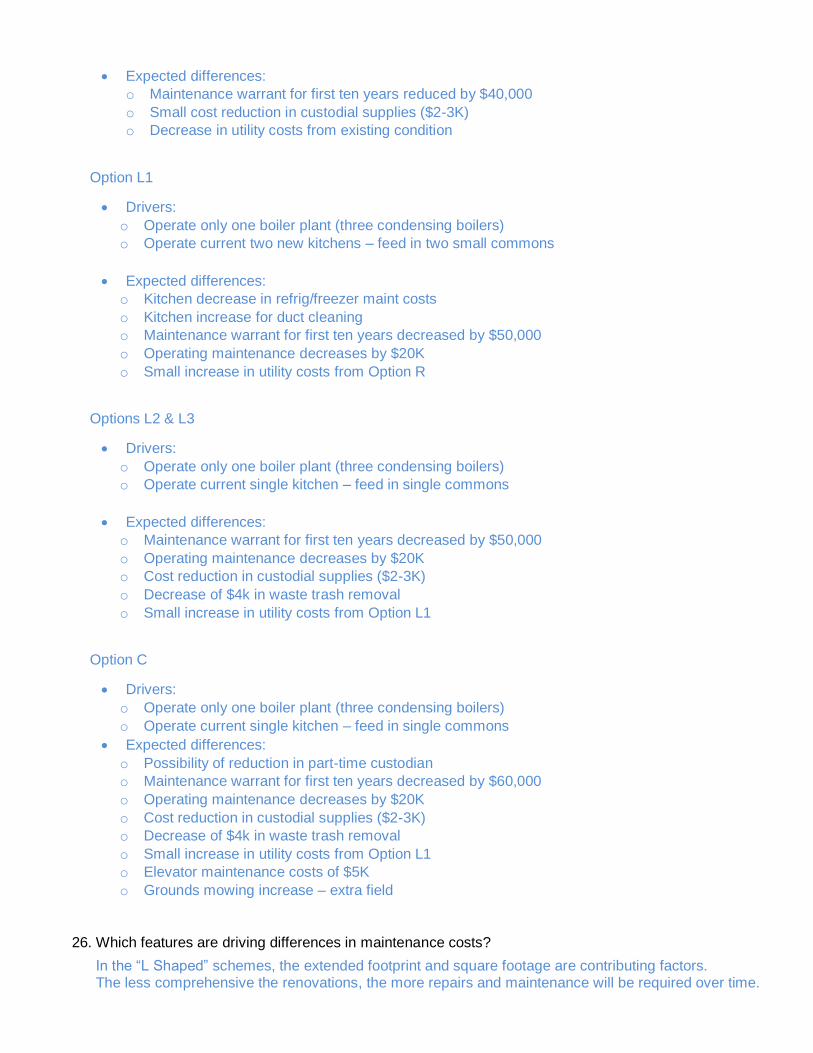
25. What are the expected differences in maintenance costs for the different options? Which
features are driving differences in maintenance costs?
All of the options result in a renewal of interior and exterior finishes, with a resultant decrease in initial
maintenance. Unknowns at this point in project development are the costs of solar array maintenance
and the costs of asphalt surface maintenance after the first three years. We anticipate some reduction
in the annual project and repair maintenance costs associated with the Lincoln School, but expect that
the operating costs will remain approximately the same.
Option R
• Drivers:
o Smith boilers still in the basement; subject to damage from flooding
o Operating two boiler rooms each with pumps
o Operate current two kitchens – feed in gyms
o Custodial costs the same
• Expected differences:
o Maintenance warrant for first ten years reduced by $40,000
o Small cost reduction in custodial supplies ($2-3K)
o Decrease in utility costs from existing condition
Option L1
• Drivers:
o Operate only one boiler plant (three condensing boilers)
o Operate current two new kitchens – feed in two small commons
• Expected differences:
o Kitchen decrease in refrig/freezer maint costs
o Kitchen increase for duct cleaning
o Maintenance warrant for first ten years decreased by $50,000
o Operating maintenance decreases by $20K
o Small increase in utility costs from Option R
Options L2 & L3
• Drivers:
o Operate only one boiler plant (three condensing boilers)
o Operate current single kitchen – feed in single commons
• Expected differences:
o Maintenance warrant for first ten years decreased by $50,000
o Operating maintenance decreases by $20K
o Cost reduction in custodial supplies ($2-3K)
o Decrease of $4k in waste trash removal
o Small increase in utility costs from Option L1
Option C
• Drivers:
o Operate only one boiler plant (three condensing boilers)
o Operate current single kitchen – feed in single commons
• Expected differences:
o Possibility of reduction in part-time custodian
o Maintenance warrant for first ten years decreased by $60,000
o Operating maintenance decreases by $20K
o Cost reduction in custodial supplies ($2-3K)
o Decrease of $4k in waste trash removal
o Small increase in utility costs from Option L1
o Elevator maintenance costs of $5K
o Grounds mowing increase – extra field
26. Which features are driving differences in maintenance costs?
In the “L Shaped” schemes, the extended footprint and square footage are contributing factors. The less comprehensive the renovations, the more repairs and maintenance will be required over time.
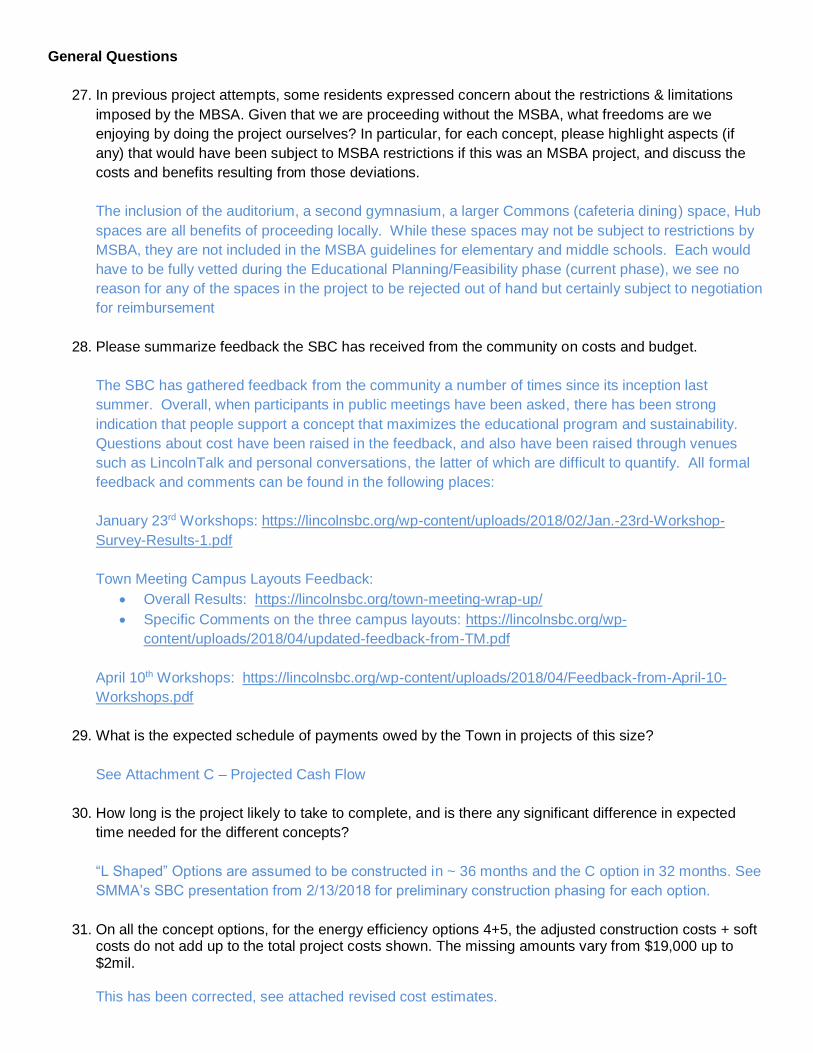
General Questions
27. In previous project attempts, some residents expressed concern about the restrictions & limitations
imposed by the MBSA. Given that we are proceeding without the MSBA, what freedoms are we
enjoying by doing the project ourselves? In particular, for each concept, please highlight aspects (if
any) that would have been subject to MSBA restrictions if this was an MSBA project, and discuss the
costs and benefits resulting from those deviations.
The inclusion of the auditorium, a second gymnasium, a larger Commons (cafeteria dining) space, Hub
spaces are all benefits of proceeding locally. While these spaces may not be subject to restrictions by
MSBA, they are not included in the MSBA guidelines for elementary and middle schools. Each would
have to be fully vetted during the Educational Planning/Feasibility phase (current phase), we see no
reason for any of the spaces in the project to be rejected out of hand but certainly subject to negotiation
for reimbursement
28. Please summarize feedback the SBC has received from the community on costs and budget.
The SBC has gathered feedback from the community a number of times since its inception last
summer. Overall, when participants in public meetings have been asked, there has been strong
indication that people support a concept that maximizes the educational program and sustainability.
Questions about cost have been raised in the feedback, and also have been raised through venues
such as LincolnTalk and personal conversations, the latter of which are difficult to quantify. All formal
feedback and comments can be found in the following places:
January 23rd Workshops: https://lincolnsbc.org/wp-content/uploads/2018/02/Jan.-23rd-Workshop-
Survey-Results-1.pdf
Town Meeting Campus Layouts Feedback:
• Overall Results: https://lincolnsbc.org/town-meeting-wrap-up/
• Specific Comments on the three campus layouts: https://lincolnsbc.org/wp-
content/uploads/2018/04/updated-feedback-from-TM.pdf
April 10th Workshops: https://lincolnsbc.org/wp-content/uploads/2018/04/Feedback-from-April-10-
Workshops.pdf
29. What is the expected schedule of payments owed by the Town in projects of this size?
See Attachment C – Projected Cash Flow
30. How long is the project likely to take to complete, and is there any significant difference in expected
time needed for the different concepts?
“L Shaped” Options are assumed to be constructed in ~ 36 months and the C option in 32 months. See
SMMA’s SBC presentation from 2/13/2018 for preliminary construction phasing for each option.
31. On all the concept options, for the energy efficiency options 4+5, the adjusted construction costs + soft costs do not add up to the total project costs shown. The missing amounts vary from $19,000 up to $2mil.
This has been corrected, see attached revised cost estimates.
32. On Option A3.4, the total project costs shown for energy efficiency options 3, 4 + 5 do not match the
total project costs shown in the full cost bar charts on pages 1-3. They differ by $100-200k.
This has been corrected, see attached revised cost estimates.
33. On Option B6.1, the line items for Windows and Foundation Additions do not match the difference between Column 3 and Column 4-5 incremental costs. They are off by about $50k and $96k respectively.
This has been corrected, see attached revised cost estimates.
Questions for Both Projects
34. Please identify any possible differences in the cost of the projects that might result from doing both
School Building and Community Center projects together versus doing them separately.
We recommend keeping the School and Community Center as two separate projects because they will
take different amounts of time to design and then different construction durations. There would be no
significant efficiency in combining the projects, in our opinion.
Attachments
Attachment A: ENR Magazine Cost Indexes dated April 2018
Attachment B: Comparison of Campus Project Concepts
Attachment C: Projected Cash Flow
Community Center
What stats, metrics, projections, and assumptions are being used for capacity planning to drive the design?
(population, usage, etc.)
How do comparable community center projects compare in sqft/resident, size, population served, and/or other
relevant metrics?
What are the projected cost estimates in $/sf terms, and what is the source for those cost estimates? Do they
vary by the type and mix of space proposed?
How do the cost estimates compare with comparable projects? Where the cost metrics deviate materially from
each comparable, identify the key drivers of the deviation.
What are the best estimates for long-term energy costs? Are there plans to consider energy efficiency
approaches, and if so, what are the expected incremental costs and energy savings?
What are the best estimates for long-term operating and maintenance costs? What's the best estimate for
marginal increases or savings relative to current operating and maintenance costs (i.e. for COA in Bemis and
PRD in Hartwell)?
What is the expected change (if any) in maintenance and operating costs for Bemis once COA departs?
After construction and occupancy, what will be the first expected major capital maintenance/repair items?
What's the expected timing?
Please summarize feedback the PPDC has received from the community on costs and budget.