Embed Size (px)
Citation preview

Financing Strategy of National Park Model
A Study in Gunung Halimun Salak National Park,
West Java, Indonesia
A Research Paper presented by:
Ika Kristiana Widyaningrum
(Indonesia)
in partial fulfilment of the requirements for obtaining the degree of
MASTERS OF ARTS IN DEVELOPMENT STUDIES
Specialization:
Economics of Development
(ECD)
Members of the Examining Committee:
Dr. Lorenzo Pellegrini [Supervisor]
Dr. Howard Nicholas [Reader]
The Hague, The Netherlands August 2012

ii

iii
Acknowledgment
My sincere gratitude is sent to people who gave valuable contributions to the completion of my study and the writing of this paper.
The greatest thank goes to Lorenzo Pellegrini, my supervisor. Without his guidance and advices, this paper wouldn‟t be written. I wish to thanks also to Howard Nicholas, my second reader, for the valuable comments and advices in the process of writing my research paper.
My gratefulness also goes to Bappenas and Nuffic NESO through Stuned Indonesia, for the opportunity to fund my study in the Double Degree Pro-gramme; in University of Indonesia (UI) Depok, and in International Institute of Social Studies (ISS) The Hague.
I would also like to thank my colleagues in Gunung Halimun Salak Na-tional Park, and The Ministry of Forestry for their valuable help in providing data for this work. Many thanks also to Anggun Susilo, Noriaki Nagai, Prasen-jit Hans, Yonky Indrajaya, Hunggul Yudono, Muhammad Fajar, and Erdenechimeg „Chimgee‟ Basaadamba for the discussions, comments, and practical assistance on my writing.
To all my Indonesian colleagues in The Netherlands, especially Qobal, Jay Miko, Evry, Kezz, and Herry thanks for the support and our wonderful time. Thanks also to my ECD classmates for sharing good times during the pro-gramme.
To my parents, sister and brothers who always encourage and support me during my school time, thank you very much for the prayers. Finally, the last but not least I thank to my husband, Fahri Syarief for his endless patience to support my study.

iv
Contents
Chapter 1 Introduction 1
1.1 Indication of the Research Problem 1
1.2 Justification and Policy Relevance 2
Justification 2
Policy Relevance 3
1.3 Research Objectives and Questions 3
Research Objectives 3
Research Questions 3
1.4 Scope and Limitations 4
1.5 Structure of the Paper 4
Chapter 2 An Overview of National Park Conservation in Indonesia 5
2.1 Introduction 5
2.2 Concept of Protected Areas and National Parks 5
2.3 Designation of National Park Models towards Financially Independent Parks 7
2.4 Focused Study Site: Gunung Halimun Salak National Park (GHSNP) 9
2.5 Conclusion 10
Chapter 3 Financial Sustainability for Conservation: Literature Review 11
3.1 Introduction 11
3.2 The Concept of Sustainable Conservation Finance 11
3.3 Current Trend of Protected Areas Finance 12
3.4 The Future View of PAs Finance 15
3.5 Conclusion 17
Chapter 4 Framework of Analysis 18
4.1 Introduction 18
4.2 The Logic of Research 18
4.3 Data and Methodology 19
Data and Variables 19
Methodology 19
4.3 Measurements for Sustainable Financing 19
4.4 Effectiveness and Efficiency use of Fund 20
4.5 Potential Funding Sources 21

v
4.6 Conclusion 21
Chapter 5 Empirical Findings and Discussion 22
5.1 Introduction 22
5.2 Current Financing of NPs 22
Government budget allocation 22
Cooperation Programs 27
5.3 Effectiveness and Efficiency use of Fund 29
5.4 Potential Sources of Funds 31
Grants and Donations 32
Tourism Based Revenue 33
Payment for Watershed Services 34
5.5 Developing Financing Strategy towards a Self-financed National Park 35
5.6 Conclusion 37
Chapter 6 Conclusion and Policy Implications 38
References 40

vi
List of Tables
Table 1 Budget Plan, Budget Approved and Real Spending 2007-2012 (in Rupiah) 27
Table 2 The Effectiveness of GHSNP; the Output Achieved Compared to the Plan 2010-2011 30
Table 3 Efficiency Use of Fund in All NPs in Indonesia and in GHSNP 2005-2011 30
Table 4 Composition of GHSNP Budget Allocation 31
Table 5 Tree Adoption Program in GHSNP 2009-2011 32
List of Figures
Figure 1 Cumulative Growth of Global Protected Areas over Time 6
Figure 2 Total Areas of National Parks in Indonesia 1983-2009 7
Figure 3 Forestry Sector Contributions to GDP Indonesia at Constant 2000 Market Prices 8
Figure 4 The Protected Area Financing Gap 13
Figure 5 Biodiversity-related Aids, Commitments by 19 Members of the OECD Development Assistance Committee 1998-2000 14
Figure 6 The Logic of Research 18
Figure 7 Government Budget for NPs in Indonesia as the Share of Total Government Expenditure and GDP 2005-2011 22
Figure 8 Total government budget allocations for 50 NPs in Indonesia 2005-2011 24
Figure 9 Total Government Budgets for GHSNP; Budget Plan, Budget Approved and Real Spending during 2007-2011 25
Figure 10 Average Financing Support under Cooperation Programs in GHSNP 2004-2011 28
Figure 11 Number of Visitors Ecotourism in National Parks Indonesia 2006-2011 33
Figure 12 Total Revenue from Ecotourism in National Parks Indonesia 2009-2011 34
Figure 13 Proposed Scheme of Public Service Agency in GHSNP 36
List of Maps
Map 1 Location of 50 National Parks in Indonesia 5
Map 2 The Area of Gunung Halimun Salak National Park 9

vii
List of Appendices
Appendix 1 Other Fund Reaching to GHSNP Area under Cooperation Program Scheme ................................................................................... 44
Appendix 2 GHSNP Achievement on Targeted Plan using Annual Government Budget 2010 ................................................................... 45
Appendix 3 Water Industries Operating Nearby GHSNP 2007 ........................ 46

viii
List of Acronyms
ABK Anggaran Berbasis Kinerja (Performance-based Budgeting)
Bappenas Badan Pengelolaan dan Pembangunan Nasional (National Development Planning Agency)
BPS Biro Pusat Statistic (Central Statistical Bureau)
CBD Convention on Biological Diversity
CIFOR Centre for International Forestry Research
CITES Convention on International Trade in Endangered Species of Wild Fauna and Flora
EDA Exploratory Data Analysis
FAO Food and Agriculture Organization
FONAG Fondo para la protección del Agua (The Fund for the Protection of Water)
FWI Forest Watch Indonesia
GDP Gross Domestic Product
GEF Global Environment Facility
GFW Global Forest Watch
GHSNP Gunung Halimun Salak National Park
ISS Institute of Social Studies
IUCN International Union for Conservation of Nature
JICA Japan International Cooperation Agency
KMNP Kayan Mentarang National Park
KNP Kutai National Park
MDGs Millennium Development Goals
MoF the Ministry of Finance
MoFs the Ministry of Forestry
NBSAPs National Biodiversity Strategies and Action Plans
NGO Non-Government Organisation
NP(s) National Park(s)
ODA Official Development Assistance
PA(s) Protected Area(s)
PES Payment for Environmental Services
PLN Perusahaan Listrik Negara (State-owned Electrical Company)
BTNKM Balai Taman Nasional Kayan Mentarang (= KMNP)
UN the United Nations

ix
UNDP United Nations Development Programme
WHC World Heritage Convention
WWF World Wildlife Fund

x
Abstract
Sustainable financing for protected areas (PAs) has currently become the sub-ject of debates. Most of PAs including national parks (NPs) were financed by the governments. Nevertheless, current global trends contrast the increasing number of NPs with the limited government budget as well as the decreasing trend of external funds. Realizing such issue, Indonesian government promot-ed NPs to be self-financed through designation of 21 NP models in 2006.
This paper aimed to look at the financing mechanism for conservation of NPs in Indonesia, and see the potentials to support for self-financing. A more focus study in GHSNP is also discussed to look at the likely budget shortfall, and the effectiveness and efficiency use of the funds. The study uses a set of secondary data from official sources, and chooses Exploratory Data Analysis (EDA) technique as a quantitative approach to reveal the data.
The results indicate that by increasing the number of parks, Indonesian government does not necessarily lessen the budget support. However, the proportion of budget allocated for NPs to GDP and to total government expenditure is relatively low. There were budget shortfalls in GHSNP, and it is not allocated in timely manner, which somehow led to ineffective and inefficiency use of the funds. Even so, local initiatives such as commitment to cooperation programs or partnerships, creating a business plan and a clear financing mechanism through an independent and trustworthy institution, seem help to solve the financial burden.
Relevance to Development Studies
The growing concern of international public on forest conservation has motivated forest rich countries including Indonesia to allocate more resources on this sector. Realizing the increasing challenges in financing conservation programs, many scholars prompt protected area managers to expand and develop a more creative funding mechanism. While most literatures suggest promising tools and policies, this study seeks some realistic options to reach sustainable financing for NPs in Indonesia. This paper is likely to be the first explores financial data of 50 NPs, and provides an in-depth discussion on solving financial gaps in a NP model; GHSNP.
Keywords
Sustainable financing, self-financed, national parks, Indonesia, GHSNP, eco-tourism, collaboration, trust fund.

1
Chapter 1 Introduction
1.1 Indication of the Research Problem
Global calls for forest conservation have been echoed in recent years as defor-estation has reached an alarming rate. Various international initiatives such as convention on climate change (UN 1992), the seventh goal of Millennium De-velopment Goals (MDGs) to ensure the environmental sustainability (EU 2004), and Convention on Biological Diversity (CBD)‟s programme on reduc-ing the biodiversity loss associated with deforestation (CBD 2004) have been promoted vigorously. All of these global initiatives have been implemented in some countries with different progress, but generally it is still far from the ex-pectations. A report by World Wild Fund (WWF) noted that even though there was a decreasing trend, current global deforestation rate of 13 million hectare per year is still a high number (WWF 2008). For example, Brazil and Indonesia were two countries with the highest annual deforestation rate in 1990s, about 2.9 million hectares and 1.9 million hectares respectively. A dec-ade after that, their annual net loss of forest decreased but it remains high; 2.6 million hectares in Brazil, and 0.6 million hectares in Indonesia (FAO 2010).
The high rate of deforestation in Indonesia in the last few decades has en-couraged the government to establish new management units of conservation in the form of protected areas, particularly national parks (NPs). Five new NPs were designated since 2004 in order to enhance the protection of national for-est (Departemen Kehutanan 2007). For the same reason, six NPs were previ-ously enlarged in 2003 (Departemen Kehutanan 2009). However, these new parks‟ areas bring a new consequence in the increasing budget of government for its management (Hartono 2008). In tune with that idea, (Castro 2003) not-ed that even though the fundamental needs for a successful conservation have been done, financial sustainability remains a problem.
The literatures on financing for conservation point that lack of financial resources has continuously become a main challenge for supporting the con-servation activities, particularly in protected areas (PAs) (Bayon et al. 2000), (Castro 2003),(Emerton et al. 2006). In many countries like Indonesia, natural resource conservation becomes public good; hence all initiatives and activities are funded by the government (Novra 2007). Nevertheless, government ability to allocate sufficient budget is limited. Some studies estimated the budget allo-cation for protected areas is less than one-sixth to one-third from the needs (Castro 2003). In Indonesia for example, government budget for national con-servation is low, which is about US $ 2-5 per hectare of NP area (Departemen Kehutanan 2009).
To support for a smooth management of NPs, Indonesian government through the Ministry of Forestry (MoFs) has promoted the formation of na-tional park models in 2006. An expectation that NPs are financially independ-ent is implied in the designation of 21 NP models out of 50 NPs in Indonesia (Hartono 2008). Being self-financed is important towards a more efficient, ef-fective, transparent, and accountably management of the parks (Departemen

2
Kehutanan 2006). The expectation that NP models will be financially inde-pendent from the government is driven by its potential to be able to manage all the income coming from the parks such as ecotourism, payment for environ-mental services (PES), bio prospecting and other activities.
National parks are mostly financed by the central government, as well as imposed to the centralized-revenue system (Emerton et al. 2006). In Indonesia, for example, revenue from ecotourism in NPs is sent to the central govern-ment, and it is under the authorization of the Ministry of Finance (MoF) to allocate the budget for conservation activities in the parks. This fact has led to the emergence of new ideas to diversify the funding sources for park manage-ment. However, beyond finding new resources, it is necessary to search for better ways in spending the existing funds more efficiently (Bayon et al. 2000). Since it is not always clear that more money can actually solve the problem, it is a challenge for the parks to enhance more innovations and creativities to fi-nance their programs.
1.2 Justification and Policy Relevance
Justification
For many years, Indonesia‟s forest condition has become the concerns of in-ternational public. This is because Indonesia contributes as the third largest forest in the world and holds globally significant biodiversity richness. Their main concerns are related to the economic, social and environmental role of the forest at international scale (World Bank 2006). On the one hand, its func-tions as the world‟s carbon sink and home for millions of species with huge economic and ecological importance have become key elements for environ-mental sustainability and the economic development. On the other hand, lack of forest governance has brought some issues related to conflict and injustice among communities and stakeholders.
In addition, the fact that deforestation in Indonesia is still at a high rate, also attracts international attentions on how Indonesian government find solu-tions to conserve it. Furthermore, they are aware of the global situation where there always be a gap between current investment on conservation and the fund needed (Verweij and de Man 2005). The paper chooses NPs as the centre of discussion to represent protected forest in Indonesia, because NPs occupy 60% of conservation area in Indonesia (Putro et al. 2012). The idea of more support on NP conservation also increase the expectation that biodiversity could be conserved (Kumar 1999).
Meanwhile, some limited economic activities such as ecotourism, envi-ronmental services and non-timber forest products extractions are allowed in NPs according to Indonesian Act No 5/1990 (Putro et al 2012). It becomes a potential source of parks‟ fund raising for the protection of forest. Moreover, it might also become instruments for local income generation to gain more communities‟ support for biodiversity conservation.
Therefore, studying the forestry management in term of financing strategy for NPs in Indonesia could answer the international public‟s curiosity. At the same time, this study could help policy makers to find the solutions of limited funding for NPs.
3
Policy Relevance
The study is interested to see the financing mechanism of NPs in Indonesia, and look at potentials of long-term funding strategy for the parks. A more de-tail study will be to look at the financing trend and the current strategy to finance a NP model in Indonesia, the Gunung Halimun Salak National Park (GHSNP). If it is found that the existing funding in the park does not support for its sustainable financing, the policy relevance is such that allows NP man-agement to diversify funding sources through a self-financing mechanism such as public service agency or trust fund in the parks. In terms of conservation of all NPs in Indonesia, this study is relevant for either local or national policy in creating a more sustainable financing.
1.3 Research Objectives and Questions
Research Objectives
This study aims to contribute to the literatures on financing for conservation in Indonesia in general, and GHSNP in particular, through exploring the poten-tials to support for a more sustainable financing. In more detail, the research is conducted:
1. To look at the existing conditions of financing system in the parks, par-ticularly the trends of funding reaching the parks.
2. To identify the current and likely future shortfall in financing national parks.
3. To consider the effectiveness and efficiency use of the funds.
4. To look at the potentials in which self-financing mechanisms are ap-propriate for the parks.
Research Questions
To reach the objectives, the paper is intended to answer a main question „how sustainable financing needs of national parks in Indonesia could be met?‟, and a set of sub-questions which are:
1. What are the trends of funding reaching the parks?
2. What are the current and likely future shortfalls in financing of the parks?
3. Do the existing funds effectively and efficiently used?
4. What are potentials for self-financing parks?
By uncovering the current financing system, the paper will explore the possibilities for the park to develop a self-finance mechanism towards more sustainable park management. In this regards, the discussion will be linked with the designation of NP model in Indonesia.

4
1.4 Scope and Limitations
The author found data availability as the limiting factor because the paper relies on secondary data. The targeted scope of study is looking at all NPs in Indone-sia. Thus, the required data should covers: the financing gap between the actual amount of fund reaching the park and its needs, discrepancies between the plan and the output of parks‟ conservation programs, and its economic poten-tial as the stimulant for being financially independent. Certain variables are not available in national level (50 parks), but available at local level (one NP).
Moreover, for newly designated NPs, most data are only available for the period of 2007-2011. However, this might not much affect the depth of dis-cussion on self-financed mechanism, particularly in relation to NP models. As mentioned previously, the park models were designated in 2006, and it would be an advantage to be focus on data starting from 2007.
A more complete data are collected in the focused study area because the author has more access to the park. Thus, for deeper discussion the paper will focused on one NP which will be used to represent the condition of all NPs. Nevertheless, the author considers that each park has unique characteristics and different management strategies. In this regard, the author admits that there could be lacks of accuracy in using one NP case to represent all parks in Indonesia.
1.5 Structure of the Paper
This paper is organized in six chapters. Chapter two provides an overview of PAs, NP, and the focused study area; GHSNP. Chapter three illustrates some literatures on the sustainable financing for conservation. Then chapter four discuss about the framework of analysis, particularly how to reach the answer of the research questions. A logical flow of thought is presented at the begin-ning of this section. The fifth section, which is the heart of the paper, presents the findings and discussions of the research. Finally, chapter six concludes.

5
Chapter 2 An Overview of National Park Conservation in Indonesia
2.1 Introduction
This chapter presents the state of PAs and NPs in Indonesia. Since the estab-lishment of five first NPs in 1980s until now, there have been shifts in its man-agement and policy (Putro et al. 2012). Those changes have been done both in national level (MoFs) and local level (NPs) to support for better park manage-ment. This chapter provides an overview of current condition of NP conserva-tion in Indonesia. A brief overview of the focused study site is also presented in the last part of this section.
2.2 Concept of Protected Areas and National Parks
At most situations, human interactions with the environment leave destruc-tions on our planet. To save the nature from larger damages, International Un-ion for Conservation of Nature (IUCN) defines a PA as “an area of land and or sea especially dedicated to conserve the nature, ecosystem services, and as-sociated cultural resources, and managed through legal or other effective means” (Emerton et al. 2006:5-6). Protected areas play a role as the milestones for conserving the nature (Castro 2003). Having the same idea, Dudley (2009) asserts that PA also act to maintain the balance between protection of endan-gered species as well as provision of direct human benefit. He found that, to some extent there are differences in the interpretation of PA among countries.
Map 1 Location of 50 National Parks in Indonesia
Source: Putro et al. 2012

6
Following IUCN Protected Area Categories, it is clearly stated that NP is an area that is managed mainly for ecosystem protection and recreation (Emer-ton et al. 2006). While according to the Indonesian Law no 5/1990 about Con-servation of Natural Resources and Ecosystem, NP is defined as “a nature conservation area in which it is managed in zoning system, and could be uti-lized for the purpose of research, science, education, culture, tourism and out-door recreation” (Putro et al. 2012).
A growing concern on its importance seemed to urge increases of PAs. As noted by scholars, PAs increase over time in the last 40 years, and cover around 12% of the earth surface (Chape et al. 2005, Dudley 2009, Emerton et al. 2006). Figure 1 shows an increasing trend of global PA overtime. It seems that the new PA designations are often used as the means for protecting biodi-versity. In Indonesia for example, due to the increase of disruption to wildlife‟s habitat, MoFs decided to enlarge some area of NPs as well as established new parks in the country (Hartono 2008).
Figure 1 Cumulative Growth of Global Protected Areas over Time
Source: Chape et al. 2005
Indonesia‟s NPs are managed by the Directorate General of Forest Pro-tection and Nature Conservation of the MoFs. As part of the forest protection and nature conservation discourse, the number of NPs in Indonesia increases time by time, from 5 parks in 1980 now becoming 50 parks (Map 1), which covers 3.2% of the total area of Indonesia (Putro et al. 2012). Figure 2 illus-trates the gradual increase in the area of NP in Indonesia from 1983 to 2009.
The expansion of NPs area as well as the designation of new parks does not necessarily resolve the problems in conserving forest and its resources. It even becomes more complex as the parks were faced with new stakeholders and new challenges. In most cases, NPs are facing social and political challeng-es along with its management (Putro et al. 2012). For example, five NPs in In-donesia which were enlarged in 2003 need about six years to be formally acknowledged by the stakeholders (Departemen Kehutanan 2009).

7
Figure 2 Total Areas of National Parks in Indonesia 1983-2009
Source: The Author’s own illustration based on BPS data
Another challenge concerns with the limitation of funding for the parks (Hartono 2008). He argues that the nature of PAs in Indonesia which are mostly financed by government becomes a problem when the finite budget should be allocated for greater number of management units. Therefore, searching for ways to sustain funding of the parks might help for its conservation. This argument seems to be in accordance to confirm the need to designate 21 NP models in Indonesia.
2.3 Designation of National Park Models towards Financially Independent Parks
In 2006 Indonesian government through MoFs assigned 21 NPs to be the models of park management in Indonesia (Departemen Kehutanan 2006). Even though the aim of designing NP models has not clear yet, but basically those parks are expected to be managed in a more optimal, efficient and effec-tive. Meanwhile, different perspectives were emerged in response to this issue.
As explicitly mentioned by MoFs (Departemen Kehutanan 2006), those parks are intended to be financially independent from the government support. This idea is mainly driven by current financing system in Indonesia which hardly support for the smooth management of the parks. As forest becomes public goods, it is fully managed and financed by the government. At the same time, the bureaucratic process of government finance often hampers the achievement of conservation goals itself. Thus, if the parks are authorized to manage all of the legal income, it could help to sustain their financing needs (Putro et al. 2012).
Developing a self-financing mechanism in the form of public service agency or other collaborative institution is therefore an option for NP models (Departemen Kehutanan 2006). In principal, parks‟ financial independence means that it is permitted to manage revenue coming to the parks without go-ing through the State Treasury, but still reported as state‟s revenue (Putro et al.
0
2
4
6
8
10
12
14
16
18
19
83
19
85
19
87
19
89
19
91
19
93
19
95
19
97
19
99
20
01
20
03
20
05
20
07
20
09
Are
a (H
ect
are
) M
illio
ns
Area of NPs

8
2012). Thus, the capacity of the parks to provide public services, in combina-tion with the flexibility to administer financial sources could facilitate its best performance.
On the other hand, lack of clarity regarding the definition of NP model apparently leaded to concerns in government support to the parks. In addition to be self-financed, those parks are also intended to contribute in dealing with the declining trend of government revenue from forestry sector (Yuwono 2010). Therefore NP models should maximize all of the economic potentials which existing in the areas. In this regard, some parks expect government to provide more financial support, particularly at the earlier stages of develop-ment process (Ibid. 2010).
The Ministry of Finance (Kementerian Keuangan. 2012) reported that during 2005-2009, forestry contributes about 6.14% (on average) to Indonesian Gross Domestic Product (GDP), but it declines gradually about 0.55% every year (Figure 3). Timber production has the biggest contribution of forestry sec-tor to national revenue (Kementerian Kehutanan 2010a). However, illegal log-ging which remains high is identified as the main cause of lowering govern-ment revenue (Ibid. 2012). Accordingly, MoF recommended exploring non-wood forest product to increase the revenue in forestry sector (Ibid. 2012). Ecotourism, environmental services, and carbon trade might be seen as poten-tials to be explored for raising the economic gains.
Figure 3 Forestry Sector Contributions to GDP Indonesia at Constant 2000 Market Prices
1998-2010
Source: The author’s own illustration based on BPS data
Eventually, the existing conditions and characteristics of each park should
become the main consideration for transforming NPs into self-financed parks (Yuwono 2010). The optimization of economic potentials should not be based solely on central government's decision. For example, early assessment on 21 NPs models found none of the parks meet the expected standards created by MoFs (Putro et al. 2012). Even though some policies has been taken out to support the attainment of independent parks, still it needs to be combined with local initiatives from parks‟ manager.
0
0.2
0.4
0.6
0.8
1
1.2
1.4
1.6
1.8
2
19
98
19
99
20
00
20
01
20
02
20
03
20
04
20
05
20
06
20
07
20
08
20
09
20
10
Pro
po
rtio
n (
%)
Contribution ofForestry sector toGDP

9
2.4 Focused Study Site: Gunung Halimun Salak National Park (GHSNP)
GHSNP is appointed as one of NP models in Indonesia based on the decree of Director General of Forest Protection and Nature Conservation on 25 July 2006 (Departemen Kehutanan 2006). Among the other 20 NP models, GHSNP has unique characteristics which become supporting factors as well as challenging factors for its management.
GHSNP is located in West Java Indonesia (Map 21). It holds the largest remaining natural forest in Java island, with an area about 100 thousands hec-tares. The park consists of more than 1500 species of flora and fauna including two endangered and endemic mammals; Javan Leopard (Panthera pardus) and Javan Gibbon (Hylobates moloch). GHSNP is also considered as the best remain-ing natural habitat for the most endangered species of Javan Hawk Eagle (Spi-zaetus bartelsi), which is the national symbol of Indonesia (GHSNP 2007a).
Despite its important values on ecological services, in the regional scale, GHSNP plays an important role in the protection of hydro-orology function. Nationally, it is very important as an example of parks located in the midst of developing region which can serve as a model of Indonesian park manage-ment. As for the people around the area, it is an important opportunity for employment and diversification efforts in enhancing the welfare of society it-self (Supriyanto and Mulyati 2010).
(Source: GHSNP, 2010b)
The area covers two districts in West Java Province, and one district in Banten Province, with more than 300 sub-villages located inside and nearby the forest (GHSNP 2007a). The existence of two mining companies and other resource extracting companies operating in this park as well as research organi-zations and NGOs that use the park area as their work site has brought some managerial challenges such as conflict of interests, resources extracting activi-
INDONESIA
JAVA
GHSNP
Map 2 The Area of Gunung Halimun Salak National Park

10
ties which are not in line with park‟s conservation program, and other chal-lenges.
The complexity of problems faced in the park requires collaborations be-cause of inadequate competence of the park managements to resolve it by their own (Supriyanto and Mulyati 2010). Thus, with technical assistance from Japan International Cooperation Agency (JICA) project during 2004-2009, GHSNP emphasizes its management towards a more collaborative way. For example, the park‟s framework management is strengthened by the involvement of stakeholders such as local government, private sectors, and local communities. The management plan for 2007-2026 is prepared in a participatory process, where it is developed with the involvement of all of the stakeholders. This long-term management plan is also endorsed by the local governments of the three districts, so that to some extent it will ease in the implementation of the programs. After the project end, more initiatives to build some collaborative institutions rises to strengthen the management of the park in more specific programs, such as raptor sanctuary, research protocol, and tree adoption pro-gram (GHSNP 2010a).
As one of NP models in Indonesia, GHSNP has recognized all challenges and opportunities to implement a self-financing mechanism as an instrument for achieving its best performance. Emphasizing on collaborative management in the park is considered as one way to be financially independent (GHSNP 2010a). Through multi-stakeholder participation and commitment, it is ex-pected that forest conservation could provide a long-term benefit of environ-mental services and a better livelihood for the communities (Supriyanto and Mulyati 2010). Hence, investigating the financing mechanism in GHSNP, and the strategy to implement a self-financed park is needed to be studied.
2.5 Conclusion
To sum up, present condition of forest conservation in Indonesia seems lead to new breakthroughs, both in policy level and implementation level. Govern-ment‟s concerns on biodiversity conservation were manifested into several pol-icies, such as increasing the PA in the form of NPs and encouraging the self-funding mechanism for the parks. Meanwhile, local initiatives in park level were also promoted to reach its better performance. GHSNP seems to give some practical lessons for other NP models to harness its potential and chal-lenges towards self-financed parks.

11
Chapter 3 Financial Sustainability for Conservation: Literature Review
3.1 Introduction
Sustainable financing for conservation has been the subject of debates among experts. Most of the arguments consider the lack of funding resources has con-tinuously becomes a challenge in the forest and biodiversity conservation (Cas-tro 2003, McNeely and Weatherly 1996, Tomaselli 2006, WWF 2009). Some scholars figure out recent conditions and future views of conservation funds (Emerton et al. 2006, McNeely 1997), while the others specifically recommend innovations for generating more financial supports and better uses of such funds (Holopainen et al. 2008, Putro et al. 2012, Oleas and Barragán 2003).
Therefore, this chapter summarizes some previous studies on financial sustainability to conserve biodiversity. Discussions on the concept of sustaina-ble financing for conservation are mostly within the context of PAs. However, it is still relevant for taking up the financing of NP in Indonesia, because al-most all of NPs are within the agreed category of PAs.
3.2 The Concept of Sustainable Conservation Finance
Sustainable financing is crucial to secure the conservation program‟s success (Verweij and de Man 2005). Considering this importance, IUCN (Emerton et al. 2006:15) specify PA financial sustainability as adequate funding sources which are available for long-term management. In addition, it should be allo-cated in a timely manner, intended for the appropriate programs, in line with the objectives of conservation (Ibid. 2006:16). A sustainable financing scheme should also appraise the total funding from all sources which is currently or potentially available (WWF 2009). At this point, these concepts seem to be in accordance with the focus of this study.
While WWF (2009) recommends conservation finance to generate new, long-term, and diversified sources of funds, other scholars argue sustainable conservation finance is not simply providing more funds (Emerton et al. 2006, McNeely and Weatherly 1996). Instead, a combination of policy changes and new funding mechanisms is required. For example by correcting unsuitable policies which harm biodiversity, or reforming the fiscal system that encour-ages both economic growth and biodiversity conservation at the same time. (Moye and Nazerali 2010:11-12) provides an example of a legal framework for giving back 64% of tourism revenue to conservation areas in Mozambique. Additionally, Oleas & Lourdes (2003)‟ study indicates that government support and the role of governance bodies are crucial to ensure good management of environmental fund.
Nevertheless, a lesson from Indonesia‟s Reforestation Funds (Dana Re-boisasi/ DR) management reveals that inappropriate financial administration in many levels of government has blocked the effective use of the funds (Barr et al. 2010:10-23). The research recorded that during 1989 to 1999, corruption

12
and fraud both in government and non-government institutions had continued to happen in the absence of effective monitoring mechanism for the fund. Ri-phat (2011) also reported that most of local governments who receive DR do not have enough capacity and qualified personnel to manage it. At the same time, their poor performance even continued to receive benefit from the fund (Ibid. 2011).
Having said that, this paper worth to consider that PA finance is about more than the amount of money, but how the existing fund is managed effec-tively towards better conservation outcomes. Taking into account fluctuations in the world‟s economic situations, (Castro 2003:5) claims that sustainability does not merely continue to finance conservation projects, but to sustain the results of conservation. Thus, the final goal is to integrate conservation in all aspects of development.
Accordingly, IUCN put five elements for the finance to be sustainable. Firstly, it should be built in a scheme that minimizes the risks and uncertainties upon funding sources (Emerton et al. 2006:16). Combining different sources of funding could encounter the risk of unexpected government budget cut, for example due to budget constraints or changes in government‟s priority. Sec-ondly, improving financial administration and effectiveness by ensuring that funding is allocated in line with the needs and conservation goals (Ibid. 2006:18). It is important to ensure that funds are used efficiently, and can be drawn upon in time of needs. Third, it should take a comprehensive view of cost and benefit in sustainable protected area management, with a fair contri-bution from those who get benefit, and adequate compensation for those who bear the cost (Ibid. 2006:18-19). The fourth, creating a framework of economic and financial mechanism in protected areas (Ibid. 2006:22). In fact, concerning to the market price of goods and services provided by PAs, the common case is its undervalued price. For example, the entrance fees to NPs are set far be-low the willingness to pay of visitors. Often, PAs are not allowed to generate revenue at all, or environmental services are totally undervalued. Bayon et al. (2000:5) has already revealed that even though there are ways to use market mechanism to finance conservation projects, most aspects of biodiversity are difficult to be valued. Finally, the fifth element recommends creating tools and mechanism in the form of a business plan (Ibid. 2006:23-24). An example from NP management in Indonesia suggest a business plan should identify a break through which economically beneficial, socially acceptable, technically manage-able, and still in line with the regulations (GIZ FORCLIME 2009).
In short, there are three main critical aspects of sustainable forest financ-ing. The first is raising the funds in order to meet the conservation goals. Then, to distribute the existing funds towards sustainable direction, and the last, to reach more profitable financing mechanism and lessen the need for additional external funding (Tomaselli 2006:9).
3.3 Current Trend of Protected Areas Finance
As it is mentioned in Chapter 2, there has been a significant expansion in PAs during the last 40 years. However, this increase in area was not followed by sufficient financing support to maximize the management (Emerton et al. 2006:12). Insufficient budget allocation then leads to inadequate basic needs

13
for PAs, for example vehicle for operational activities, fuel and other necessi-ties (CFA 2008). Even though such significant shortfall in global conservation investment happens in PAs worldwide, still it is higher in developing regions (Castro 2003). (Verweij and de Man 2005) indicated that there is a large gap between the current level of investment in biodiversity conservation and the estimated funding that is needed, particularly in the tropical areas. A study by Bruner et al. (2004) estimated a total shortfall of funding for protected areas in developing countries as much as $ 1 billion to $ 1.7 billion. Figure 4 illustrates the existence of global financing gap measured in percentage of overall conser-vation cost that is met by each region (Balmford et al 2003 in Emerton et al. 2006).
Figure 4
The Protected Area Financing Gap
Source: Balmford et al 2003 in Emerton et al. 2006
In addition to the increase number of PAs, IUCN noted the causes of budget shortfall trends are institutional shifts including decentralization, eco-nomic deregulation, as well as global and national change in development pri-orities towards poverty reduction goals (Emerton et al. 2006:11-13). For exam-ple, CBD activities were reported have moved away from focusing on biodiversity
conservation toward a broader scope of sustainable development in all sectors.
On the contrary, The World Bank had a more optimistic view on this is-sue. The report claimed that gradual reforms in Indonesian forestry policies in combination with commitment to good governance of current president through democratization and decentralisation have created a more positive po-litical climate in forestry management (World Bank 2006).
The World Bank‟s view does not seem to work for the reason that in prac-tice, decentralization does not simplify conservation efforts. In Indonesia, con-flicts between forest managers and other interested stakeholders are still in-creasing (Putro et al. 2012). Differences in policy and management priority between local government and forest managers often hinder the smooth man-agement. Moreover, the commitment of The World Bank itself to intensify its
14
assistance to Indonesia clearly stated not peculiarly focusing on forestry activi-ties, but more on macroeconomic policy intervention, corruption and poverty alleviation (World Bank 2006:9-11).
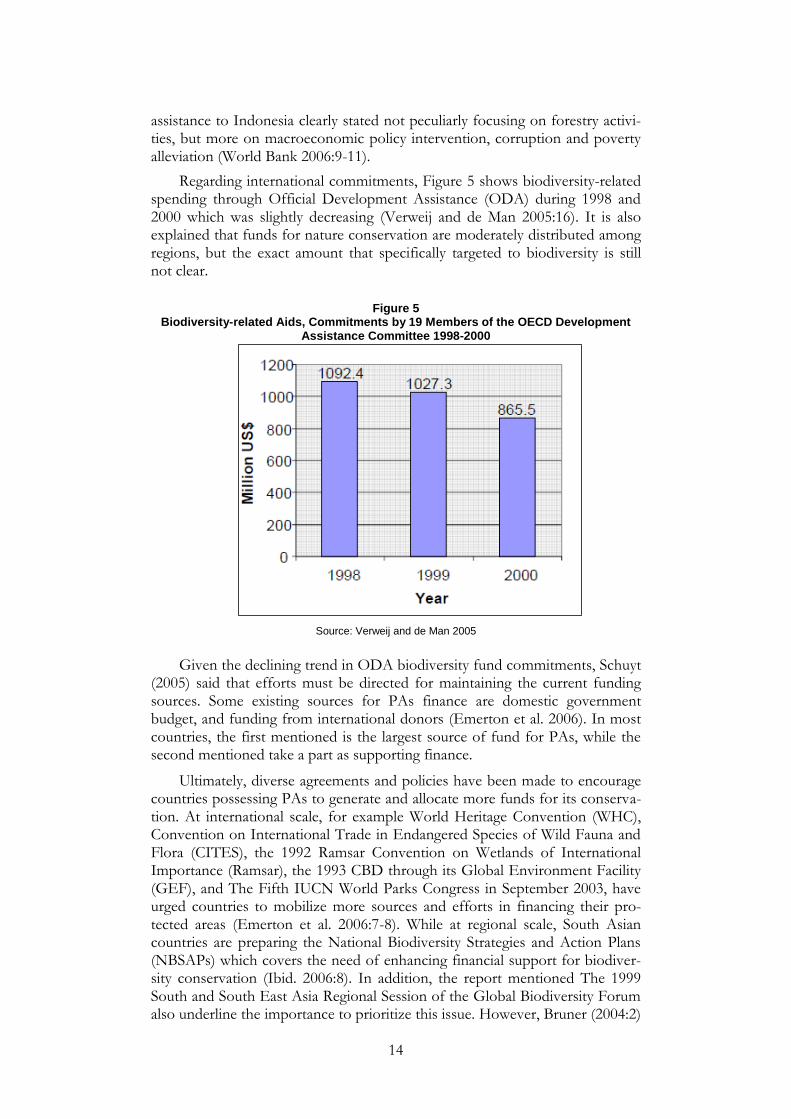
Regarding international commitments, Figure 5 shows biodiversity-related spending through Official Development Assistance (ODA) during 1998 and 2000 which was slightly decreasing (Verweij and de Man 2005:16). It is also explained that funds for nature conservation are moderately distributed among regions, but the exact amount that specifically targeted to biodiversity is still not clear.
Figure 5
Biodiversity-related Aids, Commitments by 19 Members of the OECD Development Assistance Committee 1998-2000
Source: Verweij and de Man 2005
Given the declining trend in ODA biodiversity fund commitments, Schuyt (2005) said that efforts must be directed for maintaining the current funding sources. Some existing sources for PAs finance are domestic government budget, and funding from international donors (Emerton et al. 2006). In most countries, the first mentioned is the largest source of fund for PAs, while the second mentioned take a part as supporting finance.
Ultimately, diverse agreements and policies have been made to encourage countries possessing PAs to generate and allocate more funds for its conserva-tion. At international scale, for example World Heritage Convention (WHC), Convention on International Trade in Endangered Species of Wild Fauna and Flora (CITES), the 1992 Ramsar Convention on Wetlands of International Importance (Ramsar), the 1993 CBD through its Global Environment Facility (GEF), and The Fifth IUCN World Parks Congress in September 2003, have urged countries to mobilize more sources and efforts in financing their pro-tected areas (Emerton et al. 2006:7-8). While at regional scale, South Asian countries are preparing the National Biodiversity Strategies and Action Plans (NBSAPs) which covers the need of enhancing financial support for biodiver-sity conservation (Ibid. 2006:8). In addition, the report mentioned The 1999 South and South East Asia Regional Session of the Global Biodiversity Forum also underline the importance to prioritize this issue. However, Bruner (2004:2)

15
found majority of commitments mentioned above were unmet, and funding for PAs remains limited.
Therefore, our paper follows Tomaselli (2006:24)‟s argument that innova-tive funding sources could be an option to replace the declining PAs finance. At the same time, taking into account that lack of capacity to estimate actual gap of funds has led to biases in determining the proper financing strategy in forestry management (World Bank 2006). A consequence of this is to assess the funding needed, and to estimate the financing gap that must be filled to meet the conservation‟s goals WWF (2009).
3.4 The Future View of PAs Finance
It is said in the previous sections that in most countries, government budget remain the core of long-term funding for PAs (Emerton et al. 2006). However, considering the current shortfall trends of protected area finance showed previously, the future financial plan should be done in greater efforts to achieve appropriate strategies. It is found that a recent business plan of In-donesian NP estimates its average financing shortfall is reaching 15 billion ru-piah for period 2010-2014 (BTNKM 2009).
Therefore, recent studies recommend PAs manager seeks more creative funding mechanisms. WWF (2009) and Holopainen & Marieke (2008) argue conventional funding system is not sufficient to finance the growing need of conservation programs, so they need to find an extensive innovation on fi-nancing. In addition, experiences in developing countries show that, due to insufficient government budget, protected area manager often generate reve-nue from internal sources or external donors (Moye and Nazerali 2010). The substance of those papers is that by diversifying the funding sources, PAs could prevent from unexpected financing risks.
Having similar idea to broaden PAs financing, Schuyt (2005)‟s reason is because current market situations are becoming more competitive. For in-stance, as the largest industry in the world, tourism has the potential to gener-ate substantial funding for biodiversity conservation, and PAs are often a major source of attraction for tourists (WWF 2009). However, current PAs tourisms were lack of supporting infrastructure (Moye and Nazerali 2010:6). In addition, tourism fees have been set at levels that do not reflect the value of the attrac-tion offered to the tourists (Ibid. 2010). In other words, there has been under-valued of tourism potentials which lead to failure to establish market mecha-nisms. Further, it causes inadequate tourists‟ facilities which yield PAs less competitive in tourism market. Therefore, setting tourist charge appropriately, for example based on tourists‟ willingness to pay might help to enhance its competitiveness.
From Bruner (2004:5)‟s point of view, funding shortfalls can also be re-duced by decreasing costs. For instance, through improved efficiency and through partnerships with stakeholders who concern to the PAs, such as local communities, Non-Government Organisations (NGOs), and private compa-nies. Nonetheless, spending money effectively for achieving the objectives of the conservation, in fact is not an easy task (McNeely and Weatherly 1996:19). The point of view argued here is that supporting PAs need some enabling conditions such as strong political support for PAs, supportive legislation and

16
enforcement, low corruption, and matching funding at appropriate levels (Ibid. 2004:7). In reality, these requirements seem hardly met by most of conserva-tion projects (Ibid. 1996).
Another source of fund which significantly contributes to PA conserva-tion is private and community fund which appears to have increased in recent years (Emerton et al. 2006:11-12). Schuyt (2005) said it could be in the form of creating partnerships with other organisations, or mobilising funding from other non-environmental sources. WWF (2009) also considers some voluntary and mandated compensation payments as an effective way to finance conserva-tion by involving private sectors to be responsible of the impact they have on biodiversity and environment. Similar to this scheme, a resource extraction charge can also serve as an effective way to compensate for the extraction of one resource by helping to conserve another (Ibid. 2009).
In addition, mechanism related to payment for watershed services is also widely used in developing countries. Agreements between water users and en-vironmental agencies have developed toward more improved water quality and habitat conservation (WWF 2009). In light of economic liberalisation, private sector funding, including PES, might provide an opportunity for financing in a broader-scale activities. In terms of PES, it is expected to be an increase in pro-jects that create payment mechanisms where downstream beneficiaries pay for the sustainable management of forests upstream (Schuyt 2005).
In line with the ideas stated above, WWF (2009) points one financing mechanisms that have been broadly discussed recently is carbon finance. The current debate is focused on establishing carbon policies and mechanisms that allow carbon market funding to support forest by compensating practices that causes greenhouse gasses. WWF believes that carbon finance, if used appropri-ately, can contribute to biodiversity conservation, as well as local economic and social improvement.
IUCN (Emerton et al. 2006) noted some important opportunities to diver-sify the funding sources are: benefit cost analysis; changes in fiscal system, for instance by providing incentives and removing disincentives; to allow a timely basis use of funds through a revenue-benefit sharing mechanism; to mobilize stakeholders‟ participation to share management cost and responsibilities; to involve commercial enterprises in the sustainable use of protected areas; and imposing payment for environmental services.
All of those approaches mentioned above can be summarized in a busi-ness plan which incorporates the three main actors of PAs conservation: gov-ernment, forest resource extracting companies, and public forest administra-tors (including local communities and NGOs). These funds and the whole conservation activities supported by the funds could function more effectively under a combined market and non-market approach (Johns et al. 2008). Yet, because business development in PAs is different from common business, the plan should be within the corridor of conservation goals (BTNKM 2009).
Finally, as has been noted, sustainable finance does not mean that it should continue to finance the conservation. Rather, it should be seen as a temporary intervention to stimulate societies to integrate conservation in their economic activities (Castro 2003:6). Some studies introduce financing mecha-nisms which accommodate all of the potentials mentioned above, for example

17
trust fund, conservation fund, or environmental fund (Chiramba et al. 2011, GEF 1998, Oleas and Barragán 2003). Basically, these are similar mechanism but different names. In this financing scheme, it is necessary for park managers and stakeholders to invest resources particularly at the early stage of its devel-opment. Maximizing the contribution of each funding source will require pri-oritizing investments until financial sustainability is completely met (Bruner et al. 2004).
3.5 Conclusion
This chapter is summarized by highlighting that sustainable conservation fi-nance should not be interpreted based on the amount of funds, but also how it is managed to achieve the whole conservation goals. To solve the problems of conservation financing gaps and shortfalls, PAs manager need to think beyond the conventional view point. An extensive source of fund such as ecotourism fees, charges for environmental services and partnerships need to be devel-oped. However, following Castro (2003), the final goal of PAs sustainable fi-nancing is to make them financially independent. Therefore, an innovative funding mechanism such as trust fund could become an alternative.

18
Chapter 4 Framework of Analysis
4.1 Introduction
The research examines the financing strategy of NPs. A quantitative approach is used to observe the existing condition of parks‟ financing, and compare the output of activities to the plan. This chapter briefly discusses the framework of analysis for the study.
4.2 The Logic of Research
The study is designed following the new government budgeting system namely Anggaran Berbasis Kinerja (ABK) or performance-based budgeting (Departe-men Keuangan 2009), and GHSNP management plan (GHSNP 2007a). Com-pare to the old style system, ABK is more emphasized on the results of the programs. In this system, the budget proposal is prepared based on the man-agement plan of each organisation, and the previous management results. The logic of research is presented in the scheme shown in Figure 6.
Figure 6
The Logic of Research
Source: The author’s own illustration, based on ABK (Departemen Keuangan 2009) and GHSNP man-
agement plan (GHSNP 2007a)
Output of activities (achievements)
Real spending (1 year)
Approved budget (1 year)
NP Operational Plan (1 year) Target activities Operational budget proposal
NP Strategic Plan (5 years) Target Output
National Park (NP) Management Plan (20 years)
Vision and Mission
Potential funding sources
Donors, Stakeholders' contributions, etc
Water use Ecotourism
gap
gap gap
gap

19
4.3 Data and Methodology
Data and Variables
The paper uses a set of secondary data from several sources, which are: Indo-nesian Ministry of Forestry, Indonesian Statistical Bureau, and GHSNP as the main materials. Some relevant data from other NPs in Indonesia were also tak-en to enrich the discussion. The availability of data urged the author to sepa-rate the data treatment into two kinds; national level data which covers 50 NPs, and local level data which covers only one national park.
National level data consists of some variables: government annual budget allocation on NPs 2005-2011, the annual real spending of each park 2005-2011, government revenue from ecotourism in NPs 2009-2011, the number of visitors for ecotourism 2006-2011, and the area of NPs 1983-2009. Local level data consists of some variables: the annual real budget needed by GHSNP 2007-2011, the composition of GHSNP budget allocation 2007-2012, potential sources of funding in the park such as donors, stakeholders contribution, and watershed use in various years.
Methodology
This research procedure is classified into a quantitative methodology. The ex-ploratory data analysis (EDA) is used to reveal the insights of the data. Because of the design of the research, EDA techniques are suited to help the author in understanding as well as to reveal the underlying structure of the data (Tukey 1977). The EDA approach is also appropriate because it shows all the available data, so that it minimizes the corresponding loss of information (NIST/SEMATHECH 2003).
The three steps of EDA; display the data, identify salient features, and in-terpret salient features, are applied to recognize the essence of the data (De Mast and Trip 2007). To answer the first and second research questions, the author use graphical techniques as the part of EDA. The third and fourth questions are answered by exploring the data and information shown in graphics and tables. The application of various graphics in combination with the author‟s knowledge on what is in the data and what is not in the data help to delineate the link between each data feature.
4.3 Measurements for Sustainable Financing
Protected area financing is about more than the amount of money, but in-volves mobilizing and managing funds to address a range of activities related to biodiversity conservation (Castro 2003). Financial sustainability is not possible without strong and effective institutions for conservation area management.
“PA financial sustainability can be defined as the ability to secure suffi-cient, stable and long-term financial resources, and to allocate them in a timely manner and in an appropriate form, to cover the full costs of PAs and to ensure that PAs are managed effectively and efficiently with respect to conservation and other objectives” (Emerton et al. 2006).

20
Taking the concept above, financial sustainability in NP in Indonesia is ex-pected to be achieved with maximizing all the economic potentials, taking into account the characteristics of each park. Thus, to reach the answer of the main research question „how sustainable financing needs of NPs could be met?‟ the research will be operationalized by looking at three indicators of financing in the park: timely manner allocation, appropriate form of activities, and long term funding sources.
The existing condition of financing national parks will be seen from the way funding is spent, both at national and local level, for routine and recurrent spending. Routine spending includes salary and operation for maintenance of-fice. While recurrent spending includes conservation activities such as forest patrol, community development, environmental education program, wildlife monitoring, research on biodiversity, and other activities.
Then, to measure the sustainability of financing in the parks, it should be clear about the time table of budget allocation and the timing of program im-plementation, what kind of activities and what the expected results/goals are, how much funding is needed as well as how much is obtained in real term. Fi-nally it also important to consider the possibility of long-term funding sources to ensure the future parks‟ management.
4.4 Effectiveness and Efficiency use of Fund
The effectiveness and efficiency use of funds in NPs in Indonesia are mostly influenced by some constraints of financial administration. For example, the imbalances between budget proposed and the real spending, and discrepancy timing in allocating the budget and project implementation. According to IUCN (Emerton et al. 2006), to get to a sustainable financing for conservation area, it is necessary to improve the effectiveness by ensuring that funding is allocated and spent in a way that supports all the funds need and achieve the conservation goals.
To see the effectiveness of parks‟ conservation program, the study mainly observes the outputs of activities, and compares it to the plans. NPs‟ manage-ment plan (GHSNP 2007a) and performance-based budgeting system (Depar-temen Keuangan 2009) are used as the main references. NPs management plan are not general but contextual according to each park‟s focuses (Departemen Kehutanan 2006). Therefore, this study is not intended to link the park‟s man-agement results in general but depends on those contextual reasons.
While the efficiency use of the fund is seen through how fund is allocated for each program and how it is used to reach the objectives of the program. Using the concept of economics principles that „rational people think at the margin‟, which means that „a rational decision-maker takes action if and only if the marginal benefit of the action exceeds the marginal cost‟ (Mankiw 2011). Then, efficiency should consider the input for each activity is lower than its output (Departemen Keuangan. 2009). Bruner (2004:7) asserted the efficient use of funding can be promoted by monitoring the management results, and then use this information to improve parks‟ performance in the future.

21
4.5 Potential Funding Sources
The opportunities or factors that support for self-financing parks in the parks will be identified by locating the most appropriate source of fund for each management unit. It should also consider the availability of long-term funding sources to ensure that long term management goals could be achieved (WWF 2009, Schuyt 2005).
Following Departemen Kehutanan (2006), NP models are expected to be able to manage all its revenue coming from environmental services, ecotourism and non-timber forest product. Thus, the subject of this section should cover all the potential revenue from those three aspects, both in local and national level. However, due to the limitation of the data, the discussion will be focused on ecotourism, watershed management, and donors/private funding from cooperation activities.
4.6 Conclusion
A logical framework is created to suit the problem-driven research in the study. The research is conducted using secondary data. Some limitations were faced, but an in-depth discussion is presented through accommodating both national and local level data. To reveal the existing data, the study used the EDA tech-nique which is fit to help in answering the research question.

22
Chapter 5 Empirical Findings and Discussion
5.1 Introduction
This chapter presents the findings of our study, and discuss the findings on NP financing in Indonesia. The discussion focuses on current financing, and the outlook of future funding for the parks to be self-financed. Current financing of NPs is discussed in term of the trend of funds reaching the parks, the gaps between the amount needed and the gained, and how it is used to achieve con-servation goals. The future view encompasses potential sources of funds, and possible mechanism for Indonesian NP to be financially independent.
As it is mentioned previously, the data available for 50 NPs do not bear in answering the research questions. However, the absence in some variables of 50 parks data is filled by those gathered from one NP, GHSNP.
5.2 Current Financing of NPs
Government budget allocation
The earlier chapter indicates that in most countries, government budget is the largest and long-term source of fund for NP. In Indonesia, the amount of gov-ernment budget transferred to NPs increases overtime (Figure 7). The share of national parks budget to the Gross Domestic Product (GDP), and to the total government expenditure rises during the last seven years. It seems that as the economic growth increases, Indonesian government becomes more concern on forest conservation by allocating more resources for NPs.
Figure 7
Government Budget for NPs in Indonesia as the Share of Total Government Expendi-ture and GDP 2005-2011
Source: The author’s own illustration based on BPS and MoFs data
0
0.0001
0.0002
0.0003
0.0004
0.0005
0.0006
0.0007
2005 2006 2007 2008 2009 2010 2011
NP
s' B
ud
get
Shar
e
(%) % Government
Expenditure
% GDP

23
To some extent, this fact contrary to what has stated by Hartono (2008) that the increase number of NPs in Indonesia will reduce government‟s alloca-tion for park conservations. At the global level, even though some literatures reported that most of developing countries cannot afford the expenses of higher number of PAs, none of them specifically mention that government funds were declining. As Schuyt (2005) says, due to the decrease in donors‟ support including ODA, financing for PAs should be directed to maintain the existing funds, which is government budget. As a result, a lot of agreements at international level have been signed by countries to provide more resources for biodiversity conservation, including national parks (Bayon et al. 2000). For ex-ample, the 1992 CBD agenda which is manifested through GEF as interim fi-nancial mechanism for biodiversity conservation, has urged government of each country to take a part in financing those activities (McNeely and Weather-ly 1996:9).
Therefore, the presumption being put here is, the increase in the budget expenditure in conservation is related to those intensive encouragements of international agreements to Indonesian forestry. The increasing trend of gov-ernment spending on NPs during 2005-2011 seems coincide with the rise of international calls from 1992 until today. In addition, (Emerton et al. 2006:80) assert that increasing funding of PAs is an obligation as countries signing up to international agreements such as the CBD, WHC, CITES and Ramsar, or by committing themselves to multilateral declarations such as the MDGs, and CBD 2010 Target and Programme of Work on PAs. Thus, by ratifying such policies, agreements, and declarations, it gives a basic rationale and justification to Indonesian government to commit in financing PAs.
Another important thing to note from the graph above is; as the share of total government expenditure and GDP, the sums involved in parks conserva-tion are relatively small. This fact consistent with the findings of IUCN‟s work which shows average spending in the environment is less than 1% of GDP in Latin America and Caribbean, 0.5% of total government expenditure in Vi-etnam, and 0.1% of total federal budget in the US (Emerton et al. 2006:9-10). Thus it could be inferred that government commitment to financially support NPs is still far below its capability. In other words, NPs conservation has not been the priority of Indonesian government programs.
In this case, the reason may be related to the government financing mech-anism itself, which apply a performance-based budgeting system (Departemen Keuangan 2009). According to this system, one factor which influence total government budget for the MoFs (including those for national parks) is the contribution of forestry sector to total government revenue. In the previous chapter, it is mentioned that Indonesian forestry contributes only less than 7% to the GDP, even smaller in the last three years.
The figure 8 shows a more detail information on budget allocation for the parks as well as its real spending. A significant increase from about 157 billion rupiah in 2006 to almost 300 billion rupiah in 2007 is mainly caused by the des-ignation of 9 new NPs. A large increase both in budget allocation and real spending also happens in 2010, which reaches more than 100 billion rupiah from the previous year. This happens after a little increase of government budget followed by a slight decrease in real spending of the parks during 2008-2009. At that time, there was a government instruction for national savings by

24
cutting the budget for all programs. This instruction was ended in 2010, and the conservation budget rises again. It is actually not clear whether govern-ment‟s budget cuts for the parks in 2008 and 2009 were caused by the global economic crisis or because there are several national disasters in the country that need to be prioritized (GHSNP 2010b).
The phenomenon happened in 2008-2009 as mentioned above, provides an example of uncertainty in the conventional type of conservation funding where PAs are mostly financed by government. According to IUCN (Emerton et al. 2006:29), there are indications of shifts in government funding toward more focus on new programs such as poverty reduction. Thus, it confirms the previous opinion that managing national parks apparently not the priority of the government.
Figure 8
Total government budget allocations for 50 NPs in Indonesia 2005-2011
Source: The author’s own illustration based on MoFs data
From the graph above, it seems that the gap between budget given by the government and the real spending by NPs fluctuates overtime. In general, the amount of money spent by the parks is lower than the amount approved by the government. In this case, inability of the parks to use the entire fund given by the government might lead to the gap in the achievements of parks pro-grams compared to its plans.
Previous experience in Vietnam (Emerton et al. 2006:16) proves that even though government budget is relatively high and stable; management failures related to financial issues still exists. The use of funds which is mostly allocated for salary and infrastructures; budget procedures with postponement and re-arrangements; and less flexibility for allocating the fund due to the tight plan, become evidences (Ibid. 2006:17).
Moreover, if the actual spending and also the budget approved do not match with those proposed by the parks, the gaps between real outputs and those targeted could also be greater. Thus, for more meaningful discussion, a data on the expected amount of fund by each park is needed. The gaps be-tween the proposed and the actual budget could give an overview of what are
0
100
200
300
400
500
600
Go
vern
me
nt
Bu
dge
t
(Ru
pia
h)
Bill
ion
s
Budget Approved
Real Spending

25
the trends of government budget shortfall in financing NPs. Nevertheless, due to the limited access to the data, instead of talking about all NPs, this section will discuss only the case of GHSNP.
Figure 9 illustrates the trends of budget plan, budget approved and its real spending in GHSNP during 2007-2011. The budget plan is determined based on the annual target activities of the park. In general, the graph shows that the budget proposed by GHSNP is not always fully approved by the central gov-ernment, so there is always a gap between the park‟s needs and the budget giv-en. From 2007 until 2010, GHSNP proposed around 14 billion rupiah for con-serving its area, while the approved budget was two billions rupiah lower than the need in 2007 and larger in the following years. Budget deficit during 2008-2010 were getting larger, which might be related to the budget cut in total gov-ernment expenditure mentioned before.
Figure 9
Total Government Budgets for GHSNP; Budget Plan, Budget Approved and Real Spending during 2007-2011
Source: The author’s own illustration based on GHSNP data
Similar experience is also faced by other NP in Indonesia, Kayan Menta-rang National Park (KMNP). The park‟s business plan estimates the gaps of government‟s budget for the period 2010 to 2014 ranges from 15 to 22 billion rupiah (BTNKM 2009). As shown in the graph above, the financing gap in GHSNP is at intervals 1.7 to 6.5 billion rupiah (except in 2011), which is far lower than that of KMNP. Two possible reasons could explain this situation. Firstly, it is because KMNP is a newly designated NP which is established in 2007. According to (McNeely and Weatherly 1996), new PAs usually need more resources to build the basic infrastructure such as vehicles, research equipment and other facilities. In addition, at its early establishment, the park might conduct more basic activities such as park area mapping, wildlife sur-veys, and other baseline data collection. Thus, in the case of KMNP more budgets are needed to establish those facilities compare to GHSNP‟s case. The second reason might be related to the capability of GHSNP to obtain addi-tional funds from other sources, such as grant, donors, and other kind of
-
2
4
6
8
10
12
14
16
2007 2008 2009 2010 2011
Bu
dge
t (R
up
iah
) B
illio
ns
Budget Plan
Budget Approved
Real Spending

26
funds. The earlier section specified that GHSNP received financial support from JICA and other collaborative programs.
It is stated in the park‟s business plan that KMNP also seeks alternative funding sources to reduce those funding gaps (BTNKM 2009). While in GHSNP the budget proposed in 2011 was almost the same with the approved. This fact proved that government‟s budget gap in GHSNP was filled from other sources. On the whole, it can be said that there have been initiatives to search for additional funding sources for the parks to fill up the financial needs. These initiatives not only came from NP model (GHSNP), but also from non-park model (KMNP).
The difference between the annual amounts of fund approved by gov-ernment, in turn affect the realization or the real spending of the park. It fur-ther could affect the achievement of park‟s targeted programs. These condi-tions were caused by the nature of government financing mechanism itself which implies a kind of uncertainty.
One reason that explain the condition mentioned above is related to de-posit process of government revenue to the state treasurer which affects the amount of budget given to the park as well as the time of allocation. For ex-ample, the budget request for 2011 is around 11 billion rupiah including salary. However, the ceiling budget from the government is about 10.6 billion rupiah, meaning that there is a gap almost 400 million rupiah. Then in the middle of the year, there is an additional budget given by the government for park man-agement, so the total is 11.12 billion rupiah (Table 1). Finally at the end of the year, the total spending is about 92% from the total budget given. The reason behind this additional amount of budget is because central government has received non-tax revenue from the ministry of forestry, in particular, revenue from ecotourism entrance fee in national parks. Ideally, the revenue should be deposited by the beginning of the year, so that the ministry of finance can allo-cate the fund to the park in time.
Based on the sources, there are two kinds of government budget for NP, namely Rupiah Murni (RM/cash money) and Pendapatan Non Pajak (PNP/non-tax revenue). An RM budget sourced from the state‟s treasury, while PNP came from non-tax revenues which are deposited by each ministry. An approved budget labelled with RM means it is available at any time of each program‟s implementation. While those which are labelled with PNP carry an „uncertainty‟ factor, both in the real amount of fund and the time of allocation (GHSNP 2010a). What has happened in GHSNP in 2011 discussed above was practically because of the late payment of non-tax revenue to MoF. Thus in May 2011 all PNP labelled activities can be supported only 30% of the budget. In June 2011, it increased to 50%, and finally in November 2011 the entire budgets approved were available to be used. This kind of late approval brings two consequences; either a lower real spending or lower quality of program‟s output, because when the budget are fully available, the park managers are running out of the time for the programs‟ implementation.
Another case is illustrated by the condition in 2009, which is contrary to what has happened in 2011. There was a budget cut in MoFs in November 2009. The proposed budget of GHSNP was 14.2 billion rupiah, while the ap-proved was 8.2 billion rupiah. Then in November 2009 an instruction for na-

27
tional budget savings due to national disasters caused the park accepted only 7.8 billion rupiah, and reduced its real spending became 7.4 billion rupiah.
The point presented here is that although government budget is still the major source of funds for national parks, the risks embedded in this kind of funds is quite high. The findings in this section consistent with the statement of Emerton et al. (2006:11-13) that any change in government priorities to-wards other management goals could reduce the budget allocated for PAs. Again, this point is also in accordance with the earlier point stating that at this time, NPs conservation may be not the priority of Indonesian government.
As mentioned before, un-match between the budget needed and the budget approved affect the realization of the spending. Table 1 shows that government budget for GHSNP increases every year, but the real spending varies from 68% to 95% from the ceiling budget. One reason is because some of the on-going activities were not financially supported, due to the time allo-cations of the budget which are not match with the time of implementations.
Table 1
Budget Plan, Budget Approved and Real Spending 2007-2012 (in Rupiah)
Year Budget Plan Budget
Approved
Real Spending
Nominal %
2007 14.879.110.000 13.202.529.000 8.978.705.016 68
2008 14.204.857.000 7.859.434.000 6.499.609.395 82,7
2009 14.208.177.000 7.805.274.000 7.450.910.567 95,46
2010 14.718.476.000 9.176.720.000 8.280.375.609 90,23
2011 11.009.411.476 11.123.480.000 10.234.072.800 92
Source: The author’s own illustration based on GHSNP data
Overall, the findings on current government financial support for NPs in Indonesia give clear illustrations on how these financing system affect the management of the parks. Even though there are tendencies for the parks to receive more funds from the government, but it is not allocated in timely man-ner. Furthermore, there is a risk that the budget cannot support all of the parks‟ programs that have been planned, for example because of changes in government priority. In the case of GHSNP, there were shortfalls but it seems that recently the park could manage to fill in the gap from other source of fund. While in KMNP, by realizing the existence of financial gaps and measur-ing the exact amount, the park has developed a business plan which reflects efforts to fill the deficit. Thus, along the lines of Castro (Castro 2003), our re-sult suggests it is not the case that lack of financing in forest conservation is solved simply by increasing government expenditure. Instead, a more realistic solution is to search for more diverse of funding sources.
Cooperation Programs
From the graph in Figure 9, it is also noted that there are large shortfalls in the funding for the park, but the trend does not confirm for increasing short-fall. As a matter of fact, the budget proposed in 2011 is almost the same with

28
the amount of fund given to the park. This fact should be confirmed with the other data from GHSNP, for example the existence of other sources of fund such as donors and cooperation programs.
Our findings show that since its establishment in 1997, GHSNP was sup-ported by JICA‟s grant project. The first and second phase of Biodiversity Conservation Project ended in 2003, followed by the Gunung Halimun Salak Management Project from 2004 to 2009. In addition to this project, GHSNP management has been supported by other organizations, including private companies and NGOs.
However, due to restrictions imposed to Indonesian government institu-tions to receive fund from other parties, all the conservation activities in GHSNP funded by non-government organizations were done in the scheme of cooperation program. Under this scheme, all the fund coming from donors were managed directly by the donor, while the implementations of the program were done together with NP staff.
Several cooperation programs which were conducted in GHSNP during 2004-2011 are presented in Appendix 1. Because of the limited availability on annual data, stakeholders‟ contribution in money term is presented in average amount based on the author‟s calculation. Figure 10 shows these cooperation programs presented in average amount of fund spent by five stakeholders in GHSNP.
Figure 10 Average Financing Support under Cooperation Programs in GHSNP 2004-2011
Source: The author’s own illustration based on GHSNP report 2010
Thus, it could be inferred from figure 9 and 10 that the financial gaps from government budget to GHSNP are filled by those coming from other sources under cooperation programs. The park‟s management plan which is developed in collaboration with all stakeholders is the principal that attracts cooperation in GHSNP. A good start in building the trusts between GHSNP and other stakeholders during the development of park‟s management plan somehow eases them to collaborate in the implementation of the plan.
0
200
400
600
800
1000
1200
1400
1600
1800
2000
2004 2005 2006 2007 2008 2009 2010 2011
Ave
rage
Fu
nd
s (R
up
iah
)
Mill
ion
s
Year
JICA
Local Govt
Chevron
PLN
Antam

29
Almost all of these cooperation programs addressed to the local commu-nities living inside and near the park. Some forms of community development activities were supported, for example by providing capital for local income generation through productive activities based on communities‟ own poten-tials. Another example, Perusahaan Listrik Negara (PLN/ State-owned Electri-cal Company) gave support on the establishment of micro-hydro electrical generator in some villages adjacent to the park area. While the other form of programs were intended to biodiversity protection such as research and moni-toring on endangered species in the park, and building facilities for raptor (ea-gle) sanctuary. Part of the support were also given in the form of training and capacity building for NP staff as well as local people for ecotourism and forest protection skills.
Corporate donation in Kutai National Park (KNP) is another example of a
successful cooperation program. In order to resolve the continuing shortfalls of funding in the park, KNP initiated some partnerships with several companies op-
erating within and near the park. As a result, during 1996 and 2000, participating companies invested more than US$300,000 in KNP. An association called Friends of Mitra Kutai was formed to manage the funds. Through this association, cash contributions were channelled to the park while non-cash contributions such
as vehicles, fire-fighting equipment and other form of facilities were organized by the companies. This form of cooperation has resulted an enhancement in KNP‟s management particularly ecotourism activities, community develop-ment and forest mapping (Emerton et al. 2006:32).
A lesson learned from the experiences of GHSNP and KNP is that part-nership and cooperation program between national park and the stakeholders could help the parks to solve their financial burden. Furthermore, concerning current rule in which government institutions are prohibited to receive any cash transfers from other parties, KNP has demonstrated a good lesson. With an independent and trustworthy organisation, as well as a clear mechanism to manage the funds, a better management of NP can be achieved.
5.3 Effectiveness and Efficiency use of Fund
The earlier sections found that additional funds bring in improvement in con-serving the parks. However, McNeely (1997) argued that increasing fund is not the expected response because there are cases where the existing funds were not spent in a credible way. In this regard, finding the effectiveness and effi-ciency use of the funds become crucial. In addition, to look at the composition of the funds is also a necessity.
Measuring the effectiveness of Indonesia‟s parks management is a chal-lenge in this paper, because each park has different goals according to its man-agement plan. The characteristics of each park were the main considerations for establishing a management plan. Therefore, this study attempts to link the plan with the results because of the contextual reasons above.
Table 2 provides an overview of the effectiveness use of government fund in GHSNP in term of its achievements on the targeted programs. As presented in the park‟s financial report, it seems that the funds were used effectively, most activities achieved close to 100%. However, the units of measure (Appendix 2) used do not necessarily portray the actual output achieved by the

30
park, for example the number of report and the number of activities (GHSNP 2010b). Rather, using indicators such as the number of wildlife monitoring points, the area of deforestation, and the number of illegal logging might be more useful to quantify the effectiveness use of the funds.
Table 2 The Effectiveness of GHSNP; the Output Achieved Compared to the Plan 2010-2011
Program Achievement (%)
2010 2011
Strengthening the area and legal status of GHSNP to support for ecological management
80 75
Wildlife conservation 100 100
Environmental services and ecotourism 108 108
Illegal activities management 100 120
Collaboration and partnership 66 66.7
Strengthening the institutional function of GHSNP 95.4 95.4
Source: The author’s own illustration based on GHSNP data.
Meanwhile, the non-financial park‟s reports showed that conservation ac-tivities supported by other institutions have brought GHSNP to achieve a sig-nificant improvement to reach its target. For example, the endangered species monitoring which are conducted by GHSNP staff with financial support from PLN has covered larger monitored areas, with more frequency of observations compared to similar activities which are financed by the government‟s budget (GHSNP 2007b, 2008).
According to performance-based budgeting system (Departemen Keu-angan 2009), efficiency in using government budget is measured by looking at the proportion of budget spent and the approved. Table 3 illustrates the effi-ciency use of fund in national parks. Compared to all NPs in Indonesia, the use of government fund in GHSNP is more or less the same, almost reaches 90%.
Table 3
Efficiency Use of Fund in All NPs in Indonesia and in GHSNP 2005-2011
Year
Efficiency (%)
All NPs GHSNP
2005 82.7 101.15
2006 87.8 86.45
2007 76.0 81.18
2008 106.7 82.7
2009 93.45 95.46
2010 90.69 90.23
2011 88.37 92
Average 89.38 89.88
Source: The author’s own illustration based on GHSNP data.
It is also important to look at the composition of government financing. The largest part goes to salary and honorarium. Both in routine spending (named salary), and in each program (named honorarium), payment for park‟s

31
staff are still the biggest part (Table 4). The high proportion of salary in GHSNP budget composition is closely linked with the number of park staff. With an area more than 113 thousands hectares, GHSNP has about 120 staffs that are mostly field officers such as forest rangers and technicians (GHSNP 2007a). This results confirm to previous report in 2006 (Putro et al. 2012) that more extensive parks area had greater number of staff, and in turn received greater amount of government financial support.
However, it is worth noting that the high number of staff might reflect ineffectiveness and innefectivity of work or less use of technology. In addition, the distribution of park staff in Indonesian NPs might not reflect the actual needs of each park. Previous study conducted by the World Bank in 2001 (Pu-tro et al. 2012), noted that there are un-equal allocations of staffs and funds where NPs with greater area-staff ratio receive lower area-cost ratio.
Table 4 Composition of GHSNP Budget Allocation
No Composition Proportion (%)
2007 2008 2009 2010 2011 2012
1 Salary 29.1 49 52.2 47 40.5 44.5
2 Operational office 8.8 10 15.6 11.7 15.4 13.1
3 NP’s management (all category of activities)
62.1 41 32.2 41.3 44.1 42.4
Total 100 100 100 100 100 100
Source: The author’s own illustration based on financial GHSNP data
To compare with, the budget composition in KMNP in 2009 consists of 14% for salary, and it decreases to about 6% in 2010 (GIZ FORCLIME. 2009). In details, the report denotes that the biggest part of budget in this park goes to forest protection activities and park‟s management plan development. This fact contrast to that of GHSNP where the proportion of salary over other park management budget increases over time. The result seems con-sistent with Hartono (2008)‟s argument that the budget composition for man-aging the park is related to each park‟s key features, the complexity of the problems, and its management targets.
5.4 Potential Sources of Funds
Some NPs have great economic potentials such as ecotourism revenue, envi-ronmental service fee, and non-timber forest product (Kementerian Kehutanan 2010b). There are also potentials‟ for the parks to gain financial support from public and private donor. If these potentials could be managed and legally allowed to be managed by the parks it selves, it will enable their self-financed management (Hartono 2008). The potentials of these economic re-turns have become the reason for government to designated 21 NP model in Indonesia (Departemen Kehutanan 2006).

32
Grants and Donations
GHSNP received several grants and funds from institutions other than MoFs. During 1995-2009, grants from JICA under a-Government to Government cooperation had been the second largest financial support for the park after government budget. Some facilities was built by the project including the park offices, research and ecotourism supporting facilities such as research station, guest house, canopy walk, and loop trail. These facilities in turn, support for the development of ecotourism program as well as increasing the participation of local communities in ecotourism activities.
Other program that is promoted in GHSNP which involved the public participation is tree adoption program and raptor adoption program. Both programs are carried out with the support from other organizations in the form of collaborative institution. Tree adoption program is supported by con-sortium namely Gedepahala, while raptor adoption program is supported by Suakaelang society. Each collaborative institution consists of several organiza-tions both local and national, with a commitment to support the conservation of GHSNP either in the form of fund or in kind contributions.
Table 5 shows revenue gained by Gedepahala consortium from tree adop-tion program in 2009-2011. In the tree adoption program, public (either indi-vidual or group) are invited to plant trees in the park area. Each tree costs the adopter 50,000 rupiah (equals to US $ 5).
Table 5
Tree Adoption Program in GHSNP 2009-2011
No. Parameter Year
2009 2010 2011
1. Number of trees 9,690 13,300 10,200
2. Area of planting (hectares) 10 23 20,5
3. Number of adopter (organiza-tion)
1 3 8
4. Revenue from the program (rupiah)
484.5 million 665 million 510 million
Source: The author’s own illustration based on GHSNP data
The general idea of tree adoption program is basically to achieve two out-comes. The first objective is to rehabilitate the degraded area of the park, and the second is to generate alternative income for local people through economic activities outside the park area (Supriyanto and Mulyati 2010). All of the reve-nue coming from this program will be managed by the consortium. Certain part of it will be given to local communities living near the forest who have already committed to support the protection of the park. Then it is allocated to maintain the tree for a year, and to be used as the capital for their local income generation. The rest of the fund will be allocated for other conservation pro-grams in the park with strict arrangements by the consortium.
With annual revenue 500million rupiah, this program contributes to al-most half of the budget needed for community development program. For its effective management, GHSNP need approximately US $ 180,000 for commu-nity development (GHSNP 2010a). Apart from the consortium, tree adoption

33
program in GHSNP has also been done in combination with ecotourism activ-ities, in which visitors are encouraged to participate in planting trees in park‟s degraded area. Thus it opens more opportunities to increase revenue from the program.
Tourism Based Revenue
Bappenas (2011) in its master plan of acceleration and diversification for economic development stated that tourism is one of the important targets. The literature review mentioned that currently tourism has become one of the most prospective industries in the world. At the same time, national parks hold large potentials to attract tourists because people‟s interests have shifted to a more nature-based tourism. Thus, ecotourism should be a relevant source of revenue that needs to be enhanced by MoFs.
We also need to consider that forestry contribution to GDP Indonesia during 1998-2010 shows a decreasing trend (Kementerian Keuangan 2012). Furthermore, MoF identifies that one of the causes is revenue from non-timber forest product such as ecotourism has not been maximized yet. Until now most of revenue from forestry sector is gathered from timber production, while it is decreasing due to illegal loggings and moratorium for timber cut-tings. This report asserts that MoFs should shifts the focus on other source of income such as ecotourism.
This fact means that if ecotourism program in NPs could be enhanced, there is a potential this sector to contribute in increasing government revenue. In addition, when we look at the trend of visitors coming to the park, there is a hope that in the future years the parks might gain more revenue. Figure 11 shows a significant increase in the number of visitors coming to NPs, from about 200 thousands in 2007 becomes more than 1.2 million tourists in 2010. At the same time, GHSNP attracts up to 100 thousand visitors in 2011.
Figure 11 Number of Visitors Ecotourism in National Parks Indonesia 2006-2011
Source: The author’s own illustration based on MoFs data
Revenues coming from ecotourism (namely non-tax revenue) are sent by the park manager to the MoF. These revenues include entrance fee and rent
0
200
400
600
800
1000
1200
1400
2006 2007 2008 2009 2010 2011
visi
tors
(p
ers
on
s)
Tho
usa
nd
s
All NPs
GHSNP
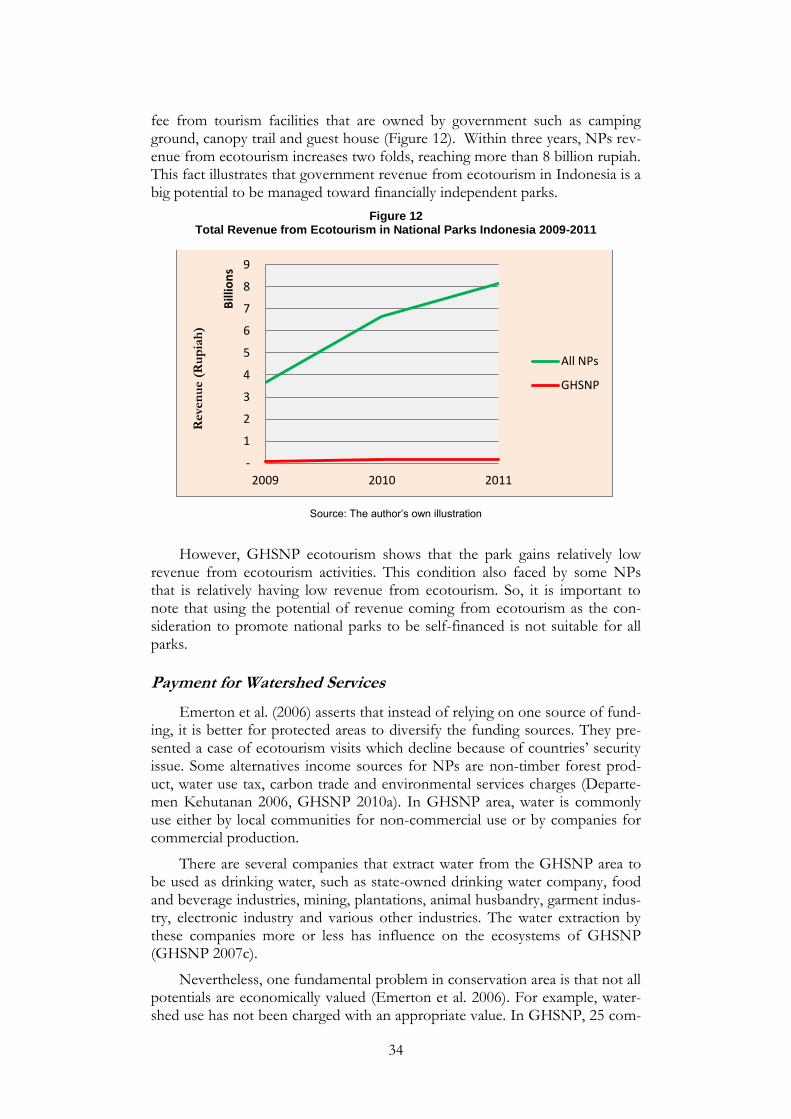
34
fee from tourism facilities that are owned by government such as camping ground, canopy trail and guest house (Figure 12). Within three years, NPs rev-enue from ecotourism increases two folds, reaching more than 8 billion rupiah. This fact illustrates that government revenue from ecotourism in Indonesia is a big potential to be managed toward financially independent parks.
Figure 12 Total Revenue from Ecotourism in National Parks Indonesia 2009-2011
Source: The author’s own illustration
However, GHSNP ecotourism shows that the park gains relatively low revenue from ecotourism activities. This condition also faced by some NPs that is relatively having low revenue from ecotourism. So, it is important to note that using the potential of revenue coming from ecotourism as the con-sideration to promote national parks to be self-financed is not suitable for all parks.
Payment for Watershed Services
Emerton et al. (2006) asserts that instead of relying on one source of fund-ing, it is better for protected areas to diversify the funding sources. They pre-sented a case of ecotourism visits which decline because of countries‟ security issue. Some alternatives income sources for NPs are non-timber forest prod-uct, water use tax, carbon trade and environmental services charges (Departe-men Kehutanan 2006, GHSNP 2010a). In GHSNP area, water is commonly use either by local communities for non-commercial use or by companies for commercial production.
There are several companies that extract water from the GHSNP area to be used as drinking water, such as state-owned drinking water company, food and beverage industries, mining, plantations, animal husbandry, garment indus-try, electronic industry and various other industries. The water extraction by these companies more or less has influence on the ecosystems of GHSNP (GHSNP 2007c).
Nevertheless, one fundamental problem in conservation area is that not all potentials are economically valued (Emerton et al. 2006). For example, water-shed use has not been charged with an appropriate value. In GHSNP, 25 com-
-
1
2
3
4
5
6
7
8
9
2009 2010 2011
Reve
nu
e (
Ru
pia
h)
Bill
ion
s
All NPs
GHSNP

35
panies extract water from the area of the park with a total investment reaches 79 billion rupiah and capacity of production more than 700 million rupiah (Appendix 3). Taking an example from Fondo para la protección del Agua (FONAG), The Fund for the Protection of Water in Ecuador, the park could build a commitment between those companies to provide 1% of water sales on a monthly basis to support the park‟s program (Chiramba et al. 2011).
5.5 Developing Financing Strategy towards a Self-financed National Park
It is clearly explained in the previous sections that government budget do not sufficient to cover all the need of NPs in Indonesia (Figure 8). The main prob-lem in financing biodiversity conservation is not only to find additional finance but also to identify the most suitable and equitable economic instruments (McNeely and Weatherly 1996:30). Towards financially independent, NPs‟ fi-nancing strategy should not only to rely on one source, but also to search for alternative sources of fund.
After identifying all of the potential sources for sustainable park financing, it is important for the parks to integrate them in the planning system. IUCN (Emerton et al. 2006) suggest PA managers to create a financial tools and mechanism to enhance the capacity in using the funding. Moreover, it is af-firmed that this plan should identify how much money is needed for each ac-tivity, and locates the most appropriate funding source in short, medium and long-term plan.
NPs should develop business plan that accommodates the interest of businesses including investors and public (Putro et al. 2012) so that a good business plan could be used as the communication tool between parks manager and the stakeholders. Some NP models in Indonesia including GHSNP has developed business plans which demonstrate their priority setting on the fund-ing needs (GHSNP 2010a). As what has been encouraged by MoFs in the des-ignation of NP models, the mechanism to collect revenue coming from the parks and to use it for its management activities should be clearly described in the business plan (Departemen Kehutanan 2006).
Overall, ecotourism revenue is the most common source of funding for the parks, while public service agency is the expected form of institution to manage the fund independently (Departemen Kehutanan 2006). However, the findings of this paper suggest NPs not to focus on ecotourism but more em-phasized on the potentials of each park. In GHSNP for example, ecotourism activities might not give much contribution to the park‟s revenue to finance their programs. At the same time, developing a public service agency solely would not optimize the use of all the potential sources. Previous research iden-tified that, with a moderate to potentially advance ecotourism activity, it is more suitable for the park to apply a trust fund mechanism (GHSNP 2010a).
The idea to establish a trust fund mechanism in GHSNP has been raised since 2003 which are mainly focused for conserving three endangered species living in the park (GHSNP 2010a). The scheme of this trust fund was formally stated in the Endangered Species Conservation Action Plan in GHSNP. In

36
2007, the idea of trust fund was also proposed and included in the park‟s man-agement plan as well as in its strategic plan (GHSNP 2007a).
In 2009, GHSNP develop a business plan as one of the steps in achieving the aims of NP model. A comprehensive scheme of GHSNP as a public ser-vice agency which is incorporated with trust fund mechanism was proposed (Figure 13). This scheme is actually a summary of all the potential funding sources in GHSNP which could support the park to be self-financed. So far, the findings of this paper consistent with the proposed financing mechanism in GHSNP.
Figure 13
Proposed Scheme of Public Service Agency in GHSNP
Source: GHSNP 2010a
In addition, a business plan developed in KMNP shows more or less simi-lar concept with that of GHSNP. The KMNP financing mechanism involved a trust fund institution to optimize the management of funding coming from several sources. The park estimates the funding required for establishing the system reaches about 24 billion rupiah every year, starting from 2010 until 2014. Furthermore, the plan was divided into two stages, the short-term and long-term financing strategy. The short-term business strategy involves gov-ernment budget and private donors. The long-term plan combines the short-term financing, and the expected profit coming from selling goods and services produced by the park (BTNKM 2009).
Spending Public Service Board – GHSNP
Public services
Park area management
Estimation source of income in GHSNP as investment:
Government budget
Entrance fee for ecotourism
Alternative income from user fee for environmental services e.g water, carbon trade.
Profit: Financial
Cash flow
Conservation Trust Fund
Cooperation program with: Local government (District Sukabumi), Private companies (Antam, Chevron, PLN, Tirta Investama Aqua), collaborative institutions (Suakaelang, Gedepahala), others (CIFOR, Islamic Boarding Schools)
Income
Benefit: Environmental services: clean water and air

37
So far, conservation area managers put their main focus to gain more funds, but do not call for the contribution of stakeholders to share the burden cost of conservation (Emerton et al. 2006:52). The mechanism proposed in the scheme of trust fund seems to accommodate this matter.
5.6 Conclusion
To sum up, the current financing of NPs shows that there is an increasing trend of government financial support, but still it is not adequate. The gaps between the amount needed and the fund received fluctuates in the last seven years. Even though government budget is the largest and long-term financial source for NPs, it is not allocated in timely manner and not prioritized for park conservation. Low proportion of the budget compared to total government expenditure and GDP, as well as the risk that government might shift their concern on other program, become the evidences.
Indonesia‟s NPs have a lot of potential funding sources to complement government budget such as ecotourism revenue, watershed services fees, dona-tion and partnerships. GHSNP and KNP are two parks that could manage to fill their financial gaps through cooperation programs and partnership. Yet to reach a self-financed NP, each needs to consider its own economic potentials and find an appropriate strategy to manage it by developing a business plan. Finally, trust fund mechanism is found to be an option for the parks to ac-commodate its economic potentials, to achieve the goal to be financially inde-pendent from the government.

38
Chapter 6 Conclusion and Policy Implications
The objective of this research is to look at the financing mechanism in conservation of national parks in Indonesia, and see potentials to support for its sustainability.
The paper started by an overview of NP management in Indonesia. The NPs were contextualized to show that the focus of this study is about promot-ing self-financed parks in Indonesia. By assigning 21 NP models, Indonesian government expects to push forward the parks to become financially inde-pendent from government support (Departemen Kehutanan 2006). The reason behind it concerns with current conditions where the number of conservation area is increasing. At the same time, the limited government budget might be reduced in order to give more balance budget for the new units or new areas (Hartono 2008).
The literature review suggests that sustainable conservation finance should provide an adequate amount of funds, and available for long-term purpose. Current global trend prompt extensive financing efforts to search for alterna-tive funding sources from ecotourism, partnerships, and environmental ser-vices need be developed. However, the chapter highlighted Castro (2003)‟s view that the final goal of PAs sustainable financing is to make them financially independent. Additionally, it should not be interpreted based on the amount of funds, but also to manage it appropriately (Emerton et al. 2006). Therefore, an innovative funding mechanism such as trust fund could be an alternative.
The findings of the study show that government budget is still the core of parks financing source. Nevertheless, parks managers need to ensure that these funds are secure, as nowadays conservation has to compete with other pro-grams such as poverty alleviation and economic development (Emerton et al. 2006). It is found that the increase numbers of NP do not necessarily cause a decrease in government funding. Meanwhile, the increase in government ex-penditure for conservation is related to intensive encouragements of interna-tional organisations to Indonesian forestry since 1992. Additionally, (Ibid. 2006) assert that increasing funding of PAs is an obligation as countries ratify the international agreements.
Government budget do not adequate to support the parks, which is prov-en by the fluctuating financial gaps in GHSNP during 2005-2011. Even though government budget is the largest and long-term financial source for NPs, it is not allocated in timely manner and not prioritized for park conservation. Moreover, low proportion of the budget compared to total government ex-penditure and GDP, as well as the risk that government might shift their con-cern on other program, become evidences.
The research found that financial gaps were augmented through develop-ing a diverse source of funds, such as ecotourism revenue, watershed services fees, donation and partnerships. The experiences of GHSNP and KNP are evidences that inadequate government budget can be filled through coopera-tion programs and partnership. Nevertheless, in-depth reasoning needs to be found to apply a financing mechanism. Each park needs to consider its own

39
economic potentials and find an appropriate strategy to manage it by develop-ing a business plan.
As a result, trust fund mechanism is found to be an option for the parks to accommodate its economic potentials, to achieve the goal of self-financed NPs. Previous research in GHSNP identified that with a moderate to poten-tially advance ecotourism activity, GHSNP is more suitable to apply a trust fund mechanism (GHSNP 2010a). This mechanism is actually a summary of all the potential funding sources in GHSNP which could support the park to be self-financed.
Overall, this study found that the nature of government financing system in Indonesia hinder the sustainable financing of the parks. The increasing trend of government budget allocations does not necessarily support for park‟s effec-tiveness and efficiency use of funds. At the same time, government policy to address the problem of parks financial gaps was directed to promote them to be financially self-sustain. Indeed, there is a tendency of Indonesian government to shift the priority towards poverty alleviation and economic development, by promoting self-financed NPs (Bappenas 2011, EU 2004). While the subsequent policy has not been taken, local initiatives indicate to in-crease park‟s performance. Therefore the following policy suggestion would worthwhile to achieve the final goal of sustainable NPs financing.
The new breakthroughs in NP management in Indonesia should be con-tinued to be supported. Initiatives both in local and national level need to be enhanced through augmenting the existing financial system. The on-going pro-ject to direct NPs towards self-financed institutions requires a combination of policy reform and appropriate economic instruments. As current market has potentials to support the competitiveness of goods and services produced by the parks, it is a chance to be explored in more advance ways. It would seem reasonable to start with policy options and financing instruments which ac-commodate all the potentials, strength, and weaknesses of each park.

40
References
Bappenas (2011) 'Sustaining Partnership', Edisi Khusus Konektivits Nasional 2011 .
Barr, C., A. Dermawan, H. Purnomo, and H. Komarudin (2010) Financial Govern-ance and Indonesia’s Reforestation Fund during the Soeharto and Post-Soeharto Periods, 1989–2009: A Political Economic Analysis of Lessons for REDD+. Vol. Occasion-al Paper 52. Bogor: CIFOR.
Bayon, R., J.S. Lovink, W.J. Veening (2000) 'Financing Biodiversity Conservation'. Washington, DC: Inter-American Development Bank, Sustainable Develop-ment Department.
Bruner, A.G., R.E. Gullison and A. Balmford (2004) 'Financial Costs and Short-falls of Managing and Expanding Protected-Area Systems in Developing Countries', Bioscience 54(12): 1119-1126.
BTNKM (2009) Rencana Bisnis (Business Plan) Taman Nasional Kayan Mentarang Kali-mantan Timur. Malinau, Kalimantan Timur: Balai Taman Nasional Kayan Mentarang (BTNKM).
Castro, G. (2003) 'Conservation Finance: The Long Road to Sustainability', Presen-tation to the Sustainable .
CBD (2004) 'Expanded Programme of Work on Forest Biological Diversity'. Can-ada: Secretariat of the Convention on Biological Diversity.
CFA (2008) 'Rapid Review of Conservation Trust Funds', Prepared for the CFA Working Group on Environmental Funds by Barry Spergel and Philippe Taieb.Conservation Finance Alliance.
Chape, S., J. Harrison, M. Spalding and I. Lysenko (2005) 'Measuring the Extent and Effectiveness of Protected Areas as an Indicator for Meeting Global Bi-odiversity Targets', Philosophical Transactions of the Royal Society B: Biological Scienc-es 360(1454): 443-455.
Chiramba, T., S. Mogoi, I. Martinez, T. Jones (2011) 'FONAG- The Fund for the Protection of Water, Ecuador', Water in The Green Economy in Practice: Towards Rio+20, 3-5 October 2011. UN- Water International Conference.
De Mast, J. and A. Trip (2007) 'Exploratory Data Analysis in Quality-Improvement Projects', Journal of Quality Technology 39(4): 301-311.
Departemen Kehutanan (2009) 'Eksekutif Data Strategis Kehutanan 2009 (Execu-tive Strategic Forestry Data 2009)'. Jakarta: Departemen Kehutanan.
Departemen Kehutanan (2007) 'Departemen Kehutanan Menetapkan Lima Ta-man Nasional Baru (the Ministry of Forestry Designated Five New National Parks)' (a webpage of Departemen Kehutanan). Accessed 10 June 2012
<http://www.dephut.go.id/index.php?q=id/node/1719>.

41
Departemen Kehutanan (2006) Mengenal 21 Taman Nasional Model Di Indonesia (Ac-quaint 21 National Park Models in Indonesia). Departemen Kehutanan, Direktorat Jenderal perlindungan Hutan dan Konservasi Alam.
Departemen Keuangan (2009) 'Sistem Penganggaran: Anggaran Berbasis Kinerja (Budgeting System: Performance-Based Budgeting)' (a webpage of Direktorat Jenderal Anggaran, Departemen Keuangan). Accessed 13 June 2012
<http://www.anggaran.depkeu.go.id/web-print-list.asp?ContentId=628>.
Dudley, N. (2009) Guidelines for Applying Protected Area Management Categories. World Conservation Union.
Emerton, L., J. Bishop and L. Thomas (2006) Sustainable Financing of Protected Areas: A Global Review of Challenges and Options. Vol. 13. World Conservation Union.
EU (2004) 'European Commission Report on Millennium Development Goals 2000-2004'. Brussel: European Commission, Directorate-General Develop-ment.
FAO (2010) 'Global Forest Resource Assessment 2010'. Rome: Food And Agri-culture Organization of The United Nations.
GEF (1998) 'GEF Evaluation of Experience with Conservation Trust Funds'. Washington, DC: Global Environmental Facility Council.
GHSNP (2010b) 'Laporan Tahunan TNGHS 2010 (Annual Reports GHSNP 2010)'. Sukabumi: GHSNP.
GHSNP (2010a) 'Rencana Strategi Bisnis TNGHS (Strategic Business Plan GHSNP)'. Sukabumi: Gunung Halimun Salak National Park.
GHSNP (2008) 'Laporan Monitoring Elang Jawa (Spizaetus Bartelsi) Di Jalur SUTET 2008 (Report on Monitoring Javan-Hawk Eagle (Spizaetus Bartelsi) in Jalur SUTET 2008)'. Sukabumi: GHSNP.
GHSNP (2007c) 'Laporan Survey Potensi Sumberdaya Air Di TNGHS (Survey Report on Water Resources in GHSNP)'. Sukabumi: GHSNP.
GHSNP (2007b) 'Laporan Monitoring Elang Jawa (Spizaetus Bartelsi) Di Jalur SUTET 2007 (Report on Monitoring Javan-Hawk Eagle (Spizaetus Bartelsi) in Jalur SUTET 2007)'. Sukabumi: GHSNP.
GHSNP (2007a) 'Rencana Pengelolaan Taman Nasional Gunung Halimun Salak 2007-2026 (Management Plan of Gunung Halimun Salak National Park 2007-2026)'. Sukabumi: GHSNP.
GIZ FORCLIME (2009) 'Sustainable Park Financing' (a webpage of GIZ FORCLIME). Accessed 25 July 2012
<http://www.forclime.org/images/stories/documents/Kayan_Mentarang/Br
iefing_paper_No._9_-_Sustainable_Finance.pdf>.

42
Hartono (2008) 'Taman Nasional Mandiri: Telaah Singkat kemungkinan Pemben-tukannya (Independent National Park: A Review of the Establishment)', Sem-inar Lustrum IX 2008 Fakultas Kehutanan UGM, 6-8 November 2008. Fakultas Kehutanan UGM.
Holopainen, J., M. Wit, J. Holopainen and M. Wit (2008) Financing Sustainable Forest Management. European tropical forest research network (ETFRN).
Johns, T., F. Merry, C. Stickler, D. Nepstad, N. Laporte and S. Goetz (2008) 'A Three-Fund Approach to Incorporating Government, Public and Private Forest Stewards into a REDD Funding Mechanism', International Forestry Re-view : 458-464.
Kementerian Kehutanan (2010b) Buku Statistik Direktorat Pemanfaatan Jasa Ling-kungan Kawasan Konservasi Dan Hutan Lindung (Statistical Book of Directorate Envi-ronmental Service Utilization Protected Area and Forest Protection). Bogor: PJLK2HL Kementerian Kehutanan.
Kementerian Kehutanan (2010a) 'Statistik Departemen Kehutanan 2010 (Statistics of Forestry 2010)'. Jakarta: Kementerian Kehutanan Republik Indonesia.
Kementerian Keuangan (2012) 'Pendapatan Negara Bukan Pajak (PNBP) Sektor Kehutanan (Non-Tax Government Revenue from Forestry Sector)' (a webpage of Kementerian Keuangan). Accessed 17 July 2012
<http://www.fiskal.depkeu.go.id/2010/edef-konten-
view.asp?id=20120629155346726712012>.
Kumar, H. (1999) Biodiversity and Sustainable Conservation. Science Publishers, Inc.
Mankiw, N.G. (2011) Principles of Economics. South-Western Pub.
McNeely, J.A. (1997) 'Achieving Financial Sustainability in Biodiversity Conserva-tion Programs', Investing in Biodiversity Conservation : 9.
McNeely, J.A. and W.P. Weatherly (1996) 'Innovative Funding to Support Biodi-versity Conservation', International Journal of Social Economics 23(4/5/6): 98-124.
Moye, M. and S. Nazerali (2010) 'Feasibility Study: Sustainable Financing of Pro-tected Areas in Mozambique'.
NIST/SEMATHECH (2003) 'E-Handbook of Statistical Methods' (a webpage of NIST/SEMATHECH). Accessed 17 March 2012
<http://www.itl.nist.gov/div898/handbook>.
Novra, A. (2007) 'Dampak Alokasi Pengeluaran Pemerintah Daerah Terhadap De-forestasi Kawasan Dan Degradasi Taman Nasional Kerinci Seblat (the Impact of the Local Government Expenditure on the Regional Deforestation and Kerinci Seblat National Park Degradation)', Bogor: Bogor Agricultural Uni-versity.

43
Oleas, R. and L. Barragán (2003) 'Environmental Funds as a Mechanism for Con-servation and Sustainable Development in Latin America and the Caribbean', Unpublished paper .
Putro, H.R., Supriatin, A. Sunkar, D. Rossanda, and E.R.Prihatini (2012) Collabora-tive Management of National Parks in Indonesia. (1st edn) Bogor: JICA-CFET.
Riphat, S. (2011) Isu-Isu Pendanaan Publik Kehutanan, REDD+, Dan Implikasi Kebijakan (Issues on Pubic Finance in Forestry, REDD+, and the Policy Im-plications). Policy Paper edn. Jakarta: Badan Kebijakan Fiskal, Kementerian Keuangan RI.
Schuyt, K. (2005) 'Forest Restoration in Landscapes; Opportunities for Long-Term Financing of Forest Restoration in Landscapes', Biomedical and Life Sci-ences Part B, DOI: 10.1007/0-387-29112-1_22: 161-165.
Supriyanto, B., S. Mulyati (2010). Approaches to the Development of Demonstra-tion Activities REDD+ in Protected Areas: Case Study in Gunung Halimun Salak National Park (GHSNP), West Java, Indonesia. Paper edn. Sukabumi: GHSNP.
Tomaselli, I. (2006) 'Brief study on funding and finance for forestry and forest-based sector', Final Report to the United Nations Forum on Forests Secretar-iat, United Nations, New York, .
Tukey, J.W. (1977) 'Exploratory Data Analysis', Reading, MA .
UN (1992) 'United Nations Framework Convention on Climate Change'United Nations.
Verweij, P.A. and M. de Man (2005) 'We Cannot Afford More Biodiversity Loss', The urgency of protected area financing, Greenpeace International (ed).Utrecht University-Copernicus Institute for Sustainable Development and Innovation, Amsterdam/The Neth-erlands .
World Bank (2006) Sustaining Indonesia's Forests: Strategy for the World Bank, 2006-2009. World Bank Indonesia Office, Jakarta.
WWF (2009) Guide to Conservation Finance: Sustainable Financing for the Planet. Wash-ington, DC: World Wildlife Fund, Inc.
WWF (2008) 'Zero Net Deforestation by 2020 (Working Paper)' (a webpage of World Wildlife Fund, Inc). Accessed 18 June 2012
<http://awsassets.panda.org/downloads/wwf_2020_zero_net_deforest_brie
f.pdf>.
Yuwono, A. (2010) 'Membangun Model Taman Nasional Di Jantung Borneo (De-veloping a National Park Model in the Heart of Borneo)' (a webpage of Be-tung Kerihun National Park). Accessed 26 March 2012
<http://buletinbetungkerihun.wordpress.com/2010/11/11/membangun-
model-taman-nasional-di-jantung-borneo/>.

44
Appendices
Appendix 1 Other Fund Reaching to GHSNP Area under Cooperation Program Scheme
No Donor Program Budget (Rp) Time
1 JICA GHSNPMP (Gunung Halimun Salak National Park Management Project)
Database management, park management plan, research and monitoring endangered species, community development, envi-ronmental education and eco-tourism, capacity building
Rp 282,351,000
In total.
2004-2009
2 Local government; District Sukabumi
Community development for farmers group in adjacent area of GHSNP
Rp. 99 million/ vil-lage/year for 24 villages in 3 years.
2007-2010
3 Chevron Ltd through Raptor sanctuary (consists of 11 organiza-tions)
Establishment of 'Raptor Sanc-tuary' as Centre for Education and Conservation of Javan-hawk Eagle, raptor adoption, release raptor, raptor conservation.
Rp 2 billion 2007-2010
4 Private Company: PLN (Rp 9.4 bil-lion))
A-5-year cooperation, local community economic develop-ment, capacity building both for national park staff and local people, park protection.
Rp 9.4 billion 2007-2011
5 Private Company: Antam (Rp 2.5 billion)
A-5-year cooperation, local community economic develop-ment, capacity building for na-tional park staff and local peo-ple, park protection.
Rp 2.5 billion 2007-2011
Source: The author’s own illustration based on GHSNP reports.

45
Appendix 2 GHSNP Achievement on Targeted Plan using Annual Government Budget 2010
Indicator Target Achievement Proportion of achievement
Forest patrol 73 reports 73 reports 100
Number of coordination by rangers to the stakeholders 168 times 168 times 100
PPNS, KTA 1 unit 1 unit 100
Number of illegal activities sent to the courts 1 time 1 time 100
Training on musketry 1 time 0 0
Forest fire management 3 species 3 species 100
Number of wildlife monitoring survey 9 sets 9 sets 100
Number of permanent plot for plants 1 plot 1 plot 100
Progress report of Raptor Sanctuary 1 report 1 report 100
Master plan of establishment of GHSNP as the center for Asian Biodiversity
1 document 1 document 100
Increase in non-tax revenue compare to 2010
20% 12% 60
Number of tourism objects 3 locations 3 locations 100
Number of volunteer* for tourism object 30 people 45 people 100
Number of conservation cadre 50 people 90 people 180
Information and promotion materials (leaflet, booklet, poster)
5000 units 5000 units 100
Number of forest patrol 27 times 43 times 159
Number of coordination by rangers to the stakeholders
12 months 12 months 100
Number of illegal activities sent to the courts 12 cases 12 cases 100
Number of Conservation Kampong Model 6 kampong 6 kampong 100
Number of partnership and collaboration with private organizations 10 organizations 10 organizations 100
Signature of MoU with stakeholders 3 MoU 0 0
Fulfillment of salaries and operational office 12 months 12 months 100
Number of staff involved in trainings 20 orang 17 Orang 85
Number of on the job capacity building 12 months 12 months 100
Number of planning and evaluation docu-ment 3 documents 3 documents 100
Source: GHSNP 2010b.

46
Appendix 3 Water Industries Operating Nearby GHSNP 2007
No Company Location
Production
Capacity
(Rupiah)
Investment
(Rupiah)
A. PDAM SUKABUMI JL. CIREUNDEU NO. 5 CIBADAK
9.020.160.000 -
B. KECAMATAN CICURUG
1. PT. AQUA GOLDEN MISSISIPI
DS. MEKARSARI 400.000.000 27.000.000.000
2. PT. TIRTAMAS MEGAH DS. NYANGKOWEK - 4.500.000.000
3. PT. ADES ALFINDO PUTRA SETIA
DS. BENDA - 6.260.090.000
4. PT. AIR GUNUNG SALAK DS. TENJO JAYA 10.000.000 1.000. 000.000
Subtotal 410. 000.000 38.760.090.000
C. KECAMATAN PARAKAN SALAK
1. PT. ANNISA RISAN UTAMA SEJAHTERA
DS. BOJONGASIH 15. 000.000 797.000.000
2. PT. PANCA PALMA TIRTA DS. MANGLAS - -
3. PT. DIMAS SEJAHTERA KP. CIKAREO 16.800.000 400.000.000
4. PT. CATUR SURYA GEMILANG
KP. CIKAWUNG DS. SUKATANI
26.880.000 600.000.000
Subtotal 58.680.000 1.797.000.000
D. PARUNGKUDA
1. PRANIDA MULIA UTAMA DS. BABAKAN JAYA - 2.658.655.000
2. PT. GIRI SALAK INDAH DS PONDOKASO ANDEUH
- 420.000.000
3. PT. MUSTIKA SANTRI DS. KOMPA - 359.670.000
Subtotal - 3.438.325.000
E. KECAMATAN CIDAHU
1. PT. TIRTA BABAKANPARI DS. BABAKANPARI 40.000.000 4.000.000.000
2. PT. ADES ALFINDO PUTRA SETIA
KP. KERENCENG DS. PONDOK KASO TENGAH
100.000.000 7.355.700.000
3. PT. AGRAWIRA TIRTA MITRA
DS. BABAKANPARI - 4.000.000.000
4. PT. MOYA ZAMZAMI UTAMA
DS. PASAWAHAN - 3.762.500.000
5. PT. TANG MAS DS. BOJONGSARI - 2.500.000.000
6. PT. TIRTA FOOD ARITAMA
DS. PASIRDOTON - 2.500.000.000
7. PT. TIGA RAKSA SATRIA (PT AIRES MEGA UTAMA)
DS. PASIRDOTON - 2.000.000.000
8. PT. EQUILINDO ASRI DS. CIMALATI - -

47
No Company Location Production
Capacity (Rupiah)
Investment (Rupiah)
9. PT. CISALADA JAYA TIRTATAMA
DS. JAYABAKTI - 1.200.000.000
10. PT. ALFAHAGRINER DS. JAYABAKTI 10.000.000 375.000.000
11. PT. BAKSOMAS SUGIHARTO PACIFIC
KP. KERENCENG DS. PONDOK KASO TENGAH
32.000.000 1.800.000.000
12. PT. SUBUR TIRTA SEJUK KP. KERENCENG DS. PONDOK KASO TENGAH
50.000.000 5.292.465.000
Subtotal 232.000.000 34.785.665.000
F. KECAMATAN KADUDAMPIT
1. KOPONTREN AT TIJAARAAH
KP. WINDUSARI RT.01/01 DS. CITAMIANG
10.000.000 250.000.000
Subtotal 10.000.000 250.000.000
TOTAL 710.680.000 79.031.080.000
Source: GHSNP 2007c.