Embed Size (px)
Citation preview
Financing Pathways for Students and Community Colleges
A State Policy White Paper

2
October 2018
By Nate Johnson
3
JFF is a national nonprofit that drives transformation in the American workforce and education systems. For 35 years, JFF has led the way in designing innovative and scalable solutions that create access to economic advancement for all. Join us as we build a future that works. www.jff.org.
4
ABOUT THE AUTHOR
Nate Johnson is the founder and principal consultant of Postsecondary Analytics in Tallahassee, Florida. He consults on higher education finance and student success issues for state governments, colleges and universities, and nonprofit organizations. Among his recent projects was "Understanding Higher Education Finance", supported by the Bill & Melinda Gates Foundation, which examines the connections between funding and low-income student success. Prior to becoming a full-time consultant, he worked in several research and policy-related positions at the state and institutional level in Florida. He has a Ph.D. in English from Cornell University, a bachelor’s from Whitman College and a GED from Walla Walla Community College.
ACKNOWLEDGEMENTS
JFF would like to thank the following members of the Policy Leadership Trust for Student Success for reviewing this paper: Julie Alexander, vice provost, Miami Dade College; Lisa Chapman, senior vice president and chief academic officer, North Carolina Community College System; Jack Hershey, president, Ohio Association of Community Colleges; and Randall VanWagoner, president, Mohawk Valley Community College. Special thanks to the Bill and Melinda Gates Foundation. Additional reviewers included Christopher Baldwin, principal, Baldwin Consulting Services, LLC, and the following JFF staff members: Lexi Barrett, senior director, national education policy; and Erica Cuevas, policy manager. JFF communications team provided editorial and design support. Becky Eidelman, program associate, and Julita Bailey Vasco, program manager, provided project management support. Michael Collins, vice president, provided strategic guidance. David Altstadt, assistant director, served as project lead and editor of the four-paper series.
5
TABLE OF CONTENTS
PREFACE ........................................................................................................................ 6
INTRODUCTION ............................................................................................................. 7
HOW COMMUNITY COLLEGES ARE FUNDED ........................................................... 8
CHALLENGE 1: IMPROVING THE ALIGNMENT OF FINANCE WITH PATHWAYS ................................................................................. 13
RECOMMENDATION 1: CHANGE PUBLIC FUNDING TO (A DIFFERENT KIND OF) OUTCOMES-BASED OR OTHER ALTERNATIVE MECHANISM ................................ 15
RECOMMENDATION 2: REFORM TUITION AND FINANCIAL AID ............................ 17
CHALLENGE 2: IMPROVING THE TIMING OF PATHWAY FINANCE .................................................................................................... 20
RECOMMENDATION 3: SHIFT ALL OR A SIGNIFICANT AMOUNT OF STATE AND LOCAL COMMUNITY COLLEGE FUNDING TO PAYROLL OR CORPORATE TAX SYSTEMS .............................................................................................................. 22
CHALLENGE 3: INCREASING THE QUANTITY OF PATHWAY FINANCE .............................................................................................. 26
RECOMMENDATION 4: FIX HIGHER ED PHILANTHROPY ....................................... 27
RECOMMENDATION 5: FOCUS ON TAX POLICY ...................................................... 28
CONCLUSION ............................................................................................................... 33
ENDNOTES ................................................................................................................... 34
6
PREFACE
Financing Pathways for Students and Community Colleges is part of a four-paper series that explores a variety of state policy approaches for dramatically increasing community college completion rates and building a competitive workforce. The series emphasizes the role of state policy in creating the conditions, incentives, and structures needed to forge seamless, affordable pathways to credentials and careers for all students – especially those who are underprepared and underserved. All told, the papers offer policy recommendations for reshaping how states measure student success, fund public 2-year institutions, strengthen alignment across K-12 and postsecondary systems, and support students along their paths.
Said differently, the papers focus on metrics, money, and systems integration. These three pillars reflect the collective vision of JFF’s Policy Leadership Trust for Student Success (the “Trust”) for what ought to be the primary focus of policymakers concerned with college completion. Established by JFF in 2015, the Trust comprises two-dozen community college presidents and state system leaders who together cull their institutional knowledge and the latest evidence to consider how policy can best catalyze change in higher education and improve student success. In 2017, the group released a set of policy design principles and priorities to represent their core tenets1.
JFF commissioned this paper series to delve more deeply into the Trust’s priority issues. The goal is to stimulate discussion and consideration among practitioners and policy influencers, alike.
Thank you for reading,
David Altstadt Associate Director, JFF
7
INTRODUCTION Imagine starting a new community college that will do everything right. It will have instructional programs that fit perfectly with the needs of both students and employers in its area. It will implement the best, research-based practices in advising, scheduling, career counseling, financial aid administration, and other support services. It will hire and retain highly qualified faculty, administrators, and support staff who will work in physical facilities perfectly suited to its curriculum. It will blend state-of-the-art technology with high-touch instruction in ways that maximize students’ capacity to learn. It will integrate with other services in the community to support students’ housing, nutritional, transportation, health, and child care needs. All students will have pathways that are as efficient and effective as possible, from their first days on campus to their final outcomes, whether they are job offers, transfers to other institutions, or the fulfillment of personal educational goals.
This paper takes as its starting point the premise that we already know much of what needs to be done and have good examples of programs that work for students, communities, and employers. The “pathway” framework encompasses many of those ideas, which have in common a focus on integrating services and programs into more coordinated offerings that produce better results. Given that knowledge, then, the question is, how do we pay for those types of programs on the scale that states and the nation need? What does it mean to finance pathways, and what approaches to funding could states and institutions adopt?
After briefly reviewing the current landscape of community college finance, the remainder of this paper breaks the issue of “financing pathways” into three sections, each with examples and recommendations to address the following challenges:
• Challenge 1: Improving the alignment of financing with student pathways. • Challenge 2: Improving the timing of pathway financing. • Challenge 3: Increasing the quantity of pathway financing.
8
HOW COMMUNITY COLLEGES ARE FUNDED Table 1. FY 2016 Summary of Revenues of Public Two-Year Institutions
Total $
(billions)
Percentage of total
$ per FTE student (rounded)
$ per FTE student
Total revenues $55.50 100% $15,700 $15,710 Operating revenue
Tuition and fees 9.1 16% 2,600 2,562
Grants and contracts: Federal 1.6 3% 400 445
State 1.8 3% 500 504
Local and private
0.5 1% 100 143
Sales and services of auxiliary enterprises
1.6 3% 500 452
Other operating revenues 0.9 2% 200 246 Nonoperating revenue
Appropriations: Federal 0.0 0% 0 14
State 14.1 25% 4,000 3,993
Local 11.2 20% 3,200 3,158
Nonoperating grants: Federal 9.0 16% 2,500 2,536
State 1.8 3% 500 523
Local 0.2 0% 100 60
Gifts 0.3 1% 100 80
Investment return (gain or loss) 0.2 0% 0 44
Other nonoperating revenues 0.7 1% 200 212 Other revenues and additions
Capital appropriations 1.7 3% 500 487
Capital grants and gifts 0.3 1% 100 85
Additions to permanent endowments
0.0 0% 0 4
Other 0.6 1% 200 161
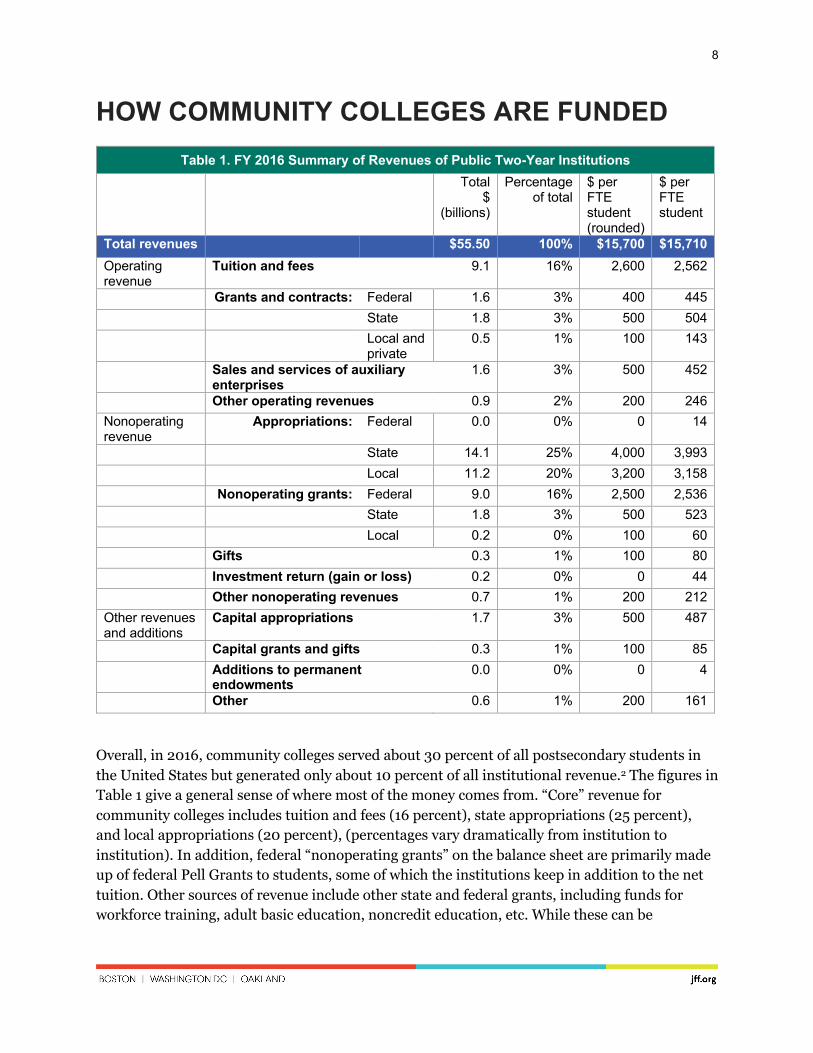
Overall, in 2016, community colleges served about 30 percent of all postsecondary students in the United States but generated only about 10 percent of all institutional revenue.2 The figures in Table 1 give a general sense of where most of the money comes from. “Core” revenue for community colleges includes tuition and fees (16 percent), state appropriations (25 percent), and local appropriations (20 percent), (percentages vary dramatically from institution to institution). In addition, federal “nonoperating grants” on the balance sheet are primarily made up of federal Pell Grants to students, some of which the institutions keep in addition to the net tuition. Other sources of revenue include other state and federal grants, including funds for workforce training, adult basic education, noncredit education, etc. While these can be
9
significant for some colleges, they do not approach the size of the “core” funding sources for purposes of addressing education needs at scale. These funds are also not necessarily available for instruction or support for students in credit-bearing courses, so the actual available revenue per full-time equivalent (FTE) student may be less than it appears.
These are national averages. They do not describe a “typical” community college, but reflect instead the variations in how colleges in different states (and sometimes the same state) are funded. Most colleges rely heavily on state support, with additional income from tuition and little or no local government funding. Local funding is heavily concentrated in a minority of states and institutions where it is the first or second most important type of support for colleges.
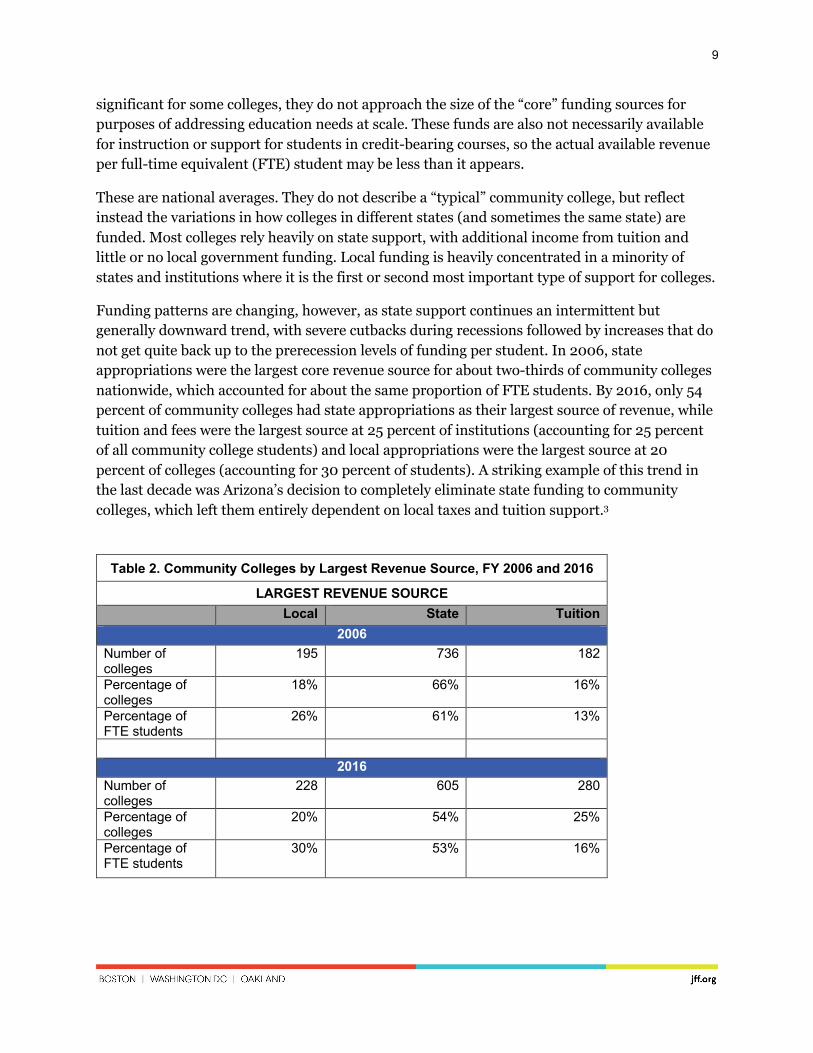
Funding patterns are changing, however, as state support continues an intermittent but generally downward trend, with severe cutbacks during recessions followed by increases that do not get quite back up to the prerecession levels of funding per student. In 2006, state appropriations were the largest core revenue source for about two-thirds of community colleges nationwide, which accounted for about the same proportion of FTE students. By 2016, only 54 percent of community colleges had state appropriations as their largest source of revenue, while tuition and fees were the largest source at 25 percent of institutions (accounting for 25 percent of all community college students) and local appropriations were the largest source at 20 percent of colleges (accounting for 30 percent of students). A striking example of this trend in the last decade was Arizona’s decision to completely eliminate state funding to community colleges, which left them entirely dependent on local taxes and tuition support.3
Table 2. Community Colleges by Largest Revenue Source, FY 2006 and 2016
LARGEST REVENUE SOURCE Local State Tuition
2006 Number of colleges
195 736 182
Percentage of colleges
18% 66% 16%
Percentage of FTE students
26% 61% 13%
2016
Number of colleges
228 605 280
Percentage of colleges
20% 54% 25%
Percentage of FTE students
30% 53% 16%
10
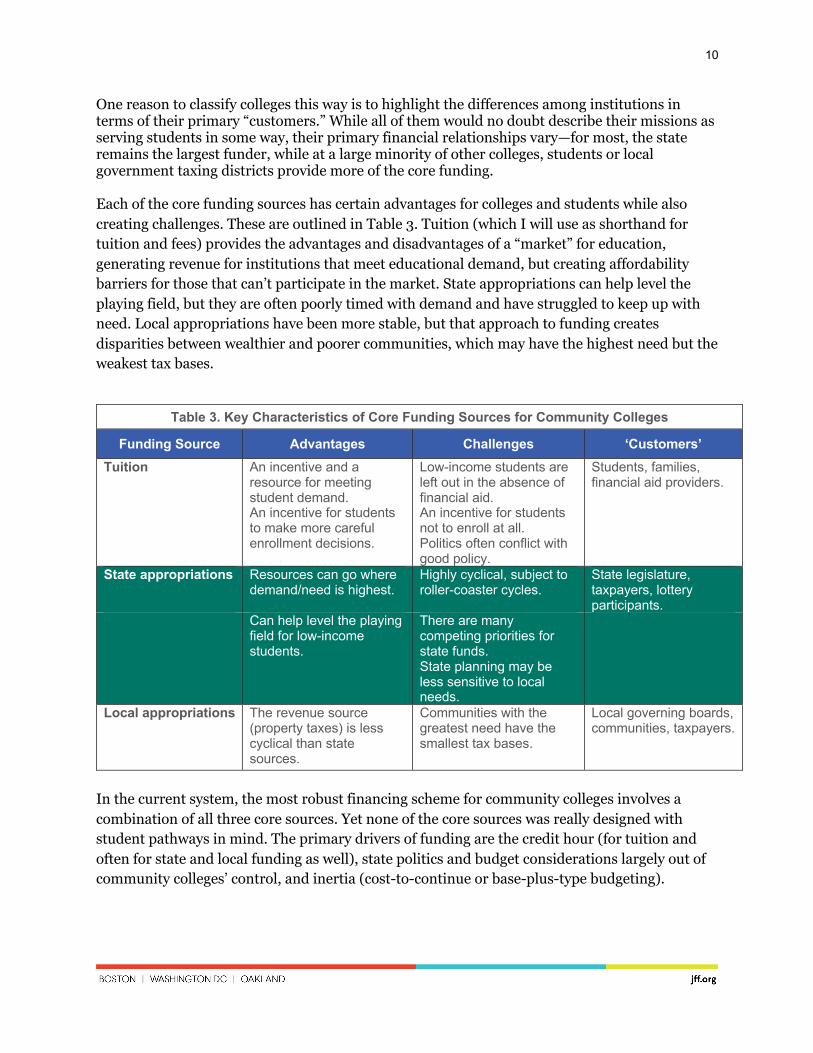
One reason to classify colleges this way is to highlight the differences among institutions in terms of their primary “customers.” While all of them would no doubt describe their missions as serving students in some way, their primary financial relationships vary—for most, the state remains the largest funder, while at a large minority of other colleges, students or local government taxing districts provide more of the core funding. Each of the core funding sources has certain advantages for colleges and students while also creating challenges. These are outlined in Table 3. Tuition (which I will use as shorthand for tuition and fees) provides the advantages and disadvantages of a “market” for education, generating revenue for institutions that meet educational demand, but creating affordability barriers for those that can’t participate in the market. State appropriations can help level the playing field, but they are often poorly timed with demand and have struggled to keep up with need. Local appropriations have been more stable, but that approach to funding creates disparities between wealthier and poorer communities, which may have the highest need but the weakest tax bases.
In the current system, the most robust financing scheme for community colleges involves a combination of all three core sources. Yet none of the core sources was really designed with student pathways in mind. The primary drivers of funding are the credit hour (for tuition and often for state and local funding as well), state politics and budget considerations largely out of community colleges’ control, and inertia (cost-to-continue or base-plus-type budgeting).
Table 3. Key Characteristics of Core Funding Sources for Community Colleges
Funding Source Advantages Challenges ‘Customers’ Tuition An incentive and a
resource for meeting student demand. An incentive for students to make more careful enrollment decisions.
Low-income students are left out in the absence of financial aid. An incentive for students not to enroll at all. Politics often conflict with good policy.
Students, families, financial aid providers.
State appropriations Resources can go where demand/need is highest.
Highly cyclical, subject to roller-coaster cycles.
State legislature, taxpayers, lottery participants.
Can help level the playing field for low-income students.
There are many competing priorities for state funds. State planning may be less sensitive to local needs.
Local appropriations The revenue source (property taxes) is less cyclical than state sources.
Communities with the greatest need have the smallest tax bases.
Local governing boards, communities, taxpayers.
11
State appropriations for community colleges
State regulatory and planning policies are important to every community college revenue source, but state appropriations have the most direct impact on colleges’ budgets. How much money a college receives in state appropriations varies immensely from state to state, but the amount is determined by three or four key inflection points, depending on the size and complexity of a state. The first two are typically in the province of high-level elected officials—the governor, the legislature—or the voters themselves. The second two vary in the extent of legislative versus administrative control.
First, the total amount of revenue available for all state spending depends on the size of the state’s economy, which is only partly under the control of policymakers, and the level of taxation, which is a matter of state policy. In some states (e.g. Colorado and California), voters have played a direct role in decisions about taxes.
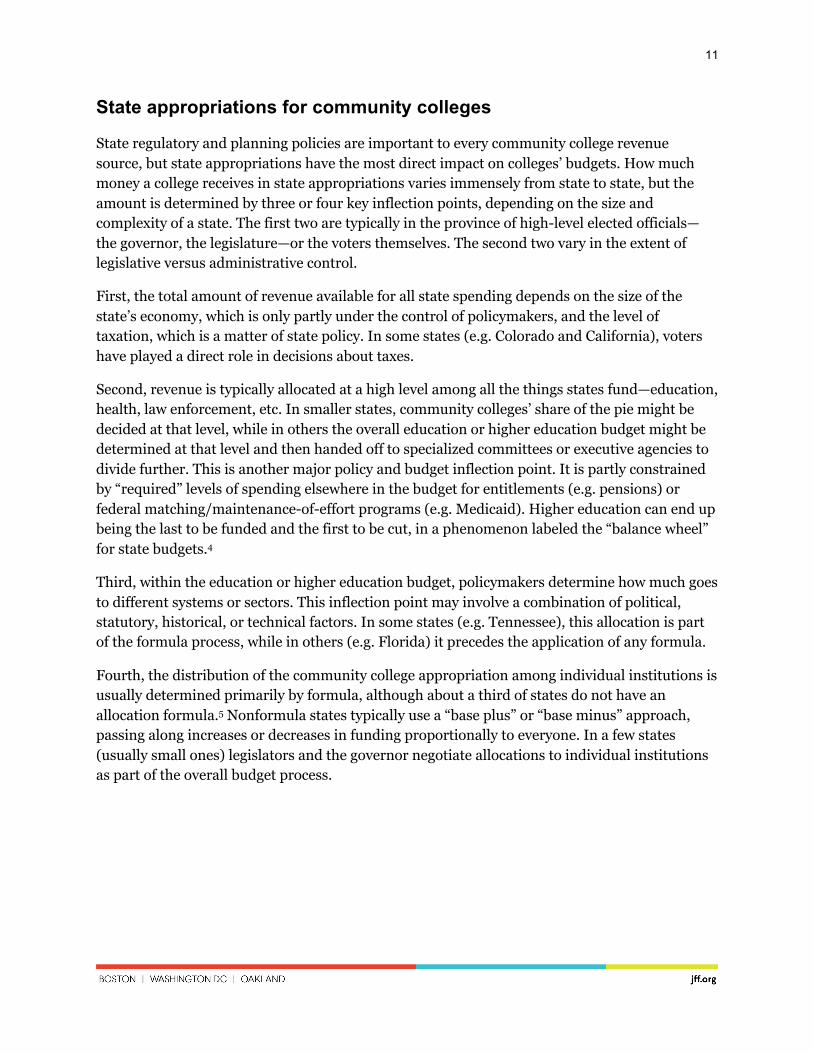
Second, revenue is typically allocated at a high level among all the things states fund—education, health, law enforcement, etc. In smaller states, community colleges’ share of the pie might be decided at that level, while in others the overall education or higher education budget might be determined at that level and then handed off to specialized committees or executive agencies to divide further. This is another major policy and budget inflection point. It is partly constrained by “required” levels of spending elsewhere in the budget for entitlements (e.g. pensions) or federal matching/maintenance-of-effort programs (e.g. Medicaid). Higher education can end up being the last to be funded and the first to be cut, in a phenomenon labeled the “balance wheel” for state budgets.4
Third, within the education or higher education budget, policymakers determine how much goes to different systems or sectors. This inflection point may involve a combination of political, statutory, historical, or technical factors. In some states (e.g. Tennessee), this allocation is part of the formula process, while in others (e.g. Florida) it precedes the application of any formula.
Fourth, the distribution of the community college appropriation among individual institutions is usually determined primarily by formula, although about a third of states do not have an allocation formula.5 Nonformula states typically use a “base plus” or “base minus” approach, passing along increases or decreases in funding proportionally to everyone. In a few states (usually small ones) legislators and the governor negotiate allocations to individual institutions as part of the overall budget process.
12
Total State Revenue
Other Priorities
Education
Other Sectors
Community Colleges College A
College B
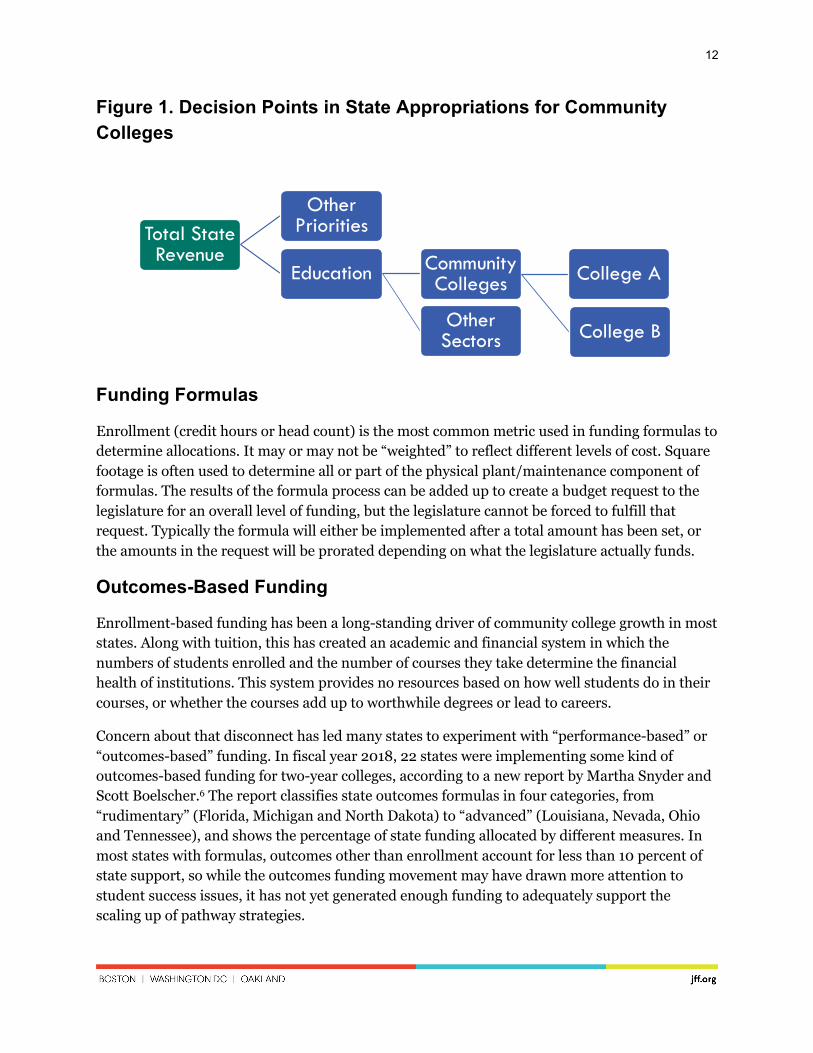
Figure 1. Decision Points in State Appropriations for Community Colleges
Funding Formulas
Enrollment (credit hours or head count) is the most common metric used in funding formulas to determine allocations. It may or may not be “weighted” to reflect different levels of cost. Square footage is often used to determine all or part of the physical plant/maintenance component of formulas. The results of the formula process can be added up to create a budget request to the legislature for an overall level of funding, but the legislature cannot be forced to fulfill that request. Typically the formula will either be implemented after a total amount has been set, or the amounts in the request will be prorated depending on what the legislature actually funds.
Outcomes-Based Funding
Enrollment-based funding has been a long-standing driver of community college growth in most states. Along with tuition, this has created an academic and financial system in which the numbers of students enrolled and the number of courses they take determine the financial health of institutions. This system provides no resources based on how well students do in their courses, or whether the courses add up to worthwhile degrees or lead to careers.
Concern about that disconnect has led many states to experiment with “performance-based” or “outcomes-based” funding. In fiscal year 2018, 22 states were implementing some kind of outcomes-based funding for two-year colleges, according to a new report by Martha Snyder and Scott Boelscher.6 The report classifies state outcomes formulas in four categories, from “rudimentary” (Florida, Michigan and North Dakota) to “advanced” (Louisiana, Nevada, Ohio and Tennessee), and shows the percentage of state funding allocated by different measures. In most states with formulas, outcomes other than enrollment account for less than 10 percent of state support, so while the outcomes funding movement may have drawn more attention to student success issues, it has not yet generated enough funding to adequately support the scaling up of pathway strategies.
13
CHALLENGE 1: IMPROVING THE ALIGNMENT OF FINANCE WITH PATHWAYS Under the current funding system, most components of strong student pathways are effectively unfunded “overhead” that must be paid for with money from a budget that was not designed with pathways in mind. Of all the elements of a pathway, it is usually only credit-bearing courses that generate revenue, while other academically important functions are considered to be overhead from a business point of view. Admission, orientation, advising, transfer, curriculum design, career placement, financial aid, and health and safety are among the critical components of integrated pathways that lack dedicated funding sources. In order for pathways to be practical on a large scale, their financing needs to be structured so that all components of the pathway have funding sources that will grow or shrink with the need. Institutions’ and students’ success in designing, implementing, and following pathways should result in financial success as well, but in the current system student success and fiscal stability are often disconnected or in conflict.
Tackling the challenge of finding new ways to finance pathways requires an understanding of the populations colleges serve, the full spectrum of costs faced by both students and institutions, and the gaps in resources available to serve those populations and meet total costs. Financial aid and state appropriations to community colleges cannot and should not do everything. Monetary support from families, employer funding, federal aid and tax benefits, and assistance from other education sectors and social services programs all need to be considered as part of integrated pathway financing. With a full picture of costs and resources, states can then determine where their investments fit best and whether financing pathways involves more resources dedicated to helping more students navigate existing paths (financial aid, tuition cuts) or focusing on improving pathways or creating new ones (institutional and cross-institutional capacity).
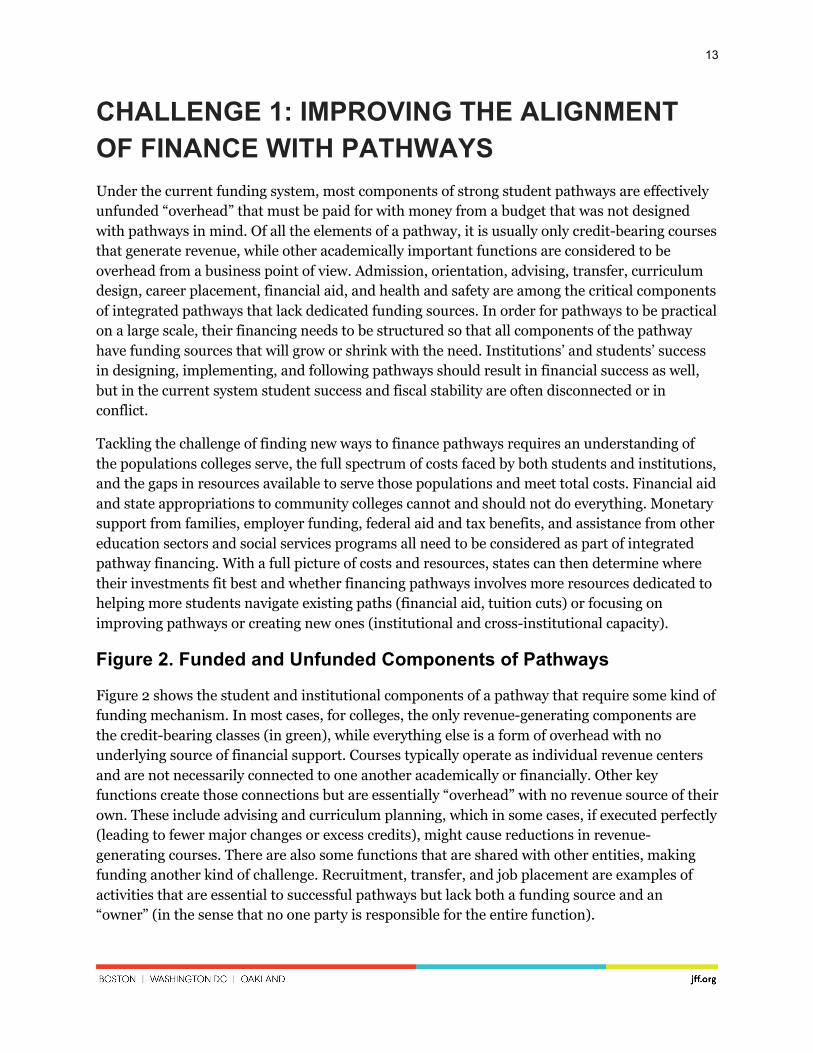
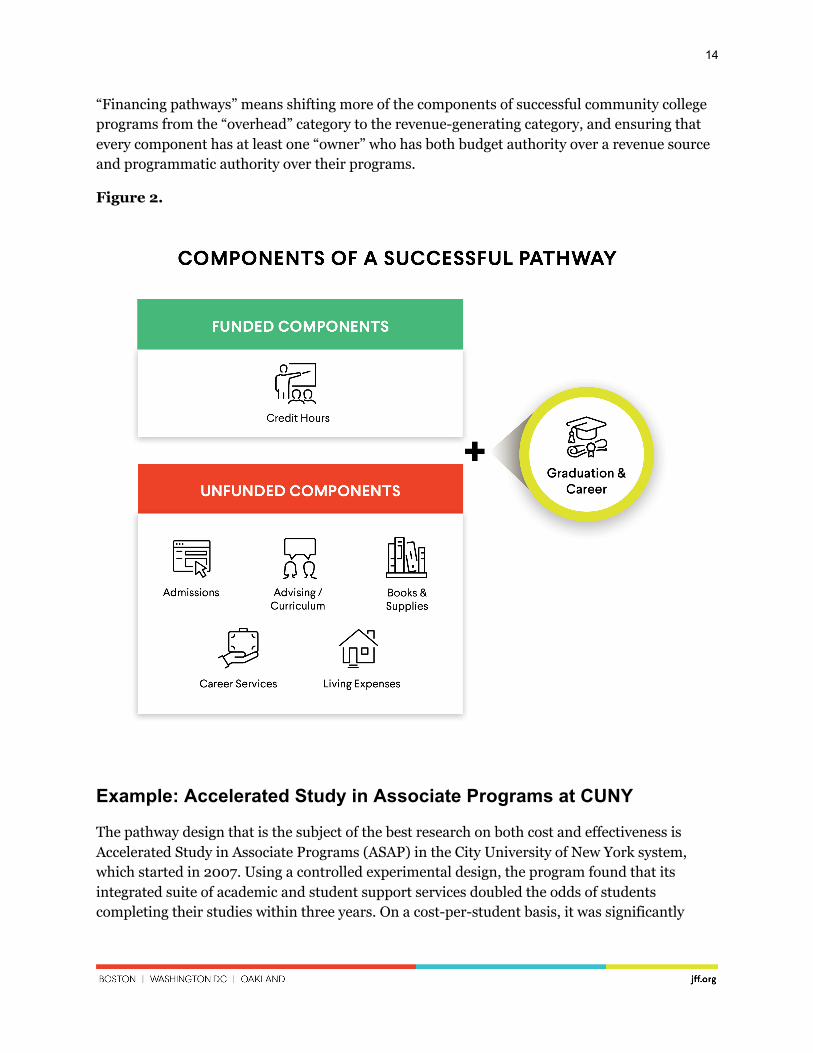
Figure 2. Funded and Unfunded Components of Pathways
Figure 2 shows the student and institutional components of a pathway that require some kind of funding mechanism. In most cases, for colleges, the only revenue-generating components are the credit-bearing classes (in green), while everything else is a form of overhead with no underlying source of financial support. Courses typically operate as individual revenue centers and are not necessarily connected to one another academically or financially. Other key functions create those connections but are essentially “overhead” with no revenue source of their own. These include advising and curriculum planning, which in some cases, if executed perfectly (leading to fewer major changes or excess credits), might cause reductions in revenue-generating courses. There are also some functions that are shared with other entities, making funding another kind of challenge. Recruitment, transfer, and job placement are examples of activities that are essential to successful pathways but lack both a funding source and an “owner” (in the sense that no one party is responsible for the entire function).
14
“Financing pathways” means shifting more of the components of successful community college programs from the “overhead” category to the revenue-generating category, and ensuring that every component has at least one “owner” who has both budget authority over a revenue source and programmatic authority over their programs.
Figure 2.
Example: Accelerated Study in Associate Programs at CUNY
The pathway design that is the subject of the best research on both cost and effectiveness is Accelerated Study in Associate Programs (ASAP) in the City University of New York system, which started in 2007. Using a controlled experimental design, the program found that its integrated suite of academic and student support services doubled the odds of students completing their studies within three years. On a cost-per-student basis, it was significantly
15
more expensive than the costs for other CUNY community college students, but on a cost-per-degree basis, the total expenditure was lower. What is important to realize in this context is that only about 11 percent of the program’s costs were related to course instruction; far greater resources were dedicated to program planning, advising, student financial aid, and other support services.7
Yet while ASAP has expanded both in New York and in replicated instances in several colleges in Ohio, it remains essentially a “boutique” program with no clear way to reach all the students it could potentially serve, since only 11 percent of the program’s costs are aligned with a dedicated source of revenue. Programs like ASAP can expand with special requests to government agencies or private foundations, and they may thrive with committed institutional leadership, but what will happen in the next recession, when student demand spikes? And to achieve scale, programs like these need to become the default, not something that only a small percentage of colleges can successfully pull off.
RECOMMENDATION 1: CHANGE PUBLIC FUNDING TO (A DIFFERENT KIND OF) OUTCOMES-BASED OR OTHER ALTERNATIVE MECHANISM
Given that tuition at most colleges can be used for the instructional components of pathway programs, public sources of funding should be structured to align and grow with other elements of the pathway that are not funded by tuition. Especially in cases where tuition is a large part of the budget, public funds should be allocated based on pathway measures other than the number of tuition-bearing courses a student takes.
Many instances of outcomes-based funding have proved to be seriously flawed and/or inadequate to the task. If states choose to focus on outcomes-based funding, they should consider focusing on one or two outcomes for the hardest-to-serve, least-funded students, rather than spreading money around in ways that duplicate existing resources.
Example: Tennessee Outcomes-Based Funding
While many states have implemented some form of outcome- or performance-based funding, few have done so in ways that allocate sufficient resources or that focus specifically on low-income students. Tennessee’s formula is probably the strongest in this regard, with most state funding allocated based on momentum points and degree and certificate completions. The state also provides an 80 percent premium for low-income students.8 Even so, when it comes to funding Tennessee community colleges, tuition and fees remain a larger source of support than state appropriations, and the amount of financial support allocated through the formula, while greater than that of other states, may not be commensurate with the size of the mission the colleges are being asked to carry out. Tennessee’s program has received mixed reviews among education researchers.9 10 11 On the other hand, no state’s approach to institutional funding has
16
unequivocal evidence of effectiveness, and every state has a responsibility to try to align its budget with its policy goals.12
Policymakers should ask how many of the problems with outcomes-based funding to date have to do with poorly designed or unfocused programs that, for example, create large incentives to “game” graduation rates or that duplicate existing funding structures (such as tuition) by generating the same amount of money for easy-to-serve students as they do for hard-to-serve students. Or in other cases, outcomes funding could fail by not going far enough and failing to produce enough revenue to support the desired outcome. Most programs involve relatively token amounts of money, while even a relatively efficient associate degree probably costs $20,000 to $30,000 in institutional expenditures.
A real test of outcomes-based funding may not have happened yet because there has been no trial of a program that is truly focused on hard-to-serve, low-income students and has adequate resources for the task. Consider, for example, how a program might work that provided $5,000 or $10,000 for every low-income student with moderate developmental education needs who completed gateway courses in math and English. Would that free up institutions to think about, and experiment with, ways to best serve students? Maybe students need extra time in developmental education, or maybe what they really need are free sandwiches so they can work without experiencing a hungry fog. Credit-hour funding only pays for one, but outcomes funding might allow institutions to experiment and find what really works.
Example: Medicare ‘Bundled Payments’ Reform
Another way to integrate funding with pathways is to use larger “units” of measure than credit hours. A two- or four-year degree might be too big of a bundle for practical and budgetary reasons, but smaller bundles could include developmental education, general education, major prerequisites, major requirements, or shorter-term credentials.
The federal government has been changing how it reimburses hospitals and other health care providers to focus on longer episodes of care rather than offering micropayments for piecemeal services. Instead of a system that provides more funding the more times patients are seen and the more individual treatments they receive, with no support for in-home care or check-in phone calls, etc., this system is designed to align hospitals’ and doctors’ financial incentives with cost savings and patient outcomes. Providers that can keep costs down benefit from the savings, while outcomes are closely monitored to ensure consistent or improved quality. Results so far are generally promising, with some significant exceptions.13 This system is not exactly outcomes-based, because providers still get payments regardless of how well a patient’s treatment turns out, but it does involve extensive monitoring and accountability for outcomes.
17
RECOMMENDATION 2: REFORM TUITION AND FINANCIAL AID
Some might argue that community colleges should be tuition-free, and the rationale for the “tuition-free” argument is indeed stronger with regard to community colleges than it is for other kinds of institutions, and it’s especially strong for colleges where 70 percent or more of students qualify for Pell Grants. But tuition does have advantages, and if it is going to be a major source of funding for community colleges, it is important that it be designed to support scaling of entire pathways, not just credit hours. Even more critical is the availability of financial aid that prevents tuition from being a barrier either to initial enrollment or to taking as many courses as appropriate. Specifically, reforming the tuition and financial aid framework would involve the following:
• Creating fee revenue streams for all important services that are going to be funded by students, so that there are no gaps between what a strong pathway requires and the funding that is going to pay for it. Advising and student support costs should not be tied to credit hours.
• Disguising pricing complexity from students using a simple structure (calling it all “tuition” is a place to start) that covers all institutional and mandatory “pass-through” fees, so that students do not need to be financial experts to know what their costs are
• Creating a financial aid system, integrated with federal aid, that results in evenly prorated net costs so there is no artificial incentive for students to take too many or too few classes. This could be anything from making tuition entirely free to having students pay 90 percent of the full cost, depending on the funding available. But there should not be a cap or a floor on the number of courses or credit hours supported.
• Linking financial aid renewal eligibility to key progress points in addition to, or in place of, credit hours (e.g. remedial completion, general education, prerequisites, and transfers in or out) and making sure financial aid covers any fees that could be important to student pathways (e.g. credit-by-exam, prior learning evaluation, transcript production, internship/apprenticeship placement, etc.).
• Including students’ non-tuition direct costs (the cost of books and supplies, for example) and indirect costs (cost-of-living expenses or the opportunity cost of not working, for example) in estimates of financial need, prorated for students’ enrollment intensity (the more courses they take or the more time off work, child care, books, etc. they need).
• Eliminating, as much as possible, the need for student loans, or, if necessary, linking loan eligibility and disbursement to students’ progress toward an economically viable credential.
18
Example: Straighterline
While not a community college, online course provider StraighterLine has a simplified pricing structure for introductory courses that covers both its incremental instructional costs and costs related to head count. Students pay $99 a month plus $59 per course. A similar scheme could be used, with higher or lower fees, at a community college. That structure provides both an ongoing source of funding for head-count costs (registration, records, advising, etc.) and for instructional delivery. It allows revenue to rise when the number of students increases (and the school collects more monthly fees) or when enrollment remains unchanged but the students take more courses (and the school collects more course fees). StraighterLine’s internal financial workings are undoubtedly more complex than the fee structure would suggest, but the pricing shown to the student is simple while providing a balanced revenue stream.
Example: Minnesota State Grant
The state of Minnesota has a need-based financial aid program that is designed to eliminate features that create artificial incentives for students to take fewer or more credit hours than they need. It is combined with federal aid so that students receive the same amount of combined state and federal aid per credit hour whether they take 3 credits, 8 credits, 13 credits or 15 credits. This fills in the stairsteps in Pell Grants, which go up in increments of 3 and are capped at 12 hours.14 This system is designed mostly for students at four-year institutions, which have higher tuitions than community colleges and whose students, therefore, tend to have more unmet need than their counterparts in community colleges. But it could also be used in a funding system focused on community colleges.
Example: Ohio Community Colleges Student Success Fees
If the only way to fund community college programs is to charge students more, it should be done in a way that clearly ties the increased tuition and fees to investments that will improve outcomes for students or reduce their long-term costs by shortening the path to a degree. In the past year, Ohio adopted three measures to generate additional revenue for community colleges to enhance supports for students.15 First, states officials have permitted community colleges to increase tuition levels by up to $10 per credit hour, with the expectation that colleges would use a significant portion of the new revenues to implement new strategies to increase student completion rates. Second, the state legislature authorized community colleges to establish a “career services” fee to provide additional resources for an array of services aimed at helping students choose a career/academic path as soon as possible upon enrolling, as well as to support job placements, internships, and other services that help students either gain employment or transfer to a university. Third, the legislature authorized a “career advantage” fee charged to students once upon enrollment to fund a range of student success reforms, including (1) programs to help students develop academic plans that take them all the way through graduation or transfer; (2) financial planning programs to help students develop a plan to pay
19
for the entire cost of a degree, (3) career counseling services; (4) development and implementation of co-requisite remedial courses; (5) programs to help incorporate the benefits of other governmental aid programs into the overall financial aid package students first receive; or (6) other items identified in a college’s strategic completion plan.
20
CHALLENGE 2: IMPROVING THE TIMING OF PATHWAY FINANCE Public and private funders of community colleges need to give more thought to the timing of their investments. Much of the research and policy discussion about postsecondary funding revolves around the types of programs that are worthwhile investments, how states and institutions should spend their budgets, and which students or institutions will gain the most from those expenditures. But an equally important issue, especially for community colleges, is when investments are made, and that question has received much less attention.
There are two major timing issues to resolve in thinking about financing community college pathways.
First, there is the problem of allocating startup funding to transformative new initiatives when operating budgets are already stretched. While there are usually processes in place to fund new capital investments—for buildings and other types of infrastructure, for example—there is no equivalent process for one-time investments in other types of transformational initiatives. Even if institutions can make the case that certain projects will yield improvements in retention rates that will in turn lead to increases in tuition revenue, the increased costs will precede the increased revenue. There may also be one-time costs for new technology or professional development that need to be funded.
The second timing issue is the fact that student demand for community college services increases during recessions—precisely at the time when students and states can least afford to support the institutions with tuition or appropriations. Pell Grants help, at least a little. In “Federal and State Aid During the Great Recession” (a chapter in the 2015 book How the Financial Crisis and Great Recession Affected Higher Education), Eric Bettinger and Betsy Williams show how, since the early 1990s, successive Republican and Democratic institutions have systematically used Pell Grant increases as a stopgap during recessions.16 17 While this has helped with student aid, interventions to help institutions have been less systematic. There is also a high risk that the federal government will not come to the rescue in the next recession or that its efforts will be inadequate.
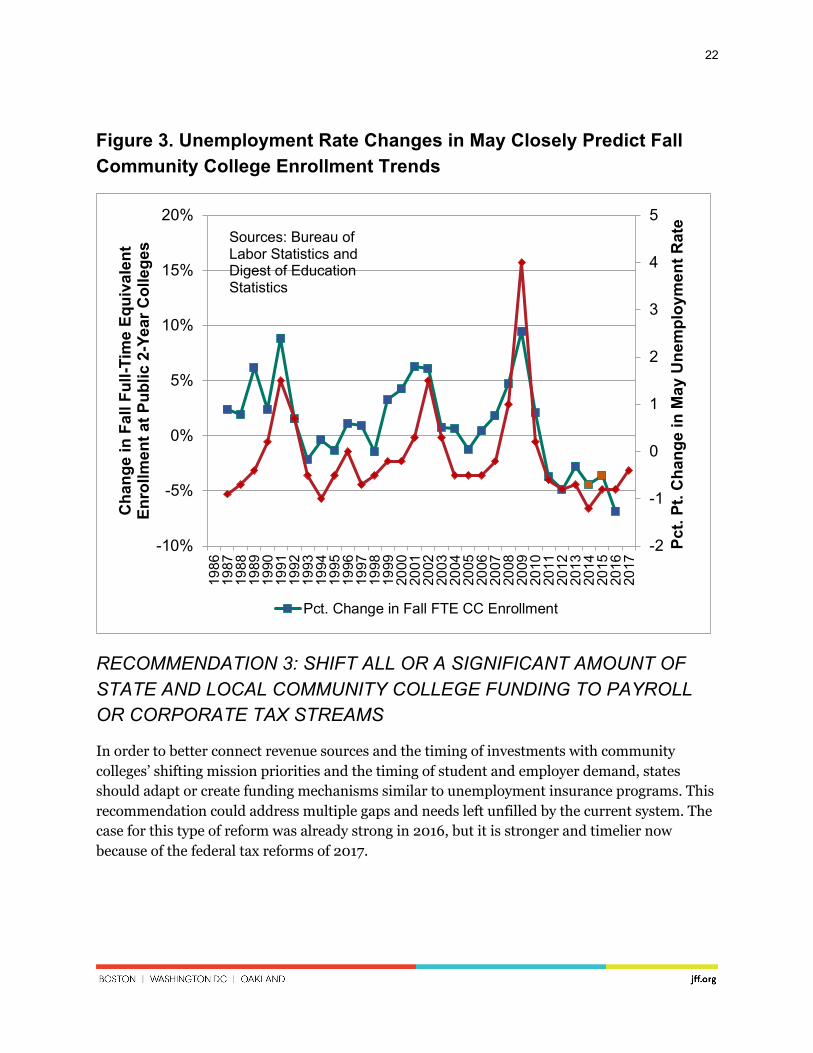
The biggest challenge in using state appropriations as a primary source for operating revenues for community colleges is that state budgets tend to be cut during recessions while demand for community college services increases. The pattern is predictable, but it still seems to come as a surprise to many policymakers and journalists covering postsecondary education during economic downturns.18 The projections in the Digest of Education Statistics, which are based on demographics rather than employment, are also consistently wrong as a result. Over the past 30 years, for every one-point decrease in the May unemployment rate from the previous year, there
21
has been on average a 2.7 percentage point decrease a few months later in fall community college enrollments.19 The pattern reverses when unemployment goes up.
Peter Bahr has created useful taxonomies of community colleges based on student enrollment patterns and goals.20 These classifications help distinguish schools that are more or less transfer-focused, adult-serving, or continuing-education-oriented, for example. But colleges also vary across time. We need to think of a community college as at least two institutions in one, with the balance of functions continually shifting, and with implications for funding changing depending on where they are in the cycle.
During economic expansions (when unemployment is low) colleges need more of the following:
• Programs that help employers struggling to find qualified employees. • Part-time or on-site options to help fully employed adults advance their educations. • Financial aid designed to offset income loss for students who need to cut back on hours
at work. • Campus work-study programs to allow students to earn money more conveniently while
also helping colleges with employee shortages.21
During recessions (when unemployment is high) colleges need more of the following:
• Programs to help communities transition to new economic models or preserve and improve a workforce for when the current model recovers.
• Full-time, campus-based programs to take advantage of the additional time students may have while working less or not at all.
• Ways to integrate pathway offerings and financial aid with social support programs (like unemployment cash benefits and Supplemental Nutrition Assistance Program benefits).
Just as states in the Southeast have elaborate hurricane plans in place well before the season arrives, states and institutions should also have economic “storm” plans that they have gamed out and planned for both logistically and financially. Most community colleges will need to keep all of these functions in place, but the balance will shift, possibly quite suddenly and unexpectedly. The next crisis, if states have planned for it, may also be the optimal time for investment.
22
Figure 3. Unemployment Rate Changes in May Closely Predict Fall Community College Enrollment Trends
RECOMMENDATION 3: SHIFT ALL OR A SIGNIFICANT AMOUNT OF STATE AND LOCAL COMMUNITY COLLEGE FUNDING TO PAYROLL OR CORPORATE TAX STREAMS
In order to better connect revenue sources and the timing of investments with community colleges’ shifting mission priorities and the timing of student and employer demand, states should adapt or create funding mechanisms similar to unemployment insurance programs. This recommendation could address multiple gaps and needs left unfilled by the current system. The case for this type of reform was already strong in 2016, but it is stronger and timelier now because of the federal tax reforms of 2017.
-2
-1
0
1
2
3
4
5
-10%
-5%
0%
5%
10%
15%
20%19
8619
8719
8819
8919
9019
9119
9219
9319
9419
9519
9619
9719
9819
9920
0020
0120
0220
0320
0420
0520
0620
0720
0820
0920
1020
1120
1220
1320
1420
1520
1620
17
Pct.
Pt. C
hang
e in
May
Une
mpl
oym
ent R
ate
Cha
nge
in F
all F
ull-T
ime
Equi
vale
nt
Enro
llmen
t at P
ublic
2-Y
ear C
olle
ges
Pct. Change in Fall FTE CC Enrollment
Sources: Bureau of Labor Statistics and Digest of Education Statistics
23
Features of this kind of funding stream could include the following:
• A portion allocated for startup funding for research-based institutional transformation
• A portion dedicated to developing and delivering programs in service of existing businesses to address labor market shortages in times of high employment. This component could be developed and managed either locally or statewide with significant input from employers.
• A portion designed as education “insurance” to be put in reserve and spent on programs when unemployment rates rise above “trigger” levels. This component would be dedicated to creating or developing new kinds of employment opportunities for students and communities, since it would be triggered only when the existing employment base is weak and job shortages, not applicant shortages, are the main problem. The amount to be reserved could be capped once a level is reached that would be sufficient for a significant downturn—perhaps equivalent to the Great Recession—and rates reduced or funds repurposed in excess of that cap.
• An alternative way of allocating funding that does not rely on credit hours or FTE student enrollment, such as population-based funding or outcomes-based funding, specifically focused on successfully serving low-income adults. There is no reason that a new funding source would necessarily be linked to credit hours or FTE enrollments, and funds could instead be allocated based on numbers of low-income residents who need the funded programs (population-based) and/or who successfully achieve key milestones within the programs (outcomes-based).
• Opportunities for tax credits or rate reductions for employers who provide tuition assistance or other transferable training benefits that address the same needs as community college programs.
• Opportunities for rate reductions for employers with historical records of providing upward economic mobility for entry-level workers, similar to risk ratings in current unemployment insurance programs.
• Possible offsetting cuts on state and local taxes that are no longer fully deductible because of the 2017 federal tax law changes.
Such a reform would solve a number of related problems. First, given that students’ need for community college programs increases according to approximately the same pattern as the need for cash unemployment benefits, it takes advantage of a mechanism that is already set up to provide counter-cyclical benefits to those hurt during economic downturns. The program would provide incentives and mechanisms for employers to participate and partner more closely with colleges on the planning and implementation of programs that meet their needs and those of their employees.
24
Also, if designed as the primary mechanism for funding rather than just as a supplement or addition, the program would establish a systematic expectation and mechanism for colleges to have scalable programs that could be deployed during economic downturns. This in turn could reduce the severity of those downturns and improve the resilience of residents and communities.
Changing the revenue source would also provide a good opportunity to change how the states allocate funding. As a new type of funding, this reform would provide an opportunity to rethink and revise how taxpayer funds support community colleges, whether that means focusing more on outcomes, on “bundles” of services, population-based payments, or dedicated support for key non-instructional services. Especially if tuition or other forms of enrollment-based funding continue to be one pillar of institutions’ financial support, having another source that is tied to other important measures could create a healthier financial model for postsecondary education overall.
Finally, as a corporate tax or insurance expense, corporate or payroll taxes or insurance fees would be deductible from federal taxes, while in many cases under the new 2017 tax law, traditional sources of funding for community colleges—sales, property and income taxes—are no longer deductible. More funding could be provided to colleges at a lower overall after-tax cost to taxpayers.
The biggest challenges of this approach would include the difficulties associated with any major shift in the how state revenues are raised and spent. It will take time to figure out the right levels of premiums or taxes and the amount of revenue to be raised. Since the eventual aim is to provide a reserve fund, there should be a cushion in the first years of implementation as the reserve is built up, and there should be adjustment mechanisms in the authorizing statute that are fine-tuned as needed to create the level of ongoing operating support and reserve funding desired.
Example: Oregon SEDAF Fund
Oregon collects a 0.09% payroll tax to support its Supplemental Employment Department Administrative Fund (SEDAF), which is separate from the federal unemployment insurance program and has been used in the past to build up reserves to support workforce education (or other support activities) when needed.22 While not on the scale needed to be a major source of community college funding, it illustrates a mechanism that could be used.
Example: Maryland Corporate Tax Reform
In 2008, Maryland raised its corporate tax rate from 7.0 percent to 8.25 percent, with much of the additional revenue dedicated specifically to the state Higher Education Investment Fund. The increase had at least some support from the business community because the state was
25
promising to invest in education programs that would benefit its workforce and its employer base.
The timing of this shift did not work well, because the Great Recession arrived before the state had an opportunity to build up a significant reserve fund. The move did, however, allow Maryland to avoid tuition increases during the recession, while most other states were implementing significant hikes.
This is not the same as the proposal to shift community funding from sales, income, and property taxes to corporate and payroll taxes, but it does illustrate the potential for creative thinking about the “customers” of higher education and how to align revenue sources.
26
CHALLENGE 3: INCREASING THE QUANTITY OF PATHWAY FINANCE The idea that community colleges need more funding, while true, is not a good place to start politically, logistically, or financially. There is very little rigorous research on the relationship between institutional funding per se—broad categories of revenues and/or expenditures—and student outcomes at community colleges. What research exists focuses primarily on four-year institutions, where historically more data has been available about the characteristics of both incoming and outgoing students. Even there, most studies are limited by the lack of good control groups for comparison purposes. State and local governments do not increase or decrease their budgets randomly, and the same factors that lead to changes in revenues or expenditures probably affect student outcomes in unrelated ways as well. To the extent that there is a prevailing view, it would be that expenditures on instruction and student services have a positive but weak correlation with student outcomes, especially for lower-income students.23
Having said that, money clearly has to matter at some level. It does not take a controlled experiment to understand that a college with $11,000 in revenue per student is much more likely to be effective than one with revenue of $1,000 per student. Nor does it take a study to understand why there might not be much difference between a school that generates $100,000 in revenue per student per year and one with revenue of $110,000 per student. There is a hard-to-pin-down level of adequacy below which institutions probably should not sink; above that, the point at which additional incremental revenue has little positive impact is less clear. Most selective four-year colleges are comfortably above that level, while many community colleges are dangerously close to or below the line.
What a growing body of research does show clearly is that specific kinds of spending can make a great deal of difference in student outcomes. The list includes the following:
• Financial aid that reduces students’ unmet financial need. • Nonfinancial student support programs. • Remedial education reform. • Pathway-oriented advising and curriculum planning.
At the same time as they make the case for more funding—whether from taxpayers, private donors, or students—colleges also need to be planning to invest that additional funding in the strongest programs and pathway designs. If they can then show outcomes improving with additional investment, it may get easier to make the case for even more investment, creating a virtuous cycle that gets colleges where they need to be financially.
The potential scale is enormous if we take seriously the need to provide opportunities to a significant proportion of adults with no college or some college but no degree. There are about 6 million students currently enrolled in public two-year institutions (more if those that award a
27
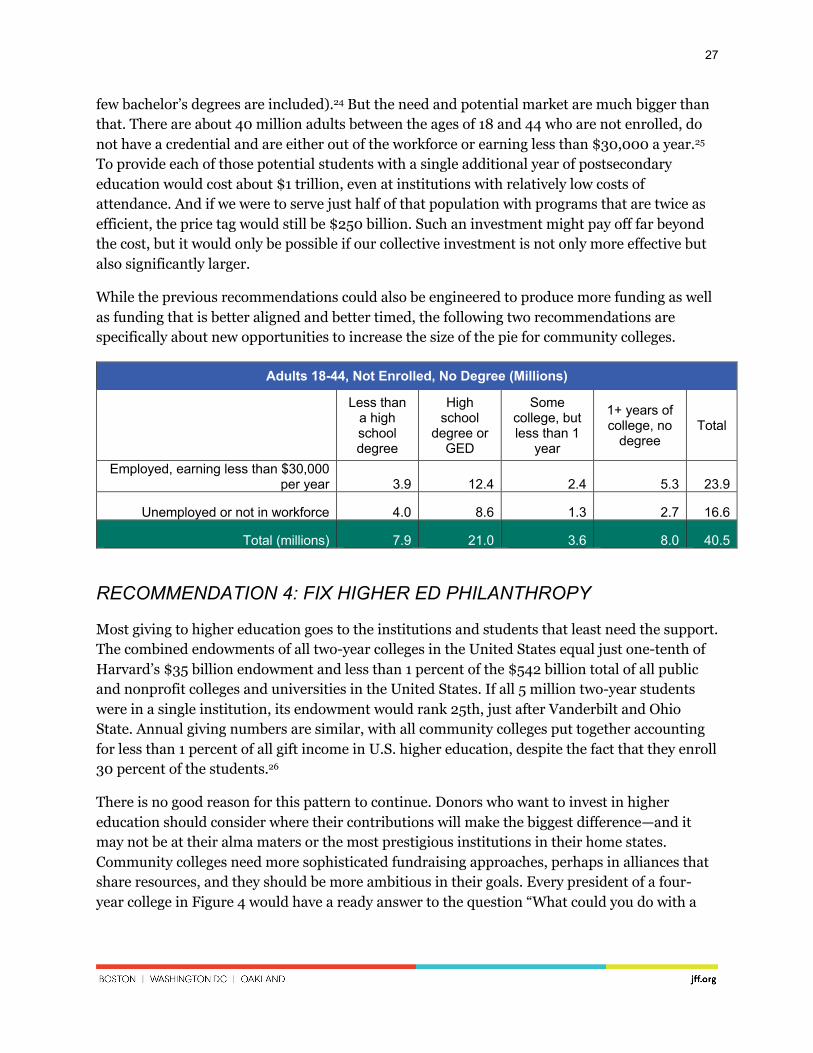
few bachelor’s degrees are included).24 But the need and potential market are much bigger than that. There are about 40 million adults between the ages of 18 and 44 who are not enrolled, do not have a credential and are either out of the workforce or earning less than $30,000 a year.25 To provide each of those potential students with a single additional year of postsecondary education would cost about $1 trillion, even at institutions with relatively low costs of attendance. And if we were to serve just half of that population with programs that are twice as efficient, the price tag would still be $250 billion. Such an investment might pay off far beyond the cost, but it would only be possible if our collective investment is not only more effective but also significantly larger.
While the previous recommendations could also be engineered to produce more funding as well as funding that is better aligned and better timed, the following two recommendations are specifically about new opportunities to increase the size of the pie for community colleges.
Adults 18-44, Not Enrolled, No Degree (Millions)
Less than a high school degree
High school
degree or GED
Some college, but less than 1
year
1+ years of college, no
degree Total
Employed, earning less than $30,000 per year 3.9 12.4 2.4 5.3 23.9
Unemployed or not in workforce 4.0 8.6 1.3 2.7 16.6
Total (millions) 7.9 21.0 3.6 8.0 40.5
RECOMMENDATION 4: FIX HIGHER ED PHILANTHROPY
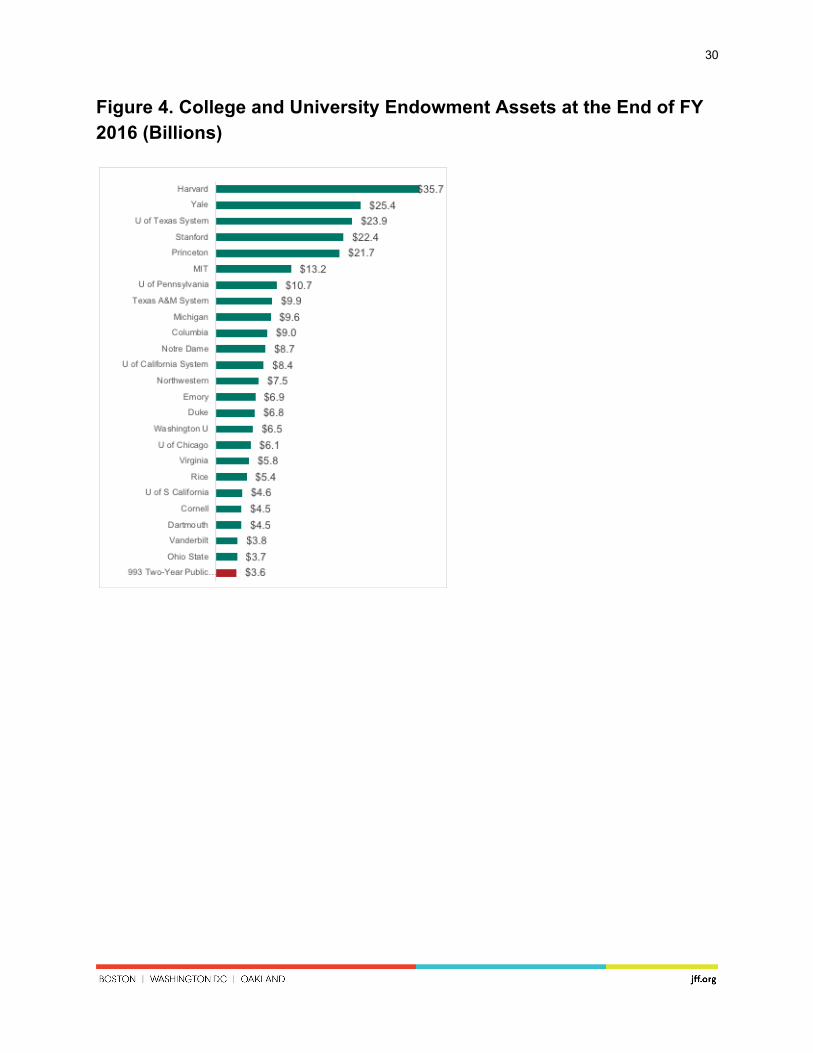
Most giving to higher education goes to the institutions and students that least need the support. The combined endowments of all two-year colleges in the United States equal just one-tenth of Harvard’s $35 billion endowment and less than 1 percent of the $542 billion total of all public and nonprofit colleges and universities in the United States. If all 5 million two-year students were in a single institution, its endowment would rank 25th, just after Vanderbilt and Ohio State. Annual giving numbers are similar, with all community colleges put together accounting for less than 1 percent of all gift income in U.S. higher education, despite the fact that they enroll 30 percent of the students.26
There is no good reason for this pattern to continue. Donors who want to invest in higher education should consider where their contributions will make the biggest difference—and it may not be at their alma maters or the most prestigious institutions in their home states. Community colleges need more sophisticated fundraising approaches, perhaps in alliances that share resources, and they should be more ambitious in their goals. Every president of a four-year college in Figure 4 would have a ready answer to the question “What could you do with a
28
$50 million gift?” But most community college presidents would not have a ready answer, and they would not be accustomed to being asked that question.
While this recommendation calls for a change in the paradigm for higher education fundraising and philanthropy, states have a potentially significant role to play in making it happen. They can provide leadership support, financial incentives, and regulatory assistance to private fundraising efforts focused specifically on low-income students and the institutions they attend. This set of state initiatives could include the following:
• Leadership from the top, with state leaders who can afford to do so contributing significantly and publicly from their own resources to support community college foundations and other endowments supporting low-income students.
• The addition of questions on application forms for appointments to higher education boards (including flagship institution and state-level boards) that ask about individuals’ commitment and contributions to community colleges and financial aid programs serving low-income students
• State tax credits of up to 100 percent for contributions to community college endowments, with bigger advantages for gifts with greater impact.
• Creation of a statewide endowment program, or coordination of a combined fundraising campaign in which all of a state’s community colleges make an appeal for large and small gifts.
• Provisions to assure donors that funds donated to community colleges will not offset state and local support.
Example: Sinclair Community College
Sinclair Community College in Dayton, Ohio, has one of the largest endowments among two-year colleges, at $48 million in 2016, according to the Integrated Postsecondary Education Data System. Its annual list of donors is extensive, and while that list includes many alumni, most contributors did not attend the school. We should find ways to encourage more people who want to give to institutions of higher education to follow the lead of Sinclair’s benefactors and consider making their largest contributions to community colleges, even if they did attend a community college.27 Several other Ohio community colleges are also high on the list, suggesting that states can play a significant role in fostering a culture of giving and providing incentives to encourage donations.
RECOMMENDATION 5: FOCUS ON TAX POLICY
Because of recent federal tax reforms, the next few years will provide a unique opportunity to focus on tax policy as it relates to community college financing. In this new tax environment, state and local governments can change their funding strategies to produce more support for colleges at the same or even lower total cost to taxpayers.
29
Even those who prefer direct spending and generally oppose using tax policy as a funding mechanism need to consider the new reality. It is true that funding key programs through tax policy is generally less transparent, less efficient, and less effective than direct spending. But states are not in the driver’s seat and, in light of the 2017 changes to the federal tax code, it would be financial malpractice not to restructure state and local taxes in ways that maximize available funding while minimizing the total tax burden. Other state and local government stakeholders—private colleges, K-12 school districts, environmental organizations, etc.—will be considering these types of initiatives, and community colleges risk losing out if they are not at the table.
The key changes in the federal tax law are the increase in the standard deduction for modest-income taxpayers and the limitation on state and local tax deductions for higher-income taxpayers. A dollar spent on community colleges through personal state sales or income tax is now an after-tax dollar for most taxpayers. A dollar spent on community colleges through a business or payroll tax or insurance fee, however, is still a before-tax dollar because it reduces taxable profit.
30
Figure 4. College and University Endowment Assets at the End of FY 2016 (Billions)
31
For higher-income taxpayers who do not take the increased standard deduction and have high state and local taxes, charitable contributions remain deductible as well. For these taxpayers, a system of state tax credit incentives for charitable giving to community college foundations could be very advantageous. Finally, for students receiving Pell Grants, the higher personal exemption under the new tax law may change the calculus about whether it is better to apply their grants to tuition and fees (not taxable, but may prevent eligibility for the American Opportunity Tax Credit) or to living expenses (taxable, but allows students to claim AOTC).
In summary, state and local governments that support community colleges should take every opportunity over the next few years to take advantage of the new tax laws by doing the following:
• Shifting dependence on less-deductible state and local tax sources (sales, income, and property taxes) to more-deductible sources (payroll taxes, business taxes, unemployment insurance).
• Creating or using charitable foundations and tax credits to allow high-income taxpayers to “pay” for public-purpose services with contributions instead of taxes.
• Helping students maximize their own tax benefits by changing how federal and state aid are administered and reported, and/or by providing bridge loans against anticipated tax refunds.
Example: Florida Tax Credit Scholarship
Florida offers 100 percent (dollar-for-dollar) corporate tax credits against state corporate income tax, excise tax, and insurance premium tax for contributions to designated organizations that fund private school scholarships for K-12 students. This policy generates more than $500 million annually in scholarship funds benefitting about 100,000 students. This policy has been controversial because it is perceived as an end-run around constitutional restrictions on providing public funds to religious schools. It was also seen as a way for tax-averse legislators to fund an expensive program and claim to offer a “tax cut” at the same time. Whether people are in favor of this type of program or not, they should take note of its effectiveness as a funding mechanism.
With federal tax reform, a similar mechanism used with personal income and property taxes would also be attractive because it could generate the same amount of funding at a lower net after-tax cost to taxpayers.
Example: Georgia Rural Hospital Tax Credit Program
In an example of tax credits being used to generate funds for institutions serving high-need communities, Georgia offers a 90 percent tax credit on personal income tax for donations to selected rural hospitals, which are ranked by financial need. Unlike the Florida scholarship credit, this policy involves donors contributing at least some of their own money (10 percent)
32
beyond what the tax credit provides. For high-income people, the additional federal benefits probably result in taxpayers getting back more on their taxes than they donate to the hospitals.
Example: Oregon Tax Credit Auction For Financial Aid Program
Oregon recently established a program designed to generate funds for state need-based financial aid through a “tax credit auction” in which $14 million worth of tax credits are available and taxpayers “bid” for them.28 Under the rules of the bidding process, someone who offered to contribute $100 to the fund in exchange for a $50 tax credit would prevail over a bidder who offered to contribute $100 in exchange for a $60 tax credit. That system theoretically maximizes the amount of private matching funds the auction generates. Programs like this may take time to develop in ways that maximize appeal and make clear the financial benefit to taxpayers and students.
33
CONCLUSION For community colleges as well as students, the “default” pathway should be an effective one, which means linking the funding that schools need to thrive and grow to the activities that will produce the best outcomes. It also means making the case to policymakers, private donors, and taxpayers that investing in better community college pathways will produce excellent returns in the form of a better educated, more productive, and more equal nation.
34
1 JFF Impact Story: Policy Leadership Trust for Student Success. https://www.jff.org/what-we-do/impact-stories/policy-leadership-trust/, accessed on July 9, 2018.
2 Two recent books cover this landscape in much more detail: Community College Finance: A Guide for Institutional Leaders (Mullin, Baime, and Honeyman, 2015) and Financing Community Colleges: Where We Are, Where We’re Going (Romano and Palmer, 2016). Both address recent, post-recession developments in community college funding. My own work on higher education finance as it relates to low-income students includes a report and a set of related online materials under the heading “Understanding Higher Education Finance” at www.postsecondaryanlytics.com.
3 Smith, A. A., “Zeroed Out in Arizona,” Inside Higher Ed, March 12, 2015.
4 Hovey, H., “State Spending for Higher Education in the Next Decade,” San Jose: National Center for Public Policy and Higher Education, July 1999.
5 SRI International, “States’ Methods of Funding Higher Education,” https://www.sri.com/sites/default/files/brochures/revised-sri_report_states_methods_of_funding_higher_education.pdf, revised Aug. 21, 2012.
6 Snyder, M., and Boelscher, S., “Driving Better Outcomes: Fiscal Year 2018 State Status and Typology Update,” Washington, DC: HCM Strategists, March 20, 2018.
7 Scrivener, S., Weiss, M., Ratledge, A., Rudd, T., Sommo, C., and Fresques, H., “Doubling Graduation Rates: Three-Year Effects of CUNY’s Accelerated Study in Associate Programs (ASAP) for Developmental Education Students,” New York: MDRC, February 2015.
8 Tennessee Higher Education Commission, “Outcomes Formula in Brief,” retrieved from https://www.tn.gov/content/dam/tn/thec/bureau/fiscal_admin/fiscal_pol/obff/1_-_Outcomes_Based_Funding_Formula_Overview_-_One_Page.pdf, March 9, 2018.
9 Dougherty, K. J., Jones, S. M., Lahr, H., Natow, R. S., Pheatt, L., and Reddy, V., Performance Funding for Higher Education, Baltimore: Johns Hopkins University Press, 2016.
10 Hillman, N., “Evaluating the Impact of Performance Funding in Ohio and Tennessee,” American Educational Research Journal 55, No. 1, 2018.
11 Callahan, K., Meehan, K., Shaw, K., Slaughter, A., Kim, D., Hunter, V., and Lin, J., “Implementation and Impact of Outcomes-Based Funding in Tennessee,” Philadelphia: Research for Action, July 2017.
12 In recent years, Tennessee has increased its formula weight for low-income students, and implemented policies such as Tennessee Promise (free community college tuition) designed to complement outcomes funding. It may also be that it takes time for funding reforms to have an effect. In 2015-16 and 2016-17,
35
years not yet reflected in most of the research, the state saw some of its biggest gains yet in associate degree graduates, even while the rest of the country had declines.
13 The Lewin Group, “CMS Bundled Payments for Care Improvement Initiative Models 24: Year 3 Evaluation and Monitoring Annual Report,” prepared for the Centers for Medicare and Medicaid Services, October 2017.
14 Minnesota Office of Higher Education, “Minnesota State Grant,” retrieved from https://www.ohe.state.mn.us/mPg.cfm?pageID=138, March 9, 2018.
15 HB 49 (specifically section 381.160), retrieved from http://search-prod.lis.state.oh.us/solarapi/v1/general_assembly_132/bills/hb49/EN/07?format=pdf, July 9, 2018. 16 Bettinger, E., and Williams, B., “Federal and State Financial Aid During the Great Recession,” in How the Financial Crisis and Great Recession Affected Higher Education eds. J. Brown, and C. Hoxby, (Chicago: University of Chicago Press) 235-262.
17 For a discussion of the relationship between tuition increases, unemployment, and state budgets, see also Johnson, N., “College Costs, Prices and the Great Recession,” Indianapolis: Lumina Foundation for Education, April 2014.
18 Johnson, N., “The Unemployment-Enrollment Link,” Inside Higher Ed., August 27, 2015.
19 Also see: Johnson, N., “College Costs, Prices and the Great Recession,” Indianapolis: Lumina Foundation for Education, April 2014. The chart now includes two more years of data and the correlation has only gotten tighter. If the pattern continues this fall, and there is no major economic event before September, we should see fall community college enrollments stabilize, with perhaps a small increase or decrease, but not as big as in previous years.
20 Bahr, P., “Classifying Community Colleges Based on Students’ Patterns of Use,” Washington, DC: HCM Strategists, September 2012.
21 Recent research on work-study indicates that it is most effective for students who would otherwise be working off-campus, not necessarily for students who would otherwise not be employed. See Scott-Clayton, J., and Minaya, V., “Should Student Employment Be Subsidized? Conditional Counterfactuals and the Outcomes of Work-Study Participation,” National Bureau of Economic Research, July 2014. Work-study is over-discussed in higher education relative to its significance as a funding stream (about $1 billion), especially given the limited evidence of its impact.
22 Oregon State Legislature, “Employment Department Program Description,” retrieved from Oregon Legislative Information System: https://olis.leg.state.or.us/liz/2011R1/Downloads/CommitteeMeetingDocument/51361, March 4, 2015.
23 As an example of research on student services expenditures at four-year institutions, see Webber, D., and Ehrenberg, R., “Do Expenditures Other Than Instructional Costs Affect Graduation and Persistence Rates in American Higher Education?” Cambridge, Massachusetts: National Bureau of Economic Research, http://www.nber.org/papers/w15216.pdf, August 2009.
36
24 National Center for Education Statistics, “Digest of Education Statistics,” Washington, DC: National Center for Education Statistics, 2017.
25 Estimates calculated from American Community Survey Public Use Microdata for 2016, U.S. Census Bureau. Cells under 30,000 are not shown because of likely sampling errors.
26 Analysis of fiscal year 2016 Integrated Postsecondary Education Data System finance files.
27 Sinclair Community College Foundation, “2016 Donor List,” Dayton, Ohio: Sinclair Community College, 2017.
28 Oregon State Legislature, “Enrolled Senate Bill 1528,” retrieved from Oregon Legislative Information System, March 2, 2018.