Embed Size (px)
Citation preview

Financing of Renewable Electricity Projects in
Atlantic Canada
Prepared for:
Atlantic Energy Gateway
Atlantic Canada Opportunities Agency
March 28, 2012
John Dalton
978 369-2465

Financing of Renewable Electricity Projects in Atlantic Canada Page i
Table of Contents 1 Introduction and Purpose ........................................................................................................ 1
1.1 Report Outline ................................................................................................................. 1 2 Review of Renewable Project Development in Atlantic Canada ........................................... 2
2.1 New Brunswick ............................................................................................................... 2 2.2 Newfoundland and Labrador ........................................................................................... 3 2.3 Nova Scotia ..................................................................................................................... 3 2.4 Prince Edward Island (PEI) ............................................................................................. 4
3 Evidence on Financing Renewable Energy Projects in Atlantic Canada................................ 5 3.1 Project Attrition Rate Assessment ................................................................................... 5
3.1.1 Nova Scotia’s Experience ........................................................................................ 6 3.1.2 New Brunswick’s Experience ................................................................................. 6 3.1.3 Conclusions ............................................................................................................. 7
3.2 Survey results .................................................................................................................. 7 3.3 Review of Relevant Literature ....................................................................................... 10 3.4 Findings on the RFP Questions ..................................................................................... 13
4 Review of Factors Affecting Cost of Capital ........................................................................ 15 4.1 Introduction ................................................................................................................... 15 4.2 The Risk-free or Base Rate ............................................................................................ 16 4.3 Review of Key Risks that Affect Project Financing ...................................................... 17
4.3.1 Project Related Risks ............................................................................................. 18 4.4 Limited Availability of Lenders and Equity Investors for Smaller Projects ................. 22
4.4.1 Fixed Costs of Due Diligence and Structuring ...................................................... 22 4.4.2 Greater Profitability of Larger Projects ................................................................. 22 4.4.3 Developers Pursuing Smaller Projects Typically Lack Experience ...................... 22 4.4.4 General Illiquidity of Smaller Transaction Sizes................................................... 23
4.5 Process for Administering RFPs ................................................................................... 23 4.5.1 Insufficient Certainty for Project Developers ........................................................ 23 4.5.2 Length of Time Pricing Proposal Needs to be Open ............................................. 23
4.6 Power Purchase Agreement Terms Leading to Higher Attrition Rates ......................... 23 4.6.1 Termination Provisions for Non-Performance ...................................................... 24 4.6.2 Appropriate Pricing Escalators (Initial and Ongoing) ........................................... 24 4.6.3 Pricing Penalties .................................................................................................... 24
5 Review of Current Capital Market Conditions ..................................................................... 25 5.1 Atlantic Canada vs. Other Jurisdictions ........................................................................ 25 5.2 Equity Capital Markets .................................................................................................. 26
5.2.1 Availability of Capital ........................................................................................... 26 5.2.2 Cost of Capital ....................................................................................................... 28
5.3 Debt Capital Markets ..................................................................................................... 29 5.3.1 Availability of Capital ........................................................................................... 29 5.3.2 Cost of Capital ....................................................................................................... 31
5.4 Conclusions ................................................................................................................... 32 6 Financing Options for Atlantic Canada ................................................................................ 34
6.1 Large Wind: Shear Wind ............................................................................................... 34

Financing of Renewable Electricity Projects in Atlantic Canada Page ii
6.2 Cooperative: Water Power Group ................................................................................. 36 6.3 Master Financing Facility .............................................................................................. 38 6.4 Government Loans Guarantee: Aboriginal Loan Guarantee Program .......................... 39
Extending this model ............................................................................................................ 41 6.5 Community Economic Development Investment Fund (CEDIF) ................................. 41 6.6 Toronto Renewable Energy Co-operative ..................................................................... 42 6.7 Summary ....................................................................................................................... 43
Source: Power Advisory ................................................................................................................ 44 7 Policy Considerations ........................................................................................................... 45
7.1 Policies to Support Finance of Renewable Generation ................................................. 45 7.2 Revenue Support Policies .............................................................................................. 46
7.2.1 Feed in Tariffs ....................................................................................................... 46 7.2.2 Standard Offer Programs ....................................................................................... 49 7.2.3 RFPs ...................................................................................................................... 50
7.3 Cost Reduction Policies ................................................................................................. 51 7.3.1 Loan guarantees ..................................................................................................... 51
7.4 Market Access Policies .................................................................................................. 52 7.4.1 Market size ............................................................................................................ 52 7.4.2 Renewable Energy Aggregator .............................................................................. 53 7.4.3 Transmission access .............................................................................................. 54
8 STRATEGIC POLICY OPTIONS ....................................................................................... 56 8.1 System Integration ......................................................................................................... 56 8.2 Policy Harmonization .................................................................................................... 57 8.3 Renewable Aggregator .................................................................................................. 57 8.4 Facilitate Distribution Level Connection ...................................................................... 58 8.5 Focused FIT Programs .................................................................................................. 58 8.6 RFP Processes ............................................................................................................... 59 8.7 Loan Guarantees ............................................................................................................ 60 8.8 Development Cost Funding ........................................................................................... 60 8.9 Facilitate Cooperative Development ............................................................................. 61
APPENDIX A: INTERVIEW GUIDE ......................................................................................... 62
APPENDIX B: INTERVIEW NOTES………………………………………………………….65
APPENDIX C: POLICIES FOR LARGER IPPS ......................................................................... 75

Financing of Renewable Electricity Projects in Atlantic Canada Page 1
1 Introduction and Purpose
The Atlantic Canada Opportunities Agency (ACOA) is conducting the Atlantic Energy Gateway
(AEG) study to facilitate the development of Atlantic Canada’s clean energy resources. As part
of this initiative, ACOA engaged Power Advisory LLC (Power Advisory) to identify and analyze
the challenges to financing of renewable energy projects by independent power producers (IPPs)
in each of the four Atlantic Provinces. This study identifies and evaluates the key factors that
affect the availability and cost of capital for Atlantic Canada renewable projects developed by
IPPs. The purpose of this study is to identify the necessary economic and market conditions and
appropriate policies and government actions to support renewable project financings under
reasonable terms and conditions so that the Atlantic Provinces can take full advantage of the
opportunities offered by the region’s renewable and clean energy potential.
1.1 Report Outline
In this report Power Advisory reviews the key factors that affect the availability and cost of
capital for renewable projects developed by IPPs and assesses the degree to which there are
policies that can be employed and changes to market conditions that can be made to facilitate the
financing of these projects so that the region’s full renewable energy potential can be realized.
The report first reviews the level of renewable project development in each of the four Atlantic
Canada provinces as well as the policies that support the development of these projects. Chapter
3 assesses the project attrition rate for renewable energy projects in Atlantic Canada to provide an
indication as to whether it is more difficult to develop and finance renewable energy projects in
Atlantic Canada than other regions. The chapter then review3s the results of and insights from a
phone survey that we conducted with over 20 renewable project developers and financiers that are
active in Atlantic Canada. Finally, Chapter 3 concludes with a review of the results of our
literature search regarding the financing of renewable energy projects. Chapter 4 reviews the
critical determinants of the cost of capital including critical project risks that must be managed by
renewable project developers and can be reflected in project’s cost of capital to the degree that
they aren’t adequately mitigated. Chapter 5 provides an overview of current capital market
conditions and assesses the implications for financing renewable projects by reviewing terms that
are available to project developers. Chapter 6 reviews financing options for Atlantic Canada,
policies to facilitate financing, and financing approaches employed in other jurisdictions by
reviewing various case studies. Chapter 7 reviews policies that can be employed to facilitate the
financing of smaller renewable energy projects which pose the greatest challenge and then
discusses policies that can expand the scope of provincial electricity markets. Chapter 8 offers
descriptions of strategic policy options for further consideration by the AEG committee members
and Atlantic Canada governments.
Appendix A is the Interview Guide that we used to survey renewable project developers and
financial industry professionals regarding the challenges associated with financing renewable
energy projects in Atlantic Canada. Appendix B summarizes our findings from these surveys.
Appendix C provides a broader review of policies to facilitate the financing of larger renewable
energy projects developed by IPPs.

Financing of Renewable Electricity Projects in Atlantic Canada Page 2
2 Review of Renewable Project Development in Atlantic Canada
This section provides a review of the level of renewable project development by IPPs and the
major policy initiatives and programs to promote the development of renewables that have been
implemented in each Province in Atlantic Canada. Finally, the major transmission
interconnections in the region are identified and contrasted with peak load and existing generating
capacity to provide an indication regarding the potential implications of market size and existing
transmission infrastructure on renewable project development.
2.1 New Brunswick
Currently 28% of the electricity consumed in New Brunswick comes from renewable resources
including hydroelectric, wind and biomass generation.1 The vast majority of this is provided by
seven hydroelectric facilities providing 895 MW, which are owned and operated by NB Power.
Other renewables include 294 MW of wind generation developed by IPPs and a 38 MW biomass
project at the Twin Rivers Paper Company. The output of these wind projects was procured by
NB Power under two separate RFPs.
In October 2011, the New Brunswick Government released its Energy Blueprint which creates a
new Renewable Portfolio Standard of 40% of NB Power’s total in-province sales by 2020. With
respect to renewable energy initiatives, the Energy Blueprint calls for: (1) supporting local and
First Nations small-scale renewable projects; (2) integrating wind generation in the most cost-
effective and efficient manner; and (3) supporting solar, bio-energy and other emerging
renewable energy technologies. The Energy Blueprint also outlines a Large Industrial Renewable
Energy Purchase Program under which NB Power would purchase the output from renewable
energy projects owned by large industrial customers. The Energy Blueprint also indicates that
“NB Power will procure new renewable energy resources through competitive Requests for
Proposals (RFP) and projects will be evaluated on criteria to be released prior to each RFP. These
criteria will include the net economic and social benefits to the community, cost of energy
production, rate of return, business plans, size of project, and cost of integrating the generation
into the grid.”
As is evident from Figure 1, New Brunswick is well connected with the rest of Atlantic Canada
and is the only province in the region that is directly connected with New England. Five of the
six New England states have renewable portfolio standards which require 18 TWh of renewable
energy by 2020, greater than the total forecast energy requirements of New Brunswick and PEI.
New Brunswick has an independent system operator which serves as the balancing authority for
New Brunswick, Northern Maine and PEI. Under the Energy Blueprint it will be folded back into
NB Power.
1 New Brunswick Department of Energy, The New Brunswick Energy Blueprint (Energy Blueprint),
October 2011, p. 20.

Financing of Renewable Electricity Projects in Atlantic Canada Page 3
Figure 1: Transmission Interconnections vs. Peak Load and Generation Capacity
2.2 Newfoundland and Labrador
Newfoundland and Labrador has three IPP wind projects which provide about 54 MW. The
Island of Newfoundland, where these projects are located, isn’t currently connected with the
Eastern Interconnect. However, Nalcor Energy has proposed the development of Muskrat Falls,
an 824 MW hydroelectric facility located in Labrador. As part of the development of this project,
Emera Energy would receive about 1 TWh of energy per year from the project and in return build
transmission, the Maritime Link, which would connect Newfoundland and Nova Scotia. The
Maritime Link will connect the Province to the rest of Atlantic Canada.
2.3 Nova Scotia
About 17% of Nova Scotia’s electricity supply is provided by renewable energy resources,
including almost 400 MW of hydroelectric and tidal generation owned and operated by NSPI.2
This includes about 300 MW of wind generation, of which about 82 MW are owned by NSPI.3
Nova Scotia has a requirement of 25% renewable electricity generation by 2015 and a target of
40% by 2020. This includes an additional 300 GWh from IPPs to be procured under an RFP
process administered by an independent Renewable Electricity Administrator, with an equivalent
amount of renewable energy to be developed by NSPI. In addition to renewable energy
development by IPPs and NSPI, Nova Scotia has implemented a feed-in tariff for community
renewable energy projects (COMFIT) and a feed-in tariff for Developmental Tidal Arrays.
As of February 2012, over 95 applications have been submitted and twenty, representing about 50
MW, have been approved by the Province. Of the twenty COMFIT applications that have been
approved ten are being developed by Community Economic Development Investment Funds
(CEDIFs), five by municipalities, one by a university, one by a First Nation, two are for Tidal
2 http://www.nspower.ca/en/home/environment/renewableenergy/default.aspx
3 A 31.5 MW project is under construction and scheduled to be in commercial operation in the first quarter
of 2012.

Financing of Renewable Electricity Projects in Atlantic Canada Page 4
Arrays, and one is an industrial biomass-fired combined heat and power project. Around 90% of
applications have been for wind projects. Of these, most are large wind (>50 kW), with about ten
percent of wind projects small wind projects. Several applications have also been submitted for
biomass and in-stream tidal projects. Eleven of the approved projects are large wind for a total of
44 MW, six are small wind for a total of 73.5 kW, the two Tidal Arrays total 2.45 MW and the
biomass CHP is 3.3 MW. The province expects about 100 MW to be produced by the COMFIT.
2.4 Prince Edward Island (PEI)
Reflecting its exceptional wind resource, PEI has 173 MW of wind capacity,4 for an electricity
system that has an average load of 145 MW.5 Maritime Electric purchases 52 MW of wind
generation from the PEI Energy Corporation’s North Cape and Eastern Kings wind farms and 10
MW from the WEICan facility. As well, the City of Summerside has developed a 12 MW wind
farm to serve a portion of the City’s load. In addition, a 99 MW wind farm was developed and
financed based on the sale of energy to New England which requires that the power be wheeled
through New Brunswick.
Maritime Electric is part of the NB Power control area, which facilitates balancing. However,
Maritime Electric is responsible for imbalances that it incurs on the NB Power system as a result
of the variability of wind.6
In October 2008, the Government of Prince Edward Island announced the province’s wind energy
strategy, Island Wind Energy, Securing Our Future: The 10 Point Plan. The province's goal is
500 MW of wind power to be installed by 2013. The 10-point plan focuses on benefiting the local
community and providing opportunities for developers by setting clear ground rules and
establishing a fair, open and transparent process for developers.
4 Including the 10 MW WEICan facility now commissioning.
5 Including Maritime Electric and the City of Summerside jurisdictions.
6 The wind in PEI and Northern Maine result in 502 MW of wind which must be balanced by NB Power,
resulting in one of the highest proportions of wind generation in North America. (Energy Blueprint, p. 22)

Financing of Renewable Electricity Projects in Atlantic Canada Page 5
3 Evidence on Financing Renewable Energy Projects in Atlantic
Canada
The RFP posed three basic questions:
1) Is there a shortage of equity and debt financing available to renewable energy projects in
Atlantic Canada and if so what financing vehicles can improve the availability of
capital?
2) In what ways are there greater risks associated with renewable energy projects in
Atlantic Canada than in other jurisdictions, including the rest of Canada? How can these
risks be mitigated for investors? Are there gaps in the information that investors
require?
3) Do projects developed in Atlantic Canada have disproportionately high technology risks
(e.g., tidal projects)?
We have addressed these questions by surveying participants in the Atlantic Canada renewable
energy market and by researching the market. We have also reviewed the available literature for
information on the issues associated with financing of renewable energy projects in general and
on such issues within Atlantic Canada. This literature review is also presented in this Chapter.
However, prior to reviewing the findings from these interviews and this literature review, the
attrition rate for renewable projects in Atlantic Canada is reviewed.
3.1 Project Attrition Rate Assessment
An important indicator regarding the health of the renewable project market in Atlantic Canada is
the level of project attrition relative to other markets. 7 A higher level of project attrition indicates
that there are greater project development risks in Atlantic Canada than other jurisdictions. One
challenge with such an analysis is the lack of transparency regarding project development efforts
which makes it harder to establish the level of project development activity.
A key determinant of project success is the market’s need for renewable capacity. A region with
favourable renewable resource potential, but relatively limited demand for renewable energy, is
likely to have a higher proportion of proposed projects that don’t get contracts and therefore don’t
achieve commercial operation.8 Our focus is on projects that were awarded contracts in RFPs
and demonstrated themselves to be attractive proposals or secured contracts under Nova Scotia’s
COMFIT or New Brunswick’s Community Energy Policy, but weren’t ultimately successfully
developed given project development barriers. The experience in Nova Scotia, based on a 2007
Renewable Energy RFP, and New Brunswick, based on its two renewable energy RFPs, is
reviewed below.
7 Project attrition here refers to projects which succeed in RFP processes or otherwise obtain contracts but
are never built. 8 A number of developers made this comment, i.e., the primary constraint to successful project
development efforts is the size of the market.

Financing of Renewable Electricity Projects in Atlantic Canada Page 6
3.1.1 Nova Scotia’s Experience
Nova Scotia Power Inc.’s (NSPI’s) 2007 RFP was for 130 MW. Power Purchase Agreements
were signed for 246 MWs, with 252 MW ultimately built. NSPI elected to contract with more
than its procurement target to compensate for anticipated project attrition which it estimated to be
20 to 30% based on the experience in California.9
The additional 6 MW built versus contracted (i.e., 252 MW versus 246 MW) reflects the
additional capacity provided by changes in wind turbines. Of this capacity, 81 MW was
ultimately built by NSPI when IPPs were unable to deliver on their contractual commitments.10
The developer of one of these projects (SkyPower) sold its interests in the project after its major
equity investor Lehman Brothers was liquidated. Another project, Amherst Wind Energy
Project, which was originally proposed by Acciona Wind Energy Canada Inc., has subsequently
been sold to Sprott Power Corp. and is under construction.
Therefore, while all of the capacity that was contracted by NSPI under its 2007 RFP was built,
the terms under which a number of these projects were constructed differed from those outlined
in the original RFP. A primary contributor to these changes was the financial crisis in 2008
which caused an unprecedented increase in debt costs. This is shown in
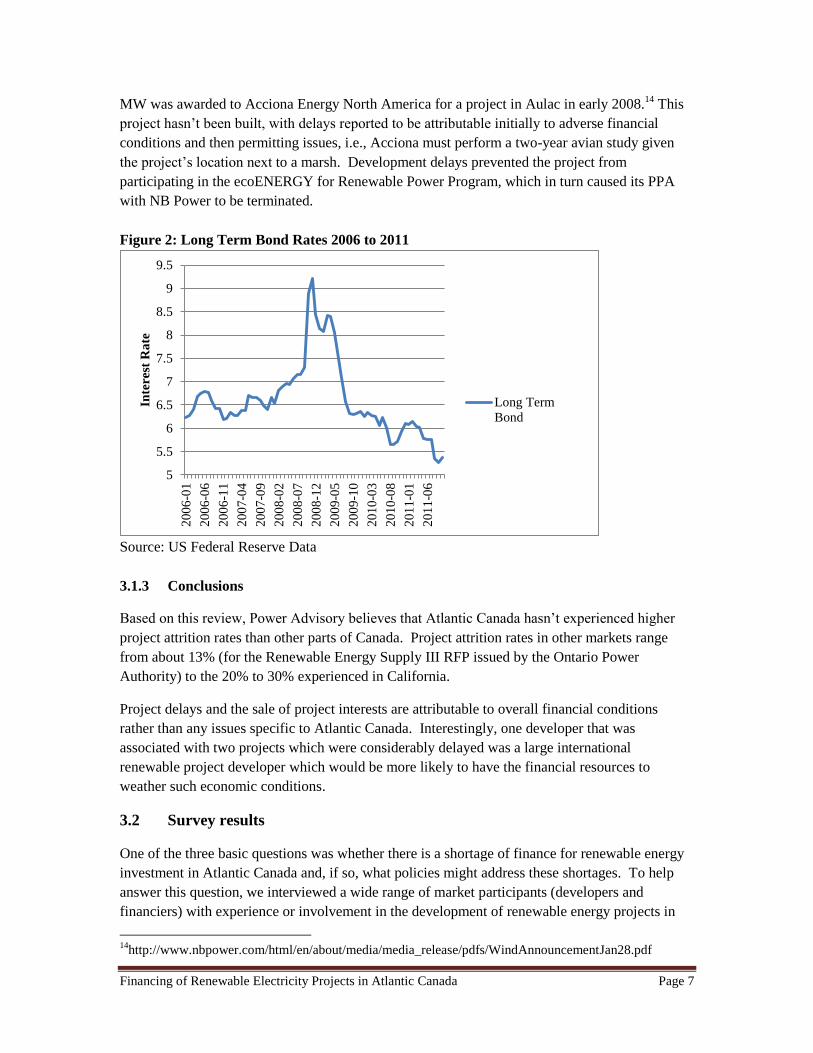
Figure 2 which presents long term bond rates from 2006 to 2011 (through October) and shows
how interest rates for Baa Bonds rated by Moody’s Investor Services increased from about 6.5%
in 2007 when proposals were submitted to around 8.5 % to 9% from October 2008 to April
2009.11
This increase in financing costs made financing very difficult for projects that were
attempting to secure debt during this period.
Given stakeholder concerns stemming in part from NSPI’s acquisition of projects and with the
RFP process, the Nova Scotia Government established an independent Renewable Electricity
Administrator (REA) to administer future RFP processes for renewable energy resources.12
3.1.2 New Brunswick’s Experience
NB Power has issued two RFPs for wind energy which have resulted in the development of 294
MW of wind generation from four projects including two at the same site.13
A contract for 64.5
9 Specifically, NSPI relied upon the following study performed for the California Energy Commission.
“Building a Margin of Safety into Renewable Energy Procurements: A Review of Experience with
Contract Failure” CEC 300-2006-004, January 2006. 10
The Nuttby Mountain (50.6 MW) and the Digby Neck (30 MW) projects. 11
These interests are for US bonds given the availability of data, but a similar increase in interest rates was
experienced in Canadian bonds. 12
Power Advisory was appointed as the REA by the Government of Nova Scotia. This model has specific
challenges given that the REA designs the RFP; drafts the PPA; and selects the Proponents to be awarded
PPAs, whereas, the PPA is ultimately executed by the IPPs selected and NPSI. 13
These are 99 MW at Caribou Mountain, owned by GDF Suez; 150 MW at KentHills, owned by
TransAlta, and 45 MW at Lamèque owned by Acciona. KentHills was contracted in two phases.
Financing of Renewable Electricity Projects in Atlantic Canada Page 7
MW was awarded to Acciona Energy North America for a project in Aulac in early 2008.14
This
project hasn’t been built, with delays reported to be attributable initially to adverse financial
conditions and then permitting issues, i.e., Acciona must perform a two-year avian study given
the project’s location next to a marsh. Development delays prevented the project from
participating in the ecoENERGY for Renewable Power Program, which in turn caused its PPA
with NB Power to be terminated.
Figure 2: Long Term Bond Rates 2006 to 2011
Source: US Federal Reserve Data
3.1.3 Conclusions
Based on this review, Power Advisory believes that Atlantic Canada hasn’t experienced higher
project attrition rates than other parts of Canada. Project attrition rates in other markets range
from about 13% (for the Renewable Energy Supply III RFP issued by the Ontario Power
Authority) to the 20% to 30% experienced in California.
Project delays and the sale of project interests are attributable to overall financial conditions
rather than any issues specific to Atlantic Canada. Interestingly, one developer that was
associated with two projects which were considerably delayed was a large international
renewable project developer which would be more likely to have the financial resources to
weather such economic conditions.
3.2 Survey results
One of the three basic questions was whether there is a shortage of finance for renewable energy
investment in Atlantic Canada and, if so, what policies might address these shortages. To help
answer this question, we interviewed a wide range of market participants (developers and
financiers) with experience or involvement in the development of renewable energy projects in
14
http://www.nbpower.com/html/en/about/media/media_release/pdfs/WindAnnouncementJan28.pdf
5
5.5
6
6.5
7
7.5
8
8.5
9
9.5
200
6-0
1
200
6-0
6
200
6-1
1
200
7-0
4
200
7-0
9
200
8-0
2
200
8-0
7
200
8-1
2
200
9-0
5
200
9-1
0
201
0-0
3
201
0-0
8
201
1-0
1
201
1-0
6
Inte
rest
Ra
te
Long Term
Bond

Financing of Renewable Electricity Projects in Atlantic Canada Page 8
Atlantic Canada. 15,16
All of the developers have been active in renewable resource development
in Atlantic Canada, and most have also been active in renewable resource development elsewhere
in Canada and the world.
Most of the interviews were conducted by telephone. At least two members of the project team
participated in most of the interviews.
Both developers and financiers told us that location in Atlantic Canada does not create any
disadvantage or differences compared to the rest of Canada in terms of availability of finance or
of expertise on development of renewable electricity projects. A project in Atlantic Canada will
be evaluated by financiers on the same terms as in the rest of Canada.17
The evaluation will be by
the same teams or by teams with the same knowledge of the industry. The initial challenges
associated with financing projects in Atlantic Canada and some of the development difficulties
were attributable to the more limited experience of local developers and smaller project sizes of
the initial projects. This made it more difficult to realize economies of scale and some of the
inexperienced developers structured projects in ways that made securing financing more difficult.
Several companies we interviewed have experience developing renewable energy projects in
more than one province in Atlantic Canada and in other parts of Canada. They consistently said
that the issues they faced in raising financial capital were the same in Atlantic Canada as
elsewhere. Financiers are interested in the quality of the power purchase agreement (PPA), the
creditworthiness of the offtaker, the experience and technical capability of the developer and the
development team, and the financial stability of the developer.18
They want to know that risks are
identified, appropriately mitigated, and assigned to appropriate parties (i.e., the party that is best
able to manage these risks). Large, experienced, well-supported renewable project developers,
therefore, are able to access financing for their projects in Atlantic Canada under essentially the
same terms as they are in the rest of Canada.
Some companies that have experience developing renewable projects in other provinces
commented that some aspects of the development process are easier in Atlantic Canada. In
particular, environmental permitting and aboriginal issues do not require as much time as they do
in other jurisdictions.
Many of our interviewees pointed out that the conditions for financing renewable projects are
quite different for small projects than for large projects, especially if the developer is also small
15
Our interview guide is attached as Appendix A. 16
The interview notes for those parties that authorized the release of the notes are attached as Appendix B. 17
As discussed further below, this isn’t necessarily true for small renewable projects which are more likely
to rely on local lenders rather than lenders that specialize in renewable energy project finance and finance
renewable energy projects across Canada. 18 Not surprisingly, this is the same as in the US where a recent report by Mintz Levin found that “High-
quality projects sponsored by experienced developers [which] have signed power purchase agreements
(“PPAs”) from credit-worthy off-takers will continue to secure project financing...” (Renewable Energy
Project Finance in the U.S.: 2010-2013 Overview and Future Outlook, January 2012, p.7 )

Financing of Renewable Electricity Projects in Atlantic Canada Page 9
and relatively inexperienced.19
The major financial institutions, banks and insurance companies,
consistently said that they are generally not interested in projects where the total financing is
below $50 million (a wind project of about 30 to 35 MW), though some said they might consider
projects as small as $30 million.20,21
The reason for this size threshold is simple: these institutions
have finite resources to perform the required analysis and due diligence for projects and it costs
them almost as much to do this for small projects as for large ones. Given the corporate
expectation that they will lend a certain amount, they cannot afford to spend these limited
resources on small projects. The institutions emphasized that this size threshold did not apply
only to Atlantic Canada; it would apply anywhere in Canada or elsewhere.
Several interviewees also noted that, in their experience, small developers are more likely to have
less development experience, to be more prone to overlook key risk factors or to make other
mistakes in project structure, and in general to require more assistance from the lenders. This
experience is not surprising as project developers are keenly focused on the success rate of their
projects, and experienced developers will chase larger projects which offer larger returns for the
same level of development effort as a smaller project. This experience reinforces the banks’
reluctance to undertake relationships with such smaller developers. Further, small developers
will have more difficulty accessing capital for such projects. For example, bank applications for
smaller loans (say, up to $10 million) would be made to the local or regional commercial loan
departments, which will not have expertise in lending to renewable developers and would not
have ready access to such expertise from elsewhere in the bank. In addition, the due diligence
and structuring costs can overwhelm the economics of a smaller project.
As the interviewees noted, the size of the market for renewable resources in Atlantic Canada
significantly affects renewable energy development in the region. Since the overall Atlantic
Canada electricity market is small relative to other areas, the amount of renewable capacity that
can be integrated and the amount of renewable energy needed to meet a requirement like a
Renewable Portfolio Standard (RPS) is also small. Therefore, the possible number of projects
large enough to attract interest from these financial institutions is also small. The survey
respondents said that this limits the number of companies that can participate in the market.
Some developers, especially those who are primarily focused on Atlantic Canada, commented on
this limit on opportunities for larger developments in Atlantic Canada. They also noted that the
limited number of winners in an RFP process, like those in New Brunswick and Nova Scotia,
increases their risk of participation in the RFP process. The cost of participation in the RFP
process for a small developer is a significant portion of its total resources. With only a few
winners, and with competition from large developers, the small developer sees only a small
chance of winning a contract. The small developers suggested that this is less of a problem for
19
The previously referenced Mintz Levin Report offered a similar finding: “Project financing constraints are
likely to disproportionately impact smaller projects, less established developers, and/or projects with higher
technology or regulatory risks.” (p. 7.) 20
Some also said that they preferred projects at or below $100 million because above that size they will
look for participation from other lenders. Some financiers preferred to finance larger projects, in the $200
million to $400 million range, but would look at projects as small as $50 million. 21
This reflects a 70/30 debt/equity ratio and project capital cost of about $2,200/kW.
Financing of Renewable Electricity Projects in Atlantic Canada Page 10
the large diversified developers who have a portfolio of existing and potential projects to draw
from and can therefore afford to participate in an RFP and lose.
In general, smaller developers preferred a feed in tariff (FIT) process for acquisition of
renewables. A FIT program would provide them with sufficient returns and with certainty of
contract award, providing that they meet the FIT criteria.
By contrast, the larger developers generally preferred an RFP process. They said that such
processes can produce better results for the buyers by ensuring the pricing is competitive.
However, they warned that the winners in an RFP process based primarily on price might not be
capable of building the project within the price they had bid. To guard against such outcomes,
the developers urged that bidders in an RFP process be carefully screened before being qualified,
including requiring them to post a significant deposit which would be forfeit if they are awarded
the contract but fail to build the project.22
To summarize the results of our survey, the respondents told us clearly that, for comparable
renewable energy projects, there is no difference between financing in Atlantic Canada and
financing in the rest of Canada or in other jurisdictions. We heard that the most desirable projects
from the financier’s viewpoint are above $50 million in total finance, and most prefer sizes above
that. The survey respondents then added that project development can be more difficult in
Atlantic Canada because of the small size of the market and therefore the small number of
projects of $50 million or more.
The respondents also commented on and suggested policies that could address these problems.
These will be reported in the policy review section, Chapter 7 of this report.
3.3 Review of Relevant Literature
In addition to our interviews with market participants, we looked for available studies that would
help us understand the difficulties and opportunities of financing renewable energy projects in
Atlantic Canada. We had hoped to find at least one such study with a focus on Atlantic Canada.
We could not find a regionally focused study, but we did find some studies dealing with the
financing of renewable energy projects. We reviewed these studies to help identify the possible
barriers to renewable energy project development, especially to financing such projects. This
section reports on the studies we found most relevant and useful.
Renewable electricity generation projects are generally financed on a project finance basis. The
overall conditions for finance of renewable electricity generation projects are the same as those
for other projects: the project should be economically viable and its risks identifiable and
manageable. The literature on finance for renewable energy projects also considers the needs of
such projects to find additional sources of revenue (above the electricity market value of their
output).
22
Alternatively, the RFP evaluation process can consider the project development status as a measure of
project risk as well as the pricing offered by the Proponent.

Financing of Renewable Electricity Projects in Atlantic Canada Page 11
The two most helpful studies we found in the literature focused on evaluating the effectiveness of
various policies aimed at improving the conditions of finance for renewable projects. One study23
looked at policies applicable to the stages of project development, from development planning
through construction and operation. At each of these stages, policies are available that can reduce
risk and therefore the finance rates and overall cost of the project. The study uses a financial
model to conclude that a combination of government policy measures can reduce the overall cost
of renewable energy projects by up to 30%.
This study specified four different kinds of projects (20 MW onshore wind, 100 MW offshore
wind, 1.5 MW solar PV, and 10 and 26 MW biomass) under the policy environments in six
jurisdictions: France, Germany, the Netherlands, UK, California and Québec.
Table 1 below summarizes the findings of this report.24
For several broad categories of policy
support, the table shows the range of impacts on levelized unit energy costs, as computed using
the financial model for all of the project types in all of the jurisdictions.
Table 1: Impact of Policies on Cost
POLICY AREA COST REDUCTION IMPACT (%)
Long-term commitment to renewable support 10-30
Risk reduction by removing barriers 5-20
Risk reduction by risk sharing 5-15
Measures to reduce debt costs 5-10
Fiscal measures to increase net returns 2-20
Production support 2-30
Source: David de Jager and Max Rathmann
All of these impacts are attributed to the effect of the policies on the cost of finance. Therefore,
the impacts of the different policy types cannot be considered cumulative; the maximum cost
impact from a mix of these policies was estimated at 30%.
The study defines and gives examples of the policies it is modeling. Removing barriers means
making permitting easier and having transmission available for grid connection when needed.
Sharing risk refers to loan guarantees from government or direct project participation from
government. Debt measures include low-interest loans direct from government or direct
subsidies, typically available for projects which promote the development of new technologies.
Fiscal measures range from accelerated depreciation to specific policies to reduce income tax
liability (e.g., investment tax credits or production tax credits).
23
David de Jager and Max Rathmann, “Policy Instrument Design to Reduce Financing Costs in Renewable
Energy Projects”, IEA Renewable Energy Technology Development, August 2008. http://iea-retd.org/wp-
content/uploads/2011/10/Policy_Main-Report.pdf 24
Ibid., pp. 3-5.

Financing of Renewable Electricity Projects in Atlantic Canada Page 12
Production support measures enhance revenue during the production period and encompass many
of the most effective policies in current use. They include FIT and feed in premium (FIP)
programs,25
direct production payments such as Canada’s Wind Power Production Incentive and
the ecoENERGY for Renewable Power programs. The study notes that well-designed FIT
programs tend to have the greatest impacts on project prices by reducing development risks and
financing costs. Such programs would evidence long-term commitments by making the period of
the FIT contracts equal to the project’s expected life as represented by the term of its financing.
In an effort to assess the reasonableness of these results, in particular the 30% cost reduction,
Power Advisory used a financial model to calculate the difference between a typical fully
contracted wind project and a similar merchant wind project in the price that would be required
for the project to be viable. For the contracted project, there is no basis for distinguishing among
the terms and conditions for a contract awarded under a FIT program or an RFP. Therefore, we
assume that the financing assumptions wouldn’t differ.
This analysis indicated that the price would have to be about 24% higher for a merchant project.26
This supports the findings of the de Jager and Rathmann study cited above, but suggests that the
cost reduction or price required would be 80% of level estimated in this study. However, Power
Advisory believes that it would in fact be difficult if not virtually impossible to finance a
renewable energy project in Canada on a merchant basis under current market conditions, i.e.,
low natural gas prices and a focus on quality by lenders.
Another study27
took a similar approach but analyzed specific cases in specific jurisdictions. The
cases were a large onshore wind farm in the US and Spain, offshore wind in Denmark, utility-
scale PV in the US and Italy, and a concentrating solar tower in the US. The study started by
computing the lifetime unit energy costs for each of these six cases and measured the impact on
that cost of the possible renewable energy support policies.
The study looked at the impacts of the policies on finance costs as they would be seen by various
classes of finance providers: lenders, mezzanine investors, balance sheet equity investors, and
project finance equity investors. Each of these classes expects a different rate of return. As with
the study cited above, the analysis used a cash flow financial model to determine the impacts of
policies on cost and financial viability.
The study concluded that the three most important determinants of policy effectiveness are
1) The duration of the renewable support, especially the production support. If the debt
term ends with the support term, the project must either maintain a much higher rate of
25
Feed in premium programs pay a premium amount over the market price. Such programs therefore leave
the renewable energy project exposed to market price risk, but with additional price support. 26
The merchant wind project was assumed to have a 60/40 debt-equity ratio, 7% cost of debt, and 13%
after tax cost of equity and cumulative debt term of 15 years, with the initial debt having a 5-year term and
the second debt issuance having a 10-year term. The contracted wind project was assumed to have a 70/30
debt-equity ratio, 6% cost of debt, and 10% after tax cost of equity and debt term of 18 years. 27
Uday Varadamjan, David Nelson, Brandon Pierpont, Morgan Hervé-Mignucci, “The Impacts of Policy
on the Financing of Renewable Energy Projects: A Case Study Analysis”. Climate Policy Initiative,
October, 2011.

Financing of Renewable Electricity Projects in Atlantic Canada Page 13
payment to amortize the debt earlier or take the risk of refinancing part way through the
project life.
2) The degree of revenue certainty. A FIT or PPA at a fixed price are preferred to other
supports like a FIP.
3) Risk perception. This is the perception of risk in the support policy. Good project
management can mitigate other risks; for example, completion risk can be mitigated in
the construction contract.
One other study provided some examples of financing relatively small renewable power
projects.28
Most of the policies in this study relate to the specifics of renewable power support in
the United States through tax preferences and are not relevant to Canadian circumstances.
However, the study also shows how these policies can combine with low-interest loans from
government to make renewable power projects economically feasible.
We reviewed briefly several other reports but those described above contributed the results most
useful for this project.29
3.4 Findings on the RFP Questions
Our findings from our survey of market participants and consideration of the success of
renewable developers in Atlantic Canada has led us to some basic conclusions on the three
questions posed by the RFP.
1) We find no shortage of debt or equity capital for renewable projects in Atlantic Canada
as compared to Canada as a whole. Renewable projects in Atlantic Canada can access
both debt and equity markets on the same footing as similar projects in other parts of
Canada. Chapters 4 and 5 discuss the financial conditions for renewable projects
generally and in Canada.
2) We find no inherently greater risks in Atlantic Canada than in other parts of Canada.
However, we do find that the small size of the Atlantic Canada electricity market tends
to mean that projects are likely to be smaller, and we find that developers of small
projects do face difficulties in raising capital that are not present for large projects.
Chapters 6 and 7 deal with financing options for Atlantic Canada projects and with
potential policies to address problems with finance, especially for small renewable
projects in Atlantic Canada.
3) We find no evidence of greater technical risks in Atlantic Canada than in other parts of
Canada for projects using proven technology such as wind turbines or hydroelectric
28
Mark Bolinger, “Community Wind: Once Again Pushing the Envelope of Project Finance”, 2011, LBNL
4193-E 29
For example, Mark Bolinger, Ryan Wiser, Naum Dargouth, “Preliminary Evaluation of the Impact of the
Section 1603Treasury Grant Program on Renewable Energy Deployment in 2009”, 2010, Lawrence
Berkeley National Laboratory LBNL 3188-E; White Paper: “Renewable Energy Project Finance in the U.
S.”, 2010, Mintz Levin; International Conference for Renewable Energies, “Mobilizing Finance for
Renewable Energies”, 2007, Thematic Background Paper for conference Renewable Power Policy and the
Cost of Capital, UN Environmental Program, Sustainable Energy Finance Initiatives; Dermot Duncan,
“Project Financing Electricity Generation Projects in NSW with a Specific Focus on the Externalities to
Renewable Generation, Dec. 2010, Crisp Legal.

Financing of Renewable Electricity Projects in Atlantic Canada Page 14
generation. We note the interest in development of new technologies, specifically tidal
power, but did not find evidence to indicate that its development in Atlantic Canada is
more difficult than would be development of a similarly new technology elsewhere in
Canada.

Financing of Renewable Electricity Projects in Atlantic Canada Page 15
4 Review of Factors Affecting Cost of Capital
4.1 Introduction
An investors’ cost of capital represents the minimum return or hurdle rate an investor needs to
achieve for investing in the project, and this hurdle rate is influenced by what returns the investor
expects or is able to achieve on investment in other projects with similar risk profiles.
The general framework for estimating the appropriate cost of capital for a company is based on an
economic theory called the capital asset pricing model (CAPM), which is considered “the
backbone of modern price theory for financial markets”. 30, 31
CAPM begins with a risk free rate
and provides a theoretical framework for estimating the appropriate return for the specific risk
factors by observing the returns for other similar securities. In practice, investors start with the
appropriate risk free or reference base rate (for debt investors) and estimate a premium above the
base rate, using a combination of theory and judgment, that is necessary to compensate the
investor for the additional risks above the risk free rate, as shown below.
Table 2: Components of the Capital Asset Pricing Model
Cost of Equity and Cost of Debt32
Cost = Risk Free Rate (equity) or Reference Base Rate (debt)33
plus risk factors:
+ Impact of Project Specific Factors
+ Impact of Size and Liquidity
+ Impact of Other terms
+ Impact of General market conditions
For Debt capital, the total impact of these
factors is known as the credit spread. For
Equity, the total impact of these factors is
known as the risk component of the cost of
equity.
Source: Power Advisory
While the risk free rate can vary significantly, changes in the risk free rate are not within the
developers’ control (see Section 4.2). Experienced project developers focus on minimizing the
credit spread, as renewable projects are predominantly financed with debt capital (70% to 80% of
total capital).34
Reducing the cost of debt will reduce the cost of equity for the project, which will
in turn reduce the cost of financing the project and the minimum power price required to keep the
30
Merkowitz, Miller and Sharpe were jointly awarded a Nobel Peace Prize in Economic Sciences in 1990
for their pioneering work in the development of the theory of portfolio choice, CAPM, and other
fundamental contributions to the theory of corporate finance. 31
"The Prize in Economics 1990 - Press Release". Nobelprize.org. 12 Dec 2011
http://www.nobelprize.org/nobel_prizes/economics/laureates/1990/press.html 32
While each of the following risk factors will impact the pricing for both debt and equity, the impact will
not necessarily be equal. 33
The appropriate reference base rate for debt capital depends on several factors, such as the term and the
repayment schedule of the loan. 34
Less mature technologies, such as tidal, may have difficulty obtaining debt financing. Biomass projects
will typically raise a lower amount of debt relative to other renewable technologies because of higher
perceived operational risks, including the risk of obtaining a long-term fuel supply and the risk that project
revenues become disconnected to project costs given swings in biomass costs.

Financing of Renewable Electricity Projects in Atlantic Canada Page 16
project economic. 35
The components which influence the credit spread or risk component are
detailed in Section 4.3.
This discussion of finance conditions for renewable generation facilities is in the context of the
project finance approach which is used for most renewable generation facilities. Whatever mode
of finance is used, the projects still must meet the rate of return criteria described here.
4.2 The Risk-free or Base Rate
The risk-free rate of return is a theoretical rate of return for an investment with zero risk of
default in the region where the asset resides and forms the underlying basis for pricing the cost of
equity and debt capital for a project since an investor will need to be compensated for each
additional risk factor layered onto the investment. 36
A complex set of factors governs the movement of interest rates, including monetary and fiscal
policy. The rate determined at the federal and global level and fluctuations in the risk-free rate
are largely outside of the control of the project developer. As shown in the graph below, the yield
of the benchmark 10-year Government of Canada (GOC) bond has fluctuated from a high of
5.8% to approximately 2.0% between March 2002 and November 2011. During this time period,
reference bond yields have been very volatile, which would have increased the cost of capital for
renewable energy projects as prudent developers will leave a buffer to account for market
changes in the key components of the cost of capital to improve the likelihood that the project
will remain economically viable at financial close.37
35
The cost of equity for a project should exceed the cost of debt for the project as debt receives a return on
and of its capital in priority to equity capital, and has prior claim in the event of default. The effective cost
of debt is also cheaper because of the deductibility of interest expense. 36
In Canada, the yield from the 10-year government of Canada bond is commonly used as a proxy for the
risk free rate for the purposes of estimating the cost of equity. 37
Large developers are not as sensitive to the impact of volatility in base rates (and the other factors
impacting pricing detailed in this section) as those developers have the ability to take a longer-term view of
the financing markets. These developers can choose to finance the project on balance sheet on the
assumption that financing rates will improve over time, at which point the developer can choose to replace
corporate funding with project financing. However, large developers which choose to rely on corporate
level or balance sheet financing to fund projects are more susceptible to changes in market conditions once
their corporate borrowing capacity is reached. Calpine Corp. and Babcock & Brown are examples of large-
scale bankruptcies for infrastructure companies with high levels of corporate level debt. The current
instability in the European banking sector means that many of the European power developers are re-
examining their corporate-level credit capacities which could curtail their ability to balance sheet finance
going forward. See Chapter 5 for a more detailed description of the capital markets.

Financing of Renewable Electricity Projects in Atlantic Canada Page 17
Figure 3: Canadian 10-year GOC Bond Yield
Data Source: Bloomberg
For debt capital, the reference rate varies according to the type of debt (floating rate or fixed rate),
term and amortization schedule. While only a graph of the 10-year GOC bond yield was shown,
the decline in yields and the high volatility (particularly since 2008) would be consistent across
all reference rates.
4.3 Review of Key Risks that Affect Project Financing
The preceding discussion reviewed the economic and financial market fundamentals that
determine the cost of capital for projects. To evaluate the challenges in the financing of
renewable energy projects in Atlantic Canada it is important to understand project risks that will
be considered by lenders and investors and the risks that are borne by developers to get their
projects to a point where they can be financed. The risks considered by lenders and investors
affect the terms under which IPPs will be able to secure financing, with riskier projects incurring
higher costs of capital and projects with risks that are too great in the eyes of lenders and
investors unable to attract the necessary capital.

Financing of Renewable Electricity Projects in Atlantic Canada Page 18
4.3.1 Project Related Risks
This section reviews the project-related risks that affect the renewable project’s cost of capital or
affect its availability of capital. Six fundamental project-related risks affect the capital costs for
projects:
1) technology risk, focusing in particular on the degree to which the technology is
immature and doesn’t have significant commercial operating experience for the
proposed application;
2) operating risks including the operating performance of the equipment with respect to
the energy conversion efficiency (e.g., power curve for wind) and fixed and variable
operating and maintenance costs;
3) market risks, which consider the revenue uncertainty of the value of the project
output;
4) resource availability risks, which consider the underlying variability of the resource
and the potential for measurement error when estimating the resource;
5) construction risks that are borne by the project proponent rather than allocated to the
firm procuring equipment for and constructing the project; and
6) market access risks including the potential for transmission constraints.
Each of these risks and the manner in which they affect the cost of capital is reviewed further
below.
Technology and Operating Risks
Technology and operating risks are directly related. To more clearly distinguish between the
factors that contribute to these risks we discuss them separately in this section. However, there is
considerable overlap. Lenders are very reluctant to consider projects that have significant
technology risk. At a minimum, they will look to the equipment vendor to provide performance
guarantees and will want to ensure that the equipment vendor has sufficient financial capability to
deliver on these commitments.38
For example, for wind projects the equipment vendor typically
provides a power curve guarantee which guarantees the project output levels at measured wind
speeds.39
Many equipment vendors (virtually all wind turbine suppliers) offer service and maintenance
agreements for the initial years of project operation, e.g., two to five years. For a set fee the
38
The number of notable case studies where the supplier did not have such financial stability includes
Clipper Wind Power which developed a 2.5 MW variable speed wind turbine and was led by seasoned
wind industry professionals and AAER Inc., a Quebec wind turbine manufacturer. Clipper Wind Power’s
2.5 MW Liberty Wind Turbines developed issues with the gear box and blades which resulted in a dramatic
slowdown in orders and ultimately caused United Technologies to take a 49.5% interest in the Company
and eventually acquire the entire company. AAER Inc. suffered from slow sales and eventually was
acquired by Pioneer Power Solutions who discontinued the business. 39
Specifically, the project owner receives liquidated damages to the degree that the project output is less
than the guarantee. However, these liquidated damages are capped (often to 10% of the contract amount)
and the project owner must demonstrate that the project output is less than promised. This requires a
formal test, the cost of which would be paid by the project owner if it shows that the project output is
consistent with the guarantee.

Financing of Renewable Electricity Projects in Atlantic Canada Page 19
equipment vendor agrees to provide major maintenance services. This significantly reduces
project operating risks by fixing maintenance costs according to the contract and ensuring that the
maintenance is performed according to manufacturer’s recommendations. In addition, it reduces
the potential for disconnects between the warranty provisions in equipment supply contracts and
maintenance contracts given that effectively one party will be providing the two services.
Another technology/operating risk is the equipment availability. For mature technologies this is
a relatively minor risk, particularly for wind projects which install a number of wind turbines
which effectively diversifies this risk. Hydroelectric turbines are also a mature technology with
low performance risks. Once again, lenders will be reluctant to lend to projects that employ new
technologies or equipment venders with limited operating experience.40
Atlantic Canada has a tidal resource that both Nova Scotia and New Brunswick want to develop.
In Nova Scotia, two tidal array projects have received COMFIT contracts. This is a very new
technology and these projects would represent its early deployment. An early application of this
technology in Nova Scotia was removed from service after several months of operation. Lenders
can be expected to perceive the technology risks of these projects to be very high.
A technology risk that can affect the cost of capital is that the useful life of the equipment could
be less than anticipated, particularly if it were less than the tenor of the debt and the debt
amortization period. A related risk is that required capital additions could be much higher than
anticipated.
Market Risks
In the current financing environment lenders and investors are reluctant to finance projects which
don’t have a long-term power purchase agreement (PPA) which provides revenue certainty for
project output. Without a PPA, the project proponent faces the risks of uncertain future
revenues. The interconnected provinces of Atlantic Canada have wholesale market access which
allows project proponents to wheel power to adjacent markets, but limited retail market access.41
Therefore, independent power producers must be awarded a PPA or wheel power to New
England. Ideally, the term of the PPA is as long as the debt term plus an additional two years or
more, i.e., a two year or more tail that provides revenue certainty beyond the term of the debt and
could allow the debt to be rescheduled if necessary. PPAs typically have durations of 20 to 25
years for wind and most renewable energy technologies and up to 40 years for hydroelectric
projects.
40
The introduction of new power generation technologies will frequently require government support to
move from pilot-scale to utility-scale projects. In the US, the Department of Energy provided a Loan
Guarantee Program (Section 1705), which facilitated the introduction of solar thermal generation projects
in the U.S. Indeed, with the expiry of the program many of these solar thermal generation projects have
been cancelled or are in the process of being converted into solar PV projects, which are better understood
by the financial markets. Following the example in the US, Atlantic Provinces could encourage the
development of innovative technologies that are well suited to the region (e.g., tidal technology) by
providing support through a loan guarantee. 41
Nova Scotia allows renewable project developers to have direct retail access.

Financing of Renewable Electricity Projects in Atlantic Canada Page 20
Resource Availability Risk
Resource availability risk considers the underlying variability of the resource and the potential for
measurement error when estimating the resource. This risk is most significant for wind projects
given that relatively small variations in average wind speeds can have significant impacts on
project output.42
For example, wind resource forecasts rely on models which estimate a power
output for each turbine at specific heights and locations within the project site, based on wind
measurements received from the met towers which are in different locations and heights. For
wind projects, resource availability risk is evaluated and mitigated in project financings by
engaging an independent meteorological expert to review the wind resource studies and calculate
the output that the project is likely to achieve or exceed at different probability levels, e.g., P50,
P90, and P99.43
For example, lenders will typically assess the adequacy of debt service coverage
ratios (DSCR) at less favourable (more stringent) project output probabilities such as P90 and
may require that the DSCR be at least 1.2 under the P90 conditions.44
For hydroelectric projects, lenders would expect good history of hydrological data, again
converted into probabilities for different exceedance levels.
For biomass projects, the resource availability risk focuses on the ability of the project to secure
sufficient long-term biomass supply at a consistent quantity and quality to ensure production. If
the biomass is waste from another operation, particularly forestry, the renewable electricity
generation project is vulnerable to loss of resource if the operation is shut down, even if it is a
temporary shutdown. If the biomass is from other resources, the risk is the exhaustion of the
resource in nearby locations and consequently higher transportation costs.
Construction Risks
Many IPPs rely on Engineering Procurement and Construction (EPC) contracts to manage
construction risks. Under EPC contracts the IPP is able to allocate many of the construction risks
and equipment cost risks to the firm providing the services. However, the terms and form of EPC
contracts vary. Under a fully reimbursable EPC, the IPP maintains flexibility and bears most of
the procurement and construction risk as costs are largely a pass through. Under a Lump Sum
EPC, these risks are largely borne by the EPC firm, but the IPP pays a premium for this service
and under some conditions (periods of significant expected cost escalation) such a contract is
difficult to get. As implied, IPPs typically don’t have a comprehensive EPC and there are often
multiple contractors, with one party assembling and erecting the wind turbines and another the
balance of plant. Therefore, there is likely to be some residual risk to the degree that the
contracts don’t link up. Finally, smaller community projects are unlikely to be able to secure
such contracts given the size of the project, limited project budget, and limited interest of
42
A rule of thumb is that a doubling of the average wind speed results in eight times more output. 43
For example, the project output at P90 is the output that the project will achieve or exceed with a 90%
probability. The output levels for different exceedance levels (e.g., P50 or P90) typically increase when
assessed over a longer period of time (e.g., at P90 the annual output for a turbine may be 5,000 MWh and
5,250 MWh over 20 years.) 44
DSCR are the annual Earnings Before Interest Taxes Depreciation and Amortization (EBITDA) divided
by the annual debt service (interest and principal payments).

Financing of Renewable Electricity Projects in Atlantic Canada Page 21
engineering and construction firms in performing the detailed work required to firm up pricing.
However, unless the project site is difficult to access or requires significant groundwork, wind
and solar renewable projects are generally easier to construct as the less predictable balance of
plant costs represents a smaller proportion of the total construction budget (compared to
traditional thermal projects).
Market Access Risks
All the Atlantic Canada provinces, except Newfoundland and Labrador (and Newfoundland isn’t
currently directly connected to the Eastern Interconnect), offer wholesale market access under
Open Access Transmission Tariffs. The most significant market access risks for renewable IPP
projects in Atlantic Canada are the potential for transmission constraints that cause the project to
be constrained down or off. This risk increases as the penetration of intermittent renewable
energy projects in these markets increases. 45
A critical determinant of the magnitude of this risk
is the transmission service for which the IPP contracts and how this risk is addressed in the PPA.
When a generator is provided with firm transmission service, curtailment risk is typically more
limited, but this can require that the transmission network be reinforced, most likely at the cost of
all transmission customers. If the IPP elects non-firm service it would be at greater risk of being
curtailed if there were transmission congestion. A critical issue in Atlantic Canada is that the
rules for managing transmission congestion (who would be curtailed and for how long) are not
well developed. Furthermore, to date there have been relatively limited amounts of intermittent
generation curtailed. Given both these factors it is difficult for IPPs to assess this risk.
Another market access risk that IPPs have to manage is the uncertainty associated with
interconnection costs that they will have to bear. Most Generation Interconnection Procedures
provide for a series of increasingly rigorous cost estimates. Typically, IPPs are awarded contracts
before the final more detailed cost estimates are completed and there is risk that these
interconnection costs estimates increase after the contract price has been established.
Development and Pre-Financial Close risks
A number of development related risks are addressed prior to project achieving financial close
and therefore would not affect the cost or availability of capital. These risks typically determine
project attrition rates. This includes environmental permitting risks and various financial and
economic risks.
Financial and Economic Risks
IPPs also face financing risks associated with changes in financial market conditions during the
period from finalization and acceptance of a contract pricing proposal until the project is
financed. These financial and economic risks include foreign exchange rate variability where
significant changes in foreign exchange rates (e.g., depreciation of the Canadian dollar) can
increase the effective cost of equipment contracts that are priced in a foreign currency (US$ or
Euros). This risk is mitigated to the degree that projects in Atlantic Canada purchase generation
45
This risk is more of a concern in Nova Scotia given its transmission infrastructure and the location of
considerable amounts of generation on Cape Breton with its major load centre in the metro Halifax area.

Financing of Renewable Electricity Projects in Atlantic Canada Page 22
technologies with significant Canadian content or offering appropriate price escalators. Another
financial risk is significant increases in interest rates and investor return expectations after
proposal pricing has been finalized such as occurred in Nova Scotia after its 2007 Renewable
Energy RFP. As discussed, these contributed to delays in the development of a number of
projects and caused the ownership of several projects to change.
4.4 Limited Availability of Lenders and Equity Investors for Smaller Projects
In discussions with debt and equity capital providers, there was a common comment that it is
difficult to provide non-recourse asset level financing for projects less than $50 million in size.
4.4.1 Fixed Costs of Due Diligence and Structuring
The due diligence and structuring costs for a typical renewable power project financing can easily
reach $1 to $2 million in total transaction costs, and a significant portion of the transaction costs
is fixed regardless of the size of the project. Examples of these fixed costs include the
legal costs of the investor and the debt provider;
independent engineer’s report to review the initial cost and performance estimates for the
project and review the ongoing capital draw-down requests for the lenders;
resource assessment;
environmental review;
interconnection review; and
financing and advisory fees.46
Projects that do not have the requisite due diligence will be unable to obtain project financing,
and would require additional credit support from a third party source (equity provider, other
assets or the government) to finance the project.
4.4.2 Greater Profitability of Larger Projects
Most of the capital providers with renewable project financing expertise are large institutions and
need to pursue larger projects to provide a meaningful impact on financial results. Smaller
financial institutions would generally not be capable of executing enough renewable power
projects to develop an appropriate level of expertise. In speaking to financial institutions, project
financiers typically have a minimum size threshold of $50 million for pre-existing relationships
with a $75 to $100 million minimum threshold for most projects.
4.4.3 Developers Pursuing Smaller Projects Typically Lack Experience
The size of project the developers are pursuing is generally a good indicator of the level of
experience a developer has, as an experienced developer would pursue larger opportunities as the
pursuit costs are largely fixed and the economic payback to the developer is greater. Smaller
46
While financing and advisory fees vary with the size of the project, the financing and advisory fees as a
percentage of capital increase significantly for smaller projects to cover the fixed internal costs of providing
these services.
Financing of Renewable Electricity Projects in Atlantic Canada Page 23
projects have difficulty attracting capital and will suffer from lower returns unless the PPA price
offers a sufficiently high premium over the PPA price for larger “utility-scale” projects.
4.4.4 General Illiquidity of Smaller Transaction Sizes
Capital providers that may not hold the investment to the end of its term place a premium on the
ability to sell and trade the investment. Transactions below a certain size will also limit the
universe of potential buyers for the investment and as a result increase pricing.47
4.5 Process for Administering RFPs
Pursuing power project development is inherently a risky process, and project developers strongly
prefer processes which are quick and clear and thus reduce the opportunities for a proposal to be
rejected.48
4.5.1 Insufficient Certainty for Project Developers
The RFP should have transparent criteria for the evaluation and selection of proposals and ensure
that the process has a level playing field for all participants.
4.5.2 Length of Time Pricing Proposal Needs to be Open
Reducing the amount of time a pricing proposal needs to be open reduces attrition because the
project economics are less exposed to market risk (e.g., changes in construction and financing
costs). Therefore, it is desirable to reduce the period between when bids are submitted and
contracts are awarded.49
In addition the cost of maintaining the pricing in a RFP response is a
direct function of the “firmness” of the pricing proposal and the amount of time the pricing
proposal needs to be firm. As the cost for maintaining the pricing proposal is generally “at-risk”
capital for the project developer, the project developers are keen to minimize this amount.
Having larger amounts of “at-risk” capital creates a bias for larger projects and larger developers
who can absorb the increased costs or increases the risks of project defaults by small developers.
4.6 Power Purchase Agreement Terms Leading to Higher Attrition Rates
Lenders pay particular attention to the details of the following terms. While the PPA should be
designed to ensure and incentivize the owner of the project to operate the facilities at a high
performance level, setting the performance levels at an inappropriately high or onerous standard
will increase the risk of default, or potentially make it impossible for the project to obtain
financing. Examples of these terms are discussed below.
47
In the 2011 Ibbotson Risk Premia Over Time Report, which evaluates the cost of equity in the US over
time, Ibbotson estimated an equity investor would need a 4.48% premium to invest in a company with a
market capitalization <$235 million (10th
decile), versus a company with a market capitalization between
$773 and $1.2 billion (7th
decile). 48
Every small developer we spoke to preferred a FIT program, where available. 49
Power Advisory is seeking to do this in Nova Scotia by requiring Proponents to submit bids and accept
the PPA that is offered rather than allowing negotiation of the PPA after contract award. This also ensures
that all proponents are bidding to the same PPA and ensures the same risk allocation across projects.

Financing of Renewable Electricity Projects in Atlantic Canada Page 24
4.6.1 Termination Provisions for Non-Performance
Lenders pay close attention to any termination provisions as the termination of the PPA will
cause the project to enter default, and likely into a situation with a low prospect of recovery as the
value of the project is substantially determined by the value of the PPA. Given the resource
variability for most forms of generation in the renewables sector, termination provisions relating
to a level of power generation are generally set at a threshold which recognizes the resource
variability as the operator has less control over the actual power produced (unlike an operator of a
thermal facility). This is particularly relevant for earlier-stage technologies such as tidal power.
4.6.2 Appropriate Pricing Escalators (Initial and Ongoing)
The risk of project attrition for PPAs without initial pricing escalators increases with the length of
time between the PPA award and the closing of financing. During this period, construction and
financing costs can continue to fluctuate, and in periods of extreme volatility, a sharp increase in
the construction and /or financing costs without a change in the PPA price could cause the
projects to become uneconomic to pursue.50
However, allowing contract prices to escalate prior
to commercial operation increases risks to the buyer and suppliers are able to mitigate these risks
by contracting with the equipment manufacturer and EPC firms.
In addition, having a pricing escalator for the PPA which tracks the costs of operating the facility
is strongly preferred. For debt providers, this can allow the debt service coverage ratios to
increase (rather than decrease) as the remaining PPA life (economic value) diminishes. However,
debt service coverage ratios will only increase to the degree that the proportion of the project
price that escalates with inflation is greater than the proportion of project costs escalating with
inflation. For equity investors, an inflation protected investment is highly sought after.
4.6.3 Pricing Penalties
Capital providers generally prefer incentive-based performance mechanisms to pricing penalties
to encourage performance levels. Introducing pricing penalties can erode the financial strength of
the project when the project is already underperforming, thus increasing the risk of default and
potentially causing the project to be unfinanceable if the risk of default is considered too high.
Therefore, a critical issue is at what performance level such penalties take effect.
50
Québec Wind RFPs are examples of projects needing additional economic incentives introduced after the
initial PPA award in order to finance the projects.

Financing of Renewable Electricity Projects in Atlantic Canada Page 25
5 Review of Current Capital Market Conditions
5.1 Atlantic Canada vs. Other Jurisdictions
To evaluate the current capital market conditions for funding the construction of renewable power
projects in Atlantic Canada, it is important to examine capital market conditions across Canada as
much of the capital to build renewable power projects in Atlantic Canada comes from national
and international investors.51
While smaller projects, such as community-based projects, can be
wholly funded by local capital or are unlikely to attract national or international capital, local
investors would look to the risk and return profile for renewable projects located elsewhere in
Canada as a benchmark.52
However, the financing of smaller projects is more insulated from
broader financial market conditions. The financing for these projects is likely to be influenced
more by the availability of specific programs and policies that support their development and
financing.
Our discussions with renewable sector investors made clear that the issues faced by projects in
Atlantic Canada were similar to the issues faced in developing projects in other jurisdictions and
that projects in Atlantic Canada did not require any adjustment in approach or debt or equity
pricing. As such, this section focuses on the capital market conditions within Canada generally
since we believe that cost and availability of capital for projects in Atlantic Canada is no different
from that for other renewable projects of similar size located elsewhere in Canada.
Global investment in clean energy projects remains high as shown in Figure 4. International
investors continue to look favourably at investing in Canada due to the relative stability of the
economy and relatively high growth rates. For example, Canada’s forecast for GDP growth
remained relatively robust at 2.3% in 2011 (compared to 1.4% for the G10 countries), and is
expected to slow but remain relatively strong at 2.0% in 2012 (compared to 1.2% for the G10
countries).53
Furthermore, the Canadian economy isn’t subject to the same debt overhang as that
plaguing the European Union and the U.S. which adds considerable uncertainty to their capital
markets.
51
Even projects wholly-owned by NSPI, a company located in Atlantic Canada, need to be evaluated in the
context of the Canadian capital markets, as the majority of NSPI’s debt and equity capital is from investors
domiciled across Canada. 52
Subject to a size-based premium, as discussed in the cost of capital Chapter 4. 53
Bloomberg composite of economists, December 2011.

Financing of Renewable Electricity Projects in Atlantic Canada Page 26
Figure 4: Global New Investment in Clean Energy (US$ Billions)54
Data source: Bloomberg
5.2 Equity Capital Markets
5.2.1 Availability of Capital
Ability to raise capital for safe, high-quality investments continues to be strong, while the
continuing volatility in the equity markets makes raising capital for new ventures difficult. As
shown in Figure 5, while the total amount of equity capital raised in Canada has recovered,
raising capital for new companies (initial public offerings) remains a challenge.
54
Source: Bloomberg New Energy Finance
0
20
40
60
80
100
120
140
160
180
2004 2005 2006 2007 2008 2009 2010 2011
YTD Q3

Financing of Renewable Electricity Projects in Atlantic Canada Page 27
Figure 5: Equity Capital Raised in Canada, Initial and Secondary Sales ('000s)
Data source: Bloomberg
For established project developers, raising capital has been relatively straightforward. This is
demonstrated by the ability of Capstone Infrastructure , Innergex Renewable Energy , and
Algonquin Power & Utilities Corp., three electricity generation and infrastructure companies with
significant renewable project holdings, to easily raise equity capital on a bought-deal basis in
2011 to support acquisitions.55
In addition, smaller project developers, which are generally
thinly-capitalized or have a limited track record, got bigger in order to improve access to the
capital markets and have the financial capacity (or buffer) to raise capital when it is advantageous
to do so. Examples in 2011 include developers merging with other developers (Magma Energy’s
acquisition of Plutonic Power), with their affiliated operating portfolio (Innergex Renewable and
Innergex Income Fund), or with a financial sponsor (such as Shear Wind with Inveravante).
Unlisted infrastructure sector funds have also invested in Atlantic Canada, and many
infrastructure funds are looking for investments.56
Thirty-eight infrastructure funds closed in
2011, raising a combined $16 billion and Prequin estimates that $34.3 billion is available for
55
In a bought deal situation, the dealer will fully underwrite the offering. Therefore, the dealer takes the
risk of what it will be able to sell shares for. A bought deal indicates that the dealer is highly confident of
its ability to sell the shares without the benefit of pre-marketing intelligence. This is in contrast to a
marketed deal where the dealer acts on a best-efforts basis. 56
Firelight Infrastructure Partners has invested in Amherst wind farm and the Dalhousie Mountain wind
energy project. Firelight Infrastructure Partners is a JV between OP Trust and Dundee Real Estate Asset
Management with a mandate to invest in renewable energy projects across Canada.

Financing of Renewable Electricity Projects in Atlantic Canada Page 28
infrastructure investments by unlisted infrastructure investors that are targeting North
America.57,58
5.2.2 Cost of Capital
The TSX utility (sub index) closed 2011 flat to 2010, while the broader TSX index closed down
by 12%. The continuing volatility in the broader equity markets has caused investors to focus on
safe, cash flow producing investments.
During 2011, Canadian publicly traded power companies with significant renewable power assets
had a cost of equity of approximately 9.6% to 11.7%.59
These publicly traded companies are a
combination of operating and development assets. The cost of equity range is consistent with
recent equity return expectations for operational assets which is below 10%, and for development
assets which is generally in the mid-teens.60
These observations are further supported by
discussions with other infrastructure sector professionals regarding current valuation levels and
the degree of competition for safe infrastructure investments, such as renewable energy projects
which are underpinned with long-term power purchase agreements with counterparties with
strong credit.
Figure 6: Canadian Equity Market Indices
Data source: Bloomberg
57
Prequin quarterly infrastructure review, Q3 2011. 58
“Infrastructure Ends 2011 on Fundraising High” (Press release). Prequin. January 4, 2012.
http://www.preqin.com/docs/press/Infrastructure_2011.pdf 59
The cost of equity capital for Northland, Capstone, Innergex, Brookfield, Algonquin, and TransAlta were
estimated using CAPM on November 2, 2011. Source: Bloomberg 60
Return expectations will vary according to the specifics of the assets. Return expectations will generally
be higher for smaller projects.
70
75
80
85
90
95
100
105
110
Jan
2011
Feb
2011
Mar
2011
Apr
2011
May
2011
Jun
2011
Jul
2011
Aug
2011
Sep
2011
Oct
2011
Nov
2011
Dec
2011
TSX Index TSX Utilities (sub-index)

Financing of Renewable Electricity Projects in Atlantic Canada Page 29
5.3 Debt Capital Markets
5.3.1 Availability of Capital
Significant debt capital is available in the Canadian market and as shown in Figure 7 below, the
value of bond and syndicated loan transactions completed in Canada in 2011 was at its highest
level in the past five years and more than double the amount of debt capital raised in 2009.
Figure 7: Canadian Bonds and Syndicated Loans (‘000s)
Data source: Bloomberg
For renewable project developers, there are two main types of project financing available: (i) a
mini-perm structure which is a form of bridge financing which requires a refinancing with a term
loan or a bond no later than five years post project completion; or (ii) a permanent term loan
which provides a locked-in rate over the entire term of the loan.61, 62
The choice between option
(i) or (ii) depends on the depth of the each market at a given point in time, and also on the
developers’ assessment of the refinancing risk as the project will book a gain or loss on the
difference between the assumed and actual refinancing spread at the time of refinancing.63
61
The refinancing period for the mini-perm will vary but is frequently for a period no more than five years. 62
In a mini-perm facility the cost of the bridge loan increases each year post completion. 63
The mini-perm market is much deeper in terms of the size of market and the number of participants.
However, capital providers compete for quality projects and savvy developers continually evaluate and
choose between all their sources of capital for each project.

Financing of Renewable Electricity Projects in Atlantic Canada Page 30
Under a permanent term loan structure, the entire repayment schedule (principal and interest) is
specified over the entire term (frequently 18-years post COD for a 20-year PPA). In a mini-perm
structure, the amortization and frequently the base rate portion of the interest payment is set over
the full term (the same 18-years post COD as in the term loan), and the developer must refinance
the mini-perm with a new term loan at up to five years post project completion. If credit spread at
the time of refinancing is lower than the assumption used to set the original mini-perm
amortization schedule, then the developer will realize a release of equity; conversely if the credit
spread is higher than expected, then the developers’ dividends from the project will be reduced.
A mini-perm structure is a bet by the developer than the credit spread will be below the assumed
spread before the end of the mini-perm facility, and that the weighted-average interest rate is
below what would otherwise be available under a permanent term loan structure.
Canadian and US banks will generally offer only a mini-perm structure, while life insurance
companies and pensions funds offer fixed rate project debt financing over the entire term of the
financing and may also decide to invest equity capital as well. Japanese and European banks
traditionally have offered both mini-perm and long-term fixed rate project financing structures.
While Japanese banks are still active in the Canadian market, many European banks have
significantly curtailed their activities in Canada.64, 65
As European banks were significant lenders
to renewable energy projects globally, there should be an impact from these lenders leaving the
market, but so far, there remains strong demand and available capital from the other industry
participants.
Given the continuing volatility in Europe it is difficult to determine the number of active power
project financing firms in Canada. However, at least 30 different institutions have successfully
provided project financing debt to Canadian renewable projects since 2010.66
These specialized project finance lenders will not lend to smaller community projects as it would
not meet their minimum size threshold ($30 to $50 million). For these lenders to lend to a
64
Many of the prominent European lenders to the renewable sector are based in or have significant
exposure to countries which have received or are considered at-risk of requiring a bail-out which would
cause the value of their debt to be written down. The European Banking Authority in its latest round of
stress tests dated December 8, 2011, estimates that the European banks have a shortfall of €115 billion
including sovereign capital buffer. Many European banks have shut down or ceased their Canadian lending
activities. At times, the decision to shut down has come abruptly, even while in the late stages of a
transaction. 65
Basel III, which will be phased in from January 1, 2013 to January 1, 2019, provides for a set of
comprehensive reform measures designed to strengthen the regulation, supervision and risk management of
the banking sector. The regulations are generally expected to increase the cost of financing as banks will
have higher capital requirements (and thus have less ability to lend or generate revenue on the same capital
base). The regulations also encourage banks to have a closer match between the maturities of a bank’s
assets and liabilities. As the majority of the banks’ liabilities are on a short-term basis, it’s believed that a
bank’s capacity to offer long-term project financings will be become more limited and result in more mini-
perm financings. 66
This is based on the review of the public disclosure for sixteen renewable power projects with financial
close announced in 2010 and 2011. Canadian and US Banks: CIBC, BMO, TD, BNS, National Bank,
Union Bank; Life insurance companies: Manulife and the other major life insurance companies; Funds and
Pension Funds: All major Canadian pension funds, such as Caisse de Depot, Stonebridge; Japanese Banks:
Bank of Tokyo, Sumitomo, Mizuho, SMBC; European Banks: Deutsche Bank, KFW, Landesbank,
Siemens, Naxitis, Rabobank, BLB, Bilbao, Dexia, Nord L/B, Caixanova, and WestLB.

Financing of Renewable Electricity Projects in Atlantic Canada Page 31
community project, the community projects would need to be aggregated to meet the minimum
size threshold.67
5.3.2 Cost of Capital
The current all-in cost of debt for A and BBB rated 10-year loans is at a 5-year low, despite credit
spreads which have remained in line with credits spreads from 2009/2010.68
The continued
decline in base rates has caused the decline in financing costs as pricing and other debt terms
have largely remained the same:
Debt / capitalization: ~75%69
Amortization term: 18-years (assuming a 20-year PPA)
DSCR (minimum): 1.20x – 1.25x
Short-Term Rates: ~1.5% (6 month Canadian LIBOR)70
Swapped Rates: ~3.0%71
Credit Spread: 225 - 250 bps72
All-in Rates: 5.25% to 5.50%
Base rates are expected to remain low as the Bank of Canada has kept and is expected to continue
to keep overnight lending rates at 1.0% until the end of 2012.73
Going forward, there should be
upward pressure on credit spreads for renewable projects as many European renewable power
sector lenders have exited the Canadian markets pending the resolution of the sovereign debt
situation in Europe.74
So far we understand that credit spreads for renewable projects in Canada
67
There have been government sponsored programs, such as PEI Energy Savings Bonds, which were
designed to allow Islanders to invest in the Eastern Kings Wind Farm. However, unlike the project
financings discussed in this report where debt investors have recourse only to the project assets, the PEI
Energy Savings Bonds are fully guaranteed by the Province of PEI and thus the repayment risk for the debt
investors is not dependent on the performance of the wind farm and thus avoids the requirement for due
diligence and structuring costs on the part of the investors. Approximately $6 to $7 million was raised
under this program. 68
A credit spread is the difference in the all-in interest rate and the corresponding rate on the “risk-less”
benchmark security. The credit spread is primarily meant to compensate the investor for the incremental
risk of default above and beyond the default risk in the benchmark security. For floating-rate debt, the
credit spread may be over a benchmark interest rate such as LIBOR (London Interbank Offered Rate),
Bankers’ Acceptances or Prime rates. For fixed rate debt, the credit spread would be over the yield for a
Bank of Canada bond (treasury security) with the same term. 69
Subject to achieving the debt service coverage ratios (DSCRs) indicated. 70
This will vary depending on reference base rate used by the bank 71
The lender will likely require a portion of the base rate to be fixed over the amortization period of the
loan. The swapped rate is the rate the project will pay the swap provider in exchange for receiving the
floating rate over the period. The actual swap rate will depend on the credit quality of the project and the
actual cash flow profile of the project. 72
The credit spread is quoted on a floating rate basis, typically a reference benchmark such as LIBOR,
BAs, or Prime 73
The Bank of Canada currently maintains overnight lending of 1.0%, which is very low on a historic basis
(for comparison, the overnight lending rate was 4.25% in 2007). Economists expect the Bank of Canada to
maintain the 1.0% rate in 2012. 74
In discussions with other project financiers, many European banks have shut down or ceased their
Canadian or North American project finance lending activities. At times, the decision to shut down was
made even while in the late-stages of a transaction or a secondary sale of the debt to another lender

Financing of Renewable Electricity Projects in Atlantic Canada Page 32
have not been adversely impacted as there remains strong demand among debt investors for
infrastructure sector debt.
Figure 8: Canadian Bond Yields - GOC vs. Utility Sector (‘000s)
Data source: Bloomberg
5.4 Conclusions
There does not appear to be any general impediment to raising capital for utility-scale renewable
power projects in Atlantic Canada. While the market remains volatile and could change quickly,
there is demonstrated interest and capital available from lenders and equity investors for utility-
scale renewable power projects developed by IPPs.
Figure 9 summarizes the required equity after tax returns and cost of debt for wind and solar PV
projects financed in the U.S. While the U.S. and Canadian capital markets are highly integrated,
there can be differences in required underlying returns given differences in inflation expectations,
monetary policy, and resulting investor expectations regarding exchange rates, and the use of
more complicated tax structures. Given these differences, Figure 9 is presented because it
represents a comprehensive review of the required return on equities and costs of debt. The
greater spread for equity returns reflects that equity is paid after debt and is inherently more risky.
The lower band for equity is associated with larger projects with higher-quality cash flows using
immediately after closing. Several European banks are reportedly in the market selling their entire
renewable project finance portfolios.
0.00%
1.00%
2.00%
3.00%
4.00%
5.00%
6.00%
7.00%
8.00%
2007 2008 2009 2010 2011
Canada 10-Year Canadian Utility 10-Year (A) Canadian Utility 10-Year (BBB)

Financing of Renewable Electricity Projects in Atlantic Canada Page 33
proven technologies which can attract numerous equity investors who must compete to participate
and the higher band is for smaller projects or those using nascent technologies with higher
investor risk given limited operating performance or a lower-quality cash flow profile.
Figure 9: Estimates of Current Debt and Equity Terms
Source: Mintz Levin
2.2%
2.5%
5.75%
7%
7.5%
8.0%
3.7%
3.5%
7.25%
8%
11%
12%
0% 5% 10% 15%
PV
Wind
PV
PV
Wind
Wind (7-25 yrs.)
(LIBOR+200-300bp)
(LIBOR+175-325bp) (4-18 yrs.)
(8-15 yrs.)
Direct / Sponsor Equity
(Long Term) **
Fixed Debt*
Floating Debt*
*Debt has an upfront fee of 200-275bp.
**Equity returns are after-tax.

Financing of Renewable Electricity Projects in Atlantic Canada Page 34
6 Financing Options for Atlantic Canada
The preceding analysis and discussion indicates that there aren’t unique challenges to financing
renewable projects in Atlantic Canada. The primary challenges that renewable energy projects in
Atlantic Canada face are similar to those present in other markets, with the most significant faced
by smaller renewable energy projects developed by community or aboriginal groups. Given the
economies of scale associated with financing renewable energy projects and the more limited
financial resources of these groups, they face distinct challenges.
The following section presents a series of case studies, the first of which focuses on the financing
of a large wind project and represents a relatively typical project finance approach which is
commonly used to finance large renewable energy projects. The subsequent case studies review
different programs and entities that have been established to help aboriginal and community
groups overcome the barriers to financing smaller renewable energy projects. These case studies
represent models that could be employed in Atlantic Canada.
6.1 Large Wind: Shear Wind
Purpose of Case Study
This case study considers Shear Wind, a local developer based in Atlantic Canada which was able
to secure funds to build the $150 million, 62.1 MW Glen Dhu project located in Nova Scotia.
Shear Wind is an example of a local developer’s journey to secure development and project
capital to build utility-scale renewable projects while remaining independent. The project
reached commercial operation on March 31, 2011.
The Finance Model
Initial Stages
Shear Wind initially incorporated on December 17, 2004 with a focus on developing wind
projects, primarily in Nova Scotia. Shear Wind’s initial projects were joint-venture agreements
with Renewable Energy Resources Ltd. (RESL), and Shear Wind was able to raise $6.1 million
through three private placements of flow-through and regular Class A common shares to fund the
purchase of six turbines and pursue the development of a portfolio of potential 50 to 100 MW
wind sites in Nova Scotia.
In 2006, Shear Wind amalgamated with MWP Capital, a capital pool company (CPC)75
, to
become a public company on the TSX. The new pro-forma company had $2.6 million of cash
remaining on hand.
Development Costs
On August 30, 2007, Shear Wind submitted a proposal to Nova Scotia Power to construct the
Glen Dhu project, and spent approximately $500,000 on the initial bid submission and expected
75
A CPC is a publicly-listed, limited blind pool formed for the purposes of identifying and acquiring a
business. The amalgamation of the blind pool and the target business is a qualifying transaction.

Financing of Renewable Electricity Projects in Atlantic Canada Page 35
to incur an additional $500,000 in costs to bring the project to a construction ready stage. The
initial 20 MW of the project was anticipated to be in-service by November 30, 2009.
However, Shear Wind was unable to secure the requisite financing due to the severe turmoil in
the world financial markets between 2007 and 2009. Shear Wind incurred a $500,000 penalty for
not having the first 20 MW of generation up and running by November 30, 2009 and incurred
additional carrying costs to maintain the $2.7 million of deposits for the performance security and
interconnection studies for the Glen Dhu facility.76
Securing Project Capital
However, the strengthening of the Canadian dollar against the Euro caused the project to become
economic and the initial cost estimate of $270 million for a 55 MW project declined to an actual
project cost of $150 million for the 62.1 MW project. On November 3rd
, 2009, Shear Wind
closed a private placement for $26.9 million from Inveravante Inversiones Universales, S.L.
(Inveravante), a Spanish utility conglomerate with an international portfolio of wind projects.
Upon closing of the private placement, Inveravante would own 62% of the common shares of
Shear Wind on a fully-diluted basis, and on June 25, 2010, Shear Wind secured the additional
equity funds required to build the 62.1 MW Glen Dhu project by selling a 49% interest in the
project to Inveravante in exchange for $22 million. Securing these funds allowed Shear Wind to
place deposits on the turbines ($24 million) and begin construction.
Project Details
Capacity: 62.1 MW (27 Enercon E-82 2.3 MW turbines)
Location: East of New Glasgow, Nova Scotia
Total Capital Cost: $150 million
Senior Debt Financing: $114.5 million (78%)
o Construction Financing $107 million
18 year term
o $1.5 million LCs to NS Power
o $6.0 million LCs for the debt reserve
Equity Financing: $35 million (22%)
o $32.9 million equity
o $2.1 million subordinated loan by Inveravante
The loan is secured by a first priority lien on substantially all of the assets of GDWE LP,
the JV partnership between Shear Wind and Inveravante which owns the project
company
The lenders are Banco Bilbao Vizcaya Argentaria SA (BBVA) and Instituto de Credito
Oficial (ICO)
76
During this time period, some of Shear Wind’s peers sold their projects or development companies to
well-capitalized partners, and these partners were able to balance sheet finance the start of these projects
despite volatile market conditions.

Financing of Renewable Electricity Projects in Atlantic Canada Page 36
Summary
Shear Wind’s Glen Dhu project is an example of a successful utility-scale wind development.
Despite Shear Wind’s efforts to remain wholly independent, the case study demonstrates that
large-scale power development is expensive and difficult, and typically requires partnership or
backing of a large, well-capitalized partner for a utility-scale project.
6.2 Cooperative: Water Power Group
This case study describes the approach being employed by a company in Ontario which has
developed an alternative financing model for small renewable energy projects that does not
require separate project assessments by lenders and does not require finding equity sources for
each project.
The Water Power Group, as its name implies, is focused on developing and owning small
hydroelectric sites in Ontario. These hydroelectric projects will be financed by forming
unincorporated joint ventures that will obtain the equity and long-term debt for each project. Up
to 49% equity is to be offered to community or aboriginal groups and by so doing qualifies for
higher power purchase rates under the Ontario Power Authority’s (OPA’s) FIT program. The
remaining project equity would be provided by the Water Power Group Limited Partnership. The
Water Power Group has received a term sheet, subject to due diligence, for 40-year debt under
favourable terms with up to 85% coverage which would be made available to these projects.
The model rests on four legs:
1) Use of local cooperative or joint venture capital for the equity portion of the investment.
The cooperative is established to secure equity from interested stakeholders in the local
community, which could include the municipality itself or individuals in the community.
Under the cooperative structure participants will benefit from the diversity provided by
investing in multiple projects.
2) Establishment of an overall cooperative structure within which to bundle each project.
This allows debt finance for the individual projects to come under the broader umbrella
so that each project does not require separate negotiations over the terms of the loans.
3) Replication of project types (all small hydroelectric projects, from 0.5-5 MW) so that the
company’s expertise and the business model can be extended over more projects.
4) Favourable treatment accorded community and aboriginal projects under the OPA’s FIT
program and the various programs put in place by the OPA and Ontario Government to
promote the development of community and aboriginal projects.
The company has been in existence for four years. They look for opportunities such as small
projects within a community. They seek to utilize existing dams in which they can install low-
impact turbines to generate electricity.
Then they approach the community to secure local support for the project and local interest in
participating in the development. They first seek equity investors within the community or
surrounding communities. If they find them, the project can be set up as a Joint Venture between
the Water Power Group and the local investors. Water Power Group will also assist the local
Financing of Renewable Electricity Projects in Atlantic Canada Page 37
community with forming the joint venture or coop, and with raising the local equity. The projects
are not dependent on raising local equity. Water Power Group’s preference is that community
equity be up to 25%; debt can be up to 85%, requiring only 15% equity, but the preference is for
community equity to be at the top of its range, thereby reducing reliance on debt. The debt can
come from insurance companies, for whom longer PPA durations and the guaranteed nature of
cash flows from the buyer are favourable.
If there are not enough individual investors in the host community or surrounding ones, it would
rely on equity from the limited partnership or use a cooperative structure for which it is seeking
approval from the Financial Services Commission of Ontario. The cooperative structure allows
many projects to fall under the financial umbrella of the overall cooperative entity, eliminating
the need to raise funds individually for each of these small projects. In effect, this structure
allows these projects to be bundled. The company has a line of term debt that they can access as
needed.
The company suggests that this model can also work as a public-private partnership between
them and the municipality. They bring the technical expertise that the local community lacks.
The small size of the projects requires such a financing structure. For projects of the size being
considered, which range from $3 to $10 million, it would cost about $200 thousand to raise the
necessary funds. The venture capital community was not interested because of the small size of
these projects.
Community support and involvement are keys to this model. The company expects that the
community support shortens approval time.
Not all projects using a cooperative structure have succeeded. For example, the Pukwis Energy
Co-op, which was planning to build a 20 MW wind farm on Georgina Island in Lake Simcoe,
Ontario, as a joint venture with the Chippewas of Georgina Island First Nation, has suspended
operations, citing (in a brief press release) problems with finance as one of the reasons for the
suspension.
Other Supporting Programs
Ontario has a number of programs to support community renewable projects. The Community
Energy Partnerships Program (CEPP) is a grant program to support community power in Ontario
and assists community power projects through funding of up to $200,000. Eligible expenses
include site investigation, resource assessment, business planning, engineering studies, and
studies needed for Renewable Energy Approval or other approvals. As CEPP Program Manager,
the Community Power Fund provides education about the CEPP, helps people through the
application process, prepares the initial screening of and recommendations regarding applications,
and provides approved project monitoring. Within the Community Power Fund, the Investment
Funds Platform includes Direct Investment Funds to maximize funding for community power
across the full capital spectrum, and fund management and fiduciary services designed to harness
and accelerate fundraising capacity at the local level. Since 2007, CP Fund consulted with a
diverse range of community power project developers, and allocated $1.5 million to assist in the

Financing of Renewable Electricity Projects in Atlantic Canada Page 38
development of 25 renewable energy projects owned by Ontario-based community and aboriginal
groups.
6.3 Master Financing Facility
One financing approach that is receiving increasing attention in the US is a Master Financing
Facility under which a developer bundles various projects together to reduce transaction costs and
the overall risk profile. Under such a financing facility, the financier agrees to finance every
project that a developer puts in service between specific dates up to some dollar amount assuming
that the projects satisfy specific criteria agreed to by the developer and financier. These criteria
are likely to include the project capacity factor, cost, and credit quality of the buyer (recognizing
that the developer might also being seeking to finance projects in other jurisdictions or with other
buyers). Alternatively, the developer will have the projects under contract allowing the financier
to have a high level of comfort regarding the specific projects.
Master Financing Facilities are often used in the US to finance portfolios of solar PV projects. A
critical element to financing such projects is efficiently utilizing the significant tax benefits that
they generate. With a 30% investment tax credit and accelerated depreciation, tax benefits are
critical to the financing of such projects. These transactions are structured around leases where
the lessor owns the projects for tax purposes and the lessee sells the electricity, and collects
revenue, much of which it pays to the lessor as rent for the use of the equipment, with the residual
representing operating profit.
The difficulty in applying bonus depreciation (Class 43) tax-driven financing structures in Canada
(based on current regulations) is that the purchaser for the tax attribute must already be generating
similar income (such as income in the generation sector) to apply the accelerated depreciation
against, whereas in the US the tax credits and accelerated losses can be applied against any
income.
Canadian renewable power projects can elect to receive Canadian Renewable and Conservation
Expense (CRCE) credits, which can be used by third-party investors. The CRCE program was
adapted from a program to allow oil and gas and mining companies to write off the upfront soft
costs incurred in development. For projects in the renewable power sector, effective use of this
credit artificially forces the development into two phases – a turbine phase which pays for a set of
test turbines to be built, followed by an infill construction phase which occurs after the 120-day
test period. CRCE tax investors fund the capital for the turbine phase and are eligible to claim the
majority of their investment as deductions against income in the first year of investment, be
carried forward indefinitely, or flow through to investors under a flow-through share agreement.
The artificial delay in the construction period means that developers need to balance the delay in
the construction schedule with the cost of funds CRCE financing provides. The majority of
renewable projects in Canada are not funded in this manner, although small developers may use
CRCE to finance their development efforts. Contrast this to the US market where tax-driven
financing structures are necessary in order to achieve a competitive cost of capital for financing
renewable projects
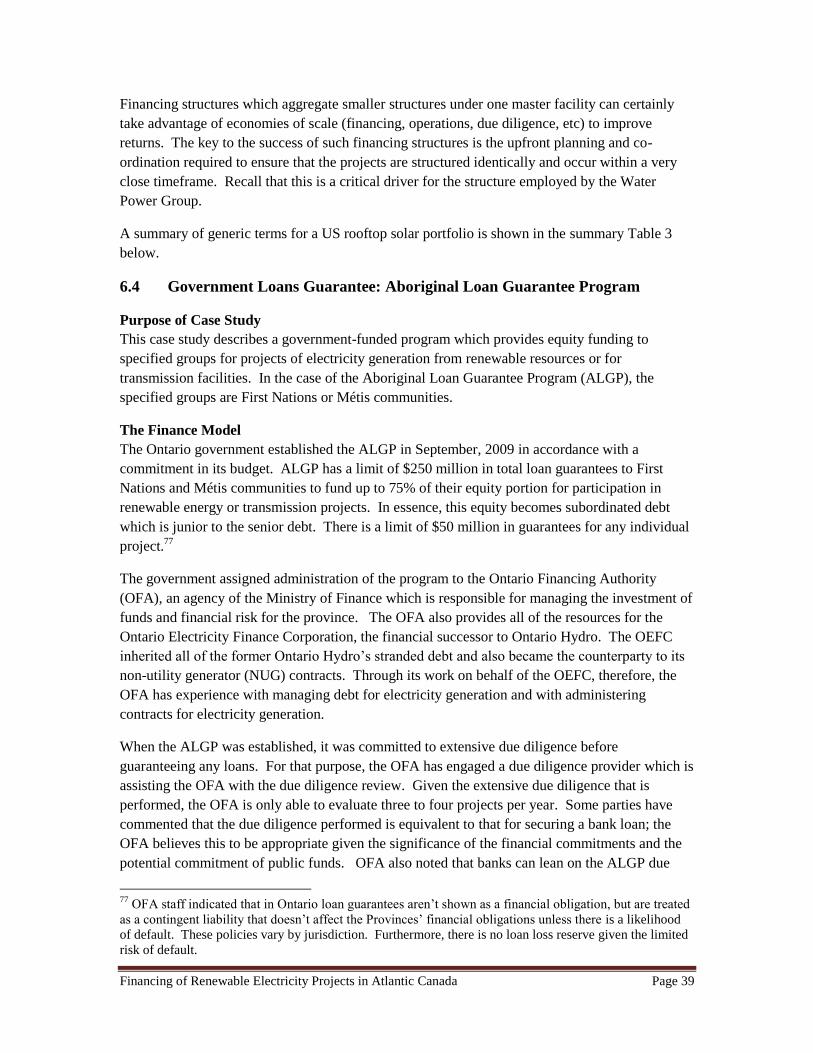
Financing of Renewable Electricity Projects in Atlantic Canada Page 39
Financing structures which aggregate smaller structures under one master facility can certainly
take advantage of economies of scale (financing, operations, due diligence, etc) to improve
returns. The key to the success of such financing structures is the upfront planning and co-
ordination required to ensure that the projects are structured identically and occur within a very
close timeframe. Recall that this is a critical driver for the structure employed by the Water
Power Group.
A summary of generic terms for a US rooftop solar portfolio is shown in the summary Table 3
below.
6.4 Government Loans Guarantee: Aboriginal Loan Guarantee Program
Purpose of Case Study
This case study describes a government-funded program which provides equity funding to
specified groups for projects of electricity generation from renewable resources or for
transmission facilities. In the case of the Aboriginal Loan Guarantee Program (ALGP), the
specified groups are First Nations or Métis communities.
The Finance Model
The Ontario government established the ALGP in September, 2009 in accordance with a
commitment in its budget. ALGP has a limit of $250 million in total loan guarantees to First
Nations and Métis communities to fund up to 75% of their equity portion for participation in
renewable energy or transmission projects. In essence, this equity becomes subordinated debt
which is junior to the senior debt. There is a limit of $50 million in guarantees for any individual
project.77
The government assigned administration of the program to the Ontario Financing Authority
(OFA), an agency of the Ministry of Finance which is responsible for managing the investment of
funds and financial risk for the province. The OFA also provides all of the resources for the
Ontario Electricity Finance Corporation, the financial successor to Ontario Hydro. The OEFC
inherited all of the former Ontario Hydro’s stranded debt and also became the counterparty to its
non-utility generator (NUG) contracts. Through its work on behalf of the OEFC, therefore, the
OFA has experience with managing debt for electricity generation and with administering
contracts for electricity generation.
When the ALGP was established, it was committed to extensive due diligence before
guaranteeing any loans. For that purpose, the OFA has engaged a due diligence provider which is
assisting the OFA with the due diligence review. Given the extensive due diligence that is
performed, the OFA is only able to evaluate three to four projects per year. Some parties have
commented that the due diligence performed is equivalent to that for securing a bank loan; the
OFA believes this to be appropriate given the significance of the financial commitments and the
potential commitment of public funds. OFA also noted that banks can lean on the ALGP due
77
OFA staff indicated that in Ontario loan guarantees aren’t shown as a financial obligation, but are treated
as a contingent liability that doesn’t affect the Provinces’ financial obligations unless there is a likelihood
of default. These policies vary by jurisdiction. Furthermore, there is no loan loss reserve given the limited
risk of default.

Financing of Renewable Electricity Projects in Atlantic Canada Page 40
diligence and that this would reduce the burden on the project and proponent. Most projects are
able to secure more favourable terms with lenders and the equity partners based on the technical
support and expertise provided by the ALGP team. While there is a loan guarantee fee, it isn’t
based on cost recovery, but is expected to cover due diligence costs over the loan term. OFA
suggested that a minimum project size limit would probably be appropriate given the significant
due diligence resources devoted to evaluating each project.78
Only the Minister of Finance can commit the province financially, so the OFA’s role is ultimately
to make recommendations to the Minister.
The ALGP is in keeping with the Ontario government’s commitment to promote the involvement
of aboriginal communities in development of renewable energy in the province. Another
incentive for such groups is that wind power and hydroelectric projects which are at least partly
owned by aboriginal communities are eligible for an adder to the purchase price under the Feed in
Tariff (FIT). The maximum adder is 1.5 cents per kWh for projects in which the aboriginal
community has over 50% equity ownership.
Experience
Several First Nations have applied to the OFA for loan guarantees under the ALGP for renewable
generation projects. The most advanced project is the M’Cheeging First Nation’s Mother Earth
Renewable Energy (MERE) wind power project, a 4 MW project on Manitoulin Island. The
project is under construction with the bases for the two wind turbines installed in the summer of
2011.Turbine erection is underway and the project is expected to be in service in the spring of
2012. This project is 100% owned by the First Nation. It has received a loan guarantee of $8.5
million from the ALGP.
Also on Manitoulin Island, the United Chiefs and Councils of Manitoulin (UCCM – a group of
the First Nations communities on Manitoulin Island) have applied to the OFA for a loan
guarantee for their portion of the McLean’s Mountain Wind project, a joint venture between
UCCM and Northland Power, an experienced power developer. A complete Renewable
Environmental Assessment has been filed with the Ontario Ministry of the Environment and
construction start is anticipated in 2012.
The Moose Cree First Nation has received a conditional offer of a loan guarantee from ALGP for
its equity investment in the Lower Mattagami project that is planned by Ontario Power
Generation for the refurbishment and extension of four generation stations on the Lower
Mattagami River.79
The process of applying to the OFA for a loan guarantee can itself add value for the project. For
example, the OFA due diligence procedure will inspect the partnership agreements between the
First Nation and its partner, giving OFA a chance to identify potential future problems in the
agreement. The OFA also has helped the First Nations’ consultants to understand the
78
OFA staff suggested that a grant program may be more appropriate if the focus were on smaller size
projects. 79
Source: newsletter from environmental lawyers Willms and Shier.
http://www.willmsshier.com/newsletters.asp?id=63

Financing of Renewable Electricity Projects in Atlantic Canada Page 41
requirements for the project to obtain finance. This can be an advantage during the application
for debt finance.
Without the ALGP, it is doubtful that these projects would have progressed as they have. The
First Nations communities do not have sufficient financial resources to contribute their share of
equity to a project as large as McLean’s Mountain. It is possible that they could find a lender or
partner to provide a loan for their equity part, but such a loan to a First Nations community would
likely carry such a high interest rate as to make the project no longer economic.80
Extending this model
Extending this model to community groups would require a commitment from government or
other agency, and its successful extension might require more than simply the loan guarantee for
the debt portion. The ALGP does not fund the initial development work, such as verifying the
resource and performing feasibility studies. The cost of this up front work is much less than the
cost of building the project, but is still significant enough to exhaust the resources of some
communities. Aboriginal communities in Ontario have access to the Aboriginal Renewable
Energy Fund, administered by the OPA, which funds from 40% to 80% of the development costs
for renewable projects, with a maximum of $500,000 per project.
Non-aboriginal community projects in Ontario can obtain loans to help with the initial stages of a
project. Infrastructure Ontario provides loans that help start capital projects of municipal
corporations, including municipal electric utilities. Eligible projects include construction of
alternative energy facilities, with maximum funding per project of $500,000. In addition, as
noted in the previous case study, Ontario has its Community Energy Partnerships Program.
These two case studies illustrate the support that community-based groups need to help them
organize and fund their participation in renewable energy projects. For communities which can
access local financial resources, required assistance might be limited to institutional support for
the renewable project organization and for the initial phases of the renewable project
development. Such communities might also need some funding for development costs like
resource assessment and preparation of documents for environmental and other approvals.
Communities which do not have such financial resources will likely need financial support for the
initial phases of project development as well as access to loan guarantees or other support to fund
their equity investment in the project.
6.5 Community Economic Development Investment Fund (CEDIF)
Six CEDIFs have been awarded contracts for the development of twelve renewable energy
projects under Nova Scotia’s COMFIT program and are the primary financial vehicle that is
being used to fund community renewable energy projects in Nova Scotia.
A CEDIF is a pool of capital, formed through the sale of shares (or units), to persons within a
defined community, created to operate or invest in local business. It must have at least six
80
Furthermore, financing projects can be difficult if they are located on reserve lands given legal
limitations on land use and requirements for federal approval.

Financing of Renewable Electricity Projects in Atlantic Canada Page 42
directors elected from the defined community. Investors in CEDIFs qualify for a 35% equity tax
credit for Nova Scotia income taxes and are eligible for further equity tax credits of 20 and 10%
at the 5 and 10 year investment anniversary. CEDIFs were established to reduce the amount of
capital leaving the province through mutual funds and registered retirement savings plans. The
CEDIF program was established over 11 years ago and over 40 CEDIFs have invested in a
variety of local businesses. The CEDIF model is readily adapted to development of community
renewable energy projects.
Eight CEDIFs in Nova Scotia have invested in the creation of Scotian Windfields Inc., which has
a mandate to develop community-based wind energy projects in Nova Scotia. One of these
CEDIFs is Colchester-Cumberland Wind Field (CCWF) Inc. CCWF has raised close to $1.5
million in equity, secured $1.2 million in debt and has one 800 kW Enercon wind turbine in
operation with a 20-year PPA with NSPI and plans to install an additional 800 kW wind turbine
and two 50 kW wind turbines. CCWF’s success appears to be attributable to a dedicated
management team and strong focus on marketing of the shares.
Power Advisory understands that some of the initial CEDIFs that were established to fund the
development of renewable energy projects failed when the investments were used for early stage
project feasibility assessment and the projects proved not to be economically viable or successful
in securing a contract. The COMFIT program clearly mitigates these risks once an application
has been accepted.
6.6 Toronto Renewable Energy Co-operative
The Toronto Renewable Energy Co-operative (TREC) was formed in 1999 with the purpose of
developing and operating wind turbines. Its wind energy arm, WindShare, is the owner and
operator of a single 660 kW wind turbine on the Canadian National Exhibition grounds near the
Toronto waterfront. WindShare is a for-profit affiliate of the non-profit TREC.
The total cost of the project was about $1.6 million. This project was developed without any
funding from a financial institution. It was built in 2002.
The project is a 50/50 joint venture between TREC and Toronto Hydro. Toronto Hydro paid half
of the total project cost and received half of the energy produced as its return. TREC’s share of
the cost was funded by selling shares to residents of Toronto. Residents purchased a membership
share for $1 and then at least five, but no more than fifty, Preferred Shares at $100 each. Over
400 Toronto residents purchased shares, fully subscribing the $800 thousand needed for the
project.81
TREC’s share of the project’s initial development was funded through two preferential loans
from government sources: a partially forgivable loan from the federal Environment Ministry and
a loan from the Toronto Atmospheric Fund (TAF), an agency of the City of Toronto. The federal
loan carried no interest. The TAF loan carried an interest rate of 5% and was repayable in nine
81
Residents actually purchased more than $800 thousand in shares; the excess is held in trust pending
investment in future projects.

Financing of Renewable Electricity Projects in Atlantic Canada Page 43
equal monthly installments from May 1 to December 1 of 2003. Funds to repay the TAF loan
came from the co-op members.
This project had a significant technical difficulty due to the failure of its turbine supplier. The
supplier went bankrupt essentially as it delivered the turbine. TREC had ordered, and expected to
receive, a 750 kW turbine, but the supplier only had a 660 kW turbine. It delivered the smaller
turbine with a promise to replace it within a year, but that promise failed due to the bankruptcy.
Also because of the bankruptcy, there could be no maintenance and support contract with the
original equipment manufacturer. As a result, in the early years of the project the turbine was
down for extended periods because parts were not available.
Because the project carried no debt and all of its equity came from Toronto Hydro and from
residents willing to accept the risk of project non-performance, it was able to continue to operate
throughout these difficulties.
TREC has extended this finance model to create SolarShare. This is a non-profit co-operative
whose funds are used to finance a portfolio of large and small solar projects throughout the
province. SolarShare sells bonds at $1,000 each, with a 5% rate of return and a five-year term.
6.7 Summary
The following table is a summary of the case studies. The ALGP isn’t reviewed given that this
information isn’t publicly available. For a summary of current market terms see section 5.3.1.
Table 3: Summary of the Case Studies
Name Shear Wind Water
Power
Group
Master Financing
Facility
Colchester-
Cumberland
Wind
TREC
Type of
Project
Wind - Private
Sector
Hydro –
Private
Sector
Solar – Private
Sector
Wind -
Community
Wind-
Co-op
Size of
Project
(MW and $
mm)
62.1 MW
($150 mm)
$3 to $10
mm
<1 MW,
portfolios
aggregated to
min 10 to 20
MW
1.7 MW
($5.15 mm)
660kW
$1.6 mm
Capital
Structure
(% Debt/
Capital)
78% 75% to
85%
45% to 50%
(debt)
35% to 40% (tax
equity)
48% 50/50 JV with
Toronto Hydro
0% debt on
coop part
Return on
Equity
n/a n/a Low-mid teens 9.2% Varies with
profits
Cost of Debt Fixed rate of
3.462% +
credit spread
n/a n/a 5.75% 5% on Toronto
Atmospheric
Fund.
Term of
Debt
18 years 40 years 15 years
(depends on
portfolio
5 and 10
years
Repaid within
2 years.

Financing of Renewable Electricity Projects in Atlantic Canada Page 44
composition and
structure used)
Structure of
Debt $114.5 mm
total
$107 mm
construction
financing
$1.6 mm PPA
letter of credit
$6 mm for
reserves
n/a Depends on the
financing
structure used
$2,475,000 Debt only for
early
development
costs; repaid
when co-op
financing in
place, within 2
years.
Source of
Equity Inveravante
(including a
$2.1 mm
subordinated
loan)
Public markets
n/a Developers’
sponsor for pure
equity and tax
equity sponsor
for tax equity
Share
offering
50% Toronto
Hydro; 50%
shares sold to
local residents
with $500
minimum and
$5000
maximum
investment
Source of
Debt Banco Bilbao
Vizcaya
Argentaria SA
Banco Espanol
de Credito SA
Instituto de
Credito
n/a Project finance
bank or tax
investor which is
also a lending
institution
Local
Cooperative
Environment
Canada and
Toronto
Atmospheric
Fund.
Source: Power Advisory

Financing of Renewable Electricity Projects in Atlantic Canada Page 45
7 Policy Considerations
This chapter reviews government policies that can be used to promote the development of
electricity generation from smaller renewable projects and then assesses how they affect project
finance for these smaller projects.82
For this Chapter, we have focused on policies that could find
application in Atlantic Canada. Each policy is described, its pros and cons discussed, and where
available its degree of success when applied in other jurisdictions evaluated. The chapter draws
on information from the developer and financier survey the results of which are reviewed in
Section 3.2, on the literature review presented in Section 3.3, and on the experience of the Power
Advisory team.
In Chapter 8 of this Report we identify Strategic Policy Options which could be implemented in
Atlantic Canada.
7.1 Policies to Support Finance of Renewable Generation
As noted in Section 3.3, policies to promote development from renewables fall in one of three
main categories:
(1) Revenue support, or policies that increase the project’s revenues or revenue certainty, or
both;
(2) Cost reduction, or policies that reduce the cost of the project through direct or indirect
subsidies on either construction cost or finance cost;
(3) Market access, or policies that facilitate a renewable project’s access to the market either
by improving physical facilities or by implementing policy favorable to renewables.
These policies are generally aimed at promoting renewable generation, not specifically at
facilitating project finance. But the impact of the policies can be seen in the effect on project
finance, both availability and terms. Renewable project finance requires that the projects be
economically viable and that project risks are appropriately identified and assigned.83
By
reducing project risks or improving economic viability, government policies can remove barriers
to financing renewable energy projects. These effects can be quantified as reductions in the
finance cost or in the overall project cost.
A focus of this report is addressing the financing barriers faced by smaller renewable energy
projects that are developed by community and aboriginal groups and the challenges posed by the
smaller size of provinces in Atlantic Canada. Therefore, this chapter focuses on policies that are
82
In considering these policies, we address as “small” projects with capacity less than 10 MW, connected
at the distribution level, and developed by aboriginal or community groups. We recognize that there are
few, if any, points where a project as large as 10 MW could be connected at the distribution level in
Atlantic Canada, so the classification of particular projects as “small” under these criteria will sometimes
require consideration of the characteristics of the project as a whole, rather than whether it strictly meets
these criteria. 83
In practice, financiers prefer to have a project that has assured prices through a contract with a
creditworthy offtaker, a term for the contract that exceeds the term of the finance by several years, an
experienced developer, and appropriate allocation of risk between the developer and offtaker.

Financing of Renewable Electricity Projects in Atlantic Canada Page 46
best suited to these types of projects and expanding the scope of these provincial electricity
markets. Appendix C reviews policies that are more appropriate for larger IPP projects.
7.2 Revenue Support Policies
Revenue supports can include a wide range of policies. This section will deal with six commonly
used policies that could be, or have been, applied in Atlantic Canada. These are feed in tariffs
(FIT), standard offer programs, production subsidies (e.g., ecoEnergy Program), renewable
mandates like renewable portfolio standards (RPS), carbon pricing, and requests for proposals
(RFP) for renewable energy supply.
7.2.1 Feed in Tariffs
FIT programs have been implemented in Canada in Ontario and, on a limited basis, in Nova
Scotia and are being explored in British Columbia. They are widely used in Europe. FIT
programs are very effective at enabling the construction of a large amount of renewable energy
projects, particularly smaller projects. FIT programs provide economies of scale for financing
which enable the construction of smaller projects by reducing the overall due diligence and
documentation costs and facilitating the aggregation of smaller projects in larger and easier to
finance issuances. (See discussion in Section 4.4) Small project sizes were frequently cited by
investors, financiers and developers as a barrier to investment for such projects.
FIT programs provide for the purchase electricity from renewable resources at a price that is
intended to enable the developer to recover its cost plus earn a reasonable rate of return. The
prices offered differ according to the technology and its size given underlying cost differences.
Most technologies for generating electricity from renewables exhibit increasing returns to scale,
which means that the overall costs are lower for large projects than they are for small ones.
Therefore, following the logic of prices which recover the project costs, larger projects typically
receive FIT prices below those offered smaller ones.
Successful applicants to FIT programs receive a PPA from a government agency or a utility. The
PPA sets the price for the electricity and the term of the agreement, which typically matches the
life of the facility (and therefore influences the term of the financing). Most renewables receive
20-year contracts. Hydroelectric projects can receive longer contracts, with 40-year contracts
offered in Ontario.
FIT programs have been very successful in attracting interest from developers with the interest
based on the pricing offered, but some of the projects may never come into service. Typical
barriers to project success are lack of access to transmission, inability to complete the project
profitably at the FIT price, and inability to obtain permits and approvals to meet the required
timetable. While FITs can have minimum requirements which ensure a minimum level of project
development before contract award, they are typically fundamentally different from RFPs where
there are often explicit criteria which favour mature development projects. This difference can
cause FITs to have higher project attrition rates.

Financing of Renewable Electricity Projects in Atlantic Canada Page 47
Table 4 below provides information on the market uptake of the Ontario FIT program. The
program is still relatively new, so many projects are still under development or in approval
processes. Many other projects are still awaiting assessment of available transmission capacity.
Table 4: Results of Ontario FIT Program
These results show the very high level of interest prompted by the attractive features of the
Ontario FIT program, primarily the price offered and the long-term PPA from a creditworthy
counterparty, the OPA.
As shown above, Ontario’s FIT has resulted in more than 10,000 applications for contracts for
projects offering over 20,000 MW, for a market with a peak load of approximately 25,000 MW.
Of these, almost 2,000, or almost 10%, have contracts executed, while almost 1,500 are no longer
active.84
A total of 183 projects are in commercial operation, providing 251 MW of capacity and
a further 385 contracts, representing 195 MW, have received Notice to Proceed but have not yet
reached commercial operation.
The inherent limits on the ability to integrate cost-effectively this amount of renewable generation
are evident from the challenges of connecting this amount of renewable generation to the grid
which has become the primary barrier to greater project participation. This raises the question as
to whether consumers are better served by a policy which effectively allocates renewable project
development based on available transmission capacity or on the basis of price such as in an RFP.
The German FIT program has been very successful in terms of the amount of renewable
generation installed, as Table 5 shows.
84
Contracts that are no longer active are those that have been rejected or withdrawn, had contract offers
expire, or have terminated contracts.
Contracts
Awarded
Post-
NTP In-service
No longer
active
Technology Number MW Number MW MW MW
Wind 295 11,845 77 42 215 2,446
Solar PV 9,633 8,451 1,791 95 26 1,334
Biomass 130 336 50 5 9 111
Hydro 104 366 49 53 23
Totals 10,162 20,998 1,967 195 251 3,914
Source: OPA. Data as of Feb. 3, 2012
NOTE: Post-NTP have received NTP but are not yet in service
Applications

Financing of Renewable Electricity Projects in Atlantic Canada Page 48
Table 5: Capacity Installed Under German FIT
The cost of the German FIT is paid by consumers through a surcharge on electricity prices which
pays the difference between the FIT price and the market price. For 2012, this surcharge is
scheduled to rise to almost €.04/kWh, or about C$.053/kWh.85
In 2011 several countries,
including Germany and France, reduced funding for their FIT programs due to financial
constraints and the rapid reduction in price for solar PV panels.86
These examples illustrate the issues raised by a FIT program. The program’s price stability and
certainty attract investors in renewable energy sources. The benefit to the developer is assurance
of earning a reasonable rate of return if it controls cost and performance.
The benefits to the ratepayer include the reduction in the environmental damage caused by
electricity generation and, because the price of the renewables is fixed, a hedge against future
increases in the price of fuels required by other forms of generation. For this, the ratepayer takes
the entire demand risk and typically pays more for renewable electricity than from conventional
sources.
The design of a FIT program therefore requires balancing the interests of the developer with the
interests of the ratepayer and arriving at prices that properly reflect costs. In the study cited in
Section 3.3, de Jager and Rathmann’s87
financial models suggested that programs like a FIT,
which offer long-term price support with little risk to the developer, can reduce unit energy costs
for a project by 20-30%.88
This reduction in costs is based on a financial model which assumes
that the revenue certainty offered by a FIT results in lower financing costs, i.e., lower cost of debt
85
Bundesnetzagentur (German Network Agency), “Renewables contribution to change only slightly in
2012”, press release Oct. 14, 2011. 86
Renewable Energy Network for the 21st Century (REN 21), Renewables 2011, Global Status Report, pg.
49. 87
David de Jager and Max Rathmann, op. cit. 88
Power Advisory’s financial model confirms up to the middle of this range.
2007 2009 2010
Technology MW MW MW
Wind: total 22,116 25,230 27,204
Wind: new 1,667 1,859 1,443
Solar PV: total 4,170 9,914 17,230
Solar PV: new 1,271 3,294 7,406
Biomass 3,290 4,102 N/A
Hydro 1,260 1,340 N/A
Gas* 647 641 N/A
Totals 34,421 46,380 53,283
*Landfill gas, sewage gas, and mine gas
Source: German Federal Ministry for the Environment,
Nature Conservation and Nuclear Safety

Financing of Renewable Electricity Projects in Atlantic Canada Page 49
and equity and greater leverage.89
Power Advisory believes that a well structured PPA can
provide equivalent lower financing costs and that an RFP can be more effective in ensuring that
the renewable resources for which contracts are offered have lower overall costs. However, RFPs
are better suited to larger IPP projects whereas FITs are better suited to smaller community and
aboriginal projects.
Similarly to a RFP process with a financeable PPA, a FIT program can greatly facilitate financing
for IPP developers. By providing price and demand certainty, it reduces risk and therefore
finance rates thereby improving access to capital. IPP developers like FIT programs as they
reduce the riskiness of development capital. Under a FIT a developer has greater control over
project success. Furthermore, pricing is not competitive and provides higher returns for good
sites. Uniform financing documents also allow IPP developers to accelerate the development of
projects.
Well-designed FIT programs are likely to be appropriate and effective in Atlantic Canada. In
theory, proper analysis of the costs for projects by size and technology would allow FIT programs
to offer prices that will attract projects but not be overly generous. The price stability that FIT
programs provide will help even small projects obtain financing. However, changes in the costs
and performance of technologies cause FITs to have greater implementation risks for the buyer.
These implementation risks can be managed through program design, e.g., procurement caps,
price degression and regular program reviews.
7.2.2 Standard Offer Programs
Both standard offer and FIT programs offer long-term PPAs at a known rate for qualifying
renewable generation projects. There are several differences between them in practice, although
some programs called FIT programs have more of the characteristics of a standard offer program.
A standard offer program sets a uniform rate for all (or most) of the eligible renewable power
sources. The rate is based on the value of the electricity. For example, the standard offer rate
could be considered to be related to the system avoided cost, defined as the full cost of the
cheapest alternative source of new power supply (including its environmental damage cost).
In Ontario, the standard offer price was based on the price at which renewable power had been
offered in a recent RFP. The program set a size limit of 10 MW per eligible project because the
standard offer program was aimed at projects too small to compete successfully in an RFP
process. The Ontario experience with its FIT program showed that the rules did not prevent
developers from offering large projects (cut up into smaller tranches), that the larger developers
thus froze out smaller projects, that the rules did not sufficiently incent developers to make
continuous progress on their projects, and that the prices were not high enough to attract many
smaller projects. Nonetheless, some capacity was developed and put into service under the
Ontario FIT program.
89
Additional, albeit smaller, savings are likely to be provided by the lower development costs offered by a
FIT.

Financing of Renewable Electricity Projects in Atlantic Canada Page 50
Standard offer programs limit cost exposure for ratepayers, because they base the price offer on
the value of the electricity to the system, not on its cost. As with other programs, ratepayers are
exposed to higher costs from any premium of the standard offer price over the cost of other
sources of electricity.
However, standard offer programs may not produce the desired amount of renewable supply
because the price may not cover costs for many potential projects and technologies.
Issues in the design of a standard offer program include what forms of generation are eligible,
whether there is a size cap on individual projects, whether there is a cap on the total amount of
electricity to be purchased under the standard offer, the term of the PPA offered to standard offer
participants, and how long participants have to bring their projects into operation.
Like FITs, standard offer programs provide favourable conditions for finance of renewable IPP
development by giving a PPA with appropriate terms and a fixed price. Prices under standard
offer programs are not technology specific so they are likely to be lower than with FITs, lowering
the number of projects that can be financed. They also do not take account of the cost
implications of smaller projects’ inability to access economics of scale. They may not be as
readily applicable as a FIT program in Atlantic Canada to attract small projects.
7.2.3 RFPs
RFPs provide revenue support by offering PPAs with a price specified to in their offers to
successful bidders. If the PPAs are well designed and properly allocate project risks, they can
form the basis for financing the project. Our survey gave the characteristics of such a well-
designed PPA: the contract term should equal the life of the asset allowing a longer financing
term; the price should be sufficient to cover the cost plus appropriate debt coverage; the offtaker
should be creditworthy; and the terms of the contract should properly allocate risk between the
developer and the offtaker.
RFP programs that are successful from the buyer’s point of view attract significantly more offers
than needed. That allows the buyers to choose suppliers that are technically competent and offer
the lowest prices. RFP programs that are successful from the bidder’s point of view are those that
offer a PPA with favorable terms and a high probability of winning a contract.
Because the contracts in RFP processes are awarded to low-price bidders, there may be project
attrition if the successful bidders find they cannot earn a reasonable return at their bid price. This
risk can be mitigated by also considering the developer’s experience and capabilities and
assessing the project maturity. Some RFP buyers provide for this attrition by awarding contracts
for more capacity or generation than they want to buy. In British Columbia, for example, BC
Hydro’s clean power calls are for 30% more than desired to allow for attrition. In Ontario, the
OPA’s Renewable Energy Supply III RFP had an attrition rate of about 13%, in part due to more
stringent minimum thresholds.
In Atlantic Canada, RFPs have been used with considerable success as a mechanism to meet RPS
requirements and have resulted in the construction and operation of over 600 MW of renewable
power projects. However, these have been larger projects.

Financing of Renewable Electricity Projects in Atlantic Canada Page 51
RFPs can also be designed to facilitate smaller projects. An RFP process to attract smaller
developers should have less onerous participation requirements and offer a higher probability of
success. To make the process less onerous, the process could accept projects at an earlier stage of
development than is required for RFPs aimed at larger projects with more experienced
developers. For example, it need not require that the participants already have all their financing
committed nor that they already be engaged in the environmental permitting process.
Requirements for resource data could also be eased. To increase the probability of success, the
RFP could have an upper limit on the size of project to be accepted and have a large enough
overall procurement total to ensure that several projects will be accepted.
7.3 Cost Reduction Policies
As the research cited in Section 3.2.3 showed, one of the most effective ways to reduce the cost
of renewable generation is through reducing financing costs. That is the mechanism through
which most of the revenue support policies work. A similar mechanism can work through
policies which reduce risks or costs, since they have the same effect of increasing the rate of
return and reducing the risk.
7.3.1 Loan guarantees
A loan guarantee from a creditworthy source (typically a government or government agency)
directly reduces the finance cost by guaranteeing the repayment of all or a portion of the debt
capital, thereby reducing the risk to the lender. Many projects would not be built without a loan
guarantee because the capital would not be otherwise available or the project would be cost
prohibitive to build.
Ontario has a loan guarantee program for projects undertaken by First Nations or Métis. The
Aboriginal Loan Guarantee Program is described in more detail in Section 6.4 of this report.
Without the ALGP, aboriginals would not be able to finance the extent of equity participation in
renewable projects they have reached in Ontario. Some level of aboriginal equity participation is
needed to qualify for the aboriginal adder to the FIT price for the kinds of renewable generation
that are eligible for the adder.90
In the United States, the Department of Energy (DoE) administers loan and loan guarantee
programs to support commercialization of technologies and technologies that avoid, reduce or
sequester greenhouse gas emissions. They recently approved $1.2 billion in a partial loan
guarantee to fund a 250 MW solar PV facility in California91
and $1.4 billion in a partial loan
90
In the Ontario FIT program, projects using eligible technologies can receive an adder, or premium, to the
stated FIT price if they have equity participation from aboriginal or community groups. The level of the
adder depends on the fraction of equity; it is a maximum of 1.5 cents per kWh for projects with 50% or
more of equity coming from aboriginal group(s). 91
US Department of Energy, “Energy Department Finalizes $1.2 Billion Loan Guarantee to Support
California Solar Generation”, Press Release, Sept. 30, 2011. http://energy.gov/articles/energy-department-
finalizes-12-billion-loan-guarantee-support-california-solar-generation

Financing of Renewable Electricity Projects in Atlantic Canada Page 52
guarantee for a multi-state project to install rooftop solar PV units.92
The DoE programs have
committed loans, loan guarantees, or conditional loan guarantees of almost $40 billion.
Other mechanisms are state-guaranteed loans from banks, as in Germany, or loans through
special bond issues, as in the Netherlands.
Loan guarantees can be an effective tool at reducing the total cost of financing. Government loan
guarantees increase the total amount of debt which can be raised against the project, thereby
reducing the amount of (more expensive) equity which will need to be raised. In addition,
Government loan guarantees can reduce the cost of debt, and the de Jager and Rathmann study93
estimated that a government loan guarantee can reduce the cost of debt by 1-2%. They estimated
that this reduction in the debt cost could reduce levelized energy cost by 5-10%. In the case of
the Ontario Aboriginal Loan Guarantee Program, the impacts may be even greater, because
lenders are likely to be reluctant to lend to these borrowers without a guarantee.
Before granting loans or loan guarantees, the governments perform due diligence similar to that
of a commercial lender. With proper due diligence, and especially if the project has revenue
support, the default rates on such loans will be low and the cost to the government low. Credit
rating agencies may count the guarantees when assessing the total debt position of the
government, which will not be a significant problem if the loans are not a large fraction of the
total government borrowing capacity.94
Loan guarantees have been effective in creating opportunities for aboriginal groups to participate
in the FIT program in Ontario. They have given the aboriginal groups the ability to attract the
attention of experienced developers of all sizes, making the projects viable both technically and
financially. Such guarantees could be very useful in promoting similar projects in Atlantic
Canada.
7.4 Market Access Policies
Market access policies do not directly affect the cost of the projects. They can improve project
economics by reducing uncertainty over access to the electricity supply system.
7.4.1 Market size
In most jurisdictions, overall size is not an issue for market access for renewables. Either the
jurisdiction itself has a large enough market, as in Ontario or Germany, or it is strongly connected
to large markets, as in the smaller New England states which have access to the broader New
England market, or Denmark, which has access both to Germany and Norway. A large market
allows the development of multiple renewable projects, each large enough to take advantage of
available economies of scale in construction, finance, development and operation.
92
US Department of Energy, “Energy Department Finalizes Loan Guarantee for Transformational Rooftop
Solar Project”, Press Release, Sept. 30, 2011. http://energy.gov/articles/energy-department-finalizes-loan-
guarantee-transformational-rooftop-solar-project 93
David de Jager and Max Rathmann, op. cit. 94
However, as discussed, the obligations of the Aboriginal Loan Guarantee Program in Ontario are not
considered an obligation of the Province.

Financing of Renewable Electricity Projects in Atlantic Canada Page 53
As our survey showed, the size of the renewable market in Atlantic Canada can present a
significant barrier to the development of projects. With the market for larger projects driven by
RFPs, the number of RFPs is limited, which increases the risks of participation since projects
which are unsuccessful must wait for extended periods for the next sales opportunity.
Furthermore, a smaller market can make for smaller projects, and the smaller projects have more
difficulty in attracting experienced developers and in obtaining finance.
The best remedy is to increase the market size, which in Atlantic Canada means stronger
interconnections and cooperation. The premiers of New Brunswick and Nova Scotia have
announced a continued commitment to collaboration on energy issues.95
The announcement
pointed to optimization of the transmission system as one area for collaboration. Both provinces
have committed to increasing the share of renewables in their electricity supply.
Collaborative efforts that would increase the effective market size would include strengthening
transmission ties between each of the various jurisdictions (e.g.,New Brunswick and Nova Scotia)
and eliminating rate pancaking for projects within the control area.
Collaboration could also improve market size for renewables by coordinating procurement across
jurisdictions. For example, the next RFPs could be issued jointly by the two provinces,
increasing the amount of supply called for and therefore the number of potential projects of large
enough size ($30-50 million in finance) to be more readily financed. This would help address a
problem that several survey participants identified.
7.4.2 Renewable Energy Aggregator
As IPPs continue to look to develop renewable power projects in Atlantic Canada for sale into
New England, they could profit from the presence of a renewable energy aggregator. Small
developers, especially, might not have the market experience to be able to address issues of
obtaining transmission access to New England, of selling renewable energy credits to buyers in
New England, and of managing the delivery of the electricity. An aggregator which possesses
these skills and knowledge can provide them efficiently to small developers.
An aggregator is better able to efficiently use transmission which a single project might not be
able to justify contracting for given its load factor or the uncertainty regarding future market
opportunities in the jurisdiction. Furthermore, an aggregator is more likely to possess the
necessary forecasting and scheduling capabilities and to have a diverse mix of generation
resources that better allows it to meet firm customer requirements and thereby secure higher
prices. The aggregator would sell the renewable power into the most promising market over the
available transmission path. That could include exports to the United States through existing
interconnections, through new facilities built in conjunction with the Muskrat Falls development
in Labrador, or through Québec to Ontario or the United States.
Improved collaboration of these kinds could help facilitate finance by broadening the markets for
the power.
95
Government of New Brunswick, “New Brunswick and Nova Scotia Commit to Continued Energy
Collaboration”, press release, May 16, 2011.

Financing of Renewable Electricity Projects in Atlantic Canada Page 54
7.4.3 Transmission access
Renewable resources are generally not located close to loads, nor are they necessarily close to
existing transmission facilities. Access to the transmission grid is a critical issue for renewables.
In Nova Scotia, as our survey pointed out, Cape Breton Island already has a surplus of generation
and not enough firm transmission capacity to reach the load centre of Halifax. Yet Cape Breton
has some of the best wind resource in the province. Bidders to the current RFP who want to
propose projects on Cape Breton may find that they would result in network upgrades that cause
their projects to be uneconomic.
In Atlantic Canada, an action that could increase the size of the market is to increase transmission
interconnection capacity with New England. The recent addition of the International Power Line
in 2007 has already increased the opportunity for trade. Effective expansion of export capacity to
the major load centers of New England may require transmission reinforcement within New
England unless new transmission paths are developed that allow direct access to the southern
New England market which is the main load centre.
The Ontario Green Energy and Green Economy Act required transmission owners to give priority
in access to electricity from renewable projects. The first projects approved in the Ontario FIT
were those which could obtain access to the Ontario transmission system. Of the applications
under the general FIT program, projects representing 6,973 MW of capacity do not have
transmission access and are waiting for a test to determine if connecting them to the system is
economic, as opposed to a total of 4,752 MW of capacity that has been awarded contracts.96
Governments can implement policies to ensure that adequate transmission is available to meet the
needs of renewable developments. However, this is likely to result in higher transmission costs
and overall electricity prices and is not necessarily in the best interests of customers. Ideally,
planners and purchasers should consider the delivered costs of renewable energy. Even with such
policies, however, developing new transmission lines is a lengthy process with consultations with
landowners and others affected by the line as well as environmental considerations for a linear
project over long distances.
If the transmission facilities are not built or reinforced to accommodate an increasing penetration
of renewables, transmission congestion will increase. Managing transmission congestion and
who bears the risk of it will be increasingly important. Requiring IPPs to bear this risk without
limits or mitigation strategies will increase financing costs. However, passing these risks through
to the purchasing utility and ultimately their customers can lead to poor project siting decisions.
Solutions need to consider existing market rules and market structure and the available
transmission infrastructure.
Network access can become an absolute barrier to the development of renewable generation
facilities. In Atlantic Canada, some small projects may be able to connect at the distribution
96
Ontario Power Authority, “Bi-Weekly FIT and microFIT report”, data as of Dec. 23, 2011. Of the
20,574 MW submitted, the remainder have not yet had their reviews completed or they have been
withdrawn.

Financing of Renewable Electricity Projects in Atlantic Canada Page 55
level. Studying the capacity of the distribution networks to accept generation could help the
development of such projects.
In Nova Scotia, for example, NSPI has a map on its website showing all of its distribution
feeders, with links that give an estimate of the capacity of each station to connect COMFIT
capacity. 97
This information is not dynamically updated to show the changes to capacity as new
generators or new loads connect or as other changes take place to the distribution system. It
therefore does not give a firm indication of available capacity at any time; that can only be
determined by a Distribution System Impact Study, which is an essential part of the connection
process. However, it does provide potential generators with basic information that can at least
warn them away from feeders which are highly unlikely to accept their proposed generation, and
can also point to those feeders more likely to be able to accept them.
In Nova Scotia, New Brunswick and PEI, the procedure for transmission connections is set out in
the respective Open Access Transmission Tariffs (OATTs).98
The New Brunswick System
Operator issued a draft report on connection requirements for renewable generators in the
summer of 2009, but it has not been made final. It deals only with projects of at least 5 MVa and
is mostly concerned with technical issues. For procedure, it refers to the generation
interconnection procedures in the OATT.
97
http://www.nspower.ca/en/home/environment/renewableenergy/comfit/capacity.aspx 98
Under that procedure, the potential generator applies to the transmission provider, who then performs a
Interconnection Feasibility Study which begins the process of identifying necessary network upgrades and
the costs of interconnection to be paid by the generator.

Financing of Renewable Electricity Projects in Atlantic Canada Page 56
8 STRATEGIC POLICY OPTIONS
In this chapter, Power Advisory presents a number of strategic policy options that may facilitate
the financing of small renewable electricity generation projects in Atlantic Canada. These
options focus on those which will facilitate financing of small projects because our survey and
case studies show that larger renewable energy projects can get financing under essentially the
same conditions and with the same attention from lenders as do similar projects elsewhere in
Canada.
The first group of strategic policy options is those which affect the Atlantic Canada region as a
whole or which require concerted action by more than one government, provincial or federal.
Because they would affect the entire region and generally are focused on overcoming barriers to
trade within the region, these policy options would have a more significant impact on larger
renewable energy projects. The second set of policies is focused more on addressing financing
barriers faced by small renewable energy projects and these policies can be implemented by and
for individual provinces.
8.1 System Integration
Electricity trade, including trade in renewables, can be increased by closer integration of the
electricity systems of Atlantic Canada.99
The extent of possible integration is limited by the
capacity of the physical connections, but even within that context integration can be enhanced
through better coordination and harmonization of the market rules.
The systems of New Brunswick, Nova Scotia and PEI are already reasonably well integrated,
with the NBSO acting as the balancing authority for the entire area. However, as the co-operation
agreement between the premiers of New Brunswick and Nova Scotia showed,100
coordination can
still be improved between the provinces.
Enhanced system integration would be promoted by reinforcing transmission interconnections
among provinces, eliminating rate pancaking whereby parties pay transmission tariffs for each
Province through which they wheel power, and employing consistent market rules. The Premiers
of Nova Scotia and New Brunswick proposed such a strengthening of the transmission link in
July, 2010, when they announced that the two provinces were exploring better connecting the
provinces with a new 500 MW transmission line.101
The addition of a direct transmission link
from Newfoundland and Labrador as part of the Lower Churchill Project development would
99
The Eastern Wind Integration and Transmission Study found that high penetrations of wind (20 to 30%)
are technically feasible with significant expansion of transmission interconnections. The study found that
“transmission helps reduce the impacts of the variability of the wind, which reduces wind integration costs,
increases reliability of the electrical grid, and helps make more efficient use of the available generation
resources.” (p. 27). 100
Government of Nova Scotia, Premier’s Office Press Release, “Nova Scotia and New Brunswick will
Work to Further Strengthen Regional Energy Co-operation”, Nov. 19, 2010. The press release mentions
“co-operation to improve transmission, system operation, renewable energy production and other aspects of
their electric power systems.” 101
Government of Nova Scotia, Premier’s Office Press Release, “New Energy Partnership Forged between
Nova Scotia and New Brunswick”, July 20, 2010.

Financing of Renewable Electricity Projects in Atlantic Canada Page 57
allow that province to be linked to the electricity system in the rest of Atlantic Canada. A new
line between Nova Scotia and New Brunswick would facilitate export of Lower Churchill and
other renewable electricity generated in Atlantic Canada to the US Northeast.
8.2 Policy Harmonization
As described in Chapter 2, the four Atlantic Canada provinces have differing policies for
promoting the development of electricity generation from renewables but they have similar goals
and use similar instruments in some cases. In particular, New Brunswick, Nova Scotia, and PEI
have RPS standards which are to be met by procurement of renewables through FIT (in Nova
Scotia) and RFP (in all three provinces) processes.
So far, these have been separate processes, each with different sets of rules and different
qualifications for bidders (e.g., mandating that projects be located in the province issuing the
RFP). Harmonizing the terms and conditions of the RFP processes would relieve potential
bidders of the requirement to become familiar with differing sets of bid conditions; allow them to
potentially participate in multiple RFPs increasing the potential for being awarded a contract and
could encourage more participation. Under this example, policy harmonization can be as simple
as allowing renewable resources from other jurisdictions to satisfy the RPS or participate in the
RFP. However, to the degree that there is a premium paid for renewable energy resources that
will increase electricity rates, policymakers are likely to prefer that projects be located within the
province so that there are offsetting economic development benefits realized. Power Advisory’s
study for NRCan showed that there can be significant benefits of allowing neighboring
jurisdictions to meet RPS requirements.102
8.3 Renewable Aggregator
The New England states have renewable obligations of about 18 TWh. While the New England
market isn’t attractive at currently low energy prices, given this demand for renewable electricity
it is expected to be an important market in the future.
However, the costs of identifying and negotiating trades, securing transmission, and scheduling
them on the system do not decrease proportionately with the size of the trade. Therefore, for
smaller sellers, these transactions costs are a relatively high fraction of the price they can expect
to obtain. Such relatively high costs create a barrier to trade for small developers. Furthermore,
one project, particularly wind projects which operate at maximum capacity a relatively limited
amount of time, often cannot cost-effectively contract for required transmission capacity.
These barriers could be mitigated by the creation of an aggregator which would negotiate trades,
secure transmission and schedule the electricity for a number of smaller developers. The
aggregator could thereby spread the transaction costs over a larger volume of trade, making the
trade feasible. Furthermore, having a portfolio of projects would enhance the degree of firmness
of the energy offered and reduce the effective cost of transmission and the risks of imbalance
penalties.
102
“The Potential Impact of Relaxing Renewable Portfolio Standard Constraints on Canada-US Electricity
Trade”, March 31, 2011

Financing of Renewable Electricity Projects in Atlantic Canada Page 58
The aggregator need not be a government agency. It could be part of an existing utility in
Atlantic Canada or it could be a private firm that offers such transaction services. There are a
number of entities that maintain a trading desk and already act as an agent for other generators in
Atlantic Canada and possibly could become a renewables aggregator for the region.
Having a single aggregator for the region would also strengthen integration.
Governments could agree to create an aggregator or they could help to fund the establishment of
an aggregator.
8.4 Facilitate Distribution Level Connection
As the Nova Scotia COMFIT program shows, connecting small renewable projects at the
distribution level can avoid some of the issues with transmission congestion, at least initially.
Allowing or facilitating such connection can increase the capacity of the system to integrate
renewable projects. Because the capacity of the distribution system is inherently limited, such
connections would be restricted to smaller-scale projects and to a finite total.
Governments could facilitate such connection ability by encouraging or requiring the distributors
to study their systems and determine ability to connect renewable generation at specific points of
their distribution systems. The NSPI website showing available capacity for each feeder could
be replicated in the other Atlantic Canada provinces.103
Such information is particularly
important for a FIT program where connection capacity is likely to be a critical determinant of
project viability and less important for an RFP where project selection is likely to be based on a
range of criteria. Each province would have to consider whether the value of information to
prospective renewable generators provides sufficient benefits to warrant the costs.
Distribution owners can also help facilitate generation connection by consulting with the groups
who might propose to build generation. Such consultations can be more specific, but a large
volume of them would also require a significant commitment of resources by the distributor.
8.5 Focused FIT Programs
A FIT program focused on smaller projects offered by target groups can attract participation by
them.
For example, the Nova Scotia community FIT (COMFIT) program is narrowly focused on
smaller projects and has attracted over 95 applications to February 2012. Only certain kinds of
organizations are eligible to participate in this program and only with certain kinds of renewable
technologies.
103
Hydro One, the distributor serving the largest service territory in Ontario, has a similar website which
provides a list of station connection capacity, a list of applications and an example showing how to
calculate connection capacity. http://www.hydroone.com/Generators/Pages/AvailableCapacity.aspx

Financing of Renewable Electricity Projects in Atlantic Canada Page 59
A focused FIT program can avoid many of the problems seen in larger FIT programs like those in
Ontario and Germany.104
For example, one of the conditions for the Nova Scotia COMFIT
program is that the project be able to connect at the distribution level. This requirement ensures
that no one project can be too large because of the limited capacity of the distribution system to
accept injections.
These conditions avoid the potential for the program to become too large relative to the size of
the electricity supply system or the requirements for renewable power. A FIT program could also
be designed with caps, either on the total program or on some technologies (solar PV, for
example).
8.6 RFP Processes
RFP processes are typically designed to ensure participation by large, experienced developers, as
they have done in New Brunswick and Nova Scotia. Appropriately stringent conditions for RFP
participation can increase the probability that all the projects selected in large-scale procurements
are built.
But as noted in Section 7.2.3, RFP programs could also be designed to facilitate participation by
small projects as defined in this Report. In our survey, small developers said that they were
deterred from participating in RFP processes by several factors: the high cost and difficulty of
meeting the mandatory requirements, including the financial requirements, and the risk due to the
low probability of winning105
and the high cost of participation relative.
To design an RFP process that could be more effective in attracting small bidders, and in
facilitating the ultimate financing of the project, the procuring agency could soften the
mandatory requirements, such as having less stringent financial and environmental approval
requirements. Assuming that the RFP was targeted at community and aboriginal projects it could
also be designed with a size cap for proposals or firms, ensuring that all successful projects meet
the definition of small. For example, a 50 MW procurement could have a 10 MW size cap, thus
ensuring at least five successful bidders. To broaden the pool of winners, proponents could be
prohibited from being affiliated with other proponents.
Relaxing these mandatory requirements would increase the risk that proponents successful in the
RFP process would be unable to complete the projects. The procuring agency would need to
monitor progress closely.106
104
These include adverse impacts on customer rates and overwhelming the system’s connection capacity,
triggering major network investment. 105
Because so few winners can be successful given the amount of total capacity sought and the size of the
likely offers. 106
The PPA might also contain some financial penalty for successful proponents who are not able to
complete their projects, recognizing that the size of these penalties will affect participation and that
securing funding prior to contract award is more difficult.

Financing of Renewable Electricity Projects in Atlantic Canada Page 60
8.7 Loan Guarantees
To facilitate First Nations’ participation in renewable electricity generation, Ontario created its
Aboriginal Loan Guarantee Program (ALGP). It has been essential to allow such groups to raise
their equity portion of the investment.
Participation by First Nations in Atlantic Canada could benefit from similar action. Eligibility for
such loan guarantees should be tightly focused on groups whose participation the governments
want to encourage and which are likely to have difficulty in raising equity capital on their own.
These would likely be limited to First Nations and community groups. In Nova Scotia,
participation by community groups has been facilitated by the CEDIF, reducing the need for such
a program in Nova Scotia.
Such programs do not have a high net cost to the government if due diligence is properly applied
and default rates are correspondingly low. With no defaults, the program’s net cost is its
administrative cost if its total lending is not high enough to affect the government’s credit rating
or borrowing ability. However, performing the required due diligence can require considerable
resources; recall that the OFA anticipates reviewing about four applications per year under the
ALGP.
Loan guarantee programs are also effective at promoting the development of new technologies.
A new generation technology being developed in Atlantic Canada is tidal power. Governments
could offer loan guarantees to help fund the construction of tidal power projects. Such funding
could be similar to that given other promising new technologies to help them achieve commercial
scale. Government loan guarantees would be needed because other sources of funds, especially
debt finance, seek projects where there is little technical risk and the technology is proven to be
commercially viable. In this case, of course, the government is assuming greater default risk,
with the intention of promoting a technology that would, if it proved viable, add to economic
activity in the province.
8.8 Development Cost Funding
Groups that the government may want to target for participation in development, like First
Nations and community groups, may have difficulty in funding the early development costs of a
project. These include resource assessment, environmental assessment costs, project engineering,
application costs, and other costs incurred before the project receives a contract and can access its
project finance. In Ontario, the OPA funds such costs for aboriginal and community groups to a
maximum of $500,000 per project.
The federal department of Aboriginal Affairs and Northern Development funds the ecoENERGY
program for renewable energy for northern and aboriginal communities. It provides up to
$250,000 in funding to aboriginal and northern communities for development activities, such as
pre-feasibility and feasibility studies for renewable generation projects.107
No aboriginal groups
107
This program is not accepting applications at this time. The website says that an announcement of
funding for the 2012-13 fiscal year will be posted as soon as it is available. http://www.aadnc-
aandc.gc.ca/eng/1100100034258

Financing of Renewable Electricity Projects in Atlantic Canada Page 61
in Atlantic Canada have accessed this funding for renewable energy projects, though those in
other provinces have, including several in Ontario and Québec.
Community groups in Atlantic Canada may be unable to obtain sufficient funding for these up-
front activities. Establishing a method of development cost funding would provide the necessary
resources for early project development.
As for the loan guarantee programs, this development funding should be narrowly focused on
those groups whose participation governments want to facilitate and which are not likely to be
able to secure funding themselves. The program should also ensure that the groups being funded
have a good likelihood of being able to develop a project.
In Nova Scotia, the existing community investment program, CEDIF (Community Economic
Development Investment Fund) has become a vehicle for such funding, as described in Section
6.5 above. CEDIFs raise money from within defined communities which is then invested within
the community or used to operate businesses within the community. They must not be charitable
or non-profit. Many of the participants in the Nova Scotia COMFIT program have used CEDIF
vehicles for their funding. However, using CEDIFs to fund initial project development activities
is problematic given that these development activities are the most risky and investors in CEDIFs
are seeking a return. Therefore, if these development expenses demonstrate that the project isn’t
viable and the CEDIF was organized to fund the development of this one project then investors
will lose their entire investment.
8.9 Facilitate Cooperative Development
As the examples of the Water Power Group, CEDIF and TREC showed, cooperative
developments, especially community-based cooperatives, can be effective in funding small-scale
renewable energy projects.
Raising equity from the community can give the project more leeway because the local pool of
equity investors may be more patient with returns that are lower than expected. For some
members of local cooperatives, part of the benefit they receive is simply knowing that they have
helped to build a renewable energy project in their community, a project that is visible to them
and others. Not all community investors take this view, but an honest offering circular that
describes the risks can mitigate impatience.
Such cooperatives may be able, as TREC was, to avoid institutional funding. Alternatively, as
the Water Power Group’s experience shows, the co-operative model can help to obtain loans if it
allows a larger financial scale.
Governments can support these initiatives by enacting appropriate legislation so that renewable
energy cooperatives can be formed. In PEI, municipalities are prohibited from investing outside
their community. In Ontario the co-operative legislation primarily contemplated either buyer (as
in agricultural) or seller co-operatives. Renewable energy co-operatives did not fit this model.
Other limiting provisions might prevent a municipality from cooperating with neighboring
municipalities when the project is not located within its municipal boundaries.

Financing of Renewable Electricity Projects in Atlantic Canada Page 62
APPENDIX A: INTERVIEW GUIDE
Study on Financing of Renewable Electricity Projects in Atlantic Canada
Background:
Power Advisory LLC (Power Advisory) has been engaged by Atlantic Canada Opportunities
Agency (ACOA) to identify and analyze the challenges in the financing of renewable energy
projects in each of the four Atlantic Provinces with jurisdictional comparisons to other regions.
The study is to identify and evaluate the key economic conditions and risks that affect the
availability and cost of capital for independent power producers associated with renewable
electricity projects. The study is focusing on the risks, the economic and market conditions and
the policies, actions and favourable market that have mitigated these risks/conditions elsewhere.
A key deliverable will be recommendations as to how the Atlantic Provinces may take full
advantage of the opportunities afforded by the region’s renewable energy potential.
Purpose of Interviews:
We are conducting interviews with renewable project developers, investors and lenders to guide
us in identifying and analyzing the challenges in financing renewable energy projects in each of
the four Atlantic Provinces. Your participation in this interview will enhance our understanding
of these issues. Thank you for your participation.
Q1. In what provinces in Atlantic Canada have you attempted to develop renewable energy
projects?
New Brunswick □ Newfoundland and Labrador □ Nova Scotia □ Prince Edwards Island □
Q2. Have you developed renewable energy projects in other jurisdictions?
If so, please identify:_____________________________________________________
Q3. What types of renewable energy project have you attempted to develop in Atlantic
Canada?
Wind □ Biomass □ Hydro □ Tidal/Wave □ Solar □ Other
Q4. What size of projects have you tried to develop in Atlantic Canada?
Size ($ mm): _____________________ Capacity (MW): ______________________
Q5. Have you been successful in your project development efforts in Atlantic?
Yes □ No □ Please
explain:________________________________________________________________________
______________________________________________________________________________
______________________________________________________________________________
Q6. Have there been issues associated with securing financing for your Atlantic Canada
project development efforts? Yes □ No □ Please
explain:________________________________________________________________________

Financing of Renewable Electricity Projects in Atlantic Canada Page 63
______________________________________________________________________________
______________________________________________________________________________
Q7. Have the financing issues for your Atlantic Canada renewable projects been related to
securing a market for the output of the project? Yes □ No □ Please
explain:________________________________________________________________________
______________________________________________________________________________
______________________________________________________________________________
Q8. Are the financing challenges for renewable projects in Atlantic Canada attributable in
part to a lack of information for investors and lenders? Yes □ No □ Please
explain:_______________________________________________________________________
______________________________________________________________________________
_____________________________________________________________________________
Q9. Are there unique technology risks that renewable projects in Atlantic Canada face relative
to other jurisdictions? Yes □ No □ Please
explain:________________________________________________________________________
______________________________________________________________________________
______________________________________________________________________________
Q10. Are there unique (or greater) regulatory risks that renewable projects in Atlantic Canada
face relative to other jurisdictions? Yes □ No □ Please
Explain:_______________________________________________________________________
______________________________________________________________________________
______________________________________________________________________________
Q11. Do you view the risks and economic conditions that affect the financing terms for
Atlantic Canada renewable projects as less favourable than those that are likely to be available for
similar projects in other jurisdictions? Yes □ No □ Please
explain:________________________________________________________________________
______________________________________________________________________________
______________________________________________________________________________
Q12. Do you believe that there is a shortage of equity and debt financing available for
renewable projects in Atlantic Canada? Yes □ No □ Please
explain:________________________________________________________________________
______________________________________________________________________________
______________________________________________________________________________
Q.13 In your experience, would you say that the difficulty of financing renewable energy
projects in Atlantic Canada is greater than that in other jurisdictions? Why? Please explain:
______________________________________________________________________________
______________________________________________________________________________
______________________________________________________________________________

Financing of Renewable Electricity Projects in Atlantic Canada Page 64
Q14. Is this shortage of equity and debt financing more pronounced for small renewable
projects in Atlantic Canada? Yes □ No □ Please
explain:________________________________________________________________________
______________________________________________________________________________
______________________________________________________________________________
Q15. Do you have any recommendations regarding how the risks and economic conditions for
project financing can be made more favourable for Atlantic Canada renewable projects? (Please
make sure where possible to tie these recommendations to the challenges and barriers you
identified.) Yes □ No □ Please
explain:________________________________________________________________________
______________________________________________________________________________
______________________________________________________________________________
______________________________________________________________________________
______________________________________________________________________________
Q16. Are there financing vehicles that can be employed that would improve the availability of
equity and debt to renewable energy projects in Atlantic Canada? Please
identify:_______________________________________________________________________
______________________________________________________________________________
______________________________________________________________________________
Q.17 Are there ways in which governments or buyers of the output of these projects can work
with the private sector to ensure that these risks of these projects are accurately assessed and not
overstated? If so, please
identify:_______________________________________________________________________
______________________________________________________________________________
______________________________________________________________________________
Q18. Please list any other concerns or forms of support you believe would assist your project
development not already
addressed:______________________________________________________________________
______________________________________________________________________________

Financing of Renewable Electricity Projects in Atlantic Canada Page 65
APPENDIX B: INTERVIEW NOTES
Interviewers: Ching-yen Chen, Potian; John Dalton, Power Advisory; Mitchell Rothman,
Power Advisory
Subject: Financing Renewable Projects in Atlantic Canada
Date: Nov 15, 2011 (Phone Call)
Category: Lender
* Company has financed renewable projects (all except Tidal) in Canada and the US. Within
Atlantic Canada, has financed wind and hydro projects in Nova several provinces
* Key determinant for whether they will participate is size of the debt
* Target size is $75 to $100 mm. At sizes above $100 mm they will syndicate to parties (2 or 3
other parties on a club basis). Minimum size is $50 mm.
* Minimum size is due to corporate pressures of a $mm target amount of capital to deploy and
limited internal resources. Time commitment per transaction is "fixed", which is why they target
larger deals.
* Have also found a strong correlation between size and competency (e.g. more experienced
developers are typically associated with larger projects). Less experienced developers require
more hand-holding
* Examples in other jurisdictions show that well-structured projects of a good size will attract
capital at competitive prices (think Saskatchewan was seeking 250MW but received over 5,000
MW in bids)
* Otherwise, no real issue with investing in Atlantic Canada
* Key issues in determining whether to invest capital is an examination of the PPA agreement to
ensure the terms make the project financeable. For renewable power, there will be no project
without a contract in hand, but to get financing the contract terms must be reasonably favourable
to the developer. An example of a less favourable contract is one with large penalties to the
developer for missing minimum output levels.
* Risks which need to remain with equity - completion, availability, interconnection
* Risks which need to remain with the PPA counterparty - resource (no min production levels but
availability ok), curtailment
* Risks which should not be in the contract - local content (introduces risks, is expensive and is
not an effective means of producing long-term employment)
* No issues with current contracts in Atlantic Canada, and in some cases they are more
favourable to the developer than those elsewhere. For example, in Ontario the developer takes
the curtailment risk.
* Other determinant is making sure the project has access to transmission

Financing of Renewable Electricity Projects in Atlantic Canada Page 66
* Ensure the transmission rights and curtailment risks are on a queue basis (and not like Texas
where every entrant is equally curtailed)
Other topics
* Ability to bundle smaller projects together into a larger financing - possible but difficult
because projects must be built around the same time (<6 months), and the ownership must be
common between projects
* Best way to encourage renewable development in Atlantic Canada is to ensure transmission
connection is available and contracts are financeable.
*We look for some experience in a developer, but we have been willing to be patient and we have
done a fair amount of holding developers’ hands.
*FIT programs - does not like it / believes RFPs are much better in procuring the most
competitive pricing for projects
* With any procurement process, they key is having a pre-qualification process or stringent
threshold requirements to ensure credible bidders (or you will have the Ontario experience)
* Atlantic Canada has an advantage over some other jurisdictions, such as BC, because the First
Nation rights are clearer

Financing of Renewable Electricity Projects in Atlantic Canada Page 67
Interviewers: Ching-yen Chen, Potian; Mitchell Rothman, Power Advisory
Subject: Financing Renewable Projects in Atlantic Canada
Date: Nov 15, 2011 @ 2 pm (Phone Call)
Category: Medium-sized Developer
* Has not yet invested in Atlantic Canada
* No issue with region, just that projects brought to them previously have not been economic
subject to further DD
* Flaw identified in diligence which reduces economics, or risks in the PPA structure
* Main issue is whether the PPA economics are rich and secure enough to support the project:
How secure is the revenue stream? It is then their lookout as buyer to determine how secure the
output is.
* Governmental agency (good credit risk)
* Dispatch rules do not constrain revenues
* Typically buys the early stage project from the developer (developer has secured land, permits,
wind data)
* Seeks minimum project sizes in order to be competitive. This is what limits the number of
projects they see in Atlantic Canada
* wind - 30 - 50MW
* water - 4-5 MW
* solar groundmount – 7-10MW
* solar rooftop - large portfolio
* biomass - 20MW
* Projects smaller than those identified above are typically too small to support the fixed cost
overheads both physical and administrative (eg., legal) -> economies of scale are key
*But if the project is good enough, size is not an issue. We will look at projects of any size if the
PPA is rich enough. Could finance a 5 MW project without borrowing, but would prefer to
aggregate, say, 6 x 5 MW projects in the same area.
* Strong preference for the counterparty to be the government. Harder to get comfortable with a
corporate credit beyond 10 years.
* Local content is an issue
* Limits ability for the developer to seek and get competitive pricing for turbines, because local
content limits the number of suppliers you can choose between etc...

Financing of Renewable Electricity Projects in Atlantic Canada Page 68
* Likes the FIT program
* Reduces the cost / risk of development capital
*What Atlantic Canada can do to encourage renewable development: make sure prices are
sufficient. The pool of potential developers in Atlantic Canada is relatively small.
* There is no difference between Atlantic Canada and other places in terms of financing, but the
utilities there are smaller and don’t always have a lot of experience buying power under contract.

Financing of Renewable Electricity Projects in Atlantic Canada Page 69
Interviewee: Senior Power Experts
Interviewers: Ching-yen Chen, Potian, Mitch Rothman, Power Advisory
Subject: Financing Renewable Projects in Atlantic Canada
Date: Nov 29, 2011 @ 2:00 pm (In Person Meeting)
Category: Lender / Debt Capital Markets
* Have not recently raised capital for a renewable energy project in Atlantic Canada, but have
raised capital in the region (no issue)
* Have been active in the power sector
* Would expect project sizes would need to be a minimum of $50 mm to get people interested,
but that’s a rule of thumb (street view). Ability to go smaller sizes on an individual transaction,
but that’s typically on an expectation of more deals
* Smaller deals ($10 million and up) would be handled by the small/medium business group at
the local branch. But local branch lenders would not have wind expertise, and would be referred
to the Toronto office
* Toronto office happy to have informal calls with the local branches, but that likely won’t be
sufficient to get deal across the line. The real issue on getting smaller deals across the line is that
the friction costs (e.g. wind studies) would overwhelm small deals
* Like other Canadian banks, we generally do not lend for terms beyond 10 years. For a
renewable energy project with a 20 year life, that can create problems because either they have to
try to pay off the loan much more quickly from the same cash flow, or they have to refinance
* The number of players looking to be active in this industry is declining, particularly the number
of European banks.

Financing of Renewable Electricity Projects in Atlantic Canada Page 70
Interviewers: Ching-yen Chen, Potian; Mitch Rothman, Power Advisory
Subject: Financing Renewable Projects in Atlantic Canada
Date: Nov 22, 2011 (Phone Call)
Category: Large Developer
* Active developer in the Atlantic region
* See no real issues different in Atlantic Canada than developing wind projects in other
jurisdictions, and they have been active nationally and internationally.
* See no difference between Atlantic Canada and other jurisdictions in terms of project attrition.
The project in New Brunswick that had a PPA was not specific to Atlantic Canada, but to a
federal/provincial issue. Expect project attrition in Ontario also.
* An issue for contracting now in Atlantic Canada is the changing structure in New Brunswick,
where NBSO is being folded back into New Brunswick Power.
* The basic problem for renewable development in Atlantic Canada is the size of the market and
therefore of the projects. The RFP in Nova Scotia addresses a small market with no transmission
access to the United States. A more integrated market would help because, for example, the
larger the market the easier it is to balance.
* So not advocating any changes
* Have generally used balance sheet finance, but we see no problems getting project finance in
Canada.
* Have not looked at biomass projects in Canada
* Minimum project size: 30 MW. Smaller developers might have more trouble project financing
because they lack the track record, but the finance should depend on the economics of the project
and on the PPA.
* We like FIT programs, though the current FIT program in Nova Scotia is too small for us.

Financing of Renewable Electricity Projects in Atlantic Canada Page 71
Interviewers: Ching-yen Chen, Potian; Mitch Rothman, Power Advisory
Subject: Financing Renewable Projects in Atlantic Canada
Date: Nov 22, 2011 (Phone Call)
Category: Small Developer
* Applied to BDC for finance and all local resources (co-ops) for finance for an earlier project in
Atlantic Canada, but little knowledge of wind or support
* Went to life companies, but little interest given management’s lack of experience at the time
* Unable to finance in Nova Scotia with private funds (amount + term)
* In theory, wealthy local families could fund but they aren’t interested in buying and holding
wind assets
* They could possibly fund a development team (buy-flip model)
* Public / Government funds weren’t interested as it didn’t meet criteria for job creation (still
unclear on why that’s the case)
* Currently funded by equity provider which provides equity commitments over construction, no
debt until complete. This was especially critical / helpful during the financial crisis (08 – 10)
* Believes it’s easy to get financing for $100+mm projects, but much more difficult to get
funding for a local developer on COMFIT 1-4 turbine projects where the project size is $5 mm to
$20 mm. Financial institutions won’t look at them because they are too small. Think a gov’t
guaranteed loan is the answer. A government guaranteed loan would also simplify the structuring
process as friction costs are significant – for example there were five different consultant teams
required to review the equity transaction.
* Believes wind projects are fantastic for the local economy as the BOP funds are entirely spent
in the local community. Very strong regional support as a result.
Financing of Renewable Electricity Projects in Atlantic Canada Page 72
Interviewee: Head of Power
Interviewers: Ching-yen Chen, Potian
Subject: Financing Renewable Projects in Atlantic Canada
Date: Nov 24, 2011 @ 9:30 am (In Person Meeting)
Category: Financial investor
* Have looked at projects in Atlantic Canada but found it difficult competing against NSP
* Beneficial that new process is independent of NSP as it was not a level playing field previously
given cost of capital advantage
* Do not like contracts where the asset is given back at the end of the PPA; strong preference for
retaining rights to the land, etc. (he thought there was a PPA in the region which that was the
case)
* Think a co-ordinated and integrated strategy across Atlantic Canada is the answer, easier to
enforce a co-ordinated balancing strategy across the ISOs, particularly given the regional
generation mix types (nukes in NB, coal in NS, renewables in PEI, etc…)
* Projects tend to be small (20 – 25MW in size), would be more comfortable going into the
region with a critical mass of at least 100 MW
* Have not looked at region in any detail recently, but would want to understand the curtailment
risks in more detail, particularly in NB, given the large base load supply from Lepreau

Financing of Renewable Electricity Projects in Atlantic Canada Page 73
Interviewee: Wind Developer
Interviewers: Ching-yen Chen, Potian; Mitch Rothman, Power Advisory
Subject: Financing Renewable Projects in Atlantic Canada
Date: Nov 22, 2011 @ 9:00 am (Phone Call)
Category: Medium-sized Developer
* Charge of renewable development in the NE region
* Sees no difference investing in Atlantic Canada vs other jurisdictions, may even be a little
easier as community support is better than some jurisdictions and permitting is easier in New
Brunswick, so we have to spend less on pre-approval processes. There is no problem sourcing
equipment or finding EPC contracts in Atlantic Canada. When financed in Atlantic Canada, talk
to the same people in the same banks in Toronto.
*Generally, the biggest issue for renewable development in Atlantic Canada is the number and
size of opportunities for procurement of renewable energy, just one in New Brunswick and one in
Nova Scotia. And these are small compared to those in Québec or Ontario just because the
markets are smaller. The problem is that each RFP attracts many bidders but produces relatively
few winners, and the projects they win tend to be relatively small. So the chances of winning and
the rewards of winning are small.
*What would make things easier is a FIT program, even one only for small (10 MW) projects,
rather than the RFP where the chance of winning is only 1-5%.
*We would not touch a project of less than 10 MW wind or 5 MW solar unless there is low risk
of not getting a contract. We looked at Nova Scotia COMFIT but concluded the projects are just
too small.
*Local content rules are OK in Ontario because it is large enough to attract the manufacturers.*
Will look at projects as small a $25 mm equity cheque
Financing of Renewable Electricity Projects in Atlantic Canada Page 74
Interviewee: Senior Power Professionals
Interviewer: Ching-yen Chen, Potian
Subject: Financing Renewable Projects in Atlantic Canada
Date: Dec 6, 2011 @ 2:00 pm
Category: Lender
* No problem financing projects in Atlantic Canada, mainly wind and also hydro. Have done it
before.
* Size is main driver, hard to look at anything less than $50 mm debt in size. Think this will be
hard for anyone to provide such loans on a nonrecourse basis.
* Government support would help but it’s still hard to chase because it's so small
* For it to be considered a non-recourse loan, it would have to very, very close to government
debt for it to not be a power project / need to evaluated by the project group
* Key is what's the size, quality, experience of the sponsors? Even if the size is there, developer
needs experience to do non-recourse financing
* Concern about lending to biomass projects as they have had a chequered past. Tougher - start-
up, supply, and O&M concerns than other technologies
* Expect views to be similar to other banks
* Smaller projects summing to $50 mm in size is, possibly ok, but careful that it's just not 4
separate financings. Much prefer one project of $50mm.
* While $50 mm is a minimum size, sweet spot $100 mm and up, preferably structure 300 to 400
mm, but hold $75 mm or so
* Commonly mini-perm structures - construction + 5/7 (maybe not 10)
* Pricing is ~250 bps, but moving target and unclear the impact will be from turbulence in the
European markets. Some are dropping out even when committed. See more impact on term than
pricing.
* Focused on wind development in the region. While the company has historically looked at
biomass, they are no longer pursuing that.
* If Nova Scotia and New Brunswick were both planning an RFP in the same time frame, it
would be an interesting idea to run it jointly and to break it up into 10 MW segments to increase
the number of developers who can win.
Financing of Renewable Electricity Projects in Atlantic Canada Page 75
APPENDIX C: POLICIES FOR LARGER IPPS
Renewables Obligations (Renewable Portfolio Standards)
Renewables obligation programs require a certain fraction of the total electricity supply to be
from renewable resources. The requirements are stated as a fraction of the supply at a certain
date, often with intermediate requirements. These programs are also called renewable portfolio
standards (RPS). In the United States, 29 states have RPS requirements and 8 more have
renewable goals. Recent U.S. legislative proposals had provisions for a national RPS program.
The obligation is generally placed on the entities responsible for providing electricity (load-
serving entities). 108
They can meet it by producing renewable power or contracting directly with
a producer. They can also purchase credits (called Renewable Energy Credits or Certificates, or
RECs) from renewable power producers. RPS programs create a separate market for the
renewable attributes of renewable power which allows developers to recover a portion of the cost
of their projects.
The expectation of RPS programs is that RECs would be priced at the incremental cost of
renewable power projects beyond the value of conventional resources. If they are priced below
that, the REC value will not be sufficient to allow the project to be financed. If they are priced
above that, additional renewable producers will enter the market and create a surplus of RECs.
In the United States, RPS requirements range from 12.5% by 2021 in North Carolina to 33% by
2020 in California.
The important design features of an RPS, in addition to the requirement and timetable, are the
definition of renewable resources which can satisfy the RPS, including whether they have to be
from within the jurisdiction or not and whether there are any technology carve-outs, requiring
some of the renewable energy to come from specified technologies or specified project sizes;
whether the renewables muse be procured in certain ways (e.g., only through RFPs); and whether
there is an amount that responsible entities can pay if they do not have enough RECs to meet their
obligation, which then forms a cap on the price of the RECs.
The effectiveness of an RPS program depends primarily on how much new renewable
construction it requires. The programs in California and Massachusetts, for example, have high
enough requirements that they cannot be met entirely from in-state resources. They have
attracted investment in neighboring jurisdictions, including investment in Atlantic Canada to
create RECs that can be sold in Massachusetts.
De Jager and Rathmann109
conclude that renewables obligations are less effective than FITs in
reducing capital cost, because by their nature the value the electricity of the RECs in the market
cannot be known in advance. The effectiveness of RPS can be undermined by changes to the
resource eligibility requirements. RPS programs are regulatory creations. Changes to these
108
Power Advisory reviewed US RPS programs for Natural Resources Canada and assessed the potential
trade impacts of relaxing provisions in RPS that represent a barrier to trade. “The Potential Impact of
Relaxing Renewable Portfolio Standard Constraints on Canada-US Electricity Trade”, March 31, 2011. 109
Op. cit.

Financing of Renewable Electricity Projects in Atlantic Canada Page 76
regulations, particularly the types of resources that are eligible to participate, create uncertainty,
cause prospective participants to be reluctant to participate, and signal to others the risks of
participating if rules can be changed that affect the value of the program.
To be effective in Atlantic Canada in removing barrier to the financing of smaller renewable
projects, RPS programs would have to carve out requirements for smaller or community-based
projects. RPS programs that require RFPs will exclude smaller developers for whom the cost of
bidding is prohibitive for an RFP with a highly uncertain outcome.
Production Subsidies
Production subsidies are amounts paid to the generators on the basis of their output. They are
stated as an amount per kWh. Such programs are typically funded from general government
revenues, though they may be funded from a charge on electricity rates. These policies are
reviewed in this Appendix because they have more typically been applied at the federal level and
because one application of such policies, production tax credits, is more applicable to larger
companies which can take better advantage of the tax benefits.
Canada has had several such subsidy programs. The first was the Wind Power Production
Incentive (WPPI), which paid from $.012 to $0.01 per kWh for all output for the first ten years of
a project producing wind power. WPPI was replaced by the ecoENERGY for renewables
program, which paid $0.01 per kWh for 10 years. No applications for ecoENERGY were
accepted after March 31, 2011.
The United States has had similar production incentives, but they have typically been only for
limited periods and based on production tax credits (PTC) with renewal dependent on passing
new legislation in the Congress.110
These have created flurries of investment activity as the end
of each funding period approached. With The American Recovery and Reinvestment Act of 2009,
the PTC was expanded to include an investment tax credit and a Treasury Grant given the
difficulty of finding investors with tax appetites that could utilize the tax credits generated. The
PTC is scheduled to expire for wind projects at the end of 2012 and the Treasury Grant required
that projects expend at least 5% of the project cost by the end of 2011. Extension of the PTC is
uncertain given fiscal pressures in the US and the current political environment. Recent moves in
Congress have created more uncertainty and prompted a warning from the American Wind
Energy Association about the economic consequences if the PTC is not renewed.111
One disadvantage of the PTC is that it requires taxable income to realize the benefit and project
developers typically don’t have sufficient income tax liability to fully utilize the PTC. This
requires that a party be brought in who has the necessary appetite for these tax benefits. To
induce these parties to participate in the project, the developer typically has to provide a sufficient
return which leads to discounting the value of these tax benefits. This can result in a loss of value
and higher transaction costs which increase overall financing costs.
110
The PTC is currently about 2.2 cents/kWh for wind projects, almost twice what the ecoENERGY
program offered. 111
American Wind Energy Association, “As wind manufacturing job losses loom, bi partisan wind PTC
extension drive continues”, press release, Feb. 16, 2012.

Financing of Renewable Electricity Projects in Atlantic Canada Page 77
The PTC, ITC and Treasury Grants provide US renewable energy projects with a policy-based
competitive advantage which must be overcome by renewable energy projects in Atlantic Canada
by more favourable renewable resources or lower project costs. Failure to renew the PTC would
reduce this advantage.
Production subsidy programs are less effective than FIT programs in overcoming financing
barriers. A 10-year production incentive payment lasts only half as long as a FIT contract, and
generally half as long as the financing for the project.
The developer still takes the market price risk in a competitive market, unless it has a contracted
price. Since the payments are funded from general government revenues, they are vulnerable to
cancellation when the government experiences fiscal problems. .
Carbon pricing programs
Programs that increase the price of conventional electricity sources relative to renewable
resources provide revenue support by increasing the value of the renewable electricity. A critical
issue with the design of such programs is how the carbon price is established: administratively or
by a market for carbon. These programs are placed in this Appendix because they generally do
not provide sufficient revenue certainty to facilitate financing of small renewable projects.
An administratively determined price could be established by estimating the environmental cost
of global warming due to greenhouse gases, i.e., on the basis of damage cost estimates. The
carbon price would then be included as part of the price of electricity generated using fossil
sources, increasing the market price of electricity in general and therefore providing additional
revenue for electricity from renewables, since they have no carbon emissions.
Carbon can also be priced through a cap and trade system or on a market basis, under which
emitters are given carbon limits and allowed to purchase allowances from others in the system. A
group of Northeastern US states has one such program, the Regional Greenhouse Gas Initiative
(RGGI). These states have committed to a schedule of carbon reductions and allocated the
reductions among themselves. Carbon allowances are auctioned every three months; the clearing
price in all four of the 2011 auctions was US$1.89 per short ton, the minimum allowable bid.
These auction results show that CO2 allowances are not in short supply given reduced electricity
demand from the recent recession and lower natural gas prices which is causing some coal-fired
generation to be displaced by natural gas-fired generation. At this price, the impact on the
competitive viability of renewable generation is relatively small. The RGGI auction price would
increase the price of electricity from coal-fired plants by under $2 per MWh, or about 4% of the
average electricity price in New England in 2010.112
The effectiveness of carbon pricing in promoting renewable electricity therefore depends on the
prices for carbon and on the relative costs of renewable and conventional generation. Carbon
pricing addresses a global, not a local, problem. Carbon pricing would be most effective as a
federal program, but no Canadian federal government has shown interest in a program that prices
carbon emissions.
112
Based on 1999 emissions data, the most recent available, from the US Energy Information
Administration of 0.95 tonnes of CO2 per MWh from coal-fired plants.

Financing of Renewable Electricity Projects in Atlantic Canada Page 78
To be effective in facilitating finance for renewable generation development, a carbon pricing
program would have to provide enough additional revenue and revenue certainty to reduce the
risk to the renewable developer and therefore affect financing conditions. As shown by the RGGI
experience, carbon pricing programs have not yet achieved that level of price support and price
certainty.
Accelerated depreciation
Accelerated depreciation programs reduce the present value of the capital costs by allowing them
to be depreciated more rapidly. In Canada, Class 43.1 treatment allows a 30% per year declining
balance treatment for the assets, rather than a 6% per year declining balance. In the United
States, the 5-year Modified Accelerated Cost Recovery System allows onshore wind energy
facilities to be depreciated over 5 years. These programs are included in this Appendix because
the proponents of small projects in Atlantic Canada are likely not to have income tax liability
(community groups or aboriginal bands) or to be small enough that accelerated depreciation has
less financial impact.
De Jager and Rathmann113
calculate that these programs can be quite effective, reducing the
levelized cost of energy in Canada by 5% for the 20 MW wind project that they consider.
For these programs to be most effective, however, the entity owning the project must be taxable
and have income subject to tax in the power sector as these programs effectively defer taxes so
they do impact government fiscal positions. In the U.S., the impacts of these programs is more
significant as investing in renewable generation can be used to offset a corporations’ income in
other sectors; whereas in Canada the tax benefits must be utilized within the same sector.
113
Op. cit.