Embed Size (px)
DESCRIPTION
Financing in Sync: Aligning the Pieces of Higher Education Funding. College Affordability Summit Chicago, Illinois February 26, 2010. The Illinois Public Agenda for College & Career Success. Goals Increase educational attainment to match best-performing states - PowerPoint PPT Presentation
Citation preview

National Center for Higher Education Management Systems3035 Center Green Drive, Suite 150Boulder, Colorado 80301
Financing in Sync:Aligning the Pieces of Higher Education Funding
College Affordability SummitChicago, Illinois
February 26, 2010

The Illinois Public Agenda for College & Career Success
• Goals1. Increase educational attainment to match best-
performing states
2. Ensure college affordability for students, families, & taxpayers
3. Increase the number of high-quality postsecondary credentials to meet the demands of the economy and an increasingly global society
4. Better integrate Illinois’ educational, research, and innovation assets to meet economic needs of the state and its regions
2

“2. Priorities, policies, and budgets must align with state goals.”
Among the principles established in conjunction with the public agenda
3

Policy Levers
slide 4
Strategies for Achieving Goal Attainment
Planning and Leadership
Finance RegulationAccountabilit
yGovernance
Goal 1Attainment
Goal 2Affordability
Goal 3IncreaseCredentials
Goal 4Meet EconomicNeeds
Consi
stency
Alignment

Of the Policy Levers Available to Legislatures, the Most Powerful is Finance
• Finance Policy– Sends the strongest signals– Creates the strongest incentives for institutional
behavior
In the absence of alignment between goals and finance policy, failure to achieve goals will be
assured.
5

Two Purposes for State Funding
• Sustaining institutions – capacity creation & maintenance
• Investing in state priorities – capacity utilization
slide 6

The Flow of Funds
7
Federal Government
Public
Institutions
Private
Tax Policy
Appropriations/GrantsStudent Aid
Tuition
Scholarships &Waivers
Student Aid (Restricted)
Income
Available State and Local
Govt. Funds
FederalGovernment
Higher Education
Students
Economy
• K-12• Corrections• Health Care• Other Govt.
DonorsFoundationsCorporations
Stimulus
Funds

The Flow of Funds - State
8
Federal Government
Tax Policy
Appropriations/GrantsStudent Aid
Tuition
Scholarships &Waivers
Available State and Local
Govt. Funds
Higher Education
Students
• K-12• Corrections• Health Care• Other Govt.
Stimulus
Funds
Federal Government
Student Aid
Income
Economy
Public
Institutions
Private

State/Local Funding plus Tuition Revenues per Student (FTE)
Illinois Public Institutions, 1983-2008$5
,813
$6,5
25
$6,6
07
$7,2
20
$7,2
70
$6,8
41
$7,0
21
$7,6
47
$7,2
55
$6,7
20
$6,7
67
$7,0
78
$7,4
27
$7,6
73
$8,2
28
$8,5
10
$8,8
39
$8,9
92
$9,3
06
$9,2
65
$8,1
67
$7,5
58
$7,4
59
$7,0
54
$7,3
29
$7,5
85
$1,4
37
$1,6
39
$1,7
40
$1,7
32
$1,6
51
$1,8
52
$1,9
68
$1,7
78
$1,6
87
$1,7
10
$1,8
49
$1,8
93
$1,9
04
$2,0
14
$2,1
16
$2,1
42
$2,1
69
$2,1
88
$2,2
42
$2,3
40
$2,5
40
$2,6
65
$3,0
00
$2,9
29
$3,0
76
$3,1
94
$0
$2,000
$4,000
$6,000
$8,000
$10,000
$12,000
$14,000
0
50
100
150
200
250
300
350
400
450
1983
1984
1985
1986
1987
1988
1989
1990
1991
1992
1993
1994
1995
1996
1997
1998
1999
2000
2001
2002
2003
2004
2005
2006
2007
2008
Do
llars
pe
r F
TE
Pu
blic
FT
E E
nro
llme
nt
(Th
ou
sa
nd
s)
Public FTE Enrollment, Educational Appropriations and Total Educational Revenue per FTE, Illinois -- Fiscal 1983-2008
Net Tuition Revenue per FTE (constant $) Educational Appropriations per FTE (constant $) Public FTE Enrollment
Note: Constant 2008 dollars adjusted by SHEEO Higher Education Cost Adjustment. (HECA) Source:SHEEO SHEF
9

State Tax Capacity & EffortIndexed to U.S. Average
Source: State Higher Education Executive Officers (SHEEO)
AL
AK
AZ
AR
CACO
CT
DE
GA HI
IL
IN IAKS
KYLA
ME
MD
MA
MS
MT
NE
NV
NJ
NY
NC
ND
OH
OK
PA
RI
SC
SD
UT
VT
VA
WA
FL
ID
MI
MN
MO
NH
NM
TNTX
WV
WI
WY
0.6
0.7
0.8
0.9
1.0
1.1
1.2
1.3
1.4
1.5
1.6
1.7
0.6 0.8 1.0 1.2 1.4
Sta
te T
ax C
apacity
(Tota
l Taxable
Reso
urce
s Per C
apita
)
State Tax Effort (Effective Tax Rate)
US
OR
slide 10

State Tax Capacity and Effort - Illinois Indexed to U.S. Average
Source: State Higher Education Executive Officers (SHEEO)
0.90
1.00
1.10
1.20
1992 1993 1994 1995 1996 1997 1998 1999 2000 2001 2002 2003 2004 2005
Tax Effort (Effective Tax Rate)
Tax Capacity (Total Taxable Resources Per Capita)
U.S. Average
Revenues Per Student from Net Tuition, State, & Local Appropriations
Public Research
slide 12
$29,172$24,184
$23,263$22,095
$21,640$21,384
$20,010$19,865$19,783$19,721$19,545$19,227$18,989$18,843$18,773$18,657$18,537
$17,610$17,360$17,267$16,974$16,774
$16,275$16,195$16,172$16,155$16,092$16,059$16,057$15,837$15,774$15,714$15,568$15,541$15,406$15,180$15,125$15,093$15,003$14,865$14,777
$14,018$14,006$13,675
$13,121$12,666$12,449$12,324
$11,620$11,243
$9,682
$0
$5,000
$10,000
$15,000
$20,000
$25,000
$30,000
$35,000
Alaska
Minnesota
Haw
aiiConnecticutN
ew York
Vermont
North Carolina
Massachusett
sKentuckyW
yoming
Maryland
Nebraska
Alabam
aCaliforniaIow
aD
elaware
New
JerseyTennesseeW
ashingtonSouth CarolinaM
ainePennsylvaniaN
ew M
exicoN
ationIdahoIndianaM
ichiganM
issouriRhode IslandKansasVirginiaG
eorgiaU
tahW
isconsinO
klahoma
Nevada
Ohio
West Virginia
Arizona
Arkansas
IllinoisFloridaN
orth Dakota
New
Ham
pshireTexasLouisianaM
ississippiO
regonSouth D
akotaM
ontanaColorado
Sources: NCES, IPEDS 2006-07 Finance Files; f0607_f1a and f0607_f2 Final Release Data Files.
NCES, IPEDS 2007-08 Institutional Characteristics File; hd2007 Final Release Data File.NCES, IPEDS 2006-07 Enrollment Files; ef2006a, effy2007, and efia2007 Final Release Data
Files.

Revenues Per Student from Net Tuition, State, & Local Appropriations
Public Masters and Baccalaureate
slide 13
$17,984 $16,148 $14,587$14,440$14,426
$13,683$12,929
$12,324$12,105$12,011$11,862
$11,443$11,443$11,389$11,284$11,266$11,249$11,063$10,836$10,788$10,778$10,721
$10,464$10,405$10,370$10,343$10,312$10,275$10,251$10,179$10,162$10,039
$9,957$9,945$9,933$9,702$9,701$9,630$9,622$9,410$9,185$8,959$8,846$8,748
$8,414$8,400
$7,964$7,877
$7,209$6,311 $5,105
$0
$2,000
$4,000
$6,000
$8,000
$10,000
$12,000
$14,000
$16,000
$18,000
$20,000
Delaw
areH
awaii
ConnecticutN
orth CarolinaA
laskaN
ew Jersey
New
Mexico
Iowa
Maryland
Massachusett
sM
aineVerm
ontVirginiaRhode IslandA
labama
Montana
IllinoisW
ashingtonN
ew York
FloridaM
ichiganSouth CarolinaKentuckyO
hioM
ississippiN
ation IdahoM
issouriD
C KansasPennsylvaniaCaliforniaN
ew H
ampshire
Minnesota
TexasIndianaTennesseeO
regonN
orth Dakota
Arkansas
Nebraska
Wisconsin
Nevada
Oklahom
aLouisianaG
eorgiaW
est VirginiaSouth D
akotaA
rizonaU
tahColorado
Sources: NCES, IPEDS 2006-07 Finance Files; f0607_f1a and f0607_f2 Final Release Data Files.
NCES, IPEDS 2007-08 Institutional Characteristics File; hd2007 Final Release Data File.NCES, IPEDS 2006-07 Enrollment Files; ef2006a, effy2007, and efia2007 Final Release Data
Files.

Revenues Per Student from Net Tuition, State, & Local Appropriations
Public 2-Year
slide 14
$14,793$11,197
$10,683$10,287
$9,964$9,953 $9,125
$8,844$8,801$8,705$8,625$8,480$8,449$8,411$8,378$8,214$8,067$8,044
$7,772$7,633$7,566$7,509$7,507$7,448$7,432$7,416$7,403$7,329$7,239$7,222$7,117$7,018$6,918$6,895$6,844$6,823$6,714$6,676$6,630$6,510$6,465$6,353
$6,082$6,028$5,970$5,945$5,939
$5,712$5,517
$5,297$3,369
$0
$2,000
$4,000
$6,000
$8,000
$10,000
$12,000
$14,000
$16,000
Wisconsin
Haw
aiiW
yoming
Maryland
Delaw
areConnecticutVerm
ontKansasO
regonN
ew York
New
Ham
pshireIdahoM
assachusetts
New
Mexico
Alaska
Michigan
PennsylvaniaN
orth Dakota
Minnesota
Arizona
Rhode IslandO
hioU
tahN
orth CarolinaTexasN
ationM
ontanaCaliforniaW
ashingtonM
aineN
evadaA
labama
IllinoisN
ebraskaM
issouriLouisianaTennesseeIow
aA
rkansasN
ew Jersey
Oklahom
aSouth CarolinaFloridaG
eorgiaM
ississippiVirginiaSouth D
akotaColoradoIndianaKentuckyW
est Virginia
Sources: NCES, IPEDS 2006-07 Finance Files; f0607_f1a and f0607_f2 Final Release Data Files.
NCES, IPEDS 2007-08 Institutional Characteristics File; hd2007 Final Release Data File.NCES, IPEDS 2006-07 Enrollment Files; ef2006a, effy2007, and efia2007 Final Release Data
Files.

Net Tuition as a Percent of Public Higher Education Total Educational Revenue by
State, FY 2008
Note: Dollars adjusted by 2008 HECA, Cost of Living Adjustment, and Enrollment Mix
Source: SHEEO SHEF15

Affordability
16

Percent of Family Income Needed to Pay for College
Minus Financial Aid
Public 2-Year Public 4-Year
Source: Measuring Up 2008
Private 4-YearNot for Profit
17

Illinois Public Institutions – State & Family Share of Funding
1988-2008
Source: Delta Project on Postsecondary Education Costs, Productivity, and Accountability; Delta Cost Project IPEDS Database.
18
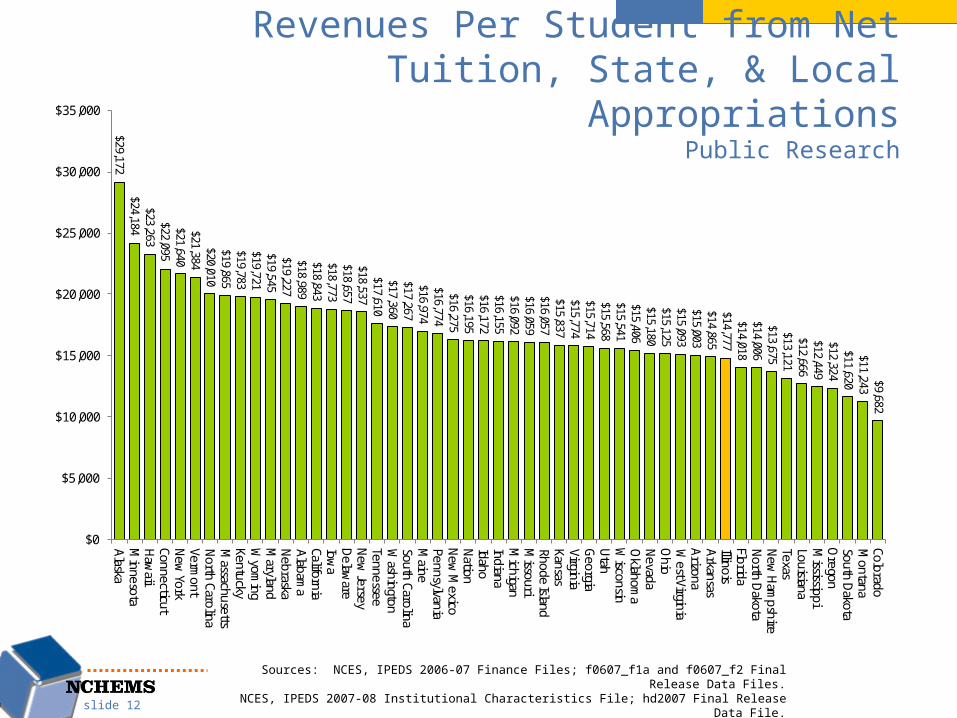
Illinois Public Research Institutions State & Family Share of Funding
1988-2008
Source: Delta Project on Postsecondary Education Costs, Productivity, and Accountability; Delta Cost Project IPEDS Database.
19

Illinois Public Masters & Bachelors Institutions State & Family Share of Funding
1988-2008
Source: Delta Project on Postsecondary Education Costs, Productivity, and Accountability; Delta Cost Project IPEDS Database.
20
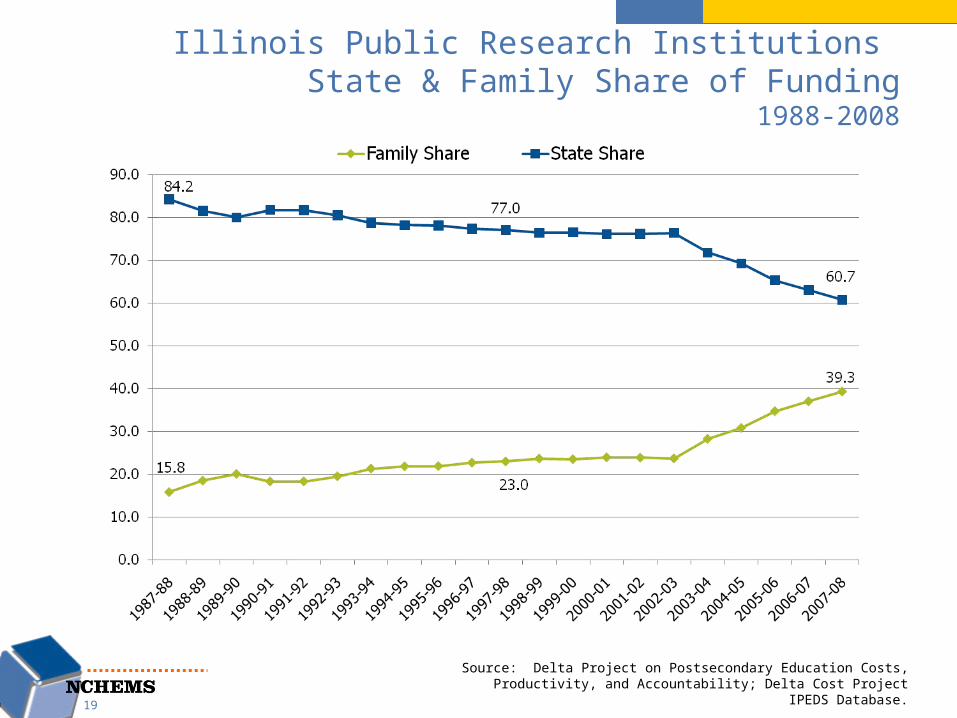
Illinois Public Associates Institutions State & Family Share of Funding
1988-2008
Source: Delta Project on Postsecondary Education Costs, Productivity, and Accountability; Delta Cost Project IPEDS Database.
21

Affordability: Need-based Financial Aid
slide 22
108% 102%96%
88% 86% 84%84% 82%
74% 70%62% 59% 57%
56%50%49%48%48% 46% 43% 41%
41% 37%36% 33%
32% 29%28%28%28% 24% 21%
20%19% 17%
16% 13% 10% 9% 8% 8% 6% 5% 5% 5% 3% 1% 1% 0% 0%
0%
20%
40%
60%
80%
100%
120%
Washington
New
Jersey Verm
ont N
ew York
Pennsylvania Indiana M
innesota Illinois Connecticut N
orth Carolina W
isconsin M
aryland M
assachusetts
California Virginia D
elaware
Kentucky N
evada O
hio W
est Virginia Colorado O
klahoma
Maine
South Carolina Iow
a Texas M
issouri A
rkansas M
ichigan Rhode Island O
regon Florida N
ew M
exico N
ebraska Kansas Tennessee N
ew H
ampshire
North D
akota M
ontana Louisiana U
tah A
laska A
labama
Haw
aii Idaho A
rizona M
ississippi W
yoming
Georgia
South Dakota
Source: Measuring Up 2008
State need-based aid as a proportion of federal need-based aid.
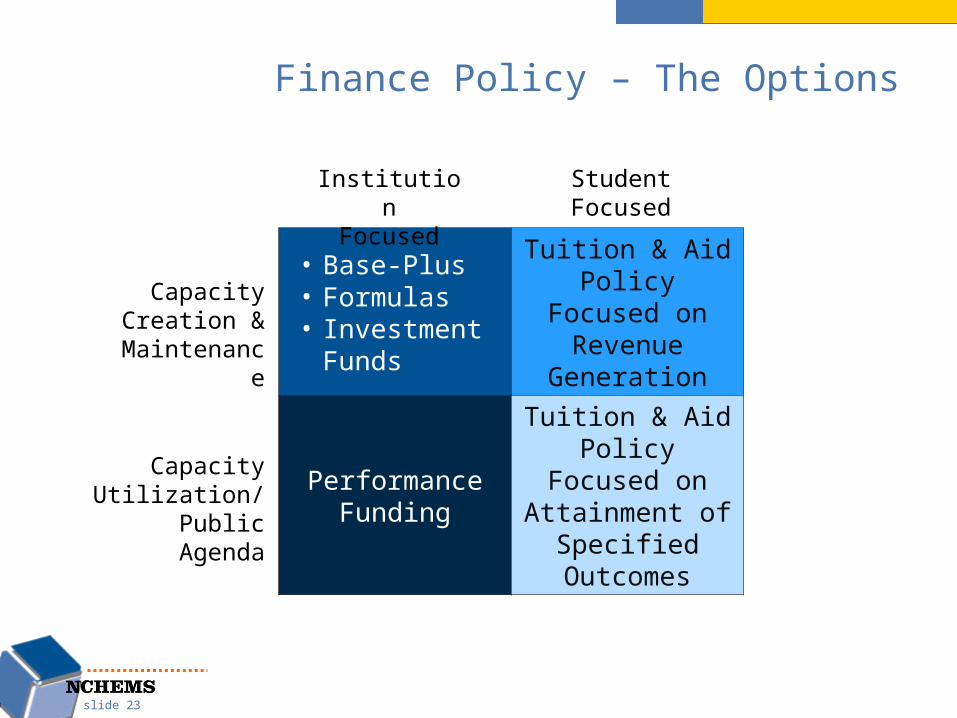
Finance Policy – The Options
slide 23
• Base-Plus• Formulas• Investment
Funds
Tuition & Aid Policy Focused
on Revenue Generation
Performance Funding
Tuition & Aid Policy Focused on Attainment
of Specified Outcomes
CapacityCreation &
Maintenance
Capacity Utilization/
Public Agenda
InstitutionFocused
StudentFocused

Question – are the incentives created consistent with pursuit of
stated goals?
Remember – all funding mechanisms create incentives for behavior
• Institutions• Students
24

Incentives in the Current Funding Mechanism
• Keep students enrolled – but not necessarily completing
• Increase tuition to compensate for declines in state allocations
25