Embed Size (px)
Citation preview
Report No. 6082
Financing Adjustment With Growthin Sub-Saharan Africa, 1986-90
February 1986
FOR OFFICIAL USE ONLY
Document of the U4rId Bank
This document has a restricted distribution and may be used by recipientsonly in the performance of their official duties. its contents may not otherwísebedisclosed without Worid Bank authorization.
Pub
lic D
iscl
osur
e A
utho
rized
Pub
lic D
iscl
osur
e A
utho
rized
Pub
lic D
iscl
osur
e A
utho
rized
Pub
lic D
iscl
osur
e A
utho
rized
Pub
lic D
iscl
osur
e A
utho
rized
Pub
lic D
iscl
osur
e A
utho
rized
Pub
lic D
iscl
osur
e A
utho
rized
Pub
lic D
iscl
osur
e A
utho
rized
THE WORLD BANKWashngtUonID. C. 20433
U.5.A.
A.W. CLAUSENPheit ~February 21, 1986
MRMORANDUM TO THE EXECUTIVE DIRECTORS
Subject: Financing Adjustment with Growth in Sub-Saharan Africa, 1986-90
This i8 the World Bank's fourth report focusíng on developmentissues and requirements in sub-Saharan Africa. Since 1981, the developmentstrategíes of many African countries have changed dramatically. Majorstructural reforms are being uindertaken and some promising results arealready evident. The tragedy of drought and famíne heightened the urgencyof these reforms while often weakening the capacity to implement them.Nevertheless, many African policy-makers have demonstrated farsighteddetermination in pursuing necessary reforms. While much remains to bedone, especially in addressing long-term issues of human and naturalresource development, there has been marked progress by many Africancountries in redressing major macro-economic and sectoral distortions.
The response of the donor community to Africa's famine wasgenerous and effectíve, and represe.ated a heartening example of how a widearray of donors can pursue a shared obiective to the great benefit of thepeople of Africa.
However, the major structural reforms undertaken by many Africancountries to address their long-term development problems have not receivedadequate donor support. As noted in the Report, growth and equityenhancing reform programs already under way are foundering because ofinadequate donor fundlng, which ís often inappropriate in form andtiming. Countríes consídering major reform programs can find littleencouragement from the donor support demonstrated for those countries withreforms under way. In the absence of adequate financial support,structural reforms cannot be achieved with growth. Adjustment throughfurther economíc contraction ls not a feasible alternatíve in a continentwhere per capita income levels today are no higher than they were twentyyears ago.
-2-
In the past, the Bank has argued that resource availability isonly one element ín addressing Africa's development; the political will ofAfrican leaders, essential to effectively utilize both domestic and foreignresources, is also critical. But there is now growing evidence that manyAfrican countries are exercising this political will. Theír comnitment andefforts must be matched now by the political will of the donor community toincrease the resources available to implement growth-oriented adjustment 3programs.
The resources needed to restore growth prospects in Africa are notlarge but they exceed by far those currently available or envisaged. Theseresource requirements reflect the deepening debt problem _n Africa, with arapidly increasing share of resource flows required to service debt, aswell as a decline in non-concessional flows due to the deterioratingcreditworthiness of the region. While-some increases in bilateral andmultilateral flows are foreseen, because of an enlarged Lome III and theSpecial Facility for Sub-Saharan Africa, a further US$2.5 billion per yearin concessional flows and debt relief is required ín 1986-90 to restoreAfrican import capacity per capita to its 1980-82 level, even assuming asignificant increase in exnorts. The increased flows from multilateralagencies including an enlarged IDA-8, IMF Trust Fund reflows, and anenhanced replenishment of the African Development Fund, when due, mightprovide up to $1 biLlion per year of these additional funds. For theremainder, a major effort is required in bilateral assistance -- whetherthrough new money or more liberal debt relief.
Donor action is also required in several areas to enhance theeffectiveness of assistance to Africa. Many of these actions are not new;they have been discussed and agreed upon in principle in various fora.However, their implementation has lagged far behind the implementation ofstructural reforms by many African countries, and urgent action is nowrequired on matters relating to the quality, form, timeliness andcoordination of aid. Action in the following areas would do much tostrengthen the system:
- Donors must be willing to work within coherent and realisticadjustment and investment programs designed by African governments.Projects outside thcese programs are of lower priority and should not befinanced unless the agreed prioríty program is also fully financed.
- Donor decisions on aid and debt relief must be made together inlight of an overall financial package and a program of adjustment withgrowth. This could be achieved Sn the context of adapted consultativegroup meetings or roundtables.
- To enhance the effectiveness of aid group meetings, the ¡najorparticipants should discuss the key elements of the financial package andadjustment program required for the country, in advance of the meeting, andarrangements should be made to monitor implementation of aid commitments insupport of each adjustment program.
- Donors should provide meaningful medium-term indications of aidand debt relief levels-, to enable countries to program their investmentstrategies in light of an indicative resource envelope.
For its part, the World Bank stands ready to further strengthenits role in assisting countries to design programs of growth-orientedadjustnent and in their funding. In addition, as requested by theDevelopment Committee, the Bank will continue to exercise a leading role inestablishing mechanisms to enhance the effectiveness of aid flows throughimproved coordination and monitoring.
There are opportunities ahead to restore many African countries toa sustainable growth path. But substantially increased donor support isessentlal to capitalize on these opportunities.
FOR OFFICIAL USK ONLY
Financing adjustment with growthin Sub-Saharan Africa, 1986-90
The World BankWashington, D.C.February 1986
This document has a restricted distribution and may be used by recipientsonly in the performance of their offícial dutíes. Its contents may notothervise be dísclosed without World Bank authorization.

.i
Contento
Country coverage y
Acrongym aud definitiona vi
Sumuary aUd conclusion. 1
Progreso in domestic policy reform 1Resource scarcity 2Measuring the resource gap 2Bridging the resource gap 3Improving aid coordination 4A year of opportunity 4
1 Introduction 5
The end of the drought 5Continuing long-term decline 7The deepening debt problem 8A strategy of adjustment with growth 9
2 Adjusttent programa 11
Correcting overvalued exchange rates 12Correcting urban-rural bias 14Rationalizing the public sector 17
3 Long-ter= constrainta on growth 20
Population 20Human resources 23
Health 23Education 24
Deforestatíon 25Agricultural research 26 _
4 External capital and aid coordination 30
External resource flows, 1986-90 30Foreign exchange requirements 31Sources of external finance 33Bridging the resource gap 36
Institutional reforms in aid coordination 37Recent progress 37Further reforms 38
Appendix A: The debt problea and ita implications for import capacity 41
Profile of the African debt problem 41Projected debt-service burden and ímport capacity 42
Appendix B: Macroeconomic indicators 48
Statistical Annez 51
Kap 109
- ív
Text tables
1.1. Develop¡Aents vi the trade environmentof IDA-eligible countries, 1970-86 6
1.2* Output, populecion, income, andconsumption in IDA-elígible countries, 1960-86 7
1.3. Availabilíty of resourcesin IDA-eligible countries, 1960-84 8
2.1. Earnings as a multiple of per capitaGDP: Sub-Saharan Africa and Asia 16
3.1. Desired family size and actual fertility rates 22
3.2. Agricultural research efforts:Sub-Saharan Africa, Asia, and Latin America, 1980 27
4.1. Foreign exchange paymentsby IDA-elígible countríes, 1980-90 32
4.2. Supply of external finance for IDA-eligiblecountries, 1980-90 34
4.3. Concessional resource gap forIDA-eligible countries, 1986-90 35
Text figures
2.1. Real effective exchange rate indexesin developing countríes, 1971-84 13
This Report was prepared by a team led by Ramgopal Agarwala and comprisingCharles Humphreys, Kathie Krumm, and John Underwood, with the assistance ofmany World Bank staff members and Stanley Please, principal consultant. Itdraws heavily on the ideas and views expressed by scholars and officials inAfrica and in donor countries. The work was carried out under the generaldirection of Xavier de la Renaudiere. Sang Lee, in collaboration with RameshChander and with the assistance of Zafar Ahmed and Maria Cristina Germany andothers, prepared the Statistical Annex. Clive Crook was principal editor andJane Carroll and Carol Rosen were technical editors. Special thanks go to thesupport staff, headed by Jean Ponchamni and including Lynn CIark-MCCarthy andAnn Van Aken.
v
Country coverage
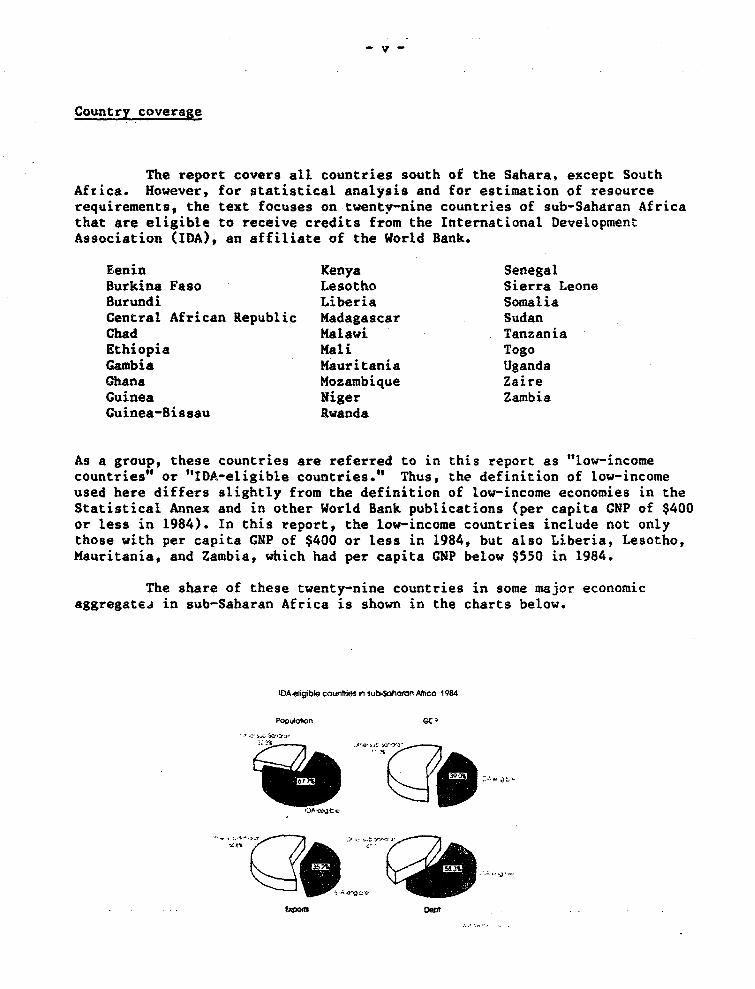
The report covers all countries south of the Sahara, except SouthAfrica. However, for statistical analyuis and for estimation of resourcerequirementa, the text focuses on twentv-nine countries of sub-Saharan Africathat are eligible to receive credíts from the International DevelopmentAssociation (IDA>, an affiliate of the World Bank.
Eenin Kenya SenegalBurkina Faso Lesotho Sierra LeoneBurundi Liberia SomaliaCentral African Republic Madagascar SudanChad Malawi TanzaniaEthiopia Mali TogoGambia Mauritania UgandaGhana Mozambíque ZaireGuinea Niger ZambiaGuinea-Bissau Rwanda
As a group, these countries are referred to in this report as tlow-íncomecountries" or "IDA-eligible countries." Thus, the definition of low-incomeused here differs slightly from the definition of low-income economies in theStatistical Annex and in other World Bank publications (per capita GNP of $400or less in 1984). In this report, the low-income countries include not onlythose with per capita GNP of $400 or less in 1984, but also Liberia, Lesotho,Mauritania, and Zambia, which had per capita CNP below $550 in 1984.
The share of these twenty-nine countries in some major economicaggregate.i in sub-Saharan Africa is shown in the charts below.
IDA eigibte counhGs in sub-Soharan Alico 1984
popuúon hGC
e7-a,
Eagofts DeS-
- ví -
Acronyms and defiuitions
DAC Development Assistance Committee of the OECDFAO Food and Agriculture OrganizationIDA International Development AseociationILO InLernational Labour OrganisationIMF International Monetary FundODA Official development assistanceOECD Organisaton for Economic Co-operation and DevelopmeatOPEC Organization of the Petroleum Exporting CountriesUNICEI United Nations Children's FundUNCTAD United Nations Conference on Trade and DevelopmentUnesco United Nations Educational, Scientific and Cultural OrganizationUNIDO United Nations Industrial Development OrganizationWHO World Health Organization
Unless otherwise indicated, tables and figures in the text andappendices are based on World Bank data. Growth rates are least-squaresestimates in constant prices unless otherwise stated.
Billíon is 1,000 million.
Dollars are US dollars.
.. Not available.
.) Less than half the unit shown.
Summary and conclusiona
Sub-Saharan Africa ia emergín& from one of the worst famines inrecent history. Cood rainas have come to much of the region. Per copitaincomes should rise this year for the first time since 1980. Even so, thereis little cause to celebrate. Low-income Africa ¡s poorer ín 1986 than it wasa generation aga in 1960. And though the recent good news interrupts thetrend of chronic economic decline, it will not be enoug- to reverse it.Population growth is largely unchecked, productivity all but stagnant. Ifpresent trends continue, the human disaster of 1983-84 in sub-Saharan Africavill return to haunt the world community.
This year gives a breathing opace. Africa shoutd use it to makeatructural adjustmenta aimed at reviving growth, especially in agriculture,and to halt the deterioration in basic health and education services. Donorcountries, for their part, must not see 1986 as a time to relax. Theprincipal theme of this report ¡s that Africa's attempts to help itself willfail with"u additional resources in the form of new aid and debt relief.
Progreuo la domestic policl refor.
Many Afri-an goverments are now making significant progresain structural adjustmen.. Sut they atill have much to do tocorrect the accumulated policy distortiona of the past.
In many African countries, government policy has long discriminatedagainst agriculture--the sector which ¡a not only crucial for any attempt toraise output and exporte, but whích also gives most of the poor theirlivelihood. Dismantling such policies will hela the region to increase outputand exporte, and help the poor at the same time. Thís proceso has begun.Goveramenta have started to reduce the overvaluation cf their currencíes--oneway in which agriculture had been penalized. They have increased adrículturalprices and lowered real urban wages. They have reduced public spending, vitbite bias toward expanding employment in urban areas.
These are welcome reformst but no more than the first steps.Exchange retes remain severely overvalued in many African countries.Producers' shares of export yrices are still too low. Urban wages are higherthan in other low-income developing countries.
Africa's governnments have done even less to overcome the region'slonger-term obstacles to development. Family planning, education and health,resource conservation and agricultural research are vital in this respect. Insome cases, however, services have declined, canceling out progress made inearlier years. And governments still have much to do to improve theallocation of resources--by giving a greater role to prices, markets and theprivate sector, by increasing the supply of domestic savings, and by runningpublic enterpríses more efficiently.
Resource scarcity
Declining importa and investment threaten to undermine atructuraladjustment in low-income Africa.
Adjustment with growth requíres extra resources, but the recent trendin resource flows has been just the opposite. The investment rate in low-íncome Africa has been falling sínce 1980 and ¡a now the lowest amongdeveloping regíons. It is not sufficíent to maintain and rehabilitateexisting productive capacity, nor to provide for new capacity. This declinein investment mirrors declines in Afríca's supply of both domestic and foreign.savings; the shortfall in foreign savings in turn reflecta a worsening debtcrisis and a diminishing flow of commercial capítal. A dozen countries nowface acute debt difficulties, with little prospect of improvement.,
Africa needs more imports, not just of investment goods, but also ofessential consumer goods and raw materials. Importa per capita have beendeclíníng since 1970s and the rate of decline has accelerated in the 1980s.In spite of hígher coffee prices and lower oil prices, the outlook for theterms of trade is poor. Without new aid and debt relie4, imports per capitawill contínue to fall for the rest of this decade and beyond.
Measuring the resource gap
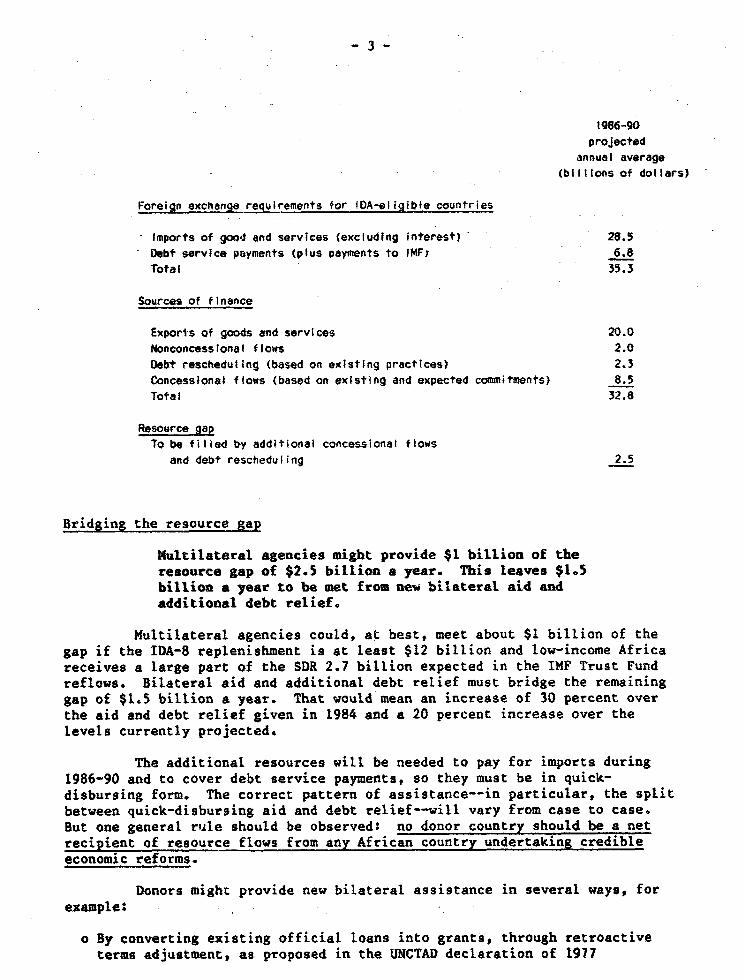
To continue its progreso toward economic adjustment, lov-income Africa vill need at least $11 billion a year inconcessional flows during 1986-90. Alloving for known andexpected aid comhnitents, a gap of $2.5 billion remains.
In calculating external resource requirements, the objective is tohalt the trend of decline in per capíta consumption by 1990 and achieve somegrowth thereafter. This minimum objective would require a GDP growth rate ofat least 3-4 percent a year by 1990. Qn the basis of the Bank's countryexperience, it is unlikely that such growth rates can be achieved, unless thedecline in import capacity is reversed. At a mninimum, imports per capitashould return to theír level of 1980-82. This implies imports of $28.5billion a year in current prices during 1986-90. Provision must also be madefor debt-service payments that are projected to rise to an average of $6.8billion a year over the períod. Altogether, then, the region needs $35.3billion a year for the next five years.
The possible sources of that finance are as foLlows. Exports mightprovíde at best $20 bíllíon a year--and this assumes that governments continueto adopt export-oriented policíes. New bank borrowing on commercial termsmight provide $1 billion a year; in view of the region's poor debt-servícingcapacity, it would be imprudent to seek more. In aLl, another $1 billion ayear ín nonconcessional finance might come from the IMF, froma direct privateforeign investment, and ín short-term capital flows. Debt. reschedulings,under existing procedures, should provide around $2.3 bíllion a year. Knownand expected aid commítments imply concessional flows of $8.5 biíLion a year--an increase of about 25 percent from tte level of 1980-82. Altogether, theregion might tap $32.8 bíLlion, leaving a resource gap of $2.5 billion a year.
-3-
1986-90
projected
annual average
(bilitons of dollars)
Forcign exchange requirements for IDA-eligible countries
Imports of go"d end services (excluding Interest> 28.5
Debt service payments (plus payments to IMF) 6.8
Total 35.
Sources of f¡nance
Exports of goods and services 20.0
Nonconcessional flows 2.0
Debt rescheduling (based on existing practices) 2.3
Concesslonal flows (based an existing and expected commitments> 8.5
Total 32.8
Resource gapTo be fWiled by additional concessional flows
and debt rescheduling 2.5
Bridgíng the resource gap
Multilateral agencies might provide $1 bíllion of the
resource gap of $2.5 billion a year. This leaves $1.5
bhllion a year to be met from new bilateral aid and
additional debt relief.
Multilateral agencies could, at best, meet about $1 billion of the
gap íf the IDA-8 replenishment is st least $12 billíon and low-income Africa
receives a large part of the SDR 2.7 billion expected in the IMF Trust Fund
reflows. Bilateral aid and additional debt relief must bridge the remaining
gap of $1.5 billion a year. That vould mean an increase of 30 percent over
the aid and debt relíef given in 1984 and a 20 percent increase over the
levels currently projected.
The additional resources will be needed to pay for importe during
1986-90 and to cover debt service payments, so they must be in quick-
disbursing form. The correct pattern of assistance--in particular, the split
between quick-disbursing aid and debt relief--will vary from case to case.
But one general rule should be observed: no donor country should be a net
recipient of resource flows fros any African country undertaking credible
economic reforma.
Donors might provide new bilateral assistance in several ways, for
example:
o By converting exísting official loans into grants, through retroactive
termsa adjustment, as proposed in the UNCTAD declaration of 1977
-4-
O By enabling their export credit agencies to refinance debt servicepayments on more concessional termo
o By widening the circLe of creditors that participates in debt rescheduling
o By increasing their ai* 5udgets, and especially by increasing quick-disbursing funde avíilLole in support of atructural adjustment.
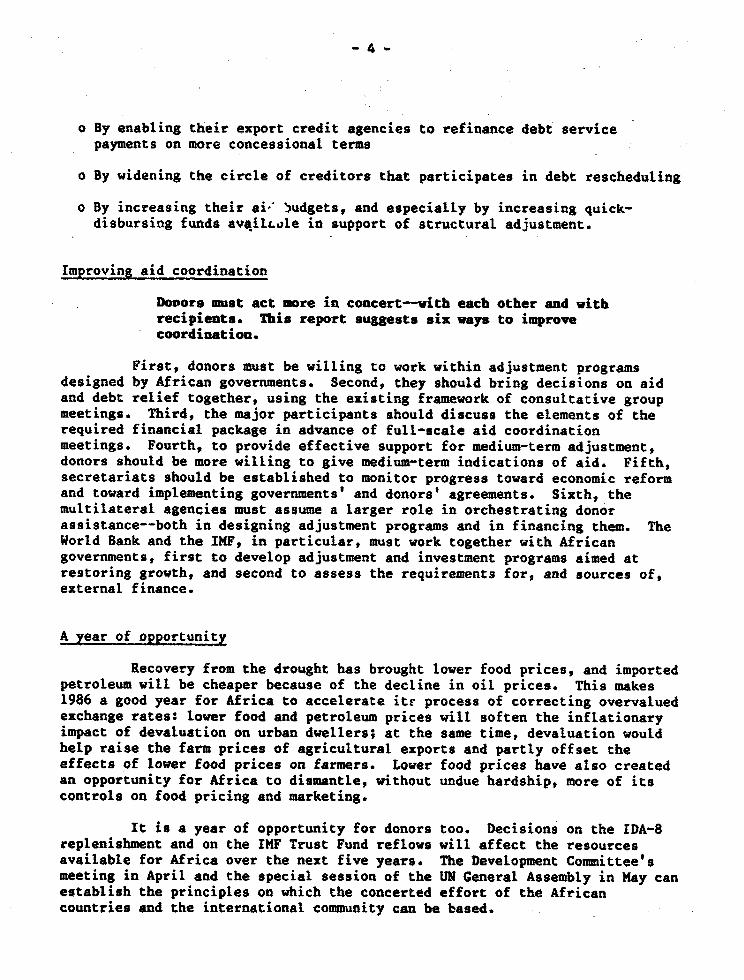
Improving aid coordination
Dovora must act more in concert-vith each other and vithrecipiente. This report suggests cix vaya to improvecoordinastioQ.
First, donora must be willing to work within adjustment programadesigned by African governments. Second, they should bring decisions on aidand debt relief together, using the existing framework of consultative groupmeetings. Third, the major participants should discuss the elements of therequired financial package in advance of full-scale aid coordinatíonmeetings. Fourth, to provide effective support for medium-term adjustment,donors should be more willing to give medium-term indications of aid. Fifth,secretariats should be established to monitor progress toward economic reformand toward implementing governments' and donors' agreements. Sixth, themultilateral agencies must assume a larger role in orchestrating donorassistance--both in designing adjustment programs and in financing them. TheWorld Bank and the IMF, in particular, must work together with Africangovernments, first to develop adjustment and investment programe aimed atrestoring growth, and second to assess the requirements for, and sources of,external finance.
A year of opportunity
Recovery from the drought has brought lower food prices, and importedpetroleum will be cheaper because of the decline in oil prices. This makes1986 a good year for Africa to accelerate ite procese of correcting overvaluedexchange rateg: lower food and petroleum prices will soften the inflationaryimpact of devaluation on urban dwelLers; at the same time, devaluation wouldhelp raise the farm prices of agricultural exporta and partly offset theeffects of lower food prices on farmere. Lover food prices have alzo createdan opportunity for Africa to dismantle, without undue hardship, more of itacontrole on food pricing and marketing.
It ¡J a year of opportunity for donors too. Decisions on the IDA-8replenishment and on the IMF Trust Fund reflows will affect the resourcesavailable for Africa over the next five years. The Development Comnittee'smeeting in April and the epecial session of the UN General Assembly in May canestablish the principles on which the concerted effort of the Africancountries and the international community can be based.
1. Introduction
The famine of 1983-84 ín sub-Saharan Africa ¡i videly recognized 8sbeing part of a longer-term production crisis. The World Bank's previousreport on the region argued that this deeper problem has ite roots in high andaccelerating pqpulation growth and in low and declining efficiency in the useof resources. _ The report predieted that, without additional donor support,inadequate resources vould soon become another major constraint, and Africa'sdecline would continue.
This year has brought some velcome signs of relief. Most of Africahas had good rainfall. An increasing number of countries are starting torecognize the policy mistakes of the p8st and are taking steps to correctthem.- Por low-income Africa, termo of trade have improved because of highercoffee prices and lower oil prices.
However, the long-term tren¿ of decline persists. As yet, too fewcountríes are embarking upon the atructural adjustment process; those thathave begun atill have far to go. Only a handful of countries are seriouslytrying to control extremely high rates of population growth. The availabilityof resources in Africa ¡a shrinking, and without additional donor support,will continue to do so.
The challenge for Africa and the donor countries ¡i to reverse thelong-term trend of decline. Adjustment with growth must become a realistictheme for the lov-income countries of the region--as for the high-debt middle-income developing countries. Over the next five years, this calls both fornational programa of policy reform and for substantially higher donorasmistance: each will fail without the other. To achieve adjustment withgrowth during this period, decisions must be made in 1986 on the level snd theform of assistance that the developnment community will provide. The focus ofthis report is on the needs of low-income African countries eligible to borrowfrom IDA, '2ut many of íts conclusions hold for the other sub-Saharan countriesas vell. -
The end of the drought
Sub-Saharan Africa ¡i emerging from one of the worst famines inrecent history. The drought that began in southern Africa in 1983 went on toaffect more than twenty countries and 35 million people by 1985. Theínternational community responded on an unprecedented scale, vithcontributions of food, medicine, and other critical supplies. Relief workersfrom donor and recipient governments and from prívate agencies moved massive
1. Tovard Sustained Development in Sub-Sahsran Africa: A Joint Programof Actíon (Washington, D.C., 1984>.
2. Por a list of the IDA-eligible countríes, see the note on countrycoverage at the beginning of this report. In this report, the terms "IDA-eligible" and 'lov-income" countries are synonymous.
-6-
samounts of material under extremely difficult condítíons, helping to savethousands, if not millions, of líves. Yet the famiíne took its toll. Manyfarmers and nomads have joined the ranks of the urban poor. Families havebroken up, systems of community support have weakened, and the strain on over-stretched goverrment servi'es has increased still further. In these difficultcircumstances, people are sL.dggling, with remarkable spirit, to resume theirnormal lives.
Fortunately, most of Africa received good rainfall in 1985. In spiteof the famine's devastation, agriculture is recovering. According to the FAO,agricultural output in 1196 will equal or exceed pre-drought levels in mostIDA-eligible countries. - The main exceptiona are Ethiopia, vhere faminepersists in some areas, and Mozambique; both will need special assístance thisyear, according to the UN Office for Emergency Operations in Africa. Most ofthe region, however, shares in a sense of relíef.
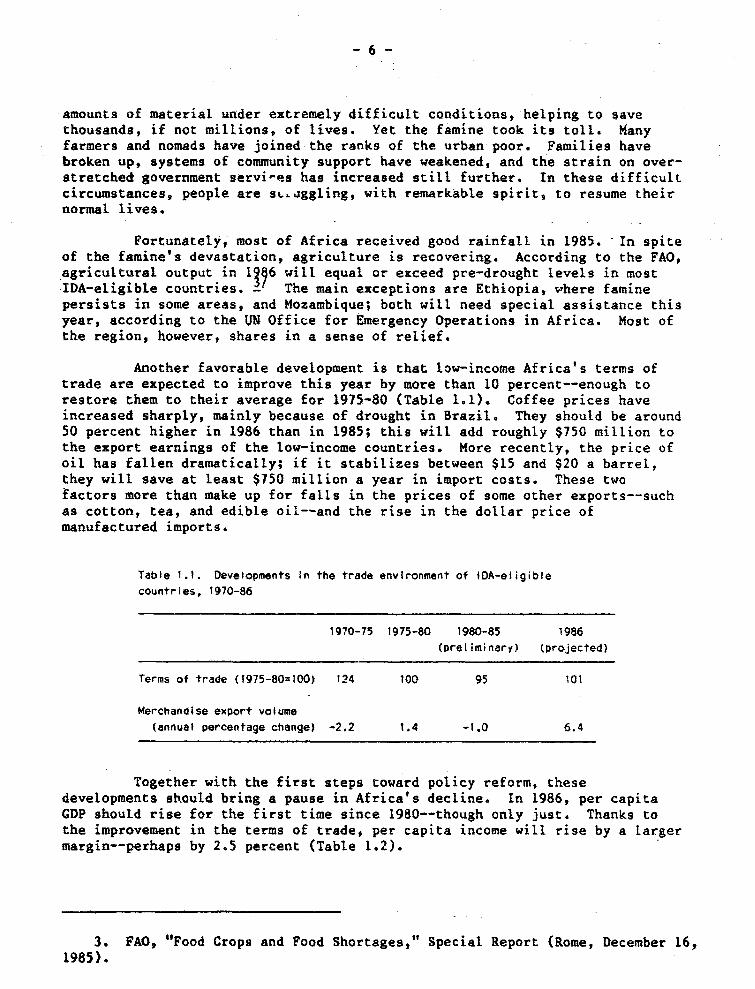
Another favorable development is that low-income Africa' s terms of
trade are expected to improve this year by more than 10 percent--enough torestore them to their average for 1975-80 (Table 1.1). Coffee prices haveíncreased sharply, mainly because of drought in Brazil. They should be around50 percent higher in 1986 than in 1985; this vill add roughly $750 million tothe export earnings of the low-income countries. More recently, the price ofoil has fallen dramatically; if it stabilizes between $15 and $20 a barrel,they will save at least $750 million a year in import costs. These twofactors more than make up for falls in the prices of some other exports--suchas cotton, tea, and edible oil--and the rise in the dollar price ofmanufactured imports.
Table 1.1. Developments in the trade environment of fDA-eligible
countries, 1970-86
1970-75 1975-80 1980-85 1986
(prel iminary) (projected)
Terms of trade (1975-80=100) 124 100 95 101
Merchandise export volume
(annual percentage changeJ -2.2 1.4 -1.0 6.4
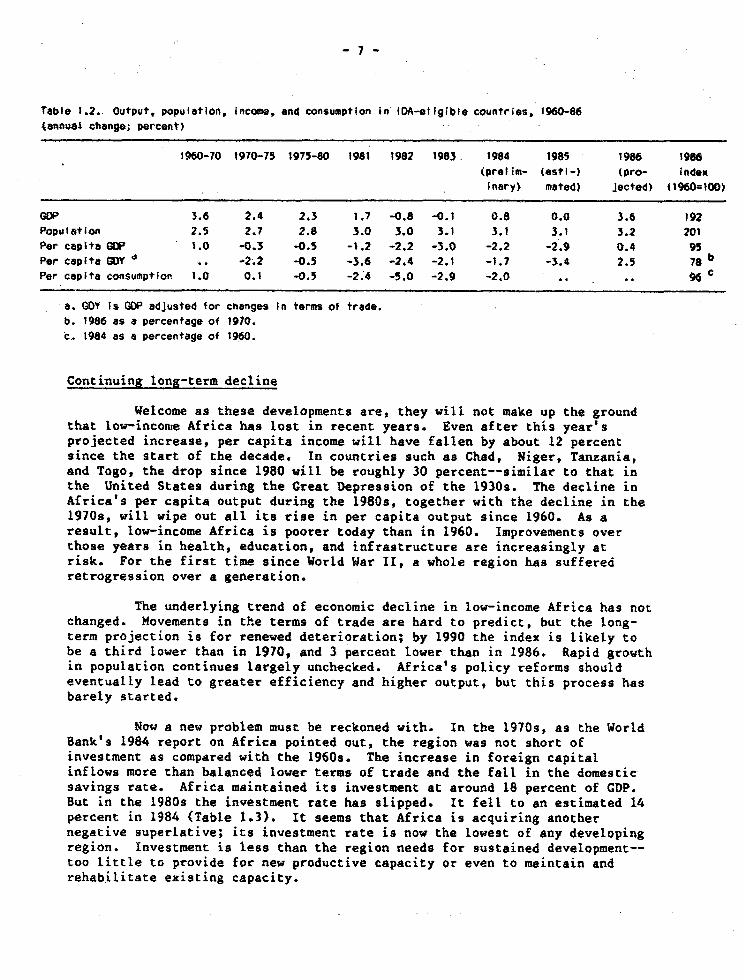
Together with the first steps toward policy reform, thesedevelopments should bring a pause in Africa's decline. In 1986, per capitaGDP should rise for the first time since 1980--though only just. Thanks tothe improvement in the terms of trade, per capita income will rise by a largermargin--perhaps by 2.5 percent (Table 1.2).
3. FAO, "Food Cropa and Food Shortages," Special Report (Rome, December 16,1985).
-7-
Table 1.2. Output, popufation, incomo, end consumption in IDA-etlgible countries" 1960-86
<ennuel chango; percent)-
1960-70 1970-75 1975-80 1981 1982 1983 1984 1985 1986 1986
(prelim- (esti-> (pro- Index
Inary> mnted) jecte4) 01960=100>
GDP 3.6 2.4 2.3 1.7 -0.8 -0.1 0.8 0.0 3.6 192PopuIation 2.5 2.7 2.8 3.0 3.0 3.1 3.1 3.1 3.2 201Por capita GDP 1.0 -0.3 -0.5 -1.2 -2.2 -3.0 -2.2 -2.9 0.4 95Por cepita GDY .. -2.2 -0.5 -3.6 -2.4 -2.1 -1.7 -3.4 2.5 78 bPer cepita consueption 1.0 0.1 -0.3 -2.4 -5.0 -2.9 -2.0 .. C
e. GDY Is GDP adjusted for changes i¡ teras of trade.
b. 1986 es a percentage of 1910.c. 1984 es a percentege of 1960.
Continuing long-term decline
Welcome as these developments are, they wíll not make up the groundthat low-inconie Africa has loSt in recent years. Even after thís year'sprojected increase, per capita income will have fallen by about 12 percentsince the atart of the decade. In countries such as Chad, Niger, Tanzania,and Togo, the drop since 1980 will be roughly 30 percent--similar to that inthe United States during the Creat Depression of the 1930s. The decline inAfrica's per capita output during the 1980s, together with the decline in the19709, will wipe out all ita rise in per capita output since 1960. As aresult, low-income Africa is poorer today than in 1960. Improvements overthose years ín health, education, and infrastructure are increasingly atrísk. For the first time since World War II, a whole region has sufferearetrogression over a generation.
The underlyíng trend of economic decline in low-income Africa has notchanged. Movementa in the terms of trade are hard to predict, but the long-term projection is for renewed deterioration; by 1990 the index is likely tobe a third lower than in 1970, and 3 percent lower than in 1986. Rapid growthin population continues largely unchecked. Afríca's policy reforms shouldeventually lead to greater efficiency and higher output, but this process hasbarely started.
Now a new problem must be reckoned with. In the 1970s, as the WorldBank's 1984 report on Africa poínted out, the region was not short ofinvestment as compared with the 1960s. The increase in foreign capitalinflows more than balanced lower terms of trade and the fall in the domesticsavings rate. Africa maintained its investment at around 18 percent of GDP.But in the 19809 the investment rate has slipped. It fell to an estimated 14percent in 1984 (Table 1.3). It seems that Africa is acquiring anothernegative superlative; its investment rate ja now the lowest of any developingregion. Investment ¡a leas than the region needa for sustained development--too little to provide for new productive capacity or even to maintain andrehabilitate existing capacity.
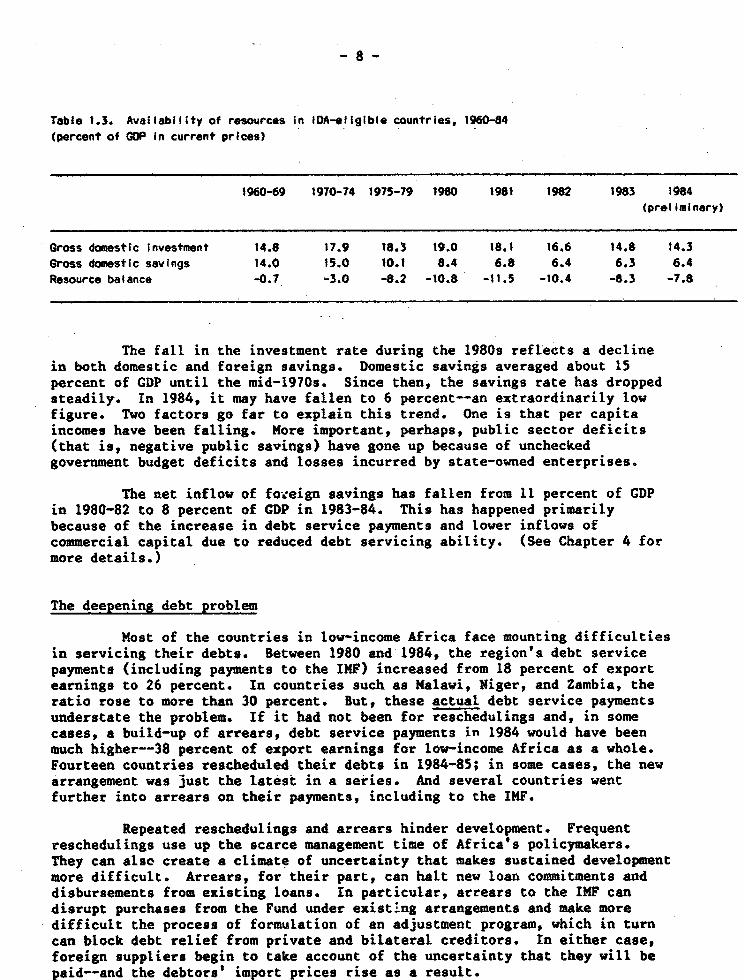
Table 1.3. Avallability of resaurces in ¡DA-elígible countries, 1960-84
(percent of GDP in current prices)
1960-69 1970-74 1975-79 1980 1981 1982 1983 1984
(preliminary)
Gross domesttc investment 14.8 17.9 18.3 19.0 18.1 16.6 14.8 14.3
Gross daomestic sevings 14.0 15.0 10.1 8.4 6.8 6.4 6.3 6.4
Resource balance -0.7 -3.0 -8.2 -10.8 -11.5 -10.4 -8.3 -7.8
The fall in the investment rate during the 1980s reflects a declinein both domestic and foreign savings. Domestic savings averaged about 15percent of GDP until the mid-1970s. Since then, the savings rate has droppedsteadily. In 1984, it may have fallen to 6 percent--an extraordinarily lowfigure. Two factors go far to explain this trend. One js that per capítaincomes have been falling. More important, perhaps, public sector def£cita(that is, negative public savings) have gone up because of uncheckedgovernment budget deficits and losses incurred by state-owned enterprises.
The net inflow of fo-.eign savings has fallen from 11 percent of GDPin 1980-82 to 8 percent of CDP in 1983-84. This has happened primarilybecause of the increase in debt service payments and lower inflows ofcoomnercial capital due to reduced debt servicing ability. (See Chapter 4 formore details.)
The deepening debt problem
Most of the countries in low-income Africa face mounting difficultiesin servicing theír debts. Between 1980 and 1984, the region's debt servicepayments (including payments to the INF) increased from 18 percent of exportearnings to 26 percent. In countries such as Malawi, Niger, and Zambia, theratio rose to more than 30 percent. But, these actual debt service paymentsunderstate the problem. If it had not been for reschedulings and, in somecases, a build-up of arrears, debt service payments in 1984 would have beenmuch higher--38 percent of export earnings for low-income Africa as a whole.Fourteen countries rescheduled their debts in 1984-85; in some cases, the newarrangement was just the latest in a series. And several countries wentfurther into arreara on their payments, including to the IMF.
Repeated reschedulings and arrears hinder development. Frequentreschedulinga use up the scarce management time of Africa's policymakers.They can also create a climate of uncertainty that makes sustained developmentmore difficult. Arreara, for their part, can halt new loan commitments anddisbursements from existing loans. In particular, arrears to the IMF candisrupt purchases from the Fund under existing arrangements and make moredifficult the process of formulation of an adjustment program, which in turncan block debt relíef from private and bilateral creditora. In either case,foreign suppliers begin to take account of the uncertainty that they will benaid--and the debtors' imDort Drices rise as a result.
-9-
Without action by the development community, these problems willmount during the next few years (see Chapter 4 and Appendix A). A dozen low-income countries face particularly severe debt problems and for them presentrescheduling arrangements will be inadequate. - Even with rescheduling onconventional termo during the next few years, their debt burden will still behigh at the end of the century.
A strategy of adjustment with growth
If Africa's decline ís to be reversed, action is needed on threefronts. First, the region needs more resources for investment--both foreignand domestic. Second, it must use new and existing resources moreefficiently. Third, it must curb its growth in population.
The basic objective of further adjustment is to stimulate growth.Thar requires more resources. Some of the additional resources can come fromhigher domestic savings. Prudent fiscal and monetary polícies are essentialfor that purpose. But domestic savings cannot carry the whole burden.
A consensus is emerging in the international community thatconcessional capital inflows to the low-income countries of Africa shouldrise, at least for the rest of this decade. To make medium-term programa ofadjustment with growth feasible, donors must give medium-term indications oftheir plans for aid and debt relief. Programs can then be designed on alonger-term basis to give adequate attention to the tasks of developing humanresources, conserving natural resources, and maintaining or extendinginfrastructure. A clearer picture of the resources to be available would alsopromote stability in trade and credit regimes. Domestic and foreign privatesectors would then feel more confident about the outlook for imports mdcredit and could play a more active role in stimulating growth.
In judging the prospecto for adjustment with growth ín low-incomeAfrica, it is important to realize that the region's performance has not beenuniformly poor. The region has its succesa storíes, some of which are betterthan average for the developir.g world. This is true both for sustaineddevelopment and for medium-term adjustment. At least seven countries in sub-Saharan Africa (Botswana, Cameroon, Ivory Coast, Kenya, Malawi, Nauritius, andRwanda) achieved significant growth ín per capita income over the last twenty-five years; four of them (Botswanas Cameroon, Ivory Coast, and Mauritius) havegraduated from low-income status. Some (Ivory Coast, Kenya, Malawi, andMauritius) launched unsustainable public expenditure programs during theperiod of commodity price boom in the mid-1970s, but then adopted atructuraladjustment programs in the early 1980s and by 1985 had made substantialprogress. For each area of policy Africa can report some success. Forexample, exchange rate policy in Malawi; food marketing in Cameroon; exportcrop pricíng in Kenya; export promotion in Mauritius; family planning inMauritius and Zimbabwe; and management of windfall income and technicalassistance in Botswana.
4. Benin, Gambia, Liberia, Madagascar, Mali, Mauritania, Miger, Somalia,Sudan. Tanzania. Toto. and Zambia.
- 10 -
A detailed strategy for 1986-90, which translates general aims intospecific programs, can be formulated only at a country level--but someelements that all such programs should include are discussed in the chaptersthat follow. Two sets of issues are important. The first, discussed inChapter 2, concerns the effíciency of reesorce use. It involves three mainareas of policy that were highlighted in earlier reports:
o Exchange rateso Urban-rural biaso - Public sector management.
The second set of issues, discussed in Chapter 3, covers longer-termconstraints on development; these were also identified in earlier reports:
o Population growtho Healtho Educationo Deforestationo Agricultural research.
Chapter 4 then goes on to assess the external capital and donorinstitutíonal reforms required to support these programs of adjustment withgrowth.
A crucIal objective of the proposed programs is to stimulate outputand exports by correcting discrímination agaínst the rural sector. This is tobe done through reduction ín price distortions and in urban bias in theallocation of government and aid expenditures. Most of the poor in low-incomeAfrica live in rural areas; so these improvements should promote equity asvell as growth. Rarely will the poor be the principal losers from suchprogramse
- 11 -
2. Adjustment programs
For some time Africa's own regional institutions have been leading achange in attítudes toward development policy. The most recent jointreport by the Ec omic Comnission for Africa and the African Development Bankas one example. - It argued that mistaken policies have depressedagricultural output and industrial productivity, promoted inefficiency instate-owned enterprises, and damaged incentives for the domestic privatesector. The Organisation of African Unity's summit meeting in July 1985echoed the theme by adopting "Africa's Priority Programme for EconomicRecovery, 1986-90." This too stressed the importance of agriculture, and theneed for new industrial policies that give the private sector a largereconomic role, and for more active population programs. This shift in Africanthinkiug toward a more pragmatic approach to development. is important andencouraging.
But new thinking is only a first step. Successful adjustment meansadopting new policies, not merely agreeing that they are desirable. How muchhas the region actually achieved? Thia is hard to answer precisely, becauseimprovemento consist of many different changes in many dífferent countries.Nonetheless, progress ¡a clearly under way.
Especially in the past two years, more countries have started toact, and the changes they are making go deeper than before. Several countriesillustrate the trend. Togo, Ghana, and Zaire have reinforced thecomprehensive economic and financial reforme which they introduced in 1983.In 1984-85, Senegal, Mauritania, Zambia, and Guinea adopted similar policies--aiming to improve broad macroeconomic performance, as well as to assistindividual economic sectors. Other countries, such as Niger, Mali andMadagascar, continue to adopt important policy reforms, though more slowly.The reform movement seems likely to endure, and perhaps to gather pace, asmore countríes see the resulta in those that have ted the way.
These reforma cover a wide range of measures aimed at giving príces,marketa, and the private sector a greater role in promoting development inAfrica. In particular, they reflect a desire to reduce administrativeintervention in setting prices; to end monopolies on trade and marketing; andto reduce the government's role in allocating credit and to increase the scopefor prívate sector activity. Changes are needed on a broad front, but thischapter focusea on three areas which were highlighted in the World Bank'sprevious Africa report: exchange rates, urban-rural bias, and public sectormanagement.
1. Economic Report on Africa, 1985.
-12-
Correcting overvalued exçhange rates
Correcting overvaluation of currencies helpa to reduce balance ofpayments deficita. Equally important, it also shifts the internal termsa oftrade in favor of those who produce for export (often mainly rural households)and away from those who consume imports (often predominantly urbanhouseholda). In the past two years, several countries have made progress inthis area. After more than a decade of creeping appreciation, the averagereal effective exchange rate for the IDA-eligible countríes in Africa began todepreciate ín 1984, and this trend seema to have continued into 1985. Agrowing number of governments have adopted more flexible exchange rateregimes, which rely on supply and demand in the foreign exchange market todetermine the exchange rate.
Following a huge devaluation, Zaire introduced a floating ratesystem in 1983, and by 1984 the exchange rate was freely determined ín aninterbank market. By the end of 1984, the real effective exchange rate hadfallen by three-quarters znd the premium on the parallel market was no morethan 10 percent, roughly in line with the cost of bank commissions. In late1985, Zambia introduced an auction system for most trade-related exchangetransactions. Although the government and selected public enterprisescontinue to receive an administrative allocation of foreign exchange, thevalue of foreign exchange is determined by the auction. After theintroduction of the new system, the nominal exchange rate fell by two-thirdsin three weeks.
Guinea and Gambia are establíshing similar systems intended to leadto a unified. market-determined exchange rate; as an interim measure inGuinea, the new rate has been devalued to less than 10 percent of the oldofficial rate. Madagascar took a step toward more flexible exchange rates inMarch 1984; it began to adjust the Malagasy franc every quarter in line withthe change ín the consumer price index during the previous quarter. Betweenthen and the third quarter of 1985, the real effective exchange ratedepreciated by about 15 percent and was brought in line wíth its 1978 level.Other countríes (Ghana and Mauritania) have made substantial devaluationswithin their existing exchange rate systems, by combining vigorous nominaldevaluations with effective measures to contain inflation.
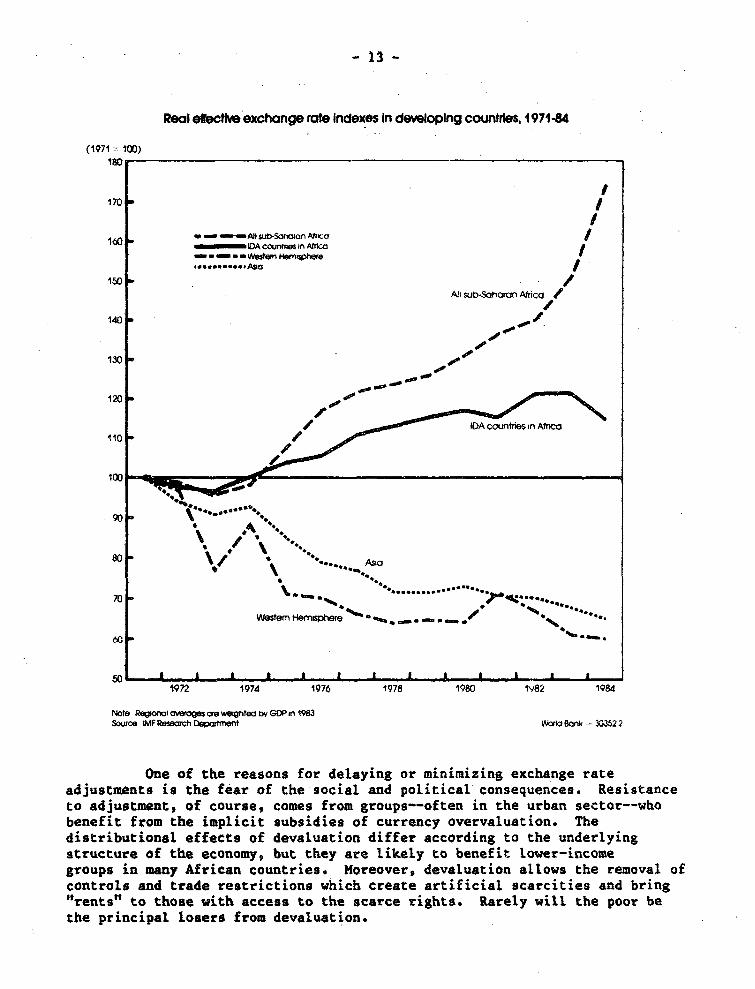
These are promising developments. However, for the low-íncomecountries as a group, the average real effective exchange tate appreciatedsignificantly in the 1970s and early 1980s--a marked contrast to theperformance of Asian and Latir American countries (see Figure 2.1>. As oflate 1985, in spite of the recent adjustments, the real effective exchangerate was about 15 percent above ita 1970-72 levels. Moreover, even the 1970-72 level ¡a too high for some countries, especially where terms of tradeshifts have been large and negative. Por example, in Zaire and Zambia,market-determined real effective exchange rates had fallen at the end of 1985by over 40 percent from their level in 1970-72. The progreso observed in1984-85 is important, but only part of a long proceso that still has far togo.
- 13 -
Real efecthe exchange rte Indoxes In devMeoping countrles, 1971-84
(1971 = 100)
170 u
160 - ~ -A1i su-tSafaan ~co atO - iD A cournes ín Af
_ * _ * _ I.Ist6Y emli1erre<,o --- ,ss..ee.e.ASI/
150 b...
Ait sub-Sahoran Africa /
140
130 --
120 -» --
- «/ IDA countriesb Afnca110
100
-
i ,
o~~ S
80 < s *'-",."..A5se
70 '
Western HeiBmsphee %. * _ '41 _ *o
1972 1974 1976 1978 1980 1V82 1984
Note Regional ove s ae weghted by GDP in 1983Sourca iMF Prch m WoW Bank - 3352 2
One of the reasons for delaying or minímizing exchange rate
adjustments is the fear of the social and political consequences. Resistance
to adjustment, of course, comes from groups--often in the urban sector--who
benefit from the implicit subsidies of currency overvaluation. The
dístributional effects of devaluation diffet aecording to the underlyingatructure of the economy, but they are likely to benefit lower-income
groups in many African countries. Moreover, devaluation allows the removal of
controls and trade restrictiona which create artificial scarcities and bring"rents" to those with acceso to the acarce rights. Rarely will the poor be
the principal losera from devaluation.
- 14 -
However, because of the impact on the urban population, it isimport-ant to time devaluations with care. The economic developuients of1985-86 make 1986 a good year to act decisively on exchange rate adjustment.Lower food prices, following recovery from the drought, together with lowerpetroleum import prices, can cushion the impa,t of devaluation on the towns;at the same time, devaluation would help raise the farm prices of agriculturalexports and partly offset the effects of lower food prices on farmers.
Correcting urban-rural bias
There is a growing consensus in Africa that policies whichdiscriminate against ag-riculture and favor the urban sector must be changed.There are at least three links between farming and development in low-incomeAfrica. First, the largest part of the population and the majority of thepoor depend on agriculture for a living. It will therefore be difficult toattack poverty on a broad front so long as the sector ¡a discriminatedagainat. Second, the region's output ís still heavily agricultural. Higheroutput will require incentives for improved productivity in farming. Third,exporta, too, will be mostly agricultural for the medium term. But they willbe slow to rise as long as governments channel the profits mostly to benefittheir urban populatíons.
Devaluation, as noted earlier, can be a powerful instrument toredress the urban-rural bias. It can simultaneously mean higher farm pricesfor agricultural exports and higher prices for the imported goods that areconsumed mostly in the towns. But correcting the urban bias requirescomplementary changes in domestic policy. These include hígher farm prices,lower agricultural taxation, more flexíble marketing arrangements, and wagerestraint in the urban sector, as well as more public expenditure in the ruralareas. Over the past two to three years, many governments in low-incomeAfrica have introduced reforms in these areas.
Many governments have improved agricultural incentives by increasingoffícial príces ín conjunction with a currency devaluation. Some have done itby deregulating markets, to give farmers access to higher prices on parallelmarkets. Others are introducing more flexible systems of offícial pricing asa step toward lifting controls on agricultural trade.
There ís a clear trend toward higher food-crop prices, In 1984,following substantíal devaluations, the government of Zambia raised theofficial producer price of maize by over 35 percent (a 12 percent increase inreal terms). In Tanzania, the government more than doubled the controlledproducer price of maize between 1983 and 1985 (a one-third increase in realterms). In 1985, Mauritanía set ration shop cereal prices in líne with theprice of imported grain. In Zaire following devaluation and deregulation offood marketing, producer prices are estimated to have doubled for maize andtripled for cassava between 1983 and 1984 (which amounted to at least adoubling of these prices in real terms since 1980). As part of a reformpackage including massive devaluation, in early 1986 Guinea decontrolledproducer prices for food crops and quadrupled the official wholesale price ofimported ríce.
*- 15 -
A number of countries are making similar efforts to improveincentives for export crops. Ghana, after large devaluationa in 1984-85,tripled the price of cocoa between 1983 and 1985 (a 50 percent íncrease inreal terms). Zambia raised the price of cotton, and Zaire raised the pricesof both coffee and cotton; in both countries, these price increases followedsubstantial currency devaluatíons.
Another clear illustration of this trend is that the countriesimplementing reforms duríng the 1980s have seen crop prices rise much fasterthan urban incomes. The disparity was sometimes dramatic--as in the case ofmaize in Zaire and rice in Madagascar. In most cases, farm prices foz exportcrops also improved relative to urban incomes, though less so than food-cropprices.
Examples of some dramatic shifts in urban-rural íncome ratíosinclude Tanzania during 1980-84, when real farm incomes are estimated to haverisen by 5 percent, while urban vage earners faced a decline of 50 percent.In Ghana, during the same petiod, farm incomes stagnated but urban incomesfell by 40 percent in real terms. Per capita incomes have fallen in low-income Africa during the 1980s, while real producer prices have risen or atleast remained constant ini most of the countries that have adopted reformprograma. This leaves little doubt that the reforming governments have helpedto raise the terma of trade between the countryside and the city.
In agriculture, it is hard to separate the effects of better weatherfrom the effects of better prices and better policy. But the response ofagriculture in the countries that have adopted improved incentives has beentoo dramatic to dismiss. In Ghana, cocoa output in 1985-86 is expected to be25 percent above the level of two years earlier--though it will still be lowerthan the pre-drought level of 1981-82. After a price increase of over 300percent in 1983, maize production tripled in 1984, rising above the pre-drought level by almost two-thirds. In Zambia, cotton and maize prodxctionrose by over 20 percent during 1983-85. The amount of maize marketed lsestimated to have risen by over 55 percent during 1984-85; it came close tomeeting Zambia's domestic consumption requirementa for the first time since1976. In Togo, cotton production is estimated to have doubled between 1984and 1985.
Incentives for farmers have improved, but there is room for furtherprogreso. The producer ahare of the international price of exports remainsrelatively love For coffee, cocoa, and cotton--low-income Africa's principalagricultural exports-farmers in the main exporting countries generallyreceived only about half of the export unit value in 1984. Coffee farmers inKenya were an important exception, usually receiving as much as 90 percent ofthe export price. By contrast, in Tanzania, the producer share for coffee was40-50 percent, and in Madagascar it was only about 20 percent in 1984-85.During these years, for cocoa, the share ín Togo was about 40 percent, and forcotton, the share in Mali and Togo was as low as 30 percent.
Two recent reforma in this area may be a guide for othercountries. in 1984-85, Cameroon's national marketing board atartedímplementing a system of rebates to coffee and cocoa farmers; it is estimated
- 16 -
that ít will increase theír share of the export price by 7-8 perce.nt. In late1985, Guinea said the state marketing agency would pay coffee and palmproducera 80 percent of export prices, and raised official buying pricessubstantially.
Conditions in 1986 seem right not just for initiatives on exchangerate policy, but also for other policies to correct the urban-rural bias.Higt food output has helped ease consumer prices in many countries. Thiscreites an opportunity for governments to dismantle price and marketingcontrols an¿ to eliminate food marketing subsidies with fewer fears of theeffects on inflation. Lower prices for food and petroleum should also dampeninflation. Hence, 1986 will be a good year to try to restrain urban andpublic sector wage increases. Furthermore, in those areas where excessproduction threatens to depress the market, deregulation, incl.uding freerintr¿regional trade, could help to maintain producer pricés and at the sametime help consurmera in areas with shortages.
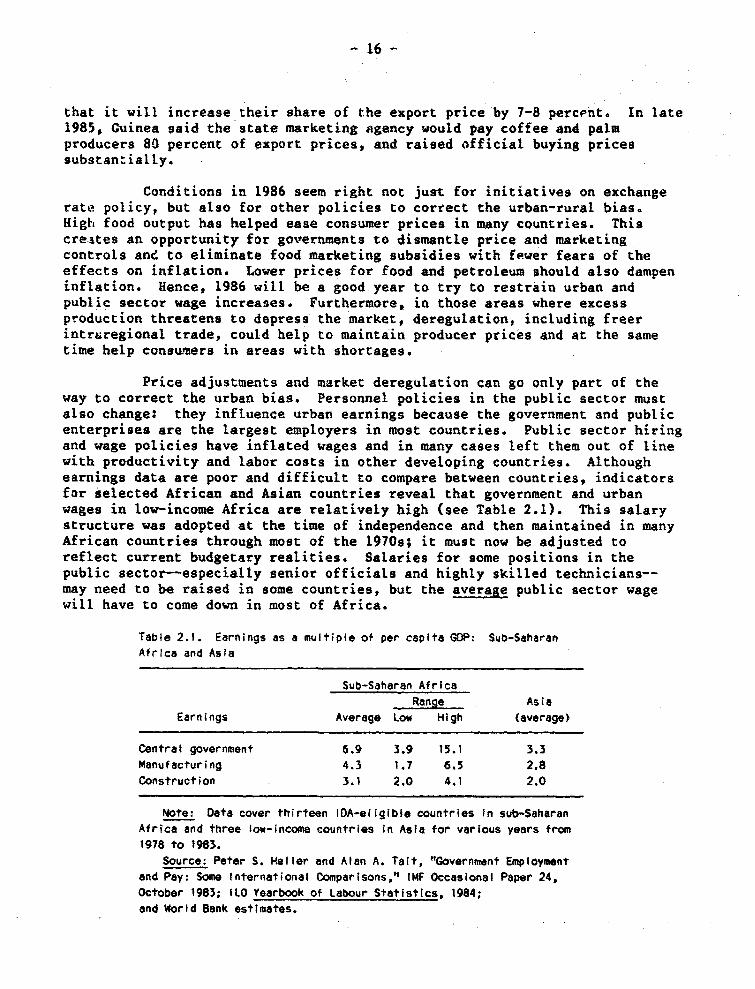
Price adjustments and market deregulation can go only part of theway to correct the urban bias. Personnel policies in the public sector mustalso change: they influence urban earnings because the government and publicenterprises are the largest employers in most countries. Public sector hiringend wage policies have ínflated wages and in many cases left them out of línewith productivity and labor costa in other developing countries. Althoughearnings data are poor and difficult to compare between countries, indicatorsfor selected African and Asian countries reveal that government and urbanwages in low-income Africa are relatively high (see Table 2.1). This salarystructure was adopted at the time of independence and then maintained in manyAfrican countries through most of the 1970s; it must now be adjusted toreflect current budgetary realities. Salaries for some positions in thepublic sector--especially senior offícials and highly skilled technicians--may need to be raised in some countries, but the average public sector wagewill have to come down in most of Africa.
Table 2.1. Earnings as a multipie of per capita GDP: Sub-SaharanAfrica and Asia
Sub-Saharan AfricaRange Asia
Earnings Average Low High (average>
Central government 6.9 3.9 15.1 3.3Manufacturing 4.3 1.7 6.5 2.8Construction 3.1 2.0 4.1 2.0
Note: Data cover thirteen IDA-eligible countries in sub-SaharanAfrica and three low-income countries in Asia for various years from1978 to 1983.
Source: Petar S. Heller end Alan A. Tait, "Government Employmentand Pay: Some International Comparisons," IMF Occasional Papar 24,October 1983; 110 Yearbook of Labour Statistlcs, 1984;and World Bank estimates.
- 17
Rationalízing the public sector
The role of the atate in the economies of sub-Saharan Africa islarger than in other regions. Public sector employment is half of all modernsector employment, compared with only one-third in Asia. Allowing for countrysize, public enterprises are more numerous than in most other developingcountries, and they engage in a wider array of activities. Public investmentaccounts for the bulk of investment in the formal sector.
As the Bank's previous reports on Africa have argued, the rapidgrowth of the pubLic sector, along with its inefficient management andoverambitious public investment programs, are ímportant reasons for theeconomic difficulties facing sub-Saharan Africa today. In addition, the scopeof public sector activities and the operating subsidies to which publicenterprises had access atifled private entrepreneurial activity inagriculture, industry and commerce. Many governments in sub-Saharan Africanow face financial dífficulties and are therefore trying to reduce the size ofthe public sector and to improve its management. However, these reforms arestill at an early stage.
Financial stabilization programa are begínning to reduce governmentexpenditures. Public consumption as a percentage of GDP in low-income Africadeclined from 17.1 percent in 1980-81 to 16.2 percent in 1983-84. Thisdecline happened alongside the fall in GDP. As a result, public consumptiondeclined by 1.5 percent a year in real terms during 1980-84, compared with anincrease of almost 5 percent a year in 1975-80. These cuts have beenachieved, in part, by restraints on public employment. In the past few years,Rwanda, Mali, Somalia, and Togo have abandoned their policy of automaticemployment of secondary school and university graduates. In 1984, the shareof personnel ín total central government expenditures declined for the firsttime in several years in Mali because of slower growth in governmentemployment as a result of the introduction of competitive examinations forentry to the civil service. The SomaLi government froze government empLoymentin 1985. Togo reduced total government employment by 1.6 percent in 1984.
Budget restraint, reflected in lower public employment, is desirablein much of Africa, but ín some cases it has led to excessive cuts in financingfor equipment, maintenance, operating costs, and materials. The result hasbeen a steady deterioration in the quaLity of public services and furtherdeclines in the productiíity of public employees. The impact is plain whenroad maintenance crews lack fuel and bitumen to accomplish their work, whenteachers lack books, chalk, and even classrooms for their students, and whenhealth workers have no medicines to distribute. This deterioration in publicservices is especially disruptive for programs designed to deal with the basicconstrainta on development. Unless a better balance is established betweenpersonnel and other expenditures, these programs are in jeopardy. To maintainnonwage expenditures, most countries must reduce government employment and, insome instances, civil service wages.
Efforts to rationalize the public enterprise sector have focused onimproving management as well as reducing it9 size. Studies and audits aregenerally followed by closure of nonviable enterprises, by divestiture of
- 18 -
nonstrategic enterprises, or by carefully taílored rehabilitation ofenterprises (such as utility companies) -selected to remain ín the publicsector. Most of these efforts involve institutional reforms to strengthengovernment supervision.
Low-income Africa's governments have closed down or divested about 5percent of their public enterprises during the 19809. For many of those thatremain, better management has cut operating losses--through hígher prices,better cost accounting, and (usually) reduced employment. In Ghana, theaggregate net loases (before taxes) of approximately a hundred publicenterprises felL in 1983 to 20 percent of their 1982 level. In the Gambia,net losses after taxes of seventeen public enterprises fell in 1984 to about30 percent of the 1982-83 level. Be en 1981 and 1984, the operatingdeficita of thirteen key public ente.prises in Mali fell by over 50 percent.In 1985, Ghana's Cocoa Marketing Board--the country's largest public sectoremployer--dísmiased 19,000 employees, a third of its payroll. In Mali, about10 percent of public enterprise employees were fired in early 1984. However,reductions made in one area can sometimes be offset by increased employmentelsewhere. In Benin, for example, the central government rehired many of theworkers who lost their jobs when some provincial public enterprises closeddown.
Of the countríes that are trying to reform their public enterprises,Senegal and Zaire are especially interesting. In Senegal, the government andaix public enterprises have signed formal agreemento (contract programs) whichestablish objectives and performance indicators and set out the reciprocalobligations of the government and the enterprises. Compared with other publicenterprises, these firma have had higher sales growth and lower personnelcosta.
In 1984, Zaire introduced a series of reforms, and for some largepublic enterprises, these measures have started to bear fruit. Substantialrestructuring of the mining sector, together with devaluation and tax reforms,have vastly improved the financial situation of CECAMINES. After two years ofsubstantial losses, and despite the continuing loa price of copper, profitsafter taxes amounted to $45 million in 1984 and are expected to have been muchhigher in 1985. In Zairels transport sector, ONATRA--the company responsiblefor river and rail transport between Kinshasa and the port of Matadi--tooksteps to reduce wage costs and raise tariffs. Nov it ía paying divídends tothe treasury for the fírst time in several years. And Zaire's nationalraílway company reduced its losses by over two-thirds since 1983.
The region s governmento have made efforta to reduce the size oftheir public investment programa and to improve the allocation of public fundsto sound, high-priority projectc. Some of the discipline results fromunavoidable financíal austerity. Much of it, though, reflects a greaterappreciation of the importance of including rehabilitation in publicinvestment programa, of keeping investments in line wíth the capacity tofinance recurrent costa, and of using existing productive capacity beforebuilding more. There ja also a growing awareness that amall-scaleinvestments, especially in agriculturea may be more productive than large-acale investments and that large projects of great political appeal butdoubtful economic viability are best postponed or dropped altogether.
-19 -
However, doubtful projects continue to be financed--ostentatiousuniversítiest overdesigned highways, luxury sports stadiums, and uncompetitiveagroindustrial ventures. Often these are financed by donors responding topolitical requests. Sometimes donors fail to appreciate the scarcity ofinvestable funds and the need to devote aid resources to projects that areeconomically sound. And it is odd that finance ¡a sometimes easier to findfor a politically sttractive project of doubtful viability than for support ofexchange and trade adjustment programs or for maintenance and rehabilitationprojects. Most African countries atilL need to strengthen the authority ofthe government agencies that are in charge of planning and project evaluation.
This year, strengthening the planning process is all the moreurgent. The coffee price boom will augment resources availahle to manyAfrican governments. It ís essential that mistakes of the miu-1970s followingcommodity price booms are not repeated, and that extra resources be used tostimulate growth in the near term and to attack the basic constraints todevelopment in the long term. In most of low-income Africa in 1986-90,rehabilitation and maintenance should remain the focus for expenditures oninfrastructure, agriculture, and industry--together with some carefully chosennew investments to remove bottlenecks. However, as the next chapter explaina,in areas concerned with overcoming long-term constraints on growth, it isnecessary to go beyond rehabilitation and maintenance and finance new projectscovering both capital and recurrent expenditure. Projects of doubtfulviability--"white elephants," as the 1984 report called them--must not beallowed to reappear.
- 20 -
3. Long-term constraints on growth
The thrust of structural adjustment in Africa has been toward agreater role for prices, markets, and the private sector in promotingdevelopment. This emphasis needs to continue. However, in areas such asfamíly planning, human resource development, natural resource conservation,and agricultural research, governments must play a larger and more effectiverole. Sub-Saharan Africa has made little progresa in these areas in recentyears. In some cases, services have declined, undoing earlier progresa.
On issues such as family planning, resource conservation, andagricultural research, governments must commit themselves to change andpromote a social consensus in its favor. Consensus must spring from a clearerunderstanding of the link between these long-term factors and prospects for abetter quality of life.
Policy can then build on this by giving programs in these areasgreater priority in the allocation of scarce budgetary and human resources, bystrengthening public institutions where necessary, and by giving privateagencies (including nongovernmental organizations) a much larger role.Increased health and education coverage for a growing population requires,when resources are short, restructured programs which emphasize low-costpreventive health care, primary education, and greater efficiency. Withoutnew policies, the quality and relevance of these services will decline, andthe objectives of universal literacy and greater technical and managerialíndependence will be out of reach.
Population
Lower rates of population growth may well be one of the mostimportant requirements for sustained development in Africa. A recent paperfrom the Worldwatch Institute stated the problem graphically:
If African governments take a serious look at futurepopulation/resource balances...they may discover thatthey are forced to choose between a sharp reduction inbirth rates or falling living standards and, in somecases, rísing death rates. If [they] choose to donothing, the "demographic transition" that has marked theadvance of all developed countries may be reversed forthe first time in modern history. -
1. L. R. Brown and E. C. Wolf, Reversing Africa's Decline (Washington,D.C.: Worldwatch Institute, June 1985), pp. 31-32.
-- 21 -
Until recently, very few African governments recognized theimportance of family planning. Africa's vast empty spaces suggest that manymore people can be accommodated. The problem,-however, ja not that Africalacks the land to support a larger population, but that substantial investmentand other inputs will be needed to make that land sufficiently productive. Ittakes time to mobilize these resources and use them effectívely. The existingrate of population growth is higher than the rate at which the supply ofnutrition, water, health, and education can be increased.
In 1984, at both the Second African Population Conference in Tanzaniaand at the UN International Population Conference in Mexico, Africangovernments appeared ready to adopt a new approach to their policy onpopulation. A recent World Bank study found that about three-quarters ofAfrican countries now endorse family planning, at least fo health reasona,and some have set explicit targets for population growth. _ Increasingly,national leaders are ready to discuss the population problem and the need foraction to deal with it--as, for example, the presidents of Nigeria and Kenyahave done in recent apeeches.
In some cases, such as Malawi, the turnaround in official attitudeshas happened remarkably quickly. In Zimbabwe, provision of contraceptiveservices has expanded rapidly in the past five years, and contraceptive usehas more than doubled. Kenya and Botswana have programs well under way, andseveral other countries--for example, Tanzania, Liberia, Nigeria, Rwanda,Burundi and Malawi--have recently started programs too. As a result, fertilityseens to be falling in some countries. Birth rate- are starting to drop inZimbabwe, which provides good access to family planning services in ruralareas. Kenya, one of the first countries with a major population program,received considerable aid for family planning in the 1970s; ita most recentpopulation surveys show that fertility rates have declined, though onlymarginally, from 8.0 in 1977 to 7.7 ín 1984.
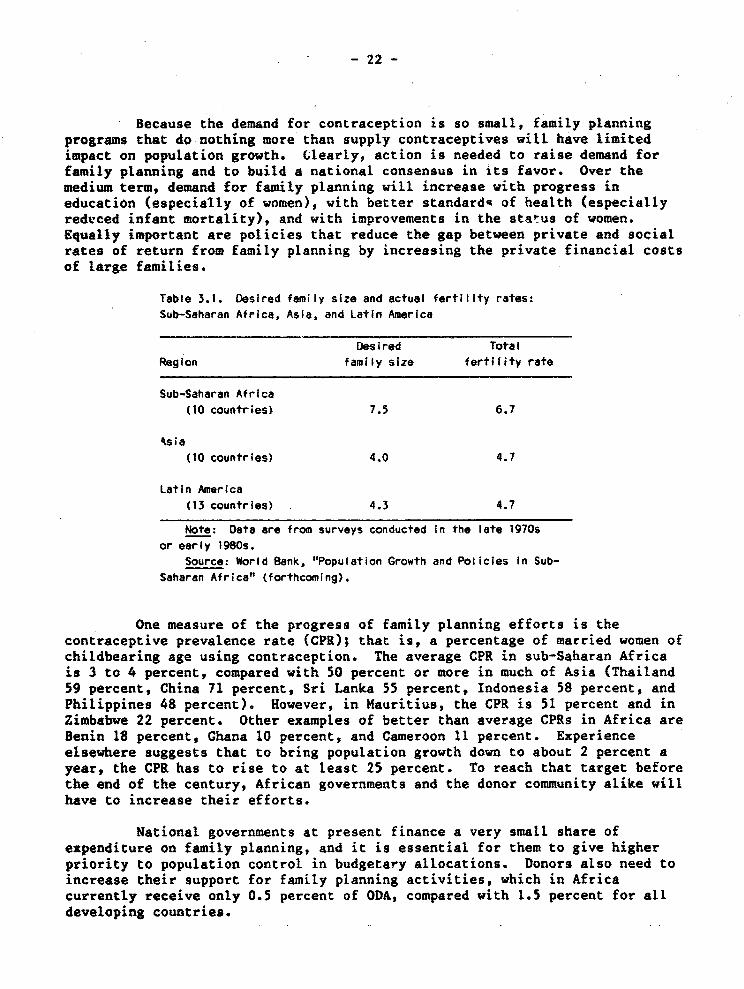
However, the progress achieved so far in sub-Saharan Africa as awhole is small in relation to the task of achieving viable populationgrowth. First, several African countries still take a pronatalist position orshow virtually no support for population control. Second, experience aroundthe world shows that in the difficult area of family planning, governmentsupport is only a begínning. It is not encugh to widen contraceptive choiceand expand channels of access to family planning assistance, however importantthat may be. Poor people in Africa, as elsewhere, find it in their interestto have large families. Desired family size in Africa is the highest in theworld (Table 3.1); in contrast wíth Asia and Latin America, it is higher thanthe fertility rate.
2. World Bank, "Population Growth and Policies in Sub-Saharan Africa"(forthcoming).
-22-
Because the demand for contraceptíon is so small, family planningprogramo that do nothing more than supply contraceptives will have limitedímpact on population growth. Clearly, action is needed to raise demand forfamily planning and to build a national consensus in itS favor. Over themedium term, demand for family planning will increase with progress ineducation (especially of women), with better standardq of health (especiallyredvced infant mortality), and with improvements in the status of women.Equally important are policies that reduce the gap between private and socialrates of return from family planning by increasing the private financial costsof large families.
Table 3.1. Desired fam¡iy slze and actual fert¡llty rates:Sub-Saharan Africa, Asia, and Latin America
Des Ired TotalRegion fam;ly size fertility rate
Sub-Saharan Africa(10 countries> 7.5 6.7
s¡a(10 countries> 4.0 4.7
Latin America(13 countries . 4.3 4.7
Note: Data are from surveys conducted in the late 1970sor early 1980s.
Source: Worid Bank, "Population Growth and Policies in Sub-Saharan Africa" (forthcomíng).
One measure of the progress of family planning efforts is thecontraceptive prevalence rate (CPR); that ¡s, a percentage of married women ofchíldbearing age using contraception. The average CPR in sub-Saharan Africai9 3 to 4 percent, compared with 50 percent or more ín much of Asia (Thailand59 percent, China 71 percent, Sri Lanka 55 percent, Indonesia 58 percent, andPhilippines 48 percent). However, in Mauritius, the CPR is 51 percent and inZimbabwe 22 percent. Other examples of better than average CPRs in Africa areBenin 18 percent, Ghana 10 percent, and Cameroon 11 percent. Experienceelsewhere suggests that to bring population growth down to about 2 percent ayear, the CPR has to ríse to at teast 25 percent. To reach that target beforethe end of the century, African governments and the donor community alike willhave to increase their efforts.
National governments at present finance a very small share ofexpenditure on family planning, and it is essential for them to give higherpriority to population control in budgetary allocations. Donors also need toincrease their support for famíly planning activities, which in Africacurrently receive only 0.5 percent of ODA, compared with 1.5 percent for alldeveloping countries.
- 23 -
Human resources
Pespite the recognized need to develop human resources in Afríca,there have recently been signs of shrínking access to, and a deterioration inthe quality of, services for health and education--especially in ruralareas. Basic policy reforms, as well as additional resources, will be neededto reverse this trend.
Health
Health conditions in sub-Saharan Africa have improved over the pastfew decades, but they remain among the worst in the world. In most Africancountries, acceas to health care is extremely limited. According to 1985estimates by U14ICEF and WHO, childhood imzunization levels, for example, arethe lowest in tLe world: polio 32 percent, measles 35 percent, tuberculosis41 percent, and diphtheria, pertussis, and tetanus 33 percent. An immuni-zation level of about 80 percent is generally considered necessary to controlthe transmissíon of these diseases, so there is still a long way to go.
The 1980s have seen decline, not improvement, in health services.Despite the lack of reliable and timely statístics, most observers report thatpublic health delivery systems have deteriorated in the past few years,particularly in rural areas. In many countries, thís has meant a loweroverall standard of health. Immunization levels have actually dropped inrecent years in countries such as Zambia, Tanzania, and Ghana. One reason forthis dismal picture is a worseníng shortage of financíal resources. Healthexpenditures are often vulnerable to cuts during períods of fiscal austerity;in some West African countries the share of public health in the nationalbudget fell in the early 1980s.
Inefficient use of the resources that are available has aggravatedthe problem. Government policy has contributed to this in three ways. First,at times of budget austerity, growth of employment in the health sector hasbeen maintained, so a rising salary bill has crowded out funding for essentialsupplies, transport, and maintenance of facilities. Second, most governmentscontinue the practice of concentrating health care facilities in urban areas(and especially in high-cost hospitals), neglecting peripheral facilities thatare much more cost-effective for treating the vast mejority of diseases.This, together with the policy of providing such facilities free or at anominal charge, puto pressure on high-cost urban facilities and leavessecondary facilities underused. Third, some governments have reduced thesupply of private health services by making medical facilities a publicmonopoly.
Raising the standard of health in Africa wíll require several policyreforms to increase the efficiency of resource use. The first step is to aimto deliver a minimum package of health care--especially immunization againstmajor communicable diseases, oral rehydration therapy, early diagnosis and
- 24 -
treatment of acute respiratory infections and malaria in chíldren under five,and other elemento of mother and child health cave. To do this, governmentsneed to reorient their public health systems by expanding access to community-based, primary health care, particularly in rural areas. These communityprogramo must then be backed up by institutions to monitor public health.
Covernments nust also change their hiring and cost recovery policiesto ensure that they have adequate funding to cover their nonlabor costa.Several governments are already emphasizing primary health care programs thatwill help to correct the urban bias of past policies. Many have introducedco0t recovery measures. Senegal, for instance, has a program in which userfees are collected and managed by community heaith committees. Othercountries--Ghana, Malawi, and Zambia, for example--are seriously consideringvarious schemes for user charges and community financing. Some have takensteps to reduce unit costs--for example, Mali now imports generic drugs.
Reforms to improve the level and use of resources are important; theymust be supported by donor financial assistance. Donors should coordinatetheir efforta not only in financing projects, but also in promotíng policyreforme that emphasize primary health care, cost recovery, and funding forrecurrent costs. Donora should also consid2r funneling a larger ehare oftheir resources through nongovernmental organizations. These are already theprincipal providera of health care in many rural areas, where they can serveas a well-developed vehicle for targeted primary health care.
Education
In many African countries, the education sector expanded afterindependence. Now it is suffering a reversal in both the quality and thequantity of the services it provides. According to the most recent Unescodata, primary enrollment ratios declined during 1980-83 in twelve IDAcountries in sub-Saharan Africa. In some cases (Somalia, Togo, andMozambique), the decline in these three years was 10 percentage points ormore. Evidence of declining quality ¡8 more scattered and anecdotal, but thefact that spending--on items other than teachers' pay--has fallen in the pastthree years is an indication. A lower qualíty of education in turndiscourages families from sending their children to school--especially whenthe decline happens alongside higher school fees and other charges.
To restore the momentum of primary education, African governmentswill have to allocate additional resources to the sector. This iS necessarynot only to meet the enrollment requirements of a rapidly growing population,but aleo teo ensure that students have basic books and supplies. Some savingsmay be possible on primary teacher salaries--without jeopardizing either thequality or quantity of primary educati,n--through increased qualitydifferentials in the salary structure, increases in teachers' working hours(to bring them more in line wíth civil service norms), and, in some cases,higher student-teacher ratios.
- 25 -
In postsecondary education, the immediate prierity ja to reduce thepublic costs-per student. In sub-Saharan Africa, the annual pubLíc cost ofhigher education amounts to almost $3,000 per studert. Thit ís eight timeshigher than the cost of higher education ín Asia and aimost double its cost inLatin America. The costs are high for several reasons. Student-teacherratios are only seven to one, compared with twelve or fifteen to one in Europeand the United States. Nonteaching costs and student subsidies are aliohigh: a recent survey of twenty-four African countries showed that twenty-twoprovide free tuition, twenty-one cover board aid lodgíng for most studenta,and sixteen provide additional cash allowances. Covernments can reduce thesepublic costs in several ways. For example, they should close or consolidotesmall or low-priority programs (for example, the degrees in Spanish and Polishgranted by Ghana's universities). They should spend leas on arta andhumanities and more on scientific and engineering training. They shouldinstitute tuition charges and provide fewer subsidized services and studentstipends. Some countries, such as Cameroon, Ghana, Malawi, and Nigeria, areworking on programs to cut costs in their universities.
Donors should coordinate their efforts to ensure that scholarships,technical assistance, and construction programs are consistent with thenational objectives discussed above. External assístance to education ls atpresent heavily skewed to postsecondary education. Bilateral assistance isconcentrated in technical assistance and scholarships, multilateral aid incivil works and construction. Only 14 percent of ODA for education :.s spenton operating costS and supplies, and only 11 percent of total foreigi.assistance for education is channeled to primary education. Foreign donorsundoubtedly have a comparative advantage in supplying higher education andcapital assistance, but they need to restructure their assistance to avoid adeterioration in the primary schools: they should increase the share ofasaistance for school supplies at the primary level.
Deforestation
Deforestation and, more broadly, degradation of the land--soilerosion, declíning soil fertílity, and desertification--are serious andmounting problems over large parts of Africa. The area of forest and savannahwoodland has halved since the turn of the century, and there have been majorlosses in farm tree stocks. The decline in tree stocks ís accelerating underseveral influences: consumption of fuelwood ís rising with population growth;land clearance has removed trees from farm boundaries and groves that wereneeded to maintain soil moisture and nutrient contents or to protect soalsfrom erosion; seedlings and mature trees have been lost to ill-managedlivestock; commercial logging in the higher rainfall zones goes on withoutadequate reinvestment in, or maíntenance of, forest reserves; and the meanannual yield of tree stocks has rallen in proportion to the decline in thestocks themselves.
A recent World Bank 3 aper reviewed the major issues in this area andproposed an action program. 3 It concluded that virtually every governmenthas recognized the threat of deforestation and taken some steps to protectforeste and encourage tree planting. Yet forestry programs are often treatedas a low priority and, in some cases, even countries with vell-designedpolicies fail to implement them effectively. There is a clear need for publiceducation and government commitment.
In the more favorable ecologícal conditions of the humid zone,farmers and local communities are planting trees, especially on privatelyowned farmlands. The issue there is how to design policies on incentives,pricing, harvesting, forestry extension, and expansion of forestry research.In the Sahelian/Sudanian zone, where trees grow,slowly, the natural rangelandsare overstocked, and land is owned communally, the hostile environmentpresente more formidable problems. These cannot be solved by reforestationalone. Forestry programs must be integrated with policy on agriculture,livestock, land settlement, forestry, energy, and irrigation. When anintegrated approach has been tried, it has often been successful as, forexample, in Ethiopia, Kenya, and Uganda. Nongovernmental organizations canplay a vital part by supporting the community actions that are essential tothe succeas of this approach. Judged against the scale of the problem,however, the programa adopted so far to check deforestation have been grosslyinadequate.
Deforestation in Africa presents a formidable challenge. Answeringit wíll require sustained political commitment and appropriate conservationpolicies on the part of the African governments, with substantial technicaland financial support from donors extending over many years.
Agricultural research
Over the past few decades, large sums have been allocated toagricultural research in sub-Saharan Africa. The number of researchocientists more than doubled in the decade 1970-80; scientific staff years inrelation to the value of agricultural output in Africa now compare favorablywith other developing regions. Funding, especially from outside donors, hasbeen substantial by international standards. It amounted to about 1 percentof agricultural GDP in 1980, which compares with 0.5 percent in Asia and about0.75 percent in Latin America (Table 3.2). All of the research centers in theConsultative Group for International Agricultural Research support some aspectof African food and agricultural production.
There have been some encouraging results. Hybrid maize varieties forsubtropical climates, adopted in the 1960s or earlier, have enabled some East
3. "Deforestation, Fuelwood Consumption and Forest Conservation inAfrica: An Action Program for FY86-88," January 1986.
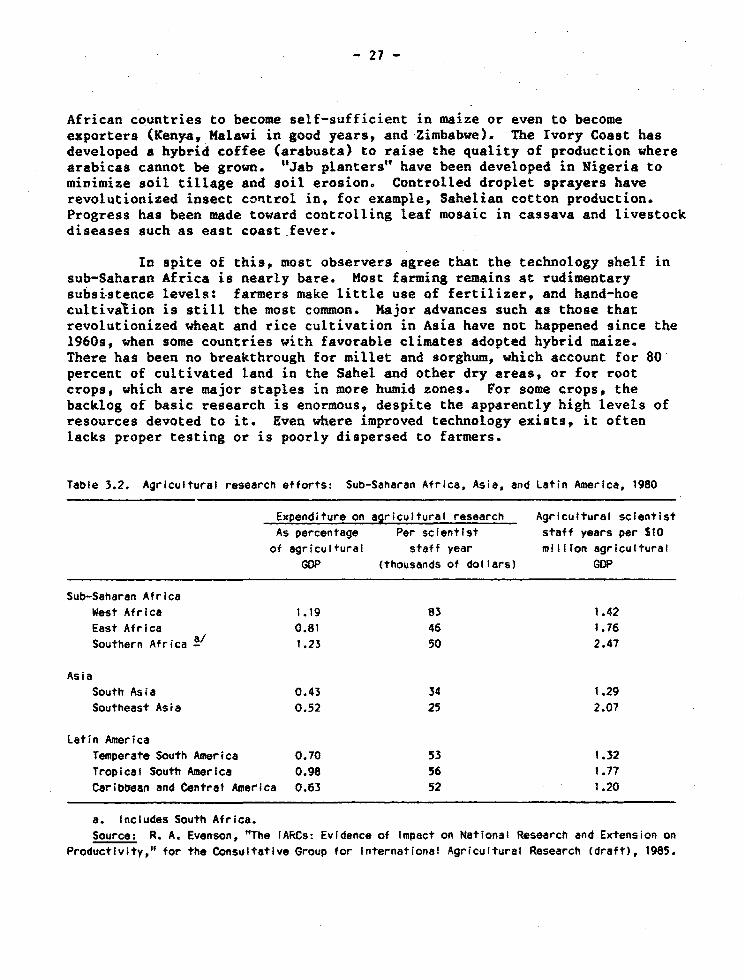
- 27 -
African countries to become self-sufficient in maize or even to becomeexportera (Kenya, Malawi in good years, and Zimbabwe). The Ivory Coast hasdeveloped a hybrid coffee (arabusta) to raise the quality of production wherearabicas cannot be grown. "Jab planters" have been developed ín Nigeria tominimize soil tillage and soil erosion. Controlled droplet sprayers haverevolutionized insect c-'ntrol in, for example, Sahelian cotton production.Progress has been made toward controlling leaf mosaic in cassava and livestockdiseases such as east coast fever.
In apite of this, most observera agree that the technology shelf insub-Saharan Africa is nearly bare. Most farming remains at rudimentarysubsistence levels: farmers make little use of fertilizer, and hand-hoecultivalion is still the most common. Major advances such as those thatrevolutionized wheat and rice cultivation in Asia have not happened since the1960s, when some countries wíth favorable climates adopted hybríd maize.There has been no breakthrough for millet and sorghum, which account for 80percent of cultivated land in the Sahel and other dry areas, or for rootcrops, which are major staples in more humid zones. For some crops, thebacklog of basic research is enormous, despite the apparently high levels ofresources devoted to it. Even where improved technology exists, it oftenlacks proper testing or is poorly dispersed to farmers.
Table 3.2. Agricultural research efforts: Sub-Saharan Africa, Asia, and Latin America, 1980
Expenditure on agricultural research Agricultural scientistAs percentage Per scientist staff years per S10of agriculural staff Vear milIlon agricultural
GDP lthousands of dollars) GDP
Sub-Saharan AfricaWest Africa 1.19 83 1.42
East Africa 0.81 46 1.76
Southern Africa - 1.23 50 2.47
Asia
South Asia 0.43 34 1.29
Southeast Asia 0.52 25 2.07
Latin AmerícaTemperate South America 0.70 53 1.32
Tropical South America 0.98 56 1.77
Caribbean and Cen-tral America 0.63 52 1.20
a. Includes South Africa.Source: R. A. Evenson, "The FARCs: Evidence of Impact on National Research and Extension on
Producttvity," for the Consultative Group for International Agricultural Research (draft), 1985.
- 28 -
Existing research capacity ís not only costly to maintain but oftenunderused. Costs per researcher are high by international standarda (onaverage, over $50,000 per scientist a year, compared with about half thatamount in Asia). Researchers are isolated and frequently lack the incentives,equipment, funding, and supporting personnel to conduct researcheffectively. Highly traíned national researchers become demoralized or aresiphoned off into administrative roles. The local institutiona responsiblefor research are generally weak; they lack strong political backing andrecurrent budget support.
A long-term program to strengthen agricultural research in sub-Saharan Africa must aim to build up scíentific knowledge, to strengthen thecountry-level institutions, and to make better use of existing local researchcapacity. A short-term príority, however, ís to adapt existing technology tolocal farm conditions. The results can then be spread by input suppliers inthe prívace sector (as in many developing countries in other regions) orthrough the extension system. In the longer run, attention must turn to landconservation--and not just to agronomic practices (cultívation, seeds,fertilizer, weed control), but also to land tenure and farming systems.Especially in dry areas, it will not always be enough, even in the short run,to adapt existing technology. Africa needs major research on new cropvarieties to diversify agricultural production, on new techniques to conservesoil moisture, on improved irrigation practices, on control of livestockdiseases, and on agroforestry.
Donors pay for much of the agricultural research in sub-SaharanAfrica. In the early 1980s they spent about $300 million a year--perhaps halfof the total. As a result, they shape research polícies, institutions, andpriorities, often without adequate national involvement. The large number ofdonors and the small síze of many of the countries in sub-Saharan Africa haveled to confusion and to duplication of effort. Donors have compounded theproblem by frequently changing their priorities and by demanding quantifiedresults within periods that are unrealistic for agricultural research. Donormissions have produced an increasing amount of often contradictory docu-mentation, proposals, and solutions to Africa's research problems. Largenumbers of separate donor-financed projects make competing demands on staffresources which are limited, particularly in the smaller countries. Moreover,these "enclave" projects typically last only a short time: they do little toimprove the institutional framework.
In order to assist the African countries in this area, the World Bankis helping te develop a special program for African agricultural resear:h.The inítial objectives of the program are to improve the exchange ofinformation among donors on research activities, to collect and assessresearch results on promising technologies, to help develop national researchstrategies supported by regional programs and networks, and to provideresearch funda to selected national scientists. Thís is a modest butimportant initiative to improve the effectiveness of aid for agriculturalresearch.
- 29 -
In conclusion, it is worth emphasizing that sub-Saharan Africa hasmade little progreso in overcoming the long-term obstacles to development. Inseveral countries, facilities for basic services have deteriorated. Poorgovernment policies have sometimes contributed to the problem--for example, byfsiling to provide adequate funde for recurrent costa and by allowing wages tocrowd out apending on equipment, maintenance, materiala, and other supplies.Unit costs have often been unaustainably high. Some governments have ruledout more efficient nongovernmental organizations or private alternatives.Policy reforma are essentíal: they can help to mobilize more local resourcesand to reallocate existing resources to their most efficient use. Rut bythemselves policy reformas will not be enough to reverse the deterioration.Additional resources--from donors as well as African governments--will beneeded if the initiatives outlíned in this chapter are to succeed. Theamounts are smaLl in relation to total resource requirements, snd in astrategy of adjustment with growth, allocations to these sectora should beprotected, even when there is an overall resource constraint.
- 30 -
4. External capital and aid coordínation
Medium-term programs of growth-oriented adjustment are e3sental ifAfrica's decline i8 to be reversed. But the effectiveness of programa thatare already in place and the further spread of such reforma are threatened byinadequate external resource flows. Adjustment programa need additionalfinancing to meet urgent needs for raw materials and spa.ne parta to increasethe use of existing capacity. External financing is also needed, along withincreases in domestic savings, to raise investment rates, which are now lowerín Africa than in any other region of the developing world.
The scarcity of foreign exchange imperils the success of adjustmen programa in country after country. Because of it, administrative controls arereta.ned, spending on maíntenance and rehabilitation is zqueezed, and existingcapacity ja not fulty used. More important, without extra resources, theprice changeo caused by greater reliance on market mechanisms can have asericus social and political impact; this, jn turn, strengthena those whoargue for continued public intervention in allocating resources.
The external capital required to support these programs in low-incomeAfrica is not large in relation to the needs of highly indebted middle-incomecountries. However, most of it must be granted on a concessional basis, sinceseveral of Africa'9 IDA-eligible countries have prolonged debt problems, andall have limited credítworthinesa. Official flows require budgetaryappropriationa. These can be made only through a political process in thedonor countries. As a result, obtaining new fundo from official sourcesraises íssues which are different from those that face countries wíth accessto commercial sources. For instance, commercial lenders provide freely usableforeign exchange, while official lendera often concentrate an projectfinancing to ensure political identification with the funda provided. Andwhen official lenders provide import fínancing, it may be tied, thus requiringthe recipient country to maintain import controls, in order to enforce donorprocurement regulations. Moreover, unlike commercial lendera, donors oftenhave. their own view of the priorities for which recipienta can use thefunda. Another complication ja that in low-income Africa a large part of debtservice is owed to preferred creditora; this límíta the acope of debtrescheduling in reducing the region's debt servicing problem.
To provide the necessary external capital in the appropriate form,political decisions are required to increase resource flows to Africa througha combination of additional aid and debt relief, and -o relax the rigiditiesconcerning the use of aid. This chapter discusses these issues withparticular attention to the resource requirements of the next five yeara,1986-90.
External resource flows, 1986-90
As earlier Bank reports on Africa have emphasized, external resourceflows cannot guarantee development. Without appropriate policies, no amountof external assistance can reverse Africa'a decline. At the same time, policy
- 31 -
reforms designed to promote growth will be unsustainable without additionalresources. Quantifying the resource requírements of particular countríesseveral years ahead ¡a difficult at the best of times. The problem now ¡sgreater than usual, because massive shifts in relative prices and in patternsof resource use in the past few years have overturned the historicalrelationships that might be a basis for calculation--and these shiftacontinue. The prospects for commodity prices, the future trenda in exchangerates, and the outlook for the world economy are all uncertain. tt isimpossible to say precisely how many countries will develop credibleadjustment programa and thus be eligible for additional resources.
Despite these uncertainties, this report estimates the minimumrequirements for IDA-eligible countries &s a group. The basic objectiveunderlying these estimates ¡a to halt the trend of decline in per capitaconsumption by 1990 and achieve some growth thereafter. Because of the needfor higher savinga to support essential investment, and because all Africancountries have rapidly growing populations, tLis objective can be achievedonly if the GDP growth rate reaches at least 3-4 percent a year by 1990. Thereport estimates external resource requirements during 1986-90 by sssessingthe minimum importa needed to achieve investment levela consístent with suchgrowth rates in light of the maximum exports and domestic savings feasíbleduring the period. These are minimum estimates for IDA-eligible countries asa group. Though some of the countries may fail to develop credible programsto be supported with additional assistance, others might need more than theminimum to support faster growth.
This report goes on to estimate the mínimum flow of concessionalassistance needed to pay for imports and debt servicing--after allowing forthe maximum feasible effort to increase export earnings, continued favorabledebt relief. and the highest level of nonconcessional flows that would beprudent. Low-income Africa will need concessional flows of $11 billion a yearduring 1986-90 to continue the proceso of growth-oriented adjustment. Of thetotal, about $8.5 billion a year can be expected on the basis of known andprojected commítmente. This leaves a gap of $2.5 billion a year to be filledby additional multilateral and bilateral asaistance, including debt relief.
Poreian exchan&e_rE!ql!iementa
The Bank's experience suggests that in much of low-income Africainadequate import capacity *s thwsrtíng adjustment programa. Real importa percapita have been declining for low-income countries as a group since the 1970s(see Table 4.1), and the rate of decline accelerated in the 1980s. To financegrowth-oriented adjustment programs, and to lay the foundation for sustainedand more rapid growth in total output and per capita consumption, thís trendmust be reversed. At a minimum, real importa per capita should return to thelevel of 1980-82. This implies importe of about $28.5 billion a year atcurrent prices during 1986-90, or about 24 percent more than in 1980-82(Table 4.1).
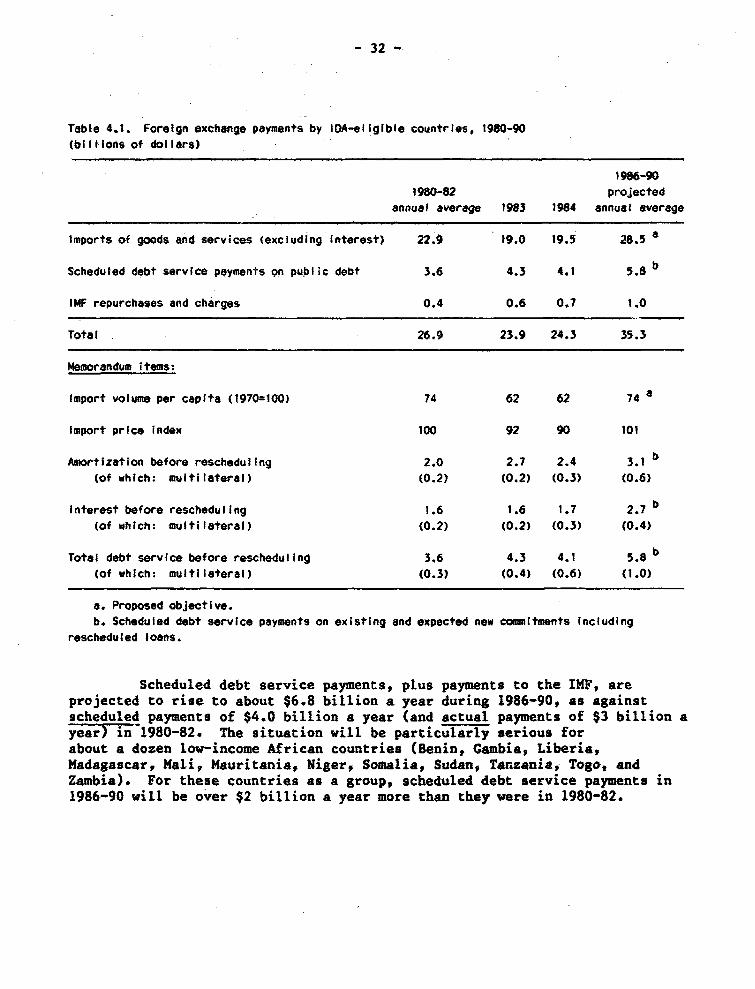
- 32 -*
Table 4.1. Foreign oxchange payments by IDA-eliglble countries, 1980-90
(bltions of dollara)
1986-901980-82 projected
annual average 1983 1984 annuel average
Imports of goods and servíces (excluding Interest) 22.9 19.0 19.5 28.5 a
Scheduled debt servlce payments on public debt 3.6 4.3 4.1 5.8 b
IMF repurchases and charges 0.4 0.6 0.7 1.0
Total 26.9 23.9 24.3 35.3
Memorandum items:
Import volume per caplta (1970=100) 74 62 62 74 a
Import prico índex 100 92 90 101
Amortization before rescheduling 2.0 2.7 2.4 3.1 b
<of which: multilateral) (0.2> (0.2> (0.3) (0.6)
lnterest before rescheduling 1.6 1.6 1.7 2.7 b
(of which: multilateral) (0.2) (0.2> (0.3) (0.4)
Total debt servlce before rescheduling 3.6 4.3 4.1 5.8 b
(of which: multilateral> (0.3) (0.4) (0.6) (1.0)
A. Proposed objectíve.
b. Scheduled debt servlce payments on existing and expected new comíitments Including
reschoduled 1oans.
Scheduled debt service payments, plus payments to the IMF, areprojected to rise to about $6.8 billion a year during 1986-90, as againstscheduled payments of $4.0 bíllion a year (and actual payments of $3 billion ayear7 in 1980-82. The situation will be particularly serious forabout a dozen low-income African countries (Benin, Gambia, Liberia,Madagascar, Mali, Mauritania, Niger, Somalia, Sudan, Tanzania, T*go, endZambia). For these countries as a group, acheduled debt service payments in1986-90 will be over $2 billion a year more than they were ín 1980-82.
- 33 -
Sources of external finance
The principal source of financing for external payments is exportearnings. Adjustment policies along the Ulnes discussed above should heLp toraise exports. However, because of the region's economic structure, exportawill be relatively slow to respond. They are mostly primary commodities,which have limited prospects. For several kinds of exports--especiallymínerals such as copper, bauxite, and iron ore--prospects are poor both forprices and for volumes. And nontraditional exports start from a very lowbase. Therefore, it will be very hard to achieve a rapid expansion of exportsin the near term. A country-by-country analysis indicates that exports incurrent prices during 1986-90 could, at best, be about 25 percent higher thanin 1980-82. And this assumes export-oriented policy reforms in Africa and noincrease in protectionísm in the industrial countries.
In order to meet Africa's growing foreign exchange requirements,resource flows from external sources will need to increase during 1986-90, butthe recent trend has been just the opposite. In 1984, gross capital inflowsto low-income Africa from all sources were about 15 percent lower in currentprices than in 1980-82. Thíi was due to a decline in nonconcessionaL flows,in particular private capital flows (Table 4.2).
Nonconcessional capital flows were more than 25 percent of totalgross capital flows in 1980-82; however, with increasing debt servicedifficulties, they have been declining steadily. The decline was particularlymarked for private commercial flows, which dropped from about $1.6 billion ayear during 1980-82 to about $0.4 billion in 1984. Nonconcessional flows fromofficial sources (bilateral and multilateral) have also declined, though notso aharply. Given the weak debt-servicing capacity of most low-income Africancountries, it would not be desirable for them to obtain more than about $1billion a year in nonconcessional funds during 1986-90.
Concessional flows to low-income Africa were largely stagnant during1980-84; worldwide concessional flows declined during thís period. As aresult, the ahare of low-income Africa in global net ODA disbursements went upfrom about 19 percent in 1980-82 to 21 percent in 1984--a small butcommendable shift of resources to Africa. During 1985, food aid deliveriesincreased substantially (about double in volume compared with 1984), butnonfood aid may have declined because of famine-related disruptions. On thebasis of known and expected levels of commitments --including the World Bank'sSpecial Facility for Sub-Saharan Africa, the increases under the Lome IIIConvention, and the fourth replenishment of the African Development Fund(1985-87)--concessional flows during 1986-90 would be about $8.5 billion ayear, some 25 percent higher than 1980-82 levels.
In recent yeara, debt reschedulinga under the Paris and London Clubshave shown considerable flexibility. For countries with serious debt-servicing difficulties and credible adjustment programs, rescheduling of85-95 percent of principal has been common, and it has sometimes covered 100percent of the principal and sometimes amounts due from previousreschedulings. Rescheduling by bilaterals of 50 percent or more of interestpayments due has also become common.
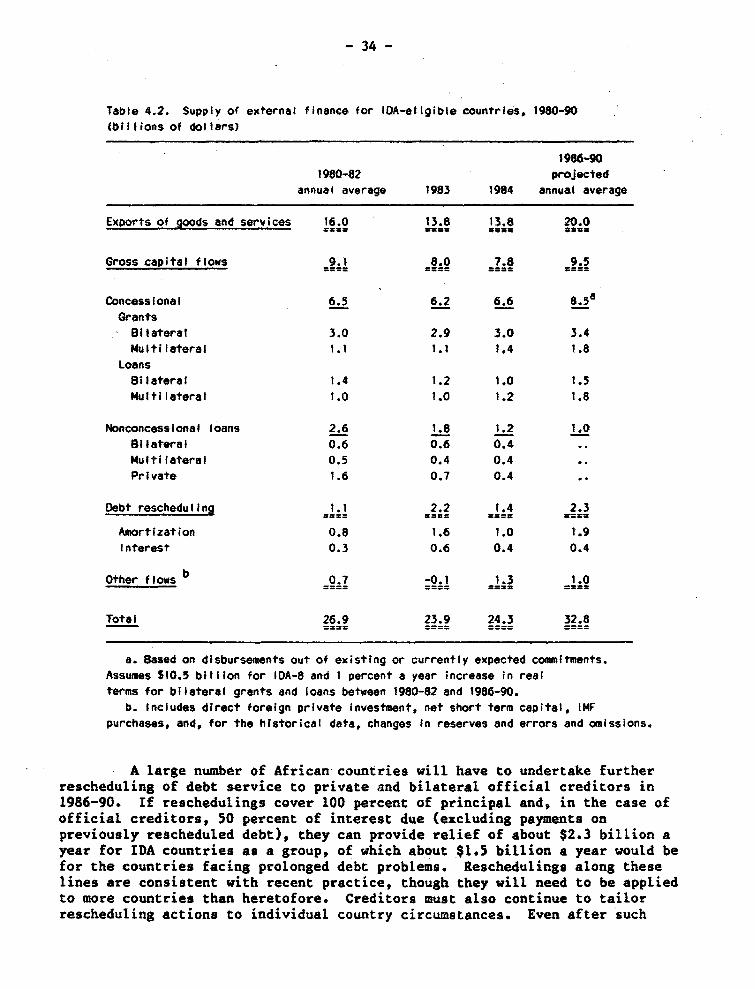
- 34 -
Table 4.2. Supply oQ external finance for IQA-eligible countrles, 1980-90
(billions of dollars)
1986-901980-82 projected
annual average 1983 1984 annual average
Exports of goods and services 16.0 13.8 13.8 20.0
Gross capital flows 4.1 8.0 7.8 9.5
Concessional 6.5 6.2 6.6 8.5Grants
Bilateral 3.0 2.9 3.0 3.4Multilateral 1.1 1.1 1,4 1.8
Loans
Bilateral 1.4 1.2 1.0 1.5Multiiateral 1.0 1.0 1.2 1.8
Nonconcessional loans 2.6 1.8 1.2 1.0
BIlateral 0.6 0.6 0.4
Multilateral 0.5 0.4 0.4
Private 1.6 0.7 0.4
Debt rescheduling 1.1 2.2 1.4 2.3
Amortization 0.8 1.6 1.0 1.9Interest 0.3 0.6 0.4 0.4
Other flows b 0.7 -0.1 1.3 1.0
Total 26.9 23.9 24.3 32.8
a. Based on disbursements out of existing or currentiy expected commitments.
Assumes $10.5 bilíion for IDA-8 and 1 percent a year increase in realterms for bilateral grmnts and loans between 1980-82 and 1986-90.
b. Includes direct foreign private Investment, net short term capital. IMFpurchases, and, for the historical data, changes in reserves and errors and omissions.
A large number of African countries wíll have to undertake furtherrescheduling of debt service to private and bilateral official creditors in1986-90. If reschedulings cover 100 percent of principal and$ in the case ofofficial creditors, 50 percent of interest due (excluding payments onpreviously rescheduled debt), they can provide relief of about $2.3 bíllion ayear for IDA countries es a group, of which about $1.5 billion a year would befor the countries facing prolonged debt problems. Reschedulings along theselinea are consistent with recent practice, though they will need to be appliedto more countries than heretofore. Creditors must also continue to tailorrescheduling actions to individual country circumatances. Even after such
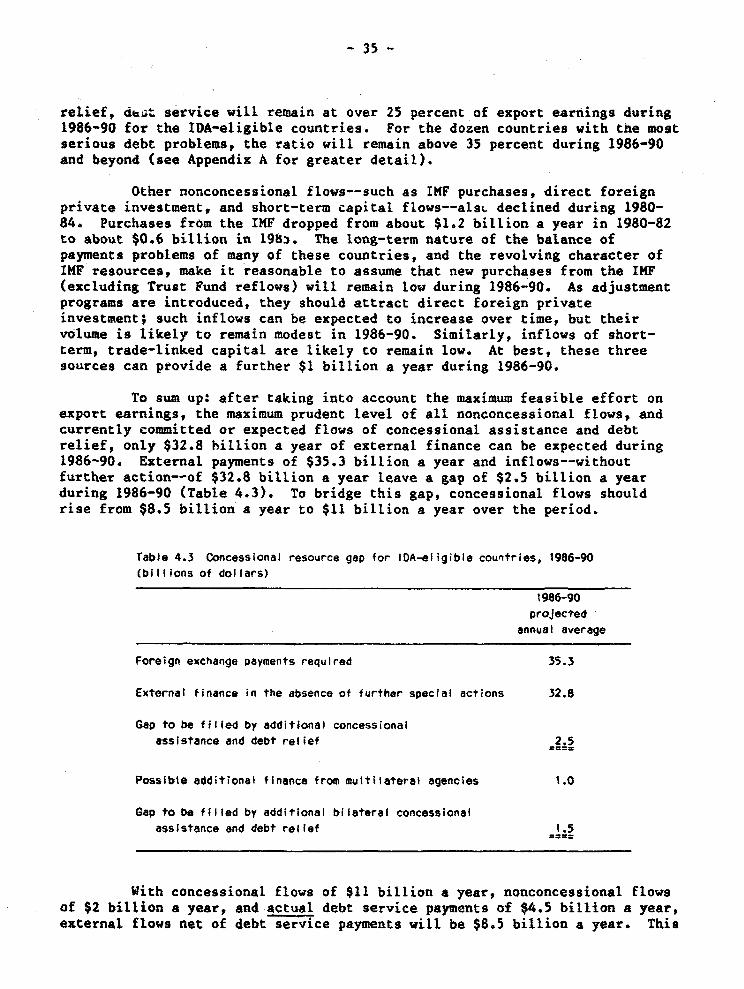
- 35 -
relief, de4t service will remain at over 25 percent of export earnings during1986-90 for the IDA-eligible countries. For the dozen countries with the mostserious debt problems, the ratio will remain above 35 percent during 1986-90and beyond (see Appendíx A for greater detail).
Other nonconcessional flows--such as IMF purchases, direct foreignprivate investment, and short-term capital flows--alsk. declined during 1980-84. Purchases fróm the IMF dropped from about $1.2 bíllíon a year in 1980-82to about $0.6 billion in 198i. The long-term nature of the balance ofpayments problema of many of these countries, and the revolving character ofIMF resources, make it reasonable to assume that new purchases from the IMF(excluding Trust Fund reflows) will remain low during 1986-90. As adjustmentprograma are introduced, they should attract direct foreign privateínvestment; such inflows can be expected to increase over time, but theirvolume is likely to remain modest in 1986-90. Similarly, inflows of short-term, trade-linked capital are likely to remain low. At best, these threesources can provide a further $1 billion a year during 1986-90.
To sum up: after taking into account the maximum feasible effort onexport earnings, the maximum prudent level of all nonconcessional flows, andcurrently committed or expected flows of concessional assistance and debtrelief, only $32.8 híllion a year of external finance can be expected during1986-90. External payments of $35.3 billion a year and inflows--withoutfurther action--of $32.8 billíon a year leave a gap of $2.5 bíllion a yearduring 1986-90 (Table 4.3). To bridge thís gap, concessional flows shouldrise from $8.5 billion a year to $11 billíon a year over the period.
Table 4.3 Concessional resource gap for IDA-el igible countries, 1986-90(bit <lons of do ars)
1986-90projected
annual average
Foreign exchange payments required 35.3
External finance in the absence of further special act;ons 32.8
Gap to be filled by additional concessionalassistance and debt rolief 2.5
Possible edditional fínance from multilateral agencies 1.0
Gap to be filled by additional bilateral concessionalassistance and debt relief 1.5
With concessional flows of $11 billíon a year, nonconcessional flowsof $2 billion a year, and actual debt service payments of $4.5 billion a year,external flows net of debt service payments wilL be $8e5 billion a year. This

- 36 -
ís the amQunt of external assistance that will be avaílable to supplementdomestic savings. Such external assistance would amount to 10-12 percent ofGDP for these countries as a group. Assuming that with improved policies thedomestic savinga rate can recover to 8-10 percent of GDP by 1990, this wouldpermít inveatment at about 20 percent of GDP, a rate which is essential for aCDP growth rate of at least 3-4 percent a year by 1990.
Bridgiflgthe resource «ap
Because of the time lag between commitments and disbursements, asubstantially larger increase in commitment authority will be required tobridge the resource gap of $2.5 billion a year. Since the additional financeis needed to meet import and debt service requirements in 1986-90, most of itwill have to be in a quick-disbursing form. However, donors should alsodirect additional assistance to projects that are addressed to the long-termconstraints on development discussed in Chapter 3.
These needs should be taken into account in decisions on the IDA-8and the next African Development Fund replenishments, and in decisions on theuse of the SDR 2.7 billíon expected from IMF Trust Fund reflows during1986-91. It has already been agreed that the Trust Fund reflows should beused to provide additional balance of payments assistance on concessionalterms to the low-income countries in sub-Saharan Africa and elsewhere that areeligible for IDA resources, are in need of such assistance, and faceprotracted balance of payments problems. These funds can go far to meet theneeds of the African countries with prolonged debt and balance of paymentsdifficulties. If there is, in addition, a positive outcome on funding for themultilateral lending institutions (including an IDA-8 replenishment of atleast $12 bíllion), these sources could probably meet about $1 billion of thedisbursement gap.
The remaining gap of about $1.5 billion a year would have to befilled by additional bilateral aid and debt relief. This would amount toabout a 30 percent increase in bilateral assistance and debt relief over 1984,or 20 percent above the levels currently projected (Table 4.2>. Suchassistance can be provided by a combination of additional fast-disbursing aidand debt relief. Each package will, of course, depend on the individualcircumstances of donor and recipient. However, as a generel rule, no donorcountry should be a net recipíent of resource flows from an African countrywhich is undertaking credible reforai programs. This is particularly importantfor countríes whose aid agencies want to maíntain a preferred creditorstatus.
Additional bilateral assistance could be provided in differentvays. For example, donors could retroactively convert existing official loai¿sinto grants--as proposed in the UNCTAD declaration of 1977; enable theirexport credit agencies to refinance scheduled debt service payments onconcessional terms; widen the group of creditors that participate ínrescheduling of principal and interest; and increase their aid budgets,particuLarly in the form of balance of payments support for adjustment
- 37 -
programa. Sweden provídes an example of the latter approach. The Swedishgovernment recently added to its aid budget a special supplement for use byrecipiente to repay commercial credits.
Institutional reforma in aid coordination
These increases in aid and debt relief will only be enough to supportminimum import levels. But much still needs to be done to increase theeffectiveness of aid in support of comprehensive adjustment. This sectiondiscusaes the key areas for attention and reform.
Recent progress
The creation of the Special Facilíty for Sub-Saharan Africa in 1985was an endorsement of the principle that donors should focus their aid,especially nonproject assistance, on countries that are willing to adoptoverall or sectoral adjustment programs. It has also shown how bilateral andmultilateral agencies can work together to support policy reforms.
At recent consultatíve group and other aid coordination meetings,increasing numbers of donors have recognized the need for additioralnonproject aid. Ghana and Senegal are cases in point. Bilateral aid agencieshad long been reluctant to join the multilateral ínstitutions in providing anadequate volume of nonproject assistance to Ghana. However, at theconsultative group meeting in November 1985, several bilateral donorsindicated that they were willing to increase their nonproject assistance andto cofinance with the multilateral agencies. In Senegal the two mainsuppliers of nonproject assistance, France and the United States, have beenworking closely with the Bank and the IMF to províde support for major policyreforms.
Another recent development is that many bilateral and multilateraldonors are concentrating on projects that maintain or rehabilitate existingcapacíty. This is particularly true of expenditure on infrastructure, large-scale irrigation, and public enterprises; lately few such projecta have beenwholly new investments. Increasingly, donora are cofinancing rehabilitationschemes. Examples include a major agricultural project in Zambií and a powerproject in Senegal.
Donors are trying to improve their project portfolios by cancelingnonperforming projects and reallocating funds to areas of higher priority.For example, in 1983-85 the World Bank increased disbursement rates andredirected funda to areas of high priority in seventy-five projects in twenty-five countries of sub-Saharan Africa. At a recent consultative group meetingfor Zambia, the aid agencies of several countries, in particular of theFederal Republic of German-, announced their intention to redirect part oftheir committed assistance toward higher priority projects and quickdiabursing operations. In Níger, the government and several donore haveagreed to scale back construction of a major trunk road and to focus insteadon higher priority activities such as road maintenance.
- 38 -
In the past two years, donors have expanded their formal arrangementsfor coordinating aíd, and their use of consultative groups and roundtables hascontinued to increase. In 1983-84, the pace of consultative group activityincreased substantially, and meetings were held in eight countries. In 1985consultative groups were established for the first time ín Mauritania andSenegal. Roundtables began in five countries in 1984 and in another three in1985. As a result, by the end of 1985, some kind of formal aid coordinatingmechanism was established or agreed in principle for all but one of the low-ancome African countries (the exception ís Ethiopia). The Bank and the United
Nations Development Programme aim to provide similar documentation for bothconsultative groups and roundtables.
Aid coordínation has also been strengthened at the local level. Forexample, special meetings on aid for selected sectors have been held--usually-under the sponsorship of a lead donor--in níne countries (Benin, Burundi,Kenya, Madagascar, Malí, Rwanda, Senegal, Tanzania, and Zaire). Similarmeetings are scheduled in eleven others. In eight countries (Ghana, Guinea-Bissau, Lesotho, Senegal, Somalia, Sudan, Zaire, and Zambia>, localrepresentatives of major donors also hold regular meetings--often under thechairmanship of a lead donor and in conjunction with a government aid steeringgroup--to discuss broad issues of aid and economic policy.
These are promising signs. But the progress toward more effectiveuse of aid needs to continue. There are at least six areas in which furthersteps should be taken now to strengthen the system.
Further reforma
First, governments in Africa must be seen to have the primeresponsibility for designing their adjustment and investment programs and forcoordinating aid and other financial flows. Donors can assist in the task--but they should not undermine this responsibility by trying to negotiate theirown favoríte package of policy reforma or by promoting their own petprojects. To this end, the African countries must strengthen their coreministries of finance and planning, and the unita that coordinate theirforeign assistance. Better coordination within the government--between thecentral bank, the ministries of finance and planning, and the sectoralministries--is also necessary. Such improvements may call for technicalasaistance from outside. Some countries have made progresa in this area (forexample, Zambia> but most 9till have a long way to go. Changes in donorattitudes and programa are essential to ensure that theír assLtance fits intothe national development priorities.
Second, decisions on aid and debt relief are not yet adequatelyintegrated. The current pattern of discussions means that aid levela areindicated before agreement is reached on debt relief. As a result, larger aidcomíitments have often allowed creditors to harden their terms for debtrestructuring. In such cases, the increase in resources necessary for theeconomy to grow out of ita problems never materialized. In Latin America's
- 39 -
debt negotiations, fresh money ard the restructuring of existing debt arenormally considered together. In Africa, donors and creditors are notnecessarily one and the same, but the principle of simultaneous determinationís just as important. Debt rescheduling for low-income African countries willbe needed regularly for many years to come, so debt relief and aid must beviewed as elements of a single financing plan in support of growth-orientedadjustment. The responsible donor country institutions can then work out thespecific details of aid commitments and debt relief, as at present. Over thenext five years, increases in aid--and the expected rise in export earníngs--should be used to support growth, not to reduce debt relief.
One vay to integrate the two financíal decisions is to bring togetherthe different representatives handling aid and debt wíthin creditor and donorgovernments. This was done in India in 1968 and 1972 and in Pakistan in 1973and 1974; debt relief was committed as part of the annual aid-pledgingexercise. In 1981, Pakistan's aid consortium meeting focused on balance ofpayments problems, and a part of the meeting was devoted to a discussion ofdebt relief--under the chairmanship of the French representative, who waschairman of the Paris Club. More recently, in Africa, the Mauritania meetingof March 1985 considered financing needs for 1984-85 and adopted an integratedpackage of aid and debt relief. In this meeting, Arab donors evaluated debtrescheduling and fresh money requirements together; and some OECD donorscommitted new aid and at the same time indicated their willingness toreschedule debt at the subsequent Paris Club.
Third, consultative group meetings have sometimes been so large thateffective policy focused discussion became almost impossible. Such groupshave worked best when the major donors have had discussions with thegovernment, the IMF, and the World Bank in advance of the formal meetings.This enables the major partíes--not least, the government--to recognize whatls required of them in devising a consistent internal and external financepackage. Such prior consultation míght be essential if the aid and debtdiscussions are brought together. Private banks have formed small steeringcommíttees to address the debt problems of the middle-income countries. Pormost of the major African debtors, they have also established small steeringcommittees led by one or two banks. In the case of countries with prolongeddebt and balance of payments difficulties, detailed discuasions on debt andaid will be required; prior consultation between the principal agencies willtherefore be particularly important.
Fourth, Africa's attempted policy reforms are likely to fail unlessdonors can give indications of the resources that will be available in themedium term-national programs of medium-term adjustment cannot be formulatedwíthout this informatíon. At present, creditors will reschedule only the debtservice that is due over the following twelve to eighteen months. As a rule,donors do not commit themselves to financial support for more than a yearahead. Often they lack legislative authority to make multiyear commitments.But even a nonbinding indication of aid to come could provide help in medium-term planning. Donors have already given multiyear pledges as part of the IDAreplenishments. In a recent consultative group for Ghana, at least onebilateral donor (Canada) was willing to make multiyear indicative pledges. Totackle the special problems of Africa, other donors must do the same.
- 40 -
Fifth, follow-up to the agreements reached at debt and aid meetingaleaves much to be desired. Too often, it takes a year after a Paris Clubagreement to finalíze the arrangements for bilateral debt relief. Donoraoften fail to abide by consultative group agreements on the volume andcomposition of assistance. Moreover, there is no procedure to identify suchahortfalla quickly.
As proposed ín the 1984 Africa report, consultative groups shouldestablish appropriate monitoring capacity. For instance, a one or two personsecretaríat could be assigned to the office of the Wor d Bank's residentrepresentative to work closely with the host government in monitoring theimplementation of consultative group agreemento and bring any developmentsthat might be inconiístent with them to the attention of the group. Such astaff function might suitably be financed jointly by donots.
Sixth, multilateral agencies must play a central role. Increases inaid should be largely in the form of nonproject assístance--for reasonsalready explained. This makes coordination through multilateral agencies allthe more important. The Bretton Woods institutions are already using more oftheir resources to support adjustment programs. The European Community,acting under the Lome III agreement, has started to consider sectoral policiesalongside its assistance programs. The African Development Bank is beginningto direct more resources to quick-disbursing assistance in support of policyreforma--as in ite recent support for Ghana's economic recovery program.These are welcome signs of an increasing emphasis on quick-disbursing, policy-oriented tending. But there is a risk of fragmentation and inconsistency inpolicy reform programs negotiated by different agencies. To avoid this, thecountry's own medium-term adjustment programs and its action program for thenext twelve to eighteen months should be the focus of adjustment lending bythe World Bank and other agencies.
Cooperation between the World Bank and the IMF should continue to bedeepened. The Bank and the Fund should work together with governments, first,to develop an adjustment and investment program aimed at restoring growth, andsecond, to assess financial needs and sources. Programs of this kind wouldthen become a basis for financial support--which would be agreed inconsultative group meetings and delivered in the form of concerted, policy-based lending.
In conclusion, 1986 offers several oppportunities to meet the Africanchallenge. Decisiona on IMF Trust Fund reflows and the IDA-8 replenishmentwill help to determine the resources available for low-income Africa during1986-90. The Development Committee's meeting in April and the apecial sessionof the UN General Assembly on Africa in May can establish the principles onwhich the concerted effort of the African countries and the internationalcommunity can be based.
- 41 -
Appendix A
The debt problem and ita implications for import capacity
Duríng the 1970s, IDA countries in Africa borrowed heavily despite arise in their export earnings and increasing ODA. Between 1970 and 1980,their external debt rosç by over 21 percent a year (Table A.1)--more rapidlythan in Latin America. - Several countries increased their debt ten times ormore in these ten years. In some cases, the debt roughly tripled in two tothree years. The growth rate of debt slowed down considerably during the1980s (to 7 percent a year during 1980-84). But purchases from the IMFincreased rapidly and arreara on short- and long-term debt accumulated(Table A.2).
Profile of the African debt problem
At the end of 1984, the low-income African countries' debt (includinglong-term and short-term arrears and IMF purchases) stood at about $45billion. For this group of countries, total debt represented 74 percent oftheir GNP and 349 percent of their exporta. Both ratios were considerablyhigher than those for major borrovers among developing countries (which were51 percent and 239 percent, respectively). For several countries, theexternal debt was more than 100 percent of GNP and 300 percent of exports.<Table A.2).
A large part of the outstanding debt of the IDA-eligible countries atthe end of 1984 was owed to official creditors, often on concessional terms.As a result, despite the heavy burden of debt, the scheduled debt service onlong-term debt (plus payments to the IMF) was 35 percent of exporta in 1984.However, the actual debt service ratio was only 22 percent, because ofreschedulings and the accumulation of arrears. This distinction can be veryimportant: some countries had scheduled debt service ratios that ranged from80 to 145 percent, while their actual debt service payments ranged from 20 to40 percent.
The composition of the debt service reveals two interesting points(Table A.3).
O The predominance of official creditors, especially multilateralagencies. Official lenders plus the IMF account for more than 75 percent ofdebt service due in 1986-81 for the IDA-eligible countries. Of the 75percent, 20 percent is due to the IMF, and 17 percent to other multilateralagencies. For some countries, multilateral lending agencies (plus the IMF)account for 50 percent or more of the debt service. Since neither payments to
1. The tables in this appendix present data on debt Lor thirty-seven ofthe principal borrovers of sub-Saharan Africa, although the discuasionconcentrates on twenty-five IDA-eligible countries.
- 42 -
the IMF nor debt service due to other multilaterals can be rescheduled, thísreduces the scope for debt relief.
O The great díversity of bilateral creditors. For some countries theprincipal bilateral creditors are countries represented at the Paris Club, butfor othere (such as Guinea, Mali, Mauritania, Somalia, Sudan, and Guinea-Bissau) the principal bilateral creditors are OPEC members or centrallyplanned economies. Since these creditora have different procedures for debtrelief, the case-by-case approach is particularly important for Africandebtora.
Projected debt service burden and import capacity
For many African countries, the reschedulings and arreara arebuilding up obligations for the future. The implications of Africa's debtburden become clear when the projected debt service payments are seen inrelati,n to the export prospects. Country-by-country projectiona wereundertaken to aseses the scheduled debt service burden in the rest of the19809 and beyond. The scheduled amounts are defined as the payments due onexisting debt and new credits, including rescheduled debts (Table A.4).
The projections of exports of goods and nonfactor services were basedon export projections done for the World Development Report 1986, which startfrom a common set of external assumptions, including developed-country growthrates, primary commodity prices and world demand, prices of manufacturedimporta, and changes in the rateo of exchange of the major currencies. Theprojections aiso assume that the sub-Saharan African countries will adopt muchbetter domestíc policies than those of the past ten years. Exports wereprojected under the assumption that there would be no increase inprotectionism in developed countries.
Gross disbursements of external capital were asaumed to be maintainedat 1980-82 levels in real terms through 1990. The distribution of newdísbursements among concessional and nonconcessional creditora was assumed tobe the same as the distribution of disbursements in 1984. As a result, theterms of the projected new commítments are, in general, somewhat softer thanthe terma of the 1980-82 commitments. New IMF purchases were assumed to behalf the level of repurchases in each year. The projections assume thatarreara are rescheduled on the same terma as other debt and, for countrieswithout debt rescheduling, paid off in equal annual installments over 1986-90.
Reschedulings were assumed to take place in most of the cases whereprojected debt service ratios significantly exceed those of the recent past--the earlier ratios were taken as a rough indicator of a country'e ability toservice debt over the next five years. No reschedulings were assumed forcountries where projected capital inflows would in any case result in asubstantíal increase in import capacity. On this reasoning, seventeer. of thetwenty-five IDA-eligible countries were projected to reschedule debt between1986 and 1990; most of them have already rescheduled their debt at least onceduring 1980-85.
- 43 -
The terma assumed for the reschedulings were:
o A ten-year repayment period, including five years of grace
o Interest ratea at or near market rates for rescheduled private debtand for the claims of export credit agencies
o Interest rates at their original level for rescheduled ODA loana
o A contract cutoff date of December 31, 1984.
Up to 100 percent of principal and 50 percent of interest payments--includingarrears and debt rescheduled before 1985--were assumed to be rescheduled. Inthe case of private financiai credits without external guarantees, however,only principal payments were assumed to be rescheduled. Debc service paymentson debt contracted or rescheduled during the 1985-90 period were not assumedto be rescheduled.
While these terms are relatively generous, they are roughly in linewith those agreed at recent Paris and London Club reschedulings for sub-Saharan Africa-n countries. A single set of terma vas used for convenience.Creditora have sometimes granted more generous terms, and this may benecessary jn the future to provide sufficient debt relief for certaincountries. In other cases, less generous debt relief may be adequate.
For twelve countries in sub-Saharan Africa the scheduled debt serviceratios ín 1986-90 are projected to be significantly higher than the actuallevels in recent years (Table A.4). In these cases, debt rescheduling jslikely to continue for some time--as indicated by the high debt service ratiosprojected for 1991. Moreover, their import capacity in 1986-90 is likely tobe lower than jn 1980-82. even after reschedulings and even if grossdisbursemento of external capital during 1986-90 are maintained at 1980-82levels. Without additional capital flows or additional debt relief, theirimport capacity wil1 decline sharply.
For the other IDA countries, the debt problem is more manageable.Their average scheduled debt service ratio in 1986-90 js hígher (28 percentathan in 1980-82 (19 percent>. However, rescheduling operations are likely toreduce the actual average to 21 percent in 1986-90; and the acheduled debtservice in 1991 ¡a projected to remain at this level, relative to exporte.With gross capital inflows at their 1980-82 level, their importa of goods andnoninterest services would rise by about 13 percent ín real terms between1980-82 and 1986-90. When population growth ¡9 taken into account, thisimplies an 11 percent decline in per capita import capacity. As noted inChapter 4, resource flows to low-rncome Africa will have to íncreasesubstantíally during 1986-90, i£ the minimum objective of restoring per capitaimports to their 1980-82 level is to be achieved.
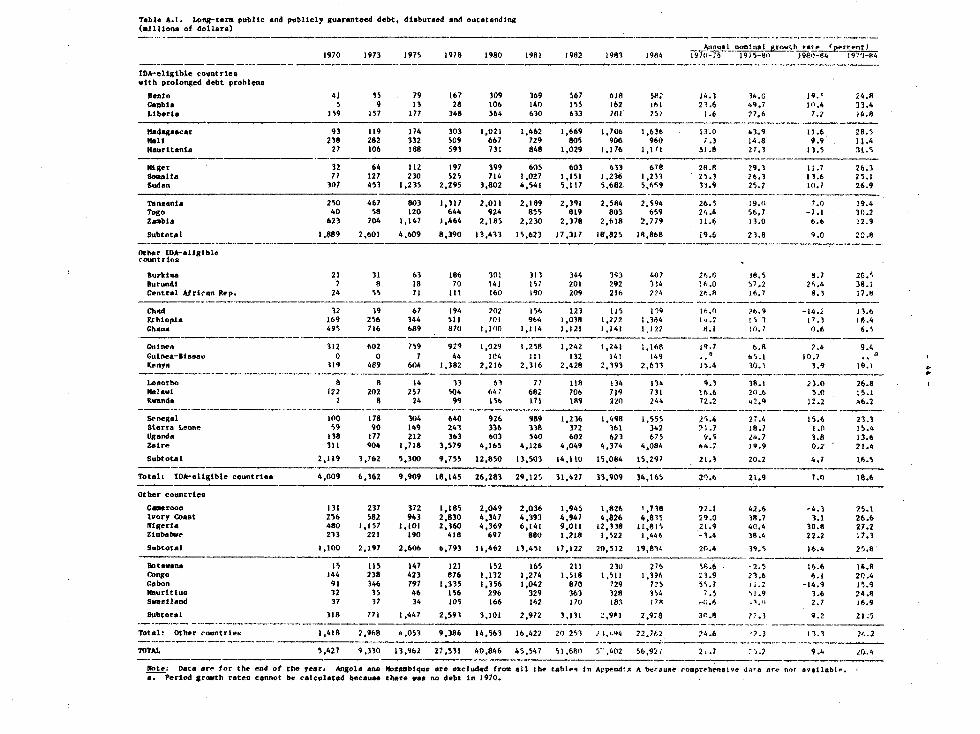
Table A.¡. Lonr-ter.. pubílc and pua911e17 guaranteed debt, disburiad mnd1 outatandíng(alilItona of dollara)
ilul. 100001grot.6ratejerveníí19710 1973 1975 1918 1980 1981 1982 <98i3 1984 19111-7 719-5-9í1 1980-984 9'-4
13A-Cligthl.e 0o4nt rleavftl. prolonged de6t problems
Oenin 41 55 79 ¡67 309 369 561 618 587" ji.3 34.G 19.' 24.8GambIa 5 9 II 28 106, 140 155 162 161 23.6 49.7 10, 33.4Liberte ¡59 157 117 348 564 630 633 101 15, 1.6 27,6 1.7 >4.8
Iladagaaear 93 119 174 303 1,021 1.462 1,669 1,106 1,636 13.0 43..9 11.6 281.>mal¡ 278 282 332 509 667 129 805 906 960 7,3 14.8 9.9 ¡1..4Ptaurítanía 21 106 188 593 131 848 1,029 1.116 1,111 51.8; 21.3 11.5 111.5
Migar 32 64 ¡la ¡97 399 605 603 633 6178 28.8 29,3 11.1 26.3SoaIta 1? 121 230 525 114 ¡ ,027 ¡ .151 1 .236 1 ,233 25.3 2b.1 13.6 25.1Sudan 301 453 1,235 2,295 3,802 4,541 5,111 5,68s2 5,63,9 31.9 25.7 111.7 26.9
Tanganía 250 461 803 1,371 2,011 2,189 2,391 2,584 2.594 26.5 19.ii 1.0 19.4Togo 40 S8 120 644 924 855 819 803 6559 24.4 56.7 -1.1 30.27.ambla 63 74 1,142 ,64 2,185 2,230 2.378 2,618 2.719 21.1 3.0 6.6b 12.9
Subtotal ].889 2,601 4,609 8.390 13.433 15.623 17,317 18,825 18,868 19.6 23,8 9.0 23.8
Gihar IDA-aíigíblecount r ea
8oa-kicna 21 31 61 186 301 313 344 393 407 241.0 38.5 8.1 2e.'.BurundI 2 8 18 10 141 151 201 292 314 16.0 5,7,2 26.4 39.1Central Afrírso Rep. 24 55 71 lit 160 190 209 216 1?4 245.8 16.7 8.3 17.8
Chad 32 39 61 194 202 ¡56 123 LIS 1349 l1'J 76.9 -14.2 13.6EtI.iopia 169 256 344 si] 701 96,4 1,038 1,272 1.384 1".7 15 1 17.3 16.4Ghana 495 116 689 81<0 1,1(t0 J,114 1,121 1,141 1.1322 $.í (k.1 0.6f 6.5
Guinee 312 6t02 759 9294 1,029 ¡.258 1,242 1,241 1,168 <9.1 6.8 7.4 9.4Ouínea-Bísiaa, 0 0 1 44 104 2111 132 ¡4 149 .. - 65.1 102 M Keny4 ¡19 489 604 1,382 2,216 2,316 2,428 2,193 2,633 15.4 30.S1 3.9 19.1
Leisotho 8 8 14 13 63 11 lis ¡34 ¡34 9.3 38.1 23.0 26.8Malawi 122 202 251 504 647 682 706 119 731 16.6 211.6 3.0 15.1Rlvanda a 8 24 99 <56 111 189 220 244 12.2 4.2.9 12.2 46.2
Senegal 100 178 304 640 926 989 1,236 1,498 1,555 25.4 21.4 15.6 22.3Sterra Leon 59 90 ¡49 243 336 358 332 361 342 7<., 18.2 M. 15.4Uganda 130 171 212 363 603 540 602 623 675 9.5 24.7 3.8 13.6ZaIre 311 904 1,718 3,579 4,165 4,126 4,049 4,374 4,084 44.7 19.9 0.-- 21.4
Subtotal 2j119 3,162 5,300 9,755 12,850 13,503 14,110 15,084 15,297 21.3 20.2 4.7 16.5
Total: IDkAIett8ibe countries 4,009 6,362 9,909 18,145 26,2831 29,125 31,427 33,909 34,165 2'3.él 21.9 1.0 18.6
Otl.ar coentrita
Camernoo ¡31 231 312 1,L85 2,049 2,036 1,945 1,826 1,718 72.1 42.6 -4.3 25.1lwory CoaBt 256 582 943 2,B30 4,347 4,393 4.947 4,826 4,835 29.0 38.1 3.1 26.6NIgerta 480 1,151 1,101 2,360 4,369 6,141 9,011 12,133 11,915 21.9 401.4 30.8 27.2Ziolbabve, 233 221 190 418 697 880 1,218 i,522 1,446S -3.4 38.4 2 2,2 17.3
Subtotal 1,100 2,197 2,606 6,793 11,462 13,451 17,122 20,512 19,63' 20.4 39.5 ¡6>.4 25.8
Bnotsana 15 ¡15 147 121 152 165 211 23.1 2765 5l.6 -2.5 16>.6 14.8Congo 144 238 423. 816 ¡.132 1,214 1,518 1,511 1,396 23.9 23.6 él.1 2rl1.4G.abon 91 346 791 1,335 1,356 1,042 810 129 725 551.? j.2 -14.9 15.9Naurittus 32 35 46 156 296 329 363 320 354 S,I5.9 3.6 24.9S~azland 37 37 34 105 166 162 110 ¡83 1781 -<# 41 2.7 16.9
Subctoal 318 771 1,447 2,593 3,101 2,972 3,131 2,981 ,9830,9 R ?,3 9.2 2í.5
Total: Olber cou11trie.. 1,418 2,969 4,053 9,386 14,563 16,422 20 253 1¡,0.4 22.76,2 74.6 7.3 1 3.3 2¿.2
TOTAL. 5,427 9.330 13,962 27,531 40,846 45,547 51, 6911 5- 402 56,92i 2-7 . .2 9.4 201.4
Niote: Data are for tha cod Of II.Year. Angola ano qpzaabfque are excludad frol. ail the table.i In Appadtx A h,rsusem romprehe-nsíve d'.'e are nol ag*1sbI-.,a. Period growt:h ratea £annot be ealculatad beausne thar, vas no dabt ¡a ¡970.
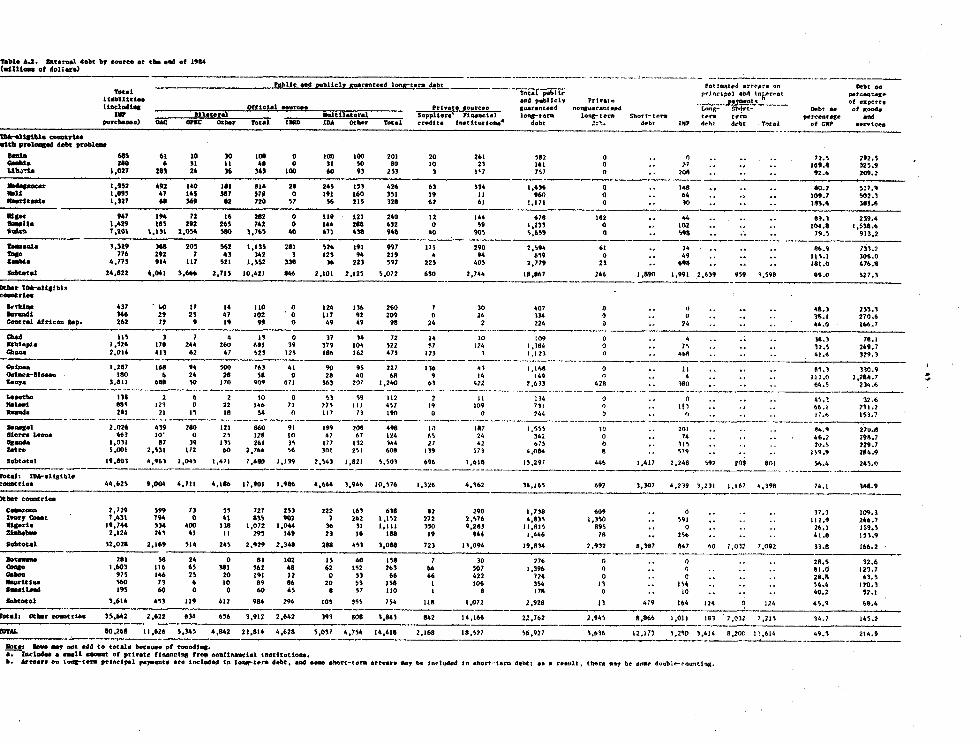
?sb1. 8.2. 89te~oe1 debt by coe." st tbb sed .f 1084
(aríllima, of dol*¡6e)
N610o. cd ~s141.1 .cc0000ed Ioo2wttml, ______ _____t___ f*tíe,tc,1 orrOAe On t¡t e.
144*1181..d .04*, "10 o-at. ...101 h..... t.,c'0ot.,, of C2pOOt01oZi1od1ee O:0OtOcíl.oeeoe .i 1,50. .oooe eofsted lnooBe1.o¡e8d toof S1,on- 8--- oc of eod.
pu.eo68so 060 0880 0M¡r total I*18 104 06. Totel -- d1ta ¡o.tit.tions debo i1 4.ht r87 4.5 deS;c To.al of 139 -e,000o
28f5116e ceostiee,368 Proleqe del prob1am
Beoda 680~~~~~~(4 61 20 30 ¡00 O 100 ¡00 201 20 261 582 0 t]5 .. . . 72.5 292.$~~~b1. ~~~~~~~280 46 31 al 68 0 II so s0 lo 23 161 0 2. 7 ., . . 69,8 325.9Ub.~~~~~t. 1~~~b,027 21 2 6 3 24 534 100 60 93 253 3 l-7 757 0 . 209 . .. . 92.65 209.2
Uedqe.e 1,952 492 *40 ¡al 814A 28 2415 131 426 69 334 ¡.66 0 .. 14B . . .8. 517.1h20 1,093 47 ¡63 387 379 0 *91 ¡60 351 ¡9 II 960 13, 64 5. . .¡2. 02.3Nasoecei ¡1,27 68 369 82 720 57 36 2*3 328 162 61 1,171 0 lo 3 .. .. .. 13.6 283.6
965.0 947 ¡96 72 *6 202 0 ¡le ¡21 260 12 146 478 167 . 44 .. . .81.3 239.4GesIl. 1,429 ¡8s 292 263 742 0 144 288 432 0 59 1,233 3 . 102 .. . . 04.0 ,3,
11~ ~~~~7.203 ¡.j31 2.034 m8 3.763 40 633 458 968 60 "05 5,659 0 . 59 ., . .79.5 313.2
U-*«& ~~~1,129 368 203 362 1,131h 281 326 ¡9* 99 ¡7 290 2.594 61 .. 26 ., . .8.9 133.?loe. 776 292 7 40 342 3 323 64 219 4 94 359 0 .. 49 .. .. .. 35.¡ 396.0¡~a,í 6,773 9*4 117 321 1,332 338 361 223 597 223 405 2,779 21 .. 6981 .. .. .. 8.0 476.01*~*t*¡s 24.022 4.041 3.646 2.713 ¡0.421 846 2,10* 2,125 3.072 610 2,744 18,867 246 180 1,991 2,6-39 959 1,598 99.0 537.3
Xt,lb. od.-e11b1oo~to0c
8B,STmg. 437 40 17 14 ¡l0 0 ¡24 ¡36 260 y 30 607 0 .. I . . . 48.3 235.3hoed 346 29 23 47 102 0 L17 92 209 ¡1 24 334 3 .. .. . . 6 270.6Csetg"a láioeelep. 262 72 9 ¡9 99 0 49 49 98 24 2 224 3 .. 4 ,. .. .. 6.Q 166.7
Cb" ~ ~ ~ ~ ~ lS 3 y 4 11 0 17 14 72 ¡4 l0 ¡09 0 .. 4 .. .. .18. 781.1ftb¡cpte 1.826 ¡78 264 260 68* 39 179 ¡09 522 si ¡76 ¡1914 0 .. 7% .. . . 2.5 269.7Ob.. 2.314 411 63 47 571 ¡25 ¡86 ¡62 473 ¡23 1 1,175 . 469 .. .. 41.t 379.3
Cefo... ¡~~~~ ~~.287 ¡68 94 500 76> 6¡ 90 95 227 11e. 43 t.168 0 .. I . . . 5.1 310.9Ceises-Ilsee. ¡90~~~te 6 24 28 sa 0 28 40 68 9 *4 ¡69 0 .4 .. . . 1,0 1,286.7
£ee~~~~~~c ~~3.811 688 l0 170 909 671 16> 20.7 1,240 65 422 2,433 429 - . 18 . . . 64.5 3.
¡4900110 ~~~~ ~ ~~136 2 6 2 10 0 si 59 ¡12 2 II 154 0 . .. . . 45.3 32.6NelasO 895~~~~~~de ¡23 0 22 146 71 277 ¡lb 457 ¡9 ¡09 711 0 .. H ,. .. .. 4.1 251.2
Recod 281 21 ¡1 la 36 6 ¡¡7 71 ¡90 3 a 244 3 .. < . .. . 5615.7
88.88.1 ~~~~~~2.026 439 780 ¡21 84O 91 199 208 498 *3 ¡87a 1,555 10 .. 201 ,. . . 4.9 273.880., Lec,e 401 10, 0 25 ¡28 10 47 67 ¡24 3,5 24 342 0 .. 74 .. . .44.2 298.7Og~d 1,031 87 39 lis 26* 35 177 112 144 27 42 475 t . 315 . , . 20.5 229.7¡sOte 3,001 2.531 ¡72 60o 2,764 56 10* 251 608 ¡19 573 4,064 8 .. 579 .. . . 59.9 264.9
80b4otel 19.801 4,961 1,045 1.471 7.480 1,139 2,543 1,821 5,501 6,96 ¡.6*8 ¡3.297 446 1,417 2.249 592 709 801 54.4 265.0
oct4u44,625 9,00 4,7*1 4.186 17,90 ¡.986 4,644 3,946, 10.576 ¡.326 4.362 34,i65 492 5,307 4.239 3,231 1,¡37 4,3991 74.1 568.9
co,eee2,729 399 73 35 727 233 222 ¡63 618 82 290 1,738 309 .. O . . . 12.3 109.3Ivawy tae 7,65* 396 0 61 83', 902 7 262 1,132 222 2,5.76 6,83% ¡.350 .. 59 .. .1.¡2.9 366.28ageio4 ¡9,744 334 400 ¡38 1,072 3.044 36 31 ¡.,m 550 9,283 ¡¡.815 895 .. .. .. ... 1 109.5Z~0b0e 2,124 741 43 II 293 149 21 *6 ¡88 19 944 1,646 78 . 214 -... 41.9 ¡31.9
IB~41. 32,028 2,169 314 245 2,929 2,348 9 493 2,.088 723 ¡3,094 ¡9,834 7.932 8,318 647 4,0 7,032 7,092 35.8 166.2
8.8.18. 281 8 24 0 8* 102 13 40 158 7 30 776 0 .. O.. . 29i.5 32.6Ceo* 1.603 *16 63 58* 362 48 62 152 263 64 507 ¡.396 0 .. .. . .1.0 121.7Caens 97S ¡66 21 20 *9* ¡2 0 53 66 46 422 724 0 .. O . . . 281.8 *3.5*WrIticc 50 71 6 10 89 86 20 33 ¡381 1 ¡06 354 ¡3 ,. 54 .. . . 4.6 110,SuadUed ¡93 80 0 0 60 43 a 37 110 ¡ 8 ¡76 0 lo 1 .. , . 0.2 32.1
9.68t8. 1,614 653 ¡19 4*2 984 294 103 303 734 ¡18 ¡.072 2,920 ¡3 479 ¡6 124 0 124 45.5 49.4
roto13 OtI.o wecetría* 33,642 2,622 634 656 3,9*7 2.,442 191 B06 5.843 842 ¡6,164 22.762 2.945 8,866 1,011 ¡83 7,032 7,215 14.7 143.2
810,2658 11,626 3,345 4,842 23,814 4,628 3,037 4,734 14,418 2.168 ¡8l.337 54,927 3.b63 *2.172 5,250 3.414 3.200 106449.5 2*4.9
e. moletd. a cmcli MOct *t pOicto. <1*800In frm o9 eeefíe.. t .etOtotlo.e.b. Lroecr. oc 1088-.0 Ptte04pc pay*caco arelled¡o ¡ocg4 " ~.r.o debt. c,.d oc~ .*~t-teom ~y80e. h. le-Ided 10.6#*rt-t.0 debO: coe r.Colt 7,1, ttlar .,t coedob.ocol
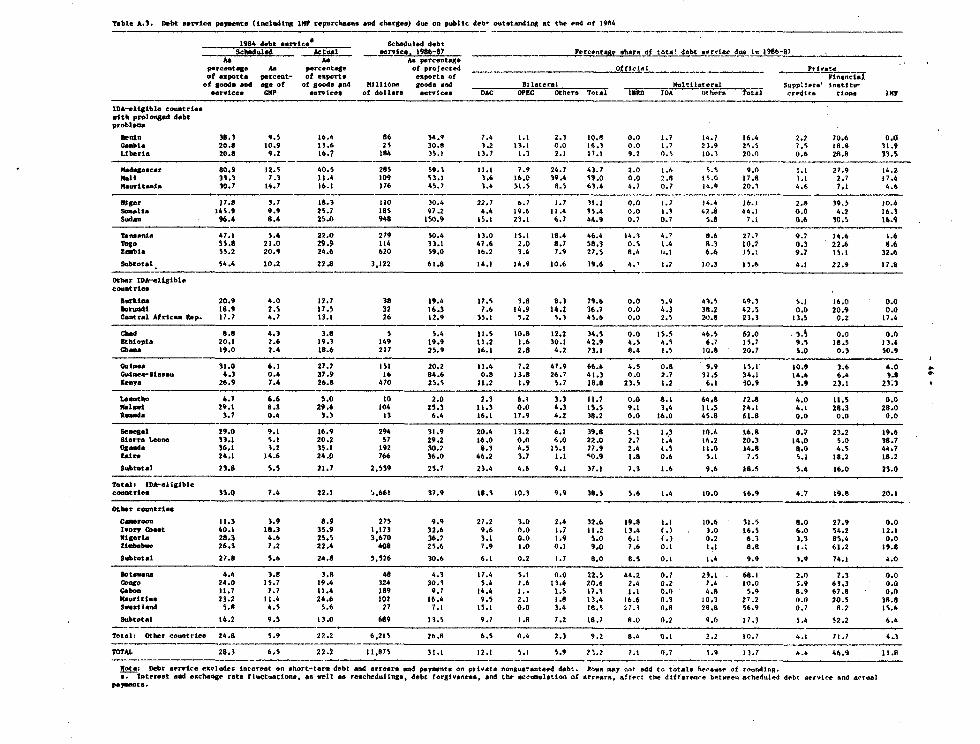
Table A 1. Debt eerricef palmants (latrgodíng 7tIF reporcha nwd cUergeo) 4ue on pubitc deb- outatrapttrg 4t che en4 of 1984
1984 debt ""lee Scbedulod 4*bt_sebeduled mettsi42 _ e_.7tt 1986-87 Percont4aRt sb4re oí total debt eervtee due In 19bó-87
A4 Ao An percentegep-rcentxgs AA perecntace of projaferd _ _ ,_ Oflli _ P Y t¿_of OxporUe p rcent- of exporte export. of Flvinenetii
of good *nd *Se of of goode pa4 Militóa, goode end DILAter l IltugletersLsipilr Instíttu*arytceo CYP *rvlees of d.11tro *."le* DAC VPESC 0ther. TotAl 1131t IDAb thr O tth ~d4r. enon llO'
IDA-e11gib7e cottrteswttb prolonged 4*bt
problerJ
Ibenti 3B.3 9.5 16.4 06 34.9 7.4 1.1 2.1 IQ.8 0.0 L.7 14.7 16.4 2.2 70.b O.Cii:_Uo 20.8 10.9 13.6 25 30.8 1.2 ll.l 0.0 16.3 0.0 ¡.y 23.S 2s.s 7.5 ¡0.0 31.SLlbbirl 20.8 9.2 16.7 184 3S 1 13.7 1.3 2.1 17.1 9.2 O.S IO.S 20.0 0.b 28.8 13.S
Kad4ge4ear 80.9 12.S 40.5 285 59.7 ll.l '.9 24.7 43.7 2.0 L.6 S.S s.o s.l 27.9 14.2Ka1i 11.3 7.1 11.4 109 53.1 3.6 16.0 39.4 S9.0 O.Q 2.8 IS.O 17.8 1.1 2.7 17.4t4auritCnt 10.7 14.7 16.1 176 45.7 1.4 Sl.S 8.5 63.4 4 7 0 7 ¡4.9 20.3 4.b 7.1 4.6
Illg r 17.8 S.J l8.3 llO 30.4 t2.7 b.7 1. 31.1 0.0 1.7 14.4 18.1 2 .3 39.5 10.4Soí{^ 14S.9 9.9 25.J laS 97.2 4.4 19.6 1 1.4 3S.4 0.0 .1. 42.8 44.1 0.0 4.2 16.1sv44n 96.4 8.4 2S.0 948 1S0.9 IS.I 21.1 6.t 44.9 0.7 0.7 5.8 7.i 0.6 lO.S 16.9
Smnnsnt 47.1 5.6 22.0 279 50.4 13.0 IS.I 18.4 46.4 14.3 4.' S.h 27.7 9.7 '14.6 1.6Toco 55.8 21.0 29.9 114 33.1 47.6 2.0 8.7 58.3 O.S 1.4 8.3 10.2 0.3 22.6 8.62rnbte S5.2 20.9 24.6 620 59.0 Ih..2 1.4 7.9) 27.5 8 IJ.I 6.t IS.t 9.7 IS.I 32.t
Subtotal. 54.4 10.2 22.0 3 122 61.8 14.1 14.9 lO.b 19.6 4.' 17 10.3 15.h 4.í 22.9 17.0
Ocb r ID-e14gtblecratrtee
Busktme 20.9 4.0 12.t 38 19.4 IT.S 1.8 8.3 2S.6 0.0 5.9 41.5 44.1 51.1 16.Q 0.04ureit 18.9 2.5 IT.S 32 16.3 7.6 14.9 14.2 36.7 0.0 4.3 38.2 42.5 Q.O 20.9 o.eCentral Afrtcea Rep. 17.7 4.7 13.1 26 12.9 35.1 5.2 5.3 4S.6 0.0 2.5 20.8 23.3 13.S 0.2 17.4
Che4 8.8 4.3 3.0 5 S.4 II.S 10.8 12.2 34.5 0.0 IS.S 46.5 62.0 1 .S O.Q 0.0Ittbiopta 20.1 2.6 19.1 149 19.9 11.2 1.6 30.1 42.9 4.5 4.5 6j.7 15.7 9.5 3c.s 11.4I:hau 19.0 2.4 18.b 217 25.9 16.1 2.8 4.2 23.1 8.4 1. 10.8 20.7 S.O 0.3 50.9
Golpe* 11.0 6.1 27.2 ISI 20.2 1".4 7.2 47.9 66.4 4.5 0.8 9.9 15.1 10.4 3.6 4.0 Catae*_»tooe 4.3 0.4 27.9 16 84.6 0.8 13.8 26.7 41.3 0.0 2.7 11.5 34.1 14.4 6.4 1.8 geoy 26.9 J.4 26.8 470 25.5 I1.2 1.9 S.7 18.8 23.5 1.2 (J.1 30.9 3.9. 23.1 23.3
Le ottro 4.7 6.6 S.O lo 2.0 2.3 6.1 1.3 11. 0.0 8.1 .64.8 J2.8 4.0 11.5 0.0mIhl 29.1 8.1 29.4 104 25.3 11.3 0.0 4.3 IS.S 9.1 3.4 II.S 74.1 4.1 20.3 20.08odF 3.7 0.4 3.3 13 6.4 16.1 17.9 *.2 38.2 0.0 16.0 45.8 61.8 0.0 0.0 0.0
Senstal 29.0 9.1 16.S 294 31.9 20.4 13.2 6.1 39.8 S.l 1.3 10.4 íM.a 0.7 23.2 19.6sierra beone 3.3. S.l 20.2 57 29.2 16.0 0.0 6.0 22.0 2.7 1;4 16.2 20.3 14.0 5. 0 3.7caOft nd6.1 1.2 35.1 192 30.2 8.3 4.5 IS.I 27.9 2.4 1.5 ll.O 14.8 8. 4.5 44.72 tre 24.1 14.6 24.P 76b 36.0 46.2 3.7 1.1 50.9 1.8 0.6 5.1 7.5 5. l0.2 18.2
Sabtotal 23.8 5.5 21.7 2.539 25.7 23.4 4.6 9.1 37.1 7.3 1.6 9.6 18 S 5.4 16.0 23-0
Total: íDt"ligílbleco~atieo 35.0 7.4 22.1 5.661 37.9 18.1 10.1 9.9 38.5 5.6 1.4 10.0 16.9 4, 7 39 20.1
Other coutrteo
Cseroon 11.3 3.9 8.9 275 9.9 27.2 3.0 2.4 32.6 19.S i»1 10.6 31.5 8.0 27.9 0.0lVTor Cact 40.1 18.3 35.9 1.171 32.6 9.6 0.0 1.7 11.2 13.4 .) 3.0 146.5 6.0 54.2 12.1ñt8 rto 28.3 4.6 25.5 3 670 36.2 3. 0.0 1.9 5.0 6.1 () 0.2 h.3 3.1 85.4 0.02tbue 26.3 7.2 22.4 408 25.6 7.9 1 .0 0.1 9.0 7.ñ 0.1 111 8B.8 '-' 61.2 19.8
Subcotel 27.8 S.h 24.8 5.526 30.6 6.1 0.2 1.7 B.o 8.5 0.1 '-4 9.9 3.S 74.1 .4.10
80to 4.4 3.8 3.8 48 4.3 17.4 5.1 0.0 22.5 44.2 0.7 23.1 - b8.1 2.0 7.3 0.0«nW# 24.0 15.7 19.4 324 30.3 S.4 1 6 11.6 20. 6 2.4 0.2 7.4 10.0 S 9 63.3 0.0C bont 11.7 7.7 11.4 189 9.1 14.4 1. 1.5 17.1 1.1 0.0 4.8 5.9 8.9 67.8 0.0Itauritluo 23.2 11.4 24.h 102 16.4 9.5 2.1 1.8 13.4 Ih.6 0.1 10.3 27.2 0.0 20.5 38.8Svactlend S.8 4.5 5.6 27 7.1 15.1 0.0 3.4 18.5 i7.t 0.8 28.8 56.9 0.7 8.2 1S.h
Sabtotal 14.2 9.5 13.0 689 ll.S 9.7 I.ñ 7.2 18.7 8.0 0.2 9.0 17.1 5.4 52.2 6.4
Total: ettwer countríce 24.8 5.9 22.2 6.215 2b.ñ 6.5 0.4 2.1 9.2 0.4 0.1 2.2 10.7 4.1 71.7 4.3
TOTAL 2S.3 6.5 22.2 11.875 31.1 12.1 5.1 S.9 ?3.2 7.1 0>.7 5.9 13.7 4.4 46.9 11.8
tiot-: Debt oerrvíe excludes interese on bhort-term debt enn4 rreero *nd p 7seto on prí.ate nonguerantet-d debt. te MAY* .. t ádd c. totul ner,sus of roundl.R.;-. nterept *nd exchanse rete fluctustioen eo we11 *s reuchedultngs debt forgtvences, end tbr eceuuletton of arreara aff-ct the dtfferon,e bet~een ochoduled dobt servce .. id 41,inal
pA~_td.
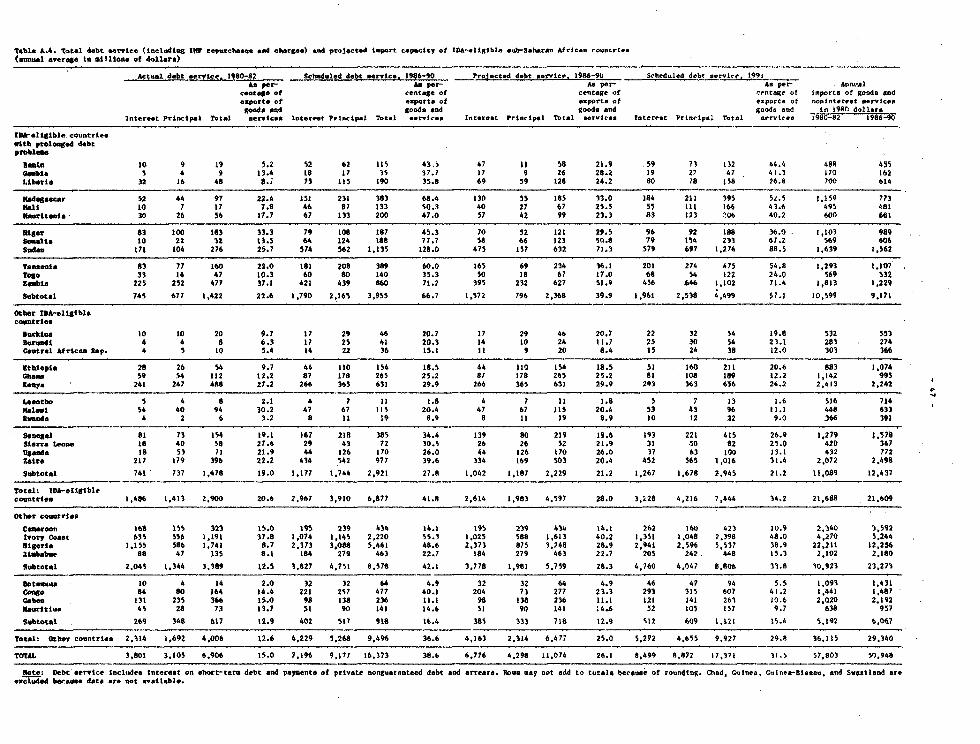
t bl- 4.4. Total debt *ece .<neludáao *13 repor t es sad ít,gea) dm projeeted tmport cpaottp of IDA-eitglbie *ob-9-be afrio. 'oootrte.<auml o0erte tu *lliton of ¿ollar.>
AMtul dabt ser* ce. 1980-82 Schoduled debt ervioe. 1986-90 Prletd dbt srvie. 1986-91> S hed.led 4eb, o.rvioe. 9I91As par- LA par- As per- *o par- ovi
reataG of ent.5e of entage of Onta3eg o1 $.porto of gooda andexporto of exporto of exporta of exporte of aoni.tera.t *ervicesgnod nd goode *nd goods and 4odol ond In 1980 dollart
Interear prioepaI l.tal aerwoea loeremO Procípial Total or---o Intereot Prnclpael Tbtotal rvloaa Tnterfet PVI-rlipl Total oervt ed 9rO-82 1986-10
ID&-eIígtble countrtaeitíh prolonged debt
problm
Eamn l0 9 19 5.2 52 62 115 43.5 47 ¡1 58 21.9 59 73 t32 44.4 4B8 455Gmbia 1 4 9 13.4 18 17 35 37.7 17 9 26 28.2 19 27 47 41.3 ¡70 l62LIberia 32 16 48 0.7 75 115 ¡90 35.8 69 59 128 24.2 80 78 158 26.8 700 614
Ksd aaoar 52 44 97 22.4 151 231 383 68.4 130 55 185 13.0 ¡84 211 395 52.5 1,159 7Z3mli 10 7 17 7.8 46 87 ¡33 50.3 40 27 67 25.5 55 1ll 166 43.6 495 481
lnaritaoia 30 26 56 17.7 67 133 200 47.0 57 42 89 23.3 83 123 206 40.2 600 661
mluer 83 100 183 33.3 79 ¡08 187 45.3 70 52 ¡21 29.5 96 92 188 36.0 1 ,103 989Soalt l0 22 32 13.5 64 124 188 77.7 58 66 123 5(.8 79 154 233 67.2 569 606Soda. 17 104 276 25.7 574 562 1.135 128.0 475 157 632 71.3 579 697 1,276 88.5 1,639 1,562
Sansenia 83 77 160 22.0 181 208 389 60.0 165 69 234 16,1 201 274 475 54.8 1,293 1,107Togo 33 14 47 10.3 60 80 140 35.3 50 18 67 ¡7.0 68 54 122 24.0 569 532Z4 bia 225 252 477 37.1 421 439 860 71.2 395 232 627 51.9 456 646 1,102 71.4 1,813 1,229
3nbtotel 745 677 1,422 22.6 1,790 2,165 3,955 66.7 1,572 796 2,368 39.9 1.961 2,538 i,499 57.1 10,599 9,171
0ther IDM-elCIblecontriae
Brkina lo lo 20 9.7 17 29 46 20.7 17 29 46 20.7 22 32 54 19.8 532 553Onrundi 4 4 8 6.3 17 25 41 20.1 14 ¡0 24 11.7 25 30 54 23.1 283 274Central &fríes* Rep. 4 5 lo 5.4 ¡4 22 36 15.1 11 9 20 8.4 15 24 38 12.0 303 366
ethlopie 28 26 54 9.7 44 llO 154 18.5 44 3lO 154 18.5 51 160 211 20.6 883 1.074nau 59 54 112 12.2 87 ¡78 265 25.2 el 178 265 25.2 83 108 189 12.2 1,142 995
Kenya 241 247 488 27.2 284 365 631 29.9 266 365 631 29.9 293 363 656 24.2 2,413 2.242
Ltsohta 5 6 8 2.1 * 7 11 1.8 4 7 a1 1.8 5 7 13 1.6 516 714maiam 54 40 94 30.2 47 67 lIS 20.4 47 67 115 20.4 53 43 96 l¡.l 448 633
gumod. 4 2 6 3.2 8 la 19 8.9 8 11 39 8.9 10 12 22 9.0 366 391
Senegal 81 75 ¡54 19.1 167 218 385 34.4 139 80 239 19.6 193 221 415 26.9 1,279 1.578Sierra L,ono ¡8 40 58 27.6 29 43 72 30.5 26 26 52 21.9 3 s50 82 25.0 420 347lganda 18 53 71 21.9 44 126 170 26.0 44 126 170 26.0 37 63 I00 13.1 432 772Zaite 237 179 396 22.2 414 542 977 39.6 334 169 503 20.4 452 565 1,016 31.4 2,072 2.498
Subtotal 741 737 1,478 19.0 1,177 1,744 2,921 27.8 1,042 1,187 2,229 21.2 1,267 1,678 2,945 21.2 11,089 12,437
Total: ¡D-eligíblecountriea 1,486 1,413 2,900 20.6 2,967 3,910 6,877 41.8 2,614 1,983 4.597 28.0 3,128 4,236 7,444 34.2 21,688 21.609
Other conotrice
Cmeroon l68 155 323 15.0 195 239 434 1¡.1 195 239 434 14.1 262 160 423 10.9 2,140 3.592tiory Coaet 63S 556 1,191 37.8 1,074 1,145 2,220 55.3 1.025 588 1,613 40.2 1.351 3,048 7.398 48.0 4,270 5.244llgeria 1,155 586 1,741 8.7 2,373 3,08B 5,461 40.6 2,373 875 1,748 28.9 2,941 2.596 5,537 38.9 22,211 12,2562iebmbee 88 47 135 8.1 184 279 463 22.7 184 279 463 22.7 205 242 448 15.1 2,102 2,180
Sobtotml 2,045 1,344 3,389 12.5 1.827 4,751 8,578 42.1 3,778 1,981 5.759 28.3 4,760 4.047 8.806 33.8 10,923 23.273
motwaou l0 4 14 2.0 12 32 64 4.9 32 32 64 4.9 46 47 94 5.5 1,093 1,431CnO 84 80 164 14.4 221 257 477 40.1 204 73 277 23.3 291 315 607 41.2 1,441 1,487GCbon 131 235 366 15.0 98 138 236 l1.l 98 138 236 13.l 121 141 261 10.6 2.020 2,192narittiu 45 28 73 13.7 S1 90 141 14.6 51 90 141 :4.6 52 l05 157 9.7 638 957
Subtotal 269 348 617 12.9 402 517 l6 136.4 385 333 718 12.9 512 609 1,121 15.4 5,192 6,067
Total: Other conotriea 2.314 3,692 4,006 12.6 4,229 5,268 9,496 36.6 4,163 2,314 6.477 25.0 5,272 4,655 9,927 29.8 36,315 29,340
TOTAL 3,801 3.105 6.906 15.0 7,196 9,177 16,373 38.6 6,776 4.298 11.074 26.1 8,499 8,S72 17,371 31.5 57,803 50,948
Note: Debt servi.e Incli,des ntereat o00 hort-tero debt tad peynente of private nongueranteed delt mnd arreare. toes *ay cot edd to total$ becoase of roundíng. Chad, GuIneo, Goove-8¡sa, 3ad Suesiland ero*¡aluded berease dota gre onot avalable.
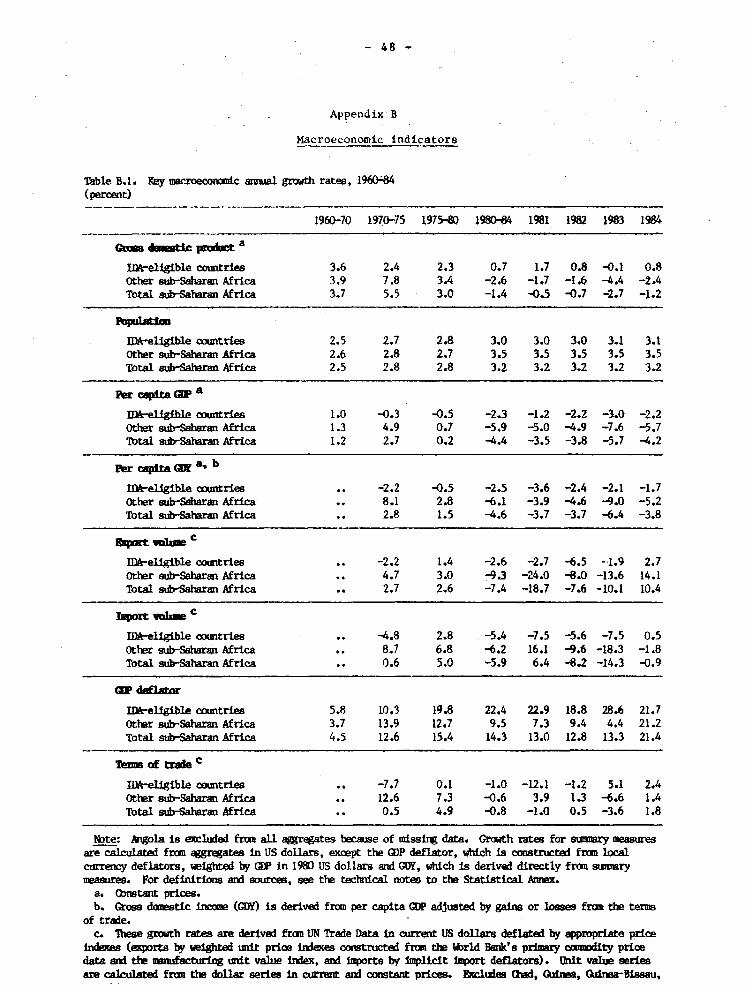
- 48 -
Appendix B
Macroeconomic indicatore
Table B.l. Ry macroeco c aual gmwth rates, 1960-84(percent)
1960-70 1970-75 1975-&) 198-4 1981 1982 1983 1984
1 dtIc pm a
Mlk-el1g1ble c tries 3.6 2.4 2.3 0.7 1.7 0.8 -0.1 0.8Other sub-Sar Africa 3.9 7.8 3.4 -2.6 -1.7 -1.6 -4.4 -2.4Total d-Saharan Africa 3.7 5.5 3.0 -1.4 0.5 -0.7 -2.7 -1.2
lM ~ellgible aoitries 2.5 2.7 2.8 3.0 3.0 3.0 3.1 3.1Other ~uh-SaaraM Africa 2.6 2.8 2.7 3.5 3.5 3.5 3.5 3.5Total sub-Sahua Africa 2.5 2.8 2.8 3.2 3.2 3.2 3.2 3.2_ _ _ a
IlY-el~le ountries 1.0 -0.3 -0.5 -2.3 -1.2 -2.2 -3.0 -2.2Other sut-Sabaran Africa 1.3 4.9 0.7 -5.9 -5.0 -4.9 -7.6 -5.7Total sub-Sabaran Africa 1.2 2.7 0.2 -4.4 -3.5 -3.8 -5.7 -4.2
Per CM a- b
Ifk--l1g~ble «z¡ntries .. -2.2 -0.5 -2.5 -3.6 -2.4 -2.1 -1.70ther sub-Saharan Africa .. 8.1 2.8 -6.1 -3.9 -4.6 -9.0 -5.2Total sub-Saharan Africa .. 2.8 1.5 -4.6 -3.7 -3.7 -6.4 -3.8
~xt Vd~¡ e
IDr-eliWible couxtries .. -2.2 1.4 -2.6 -2.7 -6.5 --1.9 2.7other aub-Saharon Africa .. 4.7 3.0 -9.3 -24.0 -8.0 -13.6 14.1Tbtal sub-Saharan Africa .. 2.7 2.6 -7.4 -18.7 -7.6 -10.1 10.4
~ _ y~ e
IDkreligible =mtries .. -4.8 2.8 -5.4 -7.5 -5.6 -7.5 0.5Ot1er sub-Saharan Africa .. 8.7 6.8 -6.2 16.1 -9.6 -18.3 -1.8Total sub-Sablran Africa .. 0.6 5.0 -5.9 6.4 -8.2 -14.3 -0.9
QP der
IDA-eligíble countrles 5.8 10.3 19.8 22.4 22.9 18.8 28.6 21.7Other sub-Sabaran Africa 3.7 13.9 12.7 9.5 7.3 9.4 4.4 21.2Total stjb-Saharan Africa 4.5 12.6 15.4 14.3 13.0 12.8 13.3 21.4
Tenm of eC
IDA-e~igible coutries .. -7.7 0.1 -1.0 -12.1 -1.2 5.1 2.4Other sub-Saharan Africa .. 12.6 7.3 -0.6 3.9 1.3 -6.6 1.4Total sub-Sarari Africa .. 0.5 4.9 -0.8 -1.0 0.5 -3.6 1.8
bte: Angola is exclude fron all aggregates becauee of missing data. Grawth rates for sumary measuresare caLeulated from agrgates In US dollars, exrept the CDP deflator, which is omstructed fron loacurreccy deflators, weigted by CDP in 1980 US dollara and GrY, which is derived directly fron samauryseaaires. For definitions and aources, me the technical notes to the Statistical Annex.
a. Cbnstant prices.b. toss damiRtic inxmme (GDY) ls derived from per capita CDP adjusted by gains or loses fra the terns
of trade.c. These grawth rates are derived from UN Trade Data in cornzt US dollar deflated by appropriate price
indexes (exports by welghted unit price Indexes constructed from the Wbrld Bank's primary cmnmodity priced<at antd tfe iiwnu£acturing unit value ir~ex, and ~imqorta by lmplicit Import deflators). Unit value s_riesare caleluU from the dollar series in current and constant prices. x1cudes Cad, QGnea, GbjnearBissau,
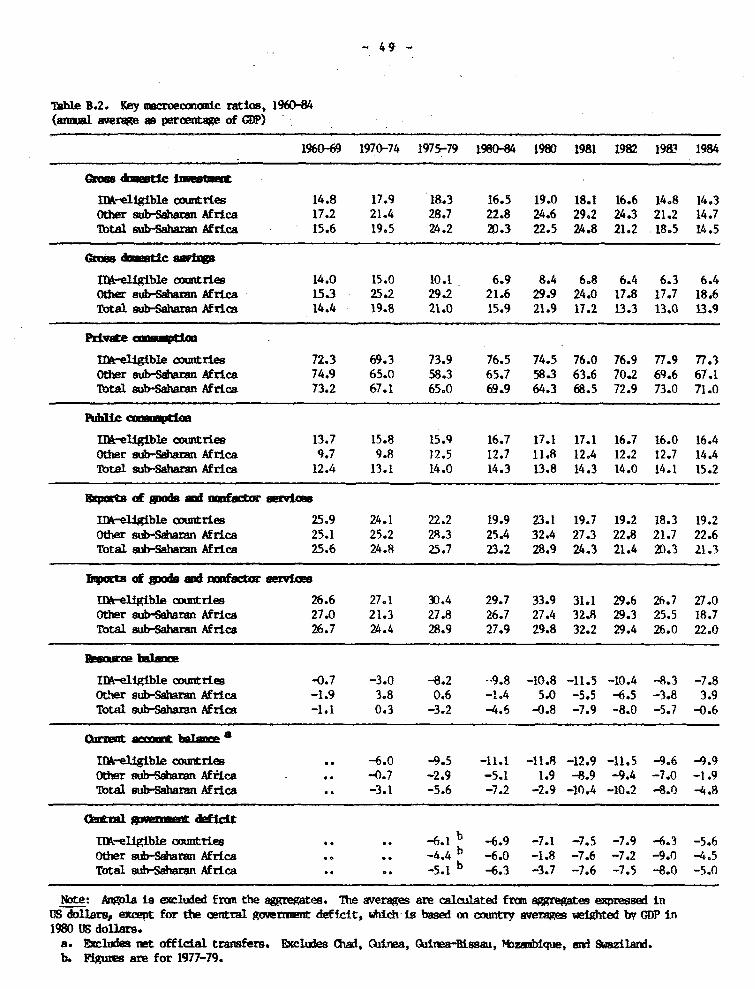
- 49 -
T~bie B.2. Key uauroenolc ratios, 1960-84(aml avere es percte of CDP)
1960-69 1970-74 1975-79 1980-4 1980 1981 1982 1983 1984
IDA-eltgible cuntries 14.8 17.9 18.3 16.5 19.0 18.1 16.6 14.8 14,3Other aib-Sian Africa 17.2 21.4 28.7 22.8 24.6 29.2 24.3 21.2 14.7Total ib-Saharan Afrfica 15.6 19.5 24.2 20.3 22.5 24.8 21.2 18.5 14.5
e~ d~d d~
IDA-~ible cantries 14.0 15.0 10.1 6.9 8.4 6.8 6.4 6.3 6.4Otier sub-Sah Africa 15.3 25.2 29.2 21.6 29.9 24.0 17.8 17.7 18.6Total sub-Sabaran Africa 14.4 19.8 21.0 15.9 21.9 17.2 13.3 13,0 13.9
fi-gible muntríes 72.3 69.3 73.9 76.5 74.5 76.0 76.9 77.9 77.3Other sub-Waran Africa 74.9 65.0 58.3 65.7 58.3 63.6 70.2 69.6 67.1Total aib-Sar Africa 73.2 67.1 65.0 69.9 64.3 68.5 72.9 73.0 71.0
_ -.. ._
Mk-e1igible amintries 13.7 15.8 15.9 16.7 17.1 17.1 16.7 16.0 16.4Other sub-Saharan Africa 9.7 9.8 12.5 12.7 11.8 12.4 12.2 12.7 14.4Tbtal sub-Saharan Africa 12.4 13.1 14.0 14.3 13.8 14.3 14.0 14.1 15.2
bts of ~i mm! mfg u
ITi ble oxmtries 25.9 24.1 22.2 19.9 23.1 19.7 19.2 18.3 19.2Oter sub-Sáan Africa 25.1 25.2 2R.3 25.4 32.4 27.3 22.8 21.7 22.6Total sib-Sabaran Africa 25.6 24.8 25.7 23.2 28.9 24.3 21.4 2D.3 21.3
~uqxKtS of gid am iafw urevan
ILk-el1gible countries 26.6 27.1 30.4 29.7 33.9 31.1 29.6 26.7 27.0Other subaran Africa 27.0 21.3 27.8 26.7 27.4 32.8 29.3 25.5 18.7Total aub-Saharan Africa 26.7 24.4 28.9 27.9 29.8 32.2 29.4 26.0 22.0
I-eligible countries -0.7 -3.0 -8.2 --9.8 -10.8 -11.5 -10.4 -8.3 -7.8Ot!er subSa~ara Africa -1.9 3.8 0.6 -1.4 5.0 -5.5 -6.5 -3.8 3.9
Totial sub-Sahamn Africa -1.1 0.3 -3.2 -4.6 -0.8 -7.9 -8.0 -5.7 -0.6
Or¡t ma= lmmia 8
tl-~eligible cantries .. -6.0 -9.5 -11.1 -11.8 -12.9 -11.5 -9.6 -9.9other sub-alharnm AfKca .. -0.7 -2.9 -5.1 1.9 -8.9 -9.4 -7.0 -1.9Total s aub ran Africa .. -3.1 -5.6 -7.2 -2.9 -10.4 -10.2 -8.0 -4.8
cm_wmm deficit
ID-eligible acuntries .. .. -6.1 b -6.9 -7.1 -7.5 -7.9 -6.3 -5.6Otier sub-Saharan Afrca .. 4.4 b -6.0 -1.8 -7.6 -7.2 -9,0 -4.5Total ahSahrn Africa .. .. -S.1 b -6.3 -3.7 -7.6 -7.5 -8.0 -5.0
Nte: ~ga la iewhc f ran the aggregates. The averages are calculated from aggregaes expressed inUS doAlIra, exopt for t1e ontral gowerorumt deficit, which i í based aon a try veges wet by GDP in1980 US dollar.
a. Exlim net off lca]. tranafers. BEblules Qai, Guinea, Ginea-Bissa, 1.bzaque, ad 9wazilard.b. us are for 1977-79.
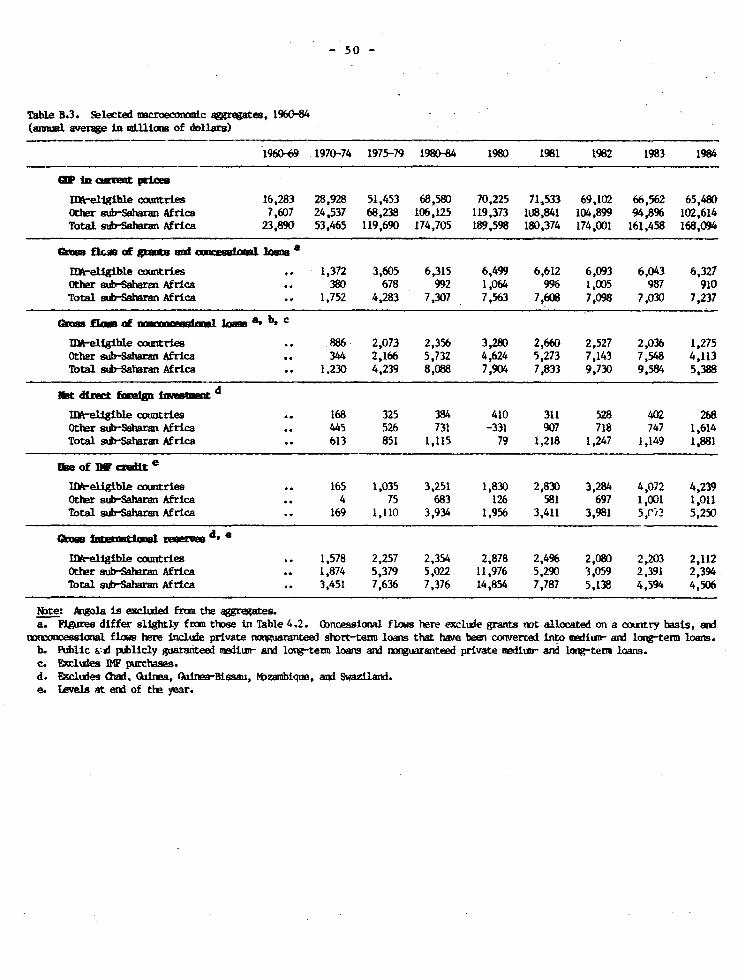
- 5 0 -
Taibe B.3. Selected macroeconnntc ggreates, 1960-84(amual averae Ln nUlixis of dollars)
1960-69 1970-74 1975-79 1980-84 1980 1981 1982 1983 1984
ap In awi p.
Mr~elzgíble ooumtries 16,283 28,928 51,453 68,580 70,225 71,533 69,102 66,562 65,480Other sub-Saharan Africa 7,607 24,537 68,238 106,125 119,373 108,841 104,899 94,896 102,614Total sub-Salurai Africa 23,890 53,465 119,690 174,705 189,598 180,374 174,001 161,458 168,094
fa oE goff a m* axms a
IDreligible ountrles ,. 1,372 3,605 6,315 6,499 6,612 6,093 6,043 6,327Other sub-Sa3rw Africa .. 380 678 992 1,064 996 1,005 987 910Total sub-Sabantn Africa .. 1,752 4,283 7,307 7,563 7,608 7,098 7,030 7,237
(hxsflo of _omms InXn a. h.
IIC-eUlgih1e countries .. 886 2,073 2,356 3,280 2,660 2,527 2,036 1,275Othar sub-Sabaran Africa .. 344 2,166 5,732 4,624 5,273 7,143 7,548 4,113Total sub-Saharan Africa 1.230 4,239 8,088 7,904 7,833 9,730 9,584 5,388
-et di~P> foelgniesten d
Inl-eligible countries .. 168 325 384 410 311 528 402 268Other sub-Saharan Africa .. 445 526 731 -331 907 718 747 1,614Total sub-Saharan Kfrica .. 613 851 1,115 79 1,218 1,247 1,149 1,881
be of ,r e e
Ml~-eligible countries .. 165 1,035 3,251 1,830 2,830 3,284 4,072 4,239Other sub-Saharan Africa .. 4 75 683 126 581 697 1,001 1,011Total sub-Sahar2n Africa .. 169 1,110 3,934 1,956 3,411 3,981 5,ri2 5,250
IIWrelWgible countries .. 1,578 2,257 2,354 2,878 2,496 2,080 2,203 2,112Other sub-Saharan Africa .. 1,874 5,379 5,022 11,976 5,290 3,059 2,391 2,394Total sdu-Saharan Africa .. 3,451 7,636 7,376 14,854 7,787 5,138 4,594 4,506
Nbte: Angola is excLxted frum the aggregates.a. Figuras differ sllghtly f ro those in Table 4.2. (bncesslonal flows here exclude grants not allocated on a country basts, and
tmooessa flo. bere incluie private noraateed short-term loans that have been comversed lnto uediu- anl longterm loass.b. Public &d publicly guaranteed nediun- ad log-term loansad rnuaranteed private nediun- and 1ongterm loans.c. bcludes IMF purchl.d. Deccludes Chdu, Ginea, lisBisa, bzambmique, and Swazil.e. Levels art eri of the year.

"4uu
.pw
1 ~~~uu19,m

»~ l>,c,Q /á ks./
_. -
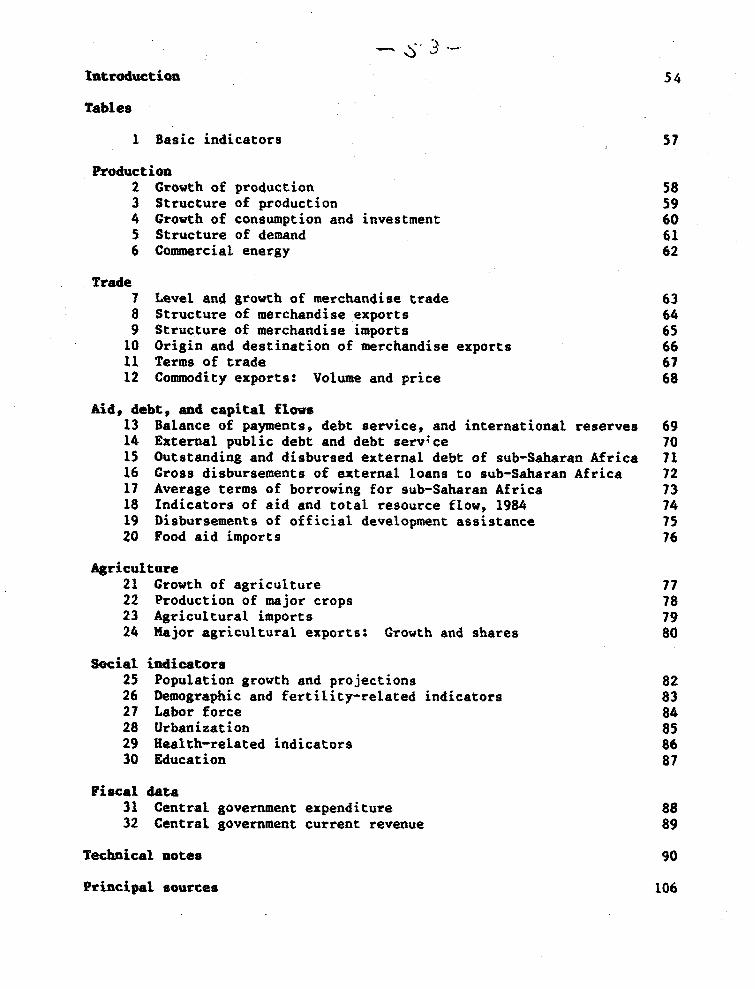
Iatroductiou 54
Tables
1 Basic indicators 51
Production2 Growth of production 583 Structure of production 594 Growth of consumption and investment 605 Structure of demand 616 Commercial energy 62
Trade7 Level and growth of merchantdse trade 638 Structure of merchandise exports 649 Structure of merchandise importa 6510 Origin and destination of merchandise exports 6611 Termsa of trade 6712 Commodity exports: Volume and price 68
Aid, debt, and capital flows13 Balance of payments, debt service, and international reserves 6914 External public debt and debt serv;ce 7015 Outstanding and disbursed external debt of sub-Saharan Africa 7116 Gross disbursements of external loans to sub-Saharan Africa 7217 Average terms of borrowíng for sub-Saharan Africa 7318 Indicators of aid and total resource flow, 1984 7419 Disbursements of official development assistance 7520 Food aid imports 76
Agriculture21 Growth of agriculture 7722 Production of major crops 7823 Agricultural imports 7924 Major agricultural exports: Growth and shares 80
Social indicatore25 Population growth and projections 8226 Demographíc and fertility-related indicators 8327 Labor force 8428 Urbanization 8529 Health-related indicatora 8630 Education 87
Fiscal data31 Central government expenditure 8832 Central government current revenue 89
Technical notes 90
Principal sources 106
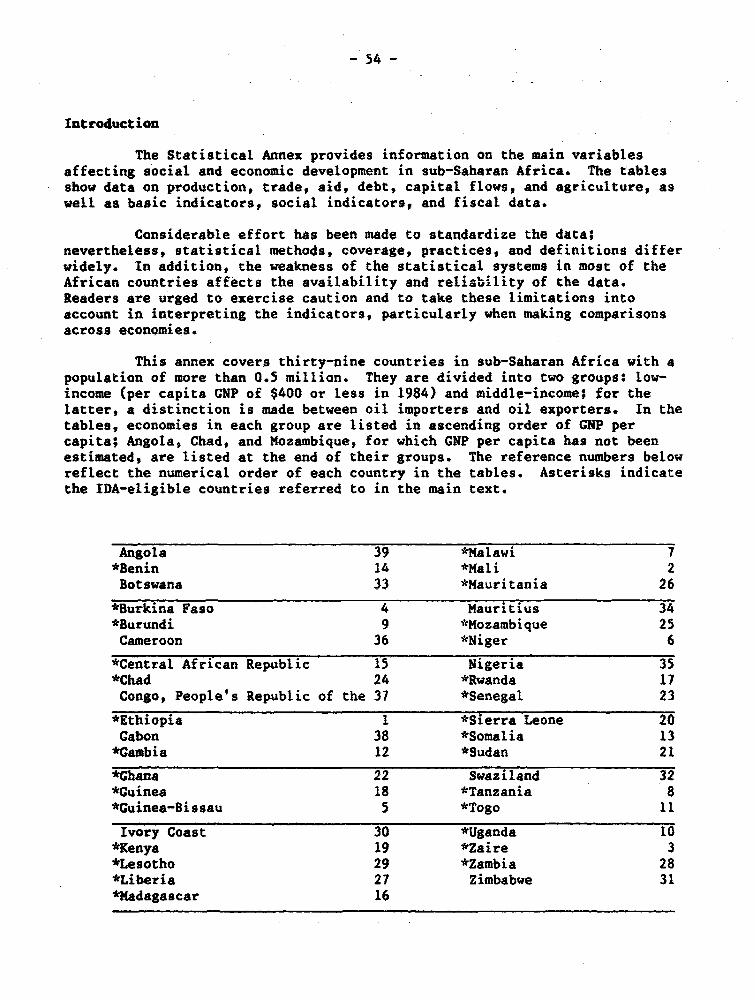
- 54 -
Introduction
The Statistical Annex provides information on the main variablesaffecting social and economic development ín sub-Saharan Africa. The tablesshow data on production, trade, aid, debt, capital flows, and agriculture, aswell as basic indicators, socíal indicators, and fiscal data.
Considerable effort has been made to atandardize the data;nevertheless, atatistical methods, coverage, practices, and definitions differwidely. In addition, the weakness of the statistical systems in most of theAfrican countries affects the availability and reliability of the data.Readers are urged to exercise caution and to take these limitations intoaccount in ínterpreting the indicators, particularly when making comparisonsacross economies.
This annex covers thirty-nine countries in sub-Saharan Afríca with apopulation of more than 0.5 million. They are divided into two groups: low-income (per capita GNP of $400 or less in 1984) and middle-income; for thelatter, a distinction is made between oil ímporters and oil exporters. In thetables, economies in each group are listed ín ascending order of GNP percapita; Angola, Chad, and Mozambique, for which GNP per capíta has not beenestimated, are listed at the end of their groups. The reference numbers belowreflect the numerical order of each country in the tables. Asterisks indicatethe IDA-eligíble countries referred to in the main text.
Angola 39 *Malawi 7*Benin 14 *Mali 2Botswana 33 *Mauritania 26
*Burkina Faso 4 Mauritius 34*Burundi 9 *Mozambique 25Cameroon 36 *Niger 6
*Central African Republic 15 Nigeria 35*Chad 24 *Rwanda 17Congo, People's Republíc of the 37 *Senegal 23
*Ethiopia 1 *Sierra Leone 20Cabon 38 *Somalia 13*Gambia 12 *Sudan 21
*Ghana 22 Swaziland 32*Cuínea 18 *Tanzania 8*Guinea-Bissau 5 *Togo 11
Ivory Coast 30 *Uganda 10*Kenya 19 *Zaire 3*Lesotho 29 *Zambia 28*Libería 27 Zimbabwe 31*Madagascar 16
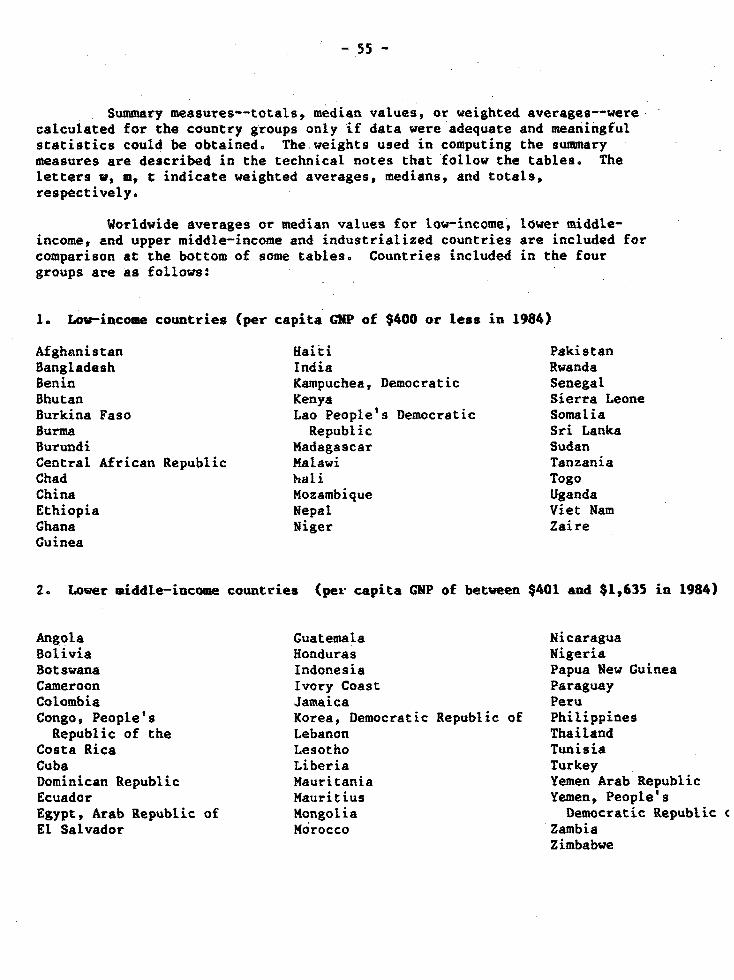
- 55 -
Summary measures--totals, median values, or weighted averages--werecalculated for the country groups only if data were adequate and meaningfulstatistica could be obtained. The weights used in computing the summarymeasures are described in the technical notes that follow the tables. Theletters y, m, t indicate weighted averages, medians, and totals,respectively.
Worldwide averages or median values for low-income, lower middle-income, end upper middle-income and industrialized countries are included forcomparison at the bottom of some tables. Countries included in the fourgroups are as follows:
1. Low-income countries (per capita GQP of $400 or leas in 1984)
Afghanistan Haiti PakistanBangladesh India RwandaBenin Kampuchea, Democratic SenegalBhutan Kenya Sierra LeoneBurkina Faso Lao People's Democratic SomaliaBurma Republic Sri LankaBurundi Madagascar SudanCentral African Republic Malawi TanzaniaChad hali TogoChina Mozambique UgandaEthiopia Nepal Viet NamGhana Niger ZaireGuinea
2. Lover uiddte-income countries (pet capita GNP of between $401 and $1,635 ín 1984)
Angola Guatemala NicaraguaBolivia Honduras NigeriaBotswana Indonesia Papua New GuineaCameroon Ivory Coast ParaguayColombia Jamaica PeruCongo, People's Korea, Democratic Republic of PhilippinesRepublic of the Lebanon Thailand
Costa Rica Lesotho TunisiaCuba Liberia TurkeyDominican Republic Mauritania Yemen Arab RepublicEcuador Mauritius Yemen, People'sEgypt, Arab Republic of Mongolia Democratíc Republic cEl Salvador Morocco Zambia
Zimbabwe
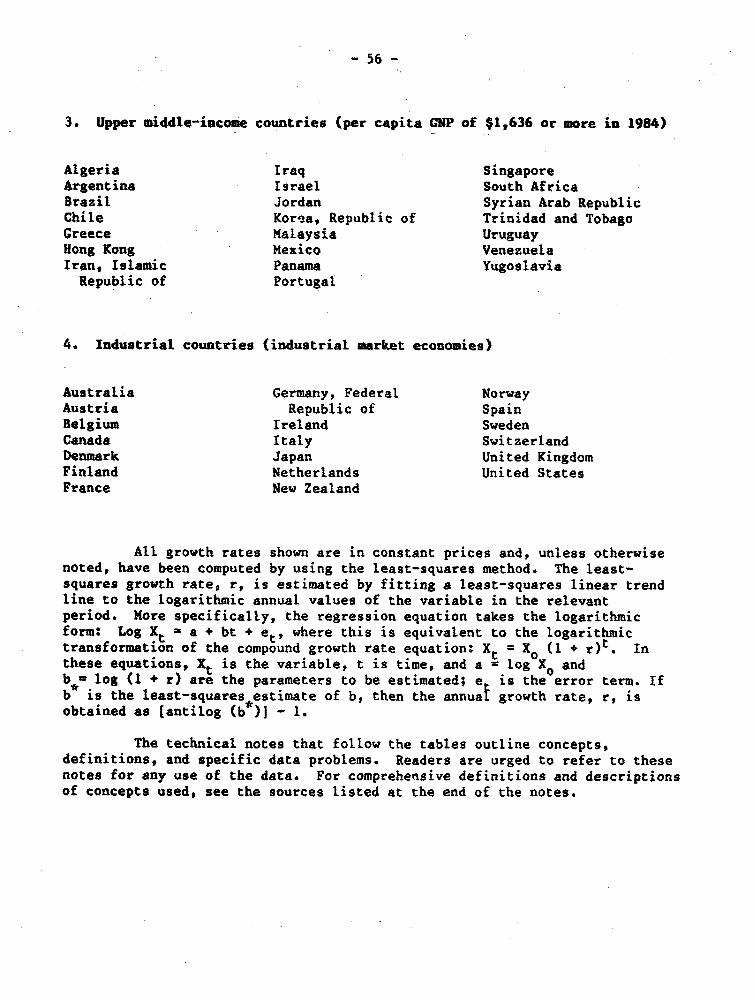
- 56 -
3. Upper middle-íacome countries (per capita CGP of $l,636 or more in 1984)
Algeria Iraq SingaporeArgentina Israel South AfricaBrazil Jordan Syrian Arab RepublicChile Korea, Republic of Trinidad and TobagoGreece Malaysia UruguayHong Kong Mexico VenezuelaIran, Islamic Panama YugoslaviaRepublic of Portugal
4. Industrial countries (industrial market economies)
Australia Germany, Federal NorwayAustria Republic of SpainBelgium Ireland SwedenCanada Italy SwitzerlandDenmark Japan United KingdomFinland Netherlands United StatesFrance New Zealand
All growth rates shown are in constant prices and, unlegs otherwisenoted, have been computed by using the least-squares method. The least-squares growth rate, r, is estimated by fitting a least-squares linear trendline to the logarithmic annual values of the variable in the relevantperiod. More specifically, the regression equation takes the logarithmicform: Log Xt = a + bt + et, where this is equivalent to the logaríthmictransformation of the compound growth rate equation: Xt = XO (1 * r)t. Inthese equatíons, X, is the variable, t is time, and a = log XO andb " log (1 + r) are the parameters to be estimated; e is the error term. If
is the least-squares estímate of b, then the annual growth rate, r, isobtained as [antilog (b >1 - 1.
The technical notes that follow the tables outline concepts,definitions, and specific data problems. Readers are urged to refer to thesenotes for any use of the data. For comprehensive definitiona and descriptionsof concepto used, see the sources listed at the end of the notes.
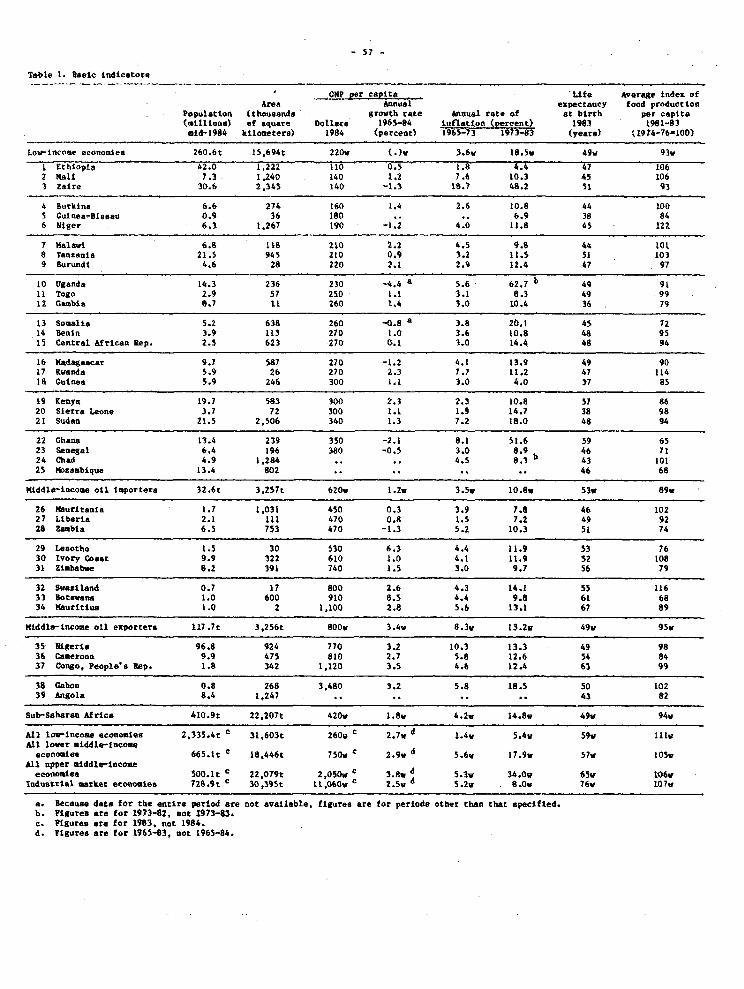
Table 1. Basec tndicatore
GNP per caita LSte Average tndex ofArea AQnuel expectancy food productton
Population (thousanda growtb rete Annual tate of at btrth per ceptta(ttl1inas) of aquare Dollare 1965-84 enfgation <Percent> 1983 1981-83aid-1984 kil~letera) 1984 (pereent) 1965-73 1973-83 (yeare) (1974-76-100)
Low-incoae economies 260.6t 15,694t 220v ()v 3.6w 18.5w 49w 93v
l Ethíopia 42.0 1.222 110 0.5 1.8 4.4 47 1062 IaalS 7.3 1,240 140 1.2 7.6 10.3 45 1063 ZaIre 30.6 2,345 140 -1.3 16.2 48.2 Si 93
4 Burkina 6.6 274 160 1.4 2.6 10.8 44 1005 Cuiaaa-Biaau 0.9 36 180 .. .. 6.9 38 846 Nltger 6.3 1.267 190 -1.2 4.0 11.8 45 122
7 Ilalaví 6.8 11S 210 2.2 4.5 9.8 44 10l8 Tanzania 21.5 945 210 0.9 3.2 11.5 51 1039 Burundt 4.6 28 220 2.1 2.9 12.4 47 97
10 Uganda 14.3 236 230 -4.4 a 5.6 62.7 b 49 9111 Togo 2.9 57 250 1.1 3.1 8.3 49 9912 Calbia 0.7 11 260 1.4 3.0 10.4 36 79
13 Soalia 5.2 638 260 -0.8 a 3.8 20.1 45 7214 Benin 3.9 113 270 1.0 3.6 10.8 48 9515 Central African Rep. 2.S 623 270 0.1 3.0 14.4 48 94
16 14dagaacar 9.7 587 270 -1.2 4.1 13.9 49 9017 Rwanda 5.9 26 270 2.3 7.7 11.2 47 11418 Guinea 5.9 246 300 1.1 3.0 4.0 37 85
19 Kenya 19.7 583 300 2.3 2.3 10.8 57 8620 Sietra Leone 3.7 72 300 1.1 1.9 14.7 38 9821 Sudan 21.5 2,506 340 1.3 7.2 18.0 48 94
22 Ghana 13.4 239 350 -2.1 8.1 51.6 59 6523 Senegal 6.4 196 380 -0.5 3.0 8.9 46 7124 Chad 4.9 1.284 .. .. 4.5 8.3 b 43 10125 Kozaabíque 13.4 802 .. .. .. .. 46 68
Kiddle-income o£l I1porters 32.6t 3,257t 620V I.Zv 3
.5S 10.8v 53v 89v
26 lluritanfa 1.7 1.031 450 0.3 3.9 7.8 46 10227 LIbería 2.1 111 470 0.8 1.5 7.2 49 9228 Zambia 6.5 753 470 -1.3 5.2 10.3 51 74
29 Lesotho 1.5 30 530 6.3 4.4 11.9 53 7630 Ivory Coast 9.9 322 610 1.0 4.1 11.9 52 10831 Ziababte 8.2 391 740 1.5 3.0 9.7 56 79
32 Svaziland 0.7 17 800 2.6 4.3 14.1 55 11633 Botsavna 1.0 600 910 8.5 4.4 9.8 61 6834 Nauritiut 1.0 2 1,100 2.8 5.6 13.1 67 89
midd1c~income oíl exportera 117.7t 3,256t 800v 3.4v 8
.3
v 13.2w 49v 95Y
35 Nigeria 96.8 924 770 3.2 10.3 13.3 49 9836 Camerooa 9.9 475 810 2.7 5.8 12.6 54 8437 Congo, Peopleas Rep. 1.8 342 1,120 3.5 4.6 12.4 63 99
38 Gabon 0.8 268 3,480 3.2 5.8 18.5 50 10239 Angola S.4 1,247 .. .. .. .. 43 82
Sub-Saharan Africa 410.9t 22,207t 420v 1.8, 4.2Y 14.8v 49v 94v
A11 ll rincome economeas 2.335.4t e 31,603t 260v c 2.7* d 1.4v 5.4Y 59v 111vA11 lover middle-income
economies 665.1t c 18.446t 750v e 2.9v d 5.6v 17.9v 57v 105,Al1 upper middia-lncoma
economea SOO.lt e Z2,079t 2,050w c 3.8< d 5.3v 34.0O 65v 106vIndustital market econoSías 728.9t e 30,39$t 11.0bov c 2.5w d 3. 8.0v 76v 107v
a. Because date for the entire parSod are not available, figures are for perioda other than that apecífied.b. Pigures are for 1973-82, not 1973-83.e. ftgureas re for 1983. not 1984.d. Figures are for 1965-83, QOt 1965-84.
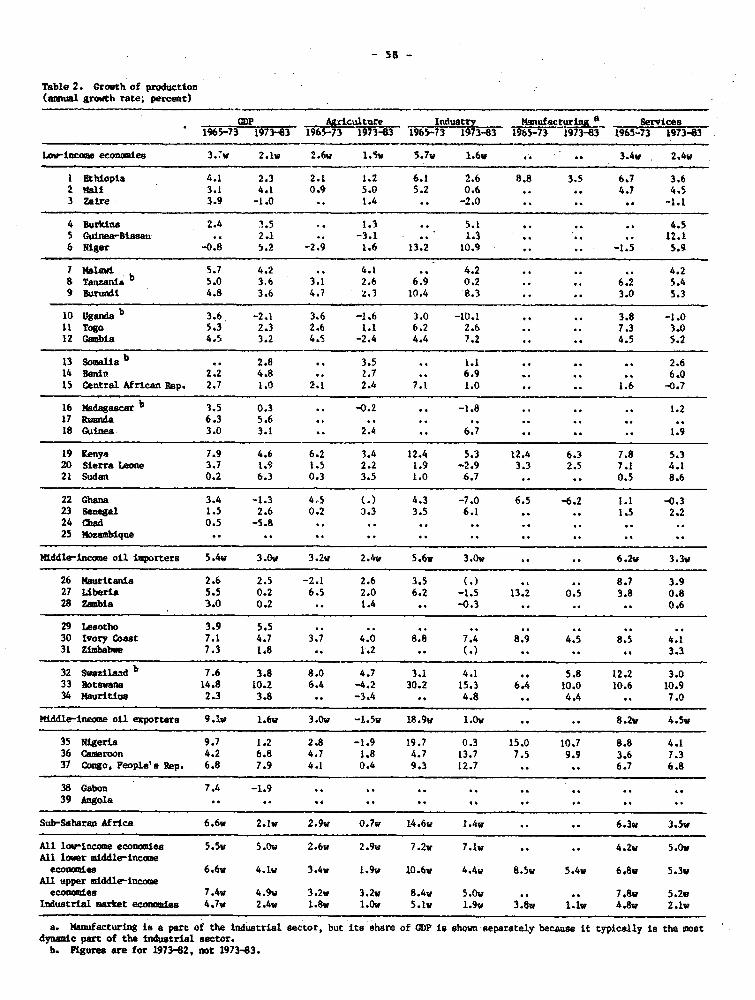
Table 2. Grouth of pro4uction(mual growth rete; percent)
(112 A~~~grí uture Industry Msnufactudiog Services1965-73 1973-43 19-65-73 1973-83 1965-73 1973-83 M95-73- ¡973-83 1965~-73 1973-63
1~Iw~ica econuiies 3.-v 2.1w 2,.6w 1.5w 5.7w 1.6v . * 3.Av 2.4w
¡ Ethiopia 4.1 2.3 2. 1.2 6.1 2.6 8.8 3.5 6.7 3.62 #al¡ 3.1 4.1 0.9 5.0 5.2 0.6 . . 4.7 4 53 Zai¡re 3.9 -1.0 .. 1.4 .. -2.0 ... . -1.1
4 Burkina 2.4 3.5 .. .3 . 5.1 ... . 4.55 Ouinea-Biasau .. 2.1 .. -3.1 .. .3 .... 12.16 Niger -O:8 5.2 -2.9 1.6 13.2 10.9 ... 15 5.9
7 ¡<slaw 5.7 4.2 .. 4.1 .. 4.2 ... . 4.28 Tanzana 5.0 3.6 3.1 2.6 6.9 0.2 . . 6.2 5.49 BUrund 4.8 3.6 4.7 Z.3 10.4 8.3 ... 3.0 5.3
10 Uganda b 3.6~ -2.1 3.6 -1.6 3.0 -10.1 ... 3.8 -1.011 Togo 5.3 2.3 2.6 1.1 6.2 2.6 . 7.3 3.012 Guabia 4.5 3.2 4.s -2.4 4.4 7.2 .. 4.5 5.2
13 So~ali b. 2.8 .. 3.5 .. 1.1 ... . 2.614 Benn 2.2; 4.8 .. 1.7 . 6.9 ... . 6.015 Oentral Africax Rep. 2.7 1.0 2.1 2.4 7.1 1.0 . 1.6 -0.7
16 Madagascab 3.5 0.3 .. -0.2 .. -1.8 ... . 1.217 Ruana 6.3 5.6 . . . . .
18 Giinea 3.0 3.1 .. 2.4 6.7..... 1.9
19 K~4y 7.9 4.6 6.2 3.4 12.4 5.3 12.4 6.3 7.8 5.320 Síerra Laoe 3.7 1.9 1.5 2.2 1.9 -2.9 3.3 2.5 7.1 4.121 Sudan 0.2 6.3 0.3 3.5 1.0 6.7 . 0.5 8.6
22 Ghana 3.4 -1.3 4.,5 <.) 4.3 -7.0 6.5 -6.2 ¡.1 -_0.323 Senga 1.5 2.6 0.2 3.3 3.5 6.1 . . 1.5 2.224 Qhad 0.5 -5.8 . . . . .
25 Wizmbiue . . . . . . .
>Uddle--i~cm oil liprtera 5.4v 3.Ow 3.2v 2.4v 5.6Y 3.0v . 6.2V 3.3w
26 Mauitania 2.6 2.5 -2.1 2.6 3.5 ().. 8.7 3.927 Uberia 5.5 0.2 6.5 2.0 6.2 -1.5 13.2 0.5 3.8 0.828 Zambia 3.0 0.2 .. 1.4 .. -0.3 ... . 0.6
29 Lestho 3.9 5.5 . . * ..
30 Ivory Coat 7.1 4.7 3.7 4.0 8.8 7.4 8.9 4.5 8.5 4.131 Zlmba~s 7.3 1.8 .. 1.2 G.(> ... . 3.3
32 Swazilaad b 7.6 3.8 8.0 4.7 3.1 4.1 .. 5.8 12.2 3.0
33 Botavaus 14.8 10.2 6.4 -4.2 30.2 15.3 6.4 10.0 10.6 10.934 Maritius 2.3 3.8 .. -3.4 .. 4.8 .. 4.4 .. 7.0
Míddle-f.ncme oíl exprter 9.1v 1.6v 3.Ow -1.5w 18.9w 1.0w .. 8.2v 4.5w
35 Nígeria 9.7 1.2 2.8 -1.9 19.7 0.3 15.0 10.7 8.8 4.136 Camroon 4.2 6.8 4.7 1.8 4.7 13.7 7.5 9.9 3.6 7.337 ~mo, People'e Rep. 6.8 7.9 4.1 0.4 9.3 12.7 . 6.7 6.8
38 Gabn 7.4 -1.9 . . . ..
39 Angola . . . . . ..
Subr-Sahersn Af rica 6.6w 2.1v 2.9v 0.7Y 14.6v 1.4w .. 6.3v 3.5v
All hoy-inco econmies 5.5v 5.0v 2.6w 2.9w 7.2Y 7.lv ... 4.2w 5.0vAhl lover ai~le-inccmeecon eoma 6.6v 4.1v 3.4w 1.9w 10.6w 4 .4w 8.5w 5.4w 6.8w 5.3v
A.ll upr uiddle-incomeeeonaíe.. 7.4w 4.9w 3.2w 3.2w 8 .4w 5.0v .. 7.8w 5.2v
Industrial uarkt economia 4.7w 2.4w 1.8v 1.0v 5.1v 1.9V 3.8w 1.1w 4.8w 2.lw
a. Mauacturing la a part of the Industrial sector, but ite ehare of CDP la shown eeparately because it typicahly te the noatdynamc pat of the Inutrial sector.
b. Figure are for 1973-82, noat 1973-83.
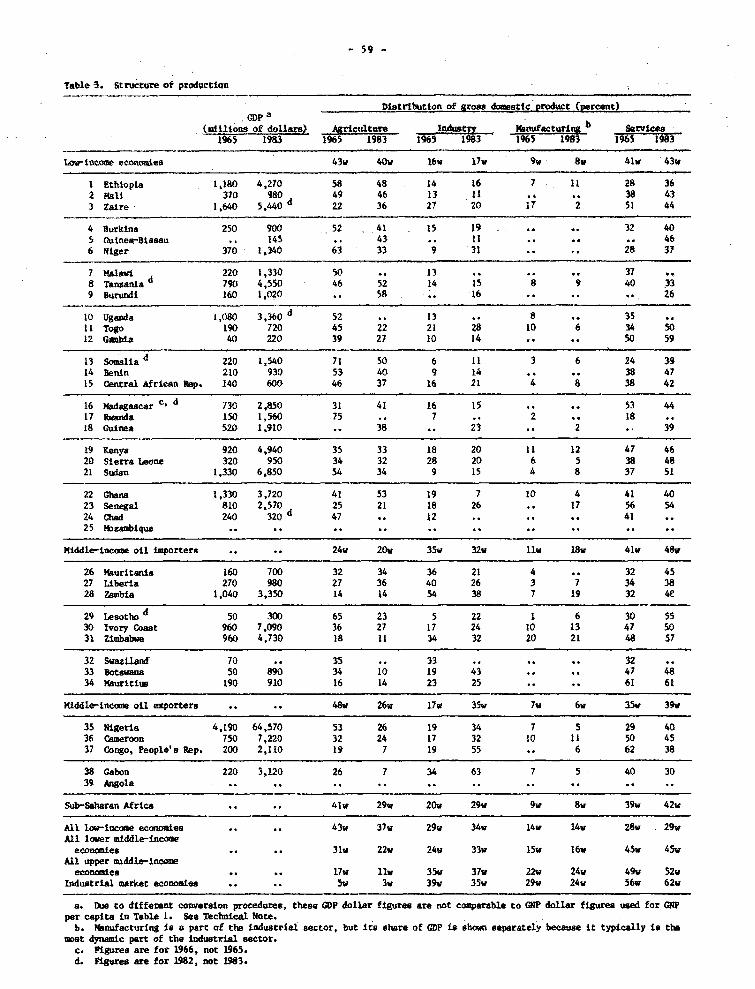
-59
Table 3. Structure of produictiQii
D.atribucton of groa dcueatic praduct (percent)
<tailltoaS of dollste> Agriuftra ndutry _________1965 1983 1965 1983 1963 93 16 1983 1965 983-
1I~Itone econnuiea 43w 40v 16w 1lv 9 8v 41w 43v
1 Ethiopia 1,180 4,210 58 48 14 16 7 11 28 362 mal¡ 370 980 49 46 13 11 . 38 433 Zaire 1,6 40 5 , 44 0 d 22 36 27 20 17 2 si 44
4 Burkina 250 900 52- 41 15 19 - . .32 405 Cuinea-Sissau *. 145 .. 43 .. 11 .. . . 466 Níger 3170 1,340 63 33 9 31 . 28 37
7 mslw 220 1,330 50 .. 13 ... .37
8 Tanzania d 790 4,550 46 52 14 15 8 9 40 339 Burund 160 1,020 .. 58 .. 16 .. . . 26
10 Uganda 1,080 3,360 d 52 .. 13 .. 8 .35
11 Togo 190 720 45 22 21 28 10 6 34 so12 Gsmb 40 220 39 27 10 14 . 50 59
13 Somna da 220 1,540 71 50 6 11 3 6 24 3914 Benin 210 930 53 40 9 14 . 38 4715 central African Rep. .140 600 46 37 16 21 4 8 38 42
16 Madagascar c, d 730 2,850 31 41 16 15 . . 53 4417 ~and 150 1,560 75 .. 7 .2 1818 Guineaí 520 1,910 38 .. 23 .. 2 .. 39
19 Kenya 920 4,940 35 33 18 20 11 12 47 4620 Sierra Leona 320 950 34 32 28 20 6 5 38 4821 Sndan 1,330 6,850 54 34 9 1S 4 8 37 51
22 Ghn 1,330 3,720 41 53 19 7 10 4 41 4023 Senegal 810 2,570 d 25 21 18 26 .. 17 56 5424 Cbad 240 320 d 47 12 , .41
25 toabiLque . ...
Middle-incoae oíl imprtear .. . 24v 20, 35w 32w 11v 18v 41v 48v
26 Mauritania 160 700 32 34 36 21 4 .. 32 4527 Libaría 270 980 27 36 40 26 3 7 34 3828 Zambia 1,040 3,350 14 14 54 38 7 19 32 4L
29 Laeotho d 50 300 65 23 5 22 1 6 30 5530 Ivory Coast 960 7,090 36 27 17 24 lO 13 47 s031 Zimlbab 960 4,730 18 11 34 32 20 21 48 57
32Svwaztland 70 .3,5 .. 33 ... .32
33Botae~a 50 8034 10 19 43. .47 4834 Mauritius 190 910 16 14 23 25 . 61 61
Middle-incom oil exPortere . . 48v 26v l7v - 35w 7w 6v 35w 39v
35 Nigeria 4,190 64,570 53 26 19 34 7 5 29 4036 Cameroon 7-50 7,220 32 24 17 32 10 11 50 4537 Congo, Peopie'o Rep. 200 2,110 19 7 19 55 . 6 62 38
38 Gabon 220 3,120 26 7 34 63 7 5 40 3039 Angola . .. . . ..
Sub-Saharan Africa . 41v 29v 20v 29w 9v 8v 39v 42v
All lov-lnm ecnomies .. .. w 37v 29w 34w 14v 14v 28w 29vAhl loer midle-income
economie . 31w 22W 24w 33w 15w 16w 45v 4-5vAlí upper middle-incom
economis .. . 7v ivw 3Sui 37w 22w 24v 49v 52vIndustrial tnarket econoeas .. . v 3v 39v 35v 29v 24v 56v 62v
a. Due te dífferent converSIOn prceurs these CDP dollar figues are not comparble to OlP ¿ollar fígures usa for GNP>par capita in Table 1. See Tectnical Note.
b. Mauacturing ía a part of thes induatríal sector, but ita ahara of CDP fes hown separately beeaue it typicahly is thaumst dynsmic part of the industrial sector.
e. Pigureo are for 1966, not 1965.d. Figures are for 1982, not 1983.
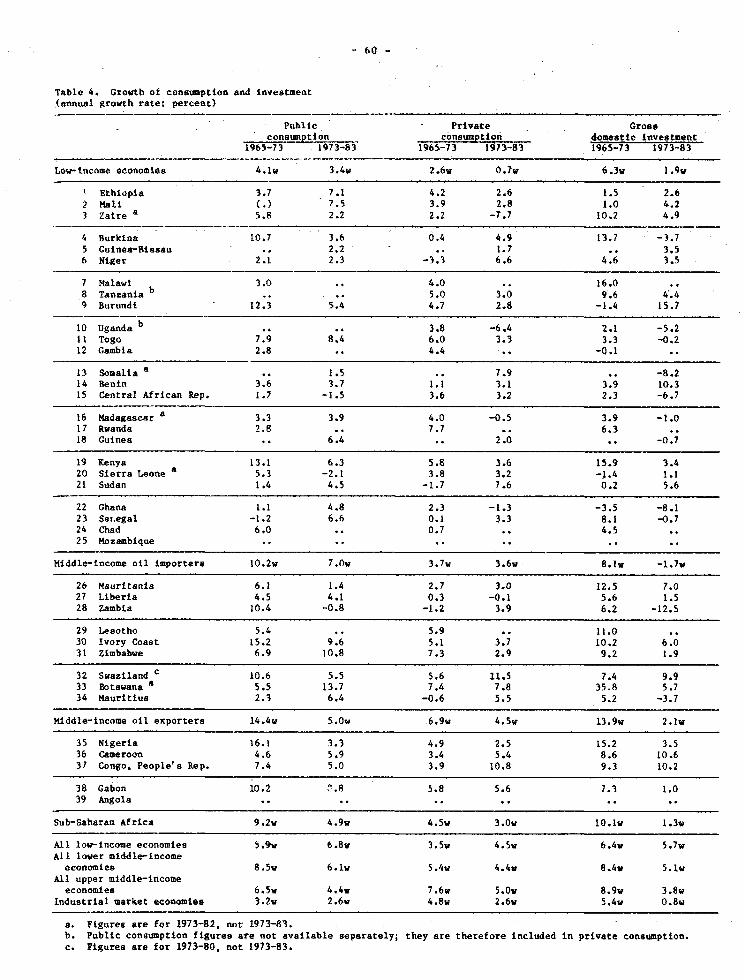
-60-
Table 4. Growtb of coneunption and inveatmeat<annusl1 growtih rate; percent)
Puhlic Private Gros.consumption consumption domestie inveetisent
1965-73 1973-83 1965-73 1973-83 1965-73 1973-83
L~w-tncome economiejs 4.1w 3.4w 2.6w 0.7v 6.3V 1.9V
E.thiopia 3.7 7.1 4.2 2.6 1.5 2.62 mali . 7.5 3.9 2.8 1.0 4.23 Zaire a 5.8 2.2 2.2 -7.7 10.2 4.9
4 Burkina 10.7 3.6 0.4 4.9 13.7 -3.75 Guinea-Messau . 2.2 .. 1.7 .. 3.56 Ntger 2.1 2.3 -- 3.3 6.6 4.6 3.5
7 Malawi 3.0 .. 4.0 .16.08 Tanzania b .. 5.0 3.0 9.6 4.49 aurundi 12.3 5.4, 4.7 2.8 -i.4 15.7
10 Uganda b .. 3.8 -6.4 2.1 -5.211 Togo 7.9 8.4 6.0 3.3 3.3 -0.212 Gambia 2.8 .. 4.4 .- 1
13 Somalia a . 1.5 .. 7.9 .. -8.214 Benin 3.6 3.7 1.1 3.1 3.9 IG.315 Central Afrícan Rep. 1.7 -1.5 3.6 3.2 2.3 -6.7
16 Madagascar a .33.9 4.0 -0.5 3.9 -1.017 Rwanda 2.8 .. 7.7 6.318 Guinea .. 6.4 2.0 . -0.7
19 Kenya 13.1 6.3 5.8 3.6 15.9 3.420 Sierra Leone a 5.3 -2.1 3.8 3.2 -1.4 1.121 Sudan 1.4 4.5 -1.7 7.6 0.2 5.6
22 Ghana 1.1 4.8 2.3 -1.3 -3.5 -8.123 Ser.egal -1.2 6.6 0.1 3.3 8.1 -0.724 Chad 6.0 .. 0.7 .. 4.525 Mozambique . ..
Middle-income oíl importere 10.2w 7.Ow 3.7w 3.6v 8.1w -1.7w
26 Mauritania 6.1 1.4 2.7 3.0 12.5 7.027 Liberia 4.5 4.1 0.3 -0.1 5.6 1.528 Zambia 10.4 -0.8 -1.2 3.9 6.2 -12.5
29 Leaotho 5.4 .. 5.9 .. 11.030 Ivory Coast 15.2 9.6 5.1 3.7 10.2 6.031 Zimbabwe 6.9 10.8 7.3 2.9 9.2 1.9
32 Swaziland e 10.6 5.5 5.6 11.5 7.4 9.933 Botawana a 5.5 13.7 7.4 7.8 35.8 5.734 Mauritius 2.3 6.4 -0.6 5.5 5.2 -3.7
Middle~incame oil exportere 14.4w 5.0v 6.9w 4.5v 13.9w 2.1w
35 Nigeria 16.1 3.3 4.9 2.5 15.2 3.536 Cameroon 4.6 5.9 3.4 5.4 8.6 10.637 Congo, Peop1c's Rep. 7.4 5.0 3.9 10.8 9.3 10.2
38 Gabon 10.2 Í~.8 5.8 5.6 7.3 1.039 Angola . ..
Sub-Saharan Africa 9.2w 4.9w 4.5w 3.0w I0.1v 1.3v
All lovw-income economtes 5.9w 6.8v 3.5w 4.5w 6.4w 5.7wAll lower middle-íncoaeeconotniee 8.5w 6.lw 5.4w 4.4v 8.4w 5.1v
All upper míddle-incomeaeconomles 6.5w 4 .4w 7.6w 5.0v 8.9w 3.8w
Industrial market economíes 3.2w 2.6,w 4.8w 2.6v 5.4w 0.8v
a. Figures are for 1973-82, not 1973-83.b. Publíe consumption figures are not available separately; they are therefore included in prívate consgmption.c. Figures are for 1973-80, not 1973-83.
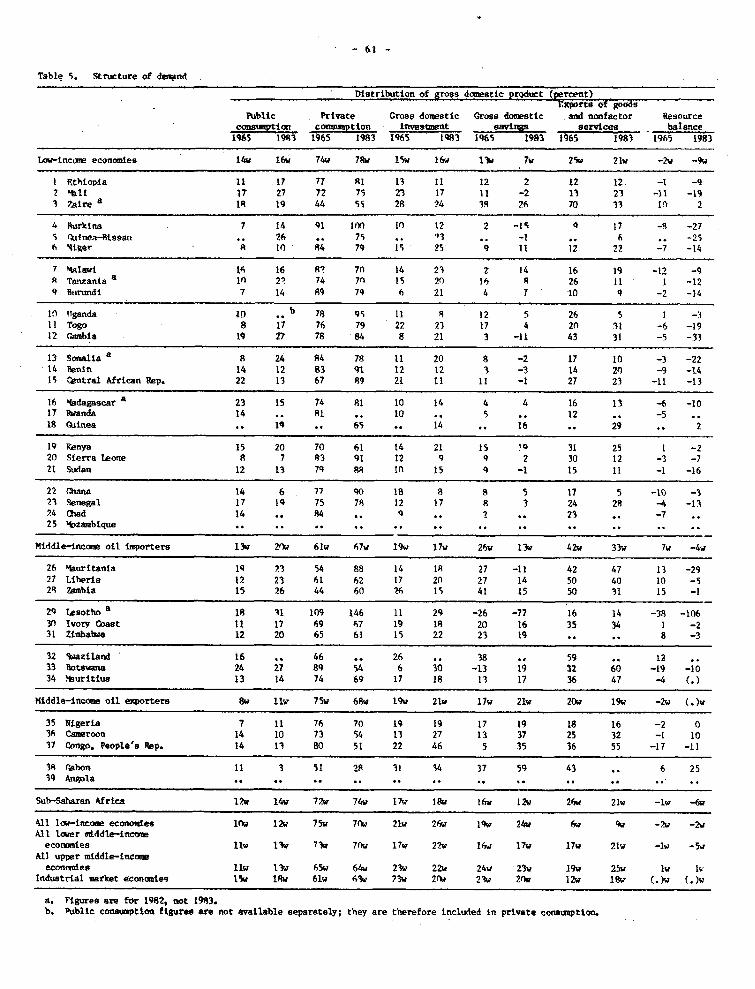
Table 5. Structure of demnd
Distributioyn of gross dmes~tc product (ereent)1'.xporta of goods
PNblic Prtvate Grosli domwstic Grosa domaDtic and tonfactor ResnurceConaiutíon ccmSm!tion ii>Swsut !Mi=servicea balanee
1965 1983 1965 1983 1965s 1983 196 1983 ¡965 1983 1965 1983
Low-tnce~ economies 14w 16w 74w 78w 15w 16W 13w 7w 25w 21w '-2w -9w
1t thtoipia 11 17 77 Rl 13 11 12 2 12 12 -1 -92 'b11 17 27 72 75 23 17 11 -2 13 23 -11 -193 Zaire 8 18I 19 44 55 28 24 IR 26 70 33 In 2
4 8grktna 7 114 91 ¡(Y> 10 12 2 -1% 1 7 -8, -27S45 -tsa . 26 75 '>3 -l . 6 .. -256 ltiger A 10 84 79 15 25 9 11 12 22 -7 -14
7 4Aíawt 16 16 8'> 70 14 23 2 14 16 19 -12 -9R Tanzan1a a In 2' 74 70 15 20> 16 8 26 ¡1 1 -129 8t>rmdi 7 14 89 79 6 21 4 7 10 9 -2 -14
10 TTganda .10 *.b 78 95 11 8 12 5 26 5 í -311 rogo 8 17 76 79 22 23 17 4 20 31 -6 -¡912 Ganbía 19 27 78 84 8 21 3 -'it 43 31 -5 -33
13 Sonialta 8 24 84 78 11 20 8 -2 17 10 -3 -2214 Penin 14 12 83 <41 12 12 3 -3 14 20) -9 -1415 Central Afr±can Rep. 22 13 67 89 21 ti 11 -1 27 23 -11 -13
16 qadagascar a 23 15 74 81 10 14 4 4 16 13 -6 -1017 Rwanda 14 .. 1 . 10 .. 5 .12 .. -518 Ciiinea .. 19 . 6,5 . 14 .. 16 . 29 .. 2
19 xenya 15 20 70 61 14 21 15 'Q 31 25 1 -220 Sferra leone 8 7 833 91 12 9 9 2 30 12 -3 -7tí Sudan 12 13 79 88 In 15 9 -1 15 11 -1 -16
22C e~n 14 6 77 90 18 8 8 5 17 5 -1O -323 9enegal 17 19 75 78 12 17 8 3 24 28 -4 -1324 ciad 14 .. 84 9 .. 9 . 21 .. -725 'boza<nbtque . .. . .
M<iddle-incom oil liprters l3w 20Iw 61w 657w 1%w 17w 26w 13w 42w 33w 7w -4w
26 4aIurítanta 19 23 54 88 14 18 27 -11 42 47 13 -2927tLíberia 12 23 61 62 17 20 27 14 50 40 10 -529 Zambia 15 26 44 60 26S 15 41 15 50 31 15 -1
29 1Usotho a 18 11 109 146 11 29 -26 -77 16 14 -38 -10630 llorv oat 11 17 69 657 19 18 20 16 35 34 1 -231 lim bwbe 12 20 65 61 15 22 23 19 8 -3
32 %r4zí1and 16 .. 46 .. 26 38 .. 59 .. 1233 %otwamna 24 27 89 54 6 30 -13 19 32 60 -19 -1034 iaurit±ug 13 14 74 69 17 18 13 17 36 47 -4 (.)
Hiddle-Incomn oíl ecprters 8w 21w 75w 68w 19w 21w 17w 21w 20w 19w -2w <.)w
35 Nigeria 7 11 76 70 19 19 17 19 18 16 -2 0S6 ameroon 14 10 73 54 13 27 13 37 25 32 -1 1037 Congo. People's Rep. 14 1Ii so 51 22 46 5 35 36 55 -17 -11
IR Osabon 11 3 51 28 31 14 37 59 43 .. 6 25'39 gl . . . . . . ..
Sub-Sahran Afríca l2w 14w 7?w 74v 17w 18w 16W 12w 26W 21w -1w --6w
41i1 1<~-neonm econoruies 10w 12w 75w 70w 21w 26w 19w 24w 8w 9W -2W -2wAlt lcwr adddle-inc~
eeoncísre liv 23w 73w 70w 17w 22w 16W 17V 17W 21v -1w -5wAll1 upper middle-incom
ecoTztImes 11w 23w 65w 64w 23w 22w 24v 23w 19w 25w lw 1vItiduatrtal maBrket econtutes 15w I8W 61w 43w 23w 20w 23wj 20u 12w 1 w (.)w (.)w
a. Figuree aZE for 1982, not 1983.b. Publlc cons,ation figuree are not walalable separately; thney are therefore i.nclu<led in private consuaption.
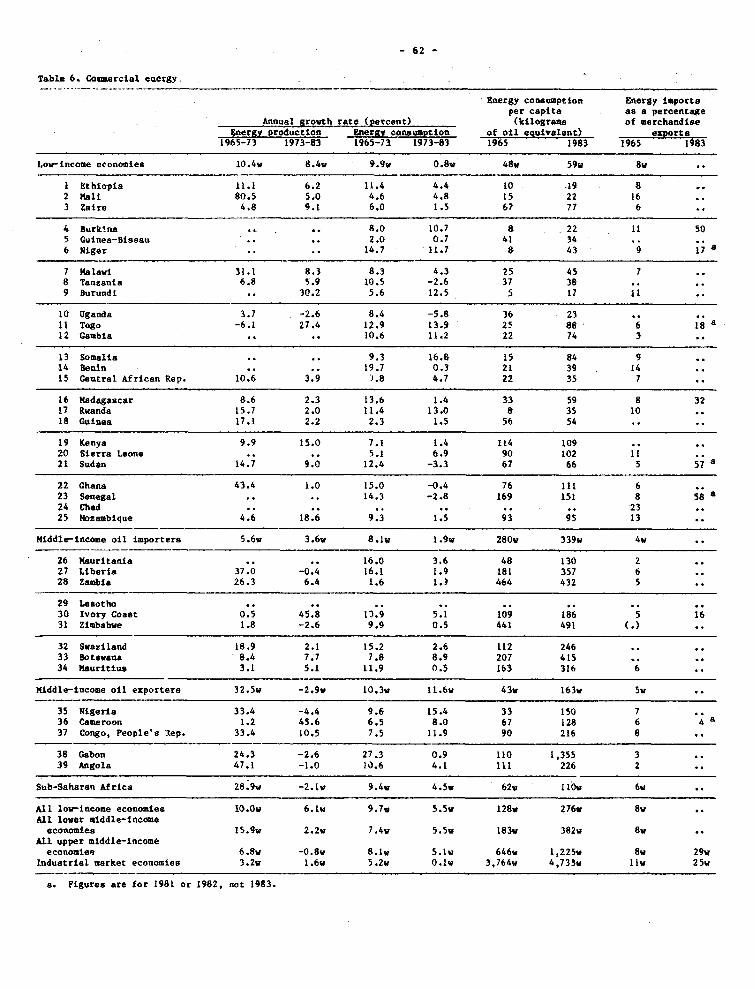
Tabl.e 6. Comaercial energy
Energy coneuaption Entergy Importaper capita as a percentage
AnulgroYth rate (prcentL (Irilograaa of merchandíse8nergy production RnerA]! coansumtIon of oíl equivalent» exporte
1965-73 1973-83 1965-73 1973-83 1965 1983 1965 1983
Lov-income economíes 10.4w 8.4v 9.9v 0.8v 48v 59v 8v
1 Ethiopia 11.1 6.2 11.4 4.4 l0 -19 82 Mali 80.5 5.0 4.6 4.8 15 22 163 Zaire 4.8 9.1 6.0 1.5 67 77 6
4 burktna .. 8.0 10.7 822 11 so5 Guinea-fiiasau ... 2.0 0.7 41 346 Níger . 14.7 11.7 8 43 9 178a
7 Malawi 31.1 8.3 8.3 4.3 25 45 78 Tanzania 6.8 5.9 10.5 -2.6 37 389 Burundi .. 0.2 5.6 12.5 5 17 11
10 Uganda 3.7 -2.6 8.4 -5.8 36 2311 Togo -6.1 27.4 12.9 13.9 25 88 6 1 12 Galuhia ... 10.6 11.2 22 74 3
13 Somalia . 9.3 16.8 15 84 914 Benin .. 19.7 0.3 21 39 1415 Central African Itep. 10.6 3.9 ').8 4.7 22 35 7
16 Madagascar 8.6 2.3 13.6 1.4 33 59 8 3217 Rwanda 15.7 2.0 11.4 13.0 8 35 1018 Guinea 17.1. 2.2 2.3 1.5 56 54
19 Kenya 9.9 15.0 7.1 1.4 114 10920 Sierra Leone . . 5.1 6.9 90 102 1121 Sudan 14.7 9.0 12.4 -3.3 67 66 5 ;7, 8
22 Ghana 43.4 1.0 15.0 -0.4 76 111 623 Senegal . .14.3 -2.8 169 151 8 5 24 Chad ... .... .23
25 IozambIque 4.6 18.6 9.3 1.5939 13
Míddle-Income oil importera 5.6w 3.6w S.lv 1.9V 280v 339v 4w
26 Mauritania . 16.0 3.6 48 130 227 Liberia 37.0 -0.4 16.1 1.9 181 357 628 Zambia 26.3 6.4 1.6 1.? 464 432 5
29 Lesotho . .. ..
30 Ivory Coast 0.5 45.8 1).9' 5.1 109 1865131 Zimbabve 1.8 -2.6 9.9 0.5 441 491(.
32 Swaziland 18.9 2.1 15.2 2.6 112 24633 Botsvana 8.4 7.7 7.8 8.9 207 41534 Nauritius 3.1 .5.1 11.9 0.5 163 316 6
Niddle-income oíl exportera 32.5v -2.9Y 10.3v 11.6v 3v 163v 5w
35 Nigeria 33.4 -4.4 9.6 15.4 33 150 736 Cameroon 1.2 45.6 6.5 8.0 67 128 6 4a37 Congo, Peop1cs, lep. 33.4 10.5 7.5 11.9 90 216 8
38 Gabon 24.3 -2.6 27.3 0.9 110 1.355 339 Angola 47.1 -1.0 10.6 4.1 111 226 2
Sub-Saharán Africa 28.9v -2.1v 9.4v 4.5v 62v 110v 6v
All lov-income economnies 10.0v 6.1w 9.7v 5.5Y 128v 276v 8v
All lower aiíddle-incomeeconomies 15.9v 2.2v 7.4v 5.5v 183w 382w 8v
All upper middle-incomeeconomies 6.8v -0.8v B.ív 5.1v 646, 1,225v 8v 29v
Industrial merket economies 3.2w 1.6V 5.2w 0.1v 3,764w
4,733w liv 25v
a. Figures are for 1981 or 1982, not 1983.
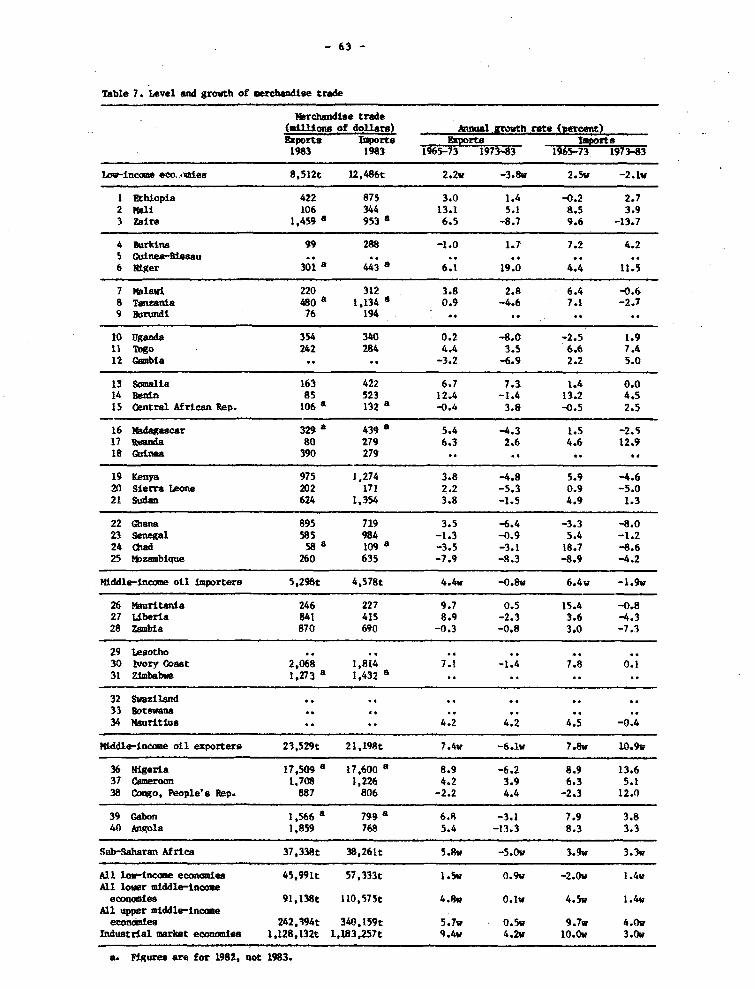
- 63 -
Table 7. ̀Level aud growth of merchandise trade
Merchandise trade(millliona of dollara) k~nnal -rowth rate (<peceat)Export8 Importo Esporte Importo1983 1983 1965-73 1973-83 1965-73 1973-83
Lo -incoze ecmo. ies 8,512t 12,486t 2.2w -3.8v 2.5v -2.1v
1 Ethiopia 422 875 3.0 1.4 -0.2 2.72 Mali 106 344 13.1 5.1 8.5 3.93 Zaire 1,459 a g53 a 6.5 -8.7 9.6 -13.7
4 Burkina 99 288 -1.0 1.7 7.2 4.25 Oainea-iassau .. .. ..6 Niger 301 a 443 a 6.1 19.0 4.4 11.
7 Malawi 220 312 3.8 2.R 6.4 -0.68 Tanzenia 480 a 1,134 8 0.9 -4.6 7.1 -2.79 BSrundí 76 194 .. .. ..
10 Uganda 354 340 0.2 -8.0 -2.5 1.911 Togo 242 284 4.4 3.5 6.6 7.412 Guabia .. .. -3.2 -6.9 2.2 5.0
13 Somalia 163 422 6.7 7.3 1.4 0.014 Benin 85 523 12.4 -1.4 13.2 4.515 Central African Rep. 106 a 132 a -0.4 3.8 -0.5 2.5
16 Madagascar 329a 439 a 5.4 -4.3 1.5 -2.517 RnaD 80 279 6.3 2.6 4.6 12.918 Guinea 390 279 .. .. ..
19 Kenya 975 1,274 3.8 -4.8 5.9 -4.620 Sierra Leone 202 171 2.2 -5.3 0.9 -5.021 Sudan 624 1,354 3.8 -1.5 4.9 1.3
22 Ghana 895 719 3.5 -6.4 -3.3 -8.023 Senegal 58S 984 -1.3 -0.9 5.4 -1.224 Chd 58 a 109 a _3,5 -3.1 18.7 -8.625 )t~zubique 260 635 -7.9 -8.3 -8.9 -4.2
Middle-income oíl importers 5,298t 4,578t 4.4w -0.8w 6.4w -1.9v
26 Mauritwana 246 227 9.7 0.5 15.4 -0.827 Llberia 841 415 8.9 -2.3 3.6 -4.328 Zambia 870 690 -0.3 -0.8 3.0 -7.3
29 Lesotho .. .. .. ..30 Ivory Coaset 2,068 1,814 7.1 -1.4 7.8 0.131 Zimbabse 1,273 a 1,432 a
32 Swaziland .. .. ..33 Bote~ana .. .. ..34 Mauritius .. .. 4.2 4.2 4.5 -0.4
Middle-income otl espartera 23,529t 21,198t 7.4w -6.1w 7.8w 10.9v
36 Nigeria 17,509 a 17,600 a 8.9 -6.2 8.9 13.637 Cameroon 1,708 1,226 4.2 3.9 6.3 5.138 Co~go, People's Rep. 887 806 -2.2 4.4 -2.3 12.0
39 Gabon 1.566 a 9a 6. -3.1 7.9 3.840 ~igola 1,859 768 5.4 -13.3 8.3 3.3
Sub-Saharan Africa 37,338t 38,261t 5.Rw -5.0w 3.9w 3.3w
All low-income econcmiea 45,991t 57,333t 1.5w 0.9w -2.0v 1.4wAll lower middle-ineomeeconomdes 91,138t 110,575t 4.8w 0.1w 4.5w 1.4w
All upper middle-incameeconoas 242,194t 340,159t 5.7w O.Sv 9.7w 4.0v
Industrial market econies 1,128,132t 1,183,257t 9.4w 4.2w 10.Ov 3.0w
a. Flgures are for 1982, not 1983.
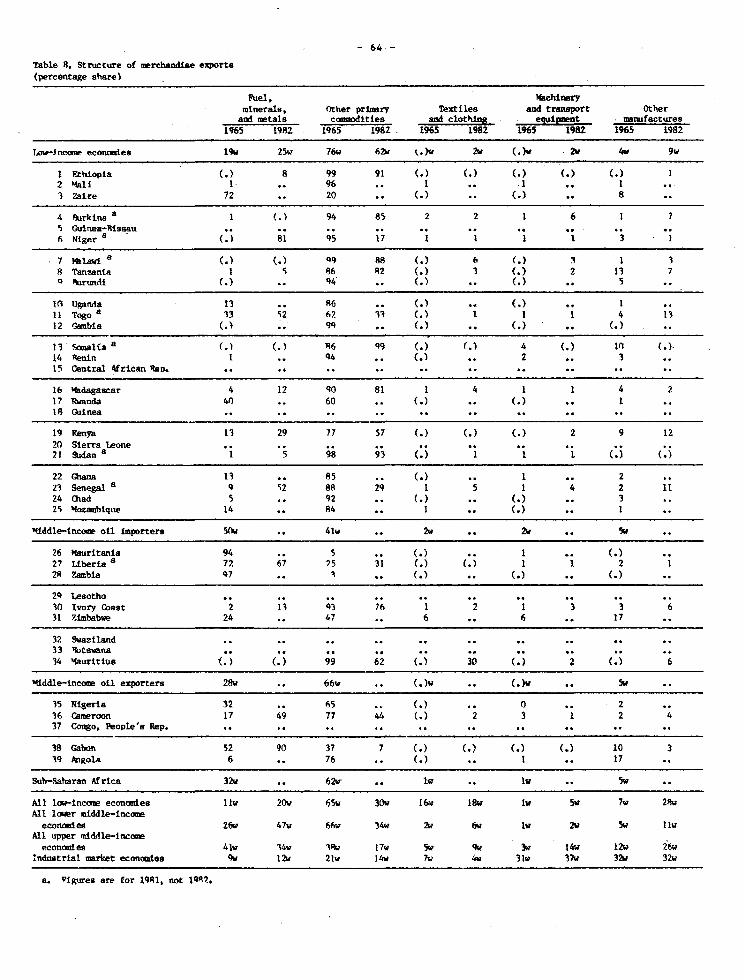
-64-
Table S. Structnure of merchand1ae exporte<percentage ehare)
Fuel, %.ehínerymínerals. Other prlmary Textiles and transprt Other
allÉ neta1s cxuoities- and clotMn equIpment mamfactures1965 1982 1965 1982 1965 1982 196 1982 1965 ¡982
lov-.fnccsw ecornsue 19v 25v 76w 62v k.)v 2v (.)v 2v 4w 9w
1 Ethlopia (.3 8 99 91 (. (3 . <.> (.3
2 Mali 1 96 . 1 1, 13 Zaire 72 .. 20 .. (3. . .8
4 Surkina 81 (3 94 8s 2 2 1 6 175 Guinea-8Nissau . . . . . ..6 Niget
8a . 1 9 7
7 M~ ai (.3 (3 99 88 (.6 <3 13ftTanzanta 1 5 86 82 (13 (3 2 13 7OPNir.md(i (. . q4 .. (3. . .5
10 Uganda 13 .. 6 .. (3.. (3. 1I TORO
81332 62 33 (. 1 1 1 4 13
13- %,owlaa ~ <. <.3 99 . (.3 4 (313 (3
14 Aenin 1 .. 4 . (...2 .. 315 Central 4frican Re. .. . . . ..
16 Mdagascar 4 12 <10 81 1 4 1 1 4 217 wanda 40 . 60 . . . (3.
19 Kenya 13 29 77 57 (3 (3. 2 9 1220 SIerra Leone . . . . . ..
21 Sudan5
1 a8 9 . . .
22 Ghana 13 As8 . (. .1. 223 Senegal a 9 52 88 29 1 5 1 4 2 124 Chad 5 .. 92 .. (3. . .3
25 Mozamique 14 .. 84 .. 1 . (3..1
Middle-Incose oíl importear 5(h . 41w .. 2v 2v .. 5
26 MaurItania 94 .. 5 . . .1 .
27 LIbería a 72 67 2l.5 31 .3 (311 2 29 Zambia 97 ... . . (3. .
29 Lesotho . . . . . ..
30 lvory Coast 2 1 3 7 31lZimbabwe 24 .. 47 6 .6 .. 17
32 Swazil.and . . . . . ..
34 '<aurlrlus <3 (1 9 2 (33 . .
Middle-Incoqe oil exporters 28v . 66V . (3 . <3 .3
35 Nigerla 32 .. 65 .. (3..o . 236 Camroon 17 49 77 44 (32 3 1 2437 Congo, People's Rep. . . . . . ..
36 Gabon 52 90 37 7 (3 ( ( ( 10 3
39) igo1a 6 .. 76 .. (3. .17
Snuh-Saharan AfrIca 32v . 62r< . w .. Iv .5v
All l~-incom econwaIes liv 20v 65w 30v 16w4 18v lv 5w 7w 28wAll 1o~r míddle-incme
econ~iee 26w 47 6w 34v 2v 6v lv 2v 5v 11vAll uxpper míddA1e-Incoiie
econonele 41w 36v lRv 17w 5v 9v 2v 14w 12w 26wInduatrial uarket economnles 9v 12v 21v 14v 7w 4w 31v 37v 32v 32v
a. 5Pigurea are for 1391, not 19R?.
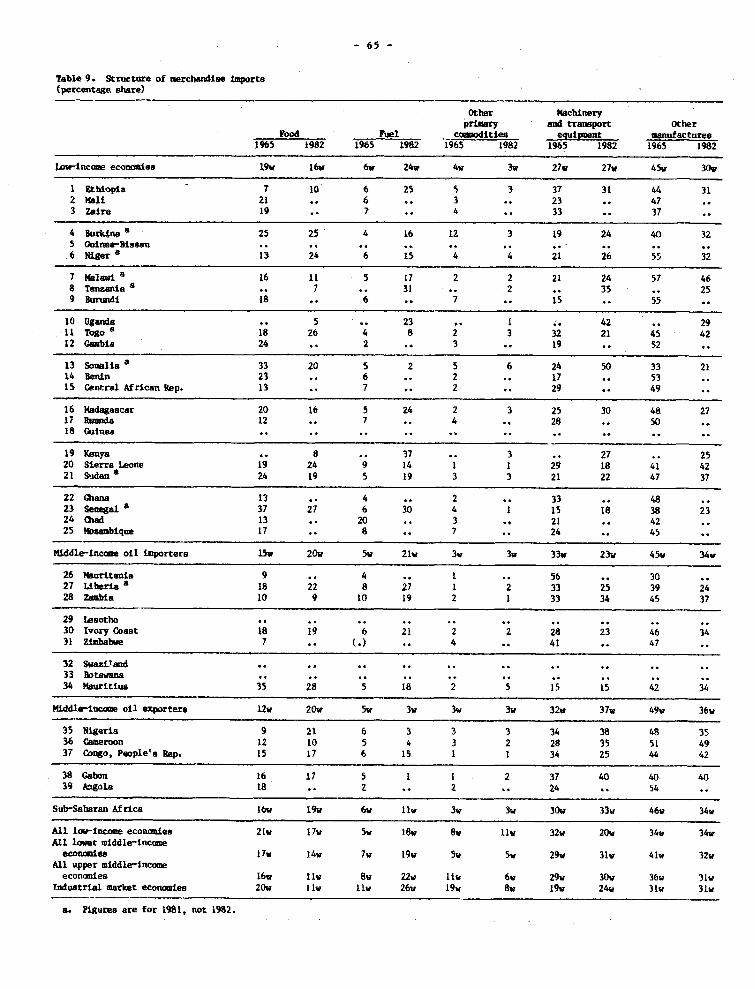
-65-
Table 9. structure of m.tchan*i. Imrte<percentage aliare)
Other ftachineryprlmary aníl tranaprt Other
Foad Fuel -~cauoditien iaan mufacturee1965 1982 1í65 1982 1965 1982 1965 1982 1965 1982
Low-incc.e econ eoie 19v 16v 6w 24v 4v 3w 2?w 27v 45v 30v
I8lihiopia 7 10 6 25 5 3 37 31 44 312 ma11 21 .. 6 .3 .. 23 .. 473 Zalre 19 .. 7 4 .. 33 .. 37
4 Eurklno 1125 25 4 16 12 3 19 24 40 325 Guinea-Eia*u .. . . . ..
.6Niger' 13 24 6 5 44 21 26 55 32
7 Me~ 11 ~~~16 11 5 17 2 2 21 24 57 468 Te~&ia 7 .. 31 2 .. 35 .. 259 Burundí 18 .. 6 .. 7 15 .. 55
í0 uganda 5 23 1 ~ . 42 29íI1Togo a 18 26 4 2 3 32 21 45 42l2 Ganbia 24 .. 2 .. 3 .19 .. 52
13 Somaliaa 33 20 5 2 5 6 24 50 33 2114 Benin 23 .. 6 .. 2 17 .. 5315 Central African Rep. 13 7 .. 2 .29 .. 49
16 Madagacar 20 16 5 24 2 3 25 30 48 2717 ,and 12 .. 7 .. 4 28 so 518 Guinea . ....
19 Kenya .. 8 .. 37 .. 3 .. 27 2520 Sierra Leone 19 24 9 14 1 1 29 18 41 4221S5.~ an 24 19 5 19 3 3 21 22 47 37
22 Ghana 13 4 2 33 .. 4823 sen ia1 37 27 6 30 4 1 15 18. 38 2324 Chad 13 .. 20 .. 3 .. 21 .. 4225 muambique 17 .. 8 .. 7 24 .. 45
lUddle-incanme oil imprtera 15w 20W 5v 21v 3v 3w 33v 23v 45v 34 w
26 Mauritania 9 .. 4 .. 1 .56 .. 3027 Liberia 8 18 22 8 27 1 2 33 25' 39 2428 Zamiba 10 9 10 19 2 1 33 34 45 37
29 Lesotho .. .. .
30 Ivory Coaat 1 96 2 82 6331 Zirnbobve 7 .. ()4 41 .. 47
32 SwvLazt sd . . . .
34 Mauritius 3 85 1 51 23
Midle-iucgin oíl exportere 12v 20v 5w 3w 3w 3w 32w 3 7v 49w 36v
35 41geri.a 9 21 6 3 3 3 34 38 48 3536 Caseroon 12 10 5 4 3 2 28 35 s1 4937 ~ono, Peop1e'a Rep. 15 17 6 15 1 1 34 25 44 42
38 Gsbon 16 17 5 1 1 2 37 40 40 40
39 ingota 18 .. 2 2 .. 24 54
Sub-Sshsran Afríca 16w 19% 6w 11v 3v 3v 30v 33v 46w 34v
All lou-lacose econaneg 21v 17v 5w 18v 8v liv 32v 20v 34w 34wAhi Iver eiddle-l-ncome
eeconmies 17v 14 v 7v 19v Si? 5w 29v 31v 41v 32vAlí upper míddle-inc~m
econonea 16w liv 8w 22w 11v 6v 29v 30v 36w 31WIndustrWa market econamies 20w 11w liv 26w 19V 8w 19v 24v 31v 31v
a. figures are for 1981, not 1982.
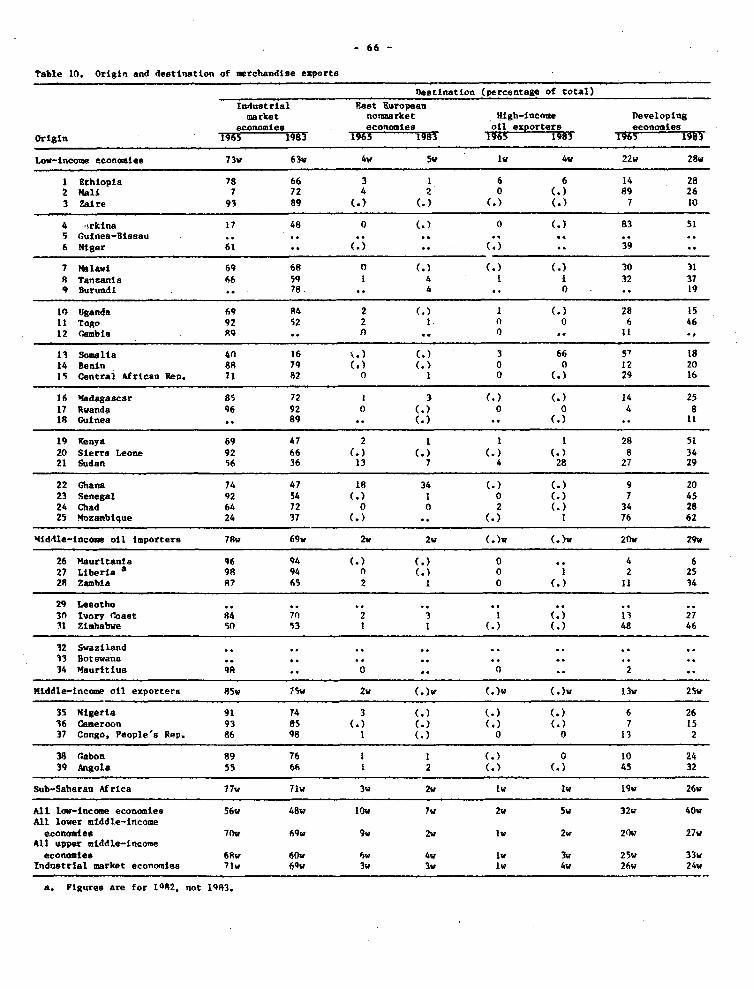
-66-
Table 10. Origin and destination of metchandise exporte
Oeatination (percentage of total)
Industrial East Europeanmarket nonmarket tligh-income Developing
economies economies oilexporters economiesOrigin 1965 1983 1965 19833 1§ó5 1953
Low-incone economies 73w 63v 4w 5w tu 4w 22v 28w
1 Ethiopta 78 66 3 1 6 6 14 282 Mali 7 72 4 2 0 <.3 89 263 Zaire 91 89 (.> (.3 (.3 <.) 7 10
4 srktn8 17 48 0 (.) O (.) 83 515 Gutnea-Bissau . .. ..6 Niger 61 .. (.3 .. (.3 .. 39
7 Mtlawt 69 68 0 (.) (.) (.3 30 31A Tanlanta 66 59 1 4 1 1 32 . 379 Burundi ,. 78 .. 4 .. O - .. 19
10 Uganda 69 84 2 (.G 1 (.) 28 1511 Togo 92 52 2 1 n 0 6 4612 rambia R9 * n ,. O .. 11
13 Somalta 4n 16 t.l (.) 3 66 57 1814 8enin 88 79 (,) <.30 0 12 2015 Central 7frtcn Rep. 71 82 0 1 0 (.1 29 16
16 '4adagascar 85 72 1 3 .3( 14 2517 Rwands 96 92 0 (.3 0 0 4 818 Guinea .. 89 .. <.3 *- (.) 11
19 Xenya 69 47 2 1 1 1 28 5120 Sierra Leone 92 66 <.) (.) (.) (.3 8 3421 Sudan 56 36 13 7 4 28 27 29
22 Ghana 74 47 18 34 (.) (.) 9 2023 Senegal 92 54 <.) 1 0 (.) 7 4524 Chad 64 72 0 0 2 <.) 34 2825 Mozambíque 24 37 (.) .. (.) 1 76 62
Middle-Income oil Importere 78V 69w 2w 2v (.)w (.)w 20v 29w
26 Maurttanta 96 94 (.) (.) 0 .. 4 627 Libertaa 98 94 0 (,) 0 1 2 2528 Zambia 87 65 2 I0 <.3 11 14
29 Lesotho30 lvory Coast 84 72 2 3 1 (.) 11 2711 Zimhabwe 50 53 t 1 (.) (.) 48 46
12 Svazxland ..13 Botswana .. .. .. .. ..34 Maurttius 9R .. O .. O .. 2
Middle-itcome oíl exportare 85w 75w 2w (.w (.}w (.)w 13v 25v
35 Etigeria 91 74 3 (.G (.) (.) 6 2636 Cameroon 93 85 (.3 (.) (.3 (.) 7 1537 Congo, People's Rep. 86 98 1 (.)0 0 13 2
38 Gabon 89 76 1 1 (.) 0 10 2439 Angola 55 66 1 2 (.) (.) 45 32
Sub-Saharan Africa 77w 71w 3w 2w lv lv 19v 26w
All lo-incomse econoies 56w 48w lOw 7w 2v 5w 32v 40wAll lower mlddle-tnceme
economies 70v 69w 9w 2w lw 2w 20w 27vA11 upper middle-incoie
economies 68v 60w 6w 4w lw 3w 25v 33wIndustrial market econoales
71w 6vw 1w 3w lw 4w 26w 24w
a. Pigures are for 1082, not 1q83.
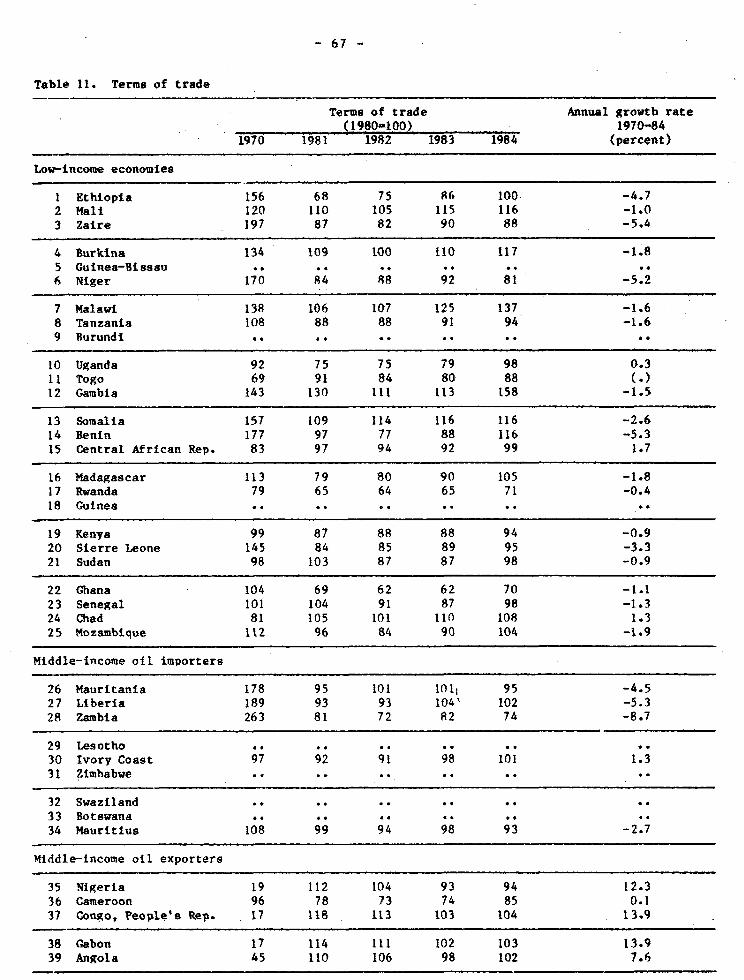
- 67 -
Table 11. Terms of trade
Terms of trade Annual growth rate(1980-100) 1970-84
1970 1981 1982 1983 1984 (percent>
Low-income economies
1 Ethiopia 156 68 75 86 100 -4.72 Mall 120 110 105 115 116 -1.03 Zaire 197 87 82 90 88 -5.4
4 Burkina 134 109 100 110 117 -1.85 Guinea-Bisasu .. .. ..6 Niger 170 84 88 92 81 -5.2
7 Malawi 138 106 107 125 137 -1.68 Tanzania 108 88 88 91 94 -1.69 Burundi .. .. ..
10 Uganda 92 75 75 79 98 0.311 Togo 69 91 84 80 88 (.)12 Gambia 143 130 111 113 158 -1.5
13 Somalia 157 109 114 116 116 -2.614 Benin 177 97 77 88 116 -5.315 Central African Rep. 83 97 94 92 99 1.7
16 Madagascar 113 79 80 90 105 -1.817 Rwanda 79 65 64 65 71 -0.418 Guinea .. .. .. .. ..
19 Kenya 99 87 88 88 94 -0.920 Sierre Leone 145 84 85 89 95 -3.321 Sudan 98 103 87 87 98 -0.9
22 Ghana 104 69 62 62 70 -1.123 Senegal 101 104 91 87 98 -1.324 Chad 81 105 101 110 108 1.325 Nozambique 112 96 84 90 104 -1.9
Middle-income oil importers
26 Mauritania 178 95 101 101 95 -4.527 Liberia 189 93 93 104' 102 -5.328 Zambia 263 81 72 82 74 -8.7
29 Lesotho .. .. .. .. ..
30 Ivory Coast 97 92 91 98 101 1.331 Zimbabwe .. .. .. .. ..
32 Swaziland .. .. ..
33 Botswana .. .. ..
34 Mauritius 108 99 94 98 93 -2.7
Middle-income oíl exporters
35 Nigeria 19 112 104 93 94 12.336 Cameroon 96 78 73 74 85 0.137 Congo, People's Rep. 17 118 113 103 104 13.9
38 Gabon 17 114 111 102 103 13.939 Angola 45 110 106 98 102 7.6
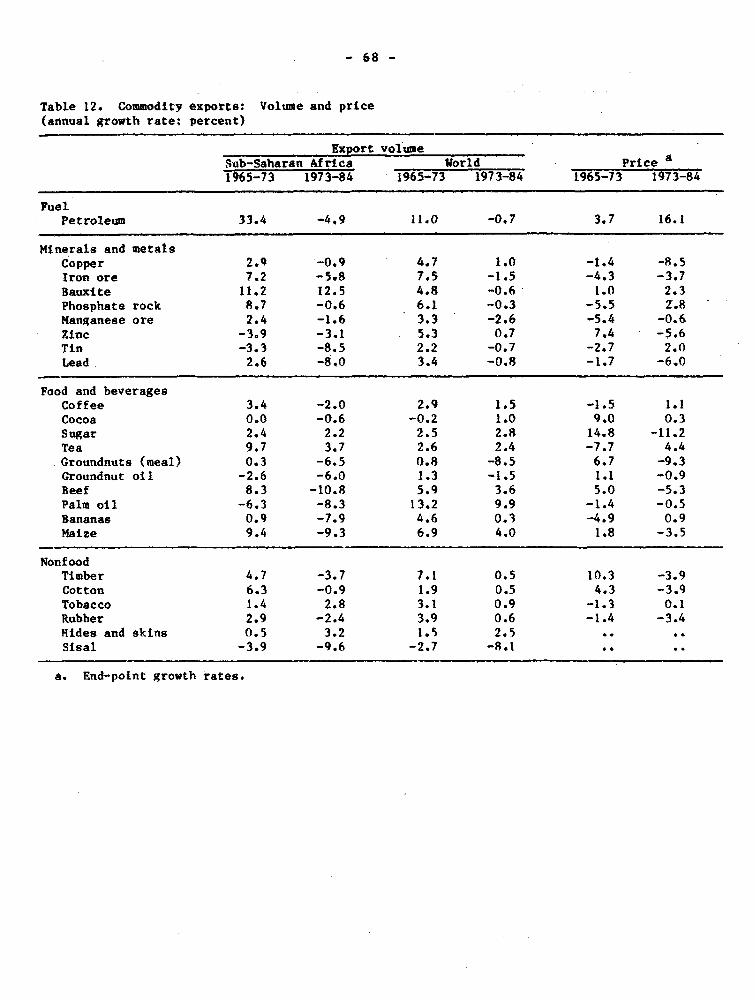
- 68 -
Table 12. Commodity exporte: Volume and price(annual growth rate: percent)
Export volumeSub-Saharan Africa World Price a1965-73 1973-84 1965-73 1973-84 1965-73 1973-84
FuelPetroleum 33.4 -4.9 11.0 -0.7 3.7 16.1
Minerals and metalsCopper 2.9 -0.9 4.7 1.0 -1.4 -8.5Tron ore 7.2 -5.8 7.5 -1.5 -4.3 -3.7Bauxite 11.2 12.5 4.8 -0.6 1.0 2.3Phosphate rock 8.7 -0.6 6.1 -0.3 -5.5 2.8Manganese ore 2.4 -1.6 3.3 -2.6 -5.4 -0.6Zinc -3.9 -3.1 5.3 0.7 7.4 -5.6Tin -3.3 -8.5 2.2 -0.7 -2.7 2.0Lead. 2.6 -8.0 3.4 -0.8 -1.7 -6.0
Food and beveragesCoffee 3.4 -2.0 2.9 1.5 -1.5 1.1Cocoa 0.0 -0.6 -0.2 1.0 9.0 0.3Sugar 2.4 2.2 2.5 2.8 14.8 -11.2Tea 9.7 3.7 2.6 2.4 -7.7 4.4Groundnuts (meal) 0.3 -6.5 0.8 -8.5 6.7 -9.3Groundnut oil -2.6 -6.0 1.3 -1.5 1.1 -0.9Beef 8.3 -10.8 5.9 3.6 5.0 -5.3Palm oil -6.3 -8.3 13.2 9.9 -1.4 -0.5Bananas 0.9 -7.9 4.6 0.3 -4.9 0.9Maize 9.4 -9.3 6.9 4.0 1.8 -3.5
NonfoodTimber 4.7 -3.7 7.1 0.5 10.3 -3.9Cotton 6.3 -0.9 1.9 0.5 4.3 -3.9Tobacco 1.4 2.8 3.1 0.9 -1.3 0.1Rubber 2.9 -2.4 3.9 0.6 -1.4 -3.4Hides and skins 0.5 3.2 1.5 2.5 ..Sisal -3.9 -9.6 -2.7 -8.1 ..
a. End-point growth rates.
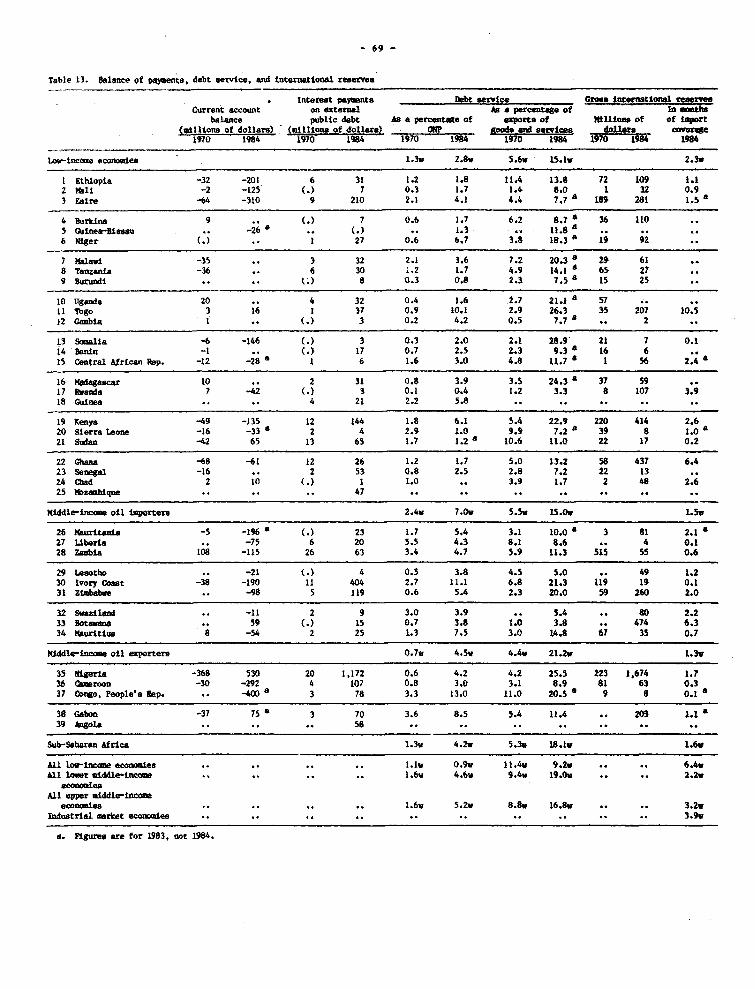
-69
Table 13. Balance of paymets, diebt uetvice. ani tnternational reservea
Interesí payesnts I3bt service G~oe ut$erntnl~ reseveCOirent accout os externe to a percentage of in u¡mtba
balance public debt As a per~ctge of exprte of ?4lflons of of iq~rt<o1lon of d Ilgar) - (mt lbsof doU.ar) oEP monde0 Sad aerk doflare corroj
197-0 1984 W19-70 1984 1970 1984 ¡90 1984 1970 1984 1984
¡,t-ncoma econoaea 1.3v 2.Bv 5.6v 13.1v 2.3v
1 Ethiopia -32 -201 6 31 1.2 1.8 11.4 13.8 72 109 1.12 i41i -2 -125 (17 0.3 1.7 1.4 8.0 1 32 0.9
3 Zaire -64 -310 9 210 2.1 4.1 4.4 7.7 0 189 281 1.5 a
4 Burkina 9 .. ). 7 0.6 1.7 6.2 8.7 & 36 ¡l05 Guiiie-Biaw . -26' .. <. 1.3 .. 11.8 '
6 Niger (. .1 27 0.6 6.7 3.8 18.3 a 19 92
7 K~av -35 .. 3 32 2.1 3.6 7.2 20.3' 29 618 Tanzsna -36 .. 6 30 i.2 1.7 4.9 14.1~ 65 279 Burundi . * .>8 0.3 0.8 2.3 7.5'a 13 25
10 Tganda 20 .. 4 32 0.4 1.6 1.7 21.1'a 5711 Togo 3 16 1 37 0.9 10.1 2.9 26.3 35 207 10.512 ~alba 1 .. ()3 0.2 4.2 0.5 7.7 *. 2
13 Somalia -6 -146 (.3 3 0.3 2.0 2.1 28.9_ 21 7 0.114 Banin -1 .. .> 17 0.7 2.3 2.3 9.3 16 615 central Afinan ROp. -12 -28 a 1 6 1.6 3.0 4.8 11.7 ' 1 56 2.4 a
16 N~dgea 10 .. 2 31 0.6 3.9 3.3 24.3 a 37 5917 R~nd 7 -42 <.> 3 0.1 0.4 1.2 3.3 8 107 3.9ISCGuinea . 4 21 2.2 3.8. .
19 kCenya -49 -135 12 144 1.8 6.1 5.4 22.9 220 414 2.620 SierreL1eona -16 -33'a 2 4 2.9 1.0 9.9 7.2'a 39 8 1.o'21 Sstan -42 65 13 65 1.7 1.2'a 10.6 ¡1.0 22 17 0.2
22 ~'in -68 -61 12 26 1.2 1.7 5.0 13.2 58 437 6.423 Senegal -16 .. 2 53 0.8 2.5 2.8 7.2 22 1324QWd 2 10 (31 1.0 .. 3.9 1.7 2 48 2.623 mzomabique .. . . 47 ... .
I4iddle-incaa oil iipera 2.4v 7.0, 5.5v 13.0, 1.5,
26 Mauitni -5 -196' (3 23 1.7 5.4 3.1 10.0' 3 81 2.1'27 Liberiae. -75 6 20 5.3 4.3 841 8.6 .. 4 0.128 Z~lba 108 -115 26 63 3.4 4.7 5.9 11.3 515 55 0.6
29 Lesotho .. -21 .34 0.5 3.8 4.5 5.0 .. 49 1.230 Ivory Coat -8 -190 11 404 2.7 11.1 6.8 21.3 119 19 0.131 ZiOb.i~ . -98 5 119 0.6 5.4 2.3 20.0 59 260 2.0
32 Swailn .. -11 2 9 3.0 3.9 .. 5.4 .. 80 2.233 Botavan . 59 (.3 15 0.7 3.8 1.0 3.8 .. 474 6.334 14auriti1u 8 -54 2 25 1.3 7.5 3.0 14.8 67 35 0.7
?~lide-¡ c.aeoi exprtear 0.7v 4.5v 4.4w 21.2, 1.3v
35 ¡ligea -368 530 20 1.172 0.6 4.2 4.2 25.5 223 1,674 1.736 !¡amroon -30 -292 4 107 0.8 3.0 3.1 8.9 81 63 0.337 Cotuo, peoplaes I.ep. .. -4 a 3 78 3.3 13.0 11.0 20.5 '1 9 8 0.1 a
38 Gabon -37 75'a 3 70 3.6 8.5 5.4 11.4 .. 20-3 1.1'a39 Aigol.a .. . . 58 .... .
Sub-Saharan Africa 1.3v 4.2vw 5.3v 18.1v 1.6v
All 1ov-In~ eco~oia .. . . . .1, 0.9v 11.4v 9.2V . . 6.4vAh lae eid1e-ucq.. . . 1.6V 4.6v 9.4» 19.0v .. . 2.2v
eenaale.All uppr siddle-inccu
aconeje . . . . 1.6V 5.2v 8.av 16.8, .. . 3.2vindustrial aarlt cc fes . . . . .. . . . . 3.9v
a. Ylgures ere for 1983, no 184
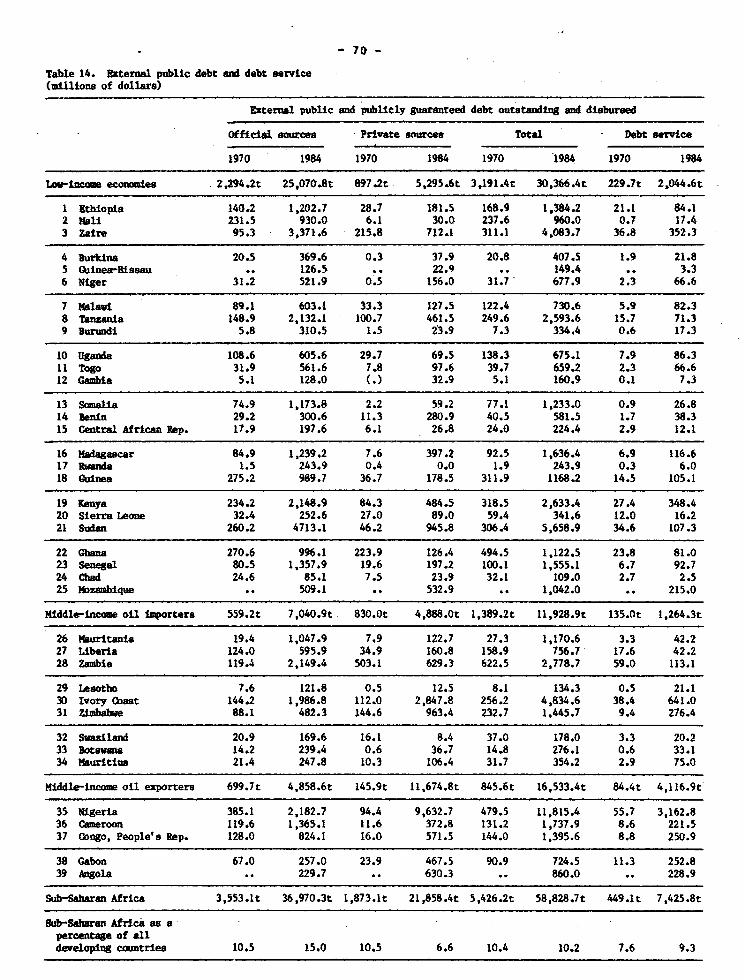
- 70 -
Table 14. bxternal public debt and debt service(millions of dollars)
External publie and publly guaranteed debt outstanding and dlsburoed
Official ma~rces Private sources Total - Debt service
1970 1984 1970 1984 1970 1984 1970 1984
Lm.-incoe ecoixuies 2,294.2t 25,070.8t 897.2t 5,295.6t 3,191.4t 3Q,366.4t 229.7t 2,044.6t
1 Etbiopia 140.2 1,202.7 28.7 181.5 168.9 1,384.2 21.1 84.12 Mali 231.5 930.0 6.1 30.0 237.6 960.0 0.7 17.43 Zaire 95.3 3,371.6 215.8 712.1 311.1 4,083.7 36.8 352.3
4 Burkina 20.5 369.6 0.3 37.9 20.8 407.5 1.9 21.85 Qidjea-Bissau .. 126.5 .. 22.9 .. 149.4 .. 3.36 Niger 31.2 521.9 0.5 156.0 31.7- 677.9 2.3 66.6
7 Ya~l 89.1 603.1 33.3 127.5 122.4 730.6 5.9 82.38 Tanzania 148.9 2,132.1 100.7 461.5 249.6 2,593.6 15.7 71.39 Burundi 5.8 310.5 1.5 23.9 7.3 334.4 0.6 17.3
10 Uganda 108.6 605.6 29.7 69.5 138.3 675.1 7.9 86.311 Togo 31.9 561.6 7.8 97.6 39.7 659.2 2.3 66.612 Gambia 5.1 128.0 (.> 32.9 5.1 160.9 0.1 7.3
13 Somalia 74.9 1,173.8 2.2 59.2 77.1 1,233.0 0.9 26.814 Benln 29.2 300.6 11.3 280.9 40.5 581.5 1.7 38.315 Central African Rep. 17.9 197.6 6.1 26.8 24.0 224.4 2.9 12.1
16 Nadagsacar 84.9 1,239.2 7.6 397.2 92.5 1,636.4 6.9 116.617 Ran~d 1.5 243.9 0.4 0.0 1.9 243.9 0.3 6.018 Guinea 275.2 989.7 36.7 178.5 311.9 1168.2 14.5 105.1
19 enaya 234.2 2,148.9 84.3 484.5 318.5 2,633.4 27.4 348.420 Sierra Leone 32.4 252.6 27.0 89.0 59.4 341.6 12.0 16.221 Sedan 260.2 4713.1 46.2 945.8 306.4 5.658.9 34.6 107.3
22 Ghuma 270.6 996.1 223.9 126.4 494.5 1,122.5 23.8 81.023 Senegal 80.5 1,357.9 19.6 197.2 100.1 1,555.1 6.7 92.724 Chad 24.6 85.1 7.5 23.9 32.1 109.0 2.7 2.525 Mazambique .. 509.1 .. 532.9 .. 1,042.0 .. 215.0
Middle-íineoe oil importers 559.2t 7,040.9t 830.Ot 4,888.0t 1,389.2t 11,928.9t 135.0t 1,264.3t
26 Mauritania 19.4 1,047.9 7.9 122.7 27.3 1,170.6 3.3 42.227 Liberia 124.0 595.9 34.9 160.8 158.9 756.7 17.6 42.228 Zambia 119.4 2,149.4 503.1 629.3 622.5 2,778.7 59.0 113.1
29 Lesotho 7.6 121.8 0.5 12.5 8.1 134.3 0.5 21.130 Ivory Guaat 144.2 1,986.8 112.0 2,847.8 256.2 4,834.6 38.4 641.031 Ziac bwa 88.1 482.3 144.6 963.4 232.7 1,445.7 9.4 276.4
32 Swaziland 20.9 169.6 16.1 8.4 37.0 178.0 3.3 20.233 Botswsna 14.2 239.4 0.6 36.7 14.8 276.1 0.6 33.134 Naurttius 21.4 247.8 10.3 106.4 31.7 354.2 2.9 75.0
Mlddle-income oil exporters 699.7t 4,858.6t 145.9t 11,674.8t 845.6t 16,533.4t 84.4t 4,116.9t'
35 Nigeria 385.1 2,182.7 94.4 9,632.7 479.5 11,815.4 55.7 3,162.836 Cmroon 119.6 1,365.1 11.6 372.8 131.2 1,737.9 8.6 221.537 Congo, People's Rep. 128.0 824.1 16.0 571.5 144.0 1,395.6 8.8 250.9
38 Gabon 67.0 257.0 23.9 467.5 90.9 724.5 11.3 252.839 Angola .. 229.7 .. 630.3 .. 860.0 .. 228.9
Sub-Saharan Africa 3,553.1t 36,970.3t 1,873.1t 21,858.4t 5,426.2t 58,828.7t 449.1t 7,425.8t
ub-Sahran Africa sa apercentsge of alldeveloping countries 10.5 15.0 10.5 6.6 10.4 10.2 7.6 9.3
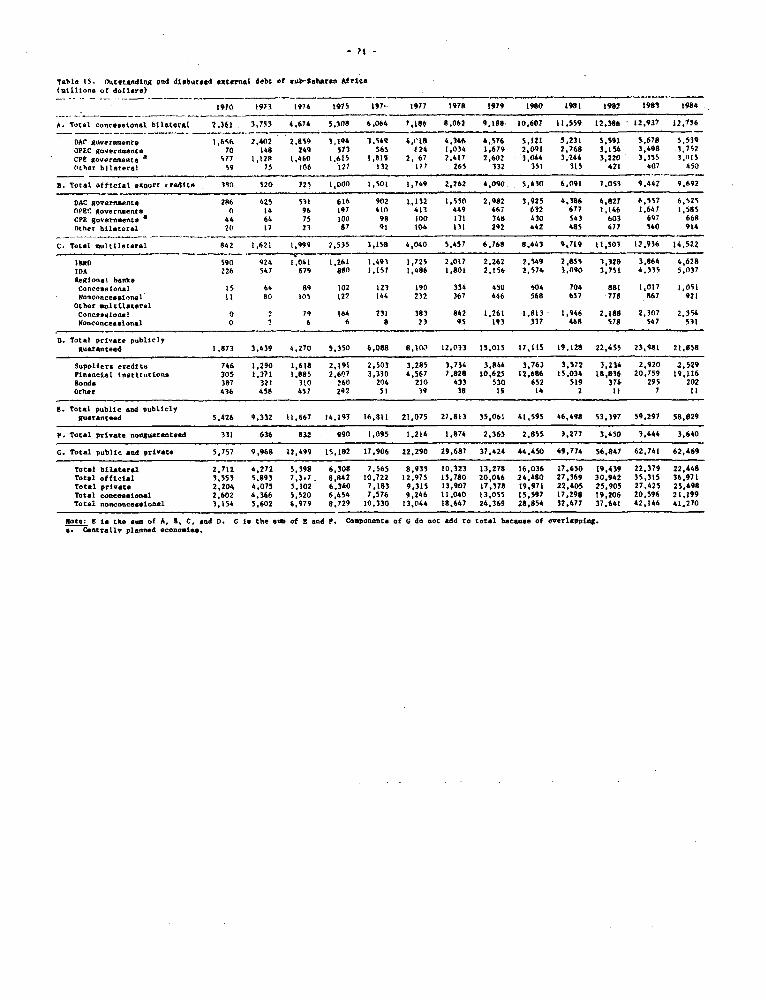
?1 -
Table t5. flotqt*ndtg sed díSbuto<d exteroal debt of aub-Sharea Afvlíca(atIltona of dolloa>_
1970 1973 t974 1975 197'- 1977 1978 19t9 1980 1981 1982 n983 Is984
A. Tolal conaesatonal b611 erail 2.361 3.753 4.674 5,308 6,064 7,186 8.n62 9,168 10.607 11.559 12.386 12,937 12.156
DAI' goveronnta 1,634 2,402 2,859 1,194 3,549 4,1í18 4,346 4,576 5.121 5.231 5,59l S.678 5,519OPEC goveromaoto 70 148 249 311 565 t24 1,034 1,679 2,091 2,768 3,154 3,498 13752CPR 8ovrrnoent a s77 1,128 1,460 1,615 1,819 2, 67 t.417 2,602 3,044 3,244 3.220 3,355 3,nisOther bilateral 59 75 106 127 132 17t 265 332 351 315 421 407 450
B. Total offletat etport credlot 350 S20 725 1,000 1,501 1,749 2,262 4.090 5,430 S.091 7,053 9*447 9,892
DAC Roveramento 286 425 539 616 902 1,132 1,550 2,982 3,925 4,386 4.827 6,557 6,b2SOPeC governoeatot 0 14 96 197 410 413 449 447 632 677 1,146 1,641 1,585CPR governoeno a 44 64 75 100 98 100 131 348 410 543 603 697 668Other bilateral 20 17 23 67 91 104 131 292 442 483 477 540 914
C. Total ríultartéral 842 1,62; 1,999 2,535 3,158 4,040 5,457 6,768 8,443 9,119 11t,03 12.936 14,52Z
IbR0 590 924 1.041 1,261 1.491 1,725 2,017 2,2h2 2,549 2,855 3,328 3,864 4,628IDA 226 547 679 880 1,157 1,486 1.801 2,156 2,574 3.090 3,751 4,315 5,037Regional banksConreselonal 15 64 89 102 123 190 334 450 504 704 881 1,017 1,051Nonconeesaton.l 11 80 105 122 144 232 367 446 568 657 778 867 921
Other ,lrtltaceralConteesolooal 0 2 J9 1ú4 231 383 842 1.261 1,813 1,946 2,188 2,307 2,354Noneonceasíooal 0 1 6 6 a 23 95 193 337 468 518 547 531
D. Total private poubl1elRuaranteed 1,873 3,439 4,270 5,350 6,088 8,10' 12,033 15.015 17,115 19.128 22,45S 23,481 21,8S8
SupPllera eredlt. 746 1,290 1,618 2,191 2,503 3,285 3,734 3,844 3,763 3,572 3,234 2,920 2,529Finanecal inatttotiOna 305 1,371 1,885 2,607 3,330 4,567 7,828 10.625 12,686 15.034 18,8ñ6 20,759 19,116Ronda 387 321 310 260 204 210 433 530 652 519 374 295 202Other 436 458 457 292 si 39 38 ES 14 2 11 7 11
P. Total Publio and publlelyguaranteed 3.426 9,332 11,667 14,193 16,811 21,075 27,813 35,061 41,595 46,498 53,391 59,297 58,829
Y. Total Prívate nonguaranteed 331 636 832 990 1,095 1,214 1.874 2,363 2,855 3,277 3,450 3,444 3.640
C. Total public and private 5,757 9.968 12,499 15,182 17,906 22,290 29,687 37,424 44,450 49,774 56,847 62,741 62,469
Total bilaterel 2,712 4,272 5,398 6,308 7,565 8,935 10.323 13,278 16,036 17,650 19,439 22,379 22,448Total official 3,553 5.893 7,3,7 8,842 10.722 12,975 15,780 20,046 24,480 27,369 30,942 35,315 36.971Total private 2,204 4,075 5,102 6,340 7,183 9.315 13,907 17,378 19,971 22.405 25.905 27.425 25,498Total coneoalonal 2,602 4,366 5,520 6,454 7,576 9,246 11.040 13,055 15,597 17,298 19,206 20,596 21,199total noaconcesalonal 3,154 5.602 6.979 8.729 10.330 13,044 18,647 24,369 28,854 32.477 37,641 42,144 41.270
fote: E te the cun of A, r, C. ,d 0. C l the 1 u0 of 8 and P. C0oponente of G do not add to total bcause of overlapping.a, Centrral planned econodie.
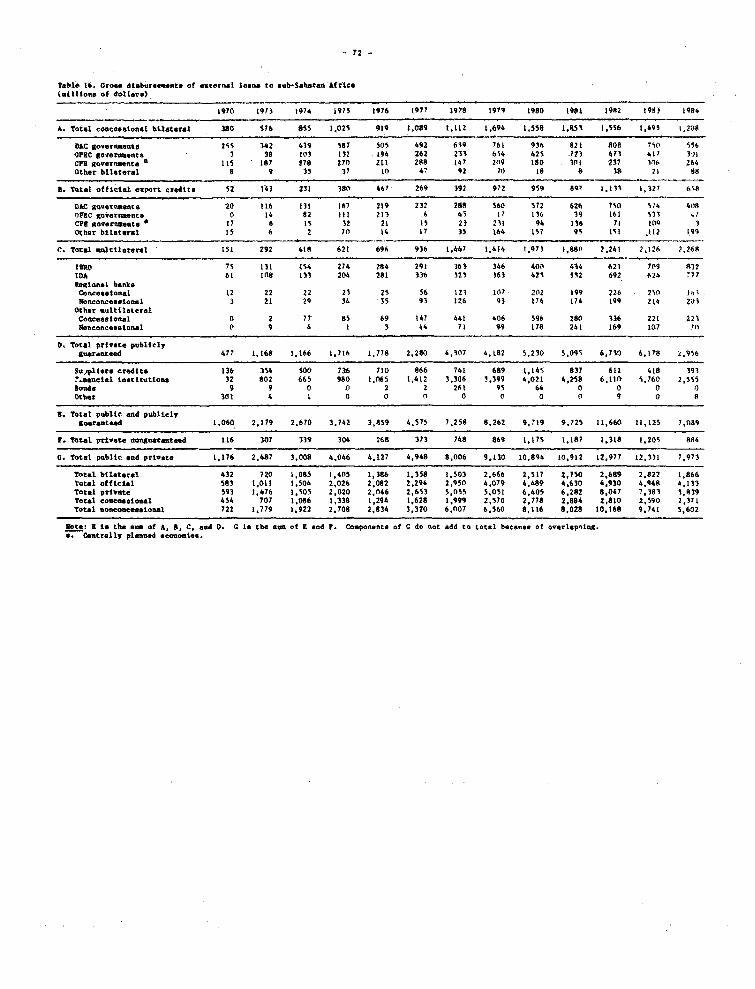
72-
Teble 16. croco dtaburceaente of external lan. te aub-Sabatao Uftca(mililone of dollara)
1970 1971 1974 1975 1976 1977 1978 19t9 1980 ¡481 1982 t9A) iOS4
A. Total conecalor, I bIttateral 380 S76 8S5 1.025 919 1,089 t,l12 1,694 1,.55 1.853 1,556 1.49S 1,208
Olli govermlent 2S5 342 439 s87 505 492 619 761 936 821 808 7S0 556OP88C Iovernt nte 3 38 1o3 132 194 262 233 654 425 175 471 417 3l1CPtt governmenoc 115 187 278 270 211 288 147 2n9 180 10l 237 3n06 264Other bilateral 8 9 3S 37 lo 4' 92 tl 18 8 1S 21 88
9. Total offitcil eiport ctredtt 52 143 231 380 467 269 392 912 959 89* 1.t13 1,177 6s8
D&C 9o,<erea ats 20 116 13t 167 219 232 288 560 S72 626 750 376 4LV8OPtC governaeote 0 14 62 1ti 213 6 41 17 136 39 161 533 .7CPE gover.enta* 17 8 15 32 21 15 23 21t 94 136 71 109 3Other bilateral 15 6 2 70 - 14 17 35 164 157 95 tst 112 199i
C. Total uttleteral 131 292 41S 621 696 936 1.447 1,414 1,973 1,880 2,241 7,126 2,268
Ibisa 75 131 154 274 2R4 291 363 346 400 434 621 709 A37tD* 61 In8 131 204 281 336 323 363 471 502 692 626 ,77ReRíonal bank.Conesteansal 12 22 22 23 25 56 121 107 202 199 226 270 lo;Notwooncaaaonal 3 21 29 34 35 93 126 93 174 174 199 214 201
Othar malítlateralConceesaonal 0 2 77 as 69 147 441 406 596 280 336 221 221
ot7oneoneaston.l 0 9 4 1 3 14 71 e9 178 241 169 107 70
D, Totel private pubte}lyg &aiftteed 477 1,168 1.166 1,716 1,778 2,280 4,307 4,182 S,230 S.09S 6,730 6,178 3,956
SuopItera credit. 136 354 500 736 710 866 741 689 1.145 837 611 418 3937.onmctal toatttutíona 32 802 665 980 1,063 1,412 3,306 3,399 4,021 4,258 6,110 5,760 2,555oonde 9 9 0 0 2 2 261 95 64 0 0 0 0Otbet 301 4 t 0 0 n 0 Q 0 0 9 0 8
E. Total publte and publielygotarntaed 1,060 2,179 2.670 3.742 3,859 4,575 7,25S 8.262 9,'19 9,725 11,660 11,125 7,089
P. Total private n~.ro Caáteed 16 307 339 304 248 173 748 869 1,173 1,187 1,318 1.205 884
C. Total pubite *nd príwate 1,174 2,487 3,008 4,046 4.127 4,948 8,006 9,130 10,894 10,912 12,977 12,331 7,973
Total bilateral 432 720 1,085 1,4n5 1,386 1,358 1,503 2,666 2,517 2,750 2,689 2.822 1,866Total offteial 583 1,011 1,504 2,026 2,082 2,294 2,950 4,079 4,489 4,630 4,930 4,948 4,133Total private 593 1,476 1,505 2,020 2,046 2,653 5,055 5,051 6,405 6,282 8,047 7,383 3,839Total eoneásaaocal 454 707 1,086 1,338 1,294 1,628 1,999 2,570 2,778 2,884 2,810 2,590 2,311total aonioeaaooal 722 1,779 1,922 2,708 2,834 3,320 6,no7 6,560 8,116 8,028 10,168 9,741 5,602
wot. a te8 the ata of A, 8, C, and D. C la the aun of e and PF Coaponenta of C do not *dd to total betauce of overlepning.a. Oaatrally pl7aniad aconontea.
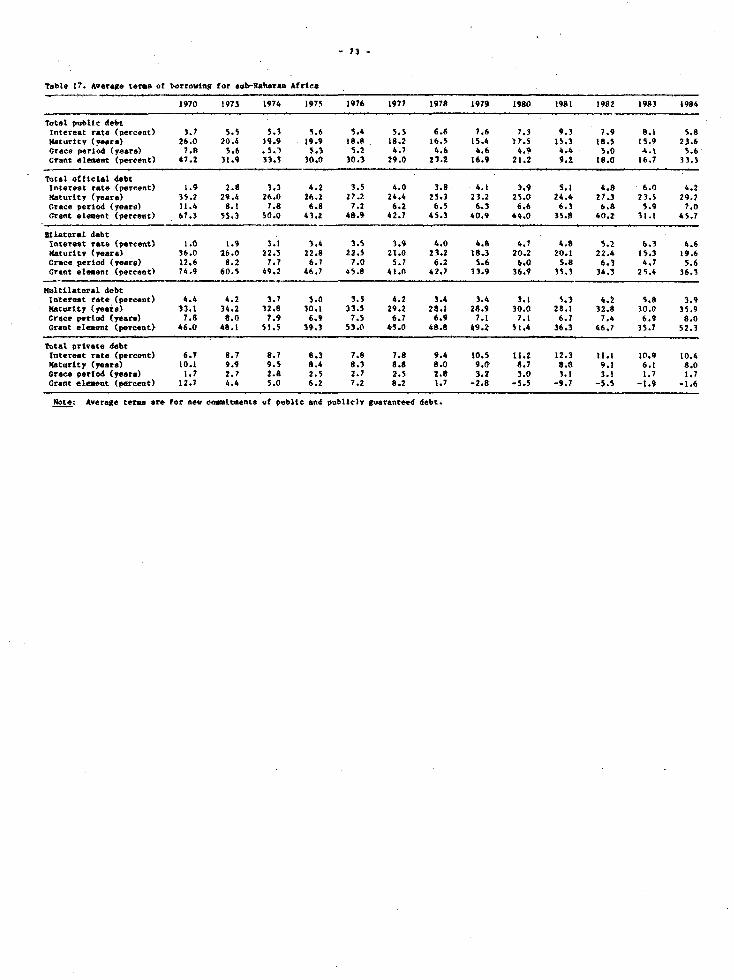
73
Tsbte 17. Average terue of borrówing for sub-Sahbren 4frten
1970 1971 1974 1975 1976 1977 1978 1979 1980 1g8t 1¡92 1983 1984
total pubílc debtIntereat rete (percent) 3.7 5.5 5.1 *.6 5.4 5.5 6.6 7.6 7.3 9.3 7.9 8.1 5.8Haturtty (<e r-) 26.0 20.4 19.9 19.9 18.8 18.2 l6.5 15.4 17.5 15.3 18.5 15.9 23.6Grece perlod (¡esre) 7.8 5.6 .5.3 5.3 5.2 4.7 4.6 4.6 4.9 4.4 5.0 4.1 5.6Grant element (perecnt) 47.2 31.9 33.3 30.0 30.3 29.0 23.2 t6.9 21.2 9.2 18.0 16.7 31.3
Total official debtIntereet rate (percent) 1.9 2.8 3.1 4.2 3.5 4.0 3.8 4.1 3.9 5.1 4.8 6.0 4*2Maturity (<ecre) 35.2 29.4 26.0 26.2 27.2 24.4 25.3 23.2 25.0 24.4 21.3 23.5 29.2Crace perl4d (yeare) 11.4 8.1 7.8 6.8 7.2 6.2 6.5 6.3 6.6 6.3 6.8 5.9 7.0Grant el.ent (percent) 67.3 55.3 50.0 43.2 48.9 42.7 45.3 40.9 44.0 35.8 40.2 31.1 45.7
Bilateral debtIntereet rekte (pertent> 1.0 1.9 3.1 3.4 3.5 3.9 4.0 4.P 4.7 4.8 5.2 6.3 4.6
aeturiLt (¡ecre) 36.0 26.0 22.5 22.8 22.5 21.0 23.2 18.3 20.2 20.1 22.4 I5.3 19.6Grace period (vear) 12.6 8.2 2.7 6.7 7.0 5.7 6.2 5.6 6.0 5.8 6.3 4.7 5.6Grant eleaent (percent) 74.9 60.5 49.2 46.7 45.8 41.n 42.7 33.9 36.9 35.3 34.3 25.4 36.1
tultilateral debtInterest rete (percent) 4.4 4.2 3.7 5.0 3.5 4.2 3.4 3.4 3.1 5.3 4.2 5.8 3.9Naturtty (ye¡e>) 33.1 34.2 32.8 30.1 33.5 29.2 28.1 28.9 30.0 28.1 32.8 30.0 35.9Crece peniod (¡Cera) 7.8 8.0 7.9 6.9 7.5 6.7 6.9 7.1 7.1 6.7 7.4 6.9 8.0Grant element (percent> 46.0 48.1 51.5 39.3 53.0 45.0 48.8 49.2 51.4 36.3 46.7 35.7 52.3
Total prtvate debtInterest rate (percent) 6.7 8.7 8.7 8.3 7.8 7.8 9.4 10.5 11.2 12.3 ll.l 10.9 10.4Maturtty (yeara> 10.1 9.9 9.5 8.4 8.3 8.8 8.0 9.0 8.7 8.8 9.1 6.1 8.0Grece paríod (¡eara) 1.7 2.7 2.8 2.5 2.7 2.5 2.8 3.2 3.0 3.1 3.1 1.7 1.7Grant eleaent (percent) 12.7 4.4 5.0 6.2 7.2 8.2 1.7 -2.8 -5.5 -9.7 -5.5 -1.9 -1.6
Note: Average teria are for new eoaltaente of pubítc and publiel guaranteed debt.
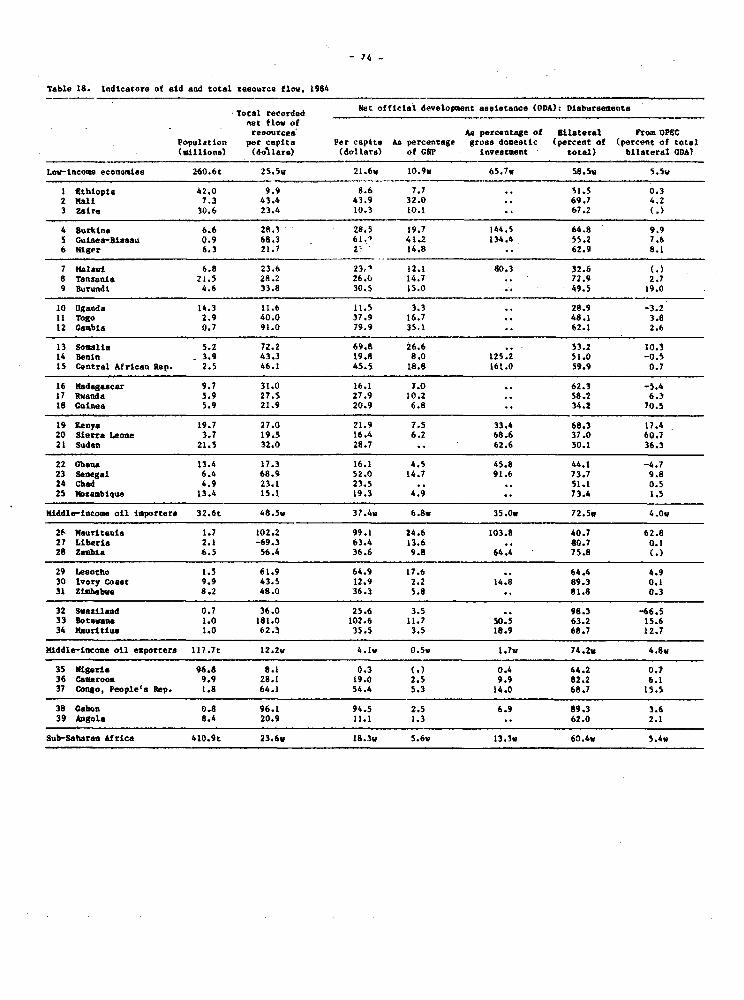
-74-
Table 18. Indicatora of ald ~o total resaurce floam, 1964
Total recorded Net of fldetl development aselstance (004>: Disburoeeent.0,t flov of
regourceés As parciantaga of Bilateral Frum OPECPopulation per capira Per capitt As percentagle groos docestie (percent of (perceot of total<millions) (do!llars> (dallare) of 01W Investment - total> bilateral 0D4)
Log-incoae econoratee 260.6t 25.5v 21.6V 10.9v 65.lv 58.5v .
5
1 Ehíbopia 42,0 9.9 8.6 7.7 .. 51.5 0.32 Wai 7.3 43.4 43.9 32.0 .. 69.7 4.23 Zaire 30.6 23.4 10.3 10.1 .. 67.2
4 burktna 6.6 ZO.3 28.5 19.7 144.5 - 64.8 9.95 Getnea-Biaaau 0.9 68.3 61.>) 41.2 134.4 55.2 7.66 Ilíger 6.3 21.7 al. 14.8 .. 62.98.
7 Malawi 6.8 23.6 23,> 12.1 80.3 32.6(.8 Tanzania 21.5 28.2 26.0 14.7 .. 72.9 2.79 Burundi 4.6 33.8 30,5 13.0 .. 49.3 19.0
10 Uganda 14.3 11.6 11.5 3.3 .. 28.9 -3.211 Togo 2.9 40.0 37.9 16.7 .. 48.1 3.812 cambhia 0.7 91.0 79.9 35.1 .. 62.1 2.6
13 Somalia 3.2 72.2 69.8 26.6 .. 53.2 10.314 Banjon 3.9 43.3 19.8 8.0 125.2 51.0 -0.515 Central Afrícan Rep. 2.5 46.1 45.5 18.8 161.0 59.9 0.7
16 Madagascar 9.7 31.0 16,1 7.0 .. 62.3 -5.417 Ivantda 5.9 27.5 27.9 10.2 .. 58.2 6.318 Guinaa 5.9 21.9 20.9 6.8 -. 34.2 70.5
19 Kenya 19.7 27.0 21.9 7.5 33.4 68.3 17.420 Sierra Leone 3.7 19.5 16.4 6.2 68.6 37.0 60.721 Sudan 21.5 32.0 28.7 .. 62.6 50.1 36.3
22 Ghana 13.4 17.3 16.1 4.5 45.8 44.1 -4.723 Senegal 6.4 68.9 52.0 14.7 91.6 73.7 9.824 Chad 4.9 23.1 23.5 si .511 0.525 Bazambique 13.4 15.1 19.3 4.9 . 73.4 1.5
Middle-income oíl importeae 32.6t 48.Sv 3
7.4Y 6.8w 35.0w 72.5w 4.0v
26, Mauritania 1.7 102.2 99.1 24.6 103.8 40.7 62.827 Libarta 2.1 -69.3 63.4 13.6 .. 807 0.128 Zambia 6.5 56.4 36.6 9.8 64.4 75.8 .
29 leosotho 1.5 61.9 64.9 17.6 .. 64.4 4.930 lvory Coast 9.9 43.5 12.9 2.2 14.8 89.3 0.131 ZiM&babe 8.2 48.0 36.3 5.8 .. 81.8 0.3
32 Swaziland 0.7 36.0 25.6 3.5 .. 98.3 -66.533 Eooíwana 1.0 181.0 102.6 11.7 50.5 63.2 15.634 Mauritiuo 1.0 62.3 35.5 3.5 18.9 68.7 12.7
MíddIe-Incoae oil exportare 117.7t 12.2Y 4.lv 0.5v 1.7v 74.2V 4.8v
35 Nigeria 96.8 8.1 0.3 ()0.4 44.2 0.736 Camaroon 9.9 28.1 19.0 2.3 9.9 82.2 6.137 Congo, Peoplels Rep. 1.8 64.1 54.4 5.3 14.0 68.7 15.5
38 Cabon 0.8 96.1 94.5 2.5 6.9 89.3 3.639 Angola 8.4 20.9 11.1 1.3 .. 62.0 2.1
Sub-Saharan Africa 410.9t 23.6Y 18.3v 5.6v 13.3v 60.4v 5.4w
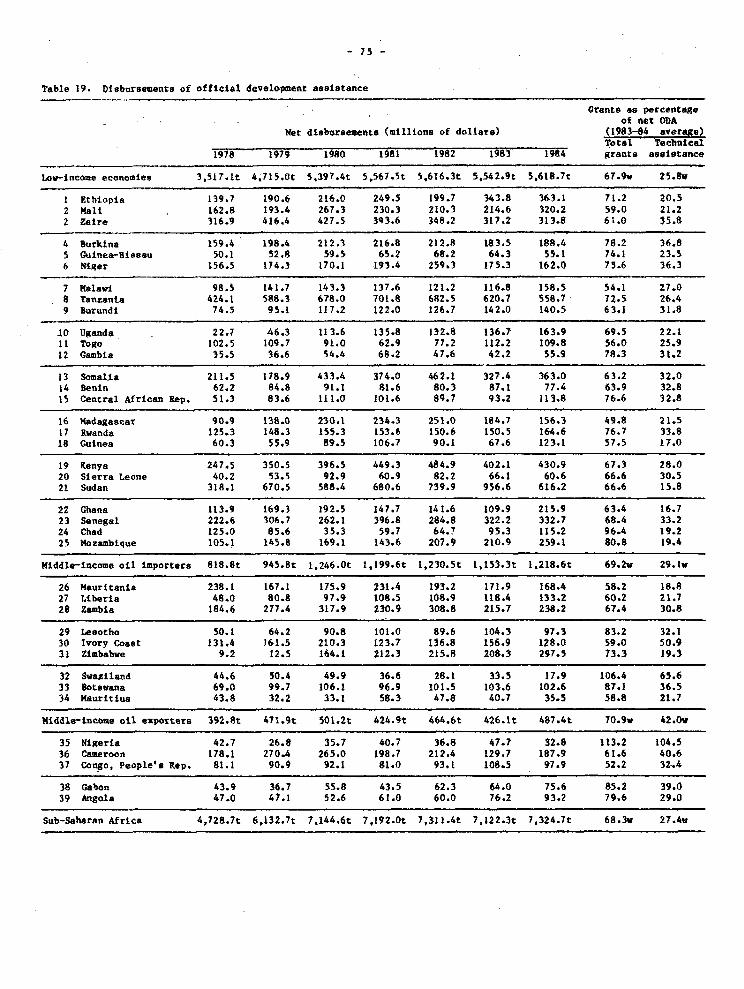
- 75 -
Table 19. Diebursemento of official development asaistance
Grants &s percentaReot net ODA
Net diabursemente (milliona of dollare) 198384 avebiaeI____ ____ ____ ____ ____ ____ ___ ____ ____ ____ ____ ____ ____ __y o t--al T echoical
1978 1979 1980 1981 1982 1983 1934 grants aseistance
Low-income economIes 3,517.1t 4.715.Ot 5,397.4t 5,567.5t 5,616.3t 5,542.9t 5,618.7t 67.9w 25.8v
1 Ethiopia 139.7 190.6 216.0 249.5 199.7 343.8 363.1 71.2 20.52 Mali 162.8 193.4 267.3 230.3 210.3 214.6 320.2 59.0 21.22 Zaire 316.9 416.4 427.5 393.6 348.2 317.2 313.8 61.0 35.8
4 Burkina 159.4 198.4 212.3 216.8 212.8 183.5 188.4 78.2 36.85 Guinea-Biasau 50.1 52.8 59.5 65.2 68.2 64.3 55.1 74.1 23.56 Niger 156.5 174.3 170.1 193.4 259.3 175.3 162.0 75.6 36.3
7 Malawi 98.5 141.7 143.3 137.6 121.2 116.8 158.5 54.1 27.08 Tanzanta 424.1 588.3 678.0 701.8 682.5 620.7 558.7 72.5 26.49 Burundi 74.5 95.1 117.2 122.0 126.7 142.0 140.5 63.1 31.8
10 Uganda 22.7 46.3 113.6 135.8 132.8 136.7 163.9 69.5 22.11I Togo 102.5 109.7 91.0 62.9 77.2 112.2 109.8 56.0 25.912 Gambia 35.5 36.6 54.4 68.2 47.6 42.2 55.9 78.3 31.2
13 Somalia 211.5 178.9 433.4 374.0 462.1 327.4 363.0 63.2 32.014 Benin 62.2 84.8 91.1 81.6 80.3 87.1 77.4 63.9 32.815 Central Afrícan Rep. 51.3 83.6 111.0 101.6 89.7 93.2 113.8 76.6 32.8
16 Madagascar 90.9 138.0 230.1 234.3 251.0 184.7 156.3 49.8 21.517 Rwanda 125.3 148.3 155.3 153.6 150.6 150.5 164.6 76.7 33.818 Guinea 60.3 55.9 89.5 106.7 90.1 67.6 123.1 57.5 17.0
19 Renya 247.5 350.5 396.5 449.3 484.9 402.1 430.9 67.3 28.020 Sierra Leone 40.2 53.5 92.9 60.9 82.2 66.1 60.6 66.6 30.521 Sudan 318.1 670.5 588.4 680.6 739.9 956.6 616.2 66.6 15.8
22 Ghana 113.9 169.3 192.5 147.7 141.6 109.9 215.9 63.4 16.723 Senegal 222.6 306.7 262.1 396.8 284.8 322.2 332.7 68.4 33.224 Chad 125.0 85.6 35.3 59.7 64.7 95.3 115.2 96.4 19.225 Mozambique 105.1 145.8 169.1 143.6 207.9 210.9 259.1 80.8 19.4
Middle-income oíl importera 818.8t 945.8t 1,246.Ot 1,199.6t 1,230.5t 1,153.3t 1,218.6t 69.2w 29.1v
26 Yauritania 238.1 167.1 175.9 231.4 193.2 171.9 168.4 58.2 18.827 Liberia 48.0 80.8 97.9 tO8.5 108.9 118.4 133.2 60.2 21.728 Zambia 184.6 277.4 317.9 230.9 308.8 215.7 238.2 67.4 30.8
29 Lesotho 50.1 64.2 90.8 101.0 89.6 104.3 97.3 83.2 32.130 Ivory Coast 131.4 161.5 210.3 123.7 136.8 156.9 128.0 59.0 50.931 Zimbabwe 9.2 12.5 164.1 212.3 215.8 208.3 297.5 73.3 19.3
32 Swaziland 44.6 50.4 49.9 36.6 28.1 33.5 17.9 106.4 65.633 Botavana 69.0 99.7 106.1 96.9 101.5 103.6 102.6 87.1 36.534 Mauritiua 43.8 32.2 33.1 58.3 47.8 40.7 35.5 58.8 21.7
Middls-income oil exportera 392.8t 471.9t 501.2t 424.9t 464.6t 426.1t 487.4t 70.9w 42.0w
35 Nigeria 42.7 26.8 35.7 40.7 36.8 47.7 32.8 113.2 104.536 Careroon 178.1 270.4 265.0 198.7 212.4 129.7 187.9 61.6 40.637 Congo, People'a Rep. 81.1 90.9 92.1 81.0 93.1 108.5 97.9 52.2 32.4
38 Gabon 43.9 36.7 55.8 43.5 62.3 64.0 75.6 85.2 39.039 Angola 47.0 47.1 52.6 61.0 60.0 76.2 93.2 79.6 29.0
Sub-Saharan Africa 4,728.7t 6,132.7t 7,144.6t 7,192.0t 7,311.4t 7,122.3t 7,324.7t 68.3w 27.4v
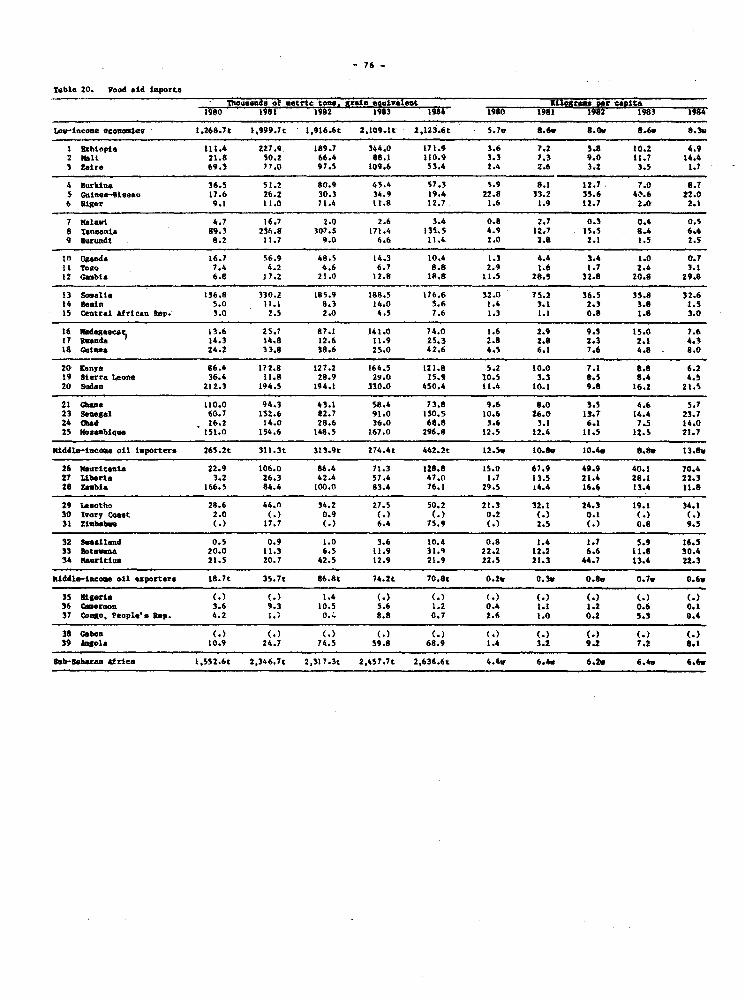
- 76 -
Tsbla 20. Food *Id mporta
- Slouwanda of etrtc tonc. grala aauiv elt jivora er eapia1980 l981 1982 1983 1984 1980 1981 1982 1983 1984
-incoau ecuomjea t.268.7t 1,999.1t 1.916.6t 2.109.1t 2,123.6t 5.7h 8.6w 8.O. 8.6. 8.3U
1 ktbiopia 111.4 227.9 189.7 344.0 171.9 3.6 7.2 5.8 10.2 4.92 Nalt 21.8 50.2 66.4 88.1 l10.9 3.3 7.3 9.0 11.7 14.43 Ztre 69.3 77.0 97.5 109.4 53.4 2.4 2.6 3.2 3.5 1.7
4 Burkina 16.5 51.2 80.9 45.4 57.3 5.9 8.1 12.7 7.0 8.75 Gatunea-Esies 17.6 26.2 30.3 34.9 19.4 22.8 33.2 35.6 48.6 22.06 Nigar 9.1 11.0 71.4 11.8 12.7. 1.6 ¡.9 12.7 2.0 2.1
7 Malawt 4.7 16.7 2.0 2.6 3.4 0.8 2.7 0.3 0.4 0.58 Tenuania 89.3 236.8 307.5 171.4 t3S.S 4.9 12.7 1I.5 8.4 6.49 Burun4t 8.2 1.7 9.0 6.6 11,4 2.0 2.8 2.1 1.5 2.5
10 Uganda 16.7 56.9 48.S 14.3 10.4 1.3 4.4 3.4 1.0 0.711 ToRO 7.4 4.2 4.6 6.7 8.8 2.9 1.6 1.7 2.4 3.112 Gbia 6.8 17.2 21.0 12.8 18.8 11.5 28.5 32.8 20.8 29.8
13 Somalía ¡36.8 330.2 185.9 188.5 176.6 32.0 75.2 36.5 35.8 32.614 Benin S.0 ll.1 8.3 14.0 5.6 1.4 3.1 2.3 3.8 1.515 Centrel Afrtean Rep.- 3.0 2.5 2.0 4.5 7.6 1.3 1.1 0.8 1.8 3.0
16. tadág*ectS 13.6 25.7 87.1 141.0 74.0 1.6 2.9 9.S 15.0 7.617 Rnuda 14.3 14.8 12.6 11.9 25.3 2.8 2.8 2.3 2.1 4.318 Ceíneí 24.2 33.8 38.6 25.0 42.6 4.5 6.1 7.6 4.8 - 8.0
20 I.nya 86.4 172.8 127.2 164.5 121.8 3.2 10.0 7.1 8.8 6.219 Sierra leona 36.4 Il.8 28.9 2Y.0 15.9 10.5 3.3 8.5 8.4 4.520 Sudan Z12.3 194.5 194.1 330.0 450.4 ¡¡.4 10.1 9.8 16.2 21.5
21 Chana 110.0 94.3 43.1 58.4 73.8 9.6 8.0 3.5 4.6 5.723 Senegal 60.7 152.6 E2.7 91.0 150.5 10.6 26.0 13.7 t4.4 23.724 Cad 16.2 14.0 28.6 36.0 68.8 3.6 3.1 6.1 7.5 14.025 Noambiqoe t51.0 154.6 148.5 167.0 296.8 12.5 12.4 11.5 12.5 21.7
ftiddla-inoea oíl tiportere 265.2t 311.3t 313.9t 274.4t 442.2t 12.5v 10.8, 10.4V 8.81 13.8»
26 Maurttaiat 22.9 106.0 86.4 71.3 128.8 15.0 67.9 49.9 40.1 70.427 Uberla 3.2 26.3 42.4 57.4 47.0 1.7 13.5 21.4 28.1 22.328 Ztabia 166.5 84.4 100.0 83.4 76.1 29.5 L4.4 16.6 13.4 11.8
29 Laeotho 28.6 44.n 34.2 27.5 50.2 21.3 32.1 24.3 19.1 34.130 Ivory Cos t 2.0 t.) 0.9 (.G <.3 0.2 (.) 0.1 (.) (.131 ttmbae <.) 17.7 (.) 6.4 75.9 <.) 2.5 <.) 0.8 9.5
32 Beatland 0.5 0.9 1.0 3.6 10.4 0.8 1.4 1.7 5.9 16.533 Rotoa 20.0 11.3 6.5 11.9 31.9 22.2 12.2 6.6 11.8 30.434 magrittu 21.5 20.7 42.5 12.9 21.9 22.5 21.3 44.7 13.4 22.3
Mtddle-incue oll exportare 18.7t 35.7t 86.8t 74.2t 70.8t 0.2T 0.3e 0.8V 0.7, 0.6.
35 ligar(a (.) 1.4 (.) (.3) <. (.) <.) (.) (.)36 Caeroon 3.6 9.3 10.5 5.6 1.2 0.4 1.1 1.2 0.6 0.137 Congo. Peoplea Rap. 4.2 1.1 0.4 8.8 0.7 2.6 1.0 0.2 5.3 0.4
38 Cebon G.3 <.) (. G) <.) (.) ( < (3 (.39 ingola 10.9 24.7 74.5 59.8 68.9 1.4 3.2 9.2 7.2 8.1
Sab-abaran Africa 1.552.6t 2.346.7t 2,317.3t 2,457.7t 2,636.6t 4.4Y 6.4w 6.2Y 6.4T 6.6,
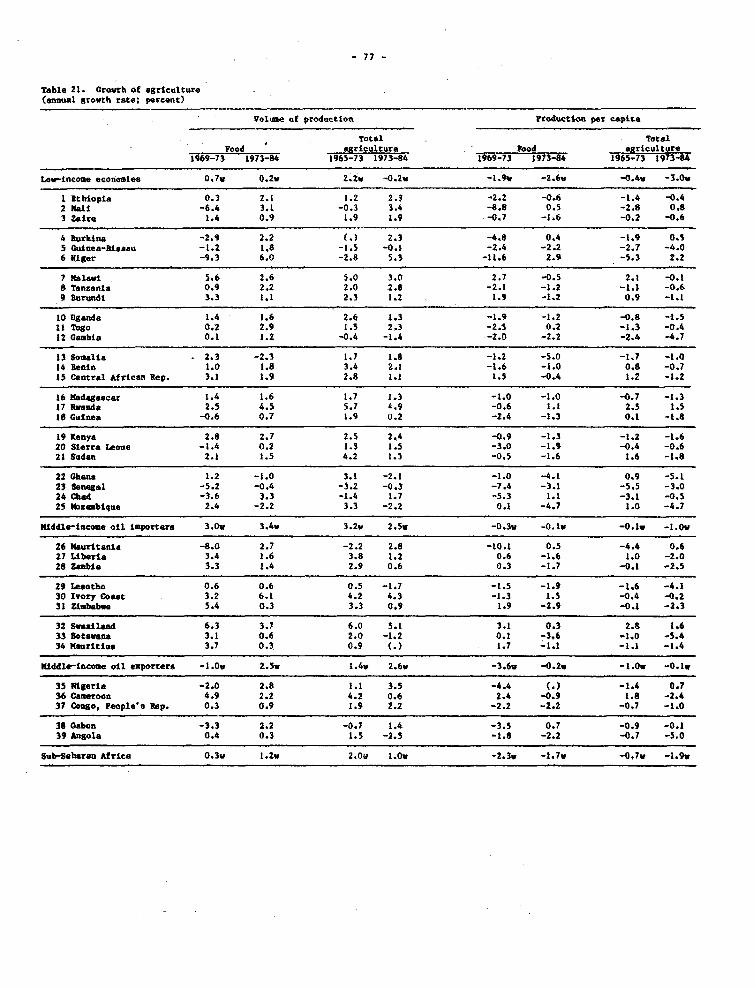
7 77
Table 21. Gr~wth of agriculture(annual growth rato; percent)
Volkoe of productton Fioduction por capita
Total TotalFood agrtcutture Food airiculture1969-73 1973-84 1965-73 1973-841697 1973-84 1965-713119738
Lov-ncoae econoales 0.7
v 0.2v 2.Zw -0.2v -1.9v -2.6v -0.4Y -3.0v
1 Ethiopia 0.3 2.1 1.2 2.3 -2.2 -0.6 -1.4 -0.42 Mlli -6.4 3.1 -0.3 3.4 -8.8 0.5 -2.8 0.83 Zaire 1.4 0.9 1.9 1.9 -0.7 -1.6 -0.2 -0.6
4 Burkina -2.9 2.2 (.3 2.3 -4.8 0.4 -1.9 0.5S Cuinea-Baesau -1.2 1.8 -1.5 -0.1 -2.4 -2.2 -2.7 -4.06 Niger -9.3 6.0 -2.8 5.3 -11.6 2.9 -5.3 2.2
7 Malawi 5.6 2.6 5.0 3.0 2.7 -0.5 2.1 -0.18 tanzata 0.9 2.2 2.0 2.8 -2.1 -1.2 -1.1 -0.69 Burundt 3.3 1.1 2.3 1.2 1.9 -1.2 0.9 -1.1
10 Uganda 1.4 1.6 2.6 1.3 -1.9 -1.2 -0.8 -1.511 Togo 0.2 2.9 1.5 2.3 -2.5 0.2 -1.3 -0.412 cambia 0.1 1.2 -0.4 -1.4 -2.0 -2.2 -2.4 -4.7
13 Soalia . 2.3 -2.3 1.7 1.8 -1.2 -5.0 -1.7 -1.014 Benin 1.0 1.8 3.4 2.1 -1.6 -1.0 0.8 -0.715 Central African Rep. 3.1 1.9 2.8 1.1 1.5 -0.4 1.2 -1.2
16 Madagascar 1.4 1.6 1.7 1.3 -1.0 -1.0 -0.7 -1.317 RWasda 2.5 4.5 5.7 4.9 -0.6 1.1 2.5 1.516 Cuinea -0.6 0.7 1.9 0.2 -2.4 -1.3 0.1 -1.8
19 Kenya 2.8 2.7 2.5 2.4 -0.9 -1.3 -1.2 -1.620 Sierra Leola -1.4 0.2 1.3 1.5 -3.0 -1.9 -0.4 -0.621 Sudan 2.1 1.5 4.2 1.3 -0.5 -1.6 1.6 -1.8
22 Ghana 1.2 -1.0 3.1 -2.1 -1.0 -4.1 0.9 -5.123 2enegal -5.2 -0.4 -3.2 -0.3 -7.4 -3.1 -5.5 -3.024 Chad -3.6 3.3 -1.4 1.7 -5.3 1.1 -3.1 -0.525 Mazambique 2.4 -2.2 3.3 -2.2 0.1 -4.7 1.0 -4.7
Nltddle-Income oíl mortera 3.0v 3.4v 3.2v 2.5v -0.3v -O.lv -0.1w -1.Ov
26 Mauritania -8.0 2.7 -2.2 2.8 -10.1 0.5 -4.4 0.621 Liberia 3.4 1.6 3.8 1.2 0.6 -1.6 1.0 -2.028 Zabia 3.3 1.4 2.9 0.6 0.3 -1.7 -0.1 -2.5
29 Lesotho 0.6 0.6 0.5 -1.7 -1.5 -1.9 -1.6 -4.130 Ivory Coest 3.2 6.1 4.2 4.3 -1.3 1.5 -0.4 -0.231 Zifbbve 5.4 0.3 3.3 0.9 1.9 -2.9 -0.1 -2.3
32 Swalad 6.3 3.7 6.0 5.1 3.1 0.3 2.8 1.633 Botevana 3.1 0.6 2.0 -1.2 0.1 -3.6 -1.0 -S.434 lnaritius 3.7 0.3 0.9 <.> 1.7 -1.1 -1.1 -1.4
Mddl-Inc~e ol e*portere -1.0v 2.5v 1.4v 2.6v -3.6v -0.2v -1.Ov -0.1-
35 Migería -2.0 2.8 1.1 3.5 -4.4 (.) -1.4 0.736 Cemerwon 4.9 2.2 4.2 0.6 2.4 -0.9 1.8 -2.437 Cogo, Peoplela Rep. 0.3 0.9 1.9 2.2 -2.2 -2.2 -0.7 -1.0
38 Gabon -3.3 2.2 -0.7 1.4 -3.5 0.7 -0.9 -0.139 Angola 0.4 0.3 1.5 -2.5 -1.8 -2.2 -0.7 -5.0
gub-haberan Africa 0.3v 1.2v 2.0v 1.Ov -2.3v -1.7v -0.7v -1.9v
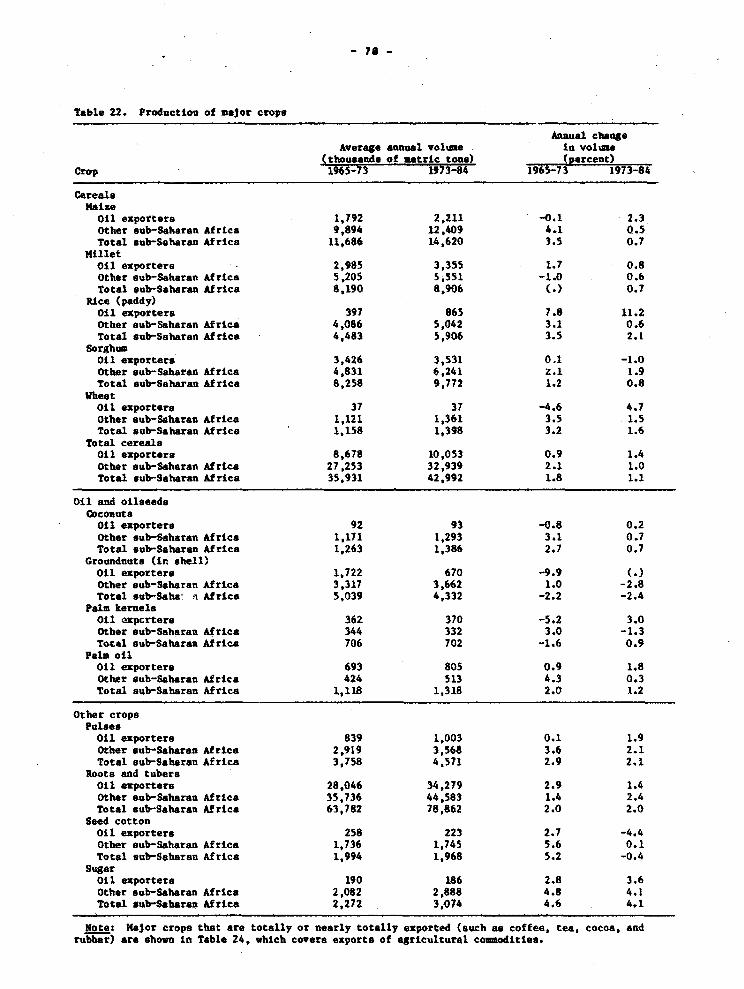
- 78 -
Table 22. Production of mejor crops
Annual changeAverage annual voluse in volume
(thousande of estrie tono) paercent)Crop 1965-73 1973-84 1965-t3 1973-84
CerealsMalse
Oil exportere 1,792 2,211 -0.1 2.3Other sub-Saharan Africa 9,894 12,409 4.1 0.5Total sub-Saharan Africa 11,686 14,620 3.5 0.7
Millet0O1 exporters 2,985 3,355 1.7 0.8Other sub-Saharan Africa 5,205 5,551 -1.0 0.6Total sub-Saharan Africa 8,190 8,906 (G> 0.7
Rice (paddy)Oil exporters 397 865 7.8 11.2Other sub-Saharan Africa 4,086 5,042 3.1 0.6Total sub-Saharan Africa 4,483 5,906 3.5 2.1
SorghumOil exporters 3,426 3,531 0.1 -1.0Other sub-Saharan Africa 4,831 6,241 Z.1 1.9total sub-Saharan Africa 8,258 9,772 1.2 0.8
WhestOil exportere 37 37 -4.6 4.7Other sub-Sahara A&frica 1,121 1,361 3.5 1.5Total sub-Saharan Africa 1,158 1,398 3.2 1.6
Total cerealeOil exporters 8,678 10,053 0.9 1.4Other sub-Saharan Africa 27,253 32,939 2.1 1.0Total sub-Saharan Africa 35,931 42,992 1.8 1.1
Oil and oilseedsWoconutsOil exporters 92 93 -0.8 0.2Other sub-Saharan Africa 1,171 1,293 3.1 0.7Total sub-Saharan Africa 1,263 1,386 2.7 0.7
orounduuts (ir. shell)Oil exporters 1,722 670 -9.9 (.)other sub-Saharan Afrlca 3,317 3,662 1.0 -2.8Total sub-Saha- n Africa 5,039 4,332 -2.2 -2.4
Pala kernelaOil expcrters 362 370 -5.2 3.0Other sub-Saharan Africa 344 332 3.0 -1.3Total sub-Saharan Africa 706 702 -1,6 0.9
Pela oilOil exporter. 693 805 0.9 1.8Other sub-Saharan Africa 424 513 4.3 0.3Total sub-Saharan Africa 1,118 1,318 2.0 1.2
Other cropsPulsesOil exporters 839 1,003 0.1 1.9Other sub-Saharan Africa 2,919 3,568 3.6 2.1Total sub-Saharan Africa 3,758 4,571 2.9 2.1
Roote and tuberaOil exporter. 28,046 34,279 2.9 1.4Other sab-Saharan Africa 35,736 44,583 1.4 2.4Total sub-Saharan Africa 63,782 78,862 2.0 2.0
Seed cottonOil exporter. 258 223 2.7 -4.4Other sub-Saharan Africa 1,736 1,745 5.6 0.1Total sub-Saharan Africa 1,994 1,968 5.2 -0.4
SugarOil exporter. 190 186 2.8 3.6Other sub-Saharan Africa 2,082 2,888 4.8 4.1Total sub-Sabaran Africa 2,272 3,074 4.6 4.1
Note: Major crops that are totally or nearly totally exported (such as coffee, tea, cocoe, andrubber) are hoawn in Table 24, which covers exporte of agricultural cossndities.
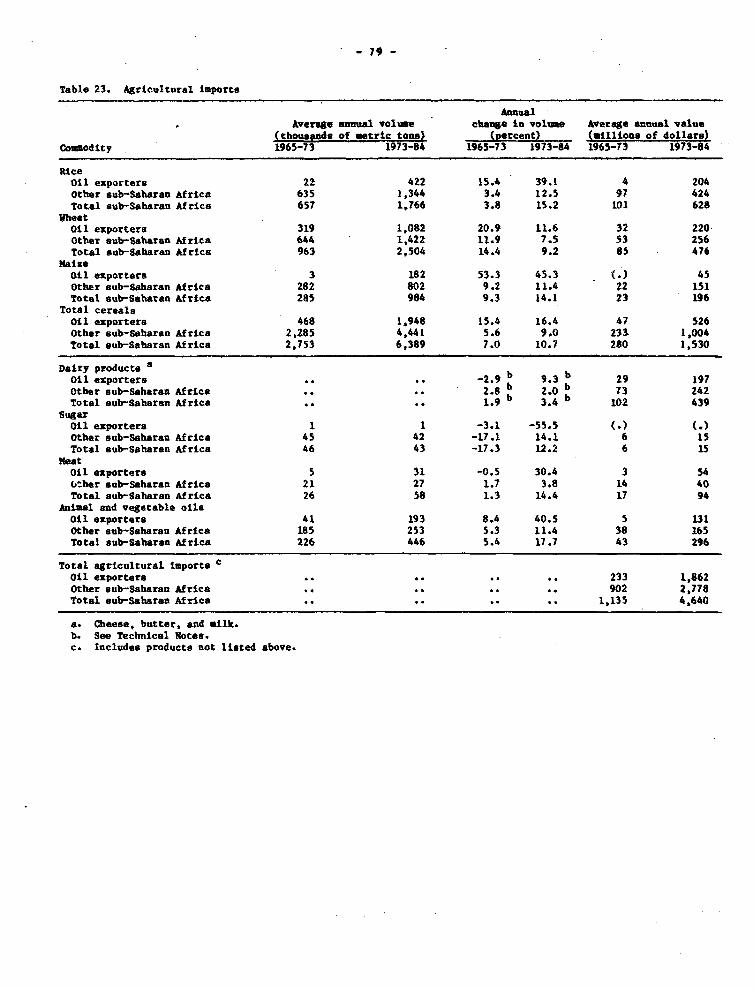
-79-
Table 23. Agricultural importe
AnimalAverage anunal volue chan8e tu voluie Average annmal value
(Cho- ¡ of *etrte tono) (percent0 (-111los8 of tollars)ComaodTty 1965-73 1973-84 1965-73 1973-84 1965-73 1973-84
RiceOil exportere 22 422 15.4 39.1 4 204Other sub-Saharan Afríca 635 1,344 3.4 12.5 97 424Total sub-saharan Africa 657 1,766 3.8 15.2 101 628
UbatOSl exportere 319 1,082 20.9 11.6 32 220-Otiher cub-Saharan Africa 644 1,422 11.9 7.5 53 256Total sub-Saharan Africa 963 2,504 14.4 9.2 85 476
YaizeOil exportere 3 182 53.3 45.3 -) 45Other sub-Saharan Africa 282 802 9.2 11.4 22 151Total sub-Sabaran Africa 285 984 9.3 14.1 23 196
Total cerealsOil exporters 468 1,948 15.4 16.4 47 526Other sub-Saharan Africa 2,285 4,441 5.6 9.0 233 1,004Total sub-Saharan Africa 2,753 6,389 7.0 10.7 280 1,530
Dairy producta aDil exportere -2.9 b b29 197Other sub-Saharan Africa .2.8 2.0 b 73 242Total sub-Saharan Africa . 1.9 b 3.4 b 102 439
SugarOil exporters 1 1 -3.1 -55.5 (.) (.)
Other sub-Saharan Africa 45 42 -17.1 14.1 6 15Total sub-Saharan Africa 46 43 -17.3 12.2 6 15
metOil exportere 5 31 -0.5 30.4 3 54<>ther sub-Saharan Afrlca 21 27 1.7 3.8 14 40Total sub-Saharan Africa 26 58 1.3 14.4 17 94
Animal and vegetable ollaOil exportera 41 193 8.4 40.5 5 131Othar sub-Saharan Africa 185 253 5.3 11.4 38 165Total sub-Saharan Africa 226 446 5.4 17.7 43 296
Total agricultural taporte cOil exportere 233 1,862Other sub-Saharan Africa . . 902 2"778Total sub-Saharan Africa 1,135 4,640
a. Cheese, butter, and a*lk.b. See Technical Notes.c. Includes producto not listed above.
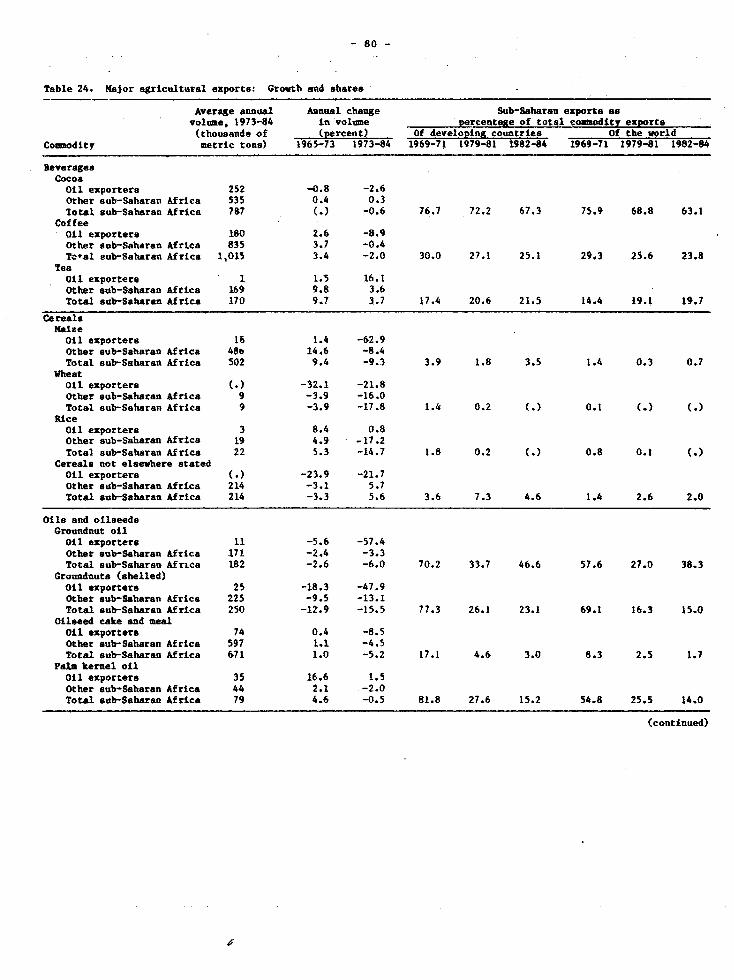
- 80 -
Table 24. Major agricultural exporte: Grouth and ahares
Average annual Annual change Sub-Saharan exporte asvolume, 1973-84 in volume 2ercentage of total coimodlty exporte(thousands of (percent) Of develonpng countries Of the world
Couaodity aetric tons) 1965-73 19?3-84 1969-71 1979-81 1982-84 1969-71 1979-81 1982-84
BeveragesCocoa011 exporters 252 -0.8 -2.6Other sub-Saharan Africa 535 0.4 0.3Total sub-Saharan Africa 787 (.) -0.6 76.7 72.2 67.3 75.9 68.8 63.1
Coffee0tl exportere 180 2.6 -8.9Other sub-Saharan Africa 835 3.7 -0.41*tal sub-Saharan Africa 1,015 3.4 -2.0 30.0 27.1 25.1 29.3 25.6 23.8
TeaOil exportere 1 1.5 16.1Other sub-Saharan Aftica 169 9.8 3.6Total sub-Saharan Africa 170 9.7 3.7 17.4 20.6 21.5 14.4 19.1 19.7
CerealsMaizeOil exportere 16 1.4 -62.9Other sub-Saharan Africa 48e 14.6 -8.4Total sub-Saharan Africa 502 9.4 -9.3 3.9 1.8 3.5 1.4 0.3 0.7
WheatOil exportere (.) -32.1 -21.8Other sub-Saharan Africa 9 -3.9 -16.0Total sub-Saharan Africa 9 -3.9 -17.8 1.4 0.2 t ) 0.1 G.) (.|
RiceOil exporters 3 8.4 0.8Other aub-Saharan Africa 19 4.9 -17.2Total sub-Saharan Africa 22 5.3 -14.7 1.8 0.2 t ) 0.8 0.1 (.)
Cereala not elasehere atatedOil exportere (.) -23.9 -21.7Other sub-Saharan Africa 214 -3.1 5.7Total sub-Saharan Africa 214 -3.3 5.6 3.6 7.3 4.6 1.4 2.6 2.0
Olla and ollseedeGroundaut otl
Oil exportere 11 -5.6 -57.4Other sub-Saharan Africa 171 -2.4 -3.3Total sub-Saharan Africa 182 -2.6 -6.0 70.2 33.7 46.6 57.6 27.0 38.3
Groundnute (ahelled)Oil exportere 25 -18.3 -47.9Other sub-Saharan Africa 225 -9.5 -13.1Total sub-Soharan Africa 250 -12.9 -15.5 77.3 26.1 23.1 69.1 16.3 15.0
Oilsead cake and mealOil exportere 74 0.4 -8.5Other sub-Saharan Africa 597 1.1 -4.5Total sub-Saharan Africa 671 1.0 -5.2 17.1 4.6 3.0 8.3 2.5 1.7
Pala kernel oilOil exportere 35 16.6 1.5Other sub-Saharan Africa 44 2.1 -2.0Total aub-Saharan Africa 79 4.6 -0.5 81.8 27.6 15.2 54.8 25.5 14.0
(continued)
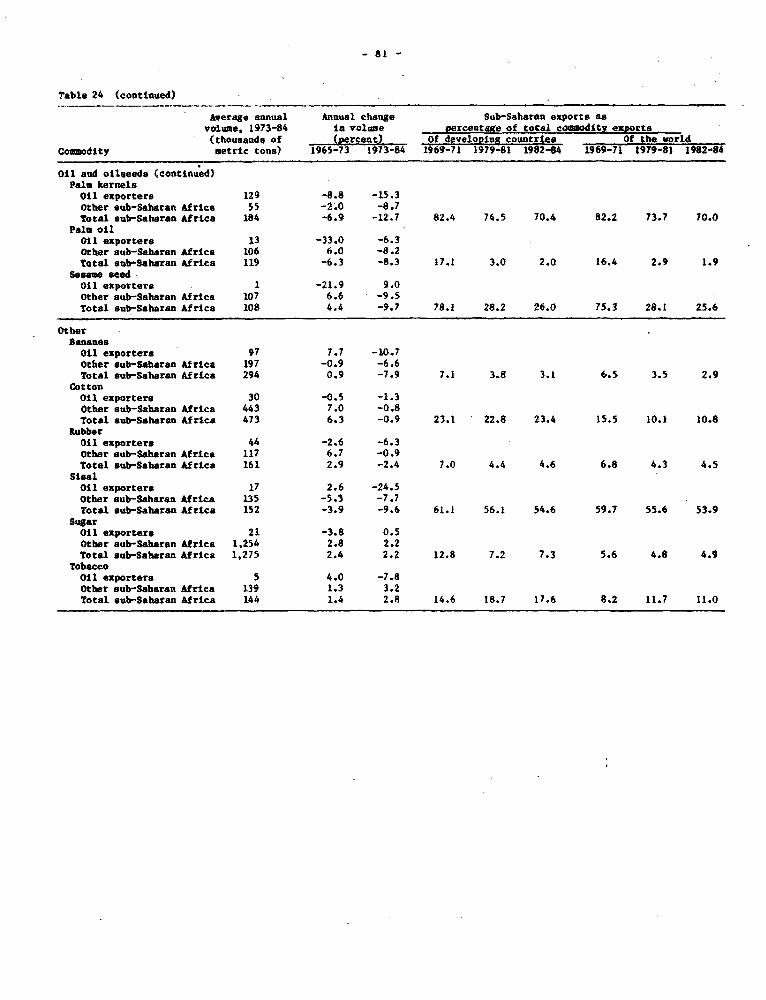
- 81 -
Table 24 (contiaued)
Average annual Annual change Sub-Saharan exporte asvolue, 1973-84 la voluae vercntge o total c0a3dítv exporto(thousaod4 of <.percent) Of developing countries Of the vorld
Comuodity uetric tona) 1965-73 1973-84 1969-71 1979-81 1982-84 1969-71 1979-81 1982-84
Oil aud ollseeds (conttnued)Palo kernelaOil exporter. 129 -8.8 -15.3Other sub-Saharan Africa 55 -2.0 -8.7Total sub-Sabaran Africa 184 -6.9 -12.7 82.4 74.5 70.4 82.2 73.7 70.0
Palo oilOil exporters 13 -33.0 -6.3Other sub-Saharan África 106 6.0 -8.2Total sub-Saharan Africa 119 -6.3 -8.3 17.1 3.0 2.0 16.4 2.9 1.9
Sesama eaed-Oil exporter. 1 -21.9 9.0Other sub-Saharan Afrtea 107 6.6 -9.5Total sub-Saharan Africa 108 4.4 -9.7 78.1 28.2 26.0 75.3 28.1 25.6
OtherBananasOil exportera 97 7.7 -10.7Other sub-Saharan frica 197 -0.9 -6.6Total sub-Sabaran Africa 294 0.9 -7.9 7.1 3.8 3.1 6.5 3.5 2.9
CottonOil exporters 30 -0.5 -1.3Other sub-Saharan Africa 443 7.0 -0.8Total aub-Saharan Africa 473 6.3 -0.9 23.1 22.8 23.4 15.5 10.1 10.8
RubberOil exportere 44 -2.6 -6.3Other sub-Saharan Africa 117 6.7 -0.9Total sub-Sabaran Africa 161 2.9 -2.4 1.0 4.4 4.6 6.8 4.3 4.5
SisalOil exporters 17 2.6 -24.5Other sub-Saharan Africa 135 -5.3 -7.7Total sub-Sabaran Africa 152 -3.9 -9.6 61.1 56.1 54.6 59.7 55.6 53.9
Sugarlll exporter. 21 -3.8 0.5
Other sub-Saharan Africa 1,254 2.8 2.2Total sub-Saharan Africa 1,275 2.4 2.2 12.8 7.2 7.3 5.6 4.8 4.9
TobaccoOil exporters 5 4.0 -7.8Other sub-Saharan Africa 139 1.3 3.2Total sub-Saharan Africa 144 1.4 2.8 14.6 18.7 17.6 8.2 11.7 11.0
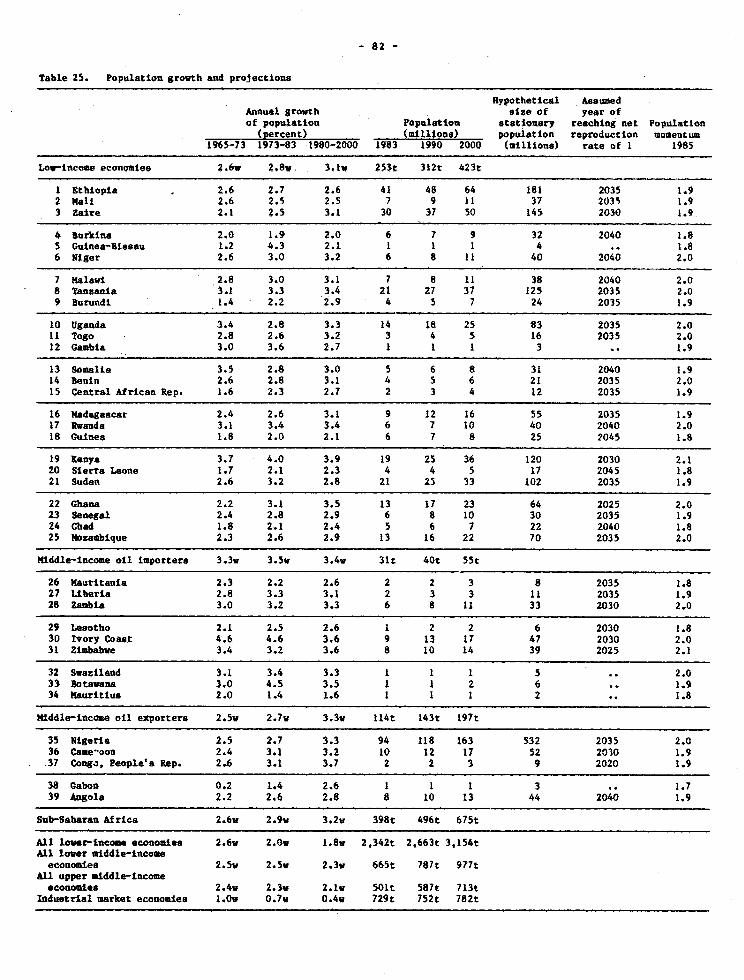
- 82 -
Table 25. Population growth and projectiona
Hypothetical AsaumedAnnual growth $s e of year ofof population Populatton statlonary reachíng net Population
(percent> (milltone> populatton reproduction mocentum1965-73 1973-83 1980-2000 1983 1990 2000 (millione) rete of 1 1985
Low-incoae economíes 2.6Y 2.8w 3.1w 253t 312t 423t
1 gthlopia 2.6 2.7 2.6 41 48 64 181 2035 1.92 Mali 2.6 2.5 2.5 7 9 11 37 2035 1.93 Zaire 2.1 2.5 3.1 30 37 50 145 2030 1.9
4 Burkina 2.0 1.9 2.0 6 7 9 32 2040 1.85 Guinea-Biaeu 1.2 4.3 2.1 1 1 1 4 .. 1.86 Ntger 2.6 3.0 3.2 6 a 11 40 2040 2.0
7 Malawi 2.8 3.0 3.1 7 8 11 38 2040 2.08 Tanzania 3.1 3.3 3.4 21 27 37 125 2035 2.09 Burundi 1.4 2.2 2.9 4 5 7 24 2035 1.9
10 Uganda 3.4 2.8 3.3 14 18 25 83 2035 2.011 Togo 2.8 2.6 3.2 3 4 5 16 2035 2.012 Gambia 3.0 3.6 2.7 1 1 1 3 .. 1.9
13 Somalia 3.5 2.8 3.0 5 6 8 31 2040 1.914 Benin 2.6 2.8 3.1 4 5 6 21 2035 2.015 Central African Rep. 1.6 2.3 2.7 2 3 4 12 2035 1.9
16 Madagascar 2.4 2.6 3.1 9 12 16 55 2035 1.917 Rwanda 3.1 3.4 3.4 6 7 10 40 2040 2.018 Cuines 1.8 2.0 2.1 6 7 8 25 2045 1.8
19 Kenya 3.7 4.0 3.9 19 25 36 120 2030 2.120 Sierra Leone 1.7 2.1 2.3 4 4 5 17 2045 1.821 Sudan 2.6 3.2 2.8 21 25 33 102 2035 1.9
22 Ghana 2.2 3.1 3.5 13 17 23 64 2025 2.023 Senegal 2.4 2.8 2.9 6 8 10 30 2035 1.924 Chad 1.8 2.1 2.4 5 6 7 22 2040 1.825 Mozambique 2.3 2.6 2.9 13 16 22 70 2035 2.0
Middle-income oil Importera 3.3v 3.5w 3.4w 31t 40t 55t
26 Mauritania 2.3 2.2 2.6 2 2 3 8 2035 1.827 Liberia 2.8 3.3 3.1 2 3 3 11 2035 1.928 Zambia 3.0 3.2 3.3 6- 8 11 33 2030 2.0
29 Lesotho 2.1 2.5 2.6 1 2 2 6 2030 1.830 Ivory Coset 4.6 4.6 3.6 9 13 17 47 2030 2.031 Z£mbabwe 3.4 3.2 3.6 8 10 14 39 2025 2.1
32 Swaziland 3.1 3.4 3.3 1 1 1 5 .. 2.033 Botsvana 3.0 4.5 3.5 1 1 2 6 .. 1.934 Mauritius 2.0 1.4 1.6 1 1 1 2 .. 1.8
Nlddle-income oil exportere 2.5w 2.7w 3.3V 114t 143t 197t
35 Nigerta 2.5 2.7 3.3 94 118 163 532 2035 2.036 Came^oon 2.4 3.1 3.2 10 12 17 52 2030 1.937 Congo, People'& Rep. 2.6 3.1 3.7 2 2 3 9 2020 1.9
38 Gabon 0.2 1.4 2.6 1 1 1 3 .. 1.739 Angola 2.2 2.6 2.8 8 10 13 44 2040 1.9
Sub-Saharan Africa 2.6w 2.9w 3.2w 398t 496t 675t
All lower-ineome econoades 2.6w 2.0v 1.8v 2,342t 2,663t 3,154t11 lower middle-incomeeconomies 2.5w 2.5w 2.3w 665t 787t 977t
All upper middle-incomeeconomies 2.4v 2.3w 2.1w 501t 587t 713t
Industrial market economiea 1.Ov 0.7w 0.4w 729t 752t 782t
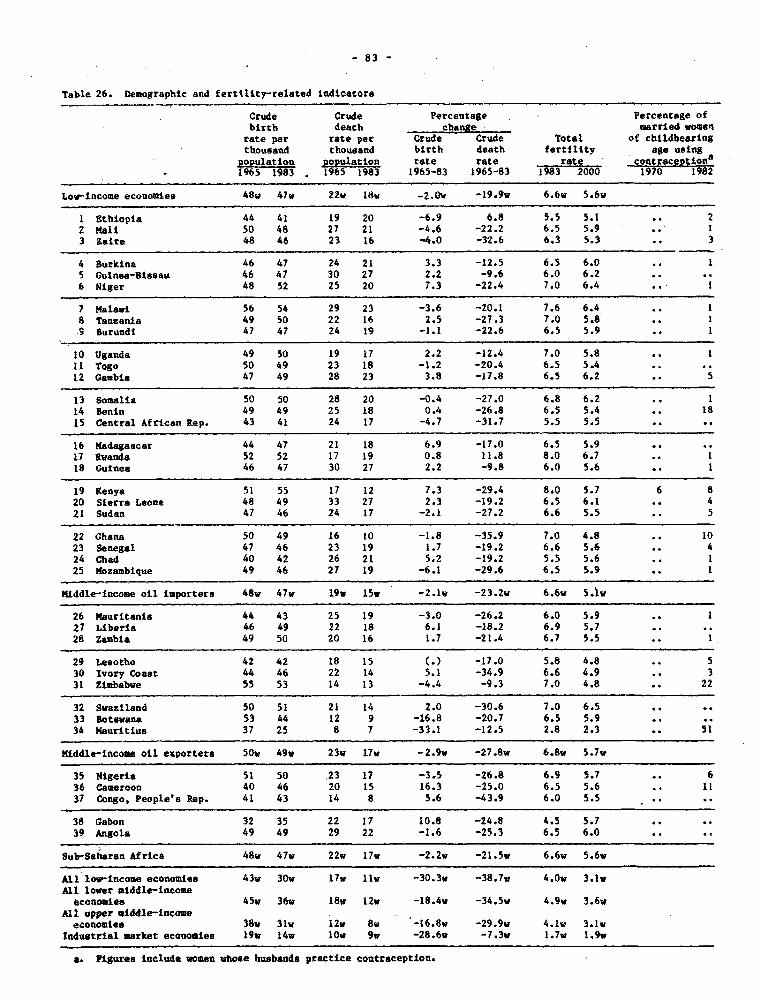
-83-
Tabl1e 26. Dleuographic and ferttlity-related iladicacora
Crude Crude Percentage Percentage ofbirth death change - mrried uoac'n
rate per rate per Crude Crude Total of childbearingthousand thouoand birth death fertil.ity alge usingpoulation l2Aon rate vate rate contraceDtion 5
1965 1983 * 61951at 1983 16-3 965-83 -1983 20W00 1970 1982
Low-incoee economíce 480 47v 22w 18V -2.0w -19.9v 6.6V 5.6v
1 £thiopia 44 41 19 20 -6.9 6.8 5.5 5.1 .. 22 mail 50 48 27 21 -4.6 -22.2 6.5 5.9 .. 13 Zaire 48 46 23 16 -4.0 -32.6 6.3 5.3 .. 3
4 Burkina 46 47 24 21 3.3 -12.5 6.5 6.0 .
5 Guinea-Uisaau 46 47 30 27 2.2 -9.6 6.0 6.26 Niger 48 52 25 20 7.3 -22.4 7.0 6.4 .
7 Malawi 56 54 29 23 -3.6 -20.1 7.6 6.4 .
8 Tanzanía 49 50 22 16 2.5 -27.3 7.0 5.8 .
9 BurundI 47 47 24 19 -1.1 -22.6 6.5 5.9 .
10 Uganda 49 50 19 17 2.2 -12.4 7.0 5.8 .
11 Togo SO 49 23 18 -1.2 -20.4 6.5 5.412 Gamzbia 47 49 28 23 3.8 -17.8 6.5 6.2 .. 5
13 Somalia so 50 28 20 -0.4 -27.0 6.8 6.2 .. 114 Benin 49 49 25 18 0.4 -26.8 6.5 5.4 .. 1815 central African tap. 43 41 24 17 -4.7 -31.7 5.5 5.5
16 Madagascar 44 47 21 18 6.9 -17.0 6.5 5.917 tvanda 52 52 17 19 0.8 11.8 8.0 6.7 .. 118 Guinea 46 47 30 27 2.2 -9.8 6.0 5.6 .. 1
19 Kenya 51 55 17 12 7.3 -29.4 8.0 5.7 6 820 Sierra Leone 48 49 33 27 2.3 -19.2 6.5 6.1 .. 421 Sudan 47 46 24 17 -2.i -27.2 6.6 5.5 .. 5
22 Ghana 50 49 16 lo -1.8 -35.9 7.0 4.8 .. 1023 Senegal 47 46 23 19 1.7 -19.2 6.6 5.6 .. 424 Chad 40 42 26 21 5.2 -19.2 5.5 5.6 .. 125 Mozambique 49 46 27 19 -6.1 -29.6 6.5 5.9 .. 1
Itiddle-income oíl importear 14 v 47w 19v l5v -2.1v -23.2w 6.6w 5.Iw
26 Mauritania 44 43 25 19 -3.0 -26.2 6.0 5.9 .. 127 Liberia 46 49 22 l8 6.i -18.2 6.9 5.728 Zambía 49 50 20 16 1.7 -21.4 6.7 5.5 .. 1
29 Lesotho 42 42 18 15 (> -17.0 5.8 4.8 .. 530 lvory Coast 44 46 22 14 5.1 -34.9 6.6 4.9 .. 331 Ziababve 55 53 14 13 -4.4 -9.3 7.0 4.8 .. 22
32 Swaziland 50 si 21 14 2.0 -30.6 7.0 6.533 Blotsvana 53 44 12 9 -16.8 -20.7 6.5 5.934 Maurítius 37 25 8 7 -33.1 -12.5 2.8 2.3 .. 51
Middle-incoma oil exportera 50v 4 9v 23w 17w -2.9v -27.8w 6.8w 5.7v
35 Y4igeria 51 s0 23 17 -3.3 -26.8 6.9 5.7 .. 636 Cameroon 40 46 20 15 16.3 -25.0 6.5 5.6 .. 1137 Congo, People's Rap. 41 43 14 8 5.6 -43.9 6.0 5.5
38 Gabon 32 35 22 17 10.8 -24.8 4.5 5.739 Aigola 49 49 29 22 -1.6 -25.3 6.5 6.0
S,b-Saharan Africa 48v 47v 22w 17, -2.2v -21.5v 6.6w 5.6v
All IowIncome economiea 4 3v 30w 17y 11w -30.3w -38.7w 4 .Ow 3.1vAll lover aiddle-Incoaeeconomías 4 5v 36v 18w 12v -18.4v -34.5w 4 .9w 3.6w
Ahl upper caidále-incomteeconomies 38Y 31v 12v 8v -16.8w -29.9w 4.1w 3.1w
Industrial msrket ecmoinomís 19v 14w 10v 9w -28.6w -7.3w 1.7w 1.9v
a. ligures include vomen v~se huabanda practica contraception.
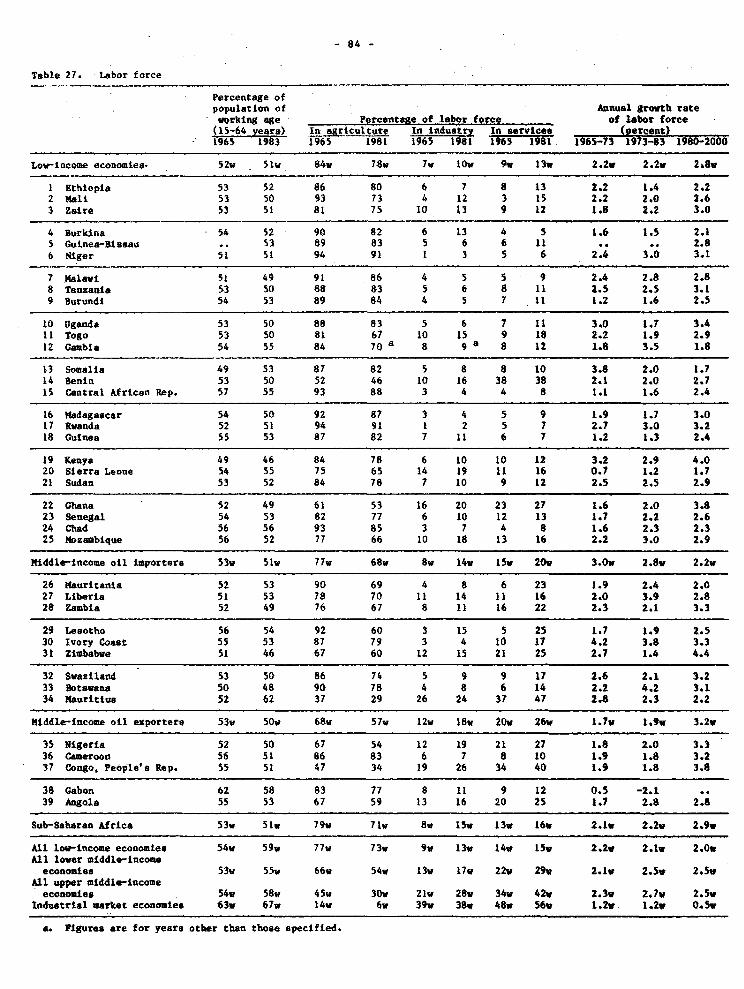
- 84 -
Table 27. Labor force
Percentage ofpopulation of Annual growth ratevorking age Percentage of labor force of labor force
(15-64 veara) In ¡.lr cultur eIn tndustry ln servicea (mercent)1965 1983 1965 1981 1965 1981 1965 1981 1965-73 1973-83 1980-2000
Lov-incose economaes. 52w Slw 84v 7 8w 7w 10w 9v 13V 2.2w 2.2v 2.8v
1 Ethtopia 53 52 86 80 6 7 8 13 2.2 1.4 2.22 Msli 53 S0 93 73 4 12 3 15 2.2 2.0 2.63 Zaire 53 Sl 81 75 10 t3 9 12 1.8 2.2 3.0
4 Burkína 54 52 90 82 6 13 4 5 1.6 1.5 2.15 outnea-Biasau .. 53 89 83 5 6 6 11 .. .. 2.86 N? ger 51 S1 94 91 1 3 5 6 2.4 3.0 3.1
7 lalavi 51 49 91 86 4 5 5 9 2.4 2.8 2.88 Tanzanta 53 50 88 83 5 6 8 11 2.S 2.5 3.19 Butundi 54 53 89 84 4 5 7 11 1.2 1.6 2.5
10 Uganda 53 S0 88 83 5 6 7 11 3.0 1. 3.411 Togo 53 50 81 6t 10 15 9 18 2.2 1.9 2.912 Gambia 54 55 84 70 a 8 9 8 12 1.8 3.5 1.8
13 Somalia 49 53 87 82 5 8 8 10 3.8 2.0 1.714 Senin 53 S0 52 46 10 16 38 38 2.1 2.0 2.715 Central African Rep. 57 55 93 88 3 4 4 8 1.1 1.6 2.4
16 Madagascer 54 50 92 87 3 4 5 9 1.9 1.7 3.017 Rvanda 52 Si 94 91 1 2 5 7 2.7 3.0 3.218 Guinea 55 53 87 82 7 11 6 7 1.2 1.3 2.4
19 Kenya 49 46 84 78 6 10 10 12 3.2 2.9 4.020 Sierra Leone 54 55 75 65 14 19 11 16 0.7 1.2 1.721 Sudan 53 52 84 78 7 10 9 12 2.5 2.5 2.9
22 Ghana 52 49 61 53 16 20 23 27 1.6 2.0 3.823 Senegal 54 53 82 77 6 10 12 13 1.7 2.2 2.624 Chad 56 56 93 85 3 7 4 8 1.6 2.3 2.325 Mozambique 56 52 77 66 10 18 13 16 2.2 3.0 2.9
MiddIe-income otl importere 53v 51w 7 7w 68v 8v 14v 15v 20v 3.0w 2.8w 2.2w
26 Mauritanta 52 53 90 69 4 8 6 23 1.9 2.4 2.027 Liberia 51 53 78 70 11 14 11 16 2.0 3.9 2.828 Zambia 52 49 76 67 8 11 16 22 2.3 2.1 3.3
29 Lesotho 56 54 92 60 3 15 5 25 1.7 1.9 2.530 Ivory Coaat 55 53 87 79 3 4 10 17 4.2 3.8 3.331 Zimbabwe 51 46 67 60 12 15 21 25 2.7 1.4 4.4
32 Svaziland 53 50 86 74 5 9 9 17 2.6 2.1 3.233 Botavean 50 48 90 78 4 8 6 14 2.2 4.2 3.134 lauritius 52 62 37 29 26 24 37 47 2.8 2.3 2.2
MtddI-income oíl exporters 5 3w soy 68v 57 w 12w 18w 20v 26v 1.7Y 1.9v 3.2v
35 Nigería 52 50 67 54 12 19 21 27 1.8 2.0 3.336 Cameroon 56 51 86 83 6 7 8 10 1.9 1.8 3.237 Congo, Peóple's Rep. 55 51 47 34 19 26 34 40 1.9 1.8 3.8
38 Gabon 62 58 83 77 8 11 9 12 0.5 -2.139 Angola 55 53 67 59 13 16 20 25 1.7 2.8 2.8
Sub-Saharan Africa 53v Slw 79v 71w 8w 15v 13v 16v 2.1v 2.2v 2.9Y
All lovincome economíes 54v 5 9 v 77w 73w 9w 13w 14v 15v 2.2v 2.1v 2.0vAll lover míddle-incomeeconomías 53v S5v 66v 54 w 13w 17v 2 2 v 2 9 v 2.1v 2.5v 2.5w
All upper middle-incomeeconomies 54w 58 w 45v 30w 21v 28v 34w 42v 2.3v 2.7v 2.5v
Industrial msrket economíes 63v 67 w 14w 6w 39w 38w 48v 56v 1.2v. 1.2Y 0.5,
a. Figures are for years other than those apecífied.
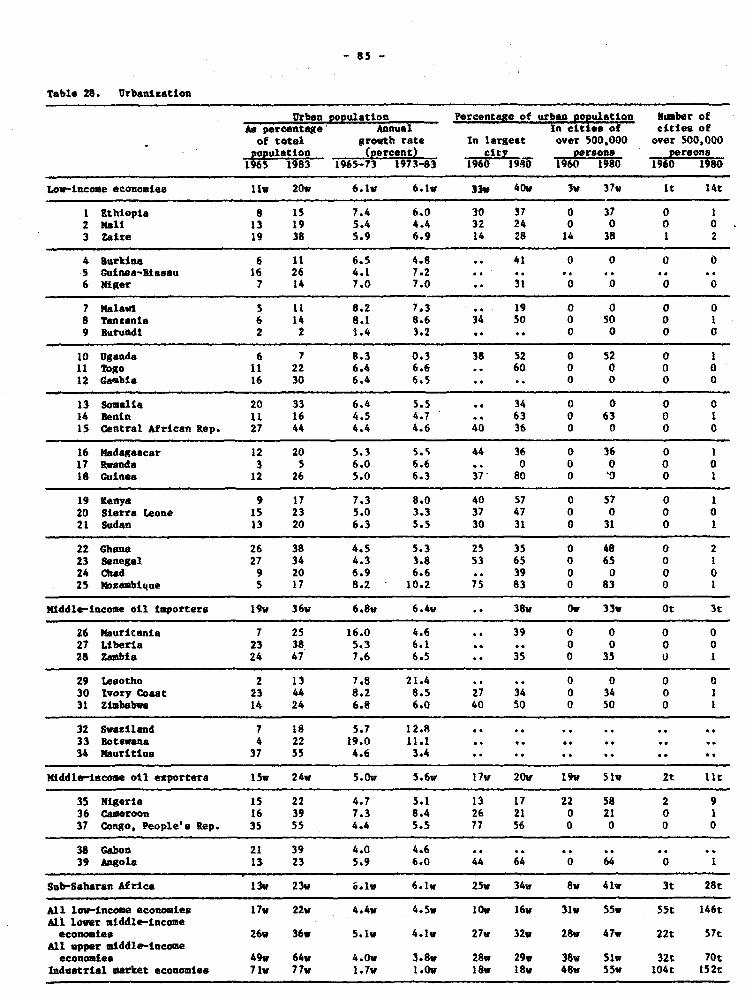
Tible 28. Urbanizatlan
Urban populatlon Percentage of urban populatíon litambar ofAs percentage' Annual- In cujes of eiii.. ofof total gro,th rate In largeat *ver 500,000 over 500.000p?pulation (2!rcent) niypron1965 1983 1965-73 1973483 1960 194v7 1960sra 98 T0 1980
Lov-incffie economie. 11, 20v 6.1, 6.1v 33v 40, 3v 37v it 14t
1 Rihiopia 8 15 7.4 6.0 30 37 0 37 0 12 mal¡ 13 19 5.4 4.4 32 24 0 0 0 0.3 Zatre 19 38 5.9 6.9 14 28 14 38 1 2
4 lurlkísa 6 11 6.3 4.8 .. 41 0 0 0 05 Guiana-Biessu 16 26 4.1 7.2 .. .. ¿6 Niger 7 14 7.0 7.0 .. 31 0 00
7 oalwi S. 11 8.2 7.3 .. 19 0 0 0 0S Tan2anta 6 14 8.1 8.6 34 so 0 SO 0 19 Burufldi 2 2 1.4 3.2 .. . 0 O 0
10 Uganda 6' 7 8.3 0.3 38 52 0 52 0 111 Togo 11 22 6.4 6.6 .. 60 0 0 0 012 Cambia 16 30 6.4 6.5 . .. 0 0 0 0
13 Somalia 20 33 6.4 5.5 .. 34 0 0 0 014 Emnin 11 16 4.5 4.7 .. 63 0 63 0 115 Central African iep. 27 44 4.4 4.6 40 36 0 0 0 0
16 Madagascar 12 20 5.3 5.% 44 36 0 36 0 117 imanda 3 5 6.0 6.6 .. O O O O18 Guinea 12 26 5.0 6.3 37 80 0 '0 0 1
19 Kenya 9 17 7.3 8.0 40 57 0 57 0 120 Sierra Leone 15 23 5.0 3.3 37 47 0 0 0 021 Sudan 13 20 6.3 5.5 30 31 0 31 0 1
22 Ghana 26 38 4.5 5.3 25 35 0 48 0 223 Senegal 21 34 4.3 3.8 53 65 0 65 0 124 Chíd 9 20 6.9 6.6 .. 39 0 0 0 025 Noxambique 5 17 8.2 10.2 75 83 0 83 0 1
Niddle-Incoae oíl importers 1%v 36Y 6.8, 6.4v . 38Y 0, 33, Ot 3t
26 Mauritania 7 25 16.0 4.6 .. 39 0 0 0 027 Liberta 23 38 5.3 6.1 0. . 0 O O28 Zaebia 24 47 7.6 6.5 . 35 0 35 U 1
29 Lesotho 2 13 7.8 21.4 0. . O O O30 lvory Coaat 23 44 8.2 8.5 27 34 0 34 0 131 Zimbabwe 14 24 6.8 6.0 40 50 0 50 0 1
32 Svaziland 7 18 5.7 12.8 . . .
33 Boteusna 4 22 19.0 11.1 . . .
34 Mautritius 37 55 4.6 3.4 . . .
W1ddle-ineome oíl eiporterí 15w 24v 5.0, 5.6w 17Y 20v' 19V 51, 2t Iii
35 Nigeria 15 22 4.7 5.1 13 17 22 58 2 936 Cimeroon 16 39 7.3 8.4 26 21 0 21 0 137 Congo, People's Rep. 35 55 4.4 5.5 77 56 0 0 0 0
38 Giban 21 39 4.0 4.6 . . . . .¿
39 Angole 13 23 5.9 6.0 44 64 0 6401
Sub-Saharan África 13, 23v <,.Iw 6.I, 25v 34v 8w 41v 3t 28t
£ll l~vincoae economies 17, 22w 4.4* 4.Sw 10, 16Y 31, 55, 55t 146tAll lavar rsddle-incoue*cononies 26v 36, 5.1w 4.lw 27, 32w 28w 47w 22t 57t
All upper uiddle-incoueeconomías 49, 64w 4.0, 3.8, 28w 29, 38w 51, 32t 70t
Industrial uarket economies 71, 77v 1.7v 1.0, 18v 18, 48v 55, 104t 152t
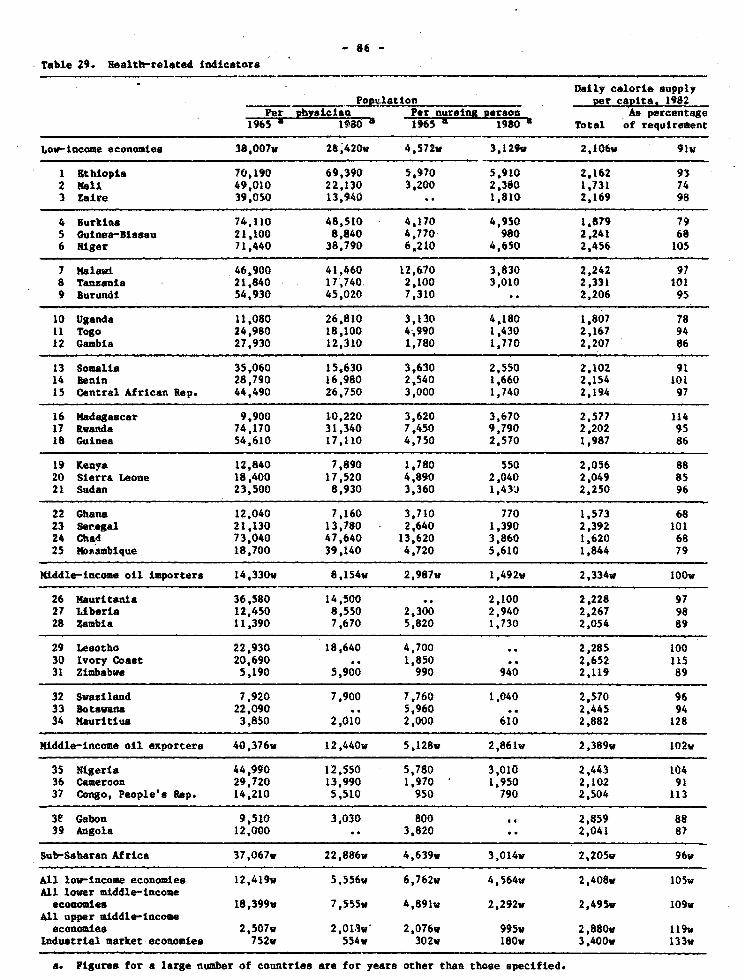
- 86 -
Table 29. Realth-related indicators
Dally caloría oupplyPopvlation per capite, 1982
Per pvbsic1ao Per nursina pers n As percentage1965 :9; T 1965 1980 Total of requiresení
Low-income econosates 38,007w 26,420w 4,572w 3,129V 2,106w 91v
1 Ethiopia 70,190 69,390 5,970 5,910 2,162 932 Mali 49,010 22,130 3,200 2,380 1,731 743 Zaire 39,050 13,940 1,810 2,169 98
4 Burkina 74,110 48,510 4,170 4,950 1,879 795 Guinea-3iseU 21,100 8,840 4,770 980 2,241 686 Niger 71,440 38,790 6,210 4,650 2,456 10I
7 Malawi 46,900 41,460 12,670 3,830 2,242 978 Tanzanta 21,840 17,740 2,100 3,010 2,331 1019 Burundi 54,930 45,020 7,310 2,206 95
10 Uganda 11,080 26,810 3,130 4,180 1,807 7811 Togo 24,980 18,100 4-,990 1,430 2,167 9412 Galbla 27,930 12,310 1,780 1,770 2,207 86
13 Somalia 35,060 15,630 3,630 2,550 2,102 9114 Benin 28,790 16,980 2,540 1,660 2,154 10115 Central African Rep. 44,490 26,750 3,000 1,740 2,194 97
16 Madagascar 9,900 1-0,220 3,620 3,670 2,577 11417 Rvanda 74,170 31,340 7,450 9,790 2,202 9518 Guinea 54,610 17,110 4,750 2,570 1,987 86
19 Kenya 12,840 7,890 1,780 550 2,056 8820 Sierra Leone 18,400 17,520 4,890 2,040 2,049 8S21 Sudan 23,500 8,930 3,360 1,43'J 2,250 96
22 Ghana 12,040 7,160 3,710 770 1,573 6823 Seregal 21,130 13,780 2,640 1,390 2,392 10124 Chad 73,040 47,640 13,620 3,860 1,620 6825 Paor.sbique 18,700 39,140 4,720 5,610 1,844 79
Míddle-income oll lmportera 14,330, 8,154w 2,987w 1,492w 2,334w lOOv
26 Mauritania 36,580 14,500 . 2,100 2,228 9727 Liberia 12,450 8,550 2,300 2,940 2,267 9828 Zambia 11,390 7,670 5,820 1,730 2,054 89
29 Lesotho 22,930 18,640 4,700 . 2,285 10030 Ivory Coast 20,690 . 1,850 .. 2,652 11531 Ziababwe 5,190 5,900 990 940 2,119 89
32 Swaziland 7,920 7,900 7,760 1,040 2,570 9633 Botswana 22,090 5,960 .. 2,445 9434 Mauritius 3,850 2,010 2,000 610 2,882 128
íiddle-íecome oll exportere 40,376w 12,440w 5,128v 2,861w 2,389w 102w
35 Ntgeria 44,990 12,550 5,780 3,010 2,443 10436 Cameroon 29,720 13,990 1,970 1,950 2,102 9137 Congo, People's Rep. 14,210 5,510 950 790 2,504 113
3e Gabon 9,510 3,030 800 2,859 8839 Angola 12,000 3,820 2,041 87
Sub-Saharan Africa 37,067v 22,886w 4,639% 3,014w 2,205w 96w
All low-income economies 12,419% 5,556w 6,762v 4,564w 2,408w 105wAll lower míddle-income
economdes 18,399, 7,555w 4 ,891v 2,292w 2,495Y 109wAll upper middle-incomeeconomíes 2,507w 2,018w' 2,076v 995w 2,880w ll9w
Industrial market economies 752v 554v 302v 180w 3,400w 133w
a. Figures for a large number of countries are for yeara other than those epecified.
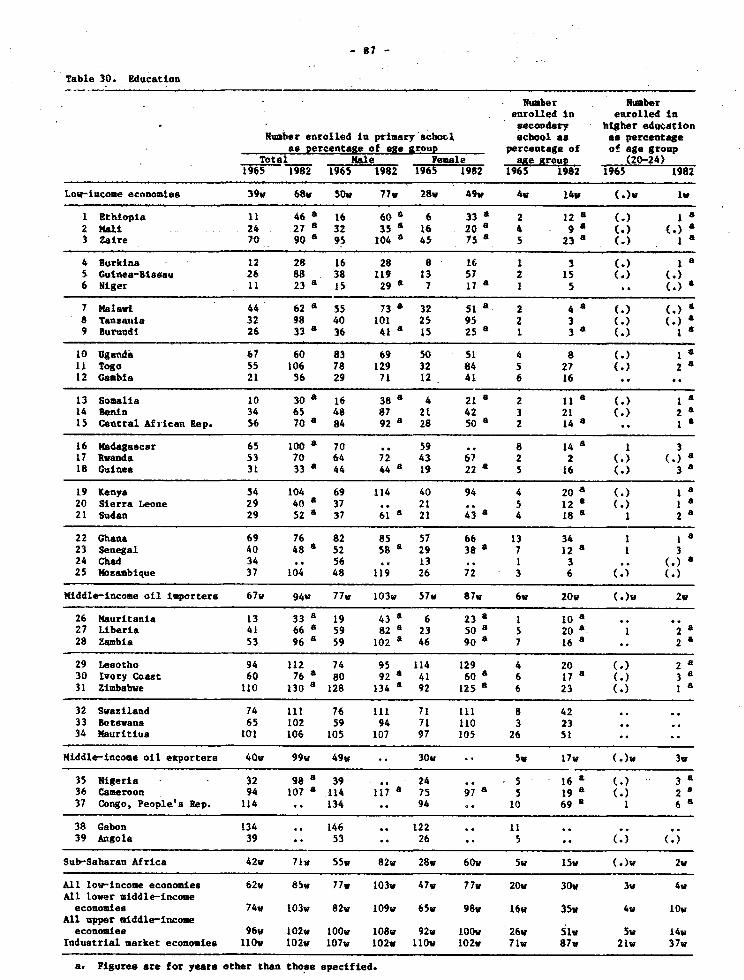
Tabla 30. Edncatían
- Nu~br Numbrenrolled In enrolled lasecoodary htgher eduo*tton
Nuaber enrolled la priaary schocl echeol es es percentegees percentage of age group percentage of of age group
Total Mal Femae ae Kr,uD (20-24>1965 2 1965 1982 196$ 1982 1965 1982 1965 1982
Low-iacome econonies 39v 68v 50w 77v 28v 4 9w 4v 14Y (.)v lv
1 Ethfopia 11 468a 16 6081 6 3381 2 128 a ¡a2 Mal 24 27 32 35 * 16 20 8 a 1> > 3 Zaire 70 90 95 104 a 45 *s. 5 23 a <>1
4 Burkina 12 28 16 28 8 16 1 3 (>¡$ Cuinea-Siasau 26 88 38 119 13 57 2 15 >6 Níger 11 238a 15 29'a 7 17' j 5 ()
7 Malawi 44 6286 55 7381 32 si a 2 48 (**8 Tanzania 32 98 40 101 25 95 2 3 (.() 9 Burundi 26 338a 36 418a 15 25 a 1 38 m * a
10 Ugantda 67 60 83 69 so 51 4 8 (>1 11 Togo 55 106 78 129 32 84 5 27 (.12 Gambia 21 56 29 71 12 41 6 16
13 Somalia 10 30 * 16 38'a 4 218a 2 ll18 a>14 Benin 34 65 48 87 21 42 3 21 (>2S15 Central Afviean Rep. 56 708a 84 92'a 28 5081 2 14 10i
16 Madagascar 65 100'* 70 .. 59 .. 8 148a 1 317 ivanda 53 70 64 72 43 67 2 2 ((.>l18 Guinea 31 338a 44 448a 19 228a 5 16 ()3a
19 Kenya 54 104 69 114 40 94 4 20' a .) a20 Sierra Leone 29 408a37 .. 21 .. 5 12 (>a¡21 Sudan 29 528a 37 61'a 21 438 4 i8s 1 28
22 Ghana 69 76 82 85 57 66 13 34 1 123 Senegal 40 488a 52 58'a 29 38' 7 12'a 1 324 Chad 34 .. 56 . 13 .. 1 3 . ()25 Mozalubique 37 104 48 119 26 72 3 6()
Middle-incoma oíl importera 67v 94v 77w 103v 57v 87w 6w 20w (.>w 2v
26 Maurítania 13 33'a 19 438 6 238a 1 108a27 Liberia 41 66'a 59 82'a 2.3 50'a 5 20 a- 1 228 Zambia 53 968a 59 1028a 46 9081 7 168 . 2a
29 Leaotho 94 112 74 95 114 129 4 20 (>2 '30 Ivory Coagt 60 76 a 80 92'a 41 60'a 6 178 < 3a31 Zimbabwe líO 1308' 128 1348 92 125'a 6 23 a. 1
32 Swazilland 74 111 76 111 71 111 8 4233 Botswana 65 102 59 94 71 110 3 2334 Mauritius 101 106 105 107 97 105 26 si
Middle-income oíl exportera 40Y 99Y 49v 30v .. v O7 () 3v
35 Nigeria -32 9 8 a 39 .. 4 5 -16' a . 38a36 Cameroan 94 1 0 7 a 114 117 75 97a 5 19' (.>237 Congo, People'a Rep. 114 .. 134 .. 94 . 10 6981 1 68a
38 Gabon 134 .. 146 .. 122 1139 Angola 39 .. 53 .. 26 .. 5 . .
Sub-Saharan Africa 42v 7 1w 55w 82v 28w 60w 5v 1w <.)v 2v
All low-income economí es 62v 85v 77v 103w 47w 77w 20w 30v 3v 4vAlIl lovar mftddle-incomeeconomie. 74v 103w 82w 109v 65v 98v 16w 35w 4v 10v
£11 upper uidd¿1-le-iftoaconomiíes 96w 102w 100v 108v 92v 100, 26v 51v 5v 14w
Induatríal aarket economías 110w 102v 107v 102v 110v 102v 71v 87v 21v 37w
a. Figures are for years other than thoese apecified.
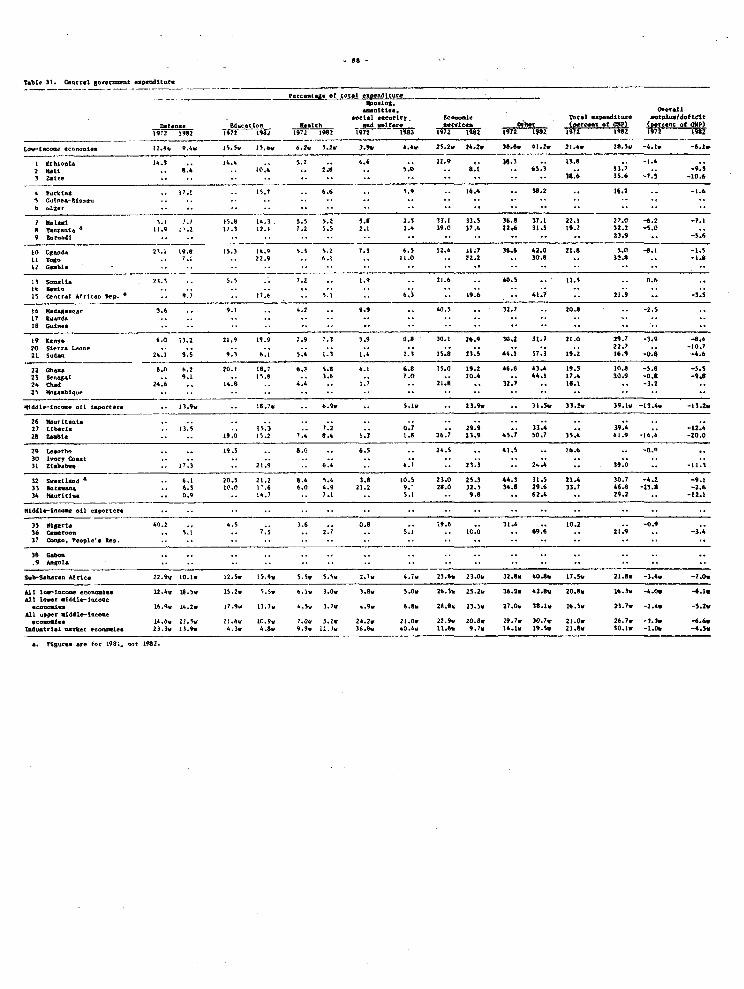
-11. .972 t -2- 1- 2- -I"r- W-1
t Fthtopia 14.3 14,4 ÍIT 4.4 22.92 Kalt 8.4 10.4 2.8 5.0 8.1 65.3
MA 33.6 -10,6
l.rkt.* 15.7 5,9 16.4 W.2 16.2 -1.6
N.Lud 5 2 5 2 3 33.5 36.8 37,1 22.1 27.e -6.2 -7 1a T*"..te ll:,' !?:Í l, 7': , 142:,1 7 2 s:s 2:', 2 4 39.0 31.4 22.6 31.5 19.7 12.2 -5.0
23.9
lo tgod 21 1 19 ¡s 3 14 9 5 3 5 2 7 3 5 12 4 lí 36 6 42 0 21.8 5.0 -0.1 -1.511 T~ : 11:0 :,2 30:0 12.412 G"bl.
13 S-11. 23 5 5 40.5 3 5
15 ce. -1 Af,[- IL.P. ti,; 5.1 6. 3i 19.6 41.7 21.9 -3.5
Lt6 Kdag r 3 9 1 4.2 9.9 32 7 20.8 -2.57a
19 K.O- 6.0 13.2 21.9 19.9 1.9 7.3 1.9 a 30 1 26 9 30 2 31 7 21.0 29.7 -3.9 -8.420 sie- l- 22 -10.721- 5~ 24:; 9:5, 9:3, 5:4, 1:3, Z.; ¡S.¡ 23.; 44.; 57.; 191:2' tb:í -4.ó
22 Ch 8.0 M 20.t 18.1 (112 5.9 4.1 6.8 15.13 19.2 415.6 43.4 19.5 10.8 -5.8 -5.523 sé.#g 1 .. 9.1 15.8 .. 3.6 1 .4 30 9 -0.8 .024 Ch*4 24.4 14.11 4.4 l.; 21:8' '0 l:; 3 225
217 Lthol. 13:; ls:; 1:2, o.; 29:; 39:¿la Ubl. 19.0 15.2 8.4 1.3 1.8 26.7 23.9 45.7 50.7 35.4 41.9 -14.4 -20.0
29 19.5 S.Q 6.5 24.5 41,5 16.6
30 1 .. y C.-t : ', ; 39:¿.3LZt::.bn 2l:i ¿; :: 23:3, 2.:4'
12 S- tt-d 20 5 2 2 11.4 5.4 10.5 23.0 25.3 44.3 31.5 21.4 30.7 -4.2 -9.133 21-1 g., 20.0 32.5 34.8 29.6 33.7 46.8 -23.8 -2.6
.W.. lo 0 1 6 6.0 4.934 Marítl.. 0,9 14.7 7.1 5,1 9.8 62.4 29.2
Míddl-i.- .11 .. p.n.r.
35 Sige�U 0.2 4.5 3.6 0.8 31.4 10.2 913,1 C- 5.1 7.5 2.7 10.0 69.6 21.911 C.U., P*OPI.,s R.P.
38 Gabo.__9 Ang.1.
S.b-S.h&-. &trL.. 22.�N 10.1. 12.5. 15.9Y 5.5Y 5.5. 2.7. 4.7. 23.% 23.OV 32.8. 40.0. 17.3. 21.8. -3.4. -7.0.
AL11 12.4. 18.5. 15.2. %.S. b.l. 3.0. 3.Ov S.O. 26.1. 25.2. 36.2. 42.Sw ZO.Su ló.). -4.0. -6.1.Al 11-
.- ~i 14.4. 14.2. 17.9. 13.7. 4.5V 1.7. 4.9. b.a. 28.8% 23.5Y 27.0. 38.1Y 16.5. 23.1. -2.4. -5.2YAll -Pper xlddl-i..~
c~ - 14.4. 11.5Y 11.6. 10.9. 7.0. 5.2. 24.2V 21.0. 22.9. 20.8. 19.7. 30,7v 21.OV 26.7. -3.1. -6.6.lmmtn.l -yke -~ Ue 23.3V 13.9. 4.3. 4.8. 9,9* 1,13. IM- 40.4. 11.6. 9.7. 14.10 19.Sv 21.8. 30.1. -1.0. -4.5.
Ftg.m. r. f- 19811. -t 1982.
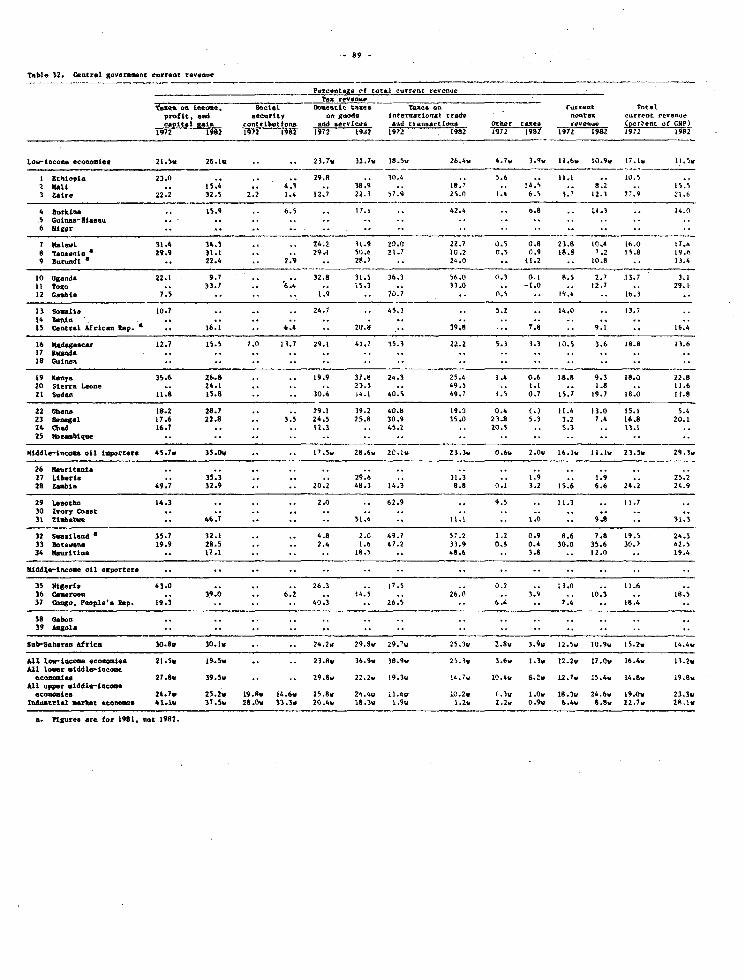
-89-
Tabla 32. Central govarmnaan current ra,anoe
Percentego r'f total curreoc renenueYax revefne______
Tazas oa tu~m. sen:ia llosstin baSco Taz4e lft r.ntret Totalprof it. and secelrtV o. goodz ieternttooaí trode nontaz current aaoCapital Rat cootrtb.,tlona zod aervínea &,,d t~anoartínv Other tauco c8ve..e .•p ecnt of 081')
).972 T982 19 72 l19 02 [9~72 19.2 1972 1í82 172 1982 1912 1982 19 72lQ2
Lo.-$acoaa eco-oalea 21.5v 24.1, .. . 23.7Y 32.7v 38,.5. 26.4. 4.7. 5.9., 11.6. 10.9., (7.1., 11.5.,
¡ Eridopía 21. . . . 29.8 .. 0.4. .. 58 .. . .. 1.3 llaIL .. 5.4 4.5 . 38.9 . 18.7 .. 4.' .. 8.2 [5:31 ZAre 22.2 52.5 2.2 1.4 [2.7 22.3 57.9 25.0 l.¡ b.5 3L7 12.3 2?.9 1.
8. Bukin. 15.9 .. 6.5 .. 11. 42.4 . .8 . 13 1, 4.0.5 Ooiuea-Ulau. . .. . . - . . . . .
7 [Isla,í 51.4 34.3 . . 24.2 31.9 20.0 22.7 0.5 2.4 23.8 10. 14.0 L17.¡.8 TazanIa a 29.9 31.1 . .. 29.1 50.6 71.7 10.2 0,5 0.9 18.8 1.2 [5.8 19.69 8BU ¿1 22.4 .. 2.9 .. 28.3 24.0 .. 11.2 .. 10.8 .. 13.4
[0 Uganda 22.1 9.7 . .. 32.8 31.5 36.3 56.0 0.3 (l.¡ 8.5 2.7 13.7 3.111 Togo .. 33.7 . 6 .4 .. 5.5 33.0 .. -1.0 .. 12.7 .. 29.1[2 Csabía 7.5 M. . . 19 . 70.7 .. m5 . 13.4 .. 1.3
15 Somaela- lo . .. . 24. .. 45.3 .. 5.2 .. 4.0 .. 3,7
13 central Afrícan ftep. .. 16.1 . 44 . 20.8 .. 39.8 .. 78 . . .16---
[6 lladagazcar 12.7 13.5 7.0 [3.7 29.1 41.7 35.3 22.2 5.3 3.3 10.5 3.4 18.9 [3.6
19 Sonya 35.6 24l.8 . . 19.9 37.83 24.3 25.4 1.4 0.6 [8.8 9.3 [8.2 22.820 SIerra Leaone . 24.t . .. . 23.S, . 49.5 .. 1.1 .. 18 a .1
21 Sudan 11.8 15.8 .. . 0. 14.1 40.5 49.7 [.5 0.7 14.7 19.7 18.0 11.8,
22 Ghana [0.2 28.7 . .. 29.1 39.2 40.4 19.0 0.4 <.1 21.4 [5.0 15.1 5.423 Senegal ¡7.6 22.8 .. 3.3 24.5 25.8 30.9 35.0 23.8 3.3 3.2 7.4 ¡6,8 20.124 Chad 16.7 .. . . 12.3 .. 45.2 .. 20.5 .. 5.3 .. 13.125 t4oaabíqwa. . . . . . . . . . .
?Iiddla-incoae * ol tportara 45.7., 35.0, 1. . 7.5V 28.4., 20.1, 23.3., 0.4., 2.0v 14.l., 11.1v 23.5v 29.3.,
26 Naurítatvla . . . . . . . . . .
27 Liberia . 35.3 .. .. . 29.6 . 31.3 .. 1. 1.9 . 25.2,28 Zaaba 69.7 32.9 . .. 20.2 48.3 14.3 8.8 0.1 3.2 15.6 4.6 24.2 24.9
29 Leaocho 14.3 .. . . 2.0 .. 62.9 .. 9.5 .. 11.3 .. I.?30 Ivory Ceaat . . . . . . . . . . .
51 Uiabab,a . 44. . . . 3j.4 .. 1. . 10 . 98 . 1.
32 SwazIland a 35.7 32.1 . .. 4.8 2.0 49.7 37.2 1.2 0.9 8.6 7.8 19.5. 24.333 lotavna 19.9 28.5 . .. 2.4 1.4 47.2 33.9 0.5 0.4 30.0 35.6 30.7 42.534 Naurltlua 17.1 .. . . j. .48.6 .. 3.8 1. 2.0 .. 19.4
lllddlatno aam oíl exportare .. . . . .. . . . . .
35 ¡lgarla 43.0 .. . . 24.3 .. .5 . 0.2 .. 3.0 .. 11.656 Camaroo .. 9.0 .. .2 t. 4.5 .. 24.0 .. .9 .. 10.3 .8.
37 Congo, Paople'a Rap. 19.3 .. . . 40.3 .. 26.5 .. 4. .. .4 .. 8.4
Sob-4aharao Afrtca 30.8., 30.1, . . 24.2., 29.8Y 29.'., 25. 3. 2.8Y 3.9., 12.5., 11.9, 15.2., 14.4.,
£11 lavIncoae economías 21.3v 19.5, .. . 23.4, 36.9., 38.9v 25.3., 3.5., 1.3., 12.2., 17.0., 14.4, 13.2,
Mi1 lavar aiddle-incoaeeco-164e 27.8, 39.5, .. . 29.8., 22.2, 19.3, 14.7. 10.4., 8.2., 12.7., 15.4., 14.8, 19.8.,
A11 oppar aiddle-Lncoaaaconoaea 24.7, 25.2. 19.8. 14.6v 25.8, 24.4., 11.4. 10.2Y <.3., 1.0., 18.3., 24.6, 19.0, 23.3.,
Industrial sarfrua aconome 41.1V 33.5v 28.0v 33.3, 20.4, 1
8.3v 1.9V 1.2, 2.2V 0.9., 6.4., S.%. 22.7. 38.5.
A. FIgure erar for 1981, zar 1982.
- 90 -
Techaical notes
Table 1. Basic indicatora
The estimates of population for mid-1984 are based primarily on datafrom the UN Population Division. In many cases the data take ínto account theresults of recent population censuses. The data on area are from the computertape for the Food and Agriculture Organization (FAO) Production Yearbook, 1983.
Gross national product (CNP) measures the total domestie and foreignoutput claimed by residente. It comprises grosa domestic product (see theno..e for Tables 2 and 3) and factor incomes tsuch as investment income, laborincome, and interest income) accruing to residento from abroad, lesa theincome earned in the domestic economy acceuing to persona abroad. It ¡s cal-culated without making deductions for depreciatíon.
The GCP per capita figures are calculated according to the nevlyrevised World Bank Atlas method. Perfect cross-country comparability of percapita CNP estimates cannot be achieved. Two obstecles stand in the way ofadequate comparabílity. One concerns CNP numbers themselves. There aredifferences in the national accounting systems of countries and in thecoverage snd reliability of underlying statistical information between variouscountries. The other relates to the conversion of CNP data expressed indifferent national currencies, to a common currency--conventionally the USdollar--to compare them across countries. The Bank's procedure for convertingCNP to US dollarn ¡a essentially based on the use of a three-year average ofthe official exchange rate. For a few countries, hovever, an alternativeconversion factor in used because the prevailing official exchange rate isjudged to diverge by an exceptionally large margin from the rate effectivelyapplied to actual foreign exchange transactiona.
Recognizing that these shortcomings affect the comparability of theCGP per capita estimates, the World Bank has introduced several improvements¡n the estimation procedures. Through its regular review of national accountsof ite member countries, the World Bank systematically evaluates the GNPestimates, focusing on the coverage and concepts employed, and whereappropriate makes adjustments to improve comparabilíty. As noted above, theBank also asseases the appropriateness of the exchange rates as conversionfactors.
The estimates of 1984 CGP and per capita CNP are calculated on thebasis of the 1982-84 base period. With this method, lhe first step ¡a tocalculate the conversion factor. Thís ¡s done by taking the simple arithmeticaverage of the actual exchange rate for 1984 and deflated exchange rates for1982 and 1983. To obtain the latter, the actual exchange rate for 1982 jamultiplied by the reletjve rate of inflation for the country and for theUnited States between 1982 snd 1984; the actual exchange rate for 1983 jimultiplied by the relative rate of inflation for the country and the UnitedStates between 1983 and 1984. The average of the actual and the deflatedexchange ratees i intended to smooth the impact of fluctuations in prices andexchange rates.
- 91 -
The second step ¡a to convert the 1984 GNP at current market pricesin national currencies to US dollars by the conversíon factor as derivedabove. The resulting GNP in 1984 US dollara is divided by the midyearpopulation to derive the 1984 per capita GNP in current US dollara.
The following formulas describe the procedure for computing theconversion factor for year t:
(e* ~~~~~tt ti
t-2,t) 3[t-2 (P t-2 P pS-t-1 t_1 p$ tt-2 ~~~~t-l
and for calculating per capita CNP in US dollars for year t:
*
(Yt$) ¡ Nt t-2,t
Where:
Yt = current CNP (local currency)
pt = GNP deflator for year t
t = annual average exchange rate (local currency/USdollar) for year t
Nt = mid-year population for year t
p$ = US GNP deflator for year tt
The annual rate of inflation ¡a the leasr-squares growth rate of theimplícit gross domestic product (GDP) deflator for each of the periodsahown. The GDP deflator is first calculated by dividing, for each year of theperiod, the value of CDP in current market prices by the value of GDP inconstant market prices, both in national currency. The least-aquares methodis then used to calculate the growth rate of the GDP deflator for theperiod. This measure of inflation has limitations, in particular for the oil-producing countries during the period of aharp increases in oil prices. It jaused as an indicator of ínflation because it ¡8 the most broadly baseddeflator, ahowing annual price movements for all gooda and services producedin an economy.
Life expectancy at birth indicates the number of years a newborninfant would live íf patterna of mortality prevailing for ahl people at thetime of ite birth were to atay the same throughout ite life. Dato are fromthe UN Populatíon Division, supplemented by World Bank estimates.
The índex of food production per capita shows the average annualquantity of food produced per capita in 1981-83 in relation to that in
- 92 -
1974-76. The estimates are derived from those of the FAO, which arecalculated by dividing indexes of the quantity of food production by indexesof total population. For this index, food is defined aS comprising cereals,starchy rotet, sugarcane, sugar beets, pulses, edible oils, nuts, fruits,vegetables, livestock, and livestock products. Quantities of food productionare measured net of animal feed, seeds for use in agriculture, and food lostin processing and distribution. Given the weaknesses in agriculturalproduction statisticá, caution should be exercísed in interpreting them.
The summary measures for GNP per capita and life expectancy ín thistable are weighted by population. The sumnary measures for the annual rate ofinflation are ueighted by the ahare of country GDP valued in current USdollars for the entire period in the particular income group.
Tables 2 and 3. Growth and structure of production
Most of the definitions used are those of the UN System of NationalAccounts.
Groas domestic product (GDP) measures the total final output of goodsand services produced by an ecor.omy--that js, by residents and nonresidents,regardless of the allocation to domestic and foreign claims. It ¡s calculaúedwithout making deductions for depreciatíon. For many countries, GDP byindustrial origín is j easured at factor cost; for other countries withoutcomplete national accounts at factor cost, it ja measured at market prices.GDP at factor cost is equal to GDP at market prices, lesa indirect taxes netof subsidies. The figures for GDP are dollar values converted from domesticcurrency by using the síngle-year official exchange rates, although for a fewcountries an alternative conversion factor is used (see note for Table 1).This procedure does not use the three-year average exchange rate used tocalculate per capita GNP in Table 1.
The agricultural sector comprises agriculture, forestry, hunting, andfishing. In developing countries with high levels of subsistence farming,much of the agricultural production is either not exchanged or not exchangedfor money. Because of difficultíes in assigning subsistence farming itaproper value, the ahare of agriculture in GDP may be underestimated. Theindustrial sector comprises mining, manuEacturing, construction, andelectricity, water, and gas. All other branches of economic activity arecategorized as services.
National accounts series in domestic currencies are used to computethe indicatora in these tables. The growth rates in Table 2 are calculatedfrom constant price series; the sectoral shares of GDP in Table 3, fromcurrent price series.
In calculating the summary measures for each indicator in Table 2,constant US dollar values are first calculated for the perioda covered, andthe values are aggregated for each of the years covered by the períod. Theleast-squares procedure is used to compute the summary growth rates. Theaverage sectoral percentage ahares in Table 3 are computed from groupaggregates of sectoral CDP in current US dollara.
- 93 -
Tables 4 and 5. Crowth of consumption and investment and structure of demand
GDP ¡B defined in the note for Table 2.
Public consumption (or general government consumption) includes allcurrent expendíture for purchases of goods and services by all levels of gov-ernment. Capital expenditure on natienal defense and security ís regarded asconsumption expenditure.
Private consumption is the market value of all goods and servicespurchased or received as income in kind by households and nonprofit institu-tions. It includes imputed rent for owner-occupied dwellings.
Gross domestic investment consists of the outlays for additions tothe fíxed assets of the economy, plus changes in the net value of inventories.
Gross domestic saving shows the amount ñf gross domestic investmentfinanced from domestic output. Comprising public and private saving, it íagross domestic investment plus the net exports of goods and nonfactorservices.
Exports of goods and nonfactor services r-epresent the value of allgoods and nonfactor serv.cee sold to the rest of the world; they include mer-chandise, freight, insurance, travel, and other nonfactor services. The valueof factor services, such as investment income, interest, and labor income, isexcluded.
The resource balance is the difference between exports and imports ofgoods and nonfactor services.
National accounts series in domestíc currency units are used to com-pute the indicators in these tables. The growth rates in Table 4 are cal-culated from constant price series; the shares of GDP in Table 5, from currentprice series. The summary measures are calculated in the same way asexplained in the note for Tables 2 and 3.
Table 6. Commercial energy
The data on energy generally are from UN sources. They refer tocommercial forma of primary energy: petroleum and natural gas liquids,natural gas, solid fuels (coal, lignite, and so on), and primary electricity(nuclear, geothermal, and hydroelectric power)--all converted into oilequivalents. Figures on liquid fuel consumption include petroleum derivativesthat have been consumed in nonenergy uses. For converting primary electricityinto oil equivalente, a thermal efficiency of 34 percent has been assumed.The use of firewood and other traditional fuel, though subs.antial in somedevelopíng countries, is not taken into account because relíable andcomprehensive data are not available.
The summary measures of energy production and consuuption arecomputed by aggregating the respective volumes for each year in the periodsand then applying the least-squares growth rate procedure. The summarymeasure of energy consumption per capita is computed from group aggregates forenergy consumption and population.
- 94 -
Energy ímporta refer to the dollar value of energy imports--Sectíon 3in the Revised Standard International Trade Classification (SITC)--and areexpressed as a percentage of earnings from merchandise exporte. The summnarymeasures are computed from group aggregates for energy imports and merchandiseexporte in current dollars.
Because data on energy imports do not permit a distinction betweenpetroleum imports for fuel and for use in the petrochemicals industry, thesepercentages may overestimate the dependence on imported energy.
Table 7. Level and growth of merchandise trade
The statistics on merchandise trade are from UN publications and theUN trade data system, supplemented by statistics from the UN Conference onTrade and Development (UNCTAD), the International Monetary Fund (INF), and ina few cases World Bank country documentation.
Merchandise exporta and imports cover, with some exceptions, allinternational changes in ownership of merchandise passing across the customsborders. Exporta are valued FOB (free on board), importa CIF (cost,insurance, and freight), unlesa otherwise apecified in the foregoingsources. These values are in current dollars and do not include trade inservices.
The growth rates of merchandise exports and imports are in real termsand calculated from volume indexes of exporta and imports. A volume index isthe ratio of the index for the total value of exporcs or imports to thecorresponding index for the unit values. For most developing economies theseindexes are from the UNCTAD Handbook of International Trade and DevelopmentStatistics and supplementary data. For industrial economies the indexes arefrom the UN Yearbook of International Trade Statistics and Monthly Bulletin ofStatistics. The summary measures are calculated by aggregating the 1980constant US dollar price series for each year and then applying the least-squares growth rate procedure for the periodo shown. These values d notinclude trade in services.
Tables 8 and 9. Structure of merchandise trade
The shares in these tables are derived from trade values in currentdollara reported in UN trade tapes and the UN Yearbook of International TradeStatistics, supplemented by other regular statistical publications of theUnited Nations and the IMP.
Merchandise exports and importa are defined in the note forTable 7. The categorization of exports and imports follows the SITC.
In Table 8, fuels, minerals, and metals are the commodities in SITCSection 3, Divisiona 27 and 28 (minerals, crude fertilizera, and metalliferousores) and Division 68 (nonferrous metals). Other primary commodities compriseSITC Sectiona 0, 1, 2, and 4 (food and live animals, beverages and tobacco,inedible crude materials, and cils and fato) less Divisions 27 and 28.-Textiles and clothiag represent SITC Divisiona 65 and 84 (textiles, yarns,fabrics, and elothing). Machinery and transport equipment are the commodities
9 95 _
in SITC Section 7. Other manufactures, calculated as the residual from thetotal value of manufactured exporta, represent SITC Sectiona 5 to 9 leasSection 7 and Divisions 65, 68, and 84.
In Table 9, food commodities are those in SITC Sections 0, 1, and 4and ín Division 22 (food and live animals, beverages and tobacco, oils andfato, and oilseeda, nuts, and kernels). Fuela are the commodities in SITCSection 3 (mineral fuels, lubricants, and related materials). 9ther primarycommodities comprise SITC Section 2 (crude materiala excluding fuel)lessasDivision 22 (oilseeds, nuts, and kernels) plus Division 68. Machinery andtransport equipment are the commodities in SITC Section 7. Othermanufactures, calculated as the residual from the total value of manufacturedimporta, represent SITC Sections 5 to 9 leas Section 7 and Division 68.
The summary measures jn Table 8 are computed from group aggregatesfor individual export commodity categories and total merchandise exports incurrent dollars; those in Table 9, from group aggregates for individual importcommodity categories and total merchandise importo jn current dollars.
Table 10. Origin and destination of merchandise exports
I4erchandise exports are defined in the note for Table 7. Tradeshares in this table are based on UN and IMF statistics on the value of tradein current dollars. Unallocated exporto are distributed among the countrygroupa ín proportion to their respective shares of allocable trade.Industrial market economies almo include Gibraltar, Iceland, and Luxembourg.The summary measures are computed from group aggregates for individual economygroups and total merchandise exports in current dolLars.
Table 11. Terms of trade
The terms of trade, or the net barter terms of trade, measure therelative level of export prices compared with import prices. Calculated asthe ratio of a country's export unit value index to its ímport unit valueindex, this indicator shows changes over time in the level of export prices asa percentage of import prices. The teri¡s of trade indexes are shown for 1970,1981, 1982, 1983, and 1984, wíth 1980 = 100. The unit value indexes are tromUNCTAD.
Table 12. Commodity exporto: Volume and price
Volume growth rates are computed from quantum data for individualcomaodities. The quantum data for agricultural commodities are from FAO tradetapes. Metals and minerals quantum data and all commodities price data arefrom the World Bank Commodity Data Bank. The príce series representinternational prices in constant US dollara, derived by deflating the currentprices by the unit value index of manufactured exporta (SITC 5-8) from fiveindustrial market economies to developing countries.
Table 13. Balance of payments, debt service, and international reserves
The current account balance is the difference between (1) exports ofgoods and services plus inflows of unrequited offícial and private transfera
- 96 -
and (2) importa of goods and servíces plus unrequited transfera to the rest ofthe world. The current account estimates are primarily from IMF data files.
Interest payments are those on the disbursed and outstanding publicand publiely guaranteed debt in foreign currencies, goods, or services; theyinclude commitment charges on undisbursed debt if information on those chargeswas available. F.>r the defínition of debt, see the note for Table 14.
Debt service la the sum of-actual interest payments and repayments ofprincipal made in foreign currencies, goods, or servíces on external publicand publicly guaranteed debt. The ratio of debt service to exports of goodsand services ís commonly used to assess the ability to service debt. Theratio of debt service to GNP in the summary measures ¡a computed from groupag8regates for debt service and GNP in current dollara; the ratio of debtservice co exporto of goods and servíces in the summary measures is computedfrom group aggregates for debt servíce and total exports of gooda and servicesin current dollars.
Croso international reserves comprise holdings of gold, specialdrawing rights (SDRs), the reserve positíon of IMF members in the Fund, andholdínga of foreign exchange under the control of monetary authoritíes. Thedata on holdings of international reserves are from IMF data files. The goldcomponent of these reserves ¡a valued throughout at year-end London prices;that ís, $37.37 an ounce in 1970 and $308.30 an ounce in 1984. The reservelevels for 1970 and 1984 refer to the end of the year and are in currentdollars at prevailing exchange rates. Because of differences in thedefinition of internat7.onal reserves, in the valuation of gold, and in reservemanagement practices, reserve levels published in national sources are notstrictly comparable. Reserve holdings at the end of 1984 are also expressedin terms of the number *. months of imports of goods and services they couldpay for, with imports at the average level for 1983 or 1984. The sunmmarymeasures are computed from group aggregates for gross international reservesarnd total imports of goods and services in current dollars.
Table 14, External publíc debt and debt service
The data on debt in this and successive tables are from the WorldBank's Debtor Reporting System for deveoping economies.
External debt is defined as debt that has an original or extendedmaturíty of more th8n one year, that ís owed to nonresidents, and that ísrepayable in foreign currency, goods, or services. A dístinction ¡a madeamong (1> publíc debt, which ja an external oblígation of a public debtor,including the national government, a political subdivísíon (or ian agency ofeither), and autonomnoua public bodies; (2) publicly guaranteed debt, whích isan external obligation of a prívate debtor that js guaranteed for repayment bya public eniíty; and (3) prívate nonguaranteed external debt, which íj anexternal obligation of a private debtor that ja not guaranteed for repaymentby a public entíty.
The tables showing public and publicly guaranteed debt do not íncludedata for (1) transactiona with the IMF, with the exceptíon of Trust Fundloans, (2> debt repayable in local currency, (3) direct investment, and (4)short-term debt (that ¡a, debt with original maturity of one year or lees).
97 _
External public debt outstanding and disbursed represente the amountat year-end of all public and publicly guaranteed loans that have been drawnby the borrower net of repayments of principal and vriteoffa.
Debt from official sources comprises (1> multilateral loana (loansand credits from the World Bank, regional development banks, and otherinternational organisationS and intergovernmental agencies> and (2) bilateralloans from governments and their agencies (including central banks) and fromautonomous public bodies. Loans from funds administered by an internationalorganization on behalf of a aingle donor government are cla2sified esbilataral loans.
Debt froa prívate sources comprises loans from (1) supplíers (creditsfrom manufacturers, exporters, or other suppliers of goods), (2) financialmarkets (loans from private banks and other private financíal institutiona,and publicly issued but prívately placed bonda), and (3) other (externalliabilities on account of nationalized properties and unclassified debts toprivate creditor>).
Debt service is defined in the note for Table 13.
Tables 15, 16, and 17. External debt and loan.
The loans referred to in all three tables are medium- and long-termloans whose maturities exceed one year. Lenders indicated in Table 15 and 16are defined in the note for Table 14.
Interest rates, maturities, and grace períods are averages weightedby the amounts of loans. Interest is the major charge levied on a loan and isusually computed on the amount of principal drawn and outstanding. Thematurity of a loan is the interval between the agreement date, when a loanagreement is signed or bonds are issued, and the date of final repayment ofprincipal. The grace period is the interval between the agreement date andthe date of the first repayment of principal.
Loans with a grant element of 25 percent and above are defined asconcessional. The grant element of a loan is the grant equivalent expresasedas a percentage of the amount committed. It is used as a measure of theoverali cost of borrowing. The grant equivalent of a loan is ita commitmentvalue, less the discounted present value of itu contractual debt service;conventionally, future debt service payments are discounted at 10 percent ayear.
Tables 18 and 19. Foreign assistance and other resources
Officíal development assistance (ODA> consists of loans and grantsmade at concescional financíal terma by official agencies of the membera ofthe Development Assistance Committee (DAC) of the Organisation for EconomicCo-operation and-Development (OECD) and members of the Organízation ofPetroleum Exporting Countries (OPEC) with the objective of promoting economicdevelopment and welfare. Net disbursements equal grosa disbursementa leaspayments to donora for amortization.
- 98 -
Total recorded net flow of resources includes ODA, grants fromprivate agencies (private aid), and transactiona at commercial terms: exportcredite, bilateral portfolio investment (including bank lending) by residentoor institutiona in DAC countries, direct investment (including reinvestedearnings>, and purchases of securities of international organizations activeín development. Net bilateral flows exclude unallocated and unspecifiedbilateral flows and all disbursements to multilateral institutions. Grants,including the value of technical cooperation and assistance, are gifts inmoney or in kind for which no repayment ís required.
The sumnary measurep of per capita net resource flows and per capitaODA in Table 18 are computed from group aggregates for population, netresource flows, and ODA. ODA os a percentage of GNP íj computed from grouptotals for ODA and GNP in current US dollars. OA es a percentage of grossdomestic investment is weighted by country GNP. Net bilateral ODA as apercentage of total ODA and ODA from OPEC as a percentage of net bilateral ODAare computed from the respective group aggregates.
The summary measures in Table 19 for total grants and technicalasaistance as percentages of net ODA are average country percentages weightedby each country's share in the aggregate ODA.
Table 20. Food aid imports
Food aid includes cereals only and is expressed in metric tons ofgrain equivalent. The dat- are for marketing years, from July 1 of thepreceding calendar year to June 30 of the current ctlendar year. The suwmarymeasures for per capita food aid are computed from group aggregates for foodíaid and population.
Tables 21 and 22. Growth of agriculture and crop production
Food includes commodities that are considered edible and containnutrients. Nonfood compt-ises all inedible and nonnutritive agriculturalcommodities. Accordingly, coffee and cea are classified as nonfood because,although edíble, they have virtually no nutritive value. (The definition offood used here is not the same as in Tables 8 and 9, where all beverages,regardless of nutritive value, are considered as food items.)
In Table 21, summary measures for annual growth rate of volume offood and agricultural production are country growth rates weighted by eachcountry's share in the aggregate value added in agriculture for the end yearof each period; those of growth rate of total production per capita aredifferences between growth rates of aggregate production and aggregatepopulation for each country group.
Tables 23 and 24. Agrícultural importa and exports
Subcategories of daíry importa are sporadically reported from oneperiod to the next. Thus, the corresponding rates of growth pertaín only tothose subcategories of dairy importa for which data are reported, and theymust be interpreted wíth caution. All data are for the calendar year.
_ 99 _
Table 25. Population growth and projections
The growth rateo of population are period averages calculated frommidyear populations. The summary measures are computed from group aggregates.
The projections of population for 1990, 2000, and the year in whichpopulation wíll eventually become stationary are made fo" each economy separ-ately. Starting with information on total population by age and sea,fertility rates, mortalíty rates, and international migration rates in thebase year 1980, these parameters are projected at five-year intervalo on thebasis of generalized assumptions until the population becomes statSonary. Thebase year estimates are from updated computer printouts of the United Nationsand data from the World Bank, the Population Council, the US Buresu of theCensus, and recent national censuses.
The net reproduction rate (NRR) indicates the number of daughtersthat a newborn girl will bear during her lifetime, assuming fixed age-specificfertility rateo and a fixed set of mortalíty rates. The KRR thus measures theextent to which a cohort of newborn gírls will reproduce themselves undergiven schedules of fertility and mortality. An NRR of 1 indicates thatfertility ji at replacement level: at this rate chíldbearing women, on theaverage, bear only enough daughters to replace themselves in the populatíon.
A stationary population is one in which age- and sex-specificmortality rates have not changed over a long period, while age-specificfertílty rates have simultaneously remained at replacement level (NRR=1). Insuch a population, the birth rate is constant and equal to the death rate, theage structure also ¡S constant, and the-growth rate ¡s zero.
Population momentum in the tendency for population growth to continuebeyond the time that replacement-level fertility has been achieved; that ¡s,even after NRR has reached unity. The momentum of a popuiation in the year tis measured as a ratio of the ultimate stationary population to the populationin the year t, given the assumption that fertility remains at replacementlevel from the year t onword.
A population tends to grow even after fertility has declined toreplacement level because pas- hígh growth rates will have produced an agedistribution with a relatively hígh proportiol of femaLes who are or will beof reproductive age. Consequently, the birth rate will remain higher than thedeath rate and the growth rate will remain positive for several decades. Apopulation takes fifty to seventy-five years, depending on the initialconditions, before its age distribution fully adjusts to the changed fertilítyrates.
To make the projections, assumptions about future mortality rates aremade in terma of female life expectancy at birth (that is, the number of yearsa newborn girl would live if subject to the mortality risks prevailing for thecross oection of population at the time of her birth). Economies are firstdívided according to whether their primary school enrollment ratio for fetalesis aboye or below 70 percent. In each group a set of annual incremento infemale life expectancy ¡s assumed, depending on the female life expectancy in1980-85. Por a given life expectancy at birth, the annual incremento during
- 100 -
the pro ection period are larger in economies having a higher primary schoolenrollment ratio and a life expectancy of up to 62.5 years. At higher lifeexpectancies, the increnients are the same.
To project the fertility rates, the year in which fertility villresch replacement level is estimated. These estimates are speculative and arebaqed on information on trends in crude birth rates (defined in the nete forTable 26), total fertilíty rates (also defined in the note for Table 26>,femsle lífe expectancy at birch, and the performance of f amilv planningprograms. For most countries in sub-Saharan Africa total fertility rates areassumed to remain constant until 1990-95 and then to decline until replacementlevel is reached; for a few they are assumed to increase until 1990-95 andthen to decline.
International migration rates are based on past and present trends inmigration flow. The estimates of future net migration are speculative. Formost economies the net migratiop rates are assumed to be zero by 2000, but fora few they are assumed to be zero by 2025.
The estimates of the hypotheticaL size of the stationary populationand the assumed year of reaching replacement level fertility arespeculative. They should not be regarded as predictions. They are includedto provide a sumnary indication of the long-run implications of recentfertility and mortality trends on the basis of highly stylizqd assumptíons. Afuller description of the methods and assumptions used to calculate theestimates is available from the Population, Health, and Nutrition Departmentof the World Bank.
Table 26. Demographic and fertility-reLated indicators
'he crude birth and death rates indicate the number of live birthsand deaths per thousand population in a year. They are from the same sourcesmentiene4 iin the note for Table 25. Percentage changes are computed fromunrounded data.
The total fertilíty rate represents the number of children that wouldbe born per woman, íf she were to live to the end of her childbearing yearsand bear children at each age in accord with prevailing age-specific fertilityrates. The rates given are from the same sources mentioned ín the note forTable 25.
The percentage of married women of childbearing age uuingcontraception refers to any form of contraception used by the women or theirhusbands. The forms generally comprise male and female sterilization,intrauterine devices (IUD), condoms, injectable and oral contraceptives,spermicides, diaphragms, rhythm, withdrawal, and abstinence. Women ofchidbearing age are generally womien aged fifteen to forty-nine, although forsome countries contraceptive usage is measured for other age groups. Data aremainly derived from the World Fertility Survey, the Contraceptive PrevalenceSurvey, the World Bank, and the UN report, Recent Levels and Trends ofContraceptive Use as Assessed in 1983.
- 101 -
The summary measures in this table are country data weighted by eachcountry's share in the aggregate population.
Table 27. Labor force
The population of working age refers to the population aged fifteento sixty-four years. The estinates are based on the population estimates ofthe World Bank for 1983 and previous years. The summary measures are countrydata weighted by each country's share in the aggregate population.
The labor force comprises economically active persons aged ten yearsand over, including the armed forces and the unemployed, but excludinghousewives, students, and otLar nonparticipanto in the labor force.Agriculture, industry, and services are defíned in the same manner as inTable 2. The sunmmary measures are country percentages weighted by eachcountry's ahare in the aggregate labor force.
The labor force growth rates are derived from the Bank's populationprojections and from ILO data on age-specific activity rates in the sourcecited above. The summary measures for 1965-73 and 1973-83 are country growthrates weighted by each country's ahare in the aggregate labor force in 1973;those for 1980-2000, by estimates of each country's share in the aggregatelabor force in 1980.
The application of ILO activity rates to the Bank's latest populationestimates may be inappropriate for some economies in which there have beenimportant changes ín unemployment and underemployment, in international andinternal migration, or in both. The labor force projections for 1980-2000should thus be treated with caution.
Table 28. Urbanization
The growth rates of urban population are calculated from the WorldBank's population estimates; the estimates of urban population shares arecalculated from UN sources. Data on urban agglomeration are also from theUnited Nationa. Because the estimates in this table are based on differentnational definitiona of what is "urban," cross-country comparisona should beínterpreted with caution.
The summary measures for urban population as a percentage of totalpopulation are calculated from country percentages weighted by each country'sshare in the aggregate population; the other summary measures ín this tableare veighted in the same fashion using urban population.
Table 29. Health-related indicators
The estimates of population per physician and nursing person arederíved from World Health Organization (WHO) data, some of which have beenrevised to reflect new information. They also take into account revisedestimates of population. Nursing persons include graduate, practical,asuistant, and auzíliary nurses; the inclusion of auxiliary nurses enables abetter estimation of the availability of nursing care. Because definitions ofnursing personnel vary--and because the data ahown are for a variety of years,
- 102 -
-generally not more than two years distant from those specífied--the data forthese two indicatora are not strictly comparable across countries.
The daily calorie supply per capita ¡a calculated by dívíding thecalorie equivalent of the food supplies in an economy by the population. Foodsupplies comprise domestic production, importo less exports, and changes inatocks; they exclude animal feed, seeds for use in agriculture, and food lostin processing and distribution. The daily calorie reguirement per capitarefera to the calories needed to sustain a person at normal levels of activityand health, taking into account age and sex distributions, average bodyweights, and environmental temperatures. Both sets of estimates are from theFAO.
The suumary measures in thís tabl-e are country figures weighted byeach country's ahare in the aggregate population.
Table 30. Education
The data in this table refer to a variety of years, generally notmore than two years distant from those specified, and are mostly from Unesco.
The data on number enrolled in primary school refer to estimates oftotal, male, and female enrollment of students of all ages in primary school;they are expressed as percentages of the total, male, or female populations ofprimary achool age to give gross primary enrollment ratios. Although primaryschool age js generally considered to be six to eleven years, the differencesjn country practices in the ages and duration of schooling are reflected inthe ratios given. For countries with uníversal primary education, the grossenrollment ratios may exceed 100 percent because some pupila are below orabove the official primary achool age.
The data on number enrolled in secondary school are calculated in thesame manner, with secondary school age generally considered to be twelve toseventeen years.
The data on number enrolled in higher education are from Unesco.
The sumimary measures ín this table are country enrollment ratesweighted by each country's share in the aggregate population.
Table 31. Central government expenditure
The data on central government fjnance ín Tables 31 and 32 are fromthe IMF Covernment Finance Statistics Yearbook, IMF data files, and World Bankcountry documentation. The accounta of each country are reported using thesystem of common definitions and classificationa found in the IMF Draft Manualon Government Finance Statistics. Owing to differences in coverage ofavailable data, the individual componenta of central government expenditureand current revenue shown ín these tables may not be atrictly comparableacross all economies. The ahares of total expenditure and revenue by categoryare calculated from national currencies.
- 103-
The inadequate statistical coverage of state, provincial, and localgovernments has dictated the use of central government dota only. ThiB mayseriously understate or distort the statistical portrayal of the allocation ofresources for various purposes, especially in large countries where lowerlevels of government have considerable autonomy and are responsible for manysocial servíces.
It must be emphasized that the data presented, especially those foreducation and health, are not comparable for a number of reasons. In manyeconomies private ixealth and education services are substantial; in otherspublic services represent the major component of total expenditure but may be-financed by lower levels of government. Great caution should therefore beused in comparísons across countries.
Central government expenditure comprises the expenditure by allgovernment offices, departments, establishments, and other bodies that areagencies or instruments of the central authority of a country. It includesboth current and capital (development) expenditure.
Defense comprises all expenditure, whether by defense or otherdepartmento, for the maintenance of military forces, including the purchase ofmilitary supplies and equipment, construction, recruiting, and traíning. Algofalling under this category is expenditure for strengthening the publicservices to meet wartime emergencies, for training civil defense personnel,and for foreign military aid and contributions to military organizations andalliances.
Education comprises public expenditure for the provision, management,inspection, and support of preprimary, primary, and secondary schools; ofuniversities and colleges; and of vocational, technical, and other traininginstitutions by central governments. Also included is expenditure on thegeneral administration and regulation of the education system; on researchinto its objectives, organization, administration, and methods; and on suchsubsidiary services as transport, school meals, and medical and dentalservíces in schools.
Health covers public expenditure on hospitala, medical and dentalcenters, and clinics with a major medical component; on national health andmedical ínsurance achemes; and on family planning and preventive care. Alsoincluded ¡a expenditure on the general administration and regulation ofrelevant government departments, hospitala and clinics, health and sanitation,and national health and medical insurance achemes.
Housing, amenities, and social security and welfare cover publicexpenditure (1) on housing (such as income-related schemes), on support ofhousing and slum clearance activities, on community development, and onsanítary services; and (2) for compensation to the sick and temporarilydisabled for loss of income, for payments to the elderly, the permanentlydisabled, and the unemployed, and for family, maternity, and childallowances. The second category alzo includes the cost of welfare servitessuch es care of the aged, the disabled, and children, as well as the cost ofgeneral administration, regulation, and research associated with socialsecurity and welfare services.
- 104 -
Economic services comprise publíc expenditure associated with theregulation,-support, and more efficient operation of business and witheconomíc development, redress of regional imbalances, and creation ofemployment opportunities. Research, trade promotion, geological surveys, andinspection and regulation of particular industry groups are among theactivities included. The five major categories of economic services are fueland erergy, agriculture, industry, transportation and communication, and othereconomic affairs and 3ervices.
Other covers expenditure for the general administration of governmentnot included elsewhere; for a few economies it also includes amounts thatcould not be allocated to other componenta.
Overall surplus/deficit is defined (on,a cash basis> as current andcapital revenue and grants received less total expenditure less lending minusrepayments.
The summary measures for the componenta of central governmentexpenditure are computed from group totals for expenditure components andcentral government expenditure in current dollars; those for total expenditureas a percentage of CNP and for overall surplus/deficit as a percentage of GNPare computed from group totals for the above total expenditures and overallsurplus/deficit in current dollars and GNP in current dollars respectively.
Table 32. Central government current revenue
Information on data, including sources and comparability, is given inthe note for Table 31.
Tax revenue is defined as all government revenue from compulsory,unrequited, nonrepayable receipts for public purposes, including interestcollected on tax arreara and penalties collected on nonpayment or late paymentof taxes. Tax revenue is shown net of refunds and other correctivetransactions. Taxes on income, profit, and capital gain are tsxes levied onthe actual or presumptive net income of individuals, on the profits ofenterprises, and on capital gains, whether realized on land sales, securities,or other assets. Social security contributions include employers' andemployees' social security contríbutions as well as those of self-employed andunemployed persons. Domestic taxes on goods and services include generalsales, turnover, or value added taxes, excises on goods, taxes on specificservices, taxes on the use of goods or property, and profits of fiscalmonopol-ies. Taxes on international trade and transactiona include importduties, export duties, profits of export or import marketing boards, transfersto government, exchange profits, and exchange taxes. Other taxes includeemployers' payroll or manpower taxes, taxes on property, and other taxes notallocable to other categories.
Current nontax revenue comprises all current government revenue thatis not a compulsory nonrepayable payment for public purposes. Proceeds ofgrants and borrowing, funds arising from the repayment of previous lending bygovernments, incurrence of liabílíties, and proceeds from the sale of capitalassets are not included.

- 105 n
The sumuary measures for the components=of current revenue arecomputed from group totals fot revenue components and total current revenue incurrent dollars; those for current revenue es a percentage of GNP are computedfrom group totala for total current revenue and GNP in current dollars.
- 106 -
Principal sources
The information in the Statistical Annex has been compiled from theWorld Bank data files and the followíng sources:
National A System of Natíonal Accounts. New York: UX Departmentaccounts of International Economic and Social Affairs, 1968.andeconomic Statistical Yearbook. New York: UN Department ofindicatora International Economic and Social Affairs, various
issues.
Draft Manual on Government Fínance Statistícs. Washíngton, D.C.:114?, 1974.
FAO and IMF data files.
National sources.
Energy World Energy Supplies. UN Statistical Papers, Series J. NewYork: UN Department of International Economic and SocialAffaírs, various years.
Trade Direction of Trade. Washington, D.C.: IMF, variousissues.
International Financial Statistics. Washington, D.C.:IMF, various issues.
Handbook of International Trade and Developmen.Statistics. New York: UNCTAD, various issues.
Monthly Bulletin of Statistics. New York: UN Departmentof International Economic and Social Affairs, various
issues.
Yearbook of International Trade Statistics. New York:UN Department of International Economic
and Social Affairs, various issues.
United Nationa trade tapes.
- 107 -
Balance Balance of Payments Manual. 4th ed. Washington, D.C.:of payments, IMF, 1977.capital flows,and debt IMF balance of payments data files.
Development Co-operation. Paris: OECD, various.annualissues.
Geographical Distribution of Financial Flows to DevelopingCountries. Paris: OECD, various annual issues
Population Demographic Yearbook. New York: UN Department ofInternational Economic and Social Affairs, various issues.
Estimates and Projections of Urban, Rural, and CityPopulations, 1950-2025. The 1982 Assessment.New York: UN Department of International Economic andSocial Affairs, 1985
Population and Vital Statistics Report (Quarterly).New York: UN Department of International Economic andSocial Affaírs, 1985
World Population Trends and Policies: 1983 Monitoríng Report.New York: UN Department of International Economicand Social Affairs, 1983.
World Populacion: 1983. Washington, D.C.: US Bureau ofthe Census, International Statistical ProgramsCenter, 1983.
World Populacion Prospects by Country, 1950-2025. New York:UN Department of International Economic and Social Affairs,1985
Labor Labour Force Estimates and Projections, 1950-2000.force 2nd ed. Geneva: ILO, 1977.
ILO tapes.
- 108 -
Social Demographic Yearbook. New York: UN Department ofindicators International Economic and Social Affairs,
various issues.
Statistical Yearbook. New York: UN Departnent ofInternational Economic and Social Affairs,various issues.
Statistícal Yearbook. Paris: Unesco, various issues.
World Health Statistics Annual. Geneva: WHO,various issues.
World Health Statistics Report. Special Issue on Waterand Sanitation, voL. 29, no. 10. Geneva: WHO, 1976.
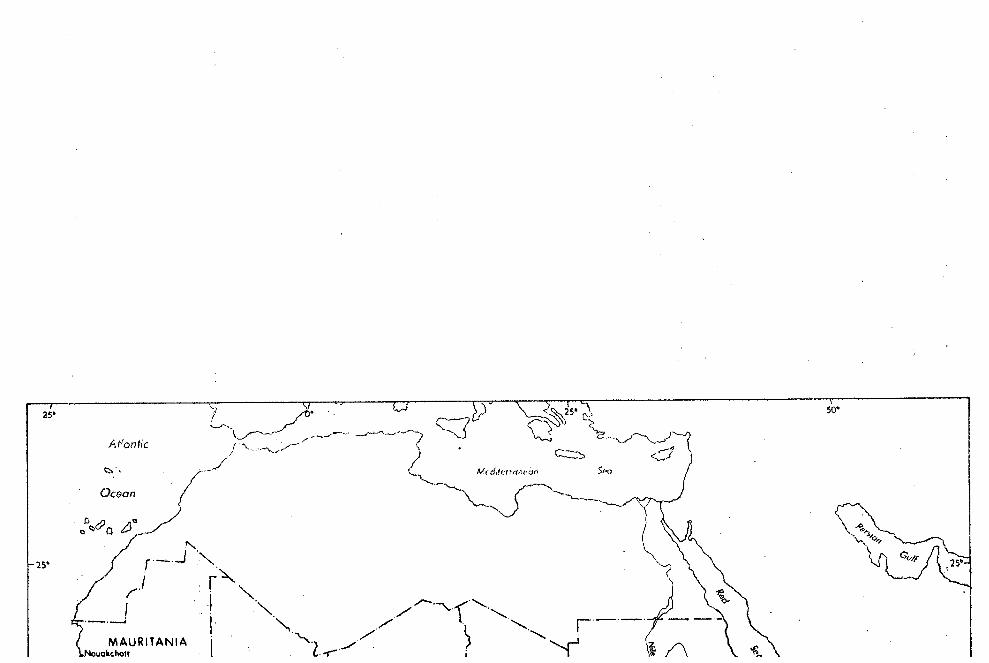
kAtt nt¢ t_
0¿ean / <~~~~~~~~~ X~~~~~u~~~Mnr_ an-j -
%-J 1 . / Y r$ t--.- V-Nouolkcfhol I S 1-Z
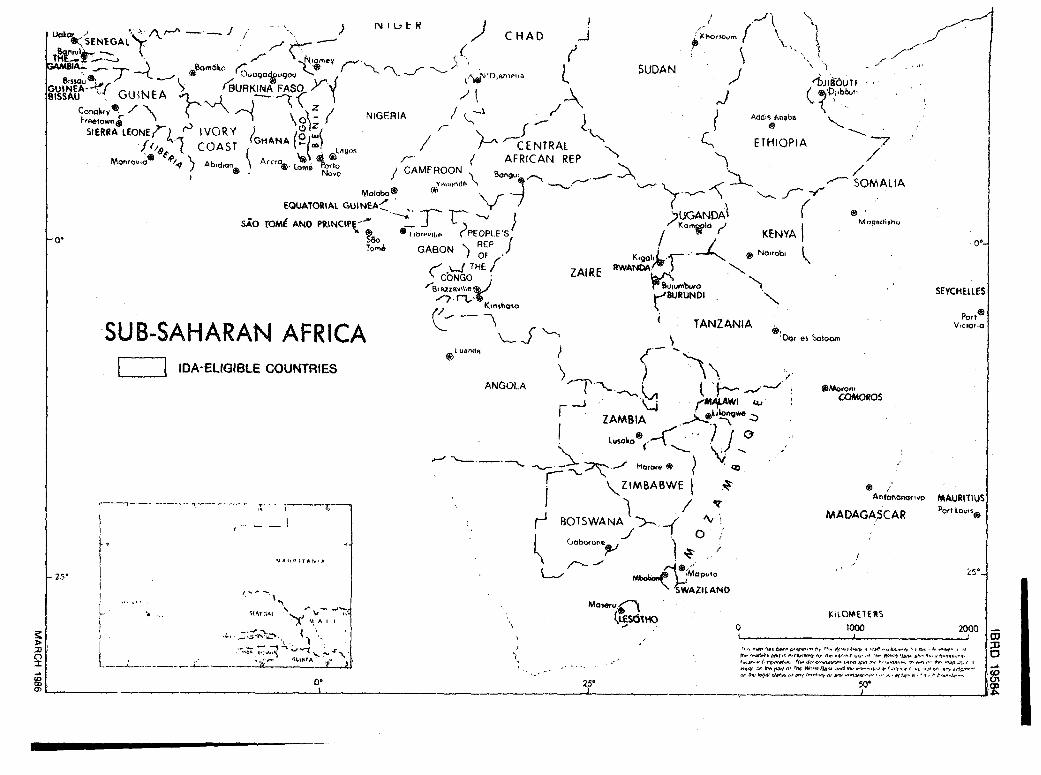
~~/X~~-"---~~~ / CHAD ~
UURKINA FASO > D 'bIBiLtl
SIERRA LEONE?) » IVORY Yf¡¼ 71 COAST GHAA L¿ fr9/CENTRAL ETHIOPIA 7
~~ Acc~~A b,dae 4i, ( AFRICAN REPCAMEROON BAFIA E
MoIoba V.,,ndé,SOMALIA
EQuA¶ORIA.t GC~&iNEAo __ \[ ¡
SAO TOMÉ ANO PRINCIP -r radishu0. tE °i t dbrevIe CPE0PIiS ¡ KENYA
o. ~~~~~~~~~~~~~~~To~.é GABON REPjOF NoANWÁ.
CONQGO f ZAIRE i - uNA<ur \tét xlasstef Buwnburo ót JY SEYCHtlEIS
TANZANIA v,cro,,o
SUB-SAHARAN AFRICA ef Soo#ióuandR
l | IDA-'ELIGIBLE COUNTRIES
ANGOLA Xm. y (Mo<orn
r ZAMBIA
- .ror'e*
\,JIMBABWE
MADAGASCAR PotLowsrj BOTSWANA>-y~v
251~~~~~~~~~~~~~~~~~~~~~~~~~~~~~~~~~~~~~~~~~~~~~~~~~~~2
I / > _ . SWAZUtAND
o, 0; 25 _ 2000