Embed Size (px)
Citation preview
Financials & KPIs àAuditor General Independent Auditor’s Report
àFinancial statements
àKey Performance Indicators
Department of PlanningDevelopment Assesment Panels

AUDITOR GENERAL INDEPENDENT AUDITOR’S REPORT
Auditor General
Page 1 of 3
7th Floor Albert Facey House 469 Wellington Street Perth MAIL TO: Perth BC PO Box 8489 Perth WA 6849 TEL: 08 6557 7500 FAX: 08 6557 7600
INDEPENDENT AUDITOR’S REPORT To the Parliament of Western Australia DEPARTMENT OF PLANNING Report on the Financial Statements I have audited the accounts and financial statements of the Department of Planning. The financial statements comprise the Statement of Financial Position as at 30 June 2015, the Statement of Comprehensive Income, Statement of Changes in Equity, Statement of Cash Flows, Schedule of Income and Expenses by Service, Schedule of Assets and Liabilities by Service, and Summary of Consolidated Account Appropriations and Income Estimates for the year then ended, and Notes comprising a summary of significant accounting policies and other explanatory information, including Administered transactions and balances. Director General’s Responsibility for the Financial Statements The Director General is responsible for keeping proper accounts, and the preparation and fair presentation of the financial statements in accordance with Australian Accounting Standards and the Treasurer’s Instructions, and for such internal control as the Director General determines is necessary to enable the preparation of financial statements that are free from material misstatement, whether due to fraud or error. Auditor’s Responsibility As required by the Auditor General Act 2006, my responsibility is to express an opinion on the financial statements based on my audit. The audit was conducted in accordance with Australian Auditing Standards. Those Standards require compliance with relevant ethical requirements relating to audit engagements and that the audit be planned and performed to obtain reasonable assurance about whether the financial statements are free from material misstatement. An audit involves performing procedures to obtain audit evidence about the amounts and disclosures in the financial statements. The procedures selected depend on the auditor’s judgement, including the assessment of the risks of material misstatement of the financial statements, whether due to fraud or error. In making those risk assessments, the auditor considers internal control relevant to the Department’s preparation and fair presentation of the financial statements in order to design audit procedures that are appropriate in the circumstances. An audit also includes evaluating the appropriateness of the accounting policies used and the reasonableness of accounting estimates made by the Director General, as well as evaluating the overall presentation of the financial statements. I believe that the audit evidence obtained is sufficient and appropriate to provide a basis for my audit opinion. Opinion In my opinion, the financial statements are based on proper accounts and present fairly, in all material respects, the financial position of the Department of Planning at 30 June 2015 and its financial performance and cash flows for the year then ended. They are in accordance with Australian Accounting Standards and the Treasurer’s Instructions.
AUDITOR GENERAL INDEPENDENT AUDITOR’S REPORT
Page 2 of 3
Report on Controls I have audited the controls exercised by the Department of Planning during the year ended 30 June 2015. Controls exercised by the Department of Planning are those policies and procedures established by the Director General to ensure that the receipt, expenditure and investment of money, the acquisition and disposal of property, and the incurring of liabilities have been in accordance with legislative provisions. Director General’s Responsibility for Controls The Director General is responsible for maintaining an adequate system of internal control to ensure that the receipt, expenditure and investment of money, the acquisition and disposal of public and other property, and the incurring of liabilities are in accordance with the Financial Management Act 2006 and the Treasurer’s Instructions, and other relevant written law. Auditor’s Responsibility As required by the Auditor General Act 2006, my responsibility is to express an opinion on the controls exercised by the Department of Planning based on my audit conducted in accordance with Australian Auditing and Assurance Standards. An audit involves performing procedures to obtain audit evidence about the adequacy of controls to ensure that the Department complies with the legislative provisions. The procedures selected depend on the auditor’s judgement and include an evaluation of the design and implementation of relevant controls. I believe that the audit evidence obtained is sufficient and appropriate to provide a basis for my audit opinion. Opinion In my opinion, the controls exercised by the Department of Planning are sufficiently adequate to provide reasonable assurance that the receipt, expenditure and investment of money, the acquisition and disposal of property, and the incurring of liabilities have been in accordance with legislative provisions during the year ended 30 June 2015. Report on the Key Performance Indicators I have audited the key performance indicators of the Department of Planning for the year ended 30 June 2015. The key performance indicators are the key effectiveness indicators and the key efficiency indicators that provide information on outcome achievement and service provision. Director General’s Responsibility for the Key Performance Indicators The Director General is responsible for the preparation and fair presentation of the key performance indicators in accordance with the Financial Management Act 2006 and the Treasurer’s Instructions and for such controls as the Director General determines necessary to ensure that the key performance indicators fairly represent indicated performance. Auditor’s Responsibility As required by the Auditor General Act 2006, my responsibility is to express an opinion on the key performance indicators based on my audit conducted in accordance with Australian Auditing and Assurance Standards.
AUDITOR GENERAL INDEPENDENT AUDITOR’S REPORT
Page 3 of 3
An audit involves performing procedures to obtain audit evidence about the key performance indicators. The procedures selected depend on the auditor’s judgement, including the assessment of the risks of material misstatement of the key performance indicators. In making these risk assessments the auditor considers internal control relevant to the Director General’s preparation and fair presentation of the key performance indicators in order to design audit procedures that are appropriate in the circumstances. An audit also includes evaluating the relevance and appropriateness of the key performance indicators for measuring the extent of outcome achievement and service provision. I believe that the audit evidence obtained is sufficient and appropriate to provide a basis for my audit opinion. Opinion In my opinion, the key performance indicators of the Department of Planning are relevant and appropriate to assist users to assess the Department’s performance and fairly represent indicated performance for the year ended 30 June 2015. Independence In conducting this audit, I have complied with the independence requirements of the Auditor General Act 2006 and Australian Auditing and Assurance Standards, and other relevant ethical requirements. Matters Relating to the Electronic Publication of the Audited Financial Statements and Key Performance Indicators This auditor’s report relates to the financial statements and key performance indicators of the Department of Planning for the year ended 30 June 2015 included on the Department’s website. The Department’s management is responsible for the integrity of the Department’s website. This audit does not provide assurance on the integrity of the Department’s website. The auditor’s report refers only to the financial statements and key performance indicators described above. It does not provide an opinion on any other information which may have been hyperlinked to/from these financial statements or key performance indicators. If users of the financial statements and key performance indicators are concerned with the inherent risks arising from publication on a website, they are advised to refer to the hard copy of the audited financial statements and key performance indicators to confirm the information contained in this website version of the financial statements and key performance indicators.
GLEN CLARKE DEPUTY AUDITOR GENERAL Delegate of the Auditor General for Western Australia Perth, Western Australia 21 September 2015
FINANCIAL STATEMENTS
2
Certification of Financial Statements
For the year ended 30 June 2015
The accompanying financial statements of the Department of Planning have been prepared in compliance with the provisions of the Financial Management Act 2006 from proper accounts and records to present fairly the financial transactions for the financial year ended 30 June 2015 and the financial position as at 30 June 2015. At the date of signing we are not aware of any circumstances which would render the particulars included in the financial statements misleading or inaccurate.
John Deery Chief Finance Officer Department of Planning 21 September 2015
Gail McGowan Accountable Authority 21 September 2015
Department of PlanningDevelopment Assesment Panels
FINANCIAL STATEMENTS
3
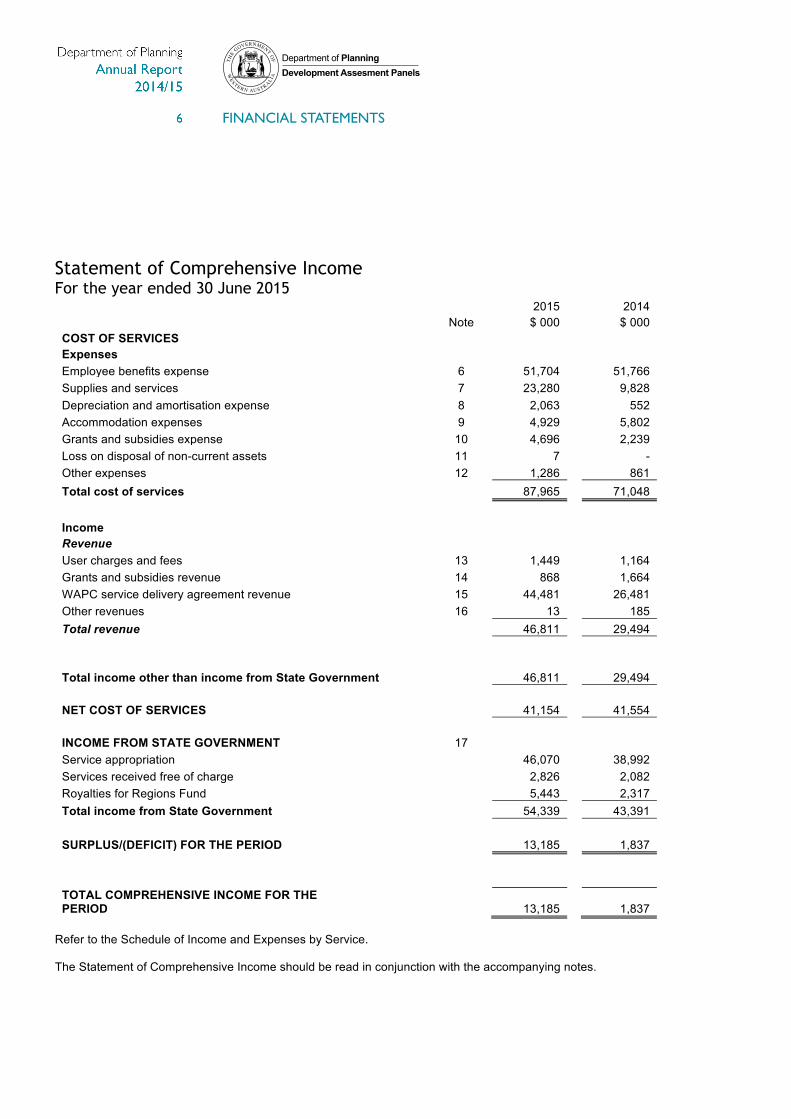
Statement of Comprehensive Income For the year ended 30 June 2015
2015
2014
Note $ 000
$ 000
COST OF SERVICES Expenses Employee benefits expense
6 51,704
51,766 Supplies and services
7 23,280
9,828
Depreciation and amortisation expense
8 2,063
552 Accommodation expenses
9 4,929
5,802
Grants and subsidies expense
10 4,696
2,239 Loss on disposal of non-current assets
11 7
-
Other expenses
12 1,286
861 Total cost of services
87,965
71,048
Income Revenue User charges and fees
13 1,449
1,164 Grants and subsidies revenue
14 868
1,664
WAPC service delivery agreement revenue
15 44,481
26,481 Other revenues
16 13
185
Total revenue
46,811
29,494
Total income other than income from State Government
46,811
29,494
NET COST OF SERVICES
41,154
41,554
INCOME FROM STATE GOVERNMENT
17 Service appropriation
46,070
38,992
Services received free of charge
2,826
2,082 Royalties for Regions Fund
5,443
2,317
Total income from State Government
54,339
43,391
SURPLUS/(DEFICIT) FOR THE PERIOD
13,185
1,837
TOTAL COMPREHENSIVE INCOME FOR THE PERIOD
13,185
1,837
Refer to the Schedule of Income and Expenses by Service. The Statement of Comprehensive Income should be read in conjunction with the accompanying notes.
Department of PlanningDevelopment Assesment Panels
FINANCIAL STATEMENTS
4
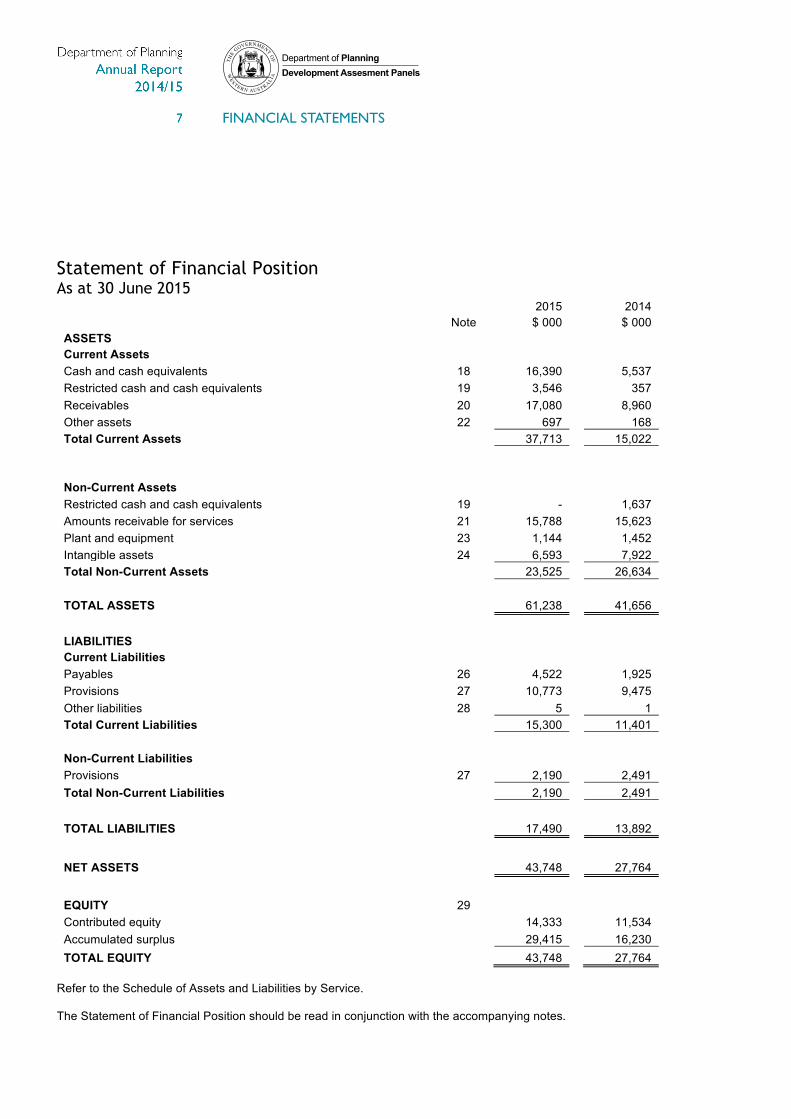
Statement of Financial Position As at 30 June 2015
2015
2014
Note $ 000
$ 000
ASSETS Current Assets Cash and cash equivalents
18 16,390
5,537 Restricted cash and cash equivalents
19 3,546
357
Receivables
20 17,080
8,960 Other assets
22 697
168
Total Current Assets
37,713
15,022
Non-Current Assets
Restricted cash and cash equivalents
19 -
1,637 Amounts receivable for services
21 15,788
15,623
Plant and equipment
23 1,144
1,452 Intangible assets
24 6,593
7,922
Total Non-Current Assets
23,525
26,634
TOTAL ASSETS
61,238
41,656
LIABILITIES Current Liabilities Payables
26 4,522
1,925 Provisions
27 10,773
9,475
Other liabilities
28 5
1 Total Current Liabilities
15,300
11,401
Non-Current Liabilities Provisions
27 2,190
2,491 Total Non-Current Liabilities
2,190
2,491
TOTAL LIABILITIES
17,490
13,892
NET ASSETS
43,748
27,764
EQUITY
29 Contributed equity
14,333
11,534
Accumulated surplus
29,415
16,230 TOTAL EQUITY
43,748
27,764
Refer to the Schedule of Assets and Liabilities by Service. The Statement of Financial Position should be read in conjunction with the accompanying notes.
Department of PlanningDevelopment Assesment Panels
FINANCIAL STATEMENTS
5
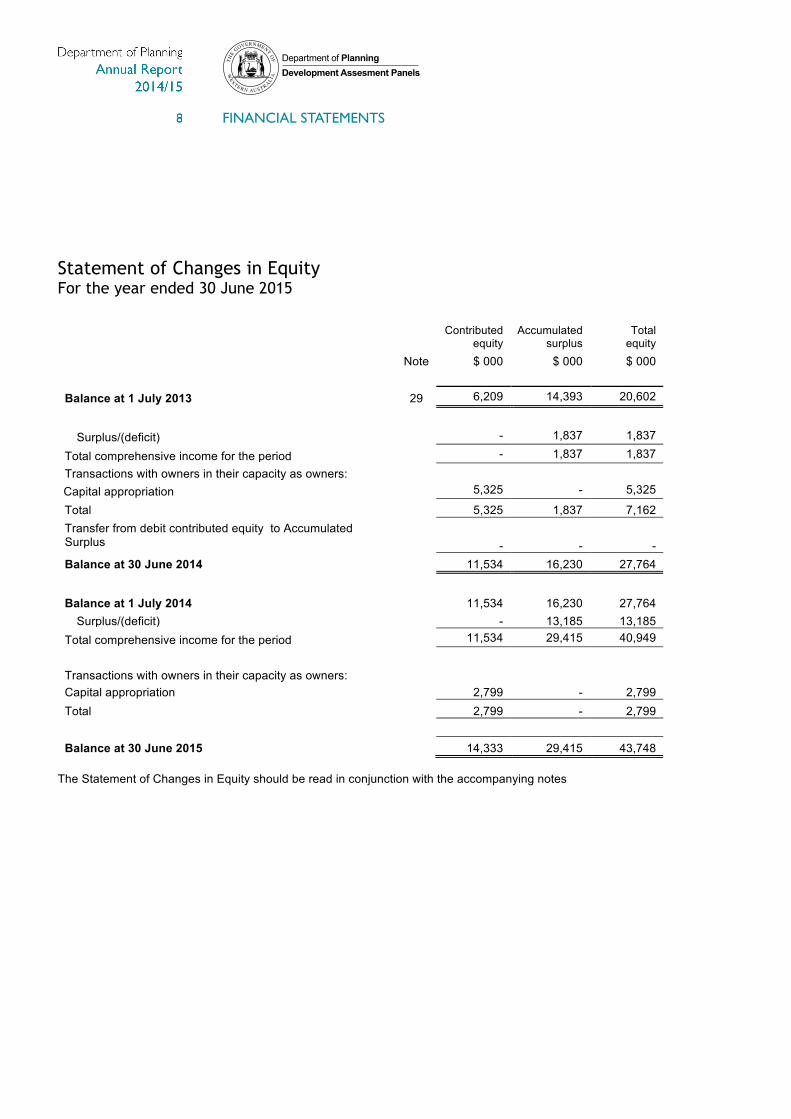
Statement of Changes in Equity For the year ended 30 June 2015
Contributed equity
Accumulated
surplus Total equity
Note $ 000 $ 000 $ 000
Balance at 1 July 2013 29 6,209 14,393 20,602
Surplus/(deficit)
- 1,837 1,837
Total comprehensive income for the period
- 1,837 1,837
Transactions with owners in their capacity as owners:
Capital appropriation
5,325 - 5,325
Total
5,325 1,837 7,162 Transfer from debit contributed equity to Accumulated Surplus
- - -
Balance at 30 June 2014
11,534 16,230 27,764
Balance at 1 July 2014
11,534 16,230 27,764 Surplus/(deficit)
- 13,185 13,185
Total comprehensive income for the period
11,534 29,415 40,949
Transactions with owners in their capacity as owners: Capital appropriation
2,799 - 2,799 Total
2,799 - 2,799
Balance at 30 June 2015
14,333 29,415 43,748 The Statement of Changes in Equity should be read in conjunction with the accompanying notes
Department of PlanningDevelopment Assesment Panels
FINANCIAL STATEMENTS
6
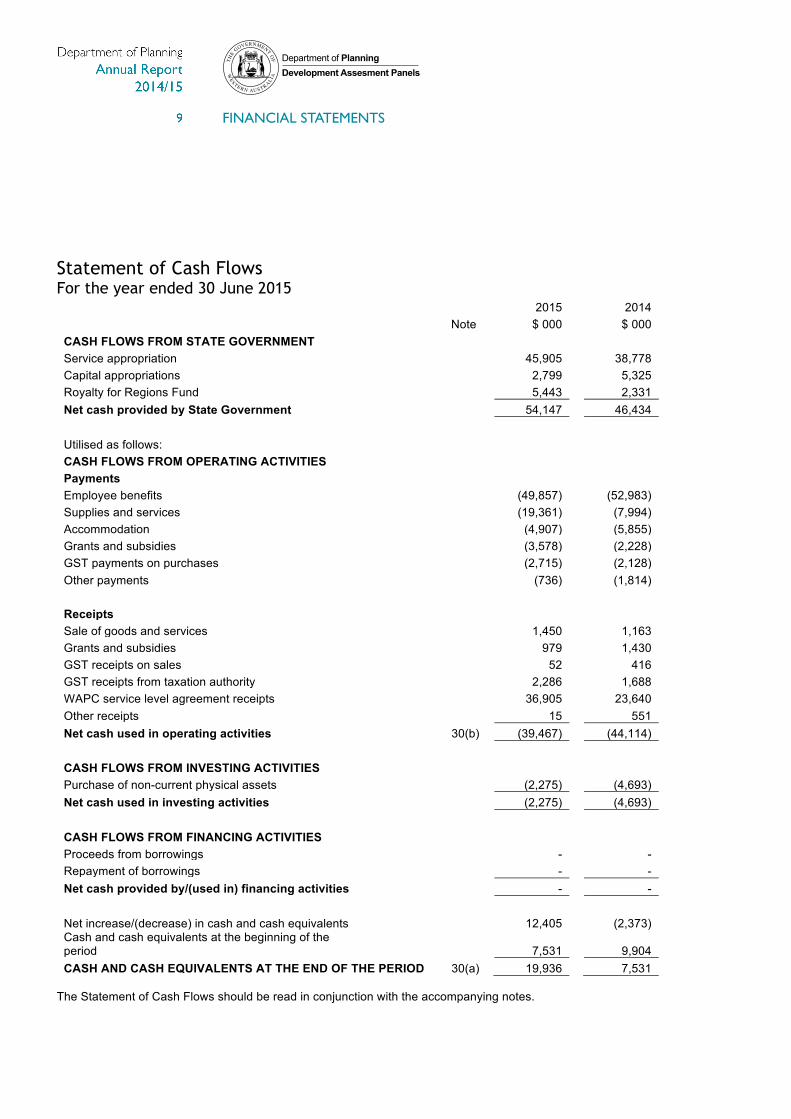
Statement of Cash Flows For the year ended 30 June 2015
2015
2014
Note $ 000
$ 000
CASH FLOWS FROM STATE GOVERNMENT Service appropriation
45,905
38,778 Capital appropriations
2,799
5,325
Royalty for Regions Fund
5,443
2,331 Net cash provided by State Government
54,147
46,434
Utilised as follows: CASH FLOWS FROM OPERATING ACTIVITIES Payments Employee benefits
(49,857)
(52,983) Supplies and services
(19,361)
(7,994)
Accommodation
(4,907)
(5,855) Grants and subsidies
(3,578)
(2,228)
GST payments on purchases
(2,715)
(2,128) Other payments
(736)
(1,814)
Receipts Sale of goods and services
1,450
1,163 Grants and subsidies
979
1,430
GST receipts on sales
52
416 GST receipts from taxation authority
2,286
1,688
WAPC service level agreement receipts
36,905
23,640 Other receipts
15
551
Net cash used in operating activities
30(b) (39,467)
(44,114)
CASH FLOWS FROM INVESTING ACTIVITIES Purchase of non-current physical assets
(2,275)
(4,693) Net cash used in investing activities
(2,275)
(4,693)
CASH FLOWS FROM FINANCING ACTIVITIES Proceeds from borrowings
-
- Repayment of borrowings
-
-
Net cash provided by/(used in) financing activities
-
-
Net increase/(decrease) in cash and cash equivalents
12,405
(2,373) Cash and cash equivalents at the beginning of the period
7,531
9,904
CASH AND CASH EQUIVALENTS AT THE END OF THE PERIOD 30(a) 19,936
7,531 The Statement of Cash Flows should be read in conjunction with the accompanying notes.
Department of PlanningDevelopment Assesment Panels

FINANCIAL STATEMENTS
7
Schedule of Income and Expenses by Service For the year ended 30 June 2015
Integrated land and infrastructure
policy development
Land accessibility planning and policy
development Total
2015 2014 2015 2014 2015 2014
$ 000 $ 000 $ 000 $ 000 $ 000 $ 000
COST OF SERVICES Expenses Employee Benefits Expense 20,516 21,330 31,188 30,436 51,704 51,766
Supplies and services 7,980 4,360 15,301 5,468 23,280 9,828 Depreciation and amortisation expense 830 222 1,234 330 2,064 552 Accommodation expenses 1,813 2,238 3,116 3,564 4,929 5,802 Grants and subsidies 4,143 1,775 553 464 4,696 2,239 Loss on disposal of non-current assets - - 7 - 7 - Other expenses 387 124 899 737 1,286 861 Total cost of services 35,667 30,049 52,298 40,999 87,965 71,048
Income User charges and fees 2 6 1,447 1,158 1,449 1,164
Grants and subsidies revenue 400 1,097 468 567 868 1,664 WAPC Service Level Agreement 9,572 2,117 34,909 24,364 44,481 26,481 Other revenue 6 123 7 62 13 185 Total income other than income from State Government 9,980 3,343 36,831 26,151 46,811 29,494
NET COST OF SERVICES 25,688 26,706 15,466 14,848 41,154 41,554
INCOME FROM STATE GOVERNMENT
Service appropriation 18,510 15,672 27,560 23,320 46,070 38,992 Services received free of charge 2,187 931 3,256 1,386 5,443 2,317 Royalties for Regions Fund 1,135 837 1,691 1,245 2,826 2,082 Total income from State Government 21,832 17,440 32,507 25,951 54,339 43,391
Surplus/(deficit) for the period (3,856) (9,266) 17,041 11,103 13,185 1,837 The Schedule of Income and Expenses by Service should be read in conjunction with the accompanying notes.
Department of PlanningDevelopment Assesment Panels
FINANCIAL STATEMENTS
8
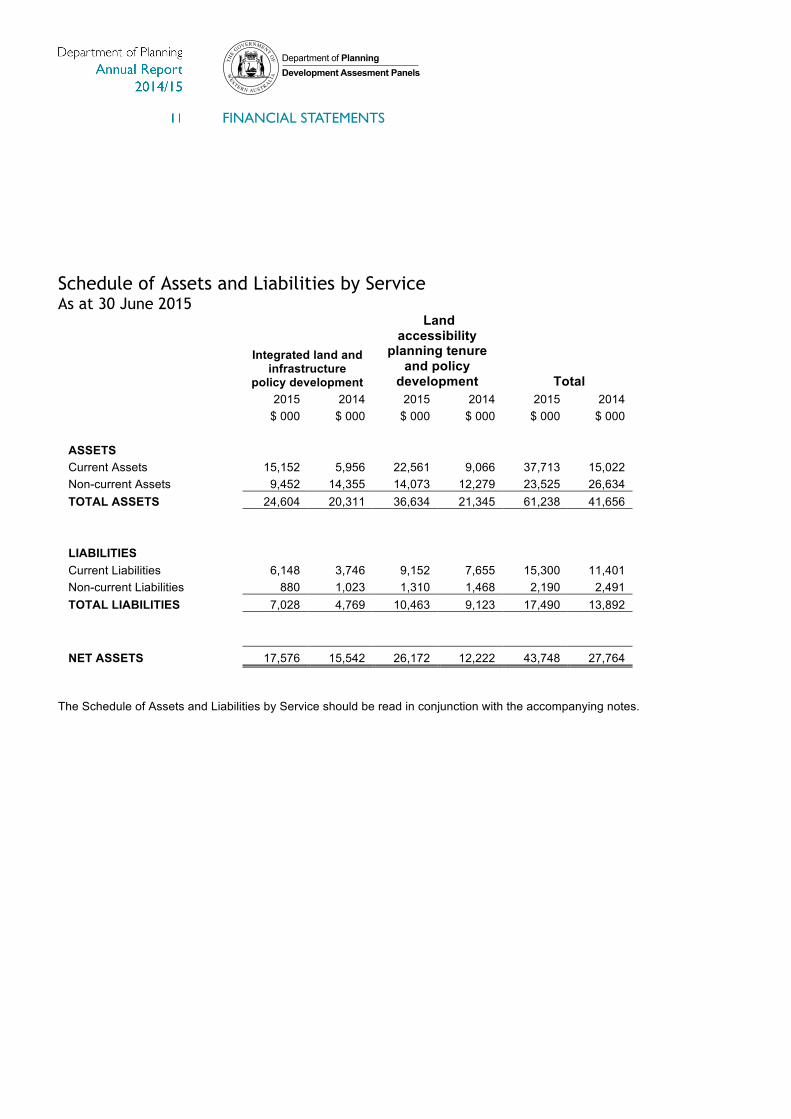
Schedule of Assets and Liabilities by Service As at 30 June 2015
Integrated land and infrastructure
policy development
Land accessibility
planning tenure and policy
development Total
2015 2014 2015 2014 2015 2014
$ 000 $ 000 $ 000 $ 000 $ 000 $ 000
ASSETS Current Assets 15,152 5,956 22,561 9,066 37,713 15,022
Non-current Assets 9,452 14,355 14,073 12,279 23,525 26,634 TOTAL ASSETS 24,604 20,311 36,634 21,345 61,238 41,656
LIABILITIES
Current Liabilities 6,148 3,746 9,152 7,655 15,300 11,401 Non-current Liabilities 880 1,023 1,310 1,468 2,190 2,491 TOTAL LIABILITIES 7,028 4,769 10,463 9,123 17,490 13,892
NET ASSETS 17,576 15,542 26,172 12,222 43,748 27,764
The Schedule of Assets and Liabilities by Service should be read in conjunction with the accompanying notes.
Department of PlanningDevelopment Assesment Panels
FINANCIAL STATEMENTS
9
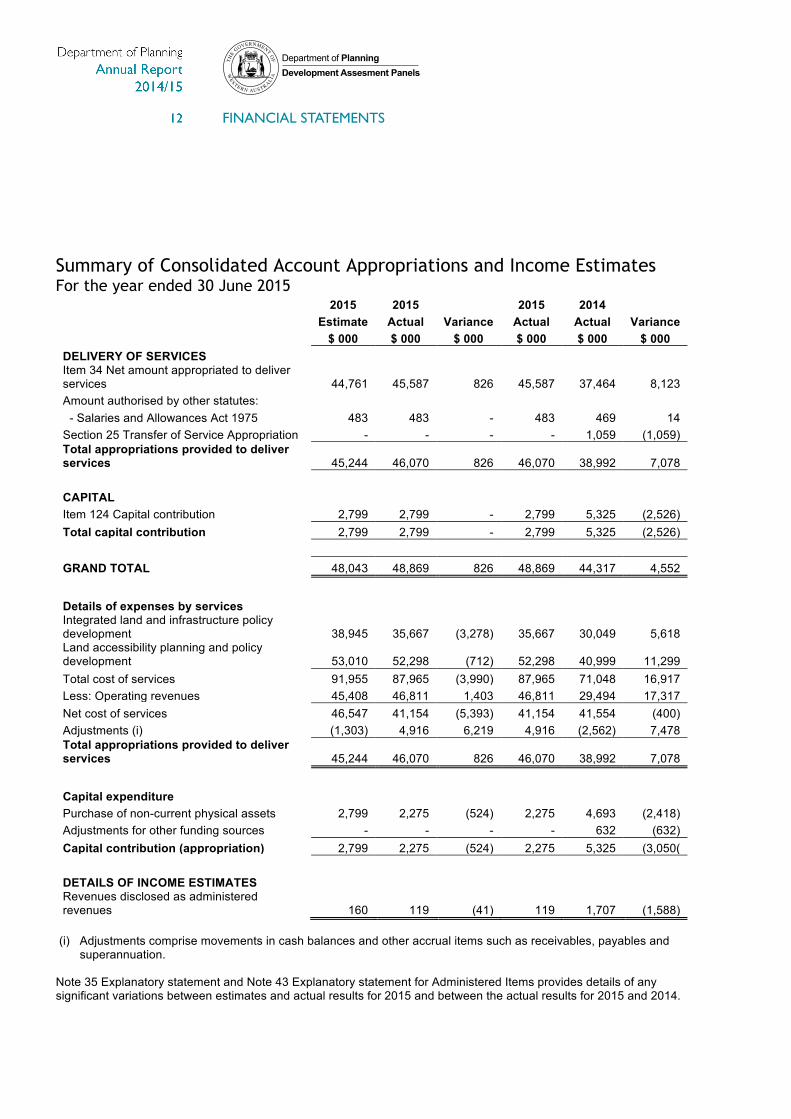
Summary of Consolidated Account Appropriations and Income Estimates For the year ended 30 June 2015
2015 2015
2015 2014
Estimate Actual Variance Actual Actual Variance
$ 000 $ 000 $ 000 $ 000 $ 000 $ 000
DELIVERY OF SERVICES Item 34 Net amount appropriated to deliver
services 44,761 45,587 826 45,587 37,464 8,123 Amount authorised by other statutes:
- Salaries and Allowances Act 1975 483 483 - 483 469 14 Section 25 Transfer of Service Appropriation - - - - 1,059 (1,059) Total appropriations provided to deliver services 45,244 46,070 826 46,070 38,992 7,078
CAPITAL Item 124 Capital contribution 2,799 2,799 - 2,799 5,325 (2,526)
Total capital contribution 2,799 2,799 - 2,799 5,325 (2,526)
GRAND TOTAL 48,043 48,869 826 48,869 44,317 4,552
Details of expenses by services Integrated land and infrastructure policy
development 38,945 35,667 (3,278) 35,667 30,049 5,618 Land accessibility planning and policy development 53,010 52,298 (712) 52,298 40,999 11,299 Total cost of services 91,955 87,965 (3,990) 87,965 71,048 16,917 Less: Operating revenues 45,408 46,811 1,403 46,811 29,494 17,317 Net cost of services 46,547 41,154 (5,393) 41,154 41,554 (400) Adjustments (i) (1,303) 4,916 6,219 4,916 (2,562) 7,478 Total appropriations provided to deliver services 45,244 46,070 826 46,070 38,992 7,078
Capital expenditure Purchase of non-current physical assets 2,799 2,275 (524) 2,275 4,693 (2,418)
Adjustments for other funding sources - - - - 632 (632) Capital contribution (appropriation) 2,799 2,275 (524) 2,275 5,325 (3,050(
DETAILS OF INCOME ESTIMATES Revenues disclosed as administered
revenues 160 119 (41) 119 1,707 (1,588) (i) Adjustments comprise movements in cash balances and other accrual items such as receivables, payables and
superannuation. Note 35 Explanatory statement and Note 43 Explanatory statement for Administered Items provides details of any significant variations between estimates and actual results for 2015 and between the actual results for 2015 and 2014.
Department of PlanningDevelopment Assesment Panels
FINANCIAL STATEMENTS
10
Notes to the financial statements For the year ending 30 June 2015 1 Australian Accounting Standards General The Department’s financial statements for the year ended 30 June 2015 have been prepared in accordance with
Australian Accounting Standards. The term ‘Australian Accounting Standards’ refers to the Standards and Interpretations issued by the Australian Accounting Standard Board (AASB).
The Department has adopted any applicable, new and revised Australian Accounting Standards from their operative
dates. Early adoption of standards The Department cannot early adopt an Australian Accounting Standard unless specifically permitted by TI 1101
Application of Australian Accounting Standards and Other Pronouncements. There has been no early adoption of any Australian Accounting Standards that have been issued or amended (but not operative) by the Department for the annual reporting period ended 30 June 2015
2 Summary of significant accounting policies (a) General statement
The Department is a not-for-profit reporting entity that prepares general purpose financial statements in accordance with Australian Accounting Standards, the Framework, Statements of Accounting Concepts and other authoritative pronouncements of the Australian Accounting Standards Board as applied by the Treasurer’s instructions. Several of these are modified by the Treasurer’s instructions to vary application, disclosure, format and wording.
The Financial Management Act 2006 and the Treasurer’s instructions impose legislative provisions that govern the preparation of financial statements and take precedence over Australian Accounting Standards, the Framework, Statements of Accounting Concepts and other authoritative pronouncements of the Australian Accounting Standards Board. Where modification is required and has a material or significant financial effect upon the reported results, details of that modification and the resulting financial effect are disclosed in the notes to the financial statements.
(b) Basis of preparation The financial statements have been prepared on the accrual basis of accounting using the historical cost convention, except for land which has been measured at fair value. The accounting policies adopted in the preparation of the financial statements have been consistently applied throughout all periods presented unless otherwise stated. The financial statements are presented in Australian dollars and all values are rounded to the nearest thousand dollars ($ 000).
In the process of reporting the Department as a single entity, all intra entity transactions and balances have been eliminated.
Note 4 ‘Key sources of estimation uncertainty’ discloses key assumptions made concerning the future and other key sources of estimation uncertainty at the end of the reporting period, that have a significant risk of causing a material adjustment to the carrying amounts of assets and liabilities within the next financial year.
Department of PlanningDevelopment Assesment Panels

FINANCIAL STATEMENTS
11
(c) Reporting entity The reporting entity comprises the Department. Purpose The Department’s purpose is to provide leadership in land use planning in Western Australia. Services The Department provides the following services: Service 1: Integrated land and infrastructure policy development Integrated land use and transport systems contribute to the state by shaping the pattern of development and influencing location, scale, density, design and mix of land uses. Service 2: Land accessibility planning and policy development Ensures that sufficient land is available for purchase for both residential and commercial purpose, by minimising land supply delays, controlling lot sizes and therefore the costs of infrastructure required to service each lot and providing resources to the Western Australian planning Commission. The Department administers assets, liabilities, income and expenses on behalf of Government which are not controlled by, nor integral to the functions of the Department. These administered balances and transactions are not recognised in the principal financial statements of the Department but schedules are prepared using the same basis as the financial statements and are presented at note 42 Disclosure of Administered income and expenses by service and note 44 Administered assets and liabilities.
(d) Contributed equity
AASB Interpretation 1038 Contributions by Owners Made to Wholly-Owned Public Sector Entities requires transfers in the nature of equity contributions, other than as a result of a restructure of administrative arrangements, to be designated by the Government (the owner) as contributions by owners (at the time of, or prior to transfer) before such transfers can be recognised as equity contributions. Capital appropriations have been designated as contributions by owners by TI 955 Contributions by Owners made to Wholly Owned Public Sector Entities and have been credited directly to Contributed Equity. The transfer of net assets to/from other agencies, other than as a result of a restructure of administrative arrangements, are designated as contributions by owners where the transfers are non-discretionary and non-reciprocal. See note 29 Equity.
Department of PlanningDevelopment Assesment Panels
FINANCIAL STATEMENTS
12
(e) Income
Revenue recognition Revenue is measured at the fair value of consideration received or receivable. Revenue is recognised for the major
business activities as follows: Sale of goods Revenue is recognised from the sale of goods and disposal of other assets when the significant risks and rewards of
ownership transfer to the purchaser and can be measured reliably. Provision of services Revenue is recognised by the stage of completion of the transaction. The revenue from other operating activities including provision of services and the sale of assets are recognised
when the Department has passed control of the goods or other assets or delivery of the service to the customer. Recoups of operating activities are recognised when invoiced.
Interest Revenue is recognised as the interest accrues.
Service appropriations Service appropriations are recognised as revenues at fair value in the period in which the Department gains control
of the appropriated funds. The Department gains control of appropriated funds at the time those funds are deposited into the Department’s bank account or credited to the Amounts receivable for services (holding account) held at Treasury. See note 16 Income from State Government for further detail.
Net appropriation determination
The Treasurer may make a determination providing for prescribed receipts to be retained for services under the control of the Department. In accordance with the most recent determination, as quantified in the 2014-15 Budget Statements, the Department retained 47.75 million in 2015 (32.24 million in 2014) from the following:
Development Assessment Panels, Services provided to the Commonwealth for Indian Ocean Territories Program, Planning for Aboriginal Communities from the Department of Housing, recoups for services provided to the Western Australian Planning Commission and other revenue.
Grants, donations, gifts and other non-reciprocal contributions Revenue is recognised at fair value when the Department obtains control over the assets comprising the contributions, usually when cash is received. Other non-reciprocal contributions that are not contributions by owners are recognised at their fair value. Contributions of services are only recognised when a fair value can be reliably determined and the services would be purchased if not donated. Royalties for Regions funds are recognised as revenue at fair value in the period in which the Department obtains control over the funds. The Department obtains control of the funds at the time the funds are deposited into the Department’s bank account.
Gains Realised or unrealised gains are usually recognised on a net basis. These include gains arising on the disposal of non-current assets and some revaluations of non-current assets.
(f) Borrowing costs
Borrowing costs are expensed when incurred.
Department of PlanningDevelopment Assesment Panels
FINANCIAL STATEMENTS
13
(g) Property, plant and equipment Capitalisation/expensing of assets
Items of property, plant and equipment costing $5,000 or more are recognised as assets and the cost of utilising assets is expensed (depreciated) over their useful lives. Items of property, plant and equipment costing less than $5,000 are immediately expensed direct to the Statement of Comprehensive Income.
Initial recognition and measurement All items of property, plant and equipment are initially recognised at cost.
For items of property, plant and equipment acquired at no cost or for nominal cost, the cost is their fair value at the date of acquisition.
Subsequent measurement Subsequent to initial recognition of an asset, the revaluation model is used for the measurement of land and historical cost for all other property, plant and equipment. Land is carried at fair value less accumulated impairment losses. All other items of property, plant and equipment are stated at historical cost less accumulated depreciation and accumulated impairment losses. Where market-based evidence is available, the fair value of land is determined on the basis of current market buying values determined by reference to recent market transactions. In the absence of market-based evidence, the fair value of land is determined on the basis of existing use. This normally applies where land use is restricted. Fair value for existing use assets is determined by reference to the cost of replacing the remaining future economic benefits embodied in the asset, i.e. the depreciated replacement cost. Land is independently valued by the Western Australian Land Information Authority (Valuation Services) and recognised annually to ensure that the carrying amount does not differ materially from the asset’s fair value at the end of the reporting period.
The most significant assumptions in estimating fair value are made in assessing whether to apply the existing use basis to assets and in determining estimated useful life. Professional judgement by the valuer is required where the evidence does not provide a clear distinction between market type assets and existing use assets. Derecognition Upon disposal or derecognition of an item of property, plant and equipment, any revaluation surplus relating to that asset is retained in the asset revaluation surplus. Asset revaluation surplus The asset revaluation surplus is used to record increments and decrements on the revaluation of non-current assets on a class of asset basis.
Depreciation All non-current assets having a limited useful life are systematically depreciated over their estimated useful lives in a manner that reflects the consumption of their future economic benefits. Land is not depreciated. Depreciation on other assets is calculated using the straight line method, using rates which are reviewed annually. Estimated useful lives for each class of depreciable asset are:
Computer hardware 3 to 7 years Refurbishments, furniture and fittings 3 to 10 years Office equipment 5 years Land is not depreciated. Assets under construction are not depreciated until commissioned.
Department of PlanningDevelopment Assesment Panels

FINANCIAL STATEMENTS
14
(h) Intangible assets
Capitalisation/expensing of assets Acquisitions of intangible assets costing $5,000 or more and internally generated intangible assets costing $5,000 or more are capitalised. The cost of utilising the assets is expensed (amortised) over their useful life. Costs incurred below these thresholds are immediately expensed directly to the Statement of Comprehensive Income.
Intangible assets are initially recognised at cost. For assets acquired at no cost or for nominal cost, the cost is their fair value at the date of acquisition.
The cost model is applied for subsequent measurement requiring the asset to be carried at cost less any accumulated amortisation and accumulated impairment losses. Amortisation for intangible assets with finite useful lives is calculated for the period of the expected benefit (estimated useful life) on the straight line basis using rates which are reviewed annually. All intangible assets controlled by the Department have a finite useful life and zero residual value. The expected useful lives for each class of intangible asset are:
• Software not integral to the operation of related hardware 3 to 10 years • Licences 3 years
Computer software Software that is an integral part of the related hardware is recognised as property, plant and equipment. Software that is not an integral part of the related hardware is treated as an intangible asset. Software costing less than $5,000 is expensed in the year of acquisition. Licenses Licences have a finite useful life and are carried at cost less accumulated amortisation and accumulated impairment losses.
(i) Impairment of assets
Property, plant and equipment and intangible assets are tested for any indication of impairment at the end of each reporting period. Where there is an indication of impairment, the recoverable amount is estimated. Where the recoverable amount is less than the carrying amount, the asset is considered impaired and is written down to the recoverable amount and an impairment loss is recognised. Where an asset measured at cost is written down to recoverable amount, an impairment loss is recognised in profit or loss. Where a previously revalued asset is written down to recoverable amount, the loss is recognised as a revaluation decrement in other comprehensive income. As the Department is a not-for-profit entity, unless an asset has been identified as a surplus asset, the recoverable amount is the higher of an asset’s fair value less costs to sell and depreciated replacement cost.
The risk of impairment is generally limited to circumstances where an asset’s depreciation is materially understated, where the replacement cost of an asset is falling or where there is a significant change in the useful life. Each relevant class of assets is reviewed annually to verify that the accumulated depreciation/amortisation reflects the level of consumption or expiration of the asset’s future economic benefits and to evaluate any impairment risk from falling replacement costs.
Intangible assets with an indefinite useful life and intangible assets not yet available for use are tested for impairment at the end of each reporting period irrespective of whether there is any indication of impairment.
The recoverable amount of assets identified as surplus assets is the higher of fair value less costs to sell and the present value of future cash flows expected to be derived from the asset. Surplus assets carried at fair value have no risk of material impairment where fair value is determined by reference to market-based evidence. Where fair value is determined by reference to depreciated replacement cost, surplus assets are at risk of impairment and the recoverable amount is measured. Surplus assets at cost are tested for indications of impairment at the end of each reporting period. See note 25 Impairment of assets for the outcome of impairment reviews and testing. See note 2(o) Receivables and note 20 Receivables for impairment of receivables.
Department of PlanningDevelopment Assesment Panels

FINANCIAL STATEMENTS
15
(j) Leases
The Department holds operating leases for head office and a number of branch office buildings, motor vehicles and office equipment. Lease payments are expensed on a straight line basis over the lease term as this represents the pattern of benefits derived from the leased properties.
(k) Financial instruments In addition to cash and cash equivalents, the Department has two categories of financial instrument:
• Receivables; and • Financial liabilities measured at amortised cost.
Financial instruments have been disaggregated into the following classes: Financial Assets
• Cash and cash equivalents • Restricted cash and cash equivalents • Receivables • Amounts receivable for services
Financial Liabilities
• Payables Initial recognition and measurement of financial instruments is at fair value which normally equates to the transaction cost or the face value. Subsequent measurement is at amortised cost using the effective interest method.
The fair value of short-term receivables and payables is the transaction cost or the face value because there is no interest rate applicable and subsequent measurement is not required as the effect of discounting is not material.
(l) Cash and cash equivalents For the purpose of the Statement of Cash Flows, cash and cash equivalents (and restricted cash and cash
equivalent) assets comprise cash on hand and short-term deposits with original maturities of three months or less that are readily convertible to a known amount of cash and which are subject to insignificant risk of changes in value.
(m) Accrued salaries
Accrued salaries (refer note 26 Payables) represent the amount due to staff but unpaid at the end of the financial year. Accrued salaries are settled within a fortnight of the financial year end. The Department considers the carrying amount of accrued salaries to be equivalent to its net fair value. The accrued salaries suspense account (see note 19 Restricted cash and cash equivalents) consists of amounts paid annually into a suspense account over a period of 10 financial years to largely meet the additional cash outflow in each eleventh year when 27 pay days occur in that year instead of the normal 26. No interest is received on this account.
(n) Amounts receivable for services (Holding Account) The Department receives funding on an accrual basis. The appropriations are paid partly in cash and partly as an
asset (holding account receivable). The accrued amount receivable is accessible on the emergence of the cash funding requirement to cover leave entitlements and asset replacement.
See also note 17 Income from State Government and note 21 Amounts receivable for services.
Department of PlanningDevelopment Assesment Panels
FINANCIAL STATEMENTS
16
(o) Receivables Receivables are recognised and carried at original invoice amount less an allowance for any uncollectible amounts
(i.e. impairment). The collectability of receivables is reviewed on an ongoing basis and any receivables identified as uncollectible are written-off against the allowance account. The allowance for uncollectible amounts (doubtful debts) is raised when there is objective evidence that the Department will not be able to collect the debts. The carrying amount is equivalent to fair value as it is due for settlement within 30 days.
See note 2(k) Financial Instruments and note 20 Receivables. (p) Payables
Payables are recognised at the amounts payable when the Department becomes obliged to make future payments as a result of a purchase of assets or services. The carrying amount is equivalent to fair value, as they are generally settled within 30 days.
See note 2(k) Financial Instruments and note 26 Payables.
(q) Borrowings All loans payable are initially recognised at fair value, being the net proceeds received. Subsequent measurement
is at amortised cost using the effective interest rate method. (r) Provisions Provisions are liabilities of uncertain timing and amount and are recognised where there is a present legal or
constructive obligation as a result of a past event and when the outflow of resources embodying economic benefits is probable and a reliable estimate can be made of the amount of the obligation. Provisions are reviewed at the end of each reporting period.
See note 27 Provisions.
(i) Provisions – employee benefits
All annual leave and long service leave provisions are in respect of employees' services up to the end of the reporting period.
Annual leave Annual leave is not expected to be settled wholly within 12 months after the end of the reporting period and is therefore considered to be ‘other long-term employee benefits’. The annual leave liability is recognised and measured at the present value of amounts expected to be paid when the liabilities are settled using the remuneration rate expected to apply at the time of settlement. When assessing expected future payments consideration is given to expected future wage and salary levels including non-salary components such as employer superannuation contributions, as well as the experience of employee departures and periods of service. The expected future payments are discounted using market yields at the end of the reporting period on national government bonds with terms to maturity that match, as closely as possible, the estimated future cash outflows. The provision for annual leave is classified as a current liability as the Department does not have an unconditional right to defer settlement of the liability for at least 12 months after the reporting period. Long service leave Long service leave is not expected to be settled wholly within 12 months after the end of the reporting period is recognised and measured at the present value of amounts expected to be paid when the liabilities are settled using the remuneration rate expected to apply at the time of settlement.
Department of PlanningDevelopment Assesment Panels
FINANCIAL STATEMENTS
17
(i) Provisions – employee benefits (continued) When assessing expected future payments consideration is given to expected future wage and salary levels including non-salary components such as employer superannuation contributions, as well as the experience of employee departures and periods of service. The expected future payments are discounted using market yields at the end of the reporting period on national government bonds with terms to maturity that match, as closely as possible, the estimated future cash outflows. Unconditional long service leave provisions are classified as current liabilities as the Department does not have an unconditional right to defer settlement of the liability for at least 12 months after the reporting period. Conditional long service leave provisions are classified as non-current liabilities because the Department has an unconditional right to defer the settlement of the liability until the employee has completed the requisite years of service.
Deferred leave The provision for deferred leave relates to Public Service employees who have entered into an agreement to self-fund an additional 12 months leave in the fifth year of the agreement. The provision recognises the value of salary set aside for employees to be used in the fifth year. This liability is measured on the same basis as annual leave. Deferred leave is reported as a current provision as employees can leave the scheme at their discretion at any time. Purchased leave The provision for purchased leave relates to Public Service employees who have entered into an agreement to self-fund up to an additional 10 weeks leave per calendar year. The provision recognises the value of salary set aside for employees and is measured at the nominal amounts expected to be paid when the liabilities are settled. This liability is measured on the same basis as annual leave. Superannuation The Government Employees Superannuation Board (GESB) and other fund providers administer public sector superannuation arrangements in Western Australia in accordance with the legislative requirements. Eligibility criteria for membership in particular schemes for public sector employees vary according to commencement and implementation dates. Eligible employees contribute to the Pension Scheme, a defined benefit pension scheme closed to new members since 1987, or the Gold State Superannuation Scheme (GSS), a defined benefit lump sum scheme closed to new members since 1995. Employees commencing employment prior to 16 April 2007 who were not members of either the Pension Scheme or the GSS became non-contributory members of the West State Superannuation Scheme (WSS). Employees commencing employment on or after 16 April 2007 became members of the GESB Super Scheme (GESBS). From 30 March 2012, existing members of the WSS or GESBS and new employees became able to choose their preferred superannuation fund. The Department makes concurrent contributions to GESB and other funds on behalf of employees in compliance with the Commonwealth Government’s Superannuation Guarantee (Administration) Act 1992. Contributions to these accumulation schemes extinguish the Department’s liability for superannuation charges in respect of employees who are not members of the Pension Scheme and GSS. The GSS is a defined benefit scheme for the purposes of employees and whole-of-government reporting. However, it is a defined contribution plan for agency purposes because the concurrent contributions (defined contributions) made by the Department to GESB extinguishes the agency’s obligations to the related superannuation liability. The Department has no liabilities under the Pension Scheme or the GSS. The liabilities for the unfunded Pension Scheme and the unfunded GSS transfer benefits attributable to members who transferred from the Pension Scheme, are assumed by the Treasurer. All other GSS obligations are funded by concurrent contributions made by the Department to the GESB. The GESB makes all benefit payments in respect of the Pension Scheme and GSS, and is recouped from the Treasurer for the employer’s share.
See also note 2(s) Superannuation expense.
Department of PlanningDevelopment Assesment Panels

FINANCIAL STATEMENTS
18
(ii) Provisions – other
Employment on-costs Employment on-costs, including workers’ compensation insurance, are not employee benefits and are recognised separately as liabilities and expenses when the employment to which they relate has occurred. Employment on-costs are included as part of ‘Other expenses’ and are not included as part of the Department’s ‘Employee benefits expense’. The related liability is included in ‘Employment on-costs provision’. See note 12 Other Expenses and note 27 Provisions.
(s) Superannuation expense The superannuation expense in the Statement of Comprehensive Income comprises of employer contributions paid
to the GSS (concurrent contributions), the WSS, the GESBS, or other superannuation funds. The employer contribution paid to the GESB in respect of the GSS is paid back to the Consolidated Account by the GESB.
(t) Assets and services received free of charge or for nominal cost Assets or services received free of charge or for nominal cost that the Department would have otherwise purchase if
not donated are recognised as income at the fair value of the assets or services where they can be reliably measured. A corresponding expense is recognised for services received. Receipts of assets are recognised in the Statement of Financial Position.
Assets or services received from other State Government agencies are separately disclosed under Income from State Government in the Statement of Comprehensive Income.
(u) Comparative figures
Comparative figures are, where appropriate, reclassified to be comparable with the figures presented in the current financial year.
3 Judgements made by management in applying accounting policies
The preparation of financial statements requires management to make judgements about the application of accounting policies that have a significant effect on the amounts recognised in the financial statements. The Department evaluates these judgements regularly. Operating lease commitments The Department has entered into a number of leases for buildings for branch office accommodation. Some of these leases relate to buildings of a temporary nature and it has been determined that the lessor retains substantially all the risks and rewards incidental to ownership. Accordingly, these leases have been classified as operating leases.
4 Key sources of Uncertainty
Key estimates and assumptions concerning the future are based on historical experience and various other factors that have a significant risk of causing a material adjustment to the carrying amount of assets and liabilities within the next financial year. Long Service Leave Several estimations and assumptions used in calculating the Authority’s long service leave provision include expected future salary rates, discount rates, employee retention rates and expected future payments. Changes in these estimations and assumptions may impact on the carrying amount of the long service leave provision.
Department of PlanningDevelopment Assesment Panels
FINANCIAL STATEMENTS
19
5 Disclosure of changes in accounting policy and estimates Initial application of an Australian Accounting Standard
The Department has applied the following Australian Accounting Standards effective, or adopted, for annual reporting periods beginning on or after 1 July 2014 that impacted on the Department:
Int 21 Levies
This Interpretation clarifies the circumstances under which a liability to pay a government levy imposed should be recognised. There is no financial impact for the Department at reporting date.
AASB 10 Consolidated Financial Statements
This Standard, issued in August 2011, supersedes AASB 127 Consolidated and Separate Financial Statements and Int 112 Consolidation – Special Purpose Entities, introducing a number of changes to accounting treatments.
The adoption of the new Standard has no financial impact for the Department as it does not impact accounting for related bodies and the Department has no interests in other entities.
AASB 11 Joint Arrangements
This Standard, issued in August 2011, supersedes AASB 131 Interests in Joint Ventures, introduces new principles for determining the type of joint arrangement that exists, which are more aligned to the actual rights and obligations of the parties to the arrangement.
There is no financial impact for the Department
AASB 12 Disclosure of Interests in Other Entities
This Standard, issued in August 2011, supersedes disclosure requirements in AASB 127 Consolidated and Separate Financial Statements, AASB 128 Investments in Associates and AASB 131 Interests in Joint Ventures.
There is no financial impact
AASB 127 Separate Financial Statements
This Standard, issued in August 2011, supersedes AASB 127 Consolidated and Separate Financial Statements removing the consolidation requirements of the earlier standard whilst retaining accounting and disclosure requirements for the preparation of separate financial statements. There is no financial impact.
AASB 128 Investments in Associates and Joint Ventures
This Standard supersedes AASB 128 Investments in Associates, introducing a number of clarifications for the accounting treatments of changed ownership interest.
The adoption of the new Standard has no financial impact for the Model Authority as it does not hold investments in associates and joint ventures.
AASB 1031 Materiality
This Standard supersedes AASB 1031 (February 2010), removing Australian guidance on materiality not available in IFRSs and refers to guidance on materiality in other Australian pronouncements. There is no financial impact.
Department of PlanningDevelopment Assesment Panels
FINANCIAL STATEMENTS
20
AASB 1055 Budgetary Reporting
This Standard requires specific budgetary disclosures in the general purpose financial statements of not-for-profit entities within the General Government Sector. The Authority will be required to disclose additional budgetary information and explanations of major variances between actual and budgeted amounts, though there is no financial impact.
AASB 2011-7 Amendments to Australian Accounting Standards arising from the Consolidation and Joint Arrangements Standards [AASB 1, 2, 3, 5, 7, 101, 107, 112, 118, 121, 124, 132, 133, 136, 138, 139, 1023 & 1038 and Int 5, 9, 16 & 17]
This Standard gives effect to consequential changes arising from the issuance of AASB 10, AASB 11, AASB 127 Separate Financial Statements and AASB 128 Investments in Associates and Joint Ventures. There is no financial impact for the Model Department.
AASB 2012-3 Amendments to Australian Accounting Standards – Offsetting Financial Assets and Financial Liabilities [AASB 132]
This Standard adds application guidance to AASB 132 to address inconsistencies identified in applying some of the offsetting criteria, including clarifying the meaning of “currently has a legally enforceable right of set-off” and that some gross settlement systems may be considered equivalent to net settlement. There is no financial impact.
AASB 2013-3 Amendments to AASB 136 – Recoverable Amount Disclosures for Non-Financial Assets.
This Standard introduces editorial and disclosure changes. There is no financial impact.
AASB 2013-4 Amendments to Australian Accounting Standards – Novation of Derivatives and Continuation of Hedge Accounting [AASB 139]
This Standard permits the continuation of hedge accounting in circumstances where a derivative, which has been designated as a hedging instrument, is novated from one counterparty to a central counterparty as a consequence of laws or regulations. The Department does not enter into derivatives or hedges, therefore there is no financial impact.
AASB 2013-8 Amendments to Australian Accounting Standards - Australian Implementation Guidance for Not-for-Profit Entities – Control and Structured Entities [AASB 10, 12 & 1049].
The amendments, issued in October 2013, provide significant guidance in determining whether a not-for-profit entity controls another entity when financial returns are not a key attribute of the investor’s relationship. The Standard has no financial impact in its own right, rather the impact results from the adoption of the amended AASB 10.
AASB 2013-9 Amendments to Australian Accounting Standards - Conceptual Framework, Materiality and Financial Instruments.
This omnibus Standard makes amendments to other Standards arising from the deletion of references to AASB 1031 in other Standards for periods beginning on or after 1 January 2014 (Part B). Part B of the Standard has no financial impact.
AASB 2014-1 Amendments to Australian Accounting Standards
Part A of this Standard consists primarily of clarifications to Australian Standards and has no financial impact for the Department.
Part B of this Standard has no financial impact as the Department contributes to schemes that are either defined contribution plans, or deemed to be defined contribution plans.
Part C of this Standard has no financial impact as it removed references to AASB 1031 Materiality from a number of Accounting Standards.
Department of PlanningDevelopment Assesment Panels
FINANCIAL STATEMENTS
21
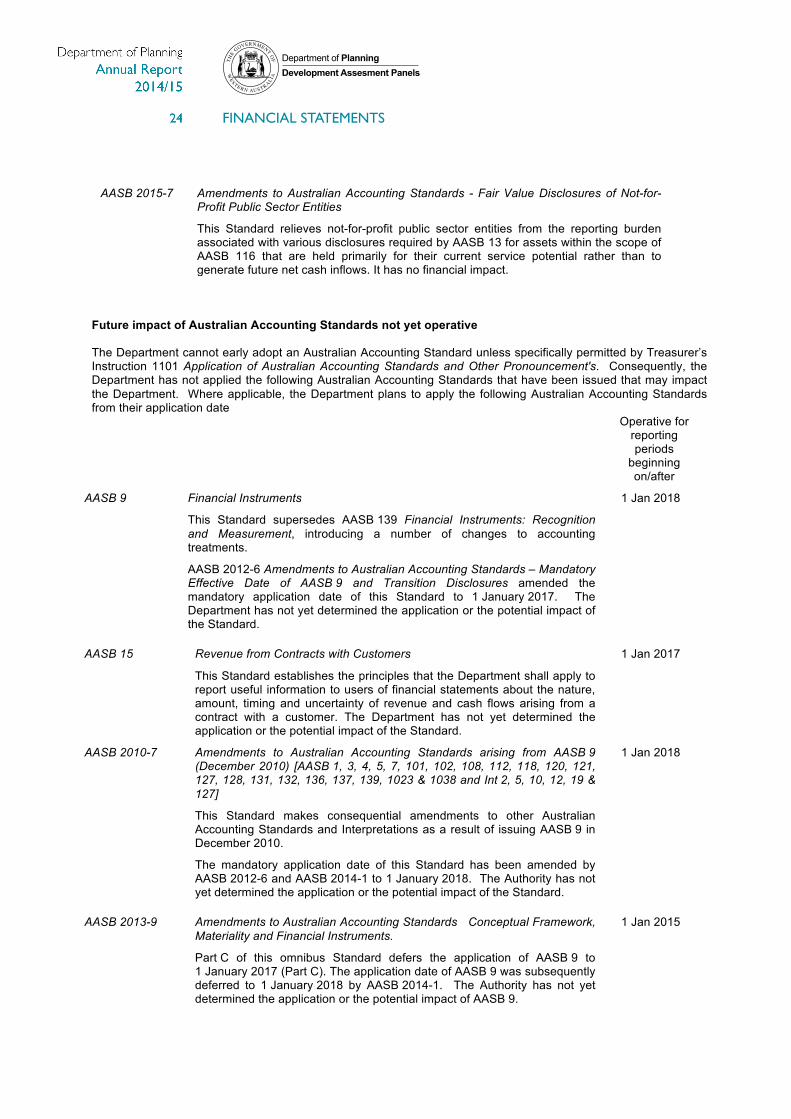
AASB 2015-7 Amendments to Australian Accounting Standards - Fair Value Disclosures of Not-for-Profit Public Sector Entities
This Standard relieves not-for-profit public sector entities from the reporting burden associated with various disclosures required by AASB 13 for assets within the scope of AASB 116 that are held primarily for their current service potential rather than to generate future net cash inflows. It has no financial impact.
Future impact of Australian Accounting Standards not yet operative The Department cannot early adopt an Australian Accounting Standard unless specifically permitted by Treasurer’s Instruction 1101 Application of Australian Accounting Standards and Other Pronouncement's. Consequently, the Department has not applied the following Australian Accounting Standards that have been issued that may impact the Department. Where applicable, the Department plans to apply the following Australian Accounting Standards from their application date Operative for
reporting periods
beginning on/after
AASB 9 Financial Instruments
This Standard supersedes AASB 139 Financial Instruments: Recognition and Measurement, introducing a number of changes to accounting treatments.
AASB 2012-6 Amendments to Australian Accounting Standards – Mandatory Effective Date of AASB 9 and Transition Disclosures amended the mandatory application date of this Standard to 1 January 2017. The Department has not yet determined the application or the potential impact of the Standard.
1 Jan 2018
AASB 15 Revenue from Contracts with Customers
This Standard establishes the principles that the Department shall apply to report useful information to users of financial statements about the nature, amount, timing and uncertainty of revenue and cash flows arising from a contract with a customer. The Department has not yet determined the application or the potential impact of the Standard.
1 Jan 2017
AASB 2010-7 Amendments to Australian Accounting Standards arising from AASB 9 (December 2010) [AASB 1, 3, 4, 5, 7, 101, 102, 108, 112, 118, 120, 121, 127, 128, 131, 132, 136, 137, 139, 1023 & 1038 and Int 2, 5, 10, 12, 19 & 127]
This Standard makes consequential amendments to other Australian Accounting Standards and Interpretations as a result of issuing AASB 9 in December 2010.
The mandatory application date of this Standard has been amended by AASB 2012-6 and AASB 2014-1 to 1 January 2018. The Authority has not yet determined the application or the potential impact of the Standard.
1 Jan 2018
AASB 2013-9 Amendments to Australian Accounting Standards Conceptual Framework, Materiality and Financial Instruments.
Part C of this omnibus Standard defers the application of AASB 9 to 1 January 2017 (Part C). The application date of AASB 9 was subsequently deferred to 1 January 2018 by AASB 2014-1. The Authority has not yet determined the application or the potential impact of AASB 9.
1 Jan 2015
Department of PlanningDevelopment Assesment Panels
FINANCIAL STATEMENTS
22
Operative for reporting periods
beginning on/after
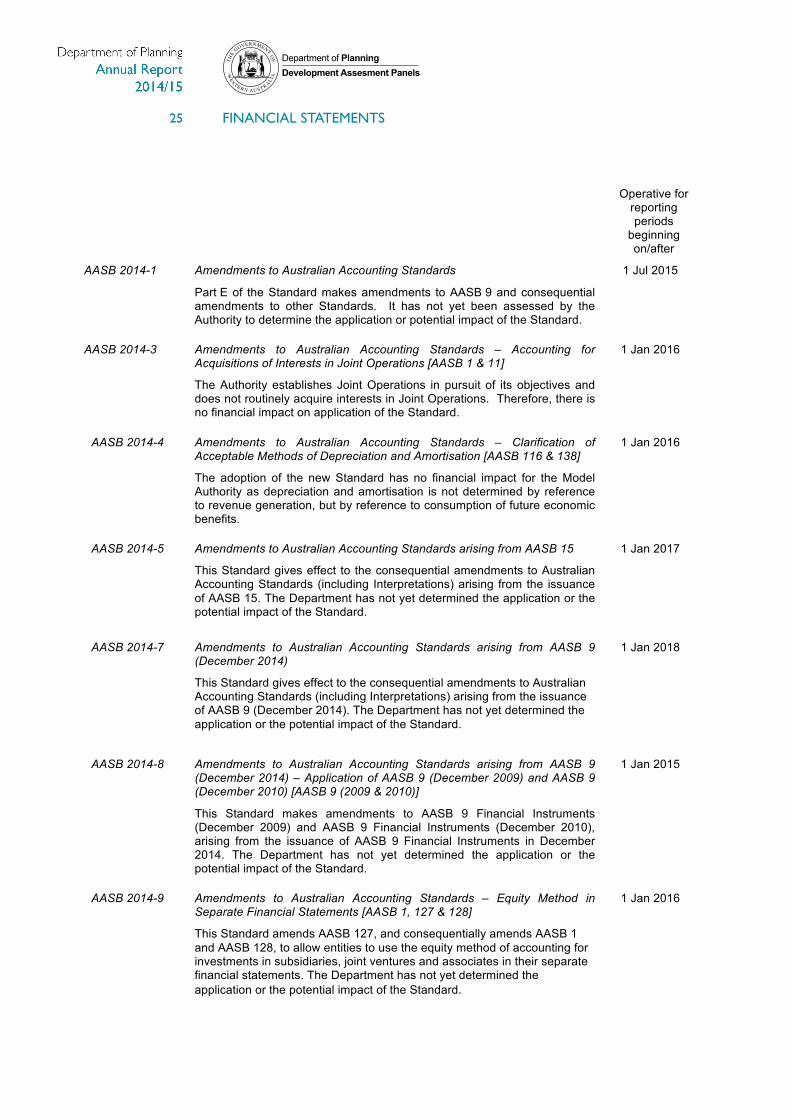
AASB 2014-1 Amendments to Australian Accounting Standards 1 Jul 2015
Part E of the Standard makes amendments to AASB 9 and consequential amendments to other Standards. It has not yet been assessed by the Authority to determine the application or potential impact of the Standard.
AASB 2014-3 Amendments to Australian Accounting Standards – Accounting for Acquisitions of Interests in Joint Operations [AASB 1 & 11]
The Authority establishes Joint Operations in pursuit of its objectives and does not routinely acquire interests in Joint Operations. Therefore, there is no financial impact on application of the Standard.
1 Jan 2016
AASB 2014-4 Amendments to Australian Accounting Standards – Clarification of Acceptable Methods of Depreciation and Amortisation [AASB 116 & 138]
The adoption of the new Standard has no financial impact for the Model Authority as depreciation and amortisation is not determined by reference to revenue generation, but by reference to consumption of future economic benefits.
1 Jan 2016
AASB 2014-5 Amendments to Australian Accounting Standards arising from AASB 15
This Standard gives effect to the consequential amendments to Australian Accounting Standards (including Interpretations) arising from the issuance of AASB 15. The Department has not yet determined the application or the potential impact of the Standard.
1 Jan 2017
AASB 2014-7 Amendments to Australian Accounting Standards arising from AASB 9 (December 2014)
This Standard gives effect to the consequential amendments to Australian Accounting Standards (including Interpretations) arising from the issuance of AASB 9 (December 2014). The Department has not yet determined the application or the potential impact of the Standard.
1 Jan 2018
AASB 2014-8 Amendments to Australian Accounting Standards arising from AASB 9 (December 2014) – Application of AASB 9 (December 2009) and AASB 9 (December 2010) [AASB 9 (2009 & 2010)]
This Standard makes amendments to AASB 9 Financial Instruments (December 2009) and AASB 9 Financial Instruments (December 2010), arising from the issuance of AASB 9 Financial Instruments in December 2014. The Department has not yet determined the application or the potential impact of the Standard.
1 Jan 2015
AASB 2014-9 Amendments to Australian Accounting Standards – Equity Method in Separate Financial Statements [AASB 1, 127 & 128]
This Standard amends AASB 127, and consequentially amends AASB 1 and AASB 128, to allow entities to use the equity method of accounting for investments in subsidiaries, joint ventures and associates in their separate financial statements. The Department has not yet determined the application or the potential impact of the Standard.
1 Jan 2016
Department of PlanningDevelopment Assesment Panels
FINANCIAL STATEMENTS
23
Operative for reporting periods beginning on/after
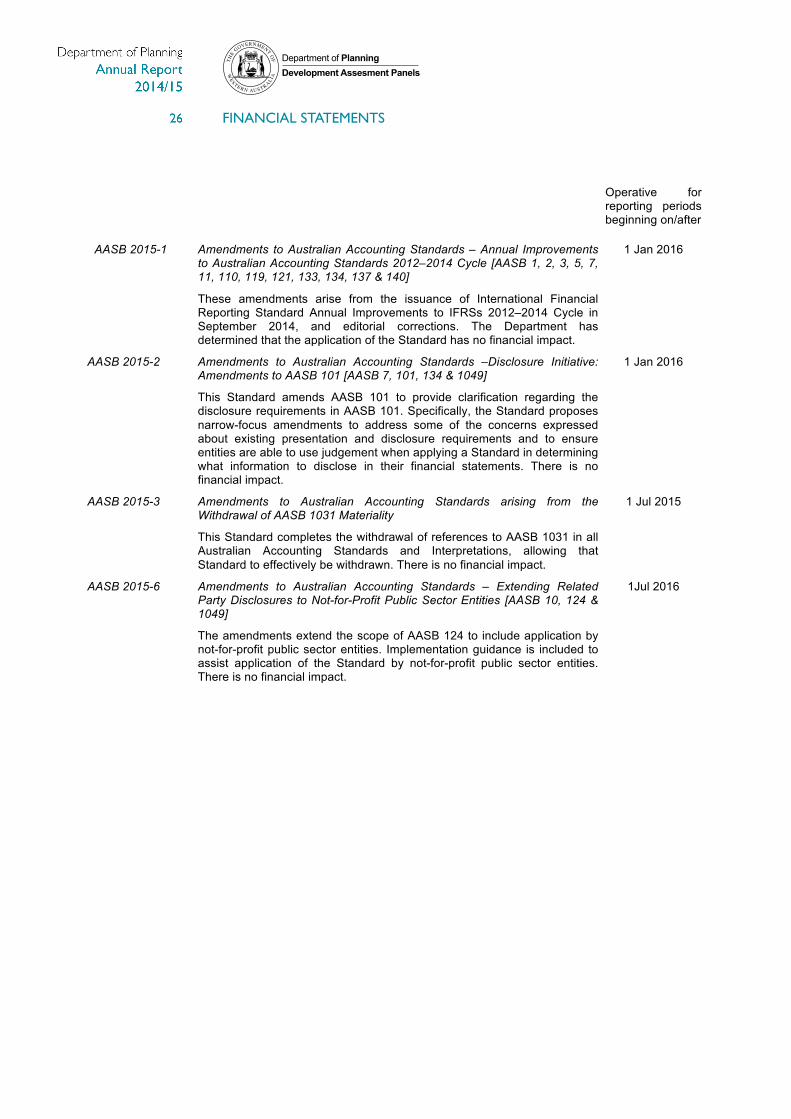
AASB 2015-1 Amendments to Australian Accounting Standards – Annual Improvements to Australian Accounting Standards 2012–2014 Cycle [AASB 1, 2, 3, 5, 7, 11, 110, 119, 121, 133, 134, 137 & 140]
These amendments arise from the issuance of International Financial Reporting Standard Annual Improvements to IFRSs 2012–2014 Cycle in September 2014, and editorial corrections. The Department has determined that the application of the Standard has no financial impact.
1 Jan 2016
AASB 2015-2 Amendments to Australian Accounting Standards –Disclosure Initiative: Amendments to AASB 101 [AASB 7, 101, 134 & 1049]
This Standard amends AASB 101 to provide clarification regarding the disclosure requirements in AASB 101. Specifically, the Standard proposes narrow-focus amendments to address some of the concerns expressed about existing presentation and disclosure requirements and to ensure entities are able to use judgement when applying a Standard in determining what information to disclose in their financial statements. There is no financial impact.
1 Jan 2016
AASB 2015-3 Amendments to Australian Accounting Standards arising from the Withdrawal of AASB 1031 Materiality
This Standard completes the withdrawal of references to AASB 1031 in all Australian Accounting Standards and Interpretations, allowing that Standard to effectively be withdrawn. There is no financial impact.
1 Jul 2015
AASB 2015-6 Amendments to Australian Accounting Standards – Extending Related Party Disclosures to Not-for-Profit Public Sector Entities [AASB 10, 124 & 1049]
The amendments extend the scope of AASB 124 to include application by not-for-profit public sector entities. Implementation guidance is included to assist application of the Standard by not-for-profit public sector entities. There is no financial impact.
1Jul 2016
Department of PlanningDevelopment Assesment Panels
FINANCIAL STATEMENTS
24
2015
2014
$ 000
$ 000
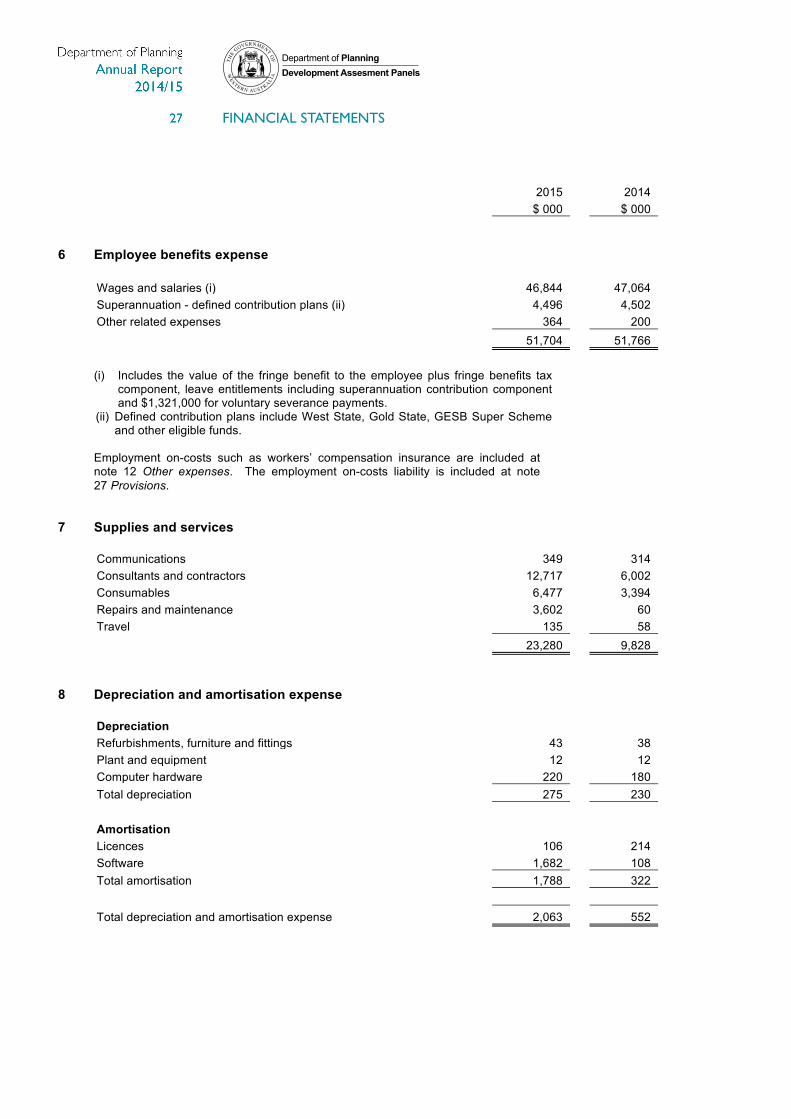
6 Employee benefits expense
Wages and salaries (i) 46,844
47,064
Superannuation - defined contribution plans (ii) 4,496
4,502
Other related expenses 364
200
51,704
51,766
(i) Includes the value of the fringe benefit to the employee plus fringe benefits tax component, leave entitlements including superannuation contribution component and $1,321,000 for voluntary severance payments.
(ii) Defined contribution plans include West State, Gold State, GESB Super Scheme and other eligible funds.
Employment on-costs such as workers’ compensation insurance are included at note 12 Other expenses. The employment on-costs liability is included at note 27 Provisions.
7 Supplies and services
Communications 349
314
Consultants and contractors 12,717
6,002
Consumables 6,477
3,394
Repairs and maintenance 3,602
60
Travel 135
58
23,280
9,828
8 Depreciation and amortisation expense
Depreciation
Refurbishments, furniture and fittings 43
38
Plant and equipment 12
12
Computer hardware 220
180
Total depreciation 275
230
Amortisation
Licences 106
214
Software 1,682
108
Total amortisation 1,788
322
Total depreciation and amortisation expense 2,063
552
Department of PlanningDevelopment Assesment Panels

FINANCIAL STATEMENTS
25
2015
2014
$ 000
$ 000
9 Accommodation expenses
Lease rentals 4,628
5,658
Cleaning 301
144
4,929
5,802
10 Grants and subsidies expense
Area Assistance Grant 79
-
Bushfire Risk Assessor Training and Accreditation Subsidy 126
-
Coastal Zone Management Program 744
-
Great Southern Planning and Infrastructure Framework -
50
Mandurah Central Revitalisation 383
54
Northern Towns Development Fund 3,271
1,775
Rockingham Kwinana Development Office -
360
Other 93
-
4,696
2,239
11 Loss on disposal of non-current assets
Proceeds from disposal of non-current assets
Plant and equipment -
-
Carrying amount of non-current assets disposed
Plant and equipment (7)
-
Net gain/(loss) (7)
-
12 Other expenses
Employment on-costs (i) 164
376
Audit cost 123
130
Donations and sponsorships 116
14
Doubtful debts expense 3
-
Board and sitting fees 639
313
Forfeit of previous years revenue 122
-
Other 119
28
1,286
861
(i) Includes worker’s compensation insurance and other employment on-costs.
The on-costs liability associated with the recognition of annual and long service leave liability is included at note 27 Provisions. Superannuation contributions accrued as part of the provision for leave are employee benefits and are not included in employment on-costs. Includes on-costs charged on provision of Indian Ocean Territories Plan.
Department of PlanningDevelopment Assesment Panels

FINANCIAL STATEMENTS
26
2015
2014
$ 000
$ 000
13 User charges and fees
Development Assessment Panel fees 1,446
1,152
Other 3
12
1,449
1,164
14 Grants and subsidies revenue
Commonwealth grants 94
91
General government grants 774
1,522
Other -
51
868
1,664
15 WAPC service delivery agreement revenue
WAPC fee transfer revenue 15,506
15,224
WAPC service delivery agreement 28,975
11,257
44,481
26,481
16 Other revenues
Recoups of operating expenses 12
184
Other 1
1
13
185
17 Income from State Government
Appropriation received during the year
Service appropriations 46,070
38,992
Service appropriations fund the net cost of services delivered. Appropriation revenue comprises a cash component and a receivable (asset). The receivable (holding account) comprises the depreciation expense for the year and any agreed increase in leave liabilities during the year.
Department of PlanningDevelopment Assesment Panels

FINANCIAL STATEMENTS
27
2015
2014
$ 000
$ 000
17 Income from State Government (continued)
Services received free of charge from other State government
agencies during the period:
Commissioner of Main Roads 23
1
Department of Finance 1,248
1,585
Landgate 773
216
State Solicitor's Office 780
154
Department of Water 2
126
2,826
2,082
Assets or services received free of charge or for nominal cost are recognised as revenue at fair value of the assets and/or services that can be reliably measured and which would have been purchased if they were not donated. Contributions of assets or services in the nature of contributions by owners are recognised directly to equity.
Royalty for Regions Fund
Regional Workers Incentives - District Allowance 25
34
Funding for Northern Planning Program Fund 5,418
2,283
5,443
2,317
This is the sub-fund within the over-arching ‘Royalties for Regions Fund’. The recurrent funds are committed to projects and programs in WA regional areas.
18 Cash and cash equivalents
Cash and cash equivalents 16,390
5,537
These cash and cash equivalents include $4,465,000 (2013 $4,036,000) capital contribution and funds available to meet capital expenditure commitments.
19 Restricted cash and cash equivalents
Current
Royalties for Regions (i) 1,664
357
Accrued salaries suspense account (ii) 1,882
-
3,546
357
Non-current
Accrued salaries suspense account (ii) -
1,637
(i) Unspent funds committed to projects in WA regional areas. (ii) Funds held in the suspense account used for the purpose of meeting the 27th
pay in a financial year that occurs every 11 years.
Department of PlanningDevelopment Assesment Panels
FINANCIAL STATEMENTS
28
2015
2014
$ 000
$ 000
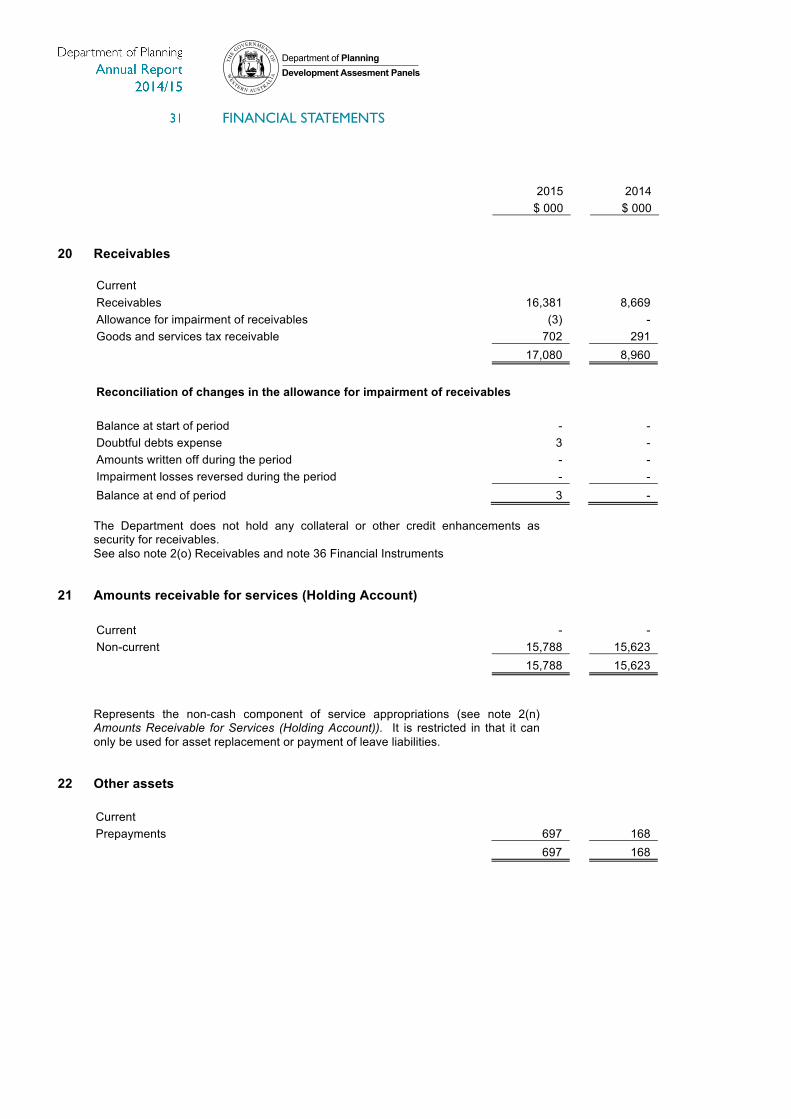
20 Receivables
Current
Receivables 16,381
8,669
Allowance for impairment of receivables (3)
-
Goods and services tax receivable 702
291
17,080
8,960
Reconciliation of changes in the allowance for impairment of receivables
Balance at start of period -
-
Doubtful debts expense 3
-
Amounts written off during the period -
-
Impairment losses reversed during the period -
-
Balance at end of period 3
-
The Department does not hold any collateral or other credit enhancements as security for receivables. See also note 2(o) Receivables and note 36 Financial Instruments
21 Amounts receivable for services (Holding Account)
Current -
-
Non-current 15,788
15,623
15,788
15,623
Represents the non-cash component of service appropriations (see note 2(n) Amounts Receivable for Services (Holding Account)). It is restricted in that it can only be used for asset replacement or payment of leave liabilities.
22 Other assets
Current
Prepayments 697
168
697
168
Department of PlanningDevelopment Assesment Panels

FINANCIAL STATEMENTS
29
23 Plant and equipment
2015
Cost Accum. Carrying
value depr. amount
$ 000 $ 000 $ 000
At cost: Refurbishments, furniture and fittings 433 (107) 326
Office equipment 120 (46) 74 Computer hardware 1,206 (524) 682 Works in progress 62 - 62
1,821 (677) 1,144
2014
Cost Accum. Carrying
value depr. amount
$ 000 $ 000 $ 000
At cost: Refurbishments, furniture and fittings 433 (64) 369
Office equipment 57 (33) 24 Computer hardware 1,276 (490) 786 Works in progress 273 - 273
2,039 (587) 1,452
30
R
econciliations of the carrying amounts of plant and equipm
ent at the beginning and end of the financial year are set out below.
Carrying
amount at
the start of the period
Additions
Disposals
Transferred to/from
construction in progress
Impairm
ent losses
D
epreciation Transfers /
adjustments
Carrying
amount at
the end of the period
$ 000
$ 000 $ 000
$ 000 $ 000
$ 000 $ 000
$ 000 2015
Refurbishm
ents, furniture and fittings 369
- -
- -
(43) -
326 O
ffice equipment
24 62
- -
- (12)
- 74
Com
puter hardware
786 123
(7) -
- (220)
- 682
Works in progress
273 62
- -
- -
(273) 62
Total 1,452
247 (7)
- -
(275) (273)
1,144
Carrying
amount at
the start of the period
Additions
Disposals
Transferred to/from
construction in progress
Impairm
ent losses
D
epreciation Transfers /
adjustments
Carrying
amount at
the end of the period
$ 000
$ 000 $ 000
$ 000 $ 000
$ 000 $ 000
$ 000 2014
Refurbishm
ents, furniture and fittings 232
- -
175 -
(38) -
369 O
ffice equipment
36 -
- -
- (12)
- 24
Com
puter hardware
414 441
- 111
- (180)
- 786
Works in progress
484 75
- (286)
- -
- 273
Total 1,166
516 -
- -
(230) -
1,452
Department of PlanningDevelopment Assesment Panels

FIN
AN
CIA
L ST
ATEM
ENT
S
30
Reconciliations of the carrying amounts of plant and equipment at the beginning and end of the financial year are set out below.
Carrying amount at
the start of the period
Additions Disposals
Transferred to/from
construction in progress
Impairment losses
Depreciation
Transfers / adjustments
Carrying amount at the end of the period
$ 000 $ 000 $ 000 $ 000 $ 000 $ 000 $ 000 $ 000
2015 Refurbishments, furniture and fittings 369 - - - - (43) - 326
Office equipment 24 62 - - - (12) - 74 Computer hardware 786 123 (7) - - (220) - 682 Works in progress 273 62 - - - - (273) 62 Total 1,452 247 (7) - - (275) (273) 1,144
Carrying amount at
the start of the period
Additions Disposals
Transferred to/from
construction in progress
Impairment losses
Depreciation
Transfers / adjustments
Carrying amount at the end of the period
$ 000 $ 000 $ 000 $ 000 $ 000 $ 000 $ 000 $ 000
2014 Refurbishments, furniture and fittings 232 - - 175 - (38) - 369
Office equipment 36 - - - - (12) - 24 Computer hardware 414 441 - 111 - (180) - 786 Works in progress 484 75 - (286) - - - 273 Total 1,166 516 - - - (230) - 1,452
Dep
artm
ent o
f Pla
nnin
gDe
velo
pmen
t Ass
esm
ent P
anel
s
FINANCIAL STATEMENTS
31
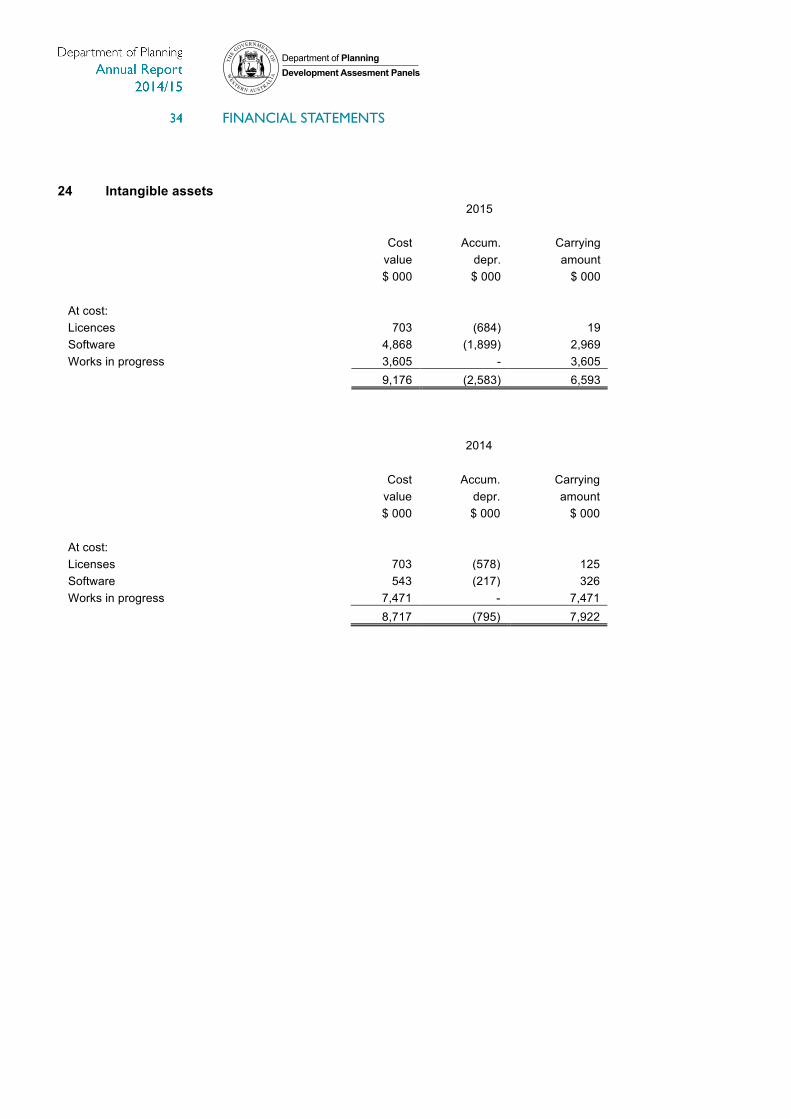
24 Intangible assets
2015
Cost Accum. Carrying
value depr. amount
$ 000 $ 000 $ 000
At cost: Licences 703 (684) 19
Software 4,868 (1,899) 2,969 Works in progress 3,605 - 3,605
9,176 (2,583) 6,593
2014
Cost Accum. Carrying
value depr. amount
$ 000 $ 000 $ 000
At cost: Licenses 703 (578) 125
Software 543 (217) 326 Works in progress 7,471 - 7,471
8,717 (795) 7,922
Department of PlanningDevelopment Assesment Panels

FIN
AN
CIA
L ST
ATEM
ENT
S
32
Reconciliations of the carrying amount of intangible assets at the beginning and end of the financial year are set out below.
Carrying amount at
the start of the period
Additions Disposals
Transferred to/from
construction in progress
Impairment losses
Depreciation
Transfers / adjustments
Carrying amount at the end of the period
$ 000 $ 000 $ 000 $ 000 $ 000 $ 000 $ 000 $ 000
2015 Licences 125 - - - - (106) - 19
Software 326 - - 4,325 - (1,682) - 2,969 Works in progress 7,471 1,407 - (4,325) - - (948) 3,605 Total 7,922 1,407 - - - (1,788) (948) 6,593
Carrying amount at
the start of the period
Additions Disposals
Transferred to/from
construction in progress
Impairment losses Depreciation Transfers /
adjustments
Carrying amount at the end of the period
$ 000 $ 000 $ 000 $ 000 $ 000 $ 000 $ 000 $ 000
2014 Licences 339 - - - - (214) - 125
Software 434 - - - - (108) - 326 Works in progress 3,551 3,920 - - - - - 7,471 Total 4,324 3,920 - - - (322) - 7,922
Dep
artm
ent o
f Pla
nnin
gDe
velo
pmen
t Ass
esm
ent P
anel
s
FINANCIAL STATEMENTS
33
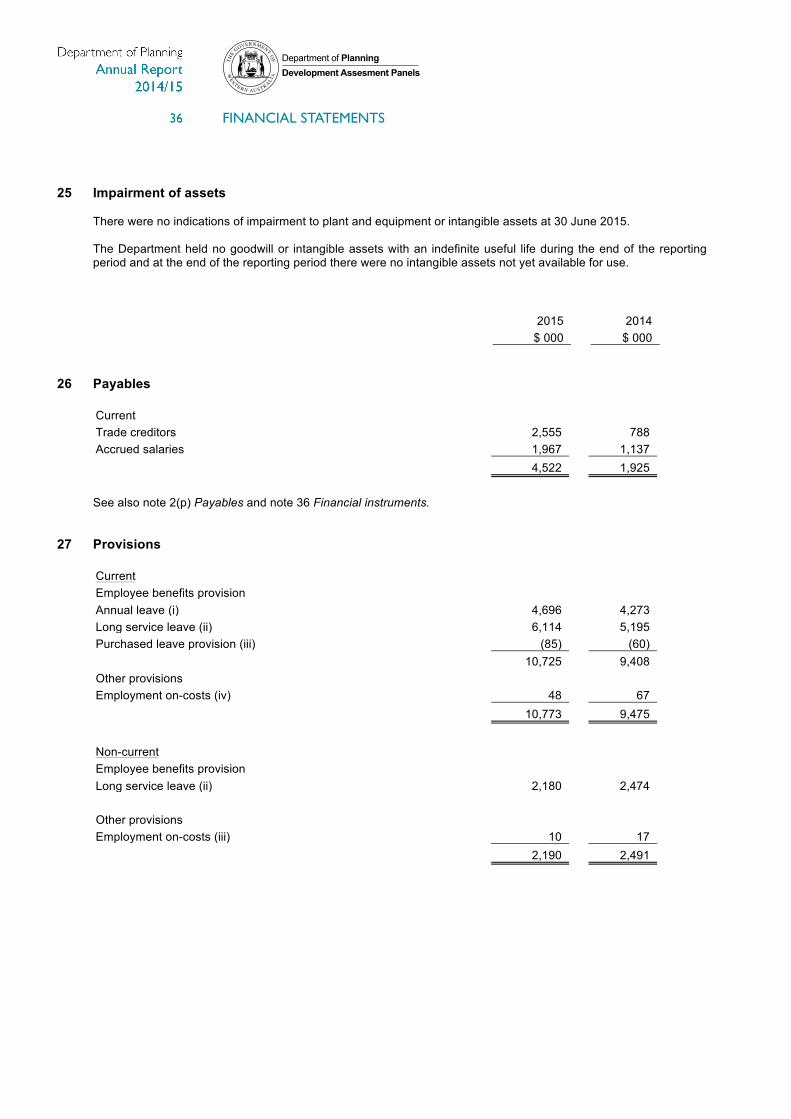
25 Impairment of assets
There were no indications of impairment to plant and equipment or intangible assets at 30 June 2015. The Department held no goodwill or intangible assets with an indefinite useful life during the end of the reporting period and at the end of the reporting period there were no intangible assets not yet available for use.
2015
2014
$ 000
$ 000
26 Payables
Current
Trade creditors 2,555
788
Accrued salaries 1,967
1,137
4,522
1,925
See also note 2(p) Payables and note 36 Financial instruments. 27 Provisions
Current
Employee benefits provision
Annual leave (i) 4,696
4,273
Long service leave (ii) 6,114
5,195
Purchased leave provision (iii) (85)
(60)
10,725
9,408
Other provisions
Employment on-costs (iv) 48
67
10,773
9,475
Non-current
Employee benefits provision
Long service leave (ii) 2,180
2,474
Other provisions
Employment on-costs (iii) 10
17
2,190
2,491
Department of PlanningDevelopment Assesment Panels
FINANCIAL STATEMENTS
34
2015
2014
$ 000
$ 000
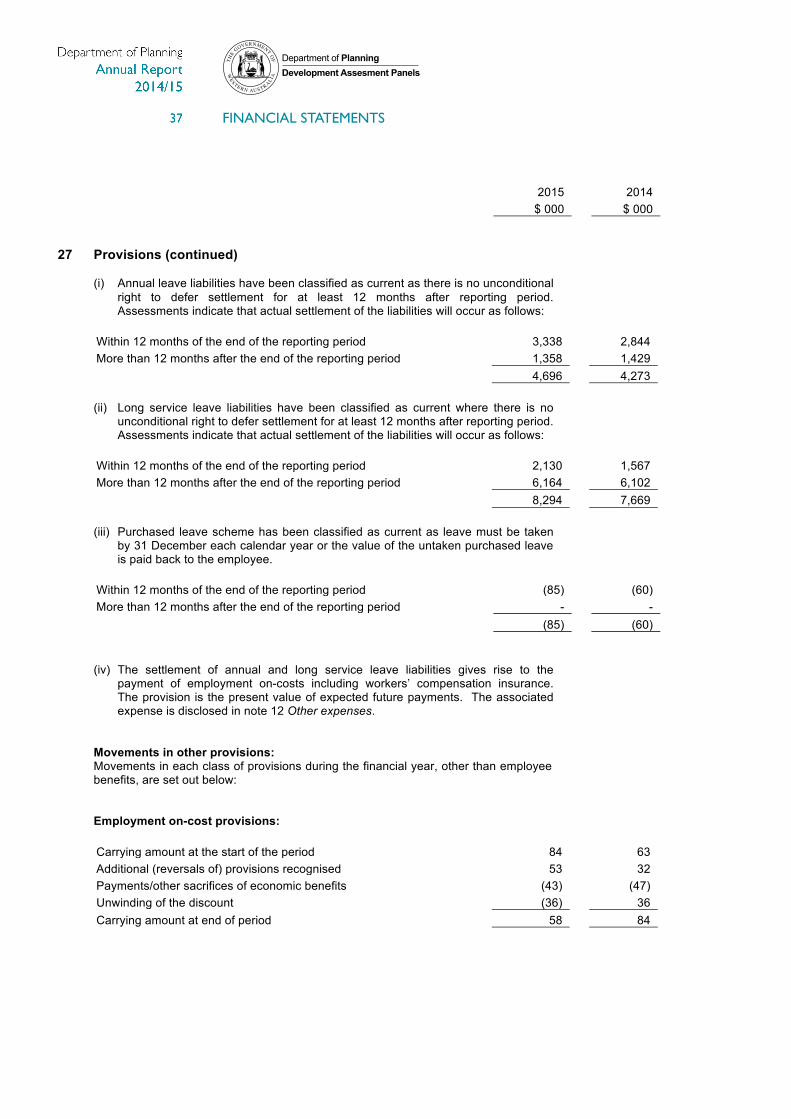
27 Provisions (continued)
(i) Annual leave liabilities have been classified as current as there is no unconditional right to defer settlement for at least 12 months after reporting period. Assessments indicate that actual settlement of the liabilities will occur as follows:
Within 12 months of the end of the reporting period 3,338
2,844
More than 12 months after the end of the reporting period 1,358
1,429
4,696
4,273
(ii) Long service leave liabilities have been classified as current where there is no unconditional right to defer settlement for at least 12 months after reporting period. Assessments indicate that actual settlement of the liabilities will occur as follows:
Within 12 months of the end of the reporting period 2,130
1,567
More than 12 months after the end of the reporting period 6,164
6,102
8,294
7,669
(iii) Purchased leave scheme has been classified as current as leave must be taken by 31 December each calendar year or the value of the untaken purchased leave is paid back to the employee.
Within 12 months of the end of the reporting period (85)
(60)
More than 12 months after the end of the reporting period -
-
(85)
(60)
(iv) The settlement of annual and long service leave liabilities gives rise to the
payment of employment on-costs including workers’ compensation insurance. The provision is the present value of expected future payments. The associated expense is disclosed in note 12 Other expenses.
Movements in other provisions:
Movements in each class of provisions during the financial year, other than employee benefits, are set out below: Employment on-cost provisions:
Carrying amount at the start of the period 84
63
Additional (reversals of) provisions recognised 53
32
Payments/other sacrifices of economic benefits (43)
(47)
Unwinding of the discount (36)
36
Carrying amount at end of period 58
84
Department of PlanningDevelopment Assesment Panels
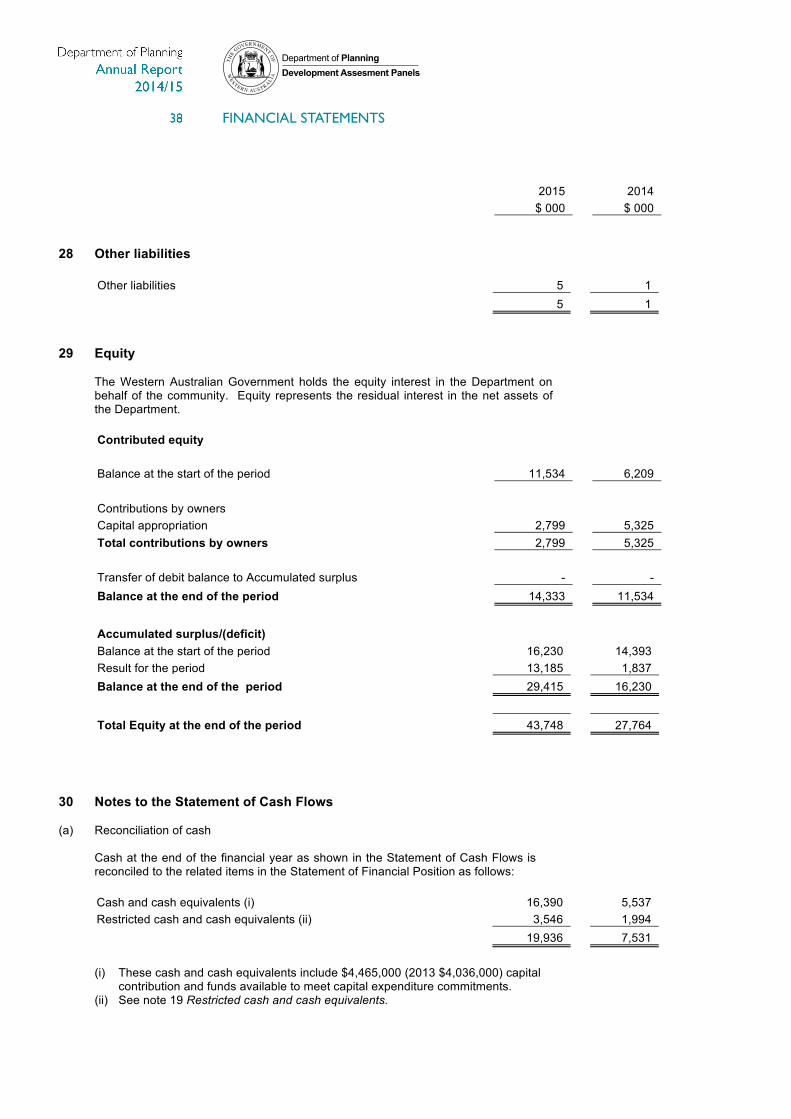
FINANCIAL STATEMENTS
35
2015
2014
$ 000
$ 000
28 Other liabilities
Other liabilities 5
1
5
1
29 Equity
The Western Australian Government holds the equity interest in the Department on behalf of the community. Equity represents the residual interest in the net assets of the Department.
Contributed equity
Balance at the start of the period 11,534
6,209
Contributions by owners
Capital appropriation 2,799
5,325
Total contributions by owners 2,799
5,325
Transfer of debit balance to Accumulated surplus -
-
Balance at the end of the period 14,333
11,534
Accumulated surplus/(deficit)
Balance at the start of the period 16,230
14,393
Result for the period 13,185
1,837
Balance at the end of the period 29,415
16,230
Total Equity at the end of the period 43,748
27,764
30 Notes to the Statement of Cash Flows (a) Reconciliation of cash
Cash at the end of the financial year as shown in the Statement of Cash Flows is reconciled to the related items in the Statement of Financial Position as follows:
Cash and cash equivalents (i) 16,390
5,537
Restricted cash and cash equivalents (ii) 3,546
1,994
19,936
7,531
(i) These cash and cash equivalents include $4,465,000 (2013 $4,036,000) capital contribution and funds available to meet capital expenditure commitments.
(ii) See note 19 Restricted cash and cash equivalents.
Department of PlanningDevelopment Assesment Panels

FINANCIAL STATEMENTS
36
2015
2014
$ 000
$ 000
30 Notes to the Statement of Cash Flows (continued) (b) Reconciliation of net cost of services to net cash flows provided by/(used in)
operating activities
Net cost of services (41,154)
(41,554)
Non cash items:
Depreciation and amortisation expense 2,063
552
Doubtful debts expense 3
-
Net (gain)/loss on disposal of non-current assets 7
-
Forfeit of previous years revenue 122
-
Resources received free of charge 2,826
2,082
Expenses previously held in construction in progress 1,222
-
(Increase)/decrease in assets
Current receivables (iii) (7,713)
(1,764)
Other current assets (529)
230
Increase/(decrease) in liabilities
Current payables 2,596
(246)
Current provisions 1,298
(1,268)
Other current liabilities 4
(1,941)
Non-current provisions (300)
(543)
Net GST receipts/(payments) (377)
(24)
Change in GST in receivables/payables (i) 465
362
Net cash used in operating activities (ii) (39,467)
(44,114)
(i) This is the net GST paid/received, i.e. cash transactions. (ii) This reverses out the GST in receivables and payables. (iii) Note that the Australian Taxation office (ATO) receivables/payable in respect of GST and the
receivable/payable in respect of sale/purchase of non-current assets are not included in these items as they do not form part of the reconciling items.
Department of PlanningDevelopment Assesment Panels
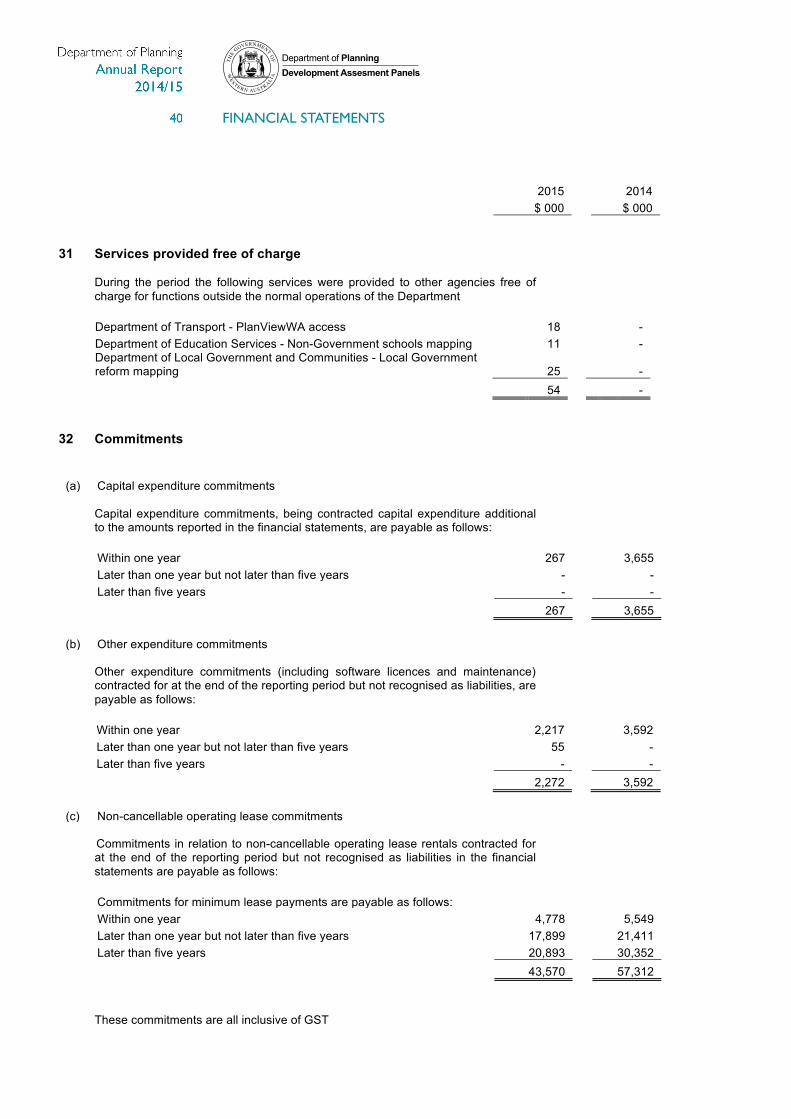
FINANCIAL STATEMENTS
37
2015
2014
$ 000
$ 000
31 Services provided free of charge
During the period the following services were provided to other agencies free of charge for functions outside the normal operations of the Department
Department of Transport - PlanViewWA access 18
-
Department of Education Services - Non-Government schools mapping 11
-
Department of Local Government and Communities - Local Government reform mapping 25
-
54
-
32 Commitments
(a) Capital expenditure commitments
Capital expenditure commitments, being contracted capital expenditure additional to the amounts reported in the financial statements, are payable as follows:
Within one year 267
3,655
Later than one year but not later than five years -
-
Later than five years -
-
267
3,655
(b) Other expenditure commitments
Other expenditure commitments (including software licences and maintenance) contracted for at the end of the reporting period but not recognised as liabilities, are payable as follows:
Within one year 2,217
3,592
Later than one year but not later than five years 55
-
Later than five years -
-
2,272
3,592
(c) Non-cancellable operating lease commitments
Commitments in relation to non-cancellable operating lease rentals contracted for at the end of the reporting period but not recognised as liabilities in the financial statements are payable as follows:
Commitments for minimum lease payments are payable as follows:
Within one year 4,778
5,549
Later than one year but not later than five years 17,899
21,411
Later than five years 20,893
30,352
43,570
57,312
These commitments are all inclusive of GST
Department of PlanningDevelopment Assesment Panels
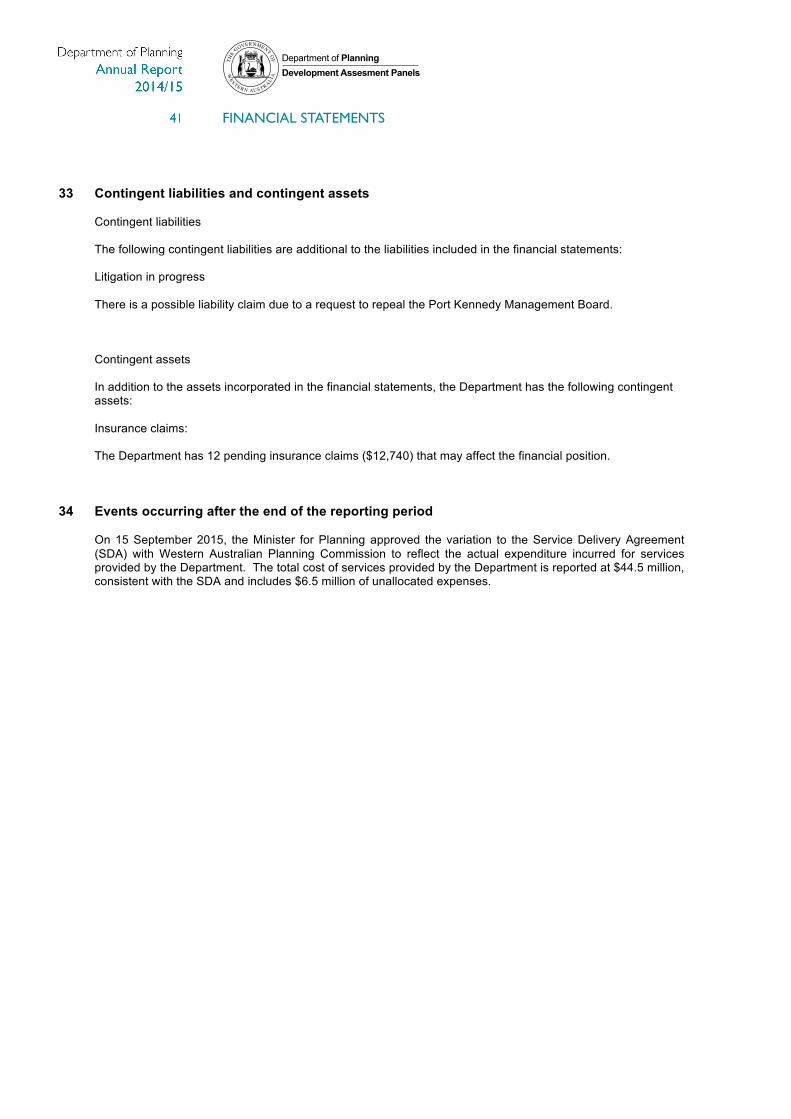
FINANCIAL STATEMENTS
38
33 Contingent liabilities and contingent assets
Contingent liabilities The following contingent liabilities are additional to the liabilities included in the financial statements: Litigation in progress There is a possible liability claim due to a request to repeal the Port Kennedy Management Board. Contingent assets In addition to the assets incorporated in the financial statements, the Department has the following contingent assets: Insurance claims: The Department has 12 pending insurance claims ($12,740) that may affect the financial position.
34 Events occurring after the end of the reporting period
On 15 September 2015, the Minister for Planning approved the variation to the Service Delivery Agreement (SDA) with Western Australian Planning Commission to reflect the actual expenditure incurred for services provided by the Department. The total cost of services provided by the Department is reported at $44.5 million, consistent with the SDA and includes $6.5 million of unallocated expenses.
Department of PlanningDevelopment Assesment Panels

FINANCIAL STATEMENTS
39
35 Explanatory Statement
Major variances between estimates (original budget) and actual results for 2015, and between the actual results for 2014 and 2015 are shown below. Major variances are considered to be those greater than 10% or $10 million.
Note
Original Budget Actual Actual
Variance between estimate
and actual
Variance between
actual results
from 2015 and 2014
2015 2015 2014
$ 000 $ 000 $ 000 $ 000 $ 000
Statement of Comprehensive Income
COST OF SERVICES Expenses Employee benefits expense
51,268 51,704 51,766 436 (62) Supplies and services A 23,947 23,280 9,828 (667) 13,452 Depreciation and amortisation expense 1 B 165 2,063 552 1,898 1,511 Accommodation expenses C 5,130 4,929 5,802 (201) (873) Grants and subsidies expense 2 D 6,635 4,696 2,239 (1,939) 2,457 Loss on disposal of non-current assets
- 7 - 7 7
Other expenses 3 E 4,810 1,286 861 (3,524) 425 Total cost of services
91,955 87,965 71,048 (3,990) 16,917
Income Revenue User charges and fees 4 F 1,701 1,449 1,164 (252) 285
Grants and subsidies revenue 5 G 544 868 1,664 324 (796) WAPC service delivery agreement revenue H 43,163 44,481 26,481 1,318 18,000 Other revenues I 0 13 185 13 (172) Total revenue
45,408 46,811 29,494 1,403 17,317
Total income other than income from State Government 45,408 46,811 29,494 1,403 17,317
NET COST OF SERVICES
46,547 41,154 41,554 (5,393) (400)
INCOME FROM STATE GOVERNMENT Service appropriation J 45,244 46,070 38,992 826 7,078
Services received free of charge 6 K 1,794 2,826 2,082 1,032 744 Royalties for Regions Fund L 5,531 5,443 2,317 (88) 3,126 Total income from State Government
52,569 54,339 43,391 1,770 10,948
SURPLUS/(DEFICIT) FOR THE PERIOD
6,022 13,185 1,837 7,163 11,348
TOTAL COMPREHENSIVE INCOME FOR THE PERIOD 6,022 13,185 1,837 7,163 11,348
Department of PlanningDevelopment Assesment Panels

FINANCIAL STATEMENTS
40
35 Explanatory Statement (continued)
Note
Original Budget Actual Actual
Variance between estimate
and actual
Variance between
actual results
from 2015 and 2014
2015 2015 2014
$ 000 $ 000 $ 000 $ 000 $ 000 Statement of Financial Position
ASSETS
Current Assets Cash and cash equivalents 7 M 8,541 16,390 5,537 7,849 10,853
Restricted cash and cash equivalents 8 N 1,987 3,546 357 1,559 3,189 Receivables 9 O 7,311 17,080 8,960 9,769 8,120 Other assets 10 P 378 697 168 319 529 Total Current Assets
18,217 37,713 15,022 19,496 22,691
Non-Current Assets
Restricted cash and cash equivalents Q - - 1,637 - (1,637) Amounts receivable for services
15,788 15,788 15,623 - 165
Plant and equipment 11 R 14,615 1,144 1,452 (13,471) (308) Intangible assets 12 S 1,076 6,593 7,922 5,517 (1,329) Other
4 - - (4) -
Total Non-Current Assets
31,479 23,525 26,634 (7,954) (3,109)
TOTAL ASSETS
49,696 61,238 41,656 11,542 19,582
LIABILITIES Current Liabilities Payables T 4,730 4,522 1,925 (208) 2,597
Provisions U 10,755 10,773 9,475 18 1,298 Other liabilities
49 5 1 (44) 4
Total Current Liabilities
15,534 15,300 11,401 (234) 3,899
Non-Current Liabilities Provisions 13 V 3,020 2,190 2,491 (830) (301)
Other
14 - - (14) - Total Non-Current Liabilities
3,034 2,190 2,491 (844) (301)
TOTAL LIABILITIES
18,568 17,490 13,892 (1,078) 3,598
NET ASSETS
31,128 43,748 27,764 12,620 15,984
EQUITY Contributed equity 14 W 16,789 14,333 11,534 (2,456) 2,799
Accumulated surplus 15 X 14,339 29,415 16,230 15,076 13,185 TOTAL EQUITY
31,128 43,748 27,764 12,620 15,984
Department of PlanningDevelopment Assesment Panels

FINANCIAL STATEMENTS
41
35 Explanatory Statement (continued)
Note
Original Budget Actual Actual
Variance between estimate
and actual
Variance between
actual results
from 2015
and 2014
2015 2015 2014
$ 000 $ 000 $ 000 $ 000 $ 000 Statement of Cash Flows
CASH FLOWS FROM STATE GOVERNMENT
Service appropriation Y 45,079 45,905 38,778 826 7,127 Capital appropriations Z 2,799 2,799 5,325 0 (2,526) Royalty for Regions Fund AA 5,531 5,443 2,331 (88) 3,112 Net cash provided by State Government
53,409 54,147 46,434 738 7,713
Utilised as follows: CASH FLOWS FROM OPERATING ACTIVITIES Payments Employee benefits
(50,812) (49,857) (52,983) 955 3,126 Supplies and services 16 BB (22,103) (19,361) (7,994) 2,742 (11,367) Accommodation CC (5,118) (4,907) (5,855) 211 948 Grants and subsidies 17 DD (6,635) (3,578) (2,228) 3,057 (1,350) GST payments on purchases 18 EE (4,340) (2,715) (2,128) 1,625 (587) Other payments 19 FF (4,810) (736) (1,814) 4,074 1,078
Receipts
Sale of goods and services 20 GG 1,701 1,450 1,163 (251) 287
Grants and subsidies 21 HH 544 979 1,430 435 (451) GST receipts on sales II 50 52 416 2 (364) GST receipts from taxation authority 22 JJ 4,290 2,286 1,688 (2,004) 598 WAPC service level agreement receipts 23 KK 43,163 36,905 23,640 (6,258) 13,265 Other receipts LL - 15 551 15 (536) Net cash used in operating activities
(44,070) (39,467) (44,114) 4,603 4,647
CASH FLOWS FROM INVESTING ACTIVITIES
Purchase of non-current physical assets 24
MM (2,799) (2,275) (4,693) 524 2,418 Net cash used in investing activities
(2,799) (2,275) (4,693) 524 2,418
CASH FLOWS FROM FINANCING ACTIVITIES Proceeds from borrowings
- - - - - Repayment of borrowings
- - - - -
Net cash provided by/(used in) financing activities - - - - -
Net increase/(decrease) in cash and cash equivalents 6,540 12,405 (2,373) 5,865 14,778 Cash and cash equivalents at the beginning of the period 3,988 7,531 9,904 3,543 (2,373) CASH AND CASH EQUIVALENTS AT THE END OF THE PERIOD 10,528 19,936 7,531 9,408 12,405
Department of PlanningDevelopment Assesment Panels
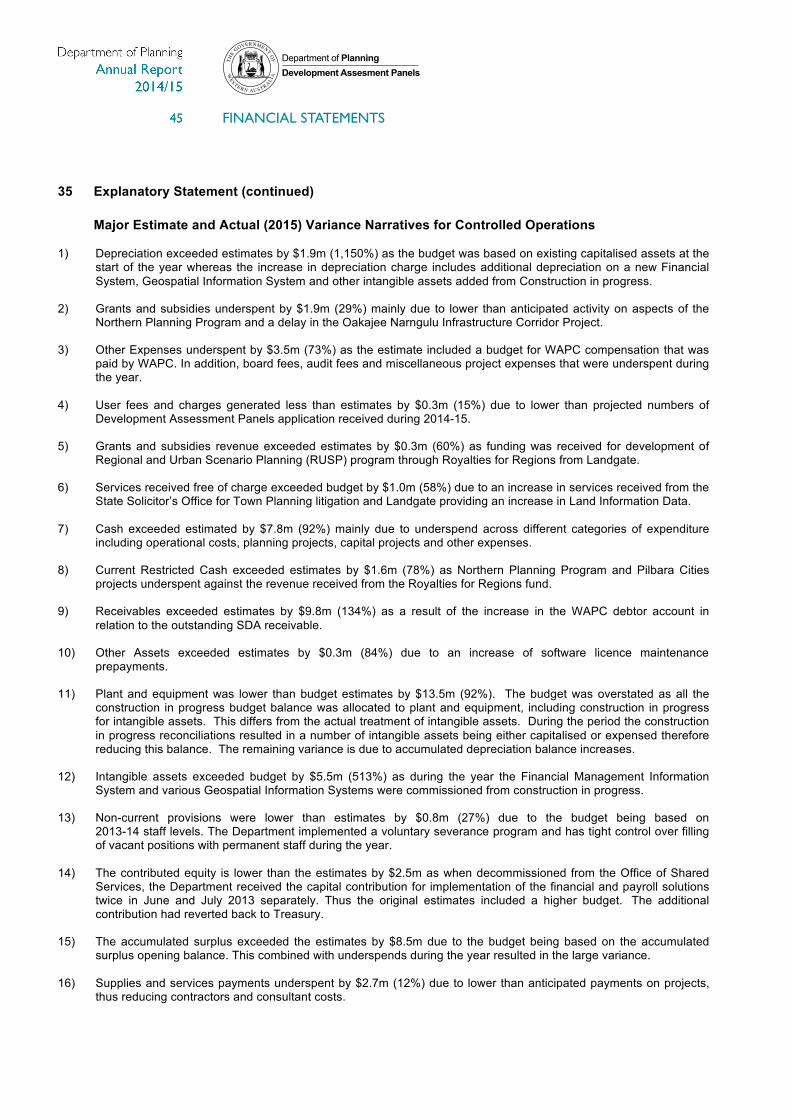
FINANCIAL STATEMENTS
42
35 Explanatory Statement (continued)
Major Estimate and Actual (2015) Variance Narratives for Controlled Operations
1) Depreciation exceeded estimates by $1.9m (1,150%) as the budget was based on existing capitalised assets at the start of the year whereas the increase in depreciation charge includes additional depreciation on a new Financial System, Geospatial Information System and other intangible assets added from Construction in progress.
2) Grants and subsidies underspent by $1.9m (29%) mainly due to lower than anticipated activity on aspects of the
Northern Planning Program and a delay in the Oakajee Narngulu Infrastructure Corridor Project. 3) Other Expenses underspent by $3.5m (73%) as the estimate included a budget for WAPC compensation that was
paid by WAPC. In addition, board fees, audit fees and miscellaneous project expenses that were underspent during the year.
4) User fees and charges generated less than estimates by $0.3m (15%) due to lower than projected numbers of
Development Assessment Panels application received during 2014-15. 5) Grants and subsidies revenue exceeded estimates by $0.3m (60%) as funding was received for development of
Regional and Urban Scenario Planning (RUSP) program through Royalties for Regions from Landgate. 6) Services received free of charge exceeded budget by $1.0m (58%) due to an increase in services received from the
State Solicitor’s Office for Town Planning litigation and Landgate providing an increase in Land Information Data. 7) Cash exceeded estimated by $7.8m (92%) mainly due to underspend across different categories of expenditure
including operational costs, planning projects, capital projects and other expenses. 8) Current Restricted Cash exceeded estimates by $1.6m (78%) as Northern Planning Program and Pilbara Cities
projects underspent against the revenue received from the Royalties for Regions fund. 9) Receivables exceeded estimates by $9.8m (134%) as a result of the increase in the WAPC debtor account in
relation to the outstanding SDA receivable. 10) Other Assets exceeded estimates by $0.3m (84%) due to an increase of software licence maintenance
prepayments. 11) Plant and equipment was lower than budget estimates by $13.5m (92%). The budget was overstated as all the
construction in progress budget balance was allocated to plant and equipment, including construction in progress for intangible assets. This differs from the actual treatment of intangible assets. During the period the construction in progress reconciliations resulted in a number of intangible assets being either capitalised or expensed therefore reducing this balance. The remaining variance is due to accumulated depreciation balance increases.
12) Intangible assets exceeded budget by $5.5m (513%) as during the year the Financial Management Information
System and various Geospatial Information Systems were commissioned from construction in progress. 13) Non-current provisions were lower than estimates by $0.8m (27%) due to the budget being based on
2013-14 staff levels. The Department implemented a voluntary severance program and has tight control over filling of vacant positions with permanent staff during the year.
14) The contributed equity is lower than the estimates by $2.5m as when decommissioned from the Office of Shared
Services, the Department received the capital contribution for implementation of the financial and payroll solutions twice in June and July 2013 separately. Thus the original estimates included a higher budget. The additional contribution had reverted back to Treasury.
15) The accumulated surplus exceeded the estimates by $8.5m due to the budget being based on the accumulated
surplus opening balance. This combined with underspends during the year resulted in the large variance. 16) Supplies and services payments underspent by $2.7m (12%) due to lower than anticipated payments on projects,
thus reducing contractors and consultant costs.
Department of PlanningDevelopment Assesment Panels

FINANCIAL STATEMENTS
43
35 Explanatory Statement (continued) 17) Grants and subsidies payment underspent by $3.1m (46%) due to lower than anticipated activity on aspects of the
Northern Planning Program and a delay in the Oakajee Narngulu Infrastructure Corridor Project. 18) GST payments on purchases underspent by $1.6m (37%) due to various underspending and timing differences. 19) Other payments underspent by $4.1m (85%) due to lower than anticipated expenditure on operations and projects
through the SDA on behalf of the WAPC. 20) Sale of goods and services (fees and charges revenue) trailed estimates by $0.3m (15%) mainly due to lower than
projected numbers of Development Assessment Panel applications received during 2014-15. 21) Grants and subsidies revenue exceeded estimates by $0.4m (80%) as additional funds were received for
development of RUSP program from Royalties for Regions from Landgate which were not originally budgeted for. 22) GST receipts from taxation authority trailed estimates by $2.0m (47%) due mainly to a reduction in revenue
received and timing differences. 23) Receipts from the SDA trailed estimates by $6.3m (14%) due to expenditure by the Department on behalf of the
WAPC being less that than budget. 24) Purchase of non-current physical assets underspent by $0.5m (19%) due to deferral of capital work plans and
underspend on related projects.
Major Actual (2015) and Actual (2014) Variance Narratives for Controlled Operations A) Supplies and services expenses increased by $13.5m (136%). $10.8m due to changes to the SDA whereby all
WAPC costs are paid by DoP. The WAPC costs are made up of $4.9m in Consultants and Contractors, $3.5m in Repairs and Maintenance and $2.3m in Consumables. The remaining increase is due to an increase of $0.7m in Services received free of charge expense, $0.8m increase in Software Licence Maintenance and an increase in Consultants and Contractors.
B) Depreciation expenses increased by $1.5m (273%) due to capitalisation of the new Financial Management
Information System and various Geospatial Information System intangible assets capitalised during the financial year.
C) Accommodation expenses decreased by $0.9m (15%) as a result of the reallocation of staff to reduce floor space. D) Grants and subsidies expenses increased by $2.5m (110%) mainly related to an increase of $1.5m in Royalty for
Regions Northern Towns Development Fund expenditure, $0.7m in Coastal Zone Management Program expenditure transferred from WAPC under the new SDA arrangements and $0.3m in Mandurah Central Revitalisation program.
E) Other expenses increased by $0.4m (49%) due to an increase of $0.3m in Board and Sitting Fees due to new SDA
arrangements with WAPC and $0.1m for the forfeit of previous year revenue. F) User charges and fees revenue increased by $0.3m (24%) due to an increase in the number of Development
Assessment Panel applications received in 2014-15 compared with 2013-14. G) Grants and subsidies revenue reduced by $0.8m (48%) as there was no funding received for the Oakajee Narngulu
Infrastructure Project funding in 2014-15, however in 2013-14, $0.4m was received. H) WAPC service level agreement revenue increased by $18.0m (68%) due to a change in the WAPC SDA
arrangements. I) Other revenue decreased by $0.2m (93%) due the conclusion of contributions to the Tourism Taskforce Review in
2013-14. J) Service Appropriation increased by $7.1m (18%) to provide for Department’s funding deficit in accommodation and
salaries and wages and the commencement of the Strategic Assessment Perth and Peel Region Project.
Department of PlanningDevelopment Assesment Panels

FINANCIAL STATEMENTS
44
35 Explanatory Statement (continued) K) Services received free of charge increased by $0.7m (36%) due the State Solicitor’s Office providing additional free
of charge services for Town planning litigation and Landgate providing an increase in Land Information Data. L) Royalties for Regions Fund increases by $3.1m (135%) due to the delay of 2013-14 funds not being received until
2014-15. M) Cash increased by $10.9m (196%) due to underspent cash from capital projects, Strategic Assessment Perth Peel
Region projects and other expenses. N) Current Restricted Cash increased by $3.2m (893%) due to underspend on Northern Planning Program funded by
Royalties for Regions and the transfer of the accrued salaries suspense account from non-current to current. O) Current Receivables increased by $8.1m (91%) due to an increase in WAPC SDA accounts receivable. P) Other Current Assets increased by $0.5m (314%) due software maintenance prepayments for the Finance System
and GIS assets. Q) Non-current Restricted Cash decreased by $1.6m (100%) relating to the transfer of the accrued salaries suspense
account to current as 27 pays will occur in 2015-16. R) Plant and equipment decreased by $0.3m (21%) due to expenditure previously capitalised as Construction in
Progress being expensed during the year. S) Intangible assets decreased by $1.3m (17%) due to amortisation during the financial year and previously capitalised
expenditure in Construction in Progress being expensed during the year. T) Current Payables increased by $2.6m (135%) due to an increase in trade creditors as a result of charges in the
WAPC SDA. U) Current Provisions increased by $1.3m (14%) due to a 2.5% salary increase during the year, the transfer of Long
Service leave liabilities from non-current provisions and an increase in annual leave and long service leave entitlement accruals.
V) Non-current provisions decreased by $0.3m (12%) due to the transfer of Long Service Leave from non-current
provisions to current provisions. W) Contributed equity increased by $2.8m (24%) due to the receipt of Capital Appropriations during 2014-15. X) The increase in accumulated surplus of $6.6m (41%) was due to an increase in the surplus for the period in the
Statement of Comprehensive Income. Y) Service Appropriation increased by $7.1m (18%) due to additional funding for Department’s funding deficit in
accommodation and salaries and commencement of the Strategic Assessment Perth and Peel Region Project. Z) Capital Appropriation decreased by $2.5m (142%) due to capital projects for Shared Service Rollout and RUSP
Location Information Strategy being carried over from 2013-14 to 2014-15. AA) Royalties for Regions Fund increased by $3.1m (133%) due to the delay in disbursement of 2013-14 funds until
2014-15. BB) Supplies and services payments increased by $11.4m (142%) due to the new WAPC SDA, where all WAPC costs
are to be included in the Department and majority of these costs are related to professional services. CC) Accommodation payments decreased by $0.9m (16%) as a result of reallocation of staff to reduce floor space to
prompt work place efficiency. DD) Grants and subsidies increase of $1.4m (61%) mainly related the transfer of the Coastal Zone Management
Program from WAPC under the new SDA and the Northern Towns Development Fund grants. EE) GST payments on purchases increased by $0.6 (28%) due to an increase in GST collected from the payment of
invoices.
Department of PlanningDevelopment Assesment Panels
FINANCIAL STATEMENTS
45
35 Explanatory Statement (continued) FF) Other payments decreased by $1.1m (59%) due to an offset of $0.2m recoup of the previous year’s WAPC Board
and Sitting Fees paid in 2014-15 and an extraordinary amount of $0.6m paid to WAPC in 2013-14 which inflated that year.
GG) Sale of goods and services increased by $0.3m (25%). This resulted from an increase in the number of
Development Assessment Panels applications received during 2014-15. HH) Grants and subsidies receipts decreased by $0.5m (32%) due to a one off grant received from the Department of
Commerce for the preparation of a structure plan to guide the development of Bentley Technology Precinct in 2013-14.
II) GST receipts on sales reduced $0.4m due to a reduction in GST received on revenue. JJ) GST receipts from the taxation authority increased by $0.6m due to an increase in the net of GST payments on
purchases and GST receipts KK) WAPC service level agreement receipts increased by $13.3m (56%) as a new Service Delivery Agreement with
WAPC commenced from 1 July 2014, whereby all WAPC expenses are paid through DOP resulting in higher receipts.
LL) Other receipts reduce by $0.5m (97%) due to a reduction in Other revenue recoups during 2014-15. MM) Purchase of non-current physical assets decreased by $2.4m (52%) due to the deferral of capital work plans and
underspend on these projects. 36 Financial instruments (a) Financial risk management objectives and policies
Financial instruments held by the Department are cash and cash equivalents, restricted cash and cash equivalents, receivables and payables. The Department has limited exposure to financial risks. The Department’s overall risk management program focuses on managing the risks identified below.
Credit risk
Credit risk arises when there is the possibility of the Department’s receivables defaulting on their contractual obligations resulting in financial loss to the Department. The maximum exposure to credit risk at the end of the reporting period in relation to each class of recognised financial assets is the gross carrying amount of those assets inclusive of any allowance for impairment, as shown in the table at note 36(c) Financial instruments disclosures and note 19 Receivables. Credit risk associated with the Department’s financial assets is minimal because the main receivable is the amounts receivable for services (holding account). For receivables other than government, the Department trades only with recognised, creditworthy third parties. The Department has policies in place to ensure that sales of products and services are made to customers with an appropriate credit history. In addition, receivable balances are monitored on an ongoing basis with the result that the Department’s exposure to bad debts is minimal. At the end of the reporting period there were no significant concentrations of credit risk.
Liquidity risk Liquidity risk arises when the Department is unable to meet its financial obligations as they fall due. The Department is exposed to liquidity risk through its trading in the normal course of business. The Department has appropriate procedures to manage cash flows including drawdowns of appropriations by monitoring forecast cash flows to ensure that sufficient funds are available to meet its commitments.
Department of PlanningDevelopment Assesment Panels
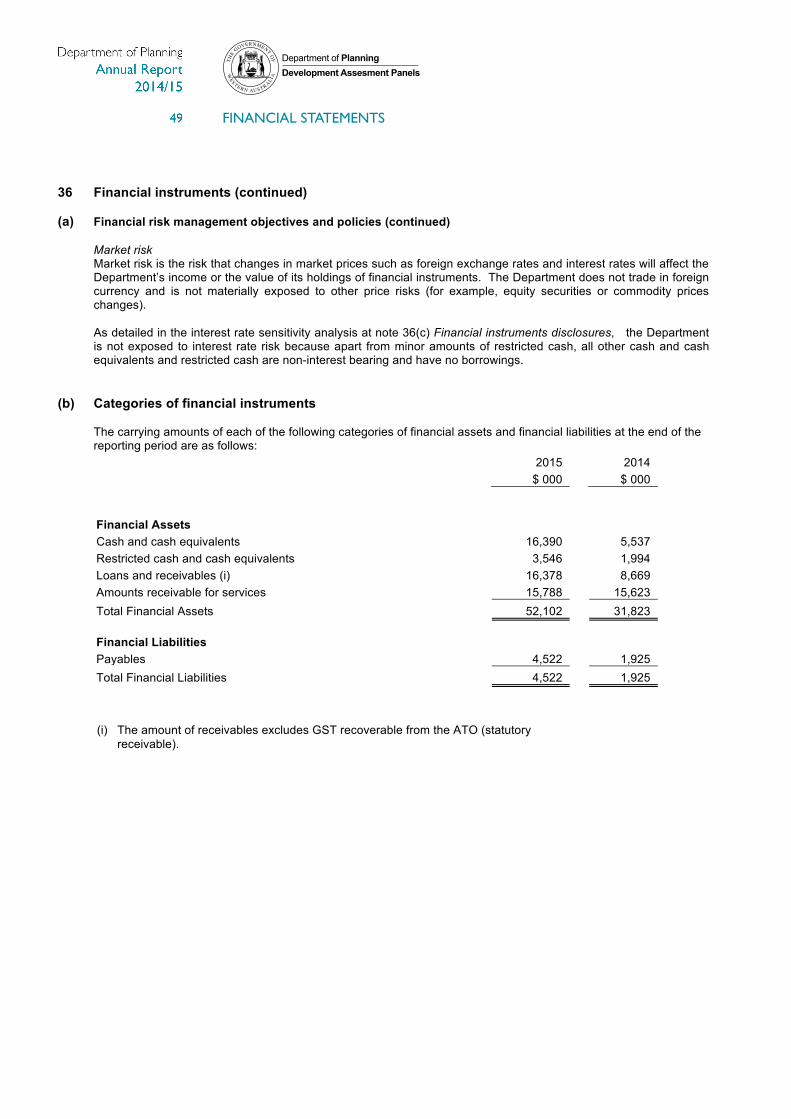
FINANCIAL STATEMENTS
46
36 Financial instruments (continued) (a) Financial risk management objectives and policies (continued) Market risk
Market risk is the risk that changes in market prices such as foreign exchange rates and interest rates will affect the Department’s income or the value of its holdings of financial instruments. The Department does not trade in foreign currency and is not materially exposed to other price risks (for example, equity securities or commodity prices changes). As detailed in the interest rate sensitivity analysis at note 36(c) Financial instruments disclosures, the Department is not exposed to interest rate risk because apart from minor amounts of restricted cash, all other cash and cash equivalents and restricted cash are non-interest bearing and have no borrowings.
(b) Categories of financial instruments The carrying amounts of each of the following categories of financial assets and financial liabilities at the end of the reporting period are as follows:
2015
2014
$ 000
$ 000
Financial Assets
Cash and cash equivalents 16,390
5,537
Restricted cash and cash equivalents 3,546
1,994
Loans and receivables (i) 16,378
8,669
Amounts receivable for services 15,788
15,623
Total Financial Assets 52,102
31,823
Financial Liabilities
Payables 4,522
1,925
Total Financial Liabilities 4,522
1,925
(i) The amount of receivables excludes GST recoverable from the ATO (statutory
receivable).
Department of PlanningDevelopment Assesment Panels
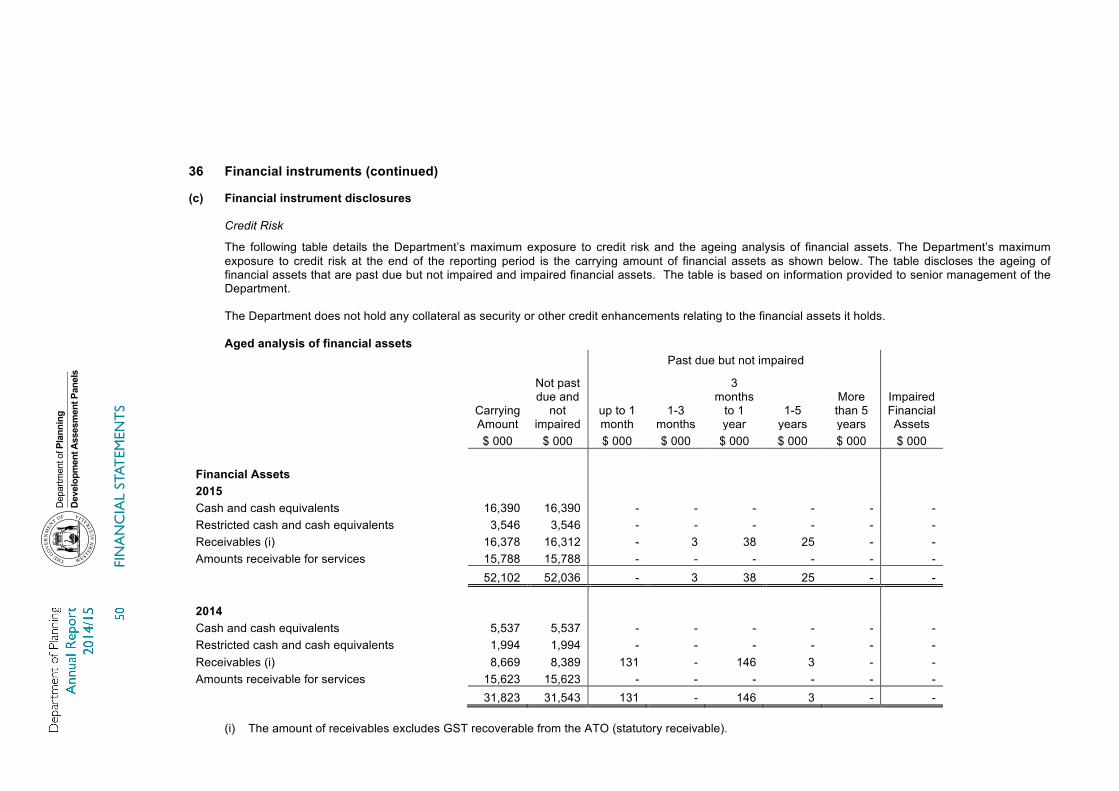
FIN
AN
CIA
L ST
ATEM
ENT
S
47
36 Financial instruments (continued)
(c) Financial instrument disclosures Credit Risk
The following table details the Department’s maximum exposure to credit risk and the ageing analysis of financial assets. The Department’s maximum exposure to credit risk at the end of the reporting period is the carrying amount of financial assets as shown below. The table discloses the ageing of financial assets that are past due but not impaired and impaired financial assets. The table is based on information provided to senior management of the Department.
The Department does not hold any collateral as security or other credit enhancements relating to the financial assets it holds. Aged analysis of financial assets
Past due but not impaired
Carrying Amount
Not past due and
not impaired
up to 1 month
1-3 months
3 months
to 1 year
1-5 years
More than 5 years
Impaired Financial Assets
$ 000 $ 000 $ 000 $ 000 $ 000 $ 000 $ 000 $ 000
Financial Assets
2015
Cash and cash equivalents 16,390 16,390 - - - - - - Restricted cash and cash equivalents 3,546 3,546 - - - - - - Receivables (i) 16,378 16,312 - 3 38 25 - - Amounts receivable for services 15,788 15,788 - - - - - -
52,102 52,036 - 3 38 25 - -
2014
Cash and cash equivalents 5,537 5,537 - - - - - - Restricted cash and cash equivalents 1,994 1,994 - - - - - - Receivables (i) 8,669 8,389 131 - 146 3 - - Amounts receivable for services 15,623 15,623 - - - - - -
31,823 31,543 131 - 146 3 - -
(i) The amount of receivables excludes GST recoverable from the ATO (statutory receivable).
Dep
artm
ent o
f Pla
nnin
gDe
velo
pmen
t Ass
esm
ent P
anel
s

FIN
AN
CIA
L ST
ATEM
ENT
S
48
36 Financial instruments (continued) (c) Financial instrument disclosures (continued) Liquidity risk and interest rate exposure
The following table details the Department’s interest rate exposure and the contractual maturity analysis of financial assets and financial liabilities. The maturity analysis section includes interest and principal cash flows. The interest rate exposure section analyses only the carrying amounts of each item. Interest rate exposures and maturity analysis of financial assets and financial liabilities
Interest rate exposure
Maturity dates
Weighted Average Effective Interest
Rate Carrying Amount
Fixed interest
rate
Variable interest
rate
Non-interest bearing
Nominal amount
Up to 1 month
1-3 months
3 months
to 1 year
1-5 years
more than 5 years
% $ 000 $ 000 $ 000 $ 000 $ 000 $ 000 $ 000 $ 000 $ 000 $ 000
2015
Financial Assets
Cash and cash equivalents 0.00 16,390 - - 16,390 16,390 16,390 - - - - Restricted cash and cash equivalents 0.00 3,546 - - 3,546 3,546 1,664 - 1,882 - - Receivables (i) 16,378 - - 16,378 16,378 16,378 - - - - Amounts receivable for services 15,788 - - 15,788 15,788 - - - 15,788 -
52,102 - - 52,102 52,102 34,432 - 1,882 15,788 -
Financial Liabilities
Payables
4,522 - - 4,522 4,522 4,522 - - - -
4,522 - - 4,522 4,522 4,522 - - - -
Dep
artm
ent o
f Pla
nnin
gDe
velo
pmen
t Ass
esm
ent P
anel
s

FIN
AN
CIA
L ST
ATEM
ENT
S
49
36 Financial instruments (continued) (c) Financial instrument disclosures (continued)
Interest rate exposures and maturity analysis of financial assets and financial liabilities
Interest rate exposure
Maturity dates
Weighted Average Effective Interest
Rate Carrying Amount
Fixed interest
rate
Variable interest
rate
Non-interest bearing
Nominal amount
Up to 1 month
1-3 months
3 months
to 1 year 1-5
years
more than 5 years
% $ 000 $ 000 $ 000 $ 000 $ 000 $ 000 $ 000 $ 000 $ 000 $ 000
2014
Financial Assets
Cash and cash equivalents 0.00 5,537 - - 5,537 5,537 5,537 - - - -
Restricted cash and cash equivalents 0.00 1,994 - - 1,994 1,994 1,994 - - - -
Receivables (i) 8,669 - - 8,669 8,669 8,669 - - - -
Amounts receivable for services 15,623 - - 15,623 15,623 - - - - 15,623
31,823 - - 31,823 31,823 16,200 - - - 15,623
Financial Liabilities
Payables
1,925 - - 1,925 1,925 1,925 - - - -
1,925 - - 1,925 1,925 1,925 - - - -
(i) The amount of payables excludes GST payable to the ATO (statutory payable).
The amounts disclosed are the contractual undiscounted cash flows of each class of financial liabilities.
Dep
artm
ent o
f Pla
nnin
gDe
velo
pmen
t Ass
esm
ent P
anel
s

FINANCIAL STATEMENTS
50
36 Financial instruments (continued)
Interest rate sensitivity analysis The Department is not exposed to interest rate fluctuations. Fair values All financial assets and liabilities recognised in the Statement of Financial Position, whether they are carried at cost or fair value, are recognised at amounts that represent a reasonable approximation of fair value unless otherwise stated in the applicable notes.
37 Remuneration of senior officers
The number of senior officers, whose total of fees, salaries, superannuation, non-monetary benefits and other benefits for the financial year, fall within the following bands are:
$ $ 2015 2014
<50,000 5
3
50,001 - 60,000 1
-
60,001 - 70,000 2
-
70,001 - 80,000 -
1
130,001 - 140,000 -
1
190,001 - 200,000 1
2
210,001 - 220,000 1
2
250,001 - 260,000 1
-
300,001 - 310,000 -
1
380,001 - 390,000 1
-
2015
2014
$ 000
$ 000
Base remuneration and superannuation
1,208
1,313
Annual leave and long service leave accruals
110
19
Other benefits
33
42
Total remuneration of senior officers
1,351
1,374
The total remuneration includes the superannuation expense incurred by the Department in respect of senior officers. No senior officers are members of the Pension Scheme.
Department of PlanningDevelopment Assesment Panels

FINANCIAL STATEMENTS
51
2015
2014
$ 000
$ 000
38 Remuneration of auditor
Remuneration payable to the Auditor General in respect of the audit for the current financial year is as follows:
Auditing the accounts, financial statements and performance indicators 123 117
39 Special purpose accounts
Perry Lakes Account
Opening balance 2,622
2,405
Receipts:
Land sales 2,195
36,359
Interest income 218
234
Other receipts 245
1,417
2,658
38,010
Payments:
Repayment of Treasurer's advance (2,500)
(31,000)
Other payments (1,685)
(6,793)
(4,185)
(37,793)
Closing balance 1,095
2,622
This Account holds funds received pursuant to section 43 of the Perry Lakes Redevelopment Act 2005 for application in accordance with section 43(1) of that Act.
Department of PlanningDevelopment Assesment Panels
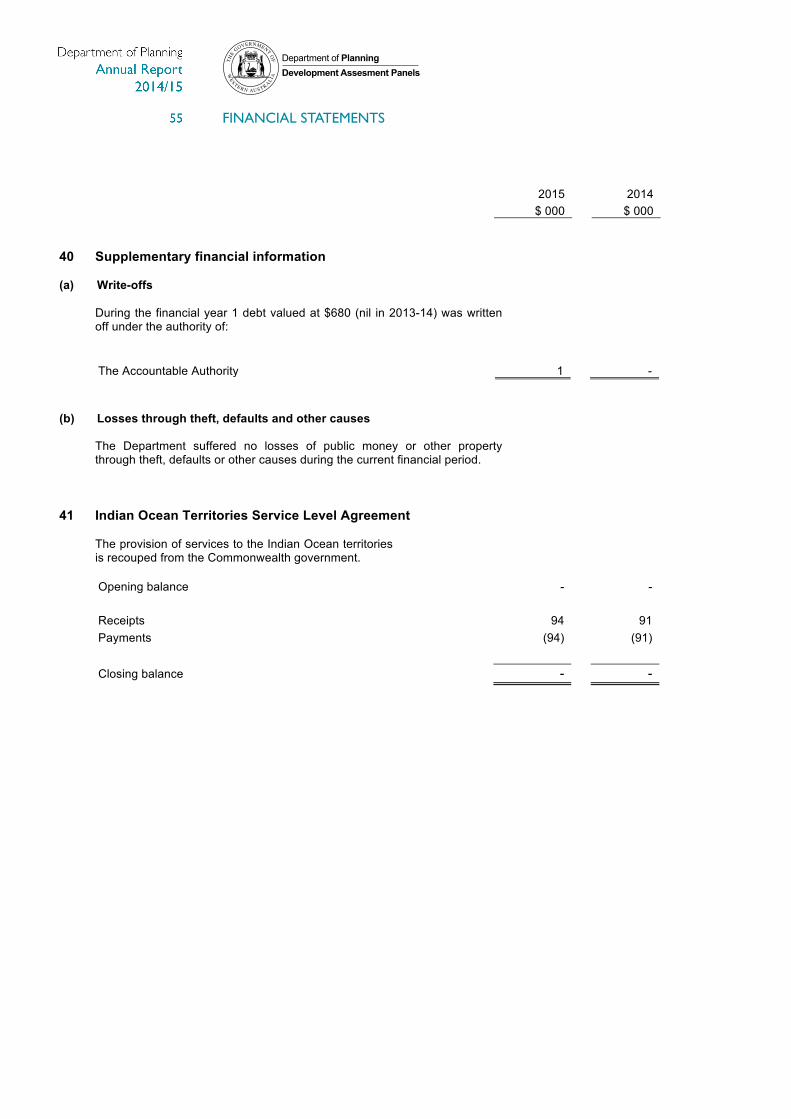
FINANCIAL STATEMENTS
52
2015
2014
$ 000
$ 000
40 Supplementary financial information (a) Write-offs
During the financial year 1 debt valued at $680 (nil in 2013-14) was written off under the authority of:
The Accountable Authority 1 -
(b) Losses through theft, defaults and other causes
The Department suffered no losses of public money or other property through theft, defaults or other causes during the current financial period.
41 Indian Ocean Territories Service Level Agreement
The provision of services to the Indian Ocean territories is recouped from the Commonwealth government.
Opening balance - -
Receipts 94 91
Payments (94) (91)
Closing balance - -
Department of PlanningDevelopment Assesment Panels
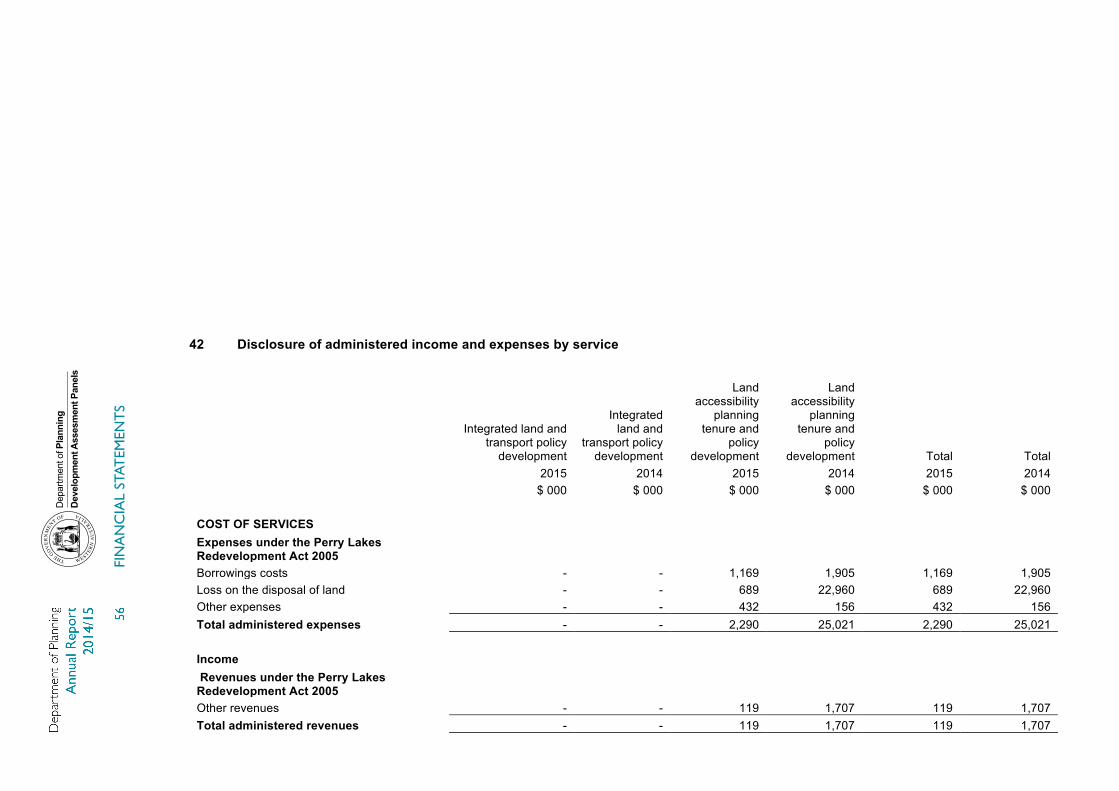
FIN
AN
CIA
L ST
ATEM
ENT
S
53
42 Disclosure of administered income and expenses by service
Integrated land and transport policy
development
Integrated land and
transport policy development
Land accessibility
planning tenure and
policy development
Land accessibility
planning tenure and
policy development Total Total
2015 2014 2015 2014 2015 2014
$ 000 $ 000 $ 000 $ 000 $ 000 $ 000
COST OF SERVICES Expenses under the Perry Lakes
Redevelopment Act 2005 Borrowings costs - - 1,169 1,905 1,169 1,905
Loss on the disposal of land - - 689 22,960 689 22,960 Other expenses - - 432 156 432 156 Total administered expenses - - 2,290 25,021 2,290 25,021
Income Revenues under the Perry Lakes
Redevelopment Act 2005 Other revenues - - 119 1,707 119 1,707
Total administered revenues - - 119 1,707 119 1,707
Dep
artm
ent o
f Pla
nnin
gDe
velo
pmen
t Ass
esm
ent P
anel
s
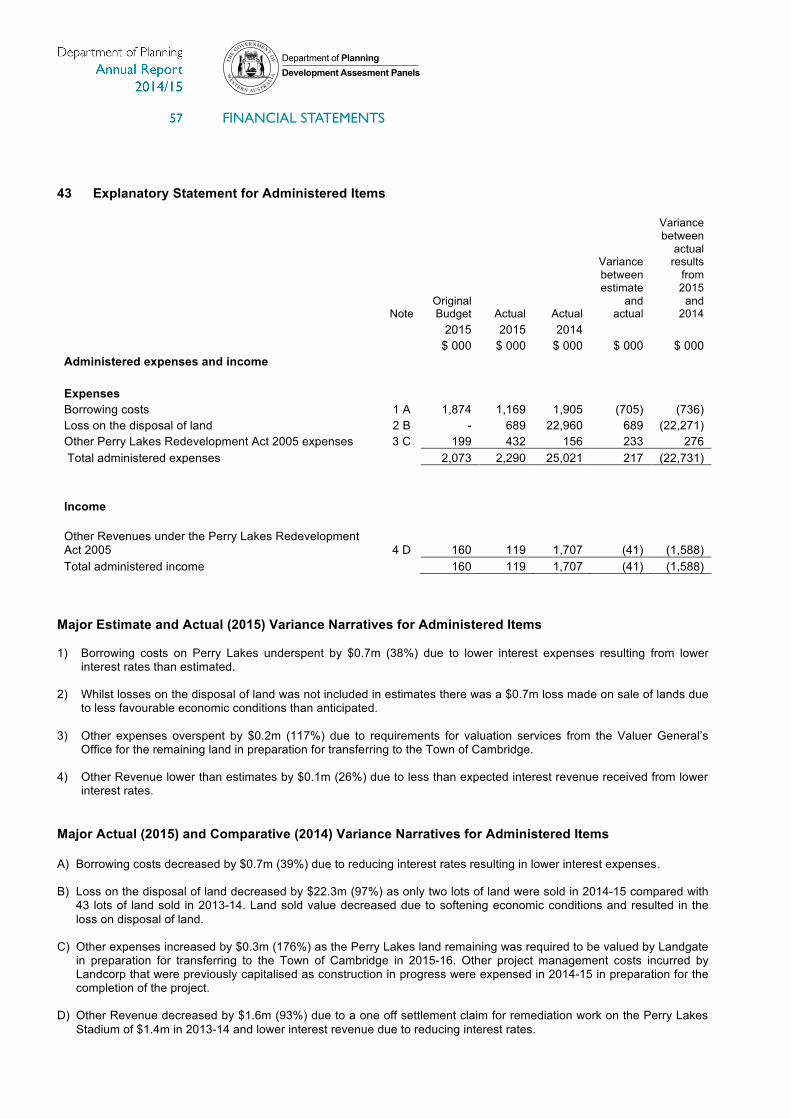
FINANCIAL STATEMENTS
54
43 Explanatory Statement for Administered Items
Note
Original Budget Actual Actual
Variance between estimate
and actual
Variance between
actual results
from 2015
and 2014
2015 2015 2014
$ 000 $ 000 $ 000 $ 000 $ 000 Administered expenses and income
Expenses
Borrowing costs 1 A 1,874 1,169 1,905 (705) (736) Loss on the disposal of land 2 B - 689 22,960 689 (22,271) Other Perry Lakes Redevelopment Act 2005 expenses 3 C 199 432 156 233 276 Total administered expenses
2,073 2,290 25,021 217 (22,731)
Income
Other Revenues under the Perry Lakes Redevelopment Act 2005 4 D 160 119 1,707 (41) (1,588) Total administered income
160 119 1,707 (41) (1,588)
Major Estimate and Actual (2015) Variance Narratives for Administered Items 1) Borrowing costs on Perry Lakes underspent by $0.7m (38%) due to lower interest expenses resulting from lower
interest rates than estimated. 2) Whilst losses on the disposal of land was not included in estimates there was a $0.7m loss made on sale of lands due
to less favourable economic conditions than anticipated.
3) Other expenses overspent by $0.2m (117%) due to requirements for valuation services from the Valuer General’s Office for the remaining land in preparation for transferring to the Town of Cambridge.
4) Other Revenue lower than estimates by $0.1m (26%) due to less than expected interest revenue received from lower
interest rates. Major Actual (2015) and Comparative (2014) Variance Narratives for Administered Items A) Borrowing costs decreased by $0.7m (39%) due to reducing interest rates resulting in lower interest expenses. B) Loss on the disposal of land decreased by $22.3m (97%) as only two lots of land were sold in 2014-15 compared with
43 lots of land sold in 2013-14. Land sold value decreased due to softening economic conditions and resulted in the loss on disposal of land.
C) Other expenses increased by $0.3m (176%) as the Perry Lakes land remaining was required to be valued by Landgate
in preparation for transferring to the Town of Cambridge in 2015-16. Other project management costs incurred by Landcorp that were previously capitalised as construction in progress were expensed in 2014-15 in preparation for the completion of the project.
D) Other Revenue decreased by $1.6m (93%) due to a one off settlement claim for remediation work on the Perry Lakes
Stadium of $1.4m in 2013-14 and lower interest revenue due to reducing interest rates.
Department of PlanningDevelopment Assesment Panels
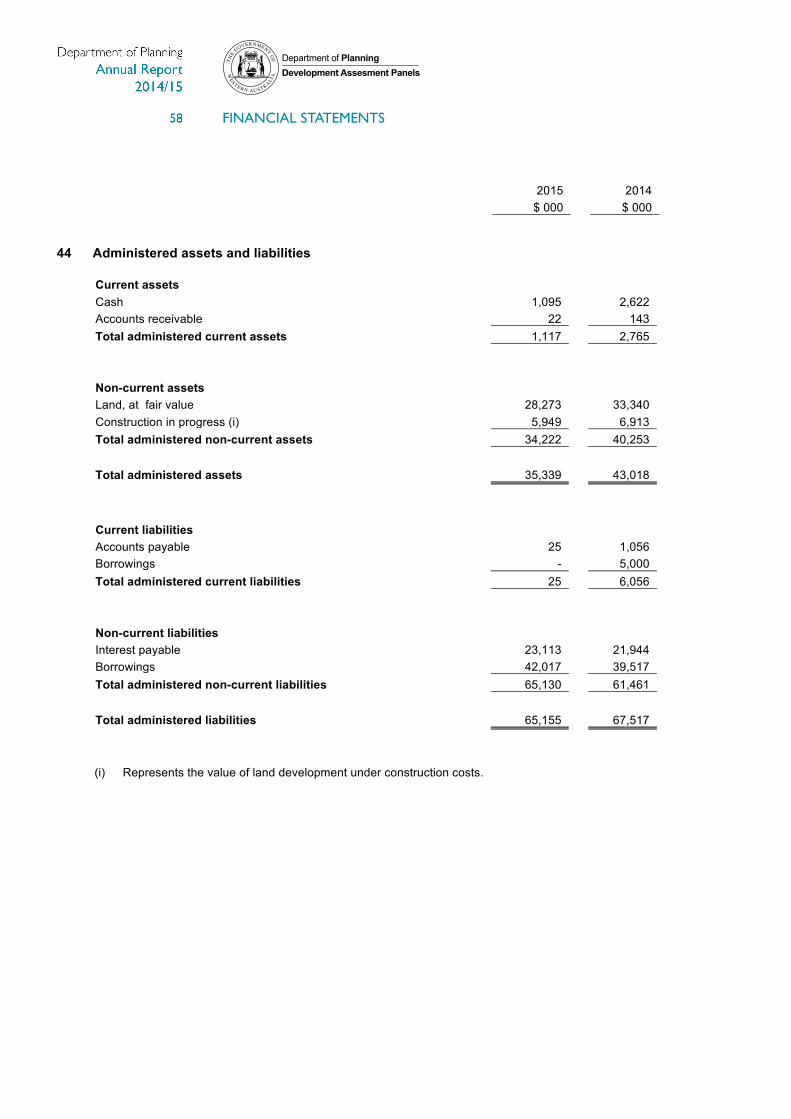
FINANCIAL STATEMENTS
55
2015
2014
$ 000
$ 000
44 Administered assets and liabilities
Current assets
Cash 1,095
2,622
Accounts receivable 22
143
Total administered current assets 1,117
2,765
Non-current assets
Land, at fair value 28,273
33,340
Construction in progress (i) 5,949
6,913
Total administered non-current assets 34,222
40,253
Total administered assets 35,339
43,018
Current liabilities
Accounts payable 25
1,056
Borrowings -
5,000
Total administered current liabilities 25
6,056
Non-current liabilities
Interest payable 23,113
21,944
Borrowings 42,017
39,517
Total administered non-current liabilities 65,130
61,461
Total administered liabilities 65,155
67,517
(i) Represents the value of land development under construction costs.
Department of PlanningDevelopment Assesment Panels

KEY PERFORMANCE INDICATORS
Department of PlanningDevelopment Assesment Panels
CERTIFICATION OF KEY PERFORMANCE INDICATORS FOR THE YEAR ENDED 30 JUNE 2015 I hereby certify that the performance indicators are based on proper records, are relevant and appropriate for assisting users to assess the Department of Planning's performance, and fairly represent the performance of the Department of Planning for the financial year ended 30 June 2015.
John Deery Chief Finance Officer Department of Planning 21 September 2015
Gail McGowan Accountable Authority 21 September 2015

KEY PERFORMANCE INDICATORS
Department of PlanningDevelopment Assesment Panels
1
Department of Planning Level Government Desired Outcomes and Key Performance Indicators
The breadth and diversity of the Department of Planning’s (the Department) functions and services means that the Department contributes to many of the Government’s strategic goals. The Department’s most significant contributions to the Government's goals are outlined in the tabled below.
Government Goal Department Desired Outcomes Department Services
Outcomes Based Service Delivery Greater focus on achieving results in key service delivery areas for the benefit of all Western Australians.
Integration of land systems that facilitate economic development.
Integrated Land and Infrastructure Policy Development
Accessibility to serviced land and infrastructure
Land Accessibility Planning and Policy Development
The Department of Treasury approved abolition of the following performance measures from the Department’s Outcome Structure in April 2014:
• People in the metropolitan region that live within ten minutes of a major public transport route Within a 10 minute walk to a bus stop, Within a 10 minute ride to a railway station, Within 10 minute car travel to a railway station); and
• Avoided land consumption costs. For comparisons purposes with previous years, the 2014-‐15 actuals for the above performance measures have been reported on pages 35 and 36. DoP Level Government Desired Outcome: Integration of land systems that facilitate economic development Effectiveness Indicator: Proportion of zoned land in the metropolitan area that is 400 metres/1 kilometre
from major transport systems. The Department, through its land-‐planning role, determines the location of major transport routes, their suitability for a range of transport services and their proximity to urban areas. The term “major transport routes” includes all major roads and railway lines which buses and trains use as the main connecting corridors, but excludes minor suburban roads. Convenient access to major transport systems pays significant economic dividends through:
• facilitating commuting to industrial centres; • linking consumers to products and services; • enabling the efficient transport of freight; and • reducing private usage road infrastructure costs.
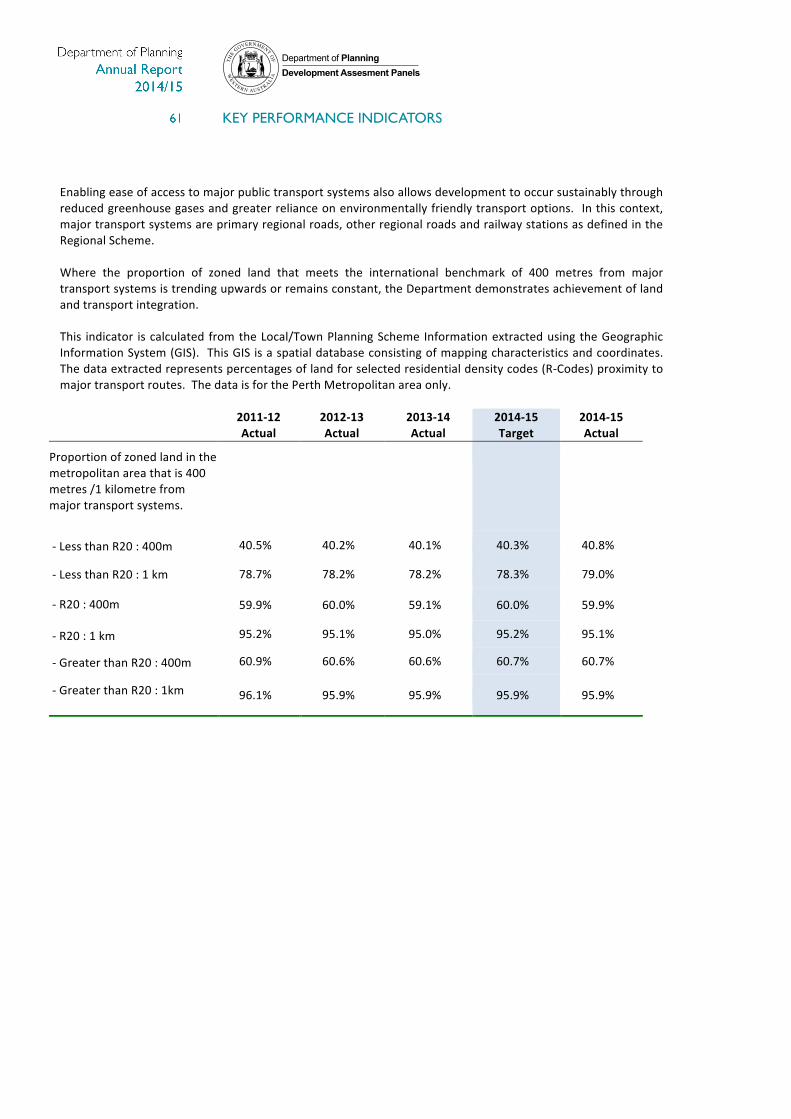
KEY PERFORMANCE INDICATORS
Department of PlanningDevelopment Assesment Panels
2
Enabling ease of access to major public transport systems also allows development to occur sustainably through reduced greenhouse gases and greater reliance on environmentally friendly transport options. In this context, major transport systems are primary regional roads, other regional roads and railway stations as defined in the Regional Scheme. Where the proportion of zoned land that meets the international benchmark of 400 metres from major transport systems is trending upwards or remains constant, the Department demonstrates achievement of land and transport integration. This indicator is calculated from the Local/Town Planning Scheme Information extracted using the Geographic Information System (GIS). This GIS is a spatial database consisting of mapping characteristics and coordinates. The data extracted represents percentages of land for selected residential density codes (R-‐Codes) proximity to major transport routes. The data is for the Perth Metropolitan area only.
2011-‐12 Actual
2012-‐13 Actual
2013-‐14 Actual
2014-‐15 Target
2014-‐15 Actual
Proportion of zoned land in the metropolitan area that is 400 metres /1 kilometre from major transport systems.
-‐ Less than R20 : 400m 40.5% 40.2% 40.1% 40.3% 40.8%
-‐ Less than R20 : 1 km 78.7% 78.2% 78.2% 78.3% 79.0%
-‐ R20 : 400m 59.9% 60.0% 59.1% 60.0% 59.9%
-‐ R20 : 1 km 95.2% 95.1% 95.0% 95.2% 95.1%
-‐ Greater than R20 : 400m 60.9% 60.6% 60.6% 60.7% 60.7%
-‐ Greater than R20 : 1km 96.1% 95.9% 95.9% 95.9% 95.9%
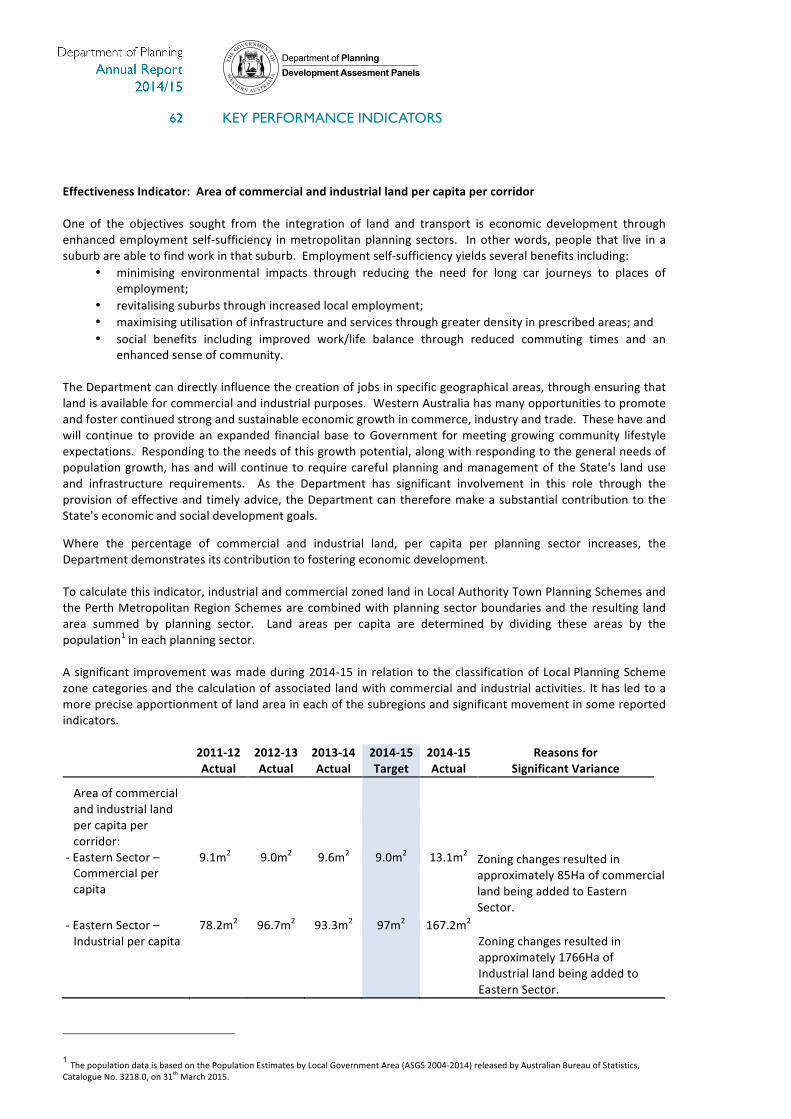
KEY PERFORMANCE INDICATORS
Department of PlanningDevelopment Assesment Panels
3
Effectiveness Indicator: Area of commercial and industrial land per capita per corridor One of the objectives sought from the integration of land and transport is economic development through enhanced employment self-‐sufficiency in metropolitan planning sectors. In other words, people that live in a suburb are able to find work in that suburb. Employment self-‐sufficiency yields several benefits including:
• minimising environmental impacts through reducing the need for long car journeys to places of employment;
• revitalising suburbs through increased local employment; • maximising utilisation of infrastructure and services through greater density in prescribed areas; and • social benefits including improved work/life balance through reduced commuting times and an
enhanced sense of community. The Department can directly influence the creation of jobs in specific geographical areas, through ensuring that land is available for commercial and industrial purposes. Western Australia has many opportunities to promote and foster continued strong and sustainable economic growth in commerce, industry and trade. These have and will continue to provide an expanded financial base to Government for meeting growing community lifestyle expectations. Responding to the needs of this growth potential, along with responding to the general needs of population growth, has and will continue to require careful planning and management of the State's land use and infrastructure requirements. As the Department has significant involvement in this role through the provision of effective and timely advice, the Department can therefore make a substantial contribution to the State's economic and social development goals. Where the percentage of commercial and industrial land, per capita per planning sector increases, the Department demonstrates its contribution to fostering economic development. To calculate this indicator, industrial and commercial zoned land in Local Authority Town Planning Schemes and the Perth Metropolitan Region Schemes are combined with planning sector boundaries and the resulting land area summed by planning sector. Land areas per capita are determined by dividing these areas by the population1 in each planning sector. A significant improvement was made during 2014-‐15 in relation to the classification of Local Planning Scheme zone categories and the calculation of associated land with commercial and industrial activities. It has led to a more precise apportionment of land area in each of the subregions and significant movement in some reported indicators. 2011-‐12
Actual 2012-‐13 Actual
2013-‐14 Actual
2014-‐15 Target
2014-‐15 Actual
Reasons for Significant Variance
Area of commercial and industrial land per capita per corridor:
-‐ Eastern Sector – Commercial per capita
9.1m2 9.0m2 9.6m2 9.0m2 13.1m2 Zoning changes resulted in approximately 85Ha of commercial land being added to Eastern Sector.
-‐ Eastern Sector – Industrial per capita
78.2m2 96.7m2 93.3m2 97m2 167.2m2 Zoning changes resulted in approximately 1766Ha of Industrial land being added to Eastern Sector.
1 The population data is based on the Population Estimates by Local Government Area (ASGS 2004-‐2014) released by Australian Bureau of Statistics, Catalogue No. 3218.0, on 31th March 2015.

KEY PERFORMANCE INDICATORS
Department of PlanningDevelopment Assesment Panels
4
2011-‐12 Actual
2012-‐13 Actual
2013-‐14 Actual
2014-‐15 Target
2014-‐15 Actual
Reasons for Significant Variance
-‐ Inner Sector – Commercial per capita
31.1m2 30.4m2 29.6m2 30.5m2 25.1m2 Zoning changes resulted in approximately 116 Ha of Industrial land being removed from the Inner Sector.
-‐ Inner Sector – Industrial per capita
12.2m2 11.8m2 11.4m2 12m2 11.2m2
-‐ Middle Sector – Commercial per capita
21.4m2 20.6m2 20.8m2 20.6m2 30.3m2 Zoning changes resulted in approximately 553 Ha of commercial land being added to Middle Sector.
-‐ Middle Sector – Industrial per capita
62.2m2 59.8m2 58.7m2 60.5m2 50.2m2 Zoning changes resulted in approximately 422 Ha of Industrial land being removed from Middle Sector.
-‐ North West Sector – Commercial per capita
34.4m2 33.4m2 39.5m2 33.5m2 42.3m2 Zoning changes resulted in approximately 135 Ha of industrial land being added to North West Sector.
-‐ North West Sector – Industrial per capita
59.1m2 57.3m2 55.2m2 57.3m2 167.9m2 Zoning changes resulted in approximately 4,043 Ha of industrial land being added to North West Sector.
-‐ South East Sector – Commercial per capita
14.0m2 13m2 17.7m2 13.3m2 17.1m2 Population changes resulted in an increase of residents of 8,138 which was below that utilised to calculate the target.
-‐ South East Sector – Industrial per capita
53.2m2 63.6m2 60.4m2 64m2 76.9m2 Zoning changes resulted in approximately 418 Ha of industrial land being added to South East Sector.
-‐ South West Sector – Commercial per capita
21.5m2 20.9m2 27.3m2 20.5m2 46.9m2 Zoning changes resulted in approximately 553 Ha of commercial land being added to South West Sector.
-‐ South West Sector – Industrial per capita
152.4m2 139.9m2 134.1m2 140m2 204.2m2 Zoning changes resulted in approximately 2,017 Ha of industrial land being added to South West Sector.
-‐ Perth Metropolitan Region – Commercial per capita
23.0m2 22.2m2 24.8m2 22.2m2 30.5m2 Zoning changes resulted in approximately 1,210 Ha of commercial land being added to overall Perth Metropolitan Region.
-‐ Perth Metropolitan Region – Industrial per capita
67.0m2 67.9m2 63.7m2 67.4m2 104.8m2 Zoning changes resulted in approximately 7,821 Ha of industrial land being added to overall Perth Metropolitan Region

KEY PERFORMANCE INDICATORS
Department of PlanningDevelopment Assesment Panels
5
EFFICIENCY KEY PERFORMANCE INDICATORS Service 1: Integrated Land and Infrastructure Policy Development By shaping the pattern of development and influencing the location, scale, density, design and mix of land uses it contributes to the Government’s goal, Outcomes Based Service Delivery by: • ensuring flexibility to meet the demands of a changing economy and market environments; and • maximising the use of existing infrastructure rather than incurring the costs of green fields infrastructure
with its resulting impact on home affordability.
Key Efficiency Indicator 2011-‐12 Actual
2012-‐13 Actual
2013-‐14 Actual
2014-‐15 Target
2014-‐15 Actual
Average cost per policy hour for integrated land policy development
$119.19 $113.25 $131.08 $132.52 $127.63
0 10 20 30 40 50 60 70 80 90
100 110 120 130 140
2011-‐12 Actual
2012-‐13 Actual
2013-‐14 Actual
2014-‐15 Target
2014-‐15 Actual
Cost
$
Financial Year
Average cost per policy hour for integrated land policy development

KEY PERFORMANCE INDICATORS
Department of PlanningDevelopment Assesment Panels
6
DoP Level Government Desired Outcome: Accessibility to serviced land and infrastructure Effectiveness Indicator: Number of lots given preliminary and final approval The Department seeks to provide sufficient land for housing to accommodate the anticipated future population growth of the State. To this end, the Department plays an important role by ensuring sufficient zoned urban land and facilitating orderly land release through structure planning and issuing subdivision approvals throughout the State. The Department is partnered with the Western Australian Planning Commission (WAPC) in this process. The Department issued final approvals for 19,140 new residential lots during 2014-‐15 (Perth and Peel) to the land development industry. The corresponding total Statewide figure for final approvals for residential lots was 21,256. The Department is not the sole determinant of land availability, as for a number of reasons, not all preliminary approvals (which reflect a bank of developable land from which developers can draw) go through to the final approval stage. These include external factors such as availability of raw materials, interest rates, developer capacity and market conditions. Therefore, the Department (via the WAPC) is only able to respond to applications lodged for preliminary and final approval. These measures are extracted from the Department's electronic administrative subdivision tracking system and are published in the quarterly bulletin entitled State Lot Activity. Analysis of trends relating to the number of lots given preliminary or final approval in statewide should be undertaken separately as each indicator can respond differently to the prevailing market conditions. 2011-‐12
Actual 2012-‐13 Actual
2013-‐14 Actual
2014-‐15 Target
2014-‐15 Actual
Number of lots given preliminary and final approval
-‐ Residential 36,133 41,027 51,812 53,000 55,187 -‐ Non-‐Residential 6,364 5,095 5,283 5,800 5,286

KEY PERFORMANCE INDICATORS
Department of PlanningDevelopment Assesment Panels
7
Effectiveness Indicator: Median land price as a percentage of median residential property sales price This indicator details land costs compared to median house sale prices. The Department has some effect on median land prices by ensuring that there is sufficient stock of approved land suitable for development or redevelopment, although the principal price determinants are supply and demand in the market itself. This indicator is useful because it disaggregates the price of residential land from the price of houses. The actual for 2014-‐15 for the whole of Western Australia is 49% while the actual for Perth is 51%. Median sales prices (derived from sales information obtained from Landgate) are quoted for houses and vacant land in the Perth Metropolitan areas and for the whole of the State in the quarterly REIWA Market Update. This indicator is calculated by expressing the average median land price for the year as a percentage of the average median established house price for the year for the Perth metropolitan area. 2011-‐12
Actual 2012-‐13 Actual
2013-‐14 Actual
2014-‐15 Target
2014-‐15 Actual
Median land price as a percentage of median residential property sales price
57% 54% 57% 55% 51%
Effectiveness Indicator: Relative Affordability of property and land prices This indicator compares the cost of existing property and land prices with that of other mainland and non-‐territory capital cities. Given that housing and land costs are a function of land supply, it is reasonable to assume that relative affordability of housing and land indicate effective management of land supply in support of economic outcomes. This indicator measures the comparative number of weeks that a home purchaser requires to pay off a house purchase in the major capital cities. It is a function of the median house prices of each of those cities over the average weekly earnings. Data for this indicator is sourced from the REIA publication Market Facts2 and the Average Weekly Earnings3, published by the Australian Bureau of Statistics. 2011-‐12
Actual 2012-‐13 Actual
2013-‐14 Actual
2014-‐15 Target
2014-‐15 Actual
Relative affordability of property and land prices
Lowest quintile
Lowest quintile
Second quintile
Lowest quintile
Second quintile
2 March Quarter 2015 (Cat no. 6302) 3 November 2014
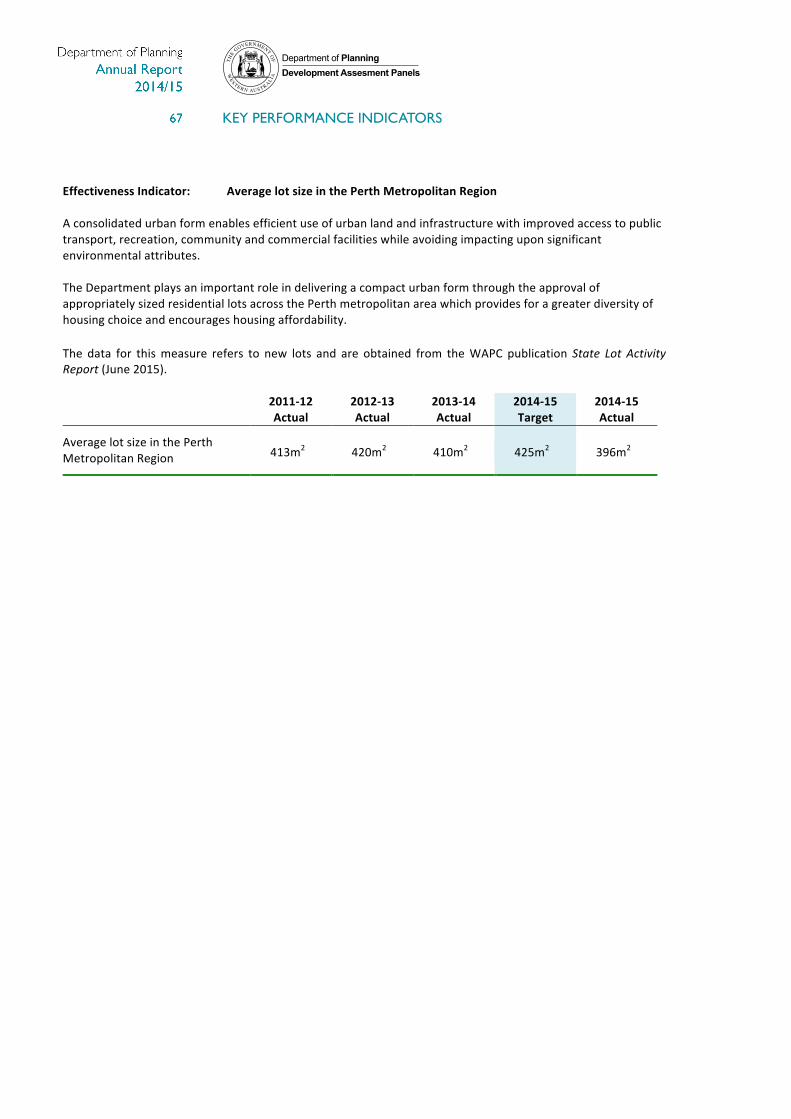
KEY PERFORMANCE INDICATORS
Department of PlanningDevelopment Assesment Panels
8
Effectiveness Indicator: Average lot size in the Perth Metropolitan Region A consolidated urban form enables efficient use of urban land and infrastructure with improved access to public transport, recreation, community and commercial facilities while avoiding impacting upon significant environmental attributes. The Department plays an important role in delivering a compact urban form through the approval of appropriately sized residential lots across the Perth metropolitan area which provides for a greater diversity of housing choice and encourages housing affordability. The data for this measure refers to new lots and are obtained from the WAPC publication State Lot Activity Report (June 2015). 2011-‐12
Actual 2012-‐13 Actual
2013-‐14 Actual
2014-‐15 Target
2014-‐15 Actual
Average lot size in the Perth Metropolitan Region 413m2 420m2 410m2 425m2 396m2

KEY PERFORMANCE INDICATORS
Department of PlanningDevelopment Assesment Panels
9
Effectiveness Indicator: Determination appeals that are unsuccessful The percentage of determinations made without successful applications for review provides an indicator of the Department's effectiveness in the application of the WAPC's State Planning Framework. Effective application of this framework delivers efficient decisions and ensures that new land is adequately serviced. Where a determination is successfully challenged by demonstrating flaws in the Department's application of policy, additional costs may be incurred both by the developer and subsequently by land purchasers. The indicator is the number of all subdivision, strata and development application determinations made that are not successfully "reviewed', (i.e. upheld) before the State Administrative Tribunal (SAT), expressed as a percentage of the total number of applications determined within the reporting period. The data shows that one application for review before the SAT was upheld in 2014-‐15, and that 3,899 subdivisions, strata and development applications were determined. 2011-‐12
Actual 2012-‐13 Actual
2013-‐14 Actual
2014-‐15 Target
2014-‐15 Actual
Determination appeals that are unsuccessful 99.8% 99.9% 99.9% 99.9% 99.9%

KEY PERFORMANCE INDICATORS
Department of PlanningDevelopment Assesment Panels
10
EFFICIENCY KEY PERFORMANCE INDICATORS
Service 2: Land Accessibility Planning and Policy Development This service contributes to the achievement of the outcome "accessibility to serviced land and infrastructure" through:
• ensuring that sufficient land is available for purchase for both residential and commercial purposes;
• controlling lot sizes and therefore the costs of infrastructure required to service each lot;
• minimising delays and their attendant costs by making accurate, timely decisions on redevelopment and subdivision proposals; and
• providing resources to the WAPC to enable:
! the acquisition and management of properties reserved under Perth's Metropolitan Region Scheme for important urban roads, controlled access highways, parks and recreational reserves, special uses and major land redevelopment projects;
! the disposal of surplus properties;
! the management of rental properties; and
! other special planning projects undertaken within the Perth metropolitan area.
Key Efficiency
Indicator 2011-‐12 Actual
2012-‐13 Actual
2013-‐14 Actual
2014-‐15 Target
2014-‐15 Actual
Reasons for Significant Variance
Cost per subdivision and development application processed
$7,645 $6,998 $5,819 $6,019 $7,176
Increases in the Cost per Subdivision and Development Application Processed has resulted from a decline in the property market including a relative decline in the number of subdivision and development applications received for processing.
0 1,000 2,000 3,000 4,000 5,000 6,000 7,000 8,000 9,000
2011-‐12 Actual
2012-‐13 Actual
2013-‐14 Actual
2014-‐15 Target
2014-‐15 Actual
Cost
$
Financial Year
Cost per subdivision and development applicaWon processed

KEY PERFORMANCE INDICATORS
Department of PlanningDevelopment Assesment Panels
11
Key Efficiency Indicator 2011-‐12 Actual
2012-‐13 Actual
2013-‐14 Actual
2014-‐15 Target
2014-‐15 Actual
Statutory planning applications processed within statutory timeframes
76% 84% 79% 80% 85%
0% 10% 20% 30% 40% 50% 60% 70% 80% 90%
2011-‐12 2012-‐13 2013-‐14 2014-‐15 Target
2014-‐15 Actual
%
Financial Year
Statutory planning applicaWons processed within statutory Wmeframes
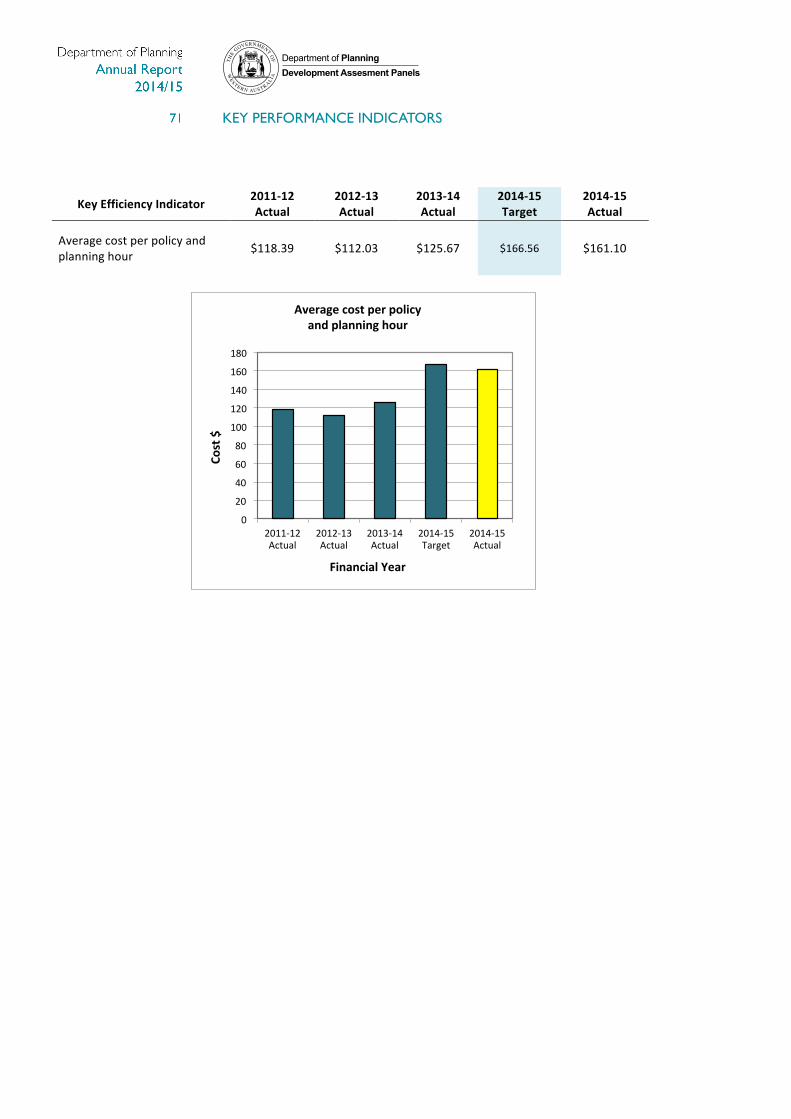
KEY PERFORMANCE INDICATORS
Department of PlanningDevelopment Assesment Panels
12
Key Efficiency Indicator 2011-‐12 Actual
2012-‐13 Actual
2013-‐14 Actual
2014-‐15 Target
2014-‐15 Actual
Average cost per policy and planning hour $118.39 $112.03 $125.67 $166.56 $161.10
0
20
40
60
80
100
120
140
160
180
2011-‐12 Actual
2012-‐13 Actual
2013-‐14 Actual
2014-‐15 Target
2014-‐15 Actual
Cost
$
Financial Year
Average cost per policy and planning hour

KEY PERFORMANCE INDICATORS
Department of PlanningDevelopment Assesment Panels
13
Key Efficiency Indicator
2011-‐12 Actual
2012-‐13 Actual
2013-‐14 Actual
2014-‐15 Target
2014-‐15 Actual
Reasons for Significant Variance
Town Planning Scheme amendments (for final approval) processed within non-‐statutory timeframes
44% 49% 28% 60% 32%
The target was not met due to a continuation of high numbers of complex LPS amendments being received during the year resulting in longer timeframes.
0%
10%
20%
30%
40%
50%
60%
70%
2011-‐12 2012-‐13 2013-‐14 2014-‐15 Target
2014-‐15 Actual
%
Financial Year
TPS Amendments within non statutory Wme frames

KEY PERFORMANCE INDICATORS
Department of PlanningDevelopment Assesment Panels
14
Key Efficiency Indicator 2011-‐12 Actual
2012-‐13 Actual
2013-‐14 Actual
2014-‐15 Target
2014-‐15 Actual
Deposited and Strata Plans endorsed within non-‐statutory timeframes
99% 99% 99% 100% 99%
0% 10% 20% 30% 40% 50% 60% 70% 80% 90%
100%
2011-‐12 2012-‐13 2013-‐14 2014-‐15 Target
2014-‐15 Actual
%
Financial Year
Deposited and Strata Plans endorsed within non-‐statutory Wmeframes