Embed Size (px)
Citation preview

Financials
84/85
Expenses Council’s total expenses for 2010/11 of $113.456 million were under the budget of $115.047 million. Cash costs were collectively managed within budget limits despite an unbudgeted funding payment of $2.16 million to the Vision superannuation defined benefits fund. A revaluation of Council’s infrastructure assets and a reassessment of the useful life of road assets, both undertaken after the budget was compiled, meant that depreciation charges were under budget by $3.9 million.
Capital ExpenditureDuring the 2010/11 year Council’s investment of $30.988 million in capital works was entirely internally funded. This expenditure comprised $26m to renew, replace, upgrade and expand existing assets so as to safeguard the sustainable delivery of Council’s services to the community plus almost $5m invested in new assets.
Works already underway, to the value of $4.5 million, will be carried over to 2011/12 for completion – including the Como Park pavilion refurbishment, Prahran Market Square stage 2 and completion of Phoenix Park community centre.
Some of the key capital works in 2010/11 included: Local roads refurbishment and resurfacing, drainage and footpath works $9.01m Buildings $11.42m Land, parks and gardens $5.29m Motor vehicles, plant and equipment, IT, library books, office equipment and furniture $5.3m
The 2010/11 capital works expenditure is classified as:
Renewal of existing assets to restore their useful life or service potential to original condition $18.722m
Expansion of existing assets to benefit more users $0.883m
Upgrade of existing assets to extend their useful life or provide greater service $6.425m
New assets $4.958m
Depreciation $17.05M 15.0%
Other Expenditure $6.00M 5.3%
Staff Costs $47.10M 41.5%
Service Delivery and Materials $26.72M 23.5%
Contact Payments $16.68M 14.7%
15%
5.3%
41.5%
23.5%
14.7%
0
5
10
15
20
25
35
30
40
06/07$22.35M
07/08$28.15M
08/09$23.98M
09/10$36.77M
10/11$30.99M
11/12$35.31M
Budget & Carryovers
Capital Expenditure by Asset Class
Land and Land Improvements Buildings
Road Infrastructure & Drainage IT, Plant and Equipment, Other
0
5
10
15
20
25
35
30
40
06/07$22.35M
07/08$28.15M
08/09$23.98M
09/10$36.77M
10/11$30.99M
11/12$35.31M
Budget & Carryovers
Capital Expenditure by Asset Type
Renewal Upgrade Expansion New
$4.68M
$6.44M
$3.53M
$7.70M
$6.83M
$4.82M
$10.04M
$6.46M
$3.67M
$6.97M
$5.75M
$7.54M $18.83M
$6.13M $6.35M
$7.93M
$11.42M
$5.29M $6.04M
$13.15M
$8.65M
$7.47M$5.94M
$5.87M
$17.47M$0.99M$0.98M
$2.91M
$17.47M $16.88M
$21.47M
$8.14M$4.96M
$0.88M
$6.43M $23.62M
$6.29M
$3.70M$1.70M
$18.72M
$2.21M
$4.95M
$5.58M
$4.74M $1.39M$0.03M $0.13M
$9.69M
$m
$m

Financials
UNDERSTANDING THE FINANCIALS
86/87
AUDITING PROCESS
Council’s Financial Report includes the Financial Statements, Standard Statements and Performance Statement, and is prepared to meet the requirements of the Local Government Act 1989, the Local Government (Finance and Reporting) Regulations 2004, Australian Accounting Standards and other authoritative pronouncements of the Australian Accounting Standards Board.
The financial statements are audited by the Auditor General Victoria’s agent and are approved in principle by both the Council’s Audit Committee and Council. The reports are then forwarded to the Auditor General’s Office for finalisation and provision of the Auditor General’s opinion on the Financial and Standard Statements and also for the Performance Statement.
The audit opinion from the Auditor General provides an independent view of the financial statements and will advise the reader if there are any issues of concern. The opinion confirms that the Financial Reports have been prepared in accordance with relevant legislation and accounting standards and represent a fair view of the financial affairs of Council.
For the financial year ended 30 June 2011 Council received a clear audit opinion for all financial statements.
FINANCIAL STATEMENTS
There are four key financial statements that are supported by explanatory notes.
__ Comprehensive Income Statement
__ Balance Sheet
__ Statement of Changes in Equity
__ Cash Flow Statement
Each statement assists in the overall understanding of Council’s financial performance and position.
1. Comprehensive Income Statement The Comprehensive Income Statement measures Council’s financial performance for the year. This statement discloses the operating surplus or deficit resulting from continuing operations. For the year ended 30 June 2011 Council reported a surplus of $12.158 million from its operations.
The statement includes all sources of revenue and operating expenses that relate to the delivery of Council services. The Income Statement is prepared on an accrual basis, meaning that all revenue and expenses relating to the financial year are included in the statement although the cash relating to those transactions may not have been received or paid.
The Comprehensive Income Statement includes depreciation charges, being the value of assets consumed during the year. These assets include buildings, roads, footpaths, and drains and all other infrastructure assets that are used to deliver Council services. Assets are depreciated over their expected useful life.
In accordance with accounting standards contributions of $2.916 million received from developers are reported as revenue in this statement. However such contributions are capital in nature and Council is obligated to use those contributions to fund future capital works, particularly in the creation of open space reserves.
Although Council reported a surplus of $12.158 million from its operations in 2010/11, the Comprehensive Income Statement also includes the net movement in Council’s equity in the Clayton South Regional Landfill. For the 2010/11 year Council’s equity in that joint initiative declined by $0.101 million, comprising Council’s share of profits $0.281 million less dividends received of $0.382 million. Council revalues its infrastructure assets biannually and the next revaluation exercise will be undertaken in June 2012. No increment or decrement was taken to account in 2010/11.
2. Balance Sheet The Balance Sheet discloses Council’s net worth and clearly defines both Council’s assets and liabilities as at 30 June 2011. Assets and liabilities are classified as either current or non-current, where current assets and liabilities are expected to be converted into cash or paid within the next 12 months.
Net Assets, or Total Equity, represents Council’s accumulated net worth and includes many infrastructure and community assets such as buildings, land, parks, roads and drains.
At 30 June 2011 Council has a strong Balance Sheet. Current Assets are more than adequate to meet current commitments as and when they fall due and its assets are funded by a very low level of borrowings. The main components of Council’s balance sheet are cash and investments, property and infrastructure assets, low levels of borrowings, accumulated surpluses and reserves.
3. Statement of Changes in Equity The Statement of Changes in Equity summarises the increase (or decrease) in Council’s net worth for the year ended 30 June 2011. Council’s net worth can only change as a result of:
__ A surplus or deficit as recorded in the Comprehensive Income Statement.
__ An increase or decrease in the value of non-current assets resulting from revaluation of those assets. The value of all non-current assets is reviewed regularly to ensure the true value of assets is reflected in the Balance Sheet.
FINANCIAL RESULTS OVERVIEW
Borrowings Debt (excluding finance leases) was reduced to $3.364 million at 30 June 2011 from $4.0 million at 30 June 2010. Debt funding is used where necessary to finance capital works although Council’s long term projections indicate it has the capacity to fund planned capital projects with its own funds and without the need for new borrowings. With an asset base of $1.4 billion, Council has exceptionally low levels of borrowings and this facility remains a funding option available to Council.
Scheduled repayments on existing loans will see their elimination by the 2016/17 year.
Cash and Other Financial Assets Cash and other financial assets at 30 June 2011 total $54.665 million.
Council’s liquidity position continues to be very strong with a ratio of 206 percent. This ratio means that Council has $2.06 of cash and current assets for every $1.00 of current liabilities.
Legislative and policy restrictions on Council’s cash at 30 June 2011 total $30.953 million. This statutory obligation means that Council must set aside sufficient cash to fund employee long service leave entitlements and its open space and car-parking reserves.
Cash assets will be required to fund the 2011/12 capital works program of $30.81 million as well as projects of $4.5 million carried over into the 2011/12 year for completion.
Looking Ahead:
–– The City of Stonnington is projecting an operating surplus of $10.01 million in 2011/12 and continuation of its strong balance sheet position over the lifespan of the 2009/13 Council Plan. The strong financial position ensures Council has the capacity to deliver the objectives and strategies within the Council Plan and Strategic Resource Plan.
–– The generation of operating surpluses over the four years of the Council Plan provides a key source of funding for major new initiatives. Council’s 2011/12 budget also allows for another significant investment in capital works – fully funded through internal cash sources and without the need to undertake new borrowings. In fact borrowings will be further reduced in 2011/12. Major projects to be completed in 2011/12 include Surrey Road Park and Phoenix Park Community Centre.
–– The approved budget includes a modest general rate increase of 4.2 percent for 2011/12, which is broadly consistent with the long-term financial strategy and among the lowest rate increases in metropolitan Melbourne.
–– Council’s strong financial position ensures it is able to provide high quality services to the community in all areas and provides funding for new community and organisational initiatives in line with the Council Plan.
0
1
2
3
4
5
6
7
8
9
10
06/07 07/08 08/09 09/10 10/11
$m
Borrowings
Working Capital Ratio
$0.0
$0.5
$1.0
$1.5
$2.0
$2.5
$3.0
06/07 07/08 08/09 09/10 10/11
$m

Financials
88/89
STANDARD INCOME STATEMENTFOR THE YEAR ENDED 30 JUNE 2011
Note
2011Actual
$’000
2011Budget
$’000Variance
$’000Variance
%
Revenue
Rates and charges 73,729 72,495 1,234 1.7%
Traffic fines and parking 14,879 15,885 (1,006) (6.3%)
User fees 18,057 17,760 297 1.7%
Grants – recurrent 7,314 7,479 (165) (2.2%)
Grants – non recurrent 1 939 787 152 19.3%
Contributions 2 2,916 1,500 1,416 94.4%
Reimbursements 3 1,238 480 758 157.9%
Interest 4 3,007 1,990 1,017 51.1%
Other revenue 5 3,408 2,046 1,362 66.6%
Fair value adjustments for investment property 6 144 186 (42) 22.6%
Financial assets available for sale – loss for the period
(17) – (17)
Total revenue 125,614 120,608 5,006 4.2%
Expenses
Employee benefits 47,103 45,576 (1,527) (3.4%)
Materials and services 43,399 43,418 19 0.0%
Bad and doubtful debts – 20 20 100.0%
Community grants 2,580 2,658 78 2.9%
Depreciation and amortisation 7 17,051 20,964 3,913 18.7%
Finance costs 242 245 3 1.2%
Other expenses 8 3,044 2,083 (961) (46.1%)
Net loss on disposal of property, infrastructure, plant and equipment
37 83 46 55.4%
Total expenses 113,456 115,047 1,591 1.4%
Profit from Continuing Operations 12,158 5,561 6,597 118.6%
Share of other comprehensive income of associates and joint ventures accounted for by the equity method
(101) 100 (201) (201.0%)
Net Surplus for the year 12,057 5,661 6,396 113.0%
The accompanying notes form part of this financial report.
UNDERSTANDING THE FINANCIALS
4.Cash Flow Statement The Cash Flow Statement identifies Council’s cash receipts and payments for the financial year and the net ‘cash on hand’ position at 30 June 2011. It excludes non-cash expenses such as depreciation but includes payments in relation to capital projects, proceeds from asset sales and movements in cash that Council may hold as a result of holding trust deposits. Council’s cash arises from, and is used, in three main areas:
Cash Flows provided by Operating Activities: Outlines all cash receipts and cash payments relating to Council’s ongoing service delivery. It is important that Council maintains a cash surplus from its operating activities to ensure the ongoing provision of day-to-day operations and to fund the purchase and enhancement of new and existing assets.
Cash Flows from Investing Activities: Includes capital works expenditure and any receipts from the sale of assets.
Cash Flows from Financing Activities: Includes proceeds from borrowing and the repayment of loans, movement in cash held in trust deposits and movement in term deposits between short term (up to 90 days) and longer term. For the purposes of the Statement of Cash Flows, and in accordance with accounting policy, only term deposits with terms of less than 90 days are treated as cash on hand.
Term deposits that mature beyond 90 days are treated as other financial assets. To the extent that cash provided by operating activities is maximised then Council is less likely to resort to the funding of capital works through external borrowings.
NOTES TO THE FINANCIAL STATEMENTS
The Notes provide further information in relation to the guiding principles employed to formulate the financial statements and detail specific items of note within the statements. The notes also advise if there has been any change to accounting standards, policy or legislation that has affected the preparation of the statements.
The notes are directly linked by number identification to the respective Financial Statement and can highlight where there has been a significant change from the previous year’s comparative figure.
STANDARD STATEMENTS
The Standard Statements include three of the four statements mentioned previously (Income Statement, Balance Sheet and Cash Flow Statement) together with a further statement (Statement of Capital Works).
The Standard Statements compare actual performance to Council’s financial plan, expressed through its annual budget. These statements are prepared on an accounting basis consistent with those used for the Financial Statements. All major variances to budget are explained in the accompanying notes.
The Statement of Capital Works sets out the expenditure on each major class of assets – including land and buildings, road and drainage infrastructure and plant and equipment. It also shows what investment has been made renewing, upgrading or expanding existing assets and creating new assets.
PERFORMANCE STATEMENT
Council has adopted a budget as part of its Council planning cycle and has separately identified the Key Strategic Activities (KSAs) to be undertaken during the financial year. Performance targets and measures are developed for each KSA.
The Performance Statement reports Council’s achievement against these performance targets and measures for the financial year ending 30 June 2011. In some cases the assessment of whether a target has been achieved is subjective. For example, under-expenditure in capital works could be interpreted as a failure to meet expectations in development of assets, but could also be interpreted as a success and achievement of a target where efficiencies were realised and works were delivered at a lower than budgeted cost.
CERTIFICATION BY PRINCIPAL ACCOUNTING OFFICER AND COUNCILLORS
The Certification of the Financial Report by the Principal Accounting Officer is made by the person responsible for the financial management of Council and signifies that, in his/her opinion, the financial statements have met all the statutory and professional reporting requirements.
The Certification of the Councillors is made by two Councillors empowered on behalf of Council to certify that, in their opinion, the financial statements fairly and accurately report Council’s financial position.

Financials
90/91
STANDARD CASH FLOW STATEMENTFOR THE YEAR ENDED 30 JUNE 2011
Note
2011Actual
$’000
2011Budget
$’000Variance
$’000Variance
%
Cash flows from operating activities
Rates and charges 73,572 70,994 2,578 3.6%
Traffic fines and parking 15,480 16,189 (70 ) (4.4%)
User fees (inclusive of GST) 18,446 17,809 637 3.6%
Grants (inclusive of GST) 9,619 8,969 650 7.2%
Contributions (inclusive of GST) 21 2,916 1,650 1,266 76.7%
Reimbursements (inclusive of GST) 22 1,351 528 823 155.9%
Interest 23 2,900 1,840 1,060 57.6%
Other receipts (inclusive of GST) 24 4,023 5,369 (1,346) (25.1%)
Net GST refund/payment 6,834 5,603 1,231 22.0%
Payments for materials and services (inclusive of GST) (54,312) (53,712) (600) (1.1%)
Payments to employees (including redundancies) (46,603) (44,523) (2,080) (4.7%)
Other payments 25 (3,597) (1,070) (2,527) (236.2%)
Net cash provided by operating activities 30,629 29,646 983 3.3%
Cash flows from investing activities
Payments for property, infrastructure, plant and equipment 26 (26,181) (35,039) 8,858 25.3%
Proceeds from sale of property, infrastructure, plant and equipment
409 401 8 2.0%
Payments for other financial assets 27 (3,444) – (3,444) 0.0%
Net cash (used) in investing activities (29,216) (34,638) 5,422 15.7%
Cash flows from financing activities
Finance costs (223) (245) 22 9.0%
Trust funds and deposits 28 385 50 335 (670.0%)
Repayment of interest bearing loans from Prahran Market Pty Ltd
450 450 – 0.0%
Repayment of interest bearing loans and borrowings 29 (646) (738) 92 12.5%
Net cash (used) in financing activities (34 ) (483) 449 (93.0%)
Net increase (decrease) in cash and cash equivalents 1,379 (5,475) 6,854 125.2%
Cash and cash equivalents at the beginning of the financial year
2,278 7,464 (5,186) 69.5%
Cash and cash equivalents at the end of the financial year
9 3,657 1,989 1,668 83.9%
The accompanying notes form part of this financial report.
STANDARD BALANCE SHEETAS AT 30 JUNE 2011
Note
2011Actual
$’000
2011Budget
$’000Variance
$’000Variance
%
Assets
Current assets
Cash and cash equivalents 9 3,657 1,989 1,668 83.9%
Trade and other receivables 10 7,048 9,139 (2,09) (22.9%)
Other financial assets 11 51,008 40,000 11,008 27.5%
Other assets 12 1,483 1,147 336 29.3%
Total current assets 63,196 52,275 10,921 20.9%
Non-current assets
Trade and other receivables – – – 0.0%
Other financial assets 13 3,377 2,015 1,362 67.6%
Investment in associate accounted for using the equity method
14 1,860 5,234 (3,374) (64.5%)
Property, infrastructure, plant and equipment 1,326,908 1,458,063 (131,155) (9.0%)
Investment property 15 6,750 6,022 728 12.1%
Intangible assets 16 1,449 1,729 (280) (16.2%)
Total non-current assets 1,340,344 1,473,063 (132,719) (9.0%)
Total assets 1,403,540 1,525,338 (121,798) (8.0%)
Liabilities
Trade and other payables 17 15,127 13,123 (2,004) (15.3%)
Trust funds and deposits 18 2,900 2,475 (425) (17.2%)
Provisions 19 11,660 10,878 (782) (7.2%)
Interest-bearing loans and borrowings 970 677 (293) (43.3%)
Total current liabilities 30,657 27,153 (3,504) (12.9%)
Non-current liabilities
Provisions 19 1,398 1,809 411 22.7%
Interest-bearing loans and borrowings 3,446 3,688 242 6.6%
Total non-current liabilities 4,844 5,497 653 11.9%
Total liabilities 35,501 32,650 (2,851) (8.7%)
Net Assets 1,368,039 1,492,688 (124,649) (8.4%)
Equity
Accumulated surplus 523,551 526,656 (3,105) (0.6%)
Reserves 20 844,488 966,032 (121,544) (12.6%)
Total Equity 1,368,039 1,492,688 (124,649) (8.4%)
The accompanying notes form part of this financial report.

Financials
92/93
A: BASIS OF PREPARATION OF THE STANDARD STATEMENTS
The City of Stonnington is required to prepare and include audited Standard Statements within its Annual Report. Four Statements are required - a Standard Income Statement, Standard Balance Sheet, Standard Cash Flow Statement, and Standard Capital Works Statement together with explanatory notes.
These statements and supporting notes form a special purpose financial report prepared to meet the requirements of the Local Government Act 1989 and the Local Government (Finance and Reporting) Regulations 2004.
The Standard Statements have been prepared on accounting bases consistent with those used for the General Purpose Financial Report and the 2010/11 Budget. The results reported in these Statements are consistent with those reported in the 2010/11 General Purpose Financial Report, and have been prepared in accordance with all applicable Accounting Standards or other authoritative professional pronouncements.
The Standard Statements compare Council’s financial plan, expressed through its annual budget, with actual performance. The Local Government Act 1989 requires explanation of any material variances. The Council has adopted a materiality threshold of 10 per cent of budget line items. Explanations have been provided for variations below the materiality threshold if considered to be material because of the nature.
The budget figures included in the Standard Statements are those adopted by the Council at its meeting on 24 May 2010. The budget was based on assumptions that were relevant at the time of adoption of the budget. The Council set guidelines and parameters for revenue and expense targets in this budget in order to meet the council’s business plan and financial performance targets for both the short and long term. The budget also reflected expected changes to equity resulting from asset revaluations, despite the knowledge their impact would be difficult to predict.
Detailed information on the actual financial results are contained in the General Purpose Financial Report. The detailed budget can be obtained by reference to Council’s web site. The Standard Statements must be read with reference to these documents.
Note 1 Grants – Non recurrent Council received the following unbudgeted grants: Harold Holt Swimming Centre redevelopment, Energy Efficient Street lighting, George Gahan Community Centre Roof and Forest Hill Precinct Creating better places.
Note 2 Contributions Developer contributions for public open spaces were higher than budget due to strong levels of development activity.
Note 3 ReimbursementsA greater range of revaluation services provided for State Revenue Office and Service Authorities, Insurance recoveries for various Council properties following storm damage and other operating costs reimbursed by third parties were all in excess of budget.
Note 4 InterestInterest income exceeded budget as the year’s opening cash position and interest rates on investments during the year were both higher than budgeted.
Note 5 Other revenueOther revenue was favourable to budget with higher revenue from transport clearway towing and an unbudgeted Clayton Landfill Joint Venture dividend of $380K.
Note 6 Fair value adjustments for investment propertyThe movement in the valuation of Council’s investment property was lower than budgeted by $42K.
Note 7 DepreciationDepreciation was lower than budget mostly due to the June 2010 revaluation exercise, which was undertaken after the budget was set, causing an extension of road asset lives
Note 8 Other ExpensesOther expenses were higher than budget due to unplanned asset writeoffs and debt collection costs and operating projects both exceeding budget.
Note 9 Cash and cash equivalents Cash and cash equivalents include all term deposit investments with expiry dates less than 90 days from the end of the financial year. Any term deposits maturing greater than 90 days from 30 June 2010 are classified as Other Financial Assets. Council’s short term deposits at June 2011 exceeded budget.
Note 10 Trade and other receivablesLower traffic infringements issued during the year and improved debtor collection processes both contributed to receivables being less than budget at June 2011.
NOTES TO THE STANDARD STATEMENTSFOR THE YEAR ENDED 30 JUNE 2011
STANDARD CAPITAL WORKS STATEMENTFOR THE YEAR ENDED 30 JUNE 2011
Note
2011Actual
$’000
2011Budget
$’000Variance
$’000Variance
%
Capital Expenditure By Asset Class:
Land Improvement 30 5,290 4,450 (840) (18.9%)
Buildings 11,416 11,908 492 4.1%
Motor Vehicles, Plant, and Equipment 2,230 2,140 (90) (4.2%)
Other (Library Books, Office Equipment, Furniture) 31 1,981 2,346 365 15.6%
Road Others 32 1,080 1,556 476 30.6%
Drainage, Roads, Foothpaths. Kerb & Channels, ROW’s, Bridges
7,928 8,720 792 9.1%
29,925 31,120 1,195 3.8%
Equity in Joint Venture:
Leased Plant, Motor Vehicles, and Equipment 373 – (373) 0.0%
373 – (373) 0.0%
Intangible Assets 690 834 144 17.3%
30,988 31,954 966 3.0%
Types of Capital Works
Renewal/Replace 18,722 18,862 140 0.7%
Upgrade 6,425 6,621 196 3.0%
Expansion 883 805 (78) (9.7%)
New Assets 4,958 5,666 708 12.5%
Total Capital Works 30,988 31,954 966 3.0%
Property, Plant, and Equipment movement
Reconciliation Worksheet:
Total capital works 30,988 31,954 966 3.0%
Movement in fair value of investment property 144 186 42 22.6%
Asset revaluation movement – 84,000 84,000 100.0%
Depreciation/amortisation (17,051) (20,964) (3,913) 18.7%
Written down value of assets sold (571) (447) 124 (27.7%)
Termination of Finance Leases – – – 0.0%
Fully depreciated assets Written Back – – – 0.0%
Write off/ Adjustment assets (74) – 74 0.0%
Net Movement – Property, Plant, and Equipment, Intangibles and Investment Property
13,436 94,729 81,293 85.8%
The accompanying notes form part of this financial report.

Financials
94/95
CERTIFICATION OF THE STANDARD STATEMENTS
In my opinion, the accompanying standard statements have been prepared on accounting bases consistent with the financial report and in accordance with the Local Government Act 1989 and the Local Government (Finance and Reporting) Regulations 2004.
Brian Hood CPAPrincipal Accounting Officer
29 August 2011 Malvern
In our opinion, the accompanying standard statements have been prepared on accounting bases consistent with the financial report and in accordance with the Local Government Act 1989 and the Local Government (Finance and Reporting) Regulations 2004.
As at the date of signing, we are not aware of any circumstances which would render any particulars in the standard statements to be misleading or inaccurate.
We have been authorised by the Council on 29 August 2011 to certify the standard statements on its behalf in their final form.
Cr Melina Sehr Mayor
29 August 2011 Malvern
Anne O’Shea Councillor
29 August 2011 Malvern
Warren Roberts Chief Executive Officer
29 August 2011 Malvern
NOTES TO THE STANDARD STATEMENTSFOR THE YEAR ENDED 30 JUNE 2011
Note 11 Other Financial assets – currentThe stronger than budgeted operating performance, more effective cash collection processes and some timing delays in capital works all contributed to cash investments exceeding budget.
Note 12 Other assetsAccrued interest on investments is higher than budgeted.
Note 13 Other Financial assets – non currentOther financial assets exceeded budget due to the inclusion of shares held in Regional Kitchen Pty Ltd.
Note 14 Investment in associate accounted for using the equity methodSee note 13 – this item was less than budget as the investment in Regional Kitchen Pty Ltd is now shown under ‘other financial assets’.
Note 15 Investment PropertyThe value of Council’s City Square investment property exceeded expectations.
Note 16 Intangible assets Lower than budget expenditure on software meant that intangible assets are under budget.
Note 17 Trade and other payablesThe value of payments outstanding for trade creditors at 30 June 2011 was higher than expected due to a significant volume of capital works performed in the last quarter of 2010/11.
Note 18 Trust funds and depositsThe movement in trusts and deposits held is unpredictable. In contrast to budget assumptions, receipts for the year exceeded refunds paid.
Note 19 ProvisionsThe Long Service Leave provision is calculated under the new Enterprise Bargaining Agreement and reflects newly negotiated entitlements.
Note 20 Reserves The asset revaluation decrement booked in 2009/10 was not anticipated in the budget.
Note 21 Contributions (inclusive of GST)Developer contributions for public open spaces were higher than budget due to strong levels of development activity.
Note 22 Reimbursements (inclusive of GST) A greater range of revaluation services provided for State Revenue Office and Service Authorities, Insurance
recoveries for various Council properties following storm damage and other operating costs reimbursed by third parties were all in excess of budget.
Note 23 InterestInterest income exceeded budget as the year’s opening cash position and interest rates on investments during the year were both higher than budgeted.
Note 24 Other receipts (inclusive of GST)Other receipts were unfavourable to budget due to timing issues.
Note 25 Other paymentsOther payments were higher than budget due to debt collection costs and operating projects both exceeding budgets.
Note 26 Payments for property, infrastructure, plant and equipmentTiming delays in capital projects have caused below budget expenditure, although significant commitments and projects commenced late in 2010/11 will be carried over into 2011/12 and completed in that year.
Note 27 Payments for other financial assetsThis variance relates to the increase in longer term cash deposits.
Note 28 Trust funds and depositsThe movement in trusts and deposits held is unpredictable. In contrast to budget assumptions, the receipts for the year exceeded refunds paid.
Note 29 Repayment of interest bearing loans and borrowingsFinance lease payments were slightly lower than budget assumptions.
Note 30 Land Improvement Includes expenditure on capital works carried over from 2009/10 not provided for in the 2010/11 budget
Note 31 Other (Library Books, Office Equipment, Furniture) Savings were realised across a range of projects.
Note 32 Road Others A number of projects were not completed in 2010/11 and will be carried over to the 2011/12 financial year.

Financials
96/97
AUDITOR GENERAL’S REPORT ON THE STANDARD STATEMENTSAUDITOR GENERAL’S REPORT ON THE STANDARD STATEMENTS
Financials
98/99
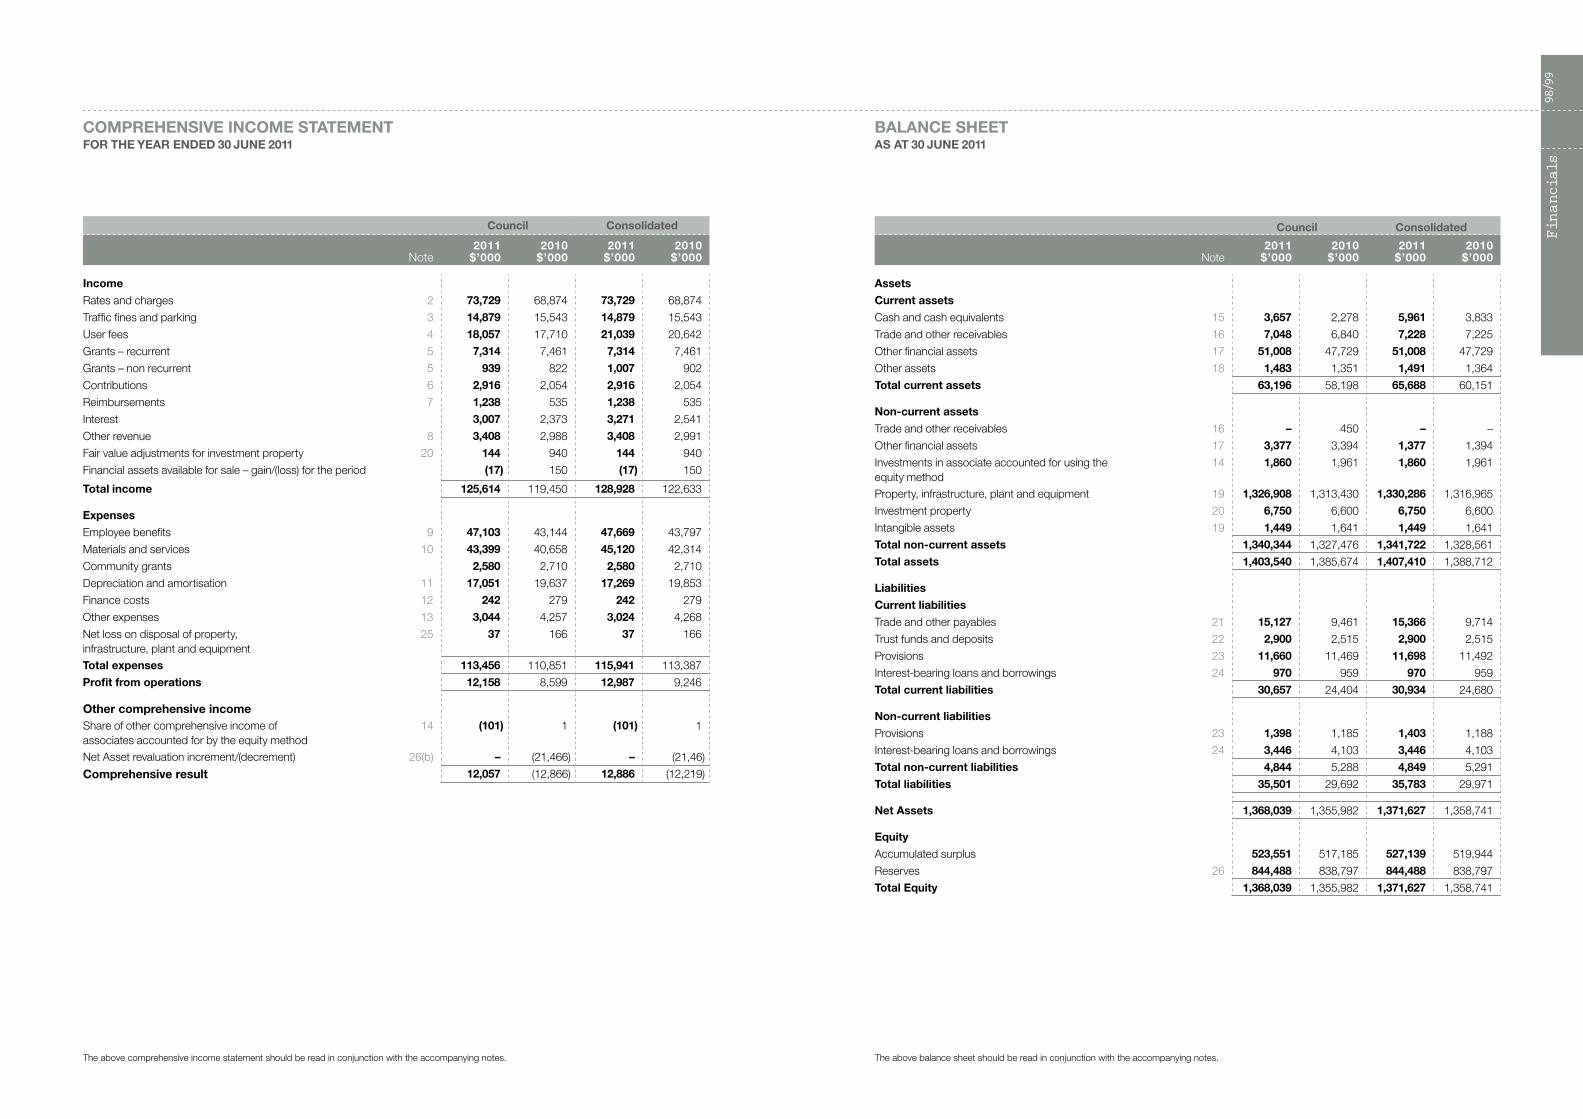
BALANCE SHEETAS AT 30 JUNE 2011
Council Consolidated
Note2011
$’0002010
$’0002011
$’0002010
$’000
Assets
Current assets
Cash and cash equivalents 15 3,657 2,278 5,961 3,833
Trade and other receivables 16 7,048 6,840 7,228 7,225
Other financial assets 17 51,008 47,729 51,008 47,729
Other assets 18 1,483 1,351 1,491 1,364
Total current assets 63,196 58,198 65,688 60,151
Non-current assets
Trade and other receivables 16 – 450 – –
Other financial assets 17 3,377 3,394 1,377 1,394
Investments in associate accounted for using the equity method
14 1,860 1,961 1,860 1,961
Property, infrastructure, plant and equipment 19 1,326,908 1,313,430 1,330,286 1,316,965
Investment property 20 6,750 6,600 6,750 6,600
Intangible assets 19 1,449 1,641 1,449 1,641
Total non-current assets 1,340,344 1,327,476 1,341,722 1,328,561
Total assets 1,403,540 1,385,674 1,407,410 1,388,712
Liabilities
Current liabilities
Trade and other payables 21 15,127 9,461 15,366 9,714
Trust funds and deposits 22 2,900 2,515 2,900 2,515
Provisions 23 11,660 11,469 11,698 11,492
Interest-bearing loans and borrowings 24 970 959 970 959
Total current liabilities 30,657 24,404 30,934 24,680
Non-current liabilities
Provisions 23 1,398 1,185 1,403 1,188
Interest-bearing loans and borrowings 24 3,446 4,103 3,446 4,103
Total non-current liabilities 4,844 5,288 4,849 5,291
Total liabilities 35,501 29,692 35,783 29,971
Net Assets 1,368,039 1,355,982 1,371,627 1,358,741
Equity
Accumulated surplus 523,551 517,185 527,139 519,944
Reserves 26 844,488 838,797 844,488 838,797
Total Equity 1,368,039 1,355,982 1,371,627 1,358,741
The above balance sheet should be read in conjunction with the accompanying notes.
COMPREHENSIVE INCOME STATEMENTFOR THE YEAR ENDED 30 JUNE 2011
Council Consolidated
Note2011
$’0002010
$’0002011
$’0002010
$’000
Income
Rates and charges 2 73,729 68,874 73,729 68,874
Traffic fines and parking 3 14,879 15,543 14,879 15,543
User fees 4 18,057 17,710 21,039 20,642
Grants – recurrent 5 7,314 7,461 7,314 7,461
Grants – non recurrent 5 939 822 1,007 902
Contributions 6 2,916 2,054 2,916 2,054
Reimbursements 7 1,238 535 1,238 535
Interest 3,007 2,373 3,271 2,541
Other revenue 8 3,408 2,988 3,408 2,991
Fair value adjustments for investment property 20 144 940 144 940
Financial assets available for sale – gain/(loss) for the period (17) 150 (17) 150
Total income 125,614 119,450 128,928 122,633
Expenses
Employee benefits 9 47,103 43,144 47,669 43,797
Materials and services 10 43,399 40,658 45,120 42,314
Community grants 2,580 2,710 2,580 2,710
Depreciation and amortisation 11 17,051 19,637 17,269 19,853
Finance costs 12 242 279 242 279
Other expenses 13 3,044 4,257 3,024 4,268
Net loss on disposal of property, infrastructure, plant and equipment
25 37 166 37 166
Total expenses 113,456 110,851 115,941 113,387
Profit from operations 12,158 8,599 12,987 9,246
Other comprehensive incomeShare of other comprehensive income of associates accounted for by the equity method
14 (101) 1 (101) 1
Net Asset revaluation increment/(decrement) 26(b) – (21,466) – (21,46)
Comprehensive result 12,057 (12,866) 12,886 (12,219)
The above comprehensive income statement should be read in conjunction with the accompanying notes.

Financials
100/101
CASH FLOW STATEMENTFOR THE YEAR ENDED 30 JUNE 2011
Council Consolidated
Note
2011 Inflows/
(Outflows)$’000
2010 Inflows/
(Outflows)$’000
2011 Inflows/
(Outflows)$’000
2010 Inflows/
(Outflows)$’000
Cash flows from operating activities
Rates and charges 73,572 68,475 73,572 68,475
Traffic fines and parking 15,480 15,656 15,480 15,656
User fees (inclusive of GST) 18,446 18,800 22,534 24,616
Grants (inclusive of GST) 9,619 8,842 9,619 8,842
Contributions (inclusive of GST) 2,916 2,054 2,916 2,054
Reimbursements (inclusive of GST) 1,351 583 1,351 583
Interest 2,900 2,140 2,972 2,177
Other receipts (inclusive of GST) 4,023 2,626 4,023 2,626
Net GST refund/(payment) 6,834 5,904 6,675 5,766
Payments for materials and services (inclusive of GST) (54,312) (49,517) (57,016) (54,536)
Payments to employees (including redundancies) (46,603) (41,397) (46,603) (41,397)
Other payments (3,597) (595) (3,597) (595)
Net cash provided by operating activities 28 (a) 30,629 33,571 31,926 34,267
Cash flows from investing activities
Payments for property, infrastructure, plant and equipment (26,181) (39,750) (26,255) (39,973)
Proceeds from sale of property, infrastructure, plant and equipment
409 550 409 550
Payments for other financial assets 28 (b) (3,444) (663) (3,444) (663)
Net cash (used) in investing activities (29,216) (39,863) (29,290) (40,086)
Cash flows from financing activities
Finance costs (223) (282) (246) (311)
Trust funds and deposits 385 140 384 140
Proceeds from interest bearing loans and borrowings 450 – 450 –
Repayment of interest bearing loans and borrowings (646) (831) (1,096) (831)
Net cash (used) in financing activities (34) (973) (508) (1,002)
Net increase/(decrease) in cash and cash equivalents 1,379 (7,265) 2,128 (6,821)
Cash and cash equivalents at the beginning of the financial year
2,278 9,543 3,833 10,654
Cash and cash equivalents at the end of the financial year
29 3,657 2,278 5,961 3,833
Financing arrangements 30
Restrictions on cash assets 31
The above cash flow statement should be read in conjunction with the accompanying notes.
STATEMENT OF CHANGES IN EQUITYFOR THE YEAR ENDED 30 JUNE 2011
Note
Total 2011
$’000
Accumulated Surplus
2011$’000
AssetRevaluation
Reserve 2011
$’000
Other Reserves
2011$’000
Council 2011
Balance at beginning of the financial year 1,355,982 517,185 824,844 13,953
Profit from operations 12,158 12,158 – –
Share of other comprehensive income of associates accounted for by the equity method
14 (101) (101) – –
Transfers from other reserves 26 – 50 – (50)
Transfers to other reserves 26 – (5,741) – 5,741
Balance at end of the financial year 1,368,039 523,551 824,844 19,644
Consolidated 2011
Balance at beginning of the financial year 1,358,741 519,944 824,844 13,953
Profit from operations 12,987 12,987 – –
Share of other comprehensive income of associates accounted for by the equity method
(101) (101) – –
Transfers from other reserves – 50 – (50)
Transfers to other reserves – (5,741) – 5,741
Balance at end of the financial year 1,371,627 527,139 824,844 19,644
Note
Total 2010
$’000
Accumulated Surplus
2010$’000
AssetRevaluation
Reserve 2010
$’000
Other Reserves
2010$’000
Council 2010
Balance at beginning of the financial year 1,374,455 513,423 846,310 14,722
Profit from operations 8,599 8,599 – –
Prior period Road Extra assets written off 27 (5,607) (5,607)
Net asset revaluation increment 26 (21,466) – (21,466) –
Share of other comprehensive income of associates accounted for by the equity method
14 1 1 – –
Transfers from other reserves 14 – 1,169 – (1,169)
Transfers to other reserves 26 – (400) – 400
Balance at end of the financial year 1,355,982 517,185 824,844 13,953
Consolidated 2010
Balance at beginning of the financial year 1,376,567 515,535 846,310 14,722
Profit from operations 9,246 9,246 – –
Prior period Road Extra assets written off 27 (5,607) (5,607) – –
Net asset revaluation increment (21,466) – (21,466) –
Share of other comprehensive income of associates accounted for by the equity method
1 1 – –
Transfers from other reserves – 1,169 – (1,169)
Transfers to other reserves – (400) – 400
Balance at end of the financial year 1,358,741 519,944 824,844 13,953
The above statement of change in equity should be read in conjunction with the accompanying notes.

Financials
102/103
contribution will flow to the Council, and the amount of the contribution can be measured reliably.
Where grants recognised as revenues during the financial year were obtained on condition that they be expended in a particular manner or used over a particular period and those conditions were undischarged at balance date, the unused grant is disclosed in note 5. The note also discloses the amount of unused grant from prior years that was expended on Council’s operations during the current year.
Grant revenue received in advance of a financial year has been treated as income in the year of receipt in accordance with AASB1004, notwithstanding the grant relates to the subsequent year and services funded by the grant are yet to be delivered.
User fees and finesUser fees and fines (including parking fees and fines) are recognised as revenue when the service has been provided, the payment is received, or when the penalty has been applied, whichever first occurs.
A provision for doubtful debts is recognised when collection in full is no longer probable.
Sale of property, infrastructure, plant and equipmentThe profit or loss on sale of an asset is determined when control of the asset has irrevocably passed to the buyer.
Interest and rentsInterest and rents are recognised as revenue on a proportional basis when the payment is due, the value of the payment is notified, or the payment is received, whichever first occurs.
DividendsDividend revenue is recognised when the Council’s right to receive payment is established.
(d) Depreciation and amortisation of non-current assets
Land improvements and buildings, infrastructure, plant and equipment, heritage assets, and other assets having limited useful lives are systematically depreciated over their useful lives to the Council in a manner which reflects consumption of the service potential embodied in those assets. Estimates of remaining useful lives and residual values are made on a regular basis. Depreciation rates and methods are reviewed annually.
Where infrastructure assets have separate identifiable components that are subject to regular replacement, these components are assigned distinct useful lives and residual values and a separate depreciation rate is determined for each component.
Straight line depreciation is charged based on the residual useful life as determined each year.
Major depreciation periods used are listed below with changes made to a number of Infrastructure assets types to better reflect the actual annual asset consumption:
Property
Land Improvements 20 yearsBuildings 50 yearsHeritage Buildings 100 years
Plant, Motor Vehicles & Equipment
Plant & Equipment 4-10 yearsMotor Vehicles 3-5 years Furniture & Equipment 5-10 yearsOffice Equipment & Information Technology 4-10 yearsHeritage Indoor Assets 100 years Library Stocks 3-8 yearsIntangible Assets 4 years
Infrastructure
Road Surface 25 yearsRoad Substructure 200 yearsSealed Footpaths 30-40 yearsKerb & Channel 60-80 yearsBridges 80 yearsRights of Way 15-200 yearsCar Parks 50 yearsDrains 100 yearsDrainage Pits 50 yearsRoad Extras 10-25 years
Following a condition assessment on road assets by Council engineers, the useful life of road substucture assets was revised from 150 years to 200 years. This change was effective from 1 July 2010, which resulted in a reduction in depreciation of $177K.
(e) Repairs and maintenanceRoutine maintenance, repair costs, and minor renewal costs are expensed as incurred. Where the repair relates to the replacement of a component of an asset and the cost exceeds the capitalisation threshold the cost is capitalised and depreciated. The carrying value of the replaced asset is expensed.
(f) Finance costsFinance costs are recognised as an expense in the year in which they are incurred, except where they are capitalised as part of a qualifying asset constructed by Council. No finance costs were capitalised during the reporting year (nil in 2010).
Note 1 Significant accounting policies (cont.)
INTRODUCTION
(a) The Stonnington City Council was established by an Order of the Governor in Council on 22 June 1994 and is a body corporate. The Council’s main office is located at 1251 High Street, Malvern, Victoria.
(b) The purpose of the Council is: – to provide for the peace, order, and good government
of its municipal district; – to promote the social, economic, and environmental
viability and sustainability of the municipal district; – to ensure that resources are used efficiently and
effectively and services are provided in accordance with Best Value Principles to best meet the needs of the local community;
– to improve the overall quality of life of people in the local community;
– to promote appropriate business and employment opportunities;
– to ensure that services and facilities provided by the Council are accessible and equitable;
– to ensure the equitable imposition of rates and charges; and
– to ensure transparency and accountability in Council decision making.
This financial report is a general purpose financial report that consists of a Comprehensive Income Statement, Balance Sheet, Statement of Changes in Equity, Cash Flow Statement, and notes accompanying these financial statements. The general purpose financial report complies with Australian Accounting Standards, other authoritative pronouncements of the Australian Accounting Standards Board, the Local Government Act 1989, and the Local Government (Finance and Reporting) Regulations 2004.
Reference to Council in this report includes the Council and its controlled entity.
NOTE 1SIGNIFICANT ACCOUNTING POLICIES
(a) Basis of accountingThis financial report has been prepared on the accrual and going concern basis.
This financial report has been prepared under the historical cost convention, except where specifically stated in notes 1(f), 1(g), 1(h), 1(i), 1(j) and 1(n).
Unless otherwise stated, all accounting policies are consistent with those applied in the prior year. Where appropriate, comparative figures have been amended to accord with current presentation and disclosure has been made of any material changes to comparatives.
(b) Basis of consolidation The consolidated financial statements comprise the financial statements of Council and those entities over which Council has the power to govern the financial and operating policies to obtain benefits from their activities. The financial statements of Council’s controlled entities are prepared for the same period as Council, using consistent accounting policies. The assets, liabilities, incomes and expenses of all controlled entities of Council have been included at the values shown in their audited financial reports. In preparing the consolidated financial statements, all inter-entity balances and transactions, income and expenses, and profit and losses from intra-group transactions have been eliminated in full.
Where there are no material differences between the Council and consolidated figures in the notes to the financial statements, then the consolidated figures are not displayed.
(c) Revenue recognition
Rates, grants, and contributionsRates, grants, and contributions (including developer contributions) are recognised as revenues when Council obtains control over the assets comprising these receipts
Control over assets acquired from rates is obtained at the commencement of the rating year as it is an enforceable debt linked to the rateable property or, where earlier, upon receipt of the rates. A provision for doubtful debts on rates has not been established as unpaid rates represent a charge against the rateable property that will be recovered when the property is next sold.
Control over granted assets is normally obtained upon their receipt (or acquittal) or upon earlier notification that a grant has been secured, and are valued at their fair value at the date of transfer.
Contribution revenue is recognised when the Council obtains control of the contribution or the right to receive the contribution, it is probable that the economic benefits comprising the
NOTES TO THE FINANCIAL REPORTFOR THE YEAR ENDED 30 JUNE 2011

Financials
104/105
(j) Investment propertyInvestment property, Malvern City Square, is held to generate long-term rental yields and increased capital value. All tenant leases are on an arms length basis. Investment property is carried at fair value $6,750,000 ($6,600,000 2010), determined annually by Council’s valuers. Changes to fair value are recorded in the Comprehensive Income Statement. (refer note 20).
(k) Cash and cash equivalentsFor the purposes of the cash flow statement, cash and cash equivalents include cash on hand, deposits at call, and other highly liquid investments with original maturities of three months or less, net of outstanding bank overdrafts.
(l) Financial assetsTerm deposits are valued at cost and interest revenues are recognised as they accrue. The policy is to hold Term Deposits through to their maturity (refer note 36).
(m) Other financial assetsShares in the Prahran Market Pty Ltd, Regional Kitchen Pty Ltd, RFK Pty Ltd, and MAPS are measured at cost or fair value depending on the nature of the investment.
(n) Accounting for investments in associates Council’s investments in associates is accounted for using the equity method as the Council has the ability to influence rather than control the operations of the entities. The investment is initially recorded at the cost of acquisition and adjusted thereafter for post-acquisition changes in the Council’s share of the net assets of the Investments. The Council’s share of the financial results of the Investments is recognised in the Comprehensive Income Statement of the year (refer note 14).
(o) Joint venture operationsThe municipality’s interest in a joint ventures’ operation is recognised by including its share of any assets, liabilities, revenue, and expenses of the joint venture within the relevant items reported in Council’s Comprehensive Income Statement, Balance Sheet, and Cash Flows Statement. All intra – entity transactions have been eliminated in full, in the preparation of these accounts (refer note 40).
(p) Contract deposits and retention amountsAmounts received as contract deposits and retention amounts controlled by Council are recognised as Trust funds until they are returned or forfeited (refer to note 22).
(q) Employee benefits
Wages and salariesLiabilities for wages and salaries and rostered days off are recognised and measured as the amount unpaid at balance date and include appropriate oncosts such as workers compensation and payroll cost.
Annual Leave and Long Service LeaveLiabilities for services rendered by employees are recognised at the reporting date to the extent that they have not been settled.
The liability for employee benefits includes annual leave and long service leave. No provision has been made for sick leave as all sick leave is non-vesting and the average sick leave taken in future years by employees of the Council is estimated to be less than the annual entitlement for sick leave.
The leave liabilities are calculated on the basis of employee remuneration to the extent that the leave is likely to be taken during service rather than paid out on termination.
All annual leave is deemed to be current. For long service leave, any amount accrued for an employee with more than 7 years service is classified as current. Service of less than 7 years is classified as a non-current liability.
The measurement of liabilities for annual leave and long service leave has been determined by reference to estimated settlement of the leave as at 30 June 2011 taking into account attrition rates and pay increases through promotion and certified agreements and increments.
Liabilities for ‘short-term employee benefits’ (as defined in AASB 119) due within twelve months of balance date are measured at their nominal amounts with regard to the rates expected to be paid on settlement of the liability.
All other employee benefit liabilities are measured at the present value of the estimated future cash outflows to be made in respect of services provided by employees up to the reporting date. Commonwealth bond rates are used for discounting future cash flows.
SuperannuationA liability is recognised in respect of Council’s present obligation to meet the unfunded obligations of defined benefit superannuation schemes to which its employees are members. The liability is defined as the Council’s share of the scheme’s unfunded position, being the difference between the present value of employees’ accrued benefits and the net market value of the scheme’s assets at balance date. The liability also includes applicable contributions tax of 15% (2010, 15%).
Note 1 Significant accounting policies (cont.)
(g) Recognition and measurement of assets
AcquisitionThe purchase method of accounting is used for all acquisitions of assets, being the fair value of assets provided as consideration at the date of acquisition plus any incidental costs attributable to the acquisition. Fair value is the amount for which the asset could be exchanged between knowledgeable willing parties in an arm’s length transaction.
Where assets are constructed by Council, cost includes all materials used in construction, direct labour, and an appropriate share of directly attributable variable and fixed overheads.
The following classes of assets have been recognised in note 19. In accordance with Council’s policy, the threshold limits detailed below have been applied when recognising assets within an applicable asset class and unless otherwise stated are consistent with the prior year:
No changes have been made to the asset recognition threshold limits during the 2011 financial year.
Threshold Limit $’000
PropertyLand all landLand under roads 10Land Improvements 5Buildings (incl Heritage Buildings) 5
Plant, Motor Vehicles, Furniture & EquipmentPlant & Equipment 1Motor Vehicles allFurniture & Equipment 1Office Equipment & Information Technology 1Heritage Indoor Assets 1Library Stocks all holdings with life exceeding one year Intangible Assets 1
InfrastructureRoads, Streets, Rights of way, and Bridges 10Road Extras 10Drainage 10
RevaluationSubsequent to the initial recognition of assets, non-current physical assets, other than plant and equipment (motor vehicles, office equipment and information technology, furniture and equipment, heritage indoor assets and library stocks), are measured at their fair value, being the amount for which the assets could be exchanged between knowledgeable willing parties in an arms length transaction (being either market value or written down replacement cost). At balance date, the Council reviewed the carrying value of the individual classes of assets measured at fair value to ensure that each asset materially approximated its fair value. Where the carrying value materially differed from the fair value at balance date the class of asset was revalued.
In addition, Council undertakes a formal revaluation of land, buildings, and infrastructure assets on a regular basis ranging from 2 to 4 years. The valuation is performed by experienced council officers.
Where assets are revalued, the revaluation increments are credited directly to the asset revaluation reserve except to the extent that an increment reverses a prior year decrement for that class of asset that had been recognised as an expense in which case the increment is recognised as revenue up to the amount of the relevant expense. Revaluation decrements are recognised as an expense except where prior increments are included in the asset revaluation reserve for that class of asset in which case the decrement is taken to the reserve to the extent of the remaining increments. Within the same class of assets, revaluation increments and decrements within the year are offset.
Land under roadsLand under roads acquired after 30 June 2008 is brought to account using the cost basis. Council does not recognise land under roads that it controlled prior to that date in its financial report.
(h) Impairment of assetsAt each reporting date, the Council reviews the carrying value of its assets to determine whether there is any indication that these assets have been impaired. If such an indication exists, the recoverable amount of the asset, being the higher of the asset’s fair value less costs to sell and value in use, is com-pared to the asset’s carrying value. Any excess of the asset’s carrying value over its recoverable amount is expensed to the Comprehensive Income Statement.
(i) Non-current assets held for sale A non-current asset held for sale is measured at the lower of its carrying amount and fair value less costs to sell.
Note 1 Significant accounting policies (cont.)
NOTES TO THE FINANCIAL REPORTFOR THE YEAR ENDED 30 JUNE 2011

Financials
106/107
Standard / Interpretation Summary
Applicable for annual reporting periods beginning or ending on
Impact on Local Government financial statements
AASB 9: Financial Instruments and AASB 2009-11: Amendments to Australian Accounting Standards arising from AASB 9 [AASB 1, 3, 4, 5, 7, 101, 102, 108, 112, 118, 121, 127, 128, 131, 132, 136, 139, 1023 & 1038 and Interpretations 10 & 12]
These standards are applicable retrospectively and amend the classification and measurement of financial assets. Council has not yet determined the potential impact on the financial statements. Specific changes include:– simplifying the classifications of financial assets
into those carried at amortised cost and those carried at fair value;
– removing the tainting rules associated with held-to-maturity assets;
– simplifying the requirements for embedded derivatives;
– removing the requirements to separate and fair value embedded derivatives for financial assets carried at amortised cost;
– allowing an irrevocable election on initial recognition to present gains and losses on investments in equity instruments that are not held for trading in other comprehensive income. Dividends in respect of these investments that are a return on investment can be recognised in profit or loss and there is no impairment or recycling on disposal of the instrument; and
– reclassifying financial assets where there is a change in an entity’s business model as they are initially classified based on:a. the objective of the entity’s business model for
managing the financial assets; andb. the characteristics of the contractual cash flows.
Applicable for annual reporting periods commencing on or after 1 January 2013.
These changes are expected to provide some simplification in the accounting for and disclosure of financial instruments
AASB 124: Related Party Disclosures
This standard removes the requirement for government related entities to disclose details of all transactions with the government and other government related entities and clarifies the definition of a related party to remove inconsistencies and simplify the structure of the standard.
Applicable for annual reporting periods commencing on or after 1 January 2011.
Although this standard does not strictly apply to Local Government it is often used as guidance, as such there will be greater clarity on the disclosure of inter government transactions.
Note 1 Significant accounting policies (cont.)
The superannuation expense for the reporting year is the amount of the statutory contribution the Council makes to the superannuation plans which provide benefits to its employees together with any movements (favourable/unfavourable) in the position of any defined benefits schemes. Details of these arrangements are recorded in note 32.
Retirement gratuitiesRetirement gratuities were provided to certain employees who joined the Council prior to 18 October 1995. The liability represents a set proportion of accumulated sick leave that is payable on retirement. At balance date, the liability is measured at the present value of estimated future cash flows to be made for this entitlement. Retirement gratuities expected to be paid later than one year have been measured at the present value of the estimated future cash outflows to be made for these accrued entitlements. Commonwealth bond rates are used for discounting future cash flows.
(r) LeasesFinance leasesLeases of assets where substantially all the risks and benefits incidental to ownership of the asset, but not the legal ownership, are transferred to the Council are classified as finance leases. Finance leases are capitalised, recording an asset and a liability equal to the present value of the minimum lease payments, including any guaranteed residual value. Lease payments are allocated between the reduction of the lease liability and the interest expense. Leased assets are amortised on a straight line basis over their estimated useful lives to the Council where it is likely that the Council will obtain ownership of the asset or over the term of the lease, whichever is the shorter. Leased assets that are currently held by Streetsahead Cleaning Service are being amortised over a 2 to 5 year period (refer notes 19, 24 and 40).
Operating leasesLease payments for operating leases are recognised as an expense in the years in which they are incurred as this reflects the pattern of benefits derived by the Council (refer note 34).
(s) Allocation between current and non-currentIn the determination of whether an asset or liability is current or non-current, consideration is given to the time when each asset or liability is expected to be settled. An asset or liability is classified as current if it is expected to be settled within the next twelve months, being the Council’s operational cycle.
(t) Agreements equally proportionately unperformedThe Council does not recognise assets and liabilities arising from agreements that are equally proportionately unperformed. Such agreements are recognised on an ‘as incurred’ basis.
(u) Web site costsCosts in relation to web sites are charged as an expense in the year in which they are incurred.
(v) Goods and Services Tax (GST)Revenues, expenses, and assets are recognised net of GST, except where the GST incurred is not recoverable from the Australian Taxation Office. In these circumstances, the GST is recognised as part of the cost of acquisition of the asset or as part of an expense. Receivables and payables are shown inclusive of GST.
Cash flows are presented in the Cash Flows Statement on a gross basis, except for the GST component of investing and financing activities, which are disclosed as operating cash flows.
(w) Financial guaranteesFinancial guarantee contracts are recognised as a liability at the time the guarantee is issued. The liability is initially measured at fair value, and if there is material increase in the likelihood that the guarantee may have to be exercised, at the higher of the amount determined in accordance with AASB 137 Provisions, Contingent Liabilities and Contingent Assets and the amount initially recognised less cumulative amortisation, where appropriate. In the determination of fair value, consideration is given to factors including the probability of default by the guaranteed party and the likely loss to Council in the event of default.
(x) Pending Accounting StandardsThe following Australian Accounting Standards have been issued or amended and are applicable to the Council but are not yet effective.
They have not been adopted in preparation of the financial statements at reporting date. The financial impact of the Standards when applied is expected to be minimal.
NOTES TO THE FINANCIAL REPORTFOR THE YEAR ENDED 30 JUNE 2011
Note 1 Significant accounting policies (cont.)

Financials
108/109
Standard / Interpretation Summary
Applicable for annual reporting periods beginning or ending on
Impact on Local Government financial statements
AASB 2009-12: Amendments to Australian Accounting Standards [AASBs 5, 8, 108, 110, 112, 119, 133, 137, 139, 1023 & 1031 and Interpretations 2, 4, 16, 1039 & 1052]
This standard makes a number of editorial amendments to a range of Australian Accounting Standards and Interpretations, including amendments to reflect changes made to the text of International Financial Reporting Standards by the IASB. The standard also amends AASB 8 to require entities to exercise judgment in assessing whether a government and entities known to be under the control of that government are considered a single customer for the purposes of certain operating segment disclosures.
Applicable for annual reporting periods commencing on or after 1 January 2011.
These amendments are not expected to impact Council
AASB 2009-13: Amendments to Australian Accounting Standards arising from Interpretation 19 [AASB 1]
This standard makes amendments to AASB 1 arising from the issue of Interpretation 19. The amendments allow a first-time adopter to apply the transitional provisions in Interpretation 19.
Applicable for annual reporting periods commencing on or after 1 July 2010.
These amendments are not expected to impact Council
AASB 2009-14: Amendments to Australian Interpretation – Prepayments of a Minimum Funding Requirement [AASB Interpretation 14]
This standard amends Interpretation 14 to address unintended consequences that can arise from the previous accounting requirements when an entity prepays future contributions into a defined benefit pension plan.
Applicable for annual reporting periods commencing on or after 1 January 2011.
These amendments are not expected to impact Council
AASB Interpretation 19: Extinguishing Financial Liabilities with Equity Instruments
This Interpretation deals with how a debtor would account for the extinguishment of a liability through the issue of equity instruments. The Interpretation states that the issue of equity should be treated as the consideration paid to extinguish the liability, and the equity instruments issued should be recognised at their fair value unless fair value cannot be measured reliably in which case they shall be measured at the fair value of the liability extinguished. The Interpretation deals with situations where either partial or full settlement of the liability has occurred.
Applicable for annual reporting periods commencing on or after 1 July 2010.
This Interpretation is not expected to impact Council.
(y) RoundingUnless otherwise stated, amounts in the financial report have been rounded to the nearest thousand dollars.
Standard / Interpretation Summary
Applicable for annual reporting periods beginning or ending on
Impact on Local Government financial statements
AASB 2009-4: Amendments to Australian Accounting Standards arising from the Annual Improvements Project [AASB 2 and AASB 138 and AASB Interpretations 9 & 16] and AASB 2009-5: Further Amendments to Australian Accounting Standards arising from the Annual Improvements Project [AASB 5, 8, 101, 107, 117, 118, 136 & 139]
These standards detail numerous non-urgent but necessary changes to accounting standards arising from the IASB’s annual improvements project.
Applicable for annual reporting periods commencing from 1 January 2010.
These amendments are not expected to impact Council
AASB 2009-8: Amendments to Australian Accounting Standards – Group Cash-settled Share-based Payment Transactions [AASB 2]
These amendments clarify the accounting for group cash-settled share-based payment transactions in the separate or individual financial statements of the entity receiving the goods or services when the entity has no obligation to settle the share-based payment transaction. The amendments incorporate the requirements previously included in Interpretation 8 and Interpretation 11 and as a consequence, these two Interpretations are superseded by the amendments.
Applicable for annual reporting periods commencing on or after 1 January 2010.
These amendments are not expected to impact Council
AASB 2009-9: Amendments to Australian Accounting Standards – Additional Exemptions for First-time Adopters [AASB 1]
These amendments specify requirements for entities using the full cost method in place of the retrospective application of Australian Accounting Standards for oil and gas assets, and exempt entities with existing leasing contracts from reassessing the classification of those contracts in accordance with Interpretation 4 when the application of their previous accounting policies would have given the same outcome.
Applicable for annual reporting periods commencing on or after 1 January 2010.
These amendments are not expected to impact Council
AASB 2009-10: Amendments to Australian Accounting Standards – Classification of Rights Issues [AASB 132]
These amendments clarify that rights, options or warrants to acquire a fixed number of an entity's own equity instruments for a fixed amount in any currency are equity instruments if the entity offers the rights, options or warrants pro-rata to all existing owners of the same class of its own non-derivative equity instruments.
Applicable for annual reporting periods commencing on or after 1 February 2010.
These amendments are not expected to impact Council
NOTES TO THE FINANCIAL REPORTFOR THE YEAR ENDED 30 JUNE 2011
Note 1 Significant accounting policies (cont.)

Financials
110/111
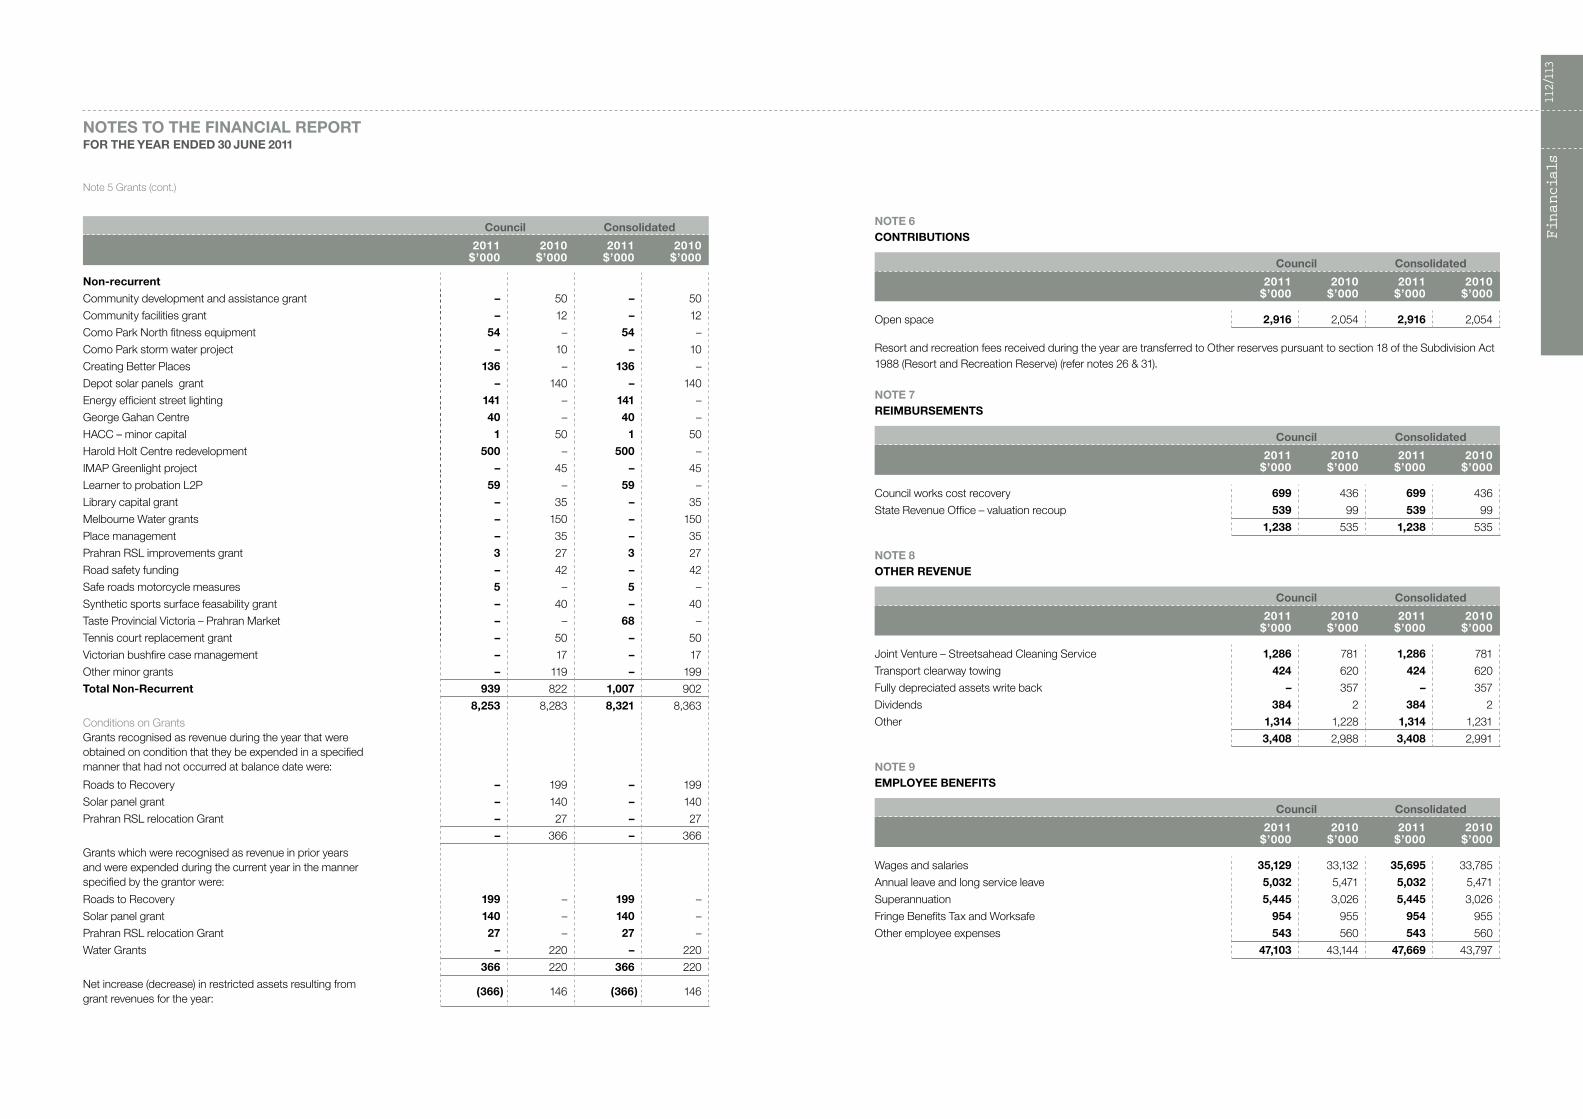
NOTE 5 GRANTS
Grants were received in respect of the following:
Council Consolidated
2011$’000
2010$’000
2011$’000
2010$’000
Summary of grants
Federally funded grants 396 480 396 480
State funded grants 7,857 7,803 7,925 7,883
Total 8,253 8,283 8,321 8,363
Recurrent
Addas 90 118 90 118
Adventure playground & leisure services 131 64 131 64
Apprentice Incentive program 20 – 20 –
Assessment services 479 464 479 464
Building inclusive communities 104 105 104 105
Community care – aged 138 93 138 93
Delivered meals 137 159 137 159
Family and children 200 146 200 146
Family Day Care\Childcare – 9 – 9
Freeza program 25 19 25 19
Graffiti awareness education – 15 – 15
Home help – aged 1,343 1,302 1,343 1,302
Home maintenance service 119 107 119 107
Immunisation 63 61 63 61
Library subsidy 556 542 556 542
Maternal & child health services 417 425 417 425
Planned activity group grant 211 189 211 189
Roads to recovery 217 198 217 198
School crossing subsidy 114 102 114 102
Specific home care 892 830 892 830
Victorian Grants Commission – General 1,380 1,853 1,380 1,853
Victorian Grants Commission – Local roads funding 362 336 362 336
Youth participation and access 30 46 30 46
Youth support services 170 164 170 164
YouthLinx – 58 – 58
Other minor grants 116 56 116 56
Total Recurrent 7,314 7,461 7,314 7,461
NOTE 2 RATES AND CHARGES
Council uses Capital Improved Value (CIV) as the basis of valuation of all properties within the municipal district. The CIV of a property is the value of the land plus buildings and other improvements.
The Capital Improved Value (CIV) used to calculate general rates for 2010/2011 was $54.182 billion (2009/2010 $50.029 billion). The 2010/2011 rate in the CIV dollar was 0.001102 (2009/2010, 0.0011418).
Council Consolidated
2011$’000
2010$’000
2011$’000
2010$’000
Residential 48,271 46,045 48,271 46,045 Commercial & Industrial 11,280 10,044 11,280 10,044 Interest on rates 453 407 453 407 Garbage charge 12,711 11,394 12,711 11,394 Special Rates 1,014 984 1,014 984
73,729 68,874 73,729 68,874
The date of the latest general revaluation of land for rating purposes within the municipal district was 1 January 2010, and the valuation was first applied in the rating year commencing 1 July 2010.
The date of the next general revaluation of land for rating purposes within the municipal district is 1 January 2012, and the valuation will be first applied to the rating period commencing 1 July 2012.
NOTE 3 TRAFFIC FINES AND PARKING
Council Consolidated
2011$’000
2010$’000
2011$’000
2010$’000
Infringements and costs 9,331 9,920 9,331 9,920 PERIN court recoveries 2,139 2,345 2,139 2,345 Fees – ticket machines 1,297 1,246 1,297 1,246 Fees – car parking fees 1,921 1,827 1,921 1,827 Permits 191 205 191 205
14,879 15,543 14,879 15,543
NOTE 4 USER FEES
Council Consolidated
2011$’000
2010$’000
2011$’000
2010$’000
Leisure centre fees 2,283 1,669 2,283 1,669 Child care/childrens program fees 2,945 2,533 2,945 2,533 Town planning fees 898 859 898 859 Aged services fees 857 800 857 800 Registration fees 1,152 1,055 1,152 1,055 Rental income 5,351 5,247 8,333 8,179 Road occupancy charges 195 230 195 230 Building services fees 591 642 591 642 Green Fees 881 962 881 962Sponsorship 17 19 17 19 Other fees and charges 2,887 3,694 2,887 3,694
18,057 17,710 21,039 20,642
NOTES TO THE FINANCIAL REPORTFOR THE YEAR ENDED 30 JUNE 2011
Financials
112/113
NOTE 6 CONTRIBUTIONS
Council Consolidated
2011$’000
2010$’000
2011$’000
2010$’000
Open space 2,916 2,054 2,916 2,054
Resort and recreation fees received during the year are transferred to Other reserves pursuant to section 18 of the Subdivision Act 1988 (Resort and Recreation Reserve) (refer notes 26 & 31).
NOTE 7 REIMBURSEMENTS
Council Consolidated
2011$’000
2010$’000
2011$’000
2010$’000
Council works cost recovery 699 436 699 436
State Revenue Office – valuation recoup 539 99 539 99
1,238 535 1,238 535
NOTE 8 OTHER REVENUE
Council Consolidated
2011$’000
2010$’000
2011$’000
2010$’000
Joint Venture – Streetsahead Cleaning Service 1,286 781 1,286 781
Transport clearway towing 424 620 424 620
Fully depreciated assets write back – 357 – 357
Dividends 384 2 384 2
Other 1,314 1,228 1,314 1,231
3,408 2,988 3,408 2,991
NOTE 9 EMPLOYEE BENEFITS
Council Consolidated
2011$’000
2010$’000
2011$’000
2010$’000
Wages and salaries 35,129 33,132 35,695 33,785
Annual leave and long service leave 5,032 5,471 5,032 5,471
Superannuation 5,445 3,026 5,445 3,026
Fringe Benefits Tax and Worksafe 954 955 954 955
Other employee expenses 543 560 543 560
47,103 43,144 47,669 43,797
NOTES TO THE FINANCIAL REPORTFOR THE YEAR ENDED 30 JUNE 2011
Council Consolidated
2011$’000
2010$’000
2011$’000
2010$’000
Non-recurrent
Community development and assistance grant – 50 – 50
Community facilities grant – 12 – 12
Como Park North fitness equipment 54 – 54 –
Como Park storm water project – 10 – 10
Creating Better Places 136 – 136 –
Depot solar panels grant – 140 – 140
Energy efficient street lighting 141 – 141 –
George Gahan Centre 40 – 40 –
HACC – minor capital 1 50 1 50
Harold Holt Centre redevelopment 500 – 500 –
IMAP Greenlight project – 45 – 45
Learner to probation L2P 59 – 59 –
Library capital grant – 35 – 35
Melbourne Water grants – 150 – 150
Place management – 35 – 35
Prahran RSL improvements grant 3 27 3 27
Road safety funding – 42 – 42
Safe roads motorcycle measures 5 – 5 –
Synthetic sports surface feasability grant – 40 – 40
Taste Provincial Victoria – Prahran Market – – 68 –
Tennis court replacement grant – 50 – 50
Victorian bushfire case management – 17 – 17
Other minor grants – 119 – 199
Total Non-Recurrent 939 822 1,007 902
8,253 8,283 8,321 8,363
Conditions on GrantsGrants recognised as revenue during the year that were obtained on condition that they be expended in a specified manner that had not occurred at balance date were:
Roads to Recovery – 199 – 199
Solar panel grant – 140 – 140
Prahran RSL relocation Grant – 27 – 27
– 366 – 366
Grants which were recognised as revenue in prior years and were expended during the current year in the manner specified by the grantor were:
Roads to Recovery 199 – 199 –
Solar panel grant 140 – 140 –
Prahran RSL relocation Grant 27 – 27 –
Water Grants – 220 – 220
366 220 366 220
Net increase (decrease) in restricted assets resulting from grant revenues for the year:
(366) 146 (366) 146
Note 5 Grants (cont.)
Financials
114/115
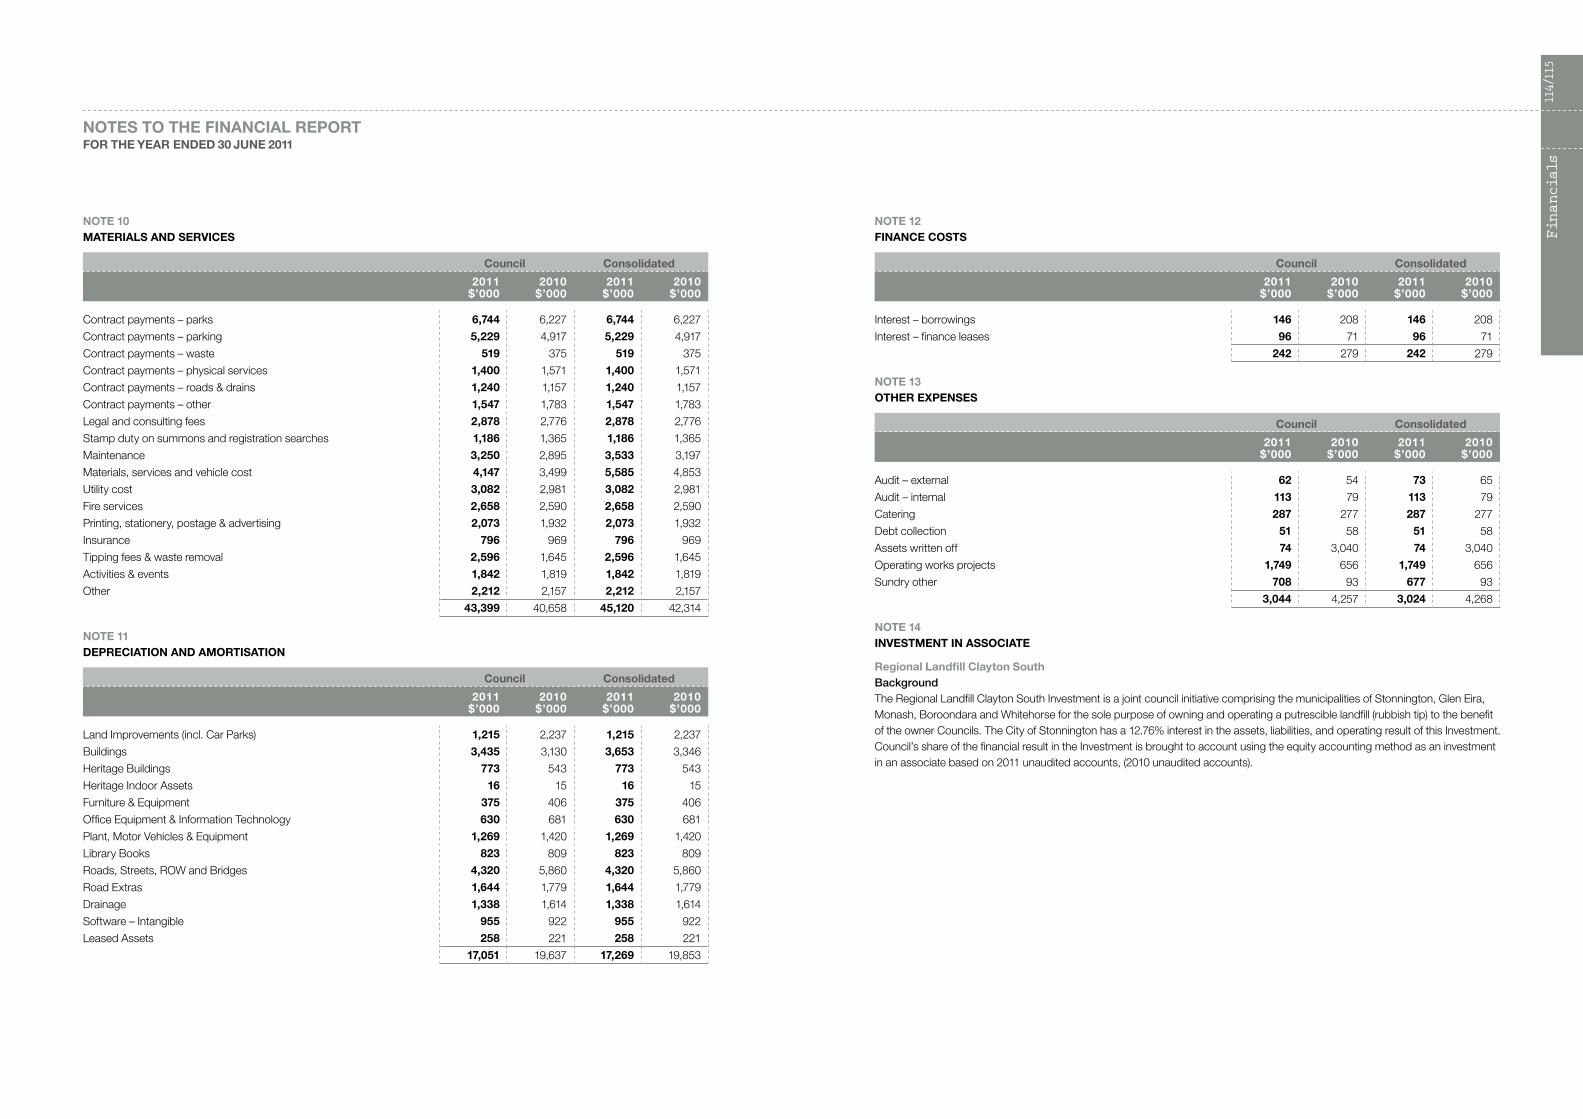
NOTE 12 FINANCE COSTS
Council Consolidated
2011$’000
2010$’000
2011$’000
2010$’000
Interest – borrowings 146 208 146 208
Interest – finance leases 96 71 96 71
242 279 242 279
NOTE 13 OTHER ExPENSES
Council Consolidated
2011$’000
2010$’000
2011$’000
2010$’000
Audit – external 62 54 73 65
Audit – internal 113 79 113 79
Catering 287 277 287 277
Debt collection 51 58 51 58
Assets written off 74 3,040 74 3,040
Operating works projects 1,749 656 1,749 656
Sundry other 708 93 677 93
3,044 4,257 3,024 4,268
NOTE 14 INVESTMENT IN ASSOCIATE
Regional Landfill Clayton SouthBackgroundThe Regional Landfill Clayton South Investment is a joint council initiative comprising the municipalities of Stonnington, Glen Eira, Monash, Boroondara and Whitehorse for the sole purpose of owning and operating a putrescible landfill (rubbish tip) to the benefit of the owner Councils. The City of Stonnington has a 12.76% interest in the assets, liabilities, and operating result of this Investment. Council’s share of the financial result in the Investment is brought to account using the equity accounting method as an investment in an associate based on 2011 unaudited accounts, (2010 unaudited accounts).
NOTE 10 MATERIALS AND SERVICES
Council Consolidated
2011$’000
2010$’000
2011$’000
2010$’000
Contract payments – parks 6,744 6,227 6,744 6,227
Contract payments – parking 5,229 4,917 5,229 4,917
Contract payments – waste 519 375 519 375
Contract payments – physical services 1,400 1,571 1,400 1,571
Contract payments – roads & drains 1,240 1,157 1,240 1,157
Contract payments – other 1,547 1,783 1,547 1,783
Legal and consulting fees 2,878 2,776 2,878 2,776
Stamp duty on summons and registration searches 1,186 1,365 1,186 1,365
Maintenance 3,250 2,895 3,533 3,197
Materials, services and vehicle cost 4,147 3,499 5,585 4,853
Utility cost 3,082 2,981 3,082 2,981
Fire services 2,658 2,590 2,658 2,590
Printing, stationery, postage & advertising 2,073 1,932 2,073 1,932
Insurance 796 969 796 969
Tipping fees & waste removal 2,596 1,645 2,596 1,645
Activities & events 1,842 1,819 1,842 1,819
Other 2,212 2,157 2,212 2,157
43,399 40,658 45,120 42,314
NOTE 11 DEPRECIATION AND AMORTISATION
Council Consolidated
2011$’000
2010$’000
2011$’000
2010$’000
Land Improvements (incl. Car Parks) 1,215 2,237 1,215 2,237
Buildings 3,435 3,130 3,653 3,346
Heritage Buildings 773 543 773 543
Heritage Indoor Assets 16 15 16 15
Furniture & Equipment 375 406 375 406
Office Equipment & Information Technology 630 681 630 681
Plant, Motor Vehicles & Equipment 1,269 1,420 1,269 1,420
Library Books 823 809 823 809
Roads, Streets, ROW and Bridges 4,320 5,860 4,320 5,860
Road Extras 1,644 1,779 1,644 1,779
Drainage 1,338 1,614 1,338 1,614
Software – Intangible 955 922 955 922
Leased Assets 258 221 258 221
17,051 19,637 17,269 19,853
NOTES TO THE FINANCIAL REPORTFOR THE YEAR ENDED 30 JUNE 2011

Financials
116/117
NOTE 16 TRADE AND OTHER RECEIVABLES
Council Consolidated
2011$’000
2010$’000
2011$’000
2010$’000
Current
Rates debtors 1,599 1,504 1,599 1,504
Parking infringement debtors 13,607 13,568 13,607 13,568
Provision for doubtful debts – parking infringements (10,679) (10,400) (10,679) (10,400)
Other debtors 1,242 1,127 1,422 1,512
Provision for doubtful debts – other debtors (100) (100) (100) (100)
Special rate assessment 22 22 22 22
Net GST receivable 1,357 1,119 1,357 1,119
7,048 6,840 7,228 7,225
Non-current
Advance to Prahran Market Pty Ltd – 450 – –
Total 7,048 7,290 7,228 7,225
NOTE 17 OTHER FINANCIAL ASSETS
Council Consolidated
2011$’000
2010$’000
2011$’000
2010$’000
Current
Term Deposits (note 1(k)) 51,008 47,729 51,008 47,729
Non-current
Shares in Prahran Market – At Cost 2,000 2,000 – –
Shares in Regional Kitchen Pty Ltd – Fair Value 1,362 1,379 1,362 1,379
Shares in RFK Pty Ltd (t/a Community Chef) – Fair Value – – – –
MAPS Shareholding – At Cost 15 15 15 15
3,377 3,394 1,377 1,394
Total 54,385 51,123 52,385 49,123
NOTE 18 OTHER ASSETS
Council Consolidated
2011$’000
2010$’000
2011$’000
2010$’000
Accrued income 1,295 1,219 1,295 1,219
Prepayments 183 126 191 139
Other 5 6 5 6
1,483 1,351 1,491 1,364
Note 14 Investment in associate (cont.)
Council Consolidated
2011$’000
2010$’000
2011$’000
2010$’000
Council’s share of retained profits
Council’s share of retained profits at start of year 685 684 685 684
Reported profit for year 281 1 281 1
Transfers (to)/from reserves – – – –
Distributions for the year (382) – (382) –
Council’s share of retained profits/ (accumulated losses) at end of year
584 685 584 685
Council’s share of reserves
Council’s share of reserves at start of year 297 1,169 297 1,169
Share of asset revaluation decrement – (872) – (872)
Council’s share of reserves at end of year 297 297 297 297
Movement in carrying value of specific investment
Carrying value of investment at start of year 1,961 2,822 1,961 2,822
Share of profit for year 281 1 281 1
Share of asset revaluation decrement – (862) – (862)
Distributions received (382) – – –
Carrying value of investment at end of year 1,860 1,961 1,860 1,961
NOTE 15 CASH AND CASH EQUIVALENTS
Council Consolidated
2011$’000
2010$’000
2011$’000
2010$’000
Cash on hand 11 10 11 10
Cash at bank 646 1,254 1,443 2,087
Term Deposits (90 days or less) 3,000 1,014 4,507 1,736
3,657 2,278 5,961 3,833
Other financial assets – Term Deposits (greater than 90 days) 51,008 47,729 51,008 47,729
Councils cash and term deposits are subject to a number of internal and external restrictions that limit amounts available for discretionary or future use. These include:
– Long service leave obligations as prescribes by the Local Government Act (Note 23)
8,409 7,921 8,414 7,924
– Reserve funds allocated for specific future purposes (Note 26) 19,644 13,890 19,644 13,890
– Trust funds and deposits (Note 22) 2,900 2,515 2,900 2,515
Restricted Funds 30,953 24,326 30,958 24,329
Total unrestricted cash and term deposits 23,712 25,681 26,011 27,233
NOTES TO THE FINANCIAL REPORTFOR THE YEAR ENDED 30 JUNE 2011

Financials
118/119
Note 19 Property, infrastructure, plant and equipment (cont.)
Council Consolidated
2011$’000
2010$’000
2011$’000
2010$’000
Plant, motor vehicles, furniture and equipmentPlant, motor vehicles and equipmentat cost 15,645 14,289 16,338 14,927
Less accumulated depreciation 8,850 8,023 9,157 8,274
6,795 6,266 7,181 6,653
Leased plant and equipmentat cost 1,495 1,491 1,495 1,491
Less accumulated depreciation 470 456 470 456
1,025 1,035 1,025 1,035
Furniture and equipmentat cost 5,058 4,522 5,202 4,666
Less accumulated depreciation 3,023 2,648 3,079 2,675
2,035 1,874 2,123 1,991
Office equipment and information technologyat cost 6,162 6,016 6,310 6,158
Less accumulated depreciation 4,964 4,698 5,035 4,750
1,198 1,318 1,275 1,408
Heritage indoor assetsat cost 2,205 2,098 2,205 2,098
Less accumulated depreciation 988 971 988 971
1,217 1,127 1,217 1,127
Library stocksat cost 14,685 13,870 14,685 13,870
Less accumulated depreciation 12,005 11,181 12,005 11,181
2,680 2,689 2,680 2,689
Total Plant and Equipment 14,950 14,309 15,501 14,903
NOTE 19 PROPERTY, INFRASTRUCTURE, PLANT AND EQUIPMENT
Council Consolidated
2011$’000
2010$’000
2011$’000
2010$’000
Summary
at cost 82,012 42,286 82,997 46,957
Less accumulated depreciation 30,300 27,977 30,734 29,112
51,712 14,309 52,263 17,845
at fair value as at 30 June 2010 1,441,586 1,278,736 1,445,505 1,278,735
at fair value as at 30 June 2011 19,476 – 19,476 –
Less accumulated depreciation 194,092 – 195,184 –
1,266,970 1,278,736 1,269,797 1,278,735
Works in progress 8,226 20,385 8,226 20,385
Total 1,326,908 1,313,430 1,330,286 1,316,965
Property
Land
at fair value as at 30 June 2010 834,389 834,389 834,389 834,389
Land Improvements
at cost 1,668 – 1,668 6
at fair value as at 30 June 2010 47,891 37,896 47,891 37,896
Less accumulated depreciation 11,210 – 11,210 6
38,349 37,896 38,349 37,896
Buildings
at cost 23,179 – 23,179 3,741
at fair value as at 30 June 2010 112,358 112,307 116,277 112,306
Less accumulated depreciation 3,486 – 4,578 799
132,051 112,307 134,878 115,248
Heritage Buildings
at cost 3,393 – 3,393 –
at fair value as at 30 June 2010 46,957 47,008 46,957 47,008
Less accumulated depreciation 722 – 722 –
49,628 47,008 49,628 47,008
Total Property 1,054,417 1,031,600 1,057,244 1,034,541
Valuation of buildings (Incl. Heritage Buildings) was undertaken by a qualified valuer Mr P. Fitzgerald AAPI CPV. The valuation of buildings is at fair value based on current replacement cost less accumulated depreciation at the date of valuation.
Valuation of land was undertaken by a qualified valuer Mr P. Fitzgerald AAPI CPV. The valuation of land is at fair value as at the date of valuation.
NOTES TO THE FINANCIAL REPORTFOR THE YEAR ENDED 30 JUNE 2011

Financials
120/121
Note 19 Property, infrastructure, plant and equipment (cont.)
2011
Movement – Council
Balance at beginning
of financial year
$’000
Acquisition of assets
$’000
Depreciation and
amortisation (Note 11)
$’000
WDV of disposals (Note 25)
$’000
Assets Written
Off $’000
Balance at end of financial
year $’000
Property
Land 834,389 – – – – 834,389
Land improvements 37,896 1,668 1,215 – – 38,349
Buildings 112,307 23,179 3,435 – – 132,051
Heritage Buildings 47,008 3,393 773 – – 49,628
Total Property 1,031,600 28,240 5,423 – – 1,054,417
Plant & Equipment
Plant, Motor Vehicles & Equipment 6,266 2,230 1,269 432 – 6,795
Leased Plant, Motor Vehicles & Equipment
1,035 373 258 125 – 1,025
Furniture and Equipment 1,874 536 375 – – 2,035
Office Equipment & Information Technology
1,318 525 630 14 1 1,198
Heritage Indoor Assets 1,127 106 16 – – 1,217
Library Stocks 2,689 814 823 – – 2,680
Total Plant & Equipment 14,309 4,584 3,371 571 1 14,950
Infrastructure
Roads, Streets, Rights of Way, and Bridges
173,720 5,191 4,320 – 73 174,518
Drainage 53,328 3,331 1,338 – – 55,321
Road Extras 20,088 1,032 1,644 – – 19,476
Total Infrastructure 247,136 9,554 7,302 – 73 249,315
Works in progress
Buildings 16,133 (15,162) – – – 971
Land Improvements 1,989 3,622 – – – 5,611
Roads, streets, rights of way and bridges
1,906 (1,076) – – – 830
Drainage 39 482 – – – 521
Road Extras 240 48 – – – 288
Intangibles 78 (73) – – – 5
Total Works in progress* 20,385 (12,159) – – – 8,226
Total Property, Infrastructure, Plant and Equipment
1,313,430 30,219 16,096 571 74 1,326,908
Intangible Assets 1,641 763 955 – – 1,449
Total Property, Infrastructure, Plant and Equipment, and Intangibles 1,315,071 30,982 17,051 571 74 1,328,357
* Refer to the reconciliation of work in progress in Note 19 on page 23 for further detail.
NOTES TO THE FINANCIAL REPORTFOR THE YEAR ENDED 30 JUNE 2011
Note 19 Property, infrastructure, plant and equipment (cont.)
Council Consolidated
2011$’000
2010$’000
2011$’000
2010$’000
InfrastructureRoads, streets, rights of way and bridgesat cost 5,191 – 5,191 –
at fair value as at 30 June 2010 295,315 173,720 295,315 173,720
Less accumulated depreciation 125,988 – 125,988 –
174,518 173,720 174,518 173,720
Drainageat cost 3,331 – 3,331 –
at fair value as at 30 June 2010 104,676 53,328 104,676 53,328
Less accumulated depreciation 52,686 – 52,686 –
55,321 53,328 55,321 53,328
Road Extrasat fair value as at 30 June 2010 – 20,088 – 20,088
at fair value as at 30 June 2011 19,476 – 19,476 –
19,476 20,088 19,476 20,088
Total Infrastructure 249,315 247,136 249,315 247,136
Works in progress
Buildings 971 16,133 971 16,133
Land Improvements 5,611 1,989 5,611 1,989
Roads, streets, rights of way and bridges 830 1,906 830 1,906
Drainage 521 39 521 39
Road Extras 288 240 288 240
Intangible Assets 5 78 5 78
Total Works in progress 8,226 20,385 8,226 20,385
Total Property, Infrastructure, Plant and Equipment 1,326,908 1,313,430 1,330,286 1,316,965
Intangible Assets
at cost 10,732 10,111 10,732 10,111
Less accumulated depreciation 9,283 8,470 9,283 8,470
1,449 1,641 1,449 1,641
Total Property, Infrastructure, Plant and Equipment (Incl Intangibles)
1,328,357 1,315,071 1,331,735 1,318,606
Reconciliation of work in progress
Balance at beginning of financial year: 20,385 7,727 20,385 7,727
Acquisition of assets 30,219 36,250 30,219 36,250
Transferred to assets (42,378) (23,592) (42,378) (23,592)
Balance at end of financial year: 8,226 20,385 8,226 20,385
Valuation of Roads, Streets, Rights of Way, Bridges, Drains, and Road Extras has been determined in accordance with an valuation undertaken by Mr J. Phillips Dip Eng CE.The valuation is at fair value based on replacement cost less accumulated depreciation as at the date of valuation.

Financials
122/123
NOTE 20 INVESTMENT PROPERTY
Council Consolidated
2011$’000
2010$’000
2011$’000
2010$’000
Balance at beginning of the financial year 6,600 5,650 6,600 5,650
Capital expenditure during year 6 10 6 10
Movement in fair value from revaluation 144 940 144 940
Balance at end of financial year 6,750 6,600 6,750 6,600
Investment property, Malvern City Square, is held to generate long-term rental yields. All tenant leases are on arms length basis. Investment property is carried at fair value being $6,750,000 ($6,600,000, 2010), determined annually by Council Valuers. Changes to fair value are recorded in the Comprehensive Income Statement.
NOTE 21 TRADE AND OTHER PAYABLES
Council Consolidated
2011$’000
2010$’000
2011$’000
2010$’000
Trade payables 9,908 5,098 10,094 5,266
Accrued expenses 5,106 4,293 5,161 4,378
Other 113 70 111 70
15,127 9,461 15,366 9,714
NOTE 22 TRUST FUNDS AND DEPOSITS
Council Consolidated
2011$’000
2010$’000
2011$’000
2010$’000
Refundable building deposits 264 257 264 257
Refundable contract deposits 630 585 630 585
Retention amounts 387 307 387 307
Other refundable deposits 1,619 1,366 1,619 1,366
2,900 2,515 2,900 2,515
NOTES TO THE FINANCIAL REPORTFOR THE YEAR ENDED 30 JUNE 2011
Note 19 Property, infrastructure, plant and equipment (cont.)
2010
Movement – Council
Balance at beginning
of financial year
$’000
Acquisition of assets
$’000
Revaluation increments
(decrements) (Note 26)
$’000
Prior period assets
written off (Note 27)
$’000
Depreciation and
amortisation (Note 11)
$’000
WDV of disposals (Note 25)
$’000
Assets Written
Off $’000
Transfers to/Lease
Termination $’000
Balance at end of financial
year $’000
Property
Land 883,470 1,808 (49,294) – – 152 1,443 – 834,389
Land improvements 51,232 3,322 (14,414) – 2,237 – 7 – 37,896
Buildings 107,363 3,505 4,872 – 3,130 – 303 – 112,307
Heritage Buildings 34,817 4,235 8,499 – 543 – – – 47,008
Total Property 1,076,882 12,870 (50,337) – 5,910 152 1,753 – 1,031,600
Plant & Equipment
Plant, Motor Vehicles & Equipment
5,890 1,977 – – 1,420 537 1 357 6,266
Leased Plant, Motor Vehicles & Equipment
978 371 – – 221 – – (93) 1,035
Furniture and Equipment 1,985 295 – – 406 – – – 1,874
Office Equipment & Information Technology
1,595 434 – – 681 27 3 – 1,318
Heritage Indoor Assets 998 144 – – 15 – – – 1,127
Library Stocks 2,697 801 – – 809 – – – 2,689
Total Plant & Equipment 14,143 4,022 – – 3,552 564 4 264 14,309
Infrastructure
Roads, Streets, Rights of Way, and Bridges
144,128 3,851 32,884 – 5,860 – 1,283 – 173,720
Drainage 55,535 1,757 (2,350) – 1,614 – – – 53,328
Road Extras 27,183 1,092 (801) (5,607) 1,779 – – – 20,088
Total Infrastructure 226,846 6,700 29,733 (5,607) 9,253 – 1,283 – 247,136
Works in progress
Buildings 5,052 11,081 – – – – – – 16,133
Land Improvements 1,251 738 – – – – – – 1,989
Roads, Streets, Rights of Way, and Bridges
1,301 605 – – – – – – 1,906
Drainage 119 (80) – – – – – – 39
Road Extras 4 236 – – – – – – 240
Intangibles – 78 – – – – – – 78
Total Works in progress 7,727 12,658 – – – – – – 20,385
Total Property, Infrastructure, Plant and Equipment
1,325,598 36,250 (20,604) (5,607) 18,715 716 3,040 264 1,313,430
Intangible Assets 2,051 512 – – 922 – – – 1,641
Total Property, Infrastructure, Plant and Equipment, and Intangibles
1,327,649 36,762 (20,604) (5,607) 19,637 716 3,040 264 1,315,071

Financials
124/125
NOTE 24 INTEREST-BEARING LOANS AND BORROWINGS
Council Consolidated
2011$’000
2010$’000
2011$’000
2010$’000
Current
Borrowings – secured 677 638 677 638
Non-current
Borrowings – secured 2,687 3,364 2,687 3,364
Total 3,364 4,002 3,364 4,002
The maturity profile for Council’s borrowings is:
Not later than one year 677 638 677 638
Later than one year and not later than five years 2,687 2,595 2,687 2,595
Later than five years – 769 – 769
3,364 4,002 3,364 4,002
Finance leases
Council’s share of Streetsahead joint venture’s obligations under finance leases for the lease of plant and equipment (the sum of which is recognised as a liability after deduction of future lease finance charges included in the obligation):
Not later than one year 387 407 387 407
Later than one year and not later than five years 898 914 898 914
Later than five years – – – –
Minimum lease payments 1,284 1,321 1,284 1,321
Less: Future finance charges (232) (261) (232) (261)
Recognised in the balance sheet as: 1,052 1,060 1,052 1,060
Current
Leases 293 321 293 321
Non-current
Leases 759 739 759 739
Total 1,052 1,060 1,052 1,060
Aggregate carrying amount of interest-bearing loans and borrowings:
Current 970 959 970 959
Non-current 3,446 4,103 3,446 4,103
4,416 5,062 4,416 5,062
NOTE 23 PROVISIONS
Annual leave $’000
Long service
leave$’000
Gratuity$’000
Other$’000
Total$’000
2011
Balance at beginning of the financial year 4,088 7,921 180 306 12,495
Provision utilised (2,349) (402) (38) (692) (3,481)
Additional provisions made 2,320 890 6 697 3,913
Balance at the end of the financial year 4,059 8,409 148 311 12,927
2010
Balance at beginning of the financial year 3,892 6,374 148 154 10,568
Provision utilised (2,075) (318) – (666) (3,059)
Additional provisions made 2,271 1,865 32 818 4,986
Balance at the end of the financial year 4,088 7,921 180 306 12,495
Council Consolidated
2011$’000
2010$’000
2011$’000
2010$’000
(a) Employee benefits
Current
Annual leave 4,059 4,088 4,097 4,111
Long service leave 7,159 6,916 7,159 6,916
Time in lieu 70 84 70 84
Other 241 222 241 222
11,529 11,310 11,567 11,333
Non-current
Long service leave 1,250 1,005 1,255 1,008
Retirement gratuity 148 180 148 180
1,398 1,185 1,403 1,188
Total 12,927 12,495 12,970 12,521
Aggregate carrying amount of employee benefits:
Current 11,529 11,310 11,567 11,333
Non-current 1,398 1,185 1,403 1,188
12,927 12,495 12,970 12,521
The following assumptions were adopted in measuring the present value of long service leave and retiring gratuity:
Weighted average increase in employee costs 3.86% 3.52% 3.86% 3.52%
Weighted average discount rates 4.79% 4.47% 4.79% 4.47%
Weighted average settlement period 12 12 12 12
Current Employee Benefits that:
Expect to be utilised within 12 months 3,424 2,785 3,479 2,843
Expect to be utilised after 12 months 8,105 8,377 8,105 8,377
11,529 11,162 11,584 11,220
(b) Other Current Provision
Insurance Excess Provision 131 159 131 159
Total 13,058 12,654 13,101 12,680
NOTES TO THE FINANCIAL REPORTFOR THE YEAR ENDED 30 JUNE 2011

Financials
126/127
NOTE 26 RESERVES
Balance at beginning of
financial year $’000
Increment (decrement)
$’000
Balance at end of
financial year $’000
(a) Asset revaluation reserve
2011
Property
Land 483,729 – 483,729
Land improvements 5,764 – 5,764
Buildings 193,403 – 193,403
Heritage buildings 19,061 – 19,061
701,957 – 701,957
Infrastructure
Roads, streets, rights of way & bridges 90,412 – 90,412
Road extras 11,922 – 11,922
Drainage 19,381 – 19,381
121,715 – 121,715
Share of net asset revaluation increment of associate 1,172 – 1,172
Total Asset revaluation reserve 824,844 – 824,844
2010
Property
Land 533,023 (49,294) 483,729
Land improvements 20,178 (14,414) 5,764
Buildings 188,531 4,872 193,403
Heritage buildings 10,562 8,499 19,061
752,294 (50,337) 701,957
Infrastructure
Roads, streets, rights of way & bridges 57,528 32,884 90,412
Road extras 12,723 (801) 11,922
Drainage 21,731 (2,350) 19,381
91,982 29,733 121,715
Share of net asset revaluation increment of associate 2,034 (862) 1,172
Total Asset revaluation reserve 846,310 (21,466) 824,844
NOTE 25 GAIN/LOSS ON DISPOSAL OF PROPERTY, PLANT AND EQUIPMENT
Council Consolidated
2011$’000
2010$’000
2011$’000
2010$’000
Total
Proceeds from sales 409 550 409 550
Less carrying amount of assets sold 446 716 446 716
Loss on disposal (37) (166) (37) (166)
Council
Proceeds from sales (Incl. Assets held for sale) 394 535 394 535
Less carrying amount of assets sold 419 704 419 704
Loss on disposal (25) (169) (25) (169)
Share of equity in joint venture
Proceeds from sales 16 15 16 15
Less carrying amount of assets sold 28 12 28 12
Loss on disposal (12) 3 (12) 3
NOTES TO THE FINANCIAL REPORTFOR THE YEAR ENDED 30 JUNE 2011

Financials
128/129
NOTE 28 (A)RECONCILIATION OF CASH FLOWS FROM OPERATING ACTIVITIES TO SURPLUS FOR THE YEAR
Council Consolidated
2011$’000
2010$’000
2011$’000
2010$’000
Profit from oeprations 12,057 8,600 12,886 9,247
Depreciation/amortisation 17,051 19,637 17,269 19,853
(Profit)/loss on disposal of property, infrastructure, plant and equipment 37 166 37 166
Assets written off 74 3,040 74 3,040
Share of other comprehensive income of associates and joint ventures accounted for by the equity method
(101) (1) (101) (1)
Fair value adjustments for investment property (144) (940) (144) (940)
Fully depreciated assets written back – (357) – (357)
Change in assets and liabilities:
(Increase)/decrease in trade and other receivables (105) (42) 101 (49)
(Increase)/decrease in prepayments (57) (15) (44) (28)
Increase/(decrease) in accrued income 41 (44) 41 (44)
Increase/(decrease) in trade and other payables 1,372 1,653 1,418 1,468
(Decrease)/increase in other liabilities – – (28) 13
Increase in provisions 404 1,874 418 1,899
Net cash provided by operating activities 30,629 33,571 31,926 34,267
NOTE 28 (B) PAYMENTS FOR OTHER FINANCIAL ASSETS
Council Consolidated
2011$’000
2010$’000
2011$’000
2010$’000
Operating lease payments 165 165 165 165
Movement in investments (3,609) (828) (3,609) (828)
(3,444) (663) (3,444) (663)
NOTE 29 RECONCILIATION OF CASH AND CASH EQUIVALENTS
Council Consolidated
2011$’000
2010$’000
2011$’000
2010$’000
Cash and cash equivalents (see note 15) 3,657 2,278 5,961 3,833
Less bank overdraft – – – –
3,657 2,278 5,961 3,833
Note 26 Reserves (cont.)
Balance at beginning of
financial year
$’000
Net Asset revaluation increment/
(decrement) $’000
Transfer from
accumulated surplus
$’000
Transfer to accumulated
surplus $’000
Balance at end of financial
year $’000
Consolidated balance at
end of financial
year $’000
(b) Reserves
2011
Asset revaluation reserve 824,844 – – – 824,844 824,844
Open Space Reserve 11,500 – 5,043 – 16,543 16,543
Off-Street Parking Reserve 790 – 49 – 839 839
Developer Contributions 63 – 149 (50) 162 162
Future Fund Reserve 1,600 – 500 – 2,100 2,100
Total Reserves 838,797 – 5,741 (50) 844,488 844,488
2010
Asset revaluation reserve 846,310 (21,466) – – 824,844 824,844
Open Space Reserve 12,663 – 2,054 (3,217) 11,500 11,500
Off–Street Parking Reserve 790 – – – 790 790
Developer Contributions 69 – 50 (56) 63 63
Future Fund Reserve 1,200 – 400 – 1,600 1,600
Total Other reserves 861,032 (21,466) 2,504 (3,273) 838,797 838,797
The Open Space Reserve is used to record developer contributions and utilisation of this reserve to purchase or develop open space assets.
The Off-Street Parking Reserve is used to record contributions to off-street parking and funds the purchase or development of off-street parking assets.
The Future Fund Reserve is a reserve created to assist Council when making strategic property acquisitions.
NOTE 27ADJUSTMENTS DIRECTLY TO EQUITY
Council Consolidated
2011$’000
2010$’000
2011$’000
2010$’000
Prior periods Road Extra assets written off – 5,607 – 5,607
NOTES TO THE FINANCIAL REPORTFOR THE YEAR ENDED 30 JUNE 2011

Financials
130/131
Note 32 Superannuation (cont.)
The Fund surplus or deficit (ie the difference between fund assets and liabilities) is calculated differently for funding purposes (ie calculating required contributions) and for the calculation of accrued benefits as required in AAS 25 to provide the values needed for the AASB 119 disclosure in the council’s financial statements. AAS 25 requires that the present value of the defined benefit liability be calculated based on benefits that have accrued in respect of membership of the plan up to the measurement date, with no allowance for future benefits that may accrue.
Following an actuarial review conducted by the Trustee in late 2010, as at 31 December 2008, a funding shortfall of $71 million for the fund was determined. A call to employers for additional contributions was made for the financial year 30 June 2011, with Council making a contribution of $2.16 million in June 2011 as its share of the shortfall. A further actuarial review will be undertaken as at 31 December 2011 by mid 2012. Based on the result of this review, a detailed funding plan will be developed and implemented to achieve the target of full funding by 31 December 2013. The Council will be notified of any additional required contributions by late 2012.
Accounting Standard DisclosureThe Fund’s liability for accrued benefits was determined by the Actuary at 31 December 2008 pursuant to the requirements of Australian Accounting Standard AAS 25 as follows:
31-Dec-08 $’000
Net Market Value of Assets 3,630,432
Accrued Benefits (per accounting standards) 3,616,422
Difference between Assets and Accrued Benefits 14,010
Vested Benefits 3,561,588
The financial assumptions used to calculate the Accrued Benefits for the defined benefit category of the Fund were:Net Investment Return 8.50% p.a.Salary Inflation 4.25% p.a.Price Inflation 2.75% p.a.
2011$’000
2010$’000
Employer contributions to Local Authorities Superannuation Fund (Vision Super) 5,403 3,021
Employer contributions to other superannuation funds 42 5
5,445 3,026
Employer contributions payable to Local Authorities Superannuation Fund (Vision Super) at reporting date
134 31
134 31
NOTE 30 FINANCING ARRANGEMENTS
Council Consolidated
2011$’000
2010$’000
2011$’000
2010$’000
Bank overdraft 250 250 250 250
Used facilities – – – –
Unused facilities 250 250 250 250
NOTE 31 RESTRICTED ASSETS
Council has cash, cash equivalents and other financial assets (notes 15, 17) that are subject to restrictions. As at the reporting date, Council had legislative restrictions in relation to employee entitlements (Long Service Leave) and reserve funds (Open Space & Car Parking Reserves).
Council Consolidated
2011$’000
2010$’000
2011$’000
2010$’000
Long service leave* 5,511 5,400 5,511 5,400
Reserve funds (note 26(b)) 17,382 12,353 17,382 12,353
22,893 17,753 22,893 17,753
* Restricted asset for long service leave is based on the Local Government (Long Service Leave) Regulations 2002 and does not necessarily equate to the long service leave liability disclosed in notes15 and 23 due to a different basis of calculation prescribed by the regulation.
NOTE 32 SUPERANNUATION
Council makes employer superannuation contributions in respect of its employees to Vision Super (the Fund). Obligations for contributions are recognised as an expense in the Comprehensive Income Statement when they are due. The Fund has two categories of membership, accumulation and defined benefit, each of which is funded differently.
The Fund’s accumulation category, Vision Super Saver, receives both employer and employee contributions on a progressive basis. Employer contributions are normally based on a fixed percentage of employee earnings (9% required under Superannuation Guarantee Legislation). No further liability accrues to the employer as the superannuation benefits accruing to employees are represented by their share of the net assets of the Fund.
Defined BenefitThe Fund’s Defined Benefit Plan is a multi-employer sponsored plan. As the Plan’s assets and liabilities are pooled and are not allocated by employer, the Actuary is unable to reliably allocate benefit liabilities, assets and costs between employers. As provided under Paragraph 32 (b) of AASB 119, Council does not use defined benefit accounting for these contributions.
Council makes employer contributions to the defined benefit category of the Fund at rates determined by the Trustee on the advice of the Fund’s Actuary. On the basis of the results of the most recent full actuarial investigation conducted by the Fund’s actuary as at 31 December 2008, Council makes the following contributions:– 9.25% of members’ salaries (same as previous year) and;– the difference between resignation and retrenchment benefits paid to any retrenched employees (same as previous year).
NOTES TO THE FINANCIAL REPORTFOR THE YEAR ENDED 30 JUNE 2011
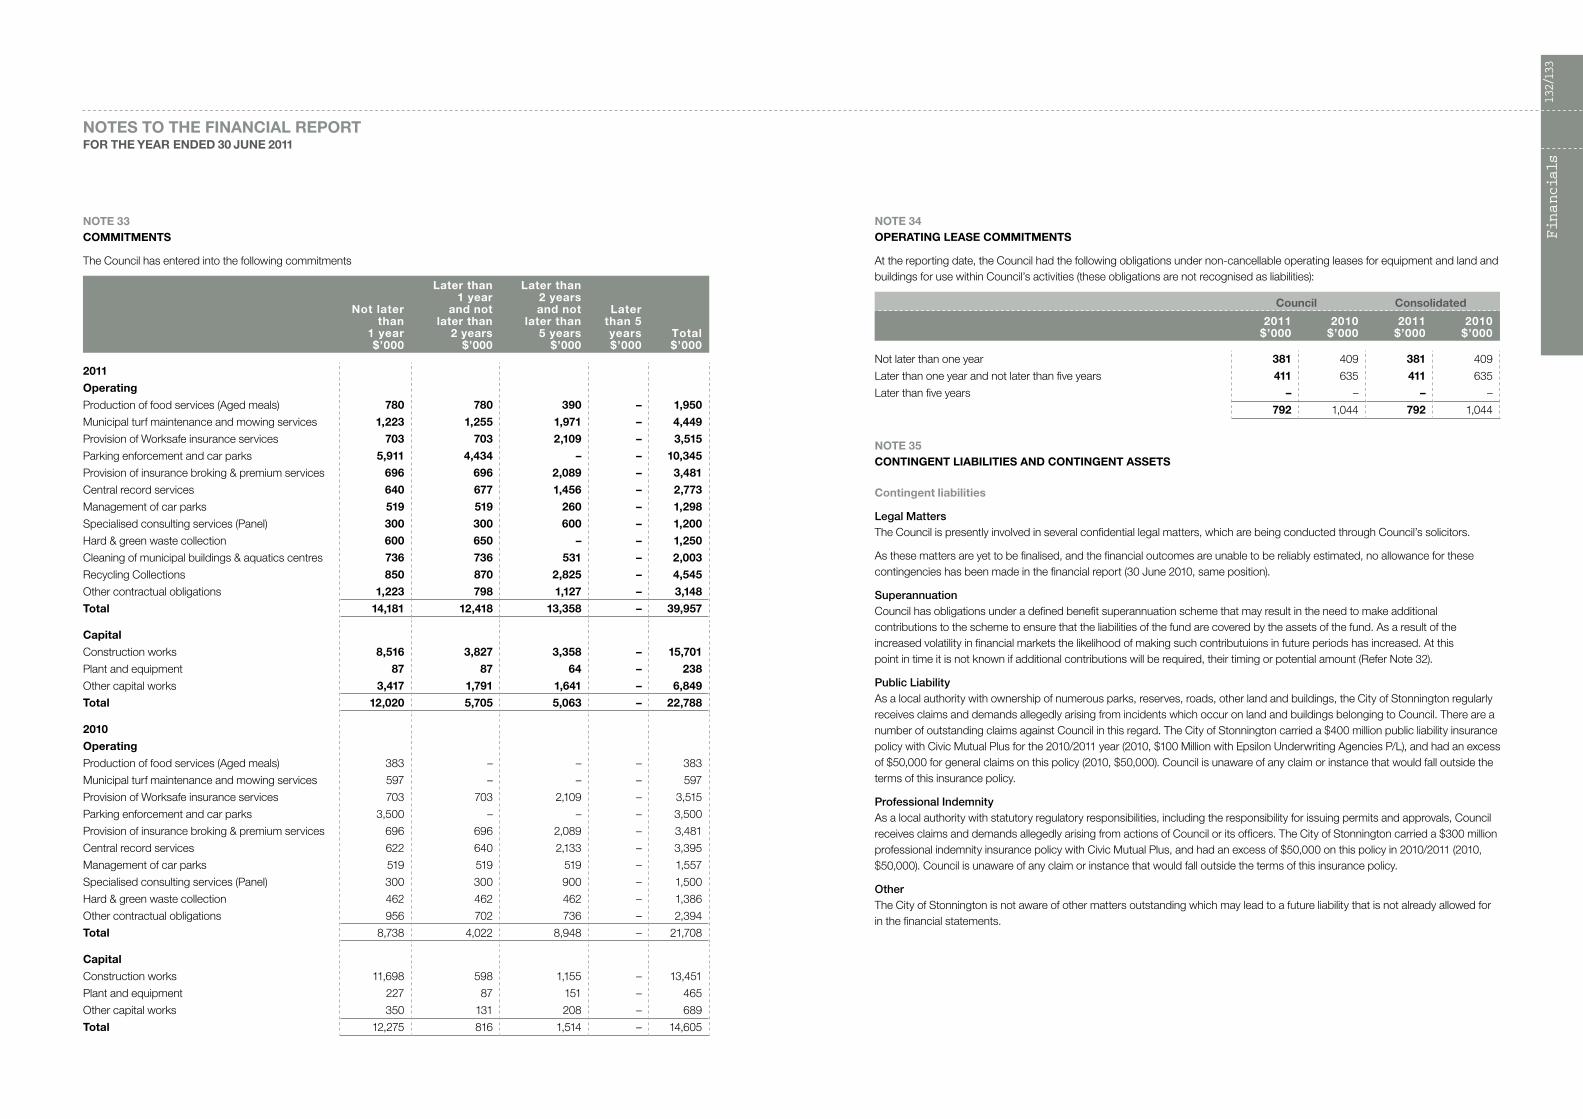
Financials
132/133
NOTE 34 OPERATING LEASE COMMITMENTS
At the reporting date, the Council had the following obligations under non-cancellable operating leases for equipment and land and buildings for use within Council’s activities (these obligations are not recognised as liabilities):
Council Consolidated
2011$’000
2010$’000
2011$’000
2010$’000
Not later than one year 381 409 381 409
Later than one year and not later than five years 411 635 411 635
Later than five years – – – –
792 1,044 792 1,044
NOTE 35 CONTINGENT LIABILITIES AND CONTINGENT ASSETS
Contingent liabilities
Legal MattersThe Council is presently involved in several confidential legal matters, which are being conducted through Council’s solicitors.
As these matters are yet to be finalised, and the financial outcomes are unable to be reliably estimated, no allowance for these contingencies has been made in the financial report (30 June 2010, same position).
SuperannuationCouncil has obligations under a defined benefit superannuation scheme that may result in the need to make additional contributions to the scheme to ensure that the liabilities of the fund are covered by the assets of the fund. As a result of the increased volatility in financial markets the likelihood of making such contributuions in future periods has increased. At this point in time it is not known if additional contributions will be required, their timing or potential amount (Refer Note 32).
Public LiabilityAs a local authority with ownership of numerous parks, reserves, roads, other land and buildings, the City of Stonnington regularly receives claims and demands allegedly arising from incidents which occur on land and buildings belonging to Council. There are a number of outstanding claims against Council in this regard. The City of Stonnington carried a $400 million public liability insurance policy with Civic Mutual Plus for the 2010/2011 year (2010, $100 Million with Epsilon Underwriting Agencies P/L), and had an excess of $50,000 for general claims on this policy (2010, $50,000). Council is unaware of any claim or instance that would fall outside the terms of this insurance policy.
Professional IndemnityAs a local authority with statutory regulatory responsibilities, including the responsibility for issuing permits and approvals, Council receives claims and demands allegedly arising from actions of Council or its officers. The City of Stonnington carried a $300 million professional indemnity insurance policy with Civic Mutual Plus, and had an excess of $50,000 on this policy in 2010/2011 (2010, $50,000). Council is unaware of any claim or instance that would fall outside the terms of this insurance policy.
OtherThe City of Stonnington is not aware of other matters outstanding which may lead to a future liability that is not already allowed for in the financial statements.
NOTE 33 COMMITMENTS
The Council has entered into the following commitments
Not later than
1 year $’000
Later than 1 year
and not later than
2 years $’000
Later than 2 years and not
later than 5 years
$’000
Later than 5 years $’000
Total $’000
2011
Operating
Production of food services (Aged meals) 780 780 390 – 1,950
Municipal turf maintenance and mowing services 1,223 1,255 1,971 – 4,449
Provision of Worksafe insurance services 703 703 2,109 – 3,515
Parking enforcement and car parks 5,911 4,434 – – 10,345
Provision of insurance broking & premium services 696 696 2,089 – 3,481
Central record services 640 677 1,456 – 2,773
Management of car parks 519 519 260 – 1,298
Specialised consulting services (Panel) 300 300 600 – 1,200
Hard & green waste collection 600 650 – – 1,250
Cleaning of municipal buildings & aquatics centres 736 736 531 – 2,003
Recycling Collections 850 870 2,825 – 4,545
Other contractual obligations 1,223 798 1,127 – 3,148
Total 14,181 12,418 13,358 – 39,957
Capital
Construction works 8,516 3,827 3,358 – 15,701
Plant and equipment 87 87 64 – 238
Other capital works 3,417 1,791 1,641 – 6,849
Total 12,020 5,705 5,063 – 22,788
2010
Operating
Production of food services (Aged meals) 383 – – – 383
Municipal turf maintenance and mowing services 597 – – – 597
Provision of Worksafe insurance services 703 703 2,109 – 3,515
Parking enforcement and car parks 3,500 – – – 3,500
Provision of insurance broking & premium services 696 696 2,089 – 3,481
Central record services 622 640 2,133 – 3,395
Management of car parks 519 519 519 – 1,557
Specialised consulting services (Panel) 300 300 900 – 1,500
Hard & green waste collection 462 462 462 – 1,386
Other contractual obligations 956 702 736 – 2,394
Total 8,738 4,022 8,948 – 21,708
Capital
Construction works 11,698 598 1,155 – 13,451
Plant and equipment 227 87 151 – 465
Other capital works 350 131 208 – 689
Total 12,275 816 1,514 – 14,605
NOTES TO THE FINANCIAL REPORTFOR THE YEAR ENDED 30 JUNE 2011

Financials
134/135
Note 36 Financial Instruments (cont.)
(b) Interest Rate RiskThe exposure to interest rate risk and the effective interest rates of financial assets and financial liabilities, both recognised and unrecognised, at balance date are as follows:
Fixed interest maturing in:
Floating interest
rate $’000
1 year or less
$’000
Over 1 to 5
years $’000
More than 5 years $’000
Non-interest bearing
$’000Total $’000
2011
Financial assets
Cash and cash equivalents 3,000 – – – 657 3,657
Other financial assets – 48,008 3,000 – 3,377 54,385
Trade and other receivables – – – – 1,142 1,142
Accrued income – – – – 1,295 1,295
Total financial assets 3,000 48,008 3,000 – 6,471 60,479
Weighted average interest rate 4.50% 6.24% 6.64% -
Financial liabilities
Trade and other payables – – – – 10,021 10,021
Trust funds and deposits – – – – 2,900 2,900
Interest-bearing loans and borrowings – 986 3,430 – – 4,416
Total financial liabilities – 986 3,430 – 12,921 17,337
Weighted average interest rate – 6.14% 6.27% –
Net financial assets/(liabilities) 3,000 47,022 (430) – (6,450) 43,142
2010
Financial assets
Cash and cash equivalents 1,014 – – – 1,264 2,278
Other financial assets – 44,729 3,000 – 3,394 51,123
Trade and other receivables – – – 450 1,027 1,477
Accrued income – – – – 1,219 1,219
Total financial assets 1,014 44,729 3,000 450 6,904 56,097
Weighted average interest rate 3.50% 6.00% 6.62% 6.50%
Financial liabilities
Trade and other payables – – – – 5,168 5,168
Trust funds and deposits – – – – 2,515 2,515
Interest-bearing loans and borrowings – 958 3,335 769 – 5,062
Total financial liabilities – 958 3,335 769 7,683 12,745
Weighted average interest rate – 6.14% 6.27% 6.75%
Net financial assets/(liabilities) 1,014 43,771 (335) (319) (779) 43,352
NOTE 36 FINANCIAL INSTRUMENTS
(a) Accounting Policy, Terms and Conditions
Recognised Financial Instruments Note Accounting Policy Terms and Conditions
Financial Assets
Cash and cash equivalents
15 Cash on hand and at bank and money market call account are valued at face value.
On call deposits returned a floating interest rate of 3.00% (3.75% in 2009/2010). The interest rate at balance date was 4.50% (4.50% in 2009/2010).
Term deposits are held to maximise interest returns of surplus cash.
Funds returned fixed interest rate of between 5.85% (2.75% in 2009/2010) and 6.00% (7.05% in 2009/2010) net of fees.
Interest is recognised as it accrues.
Other financial assets 17 Term deposits are held to maximise interest returns of surplus cash.
Funds returned fixed interest rate of between 5.10% (2.75% in 30 June 2010) and 7.05% (7.05% in 30 June 2010) net of fees.
Trade and other receivables:
Other debtors 16 Receivables are carried at amortised cost using the effective interest method. A provision for doubtful debts is recognised when there is objective evidence that an impairment loss has occurred. Collectibility of overdue accounts is assessed on an ongoing basis.
General debtors are unsecured and interest free. Credit terms are based on 30 days. Interest charged on the advance to the Prahran Market is based on the Local Government borrowing rate.
Financial Liabilities
Trade and other payables 21 Liabilities are recognised for amounts to be paid in the future for goods and services provided to Council as at balance date whether or not invoices have been received.
General creditors are unsecured, not subject to interest charges and are normally settled within 30 days of invoice receipt.
Interest-bearing loans and borrowings
24 Loans are carried at their principal amounts, which represent the present value of future cash flows associated with servicing the debt. Interest is accrued over the period it becomes due and recognised as part of payables.
Borrowings are secured by way of mortgages over the general rates of the Council. The weighted average interest rate on borrowings is 6.14% (6.32% in 2009/2010).
Finance leases are accounted for at their principle amount with the lease payments discounted to present value using the interest rates implicit in the leases.
As at balance date, the Council had finance leases with an average lease term of 5 years. The weighted average rate implicit in the lease is 9.20% (8.47% in 2009/2010).
Bank overdraft 30 Overdrafts are recognised at the principal amount. Interest is charged as an expense as it accrues.
The overdraft is subject to annual review. It is secured by a mortgage over Council’s general rates and is repayable on demand. The overdraft limit of $250,000 was not utilised in 2010/2011 (Nil in 2009/2010).
Trust funds and deposits 22 Trust funds and deposits are carried at their principal amount.
Terms and conditions depend on the nature of the trust fund and deposit held.
NOTES TO THE FINANCIAL REPORTFOR THE YEAR ENDED 30 JUNE 2011

Financials
136/137
Note 36 Financial Instruments (cont.)
We manage the interest rate exposure on our debt portfolio by appropriate budgeting strategies and obtaining approval for borrowings from the Department of Planning and Community Development each year.
Investment of surplus funds is made with approved financial institutions under the Local Government Act 1989. We manage interest rate risk by adopting an investment policy that ensures:– conformity with State and Federal regulations and standards,– capital protection,– appropriate liquidity,– diversification by credit rating, financial institution and investment product,– monitoring of return on investment, and– benchmarking of returns and comparison with budget.
Maturity will be staggered to provide for interest rate variations and to minimise interest rate risk.
Credit riskCredit risk is the risk that a contracting entity will not complete its obligations under a financial instrument and cause us to make a financial loss. We have exposure to credit risk on all financial assets included in our balance sheet. To help manage this risk:– we have a policy for establishing credit limits for the entities we deal with;– we may require collateral where appropriate; and– we only invest surplus funds with financial institutions which have a recognised credit rating specified in our investment policy.
Trade and other receivables consist of a large number of customers, spread across the consumer, business, and government sectors. Credit risk associated with the Council’s financial assets is minimal because the main debtor is rates and charges which becomes a legally obligated charge on the property. We do not have any significant credit risk exposure to a single customer or groups of customers. Ongoing credit evaluation is performed on the financial condition of our customers and, where appropriate, an allowance for doubtful debts is raised.
We may also be subject to credit risk for transactions which are not included in the balance sheet, such as when we provide a guarantee for another party. Details of our contingent liabilities are disclosed in note 35.
Movement in Provisions for Doubtful Debts
2011$’000
2010$’000
Balance at the beginning of the year 10,500 12,629
New Provisions recognised during the year 240 –
Amounts already provided for and written off as uncollectible – –
Amounts provided for but recovered during the year 39 (2,129)
Balance at end of year 10,779 10,500
Ageing of Trade and Other ReceivablesAt balance date other debtors representing financial assets were past due but not impaired. These amounts relate to a number of independent customers for whom there is no recent history of default. The ageing of Trade and Other Receivables that have been individually determined as impaired at reporting date was:
2011$’000
2010$’000
Current (not yet due) 1,031 738
Past due by up to 30 days 36 129
Past due between 31 and 60 days 15 46
Past due by more than 61 days 61 114
Total Trade & Other Receivables 1,143 1,027
Note 36 Financial Instruments (cont.)
(c) Net Fair Values
The aggregate net fair values of financial assets and financial liabilities, both recognised and unrecognised, at balance date are as follows:
Total carrying amount as per Balance Sheet
Aggregate net fair value
Financial Instruments2011
$’0002010
$’0002011
$’0002010
$’000
(1) Financial assets
Cash and cash equivalents 3,657 2,278 3,657 2,278
Other financial assets 54,385 51,123 54,385 51,123
Trade and other receivables 1,142 1,477 1,142 1,477
Accrued income 1,295 1,219 1,295 1,219
Total financial assets 60,479 56,097 60,479 56,097
(2) Financial liabilities
Trade and other payables 10,021 5,168 10,021 5,168
Trust funds and deposits 2,900 2,515 2,900 2,515
Interest-bearing loans and borrowings 4,416 5,062 4,014 4,601
Total Financial liabilities 17,337 12,745 16,935 12,284
(d) Credit RiskThe maximum exposure to credit risk at balance date in relation to each class of recognised financial asset is represented by the carrying amount of those assets as indicated in the Balance Sheet.
(e) Risks and MitigationThe risks associated with our main financial instruments and our policies for minimising these risks are detailed below.
Market riskMarket risk is the risk that the fair value or future cash flows of our financial instruments will fluctuate because of changes in market prices.
The Council’s exposures to market risk are primarily through interest rate risk with only insignificant exposure to other price risks and no exposure to foreign currency risk. Components of market risk to which we are exposed are discussed below.
Interest rate riskInterest rate risk refers to the risk that the value of a financial instrument or cash flows associated with the instrument will fluctuate due to changes in market interest rates. Interest rate risk arises from interest bearing financial assets and liabilities that we use. Non derivative interest bearing assets are predominantly short term liquid assets. Our interest rate liability risk arises primarily from long term loans and borrowings at fixed rates which exposes us to fair value interest rate risk.
Our loan borrowings are sourced from major Australian banks by a tender process. Finance leases are sourced from major Australian financial institutions. Overdrafts are arranged with major Australian banks. We manage interest rate risk on our net debt portfolio by:– ensuring access to diverse sources of funding;– reducing risks of refinancing by managing in accordance with target maturity profiles; and– setting prudential limits on interest repayments as a percentage of rate revenue.
NOTES TO THE FINANCIAL REPORTFOR THE YEAR ENDED 30 JUNE 2011
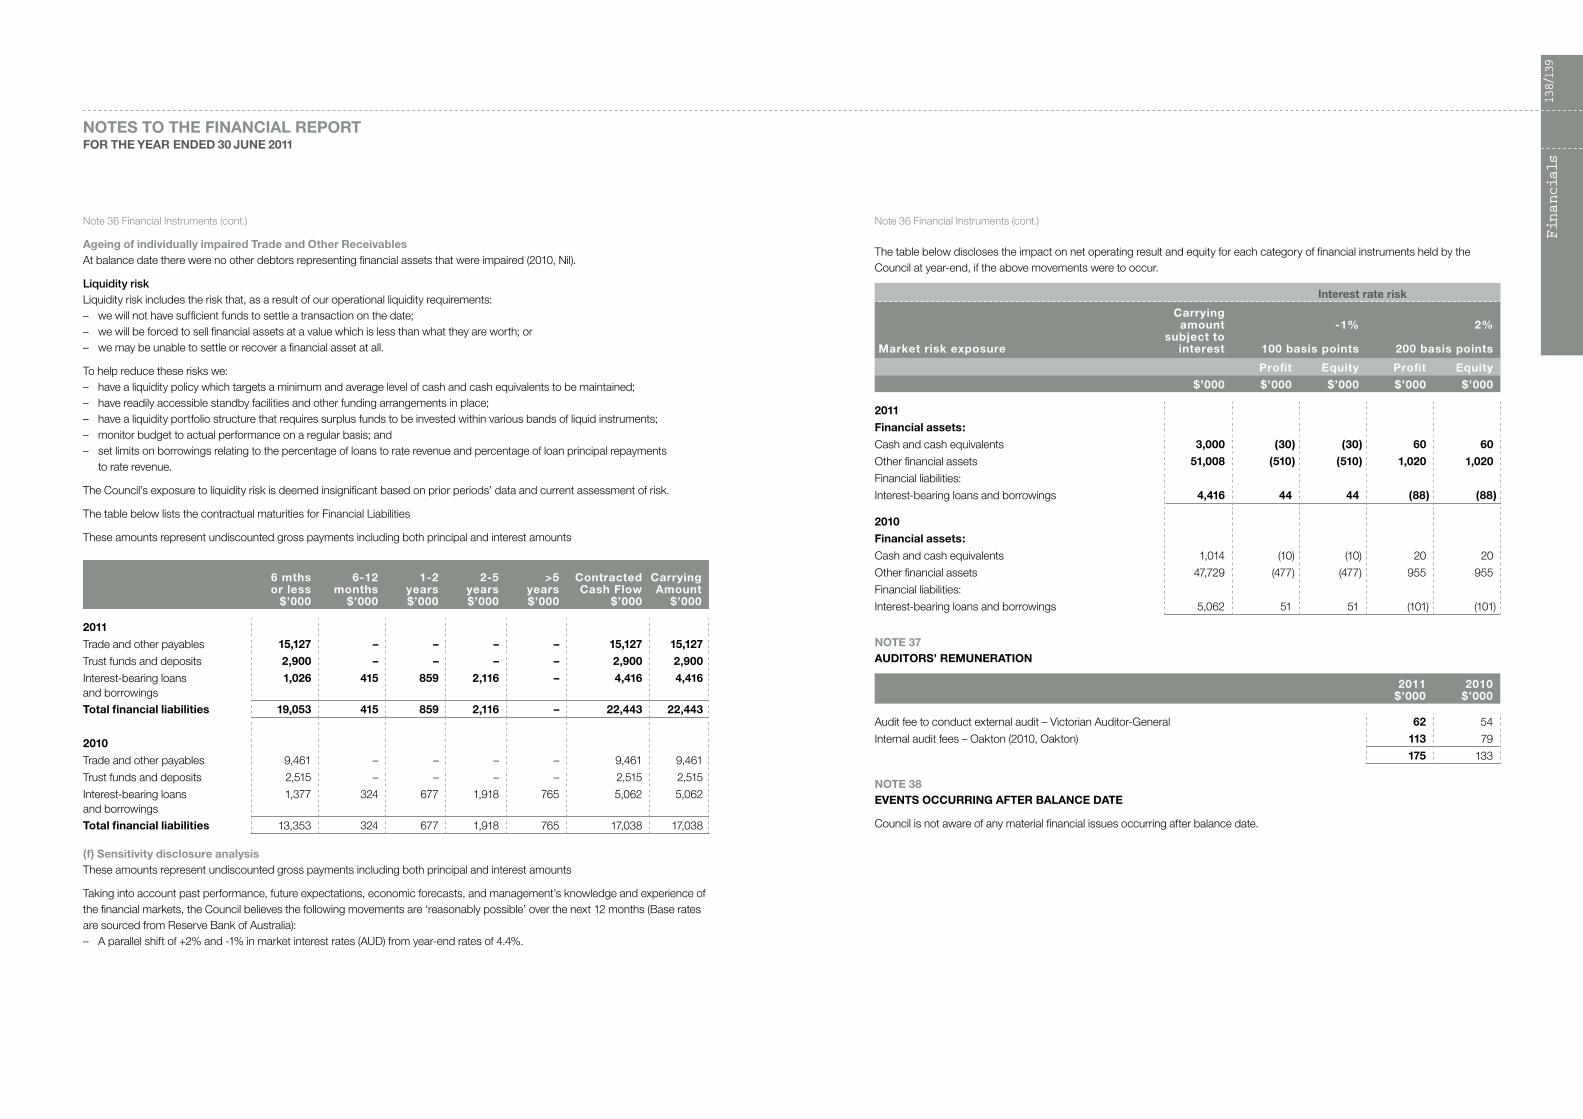
Financials
138/139
Note 36 Financial Instruments (cont.)
The table below discloses the impact on net operating result and equity for each category of financial instruments held by the Council at year-end, if the above movements were to occur.
Interest rate risk
Market risk exposure
Carrying amount
subject to interest
-1%
100 basis points
2%
200 basis points
Profit Equity Profit Equity
$’000 $’000 $’000 $’000 $’000
2011
Financial assets:
Cash and cash equivalents 3,000 (30) (30) 60 60
Other financial assets 51,008 (510) (510) 1,020 1,020
Financial liabilities:
Interest-bearing loans and borrowings 4,416 44 44 (88) (88)
2010
Financial assets:
Cash and cash equivalents 1,014 (10) (10) 20 20
Other financial assets 47,729 (477) (477) 955 955
Financial liabilities:
Interest-bearing loans and borrowings 5,062 51 51 (101) (101)
NOTE 37 AUDITORS’ REMUNERATION
2011$’000
2010$’000
Audit fee to conduct external audit – Victorian Auditor-General 62 54
Internal audit fees – Oakton (2010, Oakton) 113 79
175 133
NOTE 38 EVENTS OCCURRING AFTER BALANCE DATE
Council is not aware of any material financial issues occurring after balance date.
Note 36 Financial Instruments (cont.)
Ageing of individually impaired Trade and Other ReceivablesAt balance date there were no other debtors representing financial assets that were impaired (2010, Nil).
Liquidity riskLiquidity risk includes the risk that, as a result of our operational liquidity requirements:– we will not have sufficient funds to settle a transaction on the date;– we will be forced to sell financial assets at a value which is less than what they are worth; or– we may be unable to settle or recover a financial asset at all.
To help reduce these risks we:– have a liquidity policy which targets a minimum and average level of cash and cash equivalents to be maintained;– have readily accessible standby facilities and other funding arrangements in place;– have a liquidity portfolio structure that requires surplus funds to be invested within various bands of liquid instruments;– monitor budget to actual performance on a regular basis; and– set limits on borrowings relating to the percentage of loans to rate revenue and percentage of loan principal repayments
to rate revenue.
The Council’s exposure to liquidity risk is deemed insignificant based on prior periods’ data and current assessment of risk.
The table below lists the contractual maturities for Financial Liabilities
These amounts represent undiscounted gross payments including both principal and interest amounts
6 mths or less
$’000
6-12 months
$’000
1-2 years $’000
2-5 years $’000
>5 years $’000
Contracted Cash Flow
$’000
Carrying Amount
$’000
2011
Trade and other payables 15,127 – – – – 15,127 15,127
Trust funds and deposits 2,900 – – – – 2,900 2,900
Interest-bearing loans and borrowings
1,026 415 859 2,116 – 4,416 4,416
Total financial liabilities 19,053 415 859 2,116 – 22,443 22,443
2010
Trade and other payables 9,461 – – – – 9,461 9,461
Trust funds and deposits 2,515 – – – – 2,515 2,515
Interest-bearing loans and borrowings
1,377 324 677 1,918 765 5,062 5,062
Total financial liabilities 13,353 324 677 1,918 765 17,038 17,038
(f) Sensitivity disclosure analysisThese amounts represent undiscounted gross payments including both principal and interest amounts
Taking into account past performance, future expectations, economic forecasts, and management’s knowledge and experience of the financial markets, the Council believes the following movements are ‘reasonably possible’ over the next 12 months (Base rates are sourced from Reserve Bank of Australia):– A parallel shift of +2% and -1% in market interest rates (AUD) from year-end rates of 4.4%.
NOTES TO THE FINANCIAL REPORTFOR THE YEAR ENDED 30 JUNE 2011

Financials
140/141
Note 39 Related party transactions (cont.)
(vi) Senior Officers RemunerationA Senior Officer, other than a Responsible Person, is an officer of Council who has management responsibilities and reports directly to the Chief Executive Officer or whose total annual remuneration exceeds $124,000 (2009/10 $120,000).
The number of Senior Officers, other than the Responsible Persons, are shown below in their relevant income bands:
2011No.
2010No.
Income Range:
$124,000 – $129,999 2 5
$130,000 – $139,999 6 8
$140,000 – $149,999 9 4
$150,000 – $159,999 – 3
$160,000 – $169,999 2 –
$170,000 – $179,999 – –
$180,000 – $189,999 – –
$190,000 – $199,999 – 4
$200,000 – $209,999 4 –
23 24
$’000 $’000
Total Remuneration for the reporting year for Senior Officers included above, amounted to: 3,575 3,599
NOTE 40 JOINT VENTURE INFORMATION
Streetsahead Cleaning ServiceThe Cities of Stonnington and Port Phillip participate as partners in a joint venture with the primary objective of providing cleansing services to both Councils. The Joint Venture commenced operating on 1 February 2000 and undertakes work including street sweeping, footpath sweeping, land sweeping, weed control, beach and foreshore cleaning, litter bin clearing, and pit cleaning. The Council has a 50% interest in the assets, liabilities, and operating result of this Joint Venture. The Council’s aggregate share of the Joint Venture’s revenue and expenses, based upon 2011 unaudited financial statements, are as follows:
Council Consolidated
2011$’000
2010$’000
2011$’000
2010$’000
Income 4,160 3,900 4,160 3,900
Expense 4,253 3,836 4,253 3,836
(93) 64 (93) 64
NOTE 39 RELATED PARTY TRANSACTIONS
(i) Responsible PersonsNames of persons holding the position of a Responsible Person at the Council at any time during the year are:
Councillors Councillor Anne O’Shea 1 July 2010 to 30 June 2011 Councillor Claude Ullin 1 July 2010 to 30 June 2011 Councillor John Chandler 1 July 2010 to 30 June 2011 Councillor Melina Sehr 1 July 2010 to 30 June 2011 Councillor Judy Hindle 1 July 2010 to 30 June 2011 Councillor Tas Athanasopoulos 1 July 2010 to 30 June 2011 Councillor Greg Hannan 1 July 2010 to 30 June 2011 Councillor Tim Smith 1 July 2010 to 30 June 2011 Councillor Angus Nicholls 1 July 2010 to 30 June 2011Chief Executive Officer Warren Roberts 1 July 2010 to 30 June 2011
(ii) Remuneration of Responsible Persons
The numbers of Responsible Officers whose total remuneration from Council and any related entities fall within the following bands:
2011No.
2010No.
$1,000 – $9,999 – –
$10,000 – $19,999 – –
$20,000 – $29,999 7 7
$30,000 – $39,999 – –
$40,000 – $49,999 – –
$50,000 – $59,999 1 1
$60,000 – $69,999 1 1
$70,000 – $79,999 – –
$270,000 – $279,999 – 1
$310,000 – $319,999 1 –
10 10
$’000 $’000
Total Remuneration for the reporting year for Responsible Persons included above amounted to: 626 580
(iii) No retirement benefits have been made by the Council to a Responsible Person (2009/2010, Nil).(iv) No loans have been made, guaranteed, or secured by the Council to a Responsible Person during the reporting year (2009/2010 – Nil).
(v) Other TransactionsNo transactions other than remuneration payments or the reimbursement of approved expenses were entered into by Council with Responsible Persons, or Related Parties of such Responsible Persons, during the reporting year (2009/2010 – Nil).
NOTES TO THE FINANCIAL REPORTFOR THE YEAR ENDED 30 JUNE 2011

Financials
142/143
NOTE 41 WHOLLY OWNED SUBSIDIARY
Prahran Market Pty LtdPrahran Market Pty Ltd is a wholly owned subsidiary, incorporated within Australia, of the City of Stonnington. Prahran Market Pty Ltd manages the retail activities of the Prahran Market for the City of Stonnington on terms set out in a management agreement between both parties, dated 30 March 2008. The assets, liabilities, and operating result based upon 2011 unaudited financial statements are included in Council’s consolidated financial accounts, as follows:
2011$’000
2010$’000
Income 4,679 4,437
Expense 3,850 3,791
829 646
Council’s consolidated accounts includes the following assets and liabilities in the Balance Sheet
2011$’000
2010$’000
Assets
Current assets
Cash assets 2,304 1,555
Receivables 180 385
Other 8 13
Total current assets 2,492 1,953
Non-current assets
Property, Plant and Equipment 3,378 3,534
Total non-current assets 3,378 3,534
Total assets 5,870 5,487
Liabilities
Current liabilities
Payables 186 168
Employee benefits 55 85
Other Liabilities 38 23
Total current liabilities 279 276
Non-current liabilities
Employee benefits – 450
Interest Bearing Liabilities 5 3
Total non-current liabilities 5 453
Total liabilities 284 729
Net Assets 5,586 4,758
Equity
Accumulated Funds 3,586 2,758
Issued Capital 2,000 2,000
Total Equity 5,586 4,758
Note 40 Joint venture information (cont.)
The Council’s aggregate share of the assets and liabilities committed to the Joint Venture are included in the balance sheet under the following classifications:
Council Consolidated
2011$’000
2010$’000
2011$’000
2010$’000
Assets
Current assets
Cash and cash equivalents 570 366 570 366
Receivables 294 358 294 358
Other Financial Assets 750 1,002 750 1,002
Total current assets 1,614 1,726 1,614 1,726
Non-current assets
Property, Plant and Equipment 1,201 1,192 1,201 1,192
Total non-current assets 1,201 1,192 1,201 1,192
Total assets 2,815 2,918 2,815 2,918
Liabilities
Current liabilities
Payables 190 175 190 175
Employee benefits 673 681 673 681
Interest Bearing Liabilities 293 311 293 311
Total current liabilities 1,156 1,167 1,156 1,167
Non-current liabilities
Employee benefits 35 44 35 44
Interest Bearing Liabilities 759 748 759 748
Total non-current liabilities 794 792 794 792
Total liabilities 1,950 1,959 1,950 1,959
Net Assets 865 959 865 959
Equity
Accumulated Funds 865 959 865 959
Total Equity 865 959 865 959
NOTES TO THE FINANCIAL REPORTFOR THE YEAR ENDED 30 JUNE 2011

Financials
144/145
Note 42 Income, expenses and assets by function/activities (cont.)
InfrastructureAim: To maintain and renew existing infrastructure to improve traffic and pedestrian safety and amenity through traffic management. Also to provide and develop services and controls to remove waste and maintain clean streets, parks, and gardens.Includes: Engineering and surveying, local area traffic management, the construction and maintenance of local road infrastructure, car park maintenance, waste management, and street cleaning.
Governance, Administration, and Not AttributedAim: To establish efficient and effective processes for delivering the community needs.Includes: Civic Centres - Council Service Centres, Community Relations, Financial Management, Valuation and Rating, Information Technology, Human Resources, Councillor Support, Legal Services, Records Management, Corporate Planning, Halls Management, Asset and Property Management.
NOTE 43 FINANCIAL RATIOS (PERFORMANCE INDICATORS)
2011$’000
2011(%)
2010(%)
2009(%)
(a) Debt servicing ratio (to assess the capacity of Council to service its outstanding debt)
Debt servicing costsTotal income
242125,614
= 0.19% 0.23% 0.27%
Debt servicing costs refer to the payment of interest on loan borrowings, finance leases, and bank overdraft.
The ratio expresses the amount of interest paid as a percentage of Council’s total income.
(b) Debt commitment ratio (to assess Council’s capacity to achieve its debt redemption strategy)
Debt servicing & redemption costsRate revenue
88872,262
=1.23% 1.22% 2.25%
Council’s strategy involves the repayment of loan principal and interest, finance lease principal and interest
The ratio expresses the percentage of rate revenue utilised to pay interest and redeem debt principal.
(c) Revenue ratio (to quantify Council’s dependence on non-rate income)
Rate revenueTotal income
72,262125,614
=57.53% 56.49% 54.56%
The level of Council’s reliance on rate revenue is determined by assessing rate revenue as a proportion of the total revenue of Council.
NOTE 42 INCOME, ExPENSES AND ASSETS BY FUNCTION/ACTIVITIES
Year
Grants Income
$’000
Other Income
$’000
Total Income
$’000Expenses
$’000
Net Result
$’000
Total Assets (WDV) $’000
Leisure & Cultural Services 2010 1,023 5,545 6,568 23,680 (17,112) 109,428
2011 1,001 5,191 6,192 23,942 (17,750) 110,390
Community Services 2010 4,400 3,607 8,007 14,003 (5,996) 27,187
2011 4,470 3,912 8,382 14,514 (6,132) 27,426
Development 2010 35 4,226 4,261 5,784 (1,523) –
2011 – 5,076 5,076 6,351 (1,275) –
Regulatory & Transport 2010 194 17,819 18,013 12,410 5,603 26,448
2011 252 17,207 17,459 12,532 4,927 26,681
Infrastructure 2010 689 1,961 2,650 29,065 (26,415) 251,095
2011 594 2,587 3,181 27,068 (23,887) 293,496
Governance, Administration & Non Attributed
2010 1,942 78,009 79,951 25,908 54,043 971,516
2011 1,936 83,388 85,324 29,150 56,174 945,547
2010 8,283 111,167 119,450 110,850 8,600 1,385,674
TOTAL 2011 8,253 117,361 125,614 113,557 12,057 1,403,540
Aggregate value of Assets as disclosed in the Balance Sheet
2011$’000
2010$’000
Current Assets 63,196 58,198
Non Current Assets 1,340,344 1,327,476
Total 1,403,540 1,385,674
Leisure & Cultural ServicesAim: To provide, coordinate, and develop a broad range of facilities, programs and services which satisfy the leisure/ recreational and library needs of the community.Includes: Civic & Community Centres, Recreation & Arts Centres, Sporting facilities, Parks and Gardens, Swimming Pools, Libraries, Business Development, Tourism and Golf Course Management.
Community ServicesAim: To provide, advocate, coordinate, and develop a broad range of programs, services, and facilities within the aged, family, youth, and children’s area that are responsive to the social, emotional, and physical needs of the community.Includes: Family & Children’s Services, Aged & Disability Services, Maternal & Child Health, Child Care, and Ethnic Services.
DevelopmentAim: To implement local and State building and planning regulations within the municipality.Includes: Building Control, Strategic and Statutory Town Planning.
Regulatory & TransportAim: To regulate and reinforce parking safety, parking turnover, food safety, environment controls, animal controls, and local laws.Includes: Transport Management and Health & Environment Management.
NOTES TO THE FINANCIAL REPORTFOR THE YEAR ENDED 30 JUNE 2011

Financials
146/147
NOTE 44 CAPITAL ExPENDITURE
Note2011
$’0002010
$’000
Capital expenditure areas
Land – 1,808
Land Improvements 5,290 4,060
Buildings 8,023 14,594
Heritage Buildings 3,393 4,235
Heritage Indoor Assets 106 144
Motor Vehicles, Plant, and Equipment 2,603 2,349
Furniture and Equipment 536 295
Office Equipment & Information Technology 525 434
Library Stocks 814 801
Roads Extras 1,080 1,328
Drainage, Roads, Footpaths, Kerb & Channels, ROWs, Bridges 7,928 6,133
30,298 36,181
Intangible Assets 690 590
Total capital works 30,988 36,771
Represented by:
Renewal (a) 18,722 21,469
Upgrade (b) 6,425 8,147
Expansion (c) 883 2,208
New assets 4,958 4,947
Total capital works 30,988 36,771
Property, infrastructure, plant and equipment movement
The movement between the previous year and the current year in property, infrastructure, plant and equipment movement as shown in the Balance Sheet links to the net of the following items:
Total capital works 30,988 36,771
Movement in fair value of investment property 144 940
Asset revaluation movement – (20,604)
Depreciation/amortisation 11 (17,051) (19,637)
Written down value of assets sold (571) (716)
Termination of Finance Leases – (91)
Fully depreciated assets written back – 357
Asset write off (74) (3,040)
Net movement in property, plant & equipment, intangibles and investment property 19, 20 13,436 (6,020)
NOTE 43 FINANCIAL RATIOS (PERFORMANCE INDICATORS)
2011$’000
2011(%)
2010(%)
2009(%)
(d) Debt Exposure Ratio (to identify Council’s exposure to debt)
Total indebtednessTotal realisable assets
29,9901,080,487
= 2.78% 2.26% 1.02%
For the purposes of the calculation of financial ratios, realisable assets are those assets which can be sold and which are not subject to any restriction on realisation or use.
Any liability represented by a restricted asset (note 31) is excluded from total indebtedness.
The following assets are excluded from total assets when calculating Council’s realisable assets:
land and buildings (not owned); restricted assets; heritage assets; total infrastructure assets; and Council’s investment in associate.
This ratio enables assessment of Council’s solvency and exposure to debt. Total indebtedness refers to the total liabilities of Council. Total liabilities are compared to total realisable assets which are all Council assets not subject to any restriction and are able to be realised. The ratio expresses total liabilities as a percentage of each dollar of realisable assets.
(e) Working Capital Ratio (to assess Council’s ability to meet current commitments)
Current assetsCurrent liabilities
63,19630,657
=206.14% 238.48% 267.04%
The ratio expresses the level of current assets the Council has available to meet its current liabilities.
(f) Adjusted working capital ratio (to assess Council’s ability to meet current commitments)
Current assetsAdjusted Current liabilities
63,19623,498
=268.94% 332.79% 339.81%
The ratio expresses the level of current assets the Council has available to meet its current liabilities.
Current liabilities have been reduced to reflect the long service leave that is shown as a current liability because it is not likely to be utilised within 12 months after the end of the year.
NOTES TO THE FINANCIAL REPORTFOR THE YEAR ENDED 30 JUNE 2011

Financials
148/149
In my opinion, the accompanying financial statements have been prepared in accordance with the Local Government Act 1989, the Local Government (Finance and Reporting) Regulations 2004, Australian Accounting Standards, and other mandatory professional reporting requirements.
Brian Hood CPAPrincipal Accounting Officer
29 August 2011 Malvern
In our opinion, the accompanying financial statements present fairly the financial transactions of Stonnington City Council for the year ended 30 June 2011 and the financial position of the Council as at that date.
As at the date of signing, we are not aware of any circumstances which would render any particulars in the financial statements to be misleading or inaccurate.
We were authorised by the Council on 29 August 2011 to certify the financial statements in their final form.
Cr Melina Sehr Mayor
29 August 2011 Malvern
Anne O’Shea Councillor
29 August 2011 Malvern
Warren Roberts Chief Executive Officer
29 August 2011 Malvern
CERTIFICATION OF THE FINANCIAL REPORT
Note 44 Capital expenditure (cont.)
(a) Renewal Expenditure on an existing asset which returns the service potential or the life of the asset to that which it had originally. It is periodically required expenditure, relatively large (material) in value compared with the value of the components or sub-components of the asset being renewed. As it reinstates existing service potential, it has no impact on revenue, but may reduce future operating and maintenance expenditure if completed at the optimum time.
(b) UpgradeExpenditure which enhances an existing asset to provide a higher level of service or expenditure that will increase the life of the asset beyond that which it had originally. Upgrade expenditure is discretional and often does not result in additional revenue unless direct user charges apply. It will increase operating and maintenance expenditure in the future because of the increase in the council’s asset base.
(c) ExpansionExpenditure which extends an existing asset, at the same standard as is currently enjoyed by residents, to a new group of users. It is discretional expenditure which increases future operating and maintenance costs, because it increases council’s asset base, but may be associated with additional revenue from the new user group.
NOTES TO THE FINANCIAL REPORTFOR THE YEAR ENDED 30 JUNE 2011

Financials
150/151
PERFORMANCE STATEMENTFOR THE YEAR ENDED 30 JUNE 2011
Key Strategic ActivitiesFinancial PerformanceFinancial stability driven by strong financial management ensures a sustainable future for the City and enables Council to meet the objectives of the Council Plan. Council objective is to maintain its strong financial position by generating an operating surplus in line with budget expectations and by building a strong Balance Sheet.
Performance Targets and Measures
Actual Result
2011
Budget/Target
2011 Variance Achieved
FP 1. Underlying result/Underlying revenue 6.68% 2.86% 3.8% Yes
FP 2. Operating expenses/Rateable Assessments $2,090 $2,170 $80 Yes
FP 3. Rate revenue/Underlying revenue 59.35% 59.89% 0.5% Yes
FP 4. Rate revenue/Rateable Assessments $1,331 $1,336 ($4) No
FP 5. Debt Servicing/Total revenue 0.19% 0.20% 0.01% Yes
FP 6. Recurrent Grants/Total Revenue 5.82% 6.07% (0.2%) No
FP 7. Fees and Charges/Total Revenue 26.22% 27.30% (1.1%) No
Financial PositionManage the operations of Council to maintain and improve on the level of Council services while keeping operating cost increases to acceptable levels.
Performance Targets and Measures
Actual Result
2011
Budget/Target
2011 Variance Achieved
BS 1. Indebtedness/Rate revenue 6.11% 6.02% (0.1%) No
BS 2. Underlying result/Total assets 0.58% 0.23% 0.3% Yes
BS 3. Net realisable assets/Rateable Assessment $19,905 $23,540 ($3,635) No
BS 4. Current assets/Current liabilities 2.06 1.93 0.13 Yes
BS 5. Total liabilities/Rateable Assessment $654 $601 ($53) No
PERFORMANCE STATEMENTFOR THE YEAR ENDED 30 JUNE 2011
Introduction to the Performance StatementThe Government amended the Local Government Act 1989 (Section 153) to ensure that local government developed performance accountability mechanisms which allow for a consistent approach in the collection and reporting of information regarding financial performance, operating cost and community satisfaction.
The use of performance indicators by local government is a significant step towards achieving:– an improved capacity to objectively measure Council performance to a better set of relationships between state and local
government,– the strategic objectives as articulated in the Council Plan, and– better informed communities.
The Council has adopted a budget as part of its corporate planning cycle and has separately identified Key Strategic Activities (KSA’s) to be undertaken during the financial year and performance targets, and measures in relation to each KSA. The Performance Statement outlines the extent to which these targets have been met during the year.

Financials
NOTES TO AND FORMING PART OF THE PERFORMANCE STATEMENTExPLANATIONS OF MAJOR VARIATIONS TO BUDGET
152/153
Financial Performance:FP 1. Underlying result/Underlying revenueThe percentage of underlying surplus over underlying revenue is greater than budgeted due to higher income from rates and charges, user charges, reimbursements, and finance income. Further details of the operating result are referenced in the Standard Income Statement and the associated explanation of variances.
FP 2. Operating expenses/Rateable AssessmentsOperating expenses per rateable assessment were better than budget due to a range of operating efficiencies.
FP 3. Rate revenue/Underlying revenueThe growth in other revenue streams meant that the reliance on rate revenue was slightly lower than budgeted.
FP 4. Rate revenue/Rateable AssessmentsThere is a minimal variance between budget and actual performance for 2010/11.
FP 5. Debt Servicing/Total revenueThe minimal variance between budget and actual performance for 2010/11 is due to stronger revenue growth.
FP 6. Recurrent Grants/Total RevenueThe proportion of revenue gained from recurring grants was slightly less than budgeted.
FP 7. Fees and Charges/Total RevenueThe ratio of fees and charges to total revenue was close to budget.
Financial Position:
BS 1. Indebtedness/Rate revenueThe level of indebtedness as a proportion of rate revenue slightly exceeded budget.
BS 2. Underlying result/Total assetsThe significantly better than budget surplus improved this ratio.
BS 3. Net realisable assets/Rateable AssessmentThis ratio was below the target due to lower capital expenditure, the asset revaluation decrement and the increase in restricted assets.
BS 4. Current assets/Current liabilitiesThe ratio of current assets over current liabilities was better than budget largely due to a stronger cash position.
BS 5. Total liabilities/Rateable AssessmentTotal liabilities for 2010/11 are higher than budgeted mainly due to higher actual creditors and accruals.
Capital Expenditure:
CE 1. Capital WorksActual capital expenditure in 2010/11 was within $1M or 3% of a large capital works budget due mostly to timing issues.
CE 2. Asset renewalExpenditure on asset renewal was within 0.7% of budget.
CE 3. New assetsExpenditure on new assets was under budget by 12%, although a number of projects will be carried forward to 2011/12 for completion.
CE 4. Asset expansion/upgradeExpenditure on expansion assets was within 1.9% of budget.
CE 5. Operating Cash/Net capital outlaysThis ratio exceeded budget due to stronger operating cash inflows and lower capital expenditure in comparison to budget.
CE 6. Capital Works/Rate revenueThe proportion of rate revenue expended on capital works was slightly below budget due to timing delays in some capital projects.
CE 7. Asset renewal/Total depreciationExpenditure on asset renewals was slightly under budget but more importantly exceeded depreciation charges.
Community SatisfactionCouncil exceeded targets set for all community satisfaction measures. This is a reflection of Council providing improved and best value services to the community and our ratepayers.
Capital ExpenditureImplement a well structured capital works strategy to maintain existing Council assets and to provide a source of funds for new initiatives
Performance Targets and Measures
Actual Result
2011
Budget/Target
2011 Variance Achieved
CE 1. Capital Works $30,988,000 $31,954,000 ($966,000) No
CE 2. – Asset renewal $18,722,000 $18,862,000 ($140,000) No
CE 3. – New assets $4,958,000 $5,666,000 ($708,000) No
CE 4. – Asset expansion/upgrade $7,308,000 $7,426,000 ($118,000) No
CE 5. Operating Cash/Net capital outlays 100.47% 92.78% 7.7% Yes
CE 6. Capital Works/Rate revenue 42.88% 44.08% (1.2%) No
CE 7. Asset renewal/Total depreciation 109.80% 125.40% (15.6%) No
Community SatisfactionMonitor community feelings on Council’s performance and issues influencing community satisfaction to achieve a “Best Value” outcome for the community.
Performance Targets and Measures
Actual Result
2011
Budget/Target
2011 Variance Achieved
CS 1. Community satisfaction rating for overall performance generally of the Council
72 71 1 Yes
CS 2. Community satisfaction rating for overall performance in key service areas and responsibilities
68 67 1 Yes
CS 3. Community satisfaction rating for Council’s interaction and responsiveness in dealing with the public
76 74 2 Yes
CS 4. Community satisfaction rating for Council’s advocacy and community representation on key local issues
73 65 8 Yes
CS 5. Community satisfaction rating for Council’s engagement in decision making on key local issues
65 61 4 Yes
PERFORMANCE STATEMENTFOR THE YEAR ENDED 30 JUNE 2011

Financials
154/155
AUDITOR GENERAL’S REPORT ON THE PERFORMANCE STATEMENT
In my opinion, the accompanying Performance Statement of the City of Stonnington in respect of 2010/2011 financial year is presented fairly in accordance with the Local Government Act 1989.
The statement outlines the performance targets and measures set out in relation to the acheivement of the targets set in respect of that year described in Council’s Budget and describes the extent to which the targets were met in that year having regard to those targets and measures.
As at the time of signing, we are not aware of any circumstance which would render any particulars in the statement to be misleading or inaccurate.
We were authorised by the Council on 29 August 2011 to certify this performance statement on its behalf in its final form.
Cr Melina Sehr Mayor
29 August 2011 Malvern
Anne O’Shea Councillor
29 August 2011 Malvern
Warren Roberts Chief Executive Officer
29 August 2011 Malvern
CERTIFICATION OF THE PERFORMANCE STATEMENT

Glossary
GLOSSARY
156/157
Accumulated SurplusThe value of all net assets accumulated over time.
AssetsFuture economic benefits controlled by Council as a result of past transactions or other past events.
BenchmarkingQualitative and quantitative comparisons with similar services/service organisations to devise the best possible service provision.
Best PracticeHighest level of service viable.
Best ValueAn innovative approach to Local Government service delivery which includes community input, effective service delivery and cost efficiency as key service outcomes.
BiodiversityDifferent plants, animals and microorganisms make a variety of life incorporating their genes and the ecosystems.
Capital WorksProjects undertaken to either renew or upgrade or construct assets owned by Council in the community.
Community GrantsCouncil funding made available to local community organisations to provide activities and service not available through state, federal and private resources.
Council PlanStrategic document which provides the framework and direction for all areas of Council activity for four years.
CouncillorsElected representatives of Council.
Current AssetsAssets where Council expects to receive the future economic benefit within the next 12 months unless the asset is restricted from being exchanged or used to settle a liability for at least 12 months after the reporting date.
Current LiabilitiesLiabilities where Council expects to fulfil its obligation within the next 12 months unless the Council does not have an unconditional right to defer settlement of the liability for at least 12 months after reporting date.
EquityThe residual interest in the assets of Council after deductions of its liabilities, which is made up of accumulated surplus and reserves. Total equity is also equal to net assets.
ExpenseAn outgoing payment made by Council.
GovernanceHow Council operates as a decision-making body, its relationship with the administration and the ways that Council engages with their community in this process.
InfrastructureThe basic facilities needed for the functioning of a community including open space, road networks and drain systems.
LiabilitiesFuture sacrifices of economic benefits that Council is presently obliged to make to other entities as a result of past transactions or other past events.
Municipal Strategic Statement (MSS)Outlines the key land use and development objectives and strategies for the municipality. The MSS provides the basis for zones, overlays and particular provisions. Council will review the MSS every three years.
Net AssetsThe difference between total assets and total liabilities, which represents Council’s net worth. Net assets is also equal to total equity.
Planning SchemeSets the direction for the use, development, and protection of land within the municipality.
Rate and Charges IncomeIncome received from ratepayers in relation to general rates, garbage rates and special rate schemes.
RevenueRevenue is the amount of money that Council actually received from its activities, mostly from rates and services provided to customers and ratepayers.
Risk ManagementA discipline for developing appropriate procedures to reduce the possibility of adverse effects from future events.
Service CentreCouncil’s offices for direct customer service.
StrategyA plan of action intended to accomplish specifi c objectives.
VisionA description of the future we aim to achieve for our City and community.
WardThe delineation of a district within a municipality for the purposes of administration and representation.
INDEPENDENT AUDITOR’S REPORT

158/159
Index
INDEx
Local Government Act 1989 RequirementsThe City of Stonnington Annual Report was produced in compliance with the requirements outlined in the Local Government Act 1989.
Distribution InformationThe City of Stonnington Annual Report is distributed to our Councillors and staff, the Office of Local Government, the Municipal Association of Victoria and the State Library of Victoria. Hard copies of the Annual Report are available for collection at Council’s Service Centres in Malvern and Prahran and all branch libraries.
The Annual Report is also available on Council’s website www.stonnington.vic.gov.au
Advocacy 56
Animal Welfare Campaign 57
Awards 160
Balance Sheet 90
Balanced Scorecard 74
Best Value 73
Blue Horizon 60
Business Support 38
Business Systems and Technology 69
Cash Flow Statement 91
CEO’s Message 9 Chapel Off Chapel 32
Citizen of Year Awards 49
Civic Functions 48
Clearways 56
Communications 25
Como Park 33
Community Grants 24
Corporate Governance 45
Councillors 4
Cultural Diversity 23
Documents Available for Inspection 52
Domestic Animal Management Plan 32
Electoral Representation Review 46
Energy Saving Initiatives 13
Engagement 26
Environment 70
Equal Opportunity 61
Financial Results 82
Functions On Chapel 20
Freedom of Information 52
Gardiner’s Creek Trail 16
Glossary 157
Graffiti 31
Green Lighting 12
Green School’s Network 13
Grow With Us 22
Harold Holt Swim Centre 20
Heritage Protection 34
Human Resources 60
IMAP 49
Income Statement 89
Information Privacy Policy 53
Legislation 48
Library 35
Local Law 50
Mayor’s Message 8
Meetings 46
Municipal Inspectorate 48
Occupational Health and Safety 63
Ombudsman 54
Organisational Chart 58
Our City 6
Phoenix Park Community Hub 21
Planning 34
Population 6
Public Realm Strategy 30
Rain Gardens 13
Rates 55
Recycling 15
Regional Partnerships 39
Remuneration 47
Risk Management 67
Role in the Community 2
Staff Profile 62
Statement of Changes in Equity 100
Strategic Planning Framework 3
Sustainable Transport 16
Tourism 40
Understanding the Financials 86
Victoria Local Government Indicators 81
Water Consumption 14
Wellbeing 21
What I Love About Stonnington Campaign 30
Whistleblowers 50
WorkCover 66
Yarra River Biodiversity Project 12
GLOSSARY
COMMONLY USED ACRONYMS
AAS Australian Accounting Standards
AASB Australian Accounting Standards Board
ABS Australian Bureau of Statistics
AMP Asset Management Plan
CBD Central Business District
CE Capital Expenditure
CEO Chief Executive Officer
CIV Capital Improved Value
CPA Certified Practising Accountants
CS Community Satisfaction
CWMS Capital Works Management System
EBA Enterprise Bargaining Agreement
ECT Enforcement Computer Technology
EDMS Electronic Document Management System
EEO Equal Employment Opportunity
EOC Equal Opportunity Commission
EPA Environment Protection Authority
ESDS Electronic Service Delivery Strategy
FOI Freedom of Information
FP Financial Performance
GIS Geographic Information System
HACC Home and Community Care
HR Human Resources
IBM International Business Machines
IMAP Inner Melbourne Action Plan
IRMA Information, Records Management and Archives
IT Information Technology
ITDRS Information Technology Disaster Recovery Plan
JV Joint Venture
KPI Key Performance Indicator
LASPLAN Local Authorities Superannuation Plan
LGMA Local Government Managers Australia
LGPro Local Government Professionals
LLEN Local Learning and Employment Network
MAV Municipal Association of Victoria
MBS Municipal Building Surveyor
MCH Maternal and Child Health
MFB Melbourne Fire Brigade
MSS Municipal Strategic Statement
MTH Malvern Town Hall
NCP National Competition Policy
OC Operating Costs
OLG Offi ce of Local Government
PAC Prahran Aquatic Centre
PBS Private Building Surveyor
PCP Primary Care Partnership
PPP Parking Precinct Plan
PTH Prahran Town Hall
RHS Regional Housing Statement
RHWG Regional Housing Working Group
RM Rates Management
RMIT Royal Melbourne Institute of Technology
ROW Right of Way
SADS Save-A-Dog Scheme
SBO Special Building Overlay
SERWMG South East Regional Waste Management Group
VCAT Victorian Civil Administrative Tribunal
VIP Volunteer Interchange Program
VLGA Victorian Local Governance Association

__ Stonnington won a Gold Award in the Australasian Reporting Awards 2011 for the Annual Report 2009/10.
__ The Subdivision area within the Statutory Planning Department received an award for “Victorian Municipal Excellence (Best Council in Victoria)” from the Association of Consulting Surveyors Victoria at their Biennial Subdivision Seminar in March 2011.
__ Cultural Development and Events won a ‘Mainstreet’ Award for the ‘Shine at Christmas’ branding and campaign.
__ Stonnington was a finalist in the LGPro Awards for Excellence for Innovative Management for the 2009 Engagement Survey – Engaging Stonnington
AWARDS 2010/11