Embed Size (px)
Citation preview

83
annamaria lusardiGeorge Washington University
daniel schneiderPrinceton University
peter tufanoUniversity of Oxford
Financially Fragile Households: Evidence and Implications
ABSTRACT We examine households’ financial fragility by looking at their capacity to come up with $2,000 in 30 days. Using data from the 2009 TNS Global Economic Crisis Study, we document that approximately one-quarter of U.S. respondents are certain they could not come up with that sum. If we include respondents who report being probably unable to do so, nearly half of respon-dents are financially fragile. Although financial fragility is more severe among low-income households, a sizable fraction of seemingly middle-class Americans are also at risk. Respondents with low educational attainment and no financial education, families with children, those who have suffered large wealth losses, and the unemployed are also more likely than others to report being unable to cope with a financial shock. Households’ own savings are the resource used most often to deal with shocks, but resources of family and friends, formal and alternative credit, increased work hours, and sale of possessions are also used frequently, especially among some subgroups. These results indicate the need to look beyond precautionary savings to understand how families cope. We also find evidence suggestive of a “pecking order” of coping methods, with savings first in line. Comparing financial fragility and methods of coping among the United States and seven other industrialized countries, we find differences in coping ability but also general evidence of a consistent ordering of methods.
economists and policymakers have focused on various elements of con-sumer financial behavior to gauge the overall well-being of households
and of the economy. For example, the household saving rate; its converse, the rate of consumer spending; and household borrowing are commonly
Copyright 2011, The Brookings Institution

84 Brookings Papers on Economic Activity, spring 2011
used aggregate metrics. At the micro level, researchers have studied the distribution of wealth across the population, for example to assess house-holds’ ability to afford to retire. Other research examines households’ abili-ties to withstand financial shocks, usually by looking at their savings and access to credit. Still other work examines bankruptcy filings as a metric of financial problems. Our work builds upon this large literature but instead characterizes financial fragility by examining households’ ability to access emergency funds from any source. We study the ability of U.S. households to come up with $2,000 in 30 days, and we compare their coping ability with that of households in seven other industrialized countries.
Using this metric of financial fragility, we find widespread financial weakness in the United States: one-quarter of U.S. households surveyed report that they are certain they could not come up with $2,000 within 30 days, and an additional 19 percent of all respondents would cope at least in part by selling or pawning possessions or taking payday loans. Almost half of all U.S. households surveyed report that they either certainly or probably could not come up with the funds to deal with an ordinary financial shock of this size. We also examine the cross-sectional distribution of financial fragility and show that it is not just a problem of the poor: a material frac-tion of the solidly middle class are pessimistic about their ability to come up with $2,000 in a month. Our work allows us to begin to characterize a “pecking order” of coping mechanisms, broadly rationalize them on the basis of direct and indirect costs, and suggest some implications of these patterns. Finally, comparing levels of financial fragility and methods of coping across the United States and seven other industrialized countries, we find differences in coping ability but also a largely consistent ordering of coping methods.
This textured description of households’ financial fragility and coping mechanisms, while raising many questions, should prove useful in advanc-ing economic research, public policy, and business practice. We make two principal contributions to the research literature. First, the fragility measure we propose appears to be a powerful metric that enlightens our understand-ing of important household decisions. In related work, we have found that our simple measure of financial fragility is more predictive of consumer behavior than traditional demographic data, and in particular more predic-tive of decisions about cutting back health care usage and of individuals’ attitudes about financial regulation (Lusardi, Schneider, and Tufano 2010, Tufano 2011). Second, just as pecking order theory led to advances in under-standing corporate financial decisions, so we hope that our work will stimulate new economic research into why households have certain ordered methods
annamaria lusardi, daniel schneider, and peter tufano 85
for coping—and what the implications are for the interactions between various financial and “real” household decisions.
We also believe that a full consideration of financial fragility will enlighten public policy. In advocacy and policy circles, asset building for long-horizon goals, such as retirement, education, and small business development, has understandably been the primary focus. Although the U.S. government pro-vides extensive direct and indirect subsidies to long-horizon saving, there is much less, if any, explicit policy related to short-term emergency saving. For example, whereas borrowing to purchase a home (which results in long-term savings through the buildup of home equity) is tax advantaged through the deductibility of home mortgage interest, and long-term investing is advantaged through lower tax rates on long-term capital gains, income earned in emergency savings accounts receives no special treatment. On the contrary, asset limits on eligibility for many social programs actively discourage low-income families from building up savings. And although borrowing from family and friends is a critical element of household cop-ing, it is virtually invisible in public policy. Nor do proposals to regulate or prohibit high-cost short-term borrowing schemes typically acknowledge the place of such borrowing in the pecking order of coping mechanisms.
Finally, the level of financial fragility we identify suggests business opportunities for firms to provide better financial products for households. For example, although some existing debit card accounts feature an asso-ciated credit line or overdraft facility and thus combine two elements of the pecking order we observe (savings and mainstream credit), our work suggests that offering the possibility to draw first from savings, then from a constrained pool of funds held by friends and family members, and only then from credit might better match households’ preferences.
This paper begins by briefly summarizing some of the related literature on financial fragility and coping. We then describe our data source, summarize our results on financial fragility, analyze the cross-sectional determinants of households’ choices of coping methods, describe the apparent hierarchy of those methods, and report on cross-national comparisons. We conclude with a discussion of the implications of our work.
I. Related Research
Most of the work to date in both macroeconomics and microeconomics on how individuals manage short-term risks and their exposure to shocks focuses on precautionary savings and asset levels. According to theory, risk-averse individuals who face uninsurable risks accumulate wealth
86 Brookings Papers on Economic Activity, spring 2011
to shield themselves against shocks (Deaton 1992, Carroll 1997). Many empirical studies, however, including one based on recent data from the Financial Capability Study (described below and in Lusardi 2010), find that, in fact, many households hold few or no assets and no emergency funds and that they are very vulnerable to shocks (Caner and Wolff 2004). Others have documented the paucity of assets among certain groups in the population (Oliver and Shapiro 1995, Conley 1999, Haveman and Wolff 2004, Bucks, Kennickell, and Moore 2004, Sherraden 2005). It has proved very difficult to evaluate the strength of the precautionary motive in the economy, and estimates in the literature of the amount of precautionary wealth held by households have varied considerably, from zero or very small values (Skinner 1988), to moderate values of less than 10 percent of total household wealth (Hurst and others 2010), to values as high as 50 percent of household wealth (Carroll and Samwick 1997, 1998), depending on the empirical specifications and the datasets under consideration.
Looking at assets alone may be misleading, however. A household’s assets may be low not because the household did not accumulate wealth, but because the household has already experienced shocks that depleted its savings. Numerous, often unobservable, characteristics of individuals and their environment also determine how much wealth people wish to hold, including risk aversion, rate of time preference, and the subjective prob-ability of facing shocks, for which good data are often lacking (see Deaton 1992 and Browning and Lusardi 1996 for an overview of theoretical models of precautionary saving).
Most important, holding assets is not the only means of buffering one-self against shocks. Individuals can also access credit, for example through credit cards, home equity lines of credit, or loans on retirement accounts, all options that have expanded considerably over the past four decades. Indeed, in many theoretical models, positive amounts of precautionary sav-ings are generated by imposing liquidity constraints that prevent the individual from borrowing or drawing his or her assets down to zero (Deaton 1991). Given the ease with which access to personal credit has, until recently, been available in the United States, these assumptions are debatable. In addition, as emphasized in the sociological literature, individuals can and do rely on networks of family and friends to cope with unexpected financial shocks (Briggs 1998, Sarkisian and Gerstel 2004, Henly, Danziger, and Offer 2005, Harknett and Knab 2007). Some economic models also recognize that the family can be a very effective resource to insure against longevity risk and can provide insurance in place of, and perhaps better than, finan-cial or insurance markets (Kotlikoff and Spivak 1981). Indeed, there is

annamaria lusardi, daniel schneider, and peter tufano 87
evidence of significant borrowing and lending within the family and among friends: for example, 24 percent of all Americans claim to have borrowed money from a family member or friend during the Great Recession (Taylor, Morin, and Wang 2010), and 9 percent reported having outstanding loans to family or friends in 2004 (El Hage, Schneider, and Tufano 2006). Other models have considered the possibility that individuals might make adjust-ments on other margins, for example by increasing their labor supply or sending a nonworking spouse into the labor market.
These considerations do not exhaust the list of activities that people can engage in when faced with a shock. For example, according to Mark Aguiar and Erik Hurst (2005), the unemployed increase their home production of goods, thus reducing their expenditure on goods by less than they reduce their consumption. Also, households hold nonfinancial assets (cars, furniture, jewelry, and so on) that can be sold but that are not normally included in measures of wealth, or at least of liquid wealth.
Substantial heterogeneity in household saving behavior has been docu-mented in earlier studies of saving (Browning and Lusardi 1996) and is documented further in this paper. This heterogeneity may reflect differences in economic circumstances and opportunity (for example, education), dif-ferences in attitudes and preferences, or differences in financial capabilities (Lusardi 2009). On the last point, there is mounting evidence that many individuals, in the United States and elsewhere, are not familiar with basic financial concepts, such as interest compounding, inflation, basic asset pricing (see Lusardi 2008 for an overview), and especially risk diversifi-cation (Lusardi and Mitchell 2011a). Variation in households’ abilities to cope could reflect these factors. Furthermore, it is important to connect seemingly unrelated financial decisions. The risk preferences assumed in many neoclassical models of saving seem at odds with the prevalence and amount of gambling in large parts of the population (Tufano and others 2011), and some households regard gambling as an alternative to saving. In addition to naïveté or specific risk preferences, gambling may proxy for different attitudes toward the future and may be related to households’ preparedness to cope with financial shocks.
The recent financial crisis may have increased this heterogeneity, insofar as individuals were affected differently by the shocks that accompanied the crisis, in particular the surge in the unemployment rate and the sharp price declines in both the stock market and the housing market. House-holds’ ability to cope with a financial shock today would likely be a function of the extent to which they have already suffered from these earlier shocks.

88 Brookings Papers on Economic Activity, spring 2011
II. Data and Methodological Approach
In this paper we use an indicator of financial fragility that overcomes some of the problems of the measures described above. We rely on a self-assessed measure of capacity to deal with financial shocks, regardless of whether the source of funds is the respondent’s own assets, capacity to borrow, a network of family and friends, or something else. Specifically, we ask respondents, “How confident are you that you could come up with $2,000 if an unexpected need arose within the next month?” Respondents could reply, “I am certain I could come up with the full $2,000,” “I could prob-ably come up with $2,000,” “I could probably not come up with $2,000,” or “I am certain I could not come up with $2,000.” They could also state that they do not know, or they could refuse to answer. Because we are deal-ing with an unexpected event in the future, it is important to pose the ques-tion in terms of the respondent’s confidence about the answer rather than require a simple yes or no. The $2,000 figure is chosen because it is of the same order of magnitude as the cost of an unanticipated major car repair, a large co-payment on a medical expense, a legal expense, or a home repair.1 Finally, our question asks whether the individual could “come up with” the funds—not whether the individual has the funds in the form of savings—because, as explained above, we are interested in exploring the full gamut of resources that individuals may rely on in dealing with shocks.
This type of question has also been used in other settings. For example, the Australian Household Expenditure Survey asked a similar question in 2002 (Worthington 2003). In fact, these sorts of questions are common in the financial planning literature, because having emergency funds is one of the recommendations that financial planners routinely provide to households. In this literature, however, emergency funds are sometimes considered synonymous with savings (Chieffe and Rakes 1999). In our discussion we use the terms “capacity to cope” and “come up with the needed funds” interchangeably, although the latter is more exact.
Although we believe the answers to this question are informative, it is important to acknowledge potential limitations of its framing. First, respon-dents might interpret the phrase “could come up with $2,000” in different ways. In particular, respondents may differ as to whether they would con-sider using savings that they already have as “coming up with” the funds.
1. Brobeck (2008) reports that low-income families claim to need about $1,500 in sav-ings for emergencies. Edmunds.com, a popular automobile website, suggests that replacing an auto transmission can cost $2,000 (www.edmunds.com/ownership/techcenter/articles/ 43836/article.html).

annamaria lusardi, daniel schneider, and peter tufano 89
Second, $2,000 is a rather low figure for all but the lowest-income respon-dents, with reference to the 3 months of income or expenses that many planners recommend as an emergency fund. Third, it is not clear whether, when answering the question, respondents are thinking of a single shock or of a shock that is linked to a sequence of other shocks that would make coping more difficult. Fourth, we do not know whether respondents are thinking in terms of a consumption shock (for example, the car breaking down) or an income shock (becoming unemployed), although the two may have rather different consequences. Fifth, the specified time frame (30 days) may also influence what people can do and the cost of the methods they might rely upon. Finally, it should be noted that our survey was conducted during a period of economic crisis, and therefore the responses may be period-specific. The answers could also reflect the higher uncertainty that prevails in times of crisis, rather than actual financial fragility.
To gauge how individuals would cope with a financial shock, those survey respondents who did not state that they would certainly be unable to come up with $2,000 were asked, “If you were to face a $2,000 un -expected expense in the next month, how would you get the funds you need?”2 Respondents were presented with a list of 14 options (plus “other” and “don’t know”) and were instructed that “if there is one source that you would use, select it. If you would use multiple sources, please select up to three.” The list of 14 options was randomized on screen to avoid response-order bias, and the category labels given below were not part of the survey questionnaire. The list was composed of the following methods, grouped here by category:
—Savings: (1) draw from savings, (2) liquidate or sell investments, (3) liquidate some retirement investments even if it required me to pay a penalty, (4) borrow against my retirement savings at my employer3
—Family or friends: (5) borrow or ask for help from my family, (6) bor-row or ask for help from my friends (not members of my family)
2. Respondents in the United Kingdom were asked about a £1,500 expense, respondents in Canada about a C$2,000 expense, and respondents in France, Germany, Italy, the Netherlands, and Portugal about a 61,500 expense.
3. Depending on the institutional details, funds in certain retirement plans can be accessed prematurely either by withdrawing funds or by borrowing against them. According to the Financial Capability Study, nearly 9 percent of individuals who have self-directed retirement accounts had taken out a loan against those accounts within the last year, and almost 5 per-cent had taken a hardship withdrawal (Lusardi 2010). We include these coping methods as drawing upon savings rather than as borrowing from a third party. We also combine items 3 and 4 into a single response for the purposes of presentation.

90 Brookings Papers on Economic Activity, spring 2011
—Mainstream credit: (7) use credit cards, (8) open or use a home equity line of credit or take out a second mortgage, (9) take out an unsecured loan
—Alternative credit: (10) get a short-term payday or payroll advance loan, (11) pawn an asset I own
—Sell possessions: (12) sell things I own, except my home, (13) sell my home
—Work more: (14) work overtime, get a second job, or another member of my household would work longer or go to work.
Despite its length, the above list does not encompass all of the methods that respondents could use to get funds. For example, respondents could also stop or postpone paying bills. Moreover, although the grouping is mostly for convenience in exposition, there are differences even within these categories. For example, drawing from nonretirement savings is less expensive than liquidating retirement investments. Most important, it is limiting not to have information on coping methods for those who stated that they were certain that they could not come up with $2,000 in 30 days, although for these survey takers, it would have seemed illogical to ask how they would come up with funds that they had already claimed they could not raise.
These questions were added to a new survey, the TNS Global Economic Crisis Study, which was fielded in 13 countries between June and Septem-ber 2009. The survey was administered via an online panel by the survey research firm TNS Global (www.tnsglobal.com) and in collaboration with two of the authors, Lusardi and Tufano. TNS, which has substantial experi-ence in designing and administering cross-national surveys, reviewed the questions before they were fielded both in the United States and in the other countries. The country samples were designed to be nationally representa-tive and were subsequently weighted to reflect each nation’s population. To the extent that Internet access is stratified by socioeconomic status, we expect that the data may underrepresent those individuals most at risk. This paper deals primarily with the 2,148 U.S. survey participants, all of whom were between the ages of 18 and 65. We also perform an international com-parison to assess financial fragility in other countries. To limit the compari-son to countries that are relatively similar to the United States and to each other in terms of economic structure and development of financial markets, we study respondents in seven other high-wealth Western countries only: Canada, France, Germany, Italy, the Netherlands, Portugal, and the United Kingdom. Our final sample is composed of 9,147 observations. Additional information about the survey is provided in the appendix.
To examine financial fragility in the wake of a financial crisis, the survey includes questions not only on demographic and economic attributes such

annamaria lusardi, daniel schneider, and peter tufano 91
as age, sex, race and ethnicity, marital status, presence of children, and income but also on wealth, wealth losses, and unemployment. Specifically, respondents were asked to report current levels of financial assets, whether they were unemployed and looking for work, and whether their household wealth had increased over the past year (and if so, whether by more than 10 percent or by 1 to 10 percent), stayed the same, or decreased (and if so, whether by 1 to 10 percent, 10 to 29 percent, 30 to 50 percent, or more than 50 percent). To capture behavioral heterogeneity, we also included proxies for financial literacy in general and risk literacy in particular. For the for-mer, following Douglas Bernheim, Daniel Garrett, and Dean Maki (2001), we asked whether individuals had been exposed to financial education in school, a variable that is shown to be correlated with saving later in life. For the latter, individuals were asked three questions aimed at measuring their knowledge of risk (see the appendix). Finally, respondents were asked whether they had played the lottery or had bet on sports or games of chance in the year leading up to the financial crisis.
In the empirical analysis described in section III, we examine U.S. respondents’ perceived capacity to cope with an unexpected expense. Here we are primarily concerned with describing the level of coping capacity in the U.S. population and with describing the correlation between coping capacity and socioeconomic and demographic characteristics. We tabulate descriptive statistics and estimate probit models of the relationship between a dichotomous indicator of confidence in ability to cope and respondent char-acteristics. In these and in all our analyses, we handle missing data by includ-ing indicators for nonresponse on the covariates in our regression models, but we exclude respondents with missing data on the dependent variable.
Next, in section IV, we examine the ways in which our U.S. respondents foresee coping with such a financial shock. Here we examine the frequency with which different coping methods are named, including savings but also taking account of a much more complete range of coping options. We then suggest a “pecking order” of coping responses. To establish this order-ing, we examine three sets of findings: the ways in which coping methods are used in isolation or combined, the association between different coping methods and confidence in capacity to cope, and the socioeconomic and demographic correlates of each type of coping method. For this third aspect of the analysis, we estimate six separate probit regressions, in which the outcome variable is the choice of a coping method involving savings, family or friends, mainstream credit, alternative financial services, selling posses-sions, or additional work, with the predictors in each case being the demo-graphic and economic covariates described above.
92 Brookings Papers on Economic Activity, spring 2011
Finally, in section V we provide some comparative analysis, contrast-ing perceived capacity to cope, coping methods, and number of coping methods used in the United States and in the seven other countries in our sample.
III. Americans’ Financial Fragility
Americans’ capacity to cope with shocks is strikingly limited. The first row of table 1 presents the shares of our U.S. respondents who said that they certainly could, probably could, probably could not, and certainly could not cope with an unexpected need in the next month that required them to come up with $2,000. Half of the sample reported that they probably or certainly could not cope with such an emergency.4
This finding is broadly consistent with those of other studies. For exam-ple, when asked whether they have “set aside emergency or rainy day funds that would cover your expenses for 3 months, in case of sickness, job loss, economic downturn, or other emergencies,” only 49 percent of respondents in the 2009 Financial Capability Study responded affirmatively.5 Data from the most recent Survey of Consumer Finances, fielded in 2007 before the recent prolonged recession, show that many households hold little in liquid assets, such as checking and savings accounts and money market mutual funds: as many as 42.4 percent of Americans have $2,000 or less in such accounts. Numerous studies on wealth have documented that many house-holds have few assets other than their home and their pensions (Lusardi 1999, Gustman and others 1999).
Another way to examine financial constraints is to look at what happens when those constraints are relaxed: in other words, what do people do when they get access to a substantial amount of money or liquidity? Jonathan Parker and others (2011) show that consumption and, in particular, vehicle purchases increased at the time of the economic stimulus payments disbursed
4. These statistics exclude respondents who replied that they “don’t know” if they could cope with an emergency of this kind. When all respondents are included, about 46 percent certainly or probably could raise the funds, 47 percent certainly or probably could not raise the funds, and the remaining 7 percent claimed not to know.
5. The Financial Capability Study is a national study of the financial capability of American adults, supported by the FINRA Investor Education Foundation in consultation with the U.S. Department of the Treasury and the President’s Advisory Council on Financial Literacy. The study’s overarching research objectives were to benchmark key indicators of financial capability and evaluate how these indicators vary with underlying demographic, behavioral, attitudinal, and financial literacy characteristics. For details, see Lusardi (2010) and www.finrafoundation.org/resources/research/p120478.

annamaria lusardi, daniel schneider, and peter tufano 93
Table 1. confidence in ability to cope with an unexpected expense, by economic and demographic characteristicsa
Percent of respondents
Self-reportedabilitytocomeup with$2,000in30days
Certainly Probably Probably CertainlyCharacteristic able able notable notable
All respondents 24.9 25.1 22.1 27.9
ChangeinhouseholdwealthsincefinancialcrisisNo change 23.8 28.6 22.4 19.9Increase between 1 and 10 percent 40.4 15.6 26.4 17.6Increase < 10 percent 34.9 27.4 22.1 15.6Decrease < 10 percent 24.0 33.8 22.4 19.9Decrease between 10 and 29 percent 30.9 27.0 19.5 22.6Decrease between 30 and 50 percent 20.7 26.4 24.7 28.2Decrease > 50 percent 10.0 8.3 24.1 57.7
AnnualhouseholdincomeLess than $20,000 9.3 14.6 19.2 56.8$20,000 to $29,999 11.4 21.2 27.7 39.7$30,000 to $39,999 17.5 27.5 23.6 31.4$40,000 to $49,999 17.0 26.1 29.9 27.0$50,000 to $59,999 21.9 24.7 26.1 27.3$60,000 to $74,999 33.1 27.9 21.8 17.3$75,000 to $99,999 40.7 33.7 15.4 10.2$100,000 to $149,999 49.0 27.3 12.9 10.8$150,000 or more 58.1 27.5 4.7 9.8
HouseholdwealthZero 5.8 11.9 21.8 60.5Less than $1,000 2.4 14.9 36.5 46.2$1,000 to $2,999 6.3 27.6 37.7 28.4$3,000 to $3,999 10.3 35.7 30.3 23.7$4,000 to $9,999 19.0 35.6 243 21.1$10,000 to $19,999 25.9 35.1 15.5 23.5$20,000 to $49,999 36.4 27.8 19.6 16.1$50,000 to $99,999 34.3 28.9 17.9 18.9$100,000 to $249,999 48.7 25.3 10.9 15.1$250,000 or more 55.1 26.3 8.3 10.3
EducationHigh school or less 12.3 21.0 27.1 39.6Trade school 17.1 25.8 22.3 34.9Some college 23.0 24.7 22.9 29.5College (bachelor’s degree) 34.5 27.1 19.7 18.8Graduate education 45.4 31.8 11.6 11.3
(continued)

94 Brookings Papers on Economic Activity, spring 2011
EmploymentstatusUnemployed 15.3 15.7 27.8 41.2Not unemployed 26.5 26.7 21.1 25.8
Age18 to 34 17.8 24.6 29.0 28.735 to 54 25.4 26.8 19.3 28.655 to 65 43.0 21.1 12.3 23.6
SexFemale 21.2 24.3 22.7 31.8Male 28.6 26.0 21.4 24.1
RaceorethnicityWhite 26.5 24.9 21.3 27.3Black 16.5 20.6 25.2 37.7Hispanic 18.3 25.2 27.2 29.3Asian 26.9 34.4 25.2 13.5Other race or ethnicity 7.1 27.8 20.1 45.1
MaritalstatusMarried or cohabiting 28.4 26.7 20.1 24.5Never married 21.3 24.4 24.8 29.5Divorced or widowed 23.9 21.4 18.3 36.4Other marital status 16.4 23.0 27.8 32.8
HouseholdcompositionNo children in household 29.4 24.2 20.4 26.1Children in household 18.4 26.5 24.4 30.6Not living with parents 26.2 25.5 20.8 27.5Living with parents 15.3 22.3 31.5 30.9
RegionSouth 25.2 24.6 22.2 28.0Northeast 27.9 23.3 21.3 27.6Midwest 23.5 25.3 22.7 28.4West 23.2 27.3 21.8 27.7
Source: Authors’ regressions using data from the 2009 TNS Global Economic Crisis Study.a. The tabulations by change in wealth, income, and wealth are based on 1,681, 1,803, and 1,669 obser-
vations, respectively, because of missing data. All others are based on 1,931 observations.
Table 1. confidence in ability to cope with an unexpected expense, by economic and demographic characteristicsa (Continued)Percent of respondents
Self-reportedabilitytocomeup with$2,000in30days
Certainly Probably Probably CertainlyCharacteristic able able notable notable

annamaria lusardi, daniel schneider, and peter tufano 95
by the U.S. government in mid-2008. Similar findings are encountered when looking at the use of tax refunds by those more likely to lack liquidity, such as subprime borrowers. Loan applications and car sales spike precisely at tax rebate time (Adams, Einov, and Levin 2009). Melvin Stephens (2008) finds that consumption by families increases after they make a final vehicle loan payment. Stephens (2003) has also shown that consumption is influenced by the timing of Social Security checks: large increases in consumption are found on the day of and the day immediately following the arrival of a monthly Social Security check. Access to credit has a similar effect on con-sumption (Gross and Souleles 2002). These studies evidence the tightness of many households’ budgets, pointing to their fragility from a different angle from that pursued in this paper, although there may be an asymmetry between when constraints are tightened and when they are relaxed.
Another measure of financial fragility related to our $2,000-in-30-days metric is self-reported ability to “make ends meet.” The Pew Research Center for the People and the Press has regularly asked a nationally repre-sentative sample of Americans if they “often don’t have enough money to make ends meet.” Forty-two percent of Americans completely or mostly agreed with that statement in 2009. Similarly, nearly half of survey respon-dents in the Financial Capability Study reported facing difficulties in cov-ering monthly expenses and paying bills (Lusardi 2010).
The capacity to cope with a financial emergency not only is generally limited, but also varies significantly with the economic and demographic characteristics of individuals and their households. Table 1 reveals a pro-nounced gradient in capacity to cope by income and education: those with higher income and greater educational attainment report higher capacity to cope. However, a high proportion of individuals even at middle-class levels of income report that they are certainly or probably not able to cope, as do just over half of those with some college but not a college degree. Thus, although inability to cope is severe among the less educated and low-income populations, it is not limited to them. It may seem somewhat un believable that nearly a quarter of households making between $100,000 and $150,000 a year claim to be probably or certainly unable to raise $2,000 in a month, but this fact may be less shocking when one considers the costs of living in urban areas, expenses for housing and childcare, the substantial debt service burden of many households, and other factors (for an earlier discussion, see Warren and Tyagi 2003). During the 2008 presidential elec-tion, this issue came to the fore in a vigorous debate about what “rich” and “middle class” mean in today’s economy. Moreover, as Steven Venti and David Wise (2001) document, a sizable fraction of high-lifetime-income

96 Brookings Papers on Economic Activity, spring 2011
households have very little savings, again confirming the wide heterogene-ity we observe in household saving behavior.
Similarly, although financial fragility is more pronounced among the young, many of our respondents aged 55 to 65, who are presumably close to retirement and at a point in life when their wealth accumulation should be peaking, report having difficulty in coping with a shock. We also observe differences along other demographic characteristics. Women are less likely to report being probably or certainly able to cope with a financial shock than men. African Americans are more likely than other races and ethnic groups to report such difficulty, followed closely by Hispanics. Respondents who live in households that include minor children are less able to cope than those who do not, and respondents who share a household with their parents are also less able to cope than those who do not.
These characteristics are again consistent with the findings from the Finan-cial Capability Study (Lusardi 2010), and other studies have also documented the paucity of wealth among certain groups, such as minorities (Smith 1995). This finding is confirmed here when looking at this new measure of finan-cial fragility.
The recent financial crisis is a clear contributor to financial fragility. Those households that suffered wealth losses during the crisis, and particu-larly those with losses in excess of 30 percent, report greater inability to cope. This fact may explain why even some people with sizable amounts of wealth judge that they are unlikely to be able to cope: lowered wealth in conjunction with high fixed costs and inflexible commitments may leave little room for coping. Not surprisingly, the unemployed are also much more financially fragile: only about one-third report that they would certainly or probably be able to cope, and 41 percent report that they would certainly be unable to cope.
Table 2 reports results of a multivariate analysis of the relationships between economic and demographic characteristics and capacity to cope, presenting marginal effects from a probit regression in which the dependent variable equals 1 if the respondent reports being probably or certainly able to cope and zero if the respondent reports being probably or certainly not able to cope. The table reports results of two models: model 1 includes only the demo-graphic and other variables examined in table 1, whereas model 2 includes three additional dummy variables based on the measures of gambling behavior, overall financial literacy, and risk literacy described in section II: whether the respondent engaged in gambling during the past year, whether the respondent had financial or economic education while in school, and whether the respondent correctly answered three questions about risk.

annamaria lusardi, daniel schneider, and peter tufano 97
Table 2. probit regressions explaining confidence in ability to cope with an unexpected expense with economic and demographic characteristicsa
Characteristic Model1 Model2
Changeinhouseholdwealthsincefinancialcrisis(omittedcategory:nochange)Increase between 1 and 10 percent -0.017 -0.010 (0.060) (0.059)Increase < 10 percent 0.018 0.025 (0.050) (0.051)Decrease < 10 percent -0.018 -0.017 (0.046) (0.047)Decrease between 10 and 29 percent -0.040 -0.046 (0.040) (0.040)Decrease between 30 and 50 percent -0.115** -0.111** (0.047) (0.047)Decrease > 50 percent -0.277**** -0.272**** (0.050) (0.050)
Annualhouseholdincome(omittedcategory:<$20,000)$20,000 to $29,999 0.056 0.048 (0.057) (0.057)$30,000 to $39,999 0.121** 0.126** (0.053) (0.054)$40,000 to $49,999 0.041 0.033 (0.057) (0.058)$50,000 to $59,999 0.046 0.041 (0.059) (0.060)$60,000 to $74,999 0.168*** 0.169*** (0.054) (0.054)$75,000 to $99,999 0.260**** 0.260**** (0.052) (0.053)$100,000 to $149,999 0.246**** 0.244**** (0.059) (0.059)$150,000 or more 0.286**** 0.287**** (0.077) (0.077)
Householdwealth(omittedcategory:zero)Less than $1,000 -0.045 -0.042 (0.063) (0.064)$1,000–$2,999 0.137** 0.133** (0.066) (0.067)$3,000–$4,999 0.251**** 0.237**** (0.062) (0.064)$4,000–$9,999 0.294**** 0.300**** (0.054) (0.054)$10,000–$19,999 0.342**** 0.334**** (0.049) (0.050)$20,000–$49,999 0.363**** 0.357**** (0.045) (0.047)$50,000–$99,999 0.327**** 0.315**** (0.050) (0.051)
(continued)

98 Brookings Papers on Economic Activity, spring 2011
$100,000–$249,999 0.359**** 0.359**** (0.047) (0.048)$250,000 or more 0.409**** 0.401**** (0.044) (0.046)
Education(omittedcategory:highschoolorless)Trade school 0.029 0.030 (0.056) (0.056)Some college 0.080** 0.068 (0.037) (0.037)College (bachelor’s degree) 0.124*** 0.098** (0.038) (0.039)Graduate education 0.245**** 0.222**** (0.052) (0.055)
EmploymentstatusUnemployed -0.105*** -0.109*** (0.041) (0.041)
Age(omittedcategory:18to34)35 to 54 0.064** 0.076** (0.032) (0.032)55 to 65 0.129*** 0.144*** (0.048) (0.048)
SexFemale -0.081*** -0.077*** (0.027) (0.028)
Raceorethnicity(omittedcategory:white)Black -0.006 -0.008 (0.051) (0.051)Hispanic 0.007 0.023 (0.068) (0.068)Asian 0.102 0.103 (0.064) (0.065)Other race or ethnicity -0.002 -0.014 (0.094) (0.092)
Maritalstatus(omittedcategory:marriedorcohabiting)Never married -0.041 -0.049 (0.041) (0.040)Divorced or widowed -0.031 -0.029 (0.044) (0.044)Other marital status -0.079 -0.077 (0.049) (0.050)
Table 2. probit regressions explaining confidence in ability to cope with an unexpected expense with economic and demographic characteristicsa (Continued)
Characteristic Model1 Model2

annamaria lusardi, daniel schneider, and peter tufano 99
We find that many of the relationships described in the univariate analy-sis hold true in the multivariate analysis. First, the financial crisis appears to have diminished respondents’ abilities to cope with shocks. Those with severe wealth losses and the unemployed are particularly vulnerable to shocks: wealth losses of more than 50 percent decrease the ability to cope by 27 or 28 percentage points, depending on the model, and being unemployed decreases that ability by 11 percentage points in both models. Some groups, such as women and households with children, are much less able to deal with shocks, even after accounting for their other character-istics and economic circumstances. Moreover, having higher educational attainment improves the ability to deal with shocks, even after accounting
HouseholdcompositionChildren in household -0.071** -0.075** (0.030) (0.030)Live with parents -0.142*** -0.146*** (0.046) (0.046)
Region(omittedcategory:South)Northeast -0.002 0.011 (0.038) (0.038)Midwest -0.014 -0.012 (0.034) (0.034)West 0.010 0.003 (0.036) (0.037)
AdditionalvariablesGambler -0.079*** (0.028)Received financial education 0.102**** (0.031)Risk literate 0.060 (0.037)
Pseudo-R2 0.218 0.226
Source: Authors’ regressions using data from the 2009 TNS Global Economic Crisis Study.a. The dependent variable is a dummy set equal to 1 if the respondent reports being certainly or probably
able to cope and zero if the respondent reports being certainly or probably unable to cope. Coefficients indicate difference with respect to the omitted category; the omitted category is not listed where the variable has only two categories. Both models also include dichotomous indicators of having missing data for income, wealth, or change in wealth. Both regressions have 1,931 observations. Standard errors are in parentheses. Asterisks indicate statistical significance at the *p < 0.1, **p < 0.05, ***p < 0.01, or ****p < 0.001 level.
Table 2. probit regressions explaining confidence in ability to cope with an unexpected expense with economic and demographic characteristicsa (Continued)
Characteristic Model1 Model2

100 Brookings Papers on Economic Activity, spring 2011
for income, wealth, and wealth losses. The ability to cope increases with income, but the results are statistically significant only for those with annual income above $60,000. Financial assets can also help smooth shocks: we see a largely monotonic increase in the ability to deal with shocks with increasing values of wealth above $1,000. Generally, these findings speak to the quality of the data, as many of the relationships reported have the expected sign. They also argue against the possibility that respondents are simply “button mashing,” that is, giving whatever answers they believe will get them through the questions more quickly. For example, the regres-sions show that, as one would expect, levels of wealth below $1,000 are associated with an inability to deal with shocks of that magnitude.
The picture that emerges from this analysis is that many Americans are vulnerable to shocks. This vulnerability extends to large groups of the population, including those with higher than average income and higher educational attainment. Women, those with children, and those living with parents reveal a vulnerability to shocks, even after accounting for their other demographic and economic characteristics.
The results for model 2 show that after controlling for all of the standard demographics, gamblers are 8 percentage points less likely than nongam-blers to be able to come up with $2,000 in a month. This could reflect the depletion of their resources through gambling, a lack of self-control, a willingness to bear more risk (by having fewer spare resources), or the use of gambling as an (ineffective) means to provide for the future. On the last point, a 2005 survey by the Consumer Federation of America and the Financial Planning Association of a representative sample of more than 1,000 U.S. adults found that “more than one-fifth of Americans (21%)—38% of those with incomes below $25,000—think that winning the lottery represents the most practical way for them to accumulate several hundred thousand dollars” (Consumer Federation of America 2006).
People who acknowledge having had financial education in school are 10 percentage points more likely to be able to cope, even after controlling for all of the various demographic factors. This is consistent with previous findings on the effect of knowledge on financial behavior (Lusardi and Mitchell 2011a, Bernheim, Garrett, and Maki 2001). This relationship might be causal, or it might reflect some degree of self-selection of educational experiences by certain individuals. We do not find a relationship between the particular risk literacy measures we tested and the ability to come up with $2,000 in 30 days.
These findings begin to suggest that financial fragility may be part of a broader set of behaviors. For example, social scientists do not normally
annamaria lusardi, daniel schneider, and peter tufano 101
study savings and gambling together, but the results here suggest a link between the two, at least for people’s ability to cope with emergencies.6 Financial knowledge may also affect the ability to cope with shocks.
IV. Americans’ Methods of Coping with Financial Emergency
The univariate and multivariate analyses discussed above point to some determinants of financial fragility but do not address how Americans cope with emergencies. We now examine how people who have some capacity to cope do so. This analysis excludes those who reported that they are cer-tain they could not cope with a shock that requires coming up with $2,000 in 30 days.
Table 3 reports that more than half (54 percent) of these respondents indicate that they would use multiple coping methods. The first column of the table reports the share of all respondents selecting each coping method. For convenience, the first panel of the table aggregates these methods into the six groups listed in section II: savings, family or friends, mainstream credit, alternative credit, sale of possessions, and increased work, but the next panel provides a more disaggregated list. A large proportion (61 per-cent) of all those asked about coping methods selected drawing from sav-ings as a coping method, even though for some this method might require liquidating a retirement investment and paying a penalty (see next panel). Drawing from savings is thus one method individuals rely on, but clearly not the only one. Approximately one in three (34 percent) of those asked about coping methods reported that they would rely on family and friends. A similar proportion (30 percent) would resort to mainstream credit, mostly using a credit card. Others (11 percent) would rely on alternative credit, such as payday loans or pawn shops. Close to one in five (19 percent) would sell possessions. Taking together those who would pawn their possessions, sell their home, or take out a payday loan, and not double-counting those respondents, we find that 25.7 percent of respondents who were asked about coping methods (equal to 18.6 percent of all respondents) said they would come up with the funds for an emergency by resorting to what might be seen as extreme measures. Adding this 18.6 percent of respondents to the 27.9 percent who reported that they could certainly not cope with an emergency suggests that approximately 46.5 percent of all respondents are living very close to the financial edge.
6. This link is made clearer in lottery-linked savings schemes. See Kearney and others (2011), Tufano and others (2011), Tufano (2008), and Cole and others (2008).

Tabl
e 3.
dis
trib
utio
n of
cop
ing
met
hods
use
d by
all
res
pond
ents
and
by
res
pond
ents
rel
ying
on
sing
le o
r m
ultip
le c
opin
g m
etho
dsPe
rcen
t usi
ng in
dica
ted
met
hod
Sh
are
ofin
dica
ted
grou
pa
Sh
are
ofa
ll
Res
pond
ents
cho
osin
gR
espo
nden
tsc
hoos
ing
Res
pond
ents
cho
osin
gC
opin
gm
etho
ds
resp
onde
nts
one
met
hod
two
met
hods
th
ree
met
hods
Cat
egor
ies
Sav
ings
60
.6
65.4
63
.0
52.8
Fam
ily
or f
rien
ds
34.2
13
.4
36.7
60
.6M
ains
trea
m c
redi
t 29
.5
10.9
38
.5
49.5
Alt
erna
tive
cre
dit
10.8
1.
7 7.
8 24
.5S
ell p
osse
ssio
ns
19.1
3.
2 20
.7
39.5
Wor
k m
ore
22.9
5.
3 21
.3
47.2
Indi
vidu
alm
etho
dsD
raw
fro
m s
avin
gs
52.4
61
.3
47.6
43
.2L
iqui
date
or
sell
inve
stm
ents
2.
3 0
6.2
3.4
Liq
uida
te s
ome
reti
rem
ent i
nves
tmen
ts, e
ven
if r
equi
red
to p
ay p
enal
ty
11.1
4.
1 19
.0
16.1
Bor
row
or
ask
for
help
fro
m m
y fa
mil
y 29
.6
10.8
30
.8
54.1
Bor
row
or
ask
for
help
fro
m m
y fr
iend
s 7.
4 2.
7 6.
8 14
.0U
se c
redi
t car
ds
20.9
7.
3 29
.0
34.5
Ope
n or
use
hom
e eq
uity
line
of
cred
it o
r ta
ke o
ut s
econ
d m
ortg
age
4.3
1.4
4.3
8.3
Tak
e ou
t an
unse
cure
d lo
an
7.1
2.1
6.5
14.0
Get
a s
hort
-ter
m p
ayda
y or
pay
roll
adv
ance
loan
3.
6 0.
7 1.
5 8.
7P
awn
an a
sset
I o
wne
d 7.
7 1.
1 6.
4 17
.1S
ell t
hing
s I
owne
d, e
xcep
t my
hom
e 18
.8
2.9
20.0
39
.3S
ell m
y ho
me
0.4
0.4
0.7
0.2
Wor
k ov
ertim
e, g
et s
econ
d jo
b, o
r ot
her
hous
ehol
d m
embe
r in
crea
se w
ork
22.9
5.
3 21
.3
47.2
Oth
er
0 0
0 0
Don
’t k
now
1.
9 1.
6 6.
1 0
Mem
oran
da:
No.
of
obse
rvat
ions
1,
255
582
236
437
Sha
re o
f al
l res
pond
ents
usi
ng in
dica
ted
num
ber
of c
opin
g m
etho
ds
100
46.5
18
.6
34.9
Sour
ce: A
utho
rs’
calc
ulat
ions
usi
ng d
ata
from
the
2009
TN
S G
loba
l Eco
nom
ic C
risi
s St
udy.
a. R
espo
nden
ts in
dica
ting
mul
tiple
cop
ing
met
hods
in th
e sa
me
cate
gory
are
not
dou
ble-
coun
ted
in th
e st
atis
tics
repo
rted
in th
e fin
al tw
o co
lum
ns.

annamaria lusardi, daniel schneider, and peter tufano 103
These findings are consistent with the widespread diffusion of payday lenders. According to Paige Skiba and Jeremy Tobacman (2008), payday lenders now have more storefronts in the United States than McDonald’s and Starbucks combined. Moreover, according to the Financial Capability Study, more than one in five Americans have used high-cost methods of borrowing, such as payday loans, tax refund loans, auto title loans, pawn shops, and rent-to-own shops, in the past 5 years (Lusardi 2010).
Another method, chosen by 23 percent of those able to cope, is working more, either by working overtime, getting a second job, or having another household member work more hours.
Together these findings highlight that individuals can adjust, and plan to adjust, along several margins when facing a shock, relying not only on formal methods such as drawing from savings or borrowing, but also on assistance from networks of family and friends. Moreover, many plan to rely on the labor margin, changing either hours of work or supply of labor, even though it is not clear that many jobs allow the worker to change his or her hours of work or that those expecting to cope by finding a second job would easily do so at a time of high unemployment.
Table 3 also presents the coping methods mentioned by those respon-dents who selected one, two, or three coping methods. The second column of the table shows that savings, mentioned by 65 percent of respondents naming just one method, is the predominant coping method among this group, fol-lowed by family or friends (13 percent) and mainstream credit (11 percent). Even smaller shares of respondents naming a single method would turn to alternative credit providers, sale of possessions, or increased work.
The third column of table 3 presents the coping methods chosen by respondents who selected exactly two methods.7 Among these respondents, savings is still the method most commonly mentioned (63 percent), followed by family or friends and mainstream credit (37 percent and 39 percent, respectively). Whereas alternative credit, work, and selling possessions were very rarely used in isolation, they are somewhat more commonly used in combination with one other method: 8 percent of this group of respondents said they would use an alternative credit provider, and selling possessions and increasing work were each mentioned by a fifth of these respondents. Finally, the last column of table 3 presents the coping strategies chosen by the 35 percent of eligible respondents who reported needing a combination
7. The sum of the percentages in the top panel for this column is 188 percent, which is short of 200 percent because 12 percent of respondents listed two strategies within the same broad category.

104 Brookings Papers on Economic Activity, spring 2011
of three coping methods to come up with $2,000. Savings, family or friends, and mainstream credit were chosen by about half or more of this group. Alternative credit (mentioned by 25 percent), the sale of possessions (40 percent), and increased work effort (47 percent) are all much more commonly used in combination with other methods than alone. These find-ings indicate that focusing on savings or liquid assets to assess people’s ability to weather a shock severely limits the set of what individuals do or plan to do when facing a shock. On the other hand, few respondents would use any coping method other than savings in isolation.
Although these figures show that respondents would use these six general coping strategies in combination, they do not reveal the specific bundles of coping methods that respondents would assemble. In order to identify these bundles of emergency support, we can create a two-dimensional matrix of coping methods for respondents choosing two coping methods and a three-dimensional matrix of methods for respondents choosing three methods. These matrixes (which are not presented in the tables) reveal that, among respondents choosing two coping methods, the most commonly assembled bundle is savings and mainstream credit, a combination employed by 24.8 percent of these respondents. The next most common bundle is savings and family or friends (12.3 percent), followed by combining two different savings strategies (9.8 percent). Smaller shares, none greater than 10 percent, selected the other possible combinations. Among respondents choosing three coping methods, the most commonly assembled bundles involve savings: 8.6 percent would use a combination of savings, family or friends, and mainstream credit; 7.6 percent would choose a combination of savings, family or friends, and increased work; and 6.8 percent would combine savings, mainstream credit, and increased work. The only fre-quently identified bundle that did not involve savings was social support, sale of possessions, and increased work (chosen by 7.9 percent). Other combinations in this 6 × 6 × 6 matrix were mentioned by smaller shares of the respondents who chose three methods, most by no more than 2 percent of this group.
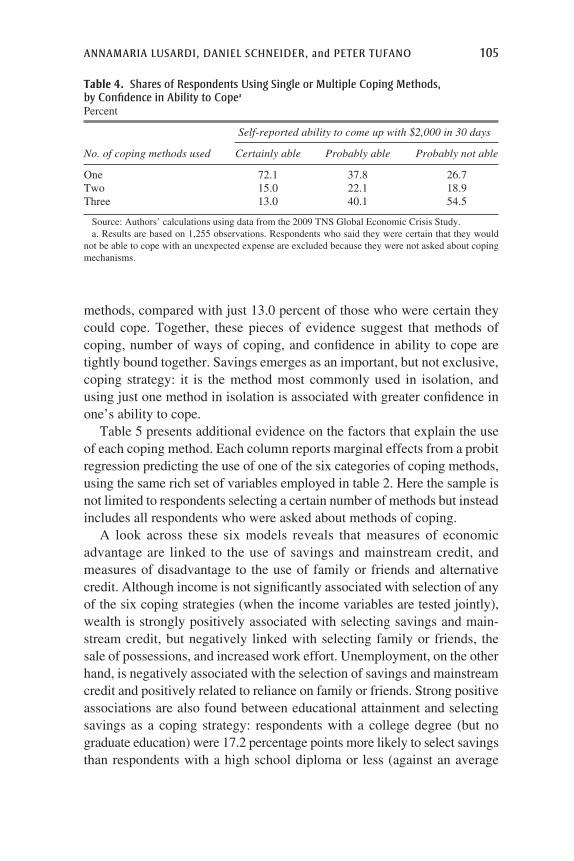
Table 4 relates respondents’ claimed ability to cope with an emergency to the number of coping methods that they would use. The table shows that respondents who were highly confident in their ability to cope with an emergency were much more likely to name just one coping method. Of those who were certain they could cope, 72.1 percent selected one coping method, compared with just 26.7 percent of those who thought it probable that they could not cope. Conversely, 54.5 percent of those who thought they could probably not cope with an emergency selected three coping
annamaria lusardi, daniel schneider, and peter tufano 105
methods, compared with just 13.0 percent of those who were certain they could cope. Together, these pieces of evidence suggest that methods of coping, number of ways of coping, and confidence in ability to cope are tightly bound together. Savings emerges as an important, but not exclusive, coping strategy: it is the method most commonly used in isolation, and using just one method in isolation is associated with greater confidence in one’s ability to cope.
Table 5 presents additional evidence on the factors that explain the use of each coping method. Each column reports marginal effects from a probit regression predicting the use of one of the six categories of coping methods, using the same rich set of variables employed in table 2. Here the sample is not limited to respondents selecting a certain number of methods but instead includes all respondents who were asked about methods of coping.
A look across these six models reveals that measures of economic advantage are linked to the use of savings and mainstream credit, and measures of disadvantage to the use of family or friends and alternative credit. Although income is not significantly associated with selection of any of the six coping strategies (when the income variables are tested jointly), wealth is strongly positively associated with selecting savings and main-stream credit, but negatively linked with selecting family or friends, the sale of possessions, and increased work effort. Unemployment, on the other hand, is negatively associated with the selection of savings and mainstream credit and positively related to reliance on family or friends. Strong positive associations are also found between educational attainment and selecting savings as a coping strategy: respondents with a college degree (but no graduate education) were 17.2 percentage points more likely to select savings than respondents with a high school diploma or less (against an average
Table 4. shares of respondents using single or multiple coping methods, by confidence in ability to copea
Percent
Self-reportedabilitytocomeupwith$2,000in30days
No.ofcopingmethodsused Certainlyable Probablyable Probablynotable
One 72.1 37.8 26.7Two 15.0 22.1 18.9Three 13.0 40.1 54.5
Source: Authors’ calculations using data from the 2009 TNS Global Economic Crisis Study.a. Results are based on 1,255 observations. Respondents who said they were certain that they would
not be able to cope with an unexpected expense are excluded because they were not asked about coping mechanisms.

Tabl
e 5.
pro
bit r
egre
ssio
ns e
xpla
inin
g ch
oice
s of
cat
egor
ies
of c
opin
g m
etho
ds w
ith e
cono
mic
and
dem
ogra
phic
cha
ract
eris
ticsa
D
epen
dent
var
iabl
e:d
umm
y=
1w
hen
resp
onde
nts
elec
ted
indi
cate
dca
tego
ry
Cha
ract
eris
tic
Savi
ngs
Fam
ily
orfr
iend
sM
ains
trea
mc
redi
tA
lter
nati
vec
redi
tSe
llp
osse
ssio
ns
Wor
km
ore
Cha
nge
inh
ouse
hold
wea
lth
sinc
efin
anci
alc
risi
s(o
mit
ted
cate
gory
:no
cha
nge)
Incr
ease
bet
wee
n 1
and
10 p
erce
nt
0.04
3 -0
.044
-0
.056
-0
.025
0.
003
-0.0
01
(0.0
63)
(0.0
57)
(0.0
52)
(0.0
23)
(0.0
48)
(0.0
47)
Incr
ease
< 1
0 pe
rcen
t 0.
088*
-0
.128
***
-0.0
79*
0.03
7 -0
.003
-0
.016
(0
.051
) (0
.044
) (0
.043
) (0
.029
) (0
.042
) (0
.043
)D
ecre
ase
< 1
0 pe
rcen
t 0.
087*
-0
.082
* 0.
007
-0.0
02
0.03
3 0.
009
(0
.050
) (0
.045
) (0
.046
) (0
.026
) (0
.041
) (0
.042
)D
ecre
ase
betw
een
10 a
nd 2
9 pe
rcen
t -0
.025
0.
015
-0.0
94**
0.
060*
* 0.
068*
-0
.005
(0
.048
) (0
.044
) (0
.037
) (0
.028
) (0
.039
) (0
.036
)D
ecre
ase
betw
een
30 a
nd 5
0 pe
rcen
t 0.
033
-0.0
55
-0.0
53
0.03
7 0.
037
-0.0
05
(0.0
55)
(0.0
52)
(0.0
46)
(0.0
34)
(0.0
45)
(0.0
45)
Dec
reas
e >
50
perc
ent
-0.0
71
-0.0
11
-0.0
32
0.04
7 0.
044
-0.0
21
(0.0
87)
(0.0
76)
(0.0
68)
(0.0
47)
(0.0
64)
(0.0
58)
Ann
ualh
ouse
hold
inco
me
(om
itte
dca
tego
ry:
<$2
0,00
0)$2
0,00
0 to
$29
,999
-0
.092
-0
.014
0.
097
0.02
2 0.
018
-0.0
40
(0.0
77)
(0.0
73)
(0.0
75)
(0.0
34)
(0.0
54)
(0.0
51)
$30,
000
to $
39,9
99
-0.0
97
0.01
3 0.
084
-0.0
01
0.04
1 0.
035
(0
.076
) (0
.072
) (0
.073
) (0
.029
) (0
.055
) (0
.059
)$4
0,00
0 to
$49
,999
-0
.036
0.
091
0.04
6 0.
002
-0.0
18
0.01
4
(0.0
74)
(0.0
77)
(0.0
70)
(0.0
29)
(0.0
47)
(0.0
58)
$50,
000
to $
59,9
99
0.02
9 -0
.048
-0
.008
-0
.035
0.
016
0.05
8
(0.0
76)
(0.0
71)
(0.0
72)
(0.0
21)
(0.0
56)
(0.0
66)

$60,
000
to $
74,9
99
-0.0
07
-0.0
48
0.07
3 -0
.053
***
-0.0
15
0.04
9
(0.0
74)
(0.0
69)
(0.0
73)
(0.0
18)
(0.0
50)
(0.0
62)
$75,
000
to $
99,9
99
0.07
6 -0
.105
0.
085
-0.0
38*
-0.0
48
0.05
9
(0.0
71)
(0.0
66)
(0.0
75)
(0.0
22)
(0.0
47)
(0.0
65)
$100
,000
to $
149,
999
0.14
4**
-0.0
76
0.11
0 -0
.047
**
-0.0
72
-0.0
49
(0.0
70)
(0.0
72)
(0.0
82)
(0.0
20)
(0.0
45)
(0.0
56)
$150
,000
or
mor
e 0.
042
0.08
7 0.
060
0.05
9 -0
.067
-0
.039
(0
.107
) (0
.114
) (0
.104
) (0
.072
) (0
.063
) (0
.084
)
Hou
seho
ldw
ealt
h(o
mit
ted
cate
gory
:ze
ro)
Les
s th
an $
1,00
0 -0
.140
0.
151*
0.
052
-0.0
01
0.03
1 -0
.041
(0
.087
) (0
.083
) (0
.078
) (0
.031
) (0
.057
) (0
.052
)$1
,000
to $
2,99
9 0.
022
0.02
5 0.
139
-0.0
18
0.05
2 0.
004
(0
.085
) (0
.079
) (0
.087
) (0
.028
) (0
.064
) (0
.064
)$3
,000
to $
4,99
9 0.
139*
-0
.114
* 0.
237*
* -0
.050
***
-0.0
37
-0.0
20
(0.0
75)
(0.0
67)
(0.0
94)
(0.0
18)
(0.0
52)
(0.0
62)
$4,0
00 to
$9,
999
0.27
1***
* -0
.112
* 0.
114
-0.0
45**
-0
.050
-0
.114
***
(0
.050
) (0
.065
) (0
.088
) (0
.019
) (0
.048
) (0
.042
)$1
0,00
0 to
$19
,999
0.
246*
***
-0.1
60**
* 0.
225*
* -0
.017
-0
.141
****
-0
.074
(0
.056
) (0
.057
) (0
.088
) (0
.029
) (0
.027
) (0
.049
)$2
0,00
0 to
$49
,999
0.
281*
***
-0.1
86**
**
0.10
2 -0
.046
**
-0.0
40
-0.1
00**
(0
.051
) (0
.052
) (0
.079
) (0
.020
) (0
.047
) (0
.043
)$5
0,00
0 to
$99
,999
0.
226*
***
-0.1
49**
* 0.
153*
-0
.044
**
-0.0
33
-0.1
70**
**
(0.0
59)
(0.0
57)
(0.0
81)
(0.0
20)
(0.0
49)
(0.0
31)
$100
,000
to $
249,
999
0.29
1***
* -0
.187
****
0.
034
-0.0
47**
-0
.103
***
-0.1
48**
**
(0.0
49)
(0.0
54)
(0.0
79)
(0.0
20)
(0.0
37)
(0.0
36)
$250
,000
or
mor
e 0.
273*
***
-0.2
47**
**
0.05
1 -0
.075
****
-0
.090
**
-0.1
09**
(0
.054
) (0
.045
) (0
.083
) (0
.012
) (0
.041
) (0
.046
)(c
onti
nued
)

Edu
cati
on(
omit
ted
cate
gory
:hi
ghs
choo
lor
less
)T
rade
sch
ool
0.08
5 -0
.011
-0
.003
-0
.009
-0
.027
-0
.059
(0
.063
) (0
.062
) (0
.061
) (0
.025
) (0
.042
) (0
.044
)S
ome
coll
ege
0.04
2 0.
006
0.03
4 -0
.022
-0
.020
0.
011
(0
.045
) (0
.042
) (0
.040
) (0
.017
) (0
.031
) (0
.035
)C
olle
ge (
bach
elor
’s d
egre
e)
0.17
2***
* -0
.045
0.
029
-0.0
53**
* -0
.046
-0
.027
(0
.045
) (0
.045
) (0
.045
) (0
.017
) (0
.032
) (0
.037
)G
radu
ate
educ
atio
n 0.
124*
* -0
.047
0.
088
-0.0
55**
**
-0.0
20
-0.0
87**
(0
.056
) (0
.057
) (0
.062
) (0
.014
) (0
.044
) (0
.041
)
Une
mpl
oym
ents
tatu
sU
nem
ploy
ed
-0.1
40**
* 0.
187*
***
-0.0
30
0.04
7*
0.07
1*
-0.0
49
(0.0
53)
(0.0
53)
(0.0
43)
(0.0
27)
(0.0
40)
(0.0
35)
Age
(om
itte
dca
tego
ry:
18to
34)
35 to
54
0.11
2***
-0
.100
***
0.00
3 -0
.021
-0
.052
* -0
.117
****
(0
.038
) (0
.034
) (0
.034
) (0
.017
) (0
.027
) (0
.027
)55
to 6
5 0.
128*
* -0
.249
****
-0
.015
-0
.058
****
-0
.072
**
-0.1
85**
**
(0.0
52)
(0.0
35)
(0.0
50)
(0.0
15)
(0.0
33)
(0.0
25)
Sex
Fem
ale
0.06
5**
0.05
9*
0.00
7 -0
.019
-0
.051
**
0.04
6*
(0.0
32)
(0.0
30)
(0.0
28)
(0.0
14)
(0.0
23)
(0.0
25)
Tabl
e 5.
pro
bit r
egre
ssio
ns e
xpla
inin
g ch
oice
s of
cat
egor
ies
of c
opin
g m
etho
ds w
ith e
cono
mic
and
dem
ogra
phic
cha
ract
eris
ticsa (
Con
tinu
ed)
D
epen
dent
var
iabl
e:d
umm
y=
1w
hen
resp
onde
nts
elec
ted
indi
cate
dca
tego
ry
Cha
ract
eris
tic
Savi
ngs
Fam
ily
orfr
iend
sM
ains
trea
mc
redi
tA
lter
nati
vec
redi
tSe
llp
osse
ssio
ns
Wor
km
ore

Rac
eor
eth
nici
ty(
omit
ted
cate
gory
:w
hite
)B
lack
0.
007
0.09
0 0.
005
0.00
8 -0
.068
* 0.
064
(0
.063
) (0
.066
) (0
.057
) (0
.027
) (0
.035
) (0
.056
)H
ispa
nic
0.02
2 0.
073
-0.0
76
-0.0
51**
**
-0.0
63
0.03
5
(0.0
80)
(0.0
77)
(0.0
61)
(0.0
15)
(0.0
44)
(0.0
60)
Asi
an
-0.1
02
0.02
4 0.
098
-0.0
30
-0.0
61
0.00
4
(0.0
69)
(0.0
65)
(0.0
67)
(0.0
22)
(0.0
42)
(0.0
53)
Oth
er r
ace
or e
thni
city
0.
014
0.15
8 0.
011
0.01
7 -0
.090
* 0.
070
(0
.112
) (0
.112
) (0
.098
) (0
.057
) (0
.051
) (0
.098
)
Mar
ital
sta
tus
(om
itte
dca
tego
ry:
mar
ried
or
coha
biti
ng)
Nev
er m
arri
ed
0.01
5 0.
029
-0.0
44
0.01
4 0.
024
0.00
4
(0.0
46)
(0.0
45)
(0.0
42)
(0.0
23)
(0.0
36)
(0.0
36)
Div
orce
d or
wid
owed
-0
.087
0.
086
0.00
9 0.
031
0.06
4 0.
012
(0
.057
) (0
.054
) (0
.049
) (0
.031
) (0
.046
) (0
.045
)O
ther
mar
ital
sta
tus
-0.0
34
0.08
0 -0
.026
0.
008
0.03
3 0.
086*
(0
.059
) (0
.058
) (0
.050
) (0
.028
) (0
.044
) (0
.051
)
Hou
seho
ldc
ompo
siti
onC
hild
ren
in h
ouse
hold
-0
.147
****
0.
074*
* 0.
021
0.05
0***
0.
026
-0.0
00
(0.0
35)
(0.0
33)
(0.0
30)
(0.0
18)
(0.0
25)
(0.0
27)
Liv
es w
ith
pare
nts
0.06
0 0.
116*
* 0.
000
-0.0
18
0.02
6 -0
.026
(0
.055
) (0
.057
) (0
.052
) (0
.022
) (0
.044
) (0
.039
)
Reg
ion
(om
itte
dca
tego
ry:
Sout
h)N
orth
east
0.
025
-0.0
59
0.01
4 -0
.044
***
0.00
7 -0
.002
(0
.044
) (0
.040
) (0
.039
) (0
.014
) (0
.032
) (0
.035
)M
idw
est
-0.0
14
0.03
7 -0
.003
-0
.039
***
0.02
9 -0
.031
(0
.043
) (0
.041
) (0
.037
) (0
.014
) (0
.031
) (0
.030
)W
est
-0.0
16
0.04
4 0.
046
-0.0
16
-0.0
02
-0.0
23
(0.0
42)
(0.0
40)
(0.0
38)
(0.0
17)
(0.0
31)
(0.0
31)
(con
tinu
ed)

Tabl
e 5.
pro
bit r
egre
ssio
ns e
xpla
inin
g ch
oice
s of
cat
egor
ies
of c
opin
g m
etho
ds w
ith e
cono
mic
and
dem
ogra
phic
cha
ract
eris
ticsa (
Con
tinu
ed)
D
epen
dent
var
iabl
e:d
umm
y=
1w
hen
resp
onde
nts
elec
ted
indi
cate
dca
tego
ry
Cha
ract
eris
tic
Savi
ngs
Fam
ily
orfr
iend
sM
ains
trea
mc
redi
tA
lter
nati
vec
redi
tSe
llp
osse
ssio
ns
Wor
km
ore
Add
itio
nalv
aria
bles
Gam
bler
-0
.019
0.
048
0.06
2**
0.06
0***
* 0.
040
-0.0
08
(0.0
33)
(0.0
32)
(0.0
29)
(0.0
17)
(0.0
24)
(0.0
25)
Rec
eive
d fi
nanc
ial e
duca
tion
0.
047
-0.0
23
-0.0
11
0.03
0**
0.01
6 0.
040
(0
.037
) (0
.036
) (0
.033
) (0
.014
) (0
.026
) (0
.028
)R
isk
lite
rate
0.
111*
**
-0.0
18
0.00
9 -0
.009
-0
.073
***
-0.0
46
(0.0
38)
(0.0
39)
(0.0
36)
(0.0
17)
(0.0
26)
(0.0
29)
Pse
udo-
R2
0.18
4 0.
170
0.03
7 0.
178
0.08
9 0.
103
Sour
ce: A
utho
rs’
calc
ulat
ions
usi
ng d
ata
from
the
2009
TN
S G
loba
l Eco
nom
ic C
risi
s St
udy.
a. C
ateg
orie
s co
mbi
ne m
ore
than
one
cop
ing
met
hod
as f
ollo
ws:
sav
ings
= d
raw
fro
m s
avin
gs,
liqui
date
or
sell
inve
stm
ents
, bo
rrow
aga
inst
ret
irem
ent
savi
ngs,
liq
uida
te s
ome
retir
emen
t inv
estm
ents
; fam
ily o
r fr
iend
s =
borr
ow o
r as
k fo
r he
lp f
rom
fam
ily, b
orro
w o
r as
k fo
r he
lp f
rom
fri
ends
(ot
her
than
fam
ily);
mai
nstr
eam
cre
dit =
use
cre
dit c
ards
, ope
n or
us
e ho
me
equi
ty li
ne o
f cr
edit
or s
econ
d m
ortg
age,
take
out
uns
ecur
ed lo
an; a
ltern
ativ
e cr
edit
= ta
ke o
ut p
ayda
y or
pay
roll
adva
nce
loan
, paw
n an
ass
et; s
ell p
osse
ssio
ns =
sel
l thi
ngs
I ow
n ex
cept
my
hom
e, s
ell m
y ho
me;
wor
k m
ore
= w
ork
over
time,
get
a s
econ
d jo
b, o
r an
othe
r m
embe
r of
my
hous
ehol
d w
ould
wor
k lo
nger
or
go to
wor
k. T
he o
mitt
ed c
ateg
ory
is
not l
iste
d w
here
the
vari
able
has
onl
y tw
o ca
tego
ries
. The
sam
ple
in a
ll re
gres
sion
s in
clud
es a
ll re
spon
dent
s w
ho w
ere
aske
d ab
out m
etho
ds o
f co
ping
(1,
255
obse
rvat
ions
), a
nd th
e de
pend
ent v
aria
ble
equa
ls 1
whe
n th
e re
spon
dent
sel
ecte
d a
met
hod
in th
e in
dica
ted
cate
gory
as
eith
er th
e on
ly m
etho
d or
one
of
two
or th
ree
copi
ng m
etho
ds u
sed.
All
mod
els
also
in
clud
e du
mm
y va
riab
les
indi
cati
ng m
issi
ng d
ata
on i
ncom
e, w
ealt
h, o
r ch
ange
in
wea
lth.
Sta
ndar
d er
rors
are
in
pare
nthe
ses.
Ast
eris
ks i
ndic
ate
stat
isti
cal
sign
ifica
nce
at t
he
*p <
0.1
, **p
< 0
.05,
***
p <
0.0
1, o
r **
**p
< 0
.001
leve
l.

annamaria lusardi, daniel schneider, and peter tufano 111
of 60.6 percent of respondents using savings; table 3). We also observe a negative relationship between education and the selection of alternative credit: respondents with a college degree but no graduate education were 5.3 percentage points less likely, and those with graduate education 5.5 per-centage points less likely, to select alternative credit (against an average of 10.8 percent of respondents choosing alternative credit).
Although risk literacy is not found to be related to overall ability to cope, it is correlated with the means by which people intend to cope. Respondents judged to be risk literate were 11.1 percentage points more likely to indicate savings as a coping strategy and 7.3 percentage points less likely to cope by selling possessions. Consistent with findings of other studies, higher financial knowledge is related to different types of financial decisions and differences in the use of financial and credit markets (Lusardi and Tufano 2009, Lusardi and Mitchell 2011b).
Some demographic markers of stability are also positively associated with selecting savings and mainstream credit and negatively associated with the choice of other coping methods. For instance, older respondents were less likely to select family or friends, alternative credit, or increased work effort as coping resources and more likely to indicate savings. However, we observe relatively few notable links between race or ethnicity and coping strategies, one exception being the lower reliance of Hispanics on alterna-tive credit. There are also few significant relationships between marital status and coping strategies, although there is some weak evidence that respondents who are divorced are less likely to use savings. Finally, we find significant regional differences only in the use of alternative credit: it is relatively less common in the Northeast and Midwest compared with the South.
Gambling is also correlated with how people plan to cope with financial shocks: gamblers were more likely to indicate relying on credit, whether from traditional or alternative sources. This may reflect either attitudes toward risk or depletion of financial resources through gambling.
These findings show that whereas economic theories have emphasized the importance of precautionary assets to shield against shocks, and soci-ologists have emphasized the importance of family or friends, in fact both play a role in how individuals plan to cope with a financial shock. Adjust-ments in labor supply (along both the intensive and the extensive margins) are also observed in the data, as are sales of assets.
Differences in coping methods may result from simple heterogeneity, or they may suggest a more generalized pecking order that households follow when dealing with a shock. Here an analogy can be drawn with corporate

112 Brookings Papers on Economic Activity, spring 2011
finance: Stewart Myers (1984) and Myers and Nicholas Majluf (1984), drawing on a long empirical tradition starting with Gordon Donaldson (1961), posit that companies prioritize their sources of financing. The empirical regularity, based on both case study evidence and aggregate data, is that firms tend to draw from internal finances before seeking external financing, and when they do finance externally, they tend to draw upon the “safest” sources (that is, debt) before issuing new equity. Myers (1984) and Myers and Majluf (1984) posit that this empirical regularity could be explained by considering the information asymmetries and associated deadweight costs of the different alternatives. Empirical evidence, a consistent theoretical grounding, and new testable predictions have made the pecking order theory a useful one in corporate finance. A pecking order describes a typical ordering, however, not a hard-and-fast, immutable set of rules.
Our work does not definitively establish a pecking order but does suggest a direction for future research to establish whether a household pecking order theory is supportable—and whether there is a single pecking order for all households or different orderings for households of different char-acteristics, financial knowledge, and preferences. Our evidence suggests that, like corporations, which first turn to internal funds, households first (or primarily) turn to internal resources: their own savings. Four pieces of evidence point to this conclusion: savings is the most commonly used coping method overall, it is the coping method most commonly used in isolation, it is associated with greater certainty in being able to cope, and it is associated with greater economic and demographic advantage and stability. That households might turn to savings first stands to reason, in part because these funds are lower in cost on multiple dimensions: direct financial costs, transaction costs, social costs, and private effort. Because interest rates on borrowing tend to exceed rates paid to savers, the income forgone by reducing savings is less than the explicit interest on borrowing. And although the vast majority of loans from family and friends charge zero interest (El Hage, Schneider, and Tufano 2006), the social costs of asking for funds, the potential for default, and certain ethnic norms make such borrowing costlier than the interest rate might suggest. The large discounts on resale of items make selling one’s possessions unattractive (although perhaps less so in the wake of innovations like eBay). Generating funds by working more may be simple in some jobs, but in others (such as professional jobs that do not pay overtime) it would require finding a second job. Savings dominates the other mechanisms on each of these dimensions, and explaining why savings comes first—at least for households that have savings—is fairly easy.
annamaria lusardi, daniel schneider, and peter tufano 113
Although the standard corporate finance pecking order is internal funds, then debt, then equity, the actual ordering varies among firms—some technology firms, for example, raise equity before issuing debt. In the same way, the “second choice” among households is both complex and interesting. A useful household pecking order would help explain why the next choice for some is credit whereas for others it is family and friends. We posit that the second choice after savings will be determined by the relevant costs of the alternatives. These costs could include sheer lack of availability, direct costs (such as interest charges on loans or forgone interest on savings consumed), fees and other transaction costs, effort involved (perhaps prox-ied by time), and social costs (for example, drawing upon favors or social capital). Beyond explaining the “second” source of coping, a robust theory would provide insight into the incentives to save. Where credit is easily available or kin networks are strong, incentives to save may be smaller—a testable proposition, but not with our data. When the transaction costs of selling goods fall (as with eBay), the use of this coping mechanism should increase, and the desire to save might be reduced.
Simply stating that some set of ordered coping methods exists is a first step to describing a pecking order. Substantial additional research is needed to definitively demonstrate such an order, justify it, and discuss its implications.
V. International Comparisons
The above analysis captures what appears to be a relatively high level of financial fragility among U.S. households, with 28 percent of respondents saying they are certainly unable to come up with the funds needed to cope with an emergency expense of $2,000 in the next 30 days, and an additional 22 percent probably unable to do so. However, the literature offers few comparisons, across time or space, by which to gauge the severity of that level of fragility. Here we provide some comparative perspective, in the form of a cross-national comparison of respondents’ abilities to come up with funds in the event of an unexpected expense. We set the precise levels of funds asked about in each country ($2,000 in the United States and Canada, £1,500 in the United Kingdom, and 61,500 in five continental EU countries) in consultation with our local research partners. These were intended to be roughly comparable, round-number amounts corresponding to the level of a major auto repair or other similar shock. Generally, the three different currency levels are within 15 percent of their average at market exchange rates. On a purchasing power parity (PPP) basis, however, the differences

114 Brookings Papers on Economic Activity, spring 2011
are greater, as much as 20 percent of the sample average PPP measure, although a crude PPP measure is unlikely to capture actual price differences of emergency services.
The top panel of table 6 shows that perceived capacity to cope with an emergency is lowest in the United States, the United Kingdom, and Germany: in these three countries, 50 percent or more of households say they would probably or certainly be unable to come up with the emergency funds. France and Portugal occupy an intermediate position: 46 percent of respondents in Portugal report they would certainly or probably be unable to come up with the funds, as would 37 percent of those in France. The highest levels of coping capacity are found in Canada (28 percent certainly or probably unable to come up with the funds), the Netherlands (27 percent), and Italy (20 percent). In sum, we see substantial cross-national heterogeneity in perceived capacity to cope, with the United States at the lower end.
We first test to see whether these differences are explained by variation in individuals’ characteristics across countries. We pool the individual-level data on respondents in seven of the countries and estimate a model similar to that presented in table 2 (the Netherlands is omitted because information on respondents’ demographic and economic characteristics could not be harmonized with that for the seven other countries). The outcome for this probit model is equal to 1 if the respondent reported that she could certainly or probably come up with the required funds, and zero if she reported being certainly or probably unable to do so. The model includes country fixed effects and harmonized measures of changes in wealth, education, age, sex, household composition, risk literacy, gambling, and financial education. We examine whether the ordering of countries by ability to cope changes after adjusting for these demographic and economic characteristics.
In the simple descriptive statistics shown in the top panel of table 6, the share of respondents probably or certainly able to come up with funds is, compared with the U.S. respondents, 2.2 percentage points lower in the United Kingdom, 0.6 percentage point lower in Germany, 4.1 percentage points higher in Portugal, 12.8 percentage points higher in France, 21.7 percentage points higher in Canada, and 30.1 percentage points higher in Italy. As one would expect, this ordering is reproduced in the model that includes only the country fixed effects (model 1 in table 7). But we also find that even after accounting for individual-level characteristics, the ranking of countries is unchanged and the magnitudes of differences from the United States are quite similar to those in the unadjusted model (model 2 in table 7).
If individual-level covariates do not explain most of this cross-national variation, national-level characteristics might. However, given that our data

Tabl
e 6.
cro
ss-n
atio
nal c
ompa
riso
ns o
f con
fiden
ce in
cap
acity
to c
ope
and
met
hods
of c
opin
gPe
rcen
t of
coun
try
tota
l
U
nite
dSt
ates
U
nite
dK
ingd
om
Fra
nce
Ger
man
yC
anad
aIt
aly
Por
tuga
lN
ethe
rlan
ds
Con
fiden
cein
abi
lity
toc
ope
Cer
tain
ly a
ble
24.9
24
.1
36.2
30
.7
44.3
48
.2
31.0
57
.7P
roba
bly
able
25
.1
23.7
26
.6
18.7
27
.4
31.9
23
.1
15.5
Pro
babl
y no
t abl
e 22
.1
16.7
18
.5
21.7
12
.3
11.0
13
.8
8.0
Cer
tain
ly n
ot a
ble
27.9
35
.5
18.8
28
.9
15.9
9.
0 32
.1
18.9
Cop
ing
met
hod
byc
ateg
ory
Sav
ings
60
.6
53.6
57
.5
54.8
58
.9
71.3
49
.2
88.8
Fam
ily
or f
rien
ds
34.2
33
.7
33.0
35
.9
25.6
23
.9
28.0
10
.3M
ains
trea
m c
redi
t 29
.5
26.2
15
.9
21.5
40
.3
16.6
12
.4
7.8
Alt
erna
tive
cre
dit
10.8
4.
1 5.
2 7.
3 7.
0 6.
4 6.
3 0.
5S
ell p
osse
ssio
ns
19.1
14
.8
12.9
11
.0
9.5
3.7
4.3
1.5
Wor
k m
ore
22.9
15
.4
16.8
14
.2
12.9
10
.6
14.7
1.
5O
ther
0
0 0
0 0
0 0
1.8
Don
’t k
now
1.
9 3.
8 5.
5 6.
0 7.
5 3.
4 11
.6
5.9
No.
ofc
opin
gm
etho
dsO
ne
46.5
59
.8
59.9
54
.7
48.3
67
.0
71.2
84
.3T
wo
18.6
16
.0
17.8
16
.6
21.3
19
.3
13.2
8.
9T
hree
34
.9
24.2
22
.2
28.8
30
.4
13.8
15
.6
6.8
No.
of
obse
rvat
ions
1,
931
1,00
1 1,
097
1,10
7 1,
132
935
1,01
1 1,
001
Sour
ce: A
utho
rs’
calc
ulat
ions
usi
ng d
ata
from
the
2009
TN
S G
loba
l Eco
nom
ic C
risi
s St
udy.
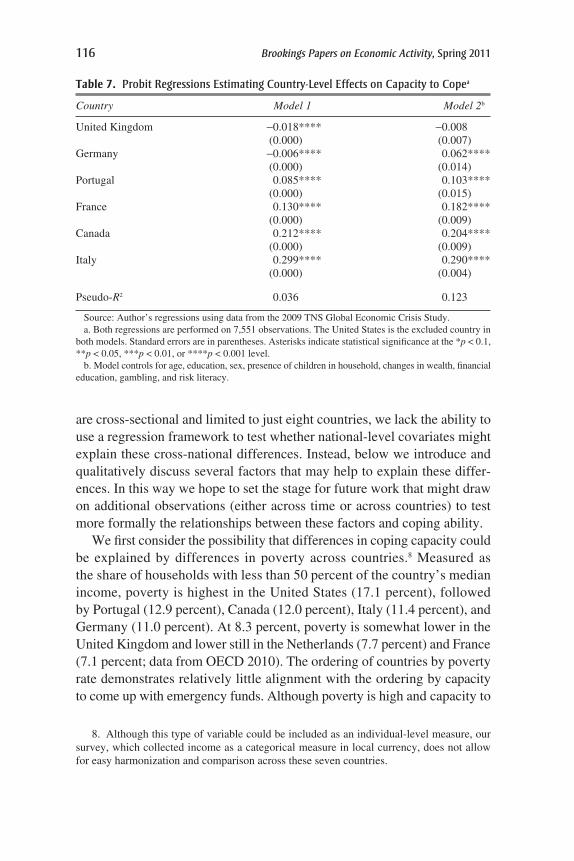
116 Brookings Papers on Economic Activity, spring 2011
are cross-sectional and limited to just eight countries, we lack the ability to use a regression framework to test whether national-level covariates might explain these cross-national differences. Instead, below we introduce and qualitatively discuss several factors that may help to explain these differ-ences. In this way we hope to set the stage for future work that might draw on additional observations (either across time or across countries) to test more formally the relationships between these factors and coping ability.
We first consider the possibility that differences in coping capacity could be explained by differences in poverty across countries.8 Measured as the share of households with less than 50 percent of the country’s median income, poverty is highest in the United States (17.1 percent), followed by Portugal (12.9 percent), Canada (12.0 percent), Italy (11.4 percent), and Germany (11.0 percent). At 8.3 percent, poverty is somewhat lower in the United Kingdom and lower still in the Netherlands (7.7 percent) and France (7.1 percent; data from OECD 2010). The ordering of countries by poverty rate demonstrates relatively little alignment with the ordering by capacity to come up with emergency funds. Although poverty is high and capacity to
Table 7. probit regressions estimating country-level effects on capacity to copea
Country Model1 Model2b
United Kingdom -0.018**** -0.008 (0.000) (0.007)Germany -0.006**** 0.062**** (0.000) (0.014)Portugal 0.085**** 0.103**** (0.000) (0.015)France 0.130**** 0.182**** (0.000) (0.009)Canada 0.212**** 0.204**** (0.000) (0.009)Italy 0.299**** 0.290**** (0.000) (0.004)
Pseudo-R2 0.036 0.123
Source: Author’s regressions using data from the 2009 TNS Global Economic Crisis Study.a. Both regressions are performed on 7,551 observations. The United States is the excluded country in
both models. Standard errors are in parentheses. Asterisks indicate statistical significance at the *p < 0.1, **p < 0.05, ***p < 0.01, or ****p < 0.001 level.
b. Model controls for age, education, sex, presence of children in household, changes in wealth, financial education, gambling, and risk literacy.
8. Although this type of variable could be included as an individual-level measure, our survey, which collected income as a categorical measure in local currency, does not allow for easy harmonization and comparison across these seven countries.

annamaria lusardi, daniel schneider, and peter tufano 117
cope low in the United States, and the converse is true in the Netherlands, other countries do not follow the pattern. For instance, poverty is relatively high in Italy, but capacity to come up with emergency funds is also high.
National social safety net programs might provide a base level of support for the most vulnerable households, allowing them and their family networks to build up greater resources (savings, credit capacity, and other resources) to deal with emergencies. The OECD measures government social safety net spending (old age, survivors, disability, and the like) as a percentage of GDP (see Tesliuc 2006). According to 2004 figures, the United States and Canada had far lower social safety net spending (averaging 8.2 percent of GDP) than the other countries in the sample, yet Canada had one of the highest and the United States one of the lowest levels of confidence in ability to come up with $2,000 in 30 days. When these two countries are compared with the others (whose social safety net spending averaged 15.5 percent of GDP), the North American countries had a slightly higher average level of ability to cope, primarily due to the high coping ability reported by Canadians. Social safety net spending alone thus cannot explain the patterns we observe.
The large law and finance literature examines the financial development of countries, and it is plausible that citizens of more financially developed countries would show greater ability to cope with financial shocks. The World Bank (2010) has assembled an extensive dataset of many financial development indicators. Indeed, there are far more of these indicators than we have country observations, but it is possible to calculate correlations between various metrics of financial market development and ability to cope, using the coefficients on the country fixed effects from model 1 in table 7. Contrary to expectations derived from this literature in law and finance, the simple correlations with ability to cope are generally negative, suggesting a lower ability to cope in countries with more developed finan-cial markets. This finding holds whether financial development is measured in terms of private credit by deposit money banks and other financial insti-tutions, bank deposits, stock market capitalization, stock market total value traded, life insurance premiums paid, or non-life insurance premiums paid (all as ratios to GDP).
An alternative explanation is that perceptions of economic well-being, rather than actual material resources, might affect confidence in one’s capacity to come up with emergency funds. In the period we study (2009), the sever-ity of the economic crisis in each country might reasonably proxy for such perceptions. Although our individual-level analysis included a measure of recent shocks to wealth from the crisis, that measure does not capture how

118 Brookings Papers on Economic Activity, spring 2011
the more general state of the national economy might affect perceptions. We therefore examined changes in unemployment rates between 2008 and 2009 in each of the eight countries, again using data from OECD (2010). The United Kingdom and the United States, two of the countries where reported coping ability was lowest, had the largest increases in unemploy-ment, which rose by 45 and 60 percent, to 7.7 percent and 9.3 percent, respectively. However, although German respondents also reported fairly low levels of coping capacity, German unemployment was fairly steady at 7.8 percent in 2009, increasing by only 3 percent. France and Portugal each saw about a 25 percent increase in unemployment between 2008 and 2009, to 9.2 percent and 9.5 percent, respectively, smaller increases than in the United Kingdom and the United States and in line with their middle position in terms of coping capacity. Among the countries with the highest coping capacity, the Netherlands had very low unemployment (3.4 percent) in 2009, an increase of about 21 percent over the preceding year, and Italy’s unemployment rate rose about 16 percent, to 7.9 percent in 2009. Canada, however, had an 8.3 percent unemployment rate in 2009, about 36 percent higher than in 2008.
We next consider the methods that respondents report they would use to cope with a financial emergency. This analysis serves a twofold purpose. First, it serves to highlight and begin to explain variation across countries in how those who could cope with an emergency would do so. Second, examining cross-national variation in how respondents would cope with an emergency may also reveal something about the between-country dif-ferences in the share of respondents who could come up with funds in the event of an emergency. Although we asked respondents separately about their confidence in their ability to cope and the methods they would use to cope, perhaps respondents considered their responses to the latter with the former in mind.
For the most part, the tabulations of coping methods presented in table 6 seem to present a story of international similarity. Savings is the most commonly named coping method in every country, generally followed by family or friends, with mainstream credit usually the third most frequently named method, trailed by increased work effort, then the sale of posses-sions, with alternative credit a distant sixth. However, there are several notable exceptions to this pattern. First, the use of savings is fairly low in Portugal (49.2 percent of respondents said they would use that method) but quite high in Italy (71.3 percent) and especially high in the Netherlands (88.8 percent). Second, the Netherlands is also distinctive in having com-paratively low levels of support from family or friends: just 10.3 percent

annamaria lusardi, daniel schneider, and peter tufano 119
versus 24 to 36 percent elsewhere. Third, the use of mainstream credit is also relatively rare in the Netherlands (7.8 percent) and Portugal (12.4 percent) but quite common in Canada (40.3 percent); the other countries range from 16 to 30 percent. Fourth, Americans are the most likely to sell possessions, work more, or use alternative sources of credit. They are also the least likely to report that they “don’t know” what coping methods they would use.
These findings track some of the aggregate characteristics of the countries. For example, Italy and the Netherlands, whose respondents are the most likely to resort to savings in an emergency, have relatively high household saving rates of 8.6 percent and 6.8 percent in 2008, respectively. These rates are much above the saving rates of the United Kingdom (-4.5 percent), Portugal (-0.9 percent), the United States (2.7 percent), and Canada (3.8 per-cent) but lower than the saving rates of Germany (11.2 percent) and France (11.6 percent; OECD 2010), countries in which savings was relatively less frequently mentioned as a coping method.
Individuals in the United States, the United Kingdom, and Germany are much more likely to resort to family and friends in financial emergencies than, for example, individuals in the Netherlands, and these figures are consistent with some of the findings about trust in familiars as captured by the World Values Survey (www.worldvaluessurvey.org). For example, consistent with the differences we observe in reliance on family and friends for financial support, only 63.4 percent of Dutch respondents state that they trust their family completely, compared with 86 percent in Great Britain, 82 percent in Germany, and 83 percent in Canada. Respondents in Italy and the Netherlands also report little trust in people they know personally. In the Netherlands, the share who completely trust the people they know personally is 30 percent, and in Italy it is 7 percent, compared with 53 percent in the United Kingdom and 47 percent in Canada.9
Similarly, the very high reliance on sources of mainstream credit in Canada is interpretable in light of the very high levels of short-term con-sumer credit in Canada: the population of approximately 33 million holds nearly $413 billion in short-term consumer debt, which translates into a ratio higher than that of the United States and orders of magnitude above France, Italy, the Netherlands, and Portugal (OECD 2010).10
Finally, table 6 also presents descriptive evidence of cross-national variation in the number of ways respondents report that they would cope
9. Figures in this paragraph are authors’ calculations from the World Values Survey.10. Ratios are calculated by dividing total household liabilities in consumer credit
(revolving and nonrevolving) by total population.

120 Brookings Papers on Economic Activity, spring 2011
with an emergency. The United States, followed by Canada and Germany, stands out for having the largest share of respondents—about a third— who report three methods of coping with a financial emergency. This share is much lower in the Netherlands (6.8 percent), Italy (13.8 percent), and Portugal (15.6 percent), countries that tend to have higher saving rates than the United States. A similar (but inverse) ordering applies to the share that would need only one method of coping: that share is highest in the Netherlands, Portugal, and Italy, followed by the United Kingdom and France, and trailed by Germany, Canada, and the United States.
These data on methods of coping are also somewhat helpful in under-standing the cross-national differences in confidence in capacity to cope. However, their usefulness in that regard is constrained by the fact that the question about coping methods was not asked of respondents who reported that they could certainly not come up with the emergency funds. That said, it is striking that respondents in Italy and the Netherlands, the two countries with the highest levels of confidence in ability to come up with emergency funds, are also characterized by very high levels of reliance on savings as a coping method. In contrast, respondents in the United States, the United Kingdom, Germany, and France, where confidence in the ability to come up with emergency funds was relatively lower, were more likely to name coping methods such as the use of alternative credit, the sale of possessions, and increase in work.
Overall, with only eight data points, we are reluctant to make any broad characterizations of differences in coping ability across countries, but we see some evidence that the propensity to save, financial market (and spe-cifically credit market) development, and the extent of trust—which in turn affect the availability of savings, credit, and family support—are likely candidates to explain the observed variation in the ability to come up with emergency funds on short notice.
VI. Conclusions and Implications
The descriptive empirical results in this paper are fairly clear and are of some cause for concern. The first finding is that a disturbingly large fraction of Americans report not being able to come up with $2,000 in 30 days. Households and individuals with socioeconomic markers of vulnerability (low income, low wealth, large wealth losses, low educa-tion, women, families with children) are more likely to be financially fragile, and substantially more fragile, than others. The more surprising finding is that a material fraction of seemingly middle-class Americans

annamaria lusardi, daniel schneider, and peter tufano 121
judge themselves to be financially fragile, reflecting either a substantially weaker financial position than one would expect or a very high level of anxiety or pessimism. Both are important in terms of behavior and for public policy.
High levels of financial fragility have fairly straightforward implications for scholars, policymakers, and businesspeople. Scholars need to better understand, through theory and empirical work, the implications of financial fragility for explaining other consumer decisions. For example, in a related paper (Lusardi, Schneider, and Tufano 2010), we document how Americans have cut back on their use of nonemergency medical services in the wake of the financial crisis, much more than have their counterparts in other developed countries with national health care plans. Even in empirical specifications including wealth, income, and other economic measures, our measure of financial fragility was one of the strongest predictors of the likelihood that a household would cut back on nonemergency care. Tufano (2011) examines Americans’ attitudes toward financial regulation and finds, in particular, that the financially fragile, as defined here, are less likely to report that laws and regulations adequately protect their financial interests. This financial fragility measure, more than traditional economic and demographic factors, was one of the strongest predictors of attitudes toward regulation. These two papers begin to examine how financial fragil-ity is either a reduced-form correlate of important behaviors or perhaps a causal factor in affecting household decisions. Much more research needs to be done to trace out the link between financial fragility and various outcomes, but these first few studies are quite suggestive. For example, it would be useful to know whether financially fragile families, as we define them, are more likely to become homeless, to become bankrupt, or to experience marital problems.
In addition to better understanding the consequences of financial fragility, we need to better understand the mechanisms that give rise to it. The fragility of the lowest-income households, in the form of lack of savings, could be attributable to tax disincentives to save, but this would not likely explain the pervasive lack of savings among higher-income Americans. Lack of savings and heavy reliance on credit could also be due to overspending or to attitudes toward risk and the future, partly captured by the propensity for gambling. Failure to cope could reflect weakening social ties that make it harder to access credit from family and friends. Lack of financial knowl-edge could also play a role in explaining the lack of savings and the use of crude methods of dealing with risk (such as selling possessions). Substan-tially more work needs to be done not only on the factors that describe the
122 Brookings Papers on Economic Activity, spring 2011
financially fragile but also on the factors that explain how they come to be fragile.
A future research agenda on financial fragility would include many elements. In particular, it would be useful to complement the quantitative analysis in this paper with qualitative analysis. For example, focus groups or in-depth interviews with those who state that they could certainly not come up with $2,000 could shed light on what individuals actually do when hit by a shock and the reasons for their lack of an emergency fund. Open-ended questions could also enrich the list of methods of coping that we have considered in this paper and provide additional insights. Merely asking for a specific ordering—by amount—would help clarify whether households perceive a pecking order of sources of funds. Although much research remains to be done, the evidence provided in this paper shows that the simple representative household assumed in many macroeconomic models is unlikely to correctly characterize the behavior we observe in the economy, and that the existing theoretical models need to be enriched to incorporate the heterogeneity in the data.
Although such work needs to precede policy action, there are some steps policymakers might consider to strengthen households’ abilities to weather financial storms. For example, although there is considerable direct and indirect federal support for long-term asset building, most of which is delivered through tax policies, evidence suggests that that support is not well targeted. The Corporation for Enterprise Development estimates that federal spending to promote asset building in 2009 was $384 billion, with the major programs benefiting the wealthiest Americans. If one considers only the mortgage interest deduction, property tax deductions, and prefer-ential capital gains and dividend rates, the top 20 percent of Americans by income received 84 percent of these benefits and the bottom 20 percent of Americans just 0.04 percent (Woo, Rademacher, and Meier 2010). At the same time, some federal policies actively discourage precautionary saving through asset limits on eligibility for federal assistance (Hubbard, Skinner, and Zeldes 1995). Given the substantial negative consequences of financial fragility, policymakers might consider helping households build emergency buffer stocks of savings. This could be done in several ways. For example, interest and dividends on the first few thousand dollars of savings could be exempted from tax or earn a refundable credit, asset limits on federal assistance programs could be significantly increased, support for lending by family and friends could be provided, or incentives could be created for banks and other financial institutions to offer emergency accounts. If self-control problems are found to be substantial, the terms of these programs
annamaria lusardi, daniel schneider, and peter tufano 123
might include a substantial commitment component, which Nava Ashraf and others (2006) have shown to be effective. Improving financial literacy and promoting financial education may be another way to address lack of precautionary savings. All of these interventions need to be tested for effectiveness, but all are motivated by a recognition of financial fragility.
High levels of financial fragility also suggest opportunities for financial institutions to offer products that facilitate emergency support. Although banks and other lenders already provide potential coping mechanisms in the form of savings accounts, credit cards, payday loans, pawn shops, over-draft programs, and other products, different products might be devised that better address these needs.11 For example, whereas savings accounts are almost always associated with interest payments, Christmas clubs historically did not pay much interest yet were quite popular. If one were to design an emergency product today, what service might be attached in lieu of interest to enhance its popularity? Might a household opening such an account as an emergency account prefer vouchers for flu shots, auto-mobile club membership, or some other services as much as, or more than, interest? Again, additional testing would be required to determine whether households would demand these products, and if so, whether they would have any impact on financial fragility.
These implications for academics, policymakers, and businesses flow from a consideration of the high observed level of financial fragility. The second finding of our paper is that households use a variety of mecha-nisms to cope with financial shocks, and that although savings is the most commonly selected coping method, it is hardly the only one. Households rely on a broad set of supports—credit, family and friends, increased labor, and others—to deal with shocks. We empirically posit that these coping mechanisms might be sequenced in the form of a pecking order. Although much additional work needs to be done to validate this hypoth-esis, it appears that just as corporations tend to fund themselves first by
11. Credit unions have developed and piloted projects that address some of these needs. For example, the “2 Grand Plan” program combines saving with borrowing to make sure emergency cash is available when needed most. In this program, an individual makes regular deposits to a savings account, but if an emergency occurs, an affordable-rate loan is made available so that the savings plan is not disrupted. The “Big Payoff Loan” is another example of an innovative program offered by credit unions. Here the borrower transfers a percentage of his or her unsecured debt to a 12-month personal loan at a low fixed interest rate. When the borrower successfully pays down this portion of the debt, the credit union may advance additional funds to pay down another portion of the debt. The cycle repeats itself until the debt is repaid. For more detail, see Gabel (2011).

124 Brookings Papers on Economic Activity, spring 2011
drawing upon internal funds, so households address financial shocks first by drawing down their own savings. And just as the cost of funds, in the form of both direct transaction costs and information asymmetries, may help explain corporate funding choices, so the relative importance of direct financial costs, transaction costs, social costs, information costs, and effort might explain the ordering of coping mechanisms for different households.
This contention suggests opportunities for considerable additional research. For example, among households with ready access to credit, does the size of the spread between borrowing and savings interest rates affect the choice between dipping into savings and borrowing? Do the associated transaction costs, in terms of time and ease of borrowing, explain differ-ences in this choice over time and across countries? We find that friends and family are the second most popular coping mechanism. Does the strength of friend and family ties affect the relative attractiveness of this choice? In particular, do we see greater use of friend and family financial support in more tight-knit communities? Is there a relationship between physical proximity and friend and family support—and would such a relationship manifest itself in different patterns depending on migration patterns? Some recent research calculates the premium, in basis points, that some borrowers will pay when offered certain types of marketing, for example inserting pictures of attractive females in marketing material (Bertrand and others 2010). We know that most loans from friends and family charge zero interest, yet people may prefer to pay interest to a finan-cial institution rather than incur the social cost of asking for money. How large is the implied discount, how much does it vary, and how do social factors influence its size?
We also find that 19 percent of Americans claim they would cope with an emergency by selling something they own. Have eBay and similar websites, which have made selling personal items easier—and arguably reduced the discount on resale items—increased the use of this coping mechanism? We also find that financial education and risk literacy affect both the ability to cope and the methods of coping chosen, suggesting ways to enrich models of saving or public policies toward saving. More-over, just as empirical work on corporate financial choices at first was motivated by, but later challenged, pecking order theory, so work on household coping mechanisms could enhance our understanding of the trade-offs involved.
If research were to validate the notion of a pecking order, policymakers might see that many different policies relate to one another in ways previ-

annamaria lusardi, daniel schneider, and peter tufano 125
ously not understood. If many of the financially fragile have low incomes, then perhaps refundable tax credits could be used to stimulate saving. The average annual income tax refund is approximately the same size as the amount that we study here (Tufano and Schneider 2009). Would it be possible to allow households to get their refunds in a form that could serve as an emergency savings account? Could households be allowed to borrow against next year’s refund through a reduction in withholdings? Could policy be used to support borrowing from family and friends? Credit, both mainstream and alternative, is an important resource in households’ plan-ning for dealing with shocks. Government policy on small-dollar credit has recently focused on issues of affordability and pricing, as seen in the John Warner National Defense Authorization Act (or Talent Amendment), which imposed a 36 percent interest rate ceiling on loans to members of the armed forces. But one can also ask what government policy might do to make small- dollar credit more widely available. The Federal Deposit Insurance Cor-poration’s Small-Dollar Loan Pilot Program may provide some answers in this regard.
Should the concept of a pecking order of coping mechanisms prove useful in explaining household financial decisionmaking, it would have implications for businesses seeking to provide new products. Financial products that combine saving and borrowing already exist, for instance in the form of savings accounts with an attached line of credit. Given the importance of lending by family and friends, one further possibility might be to create group accounts, in which savings accumulated by some mem-bers of the group might be drawn down by others, who would then repay the savers with interest. Such a product might include a mechanism by which the would-be lenders assent to the drawdown. Accounts of this kind, administered by financial institutions, might succeed as a modern version of friend-and-family lending, one that better protects the lenders from default while increasing the “stickiness” of these accounts to the financial institu-tion (that is, the tendency for deposited funds to remain in the account for long periods).
Our research does not identify any specific policy or business practice as the solution to high financial fragility. Rather, our goal is to document that financial fragility is substantial, give a sense of the many means that families use to cope with it, and suggest some implications for further research. This and subsequent work on financial fragility, by taking a broad approach to understanding how households cope with financial shocks, has the potential to enlighten scholars, policymakers, and businesses trying to understand and serve households’ financial needs.

126 Brookings Papers on Economic Activity, spring 2011
a p p e n d i x
Survey Methods
The data we draw upon in this paper were collected from respondents sur-veyed in Canada, France, Germany, Italy, the Netherlands, Portugal, the United Kingdom, and the United States as part of the TNS Global Economic Crisis survey. This survey was administered to members of existing online TNS panels of respondents. TNS panels are assembled through convenience sampling, with panel members recruited through a wide range of channels with the intent of drawing in a broad group of Internet users and of mini-mizing the bias that might be associated with any one method of recruitment. Members of these panels opt in to panel membership and are then contacted to participate in surveys fielded by TNS on a diverse range of topics.
For this particular survey, panel members were selected for contact based on their sex, education, age, and region in an effort to assemble a group of respondents that matched, on those attributes, the population of each country. Response rates to the invitation to participate in the survey ranged from 7.5 to 19.5 percent of panel members contacted, depending on the country. A reminder e-mail was issued to the group of selected panel members 3 days after the initial contact. These procedures yielded samples of 2,148 U.S. respondents, 1,132 Canadian respondents, 1,001 British respondents, 1,097 French respondents, 1,107 German respondents, 1,011 Portuguese respon-dents, 935 Italian respondents, and 1,001 Dutch respondents. These data were then weighted to ensure that they reflected the national population of each country on the basic demographic characteristics noted above.
Appendix table A1 displays univariate statistics for basic demographic and economic measures for the United States and compares the distribu-tions of responses from the TNS survey with pooled 2006–08 American Community Survey (ACS) data and with data from the 2007 Survey of Consumer Finances (SCF) for the United States. In general, our sample matches well in terms of basic demographics, including age, sex, and geog-raphy. However, our sample is underrepresented with respect to minorities and families with children and is slightly better educated than the ACS sample. Our sample is also quite similar to the overall population in terms of wealth, as measured by the 2007 SCF.
The methodology used here has the virtue of permitting the survey to be rapidly implemented in multiple countries at a fairly low cost. How-ever, several important drawbacks to this methodology should be noted. Although our sample matches the U.S. population (as measured by the ACS and the SCF) quite well on observable economic and demographic

annamaria lusardi, daniel schneider, and peter tufano 127
Table A1. descriptive statistics: economic and demographic characteristics of the tns and other samples
Statistic TNS Othersamplesa
ChangeinhouseholdwealthsincefinancialcrisisNo change 27.09 n.a.Increase > 10 percent 7.76 n.a.Increase < 10 percent 10.56 n.a.Decrease < 10 percent 12.54 n.a.Decrease 10 to 29 percent 21.66 n.a.Decrease 30 to 50 percent 11.70 n.a.Decrease > 50 percent 8.69 n.a.
Annualhouseholdincome<$20,000 13.29 14.8$20,000 to $29,999 11.96 9.17$30,000 to $39,999 12.88 9.72$40,000 to $49,999 13.27 9.25$50,000 to $59,999 11.29 8.67$60,000 to $74,999 13.13 11.15$75,000 to $99,999 11.18 13.79$100,000 to $149,999 9.53 13.85$150,000 or more 3.47 9.59
HouseholdwealthZero 12.93 9.02<$1,000 14.70 17.19$1,000 to $2,999 7.22 12.46$3,000 to $3,999 5.31 5.76$4,000 to $9,999 7.54 8.91$10,000 to $19,999 8.24 9.19$20,000 to $49,999 12.02 11.54$50,000 to $99,999 12.34 8.05$100,000 to $249,999 10.27 9.13$250,000 or more 9.45 8.75
EducationHigh school or less 22.34 42.71Trade school 8.23 n.a.Some college 34.81 31.15College (bachelor’s degree) 26.71 17.21Graduate education 7.89 8.93
UnemploymentstatusUnemployed 13.92 n.a.
Age18 to 34 39.11 36.8235 to 54 47.06 45.9355 to 65 13.83 17.25
(continued)

128 Brookings Papers on Economic Activity, spring 2011
characteristics, respondents were drawn from a convenience sample and, as such, may differ from the general population on other characteristics.
In particular, our sample is restricted to Internet users. Access to home broadband is not universal in any of the countries examined here and generally ranges between 40 and 80 percent of households (OECD 2011). However, the share of Internet users is likely somewhat higher than the share with home broadband access, because some households still use dial-up con-nections and others access the Internet outside of the home. For example,
SexFemale 49.61 50.05
Raceorethnicityb
White 80.48 66.55Black 7.78 12.06Hispanic 4.34 14.44Asian 5.03 4.69Other race or ethnicity 2.37 2.26
Maritalstatusc
Married or cohabiting 54.16 56.24Never married 23.65 31.81Divorced or widowed 11.55 11.95Other marital status 10.65 n.a.
Householdcompositiond
Children in household 41.36 53.41Live with parents 11.62 n.a.
RegionSouth 36.21 36.54Northeast 18.83 18.25Midwest 22.46 21.83West 22.50 23.37
Sources: 2009 TNS Global Economic Crisis Study, American Community Survey (ACS; pooled 2006–08 sample), and 2007 Survey of Consumer Finances.
a. Data from the ACS are used for all comparison measures except for wealth, which is calculated from the 2007 Survey of Consumer Finances. n.a. = not available.
b. The Census categorizes “Hispanic” as an ethnic category separate from racial categories. Calcula-tions were done on ACS data to ensure that the race data presented here were for ages 18 to 64 and that Hispanics were not also included in other racial categories.
c. The ACS does not categorize separately those who cohabit. The ACS category “married” includes all married persons who are either living together, separated, or designated as “other married.”
d. The most comparable ACS data are provided here, namely, those for all persons who have their own children in the household.
Table A1. descriptive statistics: economic and demographic characteristics of the tns and other samples (Continued)
Statistic TNS Othersamplesa

annamaria lusardi, daniel schneider, and peter tufano 129
67 percent of U.S. households have broadband, but 78 percent of American adults are Internet users (Horrigan 2010). Our sample likely underrepresents the most vulnerable groups in the population, such as migrant workers, and overrepresents those who are more technically savvy. Although we account for observable measures of socioeconomic status, these biases might still lead us to misstate the financial fragility of the populations examined here if these characteristics are associated with socioeconomic status or financial acumen.
Further, although our sample matches the general population well in terms of education and wealth, it may slightly underrepresent the highest-income households. The reason is that members of the TNS panels opt in to participation and receive small monetary rewards for participation, per-haps making participation particularly appealing to those with more time and lower income. This latter bias, if present, could lead us to overstate the extent of financial fragility in the population. However, when polled, few members of the TNS panels report that their decision to participate is primarily driven by economic factors.
TNS implements several systemwide checks on data quality. Most nota-bly, mean response times to each survey are calculated, and respondents whose completion times are more than 2 standard deviations from the mean are flagged. Respondents who are flagged multiple times are excluded from future surveys. In any given survey, the percent of respondents flagged in this way is generally from 1 to 2 percent.
Questions to Measure Risk Literacy
Q1. For the same amount of money, a person can enter either one of these two lotteries. Lottery A pays a prize of $200, and the chance of win-ning is 5%. Lottery B pays a prize of $90,000,12 and the chance of winning is 0.01%. In either case, if one does not win, one does not get any money. Which lottery pays the higher average amount?
(Please pick one option only)Lottery ALottery BThese two lotteries pay the same average amountI do not knowI refuse to answer
12. The amounts are £140 and £60,000, respectively, in the U.K. questionnaire and 6150 and 665,000, respectively, in the French and German questionnaires.

130 Brookings Papers on Economic Activity, spring 2011
Q2. You can invest in two projects. Project A will either deliver a return of 10% or 6%, with either outcome equally likely. Project B will either deliver a return of 12% or 4%, with either outcome equally likely. Which of the following is true? Compared to Project B, Project A has. . . .
(Please pick one option only)Higher return and lower riskSame average return and lower riskLower return and higher riskI do not knowI refuse to answer
Q3. As a general rule, if you were investing in stocks [in the United Kingdom: investing in stocks and shares], which of the two types of investments listed below is likely to be riskier?
(Please pick one option only)Investing in a single stockInvesting in a fund that holds 100 different stocksI don’t knowI refuse to answer
ACKNOWLEDGMENTS We would like to thank TNS Global and, in particular, Bertina Bus, Maria Eugenia Garcia Neder, Ellen Sills-Levy, and Bob Neuhaus. We are grateful for comments from our colleagues, seminar participants at Columbia Business School, the American Economic Associa-tion meetings, the Association for Public Policy Analysis and Management conference, and especially from Sumit Agarwal, George Akerlof, Arie Kaptein, Adair Morse, Karen Pence, Kartini Shastry, other participants at the Brookings Papers conference, and the editors. Annamaria Lusardi gratefully acknowledges financial support from Netspar. Daniel Schneider thanks the National Science Foundation Graduate Research Fellowship (grant no. DGE-0646086) and Princeton University for financial support. Peter Tufano thanks the Harvard Business School (HBS) Division of Research and Faculty Development for financial support for this work, which was largely done while he was a faculty member at HBS. We are grateful to Andrea Ryan and Dan Quan for research assistance. The views expressed herein do not necessarily reflect those of TNS Global. The authors report no relevant potential conflicts of interest.

annamaria lusardi, daniel schneider, and peter tufano 131
References
Adams, William, Liran Einav, and Jonathan Levin. 2009. “Liquidity Constraints and Imperfect Information in Subprime Lending.” AmericanEconomicReview 99, no. 1: 49–84.
Aguiar, Mark, and Erik Hurst. 2005. “Consumption versus Expenditure.” JournalofPoliticalEconomy 113, no. 5: 919–48.
Ashraf, Nava, Dean Karlan, and Wesley Yin. 2006. “Tying Odysseus to the Mast: Evidence from a Commitment Savings Product in the Philippines.” QuarterlyJournalofEconomics 121, no. 2: 635–72.
Bernheim, Douglas B., Daniel M. Garrett, and Dean M. Maki. 2001. “Education and Saving: The Long-Term Effects of High School Financial Curriculum Mandates.” JournalofPublicEconomics 80, no. 3: 435–65.
Bertrand, Marianne, Dean Karlan, Sendhil Mullainathan, Eldar Shafir, and Jonathan Zinman. 2010. “What’s Advertising Content Worth? Evidence from a Consumer Credit Marketing Field Experiment.” QuarterlyJournalofEconomics 125, no. 1: 263–306.
Briggs, Xavier de Souza. 1998. “Brown Kids in White Suburbs: Housing Mobility and the Many Faces of Social Capital.” HousingPolicyDebate 9, no. 1: 177–221.
Brobeck, Stephen. 2008. “Understanding the Emergency Savings Needs of Low- and Moderate- Income Households: A Survey-Based Analysis of Impacts, Causes, and Remedies.” Washington: Consumer Federation of America. www.consumerfed.org/elements/www.consumerfed.org/file/Emergency_Savings_Survey_Analysis_Nov_2008.pdf.
Browning, Martin, and Annamaria Lusardi. 1996. “Household Saving: Micro The-ories and Micro Facts.” JournalofEconomicLiterature 34, no. 4: 1797–1855.
Bucks, Brian K., Arthur B. Kennickell, and Kevin B. Moore. 2006. “Recent Changes in U.S. Family Finances: Evidence from the 2001 and 2004 Survey of Consumer Finances.” FederalReserveBulletin A1–A38.
Caner, Asena, and Edward N. Wolff. 2004. “Asset Poverty in the United States, 1984–99: Evidence from the Panel Study of Income Dynamics.” Review ofIncomeandWealth 50, no. 4: 493–518.
Carroll, Christopher D. 1997. “Buffer-Stock Saving and the Life Cycle/Permanent Income Hypothesis.” QuarterlyJournalofEconomics 112, no. 1: 1–55.
Carroll, Christopher D., and Andrew A. Samwick. 1997. “The Nature of Precaution-ary Wealth.” JournalofMonetaryEconomics 40, no. 1: 41–71.
———. 1998. “How Important Is Precautionary Saving?” ReviewofEconomicsandStatistics 80, no. 3: 410–19.
Chieffe, Natalie, and Ganas K. Rakes. 1999. “An Integrated Model for Financial Planning.” FinancialServicesReview 8, no. 4: 261–68.
Cole, Shawn, Peter Tufano, Daniel Schneider, and Daryl Collins. 2008. “First National Bank’s Golden Opportunity.” Case Study 208-072. Harvard Business School.
132 Brookings Papers on Economic Activity, spring 2011
Conley, Dalton. 1999. BeingBlack,LivingintheRed:Race,Wealth,andSocialPolicyinAmerica. University of California Press.
Consumer Federation of America. 2006. “How Americans View Personal Wealth Vs. How Financial Planners View This Wealth.” Washington.
Deaton, Angus. 1991. “Saving and Liquidity Constraints.” Econometrica 59, no. 5: 1221–48.
———. 1992. UnderstandingConsumption. Oxford University Press.Donaldson, Gordon. 1961. CorporateDebtCapacity:AStudyofCorporateDebt
PolicyandtheDeterminationofCorporateDebtCapacity. Beard Books.El-Hage, Nabil N., Peter Tufano, and Daniel Schneider. 2006. “Circle Lending.”
Case study 206-137. Harvard Business School.Gabel, Denise R. 2011. BlueprintsforInnovation. Madison, Wisc.: Filene Research
Institute.Gross, David B., and Nicholas S. Souleles. 2002. “Do Liquidity Constraints and
Interest Rates Matter for Consumer Behavior? Evidence from Credit Card Data.” QuarterlyJournalofEconomics 117, no. 1: 149–85.
Gustman, Alan L., Olivia S. Mitchell, Andrew A. Samwick, and Thomas L. Steinmeier. 1999. “Pension and Social Security Wealth in the Health and Retirement Study.” In Wealth,Work,andHealth:InnovationsinMeasurementintheSocialSciences, edited by James P. Smith and Robert J. Willis. University of Michigan Press.
Harknett, Kristen, and Jean Knab. 2007. “More Kin, Less Support: Multipartnered Fertility and Perceived Support among Mothers.” Journal of Marriage andFamily 69, no. 1: 237–53.
Haveman, Robert, and Edward N. Wolff. 2004. “The Concept and Measurement of Asset Poverty: Levels, Trends, and Composition for the U.S., 1983–2001.” JournalofEconomicInequality 2, no. 2: 145–69.
Henly, Julia R., Sandra K. Danziger, and Shira Offer. 2005. “The Contribution of Social Support to the Material Well-Being of Low-Income Families.” JournalofMarriageandFamily 67, no. 1: 122–40.
Horrigan, John B. 2010. “Broadband Adoption and Use in America.” OBI Working Paper Series no. 1. Washington: Federal Communications Commission.
Hubbard, R. Glenn, Jonathan Skinner, and Stephen P. Zeldes. 1995. “Precautionary Saving and Social Insurance.” JournalofPoliticalEconomy 103, no. 2: 360–99.
Hurst, Erik, Annamaria Lusardi, Arthur Kennickell, and Francisco Torralba. 2010. “The Importance of Business Owners in Assessing the Size of Precautionary Savings.” ReviewofEconomicsandStatistics 92, no. 1: 61–69.
Kearney, Melissa, Jonathan Guryan, Erik Hurst, and Peter Tufano. Forthcoming. “Making Savers Winners: An Overview of Prize-Linked Savings Products.” In FinancialLiteracy:ImplicationsforRetirementSecurityandtheFinancialMarketplace, edited by Annamaria Lusardi and Olivia S. Mitchell. Oxford University Press.
Kotlikoff, Laurence J., and Avia Spivak. 1981. “The Family as an Incomplete Annuities Market.” JournalofPoliticalEconomy 89, no. 2: 372–91.

annamaria lusardi, daniel schneider, and peter tufano 133
Lusardi, Annamaria. 1999. “Information, Expectations, and Savings for Retirement.” In BehavioralDimensionsofRetirementEconomics, edited by Henry J. Aaron. Brookings and Russell Sage Foundation
———. 2008. “Financial Literacy: An Essential Tool for Informed Consumer Choice?” Working Paper no. 14084. Cambridge, Mass.: National Bureau of Economic Research.
———. 2009. “Household Savings Behavior in the United States: The Role of Financial Literacy, Information, and Financial Education Programs.” In Policy-makingInsightsfromBehavioralEconomics, edited by Christopher L. Foote, Lorenz Goette, and Stephan Meier. Federal Reserve Bank of Boston
———. 2010. “Americans’ Financial Capability.” Report prepared for the Financial Crisis Inquiry Commission, Washington (February).
Lusardi, Annamaria, and Olivia S. Mitchell. Forthcoming-a. “Financial Literacy and Planning: Implications for Retirement Wellbeing.” In FinancialLiteracy:ImplicationsforRetirementSecurityandtheFinancialMarketplace, edited by A. Lusardi and O. S. Mitchell. Oxford University Press.
———. Forthcoming-b. “Financial Literacy around the World: An Overview.” In preparation.
Lusardi, Annamaria, and Peter Tufano. 2009. “Debt Literacy, Financial Experiences and Overindebtedness.” Working Paper no. 14808. Cambridge, Mass.: National Bureau of Economic Research.
Lusardi, Annamaria, Daniel Schneider, and Peter Tufano. 2010. “The Economic Crisis and Medical Care Usage.” Working Paper no. 15843. Cambridge, Mass.: National Bureau of Economic Research.
Myers, Stewart C. 1984. “The Capital Structure Puzzle.” JournalofFinance 39, no. 3: 575–92.
Myers, Stewart C., and Nicholas S. Majluf. 1984. “Corporate Financing and Invest-ment Decisions When Firms Have Information That Investors Do Not Have.” JournalofFinancialEconomics 13, no. 2: 187–221.
Oliver, Melvin L., and Thomas M. Shapiro. 1995. BlackWealth/WhiteWealth:ANewPerspectiveonRacialInequality. New York: Routledge.
Organization for Economic Cooperation and Development (OECD). 2010. OECDFactbook2010:Economic,EnvironmentalandSocialStatistics. Paris.
———. 2011. “Households with Broadband Access (2009).” Paris: Directorate for Science, Technology and Industry, OECD. www.oecd.org/sti/ict/broadband.
Parker, Jonathan A., Nicholas S. Souleles, David S. Johnson, and Robert McClelland. 2011. “Consumer Spending and the Economic Stimulus Payments of 2008.” Working Paper no. 16684. Cambridge, Mass.: National Bureau of Economic Research.
Sarkisian, Natalia, and Naomi Gerstel. 2004. “Kin Support among Blacks and Whites: Race and Family Organization.” AmericanSociologicalReview 69, no. 6: 812–37.
Sherraden, Michael. 2005. InclusionintheAmericanDream:Assets,PovertyandPublicPolicy. Oxford University Press.

134 Brookings Papers on Economic Activity, spring 2011
Skiba, Paige Marta, and Jeremy Tobacman. 2008. “Do Payday Loans Cause Bankruptcy?” Philadelphia, Pa.: Wharton School of Business.
Skinner, Jonathan. 1988. “Risky Income, Life Cycle Consumption and Precautionary Saving.” JournalofMonetaryEconomics 22, no. 2: 237–55.
Smith, James P. 1995. “Racial and Ethnic Differences in Wealth in the Health and Retirement Study.” JournalofHumanResources 30 (supplement): S158–83.
Stephens, Melvin, Jr. 2008. “The Consumption Response to Predictable Changes in Discretionary Income: Evidence from the Repayment of Vehicle Loans.” ReviewofEconomicsandStatistics 90, no. 2: 241–52.
———. 2003. “‘3rd of tha Month.’ Do Social Security Recipients Smooth Con-sumption between Checks?” AmericanEconomicReview 93, no. 1: 406–22.
Taylor, Paul, Rich Morin, and Wendy Wang. 2010. “One Recession, Two Americas: Most Lost Ground but Nearly Half Held Their Own.” Washington: Pew Research Center, Social and Demographic Trends Project.
Tesliuc, Emil. 2006. “Social Safety Nets in OECD Countries.” Social Safety Nets Primer Notes no. 25. Washington: World Bank.
Tufano, Peter. 2008. “Savings Whilst Gambling: An Empirical Analysis of UK Premium Bonds.” AmericanEconomicReviewPapersandProceedings 98, no. 2: 321–26.
———. 2011. “Setting Financial Regulatory Priorities: Listening to Consumers.” Harvard Business School.
Tufano, Peter, and Daniel Schneider. 2009. “Using Financial Innovation to Support Savers: From Coercion to Excitement.” In InsufficientFunds:Savings,Assets,Credit,andBankingamongLow-IncomeHouseholds, edited by Rebecca M. Blank and Michael S. Barr. New York: Russell Sage.
Tufano, Peter, Nick Maynard, and Jan-Emmanuel De Neve. Forthcoming. “Consumer Demand for Prize-linked Savings: A Preliminary Analysis.” EconomicsLetters.
Venti, Steven F., and David A. Wise. 2001. “Choice, Chance, and Wealth Dispersion at Retirement.” In AgingIssuesintheUnitedStatesandJapan, edited by Seiritsu Ogura, Toshiaki Tachibanaki, and David A. Wise. University of Chicago Press.
Warren, Elizabeth, and Amelia Warren Tyagi. 2003. TheTwo-IncomeTrap:WhyMiddle-ClassMothersandFathersAreGoingBroke. New York: Basic Books.
Woo, Beadsie, Ida Rademacher, and Jillien Meier. 2010. UpsideDown:The$400BillionFederalAsset-BuildingBudget. CFED Report. Washington: Corporation for Enterprise Development.
World Bank. 2010. “A New Database on Financial Development and Structure.” Washington. econ.worldbank.org/WBSITE/EXTERNAL/EXTDEC/EXTRESEARCH/0,,contentMDK:20696167~pagePK:64214825~piPK:64214943~theSitePK:469382,00.html (accessed March 11, 2011).
Worthington, Andrew C. 2003. “Emergency Finance in Australian Households: An Empirical Analysis of Capacity and Sources.” Discussion Paper no. 163. Brisbane, Australia: Queensland University of Technology.

135
Comments and Discussion
Comment ByADAIR moRSe Expense shocks happen. In this paper Annamaria Lusardi, Daniel Schneider, and Peter Tufano study the ability of individuals to cope with such a shock, relating the results to the fragility of preparation, that is, how vulnerable people’s financial condition is to facing a quick need for cash. Vulnerability to shocks is a topic that development economists have long considered, but this paper is the first to make the profession (shockingly) aware that half of Americans—and many Europeans—may be unable to cope with a moderate expense shock of $2,000. That finding alone is sufficient to make this a great paper to read and remember.
I structure this discussion in two main parts. First, I offer some thoughts on coping by classifying the survey responses about coping mechanisms in a slightly different way than the authors do. The idea is to shed light on some unanswered questions that the paper raises. Second, I discuss the authors’ empirical specification beyond the tabulations of coping mechanisms and suggest some alternatives.
a reclassification of coping methods. Beyond the finding that half of Americans cannot cope with a modest expense shock, the paper’s great contribution is in tabulating the ways in which those individuals who could cope would do so. The most important coping methods found in the authors’ survey are, in decreasing order of frequency cited, drawing from savings, borrowing from family, working more, using credit cards, and selling pos-sessions. The second-order mechanisms are liquidating retirement assets, pawning possessions, borrowing from friends, and taking out an unsecured loan. I would like to interpret these items using a slightly different classi-fication scheme and discuss methods of coping within this different set of buckets. My list of coping buckets would be the following: drawing down

136 Brookings Papers on Economic Activity, spring 2011
savings, rebalancing, increasing earnings, using bridge borrowing, and leveraging assets.
First, what is savings? Savings is otherwise inefficiently invested wealth that provides liquidity. Savings is about consumption insurance. The authors motivate their discussion of savings by citing theories, such as those of Angus Deaton (1992) and Christopher Carroll (1997), that hold that risk-averse individuals will accumulate wealth to shield themselves against uninsurable risks. What are the relevant empirical findings from this lit-erature? People do undertake precautionary saving (Carroll and Samwick 1998), but insufficiently so. The same pattern holds under the consumption insurance frame. John Cochrane (1991) documents failures of complete consumption insurance by looking at two types of shock: long-term illness and involuntary job loss.1 An important distinction is that the insurance measured in this literature is insurance against permanent shocks, whereas the shock investigated by Lusardi, Schneider, and Tufano is a transitory one. Cochrane (1991) is unable to reject the consumption insurance hypothesis for temporary job interruptions. Likewise, Richard Blundell, Luigi Pistaferri, and Ian Preston (2008) find a fair degree of consumption insurance against transitory shocks (less so against permanent shocks), except among the poor, who do not insure much at all.
How does the present paper fit into this picture? The authors’ survey captures fragility to a transitory expense shock. One might expect that the respondents’ answers about savings would line up with Blundell, Pista-ferri, and Preston’s (2008) distribution of who is insured against transitory income shocks. Instead, the authors find that Americans divide themselves almost equally into four groups: those definitely able, probably able, prob-ably unable, and definitely unable to come up with $2,000 within the next month. In other words, many more are unable to cope with such a shock than would have been expected.
I would have liked to see the authors try to reconcile their finding with the macroeconomic literature, perhaps constructing proxies for fragility in the Survey of Consumer Finances over time. My instinct is that the short-term nature of the shock—respondents had to come up with the cash “within the next month”—matters. (When in the month, by the way, did the survey ask them?) Or perhaps there is something special about the time period surveyed that explains why the consumption insurance hypothesis is so drastically rejected in the authors’ findings. Or maybe the explanation is
1. Attanasio and Davis (1996) also document a failure of consumption insurance by looking at shifts in cohort wage structures.
comments and discussion 137
that coping with an expense shock differs from coping with an income shock, for which short-term safety nets exist. The authors could do much more to shed some light on this reconciliation. In addition, as I discuss later, I would have liked to see savings treated as a special category sepa-rate from the other coping mechanisms in an analysis of why precautionary savings cannot cover a $2,000 shock.
My second bucket of coping mechanisms, which I call rebalancing, includes pawning possessions, the selling of possessions or of one’s home, and the liquidation of investments and retirement assets. If one adds up all of these items from the authors’ table 3, they account for 21 percent of boxes checked (and 30 percent of coping items other than savings). I was surprised by how large this share is. Rebalancing that involves tax-sheltered retirement accounts is expensive for people below retirement age because of penalties. Rebalancing home wealth is more appropriate for large per-manent shocks. Stephen Shore and Todd Sinai (2010) find that when small shocks occur, consumption adjusts, but when large shocks occur, rebalancing of housing consumption occurs in lieu of nonhousing consumption adjust-ments. That raises the question of what are the things people sell when they respond in the present survey that they sell possessions. Cars? Televisions and furniture? These items depreciate sharply as soon as one takes them out of the showroom. I think this is an interesting finding of the paper, but it leaves me wanting to know more.
The third bucket of coping is increased earning, which represents 12 per-cent of all boxes checked in the survey, or 17 percent of the nonsavings boxes. I would argue that it is hard to increase earnings in the short term as a way of responding to a transitory shock. It raises the question of who in the household has the flexibility in terms of untapped wage potential. Not many Americans can simply increase at will the number of hours they work at their current job or find short-term supplemental income. Surely this margin is available only to certain occupations. Maybe the authors could have offered some perspectives here from the labor literature.
In one sense, increased earning and rebalancing are related. Reading the paper gave me a new intuition that a quick transitory shock has the potential to disrupt household balance sheets in a different way from, say, a permanent job loss. In particular, people may not be willing or able to undertake rebalancing or increase their income in response to a transitory shock, and thus debt troubles could result from such frictions.
The fourth bucket is what I call bridge borrowing, which includes bor-rowing from family, borrowing from friends, and taking out expensive “alternative” loans. The authors may disagree with this classification of

138 Brookings Papers on Economic Activity, spring 2011
family and friends with expensive lenders, but both types of borrowing amount to stopgap measures taken before worse outcomes occur, and by far the most important stopgap is the family. I put bridge borrowing as the fourth bucket not because it carries little weight (it does not: it is second behind savings at 25 percent of items checked, and 35 percent of non-savings items checked), but because I wanted to emphasize how costly the first three nonsavings buckets are for temporary shocks. Bridge bor-rowing is essential in a society where assets have sigmoidal depreciation, where rebalancing involves penalties, and where hours worked is often not a short-term decision variable. It is also essential in situations in which individuals have no assets to rebalance. The authors are correct to point out that the societal role of borrowing from family is insufficiently recognized.
The fifth and final bucket is what I think of as leveraging assets. Two response categories fit into this bucket: home equity loans (or second mortgages) and credit cards. The household finance literature does not really do justice to the possibility that credit cards offer a leverage benefit to wealth, allowing households to substitute credit card slack for low-earning liquid savings. It is known that people do value slack in their credit card accounts (Agarwal, Skiba, and Tobacman 2010, Stango and Zinman 2009). It is not hard to imagine a framework in which, because shocks occur only with some probability, one might optimally use credit card slack, even with expensive interest rates, as precautionary savings. The quantity of slack might be considered a leveraging of assets, in the sense that the information that credit card issuers use to calculate credit limits (income and outstanding debt) can easily be transformed into implied wealth. My point in reclassifying what the authors call mainstream credit into a leveraging of assets is that little has been written on the role of financial institutions in smoothing uninsured shocks, particularly if slack is considered an ex ante mechanism.2
At this point it is worth drawing attention to the authors’ data on Euro-peans’ use of coping mechanisms. It would have been nice if the authors had used the differences in frictions and in policies across countries to identify
2. A few exceptions do exist. Krueger and Perri (2006) posit and offer evidence that financial markets have evolved to provide insurance where precautionary savings is incom-plete. Athreya, Tam, and Young (2009) contend that because income risk worsens a household’s credit prospects, those households that need consumption insurance the most (the unlucky) are unable to access credit. Iacoviello (2008) shows that the standard deviation of income and the percent of debt scaled by disposable income move together at long frequencies and that income growth and debt growth move largely in parallel at annual frequencies.

comments and discussion 139
how individuals in different countries make trade-offs in planning for and in reacting to shocks. I would like to know what it is about different income generation, saving, borrowing, or spending processes that feed into finan-cial fragility and coping. Labor and pensions are perhaps obvious examples. In European countries where labor markets are less flexible, are households less financially fragile? In countries where pensions are provided by the government, so that the building of assets for retirement is less important, are the bridge mechanisms more important? Or does savings liquidity then matter more, since people cannot rebalance assets? These questions are intended to be provocative, suggesting that more work remains to be done at this micro level, particularly with respect to the relationships between coping mechanisms and social safety net policies.
analysis of coping methods. My remaining points concern the paper’s analysis of the tabulated data. The abstract of the paper organizes the flow beautifully as follows: tabulate the degree of self-reported ability to cope, tabulate the mechanisms of coping, and then investigate what coping mech-anisms different groups of people use beyond savings. I think, however, that the paper would have benefited from some additional (or alternative) analy-sis aimed at understanding more precisely how people cope with shocks beyond using savings.
The paper estimates probit regressions specifying use of each of the coping categories in the authors’ classification (savings, family and friends, mainstream credit, alternative credit, selling things, and working more) as a function of a rich set of economic and demographic variables (income, wealth, change in wealth, education, age, sex, race, marital status, house-hold structure, and region). The results provide evidence of a hierarchy of coping methods, in which savings (the cheapest form of finance) comes first, followed by family borrowing. The paper then relates this hierarchy to the corporate finance concept of a “pecking order” of financing sources. I find this comparison interesting, but I think it comes at the expense of other takeaways. I would have preferred to see the authors provide an upfront frame of categorizing people into income categories and report evidence about how each copes. As presented, the results make it hard to confirm the generalizations made in the introduction about the middle class being unable to cope.
The other analysis I found missing is a way to tie who, in terms of demographics, is unable to cope to how they cope. (And what really does “not coping” mean? People must cope somehow. How do they do it?) As a start, I would have liked to know the distribution of coping mechanisms once savings is removed. Then I would like to understand the relative

140 Brookings Papers on Economic Activity, spring 2011
roles of coping mechanisms when people say that they struggle to cope. By showing what mechanisms are used by people with different abilities to cope, and then by relating these demographics to the mechanisms, the authors might have contributed more to our understanding of financial fragility.
conclusions. I learned two important facts from this paper: that half of Americans are not in a position to cope with a quick expense shock of $2,000, and that a comprehensive tabulation of the actual use of coping mechanisms includes many that are expected (such as drawing down savings) and many that are unexpected (such as credit cards, selling nonhousing posses-sions, borrowing from family, earning more), but also excludes some that might have been expected (rebalancing everything else, including home equity). I only wish that the paper had refocused its analyses on under-standing the importance of different mechanisms for the least well off and for the middle class, and that the paper had offered insights as to how the self-reported degree of coping relates to the mechanisms used and further to the mechanisms available. These authors are certainly well positioned, not only from the work they report here but also from their previous work, to educate the reader a bit more about financial fragility.
references for the morse comment
Agarwal, Sumit, Paige Marta Skiba, and Jeremy Tobacman. 2009. “Payday Loans and Credit Cards: New Liquidity and Credit Scoring Puzzles?” American Eco-nomic Review 99, no. 2: 412–17.
Athreya, Kartik, Xuan S. Tam, and Eric R. Young. 2009. “Unsecured Credit Markets Are Not Insurance Markets.” Journal of Monetary Economics 56, no. 1: 83–103.
Attanasio, Orazio, and Steven J. Davis. 1996. “Relative Wage Movements and the Distribution of Consumption.” Journal of Political Economy 104, no. 6: 1227–62.
Blundell, Richard, Luigi Pistaferri, and Ian Preston. 2008. “Consumption Inequality and Partial Insurance.” American Economic Review 98, no. 5: 1887–1921.
Carroll, Christopher D. 1997. “Buffer-Stock Saving and the Life Cycle/Permanent Income Hypothesis.” Quarterly Journal of Economics 112, no. 1: 1–55.
Carroll, Christopher D., and Andrew A. Samwick. 1998. “How Important Is Pre-cautionary Saving?” Review of Economics and Statistics 80, no. 3: 410–19.
Cochrane, John H. 1991. “A Simple Test of Consumption Insurance.” Journal of Political Economy 99, no. 5: 957–76.
Deaton, Angus. 1992. Understanding Consumption. Oxford University Press.Iacoviello, Matteo. 2008. “Household Debt and Income Inequality: 1963–2003.”
Journal of Money, Credit and Banking 40, no. 5: 929–65.Krueger, Dirk, and Fabrizio Perri. 2006. “Does Income Inequality Lead to Con-
sumption Inequality? Evidence and Theory.” Review of Economic Studies 73, no. 1: 163–93.

comments and discussion 141
Shore, Stephen H., and Todd Sinai. 2010. “Commitment, Risk, and Consumption: Do Birds of a Feather Have Bigger Nests?” Review of Economics and Statistics 92, no. 2: 408–24.
Stango, Victor, and Jonathan Zinman. 2009. “What Do Consumers Really Pay on Their Checking and Credit Card Accounts? Explicit, Implicit, and Avoidable Costs.” American Economic Review 99, no. 2: 424–29.
Comment ByKARen m. PenCe1 “How confident are you that you could come up with $2,000 if an unexpected need arose within the next month?” Annamaria Lusardi, Daniel Schneider, and Peter Tufano posed this question to more than 9,000 individuals in the United States and seven other Western coun-tries in an Internet survey conducted by TNS Global between June and September 2009. The answers, reported in this paper, suggest a surprisingly high level of financial fragility: half of U.S. respondents reported that they would “probably not” or “certainly not” be able to meet such an emergent financial need. About half of British, German, and Portuguese respondents also reported that they probably or certainly could not cope with such a shock, along with smaller shares of Italian, Canadian, French, and Dutch respondents. Even members of demographic groups generally thought to be financially secure, such as those with high levels of income, education, or financial assets, often said they perceived difficulty in coping with a $2,000 shock.
Among individuals who have some capacity to cope with shocks, “savings” was the most frequently mentioned source of funds, followed by “friends and family” and “mainstream credit.” This result holds, for the most part, in all eight countries. For the United States, the authors also explore the coping strategies of different demographic groups. “Savings” tends to be mentioned more frequently by individuals with more income, more financial assets, and at least some confidence in their ability to cope with shocks. In contrast, “friends and family” is mentioned more frequently by individuals with low income or low financial assets as well as those who suspect that they would probably be unable to cope with the shock.
Assessing households’ ability to weather shocks is essential for gaug-ing household well-being. The finding that half of Americans could have
1. The views in this discussion are the author’s alone and do not necessarily represent the views of the Board of Governors of the Federal Reserve System, its members, or its staff. I thank Katherine Hayden for capable research assistance and Brian Bucks, Ben Keys, and Michael Palumbo for helpful discussions.

142 Brookings Papers on Economic Activity, spring 2011
difficulty raising $2,000 to meet a financial emergency calls into question households’ ability to manage their finances, as well as the design of the social safety net. Households’ ability to weather shocks may also have implications for other sectors of the economy. To give just one example, Nathan Anderson and Jane Dokko (2011) show that mortgage borrowers who experience a shock in the form of an unexpectedly large property tax bill are subsequently more likely to default on their mortgages. In large enough numbers, such defaults can depress house prices, weaken commu-nities, and weigh on the financial system, in addition to being devastating for the households involved.
Given the importance of the topic, verifying and validating the results in this paper is crucial. As an initial step, I compared the authors’ results with data from the 2009 wave of the 2007–09 Survey of Consumer Finances (SCF) panel.2 Although the SCF is normally a cross-sectional survey, the Federal Reserve Board authorized a reinterview of the 2007 SCF cross-section respondents in 2009 in order to gather data on the effects of the recession on household finances. The reinterviews were conducted between July 2009 and January 2010, and almost 89 percent of households in the 2007 survey participated.
The SCF is considered the best source of information on U.S. household wealth, as it contains a rich array of measures of household wealth and financial well-being. To gauge the share of households who, according to the SCF data, could not come up with $2,000 in an emergency, I tabulated several measures of financial capacity. I began with two measures of whether households have $3,000 or less in savings. (I assume throughout that a $1,000 buffer is needed beyond the $2,000 shock.) The first measure is liquid savings: checking, savings, and money market accounts as well as call accounts at brokerages. A second measure of “broader savings” adds to liquid savings the sum of mutual funds, stocks, bonds, the cash value of whole life insurance, and one-third of the value of home equity, certificates of deposit, and “liquid” tax-favored retirement accounts such as 401(k)s that the accountholder can borrow against.3 To assess households’ access to the credit markets, I tabulate the share of households who have $3,000 or less of unused capacity on their credit cards, as well as the share who may have more limited access to the formal credit markets, as measured by
2. I am very grateful to Brian Bucks for devising these measures and tabulating the 2009 data. As of this writing (June 2011), data from the panel survey have not been released to the public. More results from the survey are available in Bricker and others (2011).
3. The definition of this broader measure draws upon somewhat similar measures in Bucks (forthcoming) and Kennickell and Lusardi (2004).

comments and discussion 143
having been turned down for credit or discouraged from applying for credit in the last 2 years. To assess the extent of support from friends or family, I tabulate the share who said they could not borrow $3,000 or more from friends or family in an emergency.
Under the hierarchy of coping methods outlined by the authors, house-holds generally first manage an unexpected need by tapping their savings. According to the 2009 SCF, almost half of households had less than $3,000 in liquid savings, and 20 percent had less than $3,000 in broader savings (table 1). These estimates are in line with the authors’ finding that half of respondents believed that they certainly or probably could not cope with an unexpected need, and one quarter believed that they certainly could not cope.
However, many households in the authors’ study also anticipated turning to mainstream credit or friends and family for help. When these channels are taken into account, the share of SCF households who appear financially fragile is considerably lower: 41 percent of households had less than $3,000 in unused capacity on their credit cards; 23 percent had been turned down for credit or discouraged from applying in the last 2 years; and 36 percent believed that they could not borrow $3,000 from family or friends in the case of an emergency. The share of SCF households who could not meet a shock from either savings, mainstream credit, or friends and family is quite small: 9 percent of households using the liquid savings measure and 5 percent using the broader savings measure.
As a further exercise in validation, I focus on households with income exceeding $150,000 per year and households headed by a person with at least some graduate education. In the authors’ study, 10 percent of respondents with incomes of $150,000 or more and 11 percent of respondents with a graduate education reported that they certainly could not cope with a $2,000 shock, and somewhat larger fractions reported either that they certainly could not or that they probably could not cope. However, the SCF data suggest that the overwhelming majority of households with these attributes have ample access to savings, mainstream credit, and help from friends and family in the event of an unexpected need. In fact, for practical purposes all of these high-income or highly educated households had access to at least one of these sources of funds.
The differences between my results using the SCF data and the authors’ results using the TNS data may stem from differences in the survey designs. The SCF is designed to be nationally representative and has a response rate of around 60 percent, whereas the TNS sample is a con-venience sample of Internet users and has a response rate of less than

144 Brookings Papers on Economic Activity, spring 2011
20 percent. The authors’ results may be biased if the respondents’ assess-ment of their financial fragility differs systematically from that of Amer-icans overall in a manner not captured by the survey weights. To assess this concern more fully, it would be useful to have more information on the TNS sample methodology.
Respondents’ differing interpretations of “coming up with $2,000 in the next month” may also shade the results. For example, some respondents
table 1. shares of households without access to savings or creditPercent
Households Household with annual head has All income over some graduate households $150,000 education
SavingsLiquid savingsa less than $3,000 47 5 17Broader savingsb less than $3,000 21 2 5
Mainstream creditUnused credit card capacity 41 6 11 less than $3,000Turned down or discouraged from 23 10 12 applying for credit
Friends and familyCould not borrow $3,000 from family 36 14 19 or friends
No liquid savings, mainstream credit, 9 0 1 or ability to borrow from family or friendsNo broader savings, mainstream credit, 5 0 1 or ability to borrow from family or friends
Memoranda (from Lusardi and others, this volume):Share of respondents who “certainly” 28 10 11 could not come up with $2,000 in 30 daysShare who “certainly” or “probably” 50 15 23 could not come up with $2,000 in 30 days
Source: Author’s tabulations from the 2009 Survey of Consumer Finances panel; Lusardi and others, this volume.
a. Sum of balances in checking, savings, money market accounts, and call accounts at brokerages.b. Liquid savings (note a) plus mutual funds, stocks, bonds, cash value of whole life insurance, and one-
third of the value of home equity, certificates of deposit, and tax-sheltered retirement accounts against which the accountholder can borrow.

comments and discussion 145
may worry that liquidating an investment or obtaining a loan will take more than 30 days. Other respondents may so dread the thought of asking family members for help that they ruled it out in responding to the survey, but would ask in a true emergency. More generally, respondents may envision quite different scenarios when asked about a hypothetical need to come up with $2,000.
Finally, the differences in results may reflect the difference between households’ perceptions of their financial fragility and their actual situations. Households likely had a heightened sense of their financial fragility in the second half of 2009, as unemployment continued to rise and memories of extraordinary stock and home price declines remained fresh. Indeed, Jesse Bricker and others (2011) document that households’ desired levels of precautionary savings rose over the 2007–09 period. For some policy questions, this measure of perceived financial fragility may be the most appropriate.
In conclusion, I suspect that the authors’ headline finding that half of Americans probably or certainly could not manage a $2,000 shock may overstate the extent of household financial fragility. The SCF data sug-gest that a much smaller share of U.S. households, around 5 to 10 per-cent, would be unable to obtain that sum through savings, mainstream credit, or family and friends. But the authors have clearly tapped into a deep underlying worry on the part of households about their financial fragility. The authors rightly conclude their paper with a list of questions for future research. I hope very much that researchers accept the paper’s challenge.
references for the pence comment
Anderson, Nathan B., and Jane K. Dokko. 2011. “Liquidity Problems and Early Payment Default among Subprime Mortgages.” Finance and Economics Dis-cussion Series no. 2011-09. Washington: Federal Reserve Board.
Bricker, Jesse, Brian Bucks, Arthur Kennickell, Traci Mach, and Kevin Moore. 2011. “Surveying the Aftermath of the Storm: Changes in Family Finances from 2007 to 2009.” Finance and Economics Discussion Series no. 2011-17. Washington: Federal Reserve Board.
Bucks, Brian. Forthcoming. “Out of Balance? Financial Distress in U.S. Households.” In Broke: How Debt Bankrupts the Middle Class, edited by Katherine Porter. Stanford University Press.
Kennickell, Arthur, and Annamaria Lusardi. 2004. “Disentangling the Importance of the Precautionary Saving Motive.” Working Paper no. 10888. Cambridge, Mass.: National Bureau of Economic Research.

146 Brookings Papers on Economic Activity, spring 2011
GeneRAL DISCUSSIon Robert Hall said he regarded the paper’s topic as absolutely central to understanding what was happening in the U.S. and other major economies today. What it showed was that a large fraction of households are at a corner solution in their intertemporal allocation of consumption, so that their consumption is effectively controlled by their lenders. Thus, what matters for these households is not their total debt burden—the focus of so much macroeconomic analysis—but rather their debt-servicing ability. Gauti Eggertsson and Paul Krugman in a recent paper, and Hall himself in a paper in the April American Economic Review, showed that the immediate result of the recent deleveraging of the financial sector was to reverse the direction of financial flows with respect to these liquidity-constrained households: lenders no longer finance the growth of their consumption but instead squeeze their consumption by requiring repayment of debt. After that, what Hall called a “migraine effect” emerges: as the constraint is relaxed and these households’ consumption again starts to grow, the consumption of participants in asset markets has to shrink over time, and that necessarily implies negative real interest rates. Just as high real rates occur when unconstrained households are deferring consumption and thus letting it grow over time, so low and even negative rates occur when those households are consuming unusually large amounts—to make up for the temporarily depressed consumption of constrained households. This, in Hall’s view, was the source of the zero-lower-bound constraint to which the economy is subject today.
Hall also pointed out that data from the Survey of Consumer Finances provides a sense of households’ ability to cope with a financial emergency. The survey asks whether households are able to finance two months of consumption out of available financial capacity, including lines of credit. More than three-quarters of U.S. households, accounting for about half of aggregate consumption, could not cope by that definition, Hall reported. Many of those households earn more than $300,000 a year, and most of those are relatively young.
Finally, Hall thought the flip side of the authors’ question worth con-sidering: what do people do when they receive a large cash windfall? He mentioned that a recent paper by Jonathan Parker and coauthors found that the 2008 tax rebate was a huge stimulus to the purchase of automobiles: many recipients used their rebate check to make a down payment on a car. Related evidence comes from a 2009 paper in the American Economic Review by William Adams, Liran Einav, and Jonathan Levin, showing that highly constrained consumers who use subprime car financing buy a disproportion-ate number of cars in February, when they receive income tax rebates.

comments and discussion 147
Donald Kohn noted that the authors’ survey had been conducted in September 2009, when the effects of the crisis were still being strongly felt, and in particular credit availability had been sharply cut back. That suggested that those households previously dependent on home equity lines of credit to finance their consumption, and especially those with unemployed members, would likely have already drawn down much of any savings they had. He therefore questioned whether the results were indicative of the steady state. Over time, credit should again become more widely available, and homeowners will accumulate more home equity against which to borrow.
Following up on Adair Morse’s comment, Kohn wondered whether the authors had investigated what happened to households when the hypothetical emergency actually occurred. Kohn surmised that in the event many people would come up with coping mechanisms that they had not identified ex ante.
Ricardo Reis posed Kohn’s question in a different way: what did respon-dents actually mean when they said they could not come up with $2,000 in an emergency? Did they mean it literally, or did they mean that coming up with the money was doable but costly in terms of their overall utility? In other words, could they in fact come up with the money, but only in a way that involved considerable pain and sacrifice? Reis observed that people become habituated to a certain level of income and have particular reference points for what they think their income should be. For example, a young couple on the Upper West Side of New York City making $300,000 a year might well say that they could not come up with $2,000 immediately, when in fact they clearly could if they had to. That would mean, however, giving up things that they have come to identify with their well-being.
From that perspective, Reis found it noteworthy that a key threshold seemed to occur in the authors’ data at about $60,000 in annual income. Below that level, and likewise beyond around $70,000, the answers to the survey question change little as income rises. One could plausibly reinterpret that finding as saying that $60,000 a year is a common reference point, a level that many Americans view as a minimum for sustaining a middle-class lifestyle. An emergency that pushes them below that threshold is thus in a sense more painful than one that reduces their income by a comparable amount but leaves them above the threshold.
Laurence Ball suggested that one way to distinguish between coping and not coping would be whether, in the event, the household actually did without the good or service in question, or whether they received it but somehow avoided having to pay for it.
Robert Pozen agreed that the respondents’ answers were ambiguous and suggested that the problem could be avoided by restructuring the

148 Brookings Papers on Economic Activity, spring 2011
questionnaire. One could first mention each of a number of last-resort coping mechanisms and ask whether the respondent could or would use them, and only then ask whether the respondent believes that he or she could not muster the $2,000. Such an approach might result in quite different pro-portions of respondents saying that they could or could not cope, and the distribution of coping mechanisms used might change as well.
Pozen also asked whether the authors’ setup addressed only what house-holds would do in response to a single, unrepeated financial shock, or whether it also covered the case where households take into account that an initial shock might be followed by others. In the first case, a household might choose to draw down its savings immediately, whereas in the second it might prefer to borrow first and reserve the savings to use as a last resort.
David Romer saw the paper as demonstrating that the standard notion of the representative consumer as one who optimizes utility along a straight-forward intertemporal trade-off between consumption and saving, perhaps with some liquidity constraints, simply does not apply to the majority of households and may not apply to a large part of aggregate consumption. He also observed that among those in the authors’ sample who said they could come up with $2,000, 19 percent gave pawning their possessions as one of the coping mechanisms they would use. That to Romer seemed a very concrete indicator of financial fragility.
Romer also proposed that in future work the authors conduct more in-depth interviews with a small sample of respondents, further detailing the hypothetical scenario and asking what specific actions they would or would not take. From the richer understanding that Romer believed would emerge, the authors could then redesign and repeat the survey so as to learn still more from the larger sample. He thought that the issues already being brought to light by the study made such a follow-on investigation well worth doing.
Robert Gordon said that the $2,000 figure seemed very low: just one month’s income for a household earning about $24,000 a year, and only two weeks’ income for one with a more typical annual income of $48,000. The responses therefore probably understated households’ true financial fragility. Hall’s criterion of two months of consumption came closer to the mark, in Gordon’s view.
Gordon was also curious to know more about how and to what extent households in financial stress draw on their retirement assets. Holders of tax-favored retirement accounts today typically pay a penalty on premature withdrawals, on top of the usual income tax due. Reinforcing Romer’s doubt that the intertemporal trade-off between consumption and saving applies
comments and discussion 149
to most consumers, Gordon pointed out that this trade-off, in the form of the Euler equation, is at the heart of every dynamic stochastic equilibrium model, the most frequently used tool in modern macroeconomics. The irrelevance of that form of consumption behavior for most households brings into question the relevance of such models for business cycle analysis.
Finally, Gordon recalled that when he was a young economist recently graduated from MIT, he was naturally a strong believer in the life-cycle con-sumption hypothesis. Accordingly, he borrowed to the hilt so as to smooth his consumption across what he expected to be a mostly affluent lifetime, even though, at the time, doing so moved him close to the financial brink. That a Ph.D. economist would engage in such behavior suggested that it was not necessarily involuntary or irrational.
Janice Eberly noted that delaying scheduled payments past their due dates is potentially an important source of informal credit for households on the financial edge, but one not covered in the authors’ survey. It is an expensive source of credit, given the high interest rates and penalties that usually apply, but an easily available one—no loan application is required. One can think of delaying payments as the household equivalent of trade credit.
Recalling Karen Pence’s observation that the friends and family of people under financial stress tend to be financially stressed themselves, Eberly mentioned an additional perverse disincentive against saving that may affect such households: a recent paper by researchers at the Federal Reserve Bank of Chicago found that one reason low-income households do not save as much as they could is that they perceive that their friends and family members would then want to borrow from them. The result is an equilibrium in which no one saves and all remain on the financial precipice.
James Stock remarked that the paper’s findings on the consumption side were even more striking when one considers recent results from studies of micro-level data on household income. These studies, for example a recent one by Richard Blundell and coauthors, find that unpredictable fluctuations in income far exceeding $2,000 are quite common.
Stock suggested that the micro data could also be useful in answering the complementary question, which others had raised, of what people do when actually confronted with the hypothesized financial emergency. The micro data could be used to reveal how people’s consumption responds to a given shock. Such an investigation would require somehow merging, for example, auto accident databases with data from the Survey of Consumer Finances—a challenging task, Stock admitted.
Gregory Mankiw cited two examples that he found illuminating, one fictional and one from real life, of high-income individuals whose liquid

150 Brookings Papers on Economic Activity, spring 2011
savings were a small fraction of their annual consumption. The first was Sherman McCoy, the central character of Tom Wolfe’s Bonfire of the Vanities, a millionaire bond trader whose fast life ends in financial ruin. The second was Sonia Sotomayor, whose financial disclosure forms at the time of her Supreme Court nomination revealed that despite being a success-ful lawyer and judge for many years, she had accumulated remarkably little in the way of financial assets. Also supporting the finding that many high-income households are financially vulnerable was a paper by Steven Venti and David Wise showing that the assets of new retirees are only weakly correlated with their income during their working years. All this suggested to Mankiw that whereas economists tend to think of heterogeneity in terms of the spectrum from rich to poor, another dimension that economic models should perhaps take into account is that from frugal to spendthrift. Income and frugality may correlate to some extent, but perhaps not strongly.
Justin Wolfers raised a possible methodological concern. All surveys of any length are susceptible to error introduced by respondents who answer questions in a way that they believe will lead to fewer follow-up questions and thus get them through the survey more quickly. When results are reported in terms of correlations, this “button-mashing” behavior is less of a problem, because the invalid answers are distributed randomly, and thus one can assume that the result understates the true value. In this paper, however, the results of interest are means. It could be that some of the 50 percent who report that they could not raise the $2,000 are simply button-mashing, in which case the true mean could be lower.
Alan Krueger noted that the survey that he and Andreas Mueller had conducted for their paper in this volume included some questions that were similar to those asked by Lusardi and her coauthors. One was whether the respondents (who in the Krueger and Mueller study were all unemployed) were selling off durable goods; the results showed that strikingly few were. Another noteworthy finding was that only about 15 percent of the group had more than $10,000 in liquid assets. The Krueger and Mueller sur-vey also asked specifically whether respondents could raise $5,000 in an emergency, and the results were similar to those in the present paper: about three-quarters indicated either that they could not or that they probably could not. What was remarkable, however, was that many weeks later (the study followed respondents for up to 24 weeks) that percentage was little changed. This was consistent with Pozen’s conjecture that shocks do not come not singly but rather tend to be serial.