Embed Size (px)
Citation preview
Financialisation Risks and Economic Performance Jérôme Creel, Paul Hubert, Fabien Labondance
SCIENCES PO OFCE WORKING PAPER n° 21, 2017/10/17

EDITORIAL BOARD
Chair: Xavier Ragot (Sciences Po, OFCE)
Members: Jérôme Creel (Sciences Po, OFCE), Eric Heyer (Sciences Po, OFCE), Lionel Nesta (Université Nice Sophia Antipolis), Xavier Timbeau (Sciences Po, OFCE)
CONTACT US
OFCE 10 place de Catalogne | 75014 Paris | France Tél. +33 1 44 18 54 24
www.ofce.fr
WORKING PAPER CITATION
This Working Paper: Jérôme Creel, Paul Hubert, Fabien Labondance, Financialisation Risks and Economic Performance, Sciences Po OFCE Working Paper, n° 21, 2017-10-17. Downloaded from URL : www.ofce.sciences-po.fr/pdf/dtravail/WP2017-21.pdf DOI - ISSN
© 2017 OFCE
ABOUT THE AUTHORS
Jérôme Creel*, OFCE, Sciences Po Paris, France and ESCP Europe Email Address: [email protected]
Paul Hubert, OFCE, Sciences Po Paris, France Email Address: [email protected]
Fabien Labondance, CRESE – Université de Franche-Comté and OFCE, Sciences Po Paris, France Email Address: [email protected]
ABSTRACT
Drawing on European Union data, this paper assesses the long-standing mainstream view that financialisation improves growth. We measure financialisation with private credit to GDP and capture characteristics of banking sector fragility with the ratio of credit to deposits and the ratio of bank capital to assets. We test the impact of these variables on four measures of economic performance: the growth rates of GDP per capita, consumption per capita, investment and inequality. We observe that credit has no effect on economic performance. However, the potential riskiness of the banking sector measured by the ratio of credit to deposits decreases GDP per capita and contributes to increasing inequality whereas the ratio of capital to assets has a negative impact on GDP per capita growth through its negative effect on investment. This effect is driven by countries with low GDP per capita. We also find that the potential side effects of excessive financialisation have a negative effect on growth.
KEY WORDS
Private Credit, Banking sector fragility, Non-Performing Loans, Bank crisis.
JEL
G10, G21, O40.
* Corresponding author: Jérôme Creel, OFCE, 10 Place de Catalogne, 75014 Paris, France; tel.: + 33 1 44 18 54 56.
2
1. Introduction
The paper aims to assess the contribution of financialisation to economic performance in the European Union (EU). We follow the definition of Epstein (2005) of the process of financialisation as “the increasing role of financial motives, financial markets, financial actors and financial institutions in the operation of domestic and international economies”. Indeed, the last three decades have seen a strong development of financialisation (see e.g. Hein et al., 2016). Meanwhile the evolution of economic performance has been uneven, not only in the EU but also in other developed countries and emerging nations. Linking the development of financialisation to economic performance has long been a mainstream view though (e.g. Levine, 2005). The argument according to which financialisation was positively related to economic growth and welfare has been key to foster reforms of the financial system. In this respect, the mainstream view promoted financial deregulation: a more liberalised system was meant to enhance savings (e.g. via the development of innovative financial products) and investment (e.g. via new financing opportunities and lower capital prices).
The global financial crisis has modified the mainstream view. Philippon and Reshef (2013) argue that “the relationship between the size of the financial sector and income is complex, that most of the rise in living standards from 1870 was obtained with less financial output and a smaller share of income spent on finance than what is observed after 1980. It also seems that at the current height of development, the relationship between financial output and income per capita may have changed”. However, the mainstream view has not entirely vanished and has grounded the promotion of macroprudential policies. The extension of bank capital buffers (e.g. capital requirements) and new mandates attributed to central banks to supervise and control commercial banks are not orthogonal to the former view. They assume that the link between financialisation and economic performance is not linear: above some thresholds, the relationship would change sign but below the thresholds, the mainstream view would remain valid.
The implementation of macroprudential policies which remain grounded on the mainstream view is important for a discussion about the future of capitalism and financialisation. As they currently stand, macroprudential policies pave the way for minor changes to the financial and banking systems, if any. The introduction of some binding ratios (e.g. solvency risk, liquidity risk) does not change the very nature of bank activities and does not limit financial innovations in the shadow banking sector which remains mostly unregulated. Besides, the US administration’s willingness to review the Dodd-Frank Act is a strong signal in favour of a return to the status quo which prevailed before the global financial crisis in both banking and financial sectors. This paper aims to show that the empirical foundations of the mainstream view are fragile. It also aims to highlight the channels through which financialisation influences the economy.
To investigate the empirical relevance of the mainstream view, we measure financialisation with private credit to GDP and add two measures of banking sector fragility: the ratio of credit to deposits and the ratio of bank capital to assets. These two variables capture two different features of banks’ balance sheets. The first one embeds the difference in maturity between assets and liabilities whereas the second one sheds light on the leverage ratio (the inverse of the capital to assets ratio). We test the impact of these variables on different measures of economic performance: the growth rates of GDP per capita, consumption per capita, investment and inequality. We restrict our attention to EU countries. Our findings show that credit has no effect on economic performance. However, the potential fragility of the banking sector measured by the ratio of credit to deposits decreases GDP per capita and
3
contributes to increasing inequality whereas the ratio of capital to assets has a negative impact on GDP per capita growth through its negative effect on investment, in countries with the lowest GDP per capita levels. We also look at the impact of some market-based measures of financialisation and of some measures of the side effects of excessive financialisation, like greater volatility, non-performing loans or more recurrent banking crises. The market-based variables do not impact GDP per capita growth, whereas the latter variables have a clear negative impact. The rest of the paper is organised as follows. Section 2 reviews the literature. Section 3 presents the empirical method and the data. In section 4, we present and discuss the results. In section 5, we conclude with some policy recommendations about de- and re-financialisation. 2. Financialisation and Economic Performance: a literature review Opposing views emerged from the literature on the links between finance and economic performance. The main arguments are exposed in Levine (2005), Ang (2008), Sawyer (2014), Cournède and Denk (2015) and Creel, Hubert and Labondance (2015). On the one hand, credit is found to be determinant in the process of economic development. The literature often recalls the Schumpeterian view that entrepreneurs need credit to finance their innovations. Banks and financial markets are then viewed as facilitators. On the other hand, finance development appears to respond to economic growth. With economic expansion, firms and households are more likely to demand financial services. According to both views, the finance-growth relationship is constrained by structural determinants such as the historical level of debt, the legal environment or the level of economic development. Advocates of the positive role of finance highlight that the development of finance induces a better allocation of resources, mobilizes savings, can reduce risks and facilitates transactions via lower transaction costs (Beck, 2015). Consequently, the financial sector is viewed as a lubricant for the economy, ensuring the emergence of innovative firms. The liberalisation of the banking and financial system emerges as a means to increase the quantity and quality of investment, in line with the arguments of McKinnon (1973) and Shaw (1973) against the “financial repression” stemming from government restrictions on the banking system. Quoting Sawyer (2014), “an increase in private capital flows would raise capital stock, productivity and investment, along with economic growth and employment. All these increase efficiency and policy discipline”. In contrast a growing number of studies shows that the link between finance and economic growth has been either exaggerated (Stiglitz, 2000; Rodrik and Subramanian, 2009) or misleading (Arestis, 2006). Arestis argues that the finance-economic growth nexus draws too much on the availability of savings and not enough on the availability of productive investment opportunities. The transition from “financial repression” to “financial liberalisation” generates an increase in the interest rate; the rise in interest rate certainly makes savings more attractive, and stimulates it; but the same rise in interest rate is also expected to reduce the demand for investment. The idea that financial liberalisation will lead to more investment and higher economic growth assumes that the sensitivity of investment to interest rates is very low and the sensitivity of savings to interest rates is high. The empirical literature cited by Sawyer (2014) does not validate this assumption.
4
Another argument has been put to the forth. De Gregorio and Guidotti (1995) argue that the link between finance and economic growth is tenuous or even non-existent in the developed countries and explain it by a threshold effect: once a certain level of economic wealth has been reached, the financial sector makes only a marginal contribution to the efficiency of investment. It abandons its role as a facilitator of economic growth in favour of its own growth. Banking and financial groups thus emerge and are “too big to fail”, enabling them to take excessive risk since they know it will most certainly be mutualised by public authorities’ interventions. Their fragility rapidly transmits to other financial and non-financial corporations, hence to the real economy. The subprime crisis is a good illustration of the magnitude of correlation and contagion across financial markets. Also in this spirit of “finance growth for itself”, Godechot (2006) has shown that the rise of bonuses in the finance industry was disconnected from efficiency arguments. He depicted it as a “hold-up”: bonuses were obtained under the threat of quitting a bank with the team of traders and moving to a competitor. Until recently, the empirical literature has kept on highlighting a positive relationship between financial development and economic growth (Bumann et al., 2013), drawing on cross-country, time series or panel studies. Cross-country studies generally find a positive effect of finance on economic performance with the notable exception of Ram (1999). King and Levine (1993) show that financial development indicators are positively associated with capital accumulation, total factor productivity growth and GDP growth. Focusing on stock markets, Demirgüç-Kunt and Maksimovic (1998) and Levine and Zervos (1998) conclude that liquid stock markets are positively related to GDP growth. These cross-country studies suffer from severe limitations though. Most of them intend to quantify whether finance affects economic performance, neglecting the reverse causality. To deal with this endogeneity bias, they use instrumental variables, but as demonstrated by Ahmed (1998), this technique is not robust when data are averaged over decades, which is usually the case in these studies. Another limit of cross-country analyses is the grouping of countries that are heterogeneous. This issue is highlighted by Ram (1999) who shows that after defining subgroups into his sample, an important parametric heterogeneity is observed. This is due to the fact that the link between finance and economic performance is mainly determined by the financial structures, the legal environment, the preferences and the policies implemented in each country (Arestis and Demetriades, 1997; Demirgüç-Kunt and Maksimovic, 1998). Time-series studies developed to counter the above-mentioned limitations. Arestis and Demetriades (1997) compare the finance-GDP growth link in Germany and in the United States. In Germany they find a relationship from finance development to real GDP, whereas the reverse causal pattern runs for the United States. Xu (2000) also provides evidence of heterogeneity across countries. Arestis et al. (2001) compare the influence of banks and stock markets across five developed countries. Their results show that both promote GDP growth, and also suggest that banks’ contribution is stronger than the stock markets’. Moreover, they point out that stock markets’ volatility has negative effects in Japan, France and the United Kingdom. It is worth acknowledging here that studies with time-series data use relatively small samples; consequently, they have to keep explanatory variables to a minimum and may therefore be subjected to an omitted variable bias. To address these issues and combine the benefits of cross-country analysis with those of time dimension, the literature moved to dynamic panel estimations. Most panel studies conclude that financial development has a positive effect on economic performance, e.g.
5
Beck et al. (2000), Rioja and Valev (2004), Rousseau and Wachtel (2000), Beck and Levine (2004) and Rajan and Zingales (1998) with industry-level data. Beck and Levine (2004), using dynamic panel data estimation, developed an empirical methodology based on Arellano and Bond (1991) that intends to take care of the endogeneity bias. They explain GDP per capita growth by means of the usual variables of the endogenous growth theory (i.e. the initial GDP per capita, the accumulation of human capital over the average years of education, government consumption, trade openness and inflation). Then they add to their model credit to the private sector and the turnover ratio as proxies of financial depth. They find that financial development impacts positively GDP growth. The turnover ratio and credit to the private sector are both significant suggesting that they complement each other. Nevertheless, the main conclusion that finance improves growth can be moderated. Calderon and Liu (2003) find that financial development generally leads to economic growth, but they show that the causality from economic growth to financial development coexists. They also find that the finance-growth link is more active in developing countries than in developed ones and that the longer the sample, the larger the effect of financial development. Loayza and Ranciere (2006) highlight that financial deepening has contrasting effects. It influences positively growth in the long run but a negative effect can be identified in the short run. Fink et al. (2009) show empirically that the finance-growth nexus depends on the country’s stage of development and on the segment (credit, stock, bond) of the financial market. Cournède and Denk (2015) show that bank credit and economic growth have a negative relationship whereas stock market capitalisation and economic growth have a positive one. Further investigation by the authors explains the first relationship by some composition effects (e.g. quality of credit, household vs. corporate credit). Prochniak and Wasiak (2017) show mixed results for a subsample of EU countries or a group of OECD countries: the growth of bank credit drives economic growth, but the level of bank credit has a negative impact. Moreover, Denk and Cournède (2015) show that higher bank credit (or stock market capitalisation) fuels income inequality. Finally, Barradas (2017) shows that financialisation in the EU contributed quite substantially to the slowdown of real private investment before the global financial crisis. His indicator of financialisation does not draw on bank credit, but on the financial receipts and payments of non-financial corporations. In an attempt to reconcile the diverging views expressed in the literature, Arcand et al. (2015) postulate a nonlinear relationship between finance and economic growth. They extend Beck and Levine (2004)’s explanatory variables by introducing the square of credit to the private sector. They show that the relationship between economic growth and private sector credit is positive, but the relationship between economic growth and the square of private sector credit (that is to say, the effect of credit to the private sector when it is at a high level) is negative. Taken together, these two factors indicate a concave relationship between economic growth and credit to the private sector: the relationship is positive up to a certain level of financial depth, and beyond a threshold, the effect of financial depth becomes negative. According to the different specifications estimated by Arcand et al. (2015), the threshold (as a percentage of GDP) lies between 80% and 100% of credit to the private sector. Cecchetti and Kharroubi (2012) come to similar results and make clear that these thresholds should not be viewed as targets, but more like “extrema” that might be reached only in times of crisis. In “normal” times, it would be better that private debt levels are lower so as to give the economies some leeway in times of crisis. Sahay et al. (2015) reach a similar bell-shaped relationship between financial development and economic growth in emerging economies. Gambacorta et al. (2014) find some non-linearities between finance and growth and study the incidence of the structure of finance: they show that during financial crises, bank-oriented economies are more severely hit than market-oriented ones. Law and
6
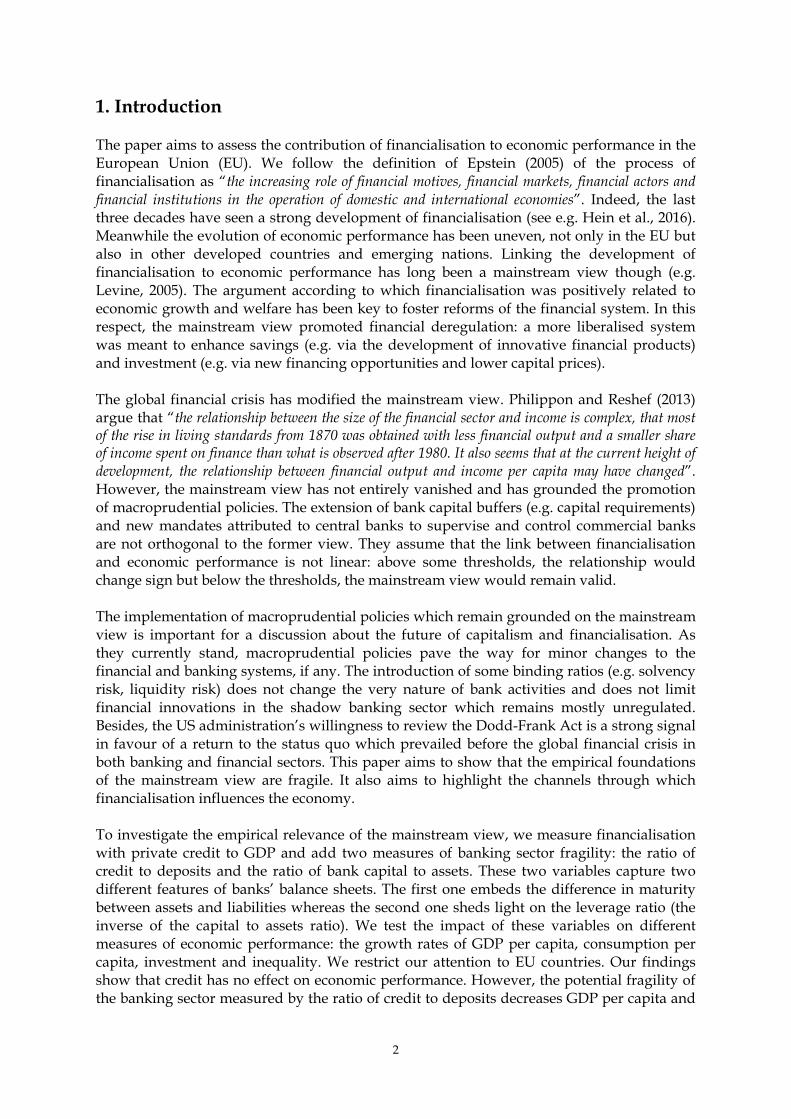
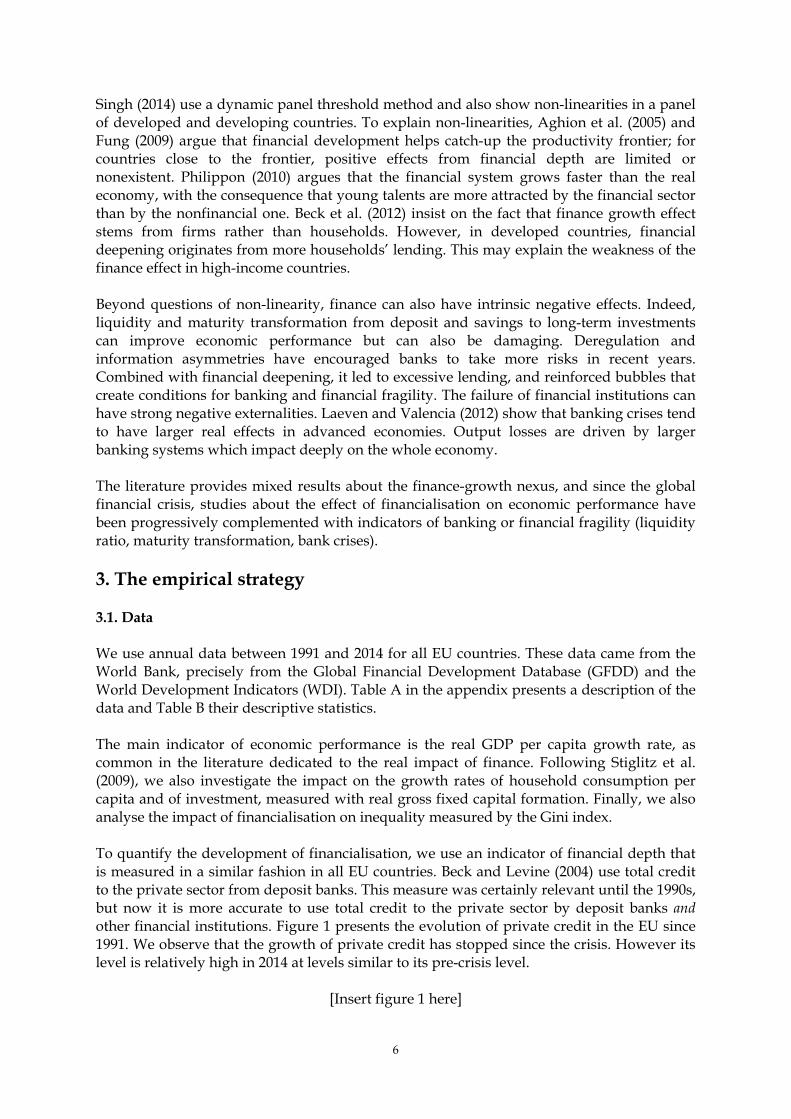
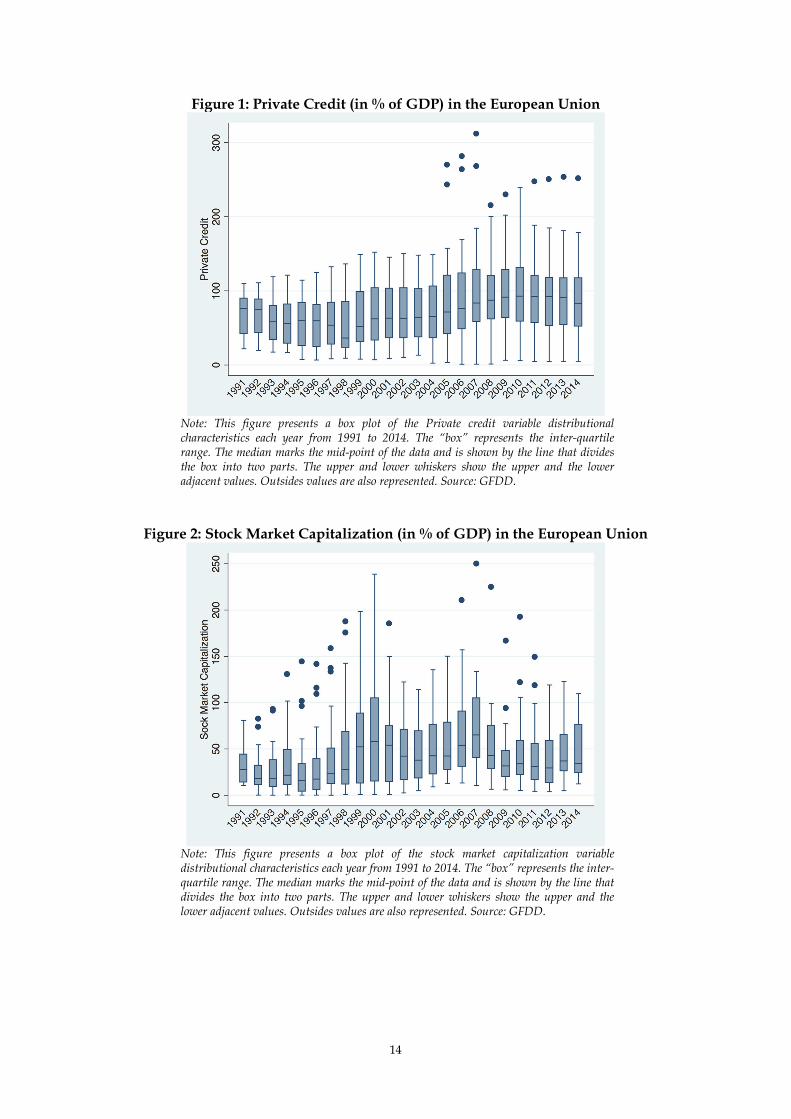
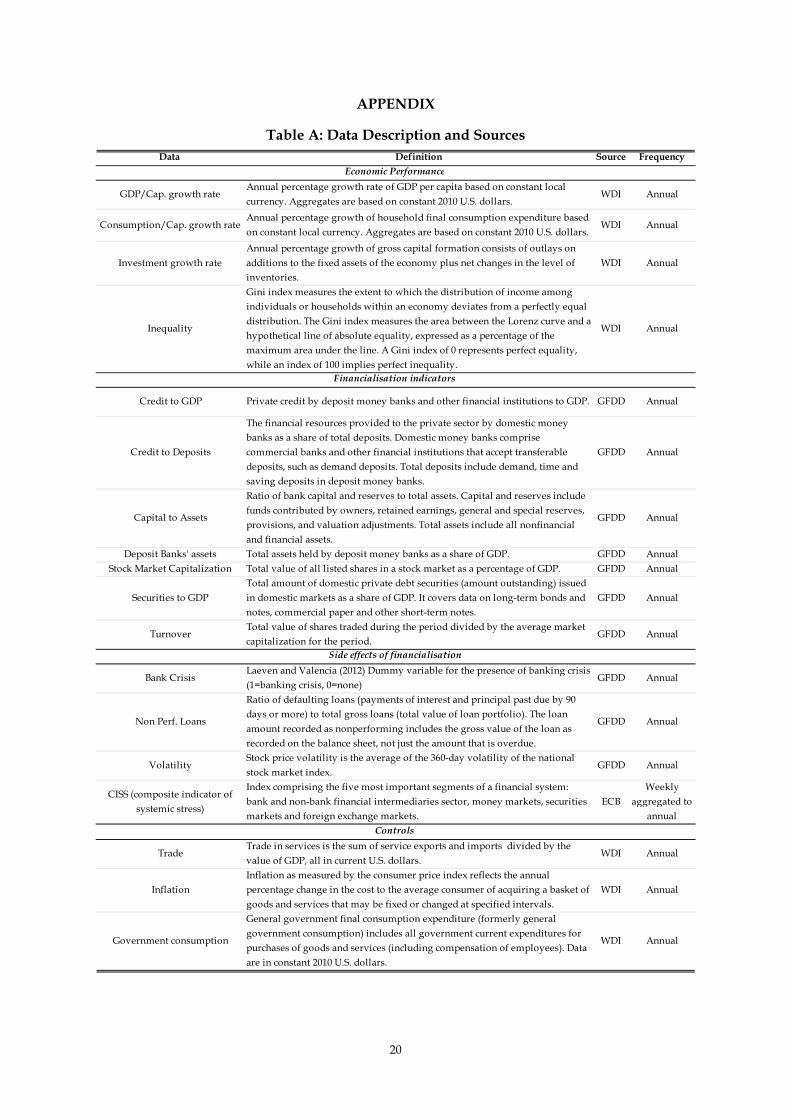
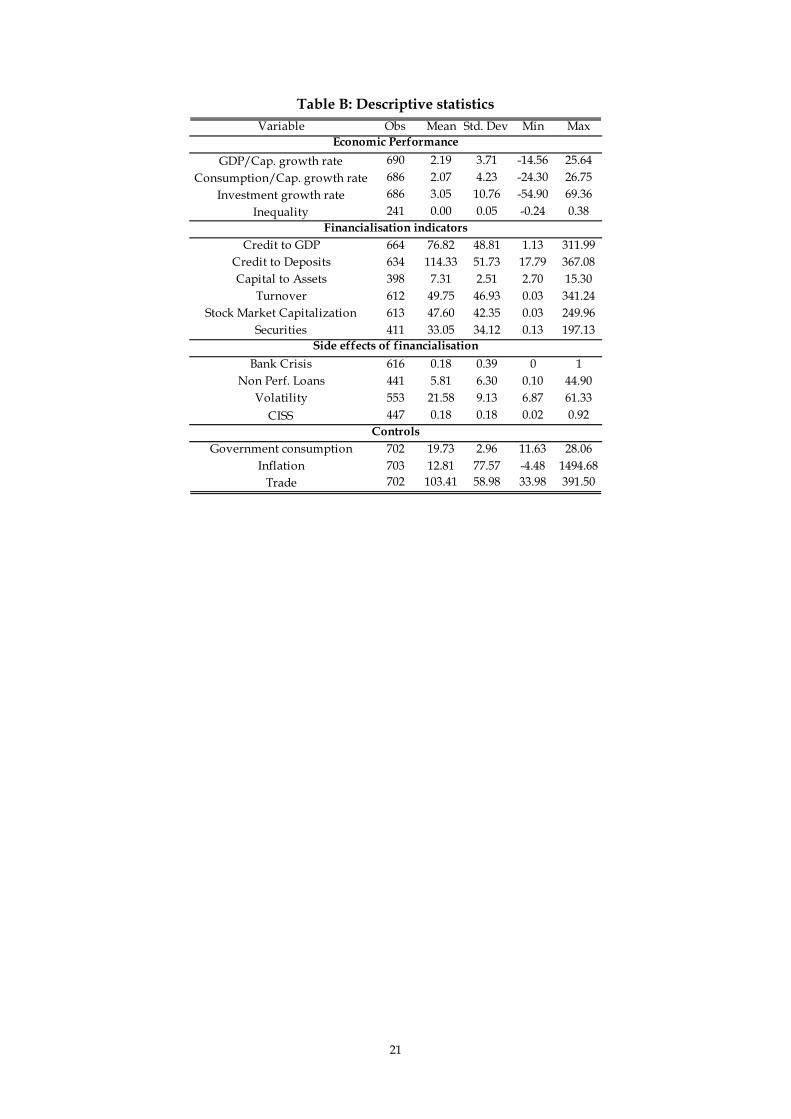
Singh (2014) use a dynamic panel threshold method and also show non-linearities in a panel of developed and developing countries. To explain non-linearities, Aghion et al. (2005) and Fung (2009) argue that financial development helps catch-up the productivity frontier; for countries close to the frontier, positive effects from financial depth are limited or nonexistent. Philippon (2010) argues that the financial system grows faster than the real economy, with the consequence that young talents are more attracted by the financial sector than by the nonfinancial one. Beck et al. (2012) insist on the fact that finance growth effect stems from firms rather than households. However, in developed countries, financial deepening originates from more households’ lending. This may explain the weakness of the finance effect in high-income countries. Beyond questions of non-linearity, finance can also have intrinsic negative effects. Indeed, liquidity and maturity transformation from deposit and savings to long-term investments can improve economic performance but can also be damaging. Deregulation and information asymmetries have encouraged banks to take more risks in recent years. Combined with financial deepening, it led to excessive lending, and reinforced bubbles that create conditions for banking and financial fragility. The failure of financial institutions can have strong negative externalities. Laeven and Valencia (2012) show that banking crises tend to have larger real effects in advanced economies. Output losses are driven by larger banking systems which impact deeply on the whole economy. The literature provides mixed results about the finance-growth nexus, and since the global financial crisis, studies about the effect of financialisation on economic performance have been progressively complemented with indicators of banking or financial fragility (liquidity ratio, maturity transformation, bank crises). 3. The empirical strategy 3.1. Data We use annual data between 1991 and 2014 for all EU countries. These data came from the World Bank, precisely from the Global Financial Development Database (GFDD) and the World Development Indicators (WDI). Table A in the appendix presents a description of the data and Table B their descriptive statistics. The main indicator of economic performance is the real GDP per capita growth rate, as common in the literature dedicated to the real impact of finance. Following Stiglitz et al. (2009), we also investigate the impact on the growth rates of household consumption per capita and of investment, measured with real gross fixed capital formation. Finally, we also analyse the impact of financialisation on inequality measured by the Gini index. To quantify the development of financialisation, we use an indicator of financial depth that is measured in a similar fashion in all EU countries. Beck and Levine (2004) use total credit to the private sector from deposit banks. This measure was certainly relevant until the 1990s, but now it is more accurate to use total credit to the private sector by deposit banks and other financial institutions. Figure 1 presents the evolution of private credit in the EU since 1991. We observe that the growth of private credit has stopped since the crisis. However its level is relatively high in 2014 at levels similar to its pre-crisis level.
[Insert figure 1 here]
7
We also use proxies of the potential fragility of the financialisation process which give some indication on risks taken by banks. The ratio of bank credit to bank deposits and the ratio of bank capital to bank assets provide complementary information on the structure of the banking sector and its resilience to negative shocks. The ratio of bank credit to bank deposit highlights the maturity risk: liabilities are short whereas assets are long. The ratio of capital to assets is the inverse of the leverage ratio of banks and is indicative of the sensitiveness of banks to balance sheet risks.
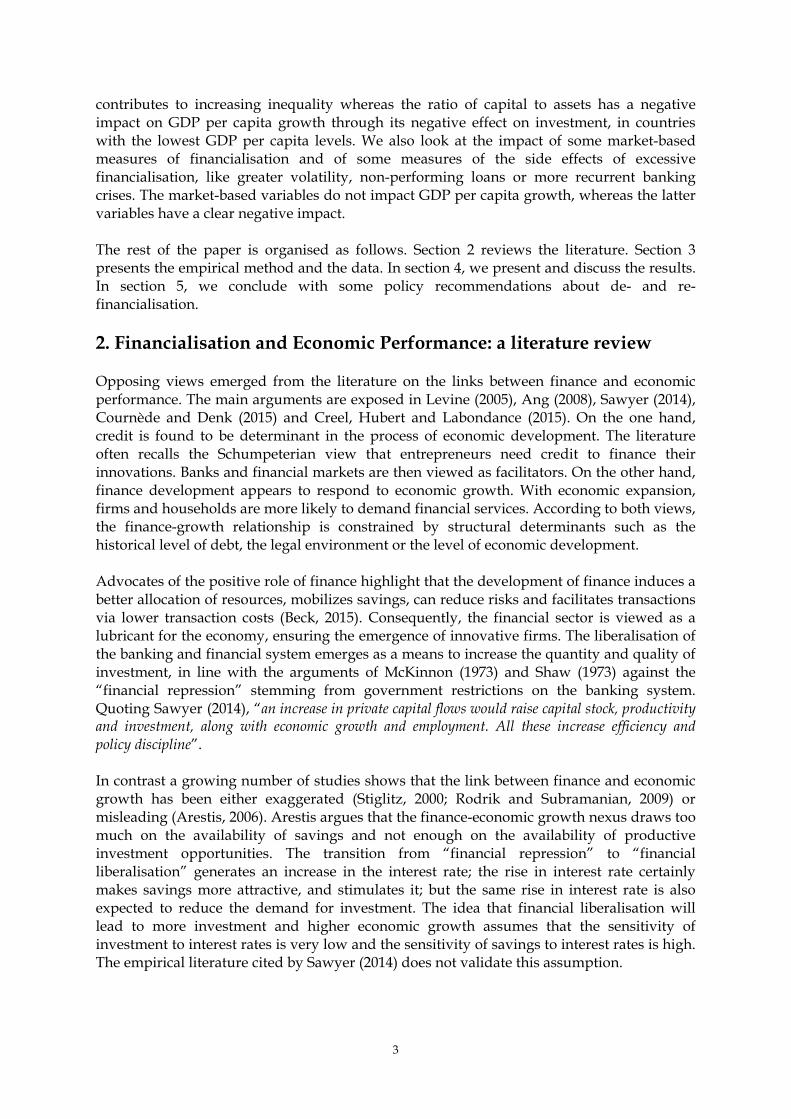
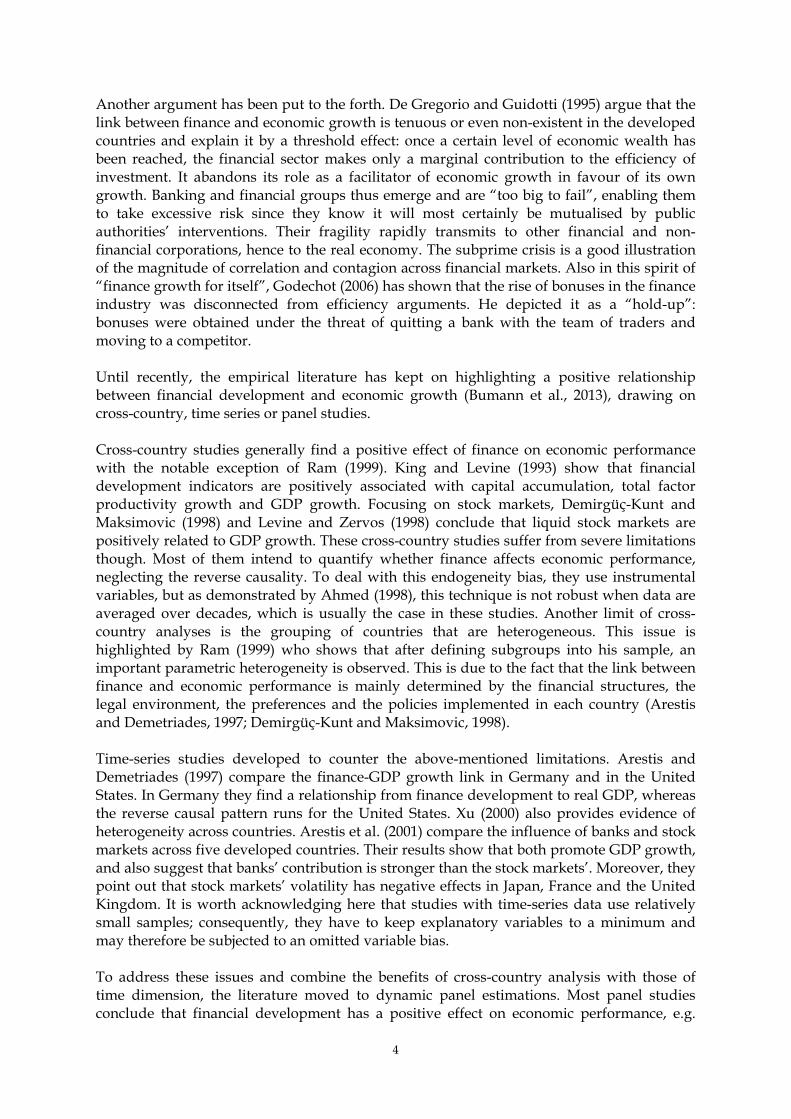
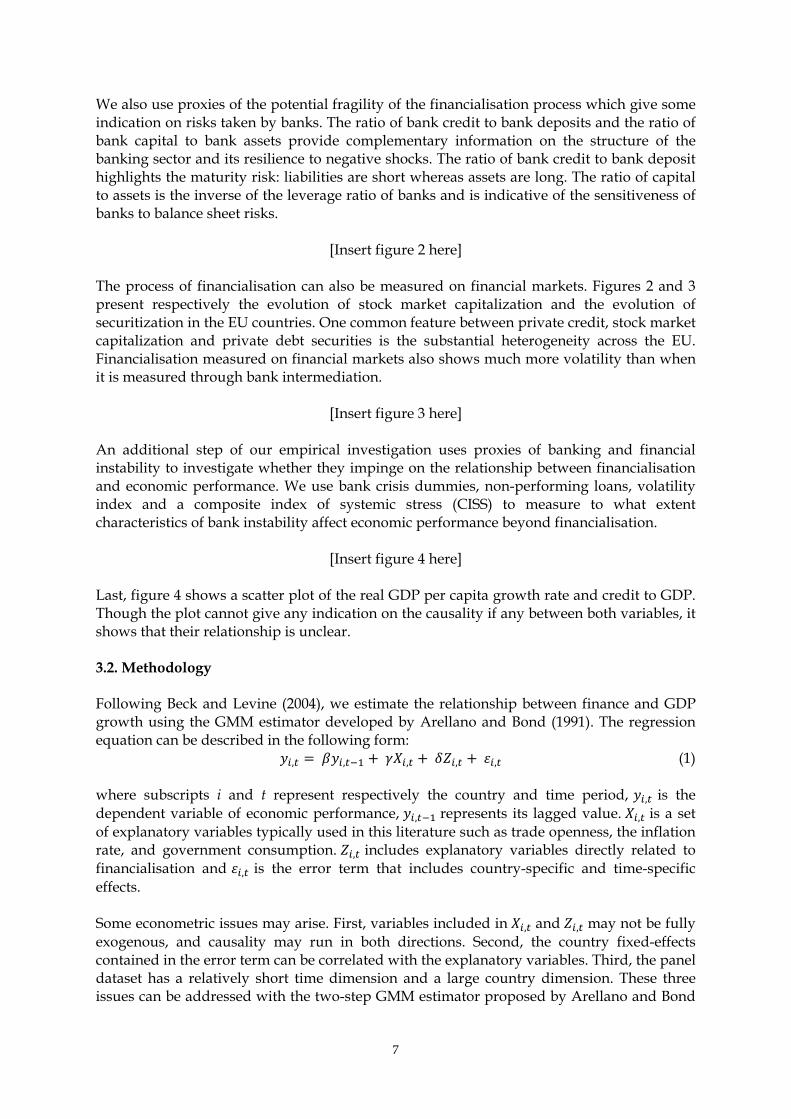
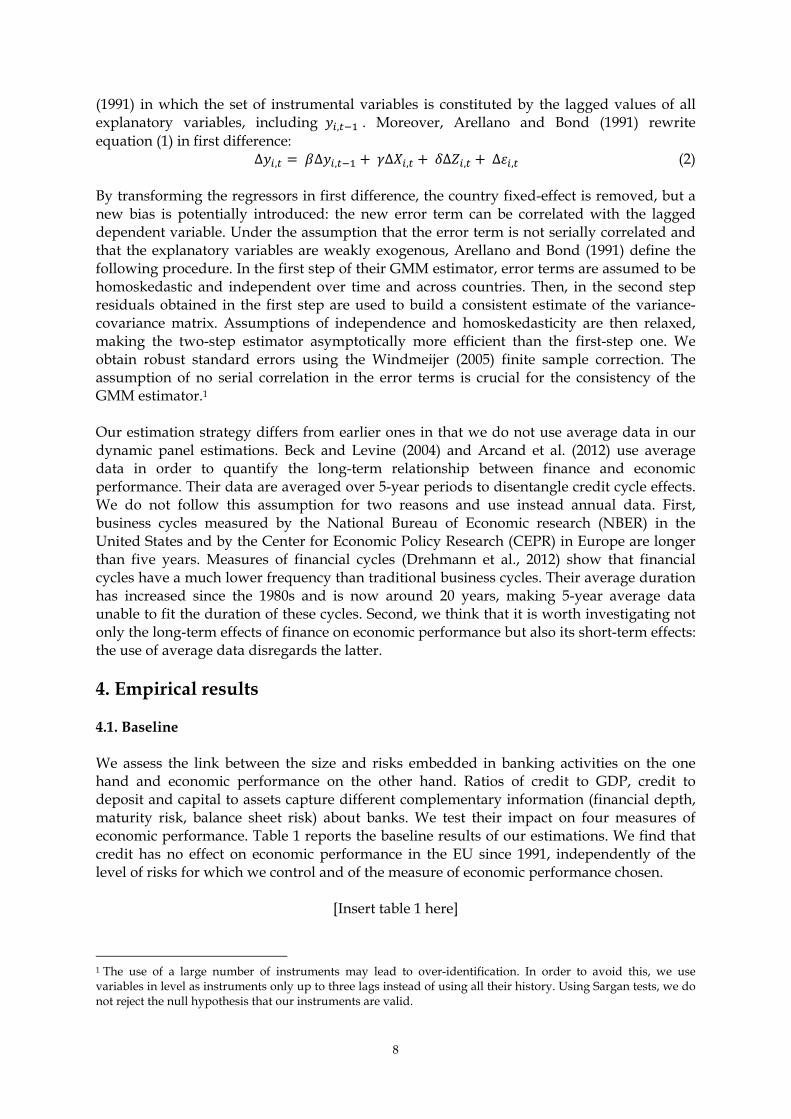
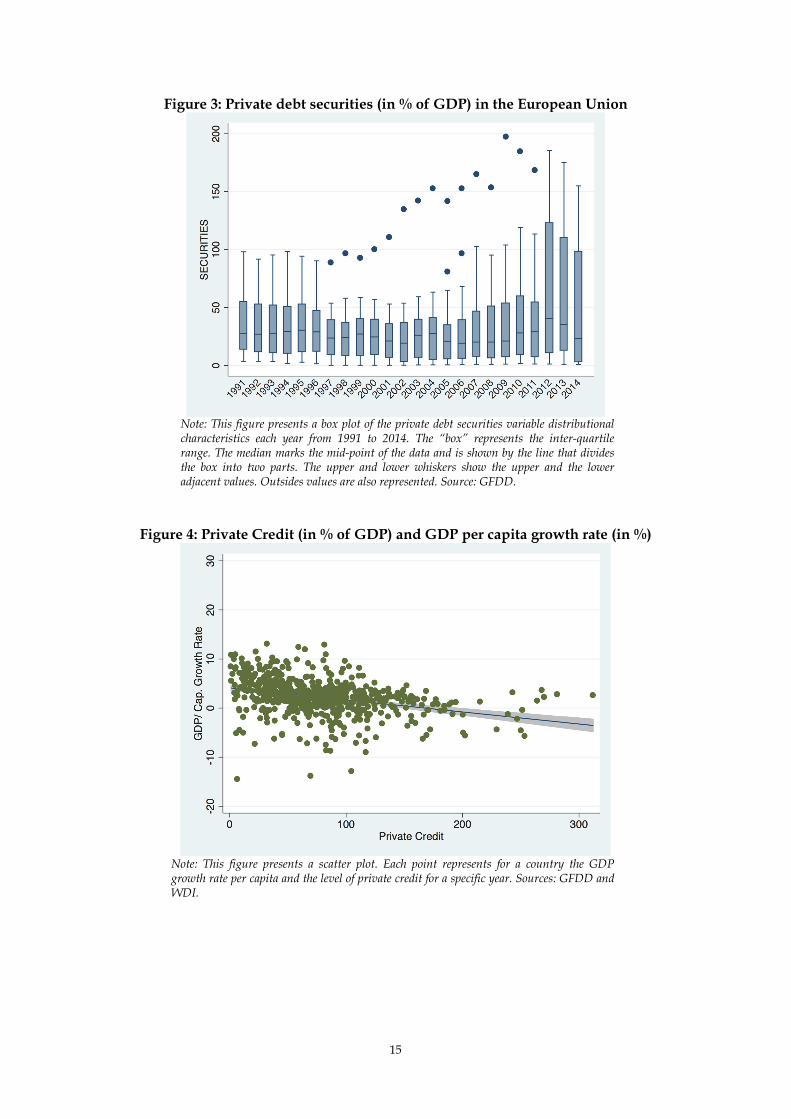
[Insert figure 2 here] The process of financialisation can also be measured on financial markets. Figures 2 and 3 present respectively the evolution of stock market capitalization and the evolution of securitization in the EU countries. One common feature between private credit, stock market capitalization and private debt securities is the substantial heterogeneity across the EU. Financialisation measured on financial markets also shows much more volatility than when it is measured through bank intermediation.
[Insert figure 3 here] An additional step of our empirical investigation uses proxies of banking and financial instability to investigate whether they impinge on the relationship between financialisation and economic performance. We use bank crisis dummies, non-performing loans, volatility index and a composite index of systemic stress (CISS) to measure to what extent characteristics of bank instability affect economic performance beyond financialisation.
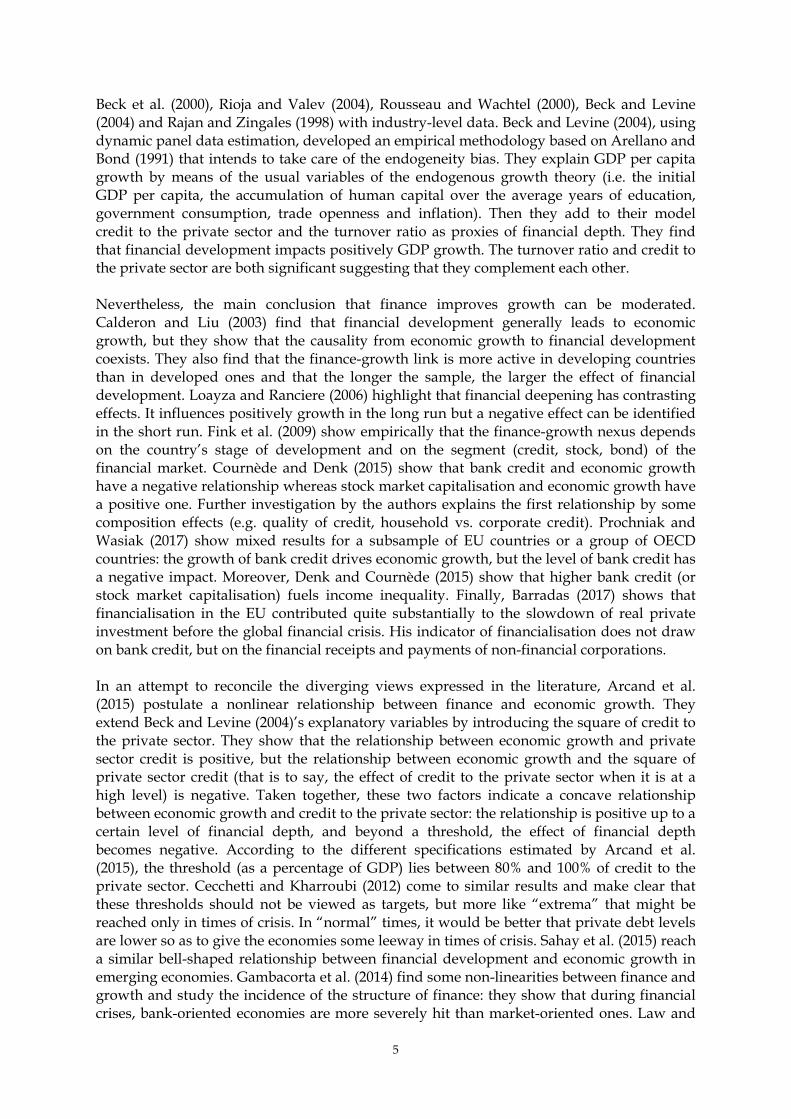
[Insert figure 4 here] Last, figure 4 shows a scatter plot of the real GDP per capita growth rate and credit to GDP. Though the plot cannot give any indication on the causality if any between both variables, it shows that their relationship is unclear. 3.2. Methodology Following Beck and Levine (2004), we estimate the relationship between finance and GDP growth using the GMM estimator developed by Arellano and Bond (1991). The regression equation can be described in the following form: , = , + , + , + , (1) where subscripts i and t represent respectively the country and time period, , is the dependent variable of economic performance, , represents its lagged value. , is a set of explanatory variables typically used in this literature such as trade openness, the inflation rate, and government consumption. , includes explanatory variables directly related to financialisation and , is the error term that includes country-specific and time-specific effects. Some econometric issues may arise. First, variables included in , and , may not be fully exogenous, and causality may run in both directions. Second, the country fixed-effects contained in the error term can be correlated with the explanatory variables. Third, the panel dataset has a relatively short time dimension and a large country dimension. These three issues can be addressed with the two-step GMM estimator proposed by Arellano and Bond
8
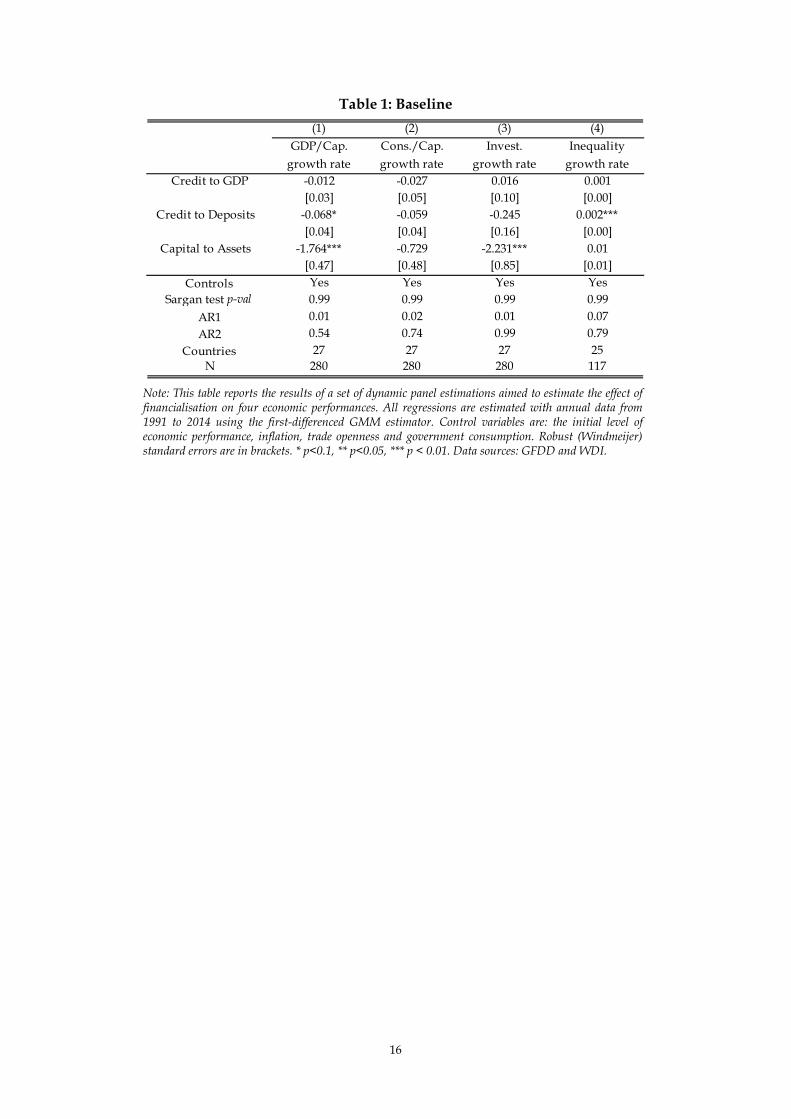
(1991) in which the set of instrumental variables is constituted by the lagged values of all explanatory variables, including , . Moreover, Arellano and Bond (1991) rewrite equation (1) in first difference: Δ , = Δ , + Δ , + Δ , + Δ , (2) By transforming the regressors in first difference, the country fixed-effect is removed, but a new bias is potentially introduced: the new error term can be correlated with the lagged dependent variable. Under the assumption that the error term is not serially correlated and that the explanatory variables are weakly exogenous, Arellano and Bond (1991) define the following procedure. In the first step of their GMM estimator, error terms are assumed to be homoskedastic and independent over time and across countries. Then, in the second step residuals obtained in the first step are used to build a consistent estimate of the variance-covariance matrix. Assumptions of independence and homoskedasticity are then relaxed, making the two-step estimator asymptotically more efficient than the first-step one. We obtain robust standard errors using the Windmeijer (2005) finite sample correction. The assumption of no serial correlation in the error terms is crucial for the consistency of the GMM estimator.1 Our estimation strategy differs from earlier ones in that we do not use average data in our dynamic panel estimations. Beck and Levine (2004) and Arcand et al. (2012) use average data in order to quantify the long-term relationship between finance and economic performance. Their data are averaged over 5-year periods to disentangle credit cycle effects. We do not follow this assumption for two reasons and use instead annual data. First, business cycles measured by the National Bureau of Economic research (NBER) in the United States and by the Center for Economic Policy Research (CEPR) in Europe are longer than five years. Measures of financial cycles (Drehmann et al., 2012) show that financial cycles have a much lower frequency than traditional business cycles. Their average duration has increased since the 1980s and is now around 20 years, making 5-year average data unable to fit the duration of these cycles. Second, we think that it is worth investigating not only the long-term effects of finance on economic performance but also its short-term effects: the use of average data disregards the latter. 4. Empirical results 4.1. Baseline We assess the link between the size and risks embedded in banking activities on the one hand and economic performance on the other hand. Ratios of credit to GDP, credit to deposit and capital to assets capture different complementary information (financial depth, maturity risk, balance sheet risk) about banks. We test their impact on four measures of economic performance. Table 1 reports the baseline results of our estimations. We find that credit has no effect on economic performance in the EU since 1991, independently of the level of risks for which we control and of the measure of economic performance chosen.
[Insert table 1 here]
1 The use of a large number of instruments may lead to over-identification. In order to avoid this, we use variables in level as instruments only up to three lags instead of using all their history. Using Sargan tests, we do not reject the null hypothesis that our instruments are valid.
9
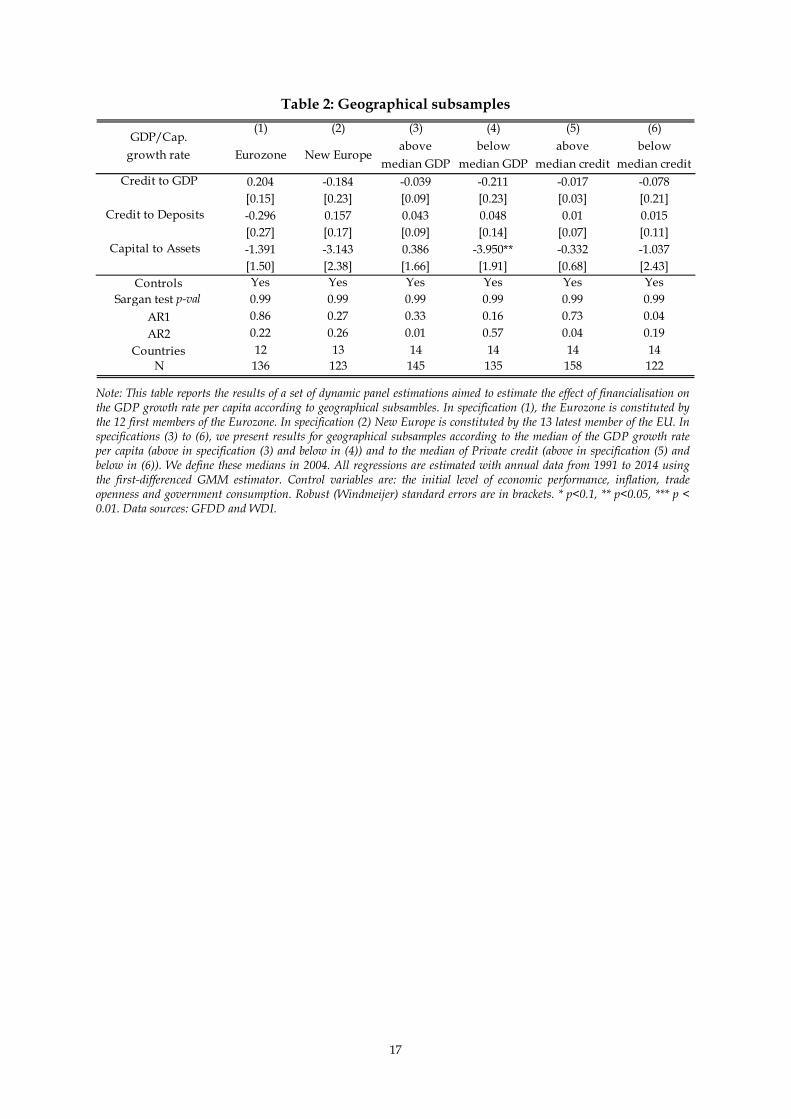
The fragility of the process of financialisation measured by the ratio of bank credit to bank deposit has a negative impact on GDP per capita and contributes to increasing inequality. In contrast, the capital to assets ratio which captures the inverse of the leverage ratio has a negative impact on GDP per capita growth possibly through its effect on investment. This latter result suggests that the higher the leverage ratio, the higher the economic performance. It seems to entail that taking more risk has positive effects on growth. This outcome is being triggered by the impact on private investment, whereas the impact on consumption is null. The positive impact of one particular dimension of financialisation (the ratio of capital to assets) on private investment seems at odds with Stockhammer (2004) and Barradas (2017) who show that financialisation can hurt capital accumulation. Such is the case (depending on the econometric specification) in France, the UK and the US in Stockhammer (2014) and for EU countries between 1995 and 2013 in Barradas (2017). The underlying arguments for their results are described in Hein and Dodig (2015). Two points must be stressed. First the measures of financialisation used by Stockhammer (2004) and Barradas (2017) are different from ours. Stockhammer uses the interest and dividend income of the non-financial business sector divided by its value added that he labels the “rentiers’ share of non-financial businesses”, whereas Barradas uses the financial receipts and financial payments of non-financial corporations. Second and more importantly, we show in the following section that the result that capital to assets has a negative impact on economic performance is driven by some country characteristics and is therefore state-dependent. 4.2. Geographical subsamples We assess whether our baseline results are driven by institutional features or non-linearities (more precisely, a threshold effect) according to the level of GDP per capita or the level of financialisation. We estimate the impact of the three variables of financialisation according to whether countries are among the founding members of the Eurozone and whether they were part of the latest waves of EU enlargement. We also estimate the impact of financialisation according to the level of GDP per capita and according to the level of credit to GDP. Table 2 reports the results of the dynamic panel estimations of equation (2) on these subsamples. In specification (1), the Eurozone is constituted by the 12 first members of the Eurozone. In specification (2) New Europe is constituted by the 13 latest members of the EU. In specifications (3) and (4), the subsamples are constituted of the countries above and below the median of the GDP per capita levels respectively. In specifications (5) and (6), the subsamples comprised the countries above and below the median of credit to GDP levels respectively.
[Insert table 2 here] These estimations confirm the result that credit to GDP has no significant impact on the GDP per capita growth rate. The ratio of credit to deposits has a negative effect on the economic performance of Eurozone countries but is not significant at conventional levels. It has no impact on other subsamples. The ratio of capital to assets has a negative effect on GDP growth in most subsamples though it is not statistically significant. However, the pattern of the effects when looking at subsamples based on GDP per capita levels is clear: the effect of capital to assets is positive though non-significant in countries with higher GDP per capita and the effect is negative and significant in countries with lower GDP per capita. It suggests that balance sheet risks captured by the leverage ratio would be harmful on growth in richer countries and would have positive impact for poorer countries, possibly because they are in a process of convergence.
10
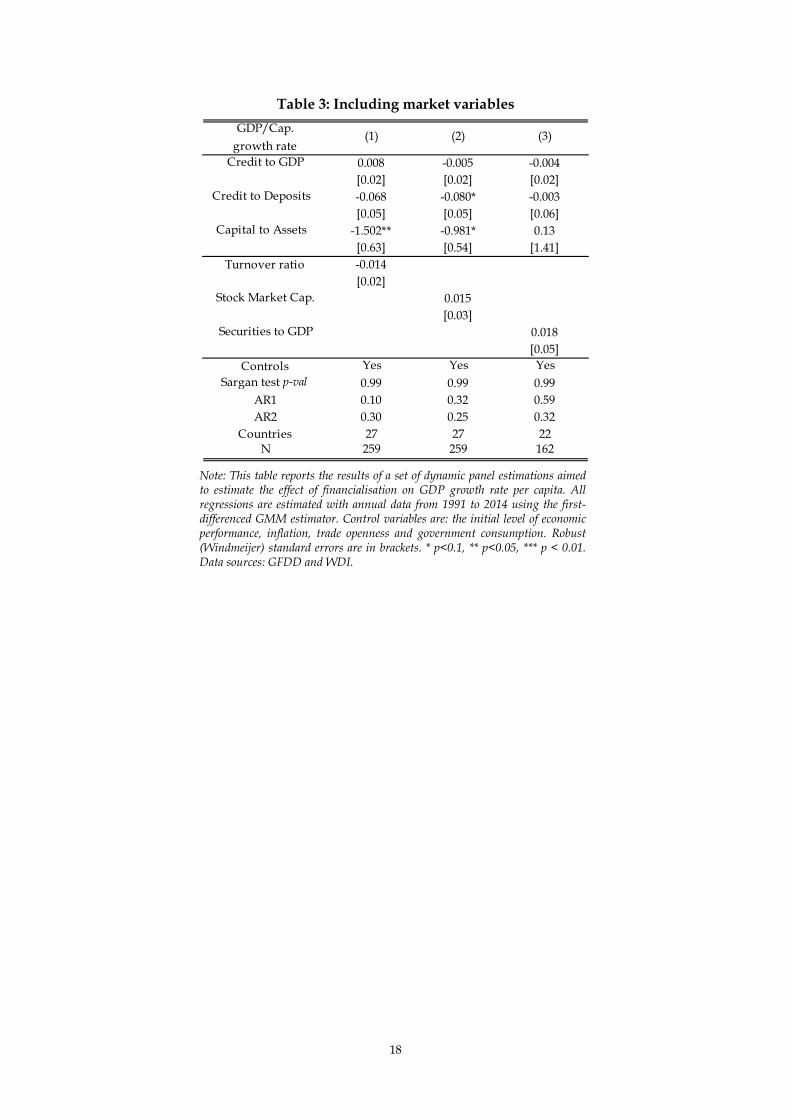
4.3. Including market variables We then investigate whether variables measuring the level of market financialisation rather than bank financialisation matter for economic performance. We alternatively test the turnover ratio, which is a measure of liquidity or depth of financial markets, the ratio of the stock market capitalization to GDP and the amount of domestic private debt securities as a share of GDP. These variables are introduced in the empirical model described by equation (2) alongside the main three variables of financialisation. The objective is to explore whether the previous results hold or whether they suffer an omitted variable bias so that the effect of financialisation is actually different. Estimates are presented in Table 3. The effect of credit to GDP on economic performance is still null while the effects of the two financialisation risk variables hold. In addition, none of the market financialisation variables contribute significantly to GDP growth.
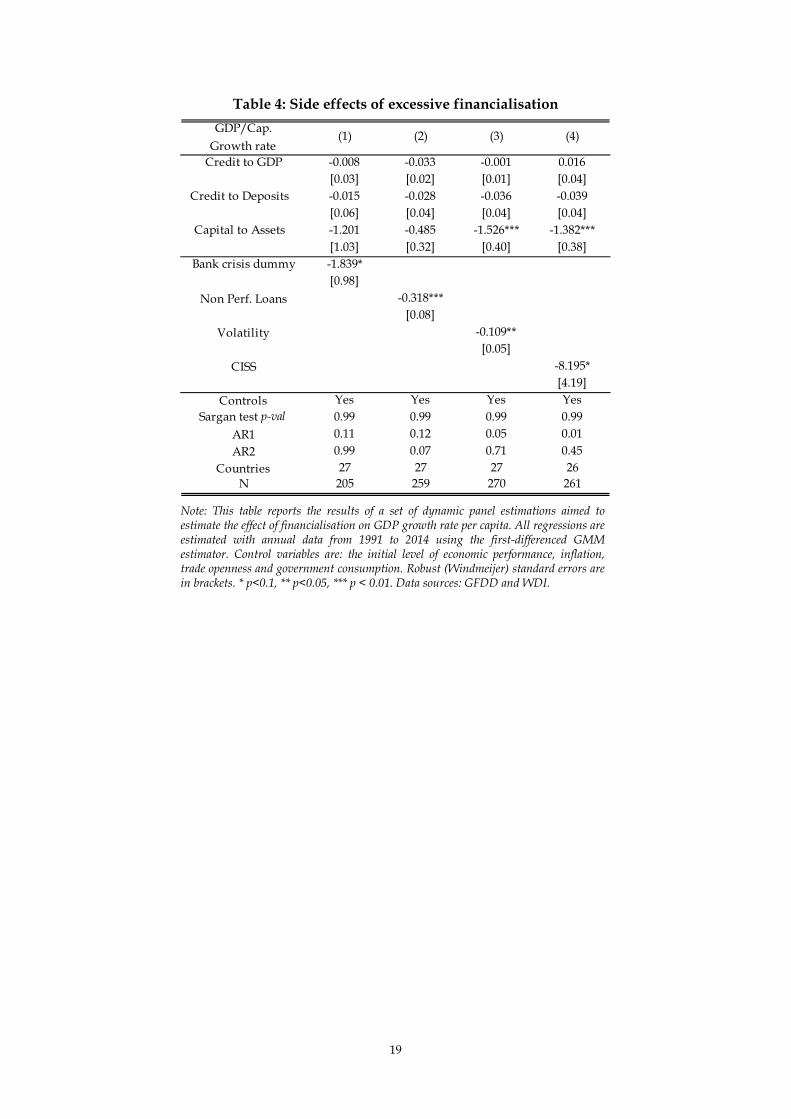
[Insert table 3 here] 4.4. Side effects Finally, we test whether different variables capturing the potential side effects of excessive financialisation influence economic performance. With the growing process of financialisation, one observes an increase in financial instability and crises. In addition to the financialisation variables, we first include in equation (2) the bank crisis dummy defined by Laeven and Valencia (2012). Second, we test the impact of non-performing loans. This variable measures the process of lending ever more to ever riskier agents. Third, we evaluate the effects of stock price volatility and of an index of systemic risk, the CISS, computed by the ECB. Results are presented in Table 4. They show that our main result that financialisation has no positive effect on the growth of GDP per capita is robust and does not suffer from an omitted variable bias. Moreover, we observe that the four variables capturing the potential side effects of excessive financialisation have a negative and significant effect on GDP growth. The most significant effect goes through non-performing loans on total credit and it is interesting to note that in this specification (column 2) the negative effect of capital to assets vanishes. This suggests that when taking into account the quality of the credit supplied to the economy, the level of capital to assets is no longer a determinant of economic performance.
[Insert table 4 here] 5. Conclusion This paper assesses the link between financialisation and economic performance. We enlarge the scope for so-called economic performance beyond GDP to consumption, investment and inequality. We complement the use of credit to GDP to measure financialisation to two variables that capture some underlying characteristics of financialisation. We restrict our attention to the EU countries which, despite their differences, share a common financial framework. Finally, we also analyse the impact of market financialisation and of the potential side effects of excessive financialisation on economic performance. We show that credit to GDP has no effect on economic performance and that credit to deposits together with the side effects associated with excessive financialisation affects negatively GDP per capita growth. In this case, the return to the pre-global-financial-crisis’
11
situation with insufficient regulation may lead to lower economic growth. Some may argue that the frequency of crises is ultimately high, except during the post-World-War-2 period until the first oil price shock (see the databases of Laeven and Valencia, 2012; Reinhart and Rogoff, 2010; or Schularick and Taylor, 2012). If a situation in which economies are crippled with frequent crises is the “new normal”, re-endorsing the mainstream view is “normal” as well. However, the next time may be different. The depth and length of the previous crisis in the European Union have been sizable and an early return to recession may have a larger financial and economic impact. Preventing the next crisis is a crucial challenge in this respect. We argue that adopting the appropriate view on the link between financialisation and economic performance is pivotal to avoid detrimental policies. It is ever more important if one extends the analysis to long-term issues about social and environmental sustainability. Backing financialisation because it is supposed to boost short-run indicators of performance may well produce counterproductive results: short-run growth may produce costs to future development, via fewer renewable resources and higher negative spillovers (e.g. Greenhalgh, 2005). But backing financialisation although it disrupts short-run indicators of performance may reduce the willingness and incentives to take better care of long-run sustainability objectives. Higher inequality in the short run, under financialisation and lower economic growth, do not facilitate the feeling of emergency of achieving the ecological transition by governments, firms and households (e.g. Laurent, 2011; Motesharrei et al., 2014). Our results thus call for regulating the banking sector activity as financialisation and financial instability are detrimental to growth and inequality. References
Aghion, P., Howitt, P., and D. Mayer-Foulkes (2005), “The effect of financial development
on convergence: theory and evidence”, Quarterly Journal of Economics, 120, 173-222. Ahmed, S. (1998), “Comment on The Legal Environment, Banks, and Long-Run Economic
Growth”, Journal of Money, Credit and Banking, 30(3), 614-620. Ang, J. (2008), “A Survey of recent developments in the literature of finance and growth”,
Journal of Economic Surveys, 22(3), 536-576. Arcand, J.-L., E. Berkes and U. Panizza (2015), “Too Much finance?”, Journal of Economic
Growth, 20(2), 105-148. Arellano, M., and S. Bond (1991), “Another tests of specification for panel data: Monte
Carlo evidence and an application to employment equations”, Review of Economic Studies, 58 (2), 277-297.
Arestis, P. (2006), “Financial liberalization and the relationship between finance and growth”, in P. Arestis and M. Sawyer (eds.), A Handbook of alternative monetary economics, Edward Elgar, Cheltenham.
Arestis, P., and P. Demetriades (1997), “Financial Development and Economic Growth: Assessing the Evidence”, Economic Journal, 107 (442), 783-799.
Arestis, P., P. Demetriades and K. Luintel (2001), “Financial Development and Economic Growth: The Role of Stock Markets”, Journal of Money, Credit and Banking, 33(1), 16-41.
Barradas, R. (2017), “Financialisation and Real Investment in the European Union: Beneficial or Prejudicial Effects?”, Review of Political Economy, 29(3), 376-413.
Beck, T. (2015), “Finance and growth – beware the measurement”, VoxEU, 30, September. Beck, T., and R. Levine (2004), “Stock markets, banks, and growth: Panel Evidence”, Journal
of Banking and Finance, 28, 423-442.
12
Beck, T., Büyükkarabacak, B., Rioja, F., and Valev, N. (2012), “Who Gets the Credit? And Does It Matter? Household vs. Firm Lending Across Countries”, The B.E. Journal of Macroeconomics, 12 (1), 1-46.
Beck, T., R. Levine and N. Loayza (2000), “Finance and the sources of growth”, Journal of Financial Economics, (58), 261-300.
Bumann, S., Hermes, N., and R. Lensink (2013), “Financial liberalization and economic growth: A meta-analysis”, Journal of International Money and Finance, 33(C), 255-281.
Calderon, C., and Liu, L. (2003), “The direction of causality between financial development and economic growth”, Journal of Development Economics, 72, 321-334.
Cecchetti, S., and Kharroubi, E. (2012), “Reassessing the impact of finance on growth”, BIS Working Paper, No. 381.
Cournède B. and O. Denk (2015), “Finance and economic growth in OECD and G20 countries”, OECD Economics Department Working Paper, No. 1223.
Creel, J., P. Hubert and F. Labondance (2015), “Financial Stability and Economic Performance”, Economic Modelling, 48, 25-40.
De Gregorio, J., and Guidotti, P. (1995), “Financial Development and economic growth”, World Development, 23 (3), 433-448.
Demirgüç-Kunt, A., and Maksimovic, V. (1998), “Law, Finance, and Firm Growth”, Journal of Finance, 53(6), 2107-2137.
Denk O. and B. Cournède (2015), “Finance and income inequality in OECD countries”, OECD Economics Department Working Paper, No. 1224.
Epstein, G. (2005), “Introduction: financialization and the world economy”, in G.A. Epstein (ed.), Financialization and the world economy, Edward Elgar, Cheltenham.
Fink, G., Haiss, P., and Vuksic, G. (2009), “Contribution of financial market segments at different stages of development: Transition, cohesion and mature economies compared”, Journal of Financial Stability, 5, 431-455.
Fung, M. (2009), “Financial development and economic growth: Convergence or divergence?”, Journal of International Money and Finance, 28(1), 56-67.
Gambacorta L., J. Yang and K. Tsatsaronis (2014), “Financial structure and growth”, BIS Quarterly Review, March, 21-35.
Godechot, O. (2006), “Hold-up en finance. Les conditions de possibilité des bonus élevés dans l'industrie financière”, Revue française de sociologie, 47(2), 341-371.
Greenhalgh C. (2005), “Why does market capitalism fail to deliver a sustainable environment and greater equality of incomes?”, Cambridge Journal of Economics, 29(6), 1091-1109.
Hein E., D. Detzer, and N. Dodig (eds.) (2016), Financialisation and the financial and economic crises, Cheltenham: Edward Elgar Publishing Limited.
Hein, E., and N. Dodig (2015), “Finance Dominated Capitalism, Distribution, Growth and Crisis–Long-run Tendencies”, in The Demise of Finance-dominated Capitalism: Explaining the Financial and Economic Crises, edited by E. Hein, D. Detzer, and N. Dodig. Cheltenham: Edward Elgar Publishing Limited.
King, R., and Levine, R. (1993), “Finance and Growth: Schumpeter Might be Right”, Quarterly Journal of Economics, 108 (3), 717-737.
Laeven, L., and Valencia, F. (2012), “Systemic Banking Crises Database: An Update”, IMF Working Paper, No. 163.
Laurent, E. (2011), “Issues in environmental justice within the European Union”, Ecological Economics, 70(11), 1846-1853.
Law, S.H. and N. Singh (2014), “Does too much finance harm economic growth?”, Journal of Banking and Finance, 41, 36-44.
Levine, R. (2005), “Finance and Growth: Theory and Evidence”, In P. Aghion and S. Durlauf, Handbook of economic growth, 865-934. Elsevier.
13
Levine, R., and S. Zervos (1998), “Stock Markets, Banks, and Economic Growth”, American Economic Review, 88(3), 537-558.
Loayza, N., and R. Ranciere (2006), “Financial Development, Financial Fragility, and Growth”, Journal of Money, Credit, Banking, 384, 1051-1076.
McKinnon, R.I. (1973), Money and Capital in Economic Development, Washington, DC: Brookings Institution.
Minsky, H.P. (1995), “Sources of Financial Fragility: Financial Factors in the Economics of Capitalism”, paper prepared for the conference, “Coping with Financial Fragility: A Global Perspective,” 7-9 September 1994, Maastricht, available at Hyman P. Minsky Archive, Paper 69.
Motesharrei S., J. Rivas, E. Kalnay (2014), “Human and nature dynamics (HANDY): Modeling inequality and use of resources in the collapse or sustainability of societies”, Ecological Economics, 101, 90-102.
Philippon, T. (2010), “Financiers vs. Engineers: Should the Financial Sector be Taxed or Subsidized?”, American Economic Journal: Macroeconomics, 2 (3), 158-182.
Philippon, T. and A. Reshef (2013), “An International Look at the Growth of Modern Finance”, Journal of Economic Perspectives, 27(2), 73–96.
Prochniak, M. and K. Wasiak (2017), “The impact of the financial system on economic growth in the context of the global crisis: empirical evidence for the EU and OECD countries”, Empirica, 44(2), 295-337.
Rajan, R., and L. Zingales (1998), “Financial dependence and growth”, American Economic Review, 88(3), 559-586.
Ram, R. (1999), “Financial development and economic growth: Additional evidence”, Journal of Development Studies, 35 (4), 164-174.
Reinhart, C., and K. Rogoff (2010), “Growth in a Time of Debt”, NBER Working Paper, No. 15639.
Rioja, F., and N. Valev (2004), “Does one size fit all?: a reexamination of the finance and growth relationship”, Journal of Development Economics, 74, 429-447.
Rodrik, D., and A. Subramanian (2009), “Why Did Financial Globalization Disappoint?”, IMF Staff Paper, 56(1), 112-138.
Rousseau, P., and P. Wachtel (2000), “Equity markets and growth: Cross-country evidence on timing and outcomes, 1980-1995”, Journal of Banking and Finance, 24, 1933-1957.
Sahay R., Cihak M., P. N’Diaye, A. Barajas, R. Bi, D. Ayala, Y. Gao, A. Kyobe, L. Nguyen, C. Saborowski, K. Svirydzenka and S.R. Yousefi (2015), “Rethinking Financial Deepening: Stability and Growth in Emerging Markets”, IMF Staff Discussion Note, SDN/15/08, May.
Sawyer, M. (2014), “Financial development, financialisation and economic growth”, FESSUD Working Paper, 21.
Schularick, M. and A.M. Taylor (2012), “Credit booms gone bust: monetary policy, leverage cycles, and financial crises, 1870–2008”, American Economic Review, 102(2), 1029-1061.
Shaw, E. (1973), Financial Deepening in Economic Development, New York: Oxford University Press.
Stiglitz, J. (2000), “Capital Market Liberalization, Economic Growth, and Instability”, World Development, 28 (6), 1075-1086.
Stockhammer, E. (2004), “Financialisation and the slowdown of accumulation”, Cambridge Journal of Economics, 28(5), September, 719–741.
Xu, Z. (2000), “Financial Development, investment, and economic growth”, Economic Inquiry, 38(2), 331-344.
14
Figure 1: Private Credit (in % of GDP) in the European Union
Note: This figure presents a box plot of the Private credit variable distributional characteristics each year from 1991 to 2014. The “box” represents the inter-quartile range. The median marks the mid-point of the data and is shown by the line that divides the box into two parts. The upper and lower whiskers show the upper and the lower adjacent values. Outsides values are also represented. Source: GFDD.
Figure 2: Stock Market Capitalization (in % of GDP) in the European Union
Note: This figure presents a box plot of the stock market capitalization variable distributional characteristics each year from 1991 to 2014. The “box” represents the inter-quartile range. The median marks the mid-point of the data and is shown by the line that divides the box into two parts. The upper and lower whiskers show the upper and the lower adjacent values. Outsides values are also represented. Source: GFDD.
15
Figure 3: Private debt securities (in % of GDP) in the European Union
Note: This figure presents a box plot of the private debt securities variable distributional characteristics each year from 1991 to 2014. The “box” represents the inter-quartile range. The median marks the mid-point of the data and is shown by the line that divides the box into two parts. The upper and lower whiskers show the upper and the lower adjacent values. Outsides values are also represented. Source: GFDD.
Figure 4: Private Credit (in % of GDP) and GDP per capita growth rate (in %)
Note: This figure presents a scatter plot. Each point represents for a country the GDP growth rate per capita and the level of private credit for a specific year. Sources: GFDD and WDI.
16
Table 1: Baseline
Note: This table reports the results of a set of dynamic panel estimations aimed to estimate the effect of financialisation on four economic performances. All regressions are estimated with annual data from 1991 to 2014 using the first-differenced GMM estimator. Control variables are: the initial level of economic performance, inflation, trade openness and government consumption. Robust (Windmeijer) standard errors are in brackets. * p<0.1, ** p<0.05, *** p < 0.01. Data sources: GFDD and WDI.
(1) (2) (3) (4)GDP/Cap.
growth rateCons./Cap. growth rate
Invest. growth rate
Inequality growth rate
Credit to GDP -0.012 -0.027 0.016 0.001[0.03] [0.05] [0.10] [0.00]
Credit to Deposits -0.068* -0.059 -0.245 0.002***[0.04] [0.04] [0.16] [0.00]
Capital to Assets -1.764*** -0.729 -2.231*** 0.01[0.47] [0.48] [0.85] [0.01]
Controls Yes Yes Yes YesSargan test p-val 0.99 0.99 0.99 0.99
AR1 0.01 0.02 0.01 0.07AR2 0.54 0.74 0.99 0.79
Countries 27 27 27 25N 280 280 280 117
17
Table 2: Geographical subsamples
Note: This table reports the results of a set of dynamic panel estimations aimed to estimate the effect of financialisation on the GDP growth rate per capita according to geographical subsambles. In specification (1), the Eurozone is constituted by the 12 first members of the Eurozone. In specification (2) New Europe is constituted by the 13 latest member of the EU. In specifications (3) to (6), we present results for geographical subsamples according to the median of the GDP growth rate per capita (above in specification (3) and below in (4)) and to the median of Private credit (above in specification (5) and below in (6)). We define these medians in 2004. All regressions are estimated with annual data from 1991 to 2014 using the first-differenced GMM estimator. Control variables are: the initial level of economic performance, inflation, trade openness and government consumption. Robust (Windmeijer) standard errors are in brackets. * p<0.1, ** p<0.05, *** p < 0.01. Data sources: GFDD and WDI.
(1) (2) (3) (4) (5) (6)
Eurozone New Europeabove
median GDPbelow
median GDPabove
median creditbelow
median creditCredit to GDP 0.204 -0.184 -0.039 -0.211 -0.017 -0.078
[0.15] [0.23] [0.09] [0.23] [0.03] [0.21] Credit to Deposits -0.296 0.157 0.043 0.048 0.01 0.015
[0.27] [0.17] [0.09] [0.14] [0.07] [0.11] Capital to Assets -1.391 -3.143 0.386 -3.950** -0.332 -1.037
[1.50] [2.38] [1.66] [1.91] [0.68] [2.43]Controls Yes Yes Yes Yes Yes Yes
Sargan test p-val 0.99 0.99 0.99 0.99 0.99 0.99AR1 0.86 0.27 0.33 0.16 0.73 0.04AR2 0.22 0.26 0.01 0.57 0.04 0.19
Countries 12 13 14 14 14 14N 136 123 145 135 158 122
GDP/Cap. growth rate
18
Table 3: Including market variables
Note: This table reports the results of a set of dynamic panel estimations aimed to estimate the effect of financialisation on GDP growth rate per capita. All regressions are estimated with annual data from 1991 to 2014 using the first-differenced GMM estimator. Control variables are: the initial level of economic performance, inflation, trade openness and government consumption. Robust (Windmeijer) standard errors are in brackets. * p<0.1, ** p<0.05, *** p < 0.01. Data sources: GFDD and WDI.
Credit to GDP 0.008 -0.005 -0.004[0.02] [0.02] [0.02]
Credit to Deposits -0.068 -0.080* -0.003[0.05] [0.05] [0.06]
Capital to Assets -1.502** -0.981* 0.13[0.63] [0.54] [1.41]
Turnover ratio -0.014[0.02]
Stock Market Cap. 0.015[0.03]
Securities to GDP 0.018[0.05]
Controls Yes Yes YesSargan test p-val 0.99 0.99 0.99
AR1 0.10 0.32 0.59AR2 0.30 0.25 0.32
Countries 27 27 22N 259 259 162
GDP/Cap. growth rate
(3)(2)(1)
19
Table 4: Side effects of excessive financialisation
Note: This table reports the results of a set of dynamic panel estimations aimed to estimate the effect of financialisation on GDP growth rate per capita. All regressions are estimated with annual data from 1991 to 2014 using the first-differenced GMM estimator. Control variables are: the initial level of economic performance, inflation, trade openness and government consumption. Robust (Windmeijer) standard errors are in brackets. * p<0.1, ** p<0.05, *** p < 0.01. Data sources: GFDD and WDI.
Credit to GDP -0.008 -0.033 -0.001 0.016[0.03] [0.02] [0.01] [0.04]
Credit to Deposits -0.015 -0.028 -0.036 -0.039[0.06] [0.04] [0.04] [0.04]
Capital to Assets -1.201 -0.485 -1.526*** -1.382***[1.03] [0.32] [0.40] [0.38]
Bank crisis dummy -1.839*[0.98]
Non Perf. Loans -0.318***[0.08]
Volatility -0.109**[0.05]
CISS -8.195*[4.19]
Controls Yes Yes Yes YesSargan test p-val 0.99 0.99 0.99 0.99
AR1 0.11 0.12 0.05 0.01AR2 0.99 0.07 0.71 0.45
Countries 27 27 27 26N 205 259 270 261
GDP/Cap. Growth rate
(4)(3)(2)(1)
20
APPENDIX
Table A: Data Description and Sources
Data Definition Source Frequency
GDP/Cap. growth rateAnnual percentage growth rate of GDP per capita based on constant local currency. Aggregates are based on constant 2010 U.S. dollars.
WDI Annual
Consumption/Cap. growth rateAnnual percentage growth of household final consumption expenditure based on constant local currency. Aggregates are based on constant 2010 U.S. dollars.
WDI Annual
Investment growth rateAnnual percentage growth of gross capital formation consists of outlays on additions to the fixed assets of the economy plus net changes in the level of inventories.
WDI Annual
Inequality
Gini index measures the extent to which the distribution of income among individuals or households within an economy deviates from a perfectly equal distribution. The Gini index measures the area between the Lorenz curve and a hypothetical line of absolute equality, expressed as a percentage of the maximum area under the line. A Gini index of 0 represents perfect equality, while an index of 100 implies perfect inequality.
WDI Annual
Credit to GDP Private credit by deposit money banks and other financial institutions to GDP. GFDD Annual
Credit to Deposits
The financial resources provided to the private sector by domestic money banks as a share of total deposits. Domestic money banks comprise commercial banks and other financial institutions that accept transferable deposits, such as demand deposits. Total deposits include demand, time and saving deposits in deposit money banks.
GFDD Annual
Capital to Assets
Ratio of bank capital and reserves to total assets. Capital and reserves include funds contributed by owners, retained earnings, general and special reserves, provisions, and valuation adjustments. Total assets include all nonfinancial and financial assets.
GFDD Annual
Deposit Banks' assets Total assets held by deposit money banks as a share of GDP. GFDD AnnualStock Market Capitalization Total value of all listed shares in a stock market as a percentage of GDP. GFDD Annual
Securities to GDPTotal amount of domestic private debt securities (amount outstanding) issued in domestic markets as a share of GDP. It covers data on long-term bonds and notes, commercial paper and other short-term notes.
GFDD Annual
TurnoverTotal value of shares traded during the period divided by the average market capitalization for the period.
GFDD Annual
Bank CrisisLaeven and Valencia (2012) Dummy variable for the presence of banking crisis (1=banking crisis, 0=none)
GFDD Annual
Non Perf. Loans
Ratio of defaulting loans (payments of interest and principal past due by 90 days or more) to total gross loans (total value of loan portfolio). The loan amount recorded as nonperforming includes the gross value of the loan as recorded on the balance sheet, not just the amount that is overdue.
GFDD Annual
VolatilityStock price volatility is the average of the 360-day volatility of the national stock market index.
GFDD Annual
CISS (composite indicator of systemic stress)
Index comprising the five most important segments of a financial system: bank and non-bank financial intermediaries sector, money markets, securities markets and foreign exchange markets.
ECBWeekly
aggregated to annual
TradeTrade in services is the sum of service exports and imports divided by the value of GDP, all in current U.S. dollars.
WDI Annual
InflationInflation as measured by the consumer price index reflects the annual percentage change in the cost to the average consumer of acquiring a basket of goods and services that may be fixed or changed at specified intervals.
WDI Annual
Government consumption
General government final consumption expenditure (formerly general government consumption) includes all government current expenditures for purchases of goods and services (including compensation of employees). Data are in constant 2010 U.S. dollars.
WDI Annual
Economic Performance
Financialisation indicators
Side effects of financialisation
Controls
21
Table B: Descriptive statistics
Variable Obs Mean Std. Dev. Min Max
GDP/Cap. growth rate 690 2.19 3.71 -14.56 25.64Consumption/Cap. growth rate 686 2.07 4.23 -24.30 26.75
Investment growth rate 686 3.05 10.76 -54.90 69.36Inequality 241 0.00 0.05 -0.24 0.38
Credit to GDP 664 76.82 48.81 1.13 311.99Credit to Deposits 634 114.33 51.73 17.79 367.08Capital to Assets 398 7.31 2.51 2.70 15.30
Turnover 612 49.75 46.93 0.03 341.24Stock Market Capitalization 613 47.60 42.35 0.03 249.96
Securities 411 33.05 34.12 0.13 197.13
Bank Crisis 616 0.18 0.39 0 1Non Perf. Loans 441 5.81 6.30 0.10 44.90
Volatility 553 21.58 9.13 6.87 61.33CISS 447 0.18 0.18 0.02 0.92
Government consumption 702 19.73 2.96 11.63 28.06Inflation 703 12.81 77.57 -4.48 1494.68
Trade 702 103.41 58.98 33.98 391.50
Economic Performance
Controls
Side effects of financialisation
Financialisation indicators
ABOUT OFCE The Paris-based Observatoire français des conjonctures économiques (OFCE), or French Economic Observatory is an independent and publicly-funded centre whose activities focus on economic research, forecasting and the evaluation of public policy.
Its 1981 founding charter established it as part of the French Fondation nationale des sciences politiques (Sciences Po), and gave it the mission is to “ensure that the fruits of scientific rigour and academic independence serve the public debate about the economy”. The OFCE fulfils this mission by conducting theoretical and empirical studies, taking part in international scientific networks, and assuring a regular presence in the media through close cooperation with the French and European public authorities. The work of the OFCE covers most fields of economic analysis, from macroeconomics, growth, social welfare programmes, taxation and employment policy to sustainable development, competition, innovation and regulatory affairs.
ABOUT SCIENCES PO Sciences Po is an institution of higher education and research in the humanities and social sciences. Its work in law, economics, history, political science and sociology is pursued through ten research units and several crosscutting programmes. Its research community includes over two hundred twenty members and three hundred fifty PhD candidates. Recognized internationally, their work covers a wide range of topics including education, democracies, urban development, globalization and public health. One of Sciences Po’s key objectives is to make a significant contribution to methodological, epistemological and theoretical advances in the humanities and social sciences. Sciences Po’s mission is also to share the results of its research with the international research community, students, and more broadly, society as a whole.
PARTNERSHIP


![Financialisation – Post-Keynesian Perspectives · ΂Financialisation‘ ‘[…] financialization means the increasing role of financial motives, financial markets, financial](https://img.pdfslide.us/doc/110x75/6067c07dc6012d3b1051f99f/financialisation-a-post-keynesian-perspectives-afinancialisationa-a.jpg)