Embed Size (px)
Citation preview
1www.energiagroup.com
Financial Year 2019Annual ReportConsolidated Financial Statements31 March 2019
Energia Group Limited(Formerly known as Viridian Group Investments Limited)
www.energiagroup.com

2 Energia Group Limited Consolidated Financial Statements 2018 - 2019
3www.energiagroup.com
Key Facts and Figures 3
Strategic and Director’s Report 6
- Operating Review 7
- Summary of Financial Performance 24
- Market Structure 34
- Risk Management and Principal Risks and Uncertainties 40
- Corporate Social Responsibility Report 56
- Management Team, Ownership and Directorship 74
Statement of Director’s Responsibilities in Respect of Accounts 82
Independent Auditors’ Report 86
Consolidated Income Statement 91
Consolidated Statement of Other Comprehensive Income 92
Consolidated Balance Sheet 93
Consolidated Statement of Changes in Equity 95
Consolidated Statement of Cash Flows 96
Notes to the Consolidated Financial Statements 97
Appendix 188
Glossary of Terms 190
2
Contents
Energia Group Limited Consolidated Financial Statements 2018-2019
4 Energia Group Limited Consolidated Financial Statements 2018 - 20193 Energia Group Limited Consolidated Financial Statements 2018-2019
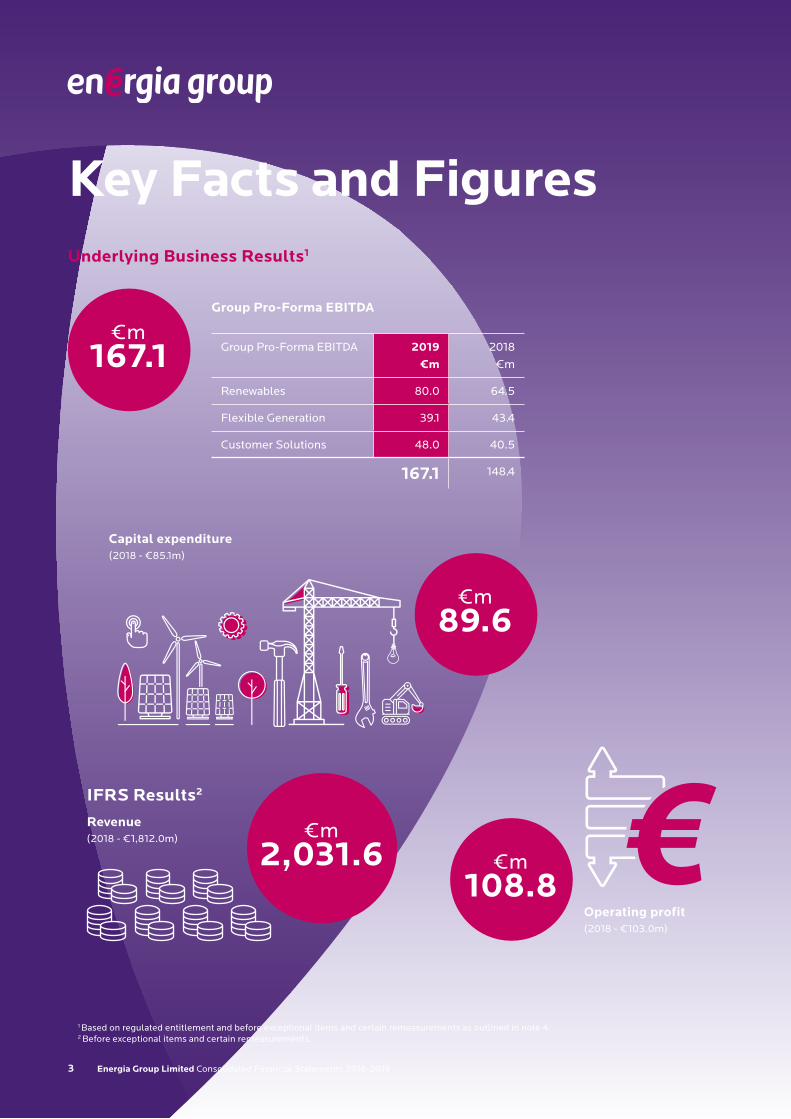
Key Facts and Figures
€m167.1
Underlying Business Results1
€m2,031.6
Operating profit (2018 - €103.0m)
IFRS Results2
Revenue(2018 - €1,812.0m)
Capital expenditure(2018 - €85.1m)
€m89.6
Group Pro-Forma EBITDA
Group Pro-Forma EBITDA 2019 €m
2018
€m
Renewables 80.0 64.5
Flexible Generation 39.1 43.4
Customer Solutions 48.0 40.5
167.1 148.4
€m108.8
1 Based on regulated entitlement and before exceptional items and certain remeasurements as outlined in note 4.2 Before exceptional items and certain remeasurements.
5www.energiagroup.com 4
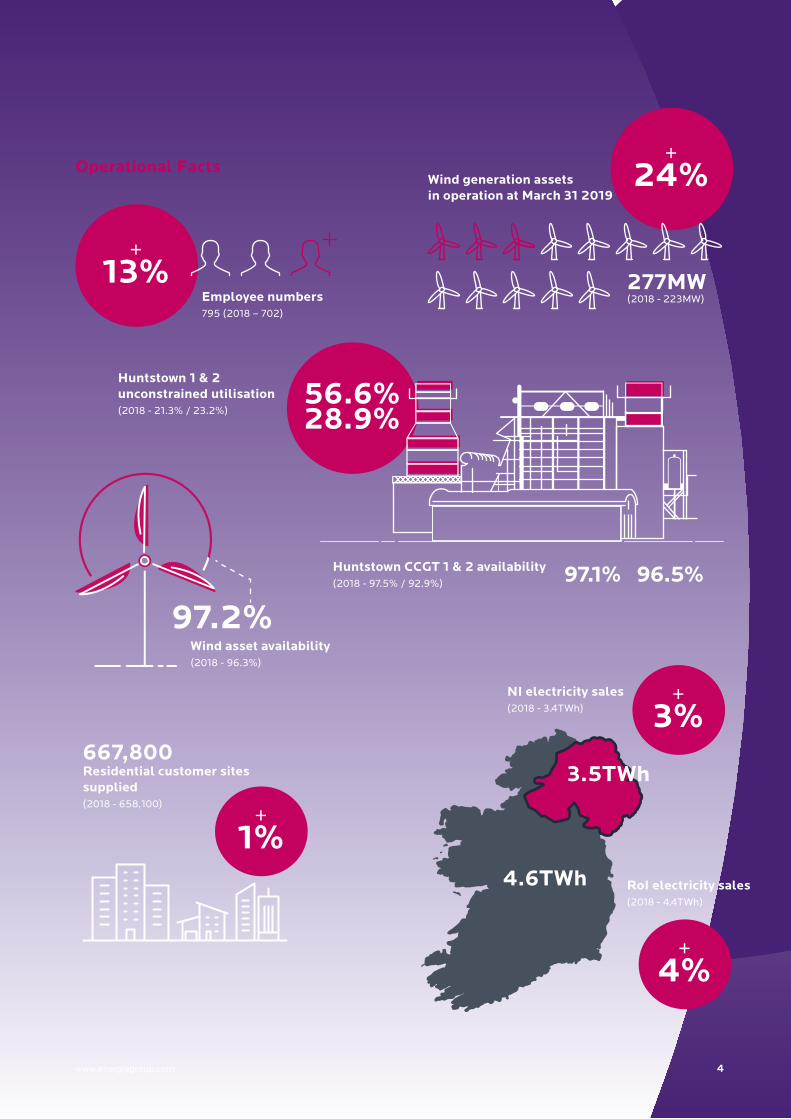
97.2%Wind asset availability(2018 - 96.3%)
Huntstown 1 & 2 unconstrained utilisation (2018 - 21.3% / 23.2%)
277MW(2018 - 223MW)
Operational Facts
+13%
+1%
+4%
+3%
Employee numbers795 (2018 – 702)
+24%Wind generation assets
in operation at March 31 2019
667,800Residential customer sites supplied (2018 - 658,100)
Huntstown CCGT 1 & 2 availability (2018 - 97.5% / 92.9%) 96.5%97.1%
NI electricity sales(2018 - 3.4TWh)
4.6TWh
www.energiagroup.com
3.5TWh
56.6%28.9%
RoI electricity sales(2018 - 4.4TWh)

6 Energia Group Limited Consolidated Financial Statements 2018 - 2019
6
Strategic and Director’s Report
7 Energia Group Limited Consolidated Financial Statements 2018 - 2019
Strategic and Director’s ReportOPERATING REVIEW
All references in this document to ‘Group’
denote Energia Group Limited (formerly known
as Viridian Group Investments Limited) and its
subsidiary undertakings and to ‘Company’ denote
Energia Group Limited, the parent company.
The principal activity of the Company is that of a
holding company.
Group Strategic Review
During the year the Board conducted a review of
the Group’s strategy. The review was carried out in
the context of recent developments in the Group’s
business, changes in the wider energy market and
trends which will affect the Group’s business going
forward.
The Board recognises the significant evolution
of the Group’s businesses in recent years. The
Group has in particular built upon its position in
the key sectors in which it operates, in Renewables,
Customer Solutions and Flexible Generation. This
has enhanced its position as a modern, renewables
focused, customer centric utility whilst positioning
the business for future growth and development.
The Group has constructed a portfolio of modern,
high-quality onshore wind assets complementing
its substantial portfolio of renewable PPAs as
offtaker from 1,281MW of renewable generating
capacity on the island of Ireland, thus significantly
responding to attractive investment signals and
contributing towards meeting the wider societal
demands of the decarbonisation agenda while
simultaneously de-risking the Group’s business
profile.
The Group has continued to grow its customer
base and is further developing its technological
capabilities in its Customers Solutions business.
This will allow the Group to offer an expanding
range of energy-related products to its customers
which will underpin and increase the attractiveness
of the Group’s customer offerings.
At the same time the strategic benefits of the
Group’s locationally advantaged modern gas
generation assets (situated on the edge of Dublin,
Ireland’s leading demand centre) have been
recognised through the award of four year Local
Reserve Services Agreements (LRSAs) for the
Huntstown CCGTs. The Huntstown plants provide
the flexible generation required to support the
Dublin power network which is affected by historical
constraints and which must nonetheless cope with
the twin effects of substantially increasing demand
from economic growth (including data centres
attracted by the many locational advantages that
Dublin presents); and the significant and increasing
proportion of nonsynchronous generation, mainly
on-shore wind.

8www.energiagroup.com
As a result of this strategic review, the Board has
determined that it is more appropriate to manage
the Group through reportable business units
aligned to business drivers rather than the business
units previously reported. Therefore with effect
from 31 March 2019 the Board has organised
the Group into the following business units for
management and reporting purposes:
• Renewables;
• Flexible Generation; and
• Customer Solutions.
A description of these business units is provided
below in the section entitled ‘Business Model and
Principal Activities’.
Recognising the increasing focus of the Group’s
business activities within the Republic of Ireland
(RoI), the Board has also decided to make an
accounting policy change for the Company
to change its presentational currency from
Sterling to Euro. The financial statements for
the year ended 31 March 2019, together with
the comparative year ended 31 March 2018 and
the opening balance sheet at 1 April 2017, have
all been restated and audited as part of these
financial statements.
On 16 May 2019, as part of a Group rebranding
exercise, the Company changed its name from
Viridian Group Investments Limited to Energia
Group Limited to better align its corporate identity
with the activities of the operational business.
Cornavarrow wind farm, Co. Tyrone
9 Energia Group Limited Consolidated Financial Statements 2018 - 2019
Business Model and Principal Activities
The Group is a leading integrated Irish energy
business with substantial businesses in both the
RoI and Northern Ireland. The Group primarily
operates through three businesses:
• Renewables;
• Flexible Generation; and
• Customer Solutions.
The Renewables business owns and operates
290MW of wind assets (including 13MW of
minority owned assets) and purchases electricity
from 1,281MW of renewable generation capacity
throughout Ireland. In addition, the Renewables
business is currently in the advanced stages of
constructing a 4.0MW bioenergy plant in Dublin.
The Flexible Generation business owns and
operates 747MW of conventional generation
assets in the RoI and procures power under
contract with 600MW of conventional generation
assets in Northern Ireland.
The Customer Solutions business supplies
electricity and gas to 256,300 customer sites in
the RoI and 499,800 customer sites in Northern
Ireland through its two retail brands, Energia and
Power NI.
Strategy
As noted above, during the year, management
and the Board completed a strategic review of
the Group. Resulting from this review, the Group
strategy has evolved significantly.
The island of Ireland, like the wider global energy
sector, is undergoing a transformation, driven by the
need to meet climate change targets and the effects
of technological change. Decarbonisation is already
an imperative; and the consequential electrification
of large sectors of the economy, such as transport
and heating are becoming policy priorities.
As the Group is a leading energy utility on the
island of Ireland in each of its Renewables, Flexible
Generation and Customer Solutions businesses,
it has an important role to play in the energy
transition the island of Ireland must go through in
the next decade. The Group has put itself in a strong
position to benefit from these changes. Accordingly,
the Group’s strategy is focused on continuing
its evolution as a modern technologically-
sophisticated, customer centric energy business
with a strong emphasis on renewable technology
providing innovative energy-related solutions and
services that meet its customers’ needs.
Management focuses on four strategic objectives
which underpin the Group’s strategy:
• build on and diversify the increasing platform
of renewable assets to accelerate low carbon
growth and increase earnings;
• grow our profitable customer base and focus
on customer retention through technological
advances with enhanced and differentiated
product offerings, while looking for opportunities
to increase, diversify and enhance the quality
of our customer relationships. Ways in which
the Group can assist our customers’ aspiration
to decarbonise will be a central aspect of our
strategy;
10www.energiagroup.com
• profitably develop, operate and grow our
portfolio of flexible generation assets in a
manner that supports the Group’s renewable
asset portfolio, enhances our product offering
to customers and provides the grid services
needed as Ireland transitions to a carbon neutral
economy; and
• support the predictability of the Group’s
underlying earnings and stable cash flows
through the diversity of contracted and regulated
revenue streams. Earnings will be further
underpinned by exploiting the complementarity
of our operations in each of our business units
through trading and balancing our portfolio of
renewable and conventional generation with the
demand from customers, employing industry
leading technology and data management.
In line with its commitment to exploit the
opportunities presented by technological
advances relevant to its business, the Group has
established a Group-wide hub to be the focus
for collaboration on initiatives in innovation;
and further to underpin delivery of the Group’s
Strategic objectives, the Group has significantly
augmented its corporate development team.
Further details of our initiatives are available on
our website energiagroup.com.
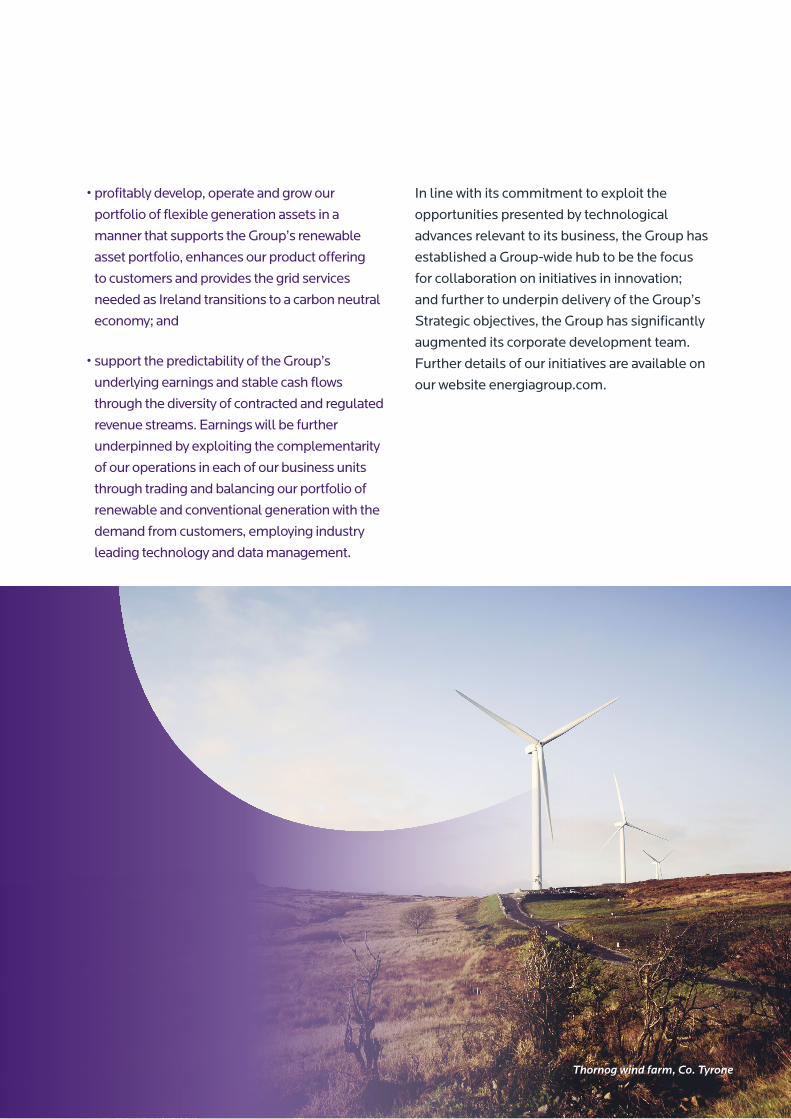
Thornog wind farm, Co. Tyrone

11 Energia Group Limited Consolidated Financial Statements 2018 - 2019
Management Team
The management team is responsible for
the delivery of the agreed strategy through
the operational management of the Group’s
businesses. Biographies for the management
team are provided in the section entitled
“Management Team, Ownership and
Directorship”.
Key Performance IndicatorsThe Group has determined that the following
key performance indicators (KPIs), covering
both financial and operational performance,
are the most effective measures of progress
towards achieving the Group’s objectives.
Financial KPIs
The financial KPIs are:
• EBITDA;
• Capital expenditure; and
• Net debt.
The EBITDA KPI is pro-forma EBITDA which
is based on regulated entitlement and before
exceptional items and certain remeasurements
as outlined in note 4.
Commentary on the financial KPIs is set out
in the Group Financial Performance section
below and within the relevant Business Review.
Left to right: Tom Gillen, Catherine Gardiner, Garrett Donnellan, Gary Ryan, Michele Hanley, Peter Baillie, Roy Foreman, Alwyn Whitford, Ian Thom, Siobhan Bailey, John Newman, Stephen McCully.
12www.energiagroup.com
Operational KPIs
The operational KPIs are:
Renewables
• the average annual and year end capacity (MW)
of owned wind generation in operation in the
RoI and Northern Ireland;
• availability (the percentage of time wind
generation assets are available to produce full
output);
• wind factor (the indicative output of the
available wind generation assets); and
• the average annual and year end capacity
(MW) of contracted renewable generation in
operation in the RoI and Northern Ireland.
Flexible Generation
• generation plant availability (the percentage
of time Huntstown CCGTs are available to
produce full output);
• generation plant unconstrained utilisation
(the indicative dispatch of the available
Huntstown CCGTs assuming no constraints i.e.
restrictions imposed by the Single Electricity
Market Operator (SEMO) on the availability of
the Huntstown CCGTs to dispatch electricity
or physical limitations of dispatching such
electricity); and
• generation plant incremental impact of
constrained utilisation (the indicative dispatch
of the available Huntstown CCGTs assuming
constraints imposed by SEMO).
Customer Solutions
• residential and non-residential customer sites
in the RoI and Northern Ireland;
• the volume of electricity sales (TWh) in the RoI
and Northern Ireland;
• the volume of gas sales (million therms) in the
RoI; and
• the number of complaints which the
Commission for Regulation of Utilities (CRU)
and the Consumer Council for Northern Ireland
(CCNI) (Stage 2 complaints) takes up on behalf
of customers.
Operational KPIs and commentary on business
performance are set out in the relevant
Business Review.
The Group also regards the lost time incident
rate (LTIR) as a KPI in respect of employee
safety; details are set out in the Workplace
section of the Corporate Social Responsibility
(CSR) report.
13 Energia Group Limited Consolidated Financial Statements 2018 - 2019
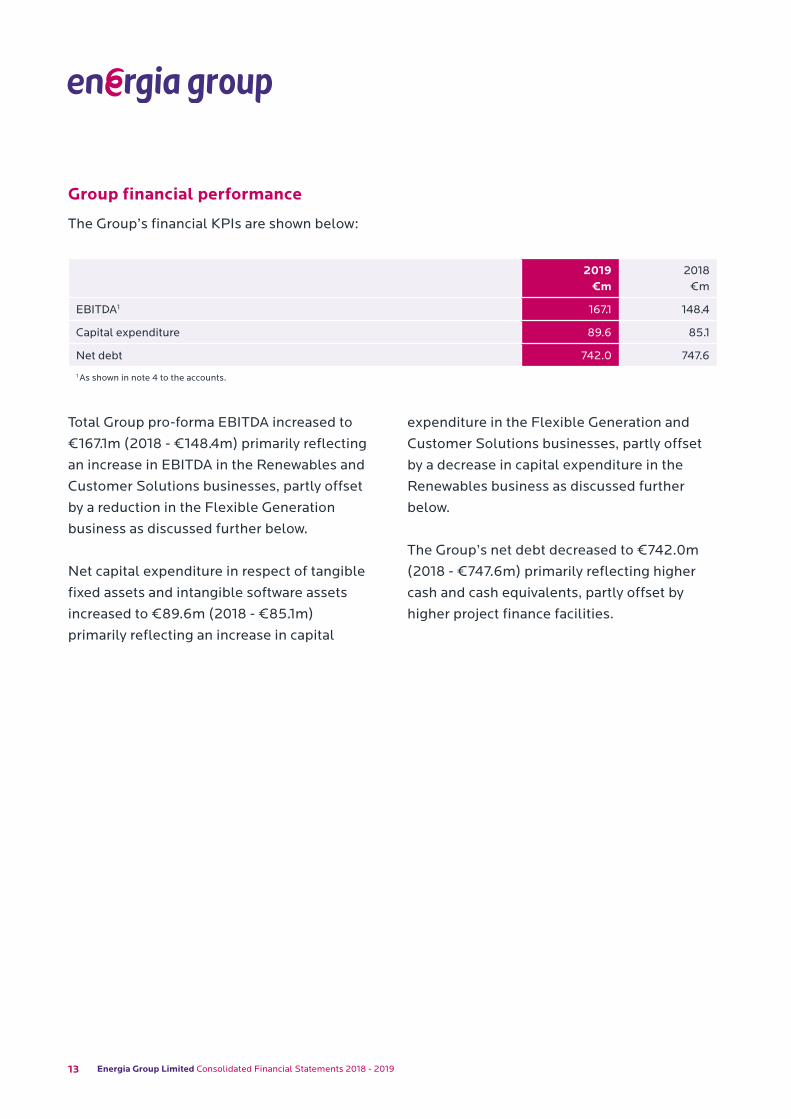
Group financial performance
The Group’s financial KPIs are shown below:
Total Group pro-forma EBITDA increased to
€167.1m (2018 - €148.4m) primarily reflecting
an increase in EBITDA in the Renewables and
Customer Solutions businesses, partly offset
by a reduction in the Flexible Generation
business as discussed further below.
Net capital expenditure in respect of tangible
fixed assets and intangible software assets
increased to €89.6m (2018 - €85.1m)
primarily reflecting an increase in capital
expenditure in the Flexible Generation and
Customer Solutions businesses, partly offset
by a decrease in capital expenditure in the
Renewables business as discussed further
below.
The Group’s net debt decreased to €742.0m
(2018 - €747.6m) primarily reflecting higher
cash and cash equivalents, partly offset by
higher project finance facilities.
2019 €m
2018 €m
EBITDA1 167.1 148.4
Capital expenditure 89.6 85.1
Net debt 742.0 747.6
1 As shown in note 4 to the accounts.
14www.energiagroup.com
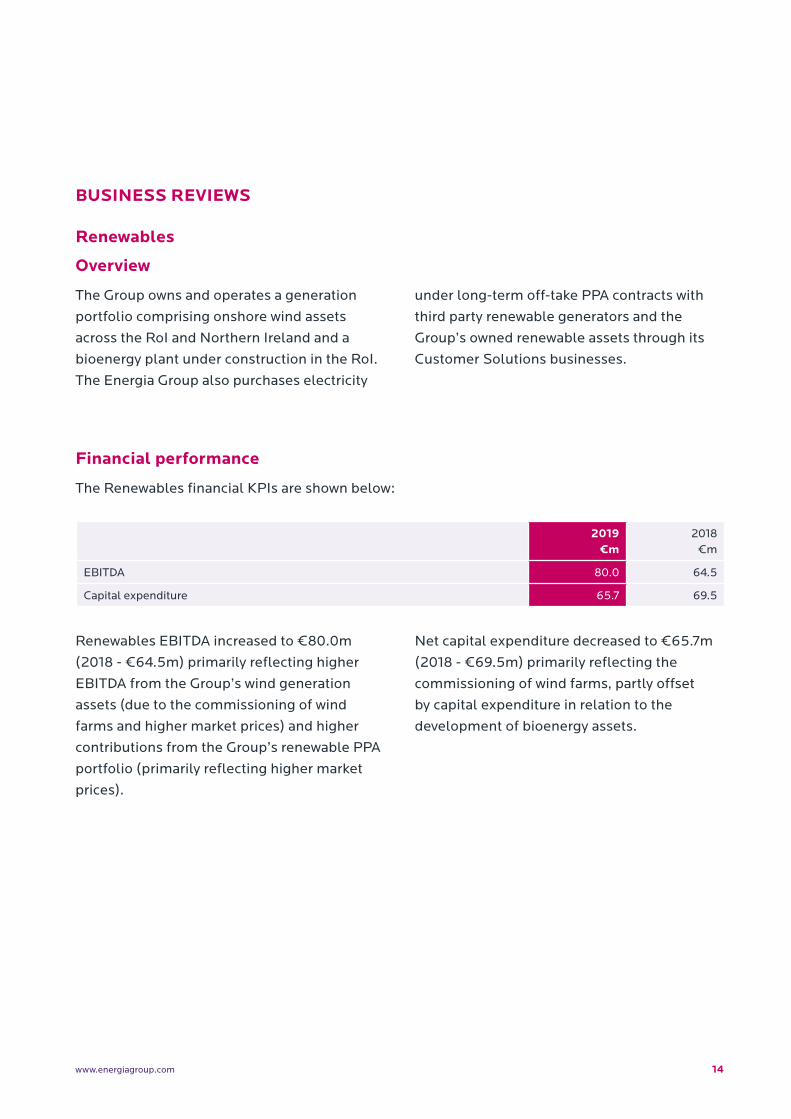
Renewables EBITDA increased to €80.0m
(2018 - €64.5m) primarily reflecting higher
EBITDA from the Group’s wind generation
assets (due to the commissioning of wind
farms and higher market prices) and higher
contributions from the Group’s renewable PPA
portfolio (primarily reflecting higher market
prices).
Net capital expenditure decreased to €65.7m
(2018 - €69.5m) primarily reflecting the
commissioning of wind farms, partly offset
by capital expenditure in relation to the
development of bioenergy assets.
2019 €m
2018 €m
EBITDA 80.0 64.5
Capital expenditure 65.7 69.5
BUSINESS REVIEWS
Renewables
Overview
The Group owns and operates a generation
portfolio comprising onshore wind assets
across the RoI and Northern Ireland and a
bioenergy plant under construction in the RoI.
The Energia Group also purchases electricity
under long-term off-take PPA contracts with
third party renewable generators and the
Group’s owned renewable assets through its
Customer Solutions businesses.
Financial performance
The Renewables financial KPIs are shown below:
15 Energia Group Limited Consolidated Financial Statements 2018 - 2019
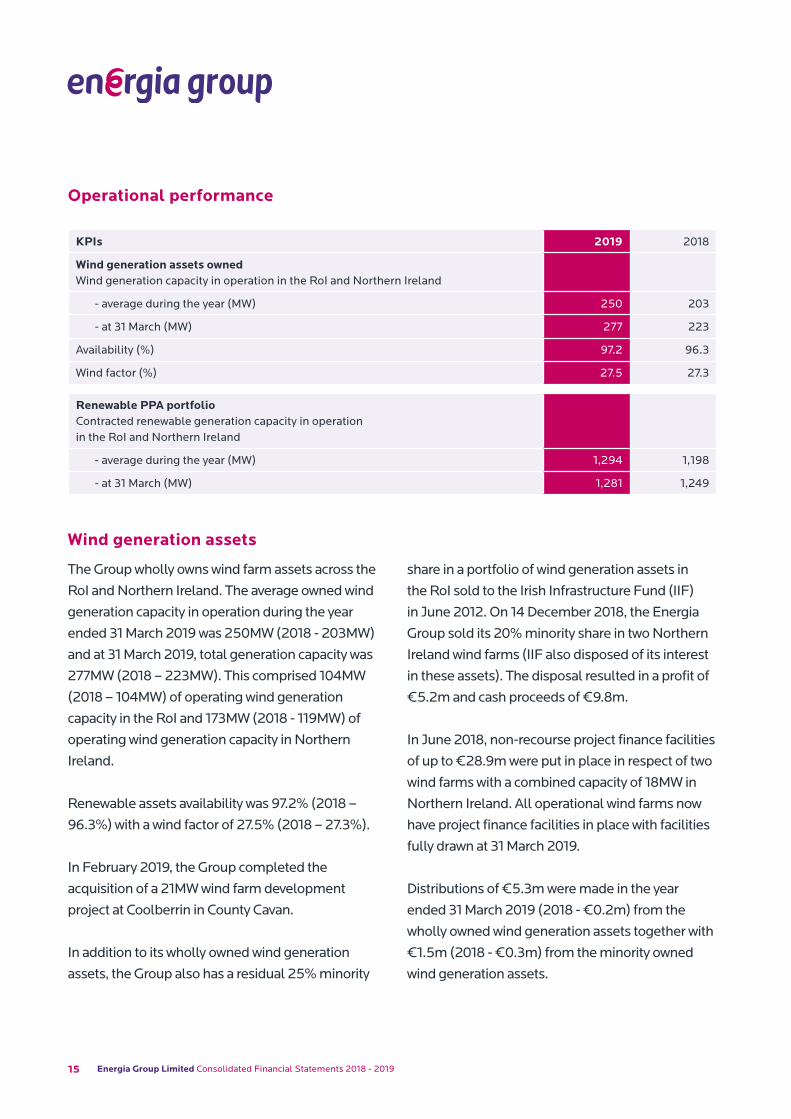
Operational performance
KPIs 2019 2018
Wind generation assets owned Wind generation capacity in operation in the RoI and Northern Ireland
- average during the year (MW) 250 203
- at 31 March (MW) 277 223
Availability (%) 97.2 96.3
Wind factor (%) 27.5 27.3
Renewable PPA portfolioContracted renewable generation capacity in operation in the RoI and Northern Ireland
- average during the year (MW) 1,294 1,198
- at 31 March (MW) 1,281 1,249
Wind generation assets
The Group wholly owns wind farm assets across the
RoI and Northern Ireland. The average owned wind
generation capacity in operation during the year
ended 31 March 2019 was 250MW (2018 - 203MW)
and at 31 March 2019, total generation capacity was
277MW (2018 – 223MW). This comprised 104MW
(2018 – 104MW) of operating wind generation
capacity in the RoI and 173MW (2018 - 119MW) of
operating wind generation capacity in Northern
Ireland.
Renewable assets availability was 97.2% (2018 –
96.3%) with a wind factor of 27.5% (2018 – 27.3%).
In February 2019, the Group completed the
acquisition of a 21MW wind farm development
project at Coolberrin in County Cavan.
In addition to its wholly owned wind generation
assets, the Group also has a residual 25% minority
share in a portfolio of wind generation assets in
the RoI sold to the Irish Infrastructure Fund (IIF)
in June 2012. On 14 December 2018, the Energia
Group sold its 20% minority share in two Northern
Ireland wind farms (IIF also disposed of its interest
in these assets). The disposal resulted in a profit of
€5.2m and cash proceeds of €9.8m.
In June 2018, non-recourse project finance facilities
of up to €28.9m were put in place in respect of two
wind farms with a combined capacity of 18MW in
Northern Ireland. All operational wind farms now
have project finance facilities in place with facilities
fully drawn at 31 March 2019.
Distributions of €5.3m were made in the year
ended 31 March 2019 (2018 - €0.2m) from the
wholly owned wind generation assets together with
€1.5m (2018 - €0.3m) from the minority owned
wind generation assets.
16www.energiagroup.com
Renewable PPA portfolio
The Group’s renewable PPA portfolio primarily
consists of off-take contracts with third party
owned wind farms (alongside wind generation
assets in which the Group has an equity interest).
The Group, via its Customer Solutions business,
has entered into contracts with developers under
which it has agreed to purchase the long term
output of a number of wind farm projects and with
generators from other renewable sources (e.g.
anaerobic digestion and biomass technologies).
The average contracted generation capacity in
operation during the year was 1,294MW (2018 –
1,198MW) with 31 March 2019 operating capacity
of 1,281MW (2018 – 1,249MW) of which the RoI
operating capacity was 586MW (2018 - 585MW)
and the Northern Ireland operating capacity was
695MW (2018 – 664MW).
Bioenergy assets
In May 2018, the Group completed the acquisition
of CEHL (Dublin) Bioenergy Limited and its
subsidiary, Huntstown Bioenergy Limited, from
Connective Energy Holdings Limited.
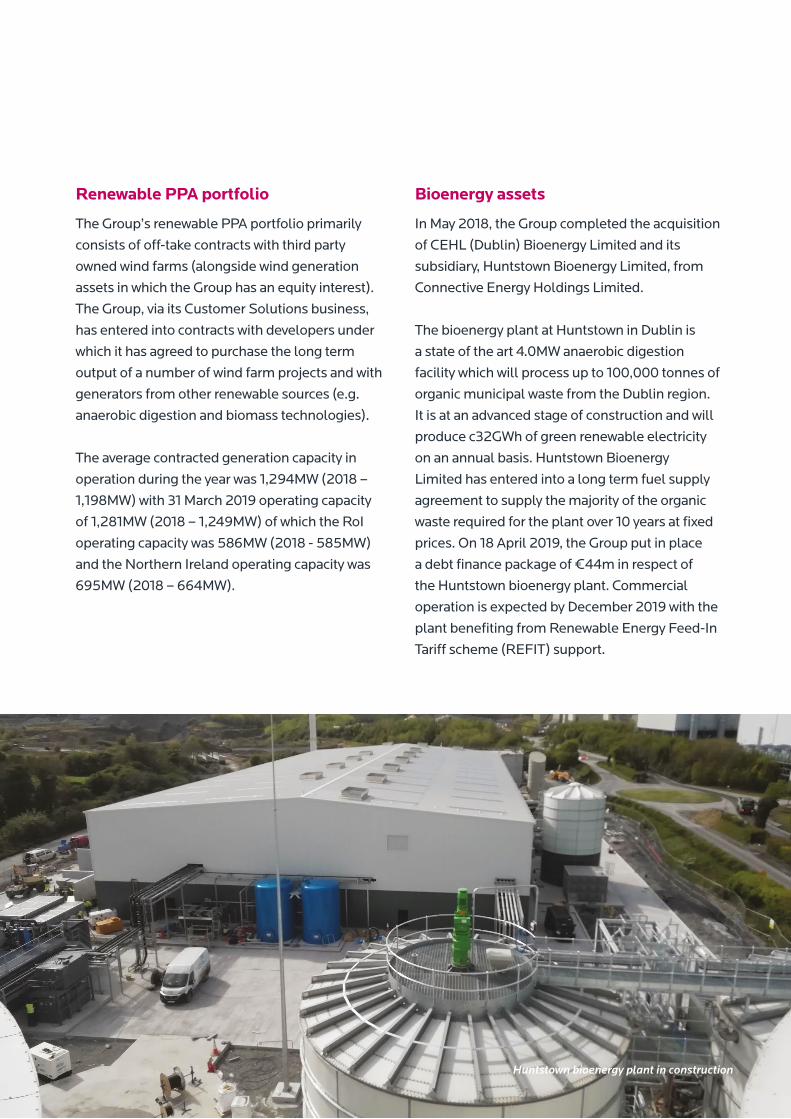
The bioenergy plant at Huntstown in Dublin is
a state of the art 4.0MW anaerobic digestion
facility which will process up to 100,000 tonnes of
organic municipal waste from the Dublin region.
It is at an advanced stage of construction and will
produce c32GWh of green renewable electricity
on an annual basis. Huntstown Bioenergy
Limited has entered into a long term fuel supply
agreement to supply the majority of the organic
waste required for the plant over 10 years at fixed
prices. On 18 April 2019, the Group put in place
a debt finance package of €44m in respect of
the Huntstown bioenergy plant. Commercial
operation is expected by December 2019 with the
plant benefiting from Renewable Energy Feed-In
Tariff scheme (REFIT) support.
Huntstown bioenergy plant in construction
17 Energia Group Limited Consolidated Financial Statements 2018 - 2019
A planning application is expected to be lodged
shortly for a 4.1MW anaerobic digestion project
at Giant’s Park in Belfast and it is intended to put
project financing in place in due course. The site
is adjacent to operational Renewable Obligation
Certificate (ROC) accredited Combined Heat and
Power (CHP) engines which the Group owns.
Subject to planning and licensing the plant is
expected to be operational by the end of 2021.
Outlook
The Group is continuing to develop its recently
acquired Coolberrin wind farm development
project in County Cavan and is also assessing
a significant number of other opportunities
to acquire and develop further wind farm
development projects. It is also developing its
plans for a proposed bioenergy plant at Giant’s
Park in Belfast while assessing opportunities
to invest in solar and off-shore wind farm
development projects.
The Group has been awarded Interreg and Office
for Low Emissions Vehicles (OLEV) grant funding
for an electrolyser, which will create hydrogen
from renewable electricity at the Long Mountain
windfarm, and a fueling station to be located
in Belfast. The OLEV funding will also support
Translink (Northern Ireland’s public transport
provider) with the purchase of a number of double
deck hydrogen buses.
Flexible Generation
Overview
The Group owns and operates two CCGT plants
at the Huntstown site in north Dublin. Huntstown
1, a 343MW CCGT plant was commissioned in
November 2002 and Huntstown 2, a 404MW
CCGT plant adjacent to Huntstown 1, was
commissioned in October 2007.
In addition, the Group’s PPB business
administers 600MW of contracted generation
capacity from the Ballylumford power station
in Northern Ireland. This legacy contract runs
to September 2023 and is cancellable by the
Utility Regulator with six months notice.
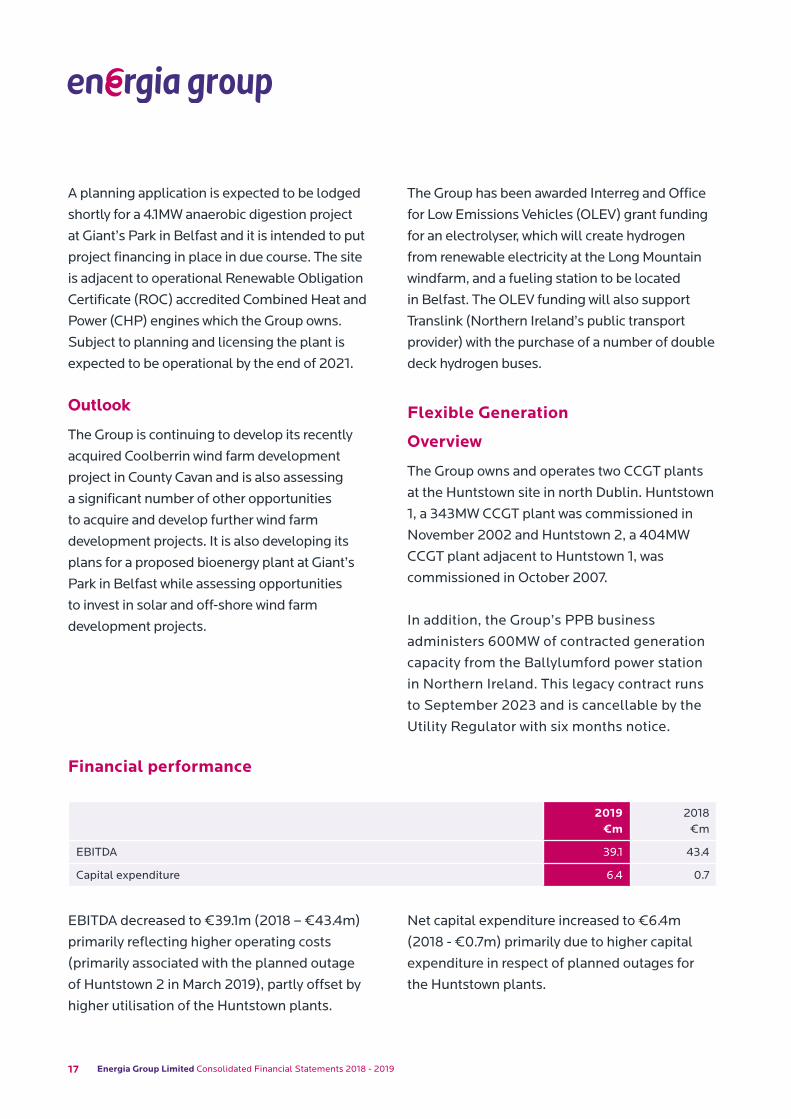
EBITDA decreased to €39.1m (2018 – €43.4m)
primarily reflecting higher operating costs
(primarily associated with the planned outage
of Huntstown 2 in March 2019), partly offset by
higher utilisation of the Huntstown plants.
Net capital expenditure increased to €6.4m
(2018 - €0.7m) primarily due to higher capital
expenditure in respect of planned outages for
the Huntstown plants.
Financial performance
2019 €m
2018 €m
EBITDA 39.1 43.4
Capital expenditure 6.4 0.7
18www.energiagroup.com
Operational performance
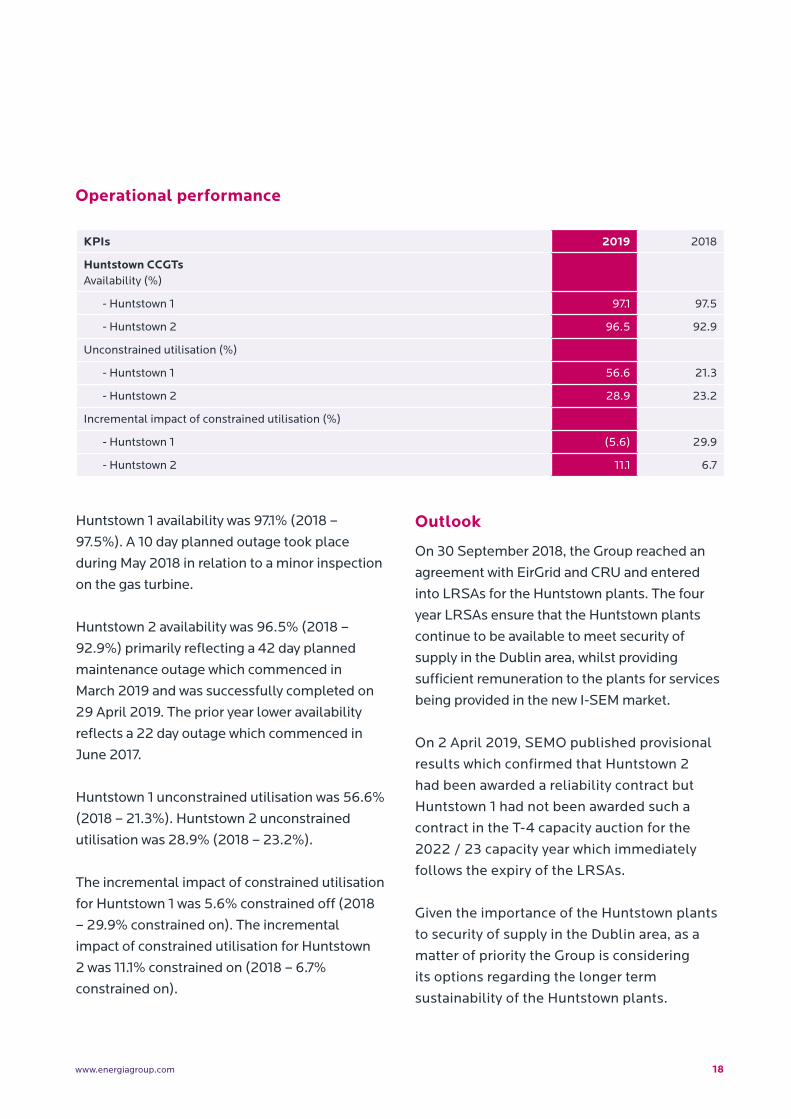
KPIs 2019 2018
Huntstown CCGTs Availability (%)
- Huntstown 1 97.1 97.5
- Huntstown 2 96.5 92.9
Unconstrained utilisation (%)
- Huntstown 1 56.6 21.3
- Huntstown 2 28.9 23.2
Incremental impact of constrained utilisation (%)
- Huntstown 1 (5.6) 29.9
- Huntstown 2 11.1 6.7
Huntstown 1 availability was 97.1% (2018 –
97.5%). A 10 day planned outage took place
during May 2018 in relation to a minor inspection
on the gas turbine.
Huntstown 2 availability was 96.5% (2018 –
92.9%) primarily reflecting a 42 day planned
maintenance outage which commenced in
March 2019 and was successfully completed on
29 April 2019. The prior year lower availability
reflects a 22 day outage which commenced in
June 2017.
Huntstown 1 unconstrained utilisation was 56.6%
(2018 – 21.3%). Huntstown 2 unconstrained
utilisation was 28.9% (2018 – 23.2%).
The incremental impact of constrained utilisation
for Huntstown 1 was 5.6% constrained off (2018
– 29.9% constrained on). The incremental
impact of constrained utilisation for Huntstown
2 was 11.1% constrained on (2018 – 6.7%
constrained on).
Outlook
On 30 September 2018, the Group reached an
agreement with EirGrid and CRU and entered
into LRSAs for the Huntstown plants. The four
year LRSAs ensure that the Huntstown plants
continue to be available to meet security of
supply in the Dublin area, whilst providing
sufficient remuneration to the plants for services
being provided in the new I-SEM market.
On 2 April 2019, SEMO published provisional
results which confirmed that Huntstown 2
had been awarded a reliability contract but
Huntstown 1 had not been awarded such a
contract in the T-4 capacity auction for the
2022 / 23 capacity year which immediately
follows the expiry of the LRSAs.
Given the importance of the Huntstown plants
to security of supply in the Dublin area, as a
matter of priority the Group is considering
its options regarding the longer term
sustainability of the Huntstown plants.

19 Energia Group Limited Consolidated Financial Statements 2018 - 2019
EBITDA increased to €48.0m (2018 - €40.5m)
primarily reflecting higher residential and non-
residential margins in the RoI (reflecting higher
volumes and market prices), partly offset by
higher operating costs in Power NI.
Net capital expenditure increased to €17.5m
(2018 - €14.9m) primarily reflecting expenditure
on I-SEM systems introduced on 1 October 2018
and the upgrade of Energia’s billing system.
2019 €m
2018 €m
EBITDA 48.0 40.5
Capital expenditure 17.5 14.9
Customer Solutions
Overview
The Group’s Customer Solutions business
operates under the Energia and Power NI brands.
Energia supplies electricity to business and
residential customers in the RoI and business
customers in Northern Ireland.
Energia also supplies natural gas to business and
residential customers in the RoI.
Power NI is the regulated electricity supplier
in Northern Ireland and supplies electricity to
business and residential customers.
The Group is assessing a number of flexible
generation, energy storage and behind the
meter projects in line with its strategy to grow
the business in a manner which supports its
renewable asset portfolio and product offerings
to customers.
Financial performance
20www.energiagroup.com
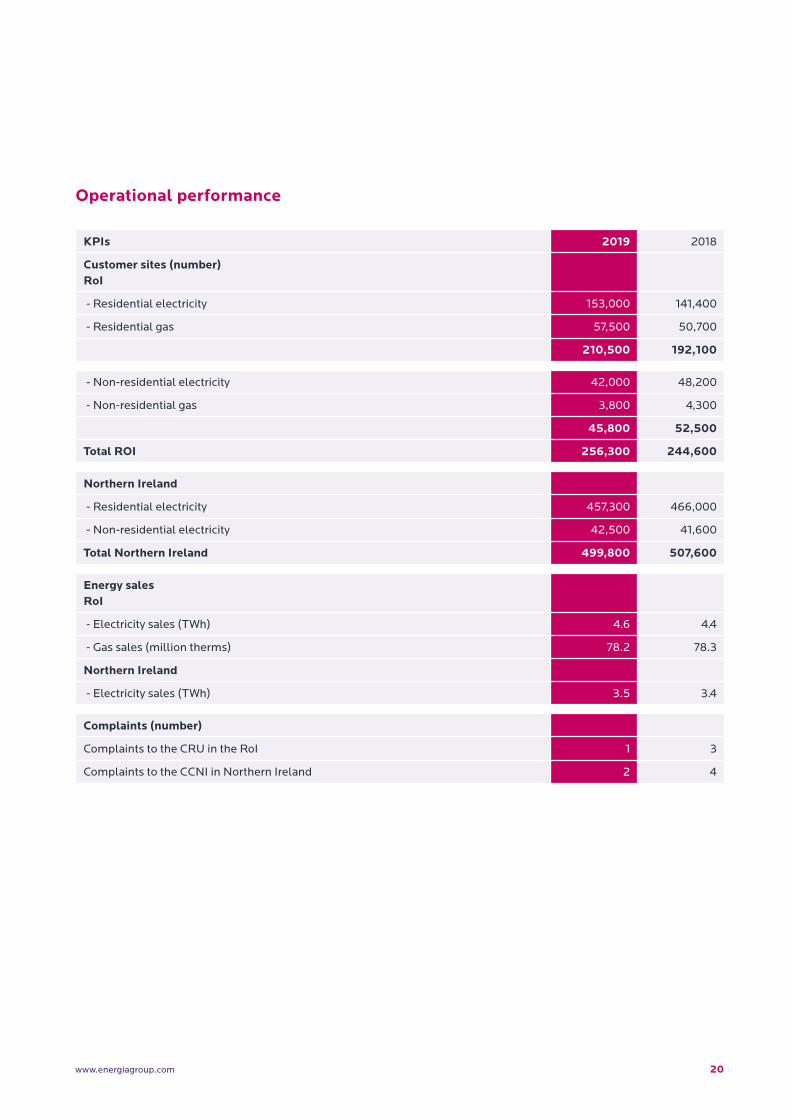
Operational performance
KPIs 2019 2018
Customer sites (number) RoI
- Residential electricity 153,000 141,400
- Residential gas 57,500 50,700
210,500 192,100
- Non-residential electricity 42,000 48,200
- Non-residential gas 3,800 4,300
45,800 52,500
Total ROI 256,300 244,600
Northern Ireland
- Residential electricity 457,300 466,000
- Non-residential electricity 42,500 41,600
Total Northern Ireland 499,800 507,600
Energy salesRoI
- Electricity sales (TWh) 4.6 4.4
- Gas sales (million therms) 78.2 78.3
Northern Ireland
- Electricity sales (TWh) 3.5 3.4
Complaints (number)
Complaints to the CRU in the RoI 1 3
Complaints to the CCNI in Northern Ireland 2 4
21 Energia Group Limited Consolidated Financial Statements 2018 - 2019
Residential electricity and gas customer sites in
the RoI increased to 210,500 at 31 March 2019
(2018 – 192,100) reflecting continued growth in
these markets.
Non-residential electricity customer sites in
the RoI were 42,000 at 31 March 2019 (2018
– 48,200). Non-residential gas customer sites
in the RoI were 3,800 at 31 March 2019 (2018 –
4,300).
Residential customer numbers in Northern
Ireland decreased to 457,300 at 31 March 2019
(2018 – 466,000). Non-residential customer
numbers in Northern Ireland were 42,500 at 31
March 2019 (2018 – 41,600).
Total electricity sales volumes in the RoI were
4.6TWh (2018 – 4.4TWh) and in Northern Ireland
were 3.5TWh (2018 – 3.4TWh). RoI gas sales
volumes were 78.2m therms (2018 – 78.3m
therms).
During the year, the Group received one (2018
– three) complaint which was referred to the
CRU and two (2018 – four) complaints which
were referred to the CCNI. The number of
complaints continues to compare favourably
with best practice in Great Britain and represents
best practice in the Northern Ireland residential
electricity supply market.
Outlook
The Group is investing in its digital platform to
enable the continued delivery of innovative,
enhanced and differentiated product offerings to
customers.
Regulatory and other business developments
Renewables
RoI Government Support for renewablesThe RoI Government has proposed a new
Renewable Electricity Support Scheme (RESS)
which will provide support to renewable
electricity projects in the RoI, subject to EU State
Aid approval clearance. With a primary focus on
cost effectiveness, the RESS will help deliver
renewable electricity policy to 2030. The scheme
design will be auction based and auctions will be
held at frequent intervals throughout the lifetime
of the scheme. The final scheme will be subject
to the receipt of State Aid clearance from The EU
Commission. The Minister for Communications,
Climate Action and Environment announced
on 28 March 2019 that the RoI Government
would set itself a target to achieve 70% of
Ireland’s electricity supply to be generated from
renewables by 2030. Flexible Generation
Regulatory process in respect of I-SEM capacity remuneration mechanismOn 30 September 2018 the Group reached
agreement with EirGrid and CRU and entered
into LRSAs for the Huntstown plants. The four
year LRSAs ensure that the Huntstown plants
continue to be available to meet security of
supply in the Dublin area whilst providing
sufficient remuneration to the plants for the
services being provided in the new I-SEM market.
Following expiry of the LRSAs on 30 September
2022, the Group has agreed potentially to make
22www.energiagroup.com
a proportion of Huntstown’s firm access rights
to the transmission system available to EirGrid
for a period of two years to facilitate EirGrid in
alleviating the Dublin transmission constraints.
On signing of the LRSAs the Group accepted the
I-SEM related generating licence modifications
previously challenged by the Group. The
protective notice of redundancy was also
removed for relevant Huntstown staff.
I-SEM market and capacity remuneration mechanism auction updateFollowing the SEM Committee’s confirmation on
31 August 2018, the new I-SEM market went live
on 1 October 2018. On 21 December 2018, SEMO
published provisional results which confirmed
that both Huntstown plants had been awarded
reliability options in the T-1 capacity auction for
the 2019/20 capacity year. The auction clearing
price was €40,646/MW and the final results
were confirmed on 1 February 2019.
On 2 April 2019, SEMO published provisional
results which confirmed that Huntstown 2
had been awarded a reliability option contract
but Huntstown 1 had not been awarded such
a contract in the T-4 capacity auction for the
2022/23 capacity year. The auction clearing
price was €46,150/MW and the final results were
confirmed on 4 April 2019. Given the importance
of the Huntstown plants to security of supply in
the Dublin area, as a matter of priority the Group
is considering its options regarding the longer
term sustainability of the Huntstown plants.
PPB price controlThe Utility Regulator (UR) published, on 14
January 2019, its decision paper and proposed
licence modifications necessary to implement
the revised PPB price control. Publication of
the final licence modifications is expected
imminently. The revised price control is
scheduled to run until September 2023 to
coincide with the expiry of the Generating Unit
Agreements covering 600MW of CCGT capacity
at the Ballylumford Power Station.
Customer SolutionsPower NI Price controlOn 25 May 2018 the UR confirmed its intention
to extend Power NI’s current price control a
further two years, from 1 April 2019 to 31 March
2021, based on Power NI agreeing to share with
customers the benefits of annual efficiency gains
made during the current price control period.

23 Energia Group Limited Consolidated Financial Statements 2018 - 2019
24www.energiagroup.com 24
Summary of Financial Performance
25 Energia Group Limited Consolidated Financial Statements 2018 - 2019
Summary of Financial PerformanceRevenue
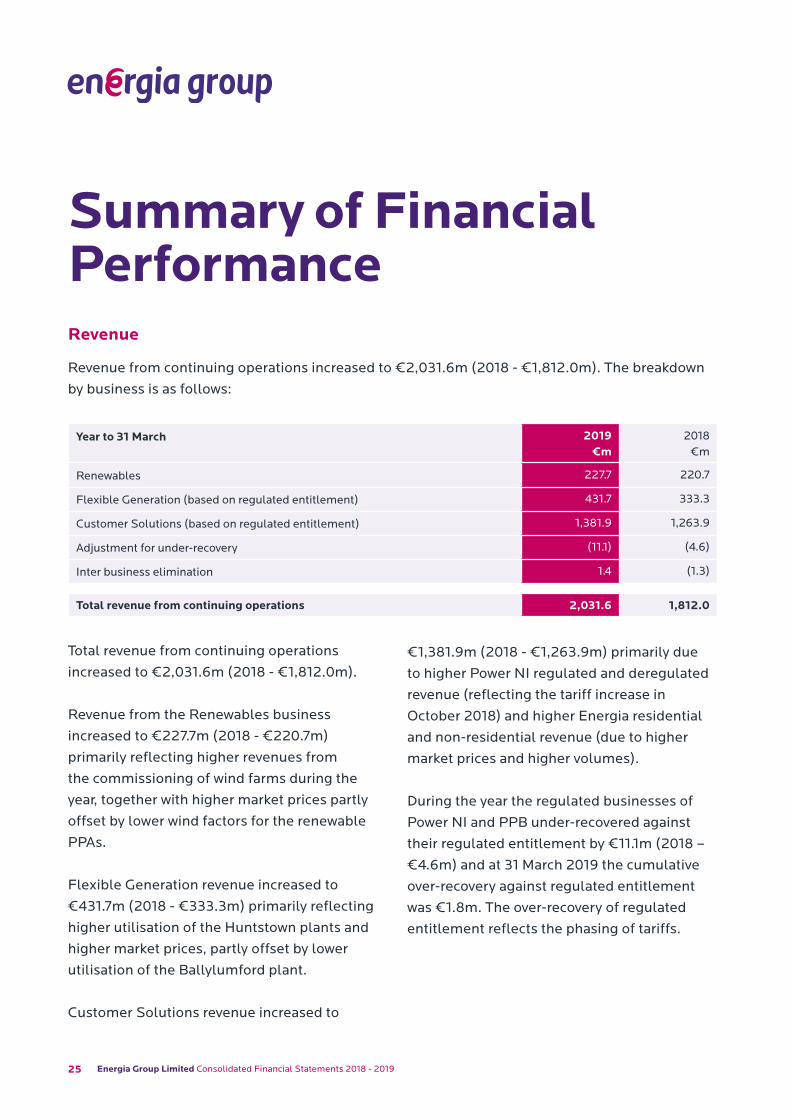
Revenue from continuing operations increased to €2,031.6m (2018 - €1,812.0m). The breakdown
by business is as follows:
Year to 31 March 2019 €m
2018 €m
Renewables 227.7 220.7
Flexible Generation (based on regulated entitlement) 431.7 333.3
Customer Solutions (based on regulated entitlement) 1,381.9 1,263.9
Adjustment for under-recovery (11.1) (4.6)
Inter business elimination 1.4 (1.3)
Total revenue from continuing operations 2,031.6 1,812.0
Total revenue from continuing operations
increased to €2,031.6m (2018 - €1,812.0m).
Revenue from the Renewables business
increased to €227.7m (2018 - €220.7m)
primarily reflecting higher revenues from
the commissioning of wind farms during the
year, together with higher market prices partly
offset by lower wind factors for the renewable
PPAs.
Flexible Generation revenue increased to
€431.7m (2018 - €333.3m) primarily reflecting
higher utilisation of the Huntstown plants and
higher market prices, partly offset by lower
utilisation of the Ballylumford plant.
Customer Solutions revenue increased to
€1,381.9m (2018 - €1,263.9m) primarily due
to higher Power NI regulated and deregulated
revenue (reflecting the tariff increase in
October 2018) and higher Energia residential
and non-residential revenue (due to higher
market prices and higher volumes).
During the year the regulated businesses of
Power NI and PPB under-recovered against
their regulated entitlement by €11.1m (2018 –
€4.6m) and at 31 March 2019 the cumulative
over-recovery against regulated entitlement
was €1.8m. The over-recovery of regulated
entitlement reflects the phasing of tariffs.
26www.energiagroup.com
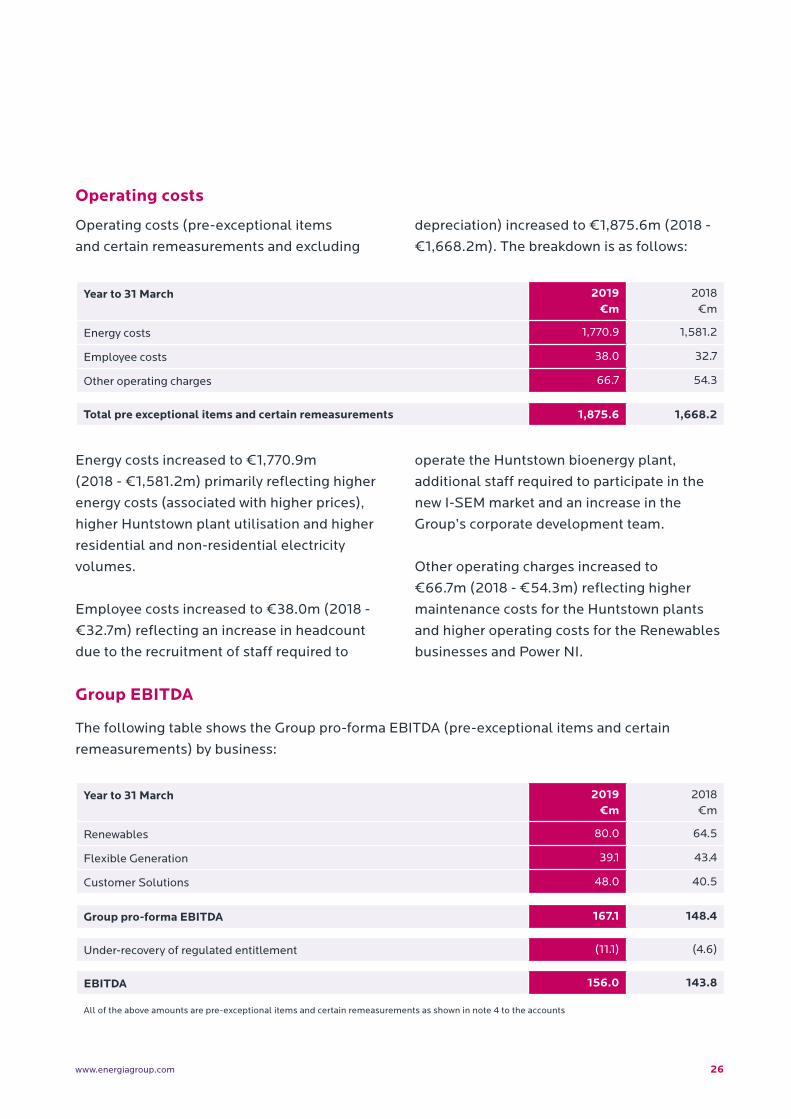
Operating costs
Operating costs (pre-exceptional items
and certain remeasurements and excluding
depreciation) increased to €1,875.6m (2018 -
€1,668.2m). The breakdown is as follows:
Energy costs increased to €1,770.9m
(2018 - €1,581.2m) primarily reflecting higher
energy costs (associated with higher prices),
higher Huntstown plant utilisation and higher
residential and non-residential electricity
volumes.
Employee costs increased to €38.0m (2018 -
€32.7m) reflecting an increase in headcount
due to the recruitment of staff required to
operate the Huntstown bioenergy plant,
additional staff required to participate in the
new I-SEM market and an increase in the
Group’s corporate development team.
Other operating charges increased to
€66.7m (2018 - €54.3m) reflecting higher
maintenance costs for the Huntstown plants
and higher operating costs for the Renewables
businesses and Power NI.
Year to 31 March 2019 €m
2018 €m
Energy costs 1,770.9 1,581.2
Employee costs 38.0 32.7
Other operating charges 66.7 54.3
Total pre exceptional items and certain remeasurements 1,875.6 1,668.2
Group EBITDA
The following table shows the Group pro-forma EBITDA (pre-exceptional items and certain
remeasurements) by business:
Year to 31 March 2019 €m
2018 €m
Renewables 80.0 64.5
Flexible Generation 39.1 43.4
Customer Solutions 48.0 40.5
Group pro-forma EBITDA 167.1 148.4
Under-recovery of regulated entitlement (11.1) (4.6)
EBITDA 156.0 143.8
All of the above amounts are pre-exceptional items and certain remeasurements as shown in note 4 to the accounts
27 Energia Group Limited Consolidated Financial Statements 2018 - 2019
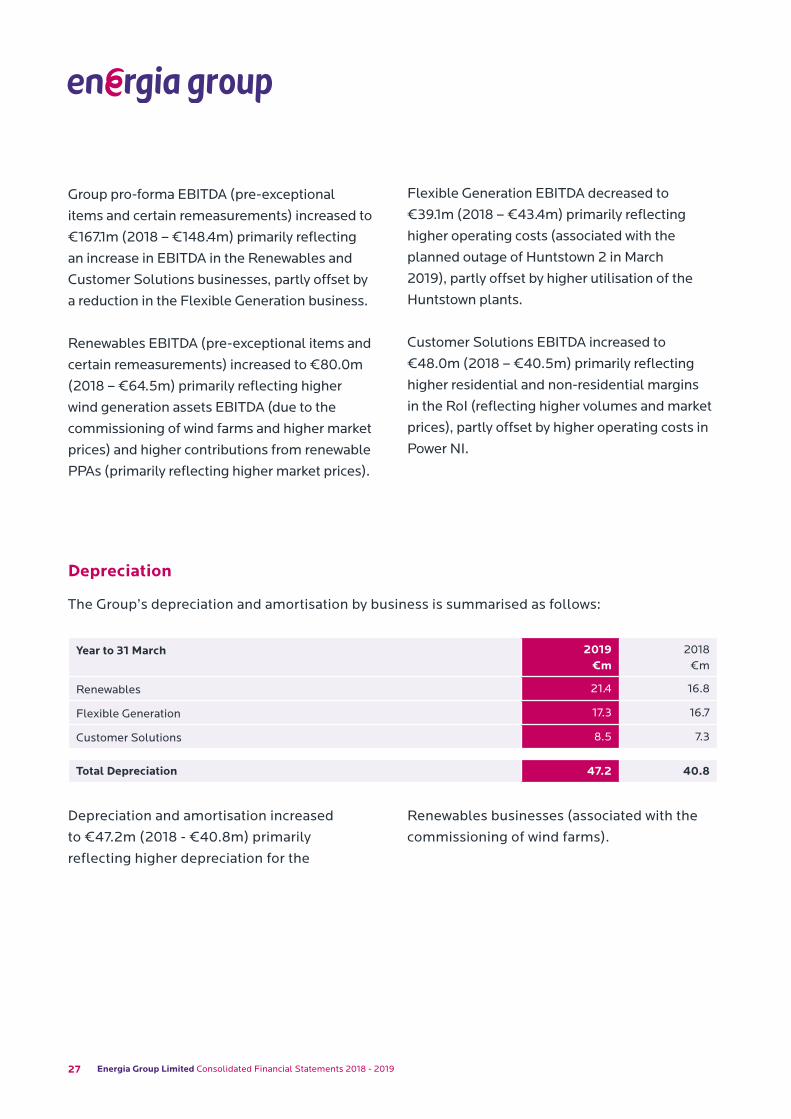
Depreciation and amortisation increased
to €47.2m (2018 - €40.8m) primarily
reflecting higher depreciation for the
Renewables businesses (associated with the
commissioning of wind farms).
Year to 31 March 2019 €m
2018 €m
Renewables 21.4 16.8
Flexible Generation 17.3 16.7
Customer Solutions 8.5 7.3
Total Depreciation 47.2 40.8
Depreciation
The Group’s depreciation and amortisation by business is summarised as follows:
Group pro-forma EBITDA (pre-exceptional
items and certain remeasurements) increased to
€167.1m (2018 – €148.4m) primarily reflecting
an increase in EBITDA in the Renewables and
Customer Solutions businesses, partly offset by
a reduction in the Flexible Generation business.
Renewables EBITDA (pre-exceptional items and
certain remeasurements) increased to €80.0m
(2018 – €64.5m) primarily reflecting higher
wind generation assets EBITDA (due to the
commissioning of wind farms and higher market
prices) and higher contributions from renewable
PPAs (primarily reflecting higher market prices).
Flexible Generation EBITDA decreased to
€39.1m (2018 – €43.4m) primarily reflecting
higher operating costs (associated with the
planned outage of Huntstown 2 in March
2019), partly offset by higher utilisation of the
Huntstown plants.
Customer Solutions EBITDA increased to
€48.0m (2018 – €40.5m) primarily reflecting
higher residential and non-residential margins
in the RoI (reflecting higher volumes and market
prices), partly offset by higher operating costs in
Power NI.
28www.energiagroup.com
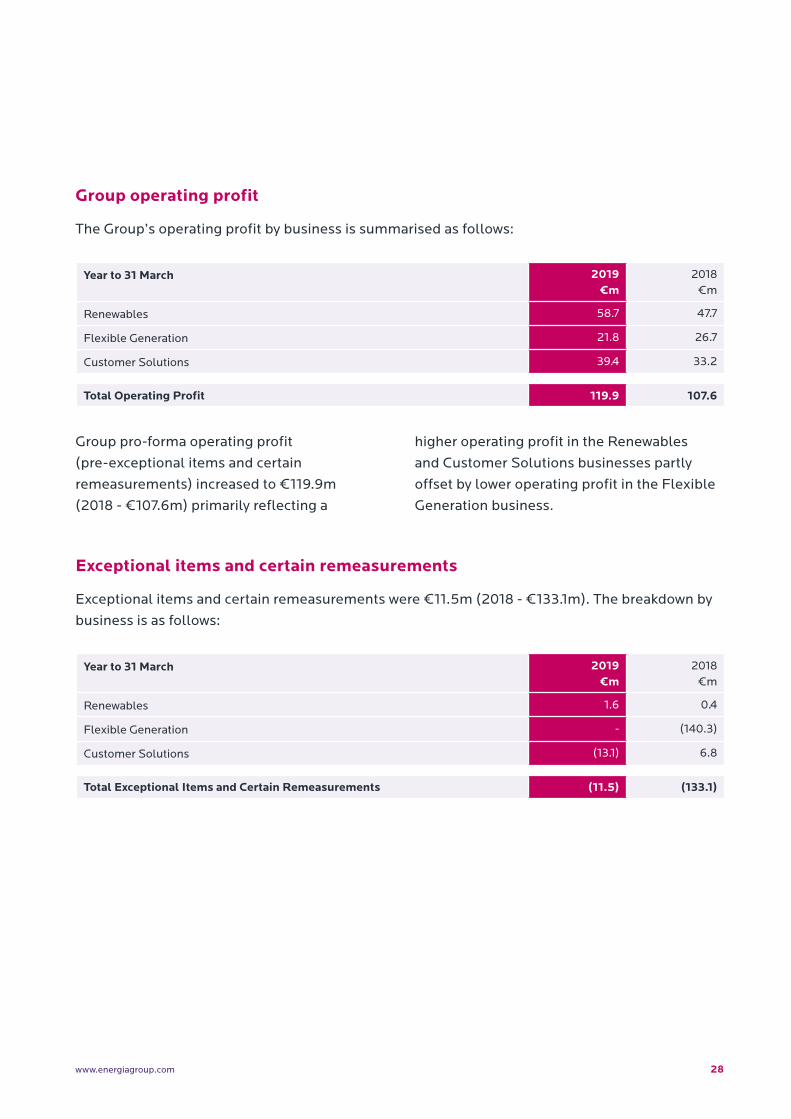
Group pro-forma operating profit
(pre-exceptional items and certain
remeasurements) increased to €119.9m
(2018 - €107.6m) primarily reflecting a
higher operating profit in the Renewables
and Customer Solutions businesses partly
offset by lower operating profit in the Flexible
Generation business.
Group operating profit
The Group’s operating profit by business is summarised as follows:
Year to 31 March 2019 €m
2018 €m
Renewables 58.7 47.7
Flexible Generation 21.8 26.7
Customer Solutions 39.4 33.2
Total Operating Profit 119.9 107.6
Year to 31 March 2019 €m
2018 €m
Renewables 1.6 0.4
Flexible Generation - (140.3)
Customer Solutions (13.1) 6.8
Total Exceptional Items and Certain Remeasurements (11.5) (133.1)
Exceptional items and certain remeasurements
Exceptional items and certain remeasurements were €11.5m (2018 - €133.1m). The breakdown by
business is as follows:
29 Energia Group Limited Consolidated Financial Statements 2018 - 2019
Exceptional items in the Renewables business
were a €1.6m credit (2018 - €0.4m credit)
reflecting a fair value adjustment to contingent
consideration of €1.8m (2018 – €0.4m), partly
offset by exceptional acquisition costs of
€0.2m (2018 - €nil).
Exceptional items in the Flexible Generation
business were €nil (2018 - €140.3m).
Exceptional items in 2018 related to an
impairment of the property, plant and
equipment of the Huntstown plants associated
with the impact of the new I-SEM market
introduced 1 October 2018.
Exceptional items in the Customer Solutions
business were €13.1m (2018 - €6.8m credit)
reflecting certain remeasurements of €13.0m
loss (2018 - €7.2m gain) relating to the
recognition of the fair value of derivatives,
partly offset by exceptional acquisition costs of
€0.1m (2018 - €0.4m). Further information is
outlined in note 7 to the accounts.
Net finance costs
Net finance costs (pre-exceptional items and
certain remeasurements) decreased from
€52.9m to €45.8m primarily reflecting a
decrease in the Senior secured notes interest
charge associated with the refinancing
undertaken in September 2017, partly offset by
the impact of foreign exchange movements in
the period compared to the same period last
year.
Tax charge
The total tax charge (pre-exceptional items
and certain remeasurements) was €10.4m
(2018 – €4.7m). A detailed analysis of the tax
charge is outlined in note 11 to the accounts.
Cash flow before acquisitions, disposals, interest and tax
Group cash flow before acquisitions, disposals,
interest and tax of continuing operations is
summarised on the following page.
30www.energiagroup.com
Year to 31 March 2019 €m
2018 €m
Group pro-forma EBITDA1 167.1 148.4
Defined benefit pension charge less contributions paid (1.1) (1.3)
Net movement in security deposits (7.0) (1.8)
Changes in working capital2 43.8 16.9
Under-recovery of regulated entitlement (11.1) (4.6)
Exceptional items (0.3) (0.4)
Foreign exchange translation (1.6) 2.0
Share based payment 0.6 -
Cash flow from operating activities 190.4 159.2
Net capital expenditure3 (89.6) (85.1)
Cash flow before acquisitions, disposals, interest and tax 100.8 74.1
1 Includes EBITDA of project financed renewable assets of €40.1m (2018 - €31.3m).2 Includes changes in working capital of project financed renewable assets of €4.0m increase (2018 – €4.3m increase) and net expenditure from the
sale and purchases of other intangibles of €10.4m outflow (2018 - €8.4m inflow).3 Includes capital expenditure on project financed renewable assets of €65.7m (2018 - €69.5m) and intangible asset (software and customer acquisition
costs) expenditure of €16.4m (2018 - €14.2m).
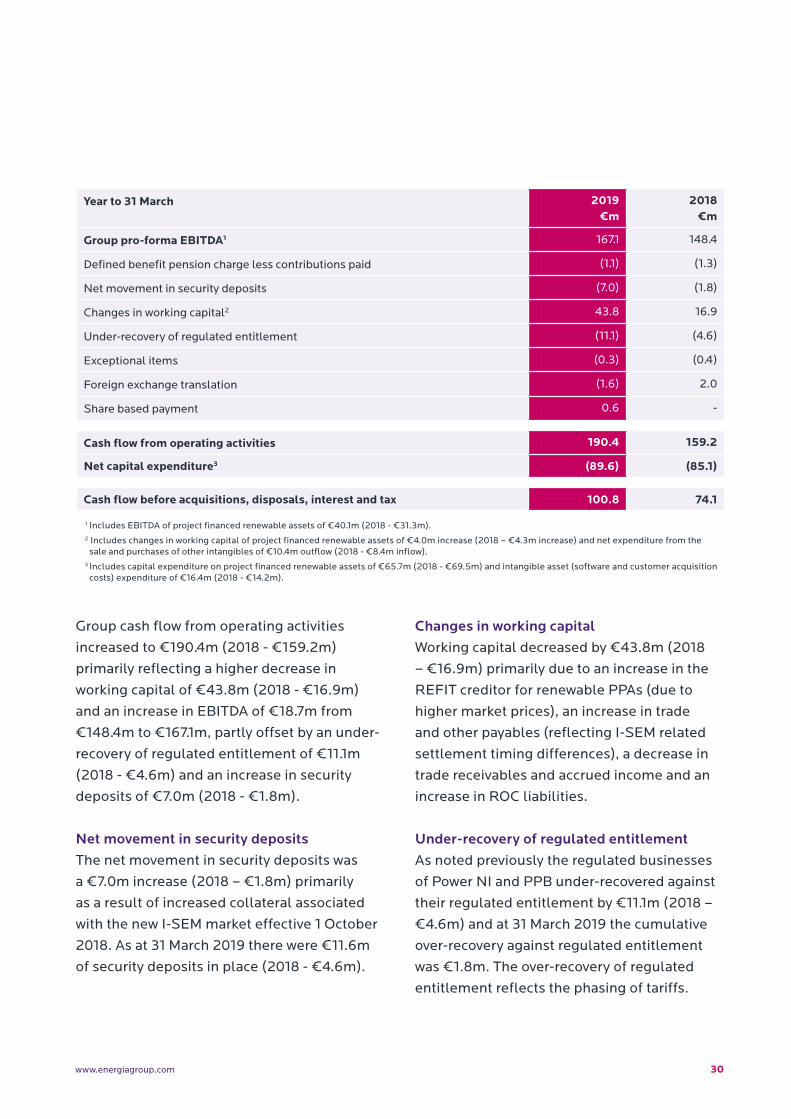
Group cash flow from operating activities
increased to €190.4m (2018 - €159.2m)
primarily reflecting a higher decrease in
working capital of €43.8m (2018 - €16.9m)
and an increase in EBITDA of €18.7m from
€148.4m to €167.1m, partly offset by an under-
recovery of regulated entitlement of €11.1m
(2018 - €4.6m) and an increase in security
deposits of €7.0m (2018 - €1.8m).
Net movement in security depositsThe net movement in security deposits was
a €7.0m increase (2018 – €1.8m) primarily
as a result of increased collateral associated
with the new I-SEM market effective 1 October
2018. As at 31 March 2019 there were €11.6m
of security deposits in place (2018 - €4.6m).
Changes in working capitalWorking capital decreased by €43.8m (2018
– €16.9m) primarily due to an increase in the
REFIT creditor for renewable PPAs (due to
higher market prices), an increase in trade
and other payables (reflecting I-SEM related
settlement timing differences), a decrease in
trade receivables and accrued income and an
increase in ROC liabilities.
Under-recovery of regulated entitlementAs noted previously the regulated businesses
of Power NI and PPB under-recovered against
their regulated entitlement by €11.1m (2018 –
€4.6m) and at 31 March 2019 the cumulative
over-recovery against regulated entitlement
was €1.8m. The over-recovery of regulated
entitlement reflects the phasing of tariffs.
31 Energia Group Limited Consolidated Financial Statements 2018 - 2019
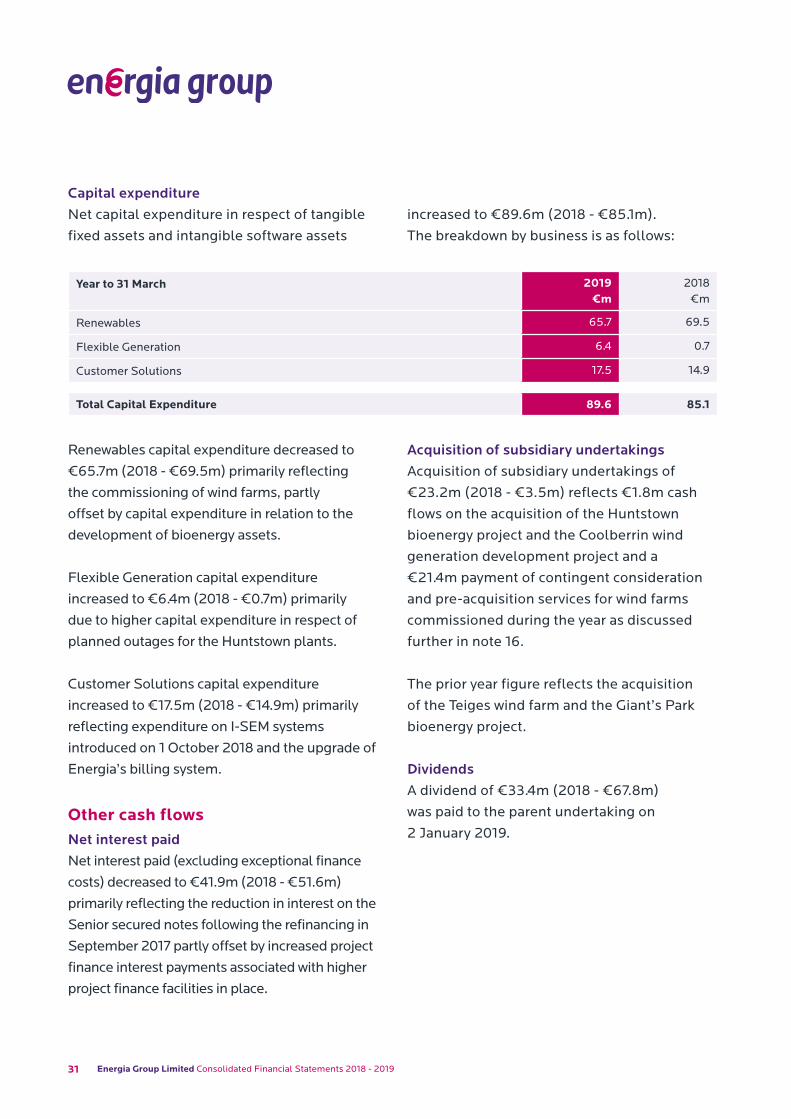
Renewables capital expenditure decreased to
€65.7m (2018 - €69.5m) primarily reflecting
the commissioning of wind farms, partly
offset by capital expenditure in relation to the
development of bioenergy assets.
Flexible Generation capital expenditure
increased to €6.4m (2018 - €0.7m) primarily
due to higher capital expenditure in respect of
planned outages for the Huntstown plants.
Customer Solutions capital expenditure
increased to €17.5m (2018 - €14.9m) primarily
reflecting expenditure on I-SEM systems
introduced on 1 October 2018 and the upgrade of
Energia’s billing system.
Other cash flowsNet interest paidNet interest paid (excluding exceptional finance
costs) decreased to €41.9m (2018 - €51.6m)
primarily reflecting the reduction in interest on the
Senior secured notes following the refinancing in
September 2017 partly offset by increased project
finance interest payments associated with higher
project finance facilities in place.
Acquisition of subsidiary undertakingsAcquisition of subsidiary undertakings of
€23.2m (2018 - €3.5m) reflects €1.8m cash
flows on the acquisition of the Huntstown
bioenergy project and the Coolberrin wind
generation development project and a
€21.4m payment of contingent consideration
and pre-acquisition services for wind farms
commissioned during the year as discussed
further in note 16.
The prior year figure reflects the acquisition
of the Teiges wind farm and the Giant’s Park
bioenergy project.
DividendsA dividend of €33.4m (2018 - €67.8m)
was paid to the parent undertaking on
2 January 2019.
Year to 31 March 2019 €m
2018 €m
Renewables 65.7 69.5
Flexible Generation 6.4 0.7
Customer Solutions 17.5 14.9
Total Capital Expenditure 89.6 85.1
Capital expenditureNet capital expenditure in respect of tangible
fixed assets and intangible software assets
increased to €89.6m (2018 - €85.1m).
The breakdown by business is as follows:
32www.energiagroup.com
Year to 31 March 2019 €m
2018 €m
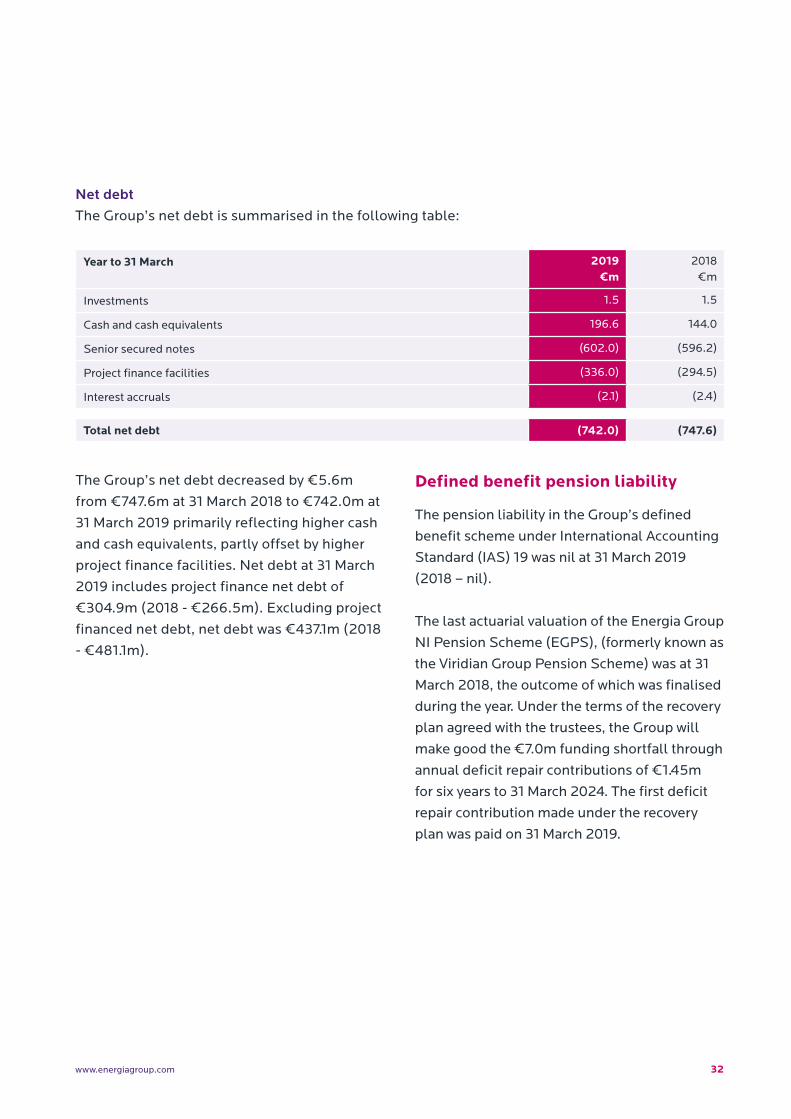
Investments 1.5 1.5
Cash and cash equivalents 196.6 144.0
Senior secured notes (602.0) (596.2)
Project finance facilities (336.0) (294.5)
Interest accruals (2.1) (2.4)
Total net debt (742.0) (747.6)
The Group’s net debt decreased by €5.6m
from €747.6m at 31 March 2018 to €742.0m at
31 March 2019 primarily reflecting higher cash
and cash equivalents, partly offset by higher
project finance facilities. Net debt at 31 March
2019 includes project finance net debt of
€304.9m (2018 - €266.5m). Excluding project
financed net debt, net debt was €437.1m (2018
- €481.1m).
Defined benefit pension liability
The pension liability in the Group’s defined
benefit scheme under International Accounting
Standard (IAS) 19 was nil at 31 March 2019
(2018 – nil).
The last actuarial valuation of the Energia Group
NI Pension Scheme (EGPS), (formerly known as
the Viridian Group Pension Scheme) was at 31
March 2018, the outcome of which was finalised
during the year. Under the terms of the recovery
plan agreed with the trustees, the Group will
make good the €7.0m funding shortfall through
annual deficit repair contributions of €1.45m
for six years to 31 March 2024. The first deficit
repair contribution made under the recovery
plan was paid on 31 March 2019.
Net debtThe Group’s net debt is summarised in the following table:

33 Energia Group Limited Consolidated Financial Statements 2018 - 2019
34www.energiagroup.com 34
Market Structure
35 Energia Group Limited Consolidated Financial Statements 2018 - 2019
Market StructureSINGLE ELECTRICITY MARKET
The Single Electricity Market (SEM) is the
wholesale electricity market for the island of
Ireland. First going live on 1 November 2007 as a
gross mandatory pool, the market trades wholesale
electricity in Ireland and Northern Ireland on
an all-island basis. New market arrangements
commenced on 1 October 2018, which were
designed to integrate the all-island electricity
market with European electricity markets, making
optimal use of cross-border interconnectors
through a single marketplace and common rules.
The new trading arrangements comprise a Day
Ahead Market, Intra-Day Market and Balancing
Market. A new auction-based capacity market
was also introduced to replace the previous
administrative capacity payments mechanism. The
new auction-based capacity mechanism awards
capacity contracts and imposes reliability penalties
on the holders of capacity contracts if they do
not provide the contracted capacity when market
prices exceed the Reliability Option Strike Price. To
allow for an immediate transition to the Capacity
Remuneration Mechanism (CRM) once the I-SEM
was implemented, a first transitional capacity
auction was held in December 2017. This was a
single auction to cover the period from go-live
on 1 October 2018 to September 2019 (2018/19
capacity year). The second transitional auction for
capacity year 2019/20 was held in December 2018
with the remaining transitional auctions scheduled
to take place in December 2019 to cover the
2020/21 and 2021/22 capacity periods.
The SEM is jointly regulated by the CRU in the
RoI and the UR in Northern Ireland. The decision-
making body which governs the market is the SEM
Committee (SEMC).
REPUBLIC OF IRELAND
Regulators
Overall policy responsibility for the energy sector
lies with the Minister for Communications, Climate
Action and Environment (the Minister). In this
capacity, the Minister is advised by the Department
of Communications Climate Action and
Environment (DCCAE) and other statutory bodies
including the CRU and the Sustainable Energy
Authority of Ireland (SEAI).
The principal objective of CRU in carrying out
its functions in relation to energy is to protect
the interests of energy consumers, wherever
appropriate by promoting effective competition
between persons engaged in, or in commercial
activities connected with, the generation,
transmission or supply of electricity and the
transportation and supply of natural gas. CRU has
a duty to carry out its functions in a manner which
does not discriminate between market participants.
36www.energiagroup.com
Transmission & Distribution network ownership and operation
Electricity Supply Board (ESB) is the incumbent
electricity utility in the RoI and its network
functions are ring-fenced from its generation
and supply interests. EirGrid is the independent
Transmission System Operator (TSO) and also
owns the East/West Interconnector.
Renewable energy
The RoI Government has a target for 40% of
electricity consumption to come from renewable
sources by 2020.
The REFIT support mechanism was designed
to encourage renewable generation in the RoI.
Under REFIT, suppliers and renewable energy
generators entered into a PPA for a minimum of
15 years. In return for entering into the PPA, the
supplier receives a supplier balancing payment
equal to 15% of the base REFIT tariff for large
scale wind. The supplier is also entitled to
compensation if the market price of electricity
falls below the REFIT tariff.
The existing primary supports, REFIT 2 and
REFIT 3, closed for new applications on 31
December 2015 and required projects to be
built and operational by 31 December 2017.
However this was extended, subject to specific
criteria being met, for REFIT 2 to allow projects
to be connected by 31 December 2019 and for
REFIT 3 to allow projects to be operational by 30
September 2019.
In March 2019, the RoI Government confirmed
that the REFIT scheme would not be further
extended.
The RoI Government has proposed a new
RESS which will provide support to renewable
electricity projects in the RoI, subject to EU
State Aid approval clearance. With a primary
focus on cost effectiveness, the RESS will help
deliver renewable electricity policy to 2030.
The scheme design will be auction based and
auctions will be held at frequent intervals
throughout the lifetime of the scheme. The
final scheme will be subject to the receipt of
State Aid clearance from the EU Commission.
The Minister announced on the 28 March 2019
that the government would set itself a target to
achieve 70% of Ireland’s electricity supply to be
generated from renewables by 2030
NORTHERN IRELAND
Regulators
The UR and the Department for the Economy
(DfE) are the principal regulators. Each is given
specific powers, duties and functions under the
relevant legislation.
The principal objective of both the UR and
DfE in carrying out their functions in relation
to electricity is to protect the interests of
consumers of electricity, wherever appropriate,
by promoting effective competition between
those engaged in, or in commercial activities
connected with, the generation, transmission or
supply of electricity.
37 Energia Group Limited Consolidated Financial Statements 2018 - 2019
Transmission & Distribution network ownership and operation
Northern Ireland Electricity Networks (NIEN)
owns the transmission and distribution
networks in Northern Ireland and System
Operator for Northern Ireland is the
independent TSO.
Price controls
Power NI and PPB are subject to price controls,
defined in formulae set out in Power NI
Energy’s licence, which limit the revenues they
may earn and the prices they may charge. The
principles of price regulation employed in the
relevant licence conditions reflect the general
duties of the UR and DfE under the relevant
legislation. These include having regard to
the need to ensure that licensees are able to
finance their authorised activities.
If the amount of revenue recovered in any
one year exceeds or falls short of the amount
allowed by the relevant price control formula, a
correction factor operates in the following year
to give back any surplus with interest, or to
recover any deficit with interest, as appropriate.
A surplus is referred to as an over-recovery and
a deficit as an under-recovery.
Renewable energy
The Northern Ireland Assembly has a target of
sourcing 40% of Northern Ireland’s electricity
from renewable sources by 2020, as reflected
in the Strategic Energy Framework 2010-2020.
The United Kingdom (UK) Renewable
Obligation (RO) scheme applies in Northern
Ireland. The RO scheme is designed to
incentivise the generation of electricity from
renewable sources. The scheme places an
obligation on suppliers to source a portion of
their electricity from renewable sources. Under
the RO scheme, eligible renewable generators
receive ROCs for each MWh of electricity
generated. ROCs are freely tradeable and
can be sold to suppliers in order to fulfil their
obligation. Suppliers can either present ROCs
to cover their obligation or pay a buy-out fee
for any shortfall. All proceeds from buy-out
fees are recycled to the holders of ROCs.
The Renewable Obligation Closure Order
(Northern Ireland) 2016 came into effect
on 17 March 2016. This legislation closed
the Northern Ireland Renewable Obligation
(NIRO) to new large (above 5MW) onshore
wind generating stations from 1 April 2016.
The NIRO Closure Order 2016 introduced
various grace periods for stations to enable
them to qualify for ROCs notwithstanding that
they would otherwise be affected by the early
closure. If grace period conditions are met
generating capacity could gain accreditation

38www.energiagroup.com
under the NIRO between 1 April 2016 and 31
December 2018. Similar legislation came into
force for small scale onshore wind generating
capacity on 29 June 2016.
ROC benefit rights will be grandfathered
to projects that accredit under the NIRO
following its closure. Generation accrediting
under the NIRO will receive full support under
the RO until 2037. From 2027 fixed price
certificates will be issued, in place of ROCs,
to projects qualifying for RO support until the
end of the RO mechanism in 2037. Fixed price
certificates will be set at the 2027 buyout price,
plus 10% and will be inflation linked.

39 Energia Group Limited Consolidated Financial Statements 2018 - 2019
40www.energiagroup.com 40
Risk Management and Principal Risks and Uncertainties
41 Energia Group Limited Consolidated Financial Statements 2018 - 2019
Risk Management and Principal Risks and UncertaintiesThe Group operates a structured and disciplined
approach to the management of risk. Its
approach is to conduct business in a manner
which balances costs and risks while taking
account of all its stakeholders and protecting
the Group’s performance and reputation by
prudently managing the risks inherent in the
businesses. Management regularly identifies
and considers the risks to which the businesses
are exposed. Management’s assessment of the
key risks and the associated controls and actions
required to mitigate these risks are recorded
in business risk registers. Each risk is regularly
assessed for the severity of its impact on the
business and for the effectiveness of the controls
in place. The risk environment is reviewed
continually in order to identify new or emerging
potential risks.
The Group’s Audit Committee, which meets
quarterly, plays a key role in internal control
and risk management. The Audit Committee
monitors the Group’s financial reporting
processes and the effectiveness of the internal
control and risk management systems; reviews
and appraises the activities of the internal and
external auditors; and provides an open channel
of communication among the internal and
external auditors, senior management and the
Board.
The Group’s Risk Management Committee
(RMC) comprises a number of senior managers
from across the Group and meets bi-monthly
to oversee the management of risks and ensure
that adequate and timely action is taken to
mitigate and manage risk. The RMC reviews
individual business and functional risk registers
and reports to the Audit Committee on a
quarterly basis.
The emphasis on sound management structures
and policies and procedures is backed up by
operational and financial review mechanisms
and an externally resourced internal audit
function.
The Director acknowledges that they have
responsibility for the Group’s systems of internal
control and risk management and monitoring
their effectiveness. The purpose of these
systems is to manage, rather than eliminate, the
risk of failure to achieve business objectives, to
provide reasonable assurance as to the quality of
management information and to maintain proper
control over the income, expenditure, assets and
liabilities of the Group. No system of control can,
however, provide absolute assurance against
material misstatement or loss.
42www.energiagroup.com
Accordingly, the Director has regard to those
specific controls, which in their judgement, are
appropriate to the Group’s business given the
relative costs and benefits of implementing
them.
The principal risks and uncertainties that affect
the Group are described below but are not
intended to be an exhaustive analysis of all the
risks that may arise in the ordinary course of
business or otherwise.
Competition in generation and supply of electricity
There is a risk that increased competition
in generation and supply will reduce
margins. Under the I-SEM there are multiple
opportunities to trade electricity. Most electricity
is traded through a day ahead market where a
single day ahead price for each hour, determined
by the day ahead price coupling solution used
across Europe, is received by all generators
with a market position. Capacity payments are
quantity-based in the form of “reliability options”
and issued through a competitive auction
process. The commissioning of new generating
capacity may reduce the SMP and may lead to
increased competition in the capacity auction
process resulting in lower capacity payments,
subject to the impact of plant retirements and
overall levels of demand.
The first transitional auction was held in
December 2017 and covers the 2018/19 capacity
year. The outcome of the first transitional auction
confirmed that Huntstown 1 had been awarded
a reliability option contract but Huntstown 2 had
not been awarded such a contract. Following
an extensive period of negotiation, the Group
reached agreement with EirGrid and CRU and
entered into LRSAs for the Huntstown plants.
The four year LRSAs ensure that the Huntstown
plants continue to be available to meet security
of supply in the Dublin area whilst providing
sufficient remuneration to the plants for services
being provided in the SEM market.
The second transitional auction was held in
December 2018 and covers the 2019/20 capacity
year. The outcome of this auction confirmed
that both Huntstown plants had been awarded
reliability option contracts.
The first T-4 capacity auction covering the
2022/23 capacity year was held in March 2019.
The outcome of this auction confirmed that
Huntstown 2 had been awarded a reliability
option contract but Huntstown 1 had not been
awarded such a contract. The 2022/23 capacity
year period commences on 1 October 2022
following expiry of the LRSAs. As a matter
of priority the Group considering its options
regarding the longer term sustainability of the
Huntstown plants.
The main competitors in the electricity supply
markets in Northern Ireland are SSE Airtricity,
Electric Ireland, Budget Energy and Go Power.
The main competitors in the electricity supply
markets in the RoI are Electric Ireland, Bord
Gáis Energy, SSE Airtricity and PrePay Power.
Certain of the Group’s competitors may be
able to offer lower prices or incentives that may
attract customers away from the Group thereby
reducing its market share, which in turn, may
have a material adverse effect on margins
achieved.
43 Energia Group Limited Consolidated Financial Statements 2018 - 2019
Wholesale electricity price
All electricity (with limited exceptions)
bought and sold across the island of Ireland is
traded through the SEM. The Group manages
wholesale electricity price risk as follows:
• Gas price exposure is hedged when fixed
price customer contracts are signed.
Energia also has the ability to hedge
against the electricity demand of fixed
price contract customers through its
contracted wind capacity and a range of
market sources of capacity such as Contract
for Differences (CfDs) with other market
participants and purchases of power over
the interconnectors. In some of Energia’s
customer contracts, the electricity price
payable by the customer varies according to
the price of gas;
• Power NI’s price control, in relation to its
regulated residential customers, allows
it to pass through the costs of wholesale
electricity subject to compliance with its
economic purchasing obligation, which it
discharges by hedging wholesale electricity
prices in line with policies agreed with the
UR. In relation to its deregulated non-
residential customers, Power NI has the
ability to hedge against the electricity
demand of fixed price contract customers
through market sources of capacity such
as CfDs with other market participants and
offers variable price contract customers
tariffs which are partly or fully indexed to
pool price; and
• PPB is entitled to receive additional
revenues from PSO charges to the extent
that the revenue it receives from the SEM
capacity and energy markets, CfDs and
ancillary services is insufficient to cover its
regulated entitlement.
The new market trading arrangements, which
comprise a Day Ahead Market, Intra-Day
Market and Balancing Market, commenced
on 1 October 2018 and are still in their
infancy. The Group’s energy purchase and
supply businesses remain exposed to energy
and capacity price resettlement risks. The
market operator has not yet resettled these
markets since commencement of the market
on 1 October 2018 and therefore the Group
is exposed to potential price resettlements
in the balancing market. There is a risk that
the impact of resettlement of the balancing
market prices for the six month period from
1 October 2018 to 31 March 2019 could result
in a material difference to the revenues
and energy costs recorded in the financial
statements for this period. The Group
estimates the level of resettlement that will be
applied. These estimates are based on known
market anomalies as extensively discussed in
industry forums and facts and circumstances
known at the Balance Sheet date. Estimations
are dependent on the resettlement approach
taken by the market operator.
44www.energiagroup.com
Huntstown plant and owned wind farm availability
Energia Group runs the risk of interruptions
to the availability of Huntstown 1 and 2 and its
owned wind farms.
For the Huntstown plants, this risk is managed
by having long term maintenance agreements
in place with the plants’ original manufacturers,
Siemens and Mitsubishi. Energia Group operates
the plants to the manufacturers’ guidelines
within a suite of International Organization
for Standardization (ISO) approved operation,
maintenance and safety policies and procedures.
The plant designs incorporate industry
accepted levels of redundancy for critical plant
components and there is regular testing of back
up services and standby equipment.
The availability of owned wind farm assets is
managed through maintenance contracts with
the original turbine manufacturers and third
parties.
Health and safety
The Group is committed to ensuring a safe
working environment. The risks arising from
inadequate management of health and safety
matters are the exposure of employees,
contractors and third parties to the risk of injury,
potential liability and/or loss of reputation.
These risks are closely managed by the Group
through the employment of a Health and Safety
Manager, the use of the services of an external
health and safety advisor, the promotion of a
strong health and safety culture, training for
all staff and well defined health, safety and
environmental policies. There is a strong focus
on the audit of work sites and the reporting and
reviewing of near miss incidents. The Group’s
approach to health and safety issues is described
more fully in the CSR Report.
In August 2018 the National Standards Authority
of Ireland (NSAI) certified the Group to ISO
45001:2018 Occupational Health and Safety
Management Standard and ISO 14001:2015
Environmental Management Standard.
Regulation and legislation
The markets in which the Group operates are
subject to regulatory and legislative intervention
at both domestic and EU level.
Energia Group is exposed to the impact
of regulatory decisions as well as changes
in legislation which impact its generation
and supply activities. Through its senior
management, Energia Group maintains regular
interaction with the UR, CRU, the SEMC, DfE and
DCCAE. A pro-active approach is taken to the
RAs’ consultations on all SEM and I-SEM related
matters.
The Governments of Northern Ireland and the
RoI charged the SEMC with responsibility for
revising the SEM, through the creation of the
new market arrangements with effect from 1
October 2018, so that trading arrangements
for the island of Ireland are compliant with
EU requirements. The introduction of the new
market arrangements affected the major revenue
streams of all thermal and renewable generators
selling into the market. Furthermore the CRM
45 Energia Group Limited Consolidated Financial Statements 2018 - 2019
now operates through capacity auctions which
award reliability options to successful bidders
at the market clearing price. In addition, the
Huntstown plants could be required to generate
to relieve constraints and therefore participate
in the balancing market. The market places
restrictions on the costs generation plants can
take into account when setting their bids in the
balancing market.
The new market arrangements create risks to
revenues from generation activities. As noted
above the Group has secured four year LRSAs
for both Huntstown plants which provide clarity
on the capacity income the plants can earn until
expiry of these agreements on 30 September
2022. There is a potential risk that the European
Commission’s decision to approve state aid for
the Irish capacity market could be subject to
similar challenge in the future similar to that
against the UK capacity market which is currently
ongoing.
Furthermore, as also noted above, the outcome
of the first T-4 capacity auction covering the
2022/23 capacity year resulted in Huntstown 2
being awarded a reliability option contract but
Huntstown 1 not being awarded such a contract.
While it is considering its options regarding the
longer term sustainability of the Huntstown
plants, the Group is currently uncertain as to
what level of capacity revenues the Huntstown
plants will earn from 1 October 2022.
In addition, the change to the new market
arrangement required renewable PPA
counterparties to agree contractual amendments
to enable PPAs to continue to operate.
While negotiations with a limited number of
counterparties are not yet concluded there is
a risk that a reduction in capacity income and
contractual amendments to the PPAs could have
an adverse effect on the Group’s businesses.
Power NI and PPB are exposed to regulatory
risk in respect of their price controls. The
Group’s approach to price control reviews is to
be pro-active in promoting arrangements that
will lead to an agreed outcome. This includes
adherence to relevant precedent and best
practice. There is regular reporting to the UR
and DfE on a wide range of financial and other
regulatory matters including licence compliance.
PPB is also exposed to regulatory decisions in
respect of its contracted generation capacity
which could impact its business activities.
Regulatory relationships are managed by senior
management through frequent meetings,
informal dialogue and formal correspondence.
Brexit
On 23 June 2016 the UK electorate voted to
leave the EU, and on 29 March 2017, the UK
Government formally notified the EU of its
intention to leave by 29 March 2019 thereby
commencing negotiations on the terms of its
exit. While a draft Withdrawal Agreement has
been negotiated with the EU, UK parliament
rejected the proposed agreement and the UK
Government requested an extension to the
deadline to leave the EU. The EU has agreed to
extend the deadline until 31 October 2019 but
the UK can still leave before that date should
Parliament approve the Withdrawal Agreement.
Exit from the EU will have wide consequences for
the UK and therefore Northern Ireland. However
the RAs in Northern Ireland and the RoI and both
46www.energiagroup.com
governments have reaffirmed their commitment
to the SEM market. The Group will continue to
monitor and manage emerging Brexit related
risks in the months ahead.
Development of wind farm and bioenergy assets
Through the development of wind farm and
bioenergy assets, the Group is exposed to
various risks including technical, commercial,
contractor, planning, financing and economic
risks. Such risks could delay the construction
of wind farm and bioenergy projects or the
commencement of commercial operations
or adversely impact operational efficiency. In
addition, the Group is exposed to regulatory
risks surrounding the accreditation of its in-
construction bioenergy plant in Ireland under the
REFIT scheme. Experienced senior staff operate
appropriate project management controls
to manage the project risks with appropriate
management reporting up to the Board.
Business continuity
The Group has measures in place to manage the
risk that one or more of its businesses sustains a
greater than necessary financial impact through
inability to carry on its operations either for a
short or prolonged period. Energia Group has
business interruption insurance in place for
both Huntstown 1 and 2 and the owned wind
farm assets. There is an IT disaster recovery plan
which covers the whole Group and centrally
co-ordinated Business Continuity Plans are in
place covering the various locations where each
business operates.
Outsourcing
The Group outsources a range of important
ICT from Capita Managed IT Solutions Limited
(Capita). Voice and data telecoms services are
provided by Eir through a contract managed
by Capita. There is a risk of disruption to the
Group if there are service delivery failures.
Comprehensive business continuity and disaster
recovery plans are maintained to manage this
risk. During the year the Group continued with
its exercise to re-procure this range of ICT and
telecoms services under a new managed service
contract. In January 2019 the Group announced
that Capita (with BT as voice and data telecoms
provider) had been selected as preferred bidder
and a new Managed Service contract was
awarded in April 2019. The Group and Capita,
with BT, have commenced a period of transition
and the new services will be effective from 1
October 2019.
Social, environmental and ethical factors
The Group has in place measures to protect
against financial and reputational risk from
any failure to manage social, environmental
and ethical (SEE) factors. In general, SEE
factors are managed through embedding CSR
into the Group’s management processes and
core business activities. Environmental risk, in
particular, is managed through: business risk
registers; environmental action plans; certified
environmental management systems; and
identification of potential environmental
exposures.
47 Energia Group Limited Consolidated Financial Statements 2018 - 2019
Taxation
The Group manages its tax affairs so as to
maintain its reputation as a well-run, open
and compliant business. The Group pays
taxes primarily in the UK and the RoI (the
jurisdictions in which it has trading operations).
Good relationships are maintained with HM
Revenue & Customs (HMRC) and the Irish
Revenue Commissioners based on trust
and co-operation. The Group’s appetite for
tax risk is low and its policy is to manage
its tax liabilities in an efficient manner and
in compliance with relevant legislation and
guidance. During the year the Group updated
it tax strategy and the Board approved this to
satisfy its obligations under paragraph 16(2)
Schedule 19 of the UK Finance Act 2016. A
copy of the Group’s tax strategy is publically
available on the homepage of the Group’s
website.
The Group has a zero tolerance approach to
tax evasion and specifically the facilitation of
tax evasion and during the year completed a
review of its compliance with the UK Criminal
Finances Act 2017.
Pensions
The EGPS has two sections: a money purchase
section and a defined benefit section. The
defined benefit section is closed to new
entrants and at 31 March 2019 there were 73
members comprising 35 active members and
38 pensioners. There is also a money purchase
arrangement for employees in the RoI known
as ‘Choices’. Most employees of the Group
are members of EGPS or Choices. While
the trustees seek the advice of professional
investment managers regarding the scheme’s
investments, there is a risk that the cost of
funding the defined benefit section could
increase if investment returns are lower than
expected, mortality rates improve or salary or
benefit increases are higher than expected.
IT security and data protection
Failure to maintain adequate IT security
measures could lead to the loss of data
through malicious attack on the Group’s
IT systems or employee negligence. Loss
of Group or customer data could damage
the Group’s reputation, adversely impact
operational performance or lead to a loss
of income. The Group employs a dedicated
IT Security Manager and a Data Protection
Officer. In addition the Group has an IT Security
Forum and a Data Protection Forum which
both comprise of the IT Security Manager, Data
Protection Officer and a number of relevant
operational managers from across the Group.
These forums meet bi-monthly and report
to the RMC. Through the forums, the Group
actively promotes awareness of IT security
and data protection and targeted controls and
procedures are in place to mitigate the risks
including the use of the services of external
IT security and data protection advisors.
During the year, the Group continued with its
preparations for the introduction of the EU
General Data Protection Regulation (GDPR)
which came into force on 25 May 2018.
48www.energiagroup.com
Financial control
Strong financial and business controls
are necessary to ensure the integrity and
reliability of financial and other information
on which the Group relies for day-to-day
operations, external reporting and for
longer term planning. The Group exercises
financial and business control through a
combination of: appropriately qualified and
experienced personnel; rigorous business
planning processes; detailed performance
analysis; an integrated accounting system; and
clearly defined approval limits. The internal
auditors test the effectiveness of financial
and business controls. Investment decisions
are accompanied by detailed analysis, both
short and long term, of the markets and
opportunities in which the Group operates or is
considering investing in.
Treasury risks
The Group’s treasury function manages
liquidity, funding, investment and the Group’s
financial risk, including risk from volatility
in currency, interest rates, commodity prices
and counterparty credit risk. The treasury
function’s objective is to manage risk at
optimum cost in line with Group policies
and procedures approved by the Board. The
treasury function employs a continuous
forecasting and monitoring process to manage
risk and to ensure that the Group complies
with its financial and operating covenants.
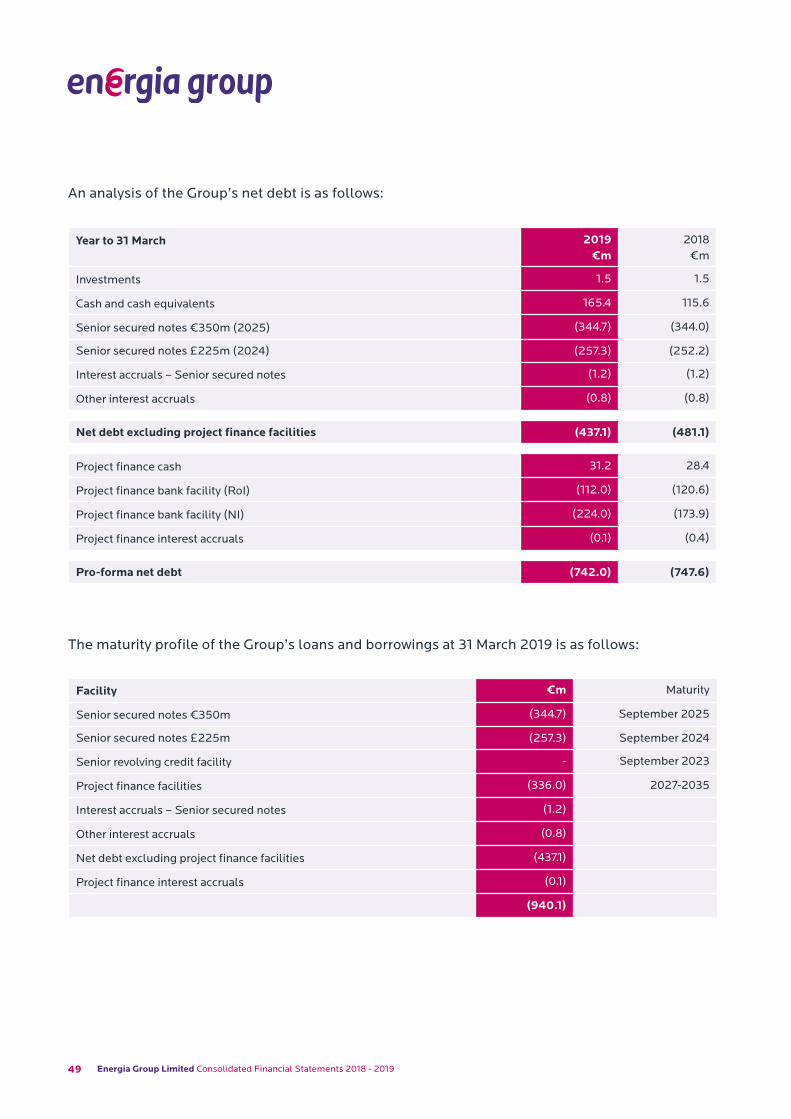
49 Energia Group Limited Consolidated Financial Statements 2018 - 2019
The maturity profile of the Group’s loans and borrowings at 31 March 2019 is as follows:
Year to 31 March 2019 €m
2018 €m
Investments 1.5 1.5
Cash and cash equivalents 165.4 115.6
Senior secured notes €350m (2025) (344.7) (344.0)
Senior secured notes £225m (2024) (257.3) (252.2)
Interest accruals – Senior secured notes (1.2) (1.2)
Other interest accruals (0.8) (0.8)
Net debt excluding project finance facilities (437.1) (481.1)
Project finance cash 31.2 28.4
Project finance bank facility (RoI) (112.0) (120.6)
Project finance bank facility (NI) (224.0) (173.9)
Project finance interest accruals (0.1) (0.4)
Pro-forma net debt (742.0) (747.6)
Facility €m Maturity
Senior secured notes €350m (344.7) September 2025
Senior secured notes £225m (257.3) September 2024
Senior revolving credit facility - September 2023
Project finance facilities (336.0) 2027-2035
Interest accruals – Senior secured notes (1.2)
Other interest accruals (0.8)
Net debt excluding project finance facilities (437.1)
Project finance interest accruals (0.1)
(940.1)
An analysis of the Group’s net debt is as follows:

50www.energiagroup.com
Maturity analysis of loans and other borrowings is:
Facility 2019 €m
2018 €m
In one year or less or on demand (25.1) (21.4)
In more than one year but less than two years (17.5) (14.5)
In more than two years but less than five years (59.0) (48.3)
In more than five years (838.5) (808.9)
(940.1) (893.1)
Project finance bank facilitiesDuring the year non-recourse project finance
facilities of up to €28.9m (including working
capital) were put in place in respect of combined
capacity of 18MW for wind farms under
construction in Northern Ireland. Non-recourse
project finance facilities of up to €44.0m were
put in place in April 2019 (including a term loan
of €38.6m, working capital facility of €0.6m,
debt service reserve facility of €2.8m and
letters of credit facility of €2.0m) in respect of
the 4.0MW Huntstown bioenergy plant. The
Group expects to put in place project finance
facilities for its other development bioenergy and
windfarm projects going forward.
At 31 March 2019 €m
2018 €m
Project finance bank facilities 384.4 352.9
Draw down (384.4) (324.8)
Undrawn committed project finance facilities - 28.1
All of the above amounts exclude project finance facilities in relation to working capital
Analysis of undrawn committed project finance bank facilities:
Liquidity and capital resourcesThe Group is financed through a combination of
retained earnings, medium term bond issuance
and both medium term and long term bank
facilities. A summary of the Group’s net debt is
set out above and in note 29. Liquidity, including
short term working capital requirements, is
managed through committed Senior revolving
credit bank facilities together with available
cash resources. The Group continues to keep
its capital structure under review and may from
time to time undertake certain transactions
such as financing transactions, acquisitions and
disposals which affect its capital structure. The
Group may also from time to time repurchase its
Senior secured notes, whether through tender
offers, open market purchases, private purchases
or otherwise.
51 Energia Group Limited Consolidated Financial Statements 2018 - 2019
In September 2017, the Group completed a
full refinancing with the issuance of a new
€350.0m Euro denominated 8 year 4.0%
Senior secured note due in September 2025
and a new £225.0m Sterling denominated
7 year 4.75% Senior secured note due in
September 2024. At the same time the Group
also put in place a new £225.0m Senior
revolving credit facility maturing in September
2023 which can be used for both letters of
credit and working capital purposes.
The Group can have significant movements
in its liquidity position due to working
capital variations such as the movements in
commodity prices, the seasonal nature of the
business and regulatory under-recoveries.
Short term liquidity is reviewed daily by the
treasury function and Group cash forecasts,
covering a rolling two year period, are reviewed
monthly. This monitoring includes reviewing
the minimum EBITDA covenant, required to be
reported quarterly under the Senior revolving
credit facility, to ensure sufficient headroom
is maintained. The project financed facilities
have one main covenant, a debt service cover
ratio, which measures available cash against
the debt service requirements on an historic
annual basis.
At 31 March 2019, the Group had letters of
credit issued out of the Senior revolving
credit facility of €179.7m resulting in undrawn
committed facilities of €81.4m (2018 -
€124.6m). There were no cash drawings under
the Senior revolving credit facility at 31 March
2019 (2018 - €nil).
During the year the Group has met all required
financial covenants in the Senior revolving
credit facility and project finance facilities.
At 31 March 2019, there was €31.2m (2018
- €28.4m) of restricted cash in the project
financed wind farms which is subject to bi-
annual distribution debt service requirements.
Interest rate riskThe majority of the Group’s borrowings bear
interest at fixed rates with its €350.0m Euro
denominated Senior secured notes bearing
interest at a fixed rate coupon of 4.0% and
its £225.0m Sterling denominated Senior
secured notes bearing interest at a fixed rate
coupon of 4.75%.
The Group’s only exposure to interest rate
risk is in respect of drawings on the Senior
revolving credit facility, which was undrawn
at 31 March 2019 and 31 March 2018 and to a
minor portion of its project financed facilities
which are based on Libor / Euribor rates but
which are largely fixed through the use of
interest rate swaps. As a result, at 31 March
2019, 95.8% of the Group’s total borrowings
were on a fixed rate basis and therefore not
subject to any interest rate risk.
52www.energiagroup.com
At 31 March 2019 €m
2018 €m
Loans and other borrowings fixed/floating analysis:
Fixed rate debt (899.7) (856.8)
Variable rate debt (40.4) (36.3)
(940.1) (893.1)
The estimated fair value of the Group’s interest rate derivative financial instruments is disclosed in note 26 to the accounts.
Foreign currency riskFollowing the refinancing of the Senior
secured notes in September 2017, the Group’s
debt is relatively evenly split between Euro
and Sterling. The Group has not designated
a hedging relationship between the Euro-
denominated assets on the Group’s balance
sheet and the Group’s Euro borrowings.
At 31 March 2019 €m
2018 €m
Loans and other borrowings currency analysis:
Euro (457.7) (427.1)
Sterling (482.4) (466.0)
(940.1) (893.1)
Energia receives income and incurs
expenditure in Euro. Energia is also exposed
to currency movements in respect of its gas
and some of its power purchases denominated
in Sterling. The Group’s policy is to identify
foreign exchange exposures with a value
equivalent to or greater than €0.6m with the
percentage level of hedging dependent on the
specific project. Exchange rate exposures are
identified, monitored and hedged through the
use of financial instruments (mainly forward
currency contracts and swap arrangements).
Power NI is exposed to currency movements
in respect of its Euro-denominated CfDs with
ESB Power Generation. These exposures are
hedged in accordance with a policy agreed with
the UR.
The estimated fair value of the Group’s foreign
currency derivative financial instruments is
disclosed in note 26 to the accounts.
53 Energia Group Limited Consolidated Financial Statements 2018 - 2019
Commodity riskEnergia employs commodity swaps to hedge gas
price exposures and forward purchase contracts
to hedge its shortfall of carbon dioxide (CO2)
emission allowances. Energia’s policy is to
hedge its exposure to changes in the price of gas
and CO2 emission allowances in line with retail
electricity sales contracts.
Power NI employs commodity swaps to hedge
gas price exposures. Power NI’s policy is to
hedge its exposure to changes in the price of gas
relative to retail electricity sales contracts.
PPB is exposed to commodity price fluctuations
in respect of its generation contracts. These
exposures are hedged through the use of
commodity swaps and forward purchase
contracts in accordance with a policy agreed with
the UR.
Energia, Power NI and PPB enter into SEM and
I-SEM CfDs to manage their exposure to pool
price volatility.
The estimated fair value of the Group’s
commodity derivative financial instruments is
disclosed in note 26 to the accounts.
Credit riskThe Group’s credit risk is primarily attributable
to its trade receivables. Provisions are made
based on previous experience and identifiable
events which indicate a reduction in the
recoverability of cash flows. Energia and Power
NI are not exposed to major concentrations of
credit risk in respect of their trade receivables,
with exposure spread over a large number of
customers. Energia takes out credit insurance
in respect of certain trade receivables. Energia
and PPB also receive security from certain
suppliers in the form of letters of credit, parent
company guarantees or cash collateral.
The Group may be exposed to credit-related
loss in the event of non-performance by bank
counterparties. The Group manages this
credit risk by establishing and monitoring
counterparty exposure limits which are
adjusted and tightened when necessary. The
Group actively manages its banking exposures
on a daily basis and cash deposits are placed
for periods not exceeding six months to
provide maximum flexibility. During the year
the Group did not suffer any bank counterparty
exposure loss.
Going concern
The Group’s business activities, together with
principal risks and uncertainties likely to affect
its future performance are described in the
preceding paragraphs.
The Group’s forecasts and projections, taking
into account possible changes in trading
performance, show that the Group will have
adequate financial resources to enable it to
continue to trade for the foreseeable future.
Accordingly, the Director continues to adopt
the going concern basis in preparing the
annual report and accounts.

54www.energiagroup.com

55 Energia Group Limited Consolidated Financial Statements 2018 - 2019
56www.energiagroup.com 56
Corporate Social Responsibility Report
57 Energia Group Limited Consolidated Financial Statements 2018 - 2019
Corporate Social Responsibility ReportThe Group is committed to operating in
a socially, environmentally and ethically
responsible manner. It aims to be recognised
as transparent and ethical in its dealings
and to make a positive contribution to the
communities in which it operates by helping
to address climate change and empower its
people to support community activities and
initiatives.
The Group recognises the importance of
engaging with a wide range of stakeholders
including: its shareholders; customers;
employees; the wider community; those
tasked with protecting the environment; and
suppliers. It does this through many channels
including working closely with: industry
regulators; consumer representative groups;
various environmental bodies; various health
and safety bodies; trade unions; business
representatives; elected representatives and
politicians; contractors; and landlords.
In line with its values of being trustworthy,
dynamic, resourceful and community focused,
the Group has defined a number of principal
CSR themes and priorities relevant to the
management of SEE-related risks that may
impact upon the short and long term value of
the Group. These are classified below under
the headings of Workplace, Environment,
Marketplace and Community.
Workplace
The Group had 795 employees at 31 March
2019 (2018 – 702) with 153 employed in
the RoI (2018 – 123) and 642 employed in
Northern Ireland (2018 – 579).
Health and safety
A CSR priority for the Group is to ensure
the safety of employees, contractors and
the general public through the promotion
of a positive health and safety culture and
adherence to legislation and recognised safety
standards. The Group’s health, safety and
environmental policy aims to promote high
standards and is supported by specific safety
principles, rules, policies and procedures.
Contractors must adhere to the same safety
rules and requirements as employees.
The Group’s health, safety and environmental
management system is certified to
internationally recognised standards which
set out the requirements for occupational
health and safety management best practice.
In June 2018 NSAI certified the Group to ISO
45001:2018 Occupational Health and Safety
Management Standard. The Group’s approach
to employment-related performance, such as
safety and sickness absence, is to set targets
in line with best practice. The Group regularly
engages with relevant organisations including
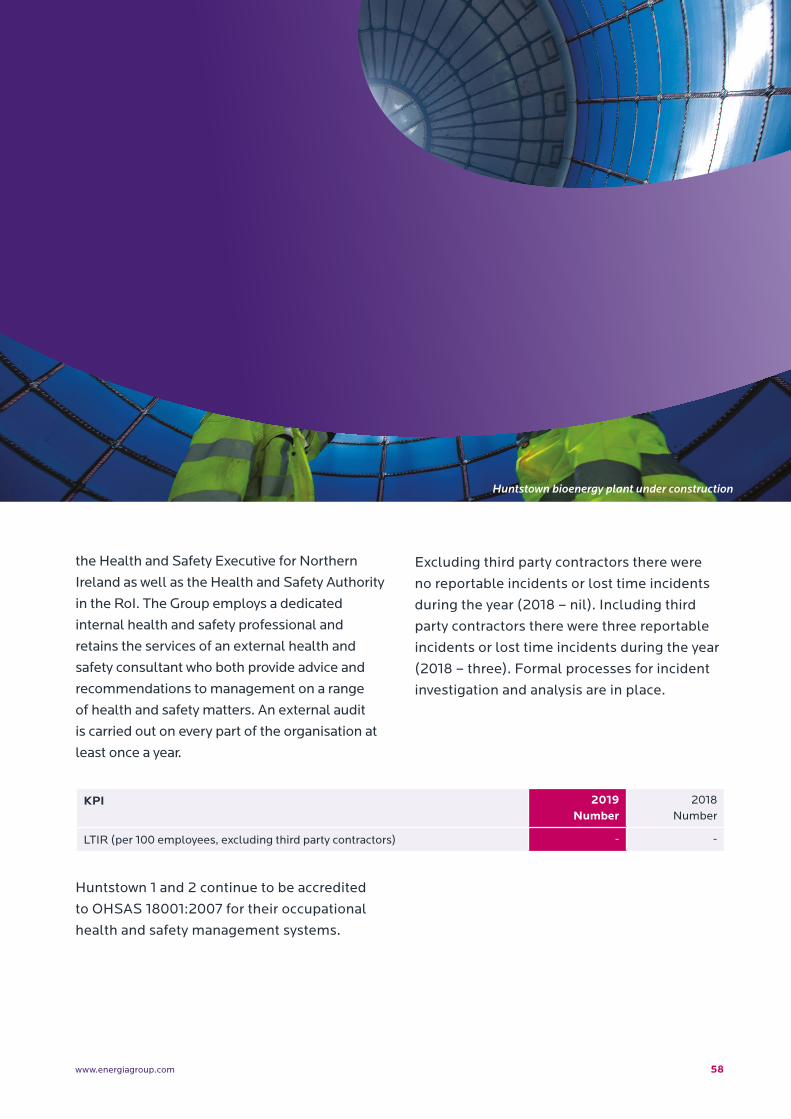
58www.energiagroup.com
the Health and Safety Executive for Northern
Ireland as well as the Health and Safety Authority
in the RoI. The Group employs a dedicated
internal health and safety professional and
retains the services of an external health and
safety consultant who both provide advice and
recommendations to management on a range
of health and safety matters. An external audit
is carried out on every part of the organisation at
least once a year.
Excluding third party contractors there were
no reportable incidents or lost time incidents
during the year (2018 – nil). Including third
party contractors there were three reportable
incidents or lost time incidents during the year
(2018 – three). Formal processes for incident
investigation and analysis are in place.
Huntstown 1 and 2 continue to be accredited
to OHSAS 18001:2007 for their occupational
health and safety management systems.
KPI 2019Number
2018Number
LTIR (per 100 employees, excluding third party contractors) - -
Huntstown bioenergy plant under construction
59 Energia Group Limited Consolidated Financial Statements 2018 - 2019
Employment
The Group is committed to a working
environment: in which personal and
employment rights are upheld; which ensures
equality of opportunity for all employees and
job applicants; and which enables employees
to realise their maximum potential and to be
appropriately challenged and fully engaged in
the business, with opportunities for personal
development.
Equal opportunitiesThe Group is pro-active in implementing
human resource policies and procedures to
ensure compliance with fair employment,
sex discrimination, equal pay, disability
discrimination, race discrimination, sexual
orientation and age discrimination legislation.
The Group’s equal opportunities policy
commits it to providing equality of opportunity
for all employees and job applicants and it
regularly monitors its actions to promote
compliance with legislation and to ensure
that it provides equality of opportunity in all
its employment practices. Equal opportunity
measures and statistics in respect of the
relevant employing entities are reported
formally to the Equality Commission for
Northern Ireland.
DisabilityIt is Group policy to provide people
with disabilities equal opportunities for
employment, training and career development,
having regard to aptitude and ability. Any
member of staff who becomes disabled during
employment is given assistance and re-training
where possible.
Dignity at WorkThe Dignity at Work policy and procedures
underline the Group’s commitment to
equality and dignity at work for all, and
ensure an environment free from bullying and
harassment.
RemunerationThe Group operates fair and visible
remuneration policies which are externally
benchmarked to ensure that employees
are paid an appropriate salary for the work
they undertake. The Group has an effective
approach to recognition and reward, based on
business and individual performance. Various
reward schemes are in place including bonus
schemes, excellence awards, reward and
recognition bonuses and skills progression
arrangements. Total reward statements,
detailing an individual’s full remuneration
package, are issued to staff annually.
Learning and developmentThe Group aims to align its Human Resources
policies with key business drivers, which
include performance improvement; cost
reduction; business growth and innovation;
and excellence in customer service. These
policies are supported by clearly defined
values and behaviours, a robust talent and
performance management process, a strong
commitment to employee and management
development and organisational competence
built upon appropriate capabilities and skills.
The Group’s People Strategy ensures
continuity with its strategic aims. The four

60www.energiagroup.com
key strategic areas are: talent management
and learning and development, employee
engagement, organisational effectiveness and
recognition and reward.
The Group’s Talent Management strategy aims
to establish an integrated talent management
process by ensuring an effective pipeline of
leadership and scarce skills to ensure robust
succession planning and protect business
continuity, increase awareness of leadership
and career development opportunities and
accelerated development of high potential and
scarce skill resources.
The Talent Management process includes
a Competency Framework which identifies
the key values and competencies, including
behavioural indicators, and how they are
expected to be demonstrated by employees at
various levels within the business.
This Competency Framework underpins
the annual Performance and Development
Review (PDR) process, which evaluates
the performance of each individual against
defined and agreed targets and objectives.
It also enables individuals to discuss the
competencies where they show real strength
and those areas that could be further
developed.
Learning and development needs are also
identified through the PDR process to
ensure that employees have a development
plan in place which is aligned to their
development needs. The Group has developed
a methodology to ensure greater focus on
development and career discussions.
The Talent Management process also includes
annual Talent Forums for each business
within the Group and key functional areas
across the business, to ensure that key skills
Customer solutions care team
61 Energia Group Limited Consolidated Financial Statements 2018 - 2019
and potential are identified in areas such
as leadership, management, scarce skills,
areas of specialism, etc. and that appropriate
succession and development plans are in
place. This also provides a consistent and
transparent approach, offering a mechanism
to develop employees to meet their full
potential and to plan and manage their careers
effectively.
As part of its commitment to develop
talent, the Group has embedded several
development programmes including LEAP
(Future Leaders’ Programme), Aspire (High
Potential Programme), Evolve (First Line
Manager Programme) and Ignite (Student
Placement Programme). The Group has also
launched a new Leadership and Management
Development Programme (Elevate) aimed at
senior managers and managers of teams and
individuals.
These programmes are complemented by the
Group’s Learning and Development Calendar,
which is available to all employees.
PoliciesThe Group has a number of formal policies
in place including Employee Complaint and
Grievance procedures, Code of Conduct
and Disciplinary policies. The Group also
has a wide range of family-friendly working
arrangements including enhanced maternity
and paternity provisions, adoption, parental
leave, shared parental leave and dependant
leave. These policies are regularly reviewed
and updated on an ongoing basis.
During the year the Group updated its Code
of Conduct and Disciplinary Policies to reflect
changes in Data Protection Legislation and The
Corporate Criminal Offences of the Failure to
Prevent the Facilitation of Tax Evasion.
All policies are available to employees via the
Group’s intranet.
Wellbeing
The Group takes the wellbeing of its
employees seriously and during 2018/19 its
Wellbeing Programme included the provision
of flu vaccines, employee health checks, walk a
mile lunchtime challenge, personal resilience
challenge and lunch & learns on various topics
(including Finance 101, Mental Health and
Acclimatising to Shift Work).
The Group operates a Cycle to Work Scheme
and offers Private Medical Insurance to eligible
employees and has a Health Cash Plan for
those employees not eligible for Private
Medical Insurance. The Health Cash Plan
enables employees to claim money back for
everyday healthcare including dental, optical
and physiotherapy treatments and allows fast
access to private consultations and scans.
Third party occupational health and
counselling services are also available for
employees if required.
Sickness absenceThe Group believes that the pro-active
management of illness and absenteeism is
to the mutual benefit of the Group and its
employees. The sickness absence rate for the
Group was 3.10% (2018 – 3.41%).
62www.energiagroup.com
Employee participation and external engagementEmployee communications occur through team
briefings, communication and involvement
groups (Connect Employee Engagement
Forums), project groups, electronic
communications and through interaction,
consultation and negotiation with trade
unions. Employee relations in all businesses
are positive and constructive. There is a well-
established arrangement for consultation and
involvement throughout the Group and for
negotiation with the relevant trade unions in
Power NI.
The Group aims to complete Employee
Engagement Surveys every two years with pulse
surveys to be completed annually.
The Group engages with relevant external
organisations including the Confederation
of British Industry Employment Affairs
Committee, the Equality Commission for
Northern Ireland, the Labour Relations Agency,
Business in the Community, The Prince’s
Trust, and the Irish Business and Employers’
Confederation. The Group also maintains links
with the education sector and in particular
with the two universities in Northern Ireland. A
total of 17 students were offered placements
for the current academic year across a range of
functions and departments.
Group staff are actively involved in energy policy
and representative bodies in Ireland, Northern
Ireland and Europe. In Ireland, staff play a
very active role in the Electricity Association of
Ireland (EAI) through positions on the board
and by chairing a number of Working Groups.
Through the EAI’s membership of Eurelectric,
this involvement extends to representing
the EAI in Brussels on various Eurelectric
Committees and Working Groups. Staff also
sit on the Board of the Irish Wind Energy
Association (IWEA) and participate fully in
their Committee and Working Group structure,
including as the chair of their Corporate PPA
Working Group. As a member of Irish Business
and Employers Confederation (IBEC), Ireland’s
largest business advocacy group, members of
staff play an active role in relevant activities in
both Ireland and Brussels and chair their Energy
Providers Working Group.
The Group is currently working in partnership
with Business in the Community to further
develop its CSR.
The profile of innovation has increased through
efforts to encourage staff participation which
has grown significantly during the year within
Power NI. Idea Drop, an idea management
software programme, has been rolled out
company wide and over 80% of staff have
registered to use it. Power NI is also a platinum
member of Catalyst which supports innovation
and entrepreneurship in Northern Ireland and
runs a number of programmes which Power NI
staff have attended.
In PPB a member of staff was selected for
the prestigious British Council’s Future
Leaders Connect programme, alongside 49
other emerging policy leaders from across
the world. The programme consisted of
intensive leadership and policy training at
Cambridge University, culminating in extensive
engagement with members of UK Parliament.
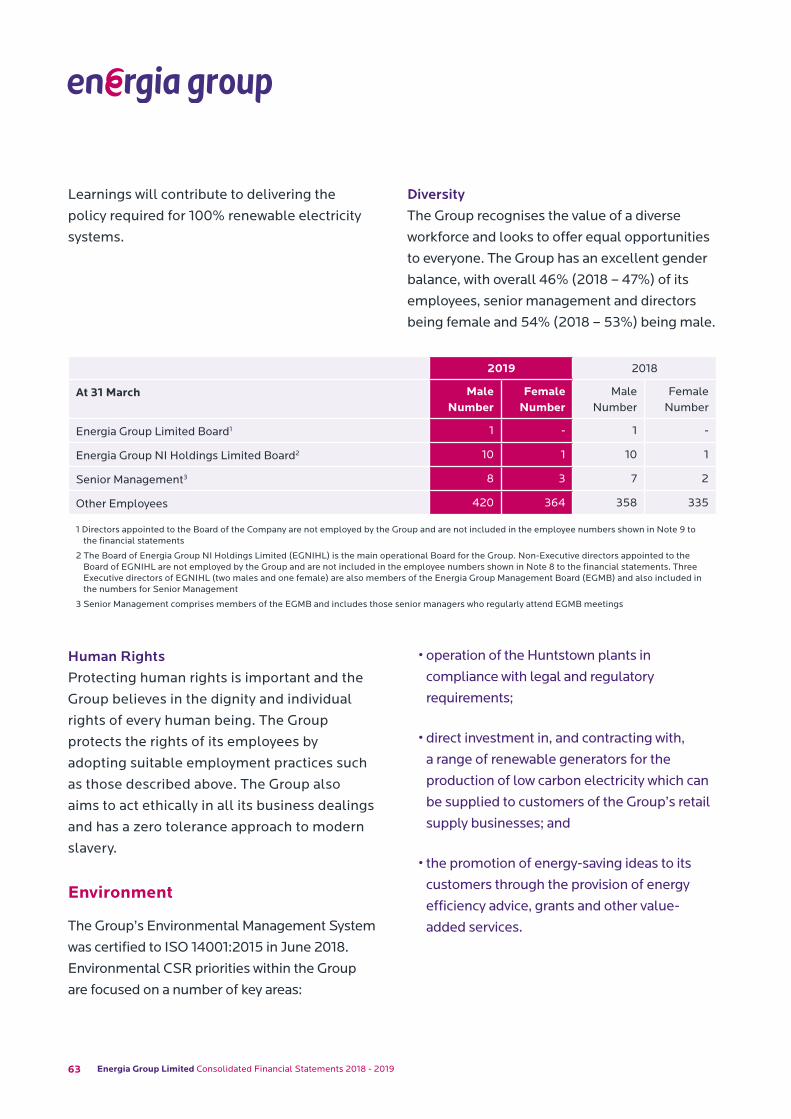
63 Energia Group Limited Consolidated Financial Statements 2018 - 2019
Learnings will contribute to delivering the
policy required for 100% renewable electricity
systems.
DiversityThe Group recognises the value of a diverse
workforce and looks to offer equal opportunities
to everyone. The Group has an excellent gender
balance, with overall 46% (2018 – 47%) of its
employees, senior management and directors
being female and 54% (2018 – 53%) being male.
2019 2018
At 31 March Male Number
FemaleNumber
Male Number
FemaleNumber
Energia Group Limited Board1 1 - 1 -
Energia Group NI Holdings Limited Board2 10 1 10 1
Senior Management3 8 3 7 2
Other Employees 420 364 358 335
1 Directors appointed to the Board of the Company are not employed by the Group and are not included in the employee numbers shown in Note 9 to the financial statements
2 The Board of Energia Group NI Holdings Limited (EGNIHL) is the main operational Board for the Group. Non-Executive directors appointed to the Board of EGNIHL are not employed by the Group and are not included in the employee numbers shown in Note 8 to the financial statements. Three Executive directors of EGNIHL (two males and one female) are also members of the Energia Group Management Board (EGMB) and also included in the numbers for Senior Management
3 Senior Management comprises members of the EGMB and includes those senior managers who regularly attend EGMB meetings
Human RightsProtecting human rights is important and the
Group believes in the dignity and individual
rights of every human being. The Group
protects the rights of its employees by
adopting suitable employment practices such
as those described above. The Group also
aims to act ethically in all its business dealings
and has a zero tolerance approach to modern
slavery.
Environment
The Group’s Environmental Management System
was certified to ISO 14001:2015 in June 2018.
Environmental CSR priorities within the Group
are focused on a number of key areas:
• operation of the Huntstown plants in
compliance with legal and regulatory
requirements;
• direct investment in, and contracting with,
a range of renewable generators for the
production of low carbon electricity which can
be supplied to customers of the Group’s retail
supply businesses; and
• the promotion of energy-saving ideas to its
customers through the provision of energy
efficiency advice, grants and other value-
added services.
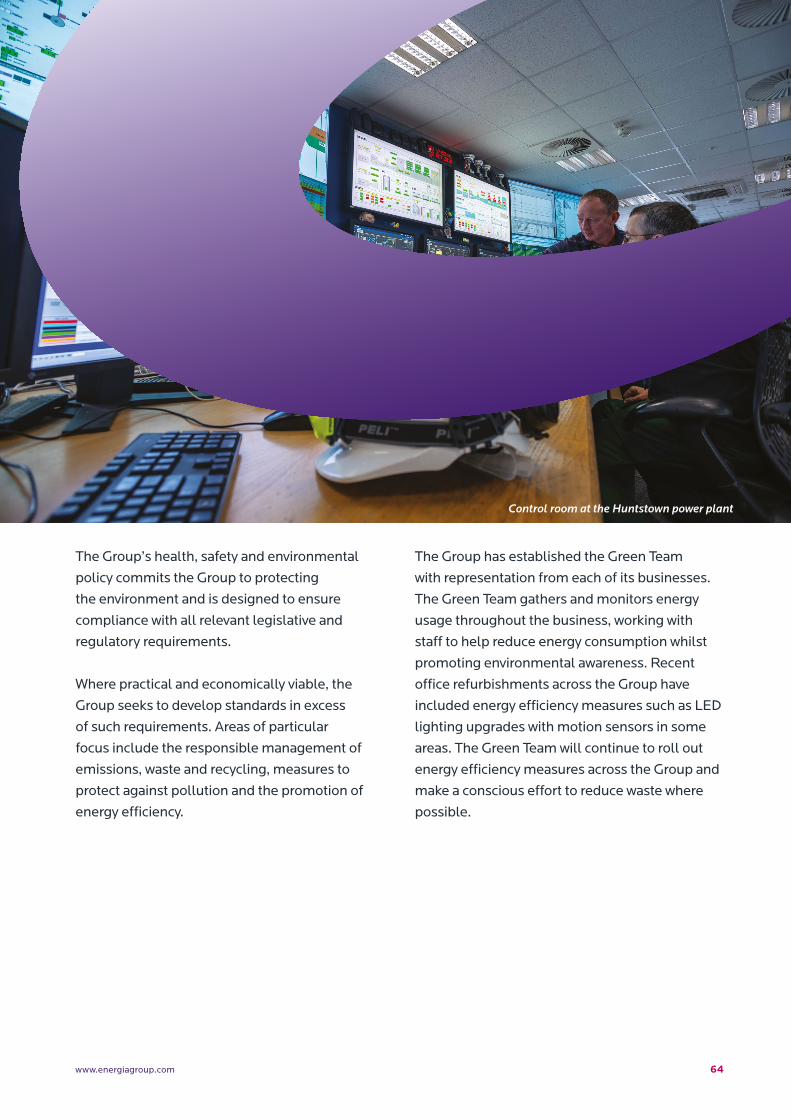
64www.energiagroup.com
The Group’s health, safety and environmental
policy commits the Group to protecting
the environment and is designed to ensure
compliance with all relevant legislative and
regulatory requirements.
Where practical and economically viable, the
Group seeks to develop standards in excess
of such requirements. Areas of particular
focus include the responsible management of
emissions, waste and recycling, measures to
protect against pollution and the promotion of
energy efficiency.
The Group has established the Green Team
with representation from each of its businesses.
The Green Team gathers and monitors energy
usage throughout the business, working with
staff to help reduce energy consumption whilst
promoting environmental awareness. Recent
office refurbishments across the Group have
included energy efficiency measures such as LED
lighting upgrades with motion sensors in some
areas. The Green Team will continue to roll out
energy efficiency measures across the Group and
make a conscious effort to reduce waste where
possible.
Control room at the Huntstown power plant
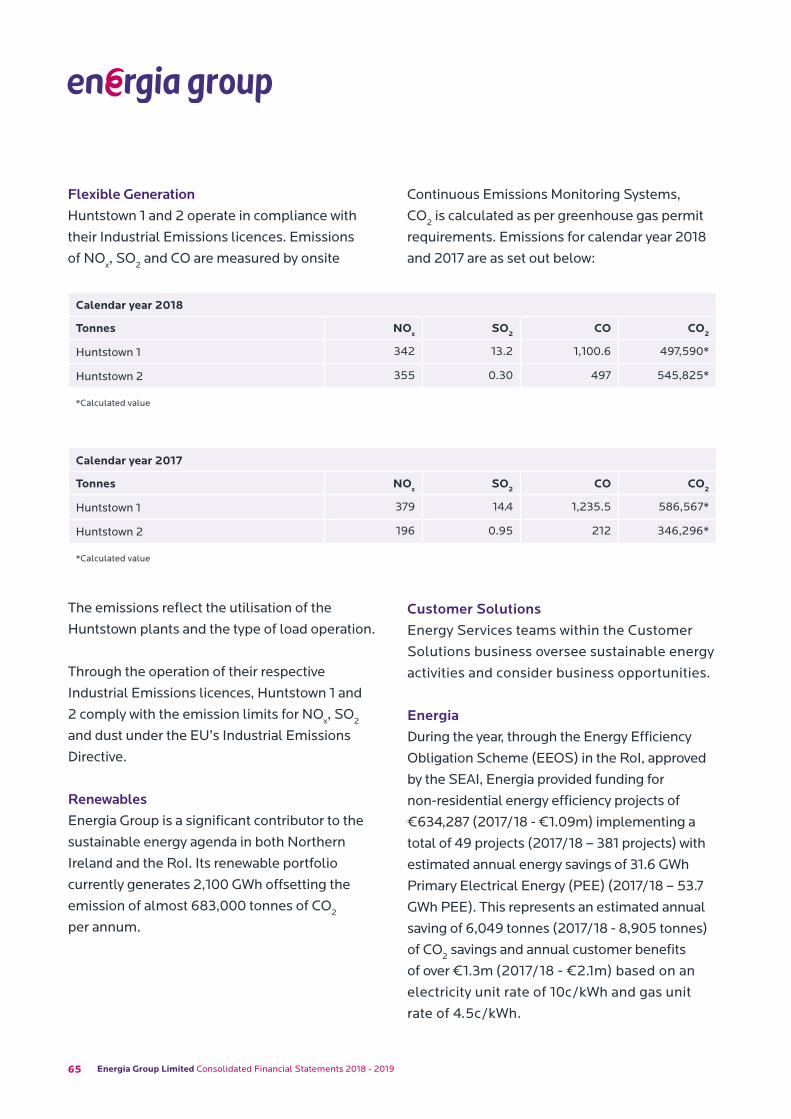
65 Energia Group Limited Consolidated Financial Statements 2018 - 2019
The emissions reflect the utilisation of the
Huntstown plants and the type of load operation.
Through the operation of their respective
Industrial Emissions licences, Huntstown 1 and
2 comply with the emission limits for NOx, SO
2
and dust under the EU’s Industrial Emissions
Directive.
RenewablesEnergia Group is a significant contributor to the
sustainable energy agenda in both Northern
Ireland and the RoI. Its renewable portfolio
currently generates 2,100 GWh offsetting the
emission of almost 683,000 tonnes of CO2
per annum.
Customer SolutionsEnergy Services teams within the Customer
Solutions business oversee sustainable energy
activities and consider business opportunities.
Energia
During the year, through the Energy Efficiency
Obligation Scheme (EEOS) in the RoI, approved
by the SEAI, Energia provided funding for
non-residential energy efficiency projects of
€634,287 (2017/18 - €1.09m) implementing a
total of 49 projects (2017/18 – 381 projects) with
estimated annual energy savings of 31.6 GWh
Primary Electrical Energy (PEE) (2017/18 – 53.7
GWh PEE). This represents an estimated annual
saving of 6,049 tonnes (2017/18 - 8,905 tonnes)
of CO2 savings and annual customer benefits
of over €1.3m (2017/18 - €2.1m) based on an
electricity unit rate of 10c/kWh and gas unit
rate of 4.5c/kWh.
Calendar year 2018
Tonnes NOx SO2 CO CO2
Huntstown 1 342 13.2 1,100.6 497,590*
Huntstown 2 355 0.30 497 545,825*
*Calculated value
Calendar year 2017
Tonnes NOx SO2 CO CO2
Huntstown 1 379 14.4 1,235.5 586,567*
Huntstown 2 196 0.95 212 346,296*
*Calculated value
Flexible GenerationHuntstown 1 and 2 operate in compliance with
their Industrial Emissions licences. Emissions
of NOx, SO
2 and CO are measured by onsite
Continuous Emissions Monitoring Systems,
CO2 is calculated as per greenhouse gas permit
requirements. Emissions for calendar year 2018
and 2017 are as set out below:
66www.energiagroup.com
Through the Residential EEOS in the RoI,
approved by the SEAI, Energia provided
funding for energy efficiency projects of
€2.63m (€2.04m Residential, €0.59m Fuel
Poor) (2017/18 - €2.18m) implementing
a total of 8,520 projects (2017/18 – 7,118)
with estimated annual energy savings of 23.74
GWh PEE (2017/18 – 16.96 GWh PEE). This
represents an estimated annual savings
of 4,858 tonnes (2017/18 – 3,474 tonnes)
of CO2 savings and annual customer benefits
of over €1.18m (2017/18 - €0.85m).
In Northern Ireland, through the Northern
Ireland Sustainable Energy Programme
Scheme (NISEP) approved by the UR, in
2018/19 Energia managed a €524k (2017/18
- €849k) energy efficiency programme
implementing a total of 219 projects (2017/18
– 285 projects) with estimated lifetime
reductions of 157GWh (2017/18 – 303GWh) in
energy demand. This represents an estimated
50,000 tonnes (2017/18 – 150,000 tonnes)
of CO2 savings and customer benefits of over
€26m (2017/18 - €56m) over the lifetime of
these measures.
Energia continues to pursue new and
innovative services aimed at increasing
awareness and offering customers energy
efficiency solutions. In addition to gas
boiler servicing, Energia offers customers
a smart thermostat that enables control
of the heating system from a smartphone,
tablet or PC resulting in the ability to make
real energy savings. Energia’s Cosy Homes
scheme offers customers a range of energy
efficiency products such as roof and cavity wall
insulation, boiler upgrades and solar panels
via the Energy Centre.
Energia continues to run customer information
programmes particularly aimed at energy
efficiency for all industrial and commercial
Meenadreen wind farm, Co. Donegal
67 Energia Group Limited Consolidated Financial Statements 2018 - 2019
customers. These programmes include;
customer energy conferences; energy
efficiency training programmes; energy
awareness days and shows; energy audits
and energy efficiency literature/brochures.
With the use of social media becoming
more prevalent and customer engagement
channels broadening, Energia is increasingly
using these channels to run competitions
and make customer offers. Along with these
programmes, Energia offers energy efficiency
grants through the Cash for Kilowatts scheme
and has recently launched an Upgrade and
Save scheme which allows Energia customers
to upgrade their lighting and repay the capital
costs through their energy bills.
Power NIDuring the year Power NI managed a €700k
(2018 - €2.0m) energy efficiency programme
aimed at reducing CO2 emissions and
alleviating fuel poverty in Northern Ireland.
Funded by the NISEP, a total of 4 energy
efficiency schemes (2018 – 7 schemes)
were implemented with estimated lifetime
reductions of 91 GWh (2018 – 220 GWh) in
energy demand. This represents an estimated
42,000 tonnes of CO2 savings (2018 – 140,000
tonnes) and customer benefits in excess of
€10m (2018 – €29m) over the lifetime of these
measures. Over 7,000 customers (2018 – 7,500
customers) use ‘EcoEnergy’, Power NI’s ‘green’
electricity tariff.
Power NI continues to offer a renewable
microgeneration tariff which offers customer
rewards for the value of ROCs and electricity
generated and exported to the network. Over
12,200 sites, use this service and Power NI acts
as an Ofgem Agent on behalf of more than
9,500 sites.
The ‘Products and Services’ section of Power
NI’s website www.powerni.co.uk provides
a wide range of information and advice on
energy efficiency and renewable energy.
An online Home Energy Check (HEC) was
launched on the Power NI website in October
2016 and gives customers an indicative
energy rating for their home and, at the end of
March, over 800 customers (2018 – 400) had
completed the HEC.
An online billing service is also available from
the Power NI website. The service, called
Energy Online has 116,067 (2018 – 102,388)
residential and commercial customers
registered to view their bills, submit their
meter readings and view their electricity
consumption online.
During the year an electric vehicle charger was
installed at Power NI’s site in Antrim thereby
completing the installation of electric vehicle
chargers for staff use at all of Power NI’s sites
across Northern Ireland.
A number of innovative project teams have
been established to drive forward key projects
within Power NI to include residential and
commercial electric vehicle propositions,
residential demand side management working
with a number of key partners and Powerbot
which aims to make electricity meters semi
smart.
68www.energiagroup.com
Marketplace
A CSR priority is to maintain a highly ethical
approach to regulatory responsibilities,
obligations under licences, public positioning
and marketing of products and services. The
Group aims to be transparent and ethical in
all its dealings with third parties and has a
number of policies in place to underpin this
objective. Policies include anti-corruption and
bribery, anti-slavery and human trafficking,
Code of Conduct and ‘whistleblowing’
procedures as well as the Group’s corporate
governance arrangements.
The Group’s procurement policy is to source
equipment, goods and services from a wide range
of suppliers throughout the EU and beyond in
accordance with commercial practices based
on fairness and transparency. The Group’s
UK businesses are committed to ensuring
transparency in their approach to tackling modern
slavery consistent with the Modern Slavery Act
2015.
Where applicable the Group adheres to
the required tender procedures of the EU
Procurement Directive as it relates to Utilities.
The Group recognises the important role that
suppliers play in its business, and works to ensure
that payments are made to them in accordance
with agreed contractual terms. During the year
the Group’s Northern Ireland operations for
Energia and Power NI commenced reporting on
payment practices and performance in line with
the requirements of the UK Government’s Small
Business, Enterprise and Employment Act 2015.
As a major purchaser, the Group recognises that
it has an opportunity to encourage suppliers
of materials and services to deliver good
environmental and safety performance and to
maintain responsible practices towards their
employees and the communities in which they
operate.
Energia’s Cash for Kilowatts scheme
69 Energia Group Limited Consolidated Financial Statements 2018 - 2019
Community
Through its mainstream business activities
and its community involvement policy, the
Group seeks to make a positive impact on the
communities in which it operates.
Energia operates several Community Benefit
Funds around wind farm sites on the island.
All of the wind farms in Northern Ireland are
operating a Community Benefit Fund with the
Cornavarrow / Slieveglass scheme added this
year. These are managed by the Community
Foundation for Northern Ireland with the
exception of the Teiges and Cornavarrow
schemes which are managed by the Fermanagh
Trust. The Meenadreen wind farm in County
Donegal is managed by the Community
Foundation of Ireland. These schemes take
the community needs into consideration and
are monitored and adjusted where needs are
seen to have changed. During the year, over
€580,000 was available in grants from Energia
through Community Benefit Funds across the
island of Ireland.
In addition to this, Energia has donated another
€158,750 to initiatives including Grow It
Yourself, Seachtain na Gaeilge, Christmassy
Homes and donations to local charities.
As noted above Energia provided funding
for energy efficiency projects through the
residential EEOS in the RoI. As part of this
funding Energia provided almost €150,000
towards SEAI’s Better Energy Communities
programme. This programme focuses on
utilising government funds and contributions
from energy companies to carry out energy
efficiency retrofits in communities across
Ireland. Works are carried out in two main
categories: community groups and residential
dwellings and homes suffering from energy
poverty. Retrofit measures include attic and
cavity wall insulation, installation of energy
efficient boilers and solar thermal and solar
PV systems. These measures will result in CO2
savings of around 280 tonnes per annum.
Power NI offers a ‘For Your Benefit’ service
for its customers which includes a benefit
entitlement check, budgeting and energy
advice for particularly vulnerable customers.
In the year 134 (2018 – 130) customers availed
themselves of the service.
Power NI also offers a number of services
to its customers that are promoted through
its codes of practice (produced in several
different languages) and through various advice
providers, including Citizens Advice Bureau and
Advice NI.
Power NI aims to assist its customers with
special needs through a number of these
services. Over 2,400 customers (2018 – 2,400
customers) with special requirements benefit
from a range of services through Power NI’s
special needs register.
The Group recognises the social dimension of
debt prevention and management and Power
NI continues to offer a wide range of payment
options and debt prevention measures.
Approximately 157,665 residential customers
(2018 – 157,090) use ‘Keypad’ meters. These
70www.energiagroup.com
pay-as-you-go meters enable customers to
budget for their electricity payments, while
Power NI offer a 2.5% discount off the standard
price of electricity and provide user-friendly
credit and consumption information.
Power NI engages with a wide range of
organisations in the voluntary, public and
private sectors focusing on social action and
energy saving. Within the last year Power NI
continued to work in partnership with Age NI
in order to help improve older peoples’ lives.
Social media was used to provide practical
information to older people, their carers and
families and energy clinics ran in Age NI shops
to provide advice on energy efficiency and
relevant grants such as NISEP.
Sponsorship and charitable donationsEach year each of Energia and Power NI choose
a charity as the focus of their fundraising
activities although the Group also supports
various local good causes nominated by staff.
Energia also partially matches its staff’s own
fundraising.
In addition to sponsorship of organisations of
€1,077,000 (2018 - €521,000), the Group’s
donations to charities in the year were €33,000
(2018 - €17,000). There were no contributions
for political purposes.
The Group seeks to support charities which its
people, customers and suppliers can relate to,
and where it can make a difference by raising
public awareness as well as money.
Energia sponsored Inner City Helping
Homeless in Dublin who partnered with
the SOS bus in Belfast. Several activities were
organised and the highlights were the ‘Fill a LUAS
tram’ with gift boxes in Connolly Station, Dublin
and the annual ‘City Centre Sleep Out’ in Belfast.
Energia staff and customers donated shoe boxes
worth €2,000 to the ‘Fill a LUAS’ campaign.
These events helped raise awareness to the plight
of the homeless and needy in the city.
Energia staff contributed over €14,000 to its
chosen charities through these activities and other
events, such as quizzes, bake offs, competitions
and ice cream sales during the hot summer
months.
This year Power NI has chosen to sponsor Chest,
Heart and Stroke.
Power NI has raised around €5,000 for Chest,
Heart and Stroke through various fundraising
activities such as raffles, coffee mornings, a quiz
night, a weekly bonus ball draw and a marathon.
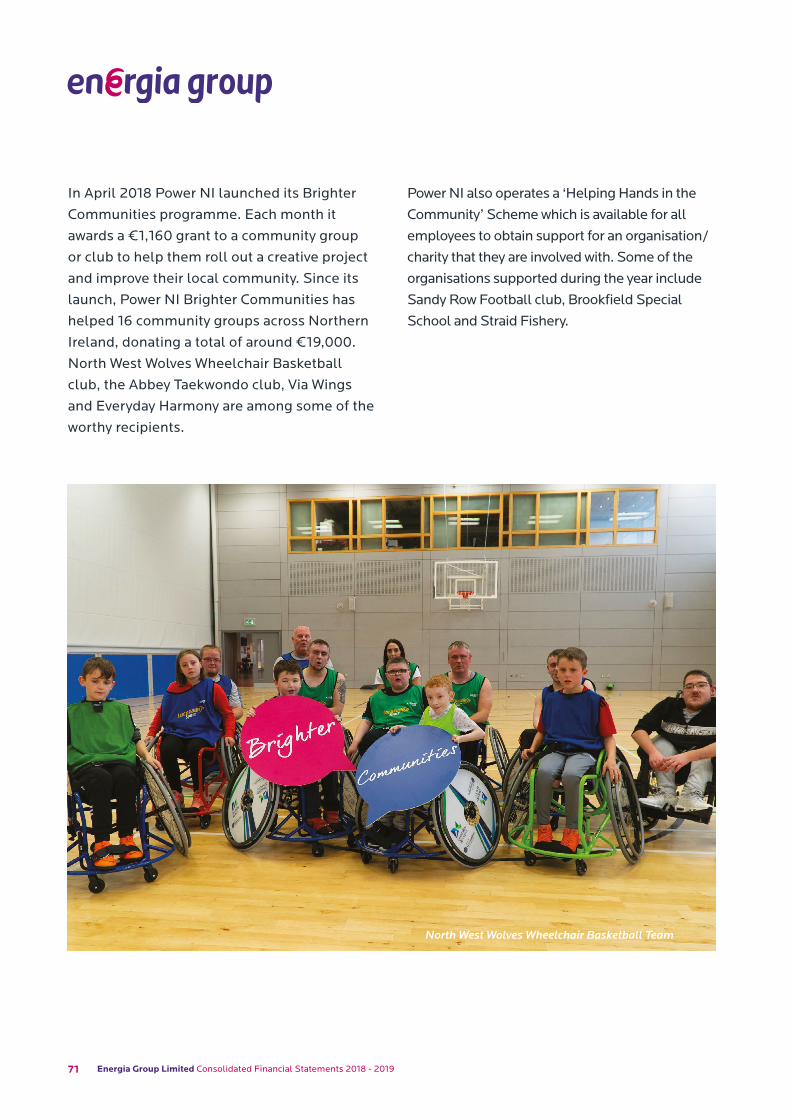
71 Energia Group Limited Consolidated Financial Statements 2018 - 2019
In April 2018 Power NI launched its Brighter
Communities programme. Each month it
awards a €1,160 grant to a community group
or club to help them roll out a creative project
and improve their local community. Since its
launch, Power NI Brighter Communities has
helped 16 community groups across Northern
Ireland, donating a total of around €19,000.
North West Wolves Wheelchair Basketball
club, the Abbey Taekwondo club, Via Wings
and Everyday Harmony are among some of the
worthy recipients.
Power NI also operates a ‘Helping Hands in the
Community’ Scheme which is available for all
employees to obtain support for an organisation/
charity that they are involved with. Some of the
organisations supported during the year include
Sandy Row Football club, Brookfield Special
School and Straid Fishery.
North West Wolves Wheelchair Basketball Team

72www.energiagroup.com

73 Energia Group Limited Consolidated Financial Statements 2018 - 2019
74www.energiagroup.com 74
Management Team, Ownership and Directorship

75 Energia Group Limited Consolidated Financial Statements 2018 - 2019
Management Team, Ownership and Directorship
Ian Thom – Chief Executive Officer
Ian has held the role of Chief Executive Officer
since 2011. He joined the Group in 2001 as
Company Secretary and General Counsel. He was
appointed to the Group’s Executive Committee
in 2003 and has had executive responsibility for
Power NI and PPB since 2007. Prior to joining the
Group, he served as the European Legal Director
of OSI International Foods. He is a barrister by
profession.
Siobhan Bailey – Chief Financial OfficerSiobhan has held the role of Chief Financial
Officer since 2011. She joined the Group in
1999 and has held a number of roles, including
Energia Finance Director from 2006 to 2011 and
Group Treasury Manager from 2003 to 2006.
She qualified as a Chartered Accountant with EY.
Management Team
The management team comprises:

76www.energiagroup.com
Tom Gillen – Chief Operating Officer
Tom has held his current role since 2011. He joined
the Group in 2000 and has held a number of
roles including Chief Operating Officer of Viridian
Power and Energy from 2009 to 2011, Managing
Director of Energia Supply from 2007 to 2009 and
Trading Director from 2000 to 2007. Prior to this,
Tom worked at ESB and Northern Electric where
he held various senior positions.
Stephen McCully – Managing Director, Power NI Customer SolutionsStephen was appointed Managing Director of
Power NI in 2002. He joined the Group in 1985
and has held a number of senior positions and
led group-wide initiatives focused on business
change. He is a Chartered Engineer and prior
to joining the Group, worked at Murland and
Partners - Consulting Engineers.
Roy Foreman – Managing Director, Power Procurement Business
Roy was appointed Managing Director, Power
Procurement Business in 2002. He joined the
Group in 1986 and has held a number of senior
positions. Prior to joining the Group, Roy was
Manager of Power Planning Economics from
1992 to 2002.
Garrett Donnellan – Head of Strategy and Corporate Development
Garrett was appointed Head of Strategy and
Corporate Development for the Group in
2012. Prior to his appointment, Garrett held
various senior management positions within
the Group, including Renewables Finance
Director and Generation Finance Director.
He qualified as a Chartered Accountant with
PricewaterhouseCoopers.

77 Energia Group Limited Consolidated Financial Statements 2018 - 2019
Gary Ryan – Managing Director, Energia Customer Solutions
Gary has held his current role since 2015.
He joined the Group in 2000 and has held
a number of senior roles including Sales &
Marketing Director (Energia) and Head of Sales
(Energia). Prior to joining the Group, Gary held
senior finance, marketing and management
consultancy roles at Tedcastle Oil Group.
He qualified as a Chartered Accountant with
PricewaterhouseCoopers.
John Newman – Director of Trading and Regulation
John was appointed Energia’s Director of
Trading & Regulation in 2008. He joined the
Group in 2002 and has held a number of
senior roles within Energia. He has over 20
years’ experience in the energy sector having
previously held senior roles with Northern
Electric.
Alwyn Whitford – Company Secretary
Alwyn was appointed Company Secretary
of the Group in 2011. Prior to this Alwyn
was Group Corporate Finance Manager and
has held several other senior management
positions within the Group since joining in
2000. He qualified as a Chartered Accountant
with EY.
Catherine Gardiner – Chief Information Officer
Catherine was appointed Chief Information
Officer in 2011 with responsibility for Strategic
Projects and Technology Operations. Prior
to this, Catherine was Head of Operations
for Energia and has held several other
management positions within the Group since
joining in 2000.

78www.energiagroup.com
Michele Hanley – Director of Human Resources
Michele was appointed Group HR Director in
2015. Prior to this, Michele was Organisational
Development Manager and HR Business
Partner with Translink (Northern Ireland’s
public transport provider). She has experience
in senior HR roles across various sectors,
including FMCG, IT and Construction. She
is a member of the Chartered Institute of
Personnel and Development.
Peter Baillie – Managing Director, Energia Renewables
Peter was appointed Managing Director of
Energia Renewables in 2008. Prior to this
Peter was Finance Director for Energia and
has held several other senior management
positions within the Group since joining in
1989. He qualified as a Chartered Accountant
with PricewaterhouseCoopers.
79 Energia Group Limited Consolidated Financial Statements 2018 - 2019
Ownership
The Company’s parent is Energia Group
TopCo Limited (formerly known as Viridian
TopCo Limited). Energia Group TopCo Limited
is majority owned by ISQ Viridian Holdings
L.P., a limited partnership incorporated in
the Cayman Islands, is owned by the ISQ
Global Infrastructure Fund (the Fund) and
ISQ Viridian Co-Invest L.P., a co-investment
vehicle for the Fund. The Fund is managed by I
Squared Capital.
I Squared Capital is an independent global
infrastructure investment manager with over
$13 billion of assets under management
focusing on the energy, utilities, telecoms and
transport sectors in the Americas, Europe and
Asia. The firm has offices in Miami, New York,
Houston, London, New Delhi, Hong Kong and
Singapore.
Directorship
The Director of the Company who held office
during the period was Ronald Schweizer.
Ronald is a representative of I Squared
Capital and his background and experience is
summarised as follows:
80www.energiagroup.com
Ronald SchweizerRonald Schweizer is Chief Financial Officer
at I Squared Capital and joined the Board
on 29 April 2016 following the acquisition
of the Group by I Squared Capital. He has
over 18 years’ experience in private equity
and investment banking. Prior to I Squared
Capital, Ronald served as Senior Vice
President & Head of Alternative Investment
Finance at PineBridge Investments where
he was responsible for the accounting and
operations for PineBridge’s alternative
investments products and oversight of all
investment valuations. Ronald has also served
as Controller at Strategic Value Partners
where he was responsible for the financial,
operational, treasury and valuation aspects of
two private equity funds. Earlier in his career,
Ronald worked at J.P. Morgan Partners as a
Vice President in Funds Management and at
Morgan Stanley as a Manager. Ronald began
his career at Ernst & Young LLP where he spent
six years in their Audit & Assurance group.
The Director considers the strategic and
director’s report and financial statements
comply with all aspects of the Guidelines for
Disclosure and Transparency in Private Equity.
The Director’s Report, as set out on pages 6
to 80, has been approved by the Board and
signed on its behalf by:
Ronald SchweizerDirector
Registered office:
PO Box 309
Ugland House
Grand Cayman
KY1-1104
Cayman Islands
Registered Number: 192375
3 June 2019

81 Energia Group Limited Consolidated Financial Statements 2018 - 2019

82www.energiagroup.com 82
Director’s Responsibilities Statement
83 Energia Group Limited Consolidated Financial Statements 2018 - 2019
Director’s Responsibilities StatementThe Director is responsible for preparing the
Group financial statements and has elected
to prepare those accounts in accordance with
IFRS as adopted by the EU and applicable
law. Accordingly, the Director is required to
prepare Group financial statements which give
a true and fair view of the financial position,
the financial performance and cash flows of
the Group and in preparing the Group financial
statements, to:
• select suitable accounting policies in
accordance with IAS 8: Accounting Policies,
Changes in Accounting Estimates and Errors
and then apply them consistently;
• present information, including accounting
policies, in a manner that provides relevant,
reliable, comparable and understandable
information;
• provide additional disclosures when
compliance with the specific requirements
in IFRS as adopted by the EU is insufficient
to enable users to understand the impact
of particular transactions, other events and
conditions on the Group’s financial position
and financial performance; and
• state whether the Group financial statements
have been prepared in accordance with IFRS
asadopted by the EU.
The Director is responsible for keeping
adequate accounting records that are sufficient
to show and explain the Group’s transactions
and disclose with reasonable accuracy at any
time the financial position of the Group.

84www.energiagroup.com

85 Energia Group Limited Consolidated Financial Statements 2018 - 2019
86www.energiagroup.com 86
Independent Auditors’ ReportTo the members of Energia Group Limited (formerly known as Viridian Group Investments Limited)
87 Energia Group Limited Consolidated Financial Statements 2018 - 2019
Independent Auditors’ ReportOpinion
We have audited the financial statements of
Energia Group Limited (formerly known as
Viridian Group Investments Limited), for the
year ended 31 March 2019 which comprise
the Consolidated Income Statement,
Consolidated Statement of Comprehensive
Income, Consolidated Balance Sheet,
Consolidated Statement of Changes in Equity,
Consolidated Statement of Cash Flows and the
related notes 1 to 35 including a summary of
significant accounting policies. The financial
reporting framework that has been applied
in their preparation is International Financial
Reporting Standards (IFRSs) as adopted by
the European Union.
In our opinion the financial statements:
• give a true and fair view of the Group’s affairs
as at 31 March 2019 and of its profit for the year
then ended; and
• have been properly prepared in accordance
with International Financial Reporting
Standards (IFRSs) as adopted by the
European Union.
Basis for opinion
We conducted our audit in accordance with
International Standards on Auditing (UK)
(ISAs (UK)). Our responsibilities under those
standards are further described in the Auditor’s
responsibilities for the audit of the financial
statements section of our report below. We are
independent of the Group in accordance with
the ethical requirements that are relevant to
our audit of the financial statements in the UK,
including the FRC’s Ethical Standard, and we
have fulfilled our other ethical responsibilities
in accordance with these requirements.
We believe that the audit evidence we have
obtained is sufficient and appropriate to
provide a basis for our opinion.
88www.energiagroup.com
Conclusions relating to going concern
We have nothing to report in respect of the
following matters in relation to which the ISAs
(UK) require us to report to you where:
• the Director’s use of the going concern basis of
accounting in the preparation of the financial
statements is not appropriate; or
• the Director has not disclosed in the
financial statements any identified material
uncertainties that may cast significant doubt
about the Group’s ability to continue to adopt
the going concern basis of accounting for a
period of at least twelve months from the date
when the financial statements are authorised
for issue.
Other information
The other information comprises the
information included in the annual report set
out on pages 3 - 80, other than the financial
statements and our auditor’s report thereon.
The Director is responsible for the other
information.
Our opinion on the financial statements does
not cover the other information and, we do
not express any form of assurance conclusion
thereon.
In connection with our audit of the financial
statements, our responsibility is to read the
other information and, in doing so, consider
whether the other information is materially
inconsistent with the financial statements
or our knowledge obtained in the audit or
otherwise appears to be materially misstated.
If we identify such material inconsistencies
or apparent material misstatements, we
are required to determine whether there
is a material misstatement in the financial
statements or a material misstatement of
the other information. If, based on the work
we have performed, we conclude that there
is a material misstatement of the other
information, we are required to report that fact.
We have nothing to report in this regard.
Responsibilities of directors
As explained more fully in the Director’s
responsibilities statement set out on page
82, the Director is responsible for the
preparation of the financial statements and
for being satisfied that they give a true and
fair view, and for such internal control as the
Director determines is necessary to enable the
preparation of financial statements that are
free from material misstatement, whether due
to fraud or error.
In preparing the financial statements, the
Director is responsible for assessing the
Group’s ability to continue as a going concern,
disclosing, as applicable, matters related to
going concern and using the going concern
basis of accounting unless the director either
intends to liquidate the Group or to cease
operations, or have no realistic alternative but
to do so.
89 Energia Group Limited Consolidated Financial Statements 2018 - 2019
Auditors’ responsibilities for the audit of the financial statements
Our objectives are to obtain reasonable
assurance about whether the financial
statements as a whole are free from material
misstatement, whether due to fraud or
error, and to issue an auditor’s report that
includes our opinion. Reasonable assurance
is a high level of assurance, but is not
a guarantee that an audit conducted in
accordance with ISAs (UK) will always detect
a material misstatement when it exists.
Misstatements can arise from fraud or error
and are considered material if, individually or
in the aggregate, they could reasonably be
expected to influence the economic decisions
of users taken on the basis of these financial
statements.
A further description of our responsibilities
for the audit of the financial statements
is located on the Financial Reporting
Council’s website at https://www.frc.org.uk/auditorsresponsibilities. This description
forms part of our auditor’s report.
Use of our report
This report is made solely to the Company’s
Director, as a body, in accordance with our
engagement letter dated July 2018. Our audit
work has been undertaken so that we might
state to the Company’s Director those matters
we are required to state to them in an auditor’s
report and for no other purpose. To the fullest
extent permitted by law, we do not accept or
assume responsibility to anyone other than
the Company and the Company’s Director as a
body, for our audit work, for this report, or for
the opinions we have formed.
Ernst & Young LLPBelfast
3 June 2019
90www.energiagroup.com 90
Consolidated Financial Statements
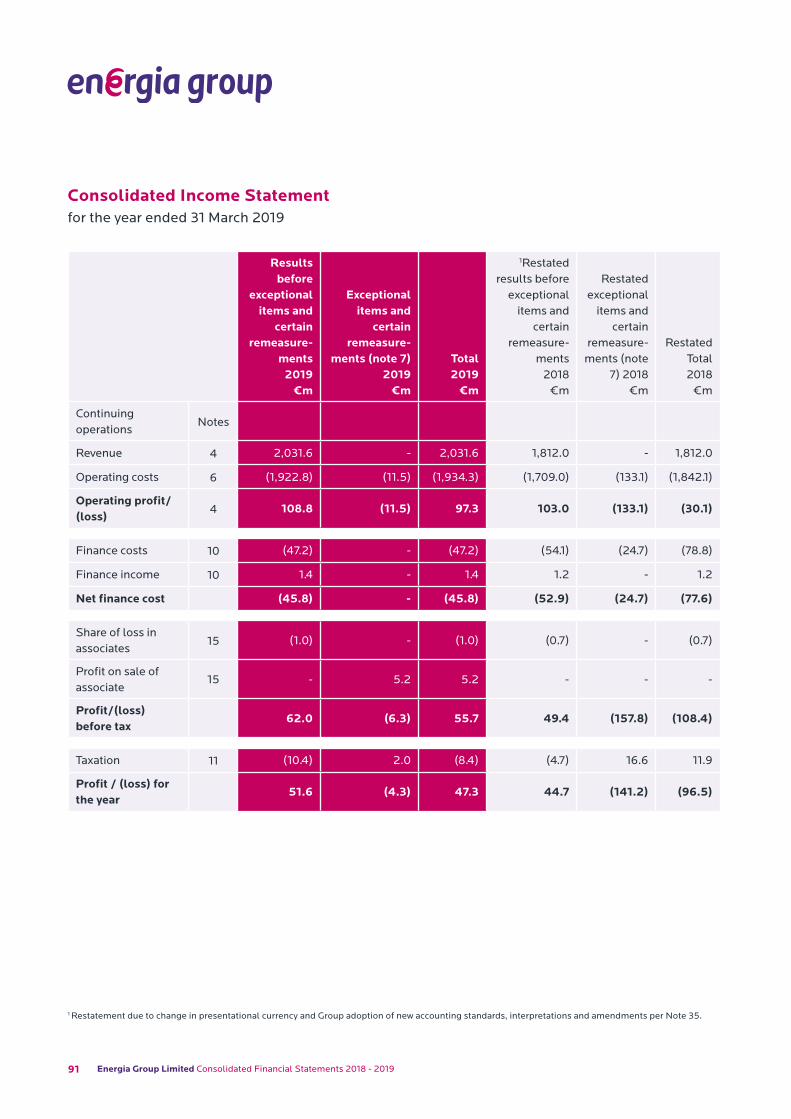
91 Energia Group Limited Consolidated Financial Statements 2018 - 2019
1 Restatement due to change in presentational currency and Group adoption of new accounting standards, interpretations and amendments per Note 35.
Consolidated Income Statementfor the year ended 31 March 2019
Results before
exceptional items and
certain remeasure-
ments 2019
€m
Exceptional items and
certain remeasure-
ments (note 7) 2019
€m
Total 2019
€m
1Restated results before
exceptional items and
certain remeasure-
ments 2018
€m
Restated exceptional
items and certain
remeasure-ments (note
7) 2018 €m
Restated Total 2018
€m
Continuing operations
Notes
Revenue 4 2,031.6 - 2,031.6 1,812.0 - 1,812.0
Operating costs 6 (1,922.8) (11.5) (1,934.3) (1,709.0) (133.1) (1,842.1)
Operating profit/(loss)
4 108.8 (11.5) 97.3 103.0 (133.1) (30.1)
Finance costs 10 (47.2) - (47.2) (54.1) (24.7) (78.8)
Finance income 10 1.4 - 1.4 1.2 - 1.2
Net finance cost (45.8) - (45.8) (52.9) (24.7) (77.6)
Share of loss in associates
15 (1.0) - (1.0) (0.7) - (0.7)
Profit on sale of associate
15 - 5.2 5.2 - - -
Profit/(loss) before tax
62.0 (6.3) 55.7 49.4 (157.8) (108.4)
Taxation 11 (10.4) 2.0 (8.4) (4.7) 16.6 11.9
Profit / (loss) for the year
51.6 (4.3) 47.3 44.7 (141.2) (96.5)
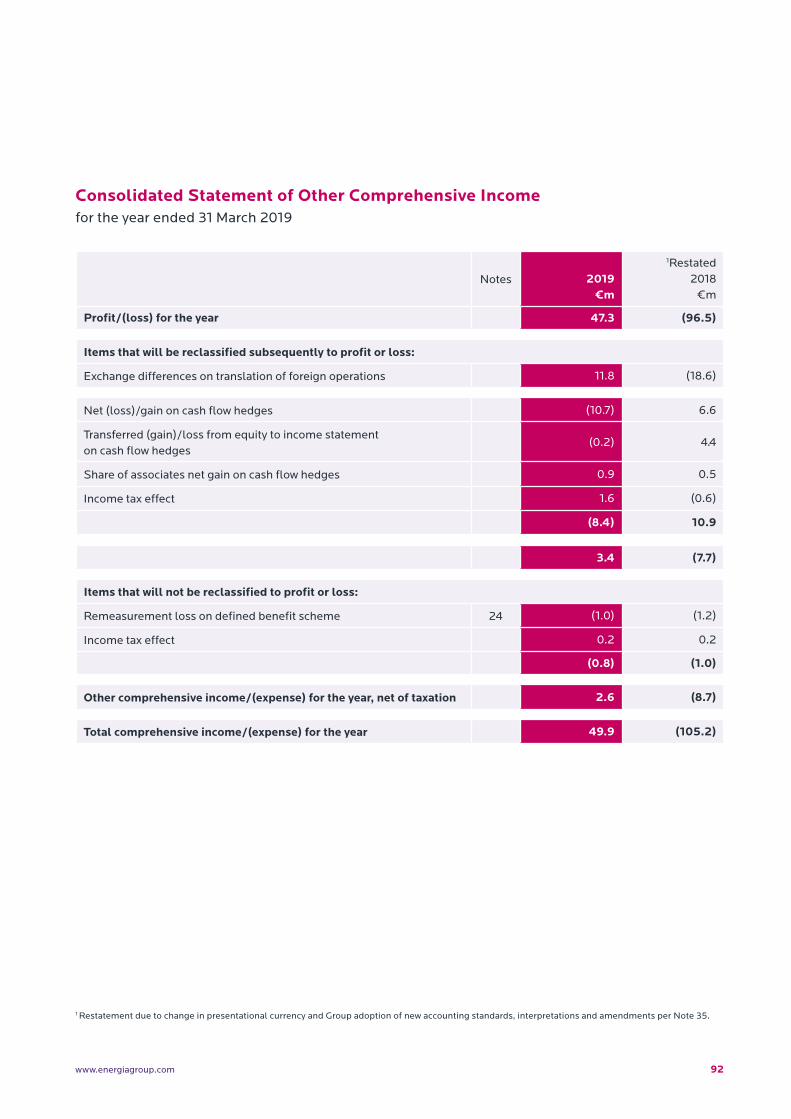
92www.energiagroup.com
Consolidated Statement of Other Comprehensive Incomefor the year ended 31 March 2019
Notes 2019 €m
1Restated 2018
€m
Profit/(loss) for the year 47.3 (96.5)
Items that will be reclassified subsequently to profit or loss:
Exchange differences on translation of foreign operations 11.8 (18.6)
Net (loss)/gain on cash flow hedges (10.7) 6.6
Transferred (gain)/loss from equity to income statement on cash flow hedges
(0.2) 4.4
Share of associates net gain on cash flow hedges 0.9 0.5
Income tax effect 1.6 (0.6)
(8.4) 10.9
3.4 (7.7)
Items that will not be reclassified to profit or loss:
Remeasurement loss on defined benefit scheme 24 (1.0) (1.2)
Income tax effect 0.2 0.2
(0.8) (1.0)
Other comprehensive income/(expense) for the year, net of taxation 2.6 (8.7)
Total comprehensive income/(expense) for the year 49.9 (105.2)
1 Restatement due to change in presentational currency and Group adoption of new accounting standards, interpretations and amendments per Note 35.

93 Energia Group Limited Consolidated Financial Statements 2018 - 2019
Consolidated Balance Sheetas at 31 March 2019
ASSETS Notes31 March
2019 €m
1Restated 31 March
2018 €m
1Restated 1 April
2017 €m
Non-current assets:
Property, plant and equipment 12 513.9 473.5 582.1
Intangible assets 13 694.2 659.5 651.3
Investment in associates 15 2.9 7.7 7.2
Derivative financial instruments 26 2.7 6.0 23.4
Other non-current financial assets 18 - 0.1 0.1
Deferred tax assets 11 29.7 31.1 32.0
1,243.4 1,177.9 1,296.1
Current assets:
Inventories 5.6 5.6 5.6
Trade and other receivables 19 216.4 218.1 175.5
Derivative financial instruments 26 22.4 12.6 11.8
Other current financial assets 18 13.1 6.1 4.4
Cash and cash equivalents 20 196.6 144.0 140.5
454.1 386.4 337.8
TOTAL ASSETS 1,697.5 1,564.3 1,633.9
1 Restatement due to change in presentational currency and Group adoption of new accounting standards, interpretations and amendments per Note 35.
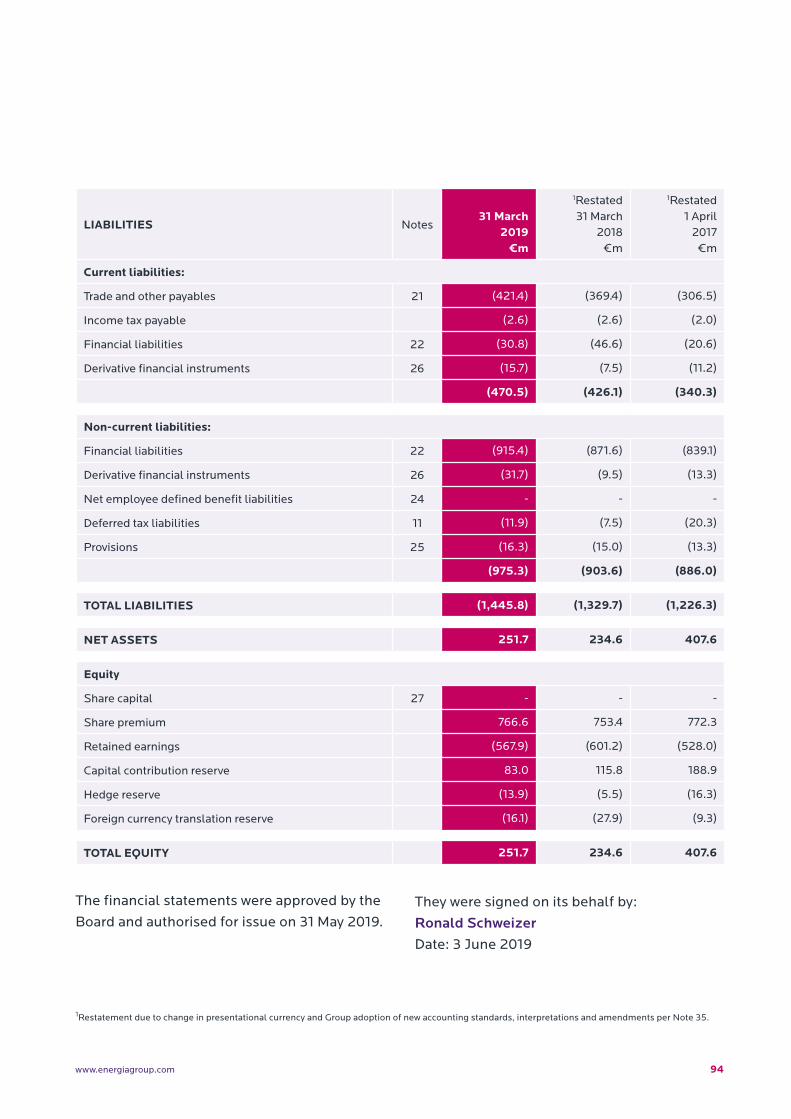
94www.energiagroup.com
LIABILITIES Notes31 March
2019 €m
1Restated 31 March
2018 €m
1Restated 1 April
2017 €m
Current liabilities:
Trade and other payables 21 (421.4) (369.4) (306.5)
Income tax payable (2.6) (2.6) (2.0)
Financial liabilities 22 (30.8) (46.6) (20.6)
Derivative financial instruments 26 (15.7) (7.5) (11.2)
(470.5) (426.1) (340.3)
Non-current liabilities:
Financial liabilities 22 (915.4) (871.6) (839.1)
Derivative financial instruments 26 (31.7) (9.5) (13.3)
Net employee defined benefit liabilities 24 - - -
Deferred tax liabilities 11 (11.9) (7.5) (20.3)
Provisions 25 (16.3) (15.0) (13.3)
(975.3) (903.6) (886.0)
TOTAL LIABILITIES (1,445.8) (1,329.7) (1,226.3)
NET ASSETS 251.7 234.6 407.6
Equity
Share capital 27 - - -
Share premium 766.6 753.4 772.3
Retained earnings (567.9) (601.2) (528.0)
Capital contribution reserve 83.0 115.8 188.9
Hedge reserve (13.9) (5.5) (16.3)
Foreign currency translation reserve (16.1) (27.9) (9.3)
TOTAL EQUITY 251.7 234.6 407.6
The financial statements were approved by the
Board and authorised for issue on 31 May 2019. They were signed on its behalf by:
Ronald SchweizerDate: 3 June 2019
1Restatement due to change in presentational currency and Group adoption of new accounting standards, interpretations and amendments per Note 35.
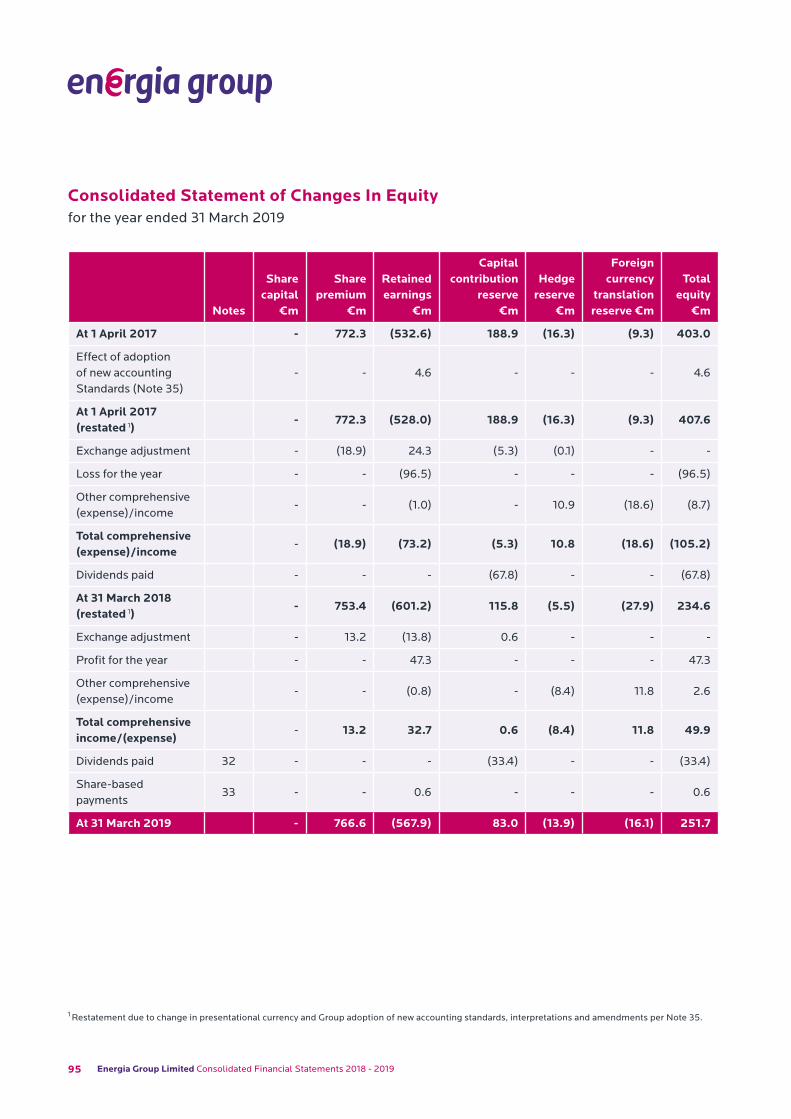
95 Energia Group Limited Consolidated Financial Statements 2018 - 2019
Notes
Sharecapital
€m
Sharepremium
€m
Retained earnings
€m
Capital contribution
reserve €m
Hedgereserve
€m
Foreign currency
translation reserve €m
Totalequity
€m
At 1 April 2017 - 772.3 (532.6) 188.9 (16.3) (9.3) 403.0
Effect of adoption of new accounting Standards (Note 35)
- - 4.6 - - - 4.6
At 1 April 2017 (restated 1)
- 772.3 (528.0) 188.9 (16.3) (9.3) 407.6
Exchange adjustment - (18.9) 24.3 (5.3) (0.1) - -
Loss for the year - - (96.5) - - - (96.5)
Other comprehensive (expense)/income
- - (1.0) - 10.9 (18.6) (8.7)
Total comprehensive (expense)/income
- (18.9) (73.2) (5.3) 10.8 (18.6) (105.2)
Dividends paid - - - (67.8) - - (67.8)
At 31 March 2018 (restated 1)
- 753.4 (601.2) 115.8 (5.5) (27.9) 234.6
Exchange adjustment - 13.2 (13.8) 0.6 - - -
Profit for the year - - 47.3 - - - 47.3
Other comprehensive (expense)/income
- - (0.8) - (8.4) 11.8 2.6
Total comprehensive income/(expense)
- 13.2 32.7 0.6 (8.4) 11.8 49.9
Dividends paid 32 - - - (33.4) - - (33.4)
Share-based payments
33 - - 0.6 - - - 0.6
At 31 March 2019 - 766.6 (567.9) 83.0 (13.9) (16.1) 251.7
Consolidated Statement of Changes In Equityfor the year ended 31 March 2019
1 Restatement due to change in presentational currency and Group adoption of new accounting standards, interpretations and amendments per Note 35.
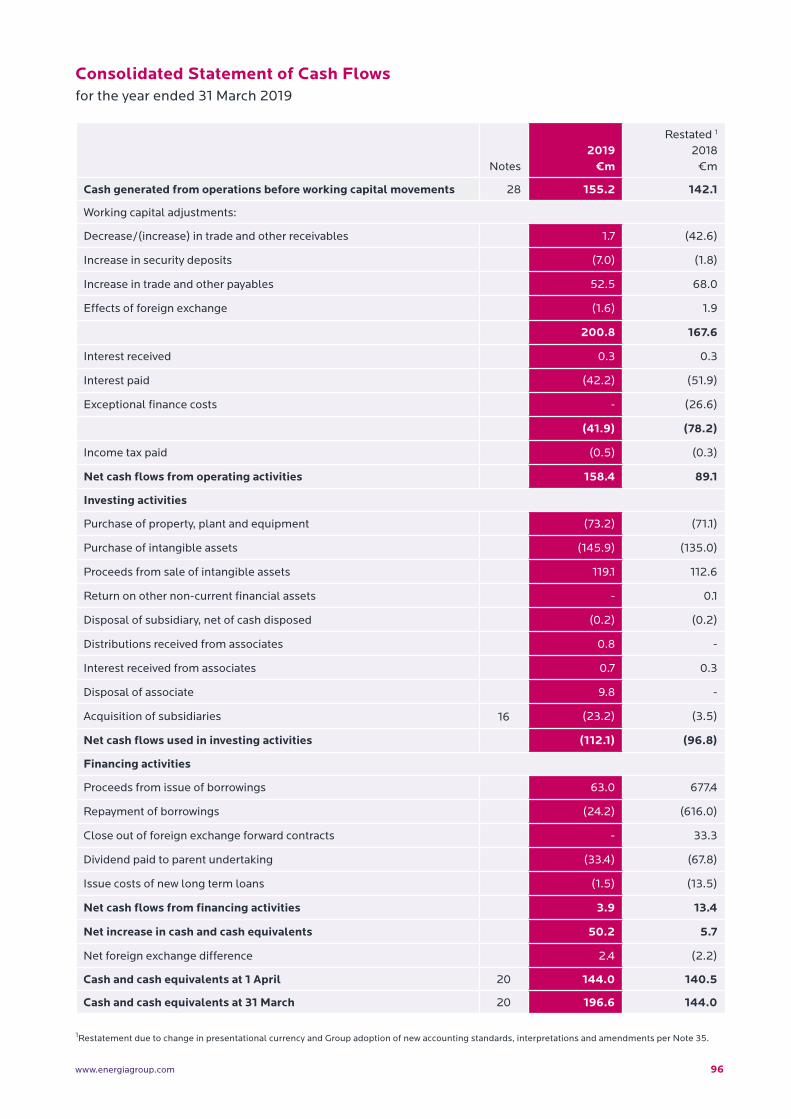
96www.energiagroup.com
Consolidated Statement of Cash Flowsfor the year ended 31 March 2019
Notes2019
€m
Restated 1
2018 €m
Cash generated from operations before working capital movements 28 155.2 142.1
Working capital adjustments:
Decrease/(increase) in trade and other receivables 1.7 (42.6)
Increase in security deposits (7.0) (1.8)
Increase in trade and other payables 52.5 68.0
Effects of foreign exchange (1.6) 1.9
200.8 167.6
Interest received 0.3 0.3
Interest paid (42.2) (51.9)
Exceptional finance costs - (26.6)
(41.9) (78.2)
Income tax paid (0.5) (0.3)
Net cash flows from operating activities 158.4 89.1
Investing activities
Purchase of property, plant and equipment (73.2) (71.1)
Purchase of intangible assets (145.9) (135.0)
Proceeds from sale of intangible assets 119.1 112.6
Return on other non-current financial assets - 0.1
Disposal of subsidiary, net of cash disposed (0.2) (0.2)
Distributions received from associates 0.8 -
Interest received from associates 0.7 0.3
Disposal of associate 9.8 -
Acquisition of subsidiaries 16 (23.2) (3.5)
Net cash flows used in investing activities (112.1) (96.8)
Financing activities
Proceeds from issue of borrowings 63.0 677.4
Repayment of borrowings (24.2) (616.0)
Close out of foreign exchange forward contracts - 33.3
Dividend paid to parent undertaking (33.4) (67.8)
Issue costs of new long term loans (1.5) (13.5)
Net cash flows from financing activities 3.9 13.4
Net increase in cash and cash equivalents 50.2 5.7
Net foreign exchange difference 2.4 (2.2)
Cash and cash equivalents at 1 April 20 144.0 140.5
Cash and cash equivalents at 31 March 20 196.6 144.0
1Restatement due to change in presentational currency and Group adoption of new accounting standards, interpretations and amendments per Note 35.
97 Energia Group Limited Consolidated Financial Statements 2018 - 2019
1. CORPORATE INFORMATION
The consolidated financial statements of
Energia Group Limited (formerly known as
Viridian Group Investments Limited) and its
subsidiaries (collectively, the Group) for the year
ended 31 March 2019 were authorised for issue
in accordance with a resolution of the Director
on 31 May 2019. Energia Group Limited (the
Company or the parent) is a limited company
incorporated and domiciled in the Cayman
Islands. The registered office is located at PO Box
309, Ugland House, Grand Cayman, KY1-1104,
Cayman Islands. The Group’s operations and its
principal activities are set out earlier in the Report
on pages 9 to 10.
2.1 BASIS OF PREPARATION
The consolidated financial statements of the
Group have been prepared in accordance with
International Financial Reporting Standards as
adopted by the European Union (IFRS) as they
apply to the financial statements of the Group for
the year ended 31 March 2019.
The consolidated financial statements have
been prepared on a historical cost basis, except
for derivative financial instruments, contingent
consideration arising on business combinations
and the assets of the Group’s pension scheme
that have been measured at fair value and the
liabilities of the Group’s pension scheme that
are measured using the projected unit credit
valuation method. The consolidated financial
statements are presented in Euros with all values
rounded to the nearest million (€m) except
where otherwise indicated.
The consolidated financial statements provide
comparative information in respect of the
previous period. In addition, the Group presents
an additional statement of financial position
at the beginning of the preceding period
when there is a retrospective application of an
accounting policy, a retrospective restatement, or
a reclassification of items in financial statements.
An additional statement of financial position as
at 1 April 2017 is presented in these consolidated
financial statements due to the retrospective
application of accounting policies as a result of
the adoption of new accounting standards. See
Note 3a.
Change in presentational currencyDuring the year, the Group changed the currency
in which it presents its consolidated financial
statements from pounds sterling to Euros
following a strategic review of the Group in the
year to reflect the increasing focus of the Group’s
business activities within the Republic of Ireland
as described on page 8.
A change in presentational currency is a change
in accounting policy which is accounted for
retrospectively. Statutory financial information
included in the Group’s consolidated financial
statements for the year ended 31 March 2018
previously reported in sterling has been restated
into Euros using the procedures outlined below:
• assets and liabilities denominated in non-
Euro currencies were translated into Euros at
the closing rates of exchange on the relevant
balance sheet date;
98www.energiagroup.com
• non-Euro income and expenditure were
translated at the average rates of exchange
prevailing for the relevant period;
• the cumulative translation reserve was set
to nil at 1 April 2011, the date of transition to
IFRS, and these reserves have been restated
on the basis that the Group has reported in
Euros since that date;
• share capital, share premium and other
reserves have been translated at the closing
rates of exchange on the relevant balance
sheet date; and
• all exchange rates were extracted from the
Group’s underlying financial records.
Change in segmental reporting During the year a strategic review of the Group
was undertaken as described on page 8. As a
result of this review, the Board has determined
that it is more appropriate to manage the Group
through reportable segments aligned to business
drivers rather than the business units previously
reported. Therefore with effect from 31 March
2019 the Board has organised the Group into
the following segments for management and
reporting purposes:
• Renewables;
• Flexible Generation; and
• Customer Solutions.
2.2 BASIS OF CONSOLIDATION
The consolidated financial statements comprise
the financial statements of the Group and its
subsidiaries as at 31 March 2019. Control is
achieved when the Group is exposed, or has
rights, to variable returns from its involvement
with the investee and has the ability to affect
those returns through its power over the investee.
Specifically, the Group controls an investee if and
only if the Group has:
• power over the investee (i.e. existing rights
that give it the current ability to direct the
relevant activities of the investee);
• exposure, or rights, to variable returns from its
involvement with the investee; and
• the ability to use its power over the investee to
affect its returns.
When the Group has less than a majority of the
voting or similar rights of an investee, the Group
considers all relevant facts and circumstances in
assessing whether it has power over an investee,
including:
• the contractual arrangement with the other
vote holders of the investee;
• rights arising from other contractual
arrangements; and
• the Group’s voting rights and potential voting
rights.
The Group re-assesses whether or not it controls
an investee if facts and circumstances indicate
that there are changes to one or more of the
99 Energia Group Limited Consolidated Financial Statements 2018 - 2019
three elements of control. Consolidation of a
subsidiary begins when the Group obtains control
over the subsidiary and ceases when the Group
loses control of the subsidiary. Assets, liabilities,
income and expenses of a subsidiary acquired or
disposed of during the year are included in the
statement of comprehensive income from the
date the Group gains control until the date the
Group ceases to control the subsidiary.
When necessary, adjustments are made to the
financial statements of subsidiaries to bring
their accounting policies into line with the
Group’s accounting policies. All intra-group
assets and liabilities, equity, income, expenses
and cash flows relating to transactions between
members of the Group are eliminated in full on
consolidation.
3. SUMMARY OF SIGNIFICANT ACCOUNTING POLICIES
(a) New and amended standards and interpretations
The Group applied IFRS 15 and IFRS 9 for the
first time in this set of financial statements. The
nature and effect of the changes as a result of
adoption of these new accounting standards are
described below and further detailed in Note 35.
Several other amendments and interpretations
apply for the first time in this set of financial
statements, but do not have an impact on the
consolidated financial statements of the Group.
The Group has not early adopted any standards,
interpretations or amendments that have been
issued but are not yet effective.
IFRS 15 Revenue from Contracts with CustomersIFRS 15 supersedes IAS 11 Construction
Contracts, IAS 18 Revenue and related
interpretations and it applies, with limited
exceptions, to all revenue arising from contracts
with customers. The core principle is that an
entity will recognise revenue at an amount that
reflects the consideration to which the entity
expects to be entitled in exchange for transferring
goods or services to a customer. The standard
establishes a five-step model that will apply to
revenue earned from a contract with a customer
(with limited exceptions), regardless of the type
of revenue transaction or the industry. The five
steps relate to identifying the contract with a
customer, identifying the separate performance
obligations in the contract, determining the
transaction price, allocating the transaction
price to the separate performance obligations
and recognising revenue when (or as) the entity
satisfies the performance obligation under the
contract. The Group adopted IFRS 15 using
the full retrospective method of adoption. For
the vast majority of the Group’s revenue the
application of IFRS 15 had no material impact on
its revenue recognition practices and there was no
impact on the Group’s cash flow.
The key areas affected are described below:
(a) Principal versus agentFor certain variable price Power Purchase
Agreements (PPAs) with renewable generators
both the Group’s Customer Solutions businesses
Energia and Power NI are deemed to be acting
as an agent primarily due to pricing risk being
removed from variable contracts meaning that
they do not bear ‘inventory risk’ as such and
100www.energiagroup.com
therefore revenue is now accounted for on a net
basis for these PPAs. There was no impact in the
consolidated balance sheet as at 31 March 2018
or the opening balance sheet at 1 April 2017.
The consolidated income statement for the year
ended 31 March 2018 was restated resulting in
decreases in both revenue and operating costs
amounting to €10.7m.
(b) Incremental contract costs The accounting for the incremental costs
of obtaining a contract within the Customer
Solutions businesses of the Group has changed
with these costs now being capitalised and
amortised on a basis that reflects the transfer
of goods or services to the customer. The
consolidated balance sheet as at 31 March 2018
was restated, resulting in recognition of customer
acquisition costs amounting to €5.8m, an
increase in the deferred tax liability of €0.8m and
an increase in retained earnings amounting to
€5.0m. The consolidated income statement for
the year ended 31 March 2018 was also restated,
resulting in a decrease in operating costs
amounting to €4.1m, an increase in amortisation
of intangible assets amounting to €3.6m and a
decrease in the tax credit of €0.1m.
(c) OtherIncome of €1.2m in relation to the
reimbursement of costs associated with
the administration of the Northern Ireland
Sustainable Energy Programme (NISEP) which
was previously included in revenue within the
Group’s Customer Solutions business of Power
NI has been netted with the corresponding
operating costs. ROC income of €49.8m within
the Group’s renewables business which was
previously netted within operating costs has been
reclassified to turnover. The consolidated income
statement for the year ended 31 March 2018
was restated resulting in a combined increase in
both revenue and operating costs amounting to
€48.6m. There is no impact in the consolidated
balance sheet as at 31 March 2018.
IFRS 9 Financial InstrumentsIFRS 9 Financial Instruments which replaces
IAS 39 Financial Instruments: Recognition and
Measurement addresses the classification,
measurement and de-recognition of financial
assets and financial liabilities, introduces new
rules for hedge accounting and a new impairment
model for financial assets. The Group adopted
IFRS 9 on 1 April 2018 using the modified
retrospective approach and opted not to restate
comparatives with the main impact to the Group
being as follows:
(a) Impairment The adoption of IFRS 9 has changed the Group’s
accounting for impairment losses for financial
assets by replacing IAS 39’s incurred loss
approach with a forward-looking expected credit
loss (ECL) approach with the main impact for
the Group being in relation to trade receivables.
For trade receivables, the Group has applied
the standard’s simplified approach and has
calculated ECLs based on lifetime expected
credit losses. The Group has established a
provision matrix that is based on the Group’s
historical credit loss experience, adjusted for
forward-looking factors specific to the debtors
and the economic environment. There is no
material impact in the consolidated balance
sheet as at 31 March 2019.
101 Energia Group Limited Consolidated Financial Statements 2018 - 2019
(b) Hedge accounting The Group applied hedge accounting
prospectively. At the date of the initial application
of 1 April 2018 all of the Group’s existing hedging
relationships were eligible to be treated as
continuing hedging relationships. Additionally
adoption of IFRS 9 hedge accounting enabled
the Group to achieve hedge accounting for gas as
a proxy to SMP prospectively from 1 April 2018.
There is no impact in the consolidated balance
sheet as at 31 March 2018.
(b) Business combinations and goodwill
Business combinations are accounted for
using the acquisition method. The cost of an
acquisition is measured as the aggregate of (i)
the consideration transferred and measured at
acquisition date fair value, and (ii) the amount of
any non-controlling interests in the acquiree.
When the Group acquires a business, it assesses
the financial assets and liabilities assumed for
appropriate classification and designation in
accordance with the contractual terms, economic
circumstances and pertinent conditions as at the
acquisition date. This includes the separation of
embedded derivatives in host contracts by the
acquiree.
Any contingent consideration to be transferred
by the acquirer will be recognised at fair value at
the acquisition date. Contingent consideration
classified as an asset or liability that is a financial
instrument and within the scope of IFRS 9
Financial Instruments, is measured at fair value
with changes in fair value recognised in the
Income Statement in accordance with IFRS 9.
If the contingent consideration is not within the
scope of IFRS 9, it is measured in accordance with
the appropriate IFRS. Contingent consideration
that is classified as equity is not remeasured and
subsequent settlement is accounted for within
equity.
Goodwill is initially measured at cost, being the
excess of the aggregate of the consideration
transferred and the amount recognised for non-
controlling interests, and any previous interest
held, over the fair value of the net identifiable
assets acquired and liabilities assumed.
After initial recognition, goodwill is measured at
cost less any accumulated impairment losses.
For the purpose of impairment testing, goodwill
acquired in a business combination is, from the
acquisition date, allocated to each of the Group’s
cash-generating units (CGU) that are expected
to benefit from the combination, irrespective of
whether other assets or liabilities of the acquiree
are assigned to those units. If a subsidiary is
subsequently sold any goodwill arising on
acquisition which has not been impaired is taken
into account in determining the profit or loss on
sale.
(c) Investment in associates
An associate is an entity over which the Group has
significant influence. Significant influence is the
power to participate in the financial and operating
policy decisions of the investee, but does not
control or have joint control over those policies.
The considerations made in determining
significant influence are similar to those
necessary to determine control over subsidiaries.
102www.energiagroup.com
The Group’s investment in its associate is
accounted for using the equity method.
Under the equity method, the investment in
an associate is initially recognised at cost. The
carrying amount of the investment is adjusted
to recognise changes in the Group’s share of net
assets of the associate since the acquisition date.
Goodwill relating to the associate is included
in the carrying amount of the investment and
is neither amortised nor individually tested for
impairment.
The Income Statement reflects the Group’s share
of the results of operations of the associate. Any
change in other comprehensive income of those
investees is presented as part of the Group’s
other comprehensive income. In addition, when
there has been a change recognised directly in
the equity of the associate, the Group recognises
its share of any changes, when applicable, in the
statement of changes in equity. Unrealised gains
and losses resulting from transactions between
the Group and the associate are eliminated to the
extent of the interest in the associate.
The aggregate of the Group’s share of profit
or loss of an associate is shown on the face of
the Income Statement outside operating profit
and represents profit or loss after tax and non-
controlling interests in the subsidiaries of the
associate.
The financial statements of the associate are
prepared for the same reporting period as the
Group. When necessary, adjustments are made to
bring the accounting policies in line with those of
the Group.
After application of the equity method, the
Group determines whether it is necessary to
recognise an impairment loss on its investment
in its associate. At each reporting date, the Group
determines whether there is objective evidence
that the investment in the associate is impaired. If
there is such evidence, the Group calculates the
amount of impairment as the difference between
the recoverable amount of the associate and its
carrying value, then recognises the loss as ‘Share
of profit of an associate’ in the Income Statement.
(d) Current versus non-current classification
The Group presents assets and liabilities in the
Balance Sheet based on current / non-current
classification. An asset is current when it is:
• expected to be realised or intended to be sold
or consumed in a normal operating cycle;
• held primarily for the purpose of trading;
• expected to be realised within twelve months
after the reporting period; or
• cash or cash equivalent unless restricted from
being exchanged or used to settle a liability
for at least twelve months after the reporting
period.
All other assets are classified as non-current.
A liability is current when:
• it is expected to be settled in a normal
operating cycle;
103 Energia Group Limited Consolidated Financial Statements 2018 - 2019
• it is held primarily for the purpose of trading;
• it is due to be settled within twelve months
after the reporting period; or
• there is no unconditional right to defer the
settlement of the liability for at least twelve
months after the reporting period.
The Group classifies all other liabilities as
non-current.
Deferred tax assets and liabilities are classified as
non-current assets and liabilities.
(e) Fair value measurement
The Group measures financial instruments, such
as, derivatives, at each balance sheet date at fair
value.
Fair value is the price that would be received to
sell an asset or paid to transfer a liability in an
orderly transaction between market participants
at the measurement date. The fair value
measurement is based on the presumption that
the transaction to sell the asset or transfer the
liability takes place either:
• in the principal market for the asset or liability;
or
• in the absence of a principal market, in the
most advantageous market for the asset or
liability.
The principal or the most advantageous market
must be accessible to the Group.
The fair value of an asset or a liability is measured
using the assumptions that market participants
would use when pricing the asset or liability,
assuming that market participants act in their
economic best interest.
A fair value measurement of a non-financial asset
takes into account a market participant’s ability to
generate economic benefits by using the asset in
its highest and best use or by selling it to another
market participant that would use the asset in its
highest and best use.
The Group uses valuation techniques that are
appropriate in the circumstances and for which
sufficient data are available to measure fair value,
maximising the use of relevant observable inputs
and minimising the use of unobservable inputs.
All assets and liabilities for which fair value is
measured or disclosed in the financial statements
are categorised within the fair value hierarchy,
described as follows, based on the lowest
level input that is significant to the fair value
measurement as a whole:
• level 1 - quoted (unadjusted) market prices in
active markets for identical assets or liabilities;
• level 2 - valuation techniques for which the
lowest level input that is significant to the fair
value measurement is directly or indirectly
observable; or
• level 3 - valuation techniques for which the
lowest level input that is significant to the fair
value measurement is unobservable.
104www.energiagroup.com
For assets and liabilities that are recognised in
the financial statements on a recurring basis,
the Group determines whether transfers have
occurred between levels in the hierarchy by re-
assessing categorisation (based on the lowest
level input that is significant to the fair value
measurement as a whole) at the end of each
reporting period. For the purpose of fair value
disclosures, the Group has determined classes
of assets and liabilities on the basis of the
nature, characteristics and risks of the asset or
liability and the level of the fair value hierarchy as
explained above.
(f) Revenue from contracts with customers
Revenue from contracts with customers is
recognised when control of the goods or services
are transferred to the customer at an amount that
reflects the consideration to which the Group
expects to be entitled in exchange for those
goods or services provided in the normal course
of business, exclusive of value added tax and
other sales related taxes. The specific recognition
criteria described below must also be met before
revenue is recognised:
Renewable generationThe key revenue streams derived from the
Renewable generation businesses include the
generation of electricity through wholly owned
wind assets and third party contracted PPAs
across the Island of Ireland together with the sale
of Renewable Obligation Certificates (ROCs)
generated from the assets in Northern Ireland.
Revenue in relation to electricity generation is
recognised over time and is only recognised
when the performance obligation is satisfied in
line with IFRS 15. Revenue generated from the
SEM / I-SEM is settled both weekly and monthly
in line with market settlement timelines, while
revenue generated from ROCs are recognised at
a point in time and settled in line with contractual
settlement terms.
Flexible generationTwo key revenue streams are received by the
Flexible Generation businesses Huntstown and
PPB. Capacity revenue is recognised based upon
the capacity (MW) provided to the SEM / I-SEM.
Energy revenue is recognised based upon
electricity units generated during the period at
market price, including an allowance for any
anticipated resettlement within the SEM and
I-SEM. Units are based on energy volumes
recorded by SEMO and these units are reconciled
to the units recorded on the plant systems to
ensure accuracy. Revenue in relation to electricity
generation is recognised over time and is only
recognised when the performance obligation is
satisfied in line with IFRS 15. Revenue generated
from the SEM / I-SEM is settled both weekly and
monthly in line with market settlement timelines.
Customer solutionsRevenue is recognised on the basis of electricity
and gas supplied during the period. This includes
an assessment of electricity and gas supplied to
customers between the date of the last meter
reading and the balance sheet date, estimated
using historical consumption patterns. Revenue
for electricity and gas is recognised over time and
only recognised when the performance obligation
is satisfied in line with IFRS 15. Revenue
recognised includes variable consideration
in respect of estimated market resettlement.
Electricity and gas revenues are invoiced on a
105 Energia Group Limited Consolidated Financial Statements 2018 - 2019
monthly, bi-monthly and quarterly basis with
standard credit terms of 14 days for residential
customers. Credit terms for business customers
vary by contract.
Contract balancesContract assets (accrued income)
A contract asset is the right to consideration in
exchange for goods or services transferred to the
customer. If the Group performs its obligation
by transferring goods or services to a customer
and an invoice has not yet been raised, a contract
asset is recognised for the earned consideration.
Trade receivables
A receivable represents the Group’s right to an
amount of consideration that is unconditional
(i.e. only the passage of time is required before
payment of the consideration is due). Refer to
financial assets accounting policies below.
Contract liabilities (payments on account)
A contract liability is the obligation to transfer
goods or services to a customer for which the
Group has received consideration (or an amount
of consideration is due) from the customer.
If a customer pays consideration before the
Group has transferred goods or services to the
customer, a contract liability is recognised when
the payment is received. Contract liabilities are
recognised as revenue when the Group performs
its performance obligation.
(g) Taxation
The tax charge represents the sum of tax
currently payable and deferred tax. Tax is charged
or credited in the income statement, except when
it relates to items charged or credited directly to
equity, in which case the tax is also dealt with in
equity.
Tax currently payable is based on taxable profit
for the year. Taxable profit differs from net profit
as reported in the income statement because it
excludes both items of income or expense that
are taxable or deductible in other years as well as
items that are never taxable or deductible.
The Group’s liability for current tax is calculated
using tax rates (and tax laws) that have been
enacted or substantially enacted by the balance
sheet date.
Deferred tax is the tax payable or recoverable
on differences between the carrying amount
of assets and liabilities in the accounts and the
corresponding tax basis used in the computation
of taxable profit, and is accounted for using the
balance sheet liability method. Deferred tax
liabilities are generally recognised for all taxable
temporary differences and deferred tax assets
are recognised to the extent that it is probable
that taxable profits will be available against which
deductible temporary differences can be utilised.
Deferred tax is not recognised on temporary
differences where they arise from the initial
recognition of goodwill or of an asset or liability in
a transaction that is not a business combination
that at the time of the transaction affects neither
accounting nor taxable profit nor loss.
Deferred tax is not recognised in respect of
taxable temporary differences associated with
investments in subsidiaries and interests in joint
ventures, when the timing of the reversal of the
temporary differences can be controlled and it is
106www.energiagroup.com
probable that the temporary differences will not
reverse in the foreseeable future.
The carrying amount of deferred tax assets is
reviewed at each balance sheet date and reduced
to the extent that it is no longer probable that
sufficient taxable profits will be available to
allow all or part of the deferred tax asset to be
recovered.
Deferred tax assets and liabilities are calculated
at the tax rates that are expected to apply to the
period when the asset is realised or the liability
is settled, based on tax rates (and tax laws) that
have been enacted or substantially enacted by
the balance sheet date.
Deferred tax relating to items recognised outside
profit or loss is recognised outside profit or loss.
Deferred tax items are recognised in correlation
to the underlying transaction either in other
comprehensive income or directly in equity.
Deferred tax assets and deferred tax liabilities
are offset if a legally enforceable right exists to
set off current tax assets against current income
tax liabilities and the deferred taxes relate to
the same taxable entity and the same taxation
authority.
Tax benefits acquired as part of a business
combination, but not satisfying the criteria for
separate recognition at that date, are recognised
subsequently if new information about facts
and circumstances change. The adjustment is
either treated as a reduction in goodwill (as long
as it does not exceed goodwill) if it was incurred
during the measurement period or recognised in
profit or loss.
(h) Dividends paid
Final dividends are recorded in the year in which
shareholder approval is obtained. Interim dividends
are recorded in the year in which they are paid.
(i) Property, plant and equipment
Property, plant and equipment is stated at cost,
net of accumulated depreciation and accumulated
impairment losses, if any. Such cost includes the
cost of replacing part of the property, plant and
equipment and borrowing costs for long term
construction projects if the recognition criteria are
met. When significant parts of property, plant and
equipment are required to be replaced at intervals,
the Group recognises such parts as individual
assets with specific useful lives and depreciates
them accordingly. Likewise, when a major
inspection is performed, its cost is recognised in
the carrying amount of the plant and equipment
as a replacement if the recognition criteria are
satisfied. All other repair and maintenance
costs are recognised in profit or loss as incurred.
The present value of the expected cost for the
decommissioning of an asset after its use is
included in the cost of the respective asset if the
recognition criteria for a provision are met.
Freehold land is not depreciated. Other tangible
fixed assets are depreciated on a straight-line basis
so as to write off the cost, less estimated residual
value, over their estimated useful economic lives as
follows:
Thermal generation assets - 12 to 30 years
Renewable generation assets - up to 20 years
Fixtures and equipment - up to 25 years
Vehicles and mobile plant - up to 5 years
107 Energia Group Limited Consolidated Financial Statements 2018 - 2019
(j) Intangible assets
Intangible assets acquired separately are
measured on initial recognition at cost. The
cost of intangible assets acquired in a business
combination is their fair value at the date
of acquisition. Following initial recognition,
intangible assets are carried at cost less any
accumulated amortisation and accumulated
impairment losses. Internally generated
intangibles, excluding capitalised development
costs, are not capitalised and the related
expenditure is reflected in profit or loss in the
period in which the expenditure is incurred. The
useful lives of intangible assets are assessed as
either finite or indefinite.
Intangible assets with finite lives are amortised
over the useful economic life and assessed for
impairment whenever there is an indication
that the intangible asset may be impaired. The
amortisation period and the amortisation method
for an intangible asset with a finite useful life are
reviewed at least at the end of each reporting
period. Changes in the expected useful life or
the expected pattern of consumption of future
economic benefits embodied in the asset are
considered to modify the amortisation period
or method, as appropriate, and are treated
as changes in accounting estimates. The
amortisation expense on intangible assets with
finite lives is recognised in the income statement
as the expense category that is consistent with
the function of the intangible assets.
Intangible assets with indefinite useful lives are
not amortised, but are tested for impairment
annually, either individually or at the CGU level.
The assessment of indefinite life is reviewed
annually to determine whether the indefinite life
continues to be supportable. If not, the change
in useful life from indefinite to finite is made on a
prospective basis.
Gains or losses arising from de-recognition of an
intangible asset are measured as the difference
between the net disposal proceeds and the
carrying amount of the asset and are recognised
in the income statement when the asset is
derecognised.
Emissions allowances, renewable and energy efficiency obligations
The Group recognises purchased CO2 emissions
allowances, ROCs and energy efficiency credits
(EECs) initially at cost (purchase price) within
intangible assets and subsequently written
down to their recoverable amount at the balance
sheet date should this be less than the purchase
price. Self-generated ROCs are initially recorded
at fair value within intangible assets with a
corresponding credit to energy costs in the
income statement, and subsequently written
down to their recoverable amount at the balance
sheet date should this be less than the fair value
on initial recognition. No amortisation is recorded
during the period as the intangible asset is
surrendered at the end of the compliance period
reflecting the consumption of economic benefit.
The Group recognises liabilities in respect of its
obligations to deliver emissions allowances to
the extent that the allowances to be delivered
exceed the level of allocation under the EU
emissions trading scheme. Any liabilities
recognised are measured based on the
current estimates of the amounts that will be
108www.energiagroup.com
required to satisfy the obligation. A liability
for the renewables obligation and the climate
change levy is recognised based on the level of
electricity supplied to customers. A liability for
the energy efficiency obligation under the EEOS
is recognised if energy saving minimum targets
are not achieved by the end of the compliance
period. Any such liability is recognised on the
compliance date (31 December) and is calculated
by reference to the relevant penalty rates for
volumes not achieved.
Computer software
The cost of acquiring computer software is
capitalised and amortised on a straight-line
basis over the Director’s estimate of its useful
economic life which is between three and ten
years. The carrying value of computer software is
reviewed for impairment where events or changes
in circumstances indicate that the carrying value
may not be recoverable.
Development assets
Development assets arising from business
combinations relate to value arising from the
development of renewable projects which the
Group believes will generate future economic
benefits. Development assets are amortised
from the date of commissioning of the renewable
asset over its useful economic life which is twenty
years.
At a point the project is no longer expected to
reach construction the carrying amount of the
project is impaired.
Customer acquisition costs
The incremental costs of obtaining a customer
contract within the Customer Solutions
businesses are capitalised and amortised on
a basis that reflects the transfer of goods or
services to the customer.
(k) Financial instruments – initial recognition and subsequent measurement
A financial instrument is any contract that gives
rise to a financial asset of one entity and a
financial liability or equity instrument of another
entity.
Financial assetsInitial recognition and measurement
Financial assets are classified, at initial
recognition, as subsequently measured at
amortised cost, fair value through Other
Comprehensive Income (‘OCI’), and fair value
through the profit or loss.
The classification of financial assets at initial
recognition depends on the financial asset’s
contractual cash flow characteristics and the
Group’s business model for managing them.
Except for trade receivables that do not contain
a significant financing component or which the
Group has applied the practical expedient, the
Group initially measures a financial asset at its fair
value plus, in the case of a financial asset not at
fair value through profit or loss, transaction costs.
Trade receivables that do not contain a significant
financing component or for which the Group has
applied the practical expedient are measured at
the transaction price under IFRS 15.
109 Energia Group Limited Consolidated Financial Statements 2018 - 2019
In order for a financial asset to be classified and
measured at amortised cost or fair value through
OCI, it needs to give rise to cash flows that are
‘Solely Payments of Principal and Interest’
(‘SPPI’) on the principal amount outstanding.
This assessment is referred to as the SPPI test
and is performed at an instrument level.
The Group’s business model for management
of financial assets refers to how it manages its
financial assets in order to generate cash flows.
The business model determines whether the
cash flows will result from collecting contractual
cash flows, selling the financial assets, or both.
Subsequent measurement
For purposes of subsequent measurement
financial assets are classified in four categories:
• financial assets at amortised cost (debt
instruments);
• Financial assets at fair value through OCI with
recycling of cumulative gains and losses (debt
instruments);
• Financial assets designated at fair value
through OCI with no recycling of cumulative
gains and losses upon derecognition (equity
instruments); and
• Financial assets at fair value through profit or
loss.
Financial assets at amortised cost (debt instruments)
This category is the most relevant to the
Group. The Group measures financial assets at
amortised cost if both of the following conditions
are met:
• The financial asset is held within a business
model with the objective to hold financial
assets in order to collect contractual cash
flows; and
• The contractual terms of the financial asset
give rise on specified dates to cash flows that
are solely payments of principal and interest
on the principal amount outstanding.
Financial assets at amortised cost are
subsequently measured using the effective
interest rate (‘EIR’) method and are subject to
impairment. Gains and losses are recognised
in profit or loss when the asset is derecognised,
modified or impaired.
This category generally applies to trade and
other receivables. Trade receivables do not carry
any interest and are recognised and carried at
the lower of their original invoiced value and
recoverable amount.
Financial assets at fair value through profit or loss
Financial assets at fair value through profit or
loss include financial assets held for trading
and financial assets designated upon initial
recognition at fair value through profit or loss.
Financial assets are classified as held for trading
if they are acquired for the purpose of selling or
repurchasing in the near term. Derivatives are
also classified as held for trading unless they are
designated as effective hedging instruments as
defined by IFRS 9. The Group has not designated
110www.energiagroup.com
any financial assets at fair value through profit or
loss. Financial assets at fair value through profit
or loss are carried in the balance sheet at fair
value with net changes in fair value presented as
finance costs (negative net changes in fair value)
or finance income (positive net changes in fair
value) in the income statement.
A derivative embedded in a hybrid contract,
with a financial liability or non-financial host,
is separated from the host and accounted
for as a separate derivative if: the economic
characteristics and risks are not closely related
to the host; a separate instrument with the
same terms as the embedded derivative would
meet the definition of a derivative; and the
hybrid contract is not measured at a fair value
through profit or loss. Embedded derivatives are
measured at fair value with changes in fair value
recognised in profit or loss. Reassessment only
occurs if there is either a change in the terms
of the contract that significantly modifies the
cash flows that would otherwise be required or a
reclassification of a financial assets out of the fair
value through profit or loss category.
A derivative embedded within a hybrid contract
containing a financial asset host is not accounted
for separately. The financial asset host together
with the embedded derivative is required to be
classified in its entirety as a financial asset at fair
value through profit or loss.
Derecognition
A financial asset (or, where applicable, a part
of a financial asset or part of a group of similar
financial assets) is primarily derecognised (i.e.
removed from the Group’s consolidated balance
sheet) when:
• the rights to receive cash flows from the asset
has expired; or
• the Group has transferred its rights to receive
cash flows from the asset or has assumed an
obligation to pay the received cash flows in full
without material delay to a third party under
a ‘pass-through’ arrangement; and either (a)
the Group has transferred substantially all
the risks and rewards of the asset, or (b) the
Group has neither transferred nor retained
substantially all the risks and rewards of the
asset, but has transferred control of the asset.
When the Group has transferred its rights to
receive cash flows from an asset or has entered
into a pass-through arrangement, it evaluates
if, and to what extent, it has retained the risks
and rewards of ownership. When it has neither
transferred nor retained substantially all of the
risks and rewards of the asset, nor transferred
control of the asset, the Group continues to
recognise the transferred asset to the extent
of its continuing involvement. In the case, the
Group also recognised an associated liability. The
transferred asset and the associated liability are
measured on a basis that reflect the rights and
obligations that the Group has retained.
Continuing involvement that the form of a
guarantee over the transferred asset is measured
at the lower of the original carrying amount of the
asset and the maximum of consideration that the
Group could be required to repay.
Impairment of financial assets
The Group recognises an allowance for ECLs for
all debt instruments not held at fair value through
profit or loss. ECLs are based on the
111 Energia Group Limited Consolidated Financial Statements 2018 - 2019
difference between the contractual cash flows
due in accordance with the contract and all the
cash flows that the Group expects to receive,
discounted at an approximation of the original
effective interest rate. The expected cash flows
will include cash flows from the sale of collateral
held or other credit enhancements that are
integral to the contractual terms.
ECLs are recognised in two stages. For credit
exposure for which there has not been a
significant increase in the credit risk since initial
recognition, ECLs are provided for credit losses
that result from default events that are possible
within the next 12 months (a 12 month ECL). For
those credit exposures for which there has been
a significant increase in credit risk since initial
recognition, a loss allowance is required for credit
losses expected over the remaining life of the
exposure, irrespective of the timing of the default
(a lifetime ECL).
For trade receivables and contract assets,
the Group applied a simplified approach in
calculating ECLs. Therefore, the Group does
not track changes in credit risk, but instead
recognised a loss allowance based on the lifetime
ECLs at each reporting date. The Group has
established a provision matrix that is based on
its historical credit loss experience, adjusted for
forward looking factors specific to the debtors
and the economic environment.
The Group considers a financial asset in default
when contractual payments are 90 days past due.
However, in certain cases, the Group may also
consider a financial asset to be in default when
internal or external information indicated that
the Group is unlikely to receive the outstanding
contractual amounts in full before taking into
account any credit enhancements held by the
Group. A financial asset is written off when there
is no reasonable expectation of recovering the
contractual cash flows.
Interest income
For all financial instruments measured at
amortised cost, interest income is recorded
using the EIR method. EIR is the rate that
exactly discounts the estimated future cash
payments or receipts over the expected life of
the financial instrument or a shorter period,
where appropriate, to the net carrying amount
of the financial asset or liability. Interest income
is included in finance income in the income
statement.
Dividend income
Dividend income is recognised on the date
the Group’s right to receive the payments is
established.
Financial liabilitiesInitial recognition and measurement
Financial liabilities are classified, at initial
recognition, as financial liabilities at fair value
through profit or loss, loans and borrowings,
payables, or as derivatives designated as hedging
instruments in an effective hedge, as appropriate.
All financial liabilities are recognised initially at
fair value and, in the case of loans and borrowings
and payables, net of directly attributable
transaction costs.
112www.energiagroup.com
The Group’s financial liabilities include trade
and other payables, loans and borrowings and
derivative financial instruments.
Subsequent measurement
The measurement of financial liabilities depends
on their classification, as described below:
Financial liabilities at fair value through profit or loss
Financial liabilities at fair value through profit or
loss include financial liabilities held for trading
and financial liabilities designated upon initial
recognition as at fair value through profit or loss.
Financial liabilities are classified as held for
trading if they are incurred for the purpose of
repurchasing in the near term. This category also
includes derivative financial instruments entered
into by the Group that are not designated as
hedging instruments in hedge relationships as
defined by IFRS 9. Derivatives are also classified
as held for trading unless they are designated as
effective hedging instruments.
Gains or losses on liabilities held for trading are
recognised in the income statement. Financial
liabilities designated upon initial recognition at
fair value through profit or loss are designated
at the initial date of recognition, and only if the
criteria in IFRS 9 are satisfied. The Group has not
designated any financial liability as at fair value
through profit or loss.
Loans and borrowings
After initial recognition, interest bearing loans
and borrowings are subsequently measured at
amortised cost using the EIR method. Gains and
losses are recognised in profit or loss when the
liabilities are derecognised as well as through the
EIR amortisation process.
Amortised cost is calculated by taking into
account any discount or premium on acquisition
and fees or costs that are an integral part of the
EIR. The EIR amortisation is included as finance
costs in the income statement.
This category generally applies to interest
bearing loans and borrowings. This category also
applies to trade and other payables which are
not interest bearing and stated at their nominal
amount.
Interest free loans receivable from or payable
to the parent undertaking are recognised at fair
value on initial recognition based on the market
rate of interest for similar loans at the date of
issue. In case of loans received from a parent
undertaking the difference on initial recognition
between the fair value and the loan amount is
recorded as a capital contribution in equity. The
difference arising between the amount of a loan
made to a parent undertaking and its fair value
is treated as a distribution to the parent and
reflected within equity. Subsequently, an interest
expense or receivable is recognised within the
income statement using the EIR method so that
each loan is stated at the amount repayable or
receivable at the redemption date.
Derecognition
A financial liability is derecognised when the
obligation under the liability is discharged or
cancelled, or expires. When an existing financial
liability is replaced by another from the same
113 Energia Group Limited Consolidated Financial Statements 2018 - 2019
lender on substantially different terms, or the
terms of an existing liability are substantially
modified, such an exchange or modification
is treated as the derecognition of the original
liability and the recognition of a new liability. The
difference in the respective carrying amounts is
recognised in the income statement.
Offsetting of financial instruments
Financial assets and financial liabilities are
offset and the net amount is reported in the
consolidated statement of financial position if
there is a currently enforceable legal right to
offset the recognised amounts and there is an
intention to settle on a net basis, to realise the
assets and settle the liabilities simultaneously.
(l) Derivative financial instruments and hedge accounting
Initial recognition and subsequent measurement
The Group uses derivative financial instruments,
such as forward currency contracts, interest rate
swaps, contracts for differences and forward
commodity contracts, to hedge its foreign
currency risks, interest rate risks, electricity price
risk and other commodity price risks, respectively.
Such derivative financial instruments are
initially recognised at fair value on the date on
which a derivative contract is entered into and
are subsequently re-measured at fair value.
Derivatives are carried as financial assets when
the fair value is positive and as financial liabilities
when the fair value is negative.
The purchase contracts that meet the definition
of a derivative under IFRS 9 are recognised in the
income statement as operating costs. Commodity
contracts that are entered into and continue to be
held for the purpose of the receipt or delivery of a
non-financial item in accordance with the Group’s
expected purchase, sale or usage requirements
are held at cost.
Any gains or losses arising from changes in the
fair value of derivatives are taken directly to
profit or loss, except for the effective portion of
cash flow hedges, which is recognised in other
comprehensive income and later reclassified to
profit or loss when the hedge item affects profit
or loss.
For the purpose of hedge accounting, hedges are
classified as:
• fair value hedges when hedging the exposure
to changes in the fair value of a recognised
asset or liability or an unrecognised firm
commitment;
• cash flow hedges when hedging the exposure
to variability in cash flows that is either
attributable to a particular risk associated
with a recognised asset or liability or a
highly probable forecast transaction or the
foreign currency risk in an unrecognised firm
commitment; or
• hedges of a net investment in a foreign
operation.
At the inception of a hedge relationship, the
Group formally designates and documents
the hedge relationship to which the Group
wishes to apply hedge accounting and the
risk management objective and strategy for
undertaking the hedge.
114www.energiagroup.com
The documentation includes identification of
the hedging instrument, the hedged item or
transaction, the nature of the risk being hedged
and how the entity will assess the effectiveness of
changes in the hedging instrument’s fair value in
offsetting the exposure to changes in the hedged
item’s fair value or cash flows attributable to the
hedged risk. Such hedges are expected to be
highly effective in achieving offsetting changes
in fair value or cash flows and are assessed on
an ongoing basis to determine that they actually
have been highly effective throughout the
financial reporting periods for which they were
designated.
Hedges that meet the strict criteria for cash flow
hedge accounting are accounted for, as described
below:
Cash flow hedges
The effective portion of the gain or loss on
the hedging instrument is recognised in other
comprehensive income in the cash flow hedge
reserve, while any ineffective portion is recognised
immediately in the income statement in operating
costs. The cash flow hedge reserve is adjusted to
the lower of the cumulative gain or loss on the
hedging instrument and the cumulative change in
fair value of the hedged item.
The Group uses forward currency contracts as
hedges of its exposure to foreign currency risk
in forecast transactions and firm commitments,
as well as forward commodity contracts for its
exposure to volatility in the commodity prices.
The ineffective portion relating to foreign
currency and commodity contracts is recognised
in operating costs.
The amounts accumulated in other
comprehensive income are accounted for,
depending on the nature of the underlying
hedged transaction. If the hedged transaction
subsequently results in the recognition of a
non-financial item, the amount accumulated in
equity is removed from the separate component
of equity and included in the initial cost or other
carrying amount of the hedged asset or liability.
This is not a reclassification adjustment and
will not be recognised in other comprehensive
income for the period. This also applies where
the hedged forecast transaction of a non-financial
asset or non-financial liability subsequently
becomes a firm commitment for which fair value
hedge accounting is applied.
For any other cash flow hedges, the amount
accumulated in other comprehensive income is
reclassified to profit or loss as a reclassification
adjustment in the same period or periods during
which the hedged cash flows affect profit or loss.
If cash flow hedge accounting is discontinued,
the amount that has been accumulated in OCI
must remain in accumulated OCI if the hedged
future cash flows are still expected to occur.
Otherwise, the amount will be immediately
reclassified to profit or loss as a reclassification
adjustment. After discontinuation, once the
hedged cash flows occur, any amount remaining
in accumulated OCI must be accounted for
depending on the nature of the underlying
transaction as described above.
115 Energia Group Limited Consolidated Financial Statements 2018 - 2019
(m) Impairment of non-financial assets
The Group assesses, at each reporting date,
whether there is an indication that an asset
may be impaired. If any indication exists, or
when annual impairment testing for an asset
is required, the Group estimates the asset’s
recoverable amount. An asset’s recoverable
amount is the higher of an asset’s or CGU’s
fair value less costs of disposal and its value
in use. Recoverable amount is determined
for an individual asset, unless the asset does
not generate cash inflows that are largely
independent of those from other assets or groups
of assets. When the carrying amount of an asset
or CGU exceeds its recoverable amount, the asset
is considered impaired and is written down to its
recoverable amount.
In assessing value in use, the estimated future
cash flows are discounted to their present value
using a pre-tax discount rate that reflects current
market assessments of the time value of money
and the risks specific to the asset. In determining
fair value less costs of disposal, recent market
transactions are taken into account. If no such
transactions can be identified, an appropriate
valuation model is used. These calculations are
corroborated by valuation multiples, quoted
share prices for publicly traded companies or
other available fair value indicators.
The Group bases its impairment calculation on
detailed budgets and forecast calculations, which
are prepared separately for each of the Group’s
CGUs to which the individual assets are allocated.
These budgets and forecast calculations
generally cover a period of five years.
For longer periods, a long term growth rate is
calculated and applied to project future cash
flows after the fifth year.
Impairment losses of continuing operations,
including impairment on inventories, are
recognised in the income statement in expense
categories consistent with the function of the
impaired asset.
For assets excluding goodwill, an assessment
is made at each reporting date to determine
whether there is an indication that previously
recognised impairment losses no longer exist
or have decreased. If such indication exists,
the Group estimates the asset’s or CGU’s
recoverable amount. A previously recognised
impairment loss is reversed only if there has been
a change in the assumptions used to determine
the asset’s recoverable amount since the last
impairment loss was recognised. The reversal is
limited so that the carrying amount of the asset
does not exceed its recoverable amount, nor
exceed the carrying amount that would have
been determined, net of depreciation, had no
impairment loss been recognised for the asset
in prior years. Such reversal is recognised in the
statement of profit or loss unless the asset is
carried at a revalued amount, in which case, the
reversal is treated as a revaluation increase.
The following assets have specific characteristics
for impairment testing:
Goodwill
Goodwill is tested for impairment annually and
when circumstances indicate that the carrying
value may be impaired.
116www.energiagroup.com
Impairment is determined for goodwill by
assessing the recoverable amount of each CGU
(or group of CGUs) to which the goodwill relates.
When the recoverable amount of the CGU is
less than its carrying amount, an impairment
loss is recognised. Impairment losses relating to
goodwill cannot be reversed in future periods.
(n) Cash and cash equivalents
Cash and cash equivalents comprise cash at bank
and in hand and short term bank deposits with a
maturity of less than three months.
(o) Provisions
General
Provisions are recognised when (i) the Group
has a present obligation (legal or constructive)
as a result of a past event (ii) it is probable
that an outflow of economic benefits will be
required to settle the obligation and (iii) a
reliable estimate can be made of the amount
of the obligation. Where the Group expects a
provision to be reimbursed, the reimbursement is
recognised as a separate asset but only when the
reimbursement is virtually certain. If the effect of
the time value of money is material, provisions
are determined by discounting the expected
future cash flows at a pre-tax rate that reflects
current market assessments of the time value of
money and, where appropriate, the risks specific
to the liability. Where discounting is used, the
increase in the provision due to the passage of
time is included within finance costs.
Decommissioning liability
Provision is made for estimated decommissioning
costs at the end of the estimated useful lives of
generation assets on a discounted basis based on
price levels and technology at the balance sheet
date. Changes in these estimates and changes to
the discount rates are added to or deducted from
the capitalised cost of the asset to which they
relate. Capitalised decommissioning costs are
depreciated over the estimated useful lives of the
related assets. The unwinding of the discount is
included within finance costs.
(p) Exceptional items and certain remeasurements
As permitted by IAS 1 Presentation of Financial
statements, the Group has disclosed additional
information in respect of exceptional items
on the face of the income statement to
aid understanding of the Group’s financial
performance. An item is treated as exceptional
if it is considered unusual by nature and scale
and of such significance that separate disclosure
is required for the financial statements to be
properly understood. “Certain remeasurements”
are remeasurements arising on certain
commodity, interest rate and currency contracts
which are not designated in hedge accounting
relationships, and which are accounted for as
held for trading in accordance with the Group’s
policy for such financial instruments. This
excludes commodity contracts not treated as
financial instruments under IFRS 9 where held
for the Group’s own use requirements. Certain
remeasurements arising from IFRS 9 are
disclosed separately to aid understanding of the
underlying performance of the Group.
117 Energia Group Limited Consolidated Financial Statements 2018 - 2019
(q) Pensions and other post-employment benefits
The Group has both defined benefit and defined
contribution pension arrangements. The amount
recognised in the balance sheet in respect of
liabilities represents the present value of the
obligations offset by the fair value of assets.
The cost of providing benefits under the
defined benefit scheme is determined using the
projected unit credit method.
Pension remeasurements, comprising of
actuarial gains and losses, excluding net interest,
and the return on plan assets (excluding net
interest), are recognised immediately in the
balance sheet with a corresponding debit
or credit to retained earnings through other
comprehensive income in the period in which
they occur. Pension remeasurements are not
reclassified to profit or loss in subsequent
periods. Past service costs are recognised in
profit or on the earlier of:
• the date of the plan amendment or
curtailment; and
• the date that the Group recognises
restructuring-related costs.
Net interest is calculated by applying the discount
rate to the net defined benefit liability or asset.
The Group recognises the following changes
in the net defined benefit obligation under
operating costs in the consolidated statement of
profit or loss:
• service costs comprising current service
costs, past-service costs, gains and losses on
curtailments and non-routine settlements;
and
• net interest expense or income.
Pension costs in respect of defined contribution
arrangements are charged to the profit and loss
account as they become payable.
(r) Inventories
Inventories are valued at the lower of average
purchase price and net realisable value.
(s) Borrowing costs
Borrowing costs directly attributable to qualifying
assets are capitalised as part of the cost of the
respective assets. All other borrowing costs are
expensed in the period they occur.
(t) Operating lease contracts
Leases are classified as operating lease contracts
whenever the terms of the lease do not transfer
substantially all the risks and benefits of
ownership to the lessee.
Rentals payable under operating leases are
charged to the income statement on a straight-
line basis over the lease term.
118www.energiagroup.com
(u) Foreign currency translation
The Group’s consolidated financial statements
are presented in Euro, which is the Group’s
presentation currency. Energia Group Limited
functional currency is sterling. For each entity
the Group determines the functional currency
and items included in the financial statements of
each entity are measured using that functional
currency.
Transactions in foreign currencies are initially
recorded by the Group’s entities at their respective
functional currency spot rates at the date the
transaction first qualifies for recognition. Monetary
assets and liabilities denominated in foreign
currencies are translated at the functional currency
spot rates of exchange at the reporting date.
Differences arising on settlement or translation
of monetary items are recognised in profit or loss
with the exception of monetary items that are
designated as part of the hedge of the Group’s
net investment of a foreign operation. These
are recognised in other comprehensive income
until the net investment is disposed of, at which
time, the cumulative amount is reclassified to
profit or loss. Tax charges and credits attributable
to exchange differences on those monetary
items are also recorded in other comprehensive
income.
Non-monetary items that are measured in
terms of historical cost in a foreign currency are
translated using the exchange rates at the dates
of the initial transactions.
Any goodwill arising on the acquisition of a
foreign operation and any fair value adjustments
to the carrying amounts of assets and liabilities
arising on the acquisition are treated as assets
and liabilities of the foreign operation and
translated at the spot rate of exchange at the
reporting date.
On consolidation, the assets and liabilities of
foreign operations are translated into Euro at
the rate of exchange prevailing at the reporting
date and their income statements are translated
at exchange rates prevailing at the dates of the
transactions. The exchange differences arising
on translation for consolidation are recognised in
other comprehensive income.
(v) Share-based payments
Employees (senior executives) of the Group
receive remuneration in the form of share-based
payments, whereby employees render services
as consideration for equity instruments (equity-
settled transactions).
Equity-settled transactions
The cost of equity-settled transactions is
determined by the fair value at the date when
the grant is made using an appropriate valuation
model, further details of which are given in Note
33.
That cost is recognised in employee benefits
expense (Note 9), together with a corresponding
increase in equity (retained earnings), over the
period in which the service and, where applicable,
the performance conditions are fulfilled (the
vesting period). The cumulative expense
recognised for equity-settled transactions at each
reporting date until the vesting date reflects the
extent to which the vesting period has expired
119 Energia Group Limited Consolidated Financial Statements 2018 - 2019
and the Group’s best estimate of the number
of equity instruments that will ultimately vest.
The expense or credit in the statement of profit
or loss for a period represents the movement
in cumulative expense recognised as at the
beginning and end of that period.
Service and non-market performance conditions
are not taken into account when determining the
grant date fair value of awards, but the likelihood
of the conditions being met is assessed as part of
the Group’s best estimate of the number of equity
instruments that will ultimately vest. Market
performance conditions are reflected within
the grant date fair value. Any other conditions
attached to an award, but without an associated
service requirement, are considered to be non-
vesting conditions. Non-vesting conditions are
reflected in the fair value of an award and lead to
an immediate expensing of an award unless there
are also service and/or performance conditions.
No expense is recognised for awards that do not
ultimately vest because non-market performance
and/or service conditions have not been met.
Where awards include a market or non-vesting
condition, the transactions are treated as vested
irrespective of whether the market or non-
vesting condition is satisfied, provided that all
other performance and/or service conditions are
satisfied.
When the terms of an equity-settled award are
modified, the minimum expense recognised is
the grant date fair value of the unmodified award,
provided the original vesting terms of the award
are met. An additional expense, measured as at
the date of modification, is recognised for any
modification that increases the total fair value
of the share-based payment transaction, or is
otherwise beneficial to the employee. Where
an award is cancelled by the entity or by the
counterparty, any remaining element of the fair
value of the award is expensed immediately
through profit or loss.
(w) Significant accounting judgements, estimates and assumptions
The preparation of the Group’s consolidated
financial statements requires management to
make judgements, estimates and assumptions
that affect the reported amounts of assets and
liabilities at the balance sheet date and the
amounts reported for revenues and operating
costs during the year. Uncertainty about these
assumptions and estimates could result in
outcomes that require a material adjustment
to the carrying amount of assets or liabilities
affected in future periods.
In the process of applying the Group’s
accounting policies, management has made
the following key judgements and estimations
of uncertainty, which have the most significant
effect on the amounts recognised in the
consolidated financial statements.
Revenue recognition
Revenue on energy sales include an estimate
of the value of electricity or gas supplied to
customers between the date of the last meter
reading and the year end. This will have been
estimated by using historical consumption
patterns. At the balance sheet date, the estimated
consumption by customers will either have
been billed or accrued (estimated unbilled
revenue). Management apply judgement to the
120www.energiagroup.com
measurement of the quantum and valuation of
the estimated consumption. The judgements
applied and the assumptions underpinning these
judgements are considered to be appropriate.
However a change in these assumptions would
impact upon the amount of revenue recognised.
Revenue recognised in the period has been
outlined in note 5.
Impairment testing
The Group reviews the carrying amounts of its
goodwill, other intangible assets and property,
plant and equipment to determine whether there
is any indication that the value of those assets
is impaired. This requires an estimation of the
value in use of the CGUs to which the assets
are allocated which includes the estimation of
future cash flows and the application of a suitable
discount rate. Subsequent changes to these
estimates or judgements may impact the carrying
value of the assets within the respective CGUs.
Impairment testing has been outlined in note 14.
Business combinations
Business combinations require a fair value
exercise to be undertaken to allocate the
purchase price to the fair value of the identifiable
assets acquired and the liabilities assumed.
The determination of the fair value of the assets
and liabilities is based to a considerable extent
on management’s judgement. The amount
of goodwill initially recognised as a result of
a business combination is dependent on the
allocation of this purchase price to the identifiable
assets and liabilities with any unallocated
portion being recorded as goodwill. Business
combinations have been outlined in note 16.
Pensions and other post-employment benefits
The Group has both defined benefit and defined
contribution arrangements. The cost of providing
benefits under the defined benefit scheme is
determined using the projected unit method. The
key assumptions used in relation to the cost of
providing post-retirement benefits are set after
consultation with qualified actuaries. While these
assumptions are considered to be appropriate, a
change in these assumptions would impact the
earnings of the Group. Pensions and other post-
employment benefits have been outlined in note
24.
Share-based payments
Estimating fair value for share-based payment
transactions requires determination of the most
appropriate valuation model, which depends
on the terms and conditions of the grant. This
estimate also requires determination of the
most appropriate inputs to the valuation model
including the expected life of the share option or
appreciation right, volatility and dividend yield
and making assumptions about them. For the
measurement of the fair value of equity-settled
transactions with employees at the grant date, the
Group uses a Monte-Carlo simulation model for
the Management Investment Plan (MIP).
The assumptions and models used for estimating
fair value for share-based payment transactions
are disclosed in Note 33.
Exceptional items and certain remeasurements
The Group has disclosed additional information
in respect of exceptional items on the face of
the income statement to aid understanding of
the Group’s financial performance. An item is
121 Energia Group Limited Consolidated Financial Statements 2018 - 2019
treated as exceptional if it is considered unusual
by nature and scale and of such significance
that separate disclosure is required for the
financial statements to be properly understood.
“Certain remeasurements” are remeasurements
arising on certain commodity, interest rate and
currency contracts which are not designated in
hedge accounting relationships, and which are
accounted for as held for trading in accordance
with the Group’s policy for such financial
instruments. This excludes commodity contracts
not treated as financial instruments under
IFRS 9 where held for the Group’s own use
requirements. Exceptional items and certain
remeasurement have been outlined in note 7.
Credit provisions for trade receivables
The Group applies the IFRS 9 simplified
approach to calculate ECLs for trade receivables
and uses a provision matrix. The matrix approach
allows application of different rates to different
groups of customers with similar characteristics.
The provision matrix is initially based on the
Group’s historical observed default rates. The
Group then calibrate the matrix to adjust the
historical credit loss experience with forward-
looking information. At every reporting date, the
historical observed default rates are updated and
changes in the forward-looking estimates are
analysed. The information about the ECLs on the
Group’s trade receivables and contract assets is
disclosed in Note 19.
Provision for I-SEM resettlement
The new market trading arrangements, which
comprise a Day Ahead Market, Intra-Day Market
and Balancing Market, commenced on 1 October
2018 and are still in their infancy. The Group’s
energy purchase and supply businesses remain
exposed to energy price resettlement risks.
The market operator has not yet resettled these
markets since commencement of the market (the
market is ordinarily resettled 4 months and 13
months after initial settlement) on 1 October 2018
and therefore the Group is exposed to potential
price resettlements in the balancing market.
The Group estimates the level of resettlement
that will be applied. These estimates are based
on known market anomalies as extensively
discussed in industry forums and facts and
circumstances known at the Balance Sheet date.
Estimations are dependent on the resettlement
approach taken by the market operator.
(X) Standards issued but not yet effective
The new and amended standards and
interpretations that are issued, but not yet
effective, up to the date of the issuance of the
Group’s financial statements are disclosed
below. The Group intends to adopt these new
and amended standards and interpretations, if
applicable, when they become effective.
IFRS 16 - Leases
IFRS 16 specifies the recognition, measurement,
presentation and disclosure of leases and will
be applied for the first time in the Group’s
consolidated financial statements for the year
ended 31 March 2020. The standard provides
a single lessee accounting model, requiring
lessees to recognise assets and liabilities for all
leases, unless the lease term is 12 months or less,
or the underlying asset has a low value.
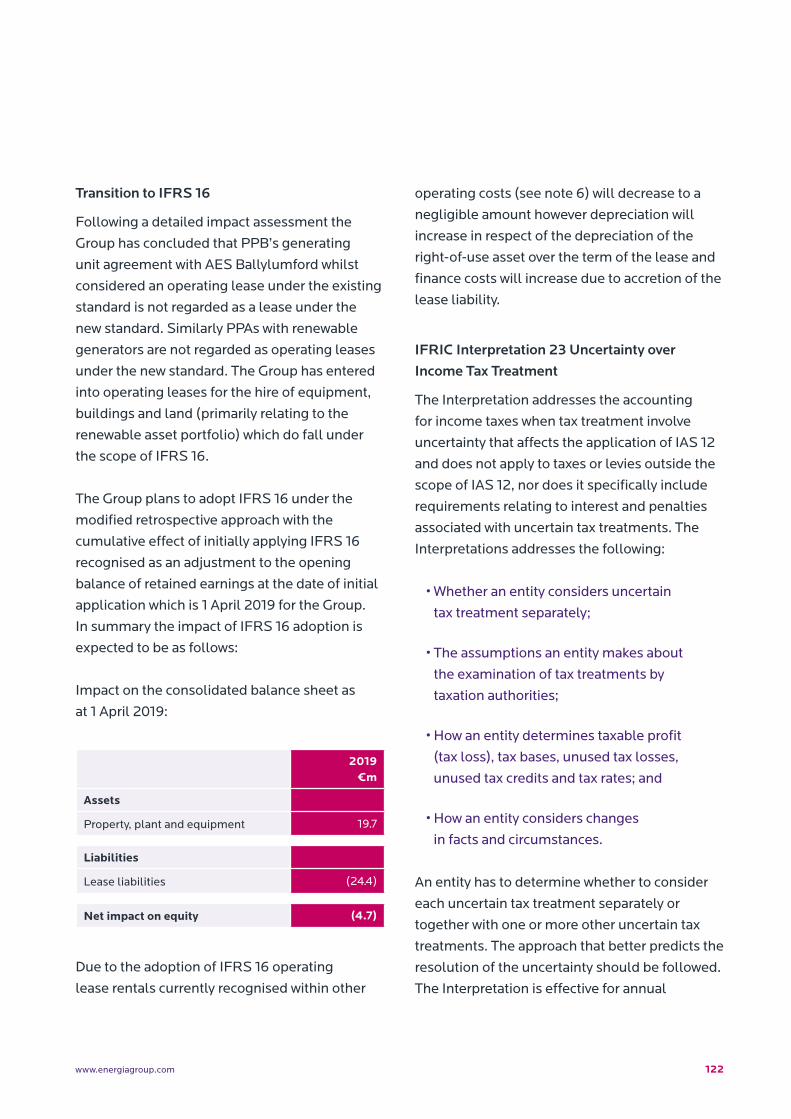
122www.energiagroup.com
Transition to IFRS 16
Following a detailed impact assessment the
Group has concluded that PPB’s generating
unit agreement with AES Ballylumford whilst
considered an operating lease under the existing
standard is not regarded as a lease under the
new standard. Similarly PPAs with renewable
generators are not regarded as operating leases
under the new standard. The Group has entered
into operating leases for the hire of equipment,
buildings and land (primarily relating to the
renewable asset portfolio) which do fall under
the scope of IFRS 16.
The Group plans to adopt IFRS 16 under the
modified retrospective approach with the
cumulative effect of initially applying IFRS 16
recognised as an adjustment to the opening
balance of retained earnings at the date of initial
application which is 1 April 2019 for the Group.
In summary the impact of IFRS 16 adoption is
expected to be as follows:
Impact on the consolidated balance sheet as
at 1 April 2019:
Due to the adoption of IFRS 16 operating
lease rentals currently recognised within other
operating costs (see note 6) will decrease to a
negligible amount however depreciation will
increase in respect of the depreciation of the
right-of-use asset over the term of the lease and
finance costs will increase due to accretion of the
lease liability.
IFRIC Interpretation 23 Uncertainty over Income Tax Treatment
The Interpretation addresses the accounting
for income taxes when tax treatment involve
uncertainty that affects the application of IAS 12
and does not apply to taxes or levies outside the
scope of IAS 12, nor does it specifically include
requirements relating to interest and penalties
associated with uncertain tax treatments. The
Interpretations addresses the following:
• Whether an entity considers uncertain
tax treatment separately;
• The assumptions an entity makes about
the examination of tax treatments by
taxation authorities;
• How an entity determines taxable profit
(tax loss), tax bases, unused tax losses,
unused tax credits and tax rates; and
• How an entity considers changes
in facts and circumstances.
An entity has to determine whether to consider
each uncertain tax treatment separately or
together with one or more other uncertain tax
treatments. The approach that better predicts the
resolution of the uncertainty should be followed.
The Interpretation is effective for annual
2019 €m
Assets
Property, plant and equipment 19.7
Liabilities
Lease liabilities (24.4)
Net impact on equity (4.7)
123 Energia Group Limited Consolidated Financial Statements 2018 - 2019
reporting periods beginning on or after 1 January
2019, but certain transitional reliefs are available.
The Group will apply the interpretation from its
effective date. Application of the interpretation
is not expected to have a material impact on the
Group’s consolidated financial statements.
Amendments to IFRS 9: Prepayments Features with Negative Compensation
Under IFRS 9, a debt instrument can be
measured at amortised costs or at fair value
through other comprehensive income,
provided that the contractual cash flows are
‘Solely Payment of Principal and Interest on
the principal amount outstanding’ (the SPPI
criterion) and the instrument is held within the
appropriate business model for classification.
The amendments to IFRS 9 clarify that a
financial asset passes the SPPI criterion
regardless of the event or circumstance that
causes early termination of the contract.
The amendments should be applied
retrospectively and are effective from 1 January
2019, with earlier application permitted. These
amendments will have no impact on the
consolidated financial statements of the Group.
Amendments to IFRS 10 and IAS 28: Sale or Contribution of Assets between an Investor and its Associate or Joint Venture
The amendments address the conflict between
IFRS 10 and IAS 28 in dealing with the loss of
control of a subsidiary that is sold or contributed
to an associate or joint venture. The amendments
clarify that the gain or loss resulting from the
sale or contribution of assets that constitute
a business, as defined in IFRS 3, between an
investor and its associate or joint venture, is
recognised in full. Any gain or loss resulting from
the sale or contribution of assets that do not
constitute a business, however, is recognised only
to the extent of unrelated investors’ interests
in the associate or joint venture. The IASB has
deferred the effective date of these amendments
indefinitely, but an entity that early adopts the
amendments must apply them prospectively.
The Group will apply these amendments when
they become effective.
Amendments to IAS 19: Plan Amendment, Curtailment or Settlement
The amendments to IAS 19 address the
accounting when a plan amendment, curtailment
or settlement occurs during a reporting period.
The amendments specify that when a plan
amendment, curtailment or settlement occurs
during the annual reporting period, an entity is
required to:
• Determine current service cost for the
remainder of the period after the plan
amendment, curtailment or settlement, using
the actuarial assumptions used to remeasure
the net defined benefit liability / (asset)
reflecting the benefits offered under the plan
and the plan assets after that event;
• Determine net interest for the remainder
of the period after the plan amendment,
curtailment or settlement using: the net
defined benefit liability / (asset) reflecting the
benefits offered under the plan and the plan
assets after that event; and the discount rate
used to remeasure that net defined benefit
liability / (asset).
124www.energiagroup.com
The amendments also clarify that an entity
first determines any past service cost, or a gain
or loss on settlement, without considering
the effect of the asset ceiling. This amount
is recognised in profit or loss. An entity then
determines the effect of the asset ceiling after
the plan amendment, curtailment or settlement.
Any change in that effect, excluding amounts
included in the net interest, is recognised in
other comprehensive income.
The amendments apply to plan amendments,
curtailments, or settlements occurring on or after
the beginning of the first annual reporting period
that begins on or after 1 January 2019, with early
application permitted. These amendments will
apply only to any future plan amendments,
curtailments, or settlements of the Group.
Annual Improvements 2015-2017 Cycle (issued in December 2017)
These improvements include:
IFRS 3 Business Combinations
The amendments clarify that, when an entity
obtains control of a business that is a joint
operation, it applies the requirements for a
business combination achieved in stages,
including remeasuring previously held interests
in the assets and liabilities of the joint operation
at fair value. In doing so, the acquirer remeasures
its entire previously held interest in the joint
operation.
An entity applies those amendments to business
combinations for which the acquisition date
is on or after the beginning of the first annual
reporting period beginning on or after 1 January
2019, with early application permitted. These
amendments will apply on future business
combinations of the Group.
IFRS 11 Joint Arrangements
A party that participates in, but does not have
joint control of, a joint operation might obtain
joint control of the joint operation in which
the activity of the joint operation constitutes a
business as defined in IFRS 3.
The amendments clarify that the previously
held interests in that joint operation are not
remeasured.
An entity applies those amendments to
transactions in which it obtains joint control on or
after the beginning of the first annual reporting
period beginning on or after 1 January 2019, with
early application permitted. These amendments
are currently not applicable to the Group but may
apply to future transactions.
125 Energia Group Limited Consolidated Financial Statements 2018 - 2019
IAS 12 Income Taxes
The amendments clarify that the income tax
consequences of dividends are linked more directly
to past transactions or events that generated
distributable profits than to distributions to owners.
Therefore, an entity recognises the income tax
consequences of dividends in profit or loss, other
comprehensive income or equity according to
where the entity originally recognised those
past transactions or events. An entity applies
those amendments for annual reporting periods
beginning on or after 1 January 2019, with early
application permitted. When an entity first applies
those amendments, it applies them to the income
tax consequences of dividends recognised on or
after the beginning of the earliest comparative
period. Since the Group’s current practice is in line
with these amendments, the Group does not expect
any effect on its consolidated financial statements.
IAS 23 Borrowing Costs
The amendments clarify that an entity treats
as part of general borrowings any borrowing
originally made to develop a qualifying asset
when substantially all of the activities necessary to
prepare that asset for its intended use or sale are
complete.
An entity applies those amendments to borrowing
costs incurred on or after the beginning of the
annual reporting period in which the entity first
applies those amendments. An entity applies
those amendments for annual reporting periods
beginning on or after 1 January 2019, with early
application permitted. Since the Group’s current
practice is in line with these amendments,
the Group does not expect any effect on its
consolidated financial statements.
4. SEGMENTAL ANALYSIS
During the year the Group completed a strategic
review which resulted in a new reporting structure.
For management purposes, the Group is now
organised into business units based on its products
and services and has three reportable segments, as
follows:
(i) Renewables
The Renewables business owns and operates
290MW (including 13MW minority owned)
of wind assets and purchases electricity from
1,281MW of renewable generation capacity
throughout Ireland. In addition, the Renewables
business is currently developing a 4.0MW
bioenergy anaerobic digestion facility in Dublin;
(ii) Flexible Generation
Consists of electricity generation from the
Group’s two Huntstown CCGT plants together
with the administration of the contracted
generation capacity from the Ballylumford
power station in Northern Ireland under
legacy generating unit agreements which
were originally established in 1992 when
the Northern Ireland electricity industry was
restructured;
(iii) Customer Solutions
Consists of the competitive supply of electricity
and gas to business and residential customers
in the RoI, the supply of electricity to business
customers in Northern Ireland through it’s
brand Energia, together with the supply of
electricity to residential and business customers
in Northern Ireland through it’s brand Power NI.
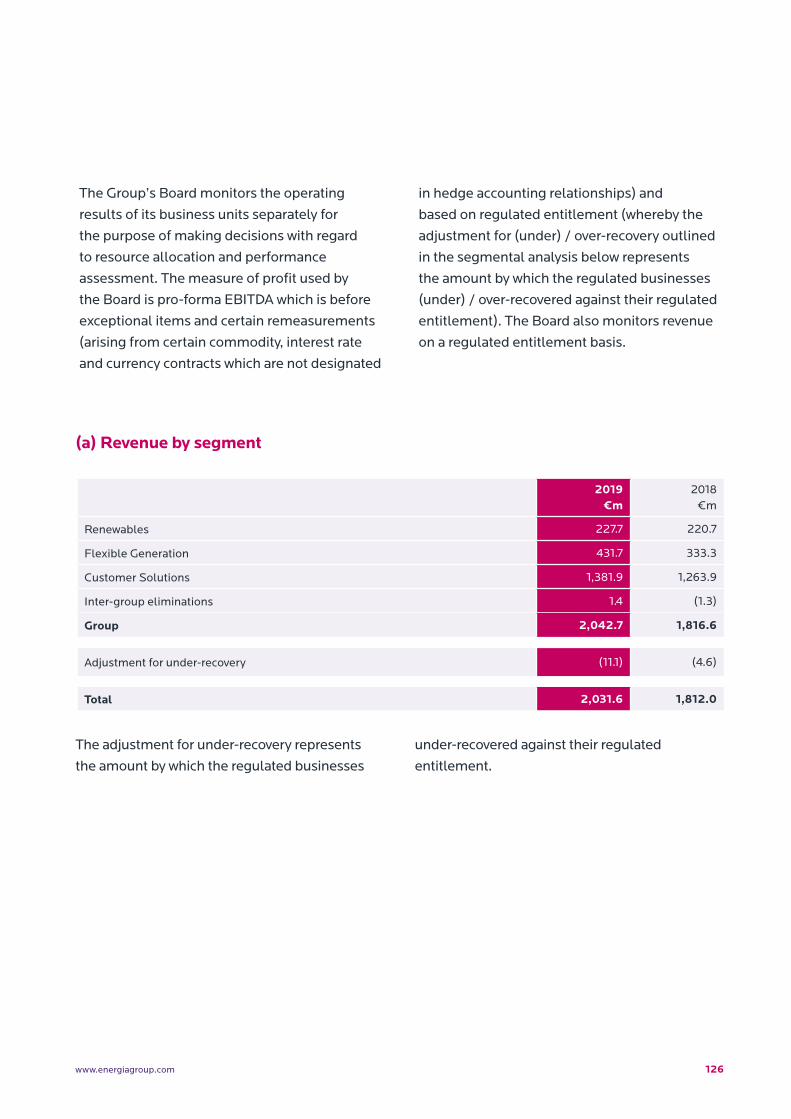
126www.energiagroup.com
The adjustment for under-recovery represents
the amount by which the regulated businesses
under-recovered against their regulated
entitlement.
2019 €m
2018 €m
Renewables 227.7 220.7
Flexible Generation 431.7 333.3
Customer Solutions 1,381.9 1,263.9
Inter-group eliminations 1.4 (1.3)
Group 2,042.7 1,816.6
Adjustment for under-recovery (11.1) (4.6)
Total 2,031.6 1,812.0
(a) Revenue by segment
The Group’s Board monitors the operating
results of its business units separately for
the purpose of making decisions with regard
to resource allocation and performance
assessment. The measure of profit used by
the Board is pro-forma EBITDA which is before
exceptional items and certain remeasurements
(arising from certain commodity, interest rate
and currency contracts which are not designated
in hedge accounting relationships) and
based on regulated entitlement (whereby the
adjustment for (under) / over-recovery outlined
in the segmental analysis below represents
the amount by which the regulated businesses
(under) / over-recovered against their regulated
entitlement). The Board also monitors revenue
on a regulated entitlement basis.
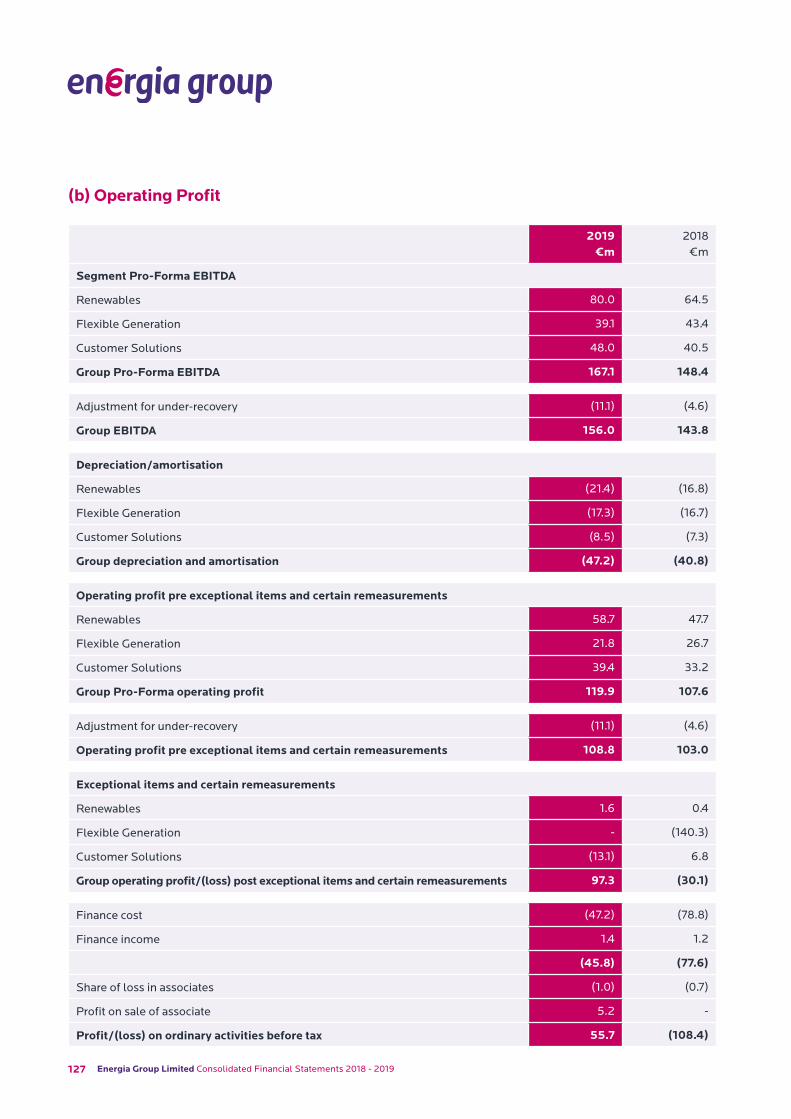
127 Energia Group Limited Consolidated Financial Statements 2018 - 2019
2019 €m
2018 €m
Segment Pro-Forma EBITDA
Renewables 80.0 64.5
Flexible Generation 39.1 43.4
Customer Solutions 48.0 40.5
Group Pro-Forma EBITDA 167.1 148.4
Adjustment for under-recovery (11.1) (4.6)
Group EBITDA 156.0 143.8
Depreciation/amortisation
Renewables (21.4) (16.8)
Flexible Generation (17.3) (16.7)
Customer Solutions (8.5) (7.3)
Group depreciation and amortisation (47.2) (40.8)
Operating profit pre exceptional items and certain remeasurements
Renewables 58.7 47.7
Flexible Generation 21.8 26.7
Customer Solutions 39.4 33.2
Group Pro-Forma operating profit 119.9 107.6
Adjustment for under-recovery (11.1) (4.6)
Operating profit pre exceptional items and certain remeasurements 108.8 103.0
Exceptional items and certain remeasurements
Renewables 1.6 0.4
Flexible Generation - (140.3)
Customer Solutions (13.1) 6.8
Group operating profit/(loss) post exceptional items and certain remeasurements 97.3 (30.1)
Finance cost (47.2) (78.8)
Finance income 1.4 1.2
(45.8) (77.6)
Share of loss in associates (1.0) (0.7)
Profit on sale of associate 5.2 -
Profit/(loss) on ordinary activities before tax 55.7 (108.4)
(b) Operating Profit
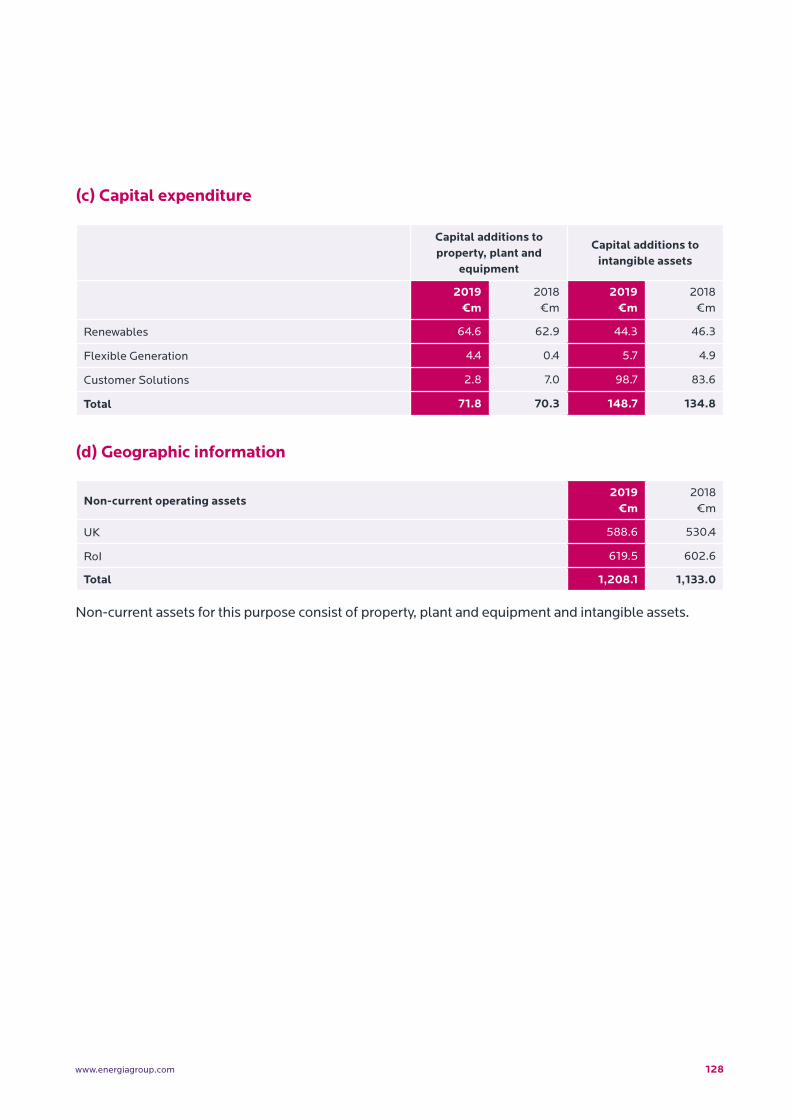
128www.energiagroup.com
Capital additions to property, plant and
equipment
Capital additions tointangible assets
2019 €m
2018 €m
2019 €m
2018 €m
Renewables 64.6 62.9 44.3 46.3
Flexible Generation 4.4 0.4 5.7 4.9
Customer Solutions 2.8 7.0 98.7 83.6
Total 71.8 70.3 148.7 134.8
Non-current operating assets2019
€m2018
€m
UK 588.6 530.4
RoI 619.5 602.6
Total 1,208.1 1,133.0
(c) Capital expenditure
(d) Geographic information
Non-current assets for this purpose consist of property, plant and equipment and intangible assets.
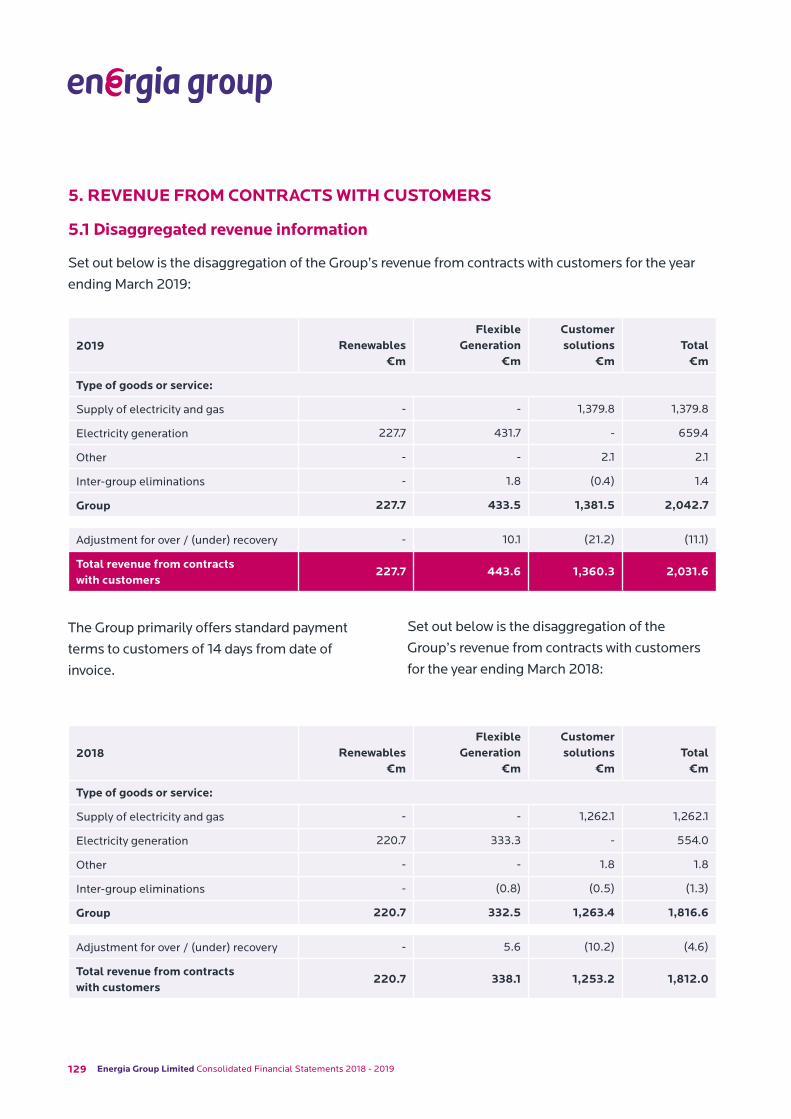
129 Energia Group Limited Consolidated Financial Statements 2018 - 2019
5. REVENUE FROM CONTRACTS WITH CUSTOMERS
5.1 Disaggregated revenue information
Set out below is the disaggregation of the Group’s revenue from contracts with customers for the year
ending March 2019:
The Group primarily offers standard payment
terms to customers of 14 days from date of
invoice.
Set out below is the disaggregation of the
Group’s revenue from contracts with customers
for the year ending March 2018:
2019 Renewables€m
Flexible Generation
€m
Customer solutions
€mTotal
€m
Type of goods or service:
Supply of electricity and gas - - 1,379.8 1,379.8
Electricity generation 227.7 431.7 - 659.4
Other - - 2.1 2.1
Inter-group eliminations - 1.8 (0.4) 1.4
Group 227.7 433.5 1,381.5 2,042.7
Adjustment for over / (under) recovery - 10.1 (21.2) (11.1)
Total revenue from contracts with customers
227.7 443.6 1,360.3 2,031.6
2018 Renewables€m
Flexible Generation
€m
Customer solutions
€mTotal
€m
Type of goods or service:
Supply of electricity and gas - - 1,262.1 1,262.1
Electricity generation 220.7 333.3 - 554.0
Other - - 1.8 1.8
Inter-group eliminations - (0.8) (0.5) (1.3)
Group 220.7 332.5 1,263.4 1,816.6
Adjustment for over / (under) recovery - 5.6 (10.2) (4.6)
Total revenue from contracts with customers
220.7 338.1 1,253.2 1,812.0
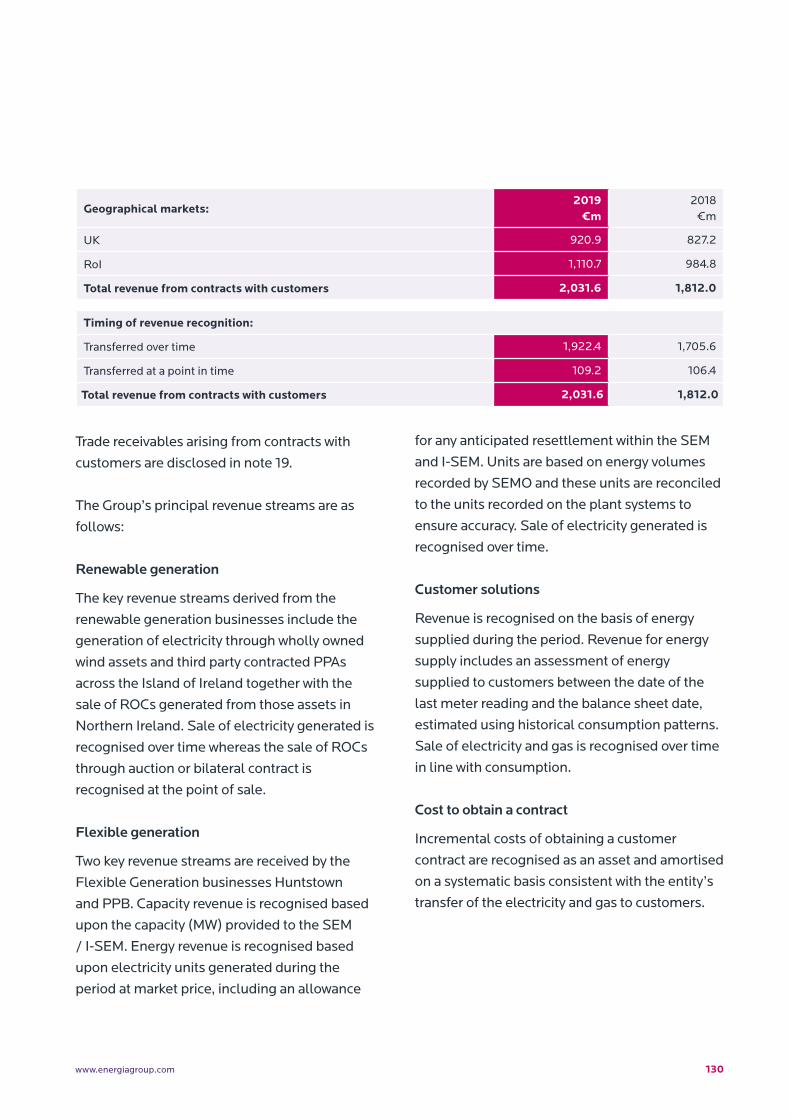
130www.energiagroup.com
Geographical markets:2019
€m2018
€m
UK 920.9 827.2
RoI 1,110.7 984.8
Total revenue from contracts with customers 2,031.6 1,812.0
Timing of revenue recognition:
Transferred over time 1,922.4 1,705.6
Transferred at a point in time 109.2 106.4
Total revenue from contracts with customers 2,031.6 1,812.0
Trade receivables arising from contracts with
customers are disclosed in note 19.
The Group’s principal revenue streams are as
follows:
Renewable generation
The key revenue streams derived from the
renewable generation businesses include the
generation of electricity through wholly owned
wind assets and third party contracted PPAs
across the Island of Ireland together with the
sale of ROCs generated from those assets in
Northern Ireland. Sale of electricity generated is
recognised over time whereas the sale of ROCs
through auction or bilateral contract is
recognised at the point of sale.
Flexible generation
Two key revenue streams are received by the
Flexible Generation businesses Huntstown
and PPB. Capacity revenue is recognised based
upon the capacity (MW) provided to the SEM
/ I-SEM. Energy revenue is recognised based
upon electricity units generated during the
period at market price, including an allowance
for any anticipated resettlement within the SEM
and I-SEM. Units are based on energy volumes
recorded by SEMO and these units are reconciled
to the units recorded on the plant systems to
ensure accuracy. Sale of electricity generated is
recognised over time.
Customer solutions
Revenue is recognised on the basis of energy
supplied during the period. Revenue for energy
supply includes an assessment of energy
supplied to customers between the date of the
last meter reading and the balance sheet date,
estimated using historical consumption patterns.
Sale of electricity and gas is recognised over time
in line with consumption.
Cost to obtain a contract
Incremental costs of obtaining a customer
contract are recognised as an asset and amortised
on a systematic basis consistent with the entity’s
transfer of the electricity and gas to customers.
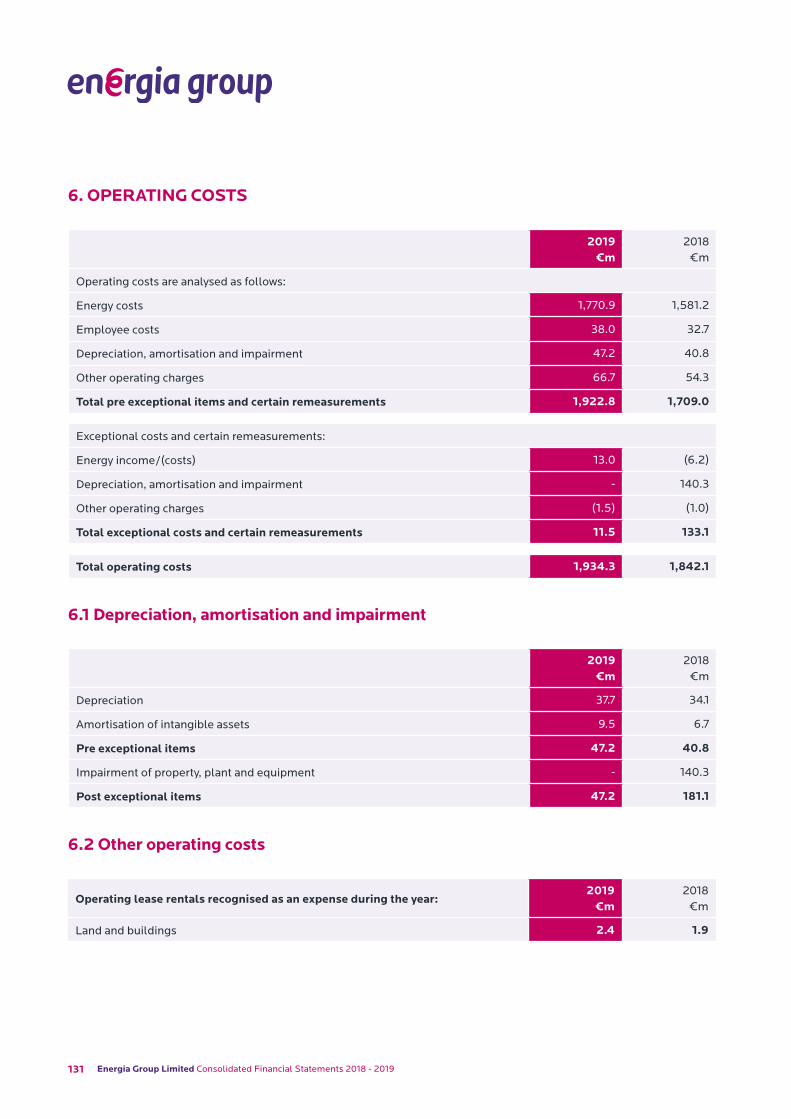
131 Energia Group Limited Consolidated Financial Statements 2018 - 2019
6. OPERATING COSTS
2019 €m
2018 €m
Operating costs are analysed as follows:
Energy costs 1,770.9 1,581.2
Employee costs 38.0 32.7
Depreciation, amortisation and impairment 47.2 40.8
Other operating charges 66.7 54.3
Total pre exceptional items and certain remeasurements 1,922.8 1,709.0
Exceptional costs and certain remeasurements:
Energy income/(costs) 13.0 (6.2)
Depreciation, amortisation and impairment - 140.3
Other operating charges (1.5) (1.0)
Total exceptional costs and certain remeasurements 11.5 133.1
Total operating costs 1,934.3 1,842.1
2019 €m
2018 €m
Depreciation 37.7 34.1
Amortisation of intangible assets 9.5 6.7
Pre exceptional items 47.2 40.8
Impairment of property, plant and equipment - 140.3
Post exceptional items 47.2 181.1
Operating lease rentals recognised as an expense during the year:2019
€m2018
€m
Land and buildings 2.4 1.9
6.1 Depreciation, amortisation and impairment
6.2 Other operating costs
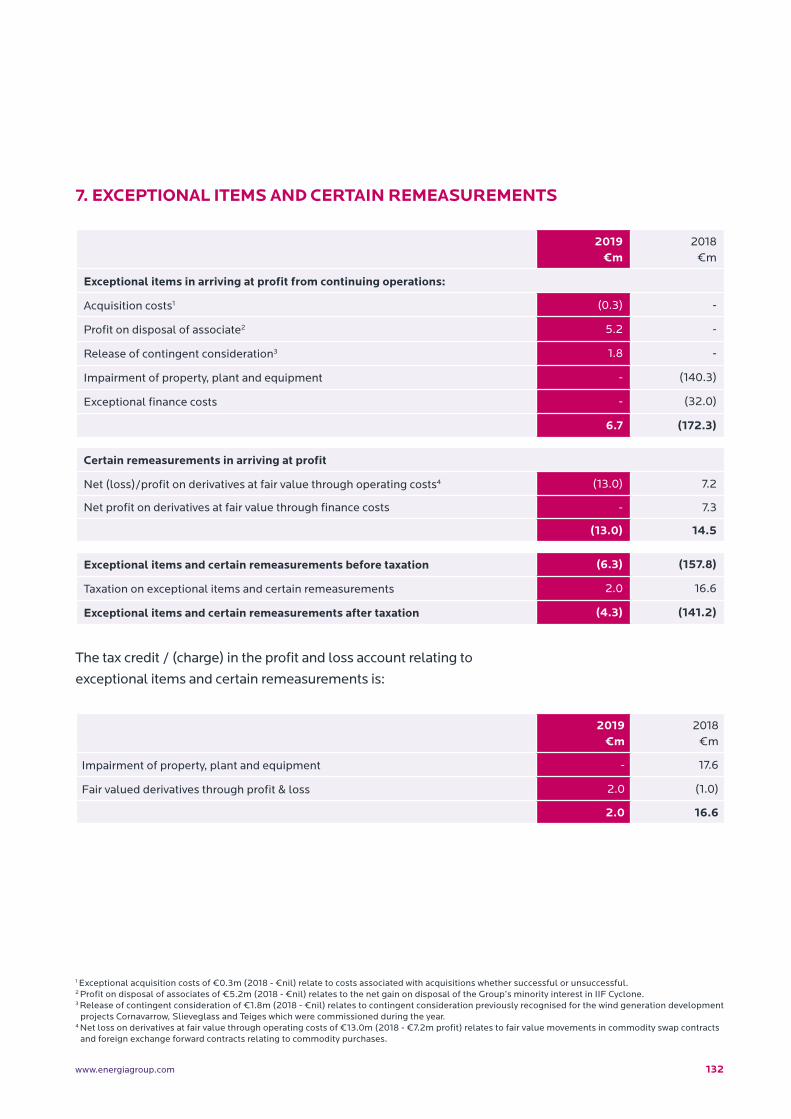
132www.energiagroup.com
7. EXCEPTIONAL ITEMS AND CERTAIN REMEASUREMENTS
2019 €m
2018 €m
Exceptional items in arriving at profit from continuing operations:
Acquisition costs1 (0.3) -
Profit on disposal of associate2 5.2 -
Release of contingent consideration3 1.8 -
Impairment of property, plant and equipment - (140.3)
Exceptional finance costs - (32.0)
6.7 (172.3)
Certain remeasurements in arriving at profit
Net (loss)/profit on derivatives at fair value through operating costs4 (13.0) 7.2
Net profit on derivatives at fair value through finance costs - 7.3
(13.0) 14.5
Exceptional items and certain remeasurements before taxation (6.3) (157.8)
Taxation on exceptional items and certain remeasurements 2.0 16.6
Exceptional items and certain remeasurements after taxation (4.3) (141.2)
2019 €m
2018 €m
Impairment of property, plant and equipment - 17.6
Fair valued derivatives through profit & loss 2.0 (1.0)
2.0 16.6
1 Exceptional acquisition costs of €0.3m (2018 - €nil) relate to costs associated with acquisitions whether successful or unsuccessful.2 Profit on disposal of associates of €5.2m (2018 - €nil) relates to the net gain on disposal of the Group’s minority interest in IIF Cyclone.3 Release of contingent consideration of €1.8m (2018 - €nil) relates to contingent consideration previously recognised for the wind generation development
projects Cornavarrow, Slieveglass and Teiges which were commissioned during the year.4 Net loss on derivatives at fair value through operating costs of €13.0m (2018 - €7.2m profit) relates to fair value movements in commodity swap contracts
and foreign exchange forward contracts relating to commodity purchases.
The tax credit / (charge) in the profit and loss account relating to
exceptional items and certain remeasurements is:
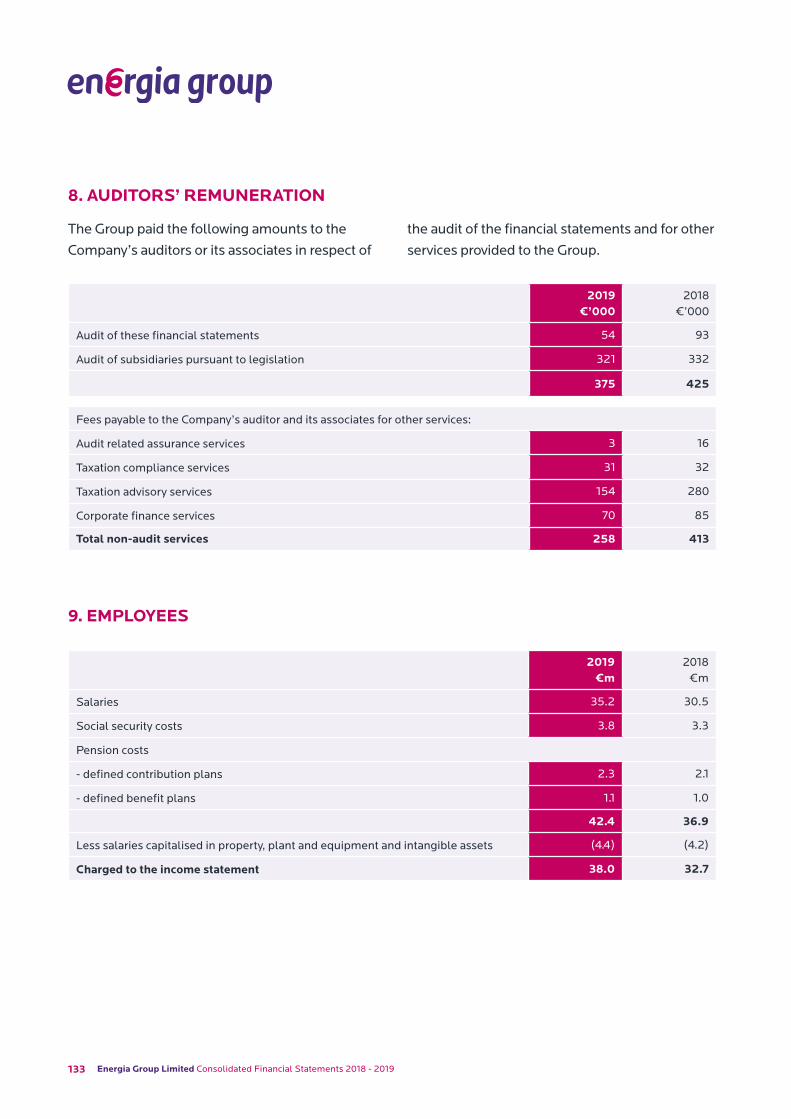
133 Energia Group Limited Consolidated Financial Statements 2018 - 2019
2019 €’000
2018 €’000
Audit of these financial statements 54 93
Audit of subsidiaries pursuant to legislation 321 332
375 425
Fees payable to the Company’s auditor and its associates for other services:
Audit related assurance services 3 16
Taxation compliance services 31 32
Taxation advisory services 154 280
Corporate finance services 70 85
Total non-audit services 258 413
2019 €m
2018 €m
Salaries 35.2 30.5
Social security costs 3.8 3.3
Pension costs
- defined contribution plans 2.3 2.1
- defined benefit plans 1.1 1.0
42.4 36.9
Less salaries capitalised in property, plant and equipment and intangible assets (4.4) (4.2)
Charged to the income statement 38.0 32.7
8. AUDITORS’ REMUNERATION
The Group paid the following amounts to the
Company’s auditors or its associates in respect of
the audit of the financial statements and for other
services provided to the Group.
9. EMPLOYEES
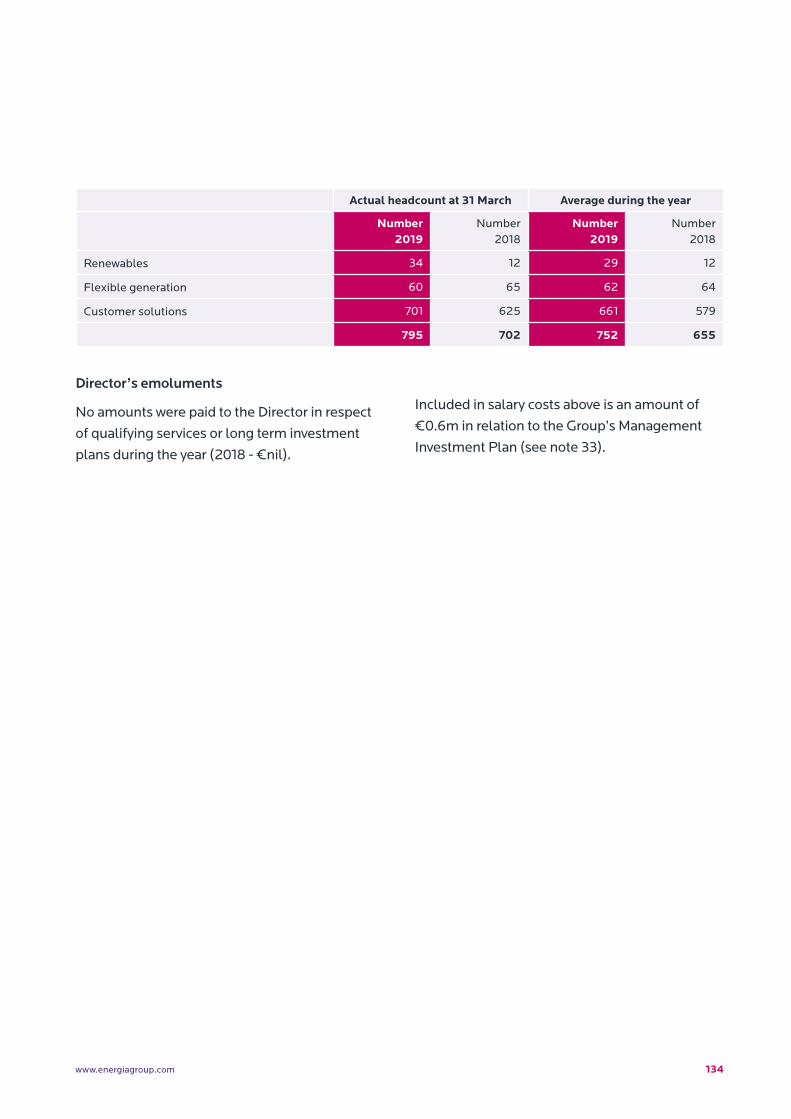
134www.energiagroup.com
Actual headcount at 31 March Average during the year
Number 2019
Number 2018
Number 2019
Number 2018
Renewables 34 12 29 12
Flexible generation 60 65 62 64
Customer solutions 701 625 661 579
795 702 752 655
Director’s emoluments
No amounts were paid to the Director in respect
of qualifying services or long term investment
plans during the year (2018 - €nil).
Included in salary costs above is an amount of
€0.6m in relation to the Group’s Management
Investment Plan (see note 33).
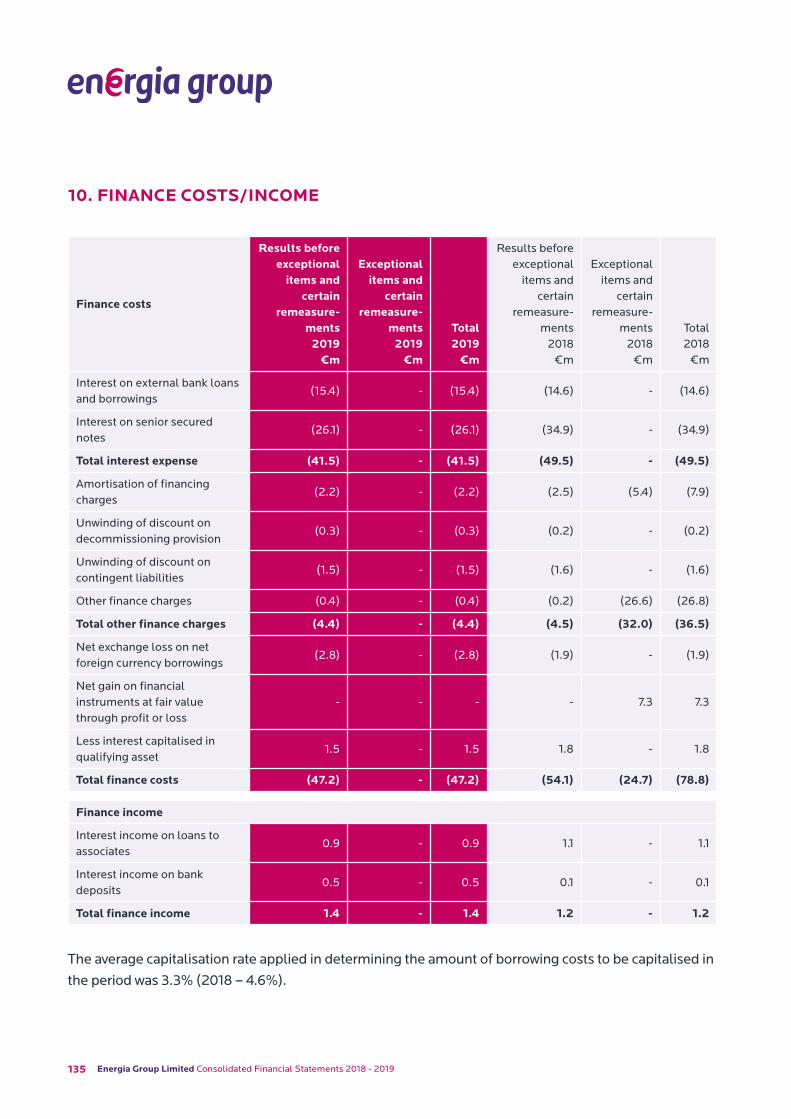
135 Energia Group Limited Consolidated Financial Statements 2018 - 2019
10. FINANCE COSTS/INCOME
Finance costs
Results before exceptional
items and certain
remeasure-ments
2019 €m
Exceptional items and
certain remeasure-
ments 2019
€m
Total 2019
€m
Results before exceptional
items and certain
remeasure-ments
2018 €m
Exceptional items and
certain remeasure-
ments 2018
€m
Total 2018
€m
Interest on external bank loans and borrowings
(15.4) - (15.4) (14.6) - (14.6)
Interest on senior secured notes
(26.1) - (26.1) (34.9) - (34.9)
Total interest expense (41.5) - (41.5) (49.5) - (49.5)
Amortisation of financing charges
(2.2) - (2.2) (2.5) (5.4) (7.9)
Unwinding of discount on decommissioning provision
(0.3) - (0.3) (0.2) - (0.2)
Unwinding of discount on contingent liabilities
(1.5) - (1.5) (1.6) - (1.6)
Other finance charges (0.4) - (0.4) (0.2) (26.6) (26.8)
Total other finance charges (4.4) - (4.4) (4.5) (32.0) (36.5)
Net exchange loss on net foreign currency borrowings
(2.8) - (2.8) (1.9) - (1.9)
Net gain on financial instruments at fair value through profit or loss
- - - - 7.3 7.3
Less interest capitalised in qualifying asset
1.5 - 1.5 1.8 - 1.8
Total finance costs (47.2) - (47.2) (54.1) (24.7) (78.8)
Finance income
Interest income on loans to associates
0.9 - 0.9 1.1 - 1.1
Interest income on bank deposits
0.5 - 0.5 0.1 - 0.1
Total finance income 1.4 - 1.4 1.2 - 1.2
The average capitalisation rate applied in determining the amount of borrowing costs to be capitalised in
the period was 3.3% (2018 – 4.6%).

136www.energiagroup.com
11. INCOME TAXThe major components of the tax (charge)/credit for the years ended 31 March 2019 and 2018 are as
follows:
Current tax:
Results before exceptional
items and certain
remeasure-ments
2019 €m
Exceptional items and
certain remeasure-
ments 2019
€m
Total 2019
€m
Results before exceptional
items and certain
remeasure-ments
2018 €m
Exceptional items and
certain remeasure-
ments 2018
€m
Total 2018
€m
Current tax (charge)/credit (2.7) 2.0 (0.7) 0.1 (1.0) (0.9)
Adjustments in respect of prior years
0.1 - 0.1 - - -
Total current tax (charge)/credit
(2.6) 2.0 (0.6) 0.1 (1.0) (0.9)
Deferred tax:
Adjustments in respect of current year
(7.6) - (7.6) (4.3) 17.6 13.3
Adjustments in respect of prior years
(0.2) - (0.2) (0.5) - (0.5)
Total deferred tax: (7.8) - (7.8) (4.8) 17.6 12.8
Total taxation (charge)/credit (10.4) 2.0 (8.4) (4.7) 16.6 11.9
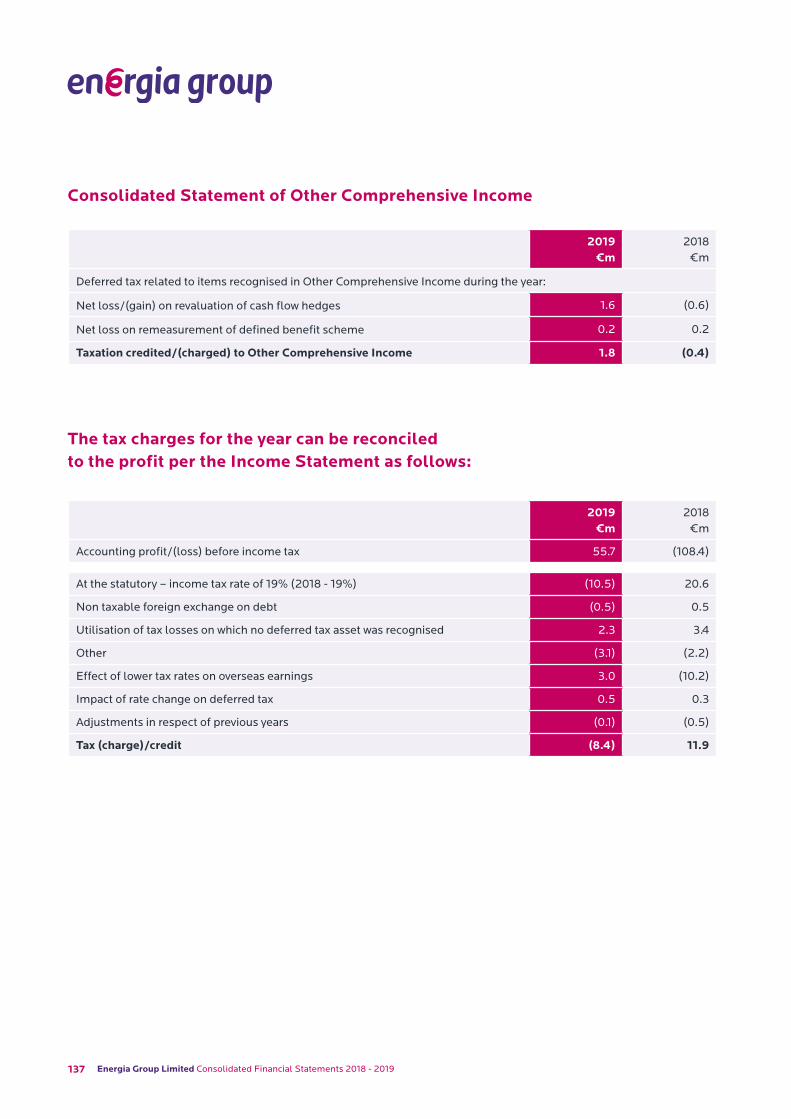
137 Energia Group Limited Consolidated Financial Statements 2018 - 2019
2019 €m
2018 €m
Deferred tax related to items recognised in Other Comprehensive Income during the year:
Net loss/(gain) on revaluation of cash flow hedges 1.6 (0.6)
Net loss on remeasurement of defined benefit scheme 0.2 0.2
Taxation credited/(charged) to Other Comprehensive Income 1.8 (0.4)
2019 €m
2018 €m
Accounting profit/(loss) before income tax 55.7 (108.4)
At the statutory – income tax rate of 19% (2018 - 19%) (10.5) 20.6
Non taxable foreign exchange on debt (0.5) 0.5
Utilisation of tax losses on which no deferred tax asset was recognised 2.3 3.4
Other (3.1) (2.2)
Effect of lower tax rates on overseas earnings 3.0 (10.2)
Impact of rate change on deferred tax 0.5 0.3
Adjustments in respect of previous years (0.1) (0.5)
Tax (charge)/credit (8.4) 11.9
Consolidated Statement of Other Comprehensive Income
The tax charges for the year can be reconciled to the profit per the Income Statement as follows:
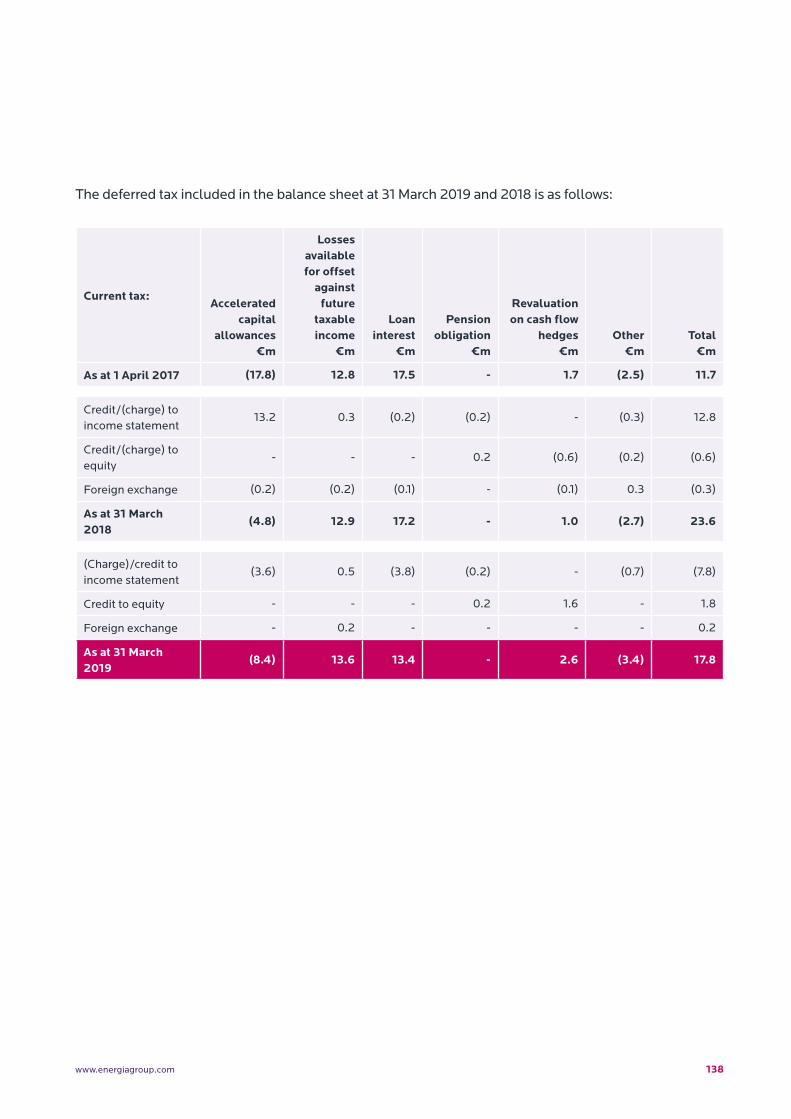
138www.energiagroup.com
The deferred tax included in the balance sheet at 31 March 2019 and 2018 is as follows:
Current tax:Accelerated
capital allowances
€m
Losses available for offset
against future
taxable income
€m
Loan interest
€m
Pension obligation
€m
Revaluation on cash flow
hedges €m
Other €m
Total €m
As at 1 April 2017 (17.8) 12.8 17.5 - 1.7 (2.5) 11.7
Credit/(charge) to income statement
13.2 0.3 (0.2) (0.2) - (0.3) 12.8
Credit/(charge) to equity
- - - 0.2 (0.6) (0.2) (0.6)
Foreign exchange (0.2) (0.2) (0.1) - (0.1) 0.3 (0.3)
As at 31 March 2018
(4.8) 12.9 17.2 - 1.0 (2.7) 23.6
(Charge)/credit to income statement
(3.6) 0.5 (3.8) (0.2) - (0.7) (7.8)
Credit to equity - - - 0.2 1.6 - 1.8
Foreign exchange - 0.2 - - - - 0.2
As at 31 March 2019
(8.4) 13.6 13.4 - 2.6 (3.4) 17.8
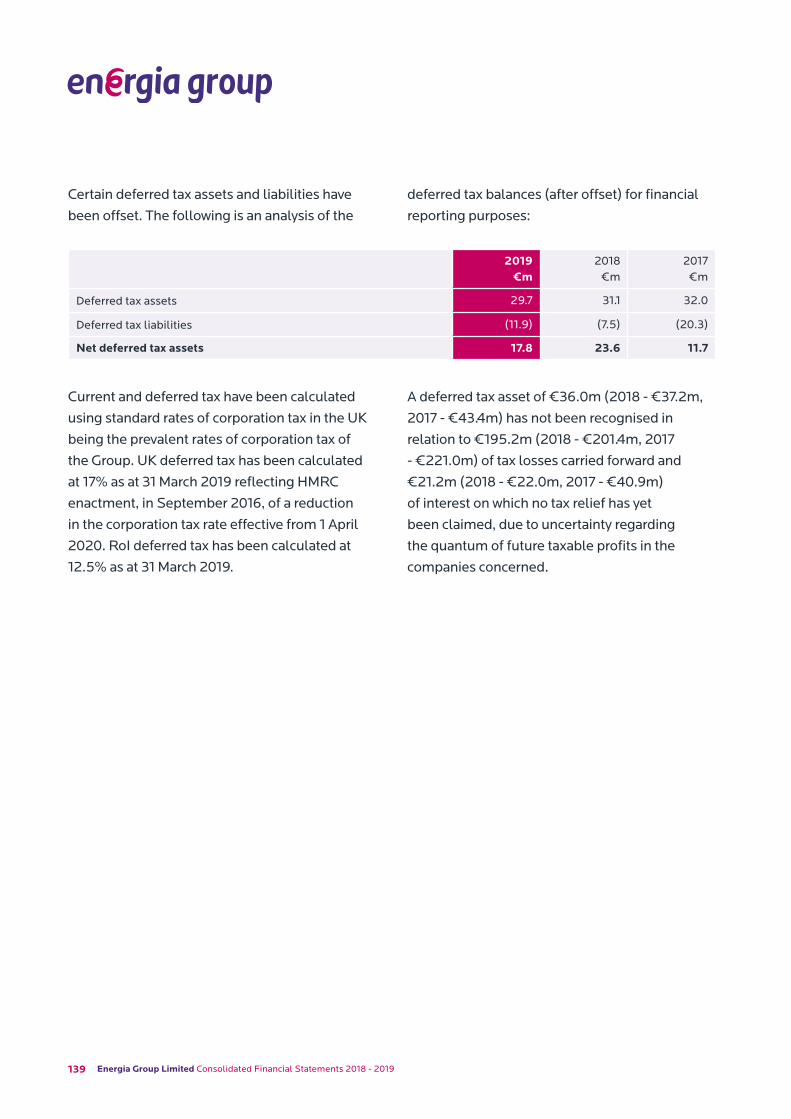
139 Energia Group Limited Consolidated Financial Statements 2018 - 2019
2019 €m
2018 €m
2017 €m
Deferred tax assets 29.7 31.1 32.0
Deferred tax liabilities (11.9) (7.5) (20.3)
Net deferred tax assets 17.8 23.6 11.7
Certain deferred tax assets and liabilities have
been offset. The following is an analysis of the
deferred tax balances (after offset) for financial
reporting purposes:
Current and deferred tax have been calculated
using standard rates of corporation tax in the UK
being the prevalent rates of corporation tax of
the Group. UK deferred tax has been calculated
at 17% as at 31 March 2019 reflecting HMRC
enactment, in September 2016, of a reduction
in the corporation tax rate effective from 1 April
2020. RoI deferred tax has been calculated at
12.5% as at 31 March 2019.
A deferred tax asset of €36.0m (2018 - €37.2m,
2017 - €43.4m) has not been recognised in
relation to €195.2m (2018 - €201.4m, 2017
- €221.0m) of tax losses carried forward and
€21.2m (2018 - €22.0m, 2017 - €40.9m)
of interest on which no tax relief has yet
been claimed, due to uncertainty regarding
the quantum of future taxable profits in the
companies concerned.
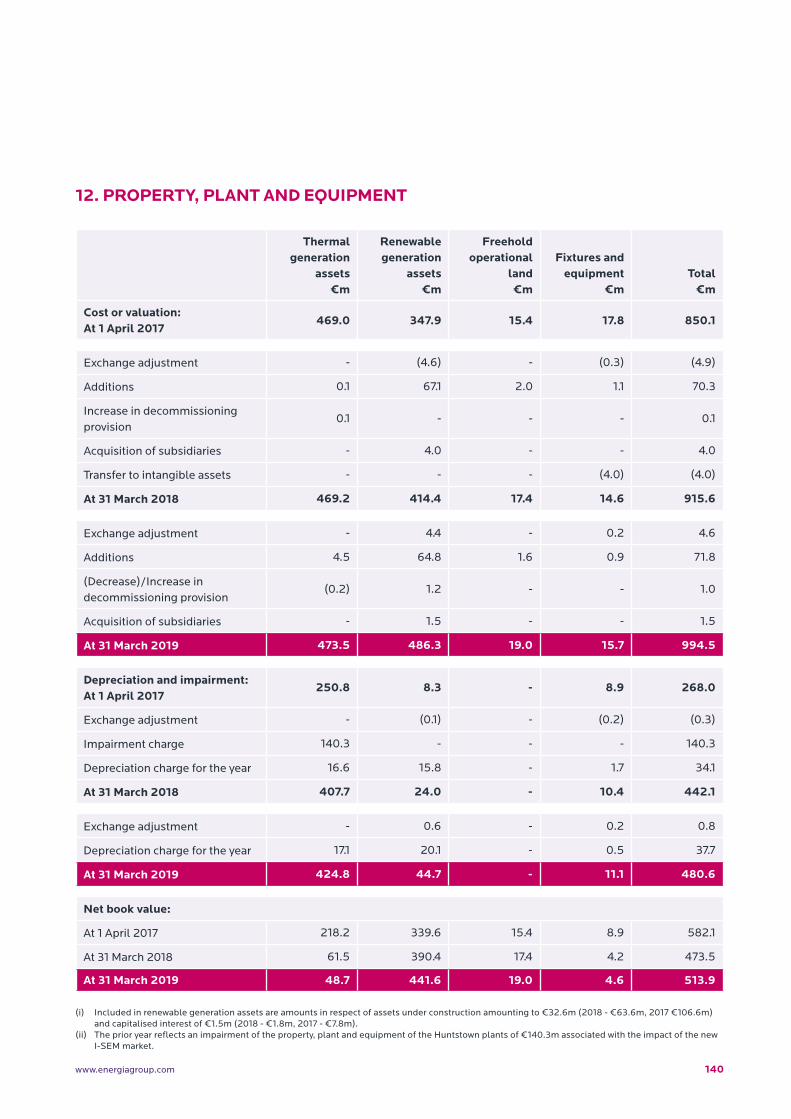
140www.energiagroup.com
12. PROPERTY, PLANT AND EQUIPMENT
Thermal generation
assets €m
Renewable generation
assets €m
Freeholdoperational
land€m
Fixtures andequipment
€mTotal
€m
Cost or valuation:At 1 April 2017
469.0 347.9 15.4 17.8 850.1
Exchange adjustment - (4.6) - (0.3) (4.9)
Additions 0.1 67.1 2.0 1.1 70.3
Increase in decommissioning provision
0.1 - - - 0.1
Acquisition of subsidiaries - 4.0 - - 4.0
Transfer to intangible assets - - - (4.0) (4.0)
At 31 March 2018 469.2 414.4 17.4 14.6 915.6
Exchange adjustment - 4.4 - 0.2 4.6
Additions 4.5 64.8 1.6 0.9 71.8
(Decrease)/Increase in decommissioning provision
(0.2) 1.2 - - 1.0
Acquisition of subsidiaries - 1.5 - - 1.5
At 31 March 2019 473.5 486.3 19.0 15.7 994.5
Depreciation and impairment:At 1 April 2017
250.8 8.3 - 8.9 268.0
Exchange adjustment - (0.1) - (0.2) (0.3)
Impairment charge 140.3 - - - 140.3
Depreciation charge for the year 16.6 15.8 - 1.7 34.1
At 31 March 2018 407.7 24.0 - 10.4 442.1
Exchange adjustment - 0.6 - 0.2 0.8
Depreciation charge for the year 17.1 20.1 - 0.5 37.7
At 31 March 2019 424.8 44.7 - 11.1 480.6
Net book value:
At 1 April 2017 218.2 339.6 15.4 8.9 582.1
At 31 March 2018 61.5 390.4 17.4 4.2 473.5
At 31 March 2019 48.7 441.6 19.0 4.6 513.9
(i) Included in renewable generation assets are amounts in respect of assets under construction amounting to €32.6m (2018 - €63.6m, 2017 €106.6m) and capitalised interest of €1.5m (2018 - €1.8m, 2017 - €7.8m).
(ii) The prior year reflects an impairment of the property, plant and equipment of the Huntstown plants of €140.3m associated with the impact of the new I-SEM market.
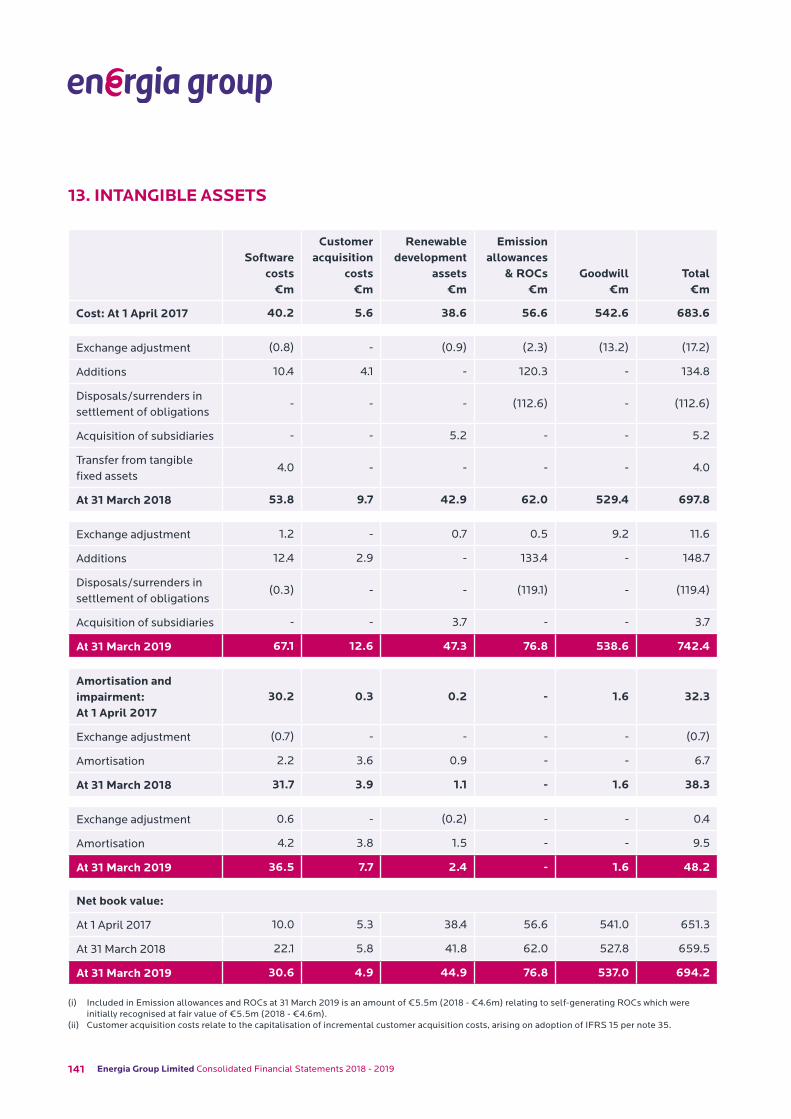
141 Energia Group Limited Consolidated Financial Statements 2018 - 2019
13. INTANGIBLE ASSETS
Software costs
€m
Customer acquisition
costs€m
Renewable development
assets €m
Emissionallowances
& ROCs €m
Goodwill€m
Total€m
Cost: At 1 April 2017 40.2 5.6 38.6 56.6 542.6 683.6
Exchange adjustment (0.8) - (0.9) (2.3) (13.2) (17.2)
Additions 10.4 4.1 - 120.3 - 134.8
Disposals/surrenders in settlement of obligations
- - - (112.6) - (112.6)
Acquisition of subsidiaries - - 5.2 - - 5.2
Transfer from tangible fixed assets
4.0 - - - - 4.0
At 31 March 2018 53.8 9.7 42.9 62.0 529.4 697.8
Exchange adjustment 1.2 - 0.7 0.5 9.2 11.6
Additions 12.4 2.9 - 133.4 - 148.7
Disposals/surrenders in settlement of obligations
(0.3) - - (119.1) - (119.4)
Acquisition of subsidiaries - - 3.7 - - 3.7
At 31 March 2019 67.1 12.6 47.3 76.8 538.6 742.4
Amortisation and impairment: At 1 April 2017
30.2 0.3 0.2 - 1.6 32.3
Exchange adjustment (0.7) - - - - (0.7)
Amortisation 2.2 3.6 0.9 - - 6.7
At 31 March 2018 31.7 3.9 1.1 - 1.6 38.3
Exchange adjustment 0.6 - (0.2) - - 0.4
Amortisation 4.2 3.8 1.5 - - 9.5
At 31 March 2019 36.5 7.7 2.4 - 1.6 48.2
Net book value:
At 1 April 2017 10.0 5.3 38.4 56.6 541.0 651.3
At 31 March 2018 22.1 5.8 41.8 62.0 527.8 659.5
At 31 March 2019 30.6 4.9 44.9 76.8 537.0 694.2
(i) Included in Emission allowances and ROCs at 31 March 2019 is an amount of €5.5m (2018 - €4.6m) relating to self-generating ROCs which were initially recognised at fair value of €5.5m (2018 - €4.6m).
(ii) Customer acquisition costs relate to the capitalisation of incremental customer acquisition costs, arising on adoption of IFRS 15 per note 35.
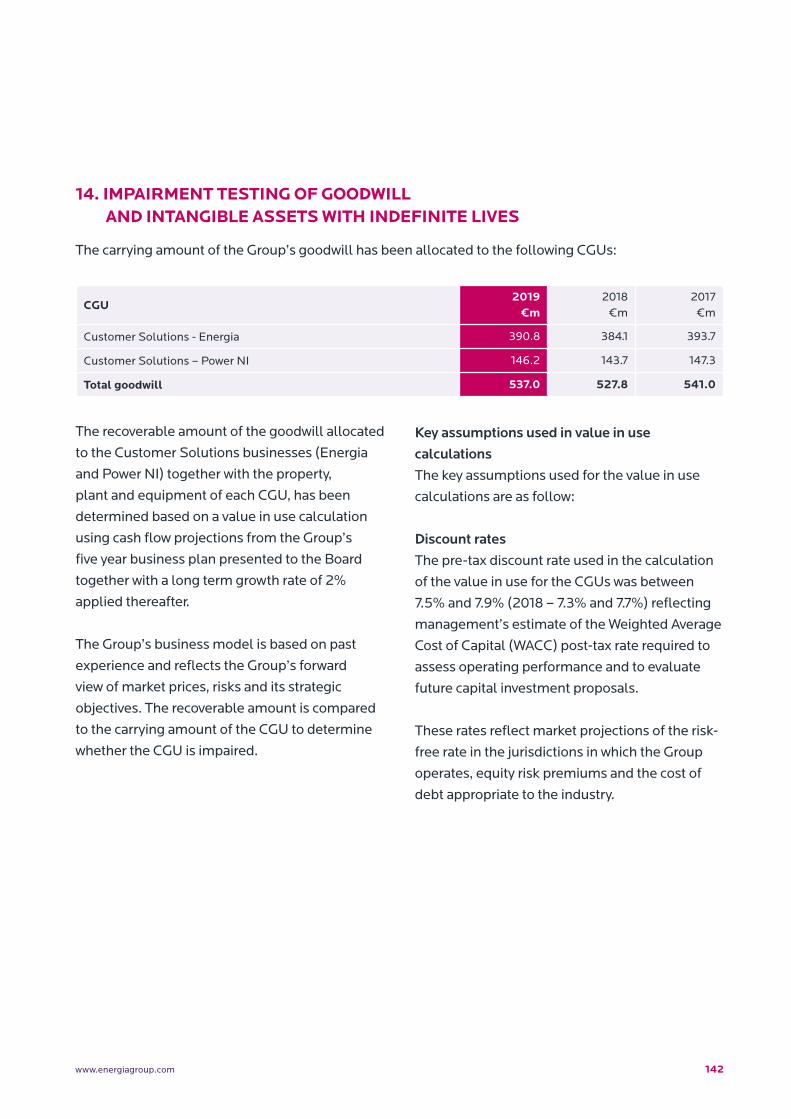
142www.energiagroup.com
CGU2019
€m2018
€m2017
€m
Customer Solutions - Energia 390.8 384.1 393.7
Customer Solutions – Power NI 146.2 143.7 147.3
Total goodwill 537.0 527.8 541.0
The recoverable amount of the goodwill allocated
to the Customer Solutions businesses (Energia
and Power NI) together with the property,
plant and equipment of each CGU, has been
determined based on a value in use calculation
using cash flow projections from the Group’s
five year business plan presented to the Board
together with a long term growth rate of 2%
applied thereafter.
The Group’s business model is based on past
experience and reflects the Group’s forward
view of market prices, risks and its strategic
objectives. The recoverable amount is compared
to the carrying amount of the CGU to determine
whether the CGU is impaired.
Key assumptions used in value in use calculationsThe key assumptions used for the value in use
calculations are as follow:
Discount ratesThe pre-tax discount rate used in the calculation
of the value in use for the CGUs was between
7.5% and 7.9% (2018 – 7.3% and 7.7%) reflecting
management’s estimate of the Weighted Average
Cost of Capital (WACC) post-tax rate required to
assess operating performance and to evaluate
future capital investment proposals.
These rates reflect market projections of the risk-
free rate in the jurisdictions in which the Group
operates, equity risk premiums and the cost of
debt appropriate to the industry.
14. IMPAIRMENT TESTING OF GOODWILL AND INTANGIBLE ASSETS WITH INDEFINITE LIVES
The carrying amount of the Group’s goodwill has been allocated to the following CGUs:
143 Energia Group Limited Consolidated Financial Statements 2018 - 2019
Energia Customer Solutions CGUThe key assumptions on which the cash flow
projections of this CGU are based are as follows:
(i) Retail supply revenues for electricity and gas
are based on the expected market share
derived from the market share at the time of
the approval of the business model adjusted
for forecasted growth. Growth in business
customer numbers is modest and growth
in respect of residential supply is moderate
with cash flows associated with increased
customer service and customer acquisition
incorporated accordingly;
(ii) Retail supply margins are based on historic
and projected gross margin percentages.
Outcome of Tests:
The recoverable amount of the Energia Customer
Solutions CGU exceeded the respective carrying
value at the time of the impairment test. While
cash flows are subject to inherent uncertainty,
reasonable possible changes in the key
assumptions applied in assessing the value in
use would not cause a change to the conclusion
reached.
Power NI Customer Solutions CGUThe key assumptions on which the cash flow
projections of this CGU are based are as follows:
(i) Regulated revenues and margins are
underpinned by the regulatory price control in
place to 31 March 2021;
(ii) Customer attrition is assumed, however the
nature of the price control with regulated
entitlement 70% fixed and 30% variable
reduces the impact of customer losses; and
(iii) Unregulated retail supply margins for
business customers are based on historic and
projected gross margin percentages.
Outcome of Tests:
The recoverable amount of the Power NI
Customer Solutions CGU exceeded the
respective carrying value at the time of the
impairment test. While cash flows are subject
to inherent uncertainty, reasonable possible
changes in the key assumptions applied in
assessing the value in use would not cause a
change to the conclusion reached.
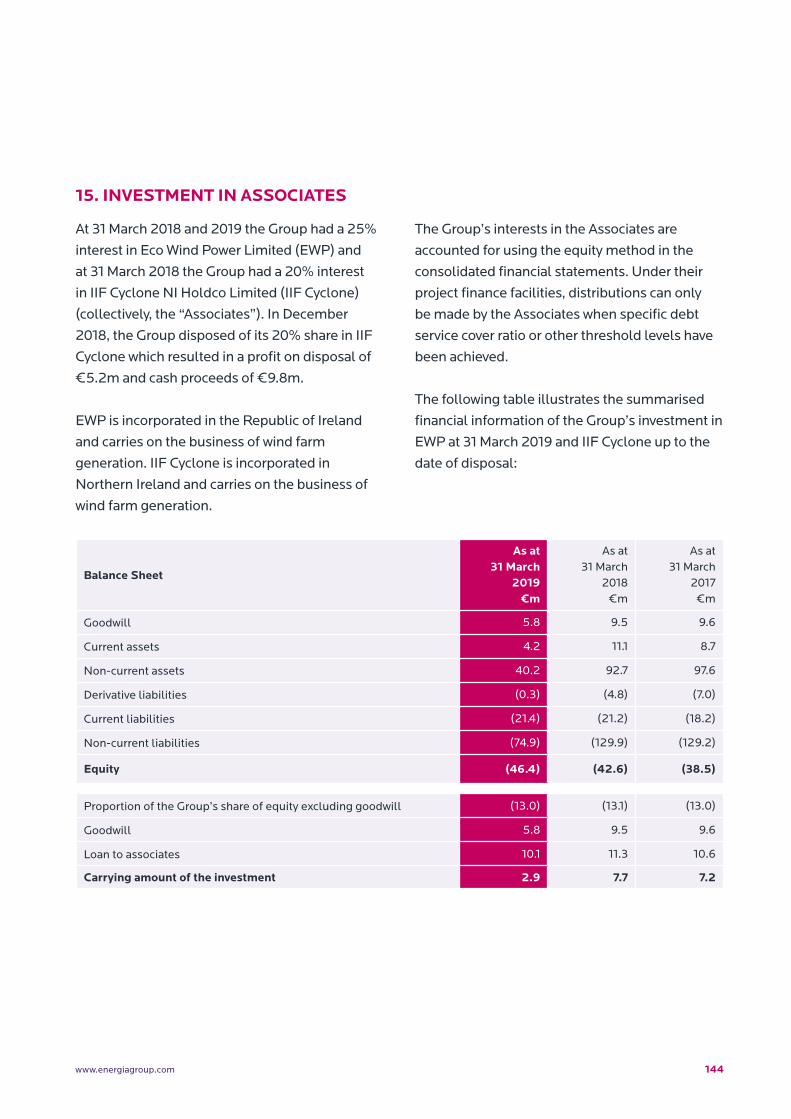
144www.energiagroup.com
Balance Sheet
As at 31 March
2019 €m
As at 31 March
2018 €m
As at 31 March
2017 €m
Goodwill 5.8 9.5 9.6
Current assets 4.2 11.1 8.7
Non-current assets 40.2 92.7 97.6
Derivative liabilities (0.3) (4.8) (7.0)
Current liabilities (21.4) (21.2) (18.2)
Non-current liabilities (74.9) (129.9) (129.2)
Equity (46.4) (42.6) (38.5)
Proportion of the Group’s share of equity excluding goodwill (13.0) (13.1) (13.0)
Goodwill 5.8 9.5 9.6
Loan to associates 10.1 11.3 10.6
Carrying amount of the investment 2.9 7.7 7.2
15. INVESTMENT IN ASSOCIATES
At 31 March 2018 and 2019 the Group had a 25%
interest in Eco Wind Power Limited (EWP) and
at 31 March 2018 the Group had a 20% interest
in IIF Cyclone NI Holdco Limited (IIF Cyclone)
(collectively, the “Associates”). In December
2018, the Group disposed of its 20% share in IIF
Cyclone which resulted in a profit on disposal of
€5.2m and cash proceeds of €9.8m.
EWP is incorporated in the Republic of Ireland
and carries on the business of wind farm
generation. IIF Cyclone is incorporated in
Northern Ireland and carries on the business of
wind farm generation.
The Group’s interests in the Associates are
accounted for using the equity method in the
consolidated financial statements. Under their
project finance facilities, distributions can only
be made by the Associates when specific debt
service cover ratio or other threshold levels have
been achieved.
The following table illustrates the summarised
financial information of the Group’s investment in
EWP at 31 March 2019 and IIF Cyclone up to the
date of disposal:
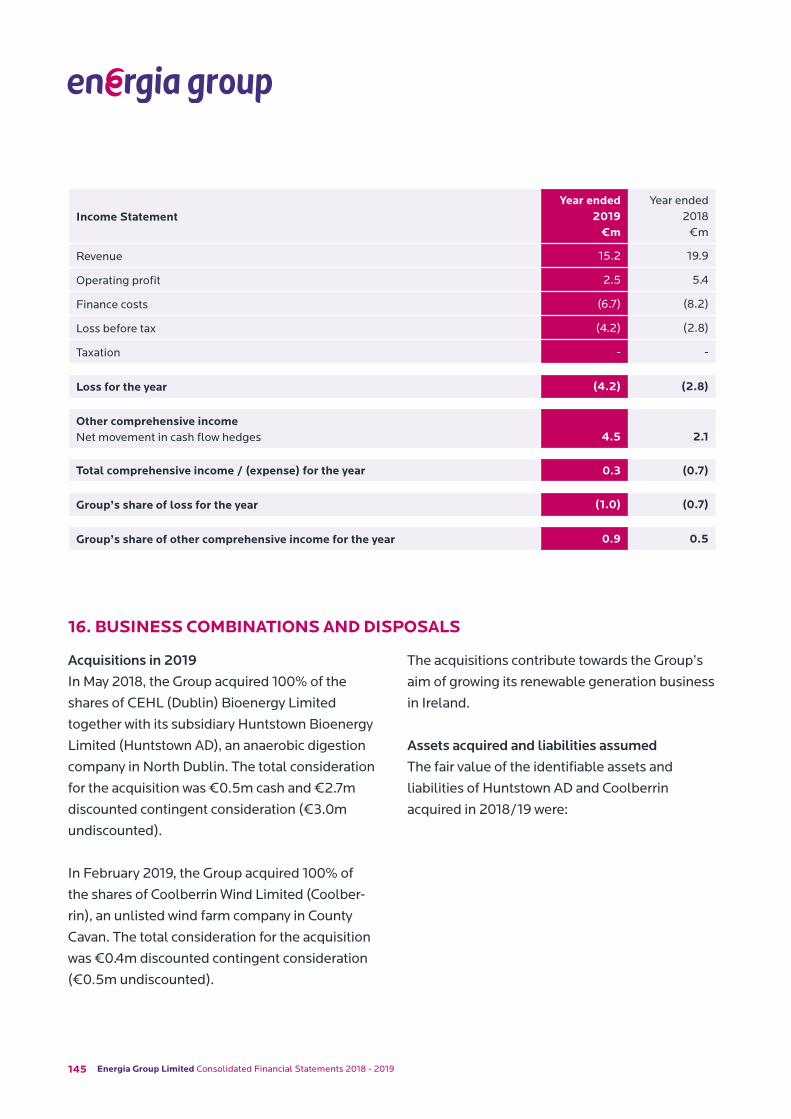
145 Energia Group Limited Consolidated Financial Statements 2018 - 2019
Income StatementYear ended
2019 €m
Year ended 2018
€m
Revenue 15.2 19.9
Operating profit 2.5 5.4
Finance costs (6.7) (8.2)
Loss before tax (4.2) (2.8)
Taxation - -
Loss for the year (4.2) (2.8)
Other comprehensive income Net movement in cash flow hedges
4.5
2.1
Total comprehensive income / (expense) for the year 0.3 (0.7)
Group’s share of loss for the year (1.0) (0.7)
Group’s share of other comprehensive income for the year 0.9 0.5
16. BUSINESS COMBINATIONS AND DISPOSALS
Acquisitions in 2019In May 2018, the Group acquired 100% of the
shares of CEHL (Dublin) Bioenergy Limited
together with its subsidiary Huntstown Bioenergy
Limited (Huntstown AD), an anaerobic digestion
company in North Dublin. The total consideration
for the acquisition was €0.5m cash and €2.7m
discounted contingent consideration (€3.0m
undiscounted).
In February 2019, the Group acquired 100% of
the shares of Coolberrin Wind Limited (Coolber-
rin), an unlisted wind farm company in County
Cavan. The total consideration for the acquisition
was €0.4m discounted contingent consideration
(€0.5m undiscounted).
The acquisitions contribute towards the Group’s
aim of growing its renewable generation business
in Ireland.
Assets acquired and liabilities assumedThe fair value of the identifiable assets and
liabilities of Huntstown AD and Coolberrin
acquired in 2018/19 were:
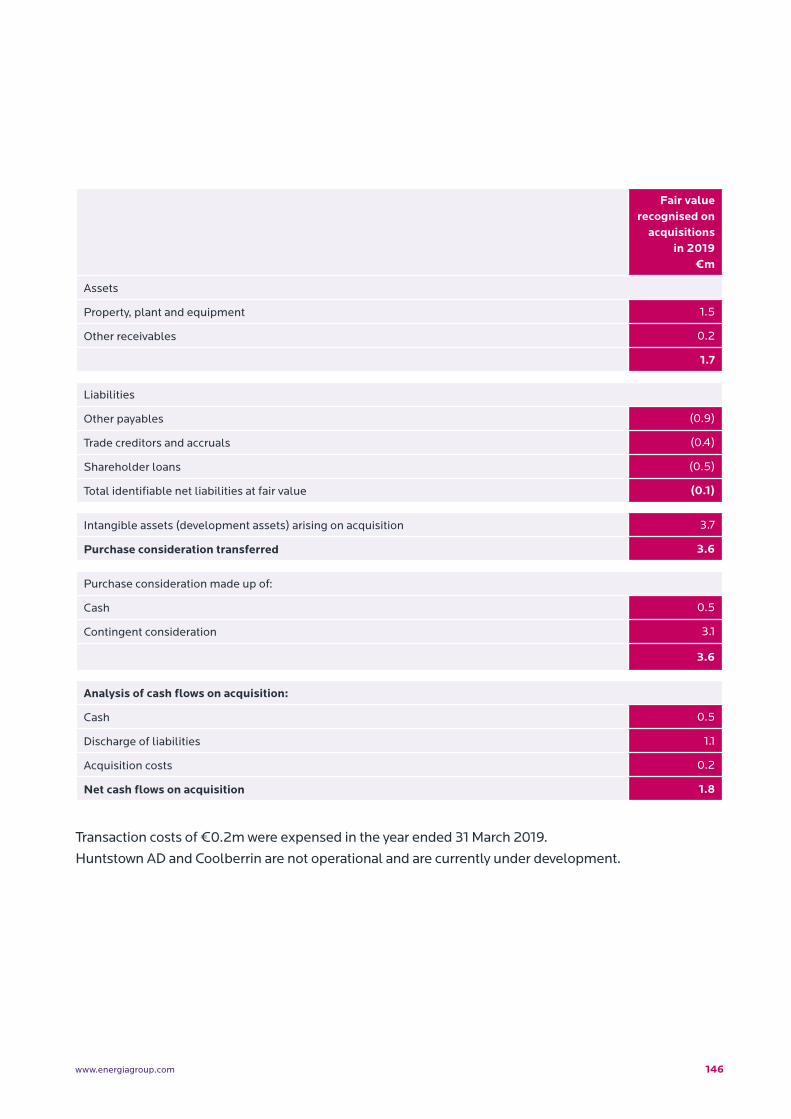
146www.energiagroup.com
Fair value recognised on
acquisitions in 2019
€m
Assets
Property, plant and equipment 1.5
Other receivables 0.2
1.7
Liabilities
Other payables (0.9)
Trade creditors and accruals (0.4)
Shareholder loans (0.5)
Total identifiable net liabilities at fair value (0.1)
Intangible assets (development assets) arising on acquisition 3.7
Purchase consideration transferred 3.6
Purchase consideration made up of:
Cash 0.5
Contingent consideration 3.1
3.6
Analysis of cash flows on acquisition:
Cash 0.5
Discharge of liabilities 1.1
Acquisition costs 0.2
Net cash flows on acquisition 1.8
Transaction costs of €0.2m were expensed in the year ended 31 March 2019.
Huntstown AD and Coolberrin are not operational and are currently under development.
147 Energia Group Limited Consolidated Financial Statements 2018 - 2019
Contingent considerationOn the acquisition of Huntstown AD, contingent
consideration of €2.7m was recognised and
reflects the present value of the maximum
amount payable, with the minimum amount
payable being €nil. Contingent consideration
is expected to be paid in 2019/20 when
construction and commissioning of the plant is
achieved.
On the acquisition of Coolberrin, contingent
consideration of €0.4m was recognised and
reflects the present value of the maximum
amount payable, with the minimum amount
payable being €nil. Contingent consideration
is expected to be paid in 2021/22 when
construction and commissioning of the plant is
achieved.
During the year, a payment of €21.4m (2018 -
€nil) was made reflecting payment of contingent
consideration of €17.2m for Cornavarrow,
Slieveglass and Teiges and payment of €4.2m
for pre-acquisition services of Cornavarrow and
Teiges following commissioning of the wind
farms.
Disposals in 2019During the year The Group disposed of its 20%
interest in IIF Cyclone Holdco Limited (IIF
Cyclone) and recognised a gain on disposal of
€5.2m.
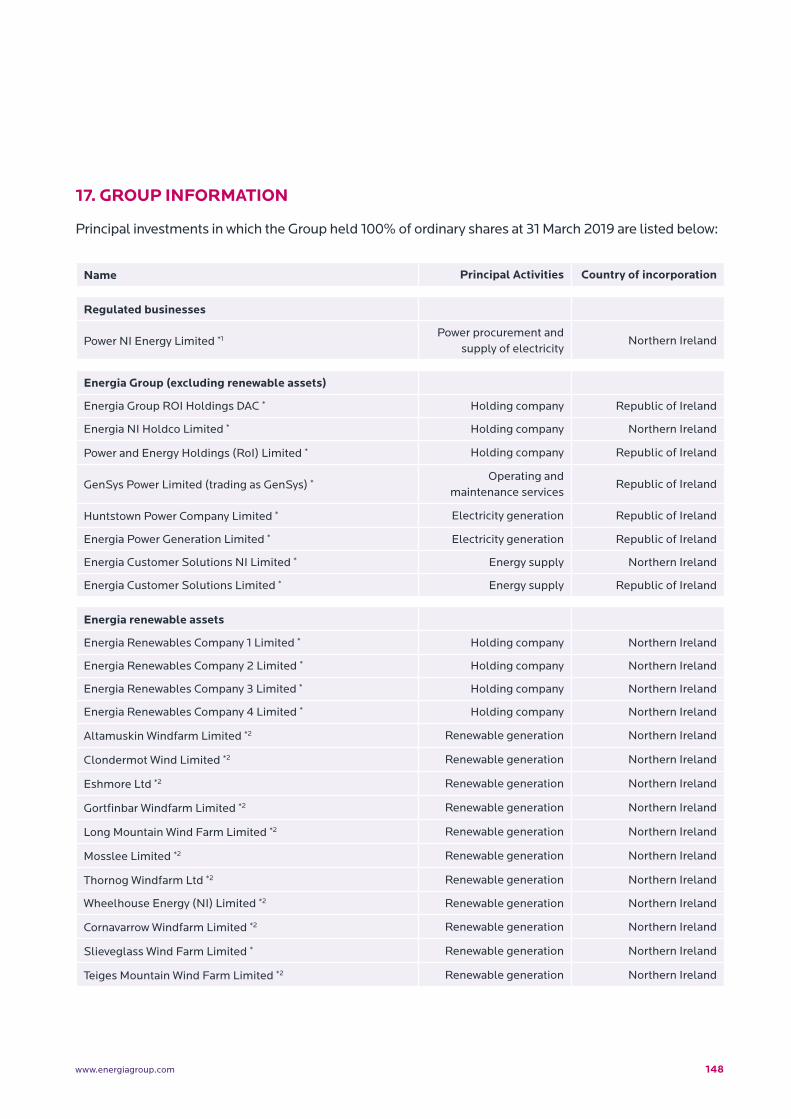
148www.energiagroup.com
17. GROUP INFORMATION
Principal investments in which the Group held 100% of ordinary shares at 31 March 2019 are listed below:
Name Principal Activities Country of incorporation
Regulated businesses
Power NI Energy Limited *1Power procurement and
supply of electricityNorthern Ireland
Energia Group (excluding renewable assets)
Energia Group ROI Holdings DAC * Holding company Republic of Ireland
Energia NI Holdco Limited * Holding company Northern Ireland
Power and Energy Holdings (RoI) Limited * Holding company Republic of Ireland
GenSys Power Limited (trading as GenSys) *Operating and
maintenance servicesRepublic of Ireland
Huntstown Power Company Limited * Electricity generation Republic of Ireland
Energia Power Generation Limited * Electricity generation Republic of Ireland
Energia Customer Solutions NI Limited * Energy supply Northern Ireland
Energia Customer Solutions Limited * Energy supply Republic of Ireland
Energia renewable assets
Energia Renewables Company 1 Limited * Holding company Northern Ireland
Energia Renewables Company 2 Limited * Holding company Northern Ireland
Energia Renewables Company 3 Limited * Holding company Northern Ireland
Energia Renewables Company 4 Limited * Holding company Northern Ireland
Altamuskin Windfarm Limited *2 Renewable generation Northern Ireland
Clondermot Wind Limited *2 Renewable generation Northern Ireland
Eshmore Ltd *2 Renewable generation Northern Ireland
Gortfinbar Windfarm Limited *2 Renewable generation Northern Ireland
Long Mountain Wind Farm Limited *2 Renewable generation Northern Ireland
Mosslee Limited *2 Renewable generation Northern Ireland
Thornog Windfarm Ltd *2 Renewable generation Northern Ireland
Wheelhouse Energy (NI) Limited *2 Renewable generation Northern Ireland
Cornavarrow Windfarm Limited *2 Renewable generation Northern Ireland
Slieveglass Wind Farm Limited * Renewable generation Northern Ireland
Teiges Mountain Wind Farm Limited *2 Renewable generation Northern Ireland
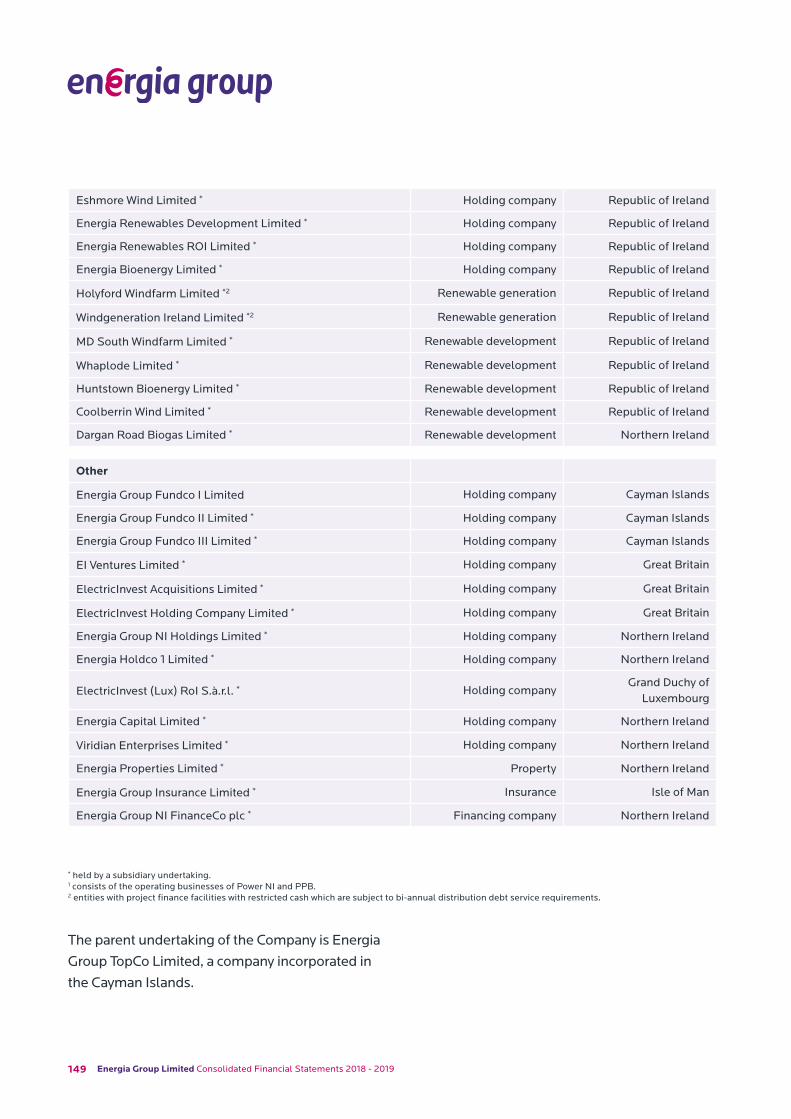
149 Energia Group Limited Consolidated Financial Statements 2018 - 2019
Eshmore Wind Limited * Holding company Republic of Ireland
Energia Renewables Development Limited * Holding company Republic of Ireland
Energia Renewables ROI Limited * Holding company Republic of Ireland
Energia Bioenergy Limited * Holding company Republic of Ireland
Holyford Windfarm Limited *2 Renewable generation Republic of Ireland
Windgeneration Ireland Limited *2 Renewable generation Republic of Ireland
MD South Windfarm Limited * Renewable development Republic of Ireland
Whaplode Limited * Renewable development Republic of Ireland
Huntstown Bioenergy Limited * Renewable development Republic of Ireland
Coolberrin Wind Limited * Renewable development Republic of Ireland
Dargan Road Biogas Limited * Renewable development Northern Ireland
Other
Energia Group Fundco I Limited Holding company Cayman Islands
Energia Group Fundco II Limited * Holding company Cayman Islands
Energia Group Fundco III Limited * Holding company Cayman Islands
EI Ventures Limited * Holding company Great Britain
ElectricInvest Acquisitions Limited * Holding company Great Britain
ElectricInvest Holding Company Limited * Holding company Great Britain
Energia Group NI Holdings Limited * Holding company Northern Ireland
Energia Holdco 1 Limited * Holding company Northern Ireland
ElectricInvest (Lux) RoI S.à.r.l. * Holding companyGrand Duchy of
Luxembourg
Energia Capital Limited * Holding company Northern Ireland
Viridian Enterprises Limited * Holding company Northern Ireland
Energia Properties Limited * Property Northern Ireland
Energia Group Insurance Limited * Insurance Isle of Man
Energia Group NI FinanceCo plc * Financing company Northern Ireland
* held by a subsidiary undertaking.1 consists of the operating businesses of Power NI and PPB.2 entities with project finance facilities with restricted cash which are subject to bi-annual distribution debt service requirements.
The parent undertaking of the Company is Energia
Group TopCo Limited, a company incorporated in
the Cayman Islands.
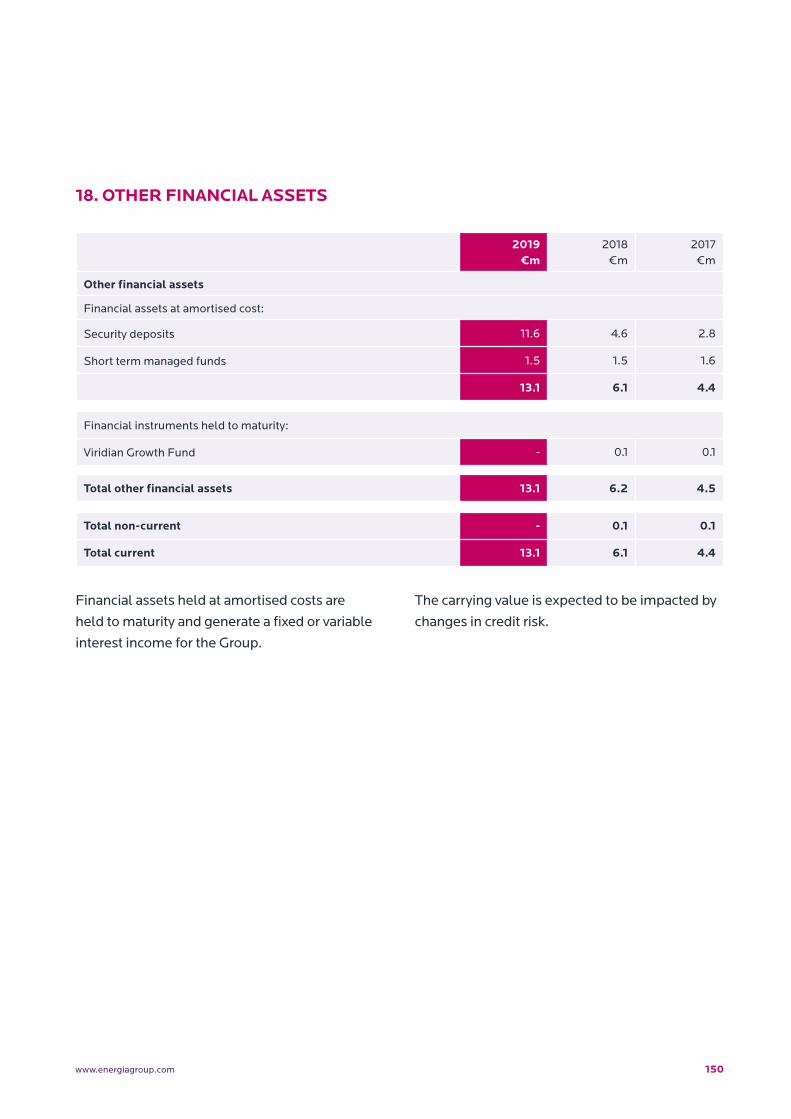
150www.energiagroup.com
2019 €m
2018 €m
2017 €m
Other financial assets
Financial assets at amortised cost:
Security deposits 11.6 4.6 2.8
Short term managed funds 1.5 1.5 1.6
13.1 6.1 4.4
Financial instruments held to maturity:
Viridian Growth Fund - 0.1 0.1
Total other financial assets 13.1 6.2 4.5
Total non-current - 0.1 0.1
Total current 13.1 6.1 4.4
Financial assets held at amortised costs are
held to maturity and generate a fixed or variable
interest income for the Group.
The carrying value is expected to be impacted by
changes in credit risk.
18. OTHER FINANCIAL ASSETS
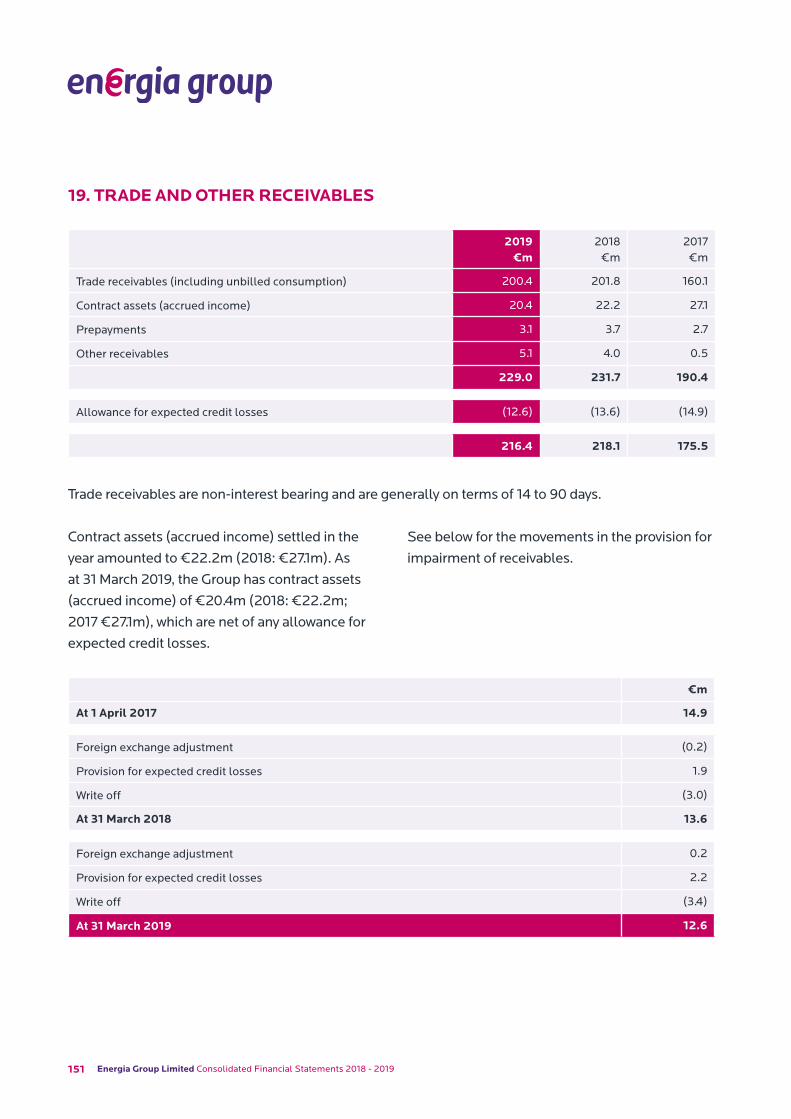
151 Energia Group Limited Consolidated Financial Statements 2018 - 2019
2019 €m
2018 €m
2017 €m
Trade receivables (including unbilled consumption) 200.4 201.8 160.1
Contract assets (accrued income) 20.4 22.2 27.1
Prepayments 3.1 3.7 2.7
Other receivables 5.1 4.0 0.5
229.0 231.7 190.4
Allowance for expected credit losses (12.6) (13.6) (14.9)
216.4 218.1 175.5
Trade receivables are non−interest bearing and are generally on terms of 14 to 90 days.
Contract assets (accrued income) settled in the
year amounted to €22.2m (2018: €27.1m). As
at 31 March 2019, the Group has contract assets
(accrued income) of €20.4m (2018: €22.2m;
2017 €27.1m), which are net of any allowance for
expected credit losses.
See below for the movements in the provision for
impairment of receivables.
19. TRADE AND OTHER RECEIVABLES
€m
At 1 April 2017 14.9
Foreign exchange adjustment (0.2)
Provision for expected credit losses 1.9
Write off (3.0)
At 31 March 2018 13.6
Foreign exchange adjustment 0.2
Provision for expected credit losses 2.2
Write off (3.4)
At 31 March 2019 12.6
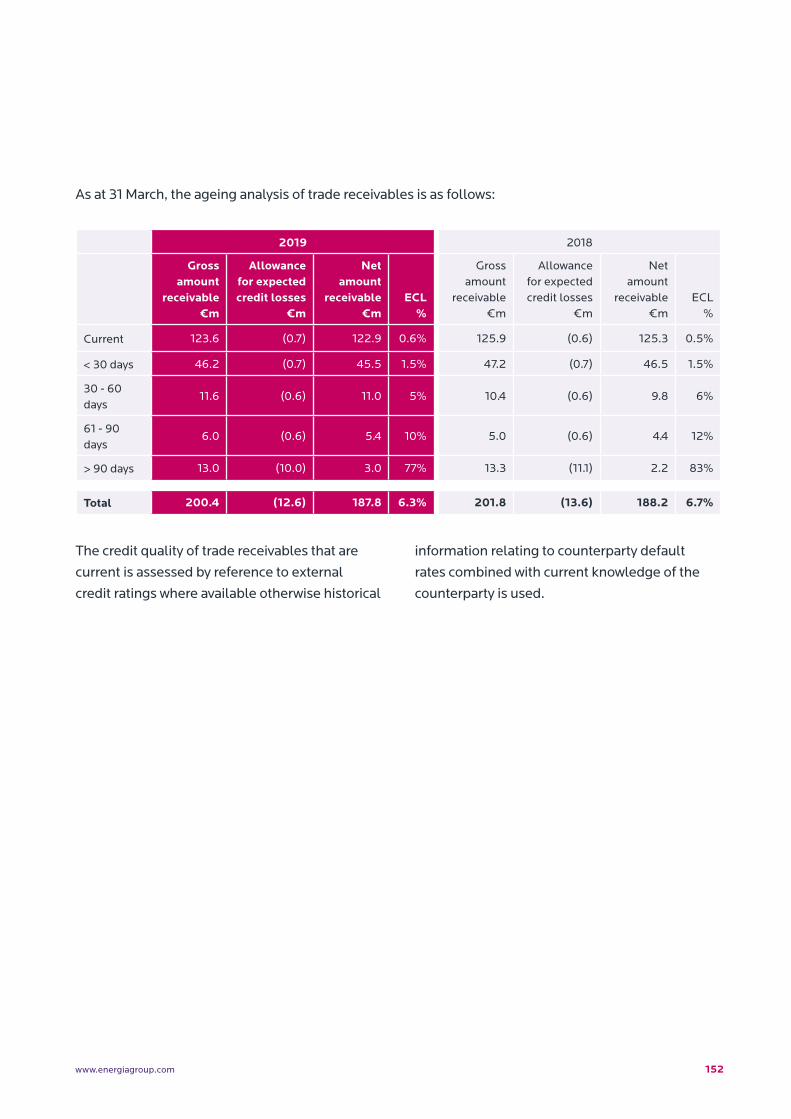
152www.energiagroup.com
As at 31 March, the ageing analysis of trade receivables is as follows:
2019 2018
Gross amount
receivable€m
Allowance for expected credit losses
€m
Net amount
receivable €m
ECL %
Gross amount
receivable€m
Allowance for expected credit losses
€m
Net amount
receivable €m
ECL %
Current 123.6 (0.7) 122.9 0.6% 125.9 (0.6) 125.3 0.5%
< 30 days 46.2 (0.7) 45.5 1.5% 47.2 (0.7) 46.5 1.5%
30 - 60 days
11.6 (0.6) 11.0 5% 10.4 (0.6) 9.8 6%
61 - 90 days
6.0 (0.6) 5.4 10% 5.0 (0.6) 4.4 12%
> 90 days 13.0 (10.0) 3.0 77% 13.3 (11.1) 2.2 83%
Total 200.4 (12.6) 187.8 6.3% 201.8 (13.6) 188.2 6.7%
The credit quality of trade receivables that are
current is assessed by reference to external
credit ratings where available otherwise historical
information relating to counterparty default
rates combined with current knowledge of the
counterparty is used.
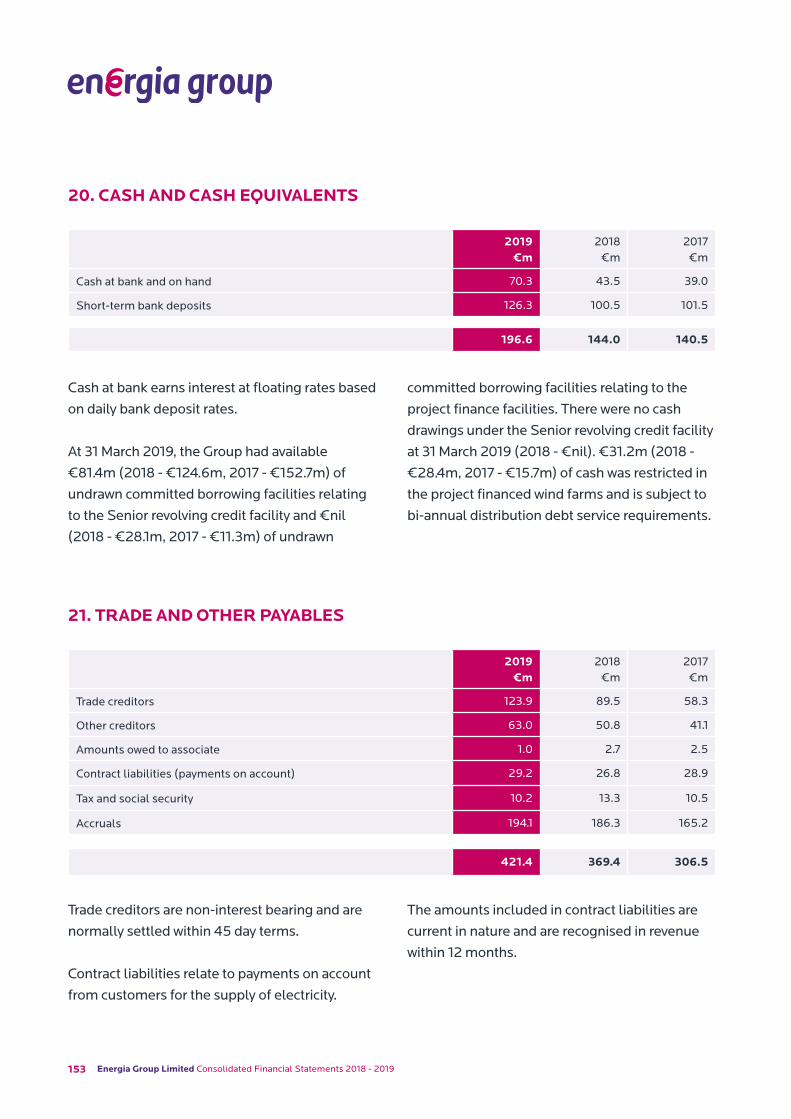
153 Energia Group Limited Consolidated Financial Statements 2018 - 2019
2019 €m
2018 €m
2017 €m
Cash at bank and on hand 70.3 43.5 39.0
Short−term bank deposits 126.3 100.5 101.5
196.6 144.0 140.5
Cash at bank earns interest at floating rates based
on daily bank deposit rates.
At 31 March 2019, the Group had available
€81.4m (2018 - €124.6m, 2017 - €152.7m) of
undrawn committed borrowing facilities relating
to the Senior revolving credit facility and €nil
(2018 - €28.1m, 2017 - €11.3m) of undrawn
committed borrowing facilities relating to the
project finance facilities. There were no cash
drawings under the Senior revolving credit facility
at 31 March 2019 (2018 - €nil). €31.2m (2018 -
€28.4m, 2017 - €15.7m) of cash was restricted in
the project financed wind farms and is subject to
bi-annual distribution debt service requirements.
20. CASH AND CASH EQUIVALENTS
2019 €m
2018 €m
2017 €m
Trade creditors 123.9 89.5 58.3
Other creditors 63.0 50.8 41.1
Amounts owed to associate 1.0 2.7 2.5
Contract liabilities (payments on account) 29.2 26.8 28.9
Tax and social security 10.2 13.3 10.5
Accruals 194.1 186.3 165.2
421.4 369.4 306.5
Trade creditors are non−interest bearing and are
normally settled within 45 day terms.
Contract liabilities relate to payments on account
from customers for the supply of electricity.
The amounts included in contract liabilities are
current in nature and are recognised in revenue
within 12 months.
21. TRADE AND OTHER PAYABLES
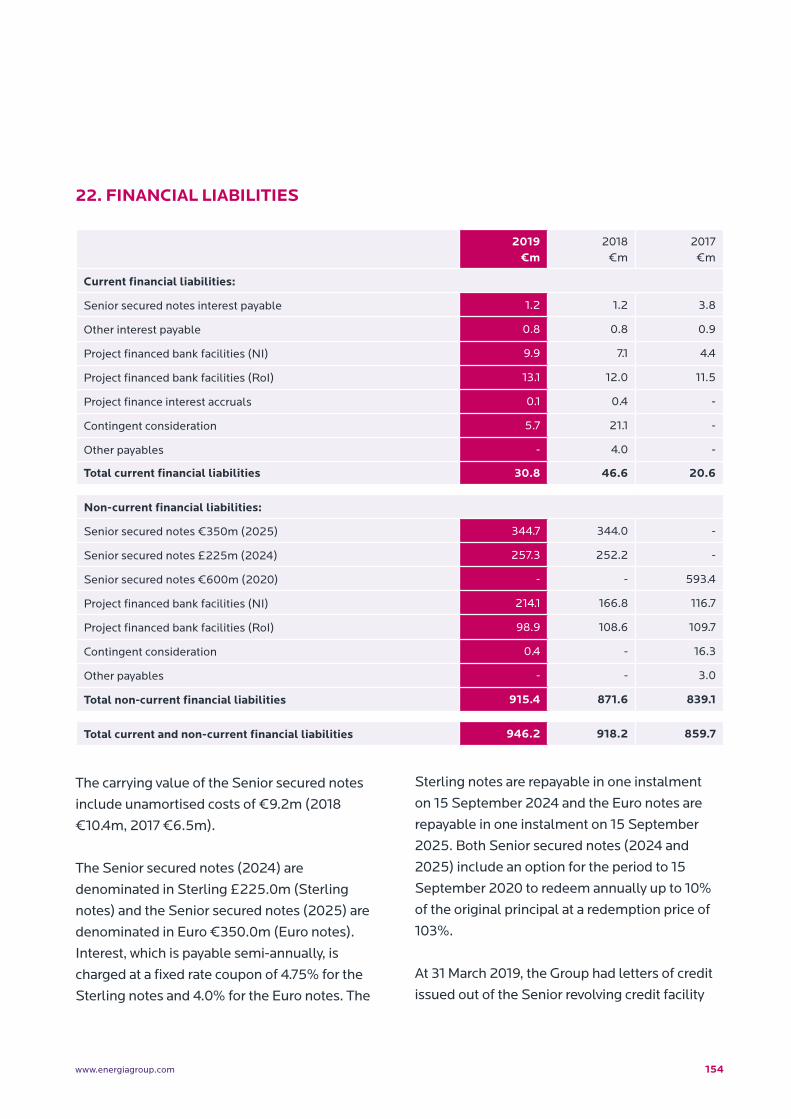
154www.energiagroup.com
2019 €m
2018 €m
2017 €m
Current financial liabilities:
Senior secured notes interest payable 1.2 1.2 3.8
Other interest payable 0.8 0.8 0.9
Project financed bank facilities (NI) 9.9 7.1 4.4
Project financed bank facilities (RoI) 13.1 12.0 11.5
Project finance interest accruals 0.1 0.4 -
Contingent consideration 5.7 21.1 -
Other payables - 4.0 -
Total current financial liabilities 30.8 46.6 20.6
Non-current financial liabilities:
Senior secured notes €350m (2025) 344.7 344.0 -
Senior secured notes £225m (2024) 257.3 252.2 -
Senior secured notes €600m (2020) - - 593.4
Project financed bank facilities (NI) 214.1 166.8 116.7
Project financed bank facilities (RoI) 98.9 108.6 109.7
Contingent consideration 0.4 - 16.3
Other payables - - 3.0
Total non−current financial liabilities 915.4 871.6 839.1
Total current and non-current financial liabilities 946.2 918.2 859.7
22. FINANCIAL LIABILITIES
The carrying value of the Senior secured notes
include unamortised costs of €9.2m (2018
€10.4m, 2017 €6.5m).
The Senior secured notes (2024) are
denominated in Sterling £225.0m (Sterling
notes) and the Senior secured notes (2025) are
denominated in Euro €350.0m (Euro notes).
Interest, which is payable semi−annually, is
charged at a fixed rate coupon of 4.75% for the
Sterling notes and 4.0% for the Euro notes. The
Sterling notes are repayable in one instalment
on 15 September 2024 and the Euro notes are
repayable in one instalment on 15 September
2025. Both Senior secured notes (2024 and
2025) include an option for the period to 15
September 2020 to redeem annually up to 10%
of the original principal at a redemption price of
103%.
At 31 March 2019, the Group had letters of credit
issued out of the Senior revolving credit facility
155 Energia Group Limited Consolidated Financial Statements 2018 - 2019
of €179.7m resulting in undrawn committed
facilities of €81.4m (31 March 2018 - €124.6m,
2017 - €152.7m). There were no cash drawings
under the Senior revolving credit facility at 31
March 2019 (31 March 2018 - €nil, 2017 - €nil).
Interest is charged under the Senior revolving
credit facility at floating interest rates based on
Libor and Euribor.
Project financed bank facilitiesThe project financed bank loan facilities are
repayable in semi-annual instalments to 2034
and are secured on a non-recourse basis over the
assets and shares of the specific project finance
companies. Interest on the project finance
bank loan facilities has been predominantly
fixed through interest rate swaps resulting in an
effective rate of interest of 3.76% (2018 - 3.95%,
2017 – 4.09%) on project financed bank facilities
NI and 2.63% (2018 – 2.83%, 2017 – 2.72%) on
the project financed bank facilities RoI.
Contingent considerationIn July 2017, the Group completed the acquisition
of Dargan Road Biogas Limited, a 3.6MW
anaerobic digestion development project at
Giant’s Park in Belfast. On acquisition contingent
consideration of €2.8m was recognised reflecting
the present value of maximum amount payable,
with the minimum amount payable being €nil.
Contingent consideration relates to the execution
of a lease option and the grant of planning and is
anticipated to be paid in 2019/20.
In May 2018, the Group acquired 100% of the
shares of CEHL (Dublin) Bioenergy Limited
together with its subsidiary Huntstown Bioenergy
Limited (Huntstown AD), a 4.0MW anaerobic
digestion facility in North Dublin On acquisition
contingent consideration of €2.7m was
recognised and reflects the present value of the
maximum amount payable, with the minimum
amount payable being €nil. Contingent
consideration is expected to be paid in 2019/20
when construction and commissioning of the
plant is achieved.
In February 2019, the Group acquired 100% of the
shares of Coolberrin Wind Limited (Coolberrin),
an unlisted wind farm company in County Cavan.
On acquisition, contingent consideration of
€0.4m was recognised and reflects the present
value of the maximum amount payable, with the
minimum amount payable being €nil. Contingent
consideration is expected to be paid in 2021/22
when construction and commissioning of the
plant is achieved.
During the year, €17.2m was paid in relation to
the contingent consideration of Cornavarrow,
Slieveglass and Teiges, with the remaining
balance of €1.8m being released to the income
statement.
Other payablesOther payables of €4.2m were paid during the
year in relation to the pre-acquisition services of
Cornavarrow and Teiges.
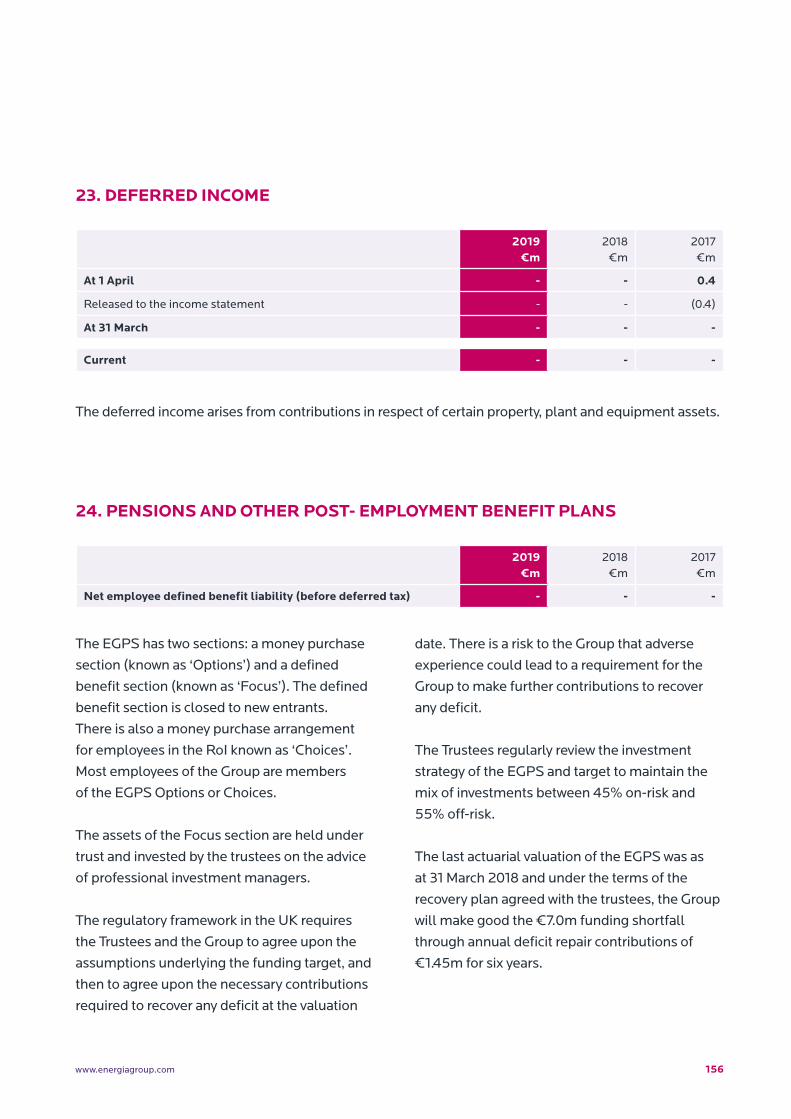
156www.energiagroup.com
2019 €m
2018 €m
2017 €m
At 1 April - - 0.4
Released to the income statement - - (0.4)
At 31 March - - -
Current - - -
23. DEFERRED INCOME
The deferred income arises from contributions in respect of certain property, plant and equipment assets.
2019 €m
2018 €m
2017 €m
Net employee defined benefit liability (before deferred tax) - - -
24. PENSIONS AND OTHER POST- EMPLOYMENT BENEFIT PLANS
The EGPS has two sections: a money purchase
section (known as ‘Options’) and a defined
benefit section (known as ‘Focus’). The defined
benefit section is closed to new entrants.
There is also a money purchase arrangement
for employees in the RoI known as ‘Choices’.
Most employees of the Group are members
of the EGPS Options or Choices.
The assets of the Focus section are held under
trust and invested by the trustees on the advice
of professional investment managers.
The regulatory framework in the UK requires
the Trustees and the Group to agree upon the
assumptions underlying the funding target, and
then to agree upon the necessary contributions
required to recover any deficit at the valuation
date. There is a risk to the Group that adverse
experience could lead to a requirement for the
Group to make further contributions to recover
any deficit.
The Trustees regularly review the investment
strategy of the EGPS and target to maintain the
mix of investments between 45% on-risk and
55% off-risk.
The last actuarial valuation of the EGPS was as
at 31 March 2018 and under the terms of the
recovery plan agreed with the trustees, the Group
will make good the €7.0m funding shortfall
through annual deficit repair contributions of
€1.45m for six years.
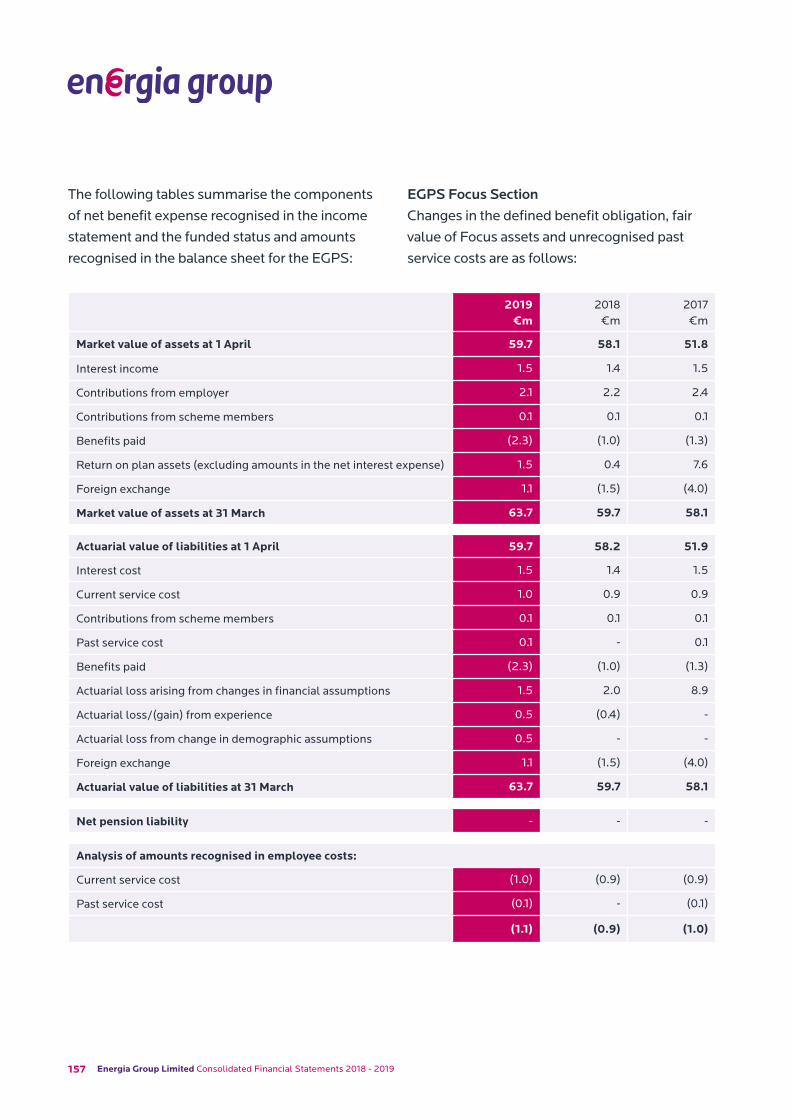
157 Energia Group Limited Consolidated Financial Statements 2018 - 2019
The following tables summarise the components
of net benefit expense recognised in the income
statement and the funded status and amounts
recognised in the balance sheet for the EGPS:
EGPS Focus SectionChanges in the defined benefit obligation, fair
value of Focus assets and unrecognised past
service costs are as follows:
2019 €m
2018 €m
2017 €m
Market value of assets at 1 April 59.7 58.1 51.8
Interest income 1.5 1.4 1.5
Contributions from employer 2.1 2.2 2.4
Contributions from scheme members 0.1 0.1 0.1
Benefits paid (2.3) (1.0) (1.3)
Return on plan assets (excluding amounts in the net interest expense) 1.5 0.4 7.6
Foreign exchange 1.1 (1.5) (4.0)
Market value of assets at 31 March 63.7 59.7 58.1
Actuarial value of liabilities at 1 April 59.7 58.2 51.9
Interest cost 1.5 1.4 1.5
Current service cost 1.0 0.9 0.9
Contributions from scheme members 0.1 0.1 0.1
Past service cost 0.1 - 0.1
Benefits paid (2.3) (1.0) (1.3)
Actuarial loss arising from changes in financial assumptions 1.5 2.0 8.9
Actuarial loss/(gain) from experience 0.5 (0.4) -
Actuarial loss from change in demographic assumptions 0.5 - -
Foreign exchange 1.1 (1.5) (4.0)
Actuarial value of liabilities at 31 March 63.7 59.7 58.1
Net pension liability - - -
Analysis of amounts recognised in employee costs:
Current service cost (1.0) (0.9) (0.9)
Past service cost (0.1) - (0.1)
(1.1) (0.9) (1.0)
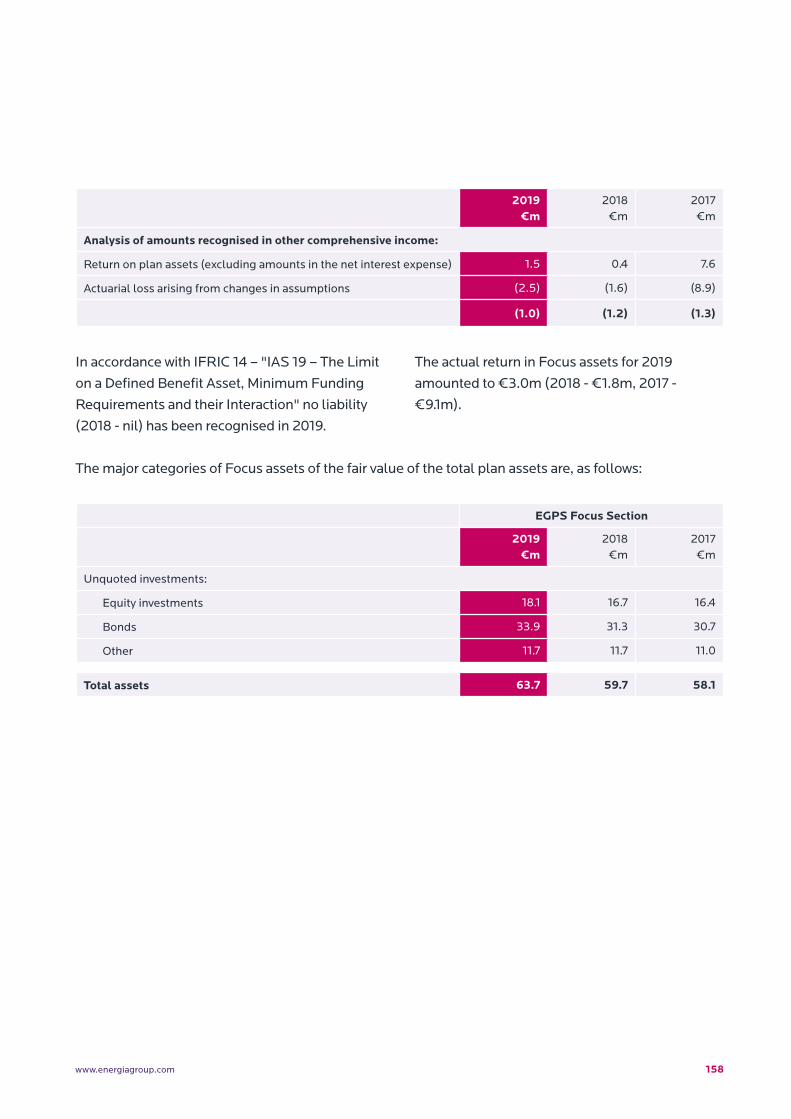
158www.energiagroup.com
2019 €m
2018 €m
2017 €m
Analysis of amounts recognised in other comprehensive income:
Return on plan assets (excluding amounts in the net interest expense) 1.5 0.4 7.6
Actuarial loss arising from changes in assumptions (2.5) (1.6) (8.9)
(1.0) (1.2) (1.3)
In accordance with IFRIC 14 – "IAS 19 – The Limit
on a Defined Benefit Asset, Minimum Funding
Requirements and their Interaction" no liability
(2018 - nil) has been recognised in 2019.
The actual return in Focus assets for 2019
amounted to €3.0m (2018 - €1.8m, 2017 -
€9.1m).
The major categories of Focus assets of the fair value of the total plan assets are, as follows:
EGPS Focus Section
2019 €m
2018 €m
2017 €m
Unquoted investments:
Equity investments 18.1 16.7 16.4
Bonds 33.9 31.3 30.7
Other 11.7 11.7 11.0
Total assets 63.7 59.7 58.1
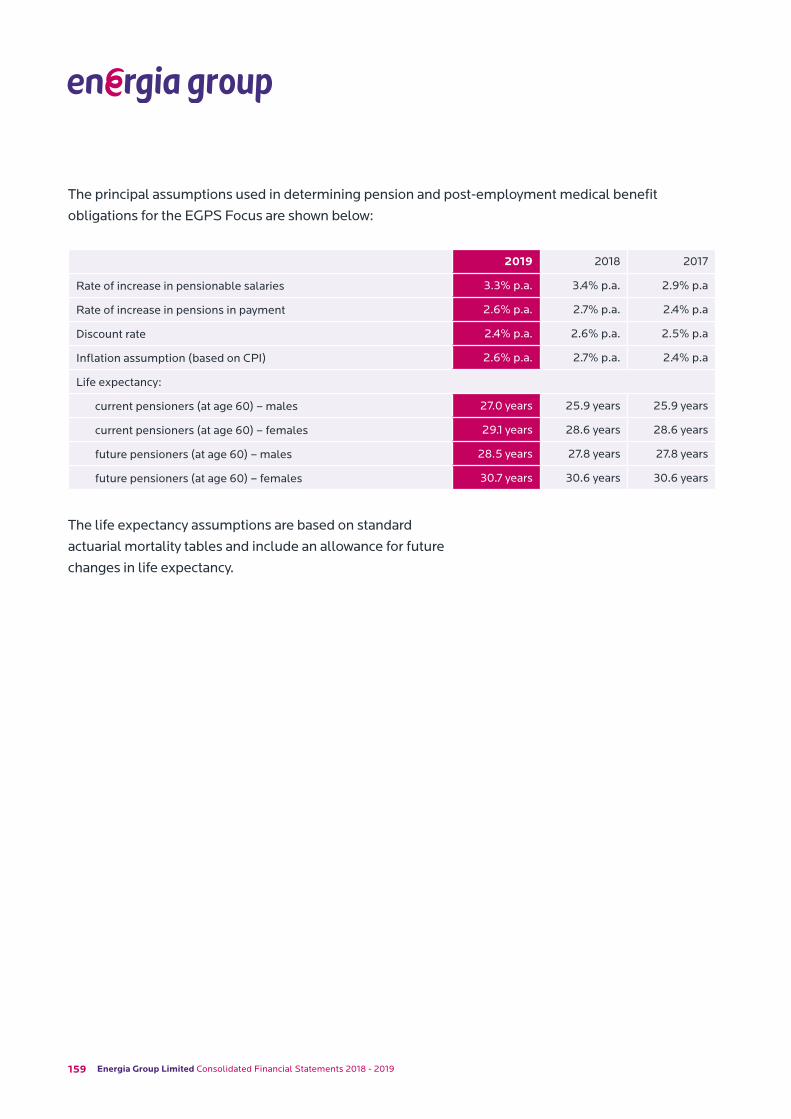
159 Energia Group Limited Consolidated Financial Statements 2018 - 2019
The principal assumptions used in determining pension and post−employment medical benefit
obligations for the EGPS Focus are shown below:
2019 2018 2017
Rate of increase in pensionable salaries 3.3% p.a. 3.4% p.a. 2.9% p.a
Rate of increase in pensions in payment 2.6% p.a. 2.7% p.a. 2.4% p.a
Discount rate 2.4% p.a. 2.6% p.a. 2.5% p.a
Inflation assumption (based on CPI) 2.6% p.a. 2.7% p.a. 2.4% p.a
Life expectancy:
current pensioners (at age 60) – males 27.0 years 25.9 years 25.9 years
current pensioners (at age 60) – females 29.1 years 28.6 years 28.6 years
future pensioners (at age 60) – males 28.5 years 27.8 years 27.8 years
future pensioners (at age 60) – females 30.7 years 30.6 years 30.6 years
The life expectancy assumptions are based on standard
actuarial mortality tables and include an allowance for future
changes in life expectancy.
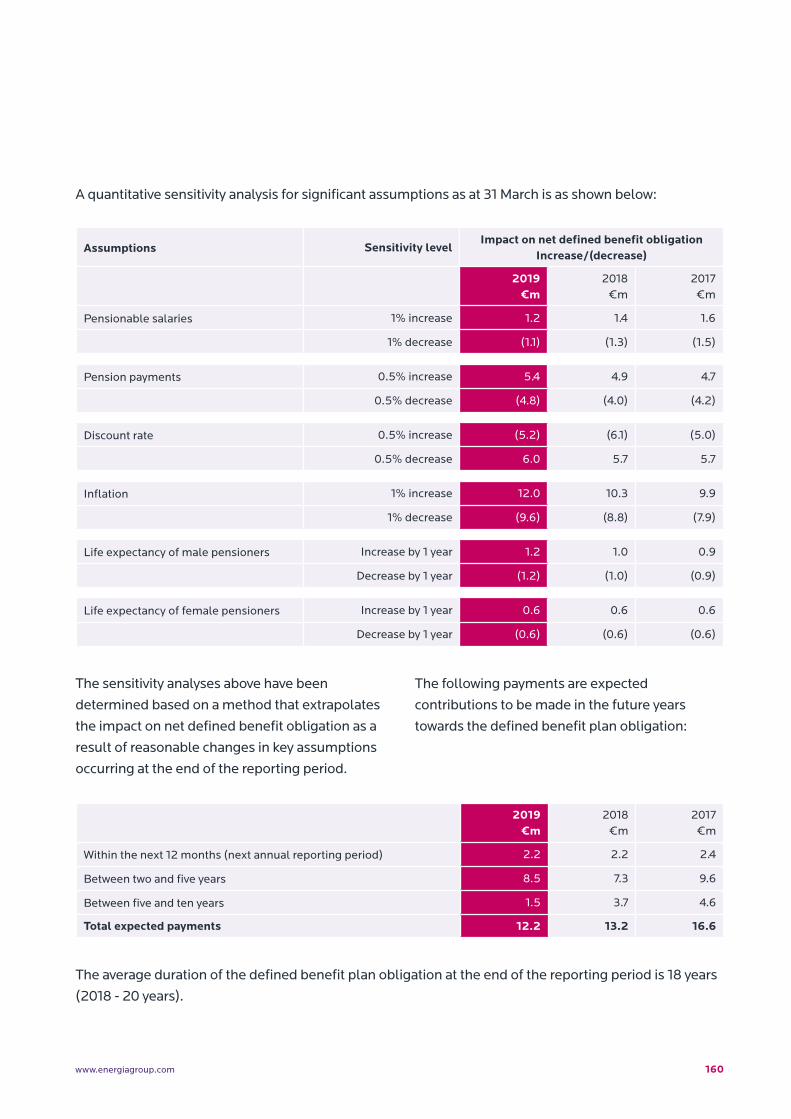
160www.energiagroup.com
A quantitative sensitivity analysis for significant assumptions as at 31 March is as shown below:
Assumptions Sensitivity levelImpact on net defined benefit obligation
Increase/(decrease)
2019 €m
2018 €m
2017 €m
Pensionable salaries 1% increase 1.2 1.4 1.6
1% decrease (1.1) (1.3) (1.5)
Pension payments 0.5% increase 5.4 4.9 4.7
0.5% decrease (4.8) (4.0) (4.2)
Discount rate 0.5% increase (5.2) (6.1) (5.0)
0.5% decrease 6.0 5.7 5.7
Inflation 1% increase 12.0 10.3 9.9
1% decrease (9.6) (8.8) (7.9)
Life expectancy of male pensioners Increase by 1 year 1.2 1.0 0.9
Decrease by 1 year (1.2) (1.0) (0.9)
Life expectancy of female pensioners Increase by 1 year 0.6 0.6 0.6
Decrease by 1 year (0.6) (0.6) (0.6)
The sensitivity analyses above have been
determined based on a method that extrapolates
the impact on net defined benefit obligation as a
result of reasonable changes in key assumptions
occurring at the end of the reporting period.
The following payments are expected
contributions to be made in the future years
towards the defined benefit plan obligation:
2019 €m
2018 €m
2017 €m
Within the next 12 months (next annual reporting period) 2.2 2.2 2.4
Between two and five years 8.5 7.3 9.6
Between five and ten years 1.5 3.7 4.6
Total expected payments 12.2 13.2 16.6
The average duration of the defined benefit plan obligation at the end of the reporting period is 18 years
(2018 - 20 years).
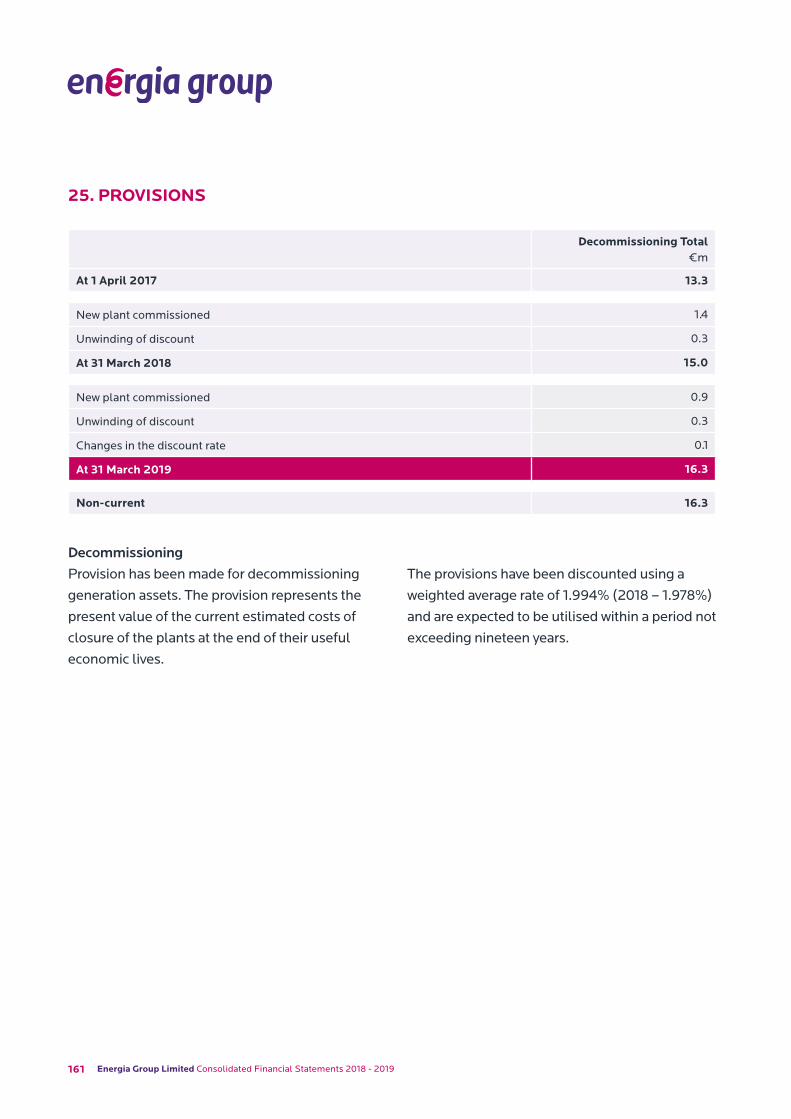
161 Energia Group Limited Consolidated Financial Statements 2018 - 2019
25. PROVISIONS
Decommissioning Total€m
At 1 April 2017 13.3
New plant commissioned 1.4
Unwinding of discount 0.3
At 31 March 2018 15.0
New plant commissioned 0.9
Unwinding of discount 0.3
Changes in the discount rate 0.1
At 31 March 2019 16.3
Non-current 16.3
DecommissioningProvision has been made for decommissioning
generation assets. The provision represents the
present value of the current estimated costs of
closure of the plants at the end of their useful
economic lives.
The provisions have been discounted using a
weighted average rate of 1.994% (2018 – 1.978%)
and are expected to be utilised within a period not
exceeding nineteen years.
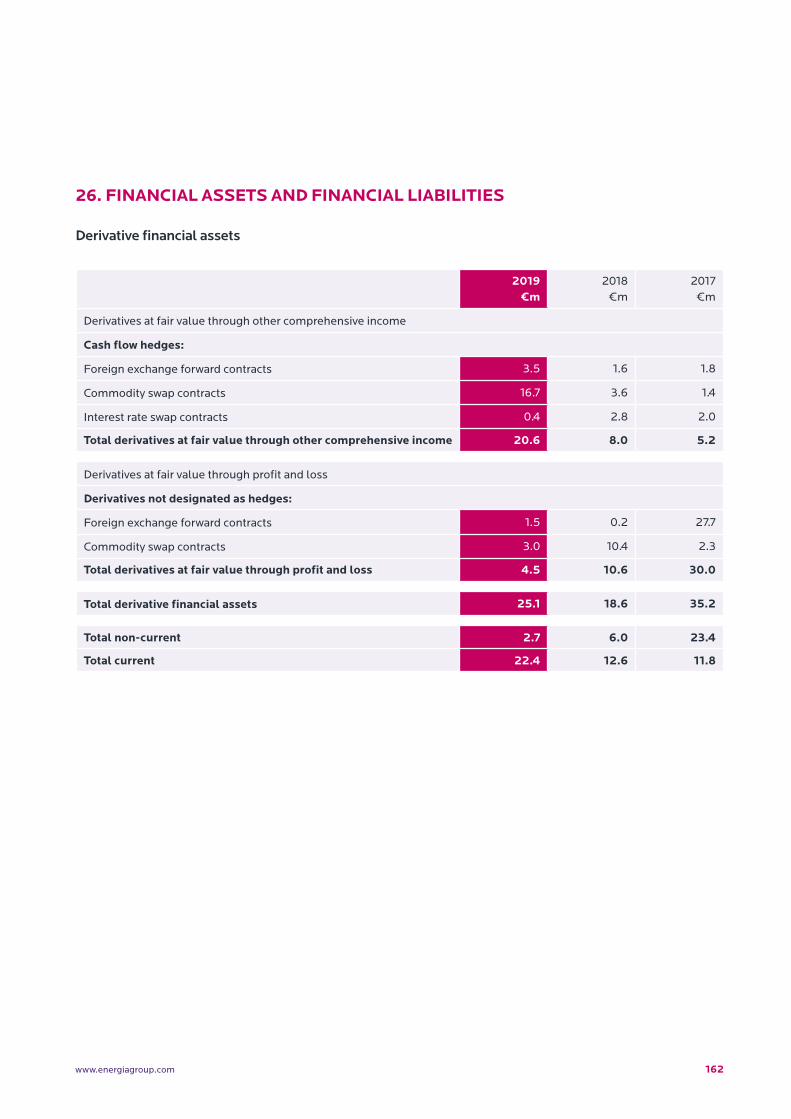
162www.energiagroup.com
26. FINANCIAL ASSETS AND FINANCIAL LIABILITIES
2019 €m
2018 €m
2017 €m
Derivatives at fair value through other comprehensive income
Cash flow hedges:
Foreign exchange forward contracts 3.5 1.6 1.8
Commodity swap contracts 16.7 3.6 1.4
Interest rate swap contracts 0.4 2.8 2.0
Total derivatives at fair value through other comprehensive income 20.6 8.0 5.2
Derivatives at fair value through profit and loss
Derivatives not designated as hedges:
Foreign exchange forward contracts 1.5 0.2 27.7
Commodity swap contracts 3.0 10.4 2.3
Total derivatives at fair value through profit and loss 4.5 10.6 30.0
Total derivative financial assets 25.1 18.6 35.2
Total non-current 2.7 6.0 23.4
Total current 22.4 12.6 11.8
Derivative financial assets
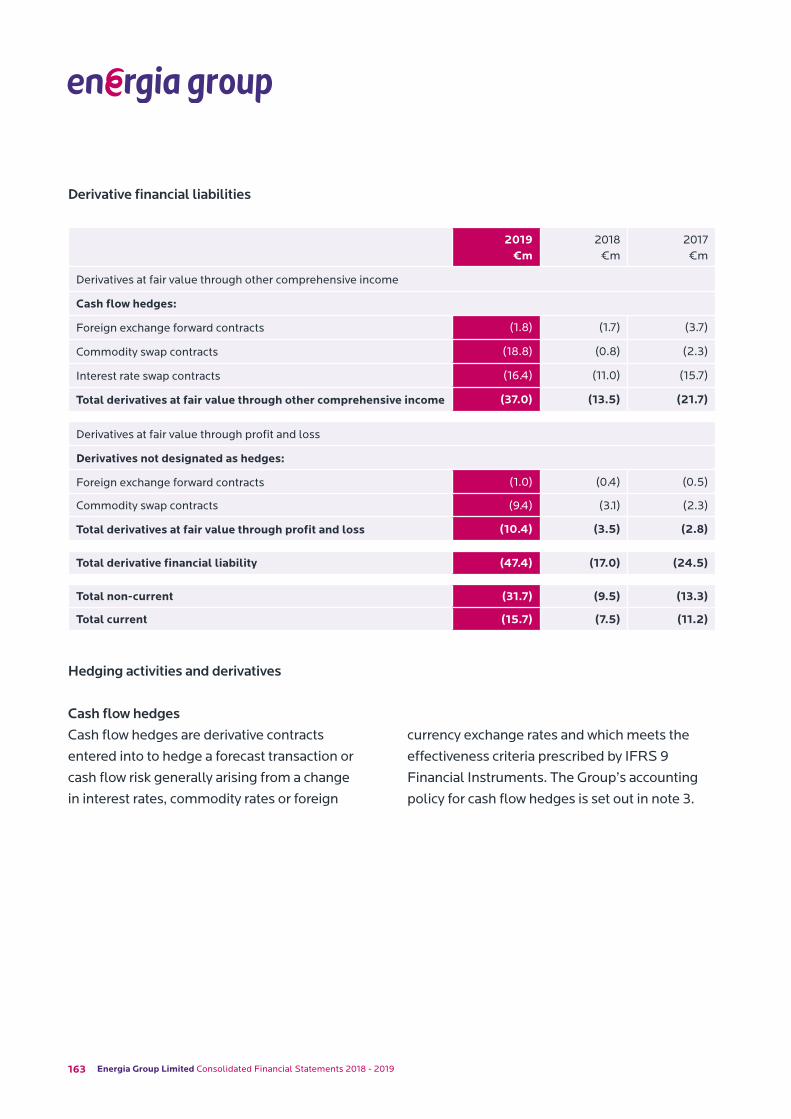
163 Energia Group Limited Consolidated Financial Statements 2018 - 2019
2019 €m
2018 €m
2017 €m
Derivatives at fair value through other comprehensive income
Cash flow hedges:
Foreign exchange forward contracts (1.8) (1.7) (3.7)
Commodity swap contracts (18.8) (0.8) (2.3)
Interest rate swap contracts (16.4) (11.0) (15.7)
Total derivatives at fair value through other comprehensive income (37.0) (13.5) (21.7)
Derivatives at fair value through profit and loss
Derivatives not designated as hedges:
Foreign exchange forward contracts (1.0) (0.4) (0.5)
Commodity swap contracts (9.4) (3.1) (2.3)
Total derivatives at fair value through profit and loss (10.4) (3.5) (2.8)
Total derivative financial liability (47.4) (17.0) (24.5)
Total non-current (31.7) (9.5) (13.3)
Total current (15.7) (7.5) (11.2)
Derivative financial liabilities
Hedging activities and derivatives
Cash flow hedgesCash flow hedges are derivative contracts
entered into to hedge a forecast transaction or
cash flow risk generally arising from a change
in interest rates, commodity rates or foreign
currency exchange rates and which meets the
effectiveness criteria prescribed by IFRS 9
Financial Instruments. The Group’s accounting
policy for cash flow hedges is set out in note 3.
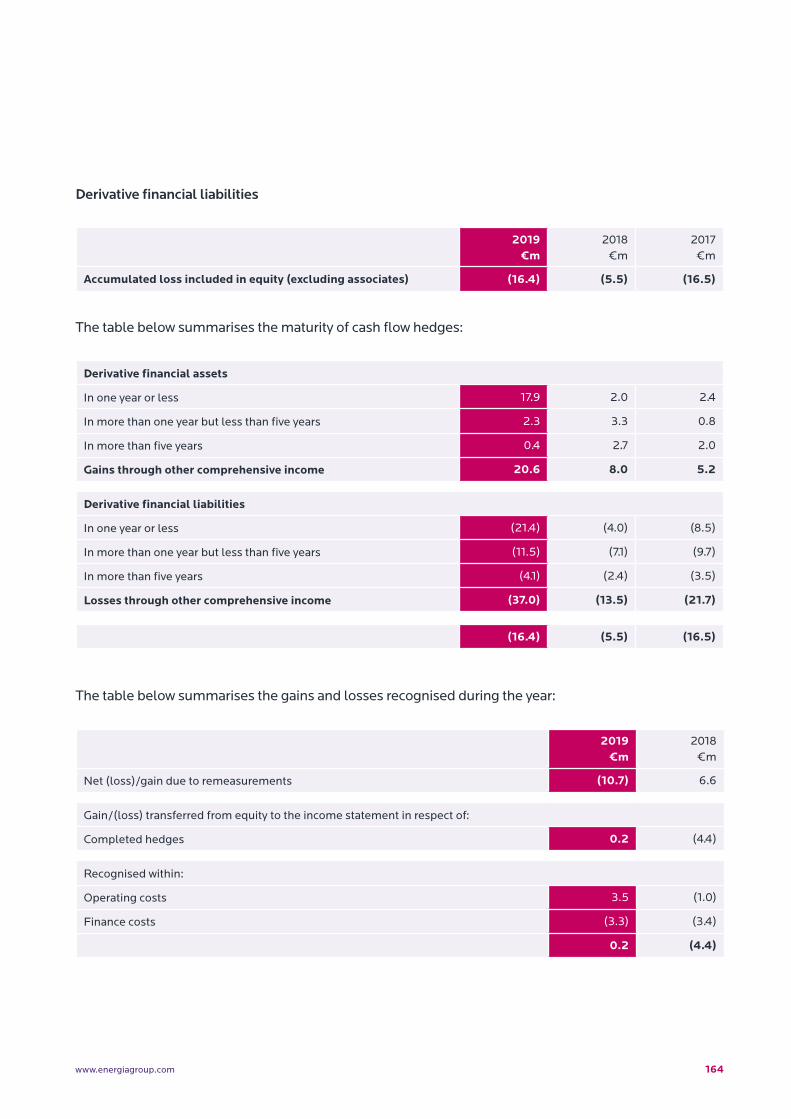
164www.energiagroup.com
2019 €m
2018 €m
2017 €m
Accumulated loss included in equity (excluding associates) (16.4) (5.5) (16.5)
Derivative financial liabilities
The table below summarises the maturity of cash flow hedges:
Derivative financial assets
In one year or less 17.9 2.0 2.4
In more than one year but less than five years 2.3 3.3 0.8
In more than five years 0.4 2.7 2.0
Gains through other comprehensive income 20.6 8.0 5.2
Derivative financial liabilities
In one year or less (21.4) (4.0) (8.5)
In more than one year but less than five years (11.5) (7.1) (9.7)
In more than five years (4.1) (2.4) (3.5)
Losses through other comprehensive income (37.0) (13.5) (21.7)
(16.4) (5.5) (16.5)
The table below summarises the gains and losses recognised during the year:
2019 €m
2018 €m
Net (loss)/gain due to remeasurements (10.7) 6.6
Gain/(loss) transferred from equity to the income statement in respect of:
Completed hedges 0.2 (4.4)
Recognised within:
Operating costs 3.5 (1.0)
Finance costs (3.3) (3.4)
0.2 (4.4)
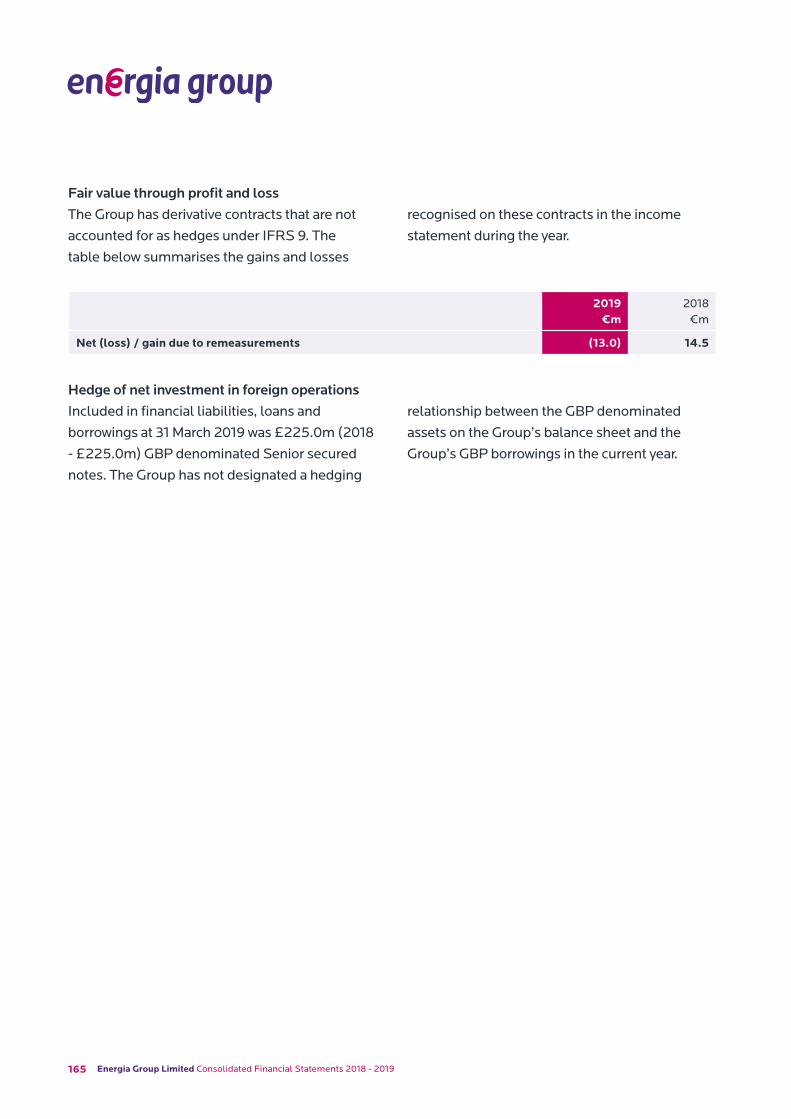
165 Energia Group Limited Consolidated Financial Statements 2018 - 2019
Fair value through profit and lossThe Group has derivative contracts that are not
accounted for as hedges under IFRS 9. The
table below summarises the gains and losses
recognised on these contracts in the income
statement during the year.
2019 €m
2018 €m
Net (loss) / gain due to remeasurements (13.0) 14.5
Hedge of net investment in foreign operationsIncluded in financial liabilities, loans and
borrowings at 31 March 2019 was £225.0m (2018
- £225.0m) GBP denominated Senior secured
notes. The Group has not designated a hedging
relationship between the GBP denominated
assets on the Group’s balance sheet and the
Group’s GBP borrowings in the current year.
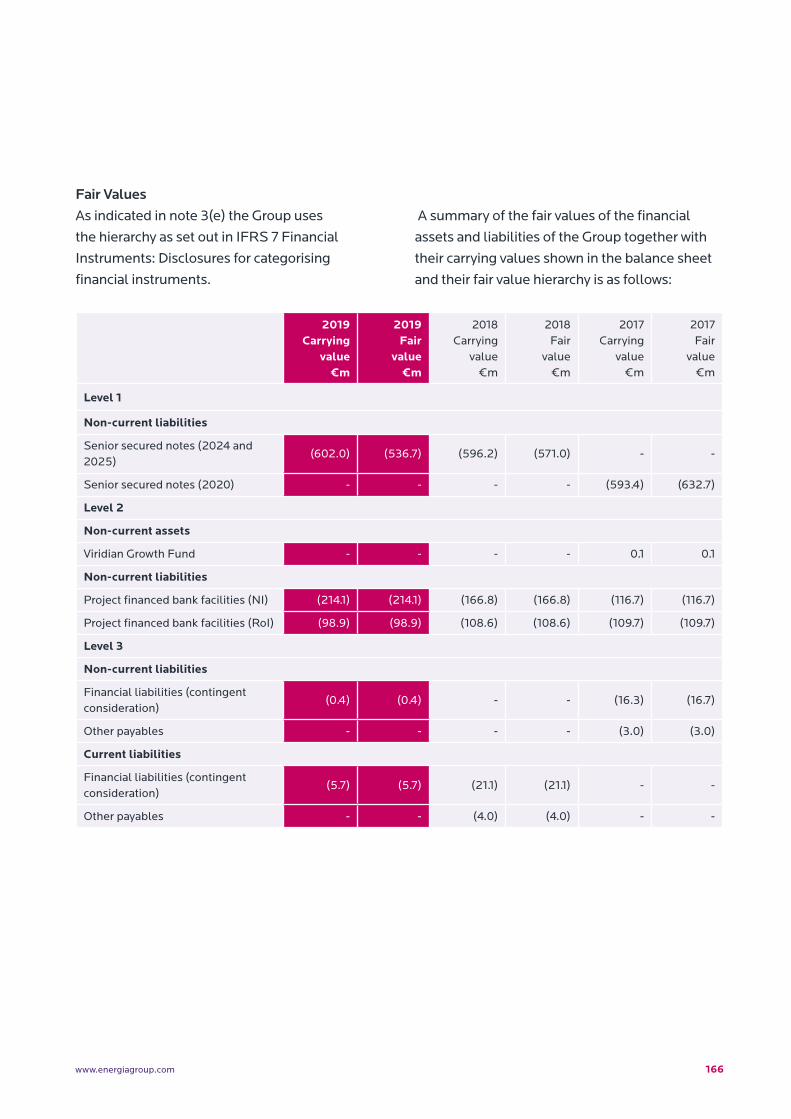
166www.energiagroup.com
2019 Carrying
value€m
2019Fair
value€m
2018Carrying
value€m
2018Fair
value€m
2017Carrying
value€m
2017Fair
value€m
Level 1
Non-current liabilities
Senior secured notes (2024 and 2025)
(602.0) (536.7) (596.2) (571.0) - -
Senior secured notes (2020) - - - - (593.4) (632.7)
Level 2
Non-current assets
Viridian Growth Fund - - - - 0.1 0.1
Non-current liabilities
Project financed bank facilities (NI) (214.1) (214.1) (166.8) (166.8) (116.7) (116.7)
Project financed bank facilities (RoI) (98.9) (98.9) (108.6) (108.6) (109.7) (109.7)
Level 3
Non-current liabilities
Financial liabilities (contingent consideration)
(0.4) (0.4) - - (16.3) (16.7)
Other payables - - - - (3.0) (3.0)
Current liabilities
Financial liabilities (contingent consideration)
(5.7) (5.7) (21.1) (21.1) - -
Other payables - - (4.0) (4.0) - -
Fair ValuesAs indicated in note 3(e) the Group uses
the hierarchy as set out in IFRS 7 Financial
Instruments: Disclosures for categorising
financial instruments.
A summary of the fair values of the financial
assets and liabilities of the Group together with
their carrying values shown in the balance sheet
and their fair value hierarchy is as follows:
167 Energia Group Limited Consolidated Financial Statements 2018 - 2019
The carrying value of cash, trade receivables,
trade payables and other current assets and
liabilities is equivalent to fair value due to the
short term maturities of these items. Contingent
consideration is estimated as the present value
of future cash flows disclosed at the market
rate of interest at the reporting date. Derivatives
are measured at fair value. There have been no
transfers between hierarchy.
The fair value of the Group’s project financed
bank facilities (RoI), project financed bank
facilities (NI) and Senior revolving credit facility
are determined by using discounted cash flows
based on the Group’s borrowing rate. The fair
value of the Group’s Senior secured notes are
based on the quoted market price. The fair value
of interest rate swaps, foreign exchange forward
contracts, foreign exchange cross currency swaps
and commodity contracts has been valued by
calculating the present value of future cash flows,
estimated using forward rates from third party
market price quotations.
The fair value of the Group’s project financed
bank facilities (RoI) and project financed bank
facilities (NI) are a close approximation to their
carrying value given that they bear interest at
floating rates based on Libor/Euribor.
The fair value of contingent consideration is
considered by the Director to fall within the level
3 fair value hierarchy and is measured using
the present value of the pay-out associated
with earnouts set out in the relevant purchase
agreement. The carrying value of €6.1m is
estimated to approximate to its fair value
determined by using discounted cash flows
based on the Company’s borrowing rate.
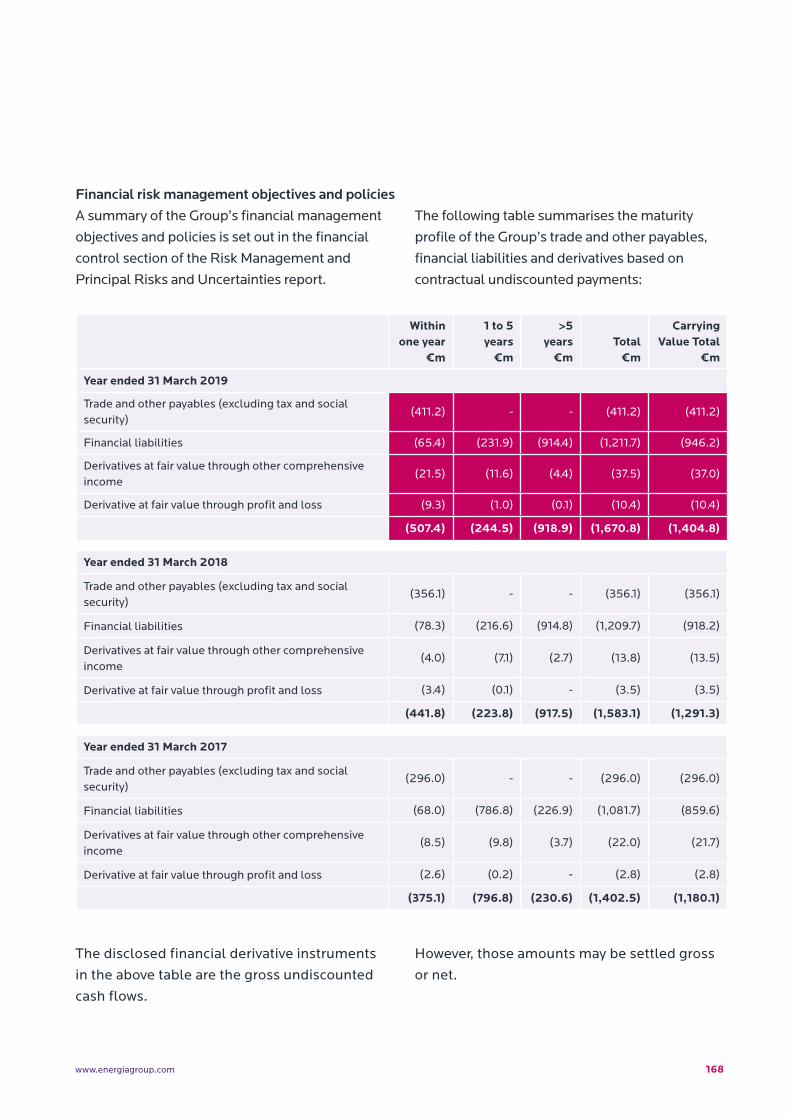
168www.energiagroup.com
Financial risk management objectives and policiesA summary of the Group’s financial management
objectives and policies is set out in the financial
control section of the Risk Management and
Principal Risks and Uncertainties report.
The following table summarises the maturity
profile of the Group’s trade and other payables,
financial liabilities and derivatives based on
contractual undiscounted payments:
The disclosed financial derivative instruments
in the above table are the gross undiscounted
cash flows.
However, those amounts may be settled gross
or net.
Within one year
€m
1 to 5 years
€m
>5years
€mTotal
€m
Carrying Value Total
€m
Year ended 31 March 2019
Trade and other payables (excluding tax and social security)
(411.2) - - (411.2) (411.2)
Financial liabilities (65.4) (231.9) (914.4) (1,211.7) (946.2)
Derivatives at fair value through other comprehensive income
(21.5) (11.6) (4.4) (37.5) (37.0)
Derivative at fair value through profit and loss (9.3) (1.0) (0.1) (10.4) (10.4)
(507.4) (244.5) (918.9) (1,670.8) (1,404.8)
Year ended 31 March 2018
Trade and other payables (excluding tax and social security)
(356.1) - - (356.1) (356.1)
Financial liabilities (78.3) (216.6) (914.8) (1,209.7) (918.2)
Derivatives at fair value through other comprehensive income
(4.0) (7.1) (2.7) (13.8) (13.5)
Derivative at fair value through profit and loss (3.4) (0.1) - (3.5) (3.5)
(441.8) (223.8) (917.5) (1,583.1) (1,291.3)
Year ended 31 March 2017
Trade and other payables (excluding tax and social security)
(296.0) - - (296.0) (296.0)
Financial liabilities (68.0) (786.8) (226.9) (1,081.7) (859.6)
Derivatives at fair value through other comprehensive income
(8.5) (9.8) (3.7) (22.0) (21.7)
Derivative at fair value through profit and loss (2.6) (0.2) - (2.8) (2.8)
(375.1) (796.8) (230.6) (1,402.5) (1,180.1)
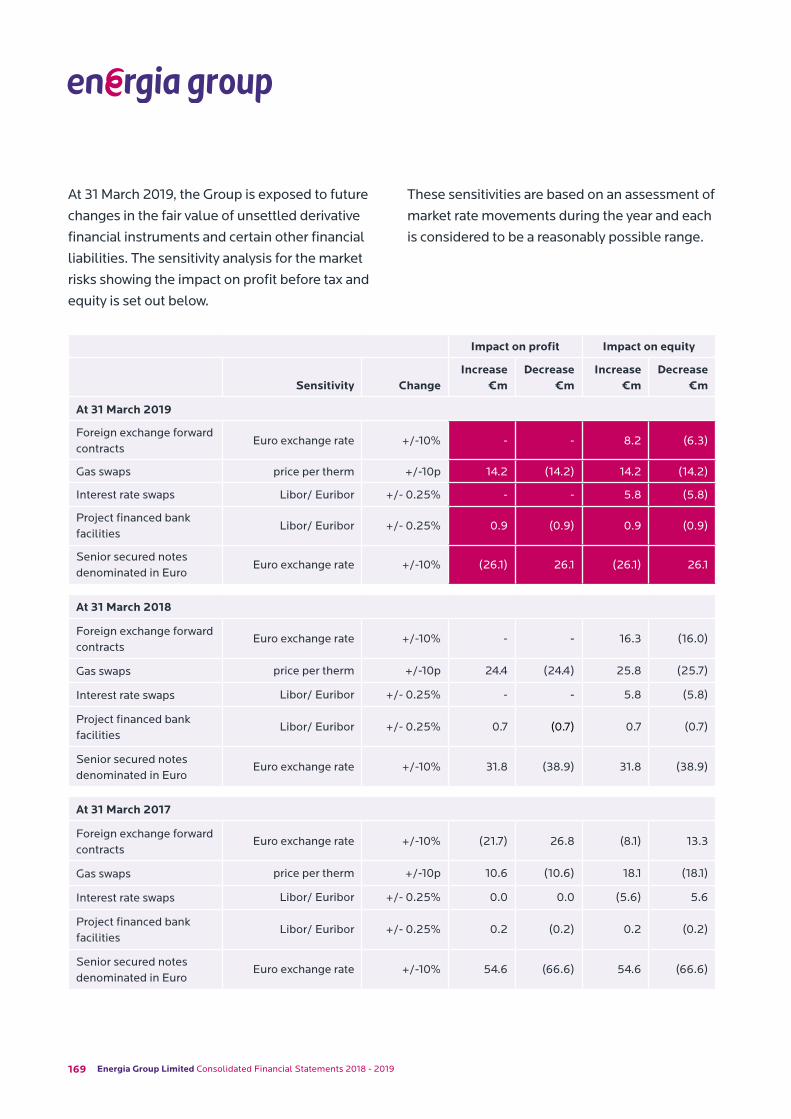
169 Energia Group Limited Consolidated Financial Statements 2018 - 2019
At 31 March 2019, the Group is exposed to future
changes in the fair value of unsettled derivative
financial instruments and certain other financial
liabilities. The sensitivity analysis for the market
risks showing the impact on profit before tax and
equity is set out below.
These sensitivities are based on an assessment of
market rate movements during the year and each
is considered to be a reasonably possible range.
Impact on profit Impact on equity
Sensitivity ChangeIncrease
€mDecrease
€mIncrease
€mDecrease
€m
At 31 March 2019
Foreign exchange forward contracts
Euro exchange rate +/-10% - - 8.2 (6.3)
Gas swaps price per therm +/-10p 14.2 (14.2) 14.2 (14.2)
Interest rate swaps Libor/ Euribor +/- 0.25% - - 5.8 (5.8)
Project financed bank facilities
Libor/ Euribor +/- 0.25% 0.9 (0.9) 0.9 (0.9)
Senior secured notes denominated in Euro
Euro exchange rate +/-10% (26.1) 26.1 (26.1) 26.1
At 31 March 2018
Foreign exchange forward contracts
Euro exchange rate +/-10% - - 16.3 (16.0)
Gas swaps price per therm +/-10p 24.4 (24.4) 25.8 (25.7)
Interest rate swaps Libor/ Euribor +/- 0.25% - - 5.8 (5.8)
Project financed bank facilities
Libor/ Euribor +/- 0.25% 0.7 (0.7) 0.7 (0.7)
Senior secured notes denominated in Euro
Euro exchange rate +/-10% 31.8 (38.9) 31.8 (38.9)
At 31 March 2017
Foreign exchange forward contracts
Euro exchange rate +/-10% (21.7) 26.8 (8.1) 13.3
Gas swaps price per therm +/-10p 10.6 (10.6) 18.1 (18.1)
Interest rate swaps Libor/ Euribor +/- 0.25% 0.0 0.0 (5.6) 5.6
Project financed bank facilities
Libor/ Euribor +/- 0.25% 0.2 (0.2) 0.2 (0.2)
Senior secured notes denominated in Euro
Euro exchange rate +/-10% 54.6 (66.6) 54.6 (66.6)
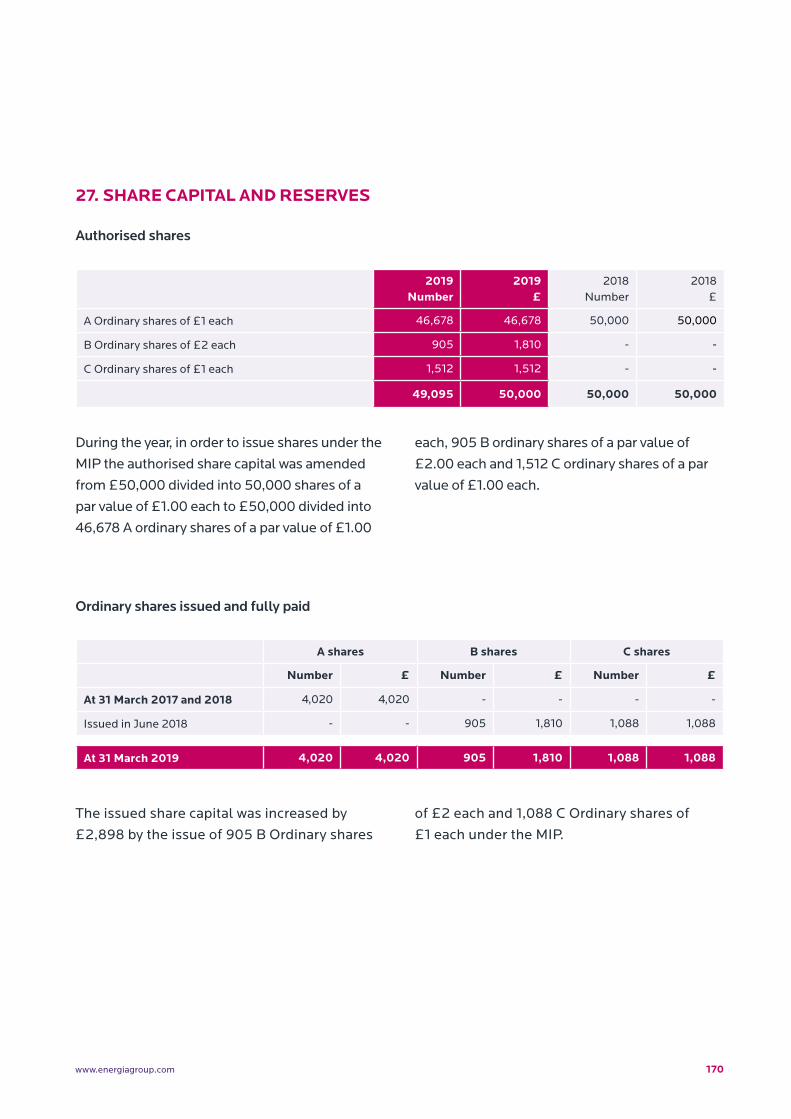
170www.energiagroup.com
27. SHARE CAPITAL AND RESERVES
2019 Number
2019 £
2018 Number
2018£
A Ordinary shares of £1 each 46,678 46,678 50,000 50,000
B Ordinary shares of £2 each 905 1,810 - -
C Ordinary shares of £1 each 1,512 1,512 - -
49,095 50,000 50,000 50,000
Authorised shares
During the year, in order to issue shares under the
MIP the authorised share capital was amended
from £50,000 divided into 50,000 shares of a
par value of £1.00 each to £50,000 divided into
46,678 A ordinary shares of a par value of £1.00
each, 905 B ordinary shares of a par value of
£2.00 each and 1,512 C ordinary shares of a par
value of £1.00 each.
A shares B shares C shares
Number £ Number £ Number £
At 31 March 2017 and 2018 4,020 4,020 - - - -
Issued in June 2018 - - 905 1,810 1,088 1,088
At 31 March 2019 4,020 4,020 905 1,810 1,088 1,088
Ordinary shares issued and fully paid
The issued share capital was increased by
£2,898 by the issue of 905 B Ordinary shares
of £2 each and 1,088 C Ordinary shares of
£1 each under the MIP.
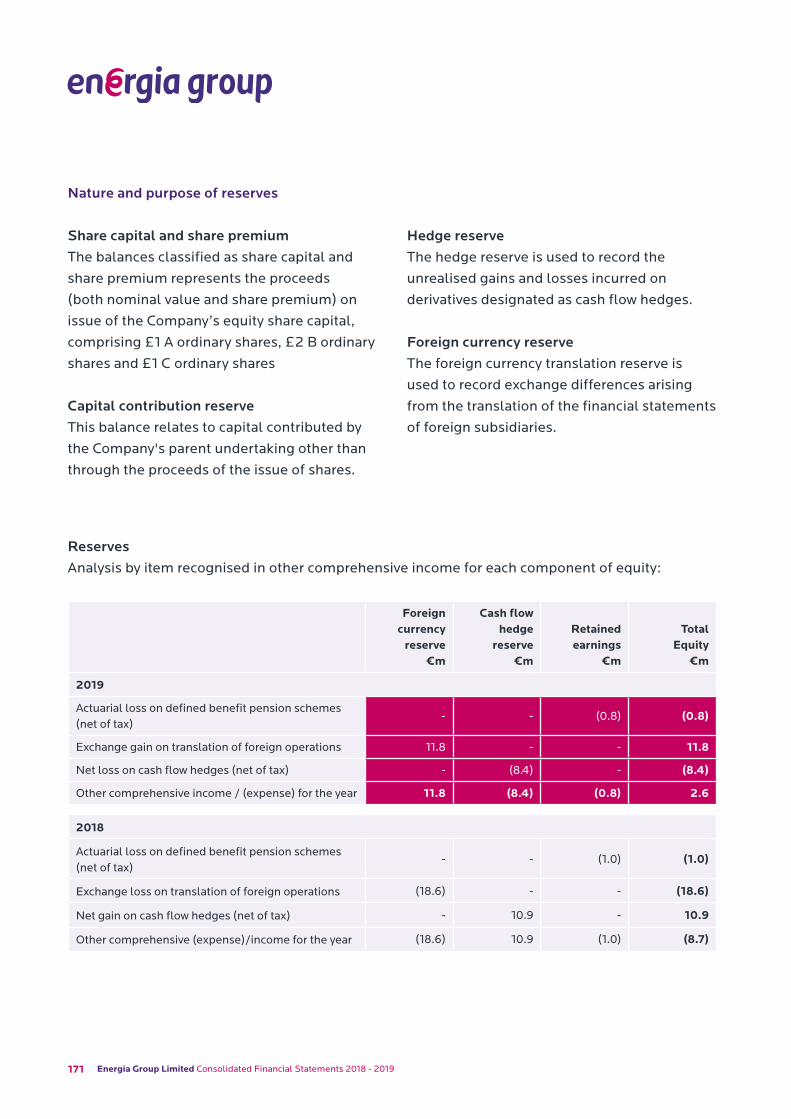
171 Energia Group Limited Consolidated Financial Statements 2018 - 2019
Nature and purpose of reserves
Share capital and share premiumThe balances classified as share capital and
share premium represents the proceeds
(both nominal value and share premium) on
issue of the Company’s equity share capital,
comprising £1 A ordinary shares, £2 B ordinary
shares and £1 C ordinary shares
Capital contribution reserve This balance relates to capital contributed by
the Company's parent undertaking other than
through the proceeds of the issue of shares.
Hedge reserve The hedge reserve is used to record the
unrealised gains and losses incurred on
derivatives designated as cash flow hedges.
Foreign currency reserve The foreign currency translation reserve is
used to record exchange differences arising
from the translation of the financial statements
of foreign subsidiaries.
Foreign currency
reserve€m
Cash flow hedge
reserve€m
Retained earnings
€m
TotalEquity
€m
2019
Actuarial loss on defined benefit pension schemes (net of tax)
- - (0.8) (0.8)
Exchange gain on translation of foreign operations 11.8 - - 11.8
Net loss on cash flow hedges (net of tax) - (8.4) - (8.4)
Other comprehensive income / (expense) for the year 11.8 (8.4) (0.8) 2.6
2018
Actuarial loss on defined benefit pension schemes (net of tax)
- - (1.0) (1.0)
Exchange loss on translation of foreign operations (18.6) - - (18.6)
Net gain on cash flow hedges (net of tax) - 10.9 - 10.9
Other comprehensive (expense)/income for the year (18.6) 10.9 (1.0) (8.7)
ReservesAnalysis by item recognised in other comprehensive income for each component of equity:
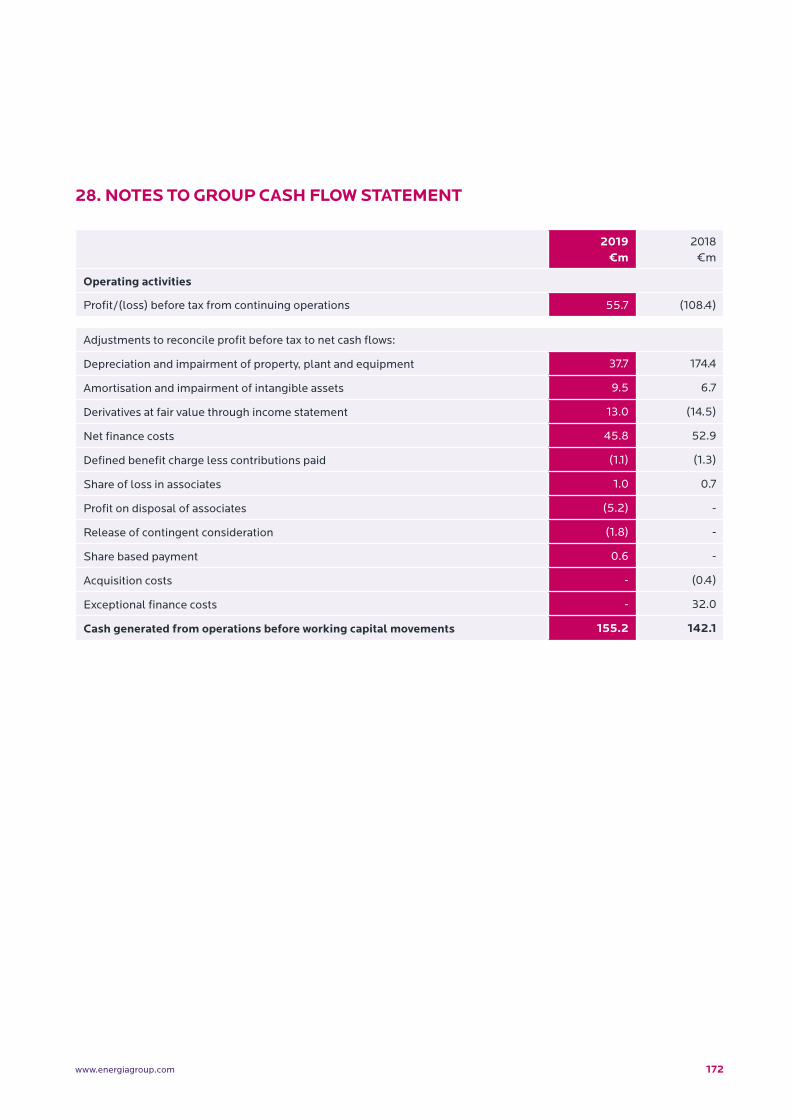
172www.energiagroup.com
28. NOTES TO GROUP CASH FLOW STATEMENT
2019 €m
2018 €m
Operating activities
Profit/(loss) before tax from continuing operations 55.7 (108.4)
Adjustments to reconcile profit before tax to net cash flows:
Depreciation and impairment of property, plant and equipment 37.7 174.4
Amortisation and impairment of intangible assets 9.5 6.7
Derivatives at fair value through income statement 13.0 (14.5)
Net finance costs 45.8 52.9
Defined benefit charge less contributions paid (1.1) (1.3)
Share of loss in associates 1.0 0.7
Profit on disposal of associates (5.2) -
Release of contingent consideration (1.8) -
Share based payment 0.6 -
Acquisition costs - (0.4)
Exceptional finance costs - 32.0
Cash generated from operations before working capital movements 155.2 142.1
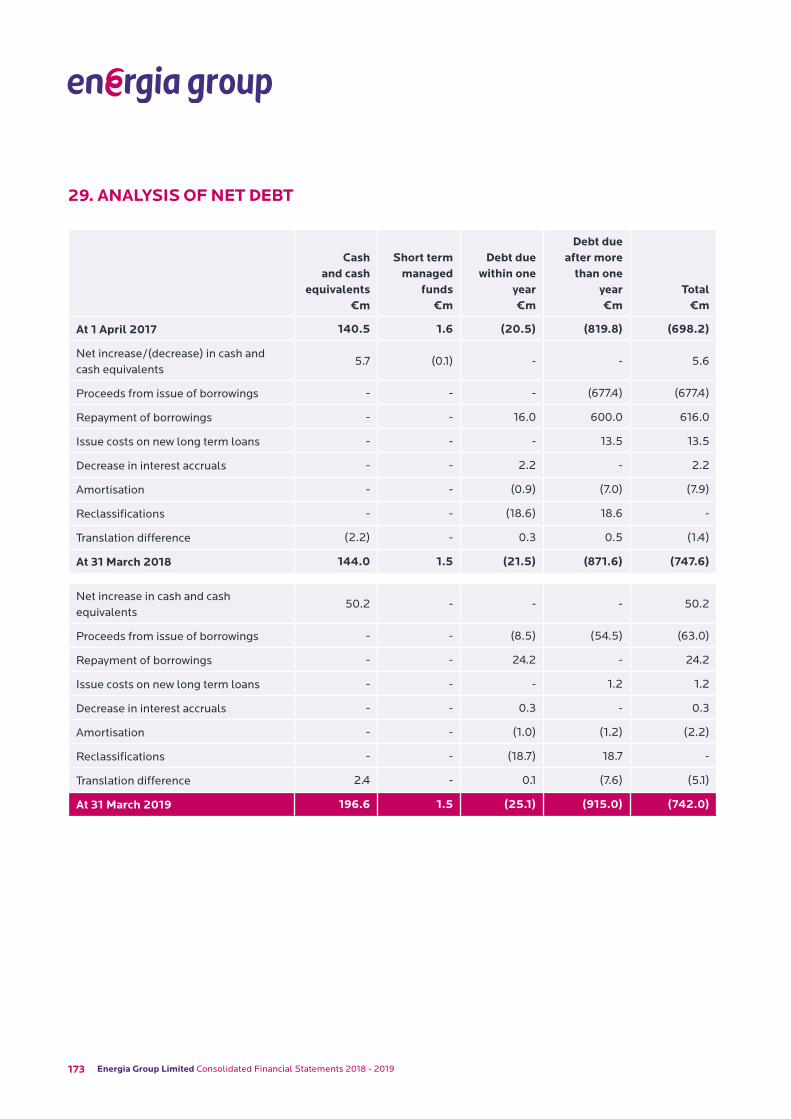
173 Energia Group Limited Consolidated Financial Statements 2018 - 2019
Cash and cash
equivalents€m
Short term managed
funds€m
Debt due within one
year€m
Debt due after more
than one year€m
Total€m
At 1 April 2017 140.5 1.6 (20.5) (819.8) (698.2)
Net increase/(decrease) in cash and cash equivalents
5.7 (0.1) - - 5.6
Proceeds from issue of borrowings - - - (677.4) (677.4)
Repayment of borrowings - - 16.0 600.0 616.0
Issue costs on new long term loans - - - 13.5 13.5
Decrease in interest accruals - - 2.2 - 2.2
Amortisation - - (0.9) (7.0) (7.9)
Reclassifications - - (18.6) 18.6 -
Translation difference (2.2) - 0.3 0.5 (1.4)
At 31 March 2018 144.0 1.5 (21.5) (871.6) (747.6)
Net increase in cash and cash equivalents
50.2 - - - 50.2
Proceeds from issue of borrowings - - (8.5) (54.5) (63.0)
Repayment of borrowings - - 24.2 - 24.2
Issue costs on new long term loans - - - 1.2 1.2
Decrease in interest accruals - - 0.3 - 0.3
Amortisation - - (1.0) (1.2) (2.2)
Reclassifications - - (18.7) 18.7 -
Translation difference 2.4 - 0.1 (7.6) (5.1)
At 31 March 2019 196.6 1.5 (25.1) (915.0) (742.0)
29. ANALYSIS OF NET DEBT
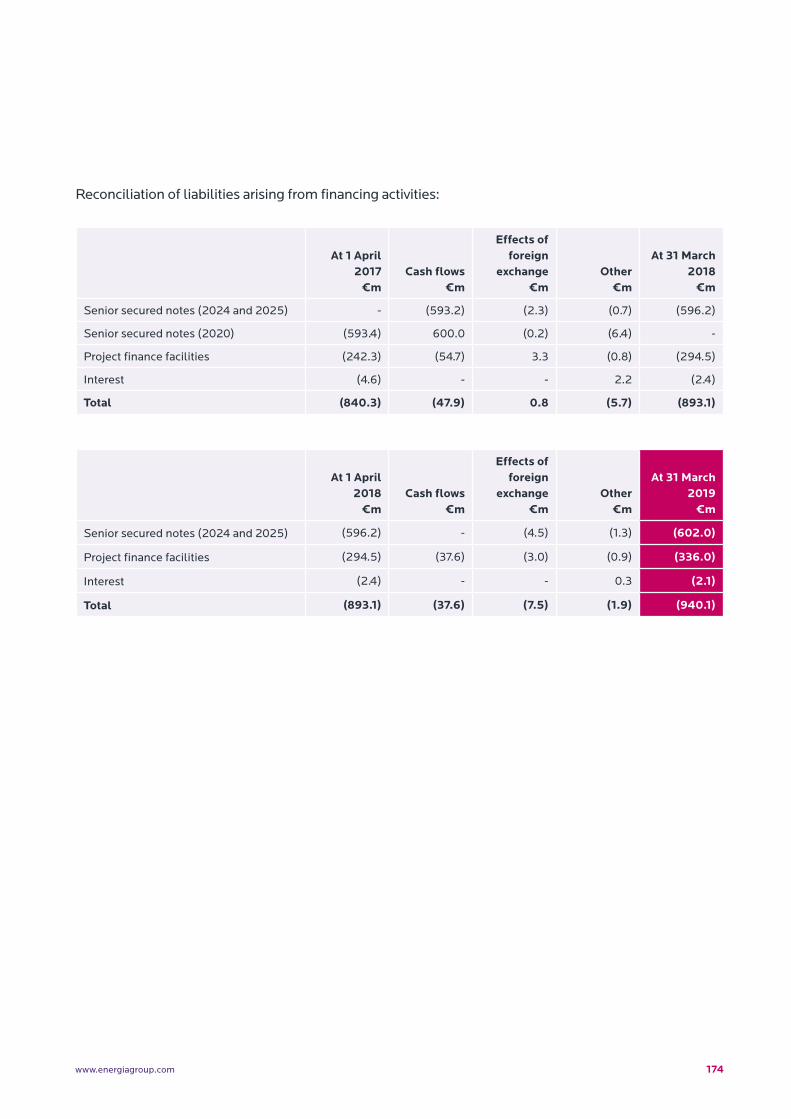
174www.energiagroup.com
At 1 April 2017
€mCash flows
€m
Effects of foreign
exchange€m
Other€m
At 31 March 2018
€m
Senior secured notes (2024 and 2025) - (593.2) (2.3) (0.7) (596.2)
Senior secured notes (2020) (593.4) 600.0 (0.2) (6.4) -
Project finance facilities (242.3) (54.7) 3.3 (0.8) (294.5)
Interest (4.6) - - 2.2 (2.4)
Total (840.3) (47.9) 0.8 (5.7) (893.1)
Reconciliation of liabilities arising from financing activities:
At 1 April 2018
€mCash flows
€m
Effects of foreign
exchange€m
Other€m
At 31 March 2019
€m
Senior secured notes (2024 and 2025) (596.2) - (4.5) (1.3) (602.0)
Project finance facilities (294.5) (37.6) (3.0) (0.9) (336.0)
Interest (2.4) - - 0.3 (2.1)
Total (893.1) (37.6) (7.5) (1.9) (940.1)
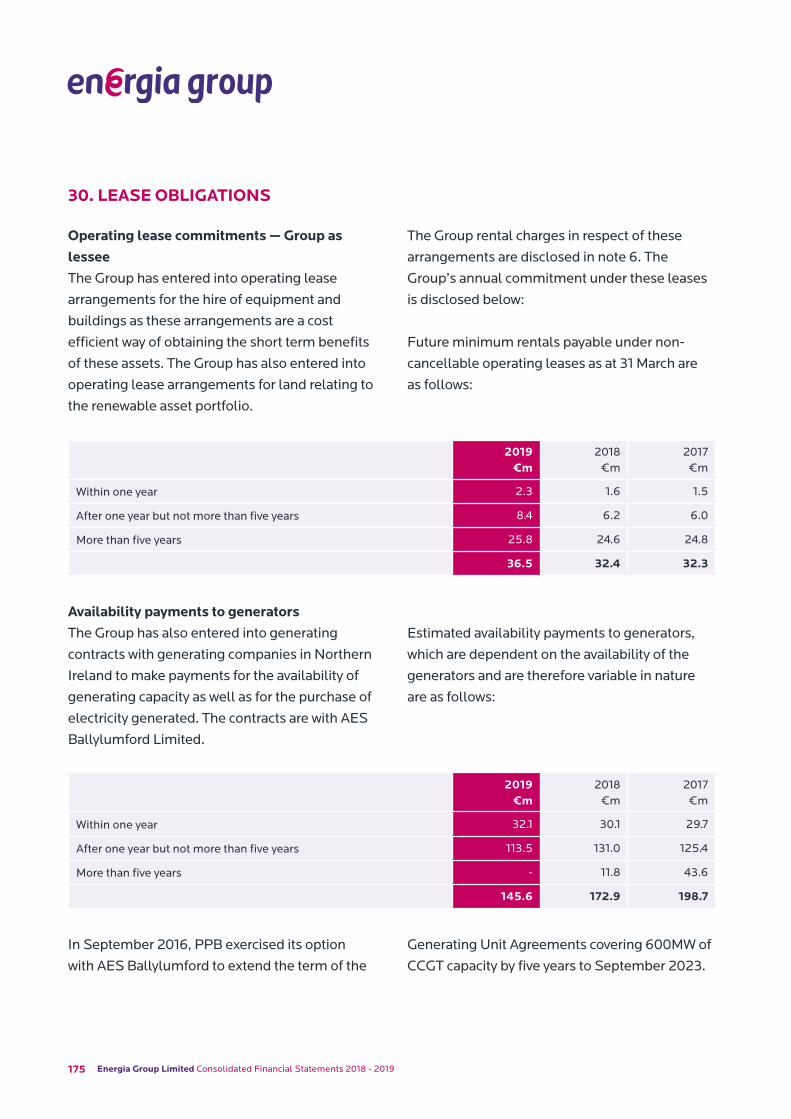
175 Energia Group Limited Consolidated Financial Statements 2018 - 2019
30. LEASE OBLIGATIONS
Operating lease commitments — Group as lesseeThe Group has entered into operating lease
arrangements for the hire of equipment and
buildings as these arrangements are a cost
efficient way of obtaining the short term benefits
of these assets. The Group has also entered into
operating lease arrangements for land relating to
the renewable asset portfolio.
The Group rental charges in respect of these
arrangements are disclosed in note 6. The
Group’s annual commitment under these leases
is disclosed below:
Future minimum rentals payable under non−
cancellable operating leases as at 31 March are
as follows:
2019 €m
2018 €m
2017 €m
Within one year 2.3 1.6 1.5
After one year but not more than five years 8.4 6.2 6.0
More than five years 25.8 24.6 24.8
36.5 32.4 32.3
Availability payments to generatorsThe Group has also entered into generating
contracts with generating companies in Northern
Ireland to make payments for the availability of
generating capacity as well as for the purchase of
electricity generated. The contracts are with AES
Ballylumford Limited.
Estimated availability payments to generators,
which are dependent on the availability of the
generators and are therefore variable in nature
are as follows:
2019 €m
2018 €m
2017 €m
Within one year 32.1 30.1 29.7
After one year but not more than five years 113.5 131.0 125.4
More than five years - 11.8 43.6
145.6 172.9 198.7
In September 2016, PPB exercised its option
with AES Ballylumford to extend the term of the
Generating Unit Agreements covering 600MW of
CCGT capacity by five years to September 2023.
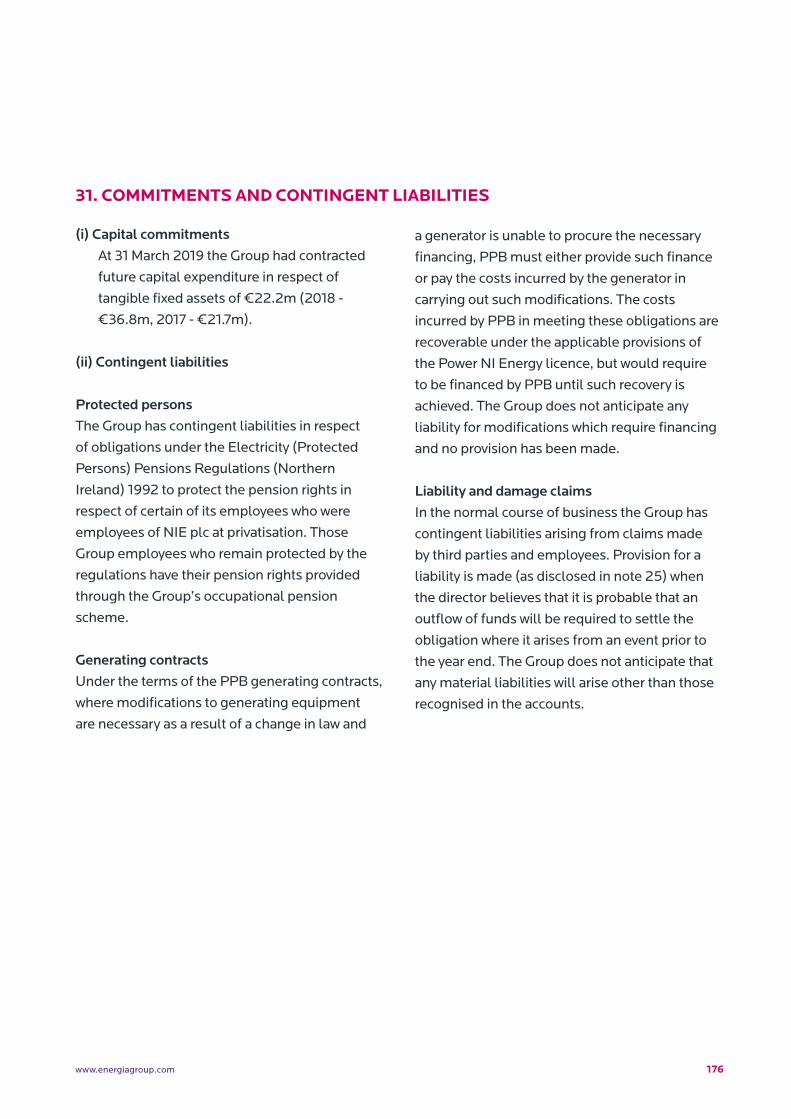
176www.energiagroup.com
31. COMMITMENTS AND CONTINGENT LIABILITIES
(i) Capital commitmentsAt 31 March 2019 the Group had contracted
future capital expenditure in respect of
tangible fixed assets of €22.2m (2018 -
€36.8m, 2017 - €21.7m).
(ii) Contingent liabilities
Protected personsThe Group has contingent liabilities in respect
of obligations under the Electricity (Protected
Persons) Pensions Regulations (Northern
Ireland) 1992 to protect the pension rights in
respect of certain of its employees who were
employees of NIE plc at privatisation. Those
Group employees who remain protected by the
regulations have their pension rights provided
through the Group’s occupational pension
scheme.
Generating contracts Under the terms of the PPB generating contracts,
where modifications to generating equipment
are necessary as a result of a change in law and
a generator is unable to procure the necessary
financing, PPB must either provide such finance
or pay the costs incurred by the generator in
carrying out such modifications. The costs
incurred by PPB in meeting these obligations are
recoverable under the applicable provisions of
the Power NI Energy licence, but would require
to be financed by PPB until such recovery is
achieved. The Group does not anticipate any
liability for modifications which require financing
and no provision has been made.
Liability and damage claimsIn the normal course of business the Group has
contingent liabilities arising from claims made
by third parties and employees. Provision for a
liability is made (as disclosed in note 25) when
the director believes that it is probable that an
outflow of funds will be required to settle the
obligation where it arises from an event prior to
the year end. The Group does not anticipate that
any material liabilities will arise other than those
recognised in the accounts.
177 Energia Group Limited Consolidated Financial Statements 2018 - 2019
32. DISTRIBUTIONS MADE
Dividends of €33.4m were paid to the parent
undertaking on 2 January 2019, at €8,308.46
per share.
In 2018 dividends of €67.8m were paid to the
parent undertaking on 25 September 2017, at
€16,865.67 per share.
Dividends are paid out of profits or from the
Company’s share premium or capital contribution
reserve provided a ‘Solvency Test’ is passed.
33. SHARE BASED PAYMENTS
Management Investment Plan (MIP)Under the MIP, growth shares of the parent are
granted to certain senior executives of the Group.
The exercise price of the share options is equal to
the market price of the underlying shares on the
date of grant. The growth shares vest over time
provided the senior executives continue to be
employed by the Group at the vesting date.
The fair value of growth shares granted is
estimated at the date of grant using a Monte-
Carlo simulation model, taking into account
the terms and conditions on which the share
options were granted. It takes into account
historical and expected dividends, and the share
price volatility of the Group relative to that of
comparable companies so as to predict the share
performance.
The Group accounts for the Growth shares as an
equity-settled plan.
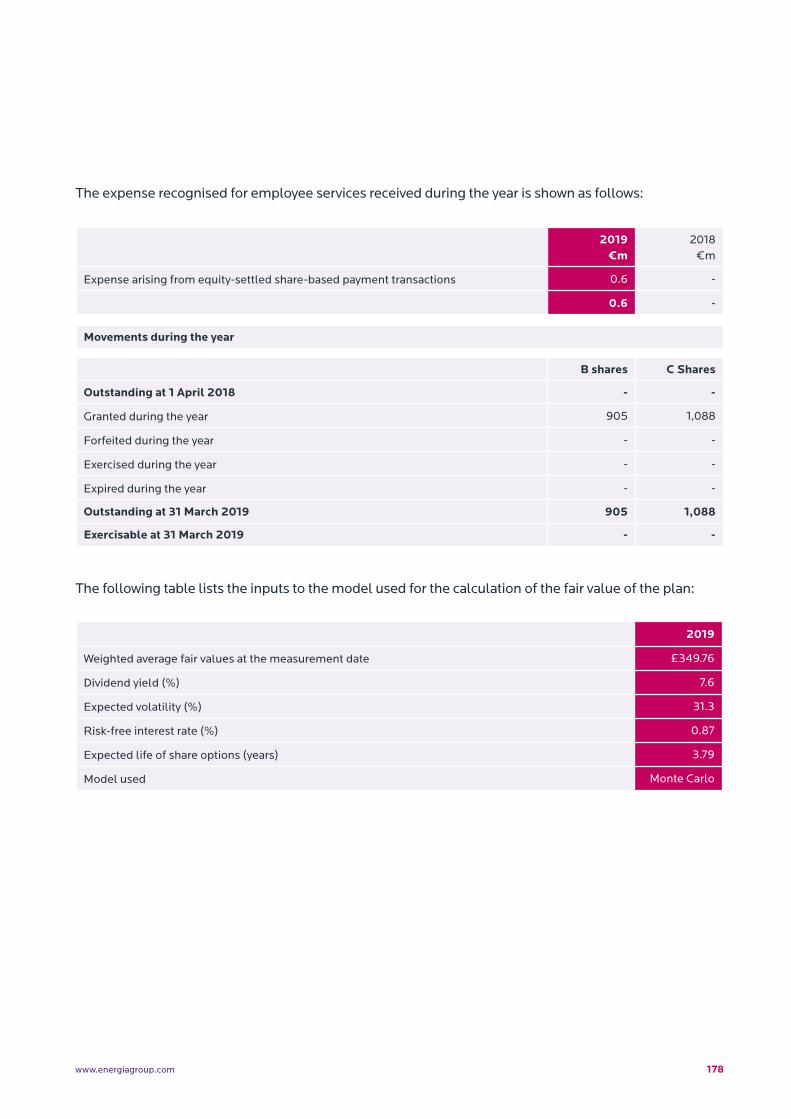
178www.energiagroup.com
2019 €m
2018 €m
Expense arising from equity-settled share-based payment transactions 0.6 -
0.6 -
Movements during the year
B shares C Shares
Outstanding at 1 April 2018 - -
Granted during the year 905 1,088
Forfeited during the year - -
Exercised during the year - -
Expired during the year - -
Outstanding at 31 March 2019 905 1,088
Exercisable at 31 March 2019 - -
The expense recognised for employee services received during the year is shown as follows:
The following table lists the inputs to the model used for the calculation of the fair value of the plan:
2019
Weighted average fair values at the measurement date £349.76
Dividend yield (%) 7.6
Expected volatility (%) 31.3
Risk-free interest rate (%) 0.87
Expected life of share options (years) 3.79
Model used Monte Carlo
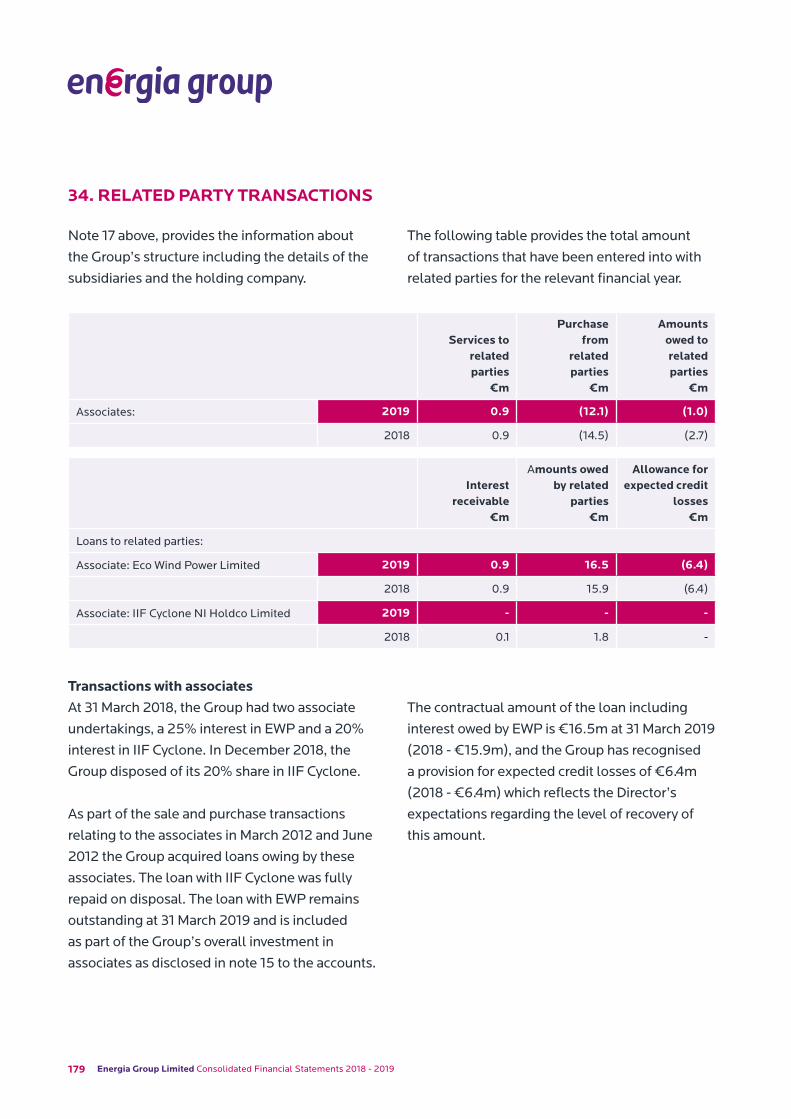
179 Energia Group Limited Consolidated Financial Statements 2018 - 2019
34. RELATED PARTY TRANSACTIONS
Note 17 above, provides the information about
the Group’s structure including the details of the
subsidiaries and the holding company.
The following table provides the total amount
of transactions that have been entered into with
related parties for the relevant financial year.
Services torelatedparties
€m
Purchasefrom
relatedparties
€m
Amountsowed torelatedparties
€m
Associates: 2019 0.9 (12.1) (1.0)
2018 0.9 (14.5) (2.7)
Interest receivable
€m
Amounts owed by related
parties€m
Allowance for expected credit
losses€m
Loans to related parties:
Associate: Eco Wind Power Limited 2019 0.9 16.5 (6.4)
2018 0.9 15.9 (6.4)
Associate: IIF Cyclone NI Holdco Limited 2019 - - -
2018 0.1 1.8 -
Transactions with associatesAt 31 March 2018, the Group had two associate
undertakings, a 25% interest in EWP and a 20%
interest in IIF Cyclone. In December 2018, the
Group disposed of its 20% share in IIF Cyclone.
As part of the sale and purchase transactions
relating to the associates in March 2012 and June
2012 the Group acquired loans owing by these
associates. The loan with IIF Cyclone was fully
repaid on disposal. The loan with EWP remains
outstanding at 31 March 2019 and is included
as part of the Group’s overall investment in
associates as disclosed in note 15 to the accounts.
The contractual amount of the loan including
interest owed by EWP is €16.5m at 31 March 2019
(2018 - €15.9m), and the Group has recognised
a provision for expected credit losses of €6.4m
(2018 - €6.4m) which reflects the Director’s
expectations regarding the level of recovery of
this amount.
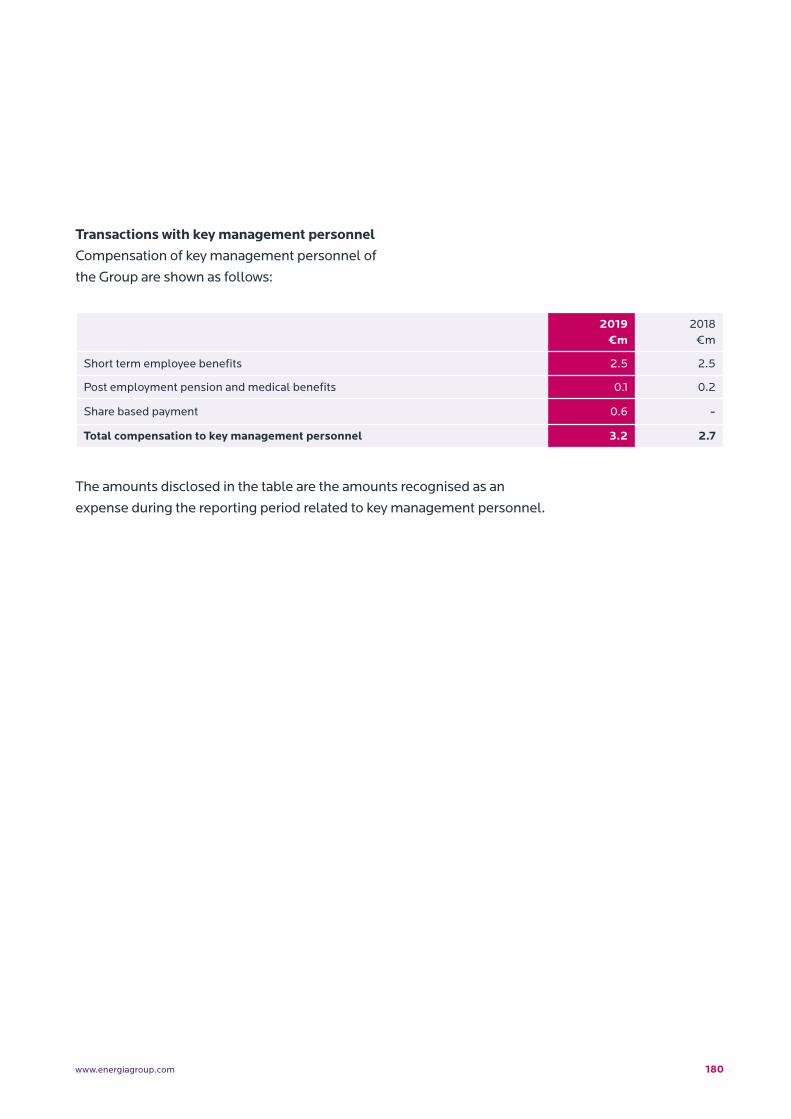
180www.energiagroup.com
2019 €m
2018 €m
Short term employee benefits 2.5 2.5
Post employment pension and medical benefits 0.1 0.2
Share based payment 0.6 -
Total compensation to key management personnel 3.2 2.7
The amounts disclosed in the table are the amounts recognised as an
expense during the reporting period related to key management personnel.
Transactions with key management personnelCompensation of key management personnel of
the Group are shown as follows:

181 Energia Group Limited Consolidated Financial Statements 2018 - 2019
ASSETS31 March
2017Audited
€m
IFRS adjustments
€m
Restated 1 April
2017Audited
€m
Non-current assets:
Property, plant and equipment 582.1 - 582.1
Intangible assets 646.0 5.3 651.3
Investment in associates 7.2 - 7.2
Derivative financial instruments 23.4 - 23.4
Other non-current financial assets 0.1 - 0.1
Deferred tax assets 32.0 - 32.0
1,290.8 5.3 1,296.1
Current assets:
Inventories 5.6 - 5.6
Trade and other receivables 175.5 - 175.5
Derivative financial instruments 11.8 - 11.8
Other current financial assets 4.4 - 4.4
Cash and cash equivalents 140.5 - 140.5
337.8 - 337.8
TOTAL ASSETS 1,628.6 5.3 1,633.9
35. NEW ACCOUNTING STANDARDS, INTERPRETATIONS AND AMENDMENTS ADOPTED BY THE GROUP
Analysis of IFRS adjustments to the Group Balance Sheet at 1 April 2017
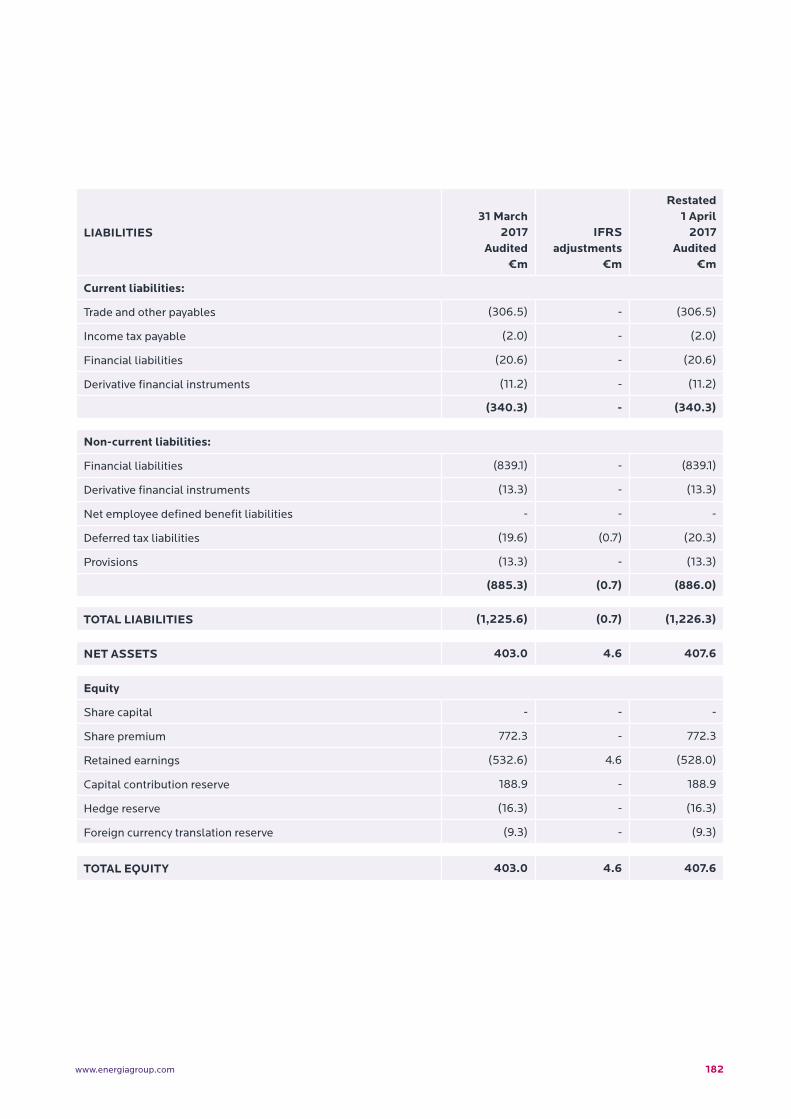
182www.energiagroup.com
LIABILITIES31 March
2017Audited
€m
IFRS adjustments
€m
Restated 1 April
2017Audited
€m
Current liabilities:
Trade and other payables (306.5) - (306.5)
Income tax payable (2.0) - (2.0)
Financial liabilities (20.6) - (20.6)
Derivative financial instruments (11.2) - (11.2)
(340.3) - (340.3)
Non-current liabilities:
Financial liabilities (839.1) - (839.1)
Derivative financial instruments (13.3) - (13.3)
Net employee defined benefit liabilities - - -
Deferred tax liabilities (19.6) (0.7) (20.3)
Provisions (13.3) - (13.3)
(885.3) (0.7) (886.0)
TOTAL LIABILITIES (1,225.6) (0.7) (1,226.3)
NET ASSETS 403.0 4.6 407.6
Equity
Share capital - - -
Share premium 772.3 - 772.3
Retained earnings (532.6) 4.6 (528.0)
Capital contribution reserve 188.9 - 188.9
Hedge reserve (16.3) - (16.3)
Foreign currency translation reserve (9.3) - (9.3)
TOTAL EQUITY 403.0 4.6 407.6
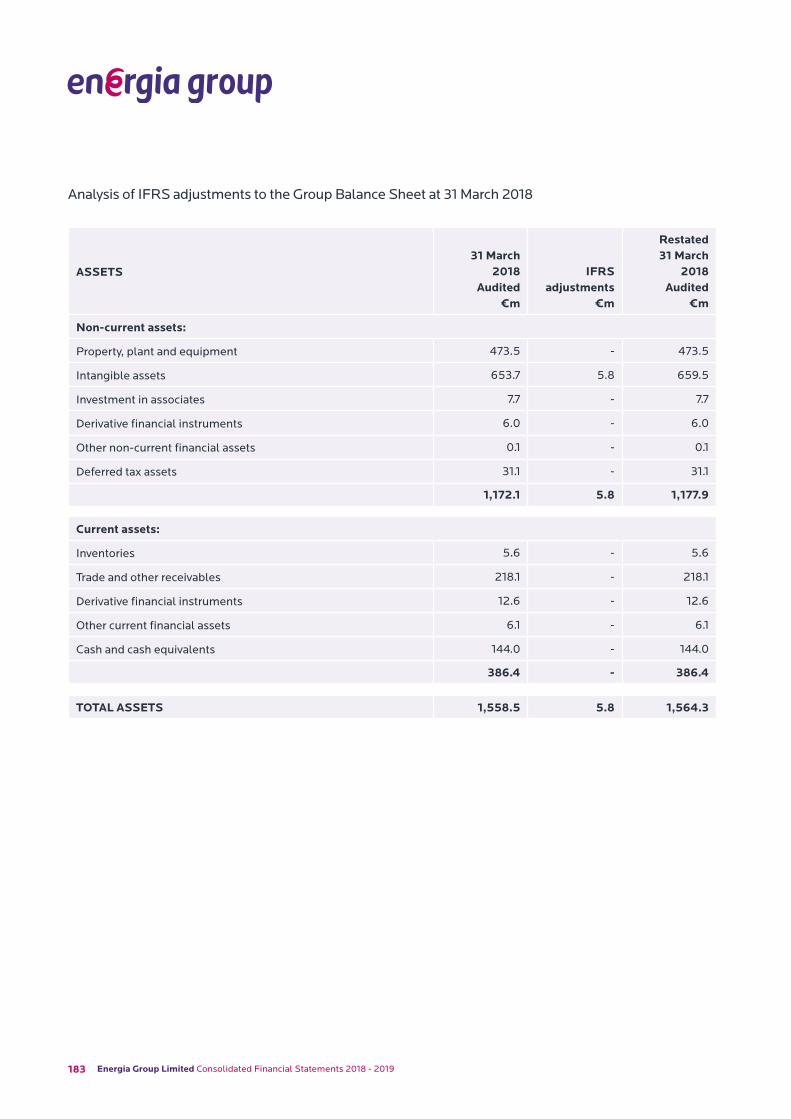
183 Energia Group Limited Consolidated Financial Statements 2018 - 2019
ASSETS31 March
2018Audited
€m
IFRS adjustments
€m
Restated 31 March
2018Audited
€m
Non-current assets:
Property, plant and equipment 473.5 - 473.5
Intangible assets 653.7 5.8 659.5
Investment in associates 7.7 - 7.7
Derivative financial instruments 6.0 - 6.0
Other non-current financial assets 0.1 - 0.1
Deferred tax assets 31.1 - 31.1
1,172.1 5.8 1,177.9
Current assets:
Inventories 5.6 - 5.6
Trade and other receivables 218.1 - 218.1
Derivative financial instruments 12.6 - 12.6
Other current financial assets 6.1 - 6.1
Cash and cash equivalents 144.0 - 144.0
386.4 - 386.4
TOTAL ASSETS 1,558.5 5.8 1,564.3
Analysis of IFRS adjustments to the Group Balance Sheet at 31 March 2018
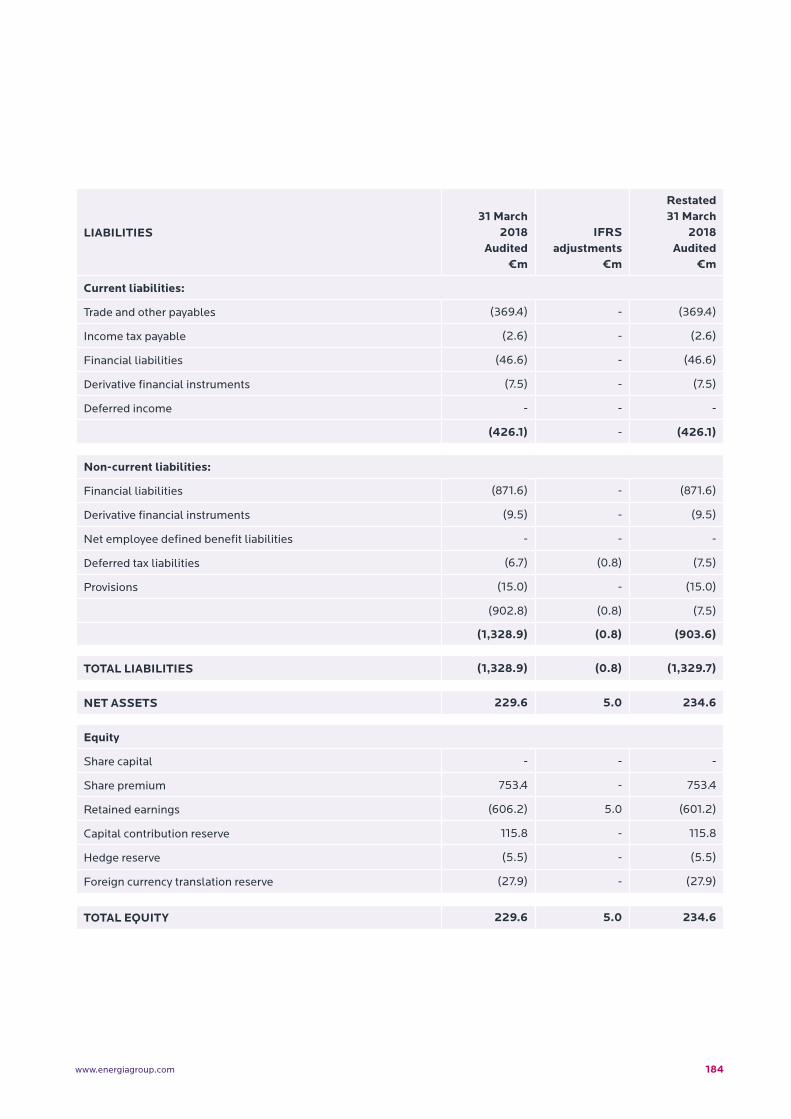
184www.energiagroup.com
LIABILITIES31 March
2018Audited
€m
IFRS adjustments
€m
Restated 31 March
2018Audited
€m
Current liabilities:
Trade and other payables (369.4) - (369.4)
Income tax payable (2.6) - (2.6)
Financial liabilities (46.6) - (46.6)
Derivative financial instruments (7.5) - (7.5)
Deferred income - - -
(426.1) - (426.1)
Non-current liabilities:
Financial liabilities (871.6) - (871.6)
Derivative financial instruments (9.5) - (9.5)
Net employee defined benefit liabilities - - -
Deferred tax liabilities (6.7) (0.8) (7.5)
Provisions (15.0) - (15.0)
(902.8) (0.8) (7.5)
(1,328.9) (0.8) (903.6)
TOTAL LIABILITIES (1,328.9) (0.8) (1,329.7)
NET ASSETS 229.6 5.0 234.6
Equity
Share capital - - -
Share premium 753.4 - 753.4
Retained earnings (606.2) 5.0 (601.2)
Capital contribution reserve 115.8 - 115.8
Hedge reserve (5.5) - (5.5)
Foreign currency translation reserve (27.9) - (27.9)
TOTAL EQUITY 229.6 5.0 234.6
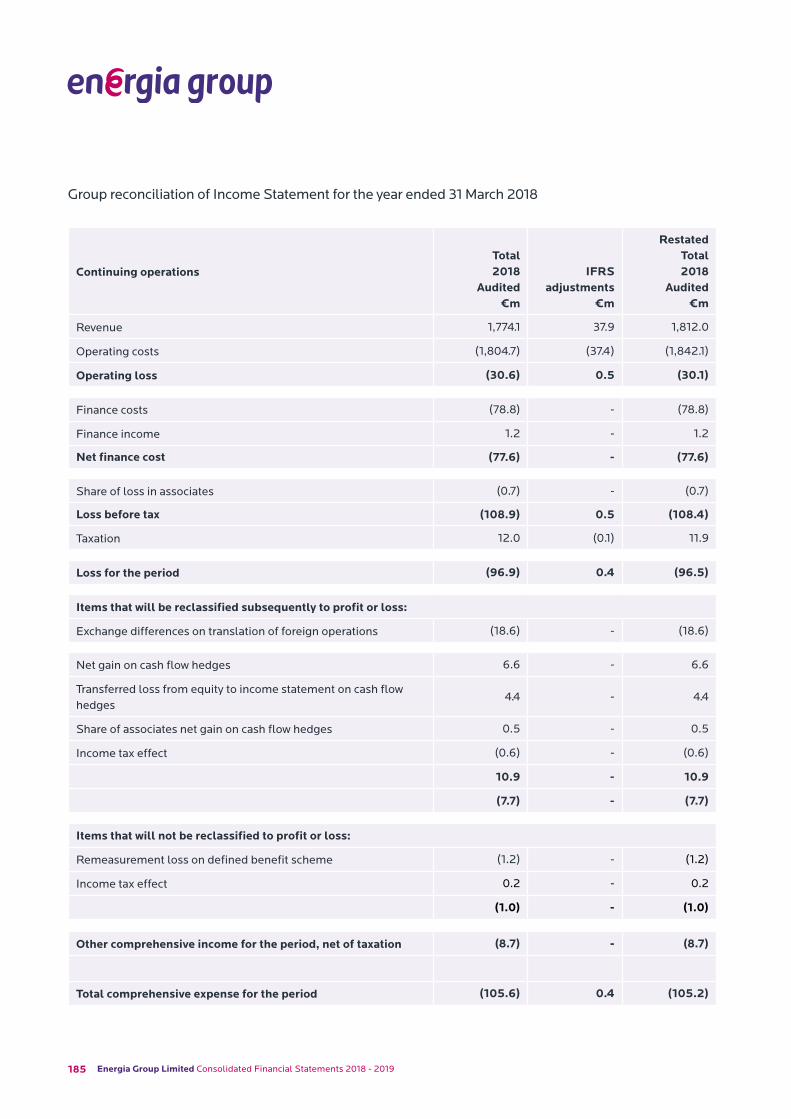
185 Energia Group Limited Consolidated Financial Statements 2018 - 2019
Continuing operationsTotal2018
Audited€m
IFRS adjustments
€m
Restated Total2018
Audited€m
Revenue 1,774.1 37.9 1,812.0
Operating costs (1,804.7) (37.4) (1,842.1)
Operating loss (30.6) 0.5 (30.1)
Finance costs (78.8) - (78.8)
Finance income 1.2 - 1.2
Net finance cost (77.6) - (77.6)
Share of loss in associates (0.7) - (0.7)
Loss before tax (108.9) 0.5 (108.4)
Taxation 12.0 (0.1) 11.9
Loss for the period (96.9) 0.4 (96.5)
Items that will be reclassified subsequently to profit or loss:
Exchange differences on translation of foreign operations (18.6) - (18.6)
Net gain on cash flow hedges 6.6 - 6.6
Transferred loss from equity to income statement on cash flow hedges
4.4 - 4.4
Share of associates net gain on cash flow hedges 0.5 - 0.5
Income tax effect (0.6) - (0.6)
10.9 - 10.9
(7.7) - (7.7)
Items that will not be reclassified to profit or loss:
Remeasurement loss on defined benefit scheme (1.2) - (1.2)
Income tax effect 0.2 - 0.2
(1.0) - (1.0)
Other comprehensive income for the period, net of taxation (8.7) - (8.7)
Total comprehensive expense for the period (105.6) 0.4 (105.2)
Group reconciliation of Income Statement for the year ended 31 March 2018

186www.energiagroup.com

187 Energia Group Limited Consolidated Financial Statements 2018 - 2019
188www.energiagroup.com 188
Appendix (unaudited)
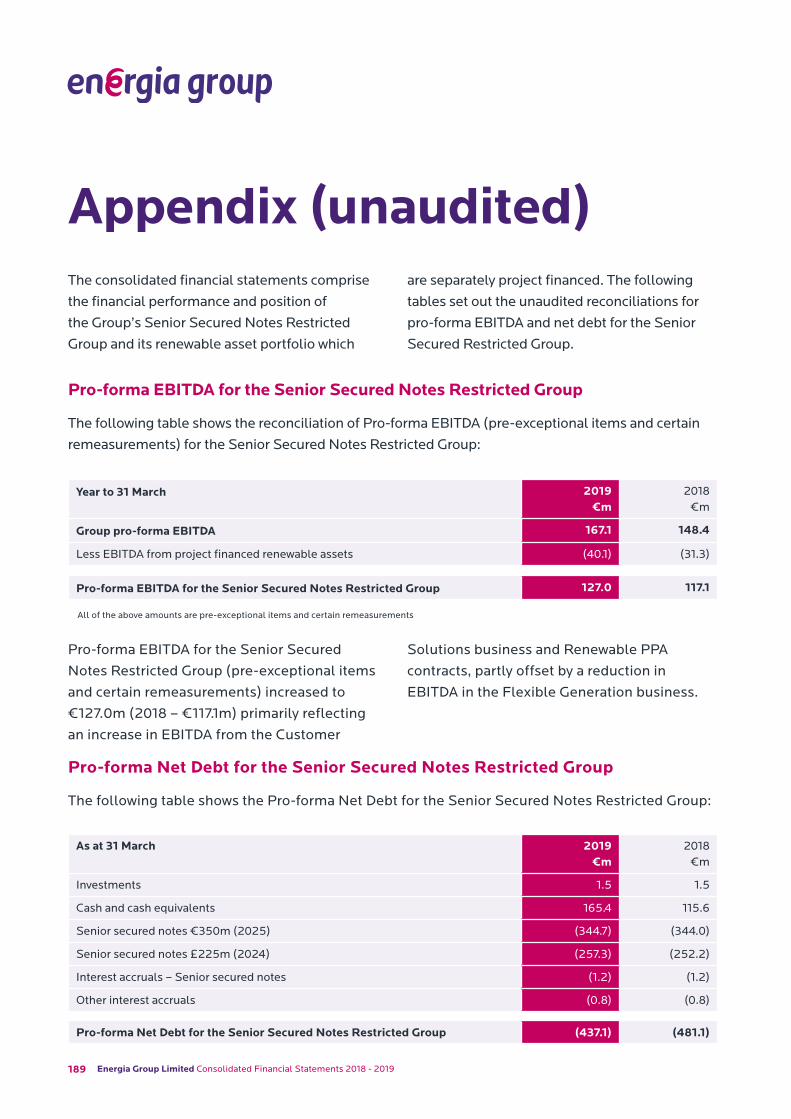
189 Energia Group Limited Consolidated Financial Statements 2018 - 2019
Appendix (unaudited)The consolidated financial statements comprise
the financial performance and position of
the Group’s Senior Secured Notes Restricted
Group and its renewable asset portfolio which
are separately project financed. The following
tables set out the unaudited reconciliations for
pro-forma EBITDA and net debt for the Senior
Secured Restricted Group.
Pro-forma EBITDA for the Senior Secured Notes Restricted Group
The following table shows the reconciliation of Pro-forma EBITDA (pre-exceptional items and certain
remeasurements) for the Senior Secured Notes Restricted Group:
Pro-forma EBITDA for the Senior Secured
Notes Restricted Group (pre-exceptional items
and certain remeasurements) increased to
€127.0m (2018 – €117.1m) primarily reflecting
an increase in EBITDA from the Customer
Solutions business and Renewable PPA
contracts, partly offset by a reduction in
EBITDA in the Flexible Generation business.
Year to 31 March 2019 €m
2018 €m
Group pro-forma EBITDA 167.1 148.4
Less EBITDA from project financed renewable assets (40.1) (31.3)
Pro-forma EBITDA for the Senior Secured Notes Restricted Group 127.0 117.1
All of the above amounts are pre-exceptional items and certain remeasurements
Pro-forma Net Debt for the Senior Secured Notes Restricted Group
The following table shows the Pro-forma Net Debt for the Senior Secured Notes Restricted Group:
As at 31 March 2019 €m
2018 €m
Investments 1.5 1.5
Cash and cash equivalents 165.4 115.6
Senior secured notes €350m (2025) (344.7) (344.0)
Senior secured notes £225m (2024) (257.3) (252.2)
Interest accruals – Senior secured notes (1.2) (1.2)
Other interest accruals (0.8) (0.8)
Pro-forma Net Debt for the Senior Secured Notes Restricted Group (437.1) (481.1)
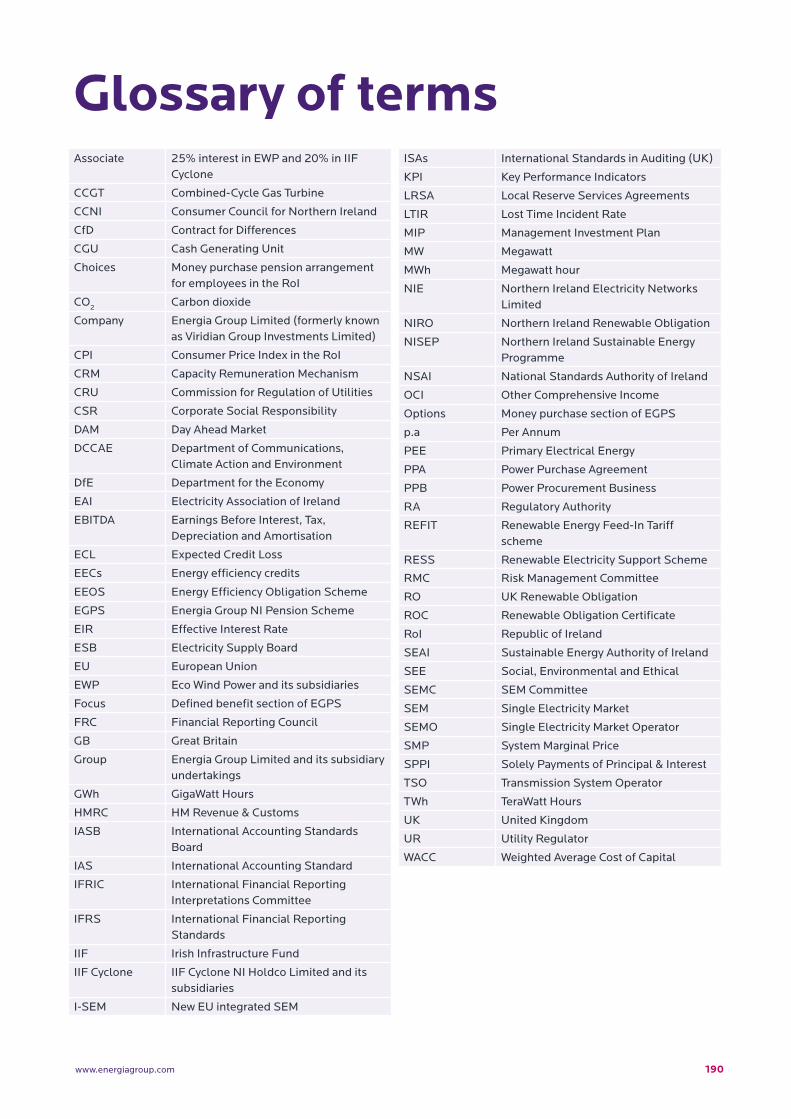
190www.energiagroup.com
Glossary of terms Associate 25% interest in EWP and 20% in IIF
Cyclone
CCGT Combined-Cycle Gas Turbine
CCNI Consumer Council for Northern Ireland
CfD Contract for Differences
CGU Cash Generating Unit
Choices Money purchase pension arrangement for employees in the RoI
CO2
Carbon dioxide
Company Energia Group Limited (formerly known as Viridian Group Investments Limited)
CPI Consumer Price Index in the RoI
CRM Capacity Remuneration Mechanism
CRU Commission for Regulation of Utilities
CSR Corporate Social Responsibility
DAM Day Ahead Market
DCCAE Department of Communications, Climate Action and Environment
DfE Department for the Economy
EAI Electricity Association of Ireland
EBITDA Earnings Before Interest, Tax, Depreciation and Amortisation
ECL Expected Credit Loss
EECs Energy efficiency credits
EEOS Energy Efficiency Obligation Scheme
EGPS Energia Group NI Pension Scheme
EIR Effective Interest Rate
ESB Electricity Supply Board
EU European Union
EWP Eco Wind Power and its subsidiaries
Focus Defined benefit section of EGPS
FRC Financial Reporting Council
GB Great Britain
Group Energia Group Limited and its subsidiary undertakings
GWh GigaWatt Hours
HMRC HM Revenue & Customs
IASB International Accounting Standards Board
IAS International Accounting Standard
IFRIC International Financial Reporting Interpretations Committee
IFRS International Financial Reporting Standards
IIF Irish Infrastructure Fund
IIF Cyclone IIF Cyclone NI Holdco Limited and its subsidiaries
I-SEM New EU integrated SEM
ISAs International Standards in Auditing (UK)
KPI Key Performance Indicators
LRSA Local Reserve Services Agreements
LTIR Lost Time Incident Rate
MIP Management Investment Plan
MW Megawatt
MWh Megawatt hour
NIE Northern Ireland Electricity Networks Limited
NIRO Northern Ireland Renewable Obligation
NISEP Northern Ireland Sustainable Energy Programme
NSAI National Standards Authority of Ireland
OCI Other Comprehensive Income
Options Money purchase section of EGPS
p.a Per Annum
PEE Primary Electrical Energy
PPA Power Purchase Agreement
PPB Power Procurement Business
RA Regulatory Authority
REFIT Renewable Energy Feed-In Tariff scheme
RESS Renewable Electricity Support Scheme
RMC Risk Management Committee
RO UK Renewable Obligation
ROC Renewable Obligation Certificate
RoI Republic of Ireland
SEAI Sustainable Energy Authority of Ireland
SEE Social, Environmental and Ethical
SEMC SEM Committee
SEM Single Electricity Market
SEMO Single Electricity Market Operator
SMP System Marginal Price
SPPI Solely Payments of Principal & Interest
TSO Transmission System Operator
TWh TeraWatt Hours
UK United Kingdom
UR Utility Regulator
WACC Weighted Average Cost of Capital
193 Energia Group Limited Consolidated Financial Statements 2018 - 2019
Registered office:
PO Box 309
Ugland House
Grand Cayman
KY1-1104
Cayman Islands
Registered Number: 192375
Energia Group Limited(Formerly known as Viridian Group Investments Limited
www.energiagroup.com