Embed Size (px)
Citation preview
1
Financial Year 2004 Final Results Presentation
19 August 2004
2
Market Overview and Financial Results
Tom HonanChief Financial Officer
3
Summary of Results
Normalised EPS (pre goodwill) of 19.0 cents, up 61%.Operating Cash Flows of $136.1m, up 79%.Total revenue of $894.7m, up 24% or up 5% excluding FY04 acquisitions.Operating Costs (excluding FY04 acquisitions, & cost of sales) of $457.8m, down 1%.Days Sales Outstanding at 57 days.Final dividend increased to 5 cents per share (fully franked)
4
Context of Results
Significant gains in Revenue, Net Profit, Earnings per Share and Cash Flows.Increased revenues reflect improved market conditions (especially in the Asia Pacific region) and the contribution from FY04 acquisitions.Significantly improved profit contribution from North America. Delivered expected cost savings from FY03 restructuring.Continued focus on capital management.
5
This presentation is structured around the following framework
MarketOverview
FinancialResults
CEO’s Report
6
CPU Revenues are driven by multiple factorsMarket
Overview
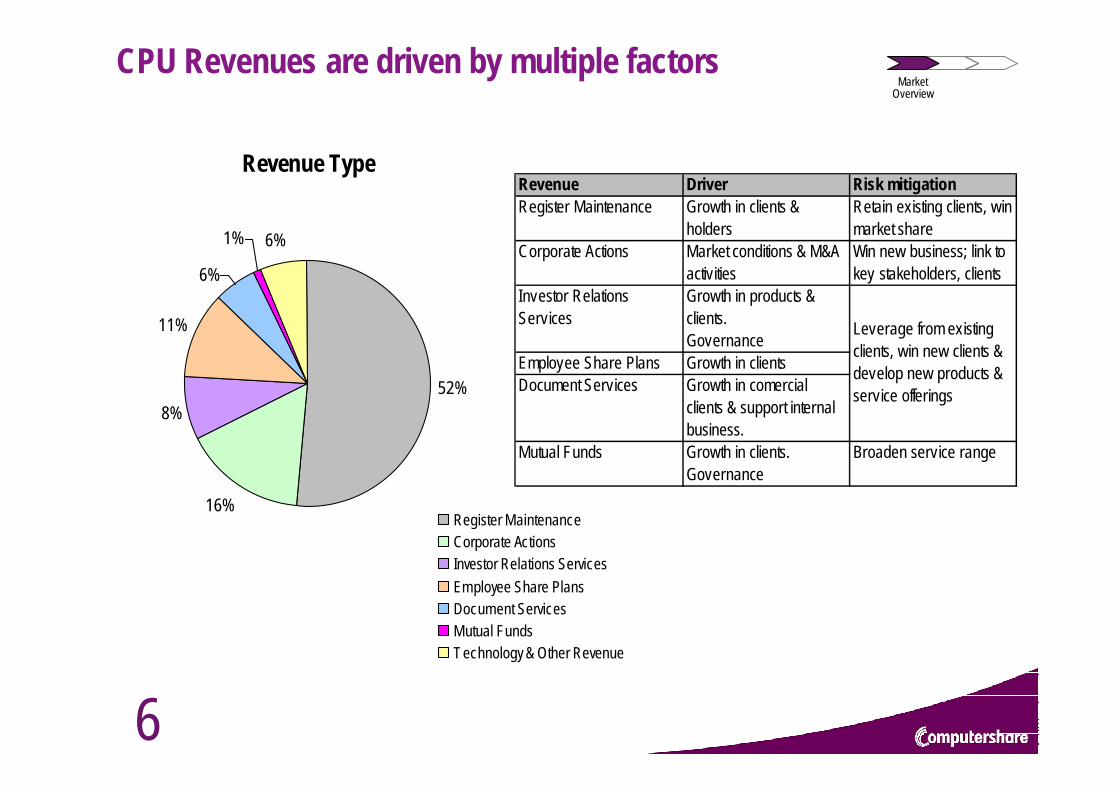
Revenue Type
52%
16%
11%
6%
1% 6%
8%
Register MaintenanceCorporate ActionsInvestor Relations ServicesEmployee Share PlansDocument ServicesMutual FundsTechnology & Other Revenue
Revenue Driver Risk mitigationRegister Maintenance Growth in clients &
holdersRetain existing clients, win market share
Investor Relations Services
Growth in products & clients.Governance
Employee Share Plans Growth in clientsDocument Services Growth in comercial
clients & support internal business.
Mutual Funds Growth in clients.Governance
Broaden service range
Corporate Actions Market conditions & M&A activities
Win new business; link to key stakeholders, clients
Leverage from existing clients, win new clients & develop new products & service offerings
7
Global Equities MarketMarket
Overview
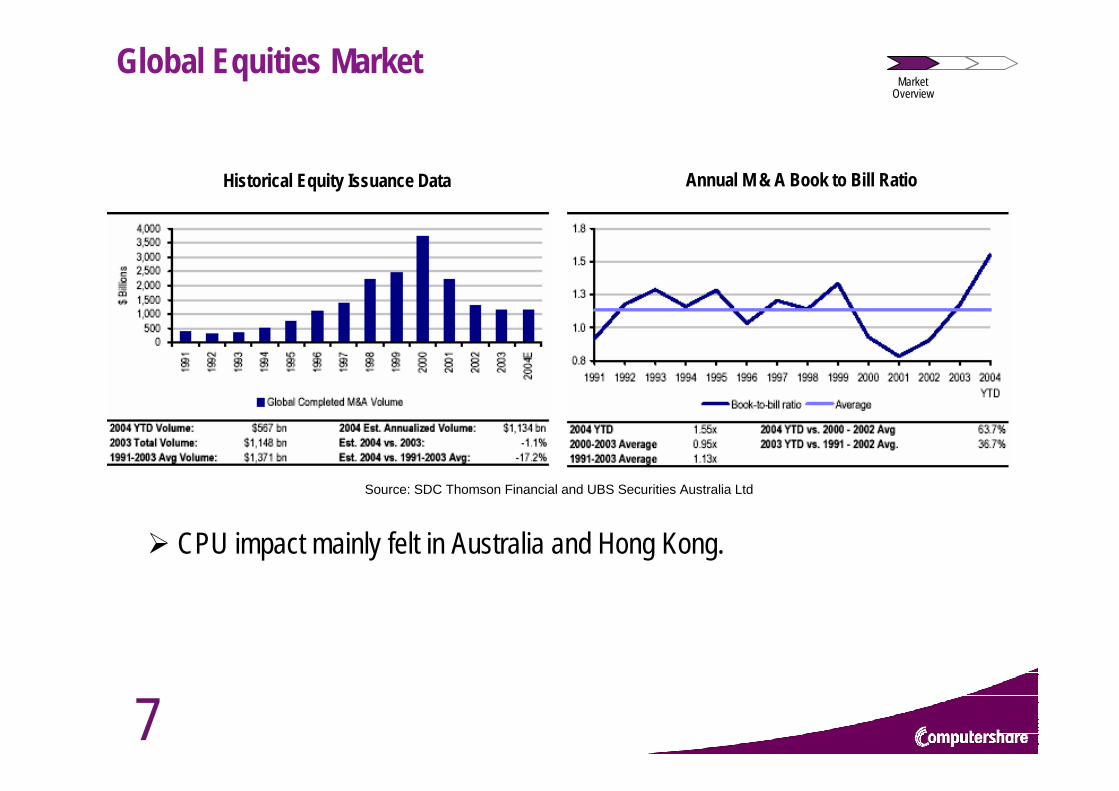
CPU impact mainly felt in Australia and Hong Kong.
Historical Equity Issuance Data Annual M & A Book to Bill Ratio
Source: SDC Thomson Financial and UBS Securities Australia Ltd
8
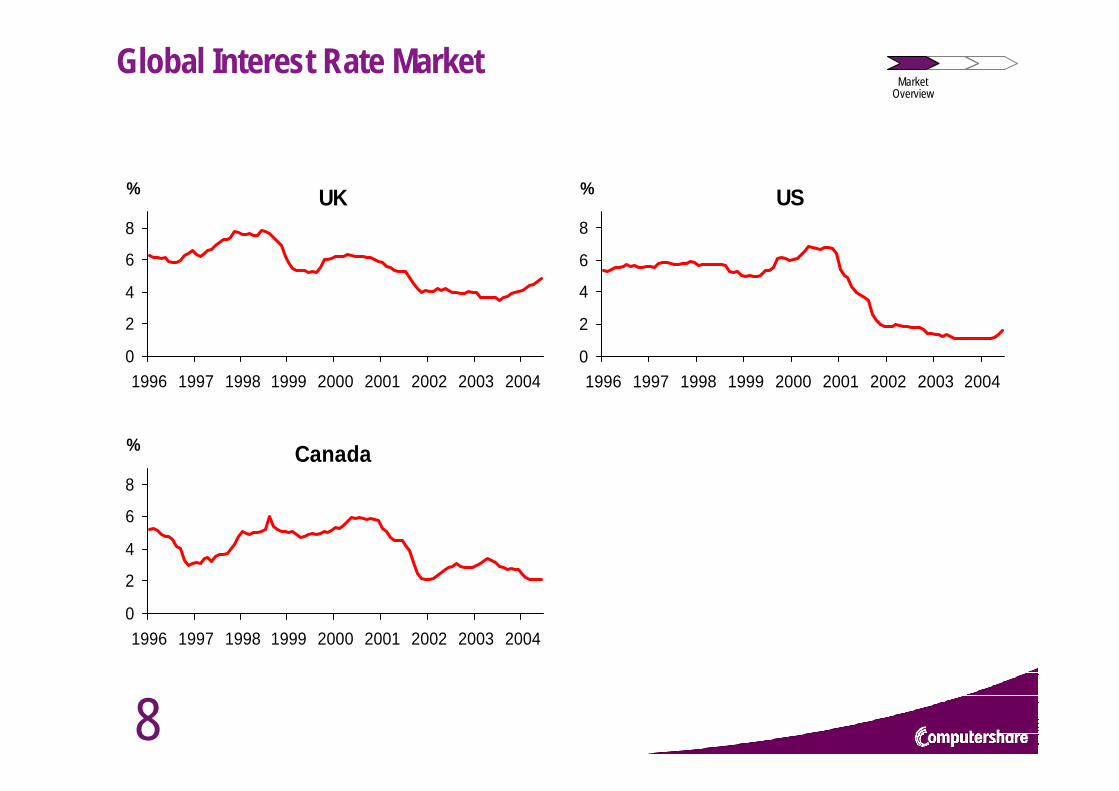
Global Interest Rate MarketMarket
Overview
US
0
2
4
6
8
1996 1997 1998 1999 2000 2001 2002 2003 2004
%UK
0
2
4
6
8
1996 1997 1998 1999 2000 2001 2002 2003 2004
%
Canada
0
2
4
6
8
1996 1997 1998 1999 2000 2001 2002 2003 2004
%
9
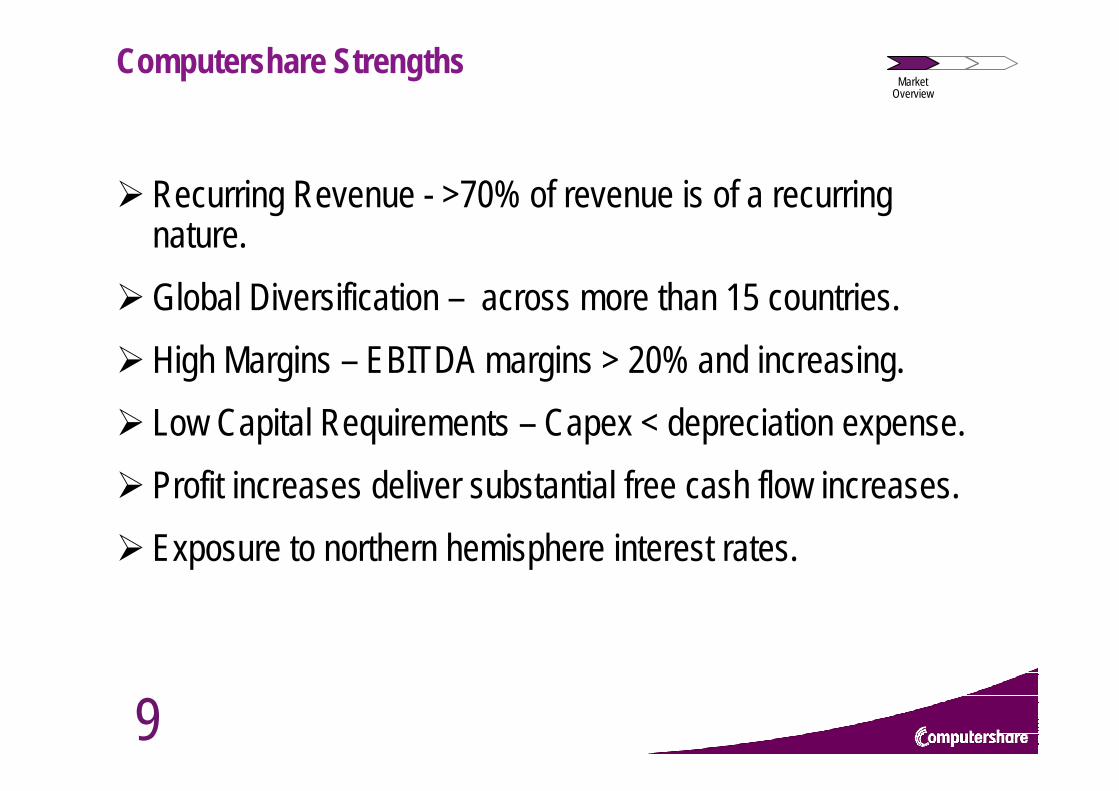
Computershare Strengths
Recurring Revenue - >70% of revenue is of a recurring nature.Global Diversification – across more than 15 countries.High Margins – EBITDA margins > 20% and increasing.Low Capital Requirements – Capex < depreciation expense.Profit increases deliver substantial free cash flow increases.Exposure to northern hemisphere interest rates.
Market Overview
10
MarketOverview
FinancialResults
CEO’s Report
11
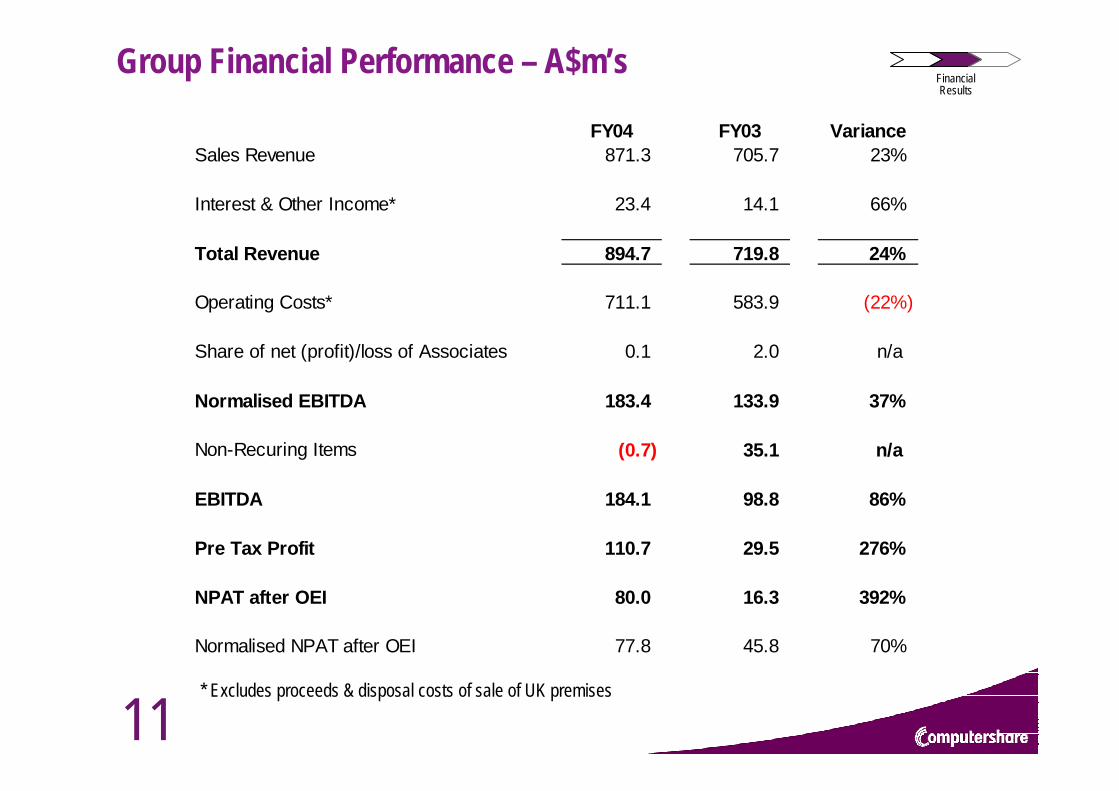
Group Financial Performance – A$m’sFinancialResults
FY04 FY03 VarianceSales Revenue 871.3 705.7 23%
Interest & Other Income* 23.4 14.1 66%
Total Revenue 894.7 719.8 24%
Operating Costs* 711.1 583.9 (22%)
Share of net (profit)/loss of Associates 0.1 2.0 n/a
Normalised EBITDA 183.4 133.9 37%
Non-Recuring Items (0.7) 35.1 n/a
EBITDA 184.1 98.8 86%
Pre Tax Profit 110.7 29.5 276%
NPAT after OEI 80.0 16.3 392%
Normalised NPAT after OEI 77.8 45.8 70%
* Excludes proceeds & disposal costs of sale of UK premises
12
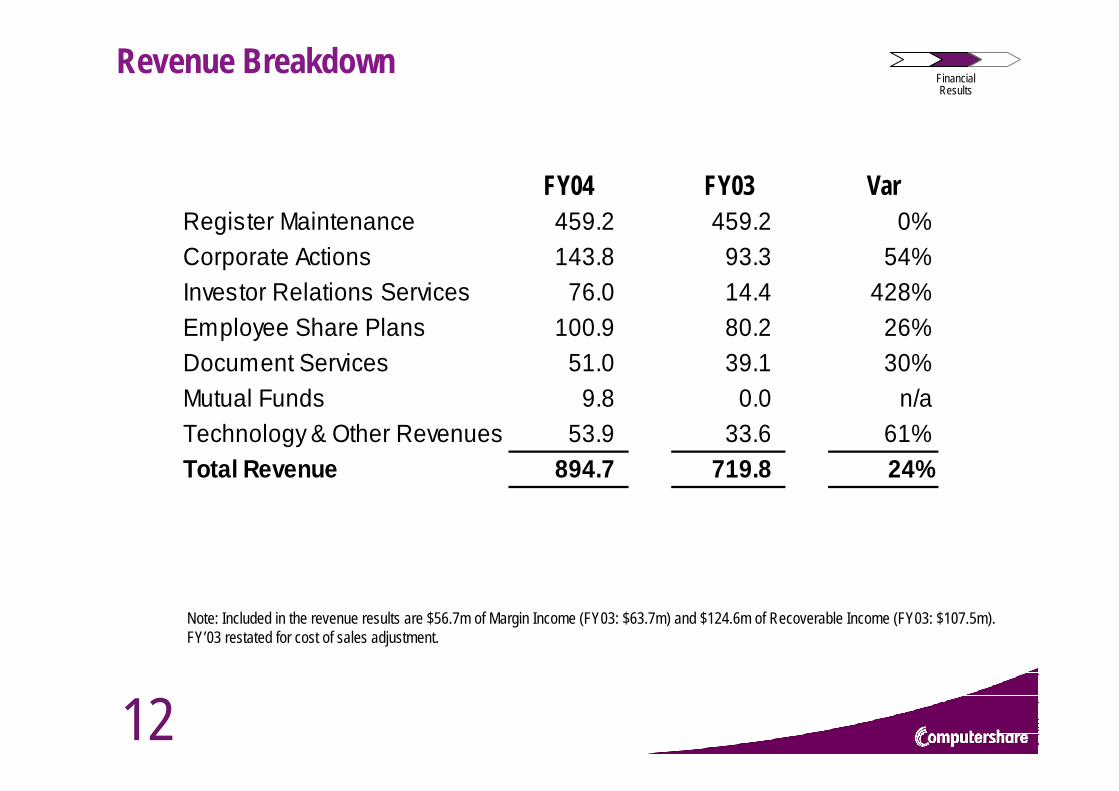
Revenue Breakdown
FY04 FY03 VarRegister Maintenance 459.2 459.2 0%Corporate Actions 143.8 93.3 54%Investor Relations Services 76.0 14.4 428%Employee Share Plans 100.9 80.2 26%Document Services 51.0 39.1 30%Mutual Funds 9.8 0.0 n/aTechnology & Other Revenues 53.9 33.6 61%Total Revenue 894.7 719.8 24%
Note: Included in the revenue results are $56.7m of Margin Income (FY03: $63.7m) and $124.6m of Recoverable Income (FY03: $107.5m).FY’03 restated for cost of sales adjustment.
FinancialResults
13
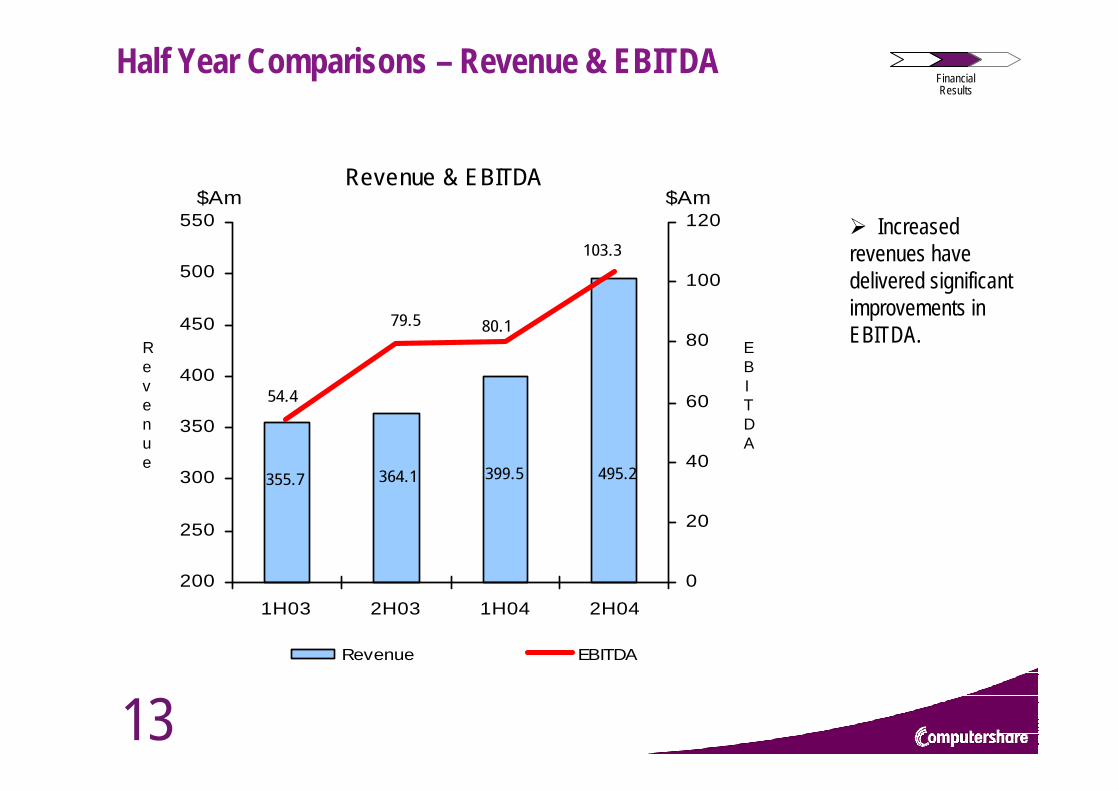
Half Year Comparisons – Revenue & EBITDAFinancialResults
Revenue & EBITDA
355.7 495.2399.5364.1
80.1
103.3
79.5
54.4
200
250
300
350
400
450
500
550
1H03 2H03 1H04 2H04
$Am
0
20
40
60
80
100
120$Am
Revenue EBITDA
Revenue
EBITDA
Increased revenues have delivered significant improvements in EBITDA.
14
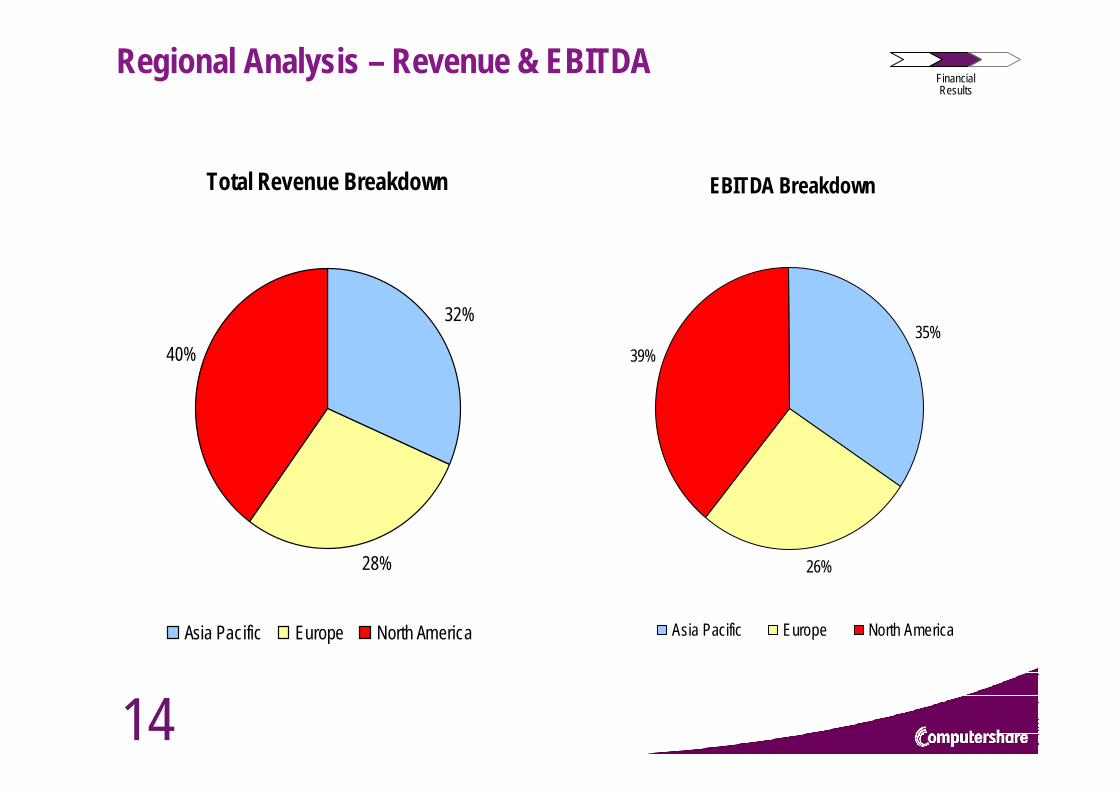
Regional Analysis – Revenue & EBITDA
Total Revenue Breakdown
32%
28%
40%
Asia Pacific Europe North America
EBITDA Breakdown
35%
26%
39%
Asia Pacific Europe North America
FinancialResults
15
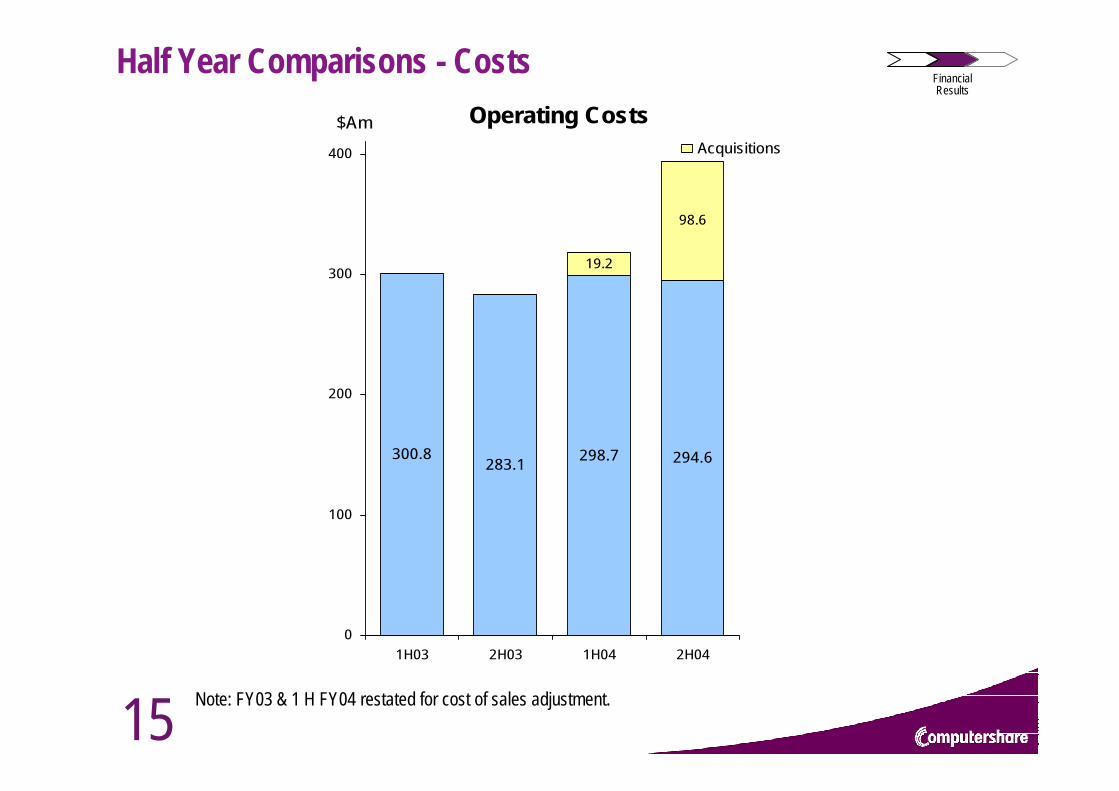
Half Year Comparisons - CostsOperating Costs
300.8283.1 294.6
19.2
98.6
298.7
0
100
200
300
400
1H03 2H03 1H04 2H04
$AmAcquisitions
FinancialResults
Note: FY03 & 1 H FY04 restated for cost of sales adjustment.
16
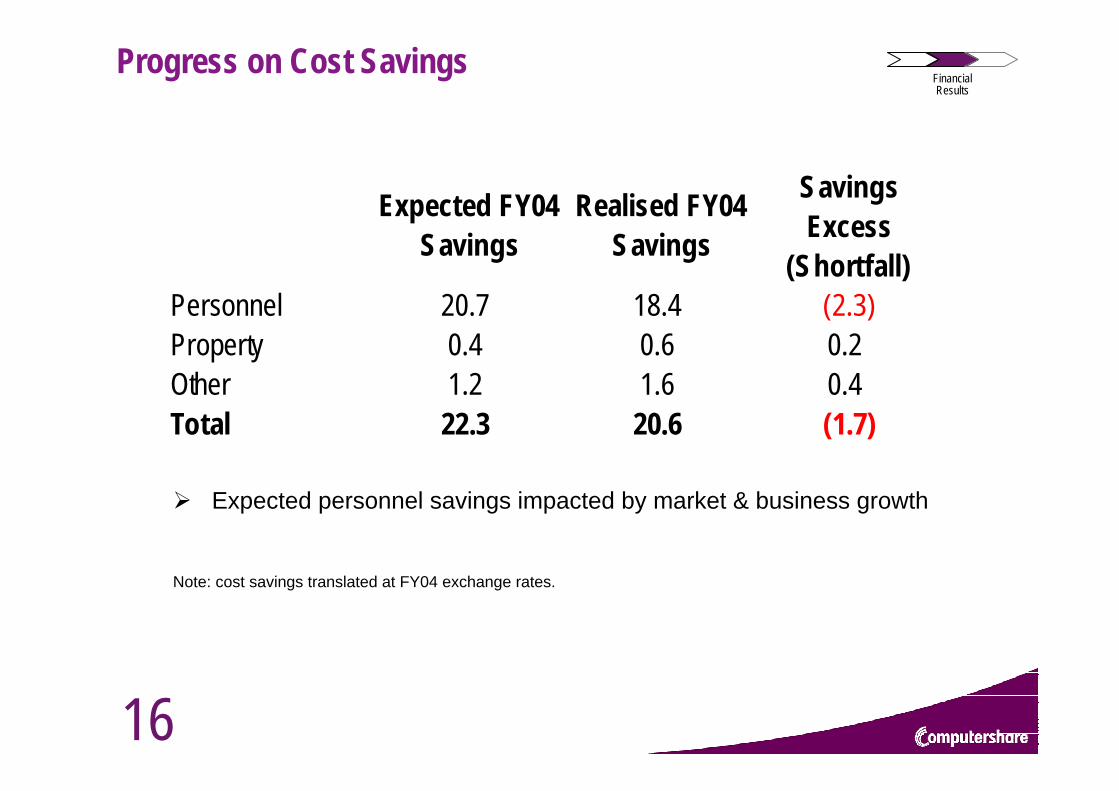
Progress on Cost Savings
Expected FY04 Savings
Realised FY04 Savings
Savings Excess
(Shortfall)Personnel 20.7 18.4 (2.3)Property 0.4 0.6 0.2Other 1.2 1.6 0.4Total 22.3 20.6 (1.7)
Expected personnel savings impacted by market & business growth
Note: cost savings translated at FY04 exchange rates.
FinancialResults
17
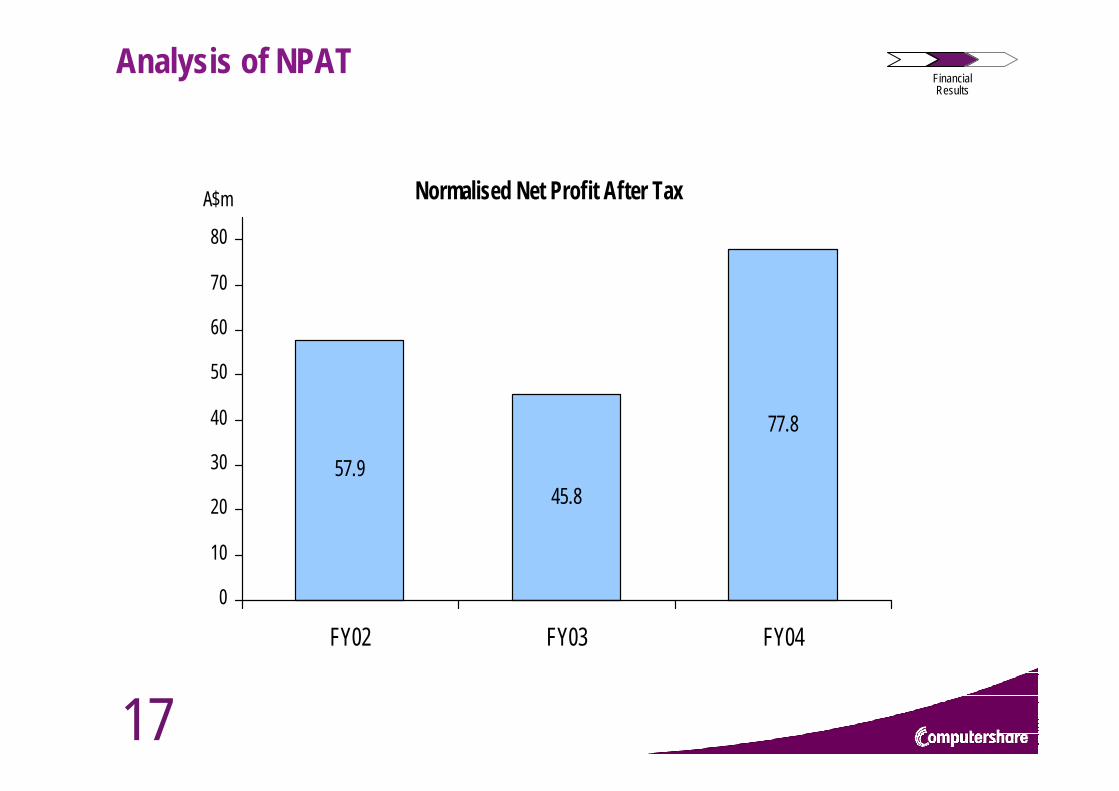
Analysis of NPATFinancialResults
Normalised Net Profit After Tax
57.945.8
77.8
0
10
20
30
40
50
60
70
80
FY02 FY03 FY04
A$m
18
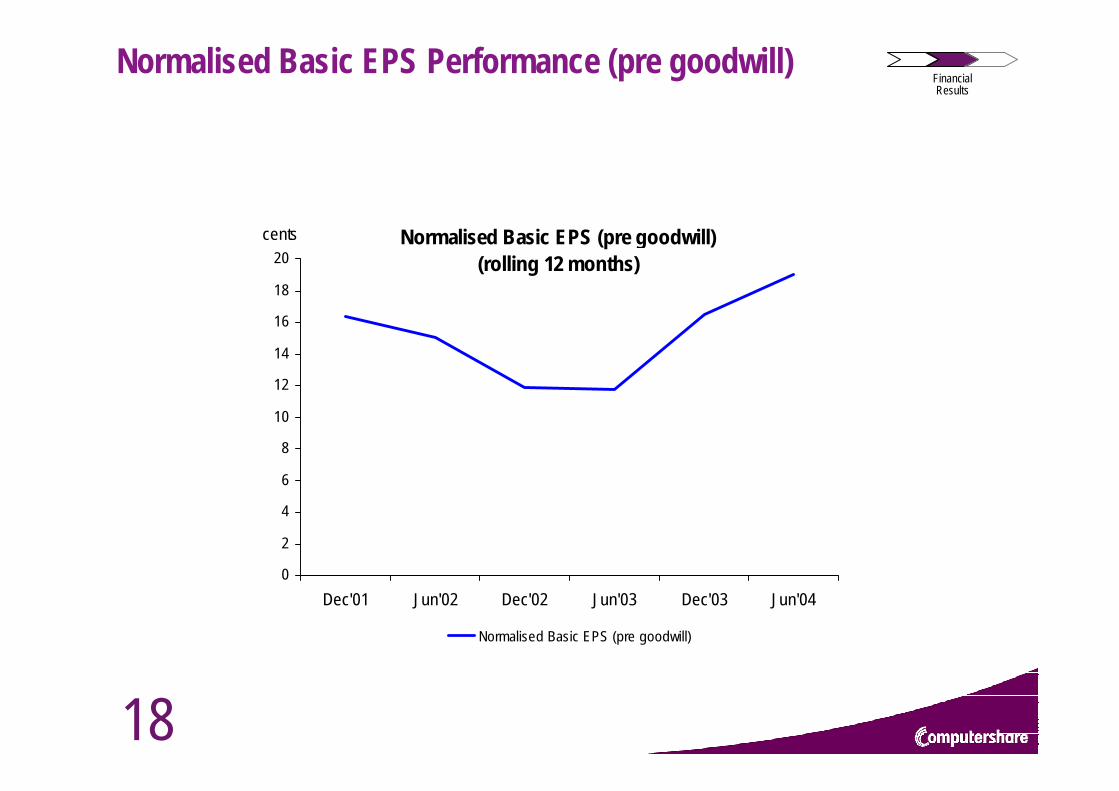
Normalised Basic EPS Performance (pre goodwill)FinancialResults
Normalised Basic EPS (pre goodwill) (rolling 12 months)
0
2
4
6
8
10
12
14
16
18
20
Dec'01 Jun'02 Dec'02 Jun'03 Dec'03 Jun'04
cents
Normalised Basic EPS (pre goodwill)
19
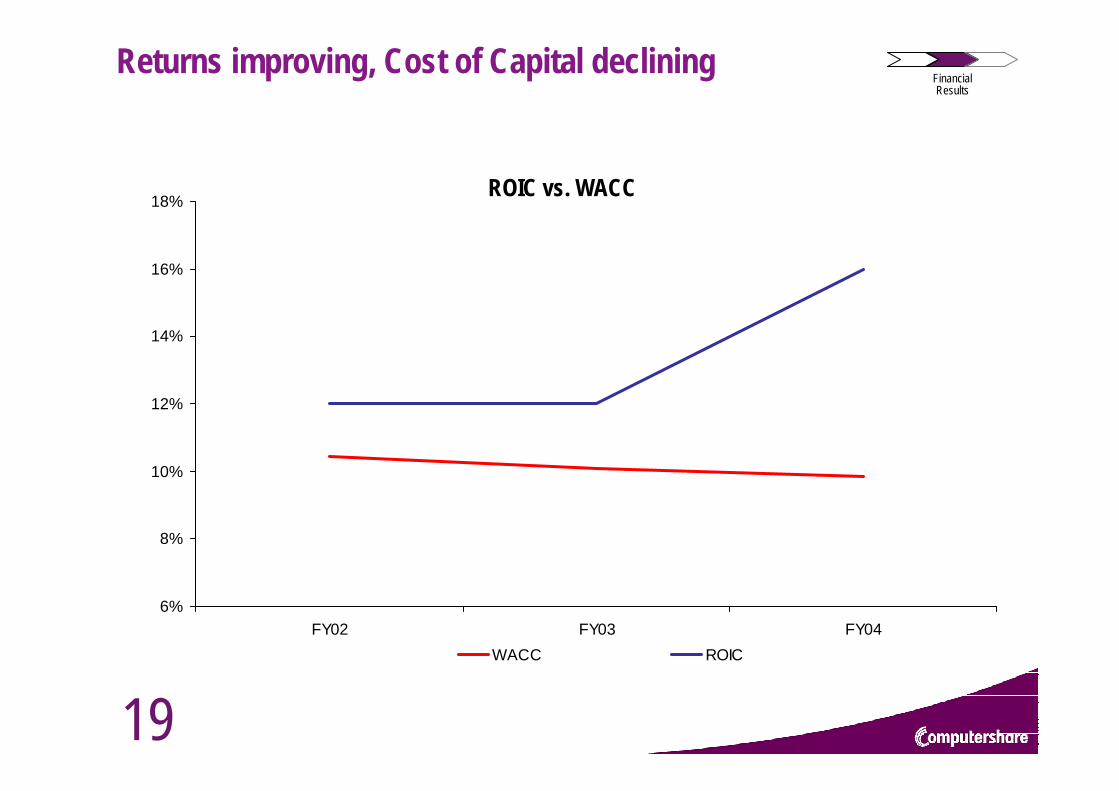
Returns improving, Cost of Capital declining
ROIC vs. WACC
FinancialResults
6%
8%
10%
12%
14%
16%
18%
FY02 FY03 FY04WACC ROIC
20
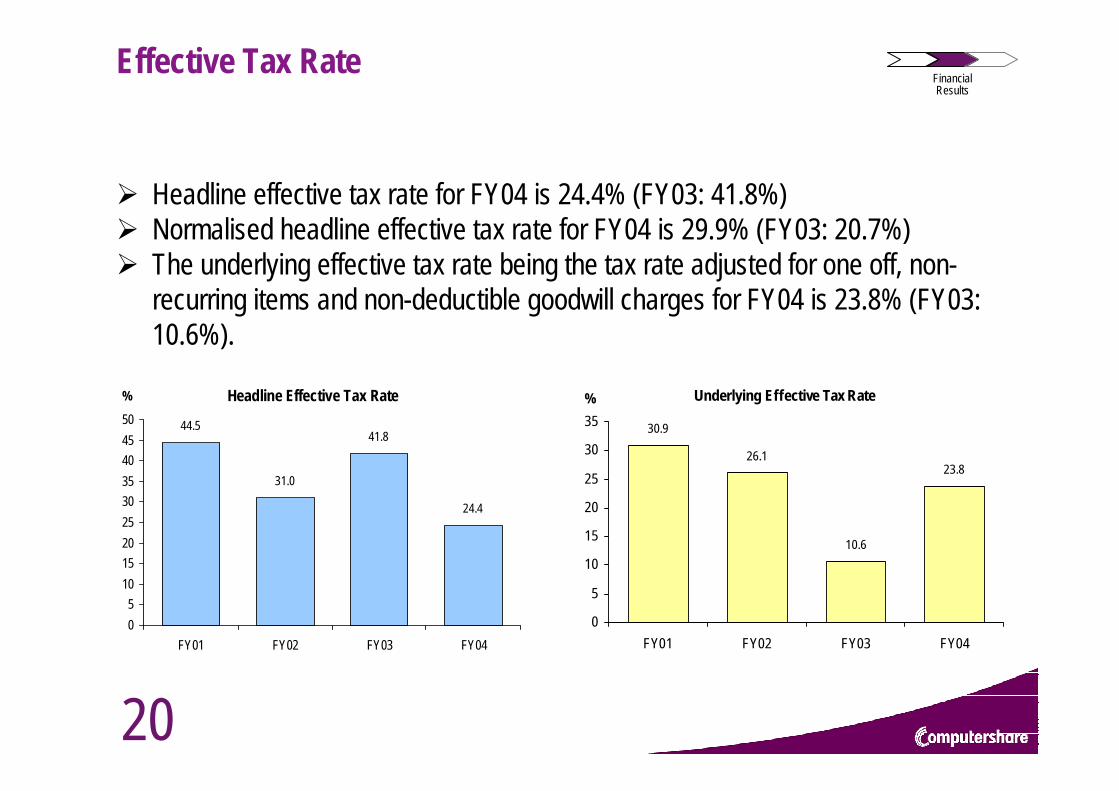
Effective Tax Rate
Headline effective tax rate for FY04 is 24.4% (FY03: 41.8%)Normalised headline effective tax rate for FY04 is 29.9% (FY03: 20.7%)The underlying effective tax rate being the tax rate adjusted for one off, non-recurring items and non-deductible goodwill charges for FY04 is 23.8% (FY03: 10.6%).
FinancialResults
Headline Effective Tax Rate
44.5
31.0
41.8
24.4
05
101520253035404550
FY01 FY02 FY03 FY04
% Underlying Effective Tax Rate
30.9
26.1
10.6
23.8
0
5
10
15
20
25
30
35
FY01 FY02 FY03 FY04
%
21
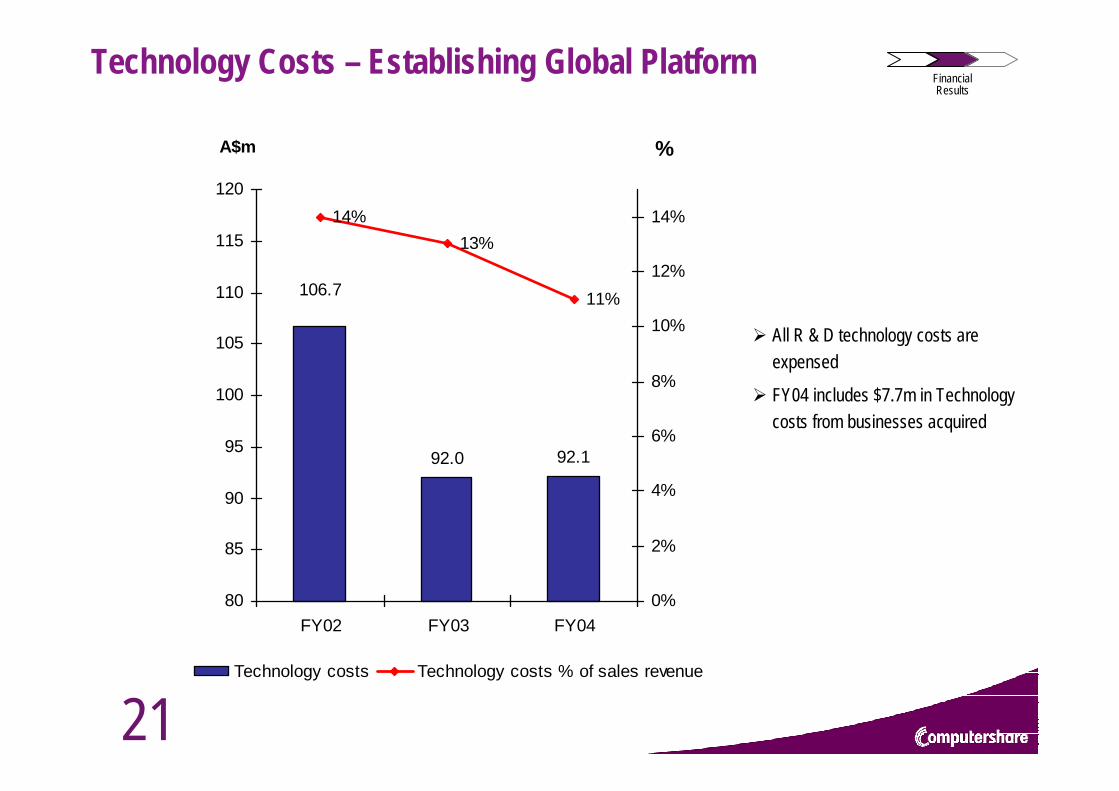
Technology Costs – Establishing Global PlatformFinancialResults
92.0 92.1
106.7
14%13%
11%
80
85
90
95
100
105
110
115
120
FY02 FY03 FY04
A$m
0%
2%
4%
6%
8%
10%
12%
14%
%
Technology costs Technology costs % of sales revenue
All R & D technology costs are expensed
FY04 includes $7.7m in Technology costs from businesses acquired
22
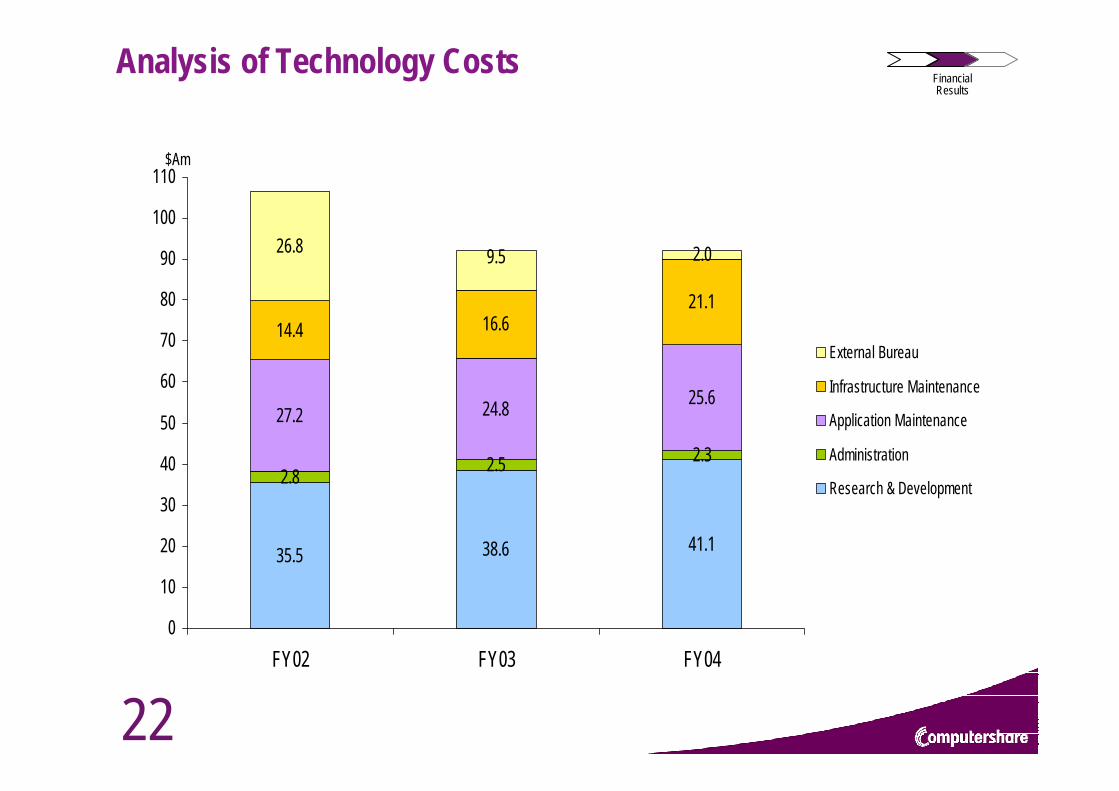
Analysis of Technology CostsFinancialResults
35.5 38.6 41.1
2.8 2.5 2.3
27.2 24.8 25.6
14.4 16.621.1
26.8 2.09.5
0
10
20
30
40
50
60
70
80
90
100
110
FY02 FY03 FY04
$Am
External Bureau
Infrastructure Maintenance
Application Maintenance
Administration
Research & Development
23
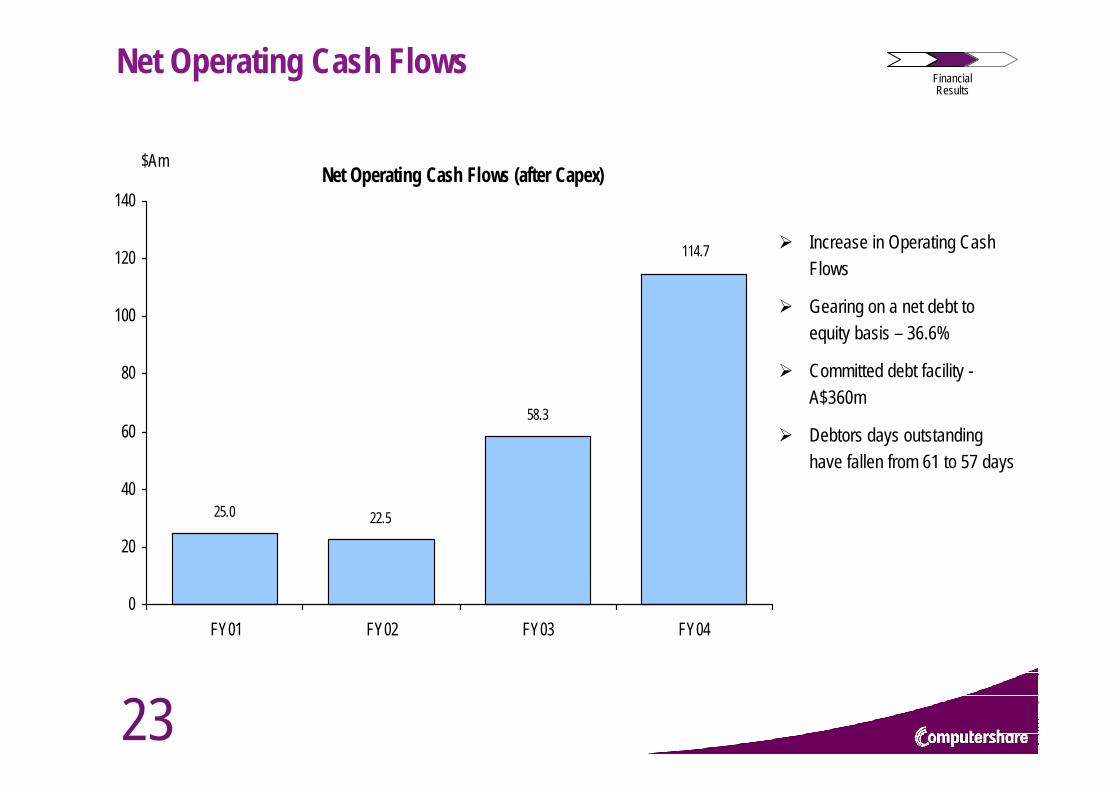
Net Operating Cash FlowsFinancialResults
Increase in Operating Cash Flows
Gearing on a net debt to equity basis – 36.6%
Committed debt facility -A$360m
Debtors days outstanding have fallen from 61 to 57 days
Net Operating Cash Flows (after Capex)
25.0 22.5
58.3
114.7
0
20
40
60
80
100
120
140
FY01 FY02 FY03 FY04
$Am
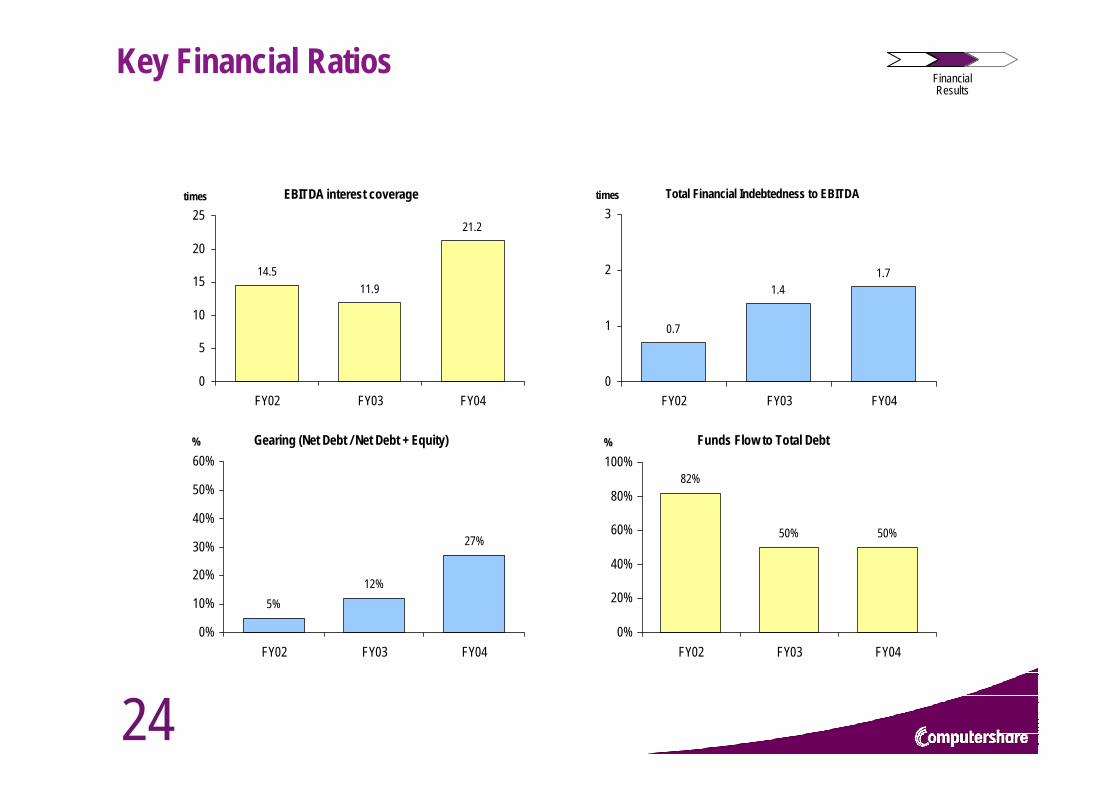
24
Key Financial Ratios
EBITDA interest coverage
14.511.9
21.2
0
5
10
15
20
25
FY02 FY03 FY04
times Total Financial Indebtedness to EBITDA
0.7
1.41.7
0
1
2
3
FY02 FY03 FY04
times
Gearing (Net Debt / Net Debt + Equity)
5%12%
27%
0%
10%
20%
30%
40%
50%
60%
FY02 FY03 FY04
% Funds Flow to Total Debt
82%
50% 50%
0%
20%
40%
60%
80%
100%
FY02 FY03 FY04
%
FinancialResults
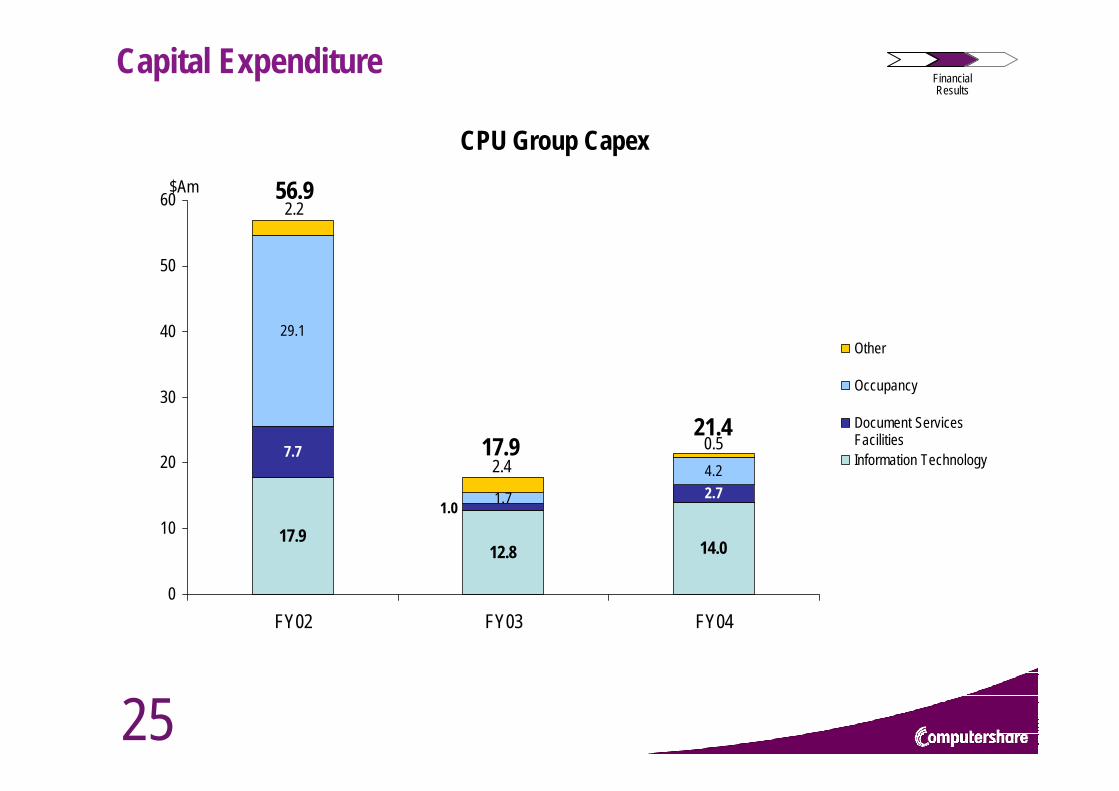
25
Capital Expenditure FinancialResults
17.912.8 14.0
7.7
2.7
29.1
1.7
4.2
1.0
0.52.4
2.2
0
10
20
30
40
50
60
FY02 FY03 FY04
$Am
Other
Occupancy
Document ServicesFacilitiesInformation Technology
CPU Group Capex
56.9
17.921.4
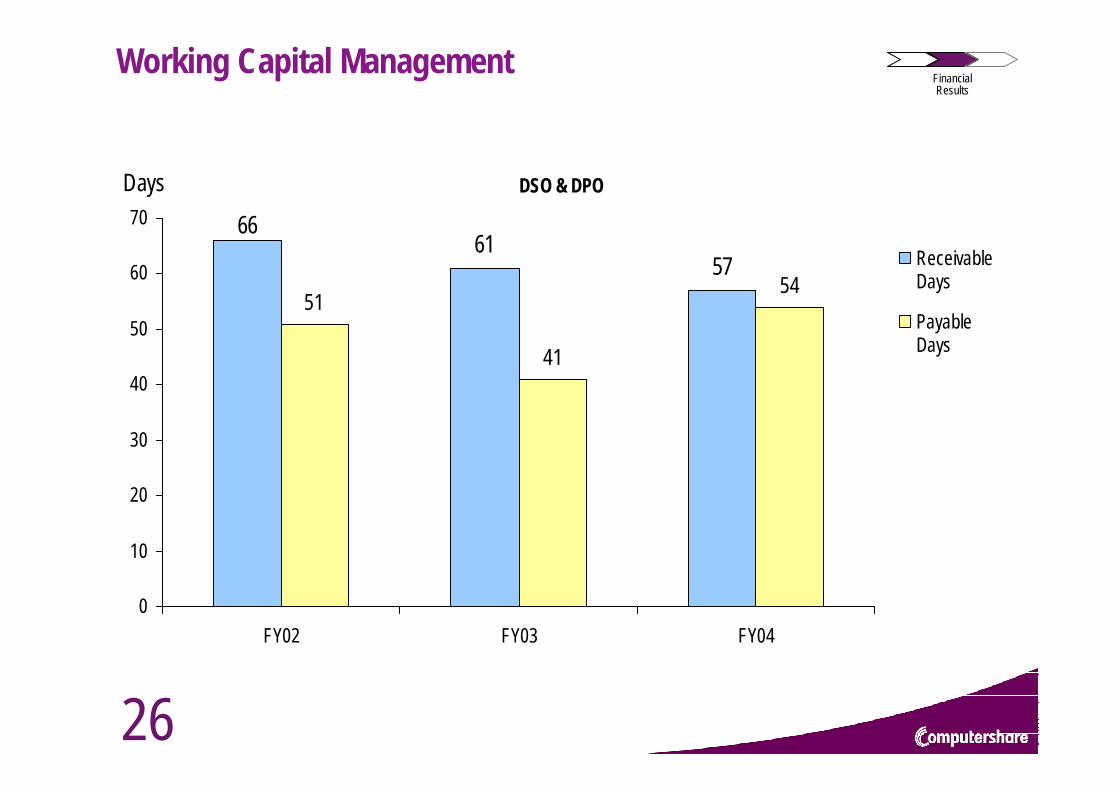
26
Working Capital ManagementFinancialResults
DSO & DPO
6157
51
41
54
66
0
10
20
30
40
50
60
70
FY02 FY03 FY04
Days
ReceivableDays
PayableDays
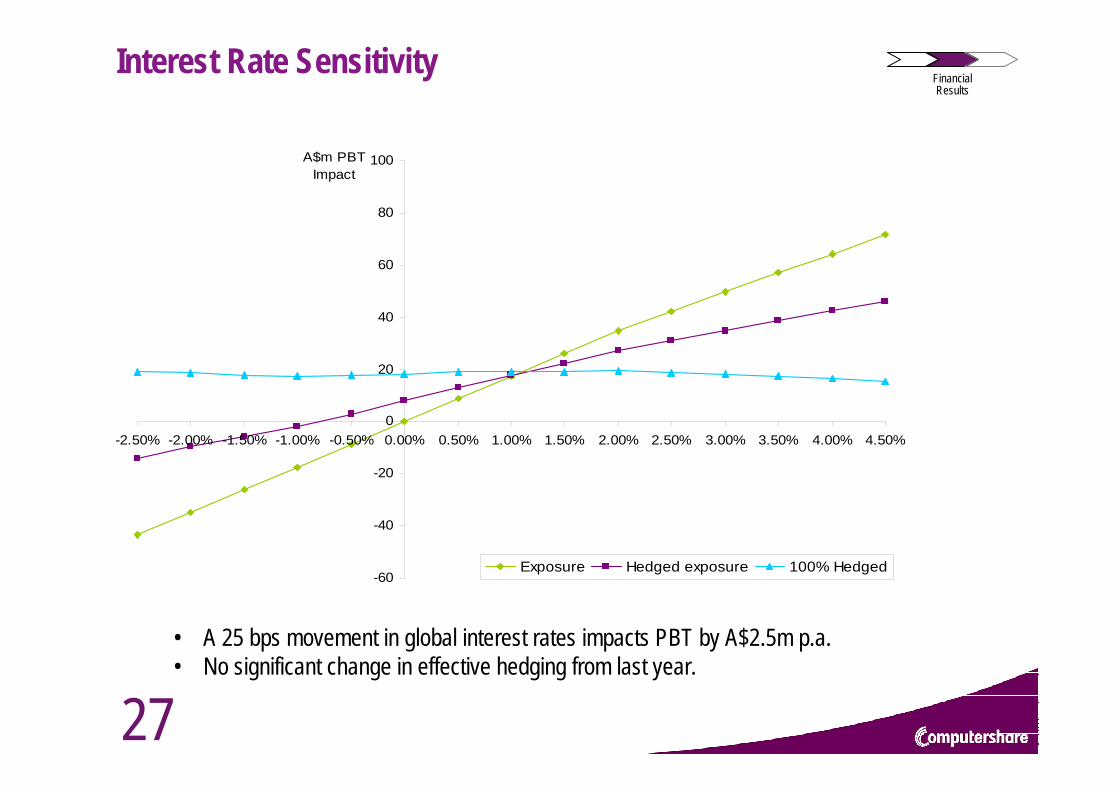
27
Interest Rate SensitivityFinancialResults
-60
-40
-20
0
20
40
60
80
100
-2.50% -2.00% -1.50% -1.00% -0.50% 0.00% 0.50% 1.00% 1.50% 2.00% 2.50% 3.00% 3.50% 4.00% 4.50%
A$m PBTImpact
Exposure Hedged exposure 100% Hedged
• A 25 bps movement in global interest rates impacts PBT by A$2.5m p.a.• No significant change in effective hedging from last year.
28
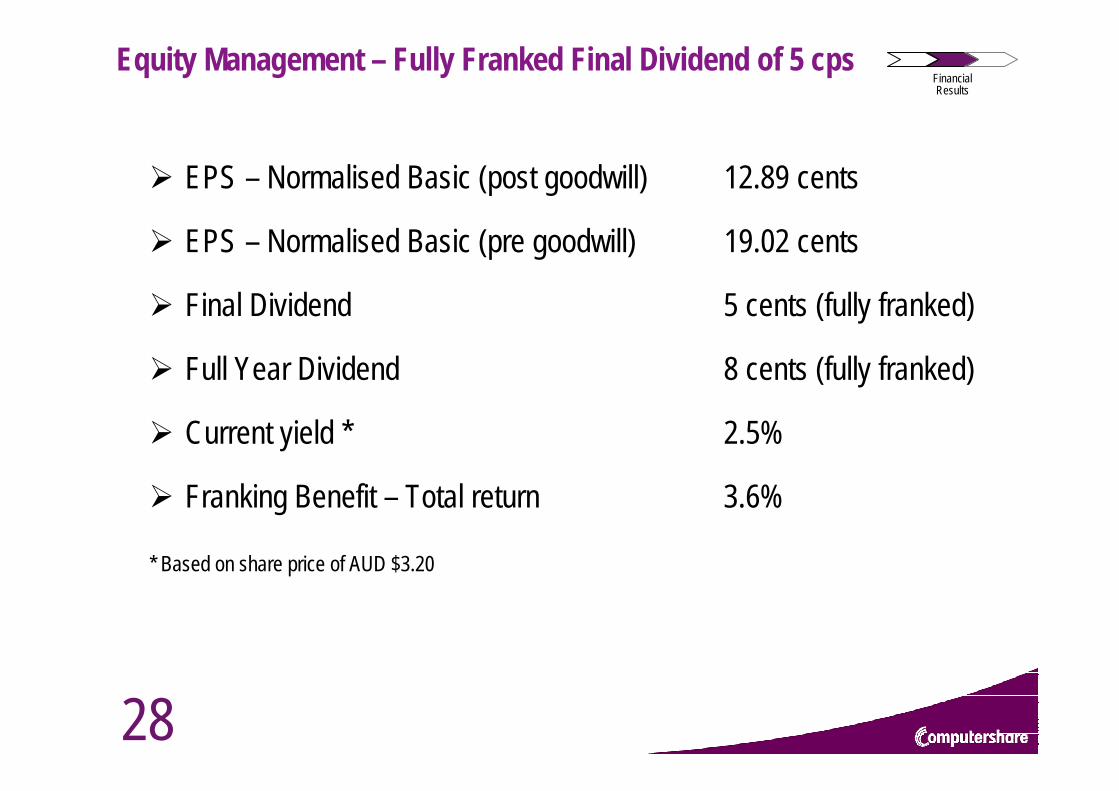
Equity Management – Fully Franked Final Dividend of 5 cps
EPS – Normalised Basic (post goodwill) 12.89 cents
EPS – Normalised Basic (pre goodwill) 19.02 cents
Final Dividend 5 cents (fully franked)
Full Year Dividend 8 cents (fully franked)
Current yield * 2.5%
Franking Benefit – Total return 3.6%
* Based on share price of AUD $3.20
FinancialResults
29
Equity Management – Preference Share ConversionFinancialResults
Recent changes in Accounting Standards treat Reset Preference Shares (RPS) as debt (at 5.5% post tax).
Announced conversion of RPS to Equity on 19th August, 2004.
Converting on 30 September 2004 at trailing 20 day VWAP (with 2.5% discount).
Expected dilution of approximately 6%, gross increase in EPS of 1.3 cents (or 10% in FY04).
30
Equity Management – Share Buy Back: Reset Preference SharesFinancialResults
Announced 19th December 2003 - Buy back a maximum of 17% (250,000 preference shares).
Commenced 5th January 2004.
Changes announced on 19th March 2004 – Buy back a further 500,000 shares.
Acquired 315,193 preference shares by 16th August 2004.
Average price AUD $103.83.
31
Equity Management – Ordinary Share BuybackFinancialResults
Announced 26th May 2004 - Buy back a maximum of 27,500,000 shares.
Commenced 10th June 2004.
Acquired 15,970,000 shares by 16th August 2004.
Completion expected 17th December 2004.
Average price AUD $3.18.
32
Financial SummaryFinancialResults
Normalised Earnings per Share (pre goodwill) rose from 11.79 to 19.02 cents per share.
Net operating Cash Flows were $136.1m (an increase of 79% on FY 2003).
Revenues increased 24% to $894.7m.
Normalised EBITDA up 37% to $183.4m
Operating expenses were $711.1m (inclusive of cost of sales). Excluding cost of sales & acquisitions, operating costs declined 1%.
Days Sales Outstanding were 57 days, down 4 days from June 2003.
Capital Expenditure was in line with expectation at $21.4 million.
33
MarketOverview
FinancialPerformance CEO’s Report
34
Increased Revenue & Profit
Major focus on capital management
Capital Expenditure
Cash Flow
Focus on EPS for future reporting
CEO’sReport
Highlights - Financial
35
Regional Highlights – Asia/Pacific
India Hong KongPhilippines
Australia New Zealand
36
Relocated to Global Headquarters
Regional Highlights – Asia/Pacific CEO’sReport
37
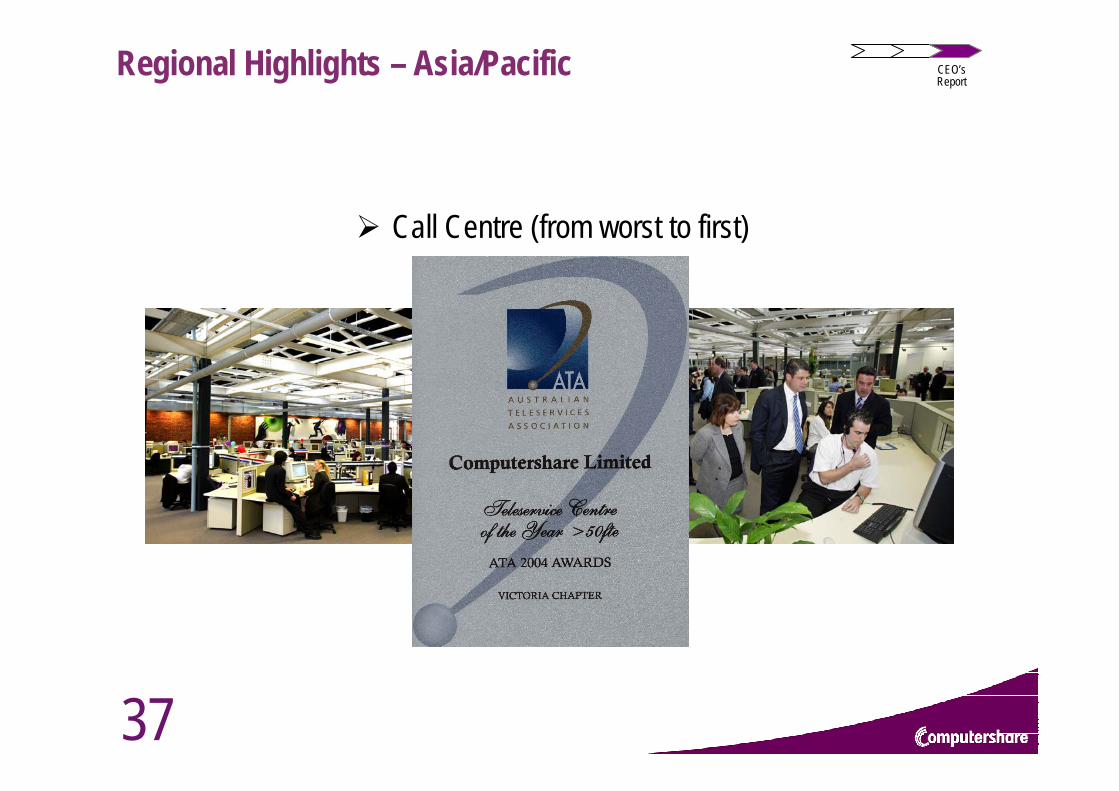
Call Centre (from worst to first)
Regional Highlights – Asia/Pacific CEO’sReport
38
Regional Highlights – Asia/Pacific
Australia: Significant improvement in productivity, accuracy and efficiency
Introduction of Workflow / EDC resulted in 65% productivity improvement over 18 monthsIAG significant winMore than 75% of clients have taken our integrated offering
India – Results better than budgetConsistent flows in IPOs from mainland China into Hong Kong with 23 IPOs won between February and July 2004
CEO’sReport
39
Ireland United Kingdom
Germany South AfricaRussia
Regional Highlights - EMEA
40
Regional Highlights - EMEA
South Africa significant turnaround in EBITDAGermany
Design and implementation of new registry systemAll companies migrated from Deutsche Bourse systemCreation of Plans divisionNow operating profitably
Gilts & NHS in UKAppointed Geoff Price, Managing Director Plans
CEO’sReport
41
Regional Highlights – North America
United States of America Canada
CEO’sReport
42
GeorgesonIntegration benefits better than expectedMajor synergies starting to be realisedRationalization of offices underwaySignificant savings in operational areasNow have 35 people in sales force in USInherited great staff who have added to management strengthPlenty of upside to comeAcquisition of Alamo to merge with GSC, creating end-to-end proxy service for Mutual Funds (print/solicitation/tabulation)
Regional Highlights – North America CEO’sReport
43
Regional Highlights – North America
TranscentiveLes Trachtman, Global head of business development for PlansExpanding their products globally
EuropeHong Kong, ChinaIndia
Selling web-based solutions hosted in USA22 New clients have been signed since acquisitionExceeding financial forecast
CEO’sReport
44
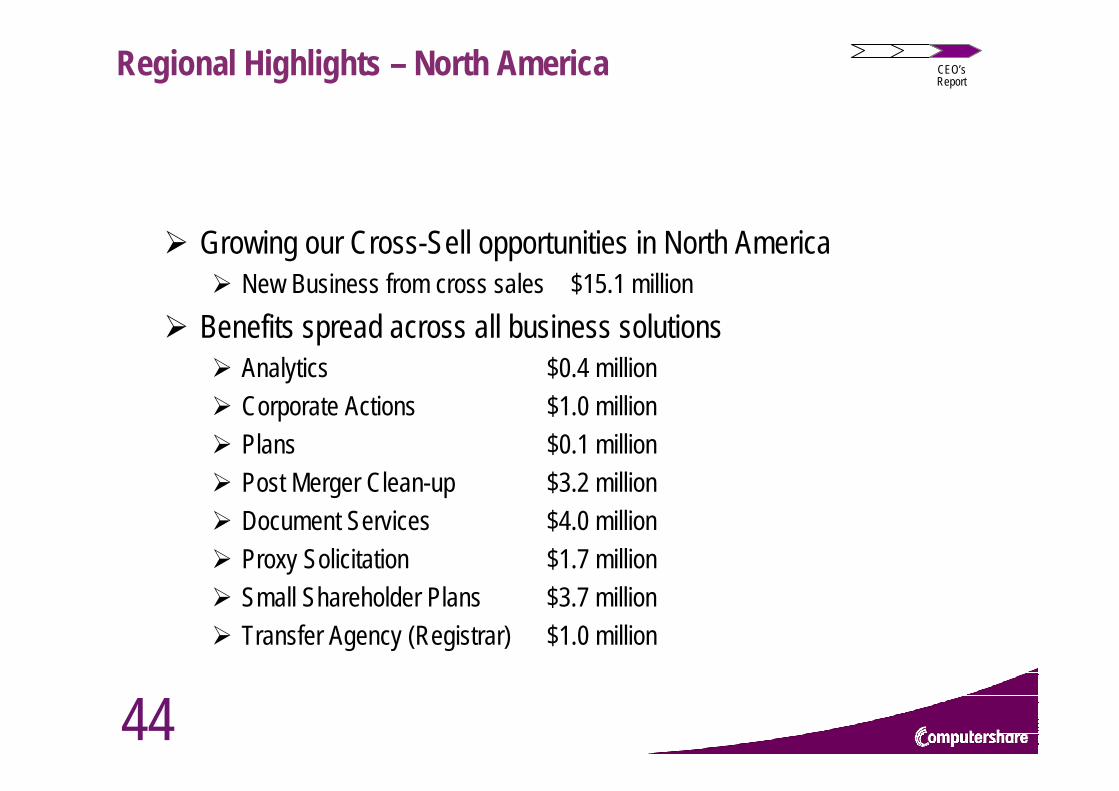
Growing our Cross-Sell opportunities in North AmericaNew Business from cross sales $15.1 million
Benefits spread across all business solutionsAnalytics $0.4 millionCorporate Actions $1.0 millionPlans $0.1 millionPost Merger Clean-up $3.2 millionDocument Services $4.0 millionProxy Solicitation $1.7 millionSmall Shareholder Plans $3.7 millionTransfer Agency (Registrar) $1.0 million
Regional Highlights – North America CEO’sReport
45
Canada efficiency gains (overtime 5% of a year ago)
Restructured Canadian Trust business - now showing solid growth
Centralization of sales and marketing in North America
Significant business wins in the US include:News CorporationAlltel
Regional Highlights – North America CEO’sReport
46
Document ServicesBrilliant resultsThe only global print/mail operationSeeking opportunities to expand in
PerthSouth AfricaIreland
Alamo gives us an East coast facility
Highlights - Global CEO’sReport
47
AnalyticsIntegration into Georgesons’ Stock ID completedAppointed Paul Conn as Global Managing DirectorIR Track released Deal with NASDAQ and in discussions with other major exchangesSome work outsourced to our Philippine businessGlobal development completed
Highlights - Global CEO’sReport
48
Highlights - Global
PepperERM forecast revenues this year > $15m plus + $$ to Plan ManagersCRM expanded to Asia Pacific and North America: revenues now over $25m per yearSRM strong in the UK and Australia, first clients signed up in the US, adds significant value to our other businesses like SSPeTree
Australia – Landcare Australia32 Major Australian companies participating446,000 trees planted or planned
US – American ForestsCanada – Tree Canada FoundationUK – Future Forests
CEO’sReport

49
WHERE TO FROM HERE?
CEO’sReport
50
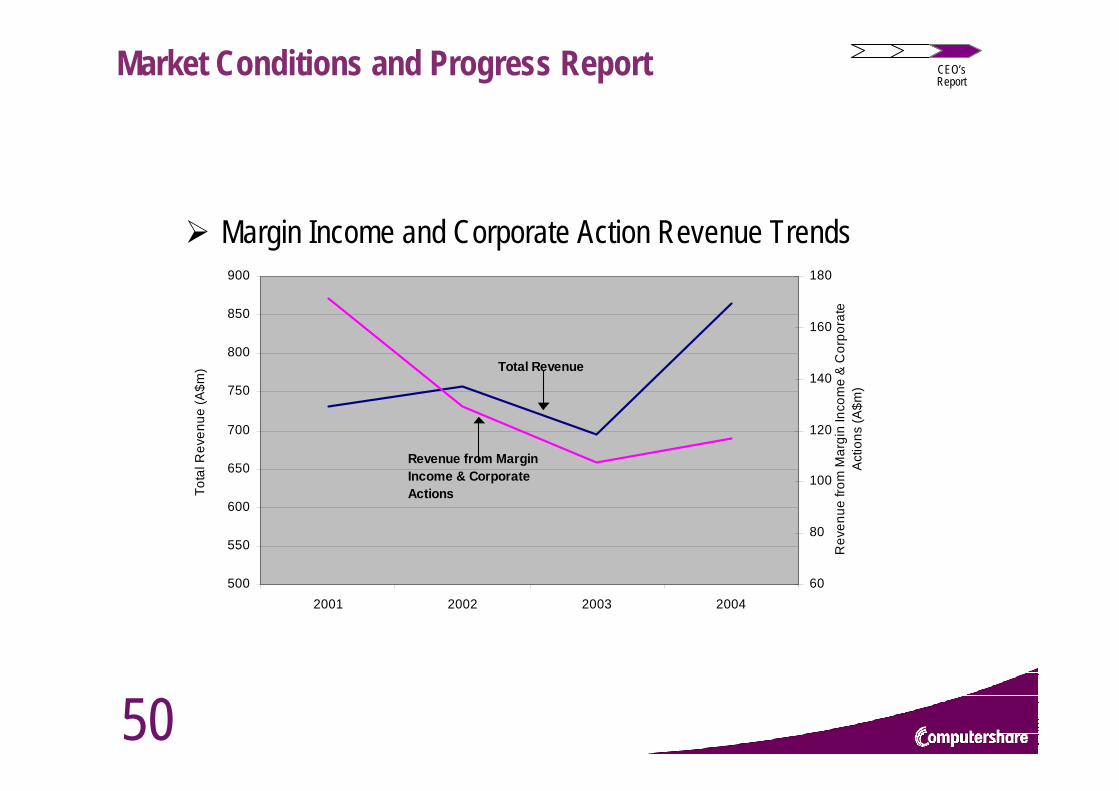
Margin Income and Corporate Action Revenue Trends
500
550
600
650
700
750
800
850
900
2001 2002 2003 2004
Tota
l Rev
enue
(A$m
)
60
80
100
120
140
160
180
Rev
enue
from
Mar
gin
Inco
me
& C
orpo
rate
A
ctio
ns (A
$m)
Total Revenue
Revenue from Margin Income & Corporate Actions
Market Conditions and Progress Report CEO’sReport
51
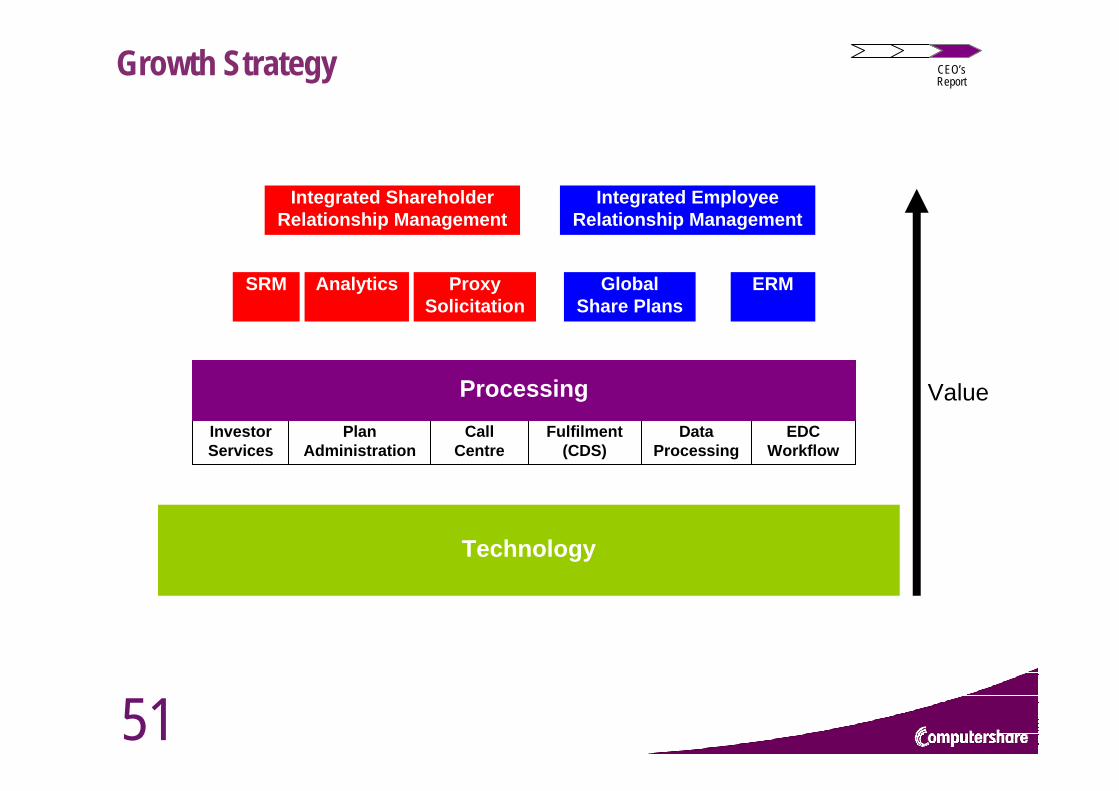
Integrated Shareholder Relationship Management
Integrated Employee Relationship Management
SRM ProxySolicitation
Analytics ERMGlobal Share Plans
Investor Services
Plan Administration
Call Centre
Fulfilment (CDS)
Data Processing
EDC Workflow
Technology
ValueProcessing
Growth Strategy CEO’sReport
52
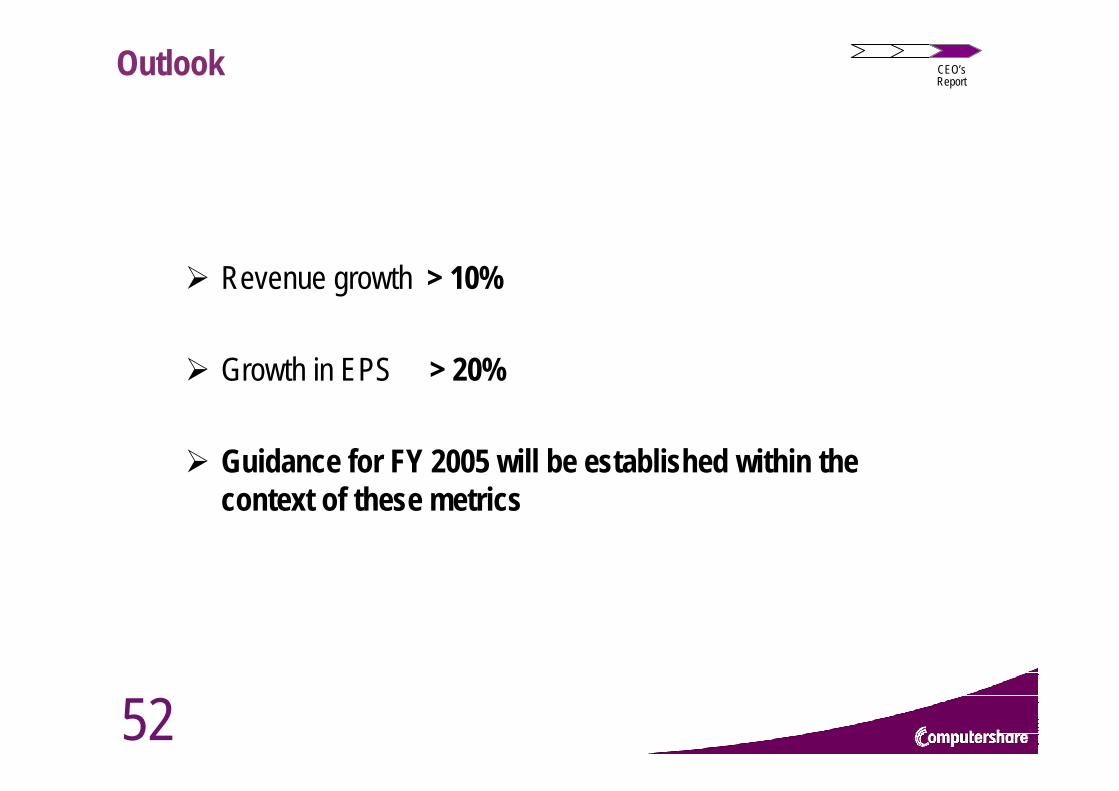
Revenue growth > 10%
Growth in EPS > 20%
Guidance for FY 2005 will be established within the context of these metrics
Outlook CEO’sReport

53
QUESTIONS?
CEO’sReport
54
Financial Year 2004 Final Results Presentation
19 August 2004
FinancialResults
55
Appendix 1: Group ComparisonsFinancialResults
Group Comparisons
56
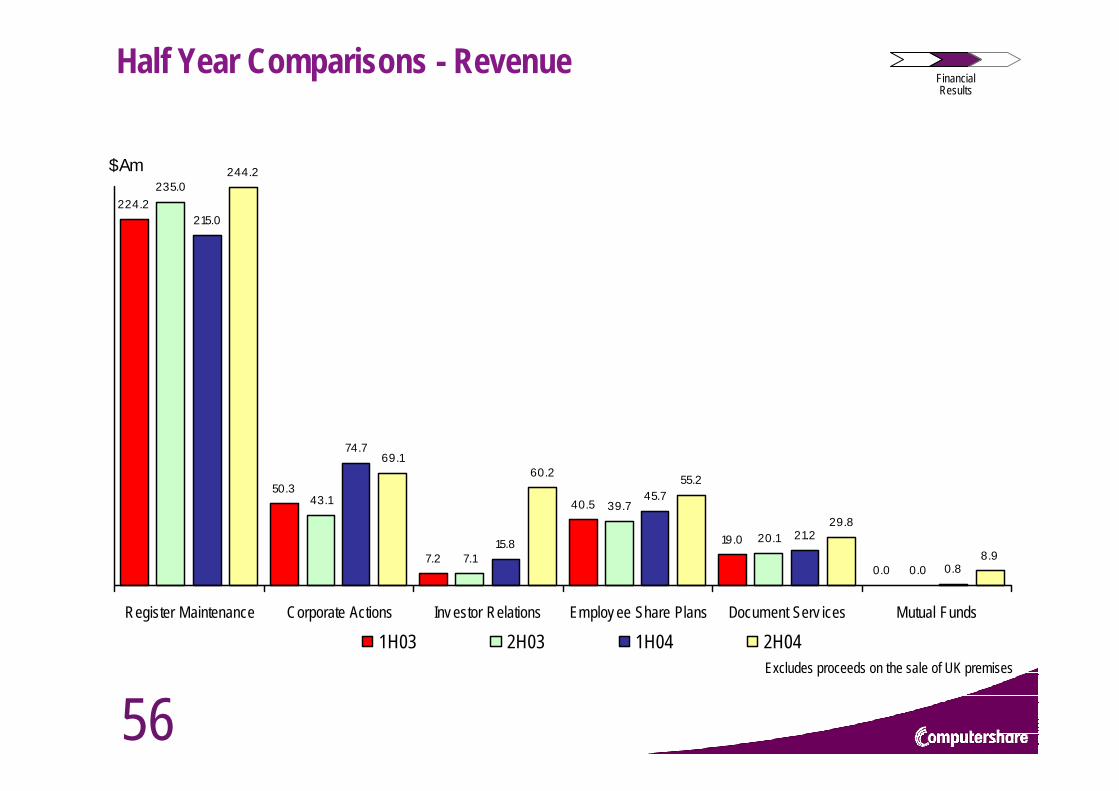
Half Year Comparisons - RevenueFinancialResults
224.2
50.3
7.2
40.5
19.0
0.0
235.0
43.1
7.1
39.7
20.1
0.0
215.0
74.7
15.8
45.7
21.2
0.8
244.2
69.1
55.2
29.8
8.9
60.2
Register Maintenance Corporate Actions Inv estor Relations Employ ee Share Plans Document Serv ices Mutual Funds
$Am
1H03 2H03 1H04 2H04Excludes proceeds on the sale of UK premises
57
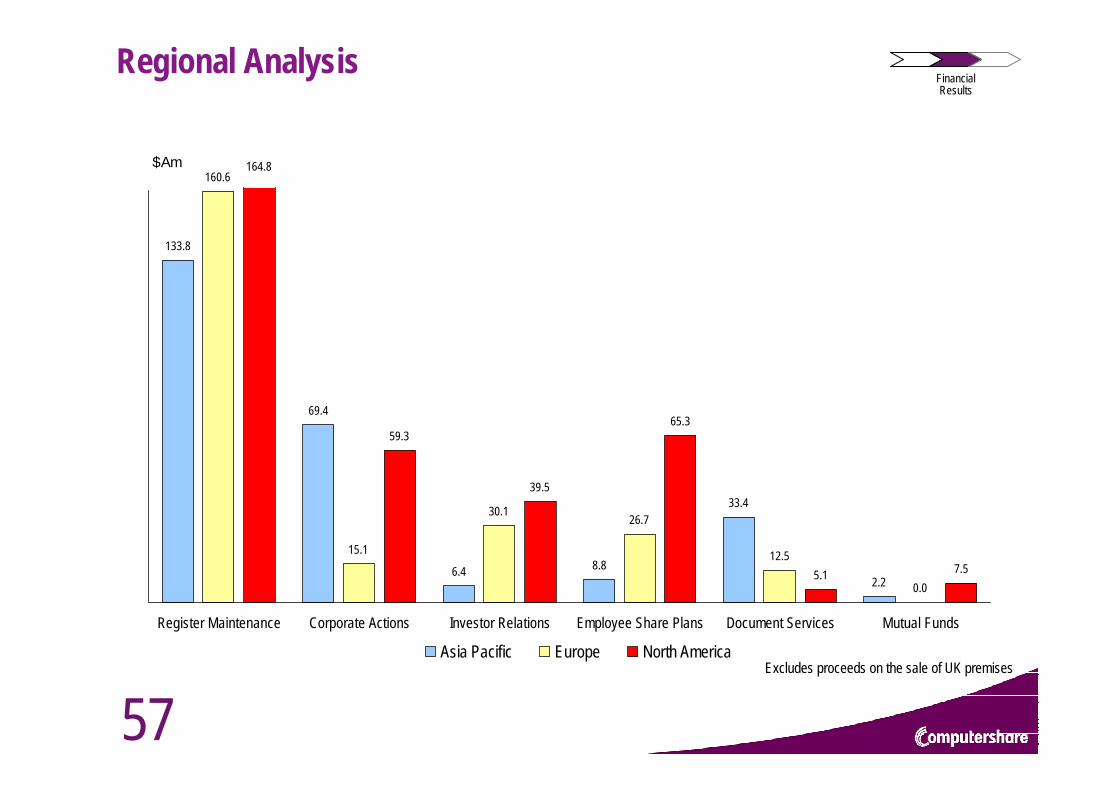
Regional AnalysisFinancialResults
133.8
69.4
6.4 8.8
33.4
2.2
160.6
15.1
30.126.7
12.5
0.0
164.8
59.3
39.5
65.3
5.1 7.5
Register Maintenance Corporate Actions Investor Relations Employee Share Plans Document Services Mutual Funds
$Am
Asia Pacific Europe North AmericaExcludes proceeds on the sale of UK premises
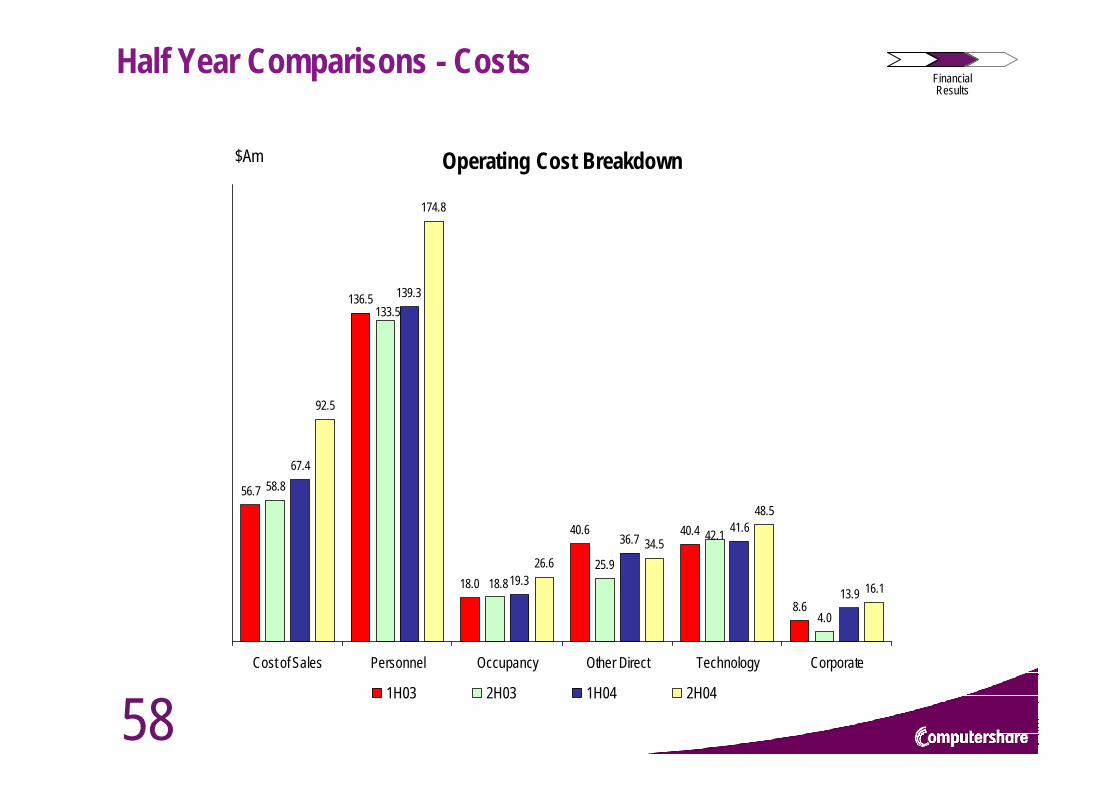
58
Half Year Comparisons - CostsFinancialResults
Operating Cost Breakdown
56.7
136.5
18.0
40.6 40.4
8.6
58.8
25.9
4.0
67.4
139.3
19.3
36.741.6
13.9
92.5
174.8
26.634.5
48.5
16.1
42.1
133.5
18.8
Cost of Sales Personnel Occupancy Other Direct Technology Corporate
$Am
1H03 2H03 1H04 2H04
59
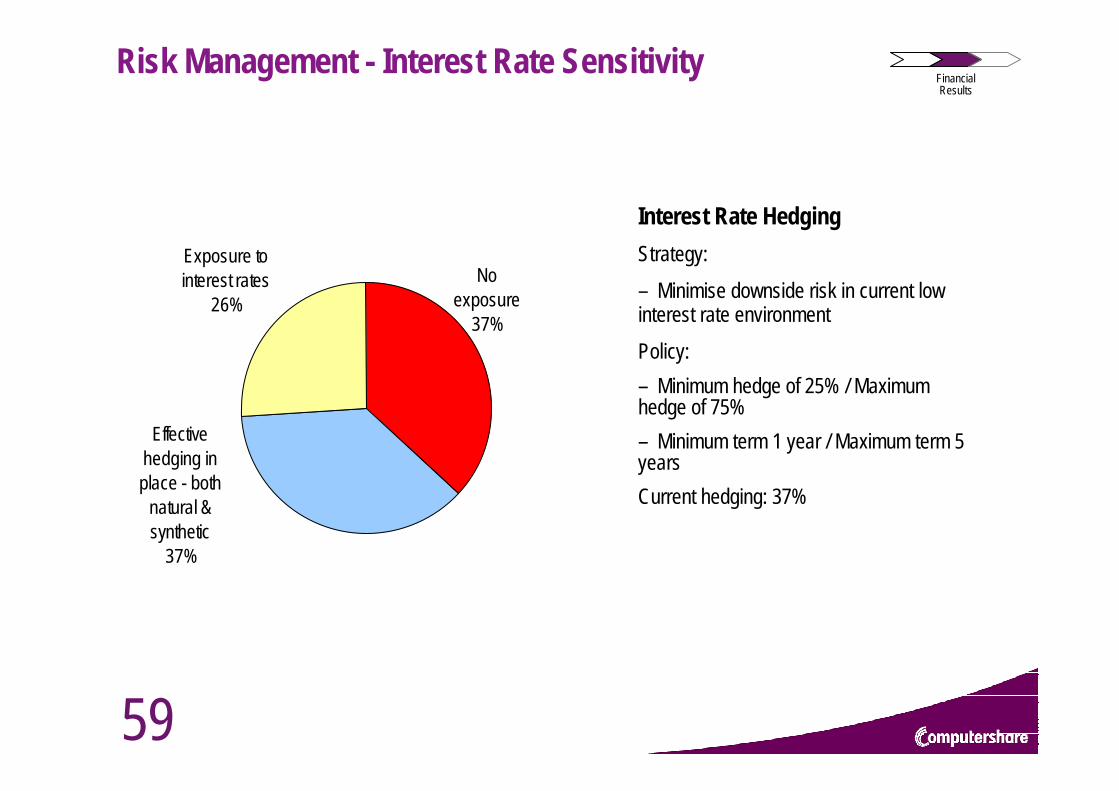
Risk Management - Interest Rate Sensitivity
Exposure to interest rates
26%
Effective hedging in place - both
natural & synthetic
37%
No exposure
37%
Interest Rate HedgingStrategy:– Minimise downside risk in current low interest rate environmentPolicy:– Minimum hedge of 25% / Maximum hedge of 75%– Minimum term 1 year / Maximum term 5 yearsCurrent hedging: 37%
FinancialResults
60
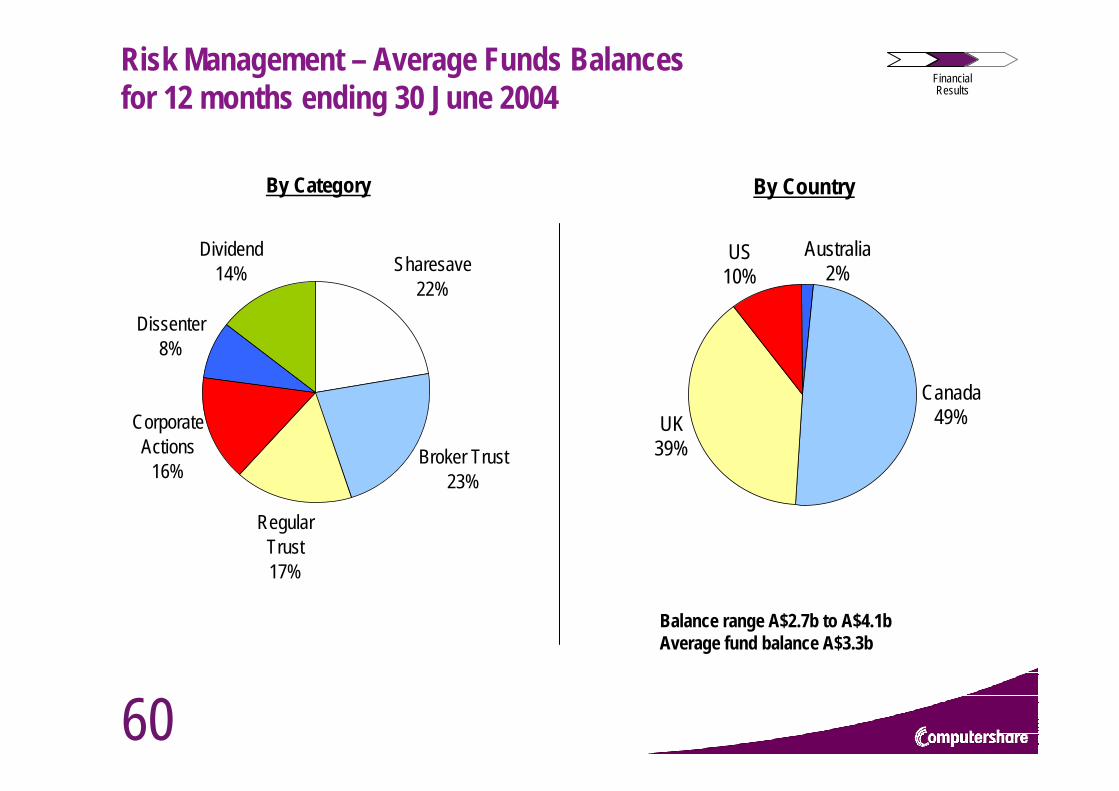
Risk Management – Average Funds Balances for 12 months ending 30 June 2004
Balance range A$2.7b to A$4.1bAverage fund balance A$3.3b
FinancialResults
By Category
Sharesave22%
Broker Trust23%
Corporate Actions
16%
Dissenter8%
Dividend14%
Regular Trust17%
By Country
Canada49%UK
39%
US10%
Australia2%
61
Appendix 2: Country SummariesFinancialResults
Country Summaries
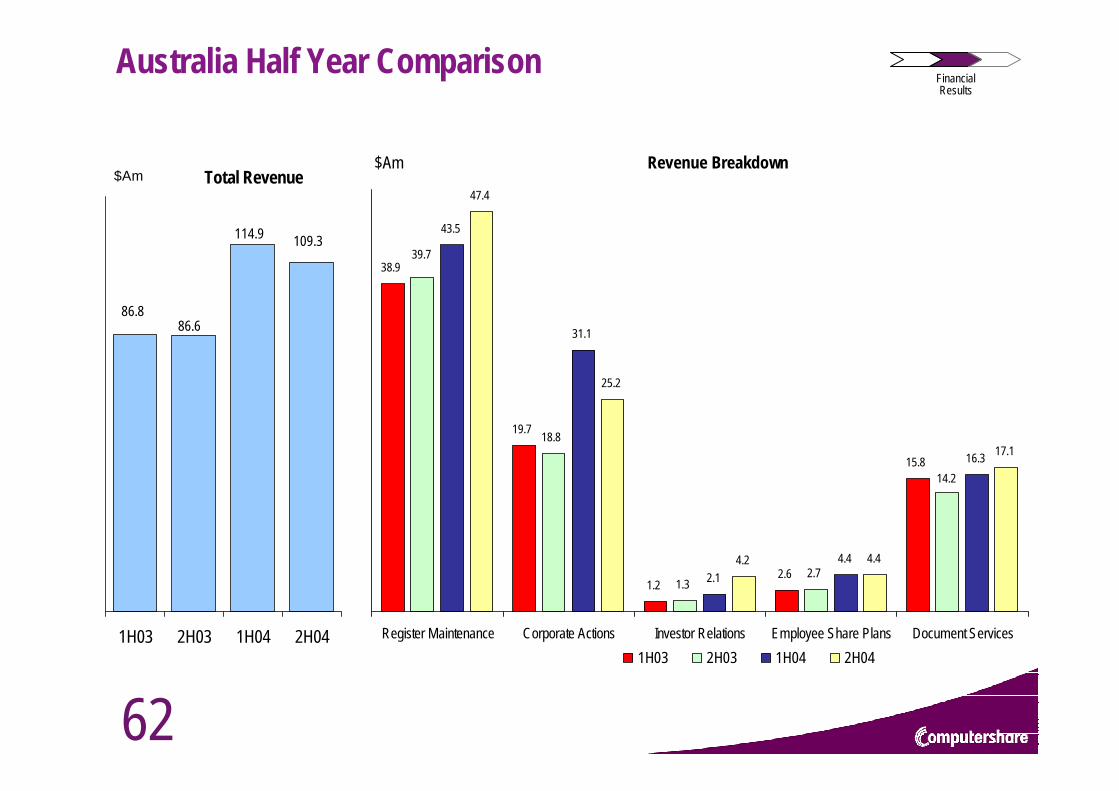
62
Australia Half Year Comparison
Revenue Breakdown
38.9
19.7
1.22.6
15.8
18.8
1.32.7
43.5
31.1
2.14.4
16.3
47.4
25.2
4.2 4.4
17.1
39.7
14.2
Register Maintenance Corporate Actions Investor Relations Employee Share Plans Document Services
$Am
1H03 2H03 1H04 2H04
Total Revenue
86.886.6
109.3114.9
1H03 2H03 1H04 2H04
$Am
FinancialResults
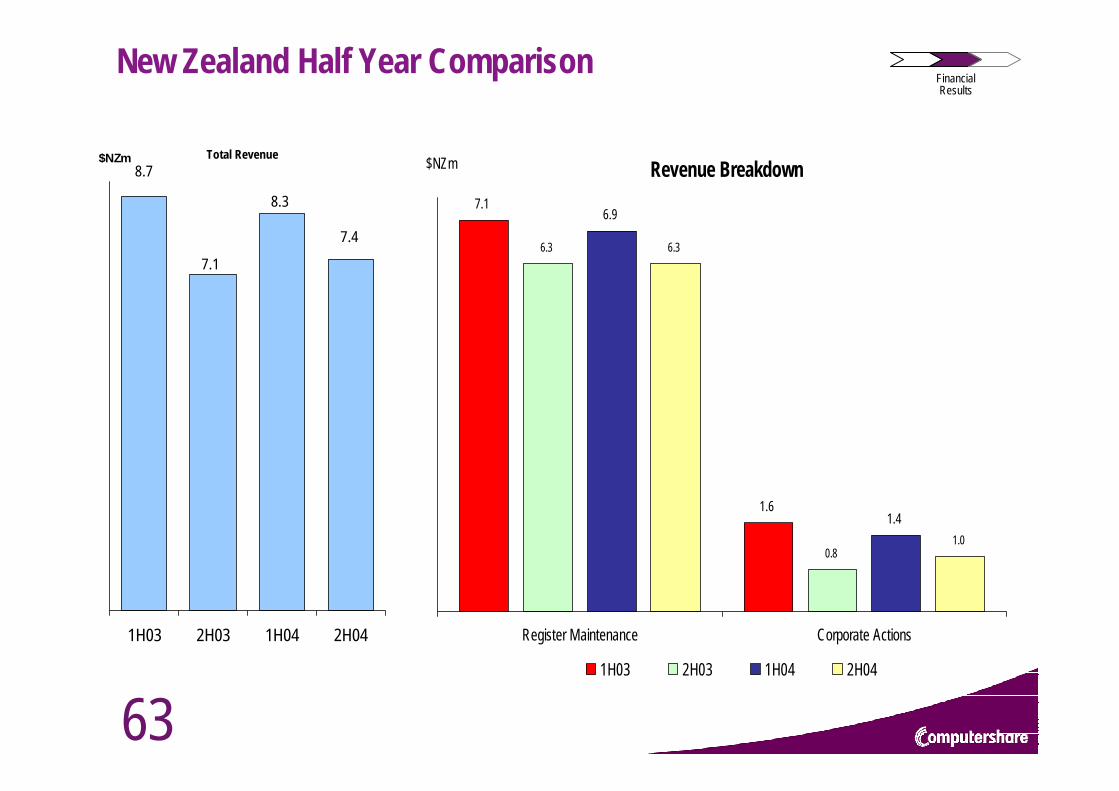
63
New Zealand Half Year Comparison
Revenue Breakdown7.1
1.6
6.3
0.8
6.9
1.4
6.3
1.0
Register Maintenance Corporate Actions
$NZm
1H03 2H03 1H04 2H04
Total Revenue8.7
7.1
7.4
8.3
1H03 2H03 1H04 2H04
$NZm
FinancialResults
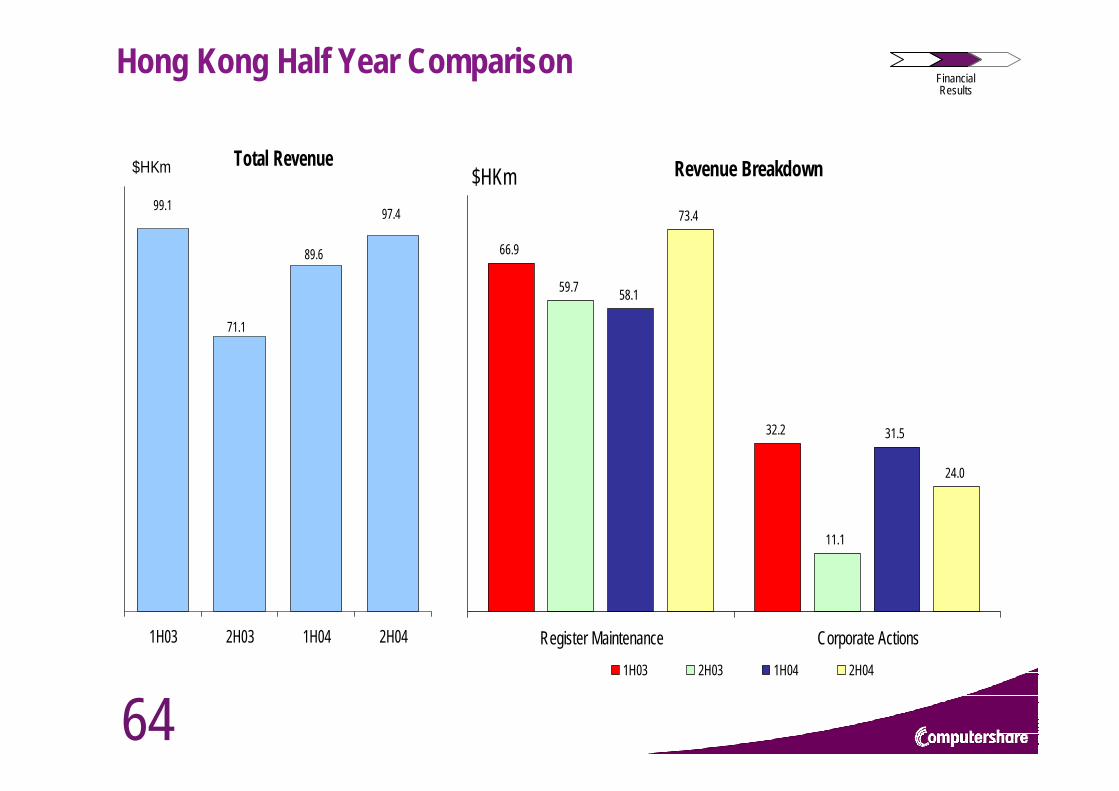
64
Hong Kong Half Year Comparison
Total Revenue
89.6
97.4
71.1
99.1
1H03 2H03 1H04 2H04
$HKm Revenue Breakdown
66.9
32.2
59.7
11.1
58.1
31.5
24.0
73.4
Register Maintenance Corporate Actions
$HKm
1H03 2H03 1H04 2H04
FinancialResults
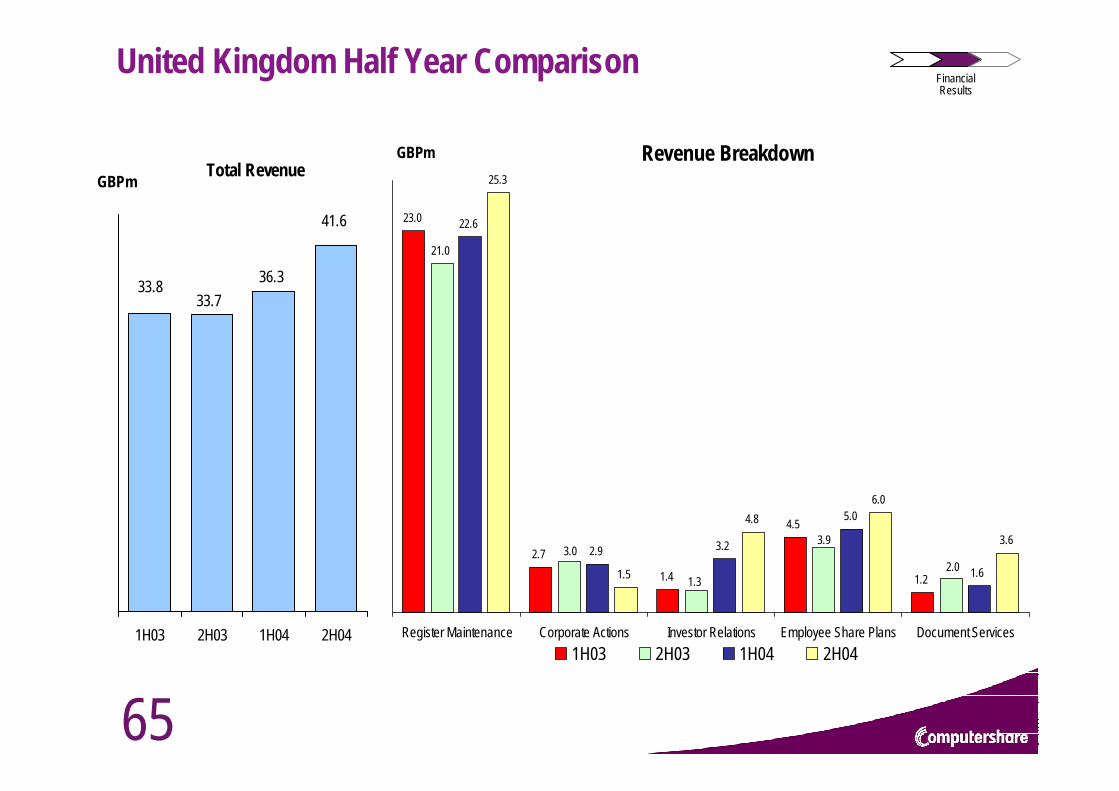
65
United Kingdom Half Year Comparison
Revenue Breakdown
23.0
2.7
1.4
4.5
1.2
21.0
22.6
2.9 3.2
5.0
1.6
25.3
1.5
4.86.0
3.63.0
2.0
3.9
1.3
Register Maintenance Corporate Actions Investor Relations Employee Share Plans Document Services1H03 2H03 1H04 2H04
GBPmTotal Revenue
33.833.7
41.6
36.3
1H03 2H03 1H04 2H04
GBPm
FinancialResults
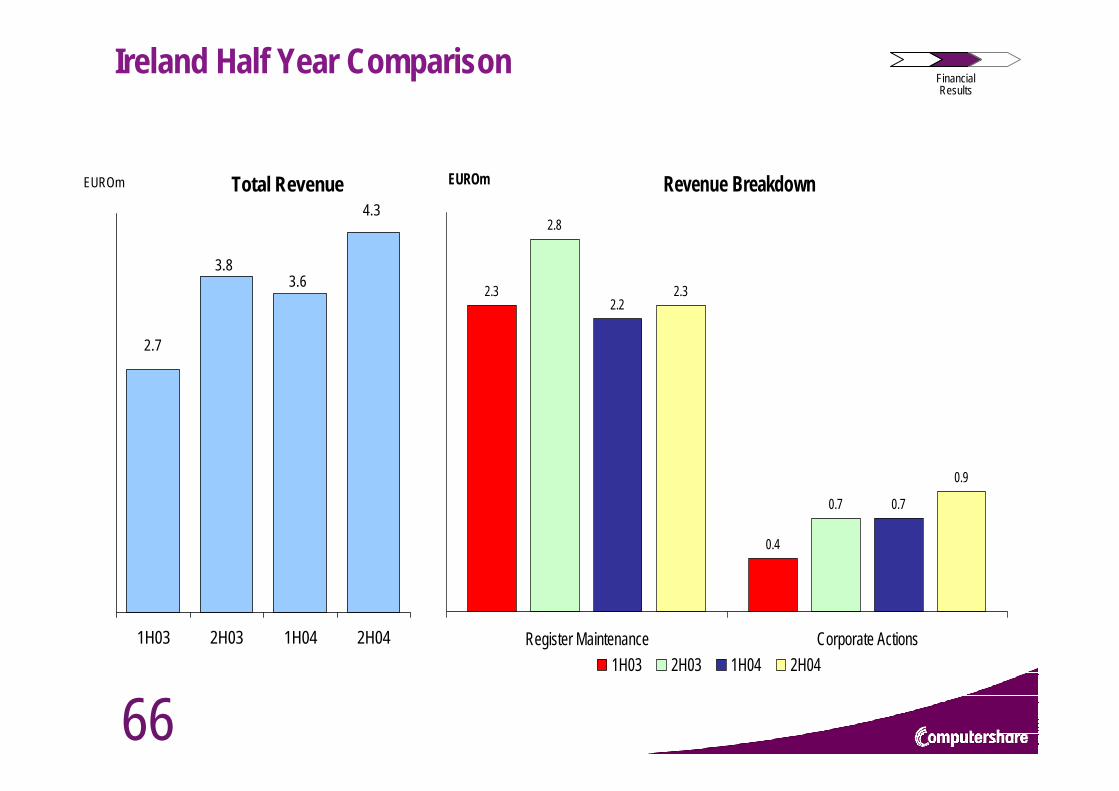
66
Ireland Half Year Comparison
Revenue Breakdown
2.3
0.4
2.8
0.7
2.2
0.7
2.3
0.9
Register Maintenance Corporate Actions
EUROm
1H03 2H03 1H04 2H04
Total Revenue
2.7
3.8
4.3
3.6
1H03 2H03 1H04 2H04
EUROm
FinancialResults
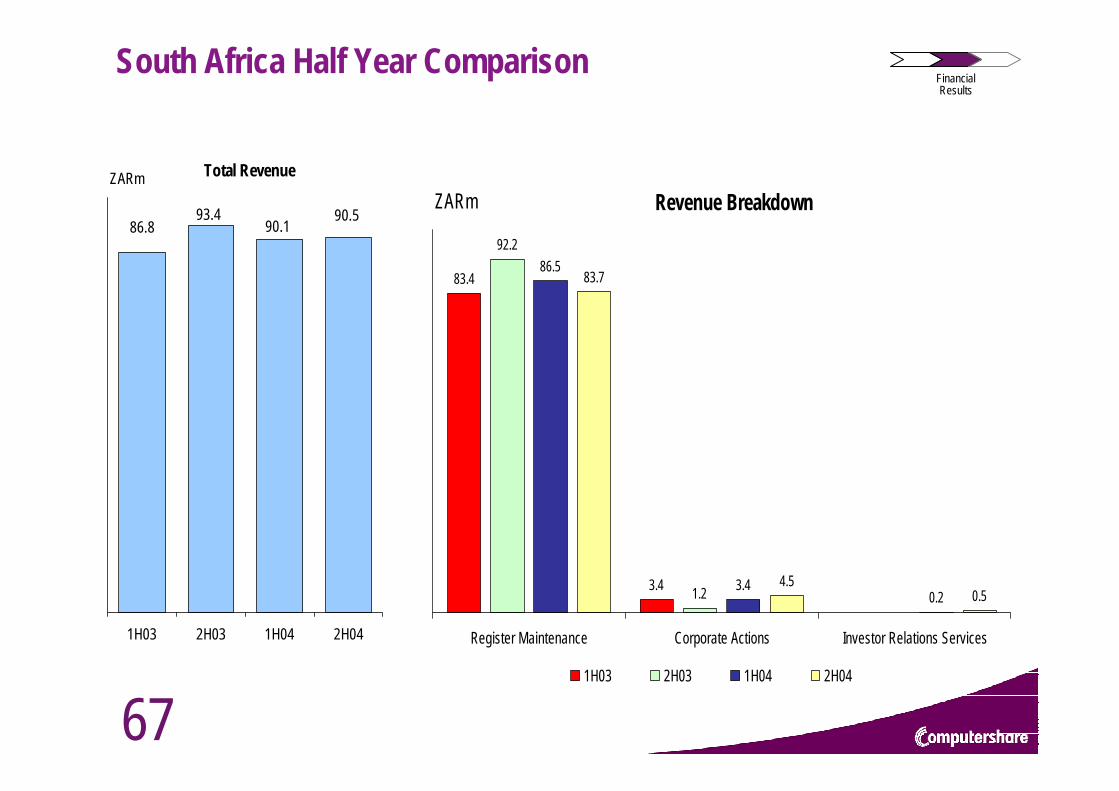
67
South Africa Half Year Comparison
Revenue Breakdown
83.4
3.4
92.2
1.2
86.5
3.40.2
83.7
4.50.5
Register Maintenance Corporate Actions Investor Relations Services
ZARm
1H03 2H03 1H04 2H04
Total Revenue
86.893.4 90.5
90.1
1H03 2H03 1H04 2H04
ZARm
FinancialResults
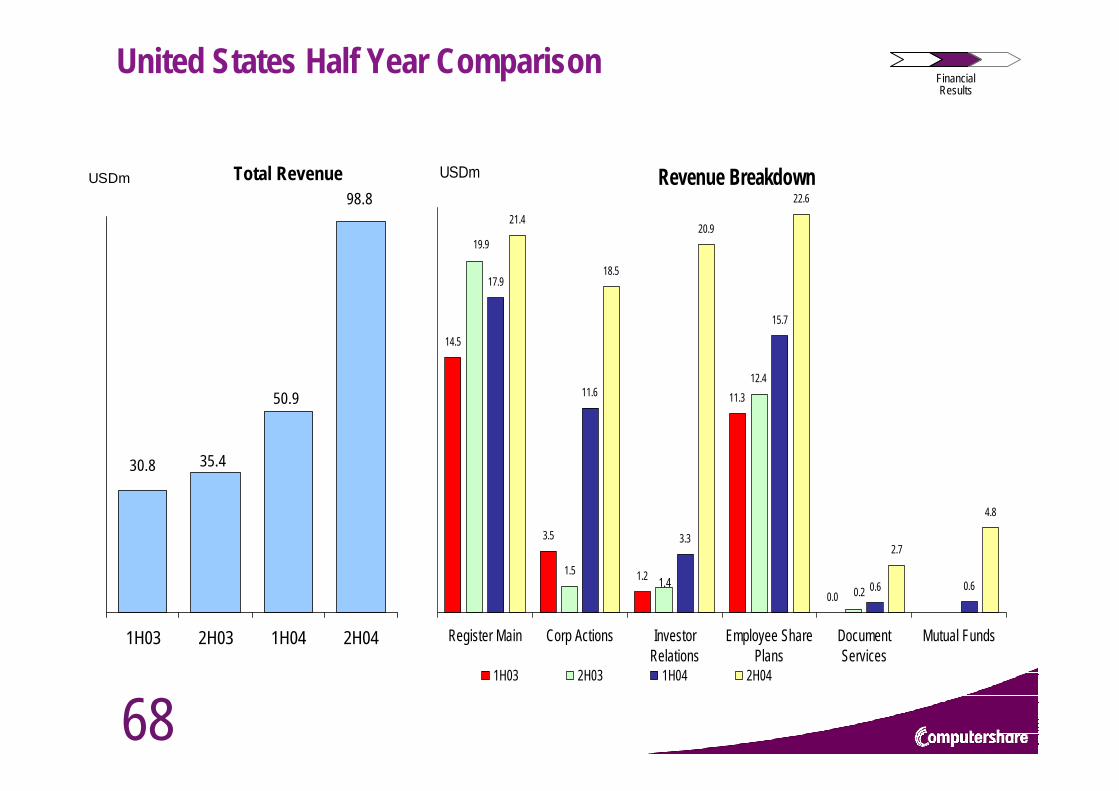
68
United States Half Year Comparison
Revenue Breakdown
14.5
3.5
1.2
11.3
0.0
1.5
12.4
17.9
11.6
3.3
15.7
0.6 0.6
21.4
18.5
20.9
22.6
2.7
4.8
1.40.2
19.9
Register Main Corp Actions InvestorRelations
Employee SharePlans
DocumentServices
Mutual Funds
USDm
1H03 2H03 1H04 2H04
Total Revenue
30.8 35.4
98.8
50.9
1H03 2H03 1H04 2H04
USDm
FinancialResults
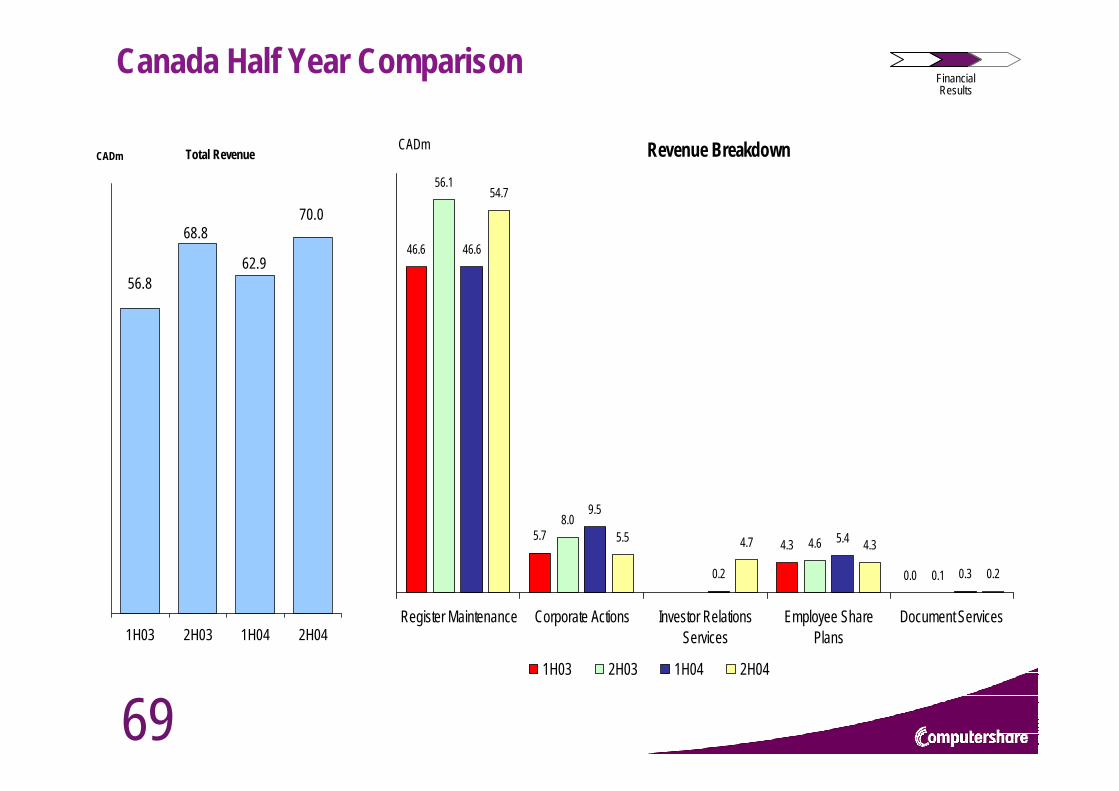
69
Canada Half Year Comparison
Revenue Breakdown
46.6
5.74.3
0.0
8.0
4.6
0.1
46.6
9.5
0.2
5.4
0.3
54.7
5.5 4.7 4.3
0.2
56.1
Register Maintenance Corporate Actions Investor RelationsServices
Employee SharePlans
Document Services
CADm
1H03 2H03 1H04 2H04
Total Revenue
56.8
68.870.0
62.9
1H03 2H03 1H04 2H04
CADm
FinancialResults