Embed Size (px)
Citation preview

BANK OF JAPAN
APRIL 2021
BA
NK
OF J
AP
AN
F
INA
NC
IAL S
YS
TEM
RE
PO
RT
AP
RIL 2021
The total of major banks, regional banks, and shinkin banks covered in this Report is as follows (as at end-March 2021). Major banks comprise the following 10 banks: Mizuho Bank, MUFG Bank, Sumitomo Mitsui Banking Corporation, Resona Bank, Saitama Resona Bank, Mitsubishi UFJ Trust and Banking Corporation, Mizuho Trust and Banking Company, Sumitomo Mitsui Trust Bank, Shinsei Bank, and Aozora Bank. Regional banks comprise the 62 member banks of the Regional Banks Association of Japan (Regional banks I) and the 38 member banks of the Second Association of Regional Banks (Regional banks II). Shinkin banks are the 247 shinkin banks that hold current accounts at the Bank of Japan. This Report basically uses data available as at end-March 2021.
Please contact the Financial System and Bank Examination Department at the e-mail address below to request permission in advance when reproducing or copying the contents of this Report for commercial purposes. Please credit the source when quoting, reproducing, or copying the contents of this Report for non-commercial purposes. Financial System Research Division, Financial System and Bank Examination Department, Bank of Japan [email protected]
i
Objectives of the Financial System Report and motivations behind the April 2021 issue of the Report
The Bank of Japan's semiannual Financial System Report has two main objectives: to assess the stability of Japan's financial system and to communicate to all related parties the future tasks and challenges in order to ensure the system's stability.
The Report first summarizes the current situation of financial markets and financial intermediation activities of Japanese financial institutions, then provides a regular assessment of the financial cycle and the resilience of financial institutions to stress, and lastly analyzes the vulnerabilities of the financial system from a macroprudential perspective. It also outlines issues that deserve attention and challenges to be addressed. Within a macroprudential framework, institutional designs and policy measures are devised based on analyses and assessments of risks in the financial system as a whole, taking into account the interconnectedness of the real economy, financial markets, and financial institutions' behavior, in order to ensure the stability of the overall financial system.
The Bank uses the results of the analysis set out in the Report in planning policies to ensure the stability of the financial system and for providing guidance and advice to financial institutions through on-site examinations and off-site monitoring. Moreover, the Bank makes use of the results in international discussions on regulation, supervision, and vulnerability assessment. In relation to the conduct of monetary policy, the macro assessment of financial system stability is also regarded as important input for the Bank in assessing risks in economic and price developments from a medium- to long-term perspective.
The April 2021 Report provides a detailed analysis of two major risks: domestic credit risk and securities investment risk, and then uses a stress testing framework to examine the robustness of Japan's financial system. On the domestic credit risk stemming from the spread of COVID-19, this Report presents a simulation of SMEs' financial soundness that incorporates the following features, which are currently observed in Japan's economy: (1) the challenges facing firms are gradually shifting from a short-term liquidity issue to a medium- to long-term solvency issue, and (2) the impact of the pandemic significantly varies not only across firm sizes and industries but also among firms in the same industry. On the securities investment risk, this Report examines how the growing presence of non-bank financial intermediaries (NBFIs), e.g., investment funds, in the global financial system changes the risk profiles of Japan's financial institutions, in light of the experience in March 2020, when the global financial market suddenly became volatile. Then, in the macro stress testing, the resilience of Japan's financial institutions and the financial system are examined under two downside scenarios that reflect risks revealed from the analysis on the real economy and on the financial markets.

ii
Contents
Chapter I. Executive summary: Assessment of the stability of Japan's financial system and discussion of future challenges
1
Chapter II. Risks observed in financial and capital markets
A. Global financial markets
B. Japanese financial markets
3
Chapter III. Examination of financial intermediation
A. Financial intermediation by financial institutions
B. Financial intermediation by non-bank financial intermediaries
C. Financial cycle and vulnerability
13
Chapter IV. Risks faced by financial institutions
A. Domestic credit risk
B. Overseas credit risk
C. Market risk associated with securities investment
D. Foreign currency funding risk
E. Risks posed by structural changes in the business environment
35
iii
Chapter V. Examination of the resilience of the financial system
A. Financial institutions' profitability and capital adequacy
B. Macro stress testing
63
Chapter VI. Challenges to be met regarding risk management to ensure financial system stability and actions by the Bank
Box 1: The predictive power of financial activity indexes with regard to various types of banking crises
Box 2: Developments in the real estate market
Box 3: Impact of foreign investors in the commercial real estate market
Box 4: The structure of project finance loans and recovery rates
Box 5: Global structural changes in the transmission channels of market shocks
Box 6: The impact of floods on firms' financial conditions
83
Glossary 111
1
I. Executive summary: Assessment of the stability of Japan's financial system and discussion of future challenges
Current assessment of the stability of Japan's financial system
Japan's financial system has been maintaining stability on the whole, while COVID-19 continues to have a significant impact on economic and financial activity at home and abroad.
The Japanese government and the Bank of Japan, in close cooperation with overseas authorities, swiftly implemented large-scale fiscal and monetary policy measures and took flexible regulatory and supervisory actions to support economic activity and maintain the functioning of financial markets. Firms that are significantly affected by the spread of COVID-19 experience funding difficulties. However, underpinned by the financial soundness of financial institutions on the whole, the policy responses have been effective and the financial intermediation function is being fulfilled smoothly. In financial markets, investors' risk sentiment has improved and inflows of funds to the stock market and emerging market economies have been increasing rapidly.
Future risks and caveats
According to the results of the macro stress testing, even in the case of future resurgence of COVID-19, Japan's financial system is likely to remain highly robust as financial institutions have improved their financial soundness after the global financial crisis (GFC). However, in the event of a substantial and rapid adjustment in global financial markets, a deterioration in financial institutions' financial soundness and the resultant impairment of the smooth functioning of financial intermediation could pose a risk of further downward pressure on the real economy.
In this regard, the following three risks warrant particular attention. The first risk is an increase in credit costs due to a delay in economic recovery at home and abroad. According to a simulation that takes into account that firms' challenge is gradually shifting from securing funds to repaying debts, credit risk of domestic loans will be contained when the economy follows a recovery trend. Underpinned by the fact that firms on the whole have maintained their financial soundness, various measures to support corporate financing seem to be highly effective in restraining that risk. However, as the impact of COVID-19 significantly varies across firms and industries, if there is a delay in the recovery, there is a risk of an adverse impact on the creditworthiness of loans to firms that are significantly affected by COVID-19 and of loans embedded vulnerabilities since before the outbreak. Regarding the vulnerabilities, attention should be paid to the developments in the changing conditions in the real estate market, which is closely related to financial institutions' businesses, and in the profits of borrowers with a large amount of borrowings that significantly increased their leverage in relation to merger and acquisition (M&A) deals.
Credit risk of overseas loans is generally contained, as the amount of Japanese banks' overseas loans to industries that are severely affected by COVID-19 are not so large. Nevertheless, attention regarding energy-related exposure needs to be paid to the possibility of a significant decline in crude oil demand in the long run, as the impact of global efforts toward achieving a low carbon economy is likely to strengthen. Exposure related to air transportation also deserves attention as there is significant uncertainty over the industry's future demand.
The second risk is a deterioration in gains/losses on securities investment due to substantial adjustments in financial markets. Under the prolonged low interest rate environment in Japan, Japanese financial institutions have been actively investing, particularly in domestic and overseas credit products and investment trusts, to search for yield. Meanwhile, the importance of non-bank

2
financial intermediaries (NBFIs) such as investment funds in financial intermediation activities has been growing in the global financial system. An analysis on structural changes in the cross-border network mediated through securities investment shows that the impact of foreign investment funds' transactions on the prices of Japanese financial institutions' securities portfolios has been increasing. This suggests that, due to a growing interlinkage between the Japanese and overseas financial systems, the market risk that Japanese financial institutions face at times of stress is amplified by the activities of overseas NBFIs.
The third risk is a destabilization of foreign currency funding due to the tightening of foreign currency funding markets, mainly for the U.S. dollar. During the March 2020 market turmoil, foreign currency-denominated loans of Japanese banks increased sharply due to the withdrawal of funds from their committed lines. At the same time, some difficulties were observed temporarily in their market funding of foreign currency. Japanese banks' recent efforts to stabilize their funding, as well as the effect of an enhancement of the U.S. dollar liquidity swap line arrangements by six central banks, helped to prevent major disruptions in their foreign currency funding. Based on the lessons learned from the experience of the March 2020 market turmoil, the shift in their focus of attention from securing the stability of their foreign currency funding to cost reductions requires continued vigilance, as the improvement in the profitability of overseas operations is becoming an increasingly important management challenge for Japanese banks.
Even after the pandemic subsides, it is likely that the low interest rate environment and structural factors will continue to exert downward pressure on financial institutions' profits. Against this backdrop, attention should be paid to the risk of a gradual pullback in financial intermediation, or on the contrary, to the possibility that the vulnerability of the financial system increases, mainly as a result of financial institutions' search for yield behavior.
Challenges for financial institutions and actions by the Bank of Japan
Future developments in the spread of COVID-19 and their impact on the domestic and overseas economies remain highly uncertain. Against this backdrop, the major challenge for financial institutions is to smoothly fulfill their financial intermediation function by balancing their financial soundness and risk taking. In this regard, (1) strengthened management of the three risks mentioned above, (2) offering support and adequate loan-loss provisioning based on the sustainability of borrowers' businesses, and (3) sound capital planning under considerable uncertainty are the keys to maintaining their financial soundness.
In Japan, the environment surrounding its economy and society is undergoing major changes, e.g., digital transformation and climate change, amid the decline in and aging of the population. Against this background, financial institutions are expected to contribute to achieving a sustainable society in the post-COVID-19 era by improving their services while maintaining their soundness.
The Bank of Japan, in close cooperation with the Japanese government and overseas financial authorities, will make efforts to ensure the stability of the financial system and the smooth functioning of financial intermediation. As part of such efforts, the Bank will facilitate the strengthening of business foundations of regional financial institutions through the Special Deposit Facility to Enhance the Resilience of the Regional Financial System. From a medium- to long-term perspective, the Bank will actively support financial institutions' initiatives by preparing institutional frameworks for the financial system, by taking measures to respond to climate-related financial risks, and by facilitating digital transformation.
3
II. Risks observed in financial and capital markets
This chapter summarizes the developments in financial markets within Japan and abroad, mainly during the second half of fiscal 2020, and examines the risks observed from market developments.1
A. Global financial markets
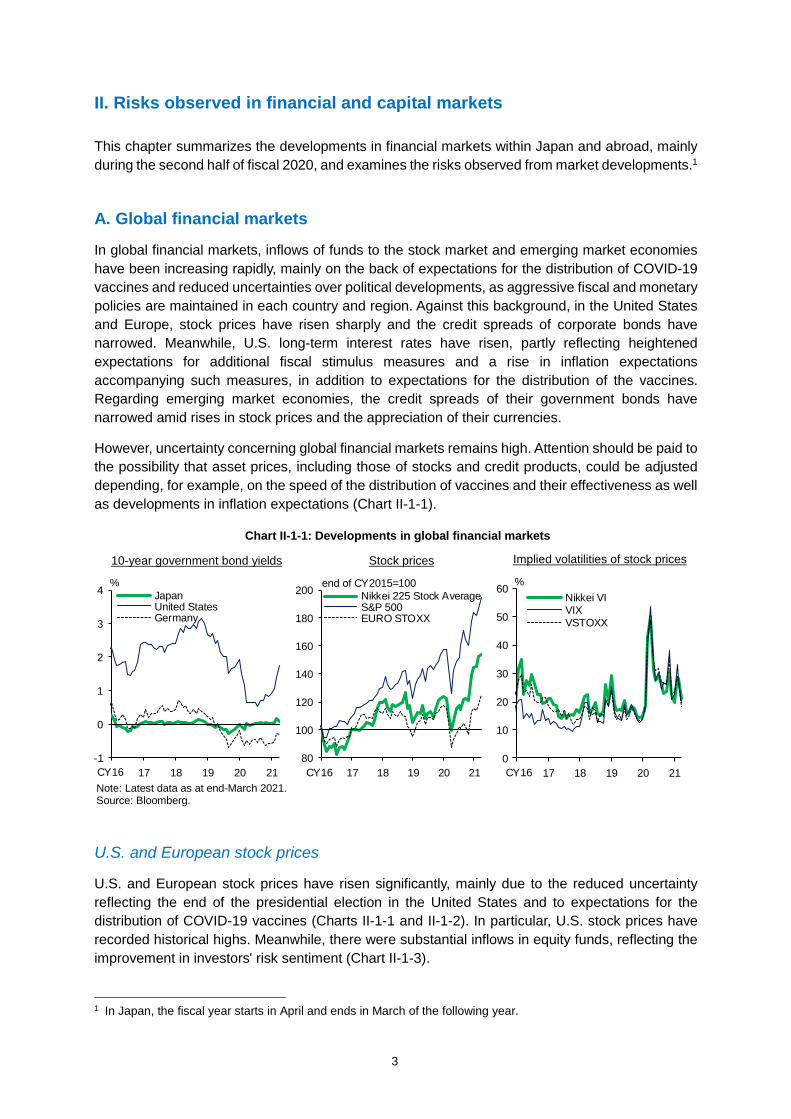
In global financial markets, inflows of funds to the stock market and emerging market economies have been increasing rapidly, mainly on the back of expectations for the distribution of COVID-19 vaccines and reduced uncertainties over political developments, as aggressive fiscal and monetary policies are maintained in each country and region. Against this background, in the United States and Europe, stock prices have risen sharply and the credit spreads of corporate bonds have narrowed. Meanwhile, U.S. long-term interest rates have risen, partly reflecting heightened expectations for additional fiscal stimulus measures and a rise in inflation expectations accompanying such measures, in addition to expectations for the distribution of the vaccines. Regarding emerging market economies, the credit spreads of their government bonds have narrowed amid rises in stock prices and the appreciation of their currencies.
However, uncertainty concerning global financial markets remains high. Attention should be paid to the possibility that asset prices, including those of stocks and credit products, could be adjusted depending, for example, on the speed of the distribution of vaccines and their effectiveness as well as developments in inflation expectations (Chart II-1-1).
U.S. and European stock prices
U.S. and European stock prices have risen significantly, mainly due to the reduced uncertainty reflecting the end of the presidential election in the United States and to expectations for the distribution of COVID-19 vaccines (Charts II-1-1 and II-1-2). In particular, U.S. stock prices have recorded historical highs. Meanwhile, there were substantial inflows in equity funds, reflecting the improvement in investors' risk sentiment (Chart II-1-3).
1 In Japan, the fiscal year starts in April and ends in March of the following year.
Chart II-1-1: Developments in global financial markets
Note: Latest data as at end-March 2021. Source: Bloomberg.
10-year government bond yields Stock prices Implied volatilities of stock prices
-1
0
1
2
3
4
16 17 18 19 20 21
JapanUnited StatesGermany
%
CY1680
100
120
140
160
180
200
16 17 18 19 20 21
Nikkei 225 Stock AverageS&P 500EURO STOXX
CY16
end of CY2015=100
0
10
20
30
40
50
60
16 17 18 19 20 21
Nikkei VIVIXVSTOXX
%
CY16

4
Looking at U.S. and European stock prices by sector, rises have been significant in cyclical sectors -- such as energy and materials-related ones, in which recovery of stock prices was relatively delayed -- on the back of expectations for additional fiscal stimulus measures under the new U.S. administration and for economic recovery driven by the distribution of vaccines. Stock prices in the financial sector have also risen, partly due to the increase in U.S. long-term interest rates (Chart II-1-4).
Meanwhile, expected earnings per share (EPS) for U.S. and European firms has been rising as the impact of COVID-19 on economic activity has generally been limited compared to early spring 2020, but in Europe it has not yet recovered to the level seen before the COVID-19 outbreak (Chart II-1-5). Price-earnings (P/E) ratios have been at high levels (Chart II-1-2). In addition, volatility has remained high, although it is becoming lower than in March 2020 (Chart II-1-1).
Chart II-1-3: Net flows in global equity funds
Note: Latest data as at March 31, 2021 (weekly data). Source: EPFR Global; Haver Analytics. -100
0
100
200
300
400
500
600
cumulative amount from the beginning of CY2020,bil. U.S. dollars
2020 21
Net inflow
Net outf low
Jan. Apr. July Oct. Jan.
United States Europe Japan Chart II-1-2: Stock prices and valuation
Note: 1. "Stock prices" indicates the S&P 500 for the United States, the EURO STOXX for Europe, and the TOPIX for Japan. "P/E ratios" is calculated using expected EPS for the next 12 months.
2. Latest data as at end-March 2021. Source: Datastream from Refinitiv.
0
500
1,000
1,500
2,000
2,500
3,000
3,500
4,000
8
10
12
14
16
18
20
22
24
07 09 11 13 15 17 19 21
P/E ratios (lhs)Stock prices (rhs)
ratio
CY07
pts
Average of P/E ratiosfrom 2007 to 2020 0
100
200
300
400
500
600
700
6
8
10
12
14
16
18
20
07 09 11 13 15 17 19 21
ratio pts
CY07300
600
900
1,200
1,500
1,800
2,100
5
10
15
20
25
30
35
07 09 11 13 15 17 19 21
ratio pts
CY07

5
U.S. and European credit markets
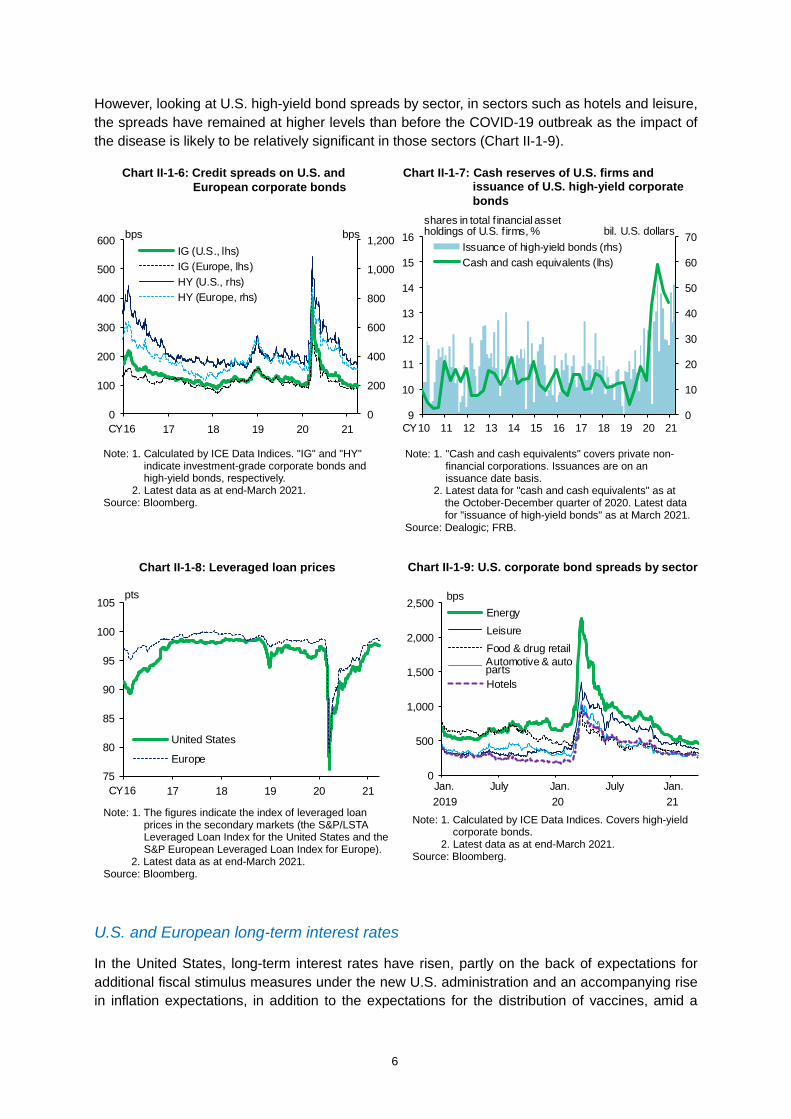
In U.S. and European credit markets, credit spreads have narrowed, partly due to expectations for economic recovery mainly driven by the distribution of vaccines, with interest rates remaining low globally and investors continuing to search for yield (Chart II-1-6). It has been pointed out that the narrowing of U.S. high-yield bond spreads has been partly attributable to subsiding concerns about firms' funding conditions, in addition to expectations for economic recovery, as firms have been securing ample cash reserves by, for example, issuing a large volume of corporate bonds under accommodative financial conditions (Chart II-1-7). Meanwhile, the prices of leveraged loans have generally recovered to the levels seen before the COVID-19 outbreak (Chart II-1-8).
Chart II-1-4: U.S. and European stock price performance by sector
Note: Latest data as at end-March 2021. Source: Bloomberg.
United States Europe
-60-50-40-30-20-10
01020304050
Ener
gy
Utili
ties
Rea
l est
ate
Con
sum
er s
tapl
es
Fina
ncia
ls
Hea
lth c
are
Indu
stria
ls
S&P5
00
Mat
eria
ls
Com
mun
icat
ion
serv
ices
Con
sum
er d
iscr
etio
nary
Info
rmat
ion
tech
nolo
gy
From the beginning of Oct. 2020From Jan. 1 to Sep. 30, 2020From the beginning of Jan. 2020
% chg.
-50-40-30-20-10
01020304050
Oil
& ga
sR
eal e
stat
eFo
od &
bev
erag
eBa
nks
Tele
com
mun
icatio
nsIn
sura
nce
Hea
lth c
are
Con
stru
ctio
n &
mat
eria
lsFi
nanc
ial s
ervi
ces
EUR
O S
TOXX
Med
iaTr
avel
& le
isur
eU
tilitie
sR
etai
lIn
dust
rial g
oods
& s
ervi
ces
Basi
c re
sour
ces
Che
mic
als
Pers
onal
& h
ouse
hold
goo
dsAu
tom
obile
s &
parts
Tech
nolo
gy
From the beginning of Oct. 2020From Jan. 1 to Sep. 30, 2020From the beginning of Jan. 2020
% chg.
Chart II-1-5: Expected EPS
Note: 1. "Japan," "United States," and "Europe" indicate expected EPS for the next 12 months of the TOPIX, the S&P 500, and the EURO STOXX, respectively. 4-week backward moving averages.
2. Latest data as at March 25, 2021. Source: Datastream from Refinitiv. 18
20
22
24
26
28
30
32
60
80
100
120
140
160
180
200
16 17 18 19 20 21
Japan (lhs)United States (lhs)Europe (rhs)
CY16
pts pts
6
However, looking at U.S. high-yield bond spreads by sector, in sectors such as hotels and leisure, the spreads have remained at higher levels than before the COVID-19 outbreak as the impact of the disease is likely to be relatively significant in those sectors (Chart II-1-9).
U.S. and European long-term interest rates
In the United States, long-term interest rates have risen, partly on the back of expectations for additional fiscal stimulus measures under the new U.S. administration and an accompanying rise in inflation expectations, in addition to the expectations for the distribution of vaccines, amid a
Note: 1. The figures indicate the index of leveraged loan prices in the secondary markets (the S&P/LSTA Leveraged Loan Index for the United States and the S&P European Leveraged Loan Index for Europe).
2. Latest data as at end-March 2021. Source: Bloomberg.
Chart II-1-8: Leveraged loan prices
75
80
85
90
95
100
105
16 17 18 19 20 21
United States
Europe
pts
CY16
Note: 1. Calculated by ICE Data Indices. "IG" and "HY" indicate investment-grade corporate bonds and high-yield bonds, respectively.
2. Latest data as at end-March 2021. Source: Bloomberg.
Chart II-1-6: Credit spreads on U.S. and European corporate bonds
0
200
400
600
800
1,000
1,200
0
100
200
300
400
500
600
16 17 18 19 20 21
IG (U.S., lhs)IG (Europe, lhs)HY (U.S., rhs)HY (Europe, rhs)
bps
CY16
bps
Chart II-1-7: Cash reserves of U.S. firms and issuance of U.S. high-yield corporate bonds
Note: 1. "Cash and cash equivalents" covers private non-financial corporations. Issuances are on an issuance date basis.
2. Latest data for "cash and cash equivalents" as at the October-December quarter of 2020. Latest data for "issuance of high-yield bonds" as at March 2021.
Source: Dealogic; FRB.
0
10
20
30
40
50
60
70
9
10
11
12
13
14
15
16
10 11 12 13 14 15 16 17 18 19 20 21
Issuance of high-yield bonds (rhs)Cash and cash equivalents (lhs)
shares in total f inancial assetholdings of U.S. f irms, % bil. U.S. dollars
CY
Chart II-1-9: U.S. corporate bond spreads by sector
Note: 1. Calculated by ICE Data Indices. Covers high-yield corporate bonds.
2. Latest data as at end-March 2021. Source: Bloomberg.
0
500
1,000
1,500
2,000
2,500EnergyLeisureFood & drug retail
Hotels
bps
Jan. July Jan. July Jan.2019 20 21
Automotive & autoparts

7
general perception that accommodative financial conditions will be maintained (Charts II-1-1 and II-1-10). In Europe, yields on government bonds have risen, mainly in Germany and France, in tandem with U.S. long-term interest rates (Chart II-1-11).
Emerging markets
Looking at emerging markets as a whole, given the improvement in investors' risk sentiment, mainly led by the expectations for the distribution of COVID-19 vaccines, stock prices have risen, currencies have appreciated, and credit spreads of government bonds in emerging market economies have narrowed (Charts II-1-12 and II-1-13). Meanwhile, regarding bond and equity fund flows to emerging market economies, significant inflows have been seen, reflecting expectations for economic recovery (Chart II-1-14).
Note: Latest data as at end-March 2021. Source: Bloomberg.
Chart II-1-11: 10-year European government bond yields
-1
0
1
2
3
4
16 17 18 19 20 21
ItalySpainFranceGermany
%
CY16
Source: Bloomberg; FRB.
Chart II-1-10: Federal funds futures curves
0.0
0.1
0.2
0.3
0.4
21/3 21/9 22/3 22/9
End-Mar. 2021End-Dec. 2020End-Sep. 2020
Median of the FOMC participants' projections of the target FF rate as at March 2021
%
Mar. Sep. Mar. Sep.2021 22
Note: 1. "Stock prices" indicates the MSCI EM Local Index. "Currencies" indicates the J.P. Morgan EMCI Index.
2. Latest data as at end-March 2021. Source: Bloomberg.
Chart II-1-12: Stock prices and currencies in emerging market economies
70
80
90
100
110
120
130
140
18 19 20 21
Stock pricesCurrencies
beginning of CY2018=100
CY18
Note: 1. Yield spreads of the EMBI Global over U.S. Treasuries. 2. Latest data as at end-March 2021.
Source: Bloomberg.
Chart II-1-13: Credit spreads in emerging market economies
200
300
400
500
600
700
18 19 20 21
bps
CY18

8
B. Japanese financial markets
In Japanese financial markets, both short- and long-term interest rates were generally stable during the second half of fiscal 2020 as the Bank of Japan has continued Quantitative and Qualitative Monetary Easing (QQE) with Yield Curve Control. During the observation period, Japanese stock prices have risen significantly, mainly reflecting expectations for global economic recovery driven by the distribution of COVID-19 vaccines.
Short- and long-term interest rates
Short-term interest rates on both overnight and term instruments have been in negative territory on the whole (Chart II-2-1). Under QQE with Yield Curve Control, the slope of the yield curve for JGBs has been in line with the current guideline for market operations, in which the short-term policy interest rate is set at minus 0.1 percent and the target level of 10-year JGB yields is around 0 percent (Charts II-2-2 and II-2-3).
Note: Latest data as at March 2021. Source: EPFR Global; Haver Analytics.
Chart II-1-14: Net flows in emerging market funds
-60
-40
-20
0
20
40
16 17 18 19 20 21
StocksBonds
Net inf low
Net outf low
bil. U.S. dollars
CY16
Chart II-2-1: Short-term rates Overnight rates 3-month rates
Note: 1. In the left-hand chart, the horizontal axis indicates the starting date of transaction settlement. Up to April 27, 2018, "GC repo rate (O/N)" indicates the T/N rate.
2. In the right-hand chart, "FX swap-implied rate" is estimated based on the U.S. dollar LIBOR and FX swap (forward spread).
3. In both charts, the latest data are as at end-March 2021. Source: Bloomberg; Japan Bond Trading; JSDA; BOJ.
-1.0
-0.8
-0.6
-0.4
-0.2
0.0
0.2
16 17 18 19 20 21
%
Uncollateralized call rate (O/N)
GC repo rate (O/N)
CY16-2.0
-1.6
-1.2
-0.8
-0.4
0.0
0.4
16 17 18 19 20 21
T-billLIBORTIBORFX swap-implied rate
%
CY16

9
Liquidity and functioning of JGB markets
The liquidity and functioning of JGB markets have been recovering from a state of significant deterioration observed around spring 2020. Liquidity indicators of market depth and resiliency have improved (Chart II-2-4).2 Inter-dealer transaction volume for cash JGBs, which remained low during 2020, has seen an increase in its level somewhat recently (Chart II-2-5). Under these circumstances, the latest Bond Market Survey (February 2021) shows that the diffusion index for the degree of bond market functioning from the surveyed institutions' viewpoint has increased somewhat from the previous round of the survey conducted in November 2020, although it remains deep in negative territory (Chart II-2-6).
2 For details, see the Bank of Japan's website (https://www.boj.or.jp/en/paym/bond/index.htm/#p02). The Financial Markets Department of the Bank generally updates and releases liquidity indicators of the JGB markets on a quarterly basis.
Chart II-2-2: JGB yield curves
Source: Bloomberg.
-0.2
-0.1
0.0
0.1
0.2
0.3
0.4
0.5
0.6
0.7
1 2 3 4 5 6 7 8 9 10 15 20 30
End-Sep. 2020End-Mar. 2021
%
years
Chart II-2-3: 10-year JGB yields
Note: Latest data as at end-March 2021. Source: Bloomberg.
-0.4
-0.2
0.0
0.2
0.4
0.6
0.8
1.0
13 14 15 16 17 18 19 20 21
%
CY13
Chart II-2-4: Market depth and resiliency in JGB futures markets Market depth Resiliency (price impact)
Note: 1. In the left-hand chart, the figures are the number of orders at the best-ask price with 1-minute frequency (median for each business day). In the right-hand chart, the figures indicate the price change per unit volume of transactions for each business day.
2. 10-day backward moving averages. Latest data as at end-February 2021. Source: Nikkei Inc., "NEEDS."
0
50
100
150
200
250
300
35012 13 14 15 16 17 18 19 20 21
inverse scale, number of best-ask orders
CY12
Low er liquidity
Higher liquidity
0
200
400
600
800
1,000
1,200
1,400
1,600
1,800
12 13 14 15 16 17 18 19 20 21
average of CY2012=100
CY12
Low er liquidity
Higher liquidity

10
U.S. dollar funding environment
Premiums for U.S. dollar funding through the dollar/yen foreign exchange swap market have returned to mostly the same levels as before the COVID-19 outbreak (Chart II-2-7).
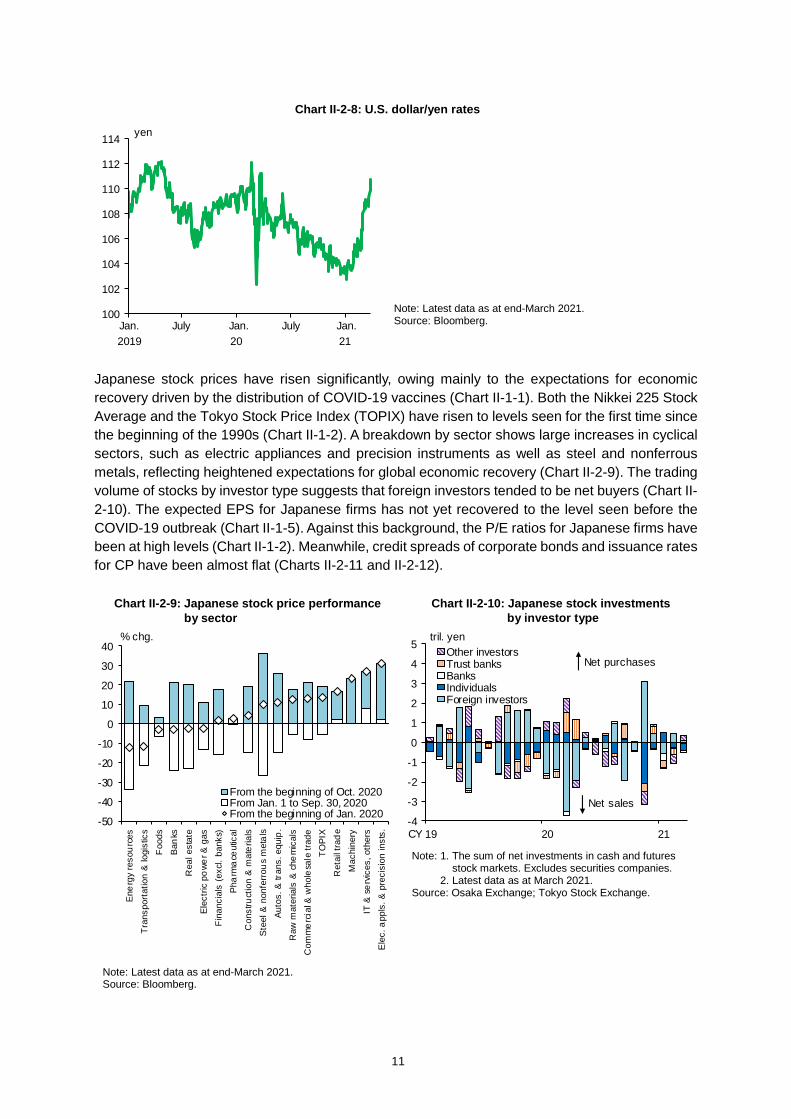
FX markets and stock and credit markets
In FX markets, the yen has depreciated against the U.S. dollar (Chart II-2-8).
Note: Inter-dealer transaction volume for cash JGBs (2-, 5-, 10-, 20-, 30-, and 40-year JGBs) via Japan Bond Trading. Latest data as at March 2021.
Source: Japan Bond Trading; QUICK.
Chart II-2-5: Transaction volume in JGB markets
0.0
0.2
0.4
0.6
0.8
1.0
15 16 17 18 19 20 21
On-the-run bondsOther bonds
CY15
tril. yen/day
Note: 1. Based on the proportion of responding institutions selecting a given choice, the DI is calculated as follows: DI for the degree of current bond market functioning = "high" - "low."
2. The data from February 2018 onward cover major institutional investors. Latest data are based on the February 2021 survey.
Source: BOJ, "Bond market survey."
Chart II-2-6: Bond market survey
-60
-50
-40
-30
-20
-10
0
10
20
15 16 17 18 19 20 21
DI for the degree of bond market functioning, % pts
High
Low
CY15
Chart II-2-7: U.S. dollar funding premiums
Note: 1. 1-year cross-currency basis swaps. 2. Latest data as at end-March 2021.
Source: Bloomberg.
-80
-70
-60
-50
-40
-30
-20
-10
0
10
Japanese yenBritish poundEuro
inverse scale, bps
Jan. Apr. July Oct. Jan. Apr. July Oct. Jan.2019 20 21
11
Japanese stock prices have risen significantly, owing mainly to the expectations for economic recovery driven by the distribution of COVID-19 vaccines (Chart II-1-1). Both the Nikkei 225 Stock Average and the Tokyo Stock Price Index (TOPIX) have risen to levels seen for the first time since the beginning of the 1990s (Chart II-1-2). A breakdown by sector shows large increases in cyclical sectors, such as electric appliances and precision instruments as well as steel and nonferrous metals, reflecting heightened expectations for global economic recovery (Chart II-2-9). The trading volume of stocks by investor type suggests that foreign investors tended to be net buyers (Chart II-2-10). The expected EPS for Japanese firms has not yet recovered to the level seen before the COVID-19 outbreak (Chart II-1-5). Against this background, the P/E ratios for Japanese firms have been at high levels (Chart II-1-2). Meanwhile, credit spreads of corporate bonds and issuance rates for CP have been almost flat (Charts II-2-11 and II-2-12).
Chart II-2-8: U.S. dollar/yen rates
Note: Latest data as at end-March 2021. Source: Bloomberg. 100
102
104
106
108
110
112
114 yen
Jan. July Jan. July Jan. 2019 20 21
Note: 1. The sum of net investments in cash and futures stock markets. Excludes securities companies.
2. Latest data as at March 2021. Source: Osaka Exchange; Tokyo Stock Exchange.
Chart II-2-10: Japanese stock investments by investor type
-4
-3
-2
-1
0
1
2
3
4
5
19 20 21
Other investorsTrust banksBanksIndividualsForeign investors
tril. yen
CY
Net purchases
Net sales
Chart II-2-9: Japanese stock price performance by sector
Note: Latest data as at end-March 2021. Source: Bloomberg.
-50
-40
-30
-20
-10
0
10
20
30
40
Ene
rgy
reso
urce
sTr
ansp
orta
tion
& lo
gist
ics
Foo
dsB
anks
Rea
l est
ate
Elec
tric
po
wer &
gas
Fin
anci
als
(exc
l. ba
nks)
Pha
rma
ceut
ical
Con
stru
ctio
n &
mat
eria
lsS
teel
& n
onfe
rrou
s m
etal
sAu
tos.
& tr
ans.
equ
ip.
Raw
mat
eria
ls &
che
mic
als
Com
me
rcia
l & w
hole
sale
trad
eTO
PIX
Ret
ail t
rad
eM
achi
nery
IT &
ser
vice
s, o
ther
sE
lec.
app
ls. &
pre
cisi
on in
sts.
From the beginning of Oct. 2020From Jan. 1 to Sep. 30, 2020From the beginning of Jan. 2020
% chg.

12
Note: 1. Yield spreads of corporate bonds with remaining maturity of 3 or more years but less than 7 years over government bonds. Rated by R&I.
2. Latest data as at end-March 2021. Source: Bloomberg; JSDA; QUICK.
Chart II-2-11: Credit spreads on corporate bonds
0.0
0.5
1.0
1.5
2.0
08 10 12 14 16 18 20
AA-rated
A-rated
CY08
%
Note: 1. Average rates of issuance for CP issued by business companies with remaining maturity of 3 months. In principle, rated by R&I.
2. Latest data as at March 26, 2021 (weekly data). Source: JASDEC.
Chart II-2-12: CP issuance rates
-0.1
0.0
0.1
0.2
0.3
0.4
0.5a-1+ rateda-1 rateda-2 rated or lower
%
Jan. Apr. July Oct. Jan. Apr. July Oct. Jan.2019 20 21
13
III. Examination of financial intermediation
This chapter examines developments in financial intermediation, mainly based on information that was available in the second half of fiscal 2020, focusing on financial intermediation by financial institutions (i.e., banks and shinkin banks) and NBFIs.
A. Financial intermediation by financial institutions
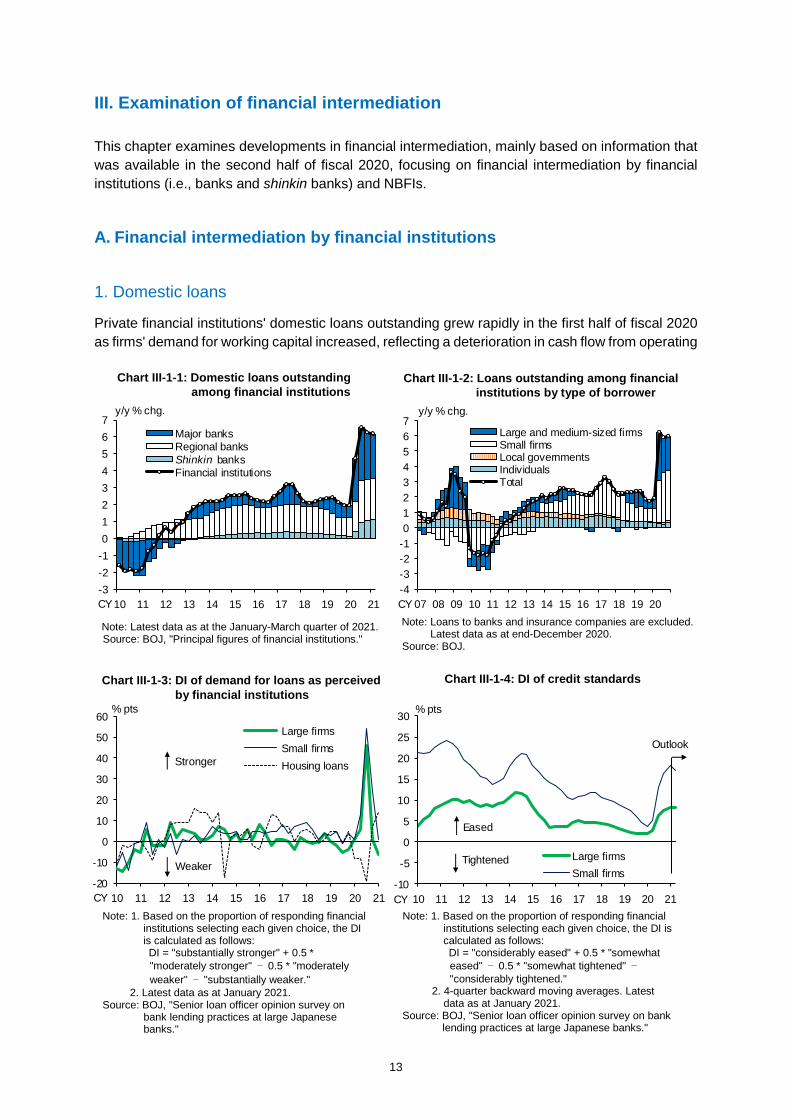
1. Domestic loans
Private financial institutions' domestic loans outstanding grew rapidly in the first half of fiscal 2020 as firms' demand for working capital increased, reflecting a deterioration in cash flow from operating
Chart III-1-3: DI of demand for loans as perceived by financial institutions
-20
-10
0
10
20
30
40
50
60
10 11 12 13 14 15 16 17 18 19 20 21
Large firmsSmall firmsHousing loans
CY
Stronger
Weaker
% pts
Note: 1. Based on the proportion of responding financial institutions selecting each given choice, the DI is calculated as follows: DI = "substantially stronger" + 0.5 * "moderately stronger" − 0.5 * "moderately weaker" − "substantially weaker."
2. Latest data as at January 2021. Source: BOJ, "Senior loan officer opinion survey on
bank lending practices at large Japanese banks."
Chart III-1-4: DI of credit standards
-10
-5
0
5
10
15
20
25
30
10 11 12 13 14 15 16 17 18 19 20 21
Large firmsSmall firms
Eased
Tightened
Outlook
% pts
CYNote: 1. Based on the proportion of responding financial
institutions selecting each given choice, the DI is calculated as follows: DI = "considerably eased" + 0.5 * "somewhat eased" − 0.5 * "somewhat tightened" − "considerably tightened."
2. 4-quarter backward moving averages. Latest data as at January 2021.
Source: BOJ, "Senior loan officer opinion survey on bank lending practices at large Japanese banks."
Chart III-1-2: Loans outstanding among financial institutions by type of borrower
-4-3-2-101234567
07 08 09 10 11 12 13 14 15 16 17 18 19 20
Large and medium-sized firmsSmall firmsLocal governmentsIndividualsTotal
y/y % chg.
CYNote: Loans to banks and insurance companies are excluded.
Latest data as at end-December 2020. Source: BOJ.
Chart III-1-1: Domestic loans outstanding among financial institutions
Note: Latest data as at the January-March quarter of 2021. Source: BOJ, "Principal figures of financial institutions."
-3-2-101234567
10 11 12 13 14 15 16 17 18 19 20 21
Major banksRegional banks banksFinancial institutions
CY
y/y % chg.
Shinkin

14
activities due to the spread of COVID-19; however, growth has slowed, albeit slightly, from the second half of the fiscal year (Charts III-1-1, III-1-2, and III-1-3). As for loans to firms, large firms in particular have been making repayments from cash reserves built up during the pandemic through borrowing; growth in loans to large and medium-sized firms has slowed since peaking in summer 2020, and that to small firms has leveled off since autumn 2020. While loans to individuals have continued to increase, the pace has been slowing.
By type of bank, while the annual growth rate of domestic loans outstanding has slowed for major banks, it is more or less unchanged for regional banks and has increased for shinkin banks. The lending stance of financial institutions continues to be active (Chart III-1-4).
Developments in loans by type of borrower
Loans to firms have continued to see a relatively high increase in a wide range of industries, such as manufacturing, wholesale and retail, transportation and postal services, food services and accommodations, and real estate, although the growth rate has declined somewhat since autumn 2020, especially for the manufacturing industry (Chart III-1-5). By type of loan (other than those to real estate firms, which are described later), growth in loans for working capital to large and medium-sized firms has decelerated since its peak in summer 2020, while that to small firms is more or less unchanged after an acceleration through autumn 2020. The pace of increase in loans to small firms for business fixed investment has recently decelerated (Chart III-1-6).
Chart III-1-6: Corporate loans outstanding by size of firm and type of loan
Large and medium-sized firms Small firms
Note: Loans to the real estate industry, banks, and insurance companies are excluded. Latest data as at end-December 2020.
Source: BOJ. -3
0
3
6
9
12
15
18
16 17 18 19 20
Loans for working capital by major banks
Loans for working capital by regional financialinstitutionsLoans for business fixed investment by major banks
Loans for business fixed investment by regionalfinancial institutionsTotal
y/y % chg.
CY 16 17 18 19 20
Chart III-1-5: Banks' corporate loans outstanding by industry
Note: Loans to banks and insurance companies, overseas yen loans, and domestic loans transferred overseas are excluded. Latest data as at end-December 2020.
Source: BOJ.
-2-10123456789
10
14 15 16 17 18 19 20
Real estateMedical and nursing careManufacturingConstructionElectricity and gasFinanceWholesale and retailGoods rental and leasingTransportation and postal servicesFood services and accommodationsOther industriesTotal
y/y % chg.
CY

15
With regard to loans to individuals, growth in housing loans -- which account for a large share of loans to individuals -- decelerated somewhat in the first half of fiscal 2020, partly because housing suppliers scaled down their sales activities amid the ongoing impact of COVID-19; however, since the second half of the fiscal year, growth has accelerated somewhat, due in part to the realization of pent-up demand for housing sales (Chart III-1-7). The annual rate of change in card loans has fallen further into negative territory, due in part to a drop in private consumption caused by the spread of COVID-19 (Chart III-1-8).
Developments in real estate loans
Growth in the outstanding amount of loans to the real estate industry accelerated in the first half of fiscal 2020, partly because, as in other industries, demand for working capital that may partially reflect precautionary motives grew due to the spread of COVID-19 (Chart III-1-9). However, since the second half of the fiscal year, growth has somewhat weakened.
Chart III-1-9: Real estate loans among financial institutions
-40
-20
0
20
40
60
-10
-5
0
5
10
15
07 08 09 10 11 12 13 14 15 16 17 18 19 20
Outstanding amount (lhs)Newly extended loans (rhs)
y/y % chg. y/y % chg.
CY0
100
200
300
400
500
0
20
40
60
80
100
80 85 90 95 00 05 10 15
Loans to real estate industry (lhs)Ref. Loans to all industries (rhs)
tril. yen
FY
tril. yen
Note: 1. The right-hand chart covers domestic banks only to extend the time scale. 2. In the left-hand chart, the latest data for "Outstanding amount" are as at end-December 2020 and the latest data for
"Newly extended loans" are as at the October-December quarter of 2020. In the right-hand chart, the latest data are as at end-March 2020.
Source: BOJ.
Chart III-1-7: Outstanding amount of housing loans among financial institutions
Note: Latest data as at end-December 2020. Source: BOJ.
-1
0
1
2
3
4
14 15 16 17 18 19 20
Major banksRegional banks banksTotal
y/y % chg.
Shinkin
CY
Chart III-1-8: Outstanding amount of card loans among financial institutions
Note: Latest data as at end-December 2020. Source: BOJ.
-10-8-6-4-202468
10
14 15 16 17 18 19 20
Major banksRegional banks banksTotal
y/y % chg.
Shinkin
CY
16
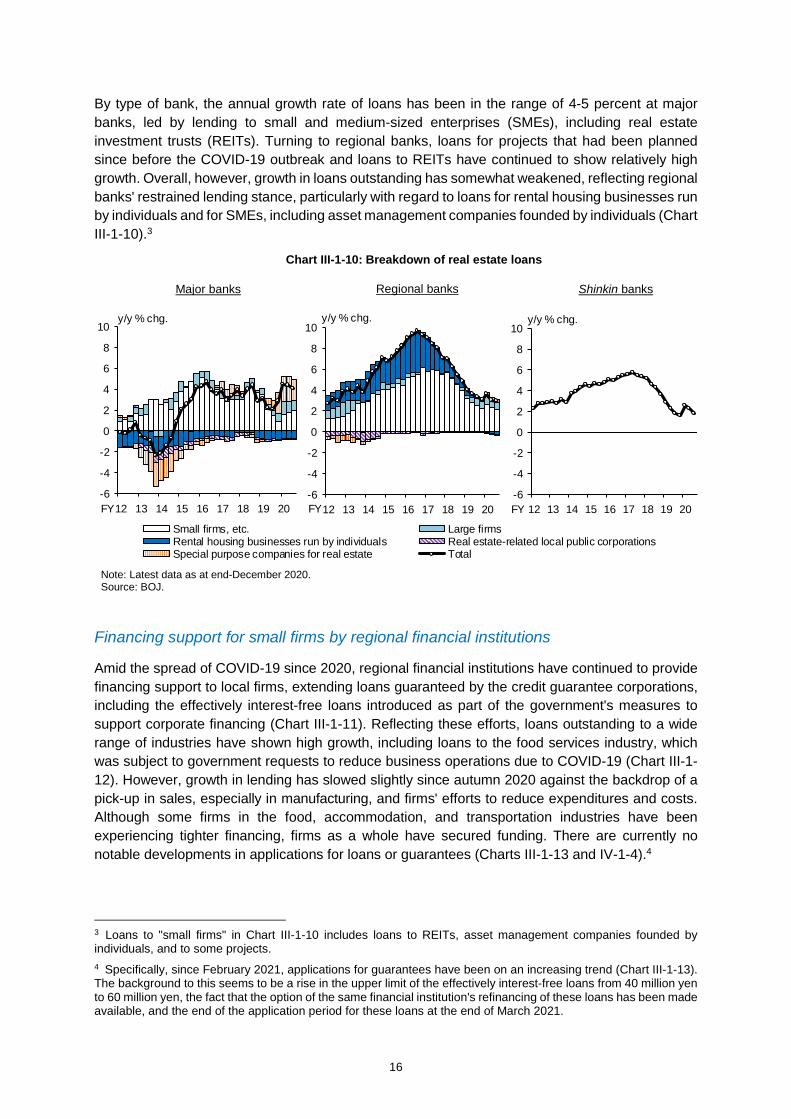
By type of bank, the annual growth rate of loans has been in the range of 4-5 percent at major banks, led by lending to small and medium-sized enterprises (SMEs), including real estate investment trusts (REITs). Turning to regional banks, loans for projects that had been planned since before the COVID-19 outbreak and loans to REITs have continued to show relatively high growth. Overall, however, growth in loans outstanding has somewhat weakened, reflecting regional banks' restrained lending stance, particularly with regard to loans for rental housing businesses run by individuals and for SMEs, including asset management companies founded by individuals (Chart III-1-10).3
Financing support for small firms by regional financial institutions
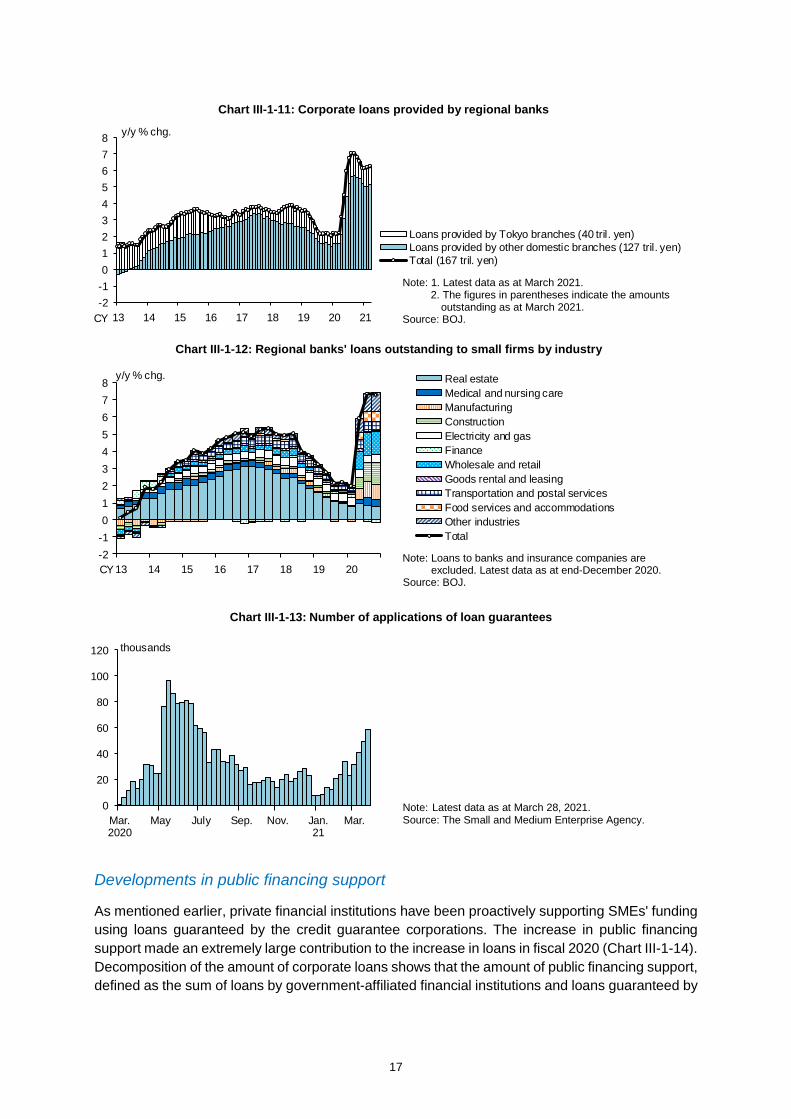
Amid the spread of COVID-19 since 2020, regional financial institutions have continued to provide financing support to local firms, extending loans guaranteed by the credit guarantee corporations, including the effectively interest-free loans introduced as part of the government's measures to support corporate financing (Chart III-1-11). Reflecting these efforts, loans outstanding to a wide range of industries have shown high growth, including loans to the food services industry, which was subject to government requests to reduce business operations due to COVID-19 (Chart III-1-12). However, growth in lending has slowed slightly since autumn 2020 against the backdrop of a pick-up in sales, especially in manufacturing, and firms' efforts to reduce expenditures and costs. Although some firms in the food, accommodation, and transportation industries have been experiencing tighter financing, firms as a whole have secured funding. There are currently no notable developments in applications for loans or guarantees (Charts III-1-13 and IV-1-4).4
3 Loans to "small firms" in Chart III-1-10 includes loans to REITs, asset management companies founded by individuals, and to some projects. 4 Specifically, since February 2021, applications for guarantees have been on an increasing trend (Chart III-1-13). The background to this seems to be a rise in the upper limit of the effectively interest-free loans from 40 million yen to 60 million yen, the fact that the option of the same financial institution's refinancing of these loans has been made available, and the end of the application period for these loans at the end of March 2021.
Chart III-1-10: Breakdown of real estate loans
Shinkin banks Regional banks Major banks
Note: Latest data as at end-December 2020. Source: BOJ.
-6
-4
-2
0
2
4
6
8
10
12 13 14 15 16 17 18 19 20
Small firms, etc. Large firmsRental housing businesses run by individuals Real estate-related local public corporationsSpecial purpose companies for real estate Total
y/y % chg.
FY-6
-4
-2
0
2
4
6
8
10
12 13 14 15 16 17 18 19 20
y/y % chg.
FY-6
-4
-2
0
2
4
6
8
10
12 13 14 15 16 17 18 19 20
y/y % chg.
FY
17
Developments in public financing support
As mentioned earlier, private financial institutions have been proactively supporting SMEs' funding using loans guaranteed by the credit guarantee corporations. The increase in public financing support made an extremely large contribution to the increase in loans in fiscal 2020 (Chart III-1-14). Decomposition of the amount of corporate loans shows that the amount of public financing support, defined as the sum of loans by government-affiliated financial institutions and loans guaranteed by
Chart III-1-12: Regional banks' loans outstanding to small firms by industry
Note: Loans to banks and insurance companies are excluded. Latest data as at end-December 2020.
Source: BOJ.
-2-1012345678
13 14 15 16 17 18 19 20
Real estateMedical and nursing careManufacturingConstructionElectricity and gasFinanceWholesale and retailGoods rental and leasingTransportation and postal servicesFood services and accommodationsOther industriesTotal
y/y % chg.
CY
Chart III-1-11: Corporate loans provided by regional banks
Note: 1. Latest data as at March 2021. 2. The figures in parentheses indicate the amounts
outstanding as at March 2021. Source: BOJ.
-2-1012345678
13 14 15 16 17 18 19 20 21
Loans provided by Tokyo branches (40 tril. yen)Loans provided by other domestic branches (127 tril. yen)Total (167 tril. yen)
y/y % chg.
CY
Chart III-1-13: Number of applications of loan guarantees
Note: Latest data as at March 28, 2021. Source: The Small and Medium Enterprise Agency.
0
20
40
60
80
100
120
Mar.2020
May July Sep. Nov. Jan.21
Mar.
thousands

18
the credit guarantee corporations, is quite large in fiscal 2020. The amount is comparable to that observed during the past financial crises (Chart III-1-15).
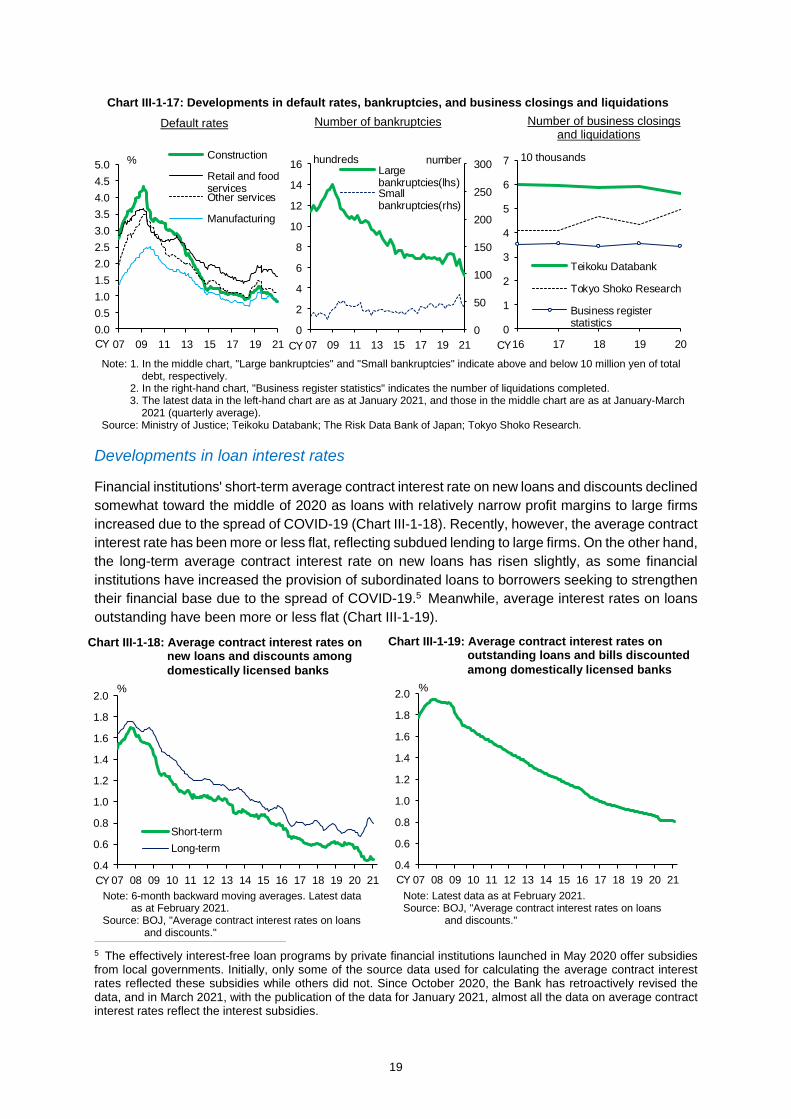
In the face of the rapid increase in public financing support, SMEs continue to perceive the lending attitudes of financial institutions as "accommodative," and the net balance of firms that perceive lending attitudes as "accommodative" is almost unchanged from before the outbreak of COVID-19. This is in stark contrast to the situation at the time of the GFC, when firms of all sizes tended to perceive financial institutions' lending attitudes as "severe" (Chart III-1-16). Thanks to the support, default rates continue to be low in all industries and the numbers of bankruptcies have remained at low levels for all debt size categories. Various surveys suggest that the numbers of business closings and liquidations so far remain low in general, although results vary depending on the definitions used (Chart III-1-17). As the challenge for firms will shift from securing funds to repaying debt, it will be necessary to continue to closely monitor developments, particularly in industries significantly impacted by COVID-19.
Chart III-1-14: Corporate loans outstanding by government-affiliated and private financial institutions
Note: The data for fiscal 2020 are as at end-December 2020. Source: Japan Federation of Credit Guarantee Corporations;
Published accounts of each financial institution; BOJ. -10
0
10
20
30
40
50
06 07 08 09 10 11 12 13 14 15 16 17 18 19 20
Private financial institutions' regular loans (notguaranteed by credit guarantee corporations)
Private financial institutions' loans guaranteed bycredit guarantee corporations
Government-affiliated financial institutions
Total
FY
change from previous period, tril. yen
Chart III-1-16: DI of lending attitude of financial institutions as perceived by firms
Note: Based on all industries. Latest data as at March 2021. Source: BOJ, "Tankan."
-20
-10
0
10
20
30
40
06 07 08 09 10 11 12 13 14 15 16 17 18 19 20 21
Large firmsSmall firms
% pts
CY
Accommodative
Severe
Chart III-1-15: Amount of loan guarantees approved by credit guarantee corporations
Note: The data for fiscal 2020 are as from April 2020 to February 2021.
Source: Japan Federation of Credit Guarantee Corporations.
0.0
0.5
1.0
1.5
2.0
0
5
10
15
20
25
30
35
80 85 90 95 00 05 10 15 20Amount of loan guarantees approved by creditguarantee corporations (lhs)
Amount of subrogation by credit guaranteecorporations (rhs)
tril. yen
FY
tril. yen
19
Developments in loan interest rates
Financial institutions' short-term average contract interest rate on new loans and discounts declined somewhat toward the middle of 2020 as loans with relatively narrow profit margins to large firms increased due to the spread of COVID-19 (Chart III-1-18). Recently, however, the average contract interest rate has been more or less flat, reflecting subdued lending to large firms. On the other hand, the long-term average contract interest rate on new loans has risen slightly, as some financial institutions have increased the provision of subordinated loans to borrowers seeking to strengthen their financial base due to the spread of COVID-19.5 Meanwhile, average interest rates on loans outstanding have been more or less flat (Chart III-1-19).
5 The effectively interest-free loan programs by private financial institutions launched in May 2020 offer subsidies from local governments. Initially, only some of the source data used for calculating the average contract interest rates reflected these subsidies while others did not. Since October 2020, the Bank has retroactively revised the data, and in March 2021, with the publication of the data for January 2021, almost all the data on average contract interest rates reflect the interest subsidies.
0.4
0.6
0.8
1.0
1.2
1.4
1.6
1.8
2.0
07 08 09 10 11 12 13 14 15 16 17 18 19 20 21
Short-termLong-term
%
CY
Chart III-1-18: Average contract interest rates on new loans and discounts among domestically licensed banks
Note: 6-month backward moving averages. Latest data as at February 2021.
Source: BOJ, "Average contract interest rates on loans and discounts."
0.4
0.6
0.8
1.0
1.2
1.4
1.6
1.8
2.0
07 08 09 10 11 12 13 14 15 16 17 18 19 20 21
%
CY
Chart III-1-19: Average contract interest rates on outstanding loans and bills discounted among domestically licensed banks
Note: Latest data as at February 2021. Source: BOJ, "Average contract interest rates on loans
and discounts."
Chart III-1-17: Developments in default rates, bankruptcies, and business closings and liquidations
Number of bankruptcies
Note: 1. In the middle chart, "Large bankruptcies" and "Small bankruptcies" indicate above and below 10 million yen of total debt, respectively.
2. In the right-hand chart, "Business register statistics" indicates the number of liquidations completed. 3. The latest data in the left-hand chart are as at January 2021, and those in the middle chart are as at January-March
2021 (quarterly average). Source: Ministry of Justice; Teikoku Databank; The Risk Data Bank of Japan; Tokyo Shoko Research.
Default rates Number of business closings and liquidations
0
1
2
3
4
5
6
7
16 17 18 19 20
Teikoku Databank
Tokyo Shoko Research
Business registerstatistics
10 thousands
CY0
50
100
150
200
250
300
0
2
4
6
8
10
12
14
16
07 09 11 13 15 17 19 21
Largebankruptcies(lhs)Smallbankruptcies(rhs)
hundreds number
CY0.00.51.01.52.02.53.03.54.04.55.0
07 09 11 13 15 17 19 21
Construction
Retail and foodservicesOther services
Manufacturing
%
CY

20
2. Overseas loans
Overseas loans increased around March 2020, at the time of the global outbreak of COVID-19, led mainly by the drawdown of committed lines by U.S. firms. Since then, repayments of such drawdowns have progressed (Chart III-1-20). In addition, overseas loans have declined to the level before the pandemic, because firms' major funding source, under favorable market funding conditions, has shifted from bank borrowing to corporate bonds, etc. and because some banks have started to become keener to achieve loan profitability (Charts III-1-21 and III-1-22).
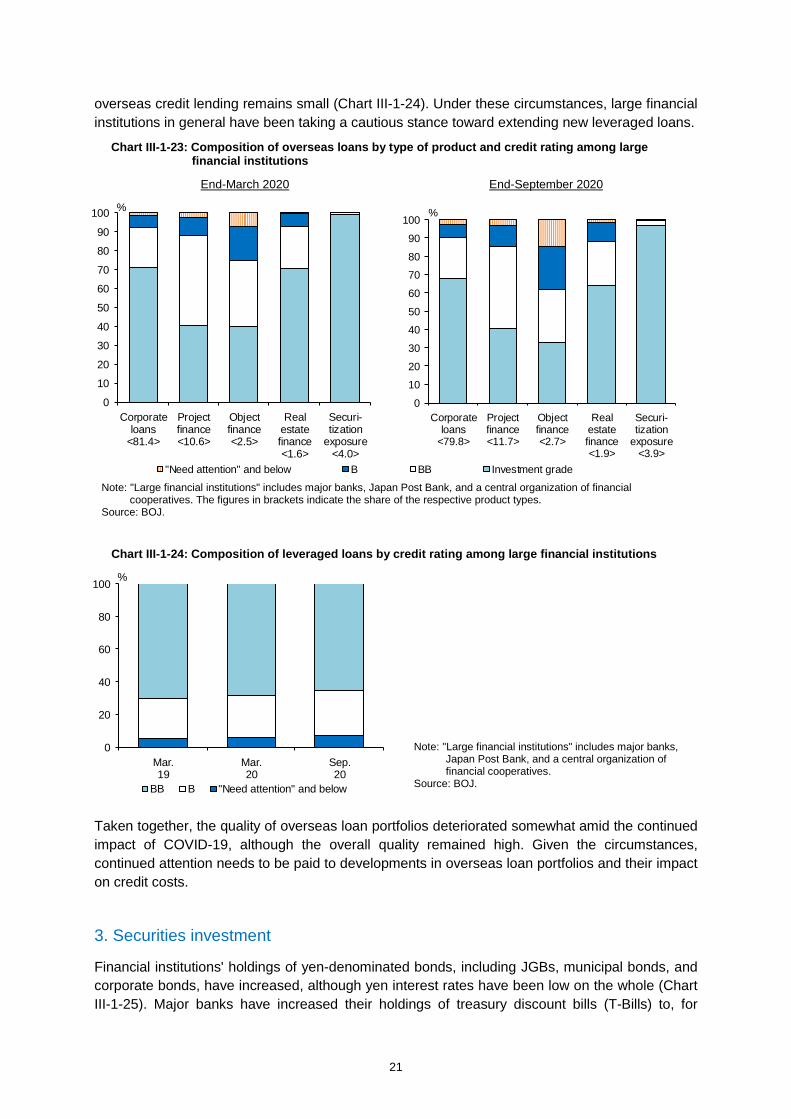
Looking at the rating composition of overseas loans by type of product, the quality of loan portfolios has remained high overall, although some downgrades reflecting the impact of COVID-19 were observed in corporate loans and object and project financing (Chart III-1-23).
With regard to leveraged loans, which carry relatively high risk, the share of such loans with lower credit ratings has been increasing somewhat recently, yet the share of leveraged loans in total
Note: 1. Covers internationally active banks. 2. In both charts, the data are as at year-end or
month-end. Latest data as at January 2021. Source: BOJ.
Chart III-1-20: Committed lines among major banks
0.0
0.2
0.4
0.6
0.8
1.0
14 15 16 17 18 19
Undrawn committed lines (lhs)Drawn committed lines (lhs)Ratio of drawn amount to total (rhs)
tril. U.S. dollars
CY0
10
20
30
40
50
Jan.20
Apr. July Oct. Jan.21
%
Note: Latest data as at end-September 2020. Source: Published accounts of each bank.
Chart III-1-21: Overseas loans outstanding of the three major banks by region
0.0
0.1
0.2
0.3
0.4
0.5
0.6
0.7
0.8
10 11 12 13 14 15 16 17 18 19 20
Other regionsLatin AmericaWestern EuropeAsiaNorth America
tril. U.S. dollars
FY
Note: 1. "Loans by overseas branches" includes parts of foreign currency-denominated impact loans in accounts held by overseas branches. "Foreign currency-denominated impact loans" indicates banks' foreign currency-denominated loans to residents.
2. On a non-consolidated basis. Latest data as at end-January 2021.
Source: BOJ.
Chart III-1-22: Overseas loans outstanding among banks
Major banks Regional banks
0.00.10.20.30.40.50.60.70.80.91.0
10 12 14 16 18 20
Foreign currency-denominated impact loansLoans by overseas branches
tril. U.S. dollars
CY0
5
10
15
20
25
30
35
40
45
10 12 14 16 18 20
bil. U.S. dollars
CY
21
overseas credit lending remains small (Chart III-1-24). Under these circumstances, large financial institutions in general have been taking a cautious stance toward extending new leveraged loans.
Taken together, the quality of overseas loan portfolios deteriorated somewhat amid the continued impact of COVID-19, although the overall quality remained high. Given the circumstances, continued attention needs to be paid to developments in overseas loan portfolios and their impact on credit costs.
3. Securities investment
Financial institutions' holdings of yen-denominated bonds, including JGBs, municipal bonds, and corporate bonds, have increased, although yen interest rates have been low on the whole (Chart III-1-25). Major banks have increased their holdings of treasury discount bills (T-Bills) to, for
Note: "Large financial institutions" includes major banks, Japan Post Bank, and a central organization of financial cooperatives. The figures in brackets indicate the share of the respective product types.
Source: BOJ.
Chart III-1-23: Composition of overseas loans by type of product and credit rating among large financial institutions
End-September 2020
0
10
20
30
40
50
60
70
80
90
100
Corporateloans
<79.8>
Projectfinance<11.7>
Objectfinance<2.7>
Realestatefinance<1.9>
Securi-tization
exposure<3.9>
"Need attention" and below B BB Investment grade
%
End-March 2020
0
10
20
30
40
50
60
70
80
90
100
Corporateloans
<81.4>
Projectfinance<10.6>
Objectfinance<2.5>
Realestatefinance<1.6>
Securi-tization
exposure<4.0>
%
Note: "Large financial institutions" includes major banks, Japan Post Bank, and a central organization of financial cooperatives.
Source: BOJ.
Chart III-1-24: Composition of leveraged loans by credit rating among large financial institutions
0
20
40
60
80
100
Mar.19
Mar.20
Sep.20
%
BB B "Need attention" and below

22
example, keep their current account deposit balances at the Bank of Japan from increasing and meet demand for collateral. They have also increased investments in yen-denominated bonds other than JGBs, which are showing positive yields. Regional financial institutions have increased investments in super-long-term JGBs and yen-denominated bonds other than JGBs by reinvesting large amounts of principal payments from JGBs that have matured.
Holdings of foreign bonds (calculated in yen terms) at financial institutions have increased somewhat (Chart III-1-26). Major banks decreased holdings of these bonds at the start of fiscal 2020 because of sales aimed at locking in gains but have started to increase such holdings somewhat amid the increase in U.S. interest rates. On the other hand, regional banks have been increasing their holdings of foreign bonds. Shinkin banks have kept holdings of foreign bonds at a high level while rebalancing their portfolios.
Total Major banks Regional banks Shinkin banks
Chart III-1-26: Outstanding amount of foreign bonds among financial institutions
Note: 1. "Foreign bonds" is the sum of figures for "Foreign currency-denominated foreign bonds" and "Yen-denominated foreign bonds." The data up to March 2010 are figures for foreign securities.
2. The data are the sum of figures for domestic and overseas branches, based on the outstanding amount at month-end. Latest data as at end-February 2021.
Source: BOJ.
0
10
20
30
40
50
60
70
07 09 11 13 15 17 19
Yen-denominated foreign bonds Foreign currency-denominated foreign bonds Foreign bonds
tril. yen
FY0
5
10
15
20
25
30
35
40
45
07 09 11 13 15 17 19
tril. yen
0
2
4
6
8
10
12
14
16
07 09 11 13 15 17 19
tril. yen
0
1
2
3
4
5
6
7
07 09 11 13 15 17 19
tril. yen
Note: The data are the sum of figures for domestic and overseas branches, based on the outstanding amount at month-end. Latest data as at end-February 2021.
Source: BOJ.
Total Major banks Regional banks Shinkin banks
Chart III-1-25: Outstanding amount of yen-denominated bonds among financial institutions
0
50
100
150
200
250
07 09 11 13 15 17 19
Other domestic bondsJGBs
tril. yen
FY0
20
40
60
80
100
120
140
07 09 11 13 15 17 19
tril. yen
0
10
20
30
40
50
60
70
80
07 09 11 13 15 17 19
tril. yen
0
10
20
30
40
07 09 11 13 15 17 19
tril. yen

23
Financial institutions' holdings of investment trusts are more or less unchanged from March 2020 onward but have recently increased (Chart III-1-27). Some major banks have started to increase their holdings of stock investment trusts somewhat -- which they reduced in March 2020 due to volatility in the stock market -- amid the global rise in stock prices. With regard to regional financial institutions' holdings of investment trusts, overseas fixed income and multi-asset investment trusts in particular have risen, despite an increase in sales of stock investment trusts to lock in gains amid the rise in stock prices (Chart III-1-28).6
6 For more on multi-asset investment trusts, see "Characteristics of Multi-Asset Investment Trusts and Caveats for Risk Management," Financial System Report Annex Series, July 2020 (available only in Japanese).
Chart III-1-27: Outstanding amount of investment trusts among financial institutions
Total Major banks Regional banks Shinkin banks
Note: 1. The data include some securities other than investment trusts. 2. The data are the sum of figures for domestic and overseas branches, including domestic and foreign investment
trusts, based on the outstanding amount at month-end. Latest data as at end-February 2021. Source: BOJ.
0
5
10
15
20
25
30
35
07 09 11 13 15 17 19Investment trusts Inverse mutual funds and ETFs
tril. yen
FY0
2
4
6
8
10
12
14
07 09 11 13 15 17 19
tril. yen
0
2
4
6
8
10
12
14
07 09 11 13 15 17 19
tril. yen
0
1
2
3
4
5
6
7
07 09 11 13 15 17 19
tril. yen
Chart III-1-28: Breakdown of outstanding amount of investment trusts among regional financial institutions
Regional banks Shinkin banks
Note: 1. Based on book values. The figures in parentheses in the chart indicate the share of the respective product types in the latest period.
2. "Other" includes other foreign securities. 3. Up to end-December 2019, "Other" includes "Multi-asset." 4. Latest data as at end-December 2020.
Source: BOJ.
0
2
4
6
8
10
12
14
Mar.2015
Mar.16
Mar.17
Mar.18
Mar.19
Mar.20
Other (13%)
Multi-asset (20%)
Real estate funds(15%)Foreign stocks (3%)
Domestic stocks(13%)Domestic fixedincome (2%)Overseas credits(9%)Overseas fixedincome (25%)Total (100%)
tril. yen
0
1
2
3
4
5
6
7
Mar.2015
Mar.16
Mar.17
Mar.18
Mar.19
Mar.20
Other (8%)
Multi-asset (24%)
Real estate funds(17%)Foreign stocks (1%)
Domestic stocks(8%)Domestic fixedincome (4%)Overseas credits(9%)Overseas fixedincome (29%)Total (100%)
tril. yen
24
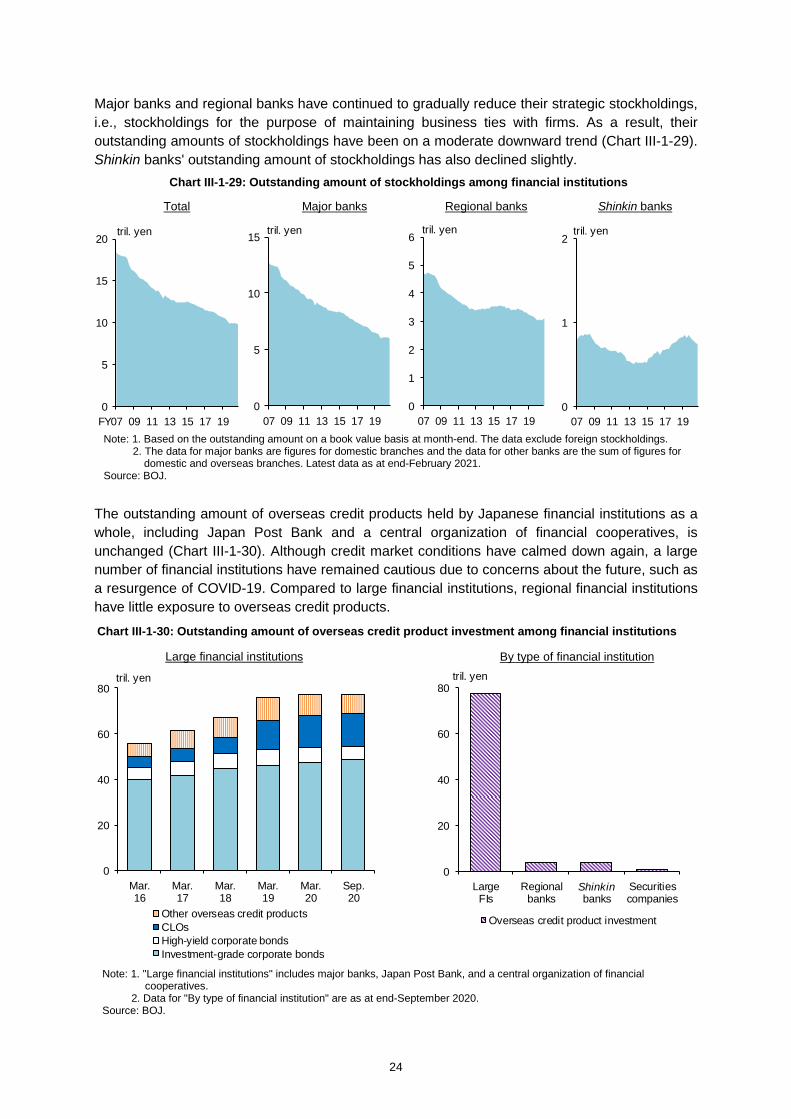
Major banks and regional banks have continued to gradually reduce their strategic stockholdings, i.e., stockholdings for the purpose of maintaining business ties with firms. As a result, their outstanding amounts of stockholdings have been on a moderate downward trend (Chart III-1-29). Shinkin banks' outstanding amount of stockholdings has also declined slightly.
The outstanding amount of overseas credit products held by Japanese financial institutions as a whole, including Japan Post Bank and a central organization of financial cooperatives, is unchanged (Chart III-1-30). Although credit market conditions have calmed down again, a large number of financial institutions have remained cautious due to concerns about the future, such as a resurgence of COVID-19. Compared to large financial institutions, regional financial institutions have little exposure to overseas credit products.
Chart III-1-29: Outstanding amount of stockholdings among financial institutions
Note: 1. Based on the outstanding amount on a book value basis at month-end. The data exclude foreign stockholdings. 2. The data for major banks are figures for domestic branches and the data for other banks are the sum of figures for
domestic and overseas branches. Latest data as at end-February 2021. Source: BOJ.
Total Major banks Regional banks Shinkin banks
0
5
10
15
20
07 09 11 13 15 17 19
tril. yen
FY0
5
10
15
07 09 11 13 15 17 19
tril. yen
0
1
2
3
4
5
6
07 09 11 13 15 17 19
tril. yen
0
1
2
07 09 11 13 15 17 19
tril. yen
0
20
40
60
80
LargeFIs
Regionalbanks banks
Securitiescompanies
Overseas credit product investment
tril. yen
Shinkin
Chart III-1-30: Outstanding amount of overseas credit product investment among financial institutions
Large financial institutions By type of financial institution
Note: 1. "Large financial institutions" includes major banks, Japan Post Bank, and a central organization of financial cooperatives.
2. Data for "By type of financial institution" are as at end-September 2020. Source: BOJ.
0
20
40
60
80
Mar.16
Mar.17
Mar.18
Mar.19
Mar.20
Sep.20
Other overseas credit productsCLOsHigh-yield corporate bondsInvestment-grade corporate bonds
tril. yen
25
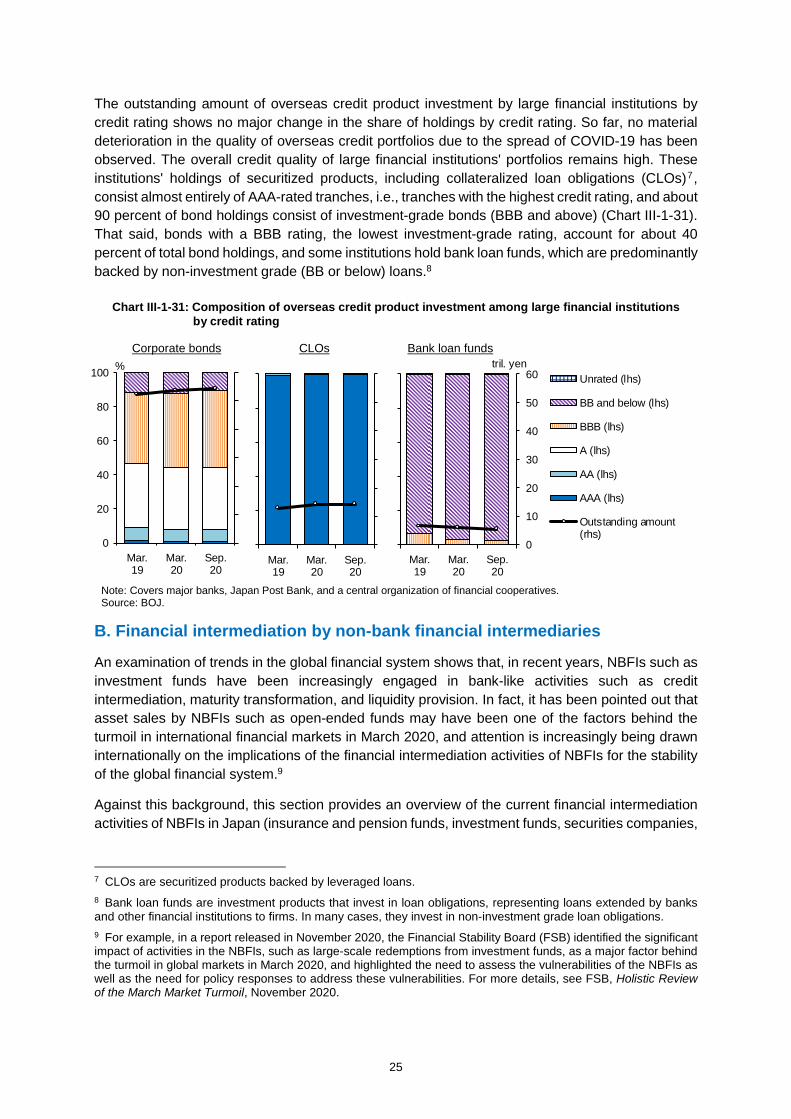
The outstanding amount of overseas credit product investment by large financial institutions by credit rating shows no major change in the share of holdings by credit rating. So far, no material deterioration in the quality of overseas credit portfolios due to the spread of COVID-19 has been observed. The overall credit quality of large financial institutions' portfolios remains high. These institutions' holdings of securitized products, including collateralized loan obligations (CLOs)7, consist almost entirely of AAA-rated tranches, i.e., tranches with the highest credit rating, and about 90 percent of bond holdings consist of investment-grade bonds (BBB and above) (Chart III-1-31). That said, bonds with a BBB rating, the lowest investment-grade rating, account for about 40 percent of total bond holdings, and some institutions hold bank loan funds, which are predominantly backed by non-investment grade (BB or below) loans.8
B. Financial intermediation by non-bank financial intermediaries
An examination of trends in the global financial system shows that, in recent years, NBFIs such as investment funds have been increasingly engaged in bank-like activities such as credit intermediation, maturity transformation, and liquidity provision. In fact, it has been pointed out that asset sales by NBFIs such as open-ended funds may have been one of the factors behind the turmoil in international financial markets in March 2020, and attention is increasingly being drawn internationally on the implications of the financial intermediation activities of NBFIs for the stability of the global financial system.9
Against this background, this section provides an overview of the current financial intermediation activities of NBFIs in Japan (insurance and pension funds, investment funds, securities companies,
7 CLOs are securitized products backed by leveraged loans. 8 Bank loan funds are investment products that invest in loan obligations, representing loans extended by banks and other financial institutions to firms. In many cases, they invest in non-investment grade loan obligations. 9 For example, in a report released in November 2020, the Financial Stability Board (FSB) identified the significant impact of activities in the NBFIs, such as large-scale redemptions from investment funds, as a major factor behind the turmoil in global markets in March 2020, and highlighted the need to assess the vulnerabilities of the NBFIs as well as the need for policy responses to address these vulnerabilities. For more details, see FSB, Holistic Review of the March Market Turmoil, November 2020.
Chart III-1-31: Composition of overseas credit product investment among large financial institutions by credit rating
Note: Covers major banks, Japan Post Bank, and a central organization of financial cooperatives. Source: BOJ.
Corporate bonds CLOs Bank loan funds
0
20
40
60
80
100
Mar.19
Mar.20
Sep.20
Unrated (lhs)
BB and below (lhs)
BBB (lhs)
A (lhs)
AA (lhs)
AAA (lhs)
Outstanding amount(rhs)
%
Mar.19
Mar.20
Sep.20
0
10
20
30
40
50
60
Mar.19
Mar.20
Sep.20
tril. yen

26
etc.) by comparing the characteristics of financial intermediation activities with those in the United States and Europe.
1. Characteristics of Japan's NBFIs
According to the Flow of Funds Accounts, the overall size of Japan's financial sector in terms of financial assets is estimated to be around 4,600 trillion yen at present (Chart III-2-1). By type of entity, deposit-taking institutions such as banks account for about half of the total, while "insurance companies" as well as "other financial intermediaries,"10 which include securities companies and investment funds, account for a large share of the NBFIs. Over the past decade, the amount of assets held by "banks" has continued to grow substantially, while the amount held by "other financial intermediaries" has increased together with that held by the "central bank" (i.e., the Bank of Japan), for which the balance sheet has expanded as a result of monetary policy measures.
The size of Japan's NBFI sector relative to the overall size of Japan's financial sector is relatively small compared to other major countries. The share of investment funds, which are currently attracting increasing international attention, is especially smaller than those in the United States and Europe (Chart III-2-2). Further, a breakdown of "other financial intermediaries" shows that broker-dealers account for a large share in terms of assets, which is a notable feature in Japan.
10 The figures for "other financial intermediaries" (OFIs) here are obtained by reclassifying data in the Flow of Funds Accounts following the definition in the FSB's annual monitoring report (FSB, Global Monitoring Report on Non-Bank Financial Intermediation, December 2020). For more details, see Sudo, N., Taira, K., and Nakamura, K., "The State of Shadow Banking: International Trends and Monitoring and Regulatory Efforts after the Global Financial Crisis," Bank of Japan Review Series, no. 15-J-10, July 2015 (available only in Japanese).
Chart III-2-1: Breakdown of financial assets in Japanese financial sector by type of entity
Note: 1. The classification of entities conforms to the definition of FSB and does not necessarily match that of Japanese flow of funds accounts.
2. The left-hand chart indicates the outstanding amount at year- or month-end. Source: BOJ, "Flow of funds accounts."
Stock Flow
0
1,000
2,000
3,000
4,000
5,000
02 04 06 08 10 12 14 16 18
Central bankFinancial auxiliariesOther financial intermediariesPension fundsInsurance companiesPublic financial institutionsBanks
tril. yen
CY Mar.2020
Sep.-150
-100
-50
0
50
100
150
200
250
300
02 04 06 08 10 12 14 16 18Central bankFinancial auxiliariesOther financial intermediariesPension fundsInsurance companiesPublic financial institutionsBanksTotal
Change from previous year or quarter,tril. yen
CY Jan.-Mar.2020
July-Sep.

27
In the following, the characteristics of the different types of entities and their current financial intermediation activities are examined, starting with insurance companies and followed by investment funds and broker-dealers.
2. Insurance companies
A key characteristic of the balance sheet structure of insurance companies in Japan is the long duration of liabilities, reflecting that many of the insurance products provided by Japanese insurers involve long contract periods (Chart III-2-3). Against this background, insurance companies have been lowering the share of domestic public and corporate bonds with a maturity of 10 years or less in their asset holdings and have been gradually increasing the share of assets such as super-long-term JGBs, overseas bonds, and fund assets with relatively low liquidity. This has allowed them to reduce the duration mismatch and secure profits under the prolonged low interest rate environment (Chart III-2-4).
At present, no major changes in these trends have been observed. Insurance companies continue to invest in super-long-term JGBs and increase their investment in hedged U.S. investment-grade bonds under the current environment of low hedging costs.
Chart III-2-2: Comparison of financial assets in financial sector by jurisdiction
Note: 1. Data as at end-2019. Estimates based on FSB, Global Monitoring Report on Non-Bank Financial Intermediation, December 2020, and statistics from each country.
2. "Major countries" covers all jurisdictions that submit data in FSB, Global Monitoring Report on Non-bank Financial Intermediation, December 2020.
Source: Bundesbank, "Financial accounts"; FRB, "Financial accounts"; FSB; ONS; BOJ, "Flow of funds accounts."
Breakdown of financial assets Breakdown of other financial intermediaries in financial sector by type of entity
0
20
40
60
80
100
Japa
n
Maj
or c
ount
ries
exce
pt fo
r Jap
an
Uni
ted
Stat
es
Ger
man
y
Uni
ted
King
dom
Others Broker-dealersInvestment funds
%
0
20
40
60
80
100
Japa
n
Maj
or c
ount
ries
exce
pt fo
r Jap
an
Uni
ted
Stat
es
Ger
man
y
Uni
ted
King
dom
Central banksFinancial auxiliariesOther financial intermediariesPension fundsInsurance corporationsPublic financial institutionsBanks
%

28
3. Investment funds
Since the beginning of the 2010s, Japan has seen a large increase in the inflow of funds into investment fund sector, such as investment trusts. While such a large increase in the inflow has also been observed in the United States and Germany, a major characteristic specific to Japan's
Chart III-2-4: Investment assets outstanding among life insurance companies
Chart III-2-3: Breakdown of insurance products among life insurance companies
Note: 1. "Other assets" includes cash and deposits, loans, investment trusts, and real estate.
2. Covers nine major life insurance companies. Based on general accounts. The data for fiscal 2020 are as at end-September 2020.
Source: Published accounts of each company.
Note: Data as at end of fiscal 2019 for Japan, and as at end of 2019 for the United States and Europe. Basically excludes group insurance and group annuities.
Source: American Council of Life Insurers, "Life Insurers Fact Book"; EIOPA; The Life Insurance Association of Japan.
0
50
100
150
200
250
04 05 06 07 08 09 10 11 12 13 14 15 16 17 18 19 20Other assetsEquitiesForeign bondsDomestic bonds (maturity of greater than 10 years)Domestic bonds (maturity of up to 10 years)
tril. yen
FY0 20 40 60 80 100
Europe
UnitedStates
Japan
Whole life insurance Term insuranceEndowment insurance InsuranceUnit-linked policies AnnuitiesOthers
%
Chart III-2-5: Decomposition of inflows to investment funds
Japan United States Germany
Note: 1. Covers flows of investment trust beneficiary certificates for Japan, money market fund shares and mutual fund shares for the United States, and investment fund shares for Germany.
2. "Households" of the United States includes nonprofit organizations. "Investment funds" of Germany does not include MMFs.
3. Latest data as at 2019. Source: Bundesbank, "Financial accounts"; FRB, "Financial accounts"; BOJ, "Flow of funds accounts."
-10
0
10
20
30
02 04 06 08 10 12 14 16 18Rest of the worldNon-financial sectorsOther financial sectorsCentral bankBanks
tril. yen
CY-0.4
-0.2
0.0
0.2
0.4
0.6
0.8
1.0
1.2
02 04 06 08 10 12 14 16 18Rest of the worldFinancial sectorsOther non-financial sectorsHouseholds
tril. U.S. dollars
CY-100
-50
0
50
100
150
200
00 02 04 06 08 10 12 14 16 18Rest of the worldNon-financial sectorsOther financial sectorsInsurance and pension fundsInvestment funds
bil. euro
CY

29
case is that the majority of inflows have come from domestic financial institutions. One of the reasons for this in Japan is that, in response to the prolonged low interest rate environment, financial institutions in Japan have been trying to secure profits by increasing their investment in investment trusts. In contrast, in the United States, the household sector is the largest source of funds for the investment fund sector, while in Germany, inflows from other NBFIs (from other investment funds as well as insurance companies and pension funds) account for a large share of the total (Chart III-2-5).
The assets under management of investment funds in Japan are mainly domestic and foreign stocks and bonds, and the scale of credit intermediation activities through lending, which is rapidly growing overseas, is small. There has been no significant change in these trends since the COVID-19 outbreak (Chart III-2-6).
4. Broker-dealers
Broker-dealers in Japan, consisting mainly of securities companies, play an important role in financial intermediation activities. Such activities, which may not always appear on their balance sheets, include dealing and market-making businesses, brokerage business involving transactions of customer financial assets, the underwriting of corporate bond issues, and IPO-related business. That said, the main component of the balance sheets of broker-dealers is assets and liabilities
Chart III-2-6: Investment assets outstanding among investment funds
Note: 1. Breakdown of investment assets held by securities investment trusts.
2. The charts indicate the outstanding amount at year- or month-end.
Source: BOJ, "Flow of funds accounts."
0
50
100
150
200
250
300
05 07 09 11 13 15 17 19
OthersOutward investment in securitiesEquity and investment fund sharesDebt securitiesLoans
tril. yen
CY Mar.2020
Sep.
Chart III-2-7: Balance sheets of broker-dealers
Note: Data as at end of 2019. Source: BOJ, "Flow of funds accounts."
020406080
100120140160180200
Asset Liability
Others
Debt securities
Equity and investmentfund sharesLoans (excluding repos)
Repos
tril. yen
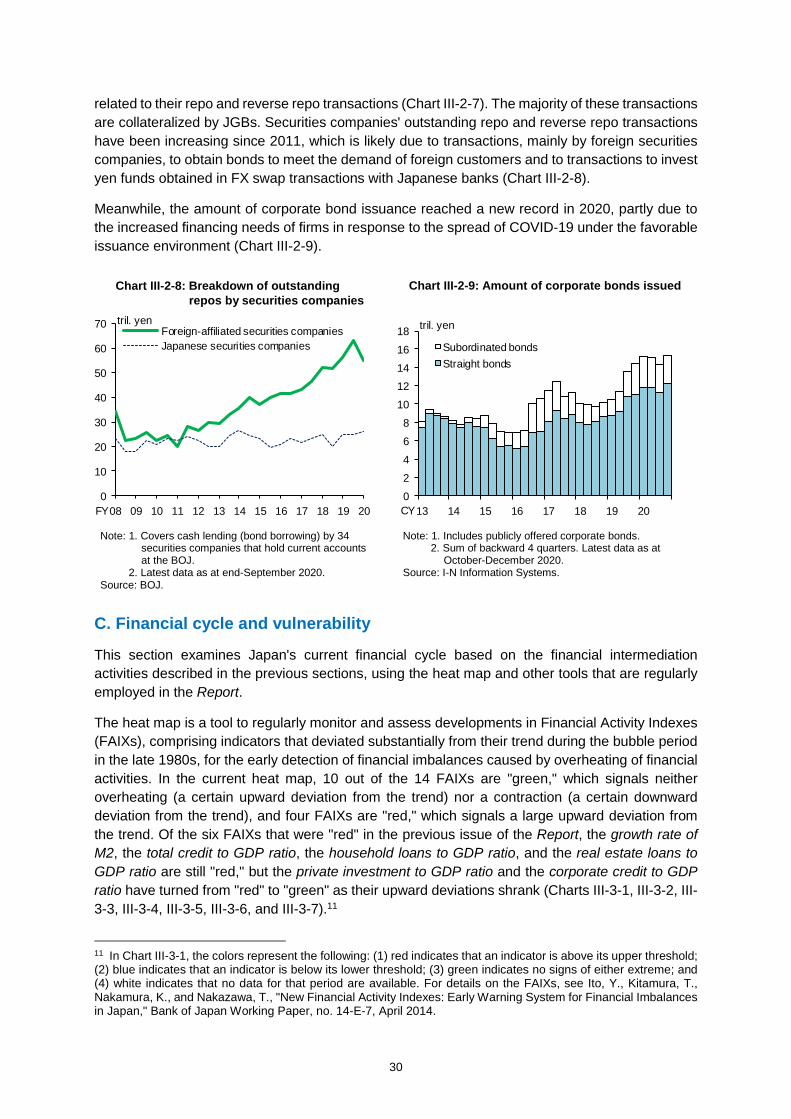
30
related to their repo and reverse repo transactions (Chart III-2-7). The majority of these transactions are collateralized by JGBs. Securities companies' outstanding repo and reverse repo transactions have been increasing since 2011, which is likely due to transactions, mainly by foreign securities companies, to obtain bonds to meet the demand of foreign customers and to transactions to invest yen funds obtained in FX swap transactions with Japanese banks (Chart III-2-8).
Meanwhile, the amount of corporate bond issuance reached a new record in 2020, partly due to the increased financing needs of firms in response to the spread of COVID-19 under the favorable issuance environment (Chart III-2-9).
C. Financial cycle and vulnerability
This section examines Japan's current financial cycle based on the financial intermediation activities described in the previous sections, using the heat map and other tools that are regularly employed in the Report.
The heat map is a tool to regularly monitor and assess developments in Financial Activity Indexes (FAIXs), comprising indicators that deviated substantially from their trend during the bubble period in the late 1980s, for the early detection of financial imbalances caused by overheating of financial activities. In the current heat map, 10 out of the 14 FAIXs are "green," which signals neither overheating (a certain upward deviation from the trend) nor a contraction (a certain downward deviation from the trend), and four FAIXs are "red," which signals a large upward deviation from the trend. Of the six FAIXs that were "red" in the previous issue of the Report, the growth rate of M2, the total credit to GDP ratio, the household loans to GDP ratio, and the real estate loans to GDP ratio are still "red," but the private investment to GDP ratio and the corporate credit to GDP ratio have turned from "red" to "green" as their upward deviations shrank (Charts III-3-1, III-3-2, III-3-3, III-3-4, III-3-5, III-3-6, and III-3-7).11
11 In Chart III-3-1, the colors represent the following: (1) red indicates that an indicator is above its upper threshold; (2) blue indicates that an indicator is below its lower threshold; (3) green indicates no signs of either extreme; and (4) white indicates that no data for that period are available. For details on the FAIXs, see Ito, Y., Kitamura, T., Nakamura, K., and Nakazawa, T., "New Financial Activity Indexes: Early Warning System for Financial Imbalances in Japan," Bank of Japan Working Paper, no. 14-E-7, April 2014.
Chart III-2-9: Amount of corporate bonds issued Chart III-2-8: Breakdown of outstanding repos by securities companies
Note: 1. Includes publicly offered corporate bonds. 2. Sum of backward 4 quarters. Latest data as at
October-December 2020. Source: I-N Information Systems.
Note: 1. Covers cash lending (bond borrowing) by 34 securities companies that hold current accounts at the BOJ.
2. Latest data as at end-September 2020. Source: BOJ.
0
10
20
30
40
50
60
70
08 09 10 11 12 13 14 15 16 17 18 19 20
Foreign-affiliated securities companiesJapanese securities companies
tril. yen
FY0
2
4
6
8
10
1214
16
18
13 14 15 16 17 18 19 20
Subordinated bondsStraight bonds
tril. yen
CY

31
Chart III-3-4: Household loans to GDP ratio
Note: 1. "Trend" is calculated using 3-year backward moving averages. The shaded area indicates 1.25 times the root mean square of the deviation from the trend.
2. 4-quarter backward moving averages. Latest data as at the October-December quarter of 2020.
Source: Cabinet Office, "National accounts"; BOJ, "Flow of funds accounts."
Chart III-3-5: Real estate loans to GDP ratio
Note: 1. "Trend" is calculated using the one-sided HP filter. The shaded area indicates the root mean square of the deviation from the trend.
2. 4-quarter backward moving averages. Latest data as at the October-December quarter of 2020.
Source: Cabinet Office, "National accounts"; BOJ, "Loans and bills discounted by sector."
20
30
40
50
60
80 83 86 89 92 95 98 01 04 07 10 13 16 19
Original seriesTrend
%
CY2
4
6
8
10
12
14
16
18
80 83 86 89 92 95 98 01 04 07 10 13 16 19
Original seriesTrend
%
CY
Chart III-3-2: Growth rate of M2
Note: 1. "Trend" is calculated using the one-sided HP filter. The shaded area indicates the root mean square of the deviation from the trend.
2. Latest data as at the October-December quarter of 2020.
Source: BOJ, "Money stock."
Chart III-3-3: Total credit to GDP ratio
Note: 1. "Trend" is calculated using the one-sided HP filter. The shaded area indicates the root mean square of the deviation from the trend.
2. 4-quarter backward moving averages. Latest data as at the October-December quarter of 2020.
Source: Cabinet Office, "National accounts"; BOJ, "Flow of funds accounts."
-4
0
4
8
12
16
80 83 86 89 92 95 98 01 04 07 10 13 16 19
Original seriesTrend
%
CY100
120
140
160
180
200
80 83 86 89 92 95 98 01 04 07 10 13 16 19
Original seriesTrend
%
CY
Chart III-3-1: Heat map
Note: The latest data for stock prices are as at the January-March quarter of 2021. The latest data for the land prices to GDP ratio are as at the July-September quarter of 2020. The latest data for the other indicators are as at the October-December quarter of 2020.
Source: Bloomberg; Cabinet Office, "National accounts"; Japan Real Estate Institute, "Urban land price index"; Ministry of Finance, "Financial statements statistics of corporations by industry"; Tokyo Stock Exchange, "Outstanding margin trading, etc."; BOJ, "Flow of funds accounts," "Loans and bills discounted by sector," "Money stock," "Tankan."
CY
80 81 82 83 84 85 86 87 88 89 90 91 92 93 94 95 96 97 98 99 00 01 02 03 04 05 06 07 08 09 10 11 12 13 14 15 16 17 18 19 20 21DI of lending attitudes of financial institutions
Growth rate of M2
Equity weighting in institutional investors' portfolios
Stock purchases on margin to sales on margin ratio
Private investment to GDP ratio
Total credit to GDP ratio
Household investment to disposable income ratio
Household loans to GDP ratio
Business fixed investment to GDP ratio
Corporate credit to GDP ratio
Real estate firms' investment to GDP ratio
Real estate loans to GDP ratio
Stock prices
Land prices to GDP ratio
Real estate
Asset prices
Financialinstitutions
Financialmarkets
Privatesector
Household
Corporate
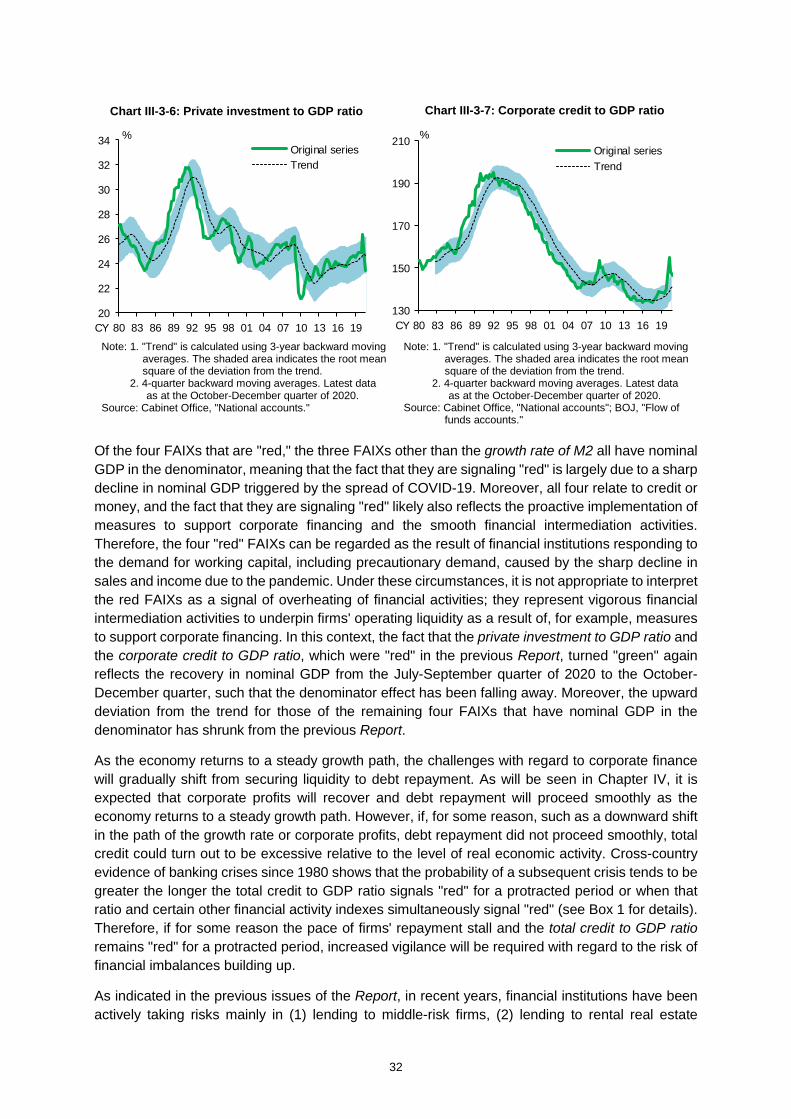
32
Of the four FAIXs that are "red," the three FAIXs other than the growth rate of M2 all have nominal GDP in the denominator, meaning that the fact that they are signaling "red" is largely due to a sharp decline in nominal GDP triggered by the spread of COVID-19. Moreover, all four relate to credit or money, and the fact that they are signaling "red" likely also reflects the proactive implementation of measures to support corporate financing and the smooth financial intermediation activities. Therefore, the four "red" FAIXs can be regarded as the result of financial institutions responding to the demand for working capital, including precautionary demand, caused by the sharp decline in sales and income due to the pandemic. Under these circumstances, it is not appropriate to interpret the red FAIXs as a signal of overheating of financial activities; they represent vigorous financial intermediation activities to underpin firms' operating liquidity as a result of, for example, measures to support corporate financing. In this context, the fact that the private investment to GDP ratio and the corporate credit to GDP ratio, which were "red" in the previous Report, turned "green" again reflects the recovery in nominal GDP from the July-September quarter of 2020 to the October-December quarter, such that the denominator effect has been falling away. Moreover, the upward deviation from the trend for those of the remaining four FAIXs that have nominal GDP in the denominator has shrunk from the previous Report.
As the economy returns to a steady growth path, the challenges with regard to corporate finance will gradually shift from securing liquidity to debt repayment. As will be seen in Chapter IV, it is expected that corporate profits will recover and debt repayment will proceed smoothly as the economy returns to a steady growth path. However, if, for some reason, such as a downward shift in the path of the growth rate or corporate profits, debt repayment did not proceed smoothly, total credit could turn out to be excessive relative to the level of real economic activity. Cross-country evidence of banking crises since 1980 shows that the probability of a subsequent crisis tends to be greater the longer the total credit to GDP ratio signals "red" for a protracted period or when that ratio and certain other financial activity indexes simultaneously signal "red" (see Box 1 for details). Therefore, if for some reason the pace of firms' repayment stall and the total credit to GDP ratio remains "red" for a protracted period, increased vigilance will be required with regard to the risk of financial imbalances building up.
As indicated in the previous issues of the Report, in recent years, financial institutions have been actively taking risks mainly in (1) lending to middle-risk firms, (2) lending to rental real estate
Chart III-3-7: Corporate credit to GDP ratio
Note: 1. "Trend" is calculated using 3-year backward moving averages. The shaded area indicates the root mean square of the deviation from the trend.
2. 4-quarter backward moving averages. Latest data as at the October-December quarter of 2020.
Source: Cabinet Office, "National accounts"; BOJ, "Flow of funds accounts."
Chart III-3-6: Private investment to GDP ratio
Note: 1. "Trend" is calculated using 3-year backward moving averages. The shaded area indicates the root mean square of the deviation from the trend.
2. 4-quarter backward moving averages. Latest data as at the October-December quarter of 2020.
Source: Cabinet Office, "National accounts."
20
22
24
26
28
30
32
34
80 83 86 89 92 95 98 01 04 07 10 13 16 19
Original seriesTrend
%
CY130
150
170
190
210
80 83 86 89 92 95 98 01 04 07 10 13 16 19
Original seriesTrend
%
CY
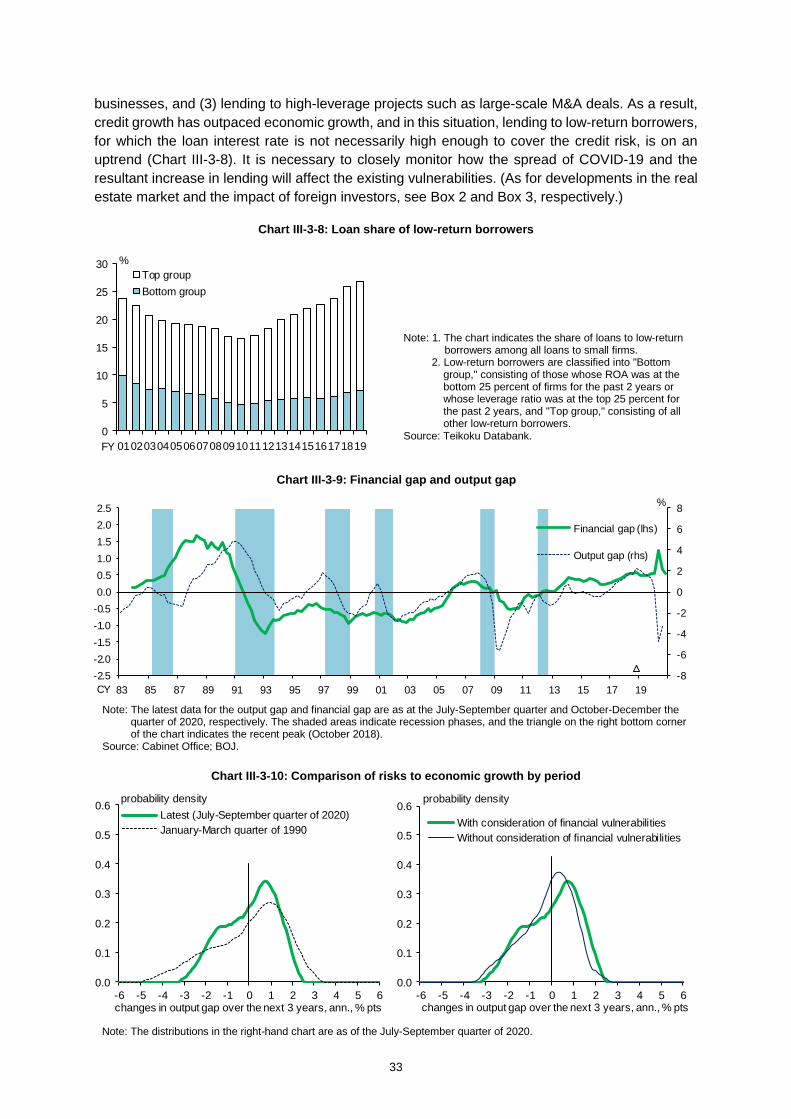
33
businesses, and (3) lending to high-leverage projects such as large-scale M&A deals. As a result, credit growth has outpaced economic growth, and in this situation, lending to low-return borrowers, for which the loan interest rate is not necessarily high enough to cover the credit risk, is on an uptrend (Chart III-3-8). It is necessary to closely monitor how the spread of COVID-19 and the resultant increase in lending will affect the existing vulnerabilities. (As for developments in the real estate market and the impact of foreign investors, see Box 2 and Box 3, respectively.)
Chart III-3-8: Loan share of low-return borrowers
Note: 1. The chart indicates the share of loans to low-return borrowers among all loans to small firms.
2. Low-return borrowers are classified into "Bottom group," consisting of those whose ROA was at the bottom 25 percent of firms for the past 2 years or whose leverage ratio was at the top 25 percent for the past 2 years, and "Top group," consisting of all other low-return borrowers.
Source: Teikoku Databank. 0
5
10
15
20
25
30
01020304050607080910111213141516171819
Top groupBottom group
FY
%
Chart III-3-9: Financial gap and output gap
Note: The latest data for the output gap and financial gap are as at the July-September quarter and October-December the quarter of 2020, respectively. The shaded areas indicate recession phases, and the triangle on the right bottom corner of the chart indicates the recent peak (October 2018).
Source: Cabinet Office; BOJ.
-8
-6
-4
-2
0
2
4
6
8
-2.5-2.0-1.5-1.0-0.50.00.51.01.52.02.5
83 85 87 89 91 93 95 97 99 01 03 05 07 09 11 13 15 17 19
Financial gap (lhs)
Output gap (rhs)
CY
%
Chart III-3-10: Comparison of risks to economic growth by period
0.0
0.1
0.2
0.3
0.4
0.5
0.6
-6 -5 -4 -3 -2 -1 0 1 2 3 4 5 6
With consideration of financial vulnerabilitiesWithout consideration of financial vulnerabilities
probability density
changes in output gap over the next 3 years, ann., % pts
Note: The distributions in the right-hand chart are as of the July-September quarter of 2020.
0.0
0.1
0.2
0.3
0.4
0.5
0.6
-6 -5 -4 -3 -2 -1 0 1 2 3 4 5 6
Latest (July-September quarter of 2020)January-March quarter of 1990
probability density
changes in output gap over the next 3 years, ann., % pts

34
Regarding the "financial gap," which is constructed by calculating the weighted average of the deviation rates of individual FAIXs in the heat map from their trends, the positive gap, which once had increased, has narrowed. This reflects the shrinking of an upward deviation in a larger number of FAIXs compared to the previous Report; such FAIXs include those having nominal GDP in the denominator (Chart III-3-9). Looking at "GDP-at-risk" (GaR),12 the estimated probability distribution of GDP growth over the next 3 years conditional on these developments in the financial gap has exhibited shrinkage in a fatter tail on the downside, which once had fattened to more than in the bubble period. This suggests that a tail risk in the real economy seems to have declined compared to the previous Report (Chart III-3-10). The result is attributable to the narrowing of the positive gap of the "financial gap" as well as to quarter-on-quarter changes in the output gap becoming positive, accompanied by a pick-up in the economy. However, as developments in the spread of COVID-19 and their impact on the domestic and overseas economies remain highly uncertain, depending on the impact of COVID-19, attention needs to be paid to the possibility of full-fledged financial adjustments through the existing vulnerabilities underlying developments in the financial gap.
12 Specifically, the regression equation for GaR is as follows:
changes in the output gapover the next years
changes in the output gapfrom the previous period financial gap U. S. NFCI .
For details on the GaR approach, including the underlying rationale, estimation method, and caveats regarding its use, see Chapter IV and Box 1 of the October 2018 issue of the Report.
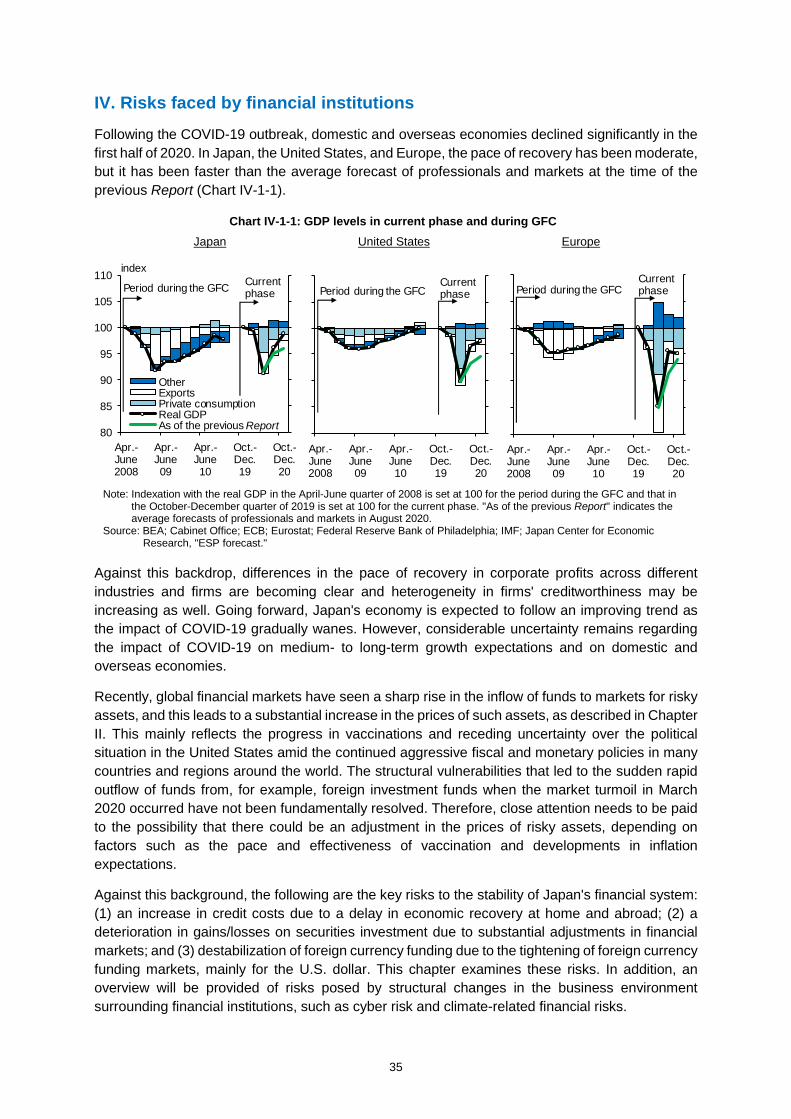
35
IV. Risks faced by financial institutions
Following the COVID-19 outbreak, domestic and overseas economies declined significantly in the first half of 2020. In Japan, the United States, and Europe, the pace of recovery has been moderate, but it has been faster than the average forecast of professionals and markets at the time of the previous Report (Chart IV-1-1).
Against this backdrop, differences in the pace of recovery in corporate profits across different industries and firms are becoming clear and heterogeneity in firms' creditworthiness may be increasing as well. Going forward, Japan's economy is expected to follow an improving trend as the impact of COVID-19 gradually wanes. However, considerable uncertainty remains regarding the impact of COVID-19 on medium- to long-term growth expectations and on domestic and overseas economies.
Recently, global financial markets have seen a sharp rise in the inflow of funds to markets for risky assets, and this leads to a substantial increase in the prices of such assets, as described in Chapter II. This mainly reflects the progress in vaccinations and receding uncertainty over the political situation in the United States amid the continued aggressive fiscal and monetary policies in many countries and regions around the world. The structural vulnerabilities that led to the sudden rapid outflow of funds from, for example, foreign investment funds when the market turmoil in March 2020 occurred have not been fundamentally resolved. Therefore, close attention needs to be paid to the possibility that there could be an adjustment in the prices of risky assets, depending on factors such as the pace and effectiveness of vaccination and developments in inflation expectations.
Against this background, the following are the key risks to the stability of Japan's financial system: (1) an increase in credit costs due to a delay in economic recovery at home and abroad; (2) a deterioration in gains/losses on securities investment due to substantial adjustments in financial markets; and (3) destabilization of foreign currency funding due to the tightening of foreign currency funding markets, mainly for the U.S. dollar. This chapter examines these risks. In addition, an overview will be provided of risks posed by structural changes in the business environment surrounding financial institutions, such as cyber risk and climate-related financial risks.
80
85
90
95
100
105
110
Apr.-June2008
Apr.-June09
Apr.-June10
Oct.-Dec.19
Oct.-Dec.20
OtherExportsPrivate consumptionReal GDPAs of the previous
indexCurrent phasePeriod during the GFC
Report
Apr.-June2008
Apr.-June09
Apr.-June10
Oct.-Dec.19
Oct.-Dec.20
Current phasePeriod during the GFC
Apr.-June2008
Apr.-June09
Apr.-June10
Oct.-Dec.19
Oct.-Dec.20
CurrentphasePeriod during the GFC
Chart IV-1-1: GDP levels in current phase and during GFC
Note: Indexation with the real GDP in the April-June quarter of 2008 is set at 100 for the period during the GFC and that in the October-December quarter of 2019 is set at 100 for the current phase. "As of the previous Report" indicates the average forecasts of professionals and markets in August 2020.
Source: BEA; Cabinet Office; ECB; Eurostat; Federal Reserve Bank of Philadelphia; IMF; Japan Center for Economic Research, "ESP forecast."
Japan United States Europe

36
A. Domestic credit risk
The credit cost ratios of Japanese financial institutions remained low, although they have shown signs of picking up, especially for regional financial institutions (Chart IV-1-2). The low credit cost is essentially explained by the fact that Japanese firms as a whole have continued to improve their financial soundness in recent years, before the COVID-19 outbreak.
Major banks' credit costs have risen substantially, especially with regard to loans to the manufacturing and services industries, due to the impact of COVID-19 and the broader adoption of forward-looking provisions. The credit cost ratios have reached their highest level since the GFC but are still low. Credit cost ratios at regional banks have not seen notable changes so far compared to the pre-COVID-19 ratio, partly due to the impact of the measures to support corporate financing for SMEs. Looking at loans by borrower classification, the share of normal loans remains high, exceeding the peak before the GFC, but it has recently declined slightly and the share of loans needing attention has risen slightly (Chart IV-1-3). The default rates continue to be low in all industries and the numbers of bankruptcies have remained at low levels irrespective of the size of the debt, which also contrasts with the situation experienced during the GFC. Various surveys suggest that the numbers of business closings and liquidations confirmed so far also remain low,
Note: The latest data for "Major banks" and "Regional banks" are annualized values for the first half of fiscal 2020 and the latest data for "Shinkin banks" are as at fiscal 2019.
Source: BOJ.
Chart IV-1-2: Credit cost ratios by type of bank
-0.2
0.0
0.2
0.4
0.6
0.8
06 08 10 12 14 16 18 20
Major banksRegional banks banks
%
FY
Shinkin
Note: 1. "Need attention" indicates "Need attention excluding special attention" from fiscal 2004. 2. The latest data in the left-hand and middle charts are as at end-September 2020, and the latest data in the right-
hand chart are as at end-March 2020. Source: BOJ.
Major banks Regional banks Shinkin banks
Chart IV-1-3: Breakdown of loans by borrower classification
65
70
75
80
85
90
95
100
99 03 07 11 15 19
"Normal" "Need attention" "Special attention" "In danger of bankruptcy" and below
%
FY65
70
75
80
85
90
95
100
99 03 07 11 15 19
%
FY65
70
75
80
85
90
95
100
99 03 07 11 15 19
%
FY

37
although results vary depending on the definitions used (Chart III-1-17). It should be noted that, for SMEs and micro firms, financial statements releases is typically infrequent than that of large firms and it takes time for them to reflect the changes caused by the COVID-19 outbreak in their financial statements, which are important pieces of information for banks in determining their borrower classification.
The pandemic is causing stress in financing, especially for firms and households that are affected by containment measures to control the spread of COVID-19. The heterogeneity in the extent of the impact across firms and industries has increased further. Keeping these points in mind, this section examines the impact of the spread of the disease on financial institutions' domestic credit risk.
1. Firms' financial conditions under the spread of COVID-19
Firms' financing since the COVID-19 outbreak shows that the number of firms perceiving their financial positions as "tight" has increased substantially. Many large firms, however, still perceive their financial positions as "easy." For SMEs, the number of firms responding that their financial positions are "easy" still slightly exceeds the number responding that they are "tight" (Chart IV-1-4).13 Moreover, corporate financing as of December 2020 had generally improved slightly, compared to June 2020, mainly due to the recent pick-up in the economy. However, many firms in the face-to-face services industry (accommodation, food, and consumer services) regard their
13 The previous issue of the Report highlighted the reasons why corporate financing overall was maintained as follows: firms had strengthened their liquidity and capital against the backdrop of the moderate economic expansion over the past few years; strong measures to support corporate financing have been put in place since the COVID-19 outbreak; and financial institutions have been actively providing loans to support corporate financing.
-60
-40
-20
0
20
40
All i
ndus
tries
Man
ufac
turin
g
Con
stru
ctio
n an
d re
al e
stat
e
Who
lesa
le a
nd re
tail
Info
rmat
ion
serv
ices
and
com
mun
icat
ions
Tran
spor
tatio
n an
dpo
stal
ser
vice
s
Face
-to-fa
ce s
ervic
es
Dec. 2020June 2020Dec. 2019
"easy" - "tight", % pts
-60
-40
-20
0
20
40
All i
ndus
tries
Man
ufac
turin
g
Con
stru
ctio
n an
d re
al e
stat
e
Who
lesa
le a
nd re
tail
Info
rmat
ion
serv
ices
and
com
mun
icat
ions
Tran
spor
tatio
n an
dpo
stal
ser
vice
s
Face
-to-fa
ce s
ervic
es
Dec. 2020June 2020Dec. 2019
"easy" - "tight", % pts
Note: 1. The figures for "Construction and real estate" and "Face-to-face services" are weighted averages by the number of firms that responded to the question in each industry.
2. "Face-to-face services" consists of food, accommodation, and consumer services. The same applies to Charts IV-1-5, IV-1-7, and IV-1-13.
Source: BOJ, "Tankan."
Large firms SMEs Chart IV-1-4: DI of financial positions (by firm size and industry)
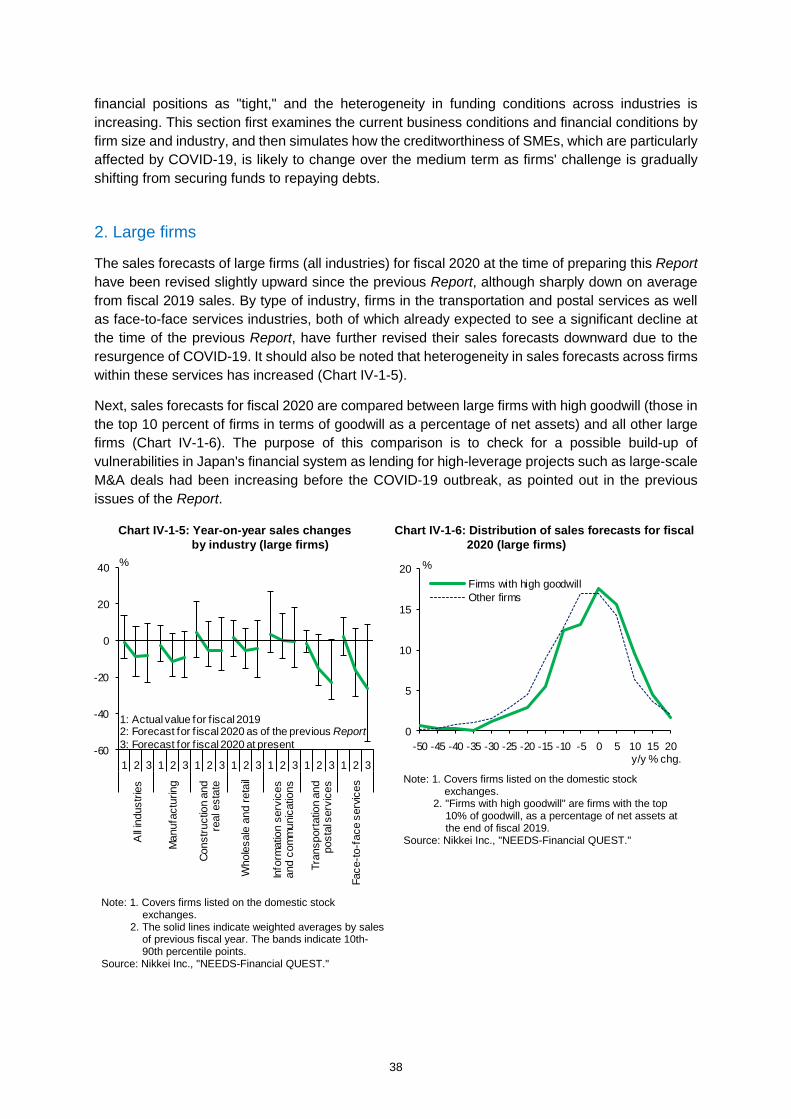
38
financial positions as "tight," and the heterogeneity in funding conditions across industries is increasing. This section first examines the current business conditions and financial conditions by firm size and industry, and then simulates how the creditworthiness of SMEs, which are particularly affected by COVID-19, is likely to change over the medium term as firms' challenge is gradually shifting from securing funds to repaying debts.
2. Large firms
The sales forecasts of large firms (all industries) for fiscal 2020 at the time of preparing this Report have been revised slightly upward since the previous Report, although sharply down on average from fiscal 2019 sales. By type of industry, firms in the transportation and postal services as well as face-to-face services industries, both of which already expected to see a significant decline at the time of the previous Report, have further revised their sales forecasts downward due to the resurgence of COVID-19. It should also be noted that heterogeneity in sales forecasts across firms within these services has increased (Chart IV-1-5).
Next, sales forecasts for fiscal 2020 are compared between large firms with high goodwill (those in the top 10 percent of firms in terms of goodwill as a percentage of net assets) and all other large firms (Chart IV-1-6). The purpose of this comparison is to check for a possible build-up of vulnerabilities in Japan's financial system as lending for high-leverage projects such as large-scale M&A deals had been increasing before the COVID-19 outbreak, as pointed out in the previous issues of the Report.
-60
-40
-20
0
20
40
1 2 3 1 2 3 1 2 3 1 2 3 1 2 3 1 2 3 1 2 3
. . . . . . .
%
All i
ndus
tries
Man
ufac
turin
g
Cons
truct
ion
and
real
est
ate
Who
lesa
le a
nd re
tail
Info
rmat
ion
serv
ices
an
d co
mm
unic
atio
ns
Tran
spor
tatio
n an
d po
stal
ser
vice
s
Face
-to-f
ace
serv
ices
1: Actual value for f iscal 20192: Forecast for f iscal 2020 as of the previous Report3: Forecast for f iscal 2020 at present
Chart IV-1-5: Year-on-year sales changes by industry (large firms)
Note: 1. Covers firms listed on the domestic stock exchanges.
2. "Firms with high goodwill" are firms with the top 10% of goodwill, as a percentage of net assets at the end of fiscal 2019.
Source: Nikkei Inc., "NEEDS-Financial QUEST."
Chart IV-1-6: Distribution of sales forecasts for fiscal 2020 (large firms)
Note: 1. Covers firms listed on the domestic stock exchanges.
2. The solid lines indicate weighted averages by sales of previous fiscal year. The bands indicate 10th-90th percentile points.
Source: Nikkei Inc., "NEEDS-Financial QUEST."
0
5
10
15
20
-50 -45 -40 -35 -30 -25 -20 -15 -10 -5 0 5 10 15 20
Firms with high goodwillOther firms
%
y/y % chg.
39
The distribution of the sales forecasts of large firms with high goodwill is to the right of that for all other large firms, which implies that, on average, large firms with high goodwill expect higher sales growth than the other firms. That said, the forecast of average sales growth for firms with high goodwill is about minus 3 percent, meaning that some firms with high goodwill expect their sales to fall considerably compared to the previous fiscal year. These results do not mean that COVID-19 disproportionately affects firms with high goodwill adversely, but they do suggest that some firms with high goodwill currently could be finding it difficult to achieve the revenue synergies they had expected. If this situation continued, the pressure on the impairment of goodwill could increase.
The impact of a credit rating downgrade on credit costs may be large for a large firm, since the amount of credit extended per borrower tends to be large and the coverage ratio is typically lower in lending to large firms than to SMEs. Therefore, financial institutions need to carefully monitor the impact of COVID-19 on the creditworthiness of individual large firms.
3. SMEs
The magnitude of the impact of the spread of COVID-19 on firms' finances, such as their liquidity and capital, is considered to depend mainly on (1) the condition of firms' liquidity and capital prior to the outbreak of the disease, and (2) the magnitude of decline in firms' sales and profits due to that outbreak.
Currently, Japan's economy is expected to follow an improving trend, but the pace of improvement is likely to be only moderate and the future is highly uncertain. As firms' challenge is gradually shifting from securing funds to repaying debts, problems faced by some firms are likely to shift from liquidity problems to solvency problems. Against this background, this Report conducts a dynamic simulation analysis of the impact not only of a deterioration in liquidity but also in solvency on firms' probability of default (PD) through fiscal 2023, taking firms' individual characteristics, size, and industry into account.14,15
a. Methodology and assumptions
In order to run a dynamic simulation analysis up to fiscal 2023, it is necessary to make medium-term assumptions about firms' future profits, investment, and finances.
Aggregate corporate profits (operating profits, current profits, etc.), one of the most important factors in the simulation, are assumed to be linked to macroeconomic developments. Specifically, the relationship between the GDP growth rate and overall corporate profits is estimated, and that estimated relationship is then used to forecast overall corporate profits based on private forecasters' forecasts of GDP growth as of March 2021 (left panel of Chart IV-1-7). Next, assumptions in line with these forecasts are made with regard to the profits of large firms and SMEs and in different industries, reflecting differences in the impact of COVID-19 (left and middle panels
14 The simulation analysis used firm-level data from the Credit Risk Database (CRD) of the CRD Association, which covers about 2.6 million SMEs. The simulation covers about 770 thousand SMEs. 15 In the simulation, the probability of default is defined as the probability of newly falling into either a downgrade to the borrower classification of "special attention" or below, being delinquent for three months or more, or subrogation by a credit guarantee corporation within one year. In the previous Report, a simulation analysis employing firm-level data for SMEs was used to quantitatively assess the impact of COVID-19 on the probability of default for fiscal 2020 of firms through changes in financing.

40
of Chart IV-1-7).16 In addition, the assumptions about the profits of individual firms take into account not only the heterogeneity across firms of different sizes and in different industries but also the impact of the increased heterogeneity among SMEs within the same industry (right panel of Chart IV-1-7).17
The profits of SMEs as a whole and by industry, estimated based on the assumptions above, are likely to decline significantly in fiscal 2020, followed by a gradual improvement.
Next, with regard to investment activity, the amount of investment for each firm is assumed to be identical to the amount of capital depreciation, considering the possibility that the SMEs' investment activity could be conservative under a recovery in their profits. As for firms' financing activity, it is assumed that each firm will raise funds to maintain 10 percent larger cash reserves at the end of each period (as a "precautionary level") than at the end of fiscal 2019 due to the heightened profit uncertainty.18 It is assumed that, if cash reserves fall below this precautionary level due to a decline in operating cash flows, firms will take out additional loans while reducing the outstanding amount of loans if cash reserves exceed the precautionary level. Firms are assumed to prefer effectively interest-free loans, up to the maximum eligible amount for fiscal 2020, as a means of their financing. 16 For each firm size group, the actual level of operating profits in the first half of fiscal 2020 is used as the starting point; the assumed profits for firms of all sizes in each period are then proportionally allocated based on sales in fiscal 2019 to obtain the assumed future profits for each firm size group. The assumed operating profits of SMEs overall in fiscal 2023 obtained based on this procedure are slightly higher than in fiscal 2019. Moreover, it is assumed that SMEs' operating profits in each industry through fiscal 2023 generally return to a level slightly higher than that of fiscal 2019. 17 The assumed future operating profits of individual firms are based on the actual level of operating profits in fiscal 2019 as the starting point, and the operating profits by industry for each period are allocated using fiscal 2019 sales and the heterogeneity across firms in that industry. For the inter-firm heterogeneity in operating profits, the inter-firm heterogeneity among large firms as shown in Chart IV-1-5 is used for reference. Specifically, the distribution of the deviation of operating profits (relative to sales in the previous year) of large firms from the average within the industry is calculated; assuming that the heterogeneity is identical for SMEs, changes in the heterogeneity between fiscal 2019 and fiscal 2020 are then incorporated into the model. 18 Using the Financial Statement Statistics of Corporations by Industry, Quarterly, to examine SMEs' cash reserves in the first half of fiscal 2020, these increased by about 10 percent compared to fiscal 2019 in almost all industries.
0
20
40
60
80
100
120
90
92
94
96
98
100
102
19 20 21 22 23
Real GDP (lhs)Large firms' operating profits (rhs)SMEs' operating profits (rhs)
FY
FY2019=100 FY2019=100
-7
-6
-5
-4
-3
-2
-1
0
1
19 20 21 22 23
Face-to-face servicesManufacturingConstruction and real estateWholesale and retail
%
FY0
2
4
6
8
10
12
14
16
-30 -20 -10 0 10 20 30
Face-to-face servicesManufacturingConstruction and real estateWholesale and retail
%
ratio of operating profits to sales(deviation from industry averages, % pts)
Chart IV-1-7: Assumptions on GDP and corporate profits for medium-term simulation
Real GDP and corporate profits Operating profits of SMEs Distribution of SMEs within industries by firm size by industry in fiscal 2020
Note: The figures in the middle chart indicate changes in operating profits from fiscal 2019 as a percentage of sales in fiscal 2019.
Source: Japan Center for Economic Research, "ESP forecast."

41
Otherwise, they rely on regular loans from financial institutions without public guarantee. From fiscal 2021 onward, it is assumed that balance sheet adjustment to meet the target is carried out through an adjustment in borrowing from financial institutions without public guarantee. Meanwhile, it is assumed that firms will start making interest payments in fiscal 2023 on effectively interest-free loans executed in fiscal 2020.
Regarding the government's measures to support corporate financing, several changes have been made since the release of the previous Report, in response to the resurgence of COVID-19 since autumn 2020. To name a few, the deadline for applications for effectively interest-free loans has been extended to the end of fiscal 2020 and the maximum amount has been raised (from 40 million yen to 60 million yen), the employment adjustment subsidies program has been expanded, support for restaurants in response to shortening business hours (cooperation fees for shortening business hours) has been established, and support for SMEs in response to the state of emergency (one-off support payments) has been introduced (Chart IV-1-8). The analysis in this Report therefore also takes into account the impact of these various support measures based on actual government expenses (Chart IV-1-9).19 As in the previous Report, with regard to support measures, the analysis focuses only on cash payments and effectively interest-free loans and does not incorporate government contingency funds for COVID-19 for which the purpose has not yet been decided as of the beginning of March 2021, or government budgets for fiscal 2021 and beyond.
19 Specifically, using the Economic Census for Business Activity and the Unincorporated Enterprise Survey to measure the number of firms of each size, etc., the total amount of cash payments to SMEs is estimated based on actual government expenses. SMEs are then ordered in terms of their percentage decline in sales (from largest to smallest) and it is assumed that SMEs receive cash benefits in that order up to the total estimated amount of cash payments to them.
Chart IV-1-8: Overview of measures to support corporate financing
Note: Based on announcements by the government until end-February 2021. "Fiscal expenses" includes the expenses from contingency funds and announced budget diversions.
Source: Cabinet Office; Ministry of Economy, Trade and Industry; Ministry of Finance.
Major measures to support corporate financing Overview of measures
Fiscal expensesand total size of
measures
Subsidies for sustaining businesses Cash payments for SMEs and sole proprietors (up to 2 mil. yen) 5.7 tril. yen
Rent assistance subsidies Cash payments for supporting rent payments (up to 6 mil. yen) 1.2 tril. yen
Expansion of employment adjustmentsubsidies program, etc. Subsidy rates increased for leave allowance (up to 100%) 4.1 tril. yen
Cooperation fees for shortening businesshours
Cash payments for restaurants, etc. that cooperate with localgovernments' requests, such as shortening their business hoursduring the second state of emergency (grants are delivered toeach prefecture)
1.9 tril. yen
One-off support payments Cash payments for SMEs and sole proprietors during thesecond state of emergency (up to 0.6 mil. yen) 0.5 tril. yen
Taxmeasures
Special tax measuressuch as tax payment moratorium
National and local taxes and/or social insurance contributionspossibly deferred for one year Approx. 26 tril. yen
Effectively interest-free loans bygovernment-affiliated and private financialinstitutions
Interest subsidies provided to government-affiliated and privatefinancial institutions
Approx. 110 tril.yen
Crisis response loans to medium-sizedand large firms by government-affiliatedfinancial institutions
Long-term loans with preferential interest rates throughgovernment-affiliated financial institutions
Approx. 10 tril.yen
Equity support by government-affiliatedfinancial institutions and funds
Equity support, mainly through subordinatedloans and capital injections
Approx. 12 tril.yen
Cash payments
Financialmeasures
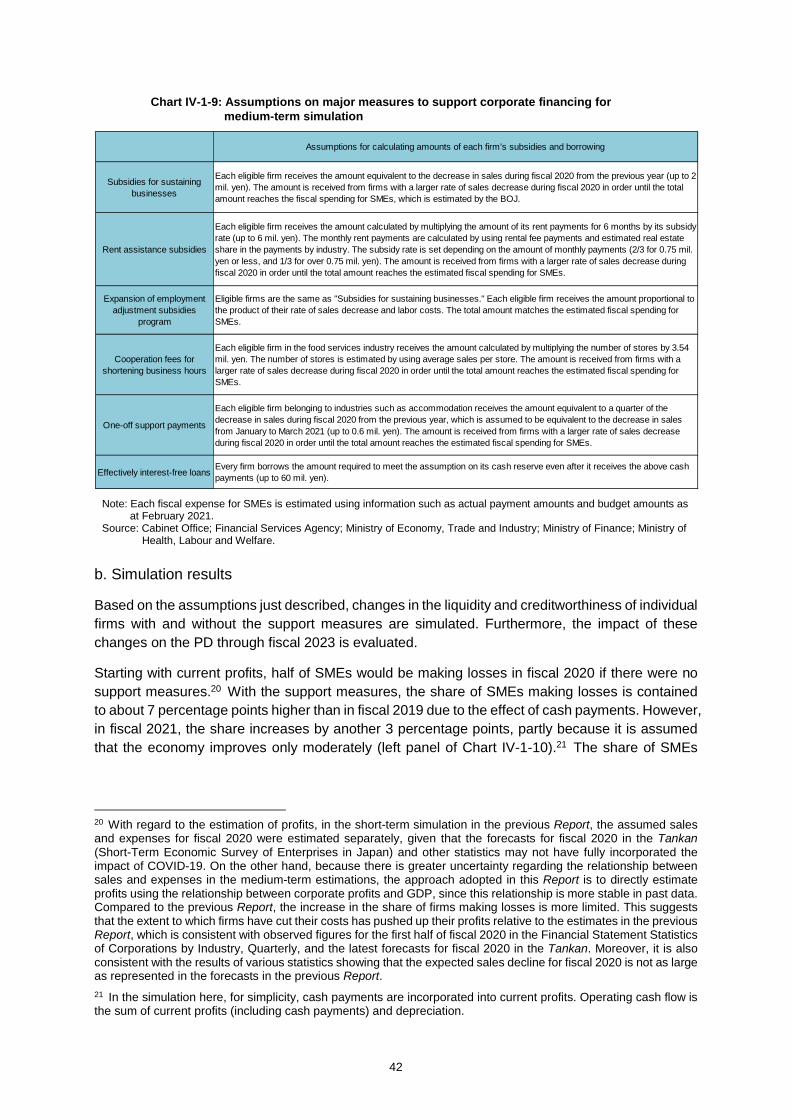
42
b. Simulation results
Based on the assumptions just described, changes in the liquidity and creditworthiness of individual firms with and without the support measures are simulated. Furthermore, the impact of these changes on the PD through fiscal 2023 is evaluated.
Starting with current profits, half of SMEs would be making losses in fiscal 2020 if there were no support measures.20 With the support measures, the share of SMEs making losses is contained to about 7 percentage points higher than in fiscal 2019 due to the effect of cash payments. However, in fiscal 2021, the share increases by another 3 percentage points, partly because it is assumed that the economy improves only moderately (left panel of Chart IV-1-10).21 The share of SMEs
20 With regard to the estimation of profits, in the short-term simulation in the previous Report, the assumed sales and expenses for fiscal 2020 were estimated separately, given that the forecasts for fiscal 2020 in the Tankan (Short-Term Economic Survey of Enterprises in Japan) and other statistics may not have fully incorporated the impact of COVID-19. On the other hand, because there is greater uncertainty regarding the relationship between sales and expenses in the medium-term estimations, the approach adopted in this Report is to directly estimate profits using the relationship between corporate profits and GDP, since this relationship is more stable in past data. Compared to the previous Report, the increase in the share of firms making losses is more limited. This suggests that the extent to which firms have cut their costs has pushed up their profits relative to the estimates in the previous Report, which is consistent with observed figures for the first half of fiscal 2020 in the Financial Statement Statistics of Corporations by Industry, Quarterly, and the latest forecasts for fiscal 2020 in the Tankan. Moreover, it is also consistent with the results of various statistics showing that the expected sales decline for fiscal 2020 is not as large as represented in the forecasts in the previous Report. 21 In the simulation here, for simplicity, cash payments are incorporated into current profits. Operating cash flow is the sum of current profits (including cash payments) and depreciation.
Chart IV-1-9: Assumptions on major measures to support corporate financing for medium-term simulation
Note: Each fiscal expense for SMEs is estimated using information such as actual payment amounts and budget amounts as at February 2021.
Source: Cabinet Office; Financial Services Agency; Ministry of Economy, Trade and Industry; Ministry of Finance; Ministry of Health, Labour and Welfare.
Assumptions for calculating amounts of each firm's subsidies and borrowing
Subsidies for sustainingbusinesses
Each eligible firm receives the amount equivalent to the decrease in sales during fiscal 2020 from the previous year (up to 2mil. yen). The amount is received from firms with a larger rate of sales decrease during fiscal 2020 in order until the totalamount reaches the fiscal spending for SMEs, which is estimated by the BOJ.
Rent assistance subsidies
Each eligible firm receives the amount calculated by multiplying the amount of its rent payments for 6 months by its subsidyrate (up to 6 mil. yen). The monthly rent payments are calculated by using rental fee payments and estimated real estateshare in the payments by industry. The subsidy rate is set depending on the amount of monthly payments (2/3 for 0.75 mil.yen or less, and 1/3 for over 0.75 mil. yen). The amount is received from firms with a larger rate of sales decrease duringfiscal 2020 in order until the total amount reaches the estimated fiscal spending for SMEs.
Expansion of employmentadjustment subsidies
program
Eligible firms are the same as "Subsidies for sustaining businesses." Each eligible firm receives the amount proportional tothe product of their rate of sales decrease and labor costs. The total amount matches the estimated fiscal spending forSMEs.
Cooperation fees forshortening business hours
Each eligible firm in the food services industry receives the amount calculated by multiplying the number of stores by 3.54mil. yen. The number of stores is estimated by using average sales per store. The amount is received from firms with alarger rate of sales decrease during fiscal 2020 in order until the total amount reaches the estimated fiscal spending forSMEs.
One-off support payments
Each eligible firm belonging to industries such as accommodation receives the amount equivalent to a quarter of thedecrease in sales during fiscal 2020 from the previous year, which is assumed to be equivalent to the decrease in salesfrom January to March 2021 (up to 0.6 mil. yen). The amount is received from firms with a larger rate of sales decreaseduring fiscal 2020 in order until the total amount reaches the estimated fiscal spending for SMEs.
Effectively interest-free loansEvery firm borrows the amount required to meet the assumption on its cash reserve even after it receives the above cashpayments (up to 60 mil. yen).

43
making losses then gradually declines, so that by fiscal 2023 it is back at the comparable level in fiscal 2019.
Turning to the share of firms facing capital shortages, if there were no support measures, the share would increase gradually, as the share of firms making current losses would remain high in fiscal 2021 and beyond (middle panel of Chart IV-1-10). However, taking the support measures into account, the increase in the share of firms facing capital shortages remains relatively limited from fiscal 2020 onward.
Looking at firms facing potential cash shortages -- i.e., those with cash reserves that are insufficient to cover their negative operating cash flow -- the share of such firms would increase by about 5 percentage points in fiscal 2020 compared to fiscal 2019 in the absence of the support measures. However, once the support measures are taken into account, the share increases only by around 1 percentage point as a result of the cash payments (right panel of Chart IV-1-10). Yet, even when the support measures are taken into account, there remain a fair number of firms that still have a negative operating cash flow, so that the share of firms facing potential cash shortages will not fall to the level of fiscal 2019.
Next, a PD model is used to conduct a dynamic simulation of how the default rate of SMEs would evolve during the simulation period due to the changes in their financial bases both in terms of liquidity and creditworthiness. 22 In this model, the PD increases as both liquidity and creditworthiness deteriorate when firms' operating cash flow decreases due to COVID-19. The channels through which support measures affect the PD can be summarized as follows. First, an
22 The PD model is estimated in the same way as in Box 4 of the previous Report, using whether a firm defaults (within one year) as the dependent variable and the cash surplus/shortage ratio, the leverage ratio, the borrowing interest rate, and the interest coverage ratio as explanatory variables. As in the previous Report, the PD model takes the amount of cash reserves at the beginning of fiscal 2020 plus the amount of effectively interest-free loans executed in fiscal 2020 into account when calculating the numerator of the cash surplus/shortage ratio in fiscal 2020. For firms facing a capital shortage, the denominator of the leverage ratio (total assets) is smaller than the numerator (outstanding amount of funding); hence, additional borrowing will reduce the leverage ratio in the calculation. Therefore, in the PD model in this Report, the denominator of the leverage ratio is changed from total assets to the sum of total assets and the outstanding amount of funding in the previous fiscal year.
0
10
20
30
40
50
60
70
05 07 09 11 13 15 17 19 21 23
Actual Without support measures in FY 2020 With support measures in FY 2020
%
FY
Simulation
20
25
30
35
40
45
05 07 09 11 13 15 17 19 21 23FY
%Simulation
0
2
4
6
8
10
12
14
16
05 07 09 11 13 15 17 19 21 23FY
%Simulation
Note: Firms facing cash shortages are defined as firms whose net operating cash outflow during the year exceeds their cash reserves at the beginning of the fiscal year.
Source: CRD Association.
Share of firms with current losses Share of firms facing capital shortages Share of firms facing cash shortages
Chart IV-1-10: Simulation results

44
increase in cash flow through cash payments and borrowing boosts the stock of cash reserves, and this improvement in firms' liquidity pushes down the PD (Chart IV-1-11). In addition, cash payments have the effect of further pushing down the PD in subsequent years through a reduction in firms' financial leverage (leverage ratio). On the other hand, an increase in borrowing will push up the PD through an increase in leverage ratios and a decrease in debt repayment capacity (the interest coverage ratio, ICR).23 It should be noted that, however, assuming that interest subsidies on effectively interest-free loans will be provided for three years, this will temporarily help to lower the PD through lower (average) borrowing rates but will then contribute to a higher PD through higher interest payments in fiscal 2023 when this effect turns off.
First, looking into the PD of SMEs as a whole in the absence of support measures, the model suggests that the PD increases by about 30 bps in fiscal 2020, mainly due to changes in firms' liquidity. The upward pressure on the PD through changes in liquidity subsequently disappears in fiscal 2022 as corporate profits improve and the severity of the firms' liquidity conditions gradually eases. However, the increase in borrowing in fiscal 2020 to ease the negative impact of COVID-19 on firms' liquidity leads to a deterioration in firms' debt repayment capacity in subsequent years, pushing up the PD through changes in firms' creditworthiness. The increase in the PD gradually becomes smaller, but the deterioration in creditworthiness leads to a higher PD throughout the simulation period (Chart IV-1-12).
On the other hand, when the support measures are taken into account, the PD due to changes in firms' liquidity in the simulation falls substantially in fiscal 2020 due to the improvement in firms' liquidity as a result of cash payments and effectively interest-free loans. Subsequently, until fiscal 2023, the PD hardly increases compared to fiscal 2019. This is because the strong impact of the fiscal 2020 support measures remains, underpinning funding in fiscal 2021 and 2022 and restraining additional borrowing. Furthermore, the interest subsidies for effectively interest-free loans exert downward pressure on the PD by preventing an increase in interest payments until fiscal 2023. In fiscal 2023, however, when interest subsidies for effectively interest-free loans end,
23 The contribution of the cash surplus/shortage ratio to changes in the PD is categorized as the contribution of changes in liquidity, while the contributions of the leverage ratio, the borrowing interest rate, and the ICR are categorized as the contribution of changes in solvency.
Chart IV-1-11: Transmission mechanism in PD model
Liquidity factor
Cash payments
Effectively interest-free loansmaximum total of 60
million yenpriority over regular loans
Measures to support corporate f inancing
(FY2020)
Leverage ratio
Borrowing interest rate
ICR
Solvency factor
Regular loans
Cash reserves
FY2023
PD (probability of default)
within 1 year
Short-term cash surplus/shortage ratio
up arrow : increase in PDdow n arrow: decrease in PD(From left to right, arrow s indicate contribution of cash payments, effectively interest-free loans, and regular loans, respectively.)
Beginningof FY2020
Beginning of FY2020
FY2020

45
the PD increases slightly through a change in firms' creditworthiness caused by the increase in interest payments.
For the face-to-face services industry, which has been heavily influenced by COVID-19, the PD is pushed down temporarily in fiscal 2020. However, in subsequent years, both firms' liquidity and creditworthiness decline as the effects of support measures gradually turn off, pushing up the PD, since the recovery in demand is assumed to be gradual (Chart IV-1-13).24 In other industries, improvements in both liquidity and creditworthiness act to push down the PD as firms reduce loans outstanding on the back of a recovery in corporate profits. In fiscal 2023, when interest subsidies for effectively interest-free loans end, the decline in the PD becomes smaller due to a deterioration in firms' creditworthiness.
The above analysis shows that the various measures to support corporate financing introduced in fiscal 2020 are considered to have a substantial impact in terms of reducing the overall PD of SMEs over the next three years. It should be noted, however, that the results greatly depend on the assumptions regarding developments in corporate profits at the macro-level, firms' investment and financing behavior, and the heterogeneity in profits across industries and firms. Since there is substantial uncertainty regarding these issues, the quantitative results of the analysis should be interpreted with a considerable degree of latitude. With this in mind, the above results suggest that, depending on future developments in the recovery of profits, the heterogeneity in SMEs' PD across industries and firms may become more pronounced going forward. Financial institutions will need to take this into account, carefully assess the sustainability of borrower firms' business, provide effective support tailored to borrowers' needs, and make appropriate provisions as necessary.
24 Another factor contributing to changes in the PD is changes in financial institutions' credit portfolios ("portfolio change factor" in Charts IV-1-12 and IV-1-13). For example, assuming that differences in the extent to which firms in the face-to-face services industry are affected by COVID-19 continue to be observed, firms in relatively healthy financial positions will repay existing loans and be stripped from financial institutions' credit portfolios, leading to an increase in the PD.
Chart IV-1-13: Decomposition of the deviation of PD (by industry)
Note: The charts show the simulation with the measures to support corporate financing.
Chart IV-1-12: Decomposition of the deviation of PD (all industries)
Face-to-face services Other industries Without support measures With support measures
Note: The charts indicate the deviation of PD from the simulation without the COVID-19 outbreak (firms' profits are unchanged and precautionary loans are not obtained, etc.). The same applies to Chart IV-1-13.
-0.6
-0.5
-0.4
-0.3
-0.2
-0.1
0.0
0.1
0.2
0.3
0.4
20 21 22 23Portfolio change factor Solvency factorLiquidity factor Deviation of PD
% pts
FY 20 21 22 23-0.8
-0.6
-0.4
-0.2
0.0
0.2
0.4
0.6
0.8
20 21 22 23Portfolio change factor Solvency factorLiquidity factor Deviation of PD
% pts
FY 20 21 22 23
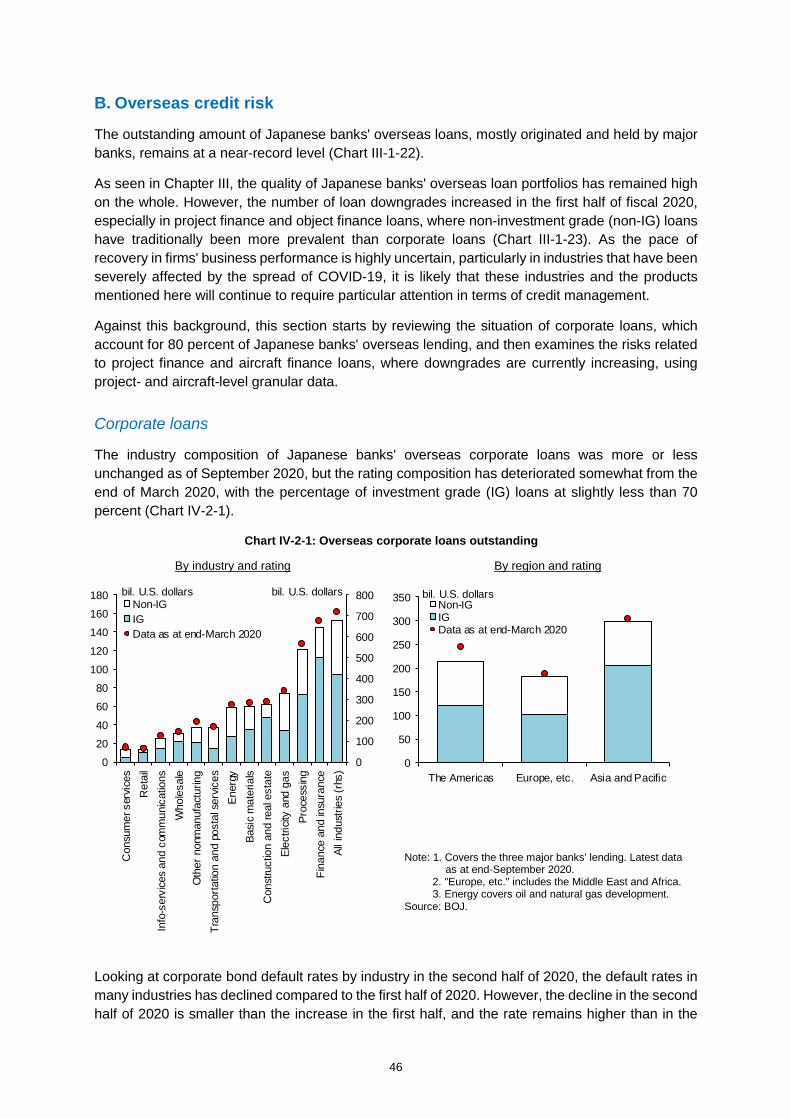
46
B. Overseas credit risk
The outstanding amount of Japanese banks' overseas loans, mostly originated and held by major banks, remains at a near-record level (Chart III-1-22).
As seen in Chapter III, the quality of Japanese banks' overseas loan portfolios has remained high on the whole. However, the number of loan downgrades increased in the first half of fiscal 2020, especially in project finance and object finance loans, where non-investment grade (non-IG) loans have traditionally been more prevalent than corporate loans (Chart III-1-23). As the pace of recovery in firms' business performance is highly uncertain, particularly in industries that have been severely affected by the spread of COVID-19, it is likely that these industries and the products mentioned here will continue to require particular attention in terms of credit management.
Against this background, this section starts by reviewing the situation of corporate loans, which account for 80 percent of Japanese banks' overseas lending, and then examines the risks related to project finance and aircraft finance loans, where downgrades are currently increasing, using project- and aircraft-level granular data.
Corporate loans
The industry composition of Japanese banks' overseas corporate loans was more or less unchanged as of September 2020, but the rating composition has deteriorated somewhat from the end of March 2020, with the percentage of investment grade (IG) loans at slightly less than 70 percent (Chart IV-2-1).
Looking at corporate bond default rates by industry in the second half of 2020, the default rates in many industries has declined compared to the first half of 2020. However, the decline in the second half of 2020 is smaller than the increase in the first half, and the rate remains higher than in the
Chart IV-2-1: Overseas corporate loans outstanding
By industry and rating By region and rating
0
50
100
150
200
250
300
350
The Americas Europe, etc. Asia and Pacific
Non-IGIGData as at end-March 2020
bil. U.S. dollars
Note: 1. Covers the three major banks' lending. Latest data as at end-September 2020.
2. "Europe, etc." includes the Middle East and Africa. 3. Energy covers oil and natural gas development.
Source: BOJ.
0
100
200
300
400
500
600
700
800
0
20
40
60
80
100
120
140
160
180
Con
sum
er s
ervi
ces
Ret
ail
Info
-ser
vice
s an
d co
mm
unic
atio
nsW
hole
sale
Oth
er n
onm
anuf
actu
ring
Tran
spor
tatio
n an
d po
stal
ser
vices
Ener
gyBa
sic
mat
eria
lsC
onst
ruct
ion
and
real
est
ate
Elec
tricit
y an
d ga
sPr
oces
sing
Fina
nce
and
insu
ranc
eAl
l ind
ustri
es (r
hs)
Non-IGIGData as at end-March 2020
bil. U.S. dollars bil. U.S. dollars

47
second half of 2019, especially in retail, consumer services, and energy (Chart IV-2-2). Default rates generally remain low and have not increased significantly in industries where Japanese banks have relatively large amounts of loans outstanding, with the exception of energy, although they have recently increased somewhat in basic materials, construction and real estate, and electricity and gas.
In the market as a whole, the rate of downgrades from IG to non-IG and the default rate of non-IG corporate bonds also increased throughout 2020 but remained at low levels compared to past episodes when defaults increased significantly, such as during the GFC in the latter half of the 2000s (Chart IV-2-3).
As described above, the overall quality of Japanese banks' overseas corporate lending has remained high, despite a slight increase in the number of downgrades. The reason is that industries for which business performance has deteriorated significantly due to the relatively strong impact of the spread of COVID-19 account for a small share of such lending. However, in some industries, such as energy, default rates are still higher than before the COVID-19 outbreak, and there is considerable uncertainty about the future course of the spread of the disease and the outlook for overseas economies; thus, it is necessary to continue to monitor developments in creditworthiness.
Project finance loans
Japanese banks have been expanding their project finance loans since the latter half of the 2000s. In particular, since the GFC, they have actively increased the amount of loans outstanding, while financial institutions in Europe and the United States have shrunk their project finance business. Currently, the number of projects in which Japanese banks have acted as lead banks accounts for about 20 percent of project finance loans overall (Chart IV-2-4). The industry composition of project
Chart IV-2-3: Default rates of corporate bonds
Note: The reference period is 2 quarters. Latest data as at July-December of 2020.
Source: Moody's.
Note: Energy covers oil and natural gas development. Source: Moody's.
Chart IV-2-2: Default rates of corporate bonds by industry
0
1
2
3
4
5
6
7
8
9
Con
sum
er s
ervi
ces
Ret
ail
Info
-ser
vice
s an
d co
mm
unic
atio
ns
Who
lesa
le
Oth
er n
onm
anuf
actu
ring
Tran
spor
tatio
n an
d po
stal
ser
vices
Ener
gy
Basi
c m
ater
ials
Con
stru
ctio
n an
d re
al e
stat
e
Elec
tricit
y an
d ga
s
Proc
essi
ng
Fina
nce
and
insu
ranc
e
H2 2019H1 2020H2 2020
%
0
1
2
3
4
5
6
7
8
9
85 90 95 00 05 10 15 20Default rates of non-IG corporate bondsDowngrade rates from IG to non-IG
%
CY
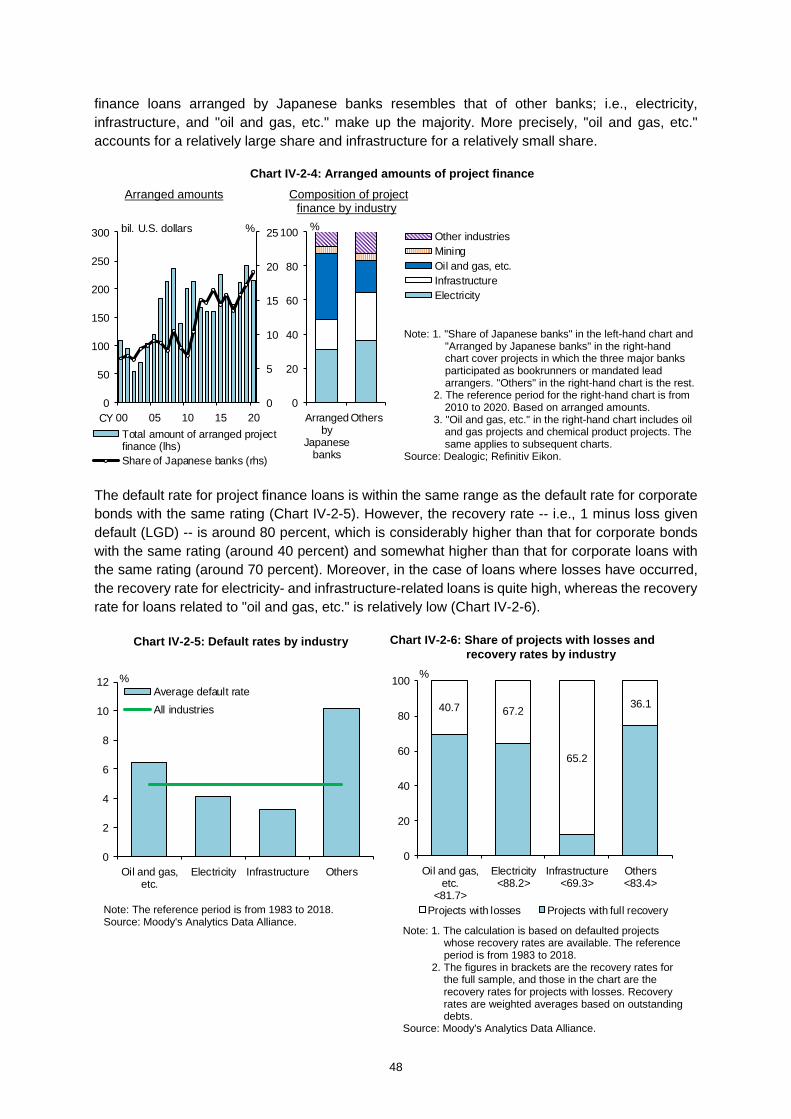
48
finance loans arranged by Japanese banks resembles that of other banks; i.e., electricity, infrastructure, and "oil and gas, etc." make up the majority. More precisely, "oil and gas, etc." accounts for a relatively large share and infrastructure for a relatively small share.
The default rate for project finance loans is within the same range as the default rate for corporate bonds with the same rating (Chart IV-2-5). However, the recovery rate -- i.e., 1 minus loss given default (LGD) -- is around 80 percent, which is considerably higher than that for corporate bonds with the same rating (around 40 percent) and somewhat higher than that for corporate loans with the same rating (around 70 percent). Moreover, in the case of loans where losses have occurred, the recovery rate for electricity- and infrastructure-related loans is quite high, whereas the recovery rate for loans related to "oil and gas, etc." is relatively low (Chart IV-2-6).
Arranged amounts Composition of project finance by industry
0
20
40
60
80
100
Arrangedby
Japanesebanks
Others
Other industriesMiningOil and gas, etc.InfrastructureElectricity
%
0
5
10
15
20
25
0
50
100
150
200
250
300
00 05 10 15 20Total amount of arranged projectfinance (lhs)Share of Japanese banks (rhs)
bil. U.S. dollars %
CY
Chart IV-2-4: Arranged amounts of project finance
Note: 1. "Share of Japanese banks" in the left-hand chart and "Arranged by Japanese banks" in the right-hand chart cover projects in which the three major banks participated as bookrunners or mandated lead arrangers. "Others" in the right-hand chart is the rest.
2. The reference period for the right-hand chart is from 2010 to 2020. Based on arranged amounts.
3. "Oil and gas, etc." in the right-hand chart includes oil and gas projects and chemical product projects. The same applies to subsequent charts.
Source: Dealogic; Refinitiv Eikon.
Chart IV-2-6: Share of projects with losses and recovery rates by industry
Chart IV-2-5: Default rates by industry
Note: 1. The calculation is based on defaulted projects whose recovery rates are available. The reference period is from 1983 to 2018.
2. The figures in brackets are the recovery rates for the full sample, and those in the chart are the recovery rates for projects with losses. Recovery rates are weighted averages based on outstanding debts.
Source: Moody's Analytics Data Alliance.
Note: The reference period is from 1983 to 2018. Source: Moody's Analytics Data Alliance.
0
2
4
6
8
10
12
Oil and gas,etc.
Electricity Infrastructure Others
Average default rateAll industries
%
0
20
40
60
80
100
Oil and gas,etc.
<81.7>
Electricity<88.2>
Infrastructure<69.3>
Others<83.4>
Projects with losses Projects with full recovery
%
40.7 67.236.1
65.2
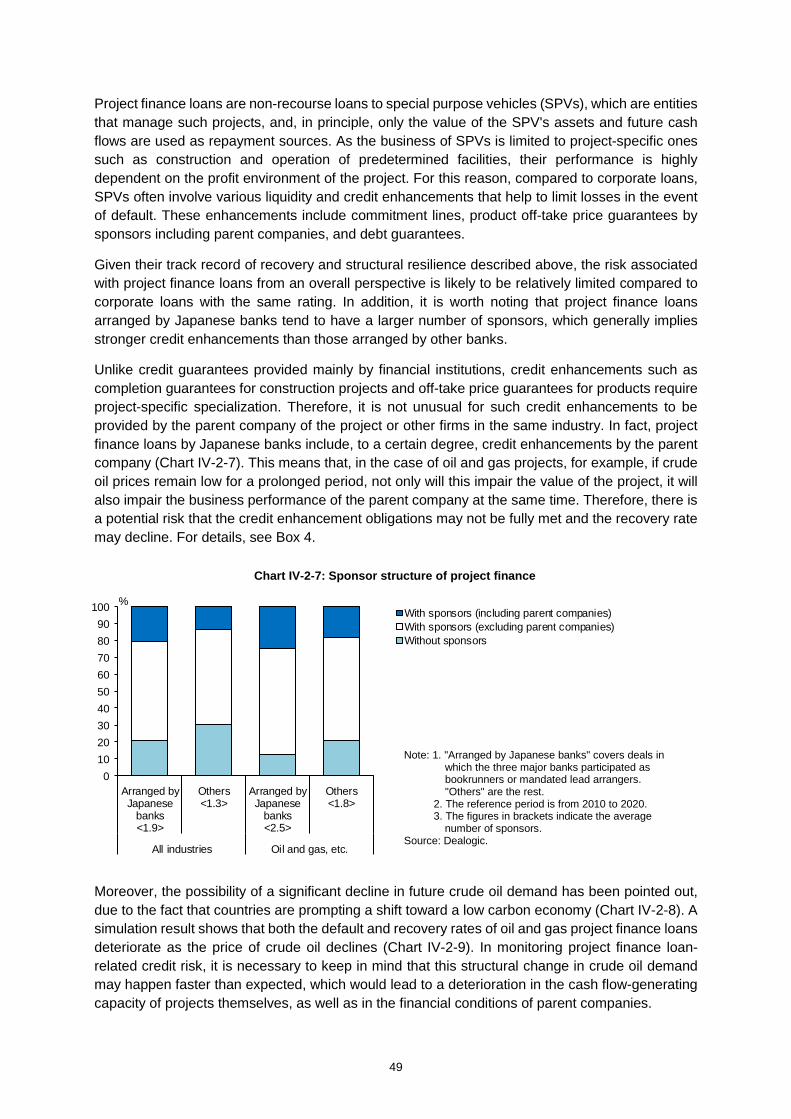
49
Project finance loans are non-recourse loans to special purpose vehicles (SPVs), which are entities that manage such projects, and, in principle, only the value of the SPV's assets and future cash flows are used as repayment sources. As the business of SPVs is limited to project-specific ones such as construction and operation of predetermined facilities, their performance is highly dependent on the profit environment of the project. For this reason, compared to corporate loans, SPVs often involve various liquidity and credit enhancements that help to limit losses in the event of default. These enhancements include commitment lines, product off-take price guarantees by sponsors including parent companies, and debt guarantees.
Given their track record of recovery and structural resilience described above, the risk associated with project finance loans from an overall perspective is likely to be relatively limited compared to corporate loans with the same rating. In addition, it is worth noting that project finance loans arranged by Japanese banks tend to have a larger number of sponsors, which generally implies stronger credit enhancements than those arranged by other banks.
Unlike credit guarantees provided mainly by financial institutions, credit enhancements such as completion guarantees for construction projects and off-take price guarantees for products require project-specific specialization. Therefore, it is not unusual for such credit enhancements to be provided by the parent company of the project or other firms in the same industry. In fact, project finance loans by Japanese banks include, to a certain degree, credit enhancements by the parent company (Chart IV-2-7). This means that, in the case of oil and gas projects, for example, if crude oil prices remain low for a prolonged period, not only will this impair the value of the project, it will also impair the business performance of the parent company at the same time. Therefore, there is a potential risk that the credit enhancement obligations may not be fully met and the recovery rate may decline. For details, see Box 4.
Moreover, the possibility of a significant decline in future crude oil demand has been pointed out, due to the fact that countries are prompting a shift toward a low carbon economy (Chart IV-2-8). A simulation result shows that both the default and recovery rates of oil and gas project finance loans deteriorate as the price of crude oil declines (Chart IV-2-9). In monitoring project finance loan-related credit risk, it is necessary to keep in mind that this structural change in crude oil demand may happen faster than expected, which would lead to a deterioration in the cash flow-generating capacity of projects themselves, as well as in the financial conditions of parent companies.
0102030405060708090
100
Arranged byJapanese
banks<1.9>
Others<1.3>
Arranged byJapanese
banks<2.5>
Others<1.8>
All industries Oil and gas, etc.
With sponsors (including parent companies)With sponsors (excluding parent companies)Without sponsors
%
Chart IV-2-7: Sponsor structure of project finance
Note: 1. "Arranged by Japanese banks" covers deals in which the three major banks participated as bookrunners or mandated lead arrangers. "Others" are the rest.
2. The reference period is from 2010 to 2020. 3. The figures in brackets indicate the average
number of sponsors. Source: Dealogic.

50
Aircraft-related object finance loans
Lastly, credit risks of aircraft financing loans, which account for a large share of object finance loans, are examined. Global air passenger demand has grown more or less steadily despite temporary setbacks in the wake of the 9/11 terrorist attacks and the GFC (Chart IV-2-10). However, due to the spread of COVID-19, it experienced a significant decrease in 2020, shrinking to the level seen in 1999. As pointed out in the previous Report, this is the first time that the air transportation industry has experienced such a sharp and simultaneous global decline in demand. Going forward, some experts are of the view that the industry will not recover to the level seen in 2019 until around 2024.
At this point in time, however, the flight schedules for 2021 of airlines worldwide25 are below 2019 levels by only a little more than 10 percent, and significant capacity reductions, such as reductions in flight numbers and the elimination of routes, have not yet materialized. The scheduled flight capacity for 2021 as of January 2021 seems to exceed by about 40 percent the flight capacity estimated based on the relationship between passenger demand and actual flight capacity from 2004 to 2019.
Consistent with this, the number of passenger aircraft owned by airlines, leasing companies, etc. in 2020 did not decline much, as the number of aircraft retired remained at the same level as in previous years, although the number of new aircraft deliveries decreased. Under these circumstances, about 30 percent of the passenger aircraft in service are now on standby or in storage, and the price of used aircraft seems to have fallen by about 15 percent on average
25 The scheduled flight capacity for 2021 (as of January 2021) in Chart IV-2-10 is the aggregate of flight schedules published by airlines as of that date. Actual flight capacity will be adjusted from scheduled capacity, such as through flight cancellations based on reservations as the flight date approaches. Therefore, the expectation is that actual flight capacity in fiscal 2021 will converge to a level close to the projected values. The purpose of the chart is to gauge the extent of surplus capacity, which is the premise of determining scheduled capacity through the comparison of scheduled capacity and estimated flight capacity.
Chart IV-2-8: Long-term outlook for crude oil demand
Note: 1. The values from 2020 onward are outlooks. 2. "Stated policies scenario" is a scenario that reflects
all of today's announced policy intensions and targets. "Sustainable development scenario" is the scenario that is expected to be followed to achieve sustainable energy objectives, including the Paris Agreement. Assumptions for the economic environments other than energy policies are the same as those of "Stated policies scenario." "Pre-COVID-19 scenario" indicates "Stated policies scenario" as of 2019.
Source: IEA, "World Energy Outlook 2020."
Chart IV-2-9: Probabilities of default and recovery rates in times of low crude oil prices
Note: The figures are estimates for oil and gas projects. In estimating "Probabilities of default," the deviation of the actual WTI from the forecast during the project period is used as an explanatory variable. In the graph, the horizontal axis for probabilities of default represents the sum of the WTI forecast (the average of the latest five years) and this deviation. See Chart B4-2 for specific variables used in the estimation.
0
20
40
60
80
100
0
1
2
3
4
5
6
7
8
9
60 55 50 45 40
Probabilities of default (lhs)Recovery rates (rhs)
% %
WTI, U.S. dollars / barrel
6065707580859095
100105110
10 15 20 25 30 35 40
Stated policies scenarioSustainable development scenarioPre-COVID-19 scenario
mil. barrel/day
CY

51
compared to the end of 2019 (Chart IV-2-11). Price declines were particularly pronounced for large aircraft and relatively old small aircraft, exceeding 30 percent in some cases, as some airlines hurried to replace such aircraft so as to meet the conditions for moving toward a low carbon economy ahead of applying for government support. The rate of decline in the prices of passenger aircraft owned by aircraft leasing companies financed by Japanese financial institutions and passenger aircraft for which Japanese banks have provided non-recourse loans is deemed to be around the market average as a whole.
Going forward, if the prices of used passenger aircraft decline further, Japanese banks may not be able to recover their entire exposure to non-recourse loans for aircraft financing in the event of default. Furthermore, the aircraft manufacturing industry will also be affected in the form of reduced demand for new aircraft, and thus future developments warrant attention.
C. Market risk associated with securities investment
Japanese financial institutions have been actively investing in overseas credit products and investment trusts since before the COVID-19 outbreak in order to secure profits under the prolonged low interest rate environment. Meanwhile, the importance of NBFIs such as investment funds in financial intermediation activities has been growing overseas. At the outbreak of the disease, when the market became volatile toward the end of March 2020, these entities faced pressure from rapid outflows of funds and margin requirements. This triggered a rapid drying up of liquidity in various financial instruments, as well as a rise in the U.S. dollar funding premium, which greatly destabilized international financial markets. Under these circumstances, many financial institutions saw price declines in their securities holdings and breached various risk management limits, such as loss limits. As markets subsequently regained calmness, due in part to the effects
Chart IV-2-10: Trends and outlook of demand and capacity for air transportation
Note: 1. Passenger kilometers and seat kilometers are calculated by multiplying the number of revenue passengers and available seats by the number of kilometers that a given passenger airplane flies, respectively.
2. The value of "Flight capacity (2021 schedule)" is annualized data for April to December 2021 as of January 2021.
3. The value of "Flight capacity (2021 estimation)" is calculated by the BOJ in consideration of the relationship between "Flight demand" and "Flight capacity" from 2004 to 2019.
Source: Cirium "SRS Analyser"; IATA/Tourism Economics, "Air Passenger Forecasts."
Chart IV-2-11: Price declines of used passenger aircraft
Note: 1. Change in price is calculated on the half-life market value basis for the period from January 2020 to January 2021 in consideration of an individual aircraft's age.
2. All passenger aircraft in service includes passenger aircraft in service and those of in storage. Five aircraft leasing firms affiliated with Japanese banks includes passenger aircraft owned or managed by five aircraft leasing firms whose major shareholders are Japanese financial institutions or their subsidiaries. Three major banks includes passenger aircraft subject to leasing contracts for which the three major banks offer non-recourse loans.
Source: Cirium, "Fleets Analyzer," "Value Time Series."
0
2
4
6
8
10
12
04 06 08 10 12 14 16 18 20 22 24
Range of forecastFlight demandFlight capacityFlight capacity (2021 schedule)Flight capacity (2021 estimation)
Demand: tril. passenger kilometersCapacity: tril. seat kilometers
CY
Forecast
-16.1-13.6
-15.0
-20
-15
-10
-5
0
All passengeraircraft in service
Five aircraftleasing firmsaffiliated with
Japanese banksThree major
banks
All passenger aircraftNarrow bodyWide body
%

52
of large-scale policy measures, the impact on Japanese financial institutions' realized gains/losses on securities holdings overall remained limited.
In response to these developments, Japanese large financial institutions in particular have become increasingly cautious about investing in overseas credit products and investment trusts. However, there has been no change in the basic picture that financial institutions put emphasis on risk-taking through investment in securities in order to secure profits. Recently, the substantial improvement in market conditions and the rise in deposit inflows against the backdrop of the increase in fiscal spending appear to have begun to have an impact on their investment stance. Against this background, this section examines the market risks associated with financial institutions' securities investment.
Yen interest rate risk
The amount of interest rate risk associated with the yen-denominated bond investments of financial institutions reached a peak in fiscal 2012 and then started to decline until bottoming out in fiscal 2017, after which it started to increase again and recently jumped to a new peak, registering the highest level since records began in fiscal 2002 (Chart IV-3-1).26 Before the COVID-19 outbreak, the increase in the amount of risk was driven by the lengthening of the duration of bond portfolios, mainly by regional financial institutions, in order to compensate for the decline in profits from high-coupon bonds, which these institutions held large amounts of and were on redemption. While this trend has continued, the increase in the amount of risk recently has been driven by the rise in the outstanding amount of bond investments at all types of financial institutions, partly due to the increase in the inflow of deposits against the backdrop of increased fiscal spending (Charts III-1-
26 In Chart IV-3-1, changes in the economic value of bondholdings are calculated assuming a parallel shift in the yield curve in which the interest rates for all maturities rise by 1 percentage point. One of the interest rate risk scenarios assumed in the FSA's public notice about interest rate risk in the banking book (IRRBB) employs an upward parallel shift of 1 percentage point.
Chart IV-3-1: Interest rate risk associated with yen-denominated bondholdings among financial institutions
Total Major banks Regional banks Shinkin banks
Note: 1. Interest rate risk is a 100 basis point value in the banking book. Convexity and higher order terms are taken into account. The data for fiscal 2020 are estimated as at end-February 2021.
2. Capital represents common equity Tier 1 (CET1) capital for internationally active banks from fiscal 2012 onward, core capital for domestic banks from fiscal 2013 onward, and Tier 1 capital for internationally active banks and domestic banks before fiscal 2012 and fiscal 2013, respectively (excluding the transitional arrangements related to the Basel III framework). Unless otherwise noted, subsequent charts are based on the same definition.
Source: BOJ.
0
1
2
3
4
10 12 14 16 18 203 years or less (lhs) 3-5 years (lhs) 5-10 years (lhs)Over 10 years (lhs) Ratio to capital (rhs)
tril. yen
FY
10th-90th percentile range (ratio to capital, rhs)
0
10
20
30
40
50
60
10 12 14 16 18 20
%
10 12 14 16 18 200
10
20
30
40
50
60
0
2
4
6
8
10
02 04 06 08 10 12 14 16 18 20FY
tril. yen %

53
25 and IV-3-2). Looking at the ratio of the amount of interest rate risk associated with yen-denominated bond investments to the amount of capital by type of financial institution, this ratio has risen to around 10 percent for major banks, around 20 percent for regional banks, and around 30 percent for shinkin banks. Moreover, the heterogeneity in the ratio among financial institutions has been increasing, especially among regional banks and shinkin banks.
If a part of the recent increase in deposits is calculated as, similar to normal deposits, an increase in sticky core deposits, the yen interest rate risk in the entire banking book is smaller than that for bond portfolios (Chart IV-3-3). However, there is uncertainty regarding the stickiness of the deposits that have flowed in due to the recent increase in fiscal spending, and close attention needs to be
Chart IV-3-2: Deposits outstanding by type of depositor
Note: 1. Covers domestically licensed banks. "Financial institutions, etc." includes NCDs.
2. Latest data as at the October-December quarter of 2020.
Source: BOJ. -2-10123456789
10
06 07 08 09 10 11 12 13 14 15 16 17 18 19 20
Financial institutions, etc.Central government, etc.IndividualsFirmsTotal
y/y % chg.
CY
Note: Interest rate risk is a 100 basis point value in the banking book. Convexity and higher order terms, and so-called "core deposits" in debts are taken into account. For major banks and regional banks, off-balance-sheet transactions (interest rate swaps) are included. The data for major banks are as at end-December 2020, and those for regional banks and shinkin banks are as at end-September 2020.
Source: BOJ.
Major banks Regional banks Shinkin banks
Chart IV-3-3: Yen interest rate risk among financial institutions
-10
0
10
20
30
40
50
-2
0
2
4
6
8
10
Bond
s
Loan
s
Inte
rest
rate
sw
aps
Deb
ts
Inte
rest
rate
risk
Increasing factor (lhs) Decreasing factor (lhs) Ratio to capital (rhs)
tril. yen %
-10
0
10
20
30
40
50
-2
0
2
4
6
8
10
Bond
s
Loan
s
Inte
rest
rate
sw
aps
Deb
ts
Inte
rest
rate
risk
tril. yen %
-10
0
10
20
30
40
50
-2
0
2
4
6
8
10
Bond
s
Loan
s
Inte
rest
rate
sw
aps
Deb
ts
Inte
rest
rate
risk
%tril. yen
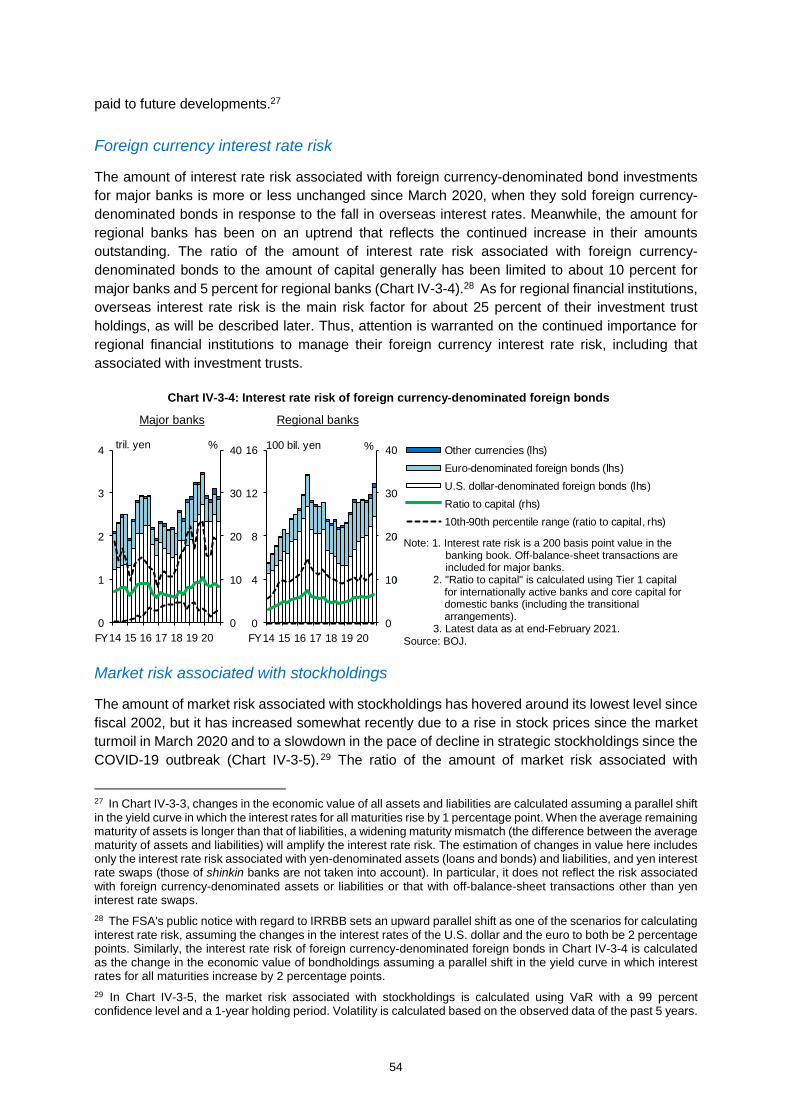
54
paid to future developments.27
Foreign currency interest rate risk
The amount of interest rate risk associated with foreign currency-denominated bond investments for major banks is more or less unchanged since March 2020, when they sold foreign currency-denominated bonds in response to the fall in overseas interest rates. Meanwhile, the amount for regional banks has been on an uptrend that reflects the continued increase in their amounts outstanding. The ratio of the amount of interest rate risk associated with foreign currency-denominated bonds to the amount of capital generally has been limited to about 10 percent for major banks and 5 percent for regional banks (Chart IV-3-4).28 As for regional financial institutions, overseas interest rate risk is the main risk factor for about 25 percent of their investment trust holdings, as will be described later. Thus, attention is warranted on the continued importance for regional financial institutions to manage their foreign currency interest rate risk, including that associated with investment trusts.
Market risk associated with stockholdings
The amount of market risk associated with stockholdings has hovered around its lowest level since fiscal 2002, but it has increased somewhat recently due to a rise in stock prices since the market turmoil in March 2020 and to a slowdown in the pace of decline in strategic stockholdings since the COVID-19 outbreak (Chart IV-3-5).29 The ratio of the amount of market risk associated with
27 In Chart IV-3-3, changes in the economic value of all assets and liabilities are calculated assuming a parallel shift in the yield curve in which the interest rates for all maturities rise by 1 percentage point. When the average remaining maturity of assets is longer than that of liabilities, a widening maturity mismatch (the difference between the average maturity of assets and liabilities) will amplify the interest rate risk. The estimation of changes in value here includes only the interest rate risk associated with yen-denominated assets (loans and bonds) and liabilities, and yen interest rate swaps (those of shinkin banks are not taken into account). In particular, it does not reflect the risk associated with foreign currency-denominated assets or liabilities or that with off-balance-sheet transactions other than yen interest rate swaps. 28 The FSA's public notice with regard to IRRBB sets an upward parallel shift as one of the scenarios for calculating interest rate risk, assuming the changes in the interest rates of the U.S. dollar and the euro to both be 2 percentage points. Similarly, the interest rate risk of foreign currency-denominated foreign bonds in Chart IV-3-4 is calculated as the change in the economic value of bondholdings assuming a parallel shift in the yield curve in which interest rates for all maturities increase by 2 percentage points. 29 In Chart IV-3-5, the market risk associated with stockholdings is calculated using VaR with a 99 percent confidence level and a 1-year holding period. Volatility is calculated based on the observed data of the past 5 years.
0
10
20
30
40
0
1
2
3
4
14 15 16 17 18 19 20
Other currencies (lhs)Euro-denominated foreign bonds (lhs)U.S. dollar-denominated foreign bonds (lhs)Ratio to capital (rhs)10th-90th percentile range (ratio to capital, rhs)
%tril. yen
FY0
10
20
30
40
0
4
8
12
16
14 15 16 17 18 19 20
100 bil. yen %
FY
Chart IV-3-4: Interest rate risk of foreign currency-denominated foreign bonds
Major banks Regional banks
Note: 1. Interest rate risk is a 200 basis point value in the banking book. Off-balance-sheet transactions are included for major banks.
2. "Ratio to capital" is calculated using Tier 1 capital for internationally active banks and core capital for domestic banks (including the transitional arrangements).
3. Latest data as at end-February 2021. Source: BOJ.
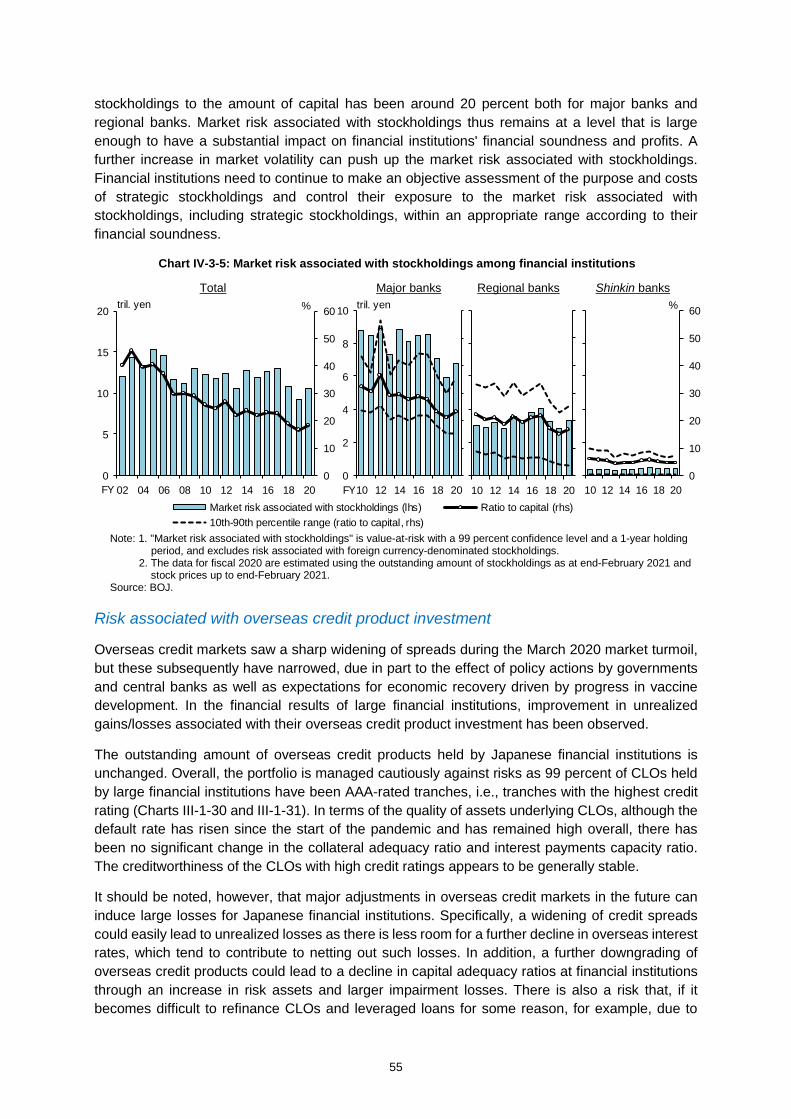
55
stockholdings to the amount of capital has been around 20 percent both for major banks and regional banks. Market risk associated with stockholdings thus remains at a level that is large enough to have a substantial impact on financial institutions' financial soundness and profits. A further increase in market volatility can push up the market risk associated with stockholdings. Financial institutions need to continue to make an objective assessment of the purpose and costs of strategic stockholdings and control their exposure to the market risk associated with stockholdings, including strategic stockholdings, within an appropriate range according to their financial soundness.
Risk associated with overseas credit product investment
Overseas credit markets saw a sharp widening of spreads during the March 2020 market turmoil, but these subsequently have narrowed, due in part to the effect of policy actions by governments and central banks as well as expectations for economic recovery driven by progress in vaccine development. In the financial results of large financial institutions, improvement in unrealized gains/losses associated with their overseas credit product investment has been observed.
The outstanding amount of overseas credit products held by Japanese financial institutions is unchanged. Overall, the portfolio is managed cautiously against risks as 99 percent of CLOs held by large financial institutions have been AAA-rated tranches, i.e., tranches with the highest credit rating (Charts III-1-30 and III-1-31). In terms of the quality of assets underlying CLOs, although the default rate has risen since the start of the pandemic and has remained high overall, there has been no significant change in the collateral adequacy ratio and interest payments capacity ratio. The creditworthiness of the CLOs with high credit ratings appears to be generally stable.
It should be noted, however, that major adjustments in overseas credit markets in the future can induce large losses for Japanese financial institutions. Specifically, a widening of credit spreads could easily lead to unrealized losses as there is less room for a further decline in overseas interest rates, which tend to contribute to netting out such losses. In addition, a further downgrading of overseas credit products could lead to a decline in capital adequacy ratios at financial institutions through an increase in risk assets and larger impairment losses. There is also a risk that, if it becomes difficult to refinance CLOs and leveraged loans for some reason, for example, due to
0
2
4
6
8
10
10 12 14 16 18 20Market risk associated with stockholdings (lhs) Ratio to capital (rhs)10th-90th percentile range (ratio to capital, rhs)
tril. yen
FY0
10
20
30
40
50
60
0
5
10
15
20
02 04 06 08 10 12 14 16 18 20
tril. yen
FY
%
10 12 14 16 18 200
10
20
30
40
50
60
10 12 14 16 18 20
%
Chart IV-3-5: Market risk associated with stockholdings among financial institutions
Total Major banks Regional banks Shinkin banks
Note: 1. "Market risk associated with stockholdings" is value-at-risk with a 99 percent confidence level and a 1-year holding period, and excludes risk associated with foreign currency-denominated stockholdings.
2. The data for fiscal 2020 are estimated using the outstanding amount of stockholdings as at end-February 2021 and stock prices up to end-February 2021.
Source: BOJ.

56
investors' more cautious stance, the default rates could increase sharply.30 Financial institutions engaged in overseas credit product investment need to make efforts to continuously improve their risk management by appropriately examining the overall functioning of overseas credit markets while taking into account the developments in their own foreign currency funding liquidity, such as the degree of dependence on market funding.31
Other market risk including that associated with investment trust holdings
In recent years, regional financial institutions in particular have actively increased the weight of investment trusts in their securities investment portfolios. The increase in investment trust holdings was previously driven by investment trusts whose main risk factor is overseas interest rate risk, but the recent pronounced increase is in investment trusts subject to a wide range of market risks, such as those related to stocks, credit, real estate, and foreign exchange (Chart III-1-28).
Even after the COVID-19 outbreak, an increase has continued in holdings of multi-asset investment trusts, which invest across multiple different asset types, such as domestic and foreign bonds and stocks. Multi-asset investment trusts basically aim to enhance returns by rebalancing their portfolios while controlling the risk of price declines within a certain range. Some of these trusts change their asset allocation at a high frequency in response to market changes, making it difficult for financial institutions to gauge and measure changes in the amount of risk in a timely manner. In addition, there were some cases in which multi-asset investment trusts were not always successful in diversifying risks in times of stress accompanied by large market volatility.
When financial institutions invest in investment trusts with complex designs, they should fully understand their risk profiles and continue to improve their risk management frameworks through risk quantification and close monitoring, and make practical and organizational plans for contingency responses in the event of significant losses.
The impact of changes in global transmission channels of market shocks on the market risk of Japanese financial institutions
Although the importance of NBFI entities, such as investment funds, in financial intermediation activities in international financial markets declined once since the GFC, it has increased again in recent years (Chart IV-3-6). In March 2020, markets were in turmoil as these entities faced pressure from rapid outflows of funds and increased margin calls for additional collateral. Correspondingly, many financial institutions in Japan breached various risk management limits such as loss limits due to a fall in the prices of securities they were holding (Charts IV-3-7 and IV-3-8).
Markets have since regained calmness due to the effects of large-scale policy measures; however, based on the experience, the Financial Stability Board (FSB), various standard-setting bodies, and financial authorities of various countries recognize that fundamental measures may need to be taken and have started discussions to address the vulnerabilities related to investment funds and other entities.
30 For details, see Box 2 in the October 2019 issue of the Report. 31 For the current situation and challenges regarding Japanese financial institutions' risk management frameworks for overseas credit product investment, see Financial System and Bank Examination Department of the Bank of Japan and Supervision Bureau of the Financial Services Agency, "Developments in Overseas Credit Investment and Lending by Japanese Financial Institutions: An Overview Based on the Joint Survey by the Bank of Japan and the Financial Services Agency," Bank of Japan Review Series, no. 20-E-2, June 2020.
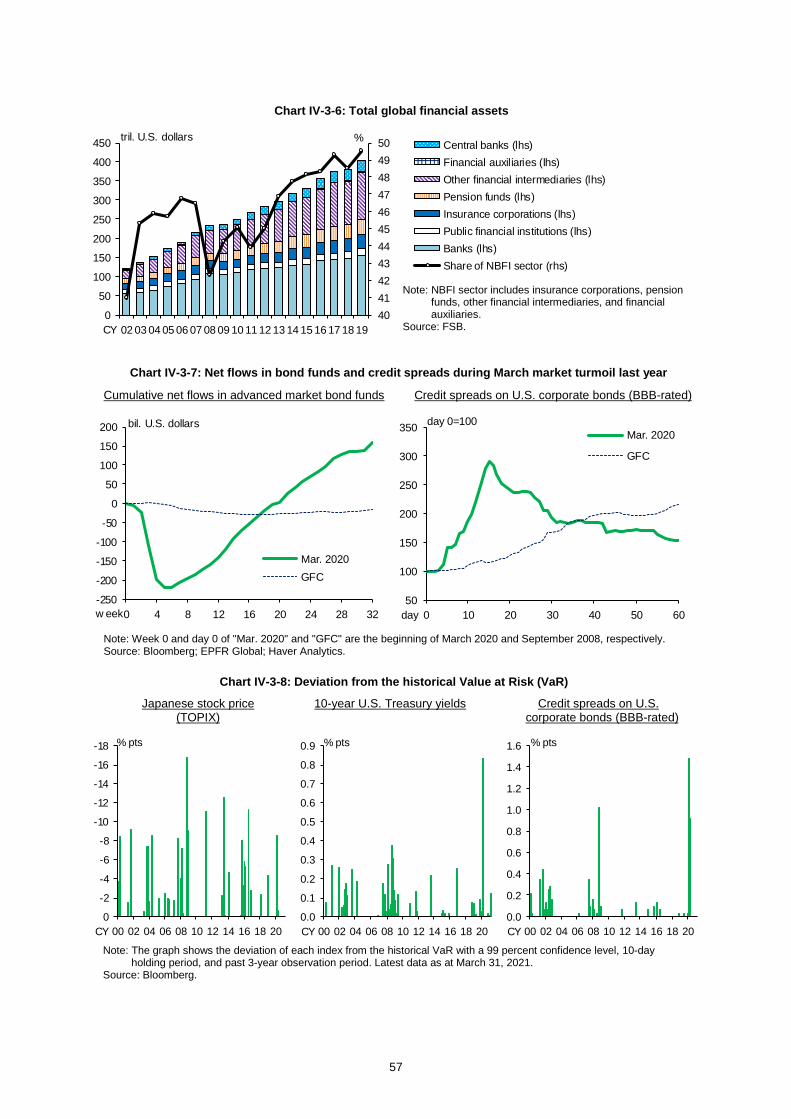
57
Chart IV-3-6: Total global financial assets
Note: NBFI sector includes insurance corporations, pension funds, other financial intermediaries, and financial auxiliaries.
Source: FSB. 4041424344454647484950
0
50
100
150
200
250
300
350
400
450
02 03 04 05 06 07 08 09 10 11 12 13 14 15 16 17 18 19
Central banks (lhs)Financial auxiliaries (lhs)Other financial intermediaries (lhs)Pension funds (lhs)Insurance corporations (lhs)Public financial institutions (lhs)Banks (lhs)Share of NBFI sector (rhs)
tril. U.S. dollars %
CY
Chart IV-3-7: Net flows in bond funds and credit spreads during March market turmoil last year
Note: Week 0 and day 0 of "Mar. 2020" and "GFC" are the beginning of March 2020 and September 2008, respectively. Source: Bloomberg; EPFR Global; Haver Analytics.
Cumulative net flows in advanced market bond funds Credit spreads on U.S. corporate bonds (BBB-rated)
50
100
150
200
250
300
350
0 10 20 30 40 50 60
Mar. 2020
GFC
day 0=100
day-250
-200
-150
-100
-50
0
50
100
150
200
0 4 8 12 16 20 24 28 32
Mar. 2020GFC
bil. U.S. dollars
w eek
Chart IV-3-8: Deviation from the historical Value at Risk (VaR)
Note: The graph shows the deviation of each index from the historical VaR with a 99 percent confidence level, 10-day holding period, and past 3-year observation period. Latest data as at March 31, 2021.
Source: Bloomberg.
Japanese stock price 10-year U.S. Treasury yields Credit spreads on U.S. (TOPIX) corporate bonds (BBB-rated)
-18
-16
-14
-12
-10
-8
-6
-4
-2
000 02 04 06 08 10 12 14 16 18 20
% pts
CY 0.0
0.1
0.2
0.3
0.4
0.5
0.6
0.7
0.8
0.9
00 02 04 06 08 10 12 14 16 18 20
% pts
CY 0.0
0.2
0.4
0.6
0.8
1.0
1.2
1.4
1.6
00 02 04 06 08 10 12 14 16 18 20
% pts
CY
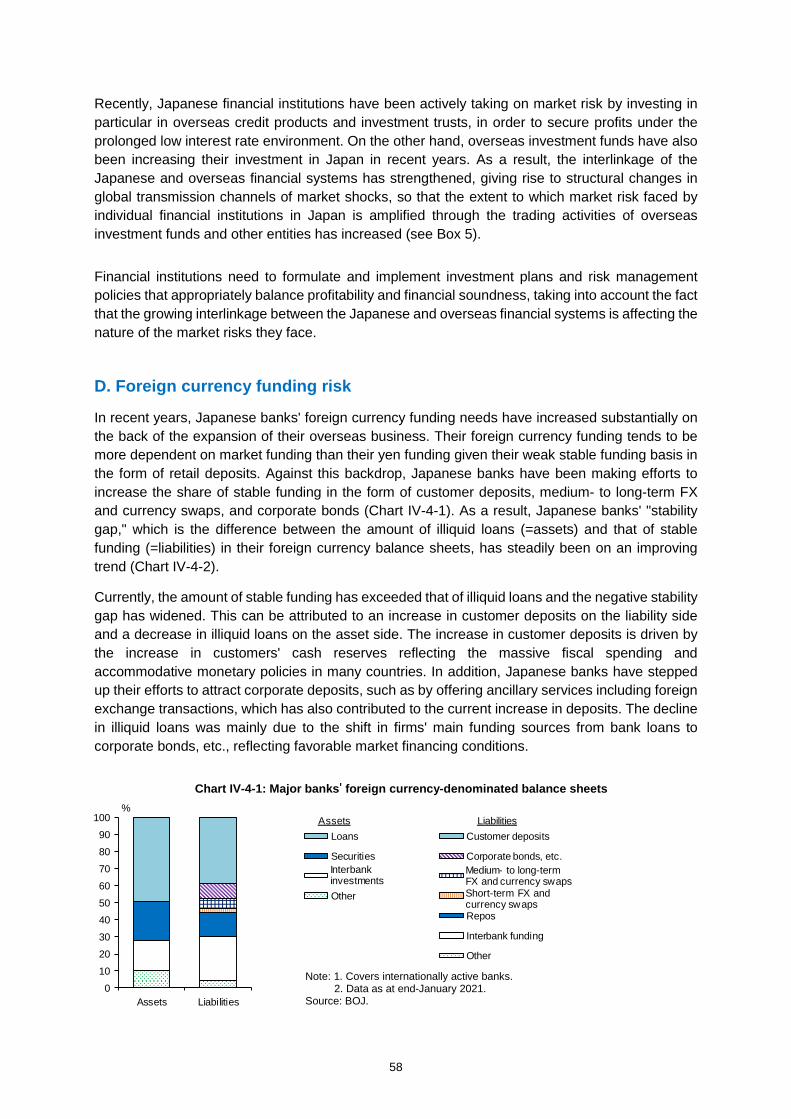
58
Recently, Japanese financial institutions have been actively taking on market risk by investing in particular in overseas credit products and investment trusts, in order to secure profits under the prolonged low interest rate environment. On the other hand, overseas investment funds have also been increasing their investment in Japan in recent years. As a result, the interlinkage of the Japanese and overseas financial systems has strengthened, giving rise to structural changes in global transmission channels of market shocks, so that the extent to which market risk faced by individual financial institutions in Japan is amplified through the trading activities of overseas investment funds and other entities has increased (see Box 5).
Financial institutions need to formulate and implement investment plans and risk management policies that appropriately balance profitability and financial soundness, taking into account the fact that the growing interlinkage between the Japanese and overseas financial systems is affecting the nature of the market risks they face.
D. Foreign currency funding risk
In recent years, Japanese banks' foreign currency funding needs have increased substantially on the back of the expansion of their overseas business. Their foreign currency funding tends to be more dependent on market funding than their yen funding given their weak stable funding basis in the form of retail deposits. Against this backdrop, Japanese banks have been making efforts to increase the share of stable funding in the form of customer deposits, medium- to long-term FX and currency swaps, and corporate bonds (Chart IV-4-1). As a result, Japanese banks' "stability gap," which is the difference between the amount of illiquid loans (=assets) and that of stable funding (=liabilities) in their foreign currency balance sheets, has steadily been on an improving trend (Chart IV-4-2).
Currently, the amount of stable funding has exceeded that of illiquid loans and the negative stability gap has widened. This can be attributed to an increase in customer deposits on the liability side and a decrease in illiquid loans on the asset side. The increase in customer deposits is driven by the increase in customers' cash reserves reflecting the massive fiscal spending and accommodative monetary policies in many countries. In addition, Japanese banks have stepped up their efforts to attract corporate deposits, such as by offering ancillary services including foreign exchange transactions, which has also contributed to the current increase in deposits. The decline in illiquid loans was mainly due to the shift in firms' main funding sources from bank loans to corporate bonds, etc., reflecting favorable market financing conditions.
Chart IV-4-1: Major banks' foreign currency-denominated balance sheets
Note: 1. Covers internationally active banks. 2. Data as at end-January 2021.
Source: BOJ. 0
10
20
30
4050
60
70
80
90
100
Assets Liabilities
Loans Customer deposits
Securities Corporate bonds, etc.
Other
Repos
Interbank funding
Other
%Assets Liabilities
Medium- to long-termFX and currency swapsShort-term FX andcurrency swaps
Interbank investments

59
Under these circumstances, Japanese banks are becoming increasingly conscious of how to balance the stability of their foreign currency funding with their cost control. This reflects the fact that the overseas risk-free rate has fallen substantially and the yields of foreign currency assets have declined. On the funding side, there are growing moves to reduce the use of highly stable but relatively expensive market funding such as corporate bonds and medium- to long-term FX and currency swaps. Some banks are reducing deposits collected at high cost in the past by revising interest rates with a greater focus on profitability. Other banks, however, are instead stepping up the provision of ancillary services to attract demand deposits from corporate customers, which tend to be stickier and involve lower funding costs than market funding. On the investment side, there are moves to curb the setting of new committed lines, which saw a sharp increase in drawdowns in the spring of 2020, in order to ensure stability in the event of stress, and, with regard to existing loans, to reduce the outstanding balance of less profitable loans.
While improving the profitability of overseas operations overall is an important challenge for Japanese banks, improving the stability of foreign currency funding also continues to be crucial, given the disruption in market funding in the spring of 2020. Japanese banks are expected to continue developing frameworks for the timely collection of necessary data, so as to understand customer characteristics, manage liquidity risks, and improve the efficiency of intra-group liquidity management, as well as diversify their funding sources.
E. Risks posed by structural changes in the business environment
Lastly, this section addresses risks posed by structural changes in the business environment surrounding financial institutions, focusing on recent developments and prospects regarding cyber risk, climate-related financial risks, and interest rate benchmark reform.
1. Cyber risk
Cyber risk differs from the other risk categories already considered in this chapter in the following respects: (1) financial institutions may be hit by a cyberattack that goes beyond, in terms of technological aspects and scale, the self-defenses they have put in place, given the rapid sophistication of cyberattacks; (2) a failure that takes place in a computer system of one financial institution may instantaneously propagate to other financial institutions and to the entire financial
Note: 1. Until end-March 2012, "Corporate bonds, etc." and "Medium- to long-term FX and currency swaps" have funding maturing in more than 3 months and thereafter, funding maturing in more than 1 year.
2. The figures indicate the ratios of the gaps to the loans (as at end-April 2014 and end-January 2021).
3. Covers internationally active banks. 4. Latest data as at end-January 2021.
Source: BOJ.
Chart IV-4-2: Stability gap among major banks
0.0
0.2
0.4
0.6
0.8
1.0
1.2
10 11 12 13 14 15 16 17 18 19Corporate bonds, etc.Medium- to long-term FX and currency swapsCustomer depositsLoans
23.9%
Stability gaptril. U.S. dollars
CY Jan.20
July Jan.21
-8.9%

60
system if a cyberattack is successful, since all financial institutions are linked through financial and securities settlement networks, etc.; (3) data on the losses from cybercrime are scarce, since most of these data rely on other data published by victims of cyberattacks; and (4) the quantification of such a risk is difficult and, moreover, there remains a risk that the capital accumulation of individual financial institutions for loss absorption may not be sufficient to internalize losses that arise from negative network externalities.
The losses from cybercrime are rapidly increasing, with some estimates suggesting that they amounted to about 1 trillion U.S. dollars worldwide in 2020.32 Based on data on insurance claims paid by reinsurance companies, by type of damage, data breaches are the most frequently reported in terms of the number of the incidents and account for the largest amount of losses.33 In Japan, too, with the expansion of cloud computing and the spread of remote work, cyberattacks are increasing and the nodes that cyberattacks aim to penetrate are becoming more diverse, which likely increases the risk. For example, in relation to remote work, reflecting the increase in intrusion routes other than emails, there have been cases where attacks may have been linked to the exploitation of vulnerabilities in remote connections. In addition, both the number of fraudulent online banking withdrawals of deposits and the losses involved have increased significantly since 2019. Currently, there have been cases of fraudulent withdrawals of deposits from banks that are associated with cashless payment services and online securities transactions.
It is difficult to avert cyberattacks completely. Therefore, the focus is to limit the potential damage as much as possible by preventing data breaches and avoiding the suspension of businesses by enhancing "operational resilience" in advance. The concept of "operational resilience" refers to the ability of a financial institution to deliver critical operations through disruption that makes it difficult to perform business operations, including not only cyberattacks but also natural disasters and computer system failures. The concept is developed with the recognition that it may be impossible to completely protect against threats. Therefore, in addition to building defenses against threats, robustness should be enhanced by preparing plans in advance to minimize any damage and by regularly conducting vulnerability assessments and attack simulations to examine the effectiveness of the plans.
The system infrastructure and information assets managed by financial institutions themselves also require special attention, such as when financial institutions use external products and services for the management of this infrastructure and these information assets. It is necessary to gather information day-to-day on threats related to such products and services, and to respond promptly in case of an incident, as reliance on them is unavoidable in performing business operations with the advances in technological innovation. When using cloud services, the scopes of responsibility of the financial institution and the cloud service provider need to be clarified in advance, and the responsibilities within the scope of the cloud service provider needs to be properly managed within the framework of vendor management.34 Moreover, financial institutions need to be aware that there are issues regarding the data governance of information assets, including personal data, not only in terms of those held by themselves but also those managed by third parties, such as
32 This estimate is by McAfee, which estimates that global losses from cybercrime increased from 522.5 billion U.S. dollars in 2018 to 945 billion U.S. dollars in 2020. For details, see the following webpage. https://www.mcafee.com/enterprise/en-us/assets/reports/rp-hidden-costs-of-cybercrime.pdf. 33 According to data compiled by Willis Towers Watson. For details, see the following webpage. https://www.willistowerswatson.com/-/media/WTW/Insights/2020/07/cyber-claims-analysis-report.pdf. 34 For details, see "Key Considerations for Risk Management in Using Cloud Services," Financial System Report Annex Series, March 2021.
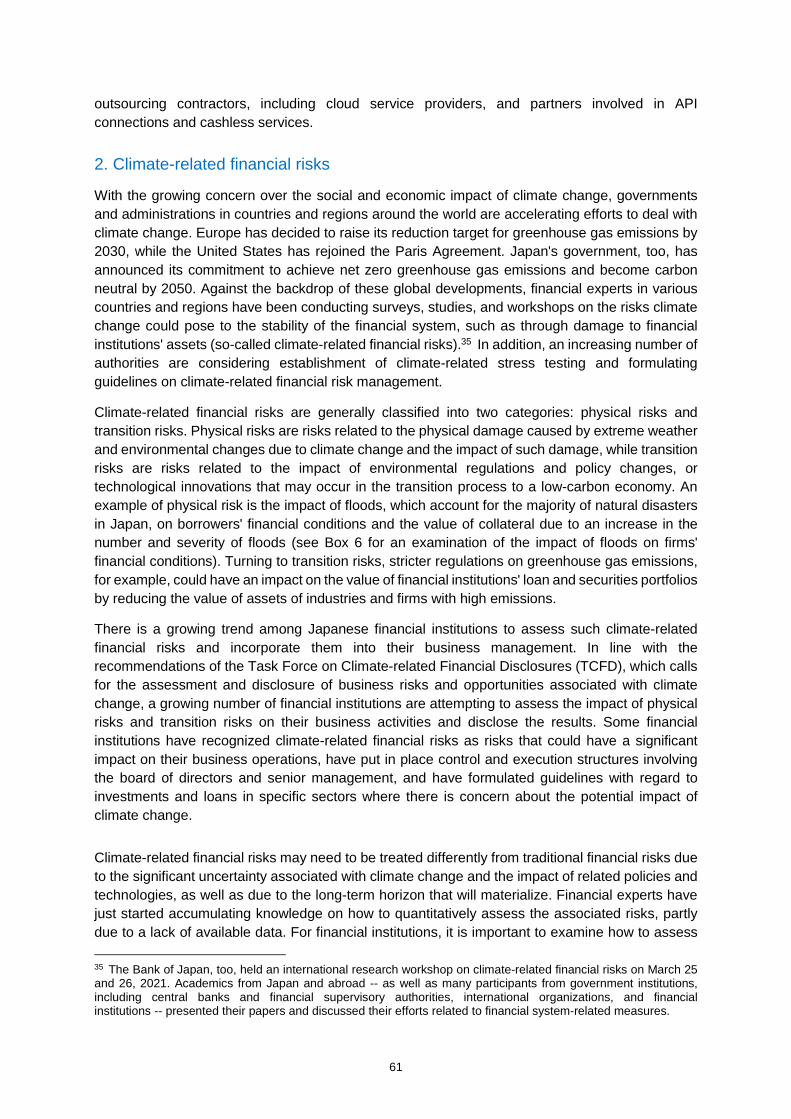
61
outsourcing contractors, including cloud service providers, and partners involved in API connections and cashless services.
2. Climate-related financial risks
With the growing concern over the social and economic impact of climate change, governments and administrations in countries and regions around the world are accelerating efforts to deal with climate change. Europe has decided to raise its reduction target for greenhouse gas emissions by 2030, while the United States has rejoined the Paris Agreement. Japan's government, too, has announced its commitment to achieve net zero greenhouse gas emissions and become carbon neutral by 2050. Against the backdrop of these global developments, financial experts in various countries and regions have been conducting surveys, studies, and workshops on the risks climate change could pose to the stability of the financial system, such as through damage to financial institutions' assets (so-called climate-related financial risks).35 In addition, an increasing number of authorities are considering establishment of climate-related stress testing and formulating guidelines on climate-related financial risk management.
Climate-related financial risks are generally classified into two categories: physical risks and transition risks. Physical risks are risks related to the physical damage caused by extreme weather and environmental changes due to climate change and the impact of such damage, while transition risks are risks related to the impact of environmental regulations and policy changes, or technological innovations that may occur in the transition process to a low-carbon economy. An example of physical risk is the impact of floods, which account for the majority of natural disasters in Japan, on borrowers' financial conditions and the value of collateral due to an increase in the number and severity of floods (see Box 6 for an examination of the impact of floods on firms' financial conditions). Turning to transition risks, stricter regulations on greenhouse gas emissions, for example, could have an impact on the value of financial institutions' loan and securities portfolios by reducing the value of assets of industries and firms with high emissions.
There is a growing trend among Japanese financial institutions to assess such climate-related financial risks and incorporate them into their business management. In line with the recommendations of the Task Force on Climate-related Financial Disclosures (TCFD), which calls for the assessment and disclosure of business risks and opportunities associated with climate change, a growing number of financial institutions are attempting to assess the impact of physical risks and transition risks on their business activities and disclose the results. Some financial institutions have recognized climate-related financial risks as risks that could have a significant impact on their business operations, have put in place control and execution structures involving the board of directors and senior management, and have formulated guidelines with regard to investments and loans in specific sectors where there is concern about the potential impact of climate change.
Climate-related financial risks may need to be treated differently from traditional financial risks due to the significant uncertainty associated with climate change and the impact of related policies and technologies, as well as due to the long-term horizon that will materialize. Financial experts have just started accumulating knowledge on how to quantitatively assess the associated risks, partly due to a lack of available data. For financial institutions, it is important to examine how to assess 35 The Bank of Japan, too, held an international research workshop on climate-related financial risks on March 25 and 26, 2021. Academics from Japan and abroad -- as well as many participants from government institutions, including central banks and financial supervisory authorities, international organizations, and financial institutions -- presented their papers and discussed their efforts related to financial system-related measures.

62
and manage the risks in their own loan and securities portfolios, and how to compile the necessary data to do so, while gathering information on advanced initiatives in Japan and abroad to move toward a carbon-neutral economy.
3. Interest rate benchmark reform
It is now little more than six months until the end of 2021, when the publication of yen LIBOR will cease.36 As part of a market-wide effort to respond to the cessation of LIBOR, the Cross-Industry Committee on Japanese Yen Interest Rate Benchmarks, for which the Bank of Japan acts as the secretariat, recently announced the results of public consultations regarding the handling of existing contracts using yen LIBOR and has been promoting the development of market practices for transactions using overnight risk-free-rate (O/N RFR) compounding (Fixing in Arrears)37 as the replacement benchmark for yen LIBOR.38 In addition, the environment for a smooth transition is being prepared, with the publication of production rates for term reference rates starting to be released.39 In light of these developments in the market overall, individual entities such as financial institutions, institutional investors, and business corporations will also need to make steady progress in their transition until the end of 2021.
Under these circumstances, Japan's Financial Services Agency (FSA) and the Bank of Japan conducted the Second Joint Survey on the Use of LIBOR (at end-2020) to examine financial institutions' preparedness. In addition, in response to the announcement in the United Kingdom in March 2021 that yen LIBOR setting would cease, the FSA and the Bank of Japan have jointly announced for financial institutions in Japan and are deepening their dialogue with them.40
Financial institutions are required to take proactive measures based on the "Roadmap to Prepare for the Discontinuation of LIBOR" released by the Cross-Industry Committee.41
36 In March 2021, the United Kingdom's ICE Benchmark Administration (IBA) -- the administrator of LIBOR -- announced that, with the exception of certain U.S. dollar LIBOR settings, LIBOR settings (based on the current methodology referencing rates provided by panel banks), including yen LIBOR settings, will cease at the end of December. Moreover, the United Kingdom's Financial Conduct Authority (FCA) expressed its intent to hold consultations regarding the use of its authority to establish synthetic LIBOR settings (pseudo-LIBOR calculated using market data). The synthetic LIBOR is expected to be time-limited and its use is also expected to be limited to existing contracts that are particularly difficult to amend ("tough legacy" contracts). 37 O/N RFR compounding (Fixing in Arrears) is a method of calculating the relevant interest rate by compounding on a daily basis the uncollateralized overnight call rate from the time when interest is applied in a financial transaction to the time when the transaction is completed. 38 For details, see Cross-Industry Committee on Japanese Yen Interest Rate Benchmarks, "Final Report on the Results of the Second Public Consultation on the Appropriate Choice and Usage of Japanese Yen Interest Rate Benchmarks," November 2020, and "TONA (Fixing in Arrears) Conventions to Use in Loans," December 2020. 39 QUICK Corp., the entity responsible for calculating and publishing these rates, established a new company, QUICK Benchmarks Inc., in January 2021. The new company announced that it would begin publishing production rates on April 26, 2021. 40 For details, see the Strategy Development and Management Bureau and the Supervision Bureau of the FSA and the Financial System and Bank Examination Department and the Financial Markets Department of the Bank of Japan, "Response to the announcement on the end date of LIBOR panel publication and the announcement on the intention to consult on the publication of synthetic yen LIBOR," March 2021. 41 The roadmap calls for the issuance of new loans and bonds referencing yen LIBOR to be ceased by the end of June 2021 and a significant reduction in the amount of loans and bonds referencing yen LIBOR by the end of September.

63
V. Examination of the resilience of the financial system
This chapter examines the stress resilience of the financial system. To start with, financial institutions' profitability and capital adequacy are analyzed, mainly based on information from their financial reports through the first half of fiscal 2020. Financial institutions' profitability is a determinant of their capacity to return profits to shareholders, etc., while their capital bases are sources of their capacity to absorb losses. Financial reports through the first half of fiscal 2020 reflect to some degree the impact of the spread of COVID-19 in the spring of 2020 and of measures to support corporate financing. However, they do not reflect the impact of the resurgence of COVID-19 infections since the end of 2020 and a state of emergency declared in 11 prefectures.
Macro stress testing described at the end of the chapter examines whether financial institutions have sufficient capacity to absorb losses under two severe downside scenarios; namely, a COVID-19 resurgence scenario and a financial stress scenario. These scenarios reflect the financial vulnerabilities and risks identified and examined in the previous chapters.
A. Financial institutions' profitability and capital adequacy
1. Profitability
Financial institutions' net income has been on a moderate downward trend (Chart V-1-1). Pre-provision net revenue (PPNR) excluding trading income, which shows financial institutions' core profitability, has continued to decline. This is due to the downward trend in domestic net interest income caused by the shrinking of deposit-lending margins, as well as to continued low levels of net non-interest income. Deposit-lending margins have continued to shrink, partly as a result of ongoing severe competition (Charts III-1-18 and III-1-19). However, in the first half of fiscal 2020, financial institutions' net interest income, especially of major banks, increased due to a surge in demand for funds as a result of COVID-19, which pushed up their PPNR. Credit costs had been declining since the GFC, and thereby had been underpinning profits, but have been on an uptrend in recent years. In the first half of fiscal 2020, credit costs increased mainly for major banks.
Chart V-1-1: Developments in and decomposition of net income
Major financial groups Regional banks
0
1
2
3
4
5
6
-3
-2
-1
0
1
2
3
0607080910111213141516171819
tril. yen tril. yen
FY0
1
2
3
-0.5
0.0
0.5
1.0
19H1
19H2
20H1
tril. yen tril. yen
FY0
2
4
6
8
-6
-4
-2
0
2
4
6
0607080910111213141516171819FY
tril. yen tril. yen
0
1
2
3
4
-3
-2
-1
0
1
2
3
19H1
19H2
20H1
tril. yen tril. yen
FY
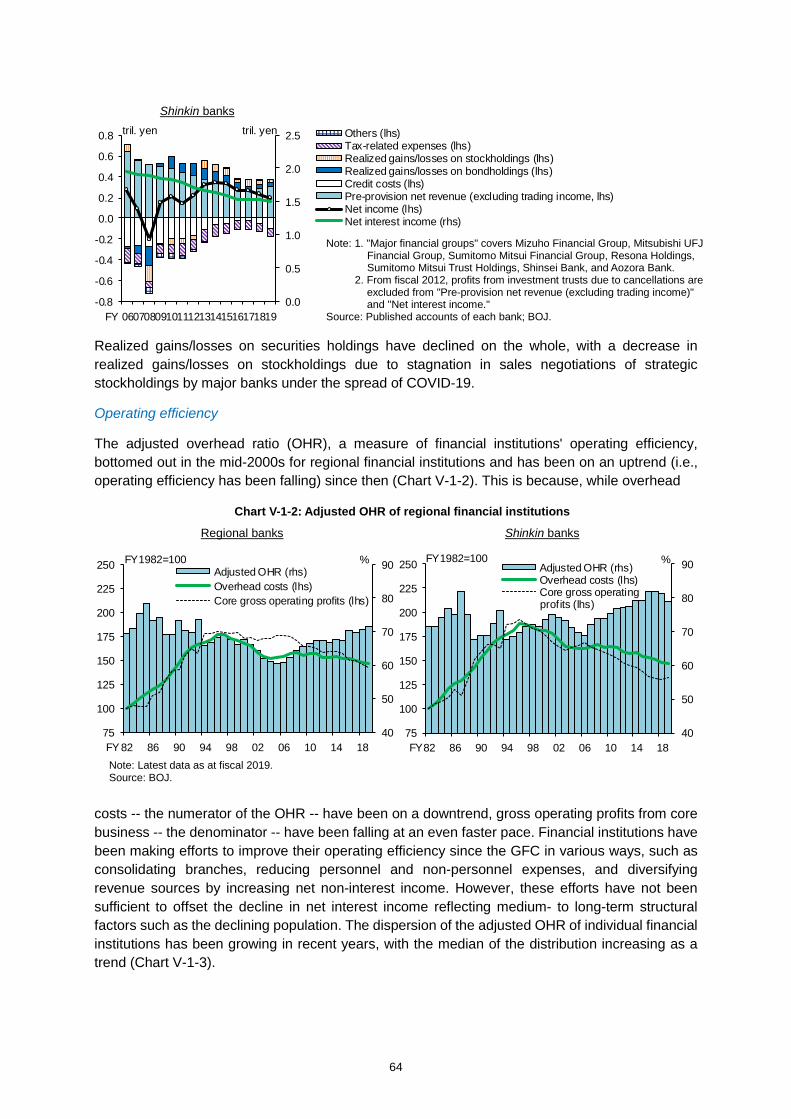
64
Realized gains/losses on securities holdings have declined on the whole, with a decrease in realized gains/losses on stockholdings due to stagnation in sales negotiations of strategic stockholdings by major banks under the spread of COVID-19.
Operating efficiency
The adjusted overhead ratio (OHR), a measure of financial institutions' operating efficiency, bottomed out in the mid-2000s for regional financial institutions and has been on an uptrend (i.e., operating efficiency has been falling) since then (Chart V-1-2). This is because, while overhead
costs -- the numerator of the OHR -- have been on a downtrend, gross operating profits from core business -- the denominator -- have been falling at an even faster pace. Financial institutions have been making efforts to improve their operating efficiency since the GFC in various ways, such as consolidating branches, reducing personnel and non-personnel expenses, and diversifying revenue sources by increasing net non-interest income. However, these efforts have not been sufficient to offset the decline in net interest income reflecting medium- to long-term structural factors such as the declining population. The dispersion of the adjusted OHR of individual financial institutions has been growing in recent years, with the median of the distribution increasing as a trend (Chart V-1-3).
Shinkin banks
0.0
0.5
1.0
1.5
2.0
2.5
-0.8
-0.6
-0.4
-0.2
0.0
0.2
0.4
0.6
0.8
0607080910111213141516171819
Others (lhs)Tax-related expenses (lhs)Realized gains/losses on stockholdings (lhs)Realized gains/losses on bondholdings (lhs)Credit costs (lhs)Pre-provision net revenue (excluding trading income, lhs)Net income (lhs)Net interest income (rhs)
tril. yen tril. yen
FY
Note: 1. "Major financial groups" covers Mizuho Financial Group, Mitsubishi UFJ Financial Group, Sumitomo Mitsui Financial Group, Resona Holdings, Sumitomo Mitsui Trust Holdings, Shinsei Bank, and Aozora Bank.
2. From fiscal 2012, profits from investment trusts due to cancellations are excluded from "Pre-provision net revenue (excluding trading income)" and "Net interest income."
Source: Published accounts of each bank; BOJ.
40
50
60
70
80
90
75
100
125
150
175
200
225
250
82 86 90 94 98 02 06 10 14 18
Adjusted OHR (rhs)Overhead costs (lhs)Core gross operating
FY1982=100
FY
%
profits (lhs)
Chart V-1-2: Adjusted OHR of regional financial institutions
Regional banks Shinkin banks
Note: Latest data as at fiscal 2019. Source: BOJ.
40
50
60
70
80
90
75
100
125
150
175
200
225
250
82 86 90 94 98 02 06 10 14 18
Adjusted OHR (rhs)Overhead costs (lhs)Core gross operating profits (lhs)
FY1982=100
FY
%
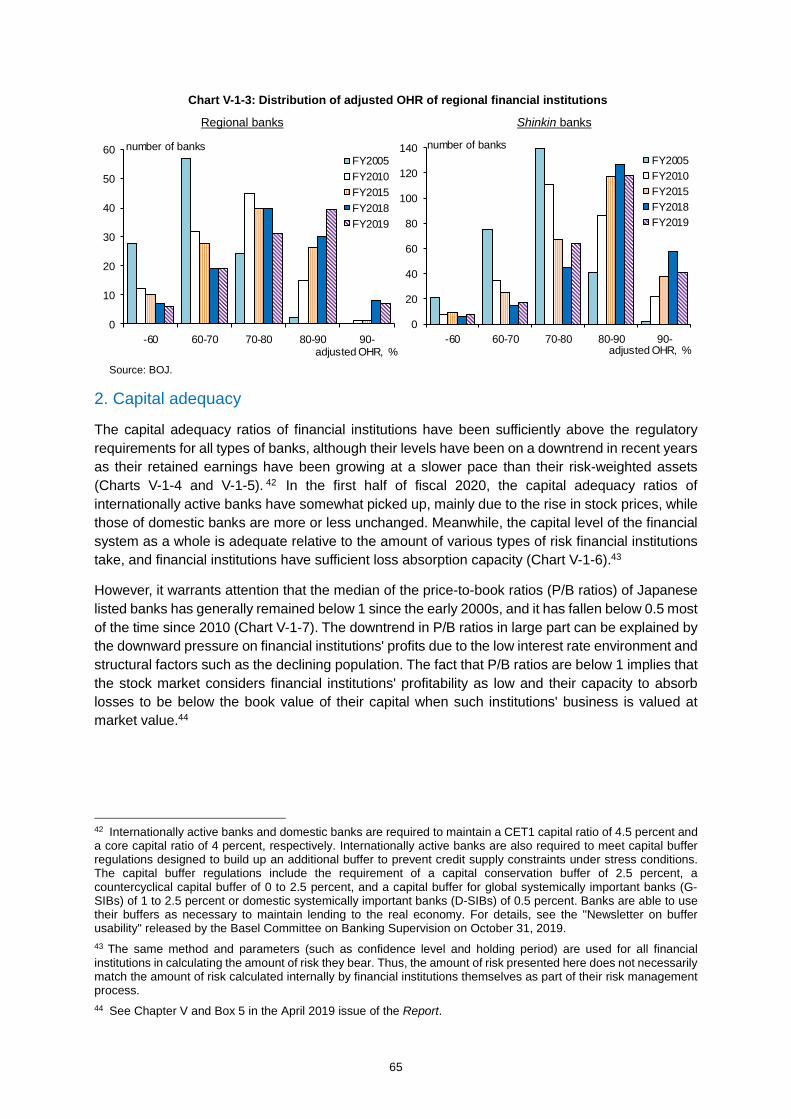
65
2. Capital adequacy
The capital adequacy ratios of financial institutions have been sufficiently above the regulatory requirements for all types of banks, although their levels have been on a downtrend in recent years as their retained earnings have been growing at a slower pace than their risk-weighted assets (Charts V-1-4 and V-1-5). 42 In the first half of fiscal 2020, the capital adequacy ratios of internationally active banks have somewhat picked up, mainly due to the rise in stock prices, while those of domestic banks are more or less unchanged. Meanwhile, the capital level of the financial system as a whole is adequate relative to the amount of various types of risk financial institutions take, and financial institutions have sufficient loss absorption capacity (Chart V-1-6).43
However, it warrants attention that the median of the price-to-book ratios (P/B ratios) of Japanese listed banks has generally remained below 1 since the early 2000s, and it has fallen below 0.5 most of the time since 2010 (Chart V-1-7). The downtrend in P/B ratios in large part can be explained by the downward pressure on financial institutions' profits due to the low interest rate environment and structural factors such as the declining population. The fact that P/B ratios are below 1 implies that the stock market considers financial institutions' profitability as low and their capacity to absorb losses to be below the book value of their capital when such institutions' business is valued at market value.44
42 Internationally active banks and domestic banks are required to maintain a CET1 capital ratio of 4.5 percent and a core capital ratio of 4 percent, respectively. Internationally active banks are also required to meet capital buffer regulations designed to build up an additional buffer to prevent credit supply constraints under stress conditions. The capital buffer regulations include the requirement of a capital conservation buffer of 2.5 percent, a countercyclical capital buffer of 0 to 2.5 percent, and a capital buffer for global systemically important banks (G-SIBs) of 1 to 2.5 percent or domestic systemically important banks (D-SIBs) of 0.5 percent. Banks are able to use their buffers as necessary to maintain lending to the real economy. For details, see the "Newsletter on buffer usability" released by the Basel Committee on Banking Supervision on October 31, 2019. 43 The same method and parameters (such as confidence level and holding period) are used for all financial institutions in calculating the amount of risk they bear. Thus, the amount of risk presented here does not necessarily match the amount of risk calculated internally by financial institutions themselves as part of their risk management process. 44 See Chapter V and Box 5 in the April 2019 issue of the Report.
Chart V-1-3: Distribution of adjusted OHR of regional financial institutions
Regional banks Shinkin banks
Source: BOJ.
0
20
40
60
80
100
120
140
-60 60-70 70-80 80-90 90-
FY2005FY2010FY2015FY2018FY2019
number of banks
adjusted OHR, %
0
10
20
30
40
50
60
-60 60-70 70-80 80-90 90-
FY2005FY2010FY2015FY2018FY2019
number of banks
adjusted OHR, %

66
Chart V-1-5: Factors of changes in capital adequacy ratios
Internationally active banks Domestic regional banks
-1.2
-0.8
-0.4
0.0
0.4
0.8
14 15 16 17 18 19
change from previous period, % pts
FY 19H1
19H2
20H1
change from previous period, % pts
FY-1.2
-0.8
-0.4
0.0
0.4
0.8
1.2
1.6
14 15 16 17 18 19
change from previous period, % pts
FY 19H1
19H2
20H1
FY
change from previous period, % pts
Shinkin banks
Note: The transitional arrangements are taken into consideration.
Source: BOJ. -1.2
-0.8
-0.4
0.0
0.4
0.8
14 15 16 17 18 19
Other factors
Retained earnings
Hybrid debt capital instruments
Risk-weighted assets
Changes in capital adequacy ratios
change from previous period, % pts
FY
Chart V-1-4: Financial institutions' capital adequacy ratios
Note: "CAR" indicates the total capital adequacy ratio. Classifications of internationally active banks and domestic banks up to fiscal 2012 are as at end-fiscal 2013. The charts are calculated on a consolidated basis. The latest data in the left-hand and middle charts are as at end-September 2020 and the latest data in the right-hand chart are as at end-March 2020. The transitional arrangements are taken into consideration.
Source: BOJ.
Internationally active banks Domestic regional banks Shinkin banks
4
6
8
10
12
14
16
18
02 04 06 08 10 12 14 16 18
%
FY0
2
4
6
8
10
12
14
16
18
12 14 16 18 20
%
CARTier 1 capital ratioCET1 capital ratio
Regulatory levels(including capital conservation buffer)
CET1Tier 1CAR
FY4
6
8
10
12
14
16
18
02 04 06 08 10 12 14 16 18 20
%
FY
Capital adequacy ratioTier 1 capital ratioCore capital ratio
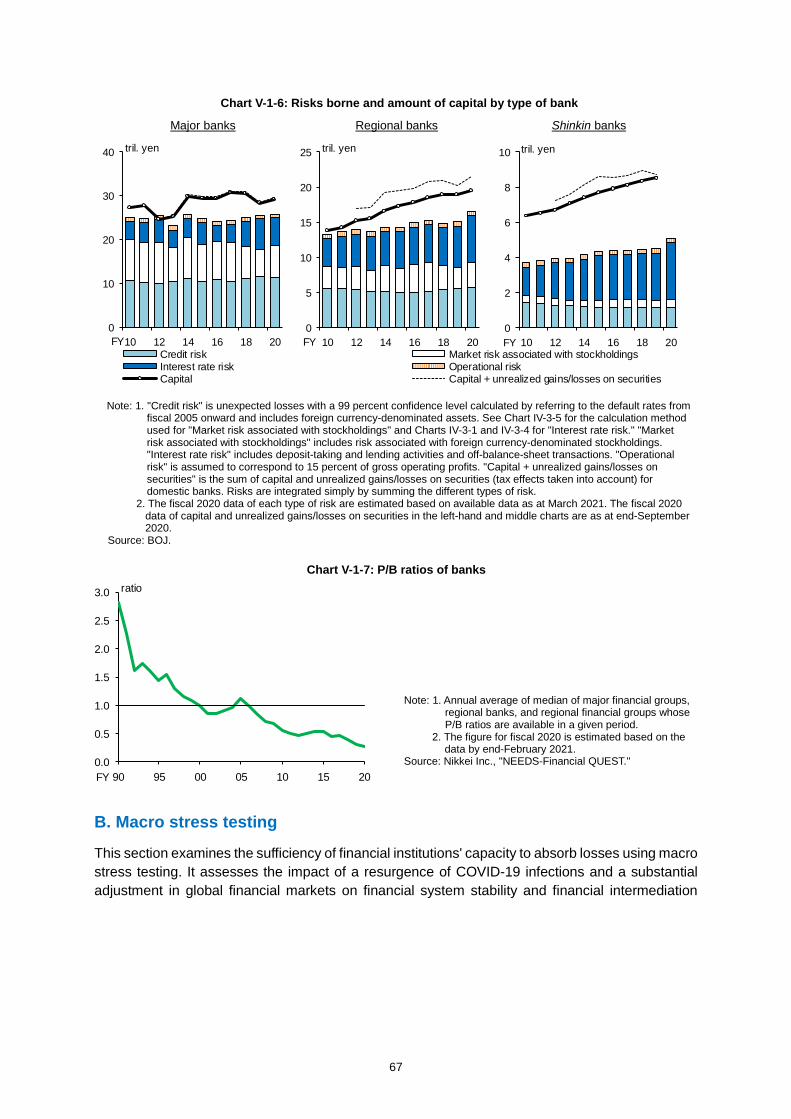
67
B. Macro stress testing
This section examines the sufficiency of financial institutions' capacity to absorb losses using macro stress testing. It assesses the impact of a resurgence of COVID-19 infections and a substantial adjustment in global financial markets on financial system stability and financial intermediation
Note: 1. Annual average of median of major financial groups, regional banks, and regional financial groups whose P/B ratios are available in a given period.
2. The figure for fiscal 2020 is estimated based on the data by end-February 2021.
Source: Nikkei Inc., "NEEDS-Financial QUEST."
Chart V-1-7: P/B ratios of banks
0.0
0.5
1.0
1.5
2.0
2.5
3.0
90 95 00 05 10 15 20
ratio
FY
Chart V-1-6: Risks borne and amount of capital by type of bank
Major banks Regional banks Shinkin banks
Note: 1. "Credit risk" is unexpected losses with a 99 percent confidence level calculated by referring to the default rates from fiscal 2005 onward and includes foreign currency-denominated assets. See Chart IV-3-5 for the calculation method used for "Market risk associated with stockholdings" and Charts IV-3-1 and IV-3-4 for "Interest rate risk." "Market risk associated with stockholdings" includes risk associated with foreign currency-denominated stockholdings. "Interest rate risk" includes deposit-taking and lending activities and off-balance-sheet transactions. "Operational risk" is assumed to correspond to 15 percent of gross operating profits. "Capital + unrealized gains/losses on securities" is the sum of capital and unrealized gains/losses on securities (tax effects taken into account) for domestic banks. Risks are integrated simply by summing the different types of risk.
2. The fiscal 2020 data of each type of risk are estimated based on available data as at March 2021. The fiscal 2020 data of capital and unrealized gains/losses on securities in the left-hand and middle charts are as at end-September 2020.
Source: BOJ.
0
10
20
30
40
10 12 14 16 18 20Credit risk Market risk associated with stockholdingsInterest rate risk Operational riskCapital Capital + unrealized gains/losses on securities
tril. yen
FY0
5
10
15
20
25
10 12 14 16 18 20
tril. yen
FY0
2
4
6
8
10
10 12 14 16 18 20
tril. yen
FY
68
activities based on the financial vulnerabilities and risks identified and examined in the previous sections.45,46
In the previous issue of the Report, the risks associated with financial stability were deemed to have arisen from the shock to the real economy against the backdrop of the continued impact of COVID-19. Multiple scenarios that considered alternative developments in the spread of the disease and the impact on the real economy and the reaction of markets were employed to examine the robustness of Japan's financial system. Looking back at economic activity after the release of the previous Report, the real GDP growth rate of domestic and overseas economies for the second half of 2020 was above what was assumed in the baseline scenario of the macro stress testing in the previous Report, as many countries managed to strike the right balance between preventive measures against COVID-19 and improved economic activity.
However, there remains substantial uncertainty about developments in the spread of COVID-19 and their impact on the domestic and overseas economies, and the risks remain tilted to the downside. In fact, since autumn 2020, some countries and regions have been forced to reintroduce strict public health measures due to the resurgence of COVID-19 together with an emergence of variants. In Japan, similarly, a state of emergency was declared in 11 prefectures, putting downward pressure on the economy, especially on the face-to-face services industry. Attention therefore needs to be paid to the risk that, combined with the vulnerabilities that have built up so far, defaults might increase in the event of a resurgence in infections going forward.
The sentiment in global financial markets has improved and prices of risk assets, such as stock prices, have risen. This reflects expectations that the global economy will continue to pick up and corporate earnings will recover, due in part to positive developments regarding COVID-19 vaccines and the expectation of additional fiscal stimulus measures in the United States. However, volatility in the stock market is still relatively high due to continuing uncertainty, including with regard to the developments in the spread of COVID-19. As pointed out in Chapter IV and Box 5, Japan's financial system may be more susceptible to market shocks than in the past as a result of a strengthened interlinkage with overseas financial systems. Thus, attention needs to be paid to the fact that, in the event of a substantial and rapid adjustment in global financial markets, the spillover effects could be material.
With these points in mind, the stress testing in this Report examines the robustness of Japan's financial system, mainly focusing on the following two risks. The first is the risk that a resurgence of COVID-19 infections, such as due to the spread of variants, impedes economic activity, particularly in the face-to-face services industry, around the end of 2021. This is based on the recognition that it is difficult to eliminate uncertainty regarding the pandemic completely and associated downside risks remain. The second risk is that a substantial and rapid adjustment in global financial markets, which could have a substantial negative influence on financial intermediation activities, exerts further downward pressure on domestic and overseas economies.
45 The simulation utilizes the Financial Macro-econometric Model (FMM) developed by the Financial System and Bank Examination Department of the Bank. For the basic structure of the model, see "The Financial Macro-econometric Model (FMM, March-2020 Version): Overview and Recent Developments," Financial System Report Annex Series, August 2020. The data used in the FMM analysis are at the macro or bank level and differ in granularity from the analysis in Chapter IV, which uses firm-level data. However, the FMM analysis takes the analysis in Chapter IV into account in terms of the choice of variables in the credit risk model and the way in which the effects of measures to support corporate financing are incorporated. 46 The stress testing targets 110 banks and 247 shinkin banks (accounting for approximately 80 to 90 percent of total loans outstanding). The simulation period is from October-December 2020 through January-March 2024. The major economic variables for the scenarios employed in the stress testing can be downloaded from the Bank's website at https://www.boj.or.jp/en/research/brp/fsr/fsr210420.htm.
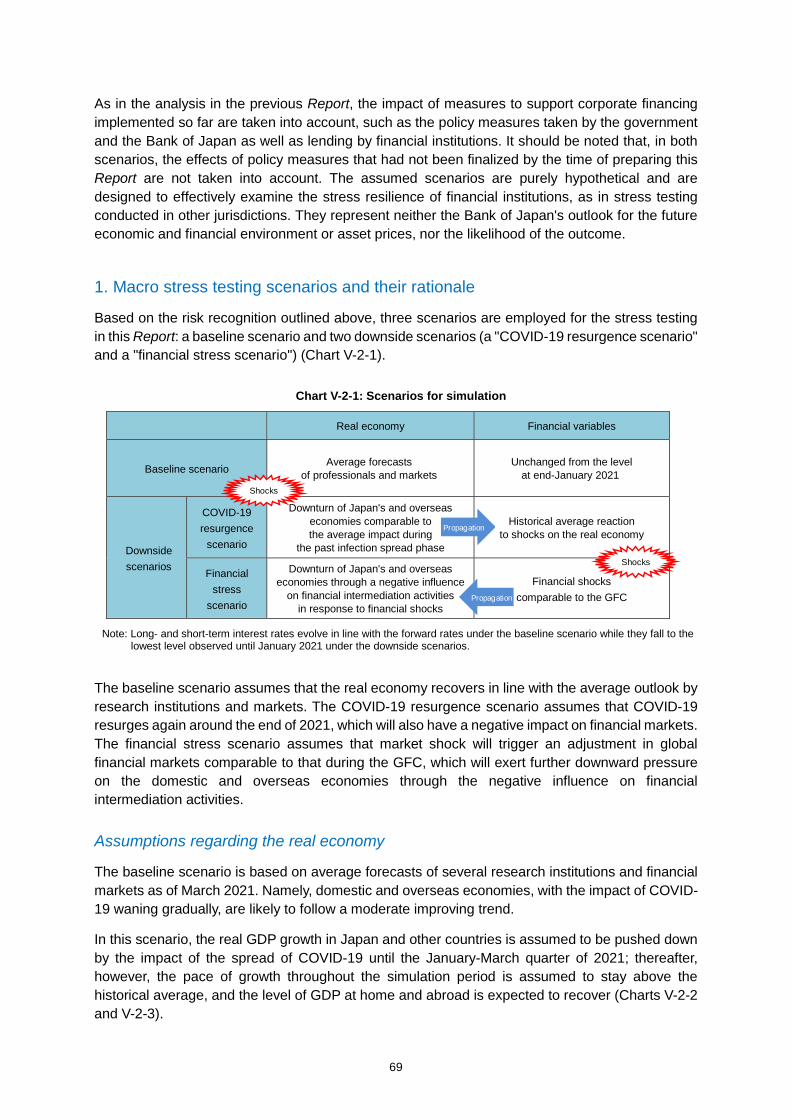
69
As in the analysis in the previous Report, the impact of measures to support corporate financing implemented so far are taken into account, such as the policy measures taken by the government and the Bank of Japan as well as lending by financial institutions. It should be noted that, in both scenarios, the effects of policy measures that had not been finalized by the time of preparing this Report are not taken into account. The assumed scenarios are purely hypothetical and are designed to effectively examine the stress resilience of financial institutions, as in stress testing conducted in other jurisdictions. They represent neither the Bank of Japan's outlook for the future economic and financial environment or asset prices, nor the likelihood of the outcome.
1. Macro stress testing scenarios and their rationale
Based on the risk recognition outlined above, three scenarios are employed for the stress testing in this Report: a baseline scenario and two downside scenarios (a "COVID-19 resurgence scenario" and a "financial stress scenario") (Chart V-2-1).
The baseline scenario assumes that the real economy recovers in line with the average outlook by research institutions and markets. The COVID-19 resurgence scenario assumes that COVID-19 resurges again around the end of 2021, which will also have a negative impact on financial markets. The financial stress scenario assumes that market shock will trigger an adjustment in global financial markets comparable to that during the GFC, which will exert further downward pressure on the domestic and overseas economies through the negative influence on financial intermediation activities.
Assumptions regarding the real economy
The baseline scenario is based on average forecasts of several research institutions and financial markets as of March 2021. Namely, domestic and overseas economies, with the impact of COVID-19 waning gradually, are likely to follow a moderate improving trend.
In this scenario, the real GDP growth in Japan and other countries is assumed to be pushed down by the impact of the spread of COVID-19 until the January-March quarter of 2021; thereafter, however, the pace of growth throughout the simulation period is assumed to stay above the historical average, and the level of GDP at home and abroad is expected to recover (Charts V-2-2 and V-2-3).
Real economy Financial variables
Baseline scenario Average forecasts
of professionals and markets Unchanged from the level
at end-January 2021
Downside scenarios
COVID-19 resurgence
scenario
Downturn of Japan's and overseas economies comparable to the average impact during
the past infection spread phase
Historical average reaction to shocks on the real economy
Financial stress
scenario
Downturn of Japan's and overseas economies through a negative influence
on financial intermediation activities in response to financial shocks
Financial shocks comparable to the GFC
Shocks
Shocks
Propagation
Propagation
Chart V-2-1: Scenarios for simulation
Note: Long- and short-term interest rates evolve in line with the forward rates under the baseline scenario while they fall to the lowest level observed until January 2021 under the downside scenarios.
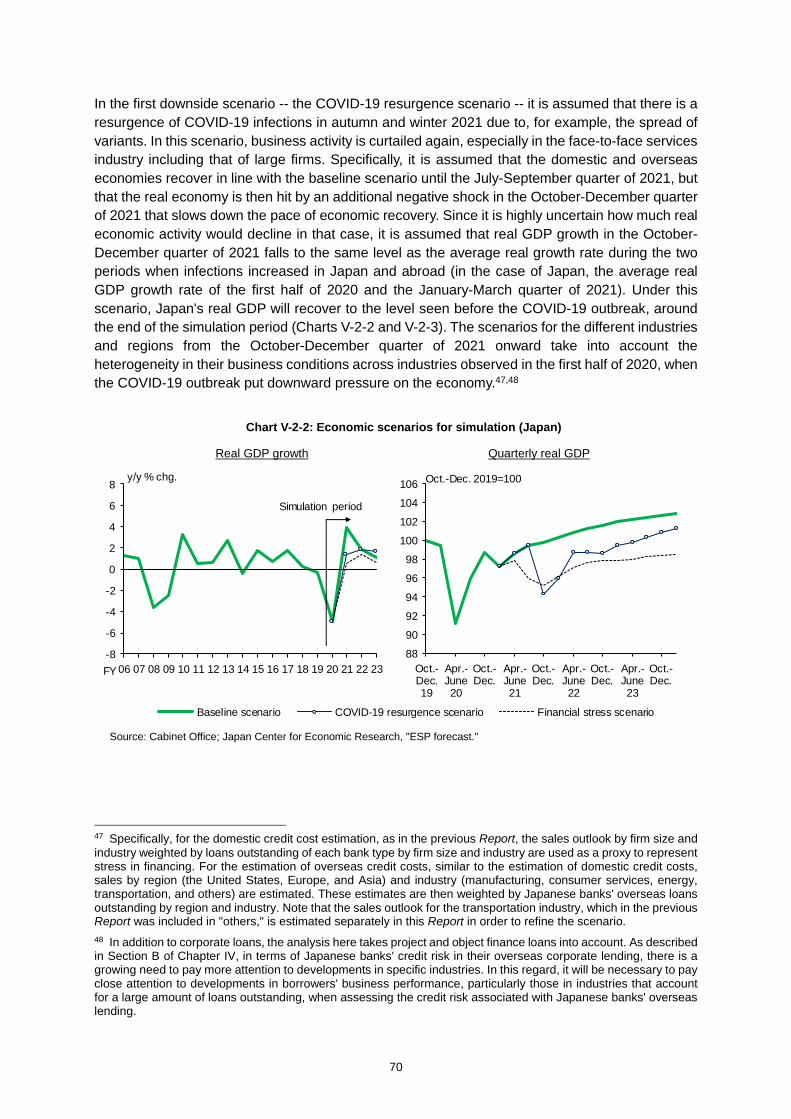
70
In the first downside scenario -- the COVID-19 resurgence scenario -- it is assumed that there is a resurgence of COVID-19 infections in autumn and winter 2021 due to, for example, the spread of variants. In this scenario, business activity is curtailed again, especially in the face-to-face services industry including that of large firms. Specifically, it is assumed that the domestic and overseas economies recover in line with the baseline scenario until the July-September quarter of 2021, but that the real economy is then hit by an additional negative shock in the October-December quarter of 2021 that slows down the pace of economic recovery. Since it is highly uncertain how much real economic activity would decline in that case, it is assumed that real GDP growth in the October-December quarter of 2021 falls to the same level as the average real growth rate during the two periods when infections increased in Japan and abroad (in the case of Japan, the average real GDP growth rate of the first half of 2020 and the January-March quarter of 2021). Under this scenario, Japan's real GDP will recover to the level seen before the COVID-19 outbreak, around the end of the simulation period (Charts V-2-2 and V-2-3). The scenarios for the different industries and regions from the October-December quarter of 2021 onward take into account the heterogeneity in their business conditions across industries observed in the first half of 2020, when the COVID-19 outbreak put downward pressure on the economy.47,48
47 Specifically, for the domestic credit cost estimation, as in the previous Report, the sales outlook by firm size and industry weighted by loans outstanding of each bank type by firm size and industry are used as a proxy to represent stress in financing. For the estimation of overseas credit costs, similar to the estimation of domestic credit costs, sales by region (the United States, Europe, and Asia) and industry (manufacturing, consumer services, energy, transportation, and others) are estimated. These estimates are then weighted by Japanese banks' overseas loans outstanding by region and industry. Note that the sales outlook for the transportation industry, which in the previous Report was included in "others," is estimated separately in this Report in order to refine the scenario. 48 In addition to corporate loans, the analysis here takes project and object finance loans into account. As described in Section B of Chapter IV, in terms of Japanese banks' credit risk in their overseas corporate lending, there is a growing need to pay more attention to developments in specific industries. In this regard, it will be necessary to pay close attention to developments in borrowers' business performance, particularly those in industries that account for a large amount of loans outstanding, when assessing the credit risk associated with Japanese banks' overseas lending.
Chart V-2-2: Economic scenarios for simulation (Japan)
Source: Cabinet Office; Japan Center for Economic Research, "ESP forecast."
Real GDP growth Quarterly real GDP
88
90
92
94
96
98
100
102
104
106
Oct.-Dec.19
Apr.-June20
Oct.-Dec.
Apr.-June21
Oct.-Dec.
Apr.-June22
Oct.-Dec.
Apr.-June23
Oct.-Dec.
Oct.-Dec. 2019=100
-8
-6
-4
-2
0
2
4
6
8
06 07 08 09 10 11 12 13 14 15 16 17 18 19 20 21 22 23
Baseline scenario COVID-19 resurgence scenario Financial stress scenario
y/y % chg.
Simulation period
FY

71
The second downside scenario, the financial stress scenario, assumes that, as the domestic and overseas economies recover from the impact of COVID-19, there is a substantial and rapid adjustment in global financial markets, which has a negative influence on financial intermediation activities; namely, it leads to sluggish business fixed investment and widespread deterioration in the employment and income situation in countries around the world. Specifically, the scenario assumes a situation in which global financial markets experience a significant negative shock in the April-June quarter of 2021 comparable to that during the GFC, which has a negative influence on financial intermediation activities, putting downward pressure on the real economy at home and abroad. In this scenario, it is assumed that, from the April-June quarter of 2021 onward, overseas GDP growth follow a path similar to that during the GFC. For Japan's GDP growth, the results of a model simulation are used. Specifically, the extent to which domestic economic activity would be pushed down through the negative influence on financial intermediation activities of a shock similar to the GFC is simulated in the model (Charts V-2-2 and V-2-3). This makes it possible to incorporate the aspect of the increase in Japanese financial institutions' capital since the GFC, which has helped to underpin financial intermediation activities.
The financial stress scenario is the most severe of the three scenarios, and the downward pressure on domestic and overseas economies is more or less the same as that in the stress scenarios employed by financial authorities in the United States and Europe in their stress testing. In this scenario, Japan's economy does not recover to the level before the COVID-19 outbreak even at the end of the simulation period (Charts V-2-2 and V-2-3).
Assumptions regarding the financial variables
The baseline scenario assumes that the impact of the major downturn in the domestic and overseas economies in fiscal 2020 and currently available information on the outlook for the domestic and international economies are appropriately priced in by financial markets. On this basis, it is assumed that government bond yields evolve in line with the forward rates implied by the yield curve as of end-January 2021, and that the TOPIX, foreign exchange rates, and credit spreads in Japan and abroad are all unchanged from their end-January 2021 levels (Chart V-2-4).
Chart V-2-3: Economic scenarios for simulation (Overseas)
Source: IMF; Japan Center for Economic Research, "ESP forecast."
Real GDP growth Quarterly real GDP
85
90
95
100
105
110
115
Oct.-Dec.19
Apr.-June20
Oct.-Dec.
Apr.-June21
Oct.-Dec.
Apr.-June22
Oct.-Dec.
Apr.-June23
Oct.-Dec.
Oct.-Dec. 2019=100
-8
-6
-4
-2
0
2
4
6
8
06 07 08 09 10 11 12 13 14 15 16 17 18 19 20 21 22 23
Baseline scenario COVID-19 resurgence scenario Financial stress scenario
y/y % chg.Simulation period
CY

72
The COVID-19 resurgence scenario assumes that, as in the previous Report, financial markets adjust the pricing by considering an additional negative shock to the real economy as a negative surprise. In this scenario, the additional negative shock to the real economy is assumed to hit in the October-December quarter of 2021, and the resultant decline in stock prices, the appreciation of the yen, and the widening of various credit spreads are calculated from the average market reactions to such surprises in the past.49 Once the negative surprise has been reflected in financial variables, it is assumed in this scenario that they revert to their long-term average at a pace suggested by the historical data (Chart V-2-4).50
In the financial stress scenario, it is assumed that global financial markets experience stress in the April-June quarter of 2021 comparable to that during the GFC (Chart V-2-4). Spillover of market shocks, however, is assumed to be much faster than during the GFC, as seen in the market turmoil in March 2020. This assumption reflects the fact that investment funds and other NBFIs have been playing an increasingly important role in financial intermediation and that the interlinkage between the Japanese and overseas financial systems has been strengthening in recent years (see Box 5 for details).
Assumptions regarding measures to support corporate financing
This Report updates the method used in the previous Report to reflect the corporate financing support measures in the estimation, taking into account the actual pace of spending of the budget. Namely, in estimating credit costs, it is taken into account that, in the short term, measures to 49 In the COVID-19 resurgence scenario, financial variables such as stock prices and credit spreads are estimated using regression analysis of the response of these variables to changes in the outlook of the output gaps of the domestic and overseas economies. Moreover, the exchange rate is assumed to fluctuate in line with the spread between two-year interest rates in Japan and the United States. Lastly, it is assumed that domestic and overseas long- and short-term interest rates fall to their past lows from the October-December quarter of 2021 in the COVID-19 resurgence scenario and from the April-June quarter of 2021 in the financial stress scenario, and remain there until the end of fiscal 2023. 50 Note that data from past stress periods show that the pace at which financial variables revert to their long-term averages after the stress event tends to be faster than during the period overall. This pattern may be linked to the fact that substantial financial market stress tends to be followed by policy responses. However, to assess the impact in the absence of a policy response in the wake of a shock, both downside scenarios assume that the pace at which financial variables revert to their long-term averages is identical to the average pace in the past.
Chart V-2-4: Financial market scenarios for simulation
Note: Real estate fund price indicates the TSE REIT Index. Source: Bloomberg.
Japanese stock price Exchange rate U.S. corporate bond Real estate fund price (TOPIX) (USD/JPY) spread (BBB)
0100200300400500600700800900
1,000
070911131517192123
bpsSimulation period
0
500
1,000
1,500
2,000
2,500
070911131517192123Baseline scenario COVID-19 resurgence scenario Financial stress scenario
Simulation periodpts
CY60
70
80
90
100
110
120
130
140
070911131517192123
yenSimulation period
0
500
1,000
1,500
2,000
2,500
3,000
070911131517192123
pts Simulation period

73
facilitate corporate financing implemented by the government and the Bank of Japan, as well as lending by financial institutions, will lower firms' default rates. In the long term, it is considered that the increase in firms' debt under those measures will raise default rates if the deterioration in profits
was prolonged and firms' debt servicing capacity declined further (Chart V-2-5). Specifically, it is assumed that the deterioration in firms' ICR, which represents their debt servicing capacity, eases as a result of firms' profits being underpinned by cash payments. Moreover, thanks to the impact of the financing support measures, it is assumed that there is no increase in default rates triggered by funding difficulties until the April-June quarter of 2021, despite a decline in nominal GDP.51,52
Loans extended in fiscal 2020 as part of corporate financing support measures are assumed not to be repaid until the end of fiscal 2023.53 Among these loans, the effectively interest-free loans guaranteed by the credit guarantee corporations are assumed to increase financial institutions' net interest income. At the same time, the credit costs are not assumed to increase in the event of borrowers' default on such loans. In addition, the risk-weighted assets for such loans are not assumed to increase either.54 While other loans are similar, in that they lead to an increase in net interest income, they differ in that they could lead to an increase in financial institutions' risk-
51 Cash payments incorporate the total of subsidies for sustaining businesses, rent assistance subsidies, expansion of the employment adjustment subsidies program (all as of the end of February), and cooperation fees for shortening business hours (estimated assuming a state of emergency period from January 8 to March 7, 2021), etc. As a result, the amount of cash payments is larger than in the previous Report. In addition, based on the analysis in Chapter IV, the estimation in this Report was refined by incorporating the effect of cash payments by firm size. Meanwhile, as in the previous Report, the amount of cash payments from fiscal 2021 onward is assumed to be zero. 52 Effectively interest-free loans, etc. ("additional liquidity support measures" in Chart V-2-5) are incorporated as a means through which the deterioration in short-term financing that reflects a rapid decline in nominal GDP is restrained, as in the previous Report. Specifically, taking into account the extension of the application deadline (extended from December 2020 to March 2021) and the deadline for loan disbursements (extended from January 2021 to May 2021) of the effectively interest-free loans, the impact of these measures, which in the previous Report was incorporated until the January-March quarter of 2021, was extended to the April-June quarter of 2021. 53 Many of these loans in practice have a grace period for principal of up to one year. Therefore, while it is expected that many of the loans will be refinanced after the grace period with a change in the terms and conditions, it should be noted that it is also possible that a fairly large number may be repaid. 54 In terms of the scale of effectively interest-free lending, the portion of loans outstanding to domestic firms as of December 2020 that exceeds the loans outstanding predicted by the model is regarded as COVID-19-related lending. Then, for regional financial institutions, the entire amount of COVID-19-related lending is regarded as effectively interest-free lending. This value is approximately equivalent to the net increase in regional financial institutions' loans outstanding between the end of March 2020 and the end of December 2020. In reality, part of the increase in lending by regional financial institutions seen since the COVID-19 outbreak is the result of their risk taking. The assumption is made to facilitate the quantitative analysis of the macro impact of the effectively interest-free loan program while avoiding making the analysis too complex, but it should be noted that, under this assumption, the proactive lending stance of regional financial institutions is not sufficiently taken into account.
Chart V-2-5: Impact of measures to support corporate financing
19 20 21 22 23
Without the measures to support corporate financingWith the measures to support corporate financing
Cash payment programs
Increase in f irms' leverage
Additional liquidity support measures
Cred
it co
st ra
tios
FY
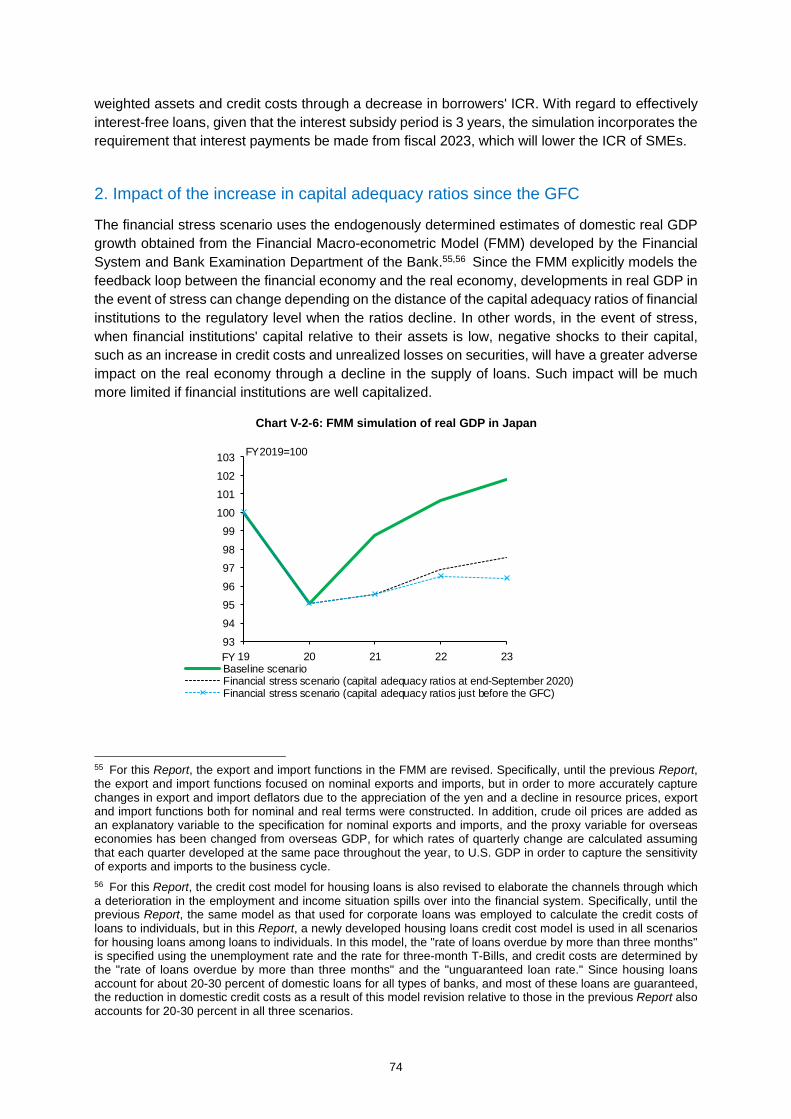
74
weighted assets and credit costs through a decrease in borrowers' ICR. With regard to effectively interest-free loans, given that the interest subsidy period is 3 years, the simulation incorporates the requirement that interest payments be made from fiscal 2023, which will lower the ICR of SMEs.
2. Impact of the increase in capital adequacy ratios since the GFC
The financial stress scenario uses the endogenously determined estimates of domestic real GDP growth obtained from the Financial Macro-econometric Model (FMM) developed by the Financial System and Bank Examination Department of the Bank.55,56 Since the FMM explicitly models the feedback loop between the financial economy and the real economy, developments in real GDP in the event of stress can change depending on the distance of the capital adequacy ratios of financial institutions to the regulatory level when the ratios decline. In other words, in the event of stress, when financial institutions' capital relative to their assets is low, negative shocks to their capital, such as an increase in credit costs and unrealized losses on securities, will have a greater adverse impact on the real economy through a decline in the supply of loans. Such impact will be much more limited if financial institutions are well capitalized.
55 For this Report, the export and import functions in the FMM are revised. Specifically, until the previous Report, the export and import functions focused on nominal exports and imports, but in order to more accurately capture changes in export and import deflators due to the appreciation of the yen and a decline in resource prices, export and import functions both for nominal and real terms were constructed. In addition, crude oil prices are added as an explanatory variable to the specification for nominal exports and imports, and the proxy variable for overseas economies has been changed from overseas GDP, for which rates of quarterly change are calculated assuming that each quarter developed at the same pace throughout the year, to U.S. GDP in order to capture the sensitivity of exports and imports to the business cycle. 56 For this Report, the credit cost model for housing loans is also revised to elaborate the channels through which a deterioration in the employment and income situation spills over into the financial system. Specifically, until the previous Report, the same model as that used for corporate loans was employed to calculate the credit costs of loans to individuals, but in this Report, a newly developed housing loans credit cost model is used in all scenarios for housing loans among loans to individuals. In this model, the "rate of loans overdue by more than three months" is specified using the unemployment rate and the rate for three-month T-Bills, and credit costs are determined by the "rate of loans overdue by more than three months" and the "unguaranteed loan rate." Since housing loans account for about 20-30 percent of domestic loans for all types of banks, and most of these loans are guaranteed, the reduction in domestic credit costs as a result of this model revision relative to those in the previous Report also accounts for 20-30 percent in all three scenarios.
Chart V-2-6: FMM simulation of real GDP in Japan
93
94
95
96
97
98
99
100
101
102
103
19 20 21 22 23Baseline scenarioFinancial stress scenario (capital adequacy ratios at end-September 2020)Financial stress scenario (capital adequacy ratios just before the GFC)
FY2019=100
FY

75
In practice, partly due to the tightening of international regulations since the GFC, the capital adequacy ratios of Japan's financial institutions have increased substantially, especially of internationally active banks (which rose from 11.9 percent as of the end of fiscal 2007 to 16.1 percent as of the end of fiscal 2019). Thus, a counterfactual simulation is conducted in order to quantitatively examine the extent to which the robustness of Japan's financial institutions to downward pressure on the economy has increased. It explores the path of real GDP if a shock to overseas economic and financial variables were identical to that assumed in the financial stress scenario and if the capital adequacy ratios were at the same level just before the GFC (Chart V-2-6). A comparison of the two simulation outcomes of the cumulative real GDP decline over the simulation period (three years) shows that the outcome assuming the current capital ratio is smaller by about 10 percent than the counterfactual outcome assuming the capital ratio just before the GFC. Reflecting the strengthening of the capital bases of Japan's financial institutions, the decline in Japan's real GDP from the April-June quarter of 2021 onward in the financial stress scenario is moderate compared to the GFC (Chart V-2-2).
3. Results of stress testing
Baseline scenario
The simulation results under the baseline scenario show that the credit cost ratios increase somewhat through fiscal 2021 for all types of banks and then decline moderately in fiscal 2023, the final year of the simulation (Chart V-2-7).
The cumulative credit cost ratios are about 0.8 percent for internationally active banks, about 0.7 percent for domestic regional banks, and about 0.5 percent for shinkin banks for the 4 years from fiscal 2020 to 2023 (Chart V-2-8). Thanks to a variety of policy measures, such as the corporate financing support measures examined in the previous chapters, the credit cost ratios do not show a significant rise for fiscal 2020, when domestic and overseas real economies are under strong stress. The measures are considered to be powerful in preventing the decline in the debt servicing capacity of firms/borrowers due to depletion of their operating liquidity and the deterioration in their profits.
Chart V-2-7: Credit cost ratios
Internationally active banks Domestic regional banks Shinkin banks
0.0
0.5
1.0
1.5
19 20 21 22 23Baseline scenario COVID-19 resurgence scenario Financial stress scenario
%Simulation
0.0
0.5
1.0
1.5
19 20 21 22 23
Simulation%
0.0
0.5
1.0
1.5
19 20 21 22 23
Simulation%
FY
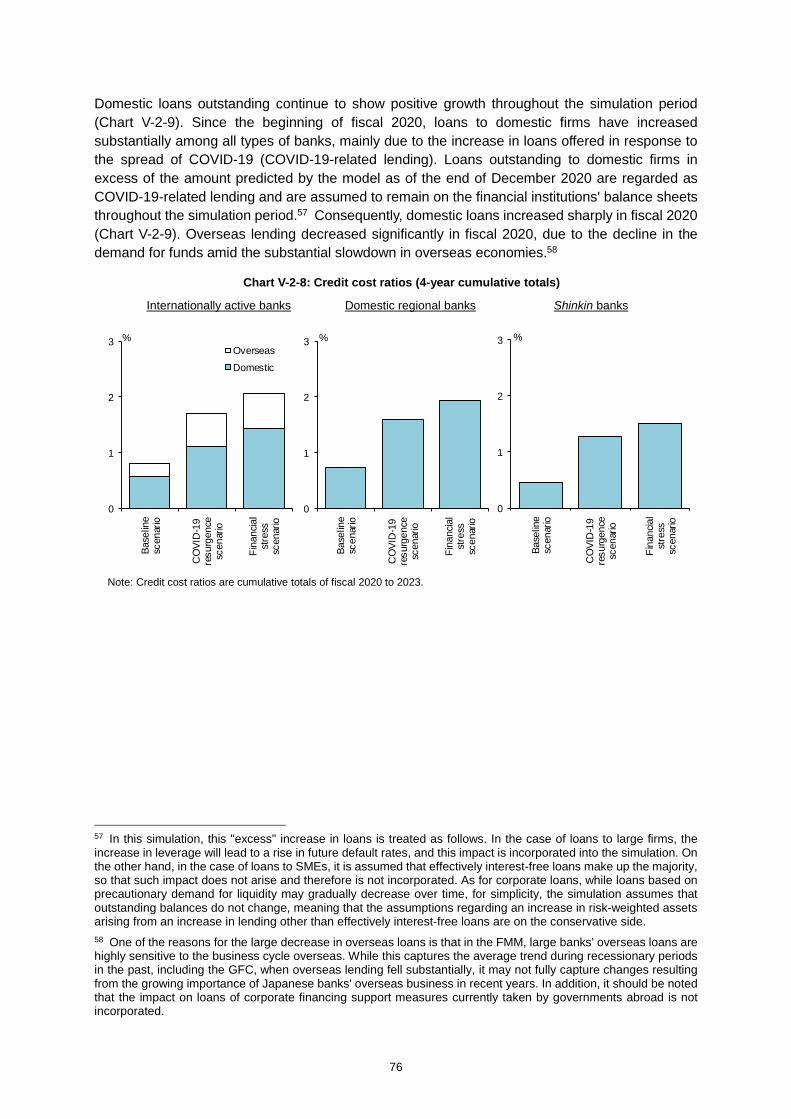
76
Domestic loans outstanding continue to show positive growth throughout the simulation period (Chart V-2-9). Since the beginning of fiscal 2020, loans to domestic firms have increased substantially among all types of banks, mainly due to the increase in loans offered in response to the spread of COVID-19 (COVID-19-related lending). Loans outstanding to domestic firms in excess of the amount predicted by the model as of the end of December 2020 are regarded as COVID-19-related lending and are assumed to remain on the financial institutions' balance sheets throughout the simulation period.57 Consequently, domestic loans increased sharply in fiscal 2020 (Chart V-2-9). Overseas lending decreased significantly in fiscal 2020, due to the decline in the demand for funds amid the substantial slowdown in overseas economies.58
57 In this simulation, this "excess" increase in loans is treated as follows. In the case of loans to large firms, the increase in leverage will lead to a rise in future default rates, and this impact is incorporated into the simulation. On the other hand, in the case of loans to SMEs, it is assumed that effectively interest-free loans make up the majority, so that such impact does not arise and therefore is not incorporated. As for corporate loans, while loans based on precautionary demand for liquidity may gradually decrease over time, for simplicity, the simulation assumes that outstanding balances do not change, meaning that the assumptions regarding an increase in risk-weighted assets arising from an increase in lending other than effectively interest-free loans are on the conservative side. 58 One of the reasons for the large decrease in overseas loans is that in the FMM, large banks' overseas loans are highly sensitive to the business cycle overseas. While this captures the average trend during recessionary periods in the past, including the GFC, when overseas lending fell substantially, it may not fully capture changes resulting from the growing importance of Japanese banks' overseas business in recent years. In addition, it should be noted that the impact on loans of corporate financing support measures currently taken by governments abroad is not incorporated.
0
1
2
3Ba
selin
esc
enar
io
CO
VID
-19
resu
rgen
cesc
enar
io
Fina
ncia
lst
ress
scen
ario
%
0
1
2
3
Base
line
scen
ario
CO
VID
-19
resu
rgen
cesc
enar
io
Fina
ncia
lst
ress
scen
ario
%
0
1
2
3
Base
line
scen
ario
CO
VID
-19
resu
rgen
cesc
enar
io
Fina
ncia
lst
ress
scen
ario
Overseas
Domestic
%
Chart V-2-8: Credit cost ratios (4-year cumulative totals)
Note: Credit cost ratios are cumulative totals of fiscal 2020 to 2023.
Internationally active banks Domestic regional banks Shinkin banks
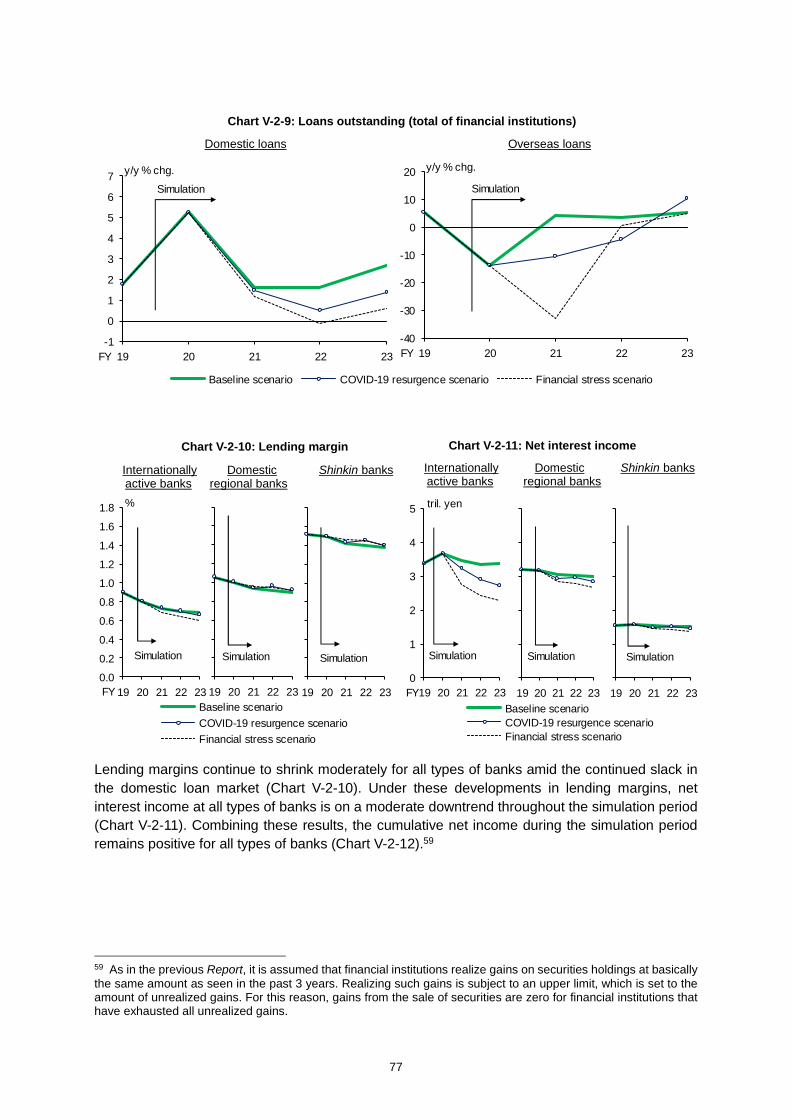
77
Lending margins continue to shrink moderately for all types of banks amid the continued slack in the domestic loan market (Chart V-2-10). Under these developments in lending margins, net interest income at all types of banks is on a moderate downtrend throughout the simulation period (Chart V-2-11). Combining these results, the cumulative net income during the simulation period remains positive for all types of banks (Chart V-2-12).59
59 As in the previous Report, it is assumed that financial institutions realize gains on securities holdings at basically the same amount as seen in the past 3 years. Realizing such gains is subject to an upper limit, which is set to the amount of unrealized gains. For this reason, gains from the sale of securities are zero for financial institutions that have exhausted all unrealized gains.
-1
0
1
2
3
4
5
6
7
19 20 21 22 23
Baseline scenario COVID-19 resurgence scenario Financial stress scenario
FY
y/y % chg.
Simulation
Domestic loans Overseas loans
-40
-30
-20
-10
0
10
20
19 20 21 22 23FY
y/y % chg.
Simulation
Chart V-2-9: Loans outstanding (total of financial institutions)
Chart V-2-11: Net interest income Chart V-2-10: Lending margin
Internationally Domestic Shinkin banks active banks regional banks
Internationally Domestic Shinkin banks active banks regional banks
19 20 21 22 23Baseline scenarioCOVID-19 resurgence scenarioFinancial stress scenario
Simulation
19 20 21 22 23
Simulation
0.0
0.2
0.4
0.6
0.8
1.0
1.2
1.4
1.6
1.8
19 20 21 22 23
%
Simulation
FY 19 20 21 22 23Baseline scenarioCOVID-19 resurgence scenarioFinancial stress scenario
Simulation
0
1
2
3
4
5
19 20 21 22 23
tril. yen
Simulation
FY 19 20 21 22 23
Simulation
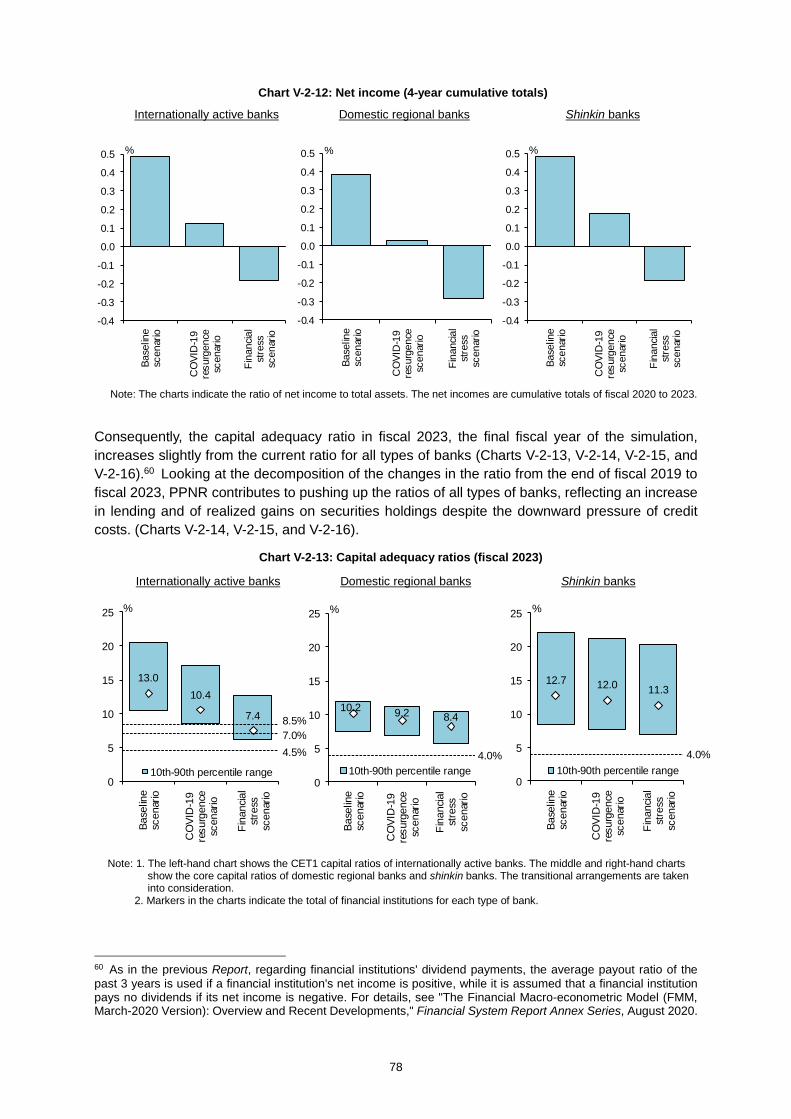
78
Consequently, the capital adequacy ratio in fiscal 2023, the final fiscal year of the simulation, increases slightly from the current ratio for all types of banks (Charts V-2-13, V-2-14, V-2-15, and V-2-16).60 Looking at the decomposition of the changes in the ratio from the end of fiscal 2019 to fiscal 2023, PPNR contributes to pushing up the ratios of all types of banks, reflecting an increase in lending and of realized gains on securities holdings despite the downward pressure of credit costs. (Charts V-2-14, V-2-15, and V-2-16).
60 As in the previous Report, regarding financial institutions' dividend payments, the average payout ratio of the past 3 years is used if a financial institution's net income is positive, while it is assumed that a financial institution pays no dividends if its net income is negative. For details, see "The Financial Macro-econometric Model (FMM, March-2020 Version): Overview and Recent Developments," Financial System Report Annex Series, August 2020.
-0.4
-0.3
-0.2
-0.1
0.0
0.1
0.2
0.3
0.4
0.5Ba
selin
esc
enar
io
CO
VID
-19
resu
rgen
cesc
enar
io
Fina
ncia
lst
ress
scen
ario
%
-0.4
-0.3
-0.2
-0.1
0.0
0.1
0.2
0.3
0.4
0.5
Base
line
scen
ario
CO
VID
-19
resu
rgen
cesc
enar
io
Fina
ncia
lst
ress
scen
ario
%
-0.4
-0.3
-0.2
-0.1
0.0
0.1
0.2
0.3
0.4
0.5
Base
line
scen
ario
CO
VID
-19
resu
rgen
cesc
enar
io
Fina
ncia
lst
ress
scen
ario
%
Chart V-2-12: Net income (4-year cumulative totals)
Note: The charts indicate the ratio of net income to total assets. The net incomes are cumulative totals of fiscal 2020 to 2023.
Internationally active banks Domestic regional banks Shinkin banks
10.2 9.2 8.4
0
5
10
15
20
25
Base
line
scen
ario
CO
VID
-19
resu
rgen
cesc
enar
io
Fina
ncia
lst
ress
scen
ario
10th-90th percentile range
%
4.0%
12.7 12.0 11.3
0
5
10
15
20
25
Base
line
scen
ario
CO
VID
-19
resu
rgen
cesc
enar
io
Fina
ncia
lst
ress
scen
ario
10th-90th percentile range
%
4.0%
13.010.4
7.4
0
5
10
15
20
25
Base
line
scen
ario
CO
VID
-19
resu
rgen
cesc
enar
io
Fina
ncia
lst
ress
scen
ario
10th-90th percentile range
%
8.5%
4.5%7.0%
Chart V-2-13: Capital adequacy ratios (fiscal 2023)
Note: 1. The left-hand chart shows the CET1 capital ratios of internationally active banks. The middle and right-hand charts show the core capital ratios of domestic regional banks and shinkin banks. The transitional arrangements are taken into consideration.
2. Markers in the charts indicate the total of financial institutions for each type of bank.
Internationally active banks Domestic regional banks Shinkin banks
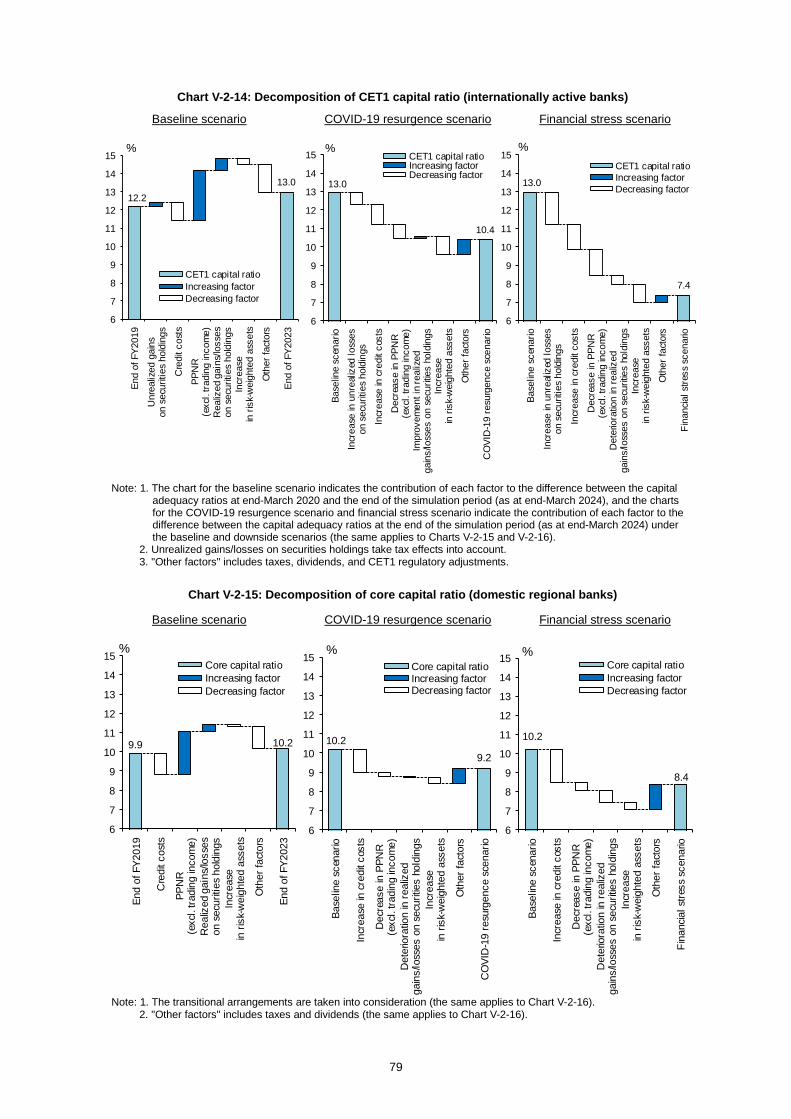
79
Chart V-2-15: Decomposition of core capital ratio (domestic regional banks)
Baseline scenario COVID-19 resurgence scenario Financial stress scenario
Note: 1. The transitional arrangements are taken into consideration (the same applies to Chart V-2-16). 2. "Other factors" includes taxes and dividends (the same applies to Chart V-2-16).
10.2 9.2
6
7
8
9
10
11
12
13
14
15
Base
line
scen
ario
Incr
ease
in c
redi
t cos
ts
Dec
reas
e in
PPN
R(e
xcl.
tradi
ng in
com
e)D
eter
iora
tion
in re
aliz
edga
ins/
loss
es o
n se
curit
ies
hold
ings
Incr
ease
in ri
sk-w
eigh
ted
asse
ts
Oth
er fa
ctor
s
CO
VID
-19
resu
rgen
ce s
cena
rio
%Core capital ratioIncreasing factorDecreasing factor
10.2
8.4
6
7
8
9
10
11
12
13
14
15
Base
line
scen
ario
Incr
ease
in c
redi
t cos
ts
Dec
reas
e in
PPN
R(e
xcl.
tradi
ng in
com
e)D
eter
iora
tion
in re
aliz
edga
ins/
loss
es o
n se
curit
ies
hold
ings
Incr
ease
in ri
sk-w
eigh
ted
asse
ts
Oth
er fa
ctor
s
Fina
ncia
l stre
ss s
cena
rio
%Core capital ratioIncreasing factorDecreasing factor
9.9 10.2
6
7
8
9
10
11
12
13
14
15
End
of F
Y201
9
Cre
dit c
osts
PPN
R(e
xcl.
tradi
ng in
com
e)R
ealiz
ed g
ains
/loss
eson
sec
uriti
es h
oldi
ngs
Incr
ease
in ri
sk-w
eigh
ted
asse
ts
Oth
er fa
ctor
s
End
of F
Y202
3
%Core capital ratioIncreasing factorDecreasing factor
12.2 13.0
6
7
8
9
10
11
12
13
14
15
End
of F
Y201
9
Unr
ealiz
ed g
ains
on s
ecur
ities
hol
ding
s
Cre
dit c
osts
PPN
R(e
xcl.
tradi
ng in
com
e)R
ealiz
ed g
ains
/loss
eson
sec
uriti
es h
oldi
ngs
Incr
ease
in ri
sk-w
eigh
ted
asse
ts
Oth
er fa
ctor
s
End
of F
Y202
3
%
CET1 capital ratioIncreasing factorDecreasing factor
13.0
10.4
6
7
8
9
10
11
12
13
14
15
Base
line
scen
ario
Incr
ease
in u
nrea
lized
loss
eson
sec
uriti
es h
oldi
ngs
Incr
ease
in c
redi
t cos
ts
Dec
reas
e in
PPN
R(e
xcl.
tradi
ng in
com
e)Im
prov
emen
t in
real
ized
gain
s/lo
sses
on
secu
ritie
s ho
ldin
gsIn
crea
sein
risk
-wei
ghte
d as
sets
Oth
er fa
ctor
s
CO
VID
-19
resu
rgen
ce s
cena
rio
%CET1 capital ratioIncreasing factorDecreasing factor
13.0
7.4
6
7
8
9
10
11
12
13
14
15
Base
line
scen
ario
Incr
ease
in u
nrea
lized
loss
eson
sec
uriti
es h
oldi
ngs
Incr
ease
in c
redi
t cos
ts
Dec
reas
e in
PPN
R(e
xcl.
tradi
ng in
com
e)D
eter
iora
tion
in re
aliz
edga
ins/
loss
es o
n se
curit
ies
hold
ings
Incr
ease
in ri
sk-w
eigh
ted
asse
ts
Oth
er fa
ctor
s
Fina
ncia
l stre
ss s
cena
rio
%CET1 capital ratioIncreasing factorDecreasing factor
Chart V-2-14: Decomposition of CET1 capital ratio (internationally active banks)
Baseline scenario COVID-19 resurgence scenario Financial stress scenario
Note: 1. The chart for the baseline scenario indicates the contribution of each factor to the difference between the capital adequacy ratios at end-March 2020 and the end of the simulation period (as at end-March 2024), and the charts for the COVID-19 resurgence scenario and financial stress scenario indicate the contribution of each factor to the difference between the capital adequacy ratios at the end of the simulation period (as at end-March 2024) under the baseline and downside scenarios (the same applies to Charts V-2-15 and V-2-16).
2. Unrealized gains/losses on securities holdings take tax effects into account. 3. "Other factors" includes taxes, dividends, and CET1 regulatory adjustments.
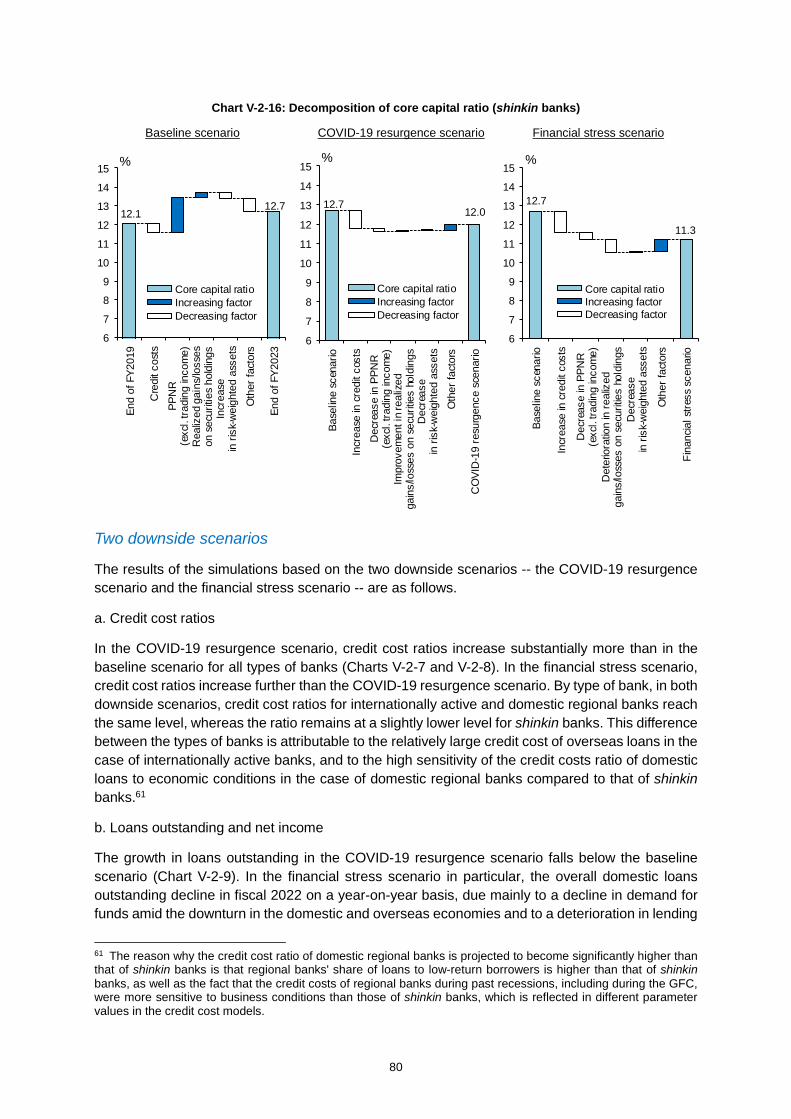
80
Two downside scenarios
The results of the simulations based on the two downside scenarios -- the COVID-19 resurgence scenario and the financial stress scenario -- are as follows.
a. Credit cost ratios
In the COVID-19 resurgence scenario, credit cost ratios increase substantially more than in the baseline scenario for all types of banks (Charts V-2-7 and V-2-8). In the financial stress scenario, credit cost ratios increase further than the COVID-19 resurgence scenario. By type of bank, in both downside scenarios, credit cost ratios for internationally active and domestic regional banks reach the same level, whereas the ratio remains at a slightly lower level for shinkin banks. This difference between the types of banks is attributable to the relatively large credit cost of overseas loans in the case of internationally active banks, and to the high sensitivity of the credit costs ratio of domestic loans to economic conditions in the case of domestic regional banks compared to that of shinkin banks.61
b. Loans outstanding and net income
The growth in loans outstanding in the COVID-19 resurgence scenario falls below the baseline scenario (Chart V-2-9). In the financial stress scenario in particular, the overall domestic loans outstanding decline in fiscal 2022 on a year-on-year basis, due mainly to a decline in demand for funds amid the downturn in the domestic and overseas economies and to a deterioration in lending
61 The reason why the credit cost ratio of domestic regional banks is projected to become significantly higher than that of shinkin banks is that regional banks' share of loans to low-return borrowers is higher than that of shinkin banks, as well as the fact that the credit costs of regional banks during past recessions, including during the GFC, were more sensitive to business conditions than those of shinkin banks, which is reflected in different parameter values in the credit cost models.
Chart V-2-16: Decomposition of core capital ratio (shinkin banks)
Baseline scenario COVID-19 resurgence scenario Financial stress scenario
12.1 12.7
6
7
8
9
10
11
12
13
14
15
End
of F
Y201
9
Cre
dit c
osts
PPN
R(e
xcl.
tradi
ng in
com
e)R
ealiz
ed g
ains
/loss
eson
sec
uriti
es h
oldi
ngs
Incr
ease
in ri
sk-w
eigh
ted
asse
ts
Oth
er fa
ctor
s
End
of F
Y202
3
%
Core capital ratioIncreasing factorDecreasing factor
12.7 12.0
6
7
8
9
10
11
12
13
14
15
Base
line
scen
ario
Incr
ease
in c
redi
t cos
tsD
ecre
ase
in P
PNR
(exc
l. tra
ding
inco
me)
Impr
ovem
ent i
n re
aliz
edga
ins/
loss
es o
n se
curit
ies
hold
ings
Dec
reas
ein
risk
-wei
ghte
d as
sets
Oth
er fa
ctor
s
CO
VID
-19
resu
rgen
ce s
cena
rio
%
Core capital ratioIncreasing factorDecreasing factor
12.7
11.3
6
7
8
9
10
11
12
13
14
15
Base
line
scen
ario
Incr
ease
in c
redi
t cos
ts
Dec
reas
e in
PPN
R(e
xcl.
tradi
ng in
com
e)D
eter
iora
tion
in re
aliz
edga
ins/
loss
es o
n se
curit
ies
hold
ings
Dec
reas
ein
risk
-wei
ghte
d as
sets
Oth
er fa
ctor
s
Fina
ncia
l stre
ss s
cena
rio
%
Core capital ratioIncreasing factorDecreasing factor

81
capacity amid lower capital adequacy ratios. Overseas loans outstanding by internationally active banks decline in the COVID-19 resurgence scenario, not only in fiscal 2020 but also in fiscal 2021 and 2022, mainly due to weaker demand for funds amid a downturn in the overseas economies. Additionally, in the financial stress scenario, a significant decline in the yen-denominated value of overseas loans due to the yen appreciation contributes to a greater rate of decline for fiscal 2021. The lending margins of domestic regional banks and shinkin banks in the COVID-19 resurgence scenario expand slightly, reflecting the rise in domestic credit spreads. On the other hand, those of internationally active banks remain at the same level as in the baseline scenario. This is because the increase in domestic lending margins is offset by the contraction in overseas lending margins due to the deterioration of overseas economies (Chart V-2-10). The lending margins for domestic regional banks and shinkin banks in the financial stress scenario are more or less the same as in the COVID-19 resurgence scenario, but for internationally active banks, the further contraction in overseas lending margins due to higher foreign currency funding costs leads to a decline in overall lending margins.62 Turning to financial institutions' net interest income in the COVID-19 resurgence scenario shows that, compared to the baseline scenario, the net interest income of internationally active banks is considerably lower due to the substantially lower overseas loans outstanding. As for domestic regional banks and shinkin banks, a decrease in loans outstanding is relatively small, and the decline in net interest income is relatively moderate. In the financial stress scenario, the net interest income is lower for all types of banks than in the COVID-19 resurgence scenario, reflecting the relatively low loans outstanding. This is particularly emphasized in internationally active banks due to the contraction of overseas lending margins (Chart V-2-11). As a result, the net income of all types of banks is considerably smaller in the COVID-19 resurgence scenario than in the baseline scenario (Chart V-2-12). In the financial stress scenario, the cumulative net income over the simulation period is likely to be negative as net interest income declines further compared to the COVID-19 resurgence scenario and realized gains/losses on securities deteriorate substantially.
c. Capital adequacy ratios
In the two downside scenarios, capital adequacy ratios decline through fiscal 2023. In detail, in the COVID-19 resurgence scenario, the ratios on average remain above regulatory levels for all types of banks (Charts V-2-14, V-2-15, and V-2-16). Decomposition of the decline in the ratios relative to that of the baseline scenario shows that the rise in credit costs is the main contributor to the decline for all types of banks.
In the financial stress scenario, the average CET1 ratio of internationally active banks falls below 8 percent, and that of many financial institutions declines to a level that breaches the capital buffer ratios, which are set in the range of 7 to 8.5 percent depending on each financial institution's importance in the financial system (Charts V-2-14, V-2-15, and V-2-16).63 The average core capital ratio of domestic regional banks also falls to the range of 8.0-8.5 percent. In the financial stress scenario, in addition to an increase in credit costs, realized gains/losses on securities holdings contribute to a further decline in capital adequacy ratios relative to the baseline scenario. For
62 For this Report, the function of funding rates, which affects loan margins, was refined. Specifically, up until the previous issue of the Report, different domestic and overseas funding rates were respectively lumped together, whereas in this Report, interest rate functions were specified for the following different funding instruments: (1) domestic deposit rates; (2) borrowing rates from the Bank of Japan; (3) domestic market funding rates; (4) overseas deposit rates; (5) overseas repo rates; and (6) overseas market funding rates. As a result, it is possible to incorporate differences in the degree to which banks rely on the different funding instruments into the simulation. 63 When capital buffers decline below a certain threshold, financial institutions are subject to the automatic distribution restriction mechanism, according to their capital buffer ratios.

82
internationally active banks, unrealized gains/losses on securities holdings also push the ratios down.
In summary, the stability of Japan's financial system will be maintained if the economy recovered moderately in line with the average of the current forecasts. Since the GFC, financial institutions have become more robust by building up their capital and non-financial firms have also maintained their sound financial positions on the whole. Against this backdrop, measures to support corporate financing have been highly effective, which is the fundamental background of this result.64 Even in the case where COVID-19 resurges, giving an additional negative shock to domestic and overseas real economies, and financial markets react to such shock, Japan's financial system is likely to remain robust and the smooth functioning of financial intermediation will be maintained. The results indicates that Japan's financial system is considerably resilient against shocks caused by COVID-19.
Nevertheless, given the growing interlinkage between the Japanese and overseas financial systems, more attention needs to be paid to the risk of substantial adjustment in global financial markets assumed in the financial stress scenario in this macro stress testing. The developments in the business fixed investment of Japanese firms since the COVID-19 outbreak indicate that the pressure stemming from capital stock adjustments so far has been modest relative to the magnitude of the decline in economic activity. This can be attributed to the fact that business fixed investment has been supported from the financial side due, for example, to the proactive efforts of financial institutions.65 In addition, the accommodative financial conditions also have the effect of underpinning the real estate market (see Boxes 2 and 3 for details). However, there is a risk that, if there were an adjustment in financial markets comparable to that of the GFC and a simultaneous deterioration in global economies, a decline in financial institutions' capital adequacy ratios would have a negative influence on financial intermediation activities and exert downward pressure on the real economy, including business fixed investment and the real estate market.
As mentioned above, market sentiment in global financial markets has improved and prices of risky assets such as stock prices have risen, reflecting expectations that the global economy will continue to pick up. However, volatility in the stock market remains high, which may reflect market participants' sense of uncertainty. As seen in Chapter IV, at the outbreak of the COVID-19 pandemic toward the end of fiscal 2019, NBFIs such as foreign investment funds, which have seen their importance in financial intermediation activities grow in recent years, faced pressure from rapid outflows of funds. This triggered a rapid drying up of liquidity in various financial instruments, as well as a rise in the U.S. dollar funding premium, which greatly destabilized global financial markets. Markets subsequently regained calmness, thanks in part to the effects of large-scale policy measures. Such developments have triggered active international discussions on how to overcome these vulnerabilities.
64 However, the impact of policy responses on credit costs, etc. in the banking sector should be regarded as subject to a considerable margin of error. For example, an increase in lending to low-return borrowers due to the policy responses may lead to an increase in credit costs and a decrease in financial institutions' profits. This Report does not consider these negative effects regarding the allocation of loans across firms. 65 For details, see the Bank's January 2021 Outlook for Economic Activity and Prices.
83
VI. Challenges to be met regarding risk management to ensure financial system stability and actions by the Bank
Risks in Japan's financial system and challenges for financial institutions
The major challenge for financial institutions is to smoothly fulfill their financial intermediation function and support the economy by balancing their financial soundness and risk taking, in a situation where the impact of COVID-19 continues to be observed. To this end, it is important for financial institutions to maintain robust financial health.
The following are the three risks that call for particular attention from the perspective of ensuring financial system stability in Japan.
The first risk is an increase in credit costs due to a delay in economic recovery at home and abroad.
In Japan, the level of total credit relative to real economic activity significantly exceeds the level of the past trend, as a result of financial institutions' responses to a sudden increase in demand for funds due to the spread of COVID-19. As the impact of the disease gradually wanes, credit risk of domestic loans will likely continue to be contained as firms' business conditions improve on the whole and debt repayment proceeds. Moreover, in the case of a resurgence of COVID-19, an increase in credit costs is unlikely to accelerate to a degree that will significantly impair financial institutions' solid financial soundness, because firms as a whole have maintained favorable financial conditions assisted by large-scale measures taken thus far to support corporate financing. Nevertheless, an improvement in business conditions may be delayed for some firms as the impact of COVID-19 significantly varies across industries and firms. Moreover, there is a risk that firms' debt repayments will not progress as planned if medium- to long-term growth expectations decline due to the impact of COVID-19. Turning to overseas, credit risk to corporate loans has been contained as well so far, but the heterogeneity in business conditions across firms is increasing. Continued deterioration in the creditworthiness of energy-related firms, in which Japanese banks' exposure is large, warrants particular attention.
Against this background, it is important for financial institutions to appropriately manage risks based on an accurate assessment of their borrowers' business conditions. As for domestic borrowers in particular, it is necessary to carefully assess the sustainability of their businesses and provide timely support for their reform, such as facilitating business revitalization, transfer, and restructuring as well as strengthening capital bases, in addition to supporting their core business while applying adequate loan-loss provisioning. On this point, the fact that an increasing number of financial institutions have been implementing loan-loss provisioning that is compatible with their business strategies and focuses on borrowers' future repayment capacity in a forward-looking manner marks an important change. This change is consistent with the repeal of the FSA's inspection manual. Moreover, careful credit risk management is essential for overseas project finance loans related to energy and for object finance loans related to aircraft.
The second risk is a deterioration in gains/losses on securities investment due to substantial adjustments in financial markets.
Under the prolonged low interest rate environment in Japan, Japanese financial institutions have been actively taking risks through securities investment at home and abroad. Meanwhile, the
84
importance of NBFIs has been growing in the global financial system, and there is an increasing interlinkage between overseas NBFIs and the Japanese financial system. Thus, Japanese financial institutions have become more susceptible to global financial market shocks. In the current financial markets, a rapid increase in inflows of funds to the stock market and emerging market economies is observed, against the backdrop of expectations for global economic recovery, as is a narrowing of the credit spreads of corporate bonds accompanied by a significant rise in stocks compared to the time of the market turmoil in March 2020. However, uncertainty over future developments remains significant. If global financial markets are subject to some market shock and an adjustment in global financial markets comparable to that during the GFC and a deterioration in overseas economies occur simultaneously, there will be a negative impact on financial intermediation activities due to financial institutions' capital constraints. As a result, the real economy could be put under further downward pressure.
To this end, financial institutions need to make efforts to enhance their risk management frameworks through refining quantification and close monitoring of market risks, and make practical and organizational plans for contingency responses in the event of significant losses. Moreover, stress testing needs to be conducted among major financial institutions, which have a particularly high systemic importance, assuming a scenario incorporating a strong additional negative shock on Japan's and overseas economies. Through the stress testing, the balance between financial soundness and risk taking should be examined. It is necessary for financial institutions to formulate strategic plans and capital planning in light of considerable future uncertainties, taking into account both the credit risks mentioned above and the market risks.
The third risk is a destabilization of foreign currency funding due to the tightening of foreign currency funding markets, mainly for the U.S. dollar.
Japanese banks' recent efforts to stabilize their funding, as well as the effect of an enhancement of the U.S. dollar liquidity swap line arrangements by six central banks helped to prevent major disruptions in their foreign currency funding during the March 2020 market turmoil. However, attention needs to be paid to the current condition that the focus of Japanese banks may shift from securing the stability of their foreign currency funding to cost reductions, as the improvement in the profitability of overseas operations is becoming an increasingly important management challenge for them. Financial institutions need to continue their efforts to ensure the stability of their funding bases and to strengthen their ability to respond in the event of stress while seeking improvement in profitability. In order to do so, it is of utmost importance to strengthen their preparedness, including making use of computer systems, to flexibly grasp and analyze data at headquarters on foreign currency funding for the entire group. At the same time, in addition to increasing the sophistication of their foreign currency liquidity stress testing, financial institutions need to examine the feasibility of using additional foreign currency funding instruments in the event of stress, analyze the stickiness of customer deposits, check the preparedness regarding foreign currency provision among group affiliates, and, informed by these efforts, diversify their foreign currency funding instruments and counterparts.
The environment surrounding Japanese society is undergoing major changes, including population declines and aging, digital transformation and working-style reforms, and a further heightening interest in climate change and cyber resilience. In the medium to long run, financial institutions are expected to contribute to achieving a sustainable society in the post-COVID-19 era by offering higher value-added financial services. Of these issues, the digital transformation can affect financial
85
institutions' profits in their conventional business areas through new entry of firms from different businesses and lower pricing. Looking ahead, financial institutions need to further accelerate their efforts to make use of digital technologies, improve their capability to contribute to vitalizing the national and local economies, and simultaneously establish business models to profit from such efforts and enhance operating efficiency and business bases. With regard to climate change, Japan's society, economy, and industries could be widely affected if the governments' efforts toward achieving a low carbon economy make significant progress at the global level. It is essential for financial institutions to be aware of developments in global discussions in order to step up their efforts to assess the impact of climate change on their existing loans' credit risk and to formulate strategies on investments and loans that are consistent with Sustainable Development Goals (SDGs), which encompass the global response toward climate change.
Actions by the Bank of Japan
The Bank of Japan will continue to make efforts to ensure the stability of the financial system and the smooth functioning of financial intermediation, which are prerequisites for achieving sustainable economic growth and price stability. In doing so, the Bank, in close cooperation with the Japanese government and overseas financial authorities, will accurately monitor and understand financial institutions' businesses, including their risk management and financial positions at micro levels, as well as fulfill its leading role on the macroprudential front.
In conducting on-site examinations and off-site monitoring, the Bank will identify and measure the impact of COVID-19 and of the changes in the economic and financial environment resulting from policy responses to COVID-19 on financial institutions' financial intermediation and investment activities, as well as future profitability, financial soundness, and foreign currency funding. The Bank will reach out to make recommendations as necessary. The Bank will place greater emphasis on examining financial institutions' resilience to downside risks to their profitability and financial soundness by using, for example, supervisory simultaneous stress testing that is based on common scenarios and conducted jointly with the FSA so as to sustainably fulfill the smooth functioning of financial intermediation. In terms of foreign currency funding, the Bank will monitor and understand Japanese banks' management framework, and will closely exchange views with the banks about managing stable foreign currency funding in cooperation with the FSA while taking account of the fact that financial institutions are becoming increasingly attentive not only to the stability of their foreign currency funding, but also to their cost control. Moreover, the Bank will proactively promote financial institutions' initiatives through close communication regarding the institutions' challenges from a relatively longer-term perspective, including cyber risk, climate-related financial risks, interest rate benchmark reform, and responses to digitalization.66
Regarding the operations of on-site examination and off-site monitoring, the Bank will further enhance the efficiency and effectiveness of on-site examinations and off-site monitoring while strengthening its coordination with the FSA through the Joint Group for Coordinating FSA's Inspections and BOJ's On-Site Examinations, which was established by the two entities in December 2020. Specifically, in addition to regularly sharing their awareness, enhancing joint surveys with the FSA regarding important issues, coordinating the planning of the FSA's inspections and the Bank's on-site examinations, and sharing the findings of inspections and examinations, these two entities will streamline the framework used for financial institutions' data submission. Moreover, in conducting on-site examinations, the Bank will avoid overlapping with the aforementioned joint initiatives as part of off-site monitoring, including joint surveys with the FSA. 66 For more details on the basic approach applied in conducting on-site examinations in fiscal 2021, see "On-Site Examination Policy for Fiscal 2021," March 2021.

86
In this way, it will take into account the operational burden on financial institutions while securing the thoroughness of monitoring, and will enhance the efficiency of such examinations. The Bank will resume on-site examinations in fiscal 2021, and in doing so will make active use of remote methods such as web and telephone conferencing. Once resumed, the Bank will assess whether it is appropriate to conduct examinations, mainly in light of COVID-19 trends and examinee institutions' operational burden, and will give the utmost consideration to the situation faced by these institutions by, for example, adjusting schedules as necessary.
The Bank will conduct financial system research by strengthening its analysis from a macroprudential perspective. At the same time, it will make improvements in stress testing and further refine the model for credit risk assessment by utilizing granular data, in collaboration with the FSA and financial institutions. Moreover, the Bank will enhance its framework for monitoring developments in global financial markets and global financial systems by coordinating with overseas central banks and other organizations and participating in international meetings. As for climate-related financial risks in particular, the Bank will make efforts to extend its knowledge of the methods used to measure these risks, such as stress testing, and intensify its research while keeping up with the efforts made by financial authorities of various countries and financial institutions. It will also contribute to discussions on international financial regulations, including those regarding the smooth implementation of the Basel III framework and its impact assessment. With respect to measures related to transaction activities, the Bank will appropriately take the measures necessary to ensure the stability of the financial system, including facilitating the strengthening of business foundations of regional financial institutions through the Special Deposit Facility to Enhance the Resilience of the Regional Financial System, as well as carrying out its lender-of-last-resort function when deemed appropriate. The Bank will hold seminars for financial institutions and support their efforts to put in place more sophisticated financial services and risk management and to improve profitability through, for example, the reengineering of governance, efforts related to SDGs and Environmental, Social, and Governance (ESG) factors, digitalization, customer-oriented management, and the revitalization of clients and the region.
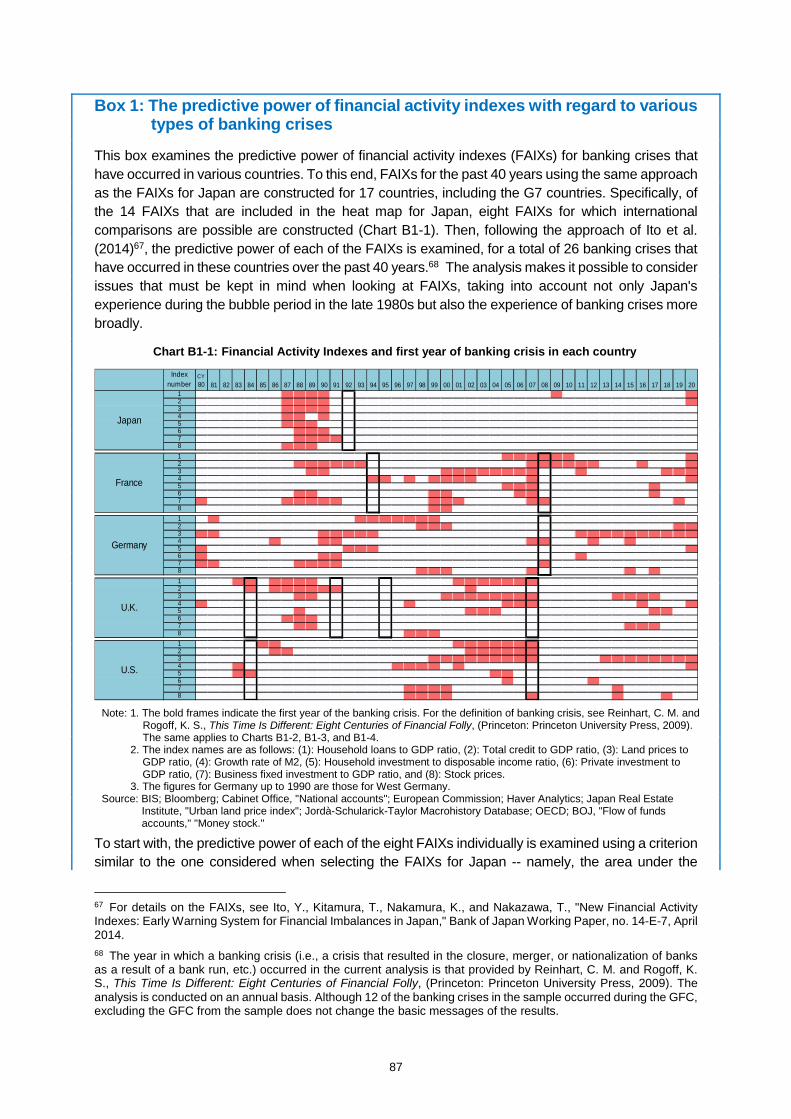
87
Box 1: The predictive power of financial activity indexes with regard to various types of banking crises
This box examines the predictive power of financial activity indexes (FAIXs) for banking crises that have occurred in various countries. To this end, FAIXs for the past 40 years using the same approach as the FAIXs for Japan are constructed for 17 countries, including the G7 countries. Specifically, of the 14 FAIXs that are included in the heat map for Japan, eight FAIXs for which international comparisons are possible are constructed (Chart B1-1). Then, following the approach of Ito et al. (2014)67, the predictive power of each of the FAIXs is examined, for a total of 26 banking crises that have occurred in these countries over the past 40 years.68 The analysis makes it possible to consider issues that must be kept in mind when looking at FAIXs, taking into account not only Japan's experience during the bubble period in the late 1980s but also the experience of banking crises more broadly.
To start with, the predictive power of each of the eight FAIXs individually is examined using a criterion similar to the one considered when selecting the FAIXs for Japan -- namely, the area under the
67 For details on the FAIXs, see Ito, Y., Kitamura, T., Nakamura, K., and Nakazawa, T., "New Financial Activity Indexes: Early Warning System for Financial Imbalances in Japan," Bank of Japan Working Paper, no. 14-E-7, April 2014. 68 The year in which a banking crisis (i.e., a crisis that resulted in the closure, merger, or nationalization of banks as a result of a bank run, etc.) occurred in the current analysis is that provided by Reinhart, C. M. and Rogoff, K. S., This Time Is Different: Eight Centuries of Financial Folly, (Princeton: Princeton University Press, 2009). The analysis is conducted on an annual basis. Although 12 of the banking crises in the sample occurred during the GFC, excluding the GFC from the sample does not change the basic messages of the results.
Chart B1-1: Financial Activity Indexes and first year of banking crisis in each country
Indexnumber
CY80 81 82 83 84 85 86 87 88 89 90 91 92 93 94 95 96 97 98 99 00 01 02 03 04 05 06 07 08 09 10 11 12 13 14 15 16 17 18 19 20
1234567812345678123456781234567812345678
U.K.
U.S.
Japan
France
Germany
Note: 1. The bold frames indicate the first year of the banking crisis. For the definition of banking crisis, see Reinhart, C. M. and Rogoff, K. S., This Time Is Different: Eight Centuries of Financial Folly, (Princeton: Princeton University Press, 2009). The same applies to Charts B1-2, B1-3, and B1-4.
2. The index names are as follows: (1): Household loans to GDP ratio, (2): Total credit to GDP ratio, (3): Land prices to GDP ratio, (4): Growth rate of M2, (5): Household investment to disposable income ratio, (6): Private investment to GDP ratio, (7): Business fixed investment to GDP ratio, and (8): Stock prices.
3. The figures for Germany up to 1990 are those for West Germany. Source: BIS; Bloomberg; Cabinet Office, "National accounts"; European Commission; Haver Analytics; Japan Real Estate
Institute, "Urban land price index"; Jordà-Schularick-Taylor Macrohistory Database; OECD; BOJ, "Flow of funds accounts," "Money stock."
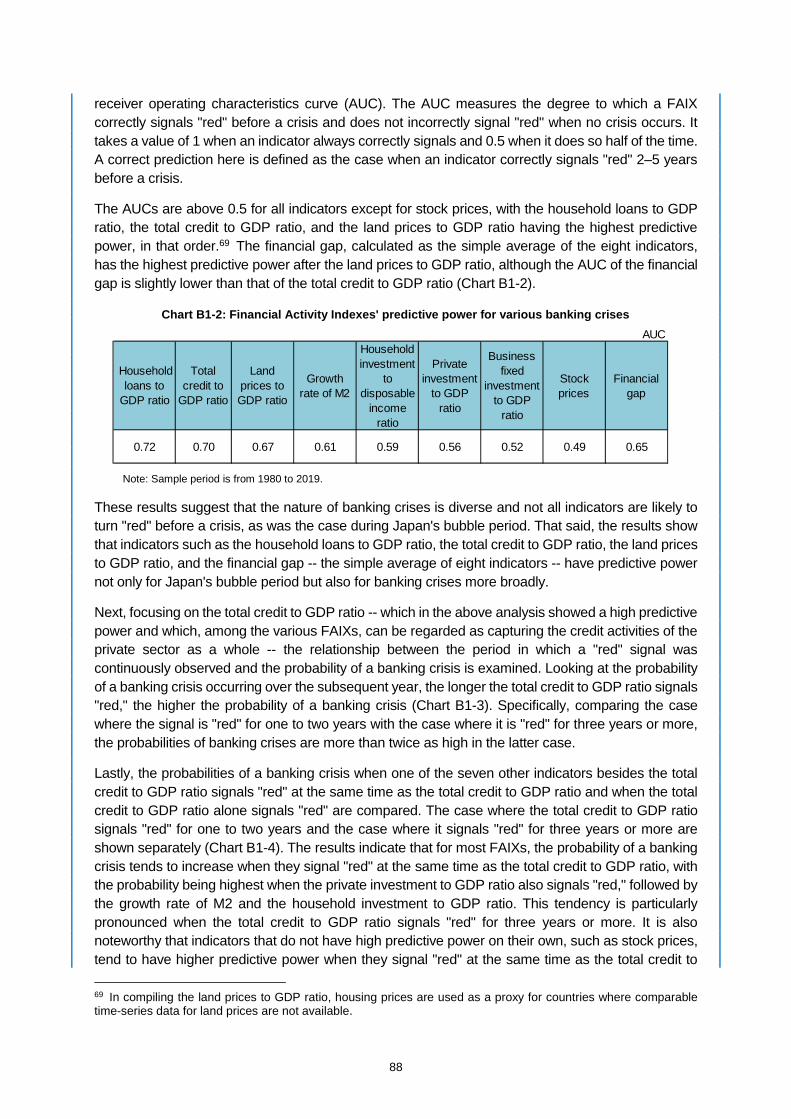
88
receiver operating characteristics curve (AUC). The AUC measures the degree to which a FAIX correctly signals "red" before a crisis and does not incorrectly signal "red" when no crisis occurs. It takes a value of 1 when an indicator always correctly signals and 0.5 when it does so half of the time. A correct prediction here is defined as the case when an indicator correctly signals "red" 2–5 years before a crisis.
The AUCs are above 0.5 for all indicators except for stock prices, with the household loans to GDP ratio, the total credit to GDP ratio, and the land prices to GDP ratio having the highest predictive power, in that order.69 The financial gap, calculated as the simple average of the eight indicators, has the highest predictive power after the land prices to GDP ratio, although the AUC of the financial gap is slightly lower than that of the total credit to GDP ratio (Chart B1-2).
These results suggest that the nature of banking crises is diverse and not all indicators are likely to turn "red" before a crisis, as was the case during Japan's bubble period. That said, the results show that indicators such as the household loans to GDP ratio, the total credit to GDP ratio, the land prices to GDP ratio, and the financial gap -- the simple average of eight indicators -- have predictive power not only for Japan's bubble period but also for banking crises more broadly.
Next, focusing on the total credit to GDP ratio -- which in the above analysis showed a high predictive power and which, among the various FAIXs, can be regarded as capturing the credit activities of the private sector as a whole -- the relationship between the period in which a "red" signal was continuously observed and the probability of a banking crisis is examined. Looking at the probability of a banking crisis occurring over the subsequent year, the longer the total credit to GDP ratio signals "red," the higher the probability of a banking crisis (Chart B1-3). Specifically, comparing the case where the signal is "red" for one to two years with the case where it is "red" for three years or more, the probabilities of banking crises are more than twice as high in the latter case.
Lastly, the probabilities of a banking crisis when one of the seven other indicators besides the total credit to GDP ratio signals "red" at the same time as the total credit to GDP ratio and when the total credit to GDP ratio alone signals "red" are compared. The case where the total credit to GDP ratio signals "red" for one to two years and the case where it signals "red" for three years or more are shown separately (Chart B1-4). The results indicate that for most FAIXs, the probability of a banking crisis tends to increase when they signal "red" at the same time as the total credit to GDP ratio, with the probability being highest when the private investment to GDP ratio also signals "red," followed by the growth rate of M2 and the household investment to GDP ratio. This tendency is particularly pronounced when the total credit to GDP ratio signals "red" for three years or more. It is also noteworthy that indicators that do not have high predictive power on their own, such as stock prices, tend to have higher predictive power when they signal "red" at the same time as the total credit to 69 In compiling the land prices to GDP ratio, housing prices are used as a proxy for countries where comparable time-series data for land prices are not available.
Chart B1-2: Financial Activity Indexes' predictive power for various banking crises
Note: Sample period is from 1980 to 2019.
AUC
Householdloans to
GDP ratio
Totalcredit to
GDP ratio
Landprices toGDP ratio
Growthrate of M2
Householdinvestment
todisposable
incomeratio
Privateinvestment
to GDPratio
Businessfixed
investmentto GDP
ratio
Stockprices
Financialgap
0.72 0.70 0.67 0.61 0.59 0.56 0.52 0.49 0.65
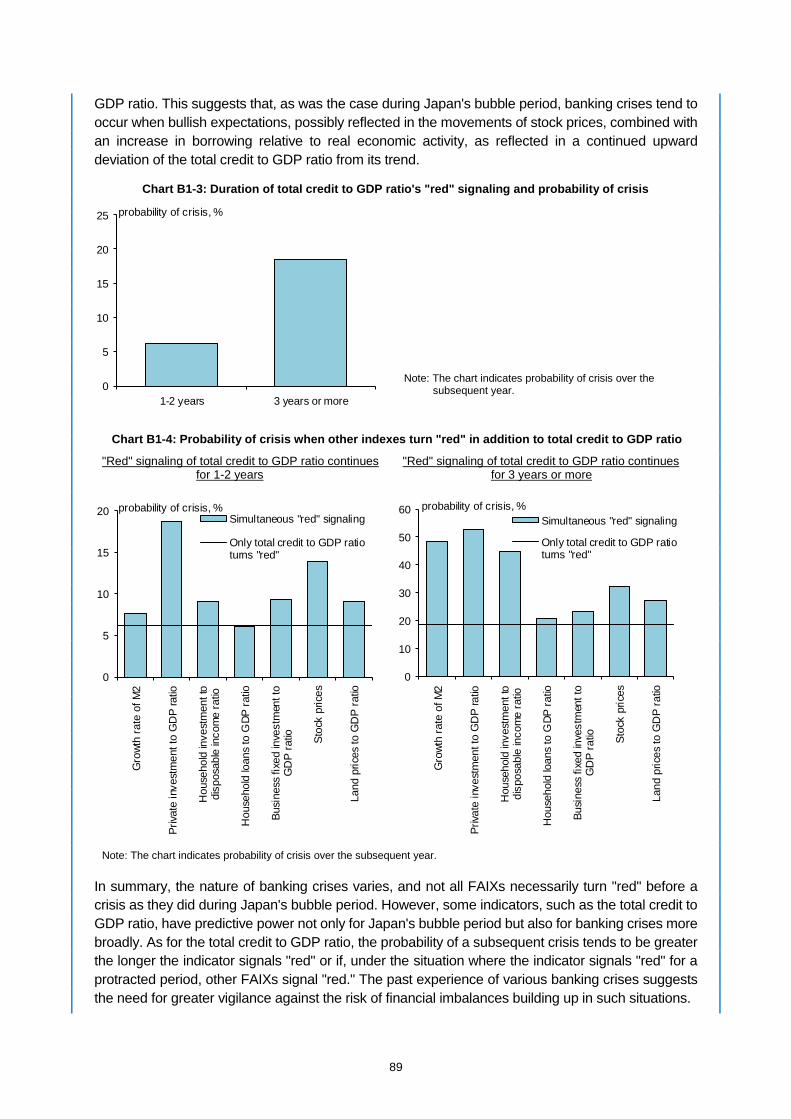
89
GDP ratio. This suggests that, as was the case during Japan's bubble period, banking crises tend to occur when bullish expectations, possibly reflected in the movements of stock prices, combined with an increase in borrowing relative to real economic activity, as reflected in a continued upward deviation of the total credit to GDP ratio from its trend.
In summary, the nature of banking crises varies, and not all FAIXs necessarily turn "red" before a crisis as they did during Japan's bubble period. However, some indicators, such as the total credit to GDP ratio, have predictive power not only for Japan's bubble period but also for banking crises more broadly. As for the total credit to GDP ratio, the probability of a subsequent crisis tends to be greater the longer the indicator signals "red" or if, under the situation where the indicator signals "red" for a protracted period, other FAIXs signal "red." The past experience of various banking crises suggests the need for greater vigilance against the risk of financial imbalances building up in such situations.
Chart B1-3: Duration of total credit to GDP ratio's "red" signaling and probability of crisis
Note: The chart indicates probability of crisis over the subsequent year. 0
5
10
15
20
25
1-2 years 3 years or more
probability of crisis, %
Chart B1-4: Probability of crisis when other indexes turn "red" in addition to total credit to GDP ratio
"Red" signaling of total credit to GDP ratio continues "Red" signaling of total credit to GDP ratio continues for 1-2 years for 3 years or more
Note: The chart indicates probability of crisis over the subsequent year.
0
10
20
30
40
50
60
Gro
wth
rate
of M
2
Priva
te in
vest
men
t to
GD
P ra
tio
Hou
seho
ld in
vest
men
t to
disp
osab
le in
com
e ra
tio
Hou
seho
ld lo
ans
to G
DP ra
tio
Busi
ness
fixe
d in
vest
men
t to
GD
P ra
tio Stoc
k pr
ices
Land
pric
es to
GD
P ra
tio
Simultaneous "red" signaling
Only total credit to GDP ratioturns "red"
probability of crisis, %
0
5
10
15
20
Gro
wth
rate
of M
2
Priva
te in
vest
men
t to
GD
P ra
tio
Hou
seho
ld in
vest
men
t to
disp
osab
le in
com
e ra
tio
Hou
seho
ld lo
ans
to G
DP ra
tio
Busi
ness
fixe
d in
vest
men
t to
GD
P ra
tio Stoc
k pr
ices
Land
pric
es to
GD
P ra
tio
Simultaneous "red" signaling
Only total credit to GDP ratioturns "red"
probability of crisis, %

90
Among the eight indicators, the household loans to GDP ratio has the highest figure for AUC, meaning that it has the highest predictive power for banking crises that have occurred in the past 40 years. Some studies have shown that financial crises triggered by high growth in lending to households are followed by extremely slow economic recoveries.70 In Japan, the default rate on loans to households such as housing loans has been low for a long time, and discussions on financial institutions' credit risk have been focusing mainly on corporate loans. It should be noted, however, that the share of household loans in financial institutions' lending has been increasing, and this trend in the composition of lending has been slowly but steadily changing the risk profiles of financial institutions (Chart B1-5).
70 For details, see Jordà, Ò., Schularick, M., and Taylor, A. M., "The Great Mortgaging: Housing Finance, Crises, and Business Cycles," NBER Working Paper Series, no. 20501, September 2014.
Chart B1-5: Household loans to total credit ratio
Note: 4-quarter backward moving averages. Latest data as at the October-December quarter of 2020.
Source: BOJ, "Flow of funds accounts." 10
20
30
40
80 83 86 89 92 95 98 01 04 07 10 13 16 19
%
CY
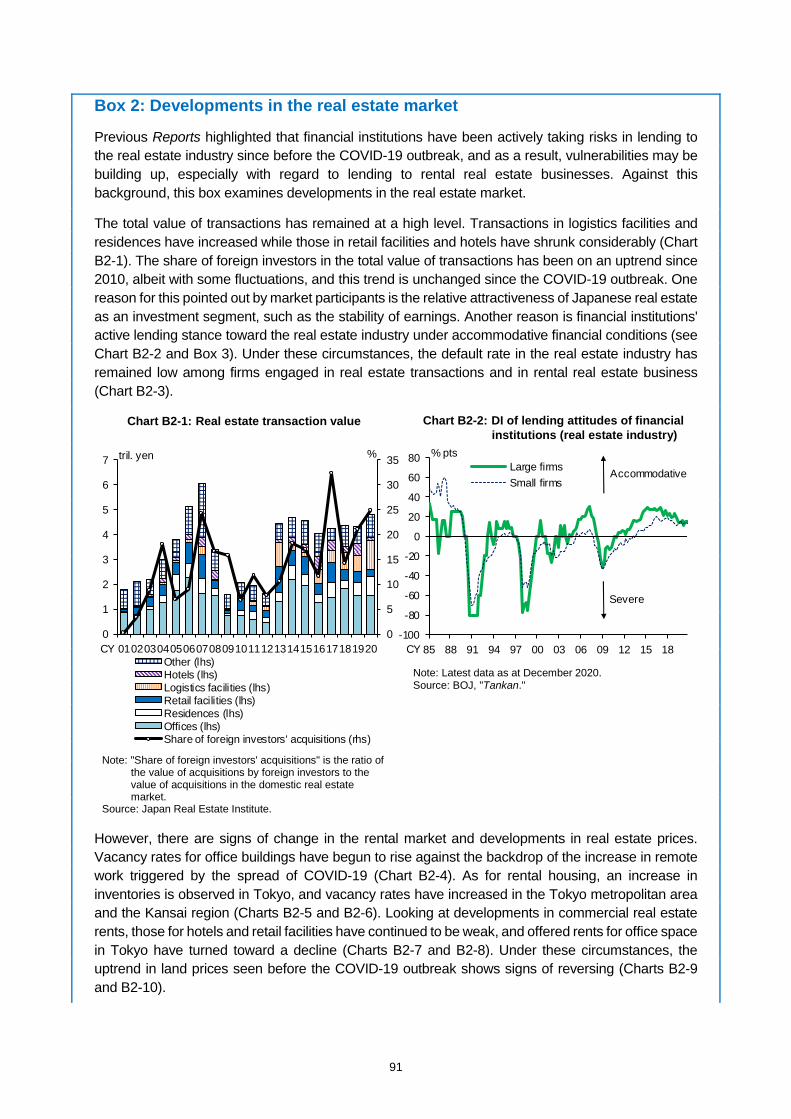
91
Box 2: Developments in the real estate market
Previous Reports highlighted that financial institutions have been actively taking risks in lending to the real estate industry since before the COVID-19 outbreak, and as a result, vulnerabilities may be building up, especially with regard to lending to rental real estate businesses. Against this background, this box examines developments in the real estate market.
The total value of transactions has remained at a high level. Transactions in logistics facilities and residences have increased while those in retail facilities and hotels have shrunk considerably (Chart B2-1). The share of foreign investors in the total value of transactions has been on an uptrend since 2010, albeit with some fluctuations, and this trend is unchanged since the COVID-19 outbreak. One reason for this pointed out by market participants is the relative attractiveness of Japanese real estate as an investment segment, such as the stability of earnings. Another reason is financial institutions' active lending stance toward the real estate industry under accommodative financial conditions (see Chart B2-2 and Box 3). Under these circumstances, the default rate in the real estate industry has remained low among firms engaged in real estate transactions and in rental real estate business (Chart B2-3).
However, there are signs of change in the rental market and developments in real estate prices. Vacancy rates for office buildings have begun to rise against the backdrop of the increase in remote work triggered by the spread of COVID-19 (Chart B2-4). As for rental housing, an increase in inventories is observed in Tokyo, and vacancy rates have increased in the Tokyo metropolitan area and the Kansai region (Charts B2-5 and B2-6). Looking at developments in commercial real estate rents, those for hotels and retail facilities have continued to be weak, and offered rents for office space in Tokyo have turned toward a decline (Charts B2-7 and B2-8). Under these circumstances, the uptrend in land prices seen before the COVID-19 outbreak shows signs of reversing (Charts B2-9 and B2-10).
0
5
10
15
20
25
30
35
0
1
2
3
4
5
6
7
0102030405060708091011121314151617181920Other (lhs)Hotels (lhs)Logistics facilities (lhs)Retail facilities (lhs)Residences (lhs)Offices (lhs)Share of foreign investors' acquisitions (rhs)
tril. yen
CY
%
Chart B2-1: Real estate transaction value
Note: "Share of foreign investors' acquisitions" is the ratio of the value of acquisitions by foreign investors to the value of acquisitions in the domestic real estate market.
Source: Japan Real Estate Institute.
Chart B2-2: DI of lending attitudes of financial institutions (real estate industry)
Note: Latest data as at December 2020. Source: BOJ, "Tankan."
-100
-80
-60
-40
-20
0
20
40
60
80
85 88 91 94 97 00 03 06 09 12 15 18
Large firmsSmall firms
% pts
Accommodative
Severe
CY

92
The previous Report highlighted that, unlike that of other industries, the financial vulnerability of small and medium-sized rental real estate businesses has been on a trend increase, with regional financial institutions lending actively. In recent years, there had been an increase in rental housing concentrated in areas that had seen a substantial rise in the number of households due to migration to urban areas and the increase in single-person households; however, since the COVID-19 outbreak, there have been considerable changes in the demographic landscape in urban areas and other areas (Chart B2-11). Thus, the real estate industry needs to continue to be monitored closely, as the market environment and developments in default rates may change in the future if market conditions weaken further or if financial institutions change their lending stance.
Note: Latest data as at January 2021. Source: The Risk Data Bank of Japan.
Chart B2-3: Default rates for real estate industry
Note: 1. Vacancy rates for "Three major metropolitan areas" are the average among Tokyo, Osaka, and Nagoya, and those for "Local urban areas" are the average among Sapporo, Sendai, and Fukuoka.
2. Latest data as at February 2021. Source: Miki Shoji Co., Ltd.
Chart B2-4: Vacancy rates for office buildings
0
2
4
6
8
10
12
14
16
18
06 08 10 12 14 16 18 20
Three majormetropolitan areasLocal urban areas
Tokyo
%
CY0
1
2
3
4
5
6
06 08 10 12 14 16 18 20
Rental real estate businessReal estate transactions
CY
%
Chart B2-5: Inventories of rental housing in Tokyo metropolitan area
Chart B2-6: Vacancy rates for rental housing
Note: 1. The chart indicates the number of inventories registered on the REINS system.
2. Latest data as at February 2021. Source: Real Estate Information Network For East Japan.
Note: 1. The vacancy rates are calculated using the questionnaire value of occupancy rates for rental housing managed by real estate management companies.
2. Values are as at the first half of each fiscal year. Latest data as at the first half of fiscal 2020.
Source: Japan Property Management Association.
0
50
100
150
200
250
07 08 09 10 11 12 13 14 15 16 17 18 19 20 21
TokyoSaitama, Chiba, and Kanagawa
seasonally adjusted, thousands
CY0
2
4
6
8
10
12
14
09 10 11 12 13 14 15 16 17 18 19 20
Tokyo metropolitan areaKansai regionOther areas
%
FY
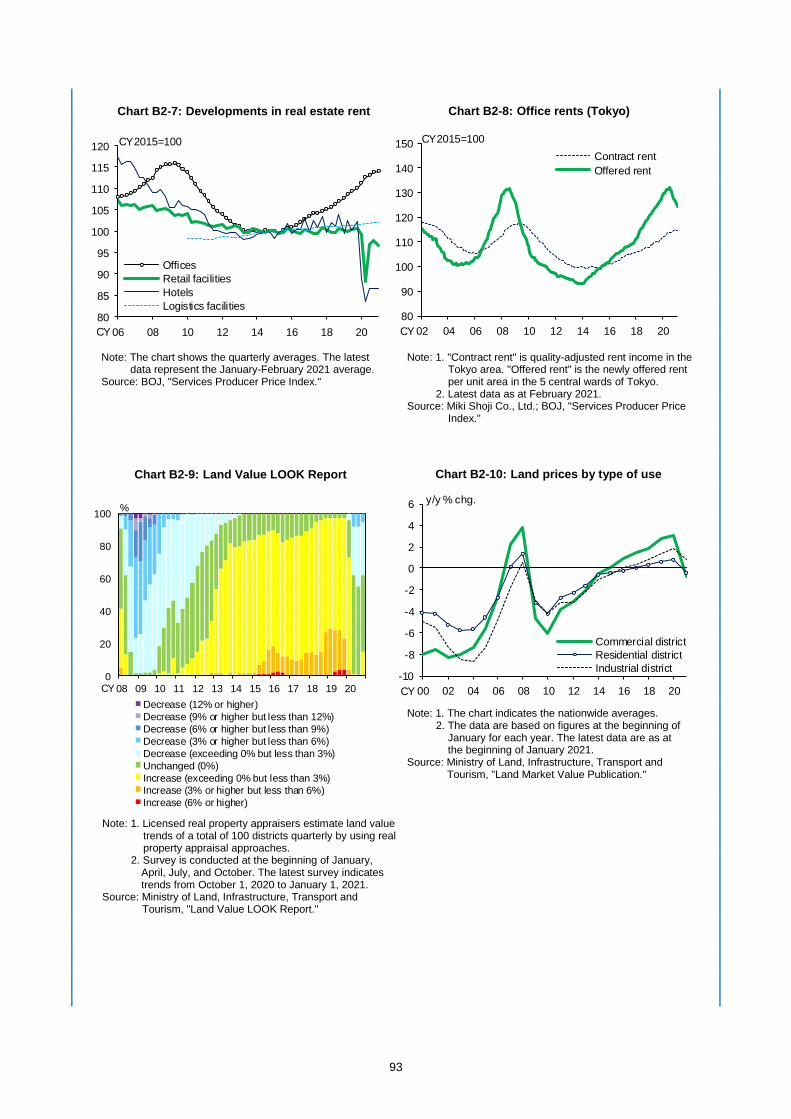
93
Note: The chart shows the quarterly averages. The latest data represent the January-February 2021 average.
Source: BOJ, "Services Producer Price Index."
Chart B2-7: Developments in real estate rent
Note: 1. "Contract rent" is quality-adjusted rent income in the Tokyo area. "Offered rent" is the newly offered rent per unit area in the 5 central wards of Tokyo.
2. Latest data as at February 2021. Source: Miki Shoji Co., Ltd.; BOJ, "Services Producer Price
Index."
Chart B2-8: Office rents (Tokyo)
80
90
100
110
120
130
140
150
02 04 06 08 10 12 14 16 18 20
Contract rentOffered rent
CY2015=100
CY80
85
90
95
100
105
110
115
120
06 08 10 12 14 16 18 20
OfficesRetail facilitiesHotelsLogistics facilities
CY2015=100
CY
Chart B2-9: Land Value LOOK Report
Note: 1. The chart indicates the nationwide averages. 2. The data are based on figures at the beginning of
January for each year. The latest data are as at the beginning of January 2021.
Source: Ministry of Land, Infrastructure, Transport and Tourism, "Land Market Value Publication."
Chart B2-10: Land prices by type of use
Note: 1. Licensed real property appraisers estimate land value trends of a total of 100 districts quarterly by using real property appraisal approaches.
2. Survey is conducted at the beginning of January, April, July, and October. The latest survey indicates trends from October 1, 2020 to January 1, 2021.
Source: Ministry of Land, Infrastructure, Transport and Tourism, "Land Value LOOK Report."
-10
-8
-6
-4
-2
0
2
4
6
00 02 04 06 08 10 12 14 16 18 20
Commercial districtResidential districtIndustrial district
CY
y/y % chg.
0
20
40
60
80
100
08 09 10 11 12 13 14 15 16 17 18 19 20Decrease (12% or higher)Decrease (9% or higher but less than 12%)Decrease (6% or higher but less than 9%)Decrease (3% or higher but less than 6%)Decrease (exceeding 0% but less than 3%)Unchanged (0%)Increase (exceeding 0% but less than 3%)Increase (3% or higher but less than 6%)Increase (6% or higher)
CY
%
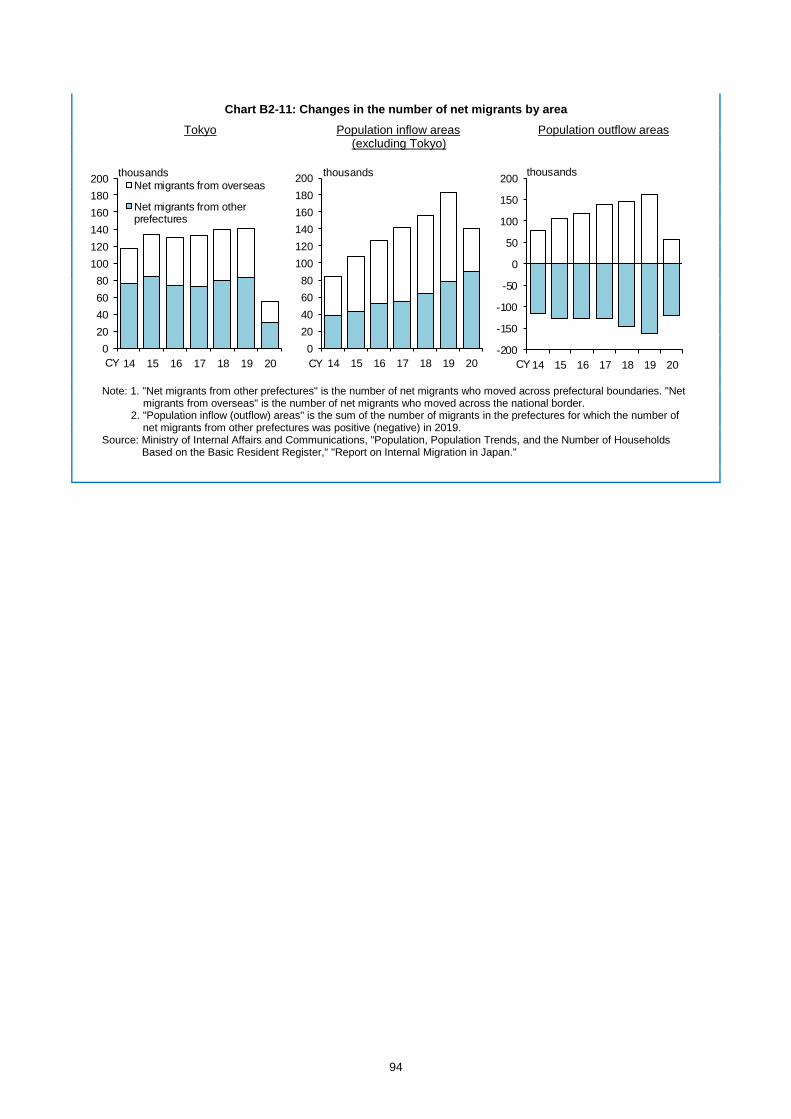
94
Chart B2-11: Changes in the number of net migrants by area
Tokyo Population inflow areas Population outflow areas (excluding Tokyo)
Note: 1. "Net migrants from other prefectures" is the number of net migrants who moved across prefectural boundaries. "Net migrants from overseas" is the number of net migrants who moved across the national border.
2. "Population inflow (outflow) areas" is the sum of the number of migrants in the prefectures for which the number of net migrants from other prefectures was positive (negative) in 2019.
Source: Ministry of Internal Affairs and Communications, "Population, Population Trends, and the Number of Households Based on the Basic Resident Register," "Report on Internal Migration in Japan."
020406080
100120140160180200
14 15 16 17 18 19 20
Net migrants from overseas
Net migrants from otherprefectures
thousands
CY0
20406080
100120140160180200
14 15 16 17 18 19 20
thousands
CY-200
-150
-100
-50
0
50
100
150
200
14 15 16 17 18 19 20
thousands
CY

95
Box 3: Impact of foreign investors in the commercial real estate market
While real estate rents in certain segments have shown signs of weakening since the outbreak of COVID-19, the total value of commercial real estate transactions has continued to increase, driven by the growing share of foreign investors (Charts B2-1, B2-7, and B2-8). This box examines the factors that explain the recent trends in investments by foreign investors as well as the impact of such trends on commercial real estate prices.
The result of the regression that examines the total value of real estate property acquisitions by foreign investors shows that variables such as the global business conditions, interest rates in the United States, yield differences between Japan and the United States, and differences in the degree of uncertainty between Japan and the United States are statistically significant (Chart B3-1). This
Chart B3-1: Estimation results for value of real estate property acquisitions by foreign investors
Note: 1. *** and * indicate statistical significance at the 1 percent and 10 percent levels, respectively. 2. Dependent variable is 1.5-year backward moving average.
Source: Bloomberg; FRB; IMF; Japan Real Estate Institute; JLL; OECD; BOJ.
Dependent variable: Value of real estate property acquisitions by foreign investors in Japan (h/h % chg.)Explanatory variables Expected signsGlobal factor
GDP growth rate of OECD countries (h/h % chg.) + 4.92 *U.S. policy rate (h/h chg.) - -0.21 ***Yield difference (Japan - U.S., h/h chg.) + 0.26 ***FX rate (U.S. dollar/yen, h/h % chg.) + 2.14 ***U.S. VIX (h/h chg.) + or - 0.06 ***
Domestic factorDI of lending attitudes of financial institutions (real estate industry) + 0.01 ***Nikkei VI (h/h chg.) - -0.04 ***
Constant -0.06 *Estimation periodAdj. R2
S.E. of regression
Coefficients
2005-20200.440.29
-3
-2
-1
0
1
2
-2 -1 0 +1 +2 +3 +4
Economic uncertainty in Japan and abroad Real estate yield differenceFX rate U.S. policy rateGlobal economy Lending attitudes of Japanese financial institutionsActual Model prediction
2020 H1
logarithm, cumulative chg.
Chart B3-2: Decomposition of value of real estate property acquisitions by foreign investors
Note: The charts indicate cumulative contributions for every half year based on the estimation results shown in Chart B3-1. "Lending attitudes of Japanese financial institutions" represents "DI of lending attitudes of financial institutions (real estate industry)," "Global economy" represents "GDP growth rate of OECD countries," and "Economic uncertainty in Japan and abroad" represents the sum of "Nikkei VI" and "U.S. VIX." Latest data for left-hand chart as at the second half of 2020.
Current phase GFC
-3
-2
-1
0
1
2
-2 -1 0 +1 +2 +3 +42008 H2
logarithm, cumulative chg.

96
finding is consistent with market participants' perception that foreign investors make investments from a global perspective and that, currently, the Japanese real estate market is a relatively attractive market segment for investment. Moreover, the finding that Japan's financial institutions' lending attitudes affect the total value of transactions is consistent with the view that foreign investors' proactive investment stance is supported by the continued accommodative lending stance of Japan's financial institutions toward the real estate sector, even after the COVID-19 outbreak. The historical decomposition using the estimation result shows that financial institutions' severe lending stance contributed to a considerable reduction of real estate property acquisitions by foreign investors during the GFC (Chart B3-2). In contrast, during the current phase, financial institutions' accommodative lending stance, the decline in U.S. interest rates, and the relative calmness in Japan's financial markets have helped to push up real estate property acquisitions by foreign investors, while the deterioration in the global economy has exerted some downward pressure.
These results suggest that foreign investors' proactive investment stance may change if the upward pressure on U.S. interest rates were to become stronger, or if the lending stance of Japanese financial institutions toward the real estate sector were to become severe.
Next, the price impact of transactions by foreign investors on Japan's commercial real estate market is examined. Specifically, using transaction-level data of large commercial real estate transactions performed by 7,500 domestic and overseas real estate investors, among approximately 24,000 transactions worth 100 million yen or more from 2002 onward, the average difference in transaction prices for domestic and overseas investors is examined. The results show that, after controlling the differences in the characteristics of individual properties, such as their location and type of use, the prices paid by foreign investors tended to be more than 10 percent higher than those paid by domestic investors (Chart B3-3).
These results are consistent with those of preceding studies for other countries showing that foreign investors tend to pay a larger risk premium than domestic investors when acquiring real estate.71 71 The pattern that foreign investors tend to pay more than domestic investors is reported, for example, in the following study: Committee on the Global Financial System, "Property price dynamics: domestic and international drivers," CGFS Papers, no. 64, February 2020.
Chart B3-3: Estimation results for real estate transaction price
Outline of database Estimation results
Note: 1. Estimation samples contain all the characteristics required for estimation at December 2020.
2. *** and ** indicate statistical significance at the 1 percent and 5 percent levels, respectively.
3. Estimated by the BOJ. Source: BOJ calculations based on "Nikkei real estate
market information DEAL SEARCH."
Explanatory variables
0.13 ***Property quality
Age -0.04 ***Age2 0.00 ***Total floor area (logarithm) 0.74 ***Number of aboveground floors 0.01 ***Number of basement floors 0.12 ***SRC-structure dummy 0.12 ***
Constant 0.27 **
Estimation periodAdj. R2
Sample size 9,539
Dependent variable:Real estate transaction price (logarithm)
Foreign-buyer dummy
Dummy variables for location, use, andtransaction year
Coefficients
Yes
2002-20200.78
Eligibletransaction
Real estate investment worth 100 millionyen or more
Start year 2002
Characteristics Location, use, area,seller's and buyer's name, etc.
Sample size Approx. 24,000 cases
Estimationsample size
9,539 cases (Approx. 7,500 sellers and buyers)

97
The findings suggest that, if foreign investors' investment in Japan's real estate market were to decrease, this could exert a certain amount of downward pressure on commercial real estate transaction prices, especially in the case of large-scale transactions.

98
Box 4: The structure of project finance loans and recovery rates
This box provides an overview of the basic structure of project finance loans and presents the results of a quantitative analysis of the recovery rate taking the characteristics of project finance loans into account. A project finance loan is a loan structure for providing funds to a SPV that specializes in the operation of a specific, predetermined project such as resource extraction or the construction and operation of transportation infrastructure and power plants (Chart B4-1).
When examining the credit risk of project finance loans, given the risk characteristics described in the main text, it is necessary to take into account the profitability of the project, its financial conditions and cash flows, and the effects of the various credit enhancements provided by the sponsor(s). This box quantitatively examines the impact of these factors on the recovery rate using data on approximately 5,500 infrastructure, power, and oil and gas projects arranged between 2000 and 2018. The data consist of projects' attributes, the default status, and the recovery rate. Of about 5,500 projects, 97 ended in default.
When estimating the impact of variables representing the financial conditions of a project -- e.g., the leverage -- on the recovery rate, using only defaulted projects would imply selecting projects that were financially weak or that were implemented during difficult macroeconomic conditions. Consequently, this may lead to biased estimation results. In order to correct for such potential biases, a two-step (Heckit model) estimation is employed. In the first step, a probit model on the determinants of whether a project defaulted or not is estimated, using data on all projects arranged during the observation period. In the second step, the Inverse Mills ratio calculated from the parameters of the first step is used to correct for biases in the data, and a Tobit model for the recovery rate using only projects that defaulted is estimated.
The estimation results show that, in both the first and second steps, the coefficients have the expected signs and most of the coefficients are statistically significant. The results of the first-step estimation suggest that whether a project defaults depends on market conditions such as GDP growth and crude oil prices during the project period. The second-step results suggest that the recovery rate is affected by the project's financial conditions and cash flows, such as the leverage ratio and the ratio of
Chart B4-1: Standard scheme of project finance
Note: "EPC contractors" and "O&M contractors" are entities involved in the start-up and maintenance of projects, respectively. "Off-takers" are entities that purchase goods and services produced by the project company.
Parentcompanies
Project company(SPV)
Non-recourse loans, etc. Equities
Off-takers(Some may serve
as sponsors)
EPC contractorsO&M contractors
Fuel supply companies(Some may serve as sponsors)
Primary market
Secondary market
Syndicate group(Japanese banks, etc.)
Other financial institutionsSell a portion of loans(Typically term loans)
Sponsors
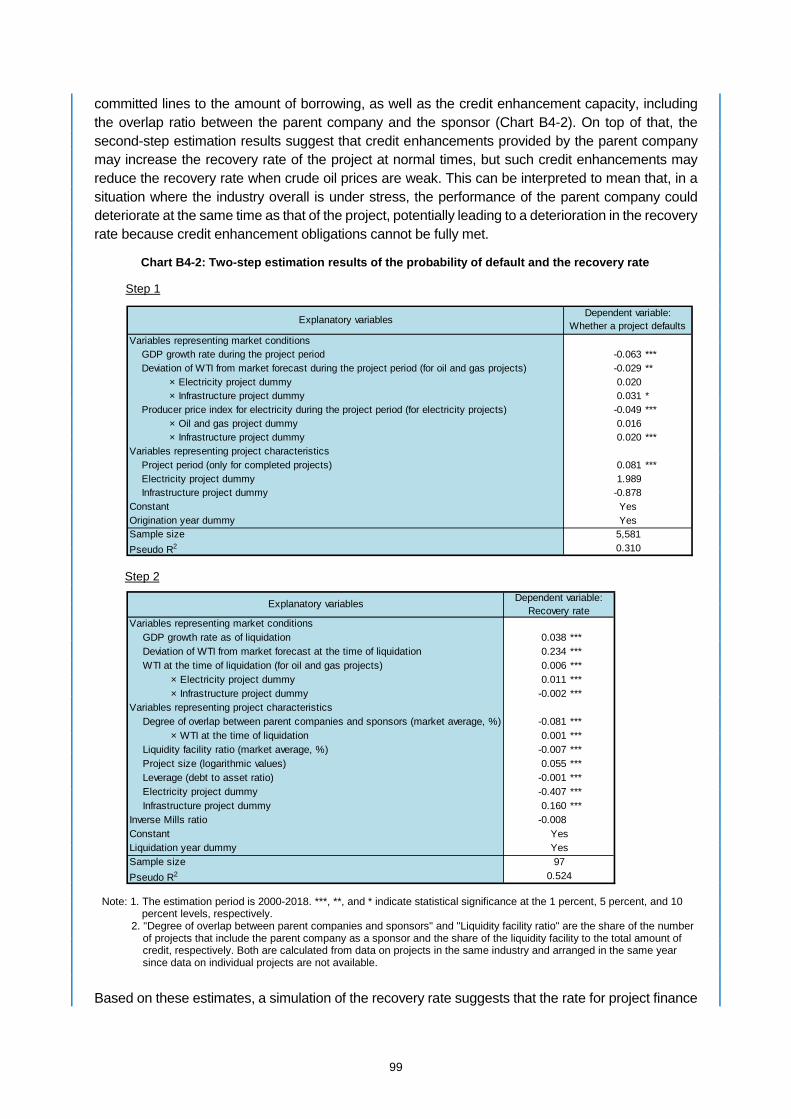
99
committed lines to the amount of borrowing, as well as the credit enhancement capacity, including the overlap ratio between the parent company and the sponsor (Chart B4-2). On top of that, the second-step estimation results suggest that credit enhancements provided by the parent company may increase the recovery rate of the project at normal times, but such credit enhancements may reduce the recovery rate when crude oil prices are weak. This can be interpreted to mean that, in a situation where the industry overall is under stress, the performance of the parent company could deteriorate at the same time as that of the project, potentially leading to a deterioration in the recovery rate because credit enhancement obligations cannot be fully met.
Based on these estimates, a simulation of the recovery rate suggests that the rate for project finance
Chart B4-2: Two-step estimation results of the probability of default and the recovery rate
Step 1
Variables representing market conditionsGDP growth rate during the project period -0.063 ***Deviation of WTI from market forecast during the project period (for oil and gas projects) -0.029 **
× Electricity project dummy 0.020× Infrastructure project dummy 0.031 *
Producer price index for electricity during the project period (for electricity projects) -0.049 ***× Oil and gas project dummy 0.016× Infrastructure project dummy 0.020 ***
Variables representing project characteristicsProject period (only for completed projects) 0.081 ***Electricity project dummy 1.989Infrastructure project dummy -0.878
ConstantOrigination year dummySample sizePseudo R2 0.310
Explanatory variablesDependent variable:
Whether a project defaults
Yes5,581
Yes
Step 2
Note: 1. The estimation period is 2000-2018. ***, **, and * indicate statistical significance at the 1 percent, 5 percent, and 10 percent levels, respectively.
2. "Degree of overlap between parent companies and sponsors" and "Liquidity facility ratio" are the share of the number of projects that include the parent company as a sponsor and the share of the liquidity facility to the total amount of credit, respectively. Both are calculated from data on projects in the same industry and arranged in the same year since data on individual projects are not available.
Variables representing market conditionsGDP growth rate as of liquidation 0.038 ***Deviation of WTI from market forecast at the time of liquidation 0.234 ***WTI at the time of liquidation (for oil and gas projects) 0.006 ***
× Electricity project dummy 0.011 ***× Infrastructure project dummy -0.002 ***
Variables representing project characteristicsDegree of overlap between parent companies and sponsors (market average, %) -0.081 ***
× WTI at the time of liquidation 0.001 ***Liquidity facility ratio (market average, %) -0.007 ***Project size (logarithmic values) 0.055 ***Leverage (debt to asset ratio) -0.001 ***Electricity project dummy -0.407 ***Infrastructure project dummy 0.160 ***
Inverse Mills ratio -0.008ConstantLiquidation year dummySample sizePseudo R2 0.524
Explanatory variables Dependent variable:Recovery rate
Yes97
Yes
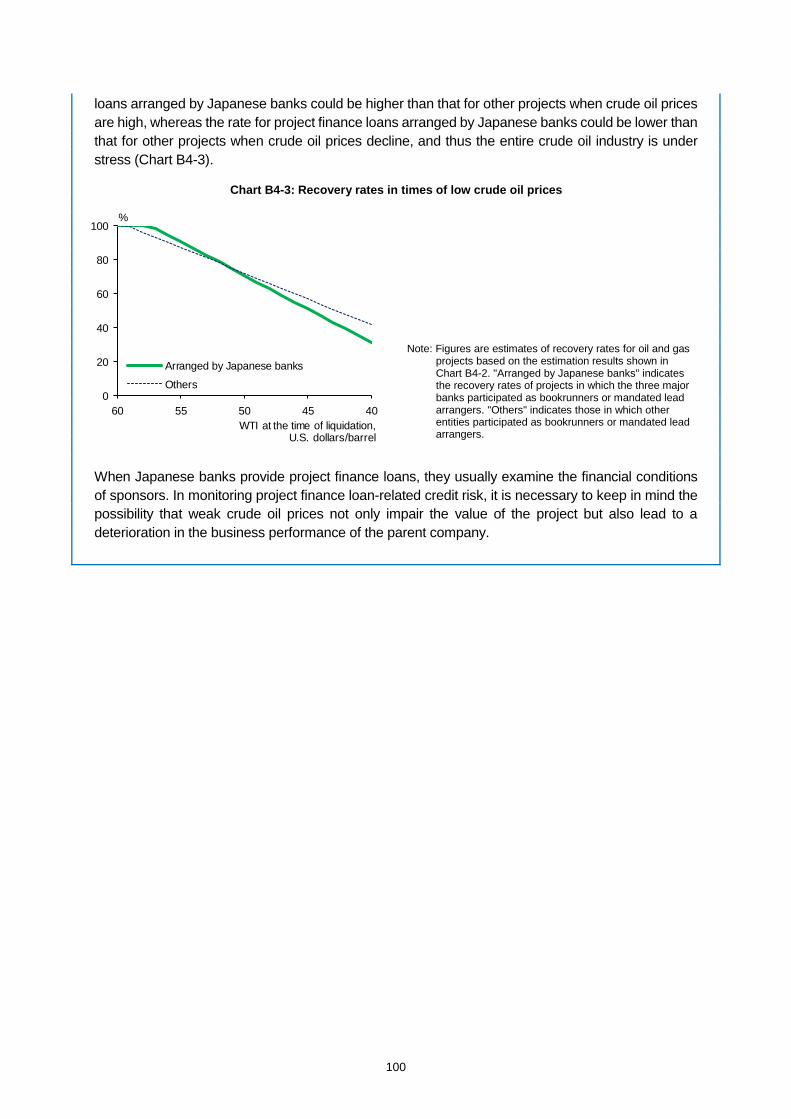
100
loans arranged by Japanese banks could be higher than that for other projects when crude oil prices are high, whereas the rate for project finance loans arranged by Japanese banks could be lower than that for other projects when crude oil prices decline, and thus the entire crude oil industry is under stress (Chart B4-3).
When Japanese banks provide project finance loans, they usually examine the financial conditions of sponsors. In monitoring project finance loan-related credit risk, it is necessary to keep in mind the possibility that weak crude oil prices not only impair the value of the project but also lead to a deterioration in the business performance of the parent company.
Chart B4-3: Recovery rates in times of low crude oil prices
Note: Figures are estimates of recovery rates for oil and gas projects based on the estimation results shown in Chart B4-2. "Arranged by Japanese banks" indicates the recovery rates of projects in which the three major banks participated as bookrunners or mandated lead arrangers. "Others" indicates those in which other entities participated as bookrunners or mandated lead arrangers.
0
20
40
60
80
100
60 55 50 45 40
Arranged by Japanese banks
Others
%
WTI at the time of liquidation,U.S. dollars/barrel

101
Box 5: Global structural changes in the transmission channels of market shocks
Strengthened interlinkage between the domestic and foreign financial systems
Since the GFC, the importance of the NBFIs (investment funds such as investment trusts; pension funds and insurance companies) -- especially of investment funds -- in global financial intermediation activities has been growing (Chart IV-3-6). This box examines the implications of these changes for the stability of Japan's financial system.
As seen in Section B of Chapter III, the size of the NBFIs in Japan's financial system in terms of financial assets is smaller than that in other advanced economies. However, looking at the financial interconnectedness between entities suggests that in Japan, too, there are some characteristics that warrant attention.
Using flow of funds statistics in each country to estimate the structure of cash flow through various types of assets (loans, debt securities, stocks, and beneficial interest in trusts), the financial interconnectedness between entities could be presented as the following networks (Chart B5-1).72
The estimated networks show that, while the cash flow from "banks, etc." to "other domestic sectors" continues to be large in all countries, there are differences in the way "NBFIs" and other sectors are linked. In Japan, the flow from "banks, etc." to "NBFIs" has strengthened in recent years, reflecting the increase in investment trust holdings by financial institutions, while the importance of "NBFIs" as a source of supplying funds to "other domestic sectors," which includes the nonfinancial sector, is
72 Although there has been progress in the compilation of data on from-whom-to-whom relationships in the flow of funds statistics of various countries, there are still many missing values at the level of granularity of this analysis (interconnectedness among 11 entities). Therefore, the analysis here uses a method called the "maximum entropy method" to estimate such missing values. In the maximum entropy method, the probability distribution is determined such that it does not contain more information than the specified preconditions. In the analysis here, missing values are regarded as random variables and the distribution is set so that their uncertainty (entropy) is maximized based on the available information. This method is widely used in the estimation of interconnectedness and network structures. See, for example, Castrén, O. and Kavonius, I. K., "Balance Sheet Interlinkages and Macro-Financial Risk Analysis in the Euro Area," ECB Working Paper Series, European Central Bank, no. 1124, December 2009.
NBFIs
Banks, etc.
Otherdomestic sectors
Rest of the w orld
NBFIs
Banks, etc.
Rest of the w orld
Otherdomestic sectors
NBFIs
Banks,etc.
Rest of the w orld
Otherdomestic sectors
Chart B5-1: Structural changes in interconnectedness surrounding non-banks
Japan United States Germany
Note: 1. Covers loans, debt securities, equities, and investment trust beneficiary certificates (fund shares). Estimates by the BOJ.
2. The thickness of the arrows indicates the relative amount within each country as of 2020. 3. Red arrows indicate the top four links with the highest percentage increase compared to 2010 within each country.
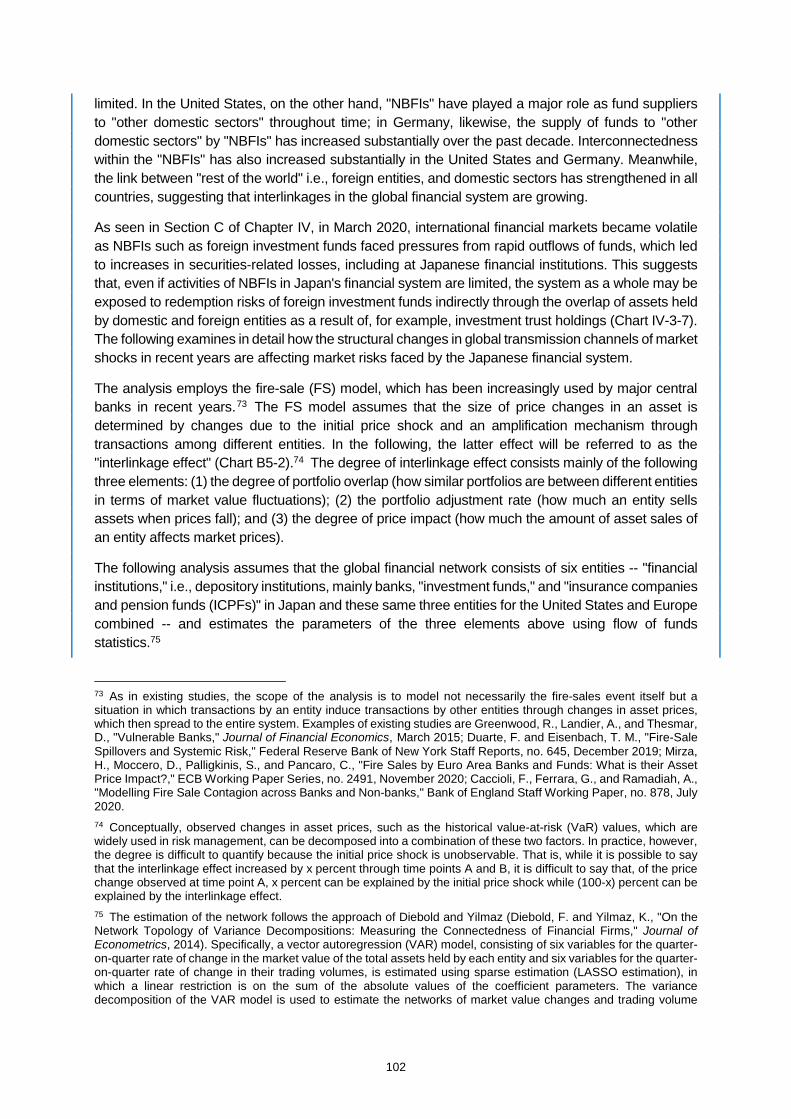
102
limited. In the United States, on the other hand, "NBFIs" have played a major role as fund suppliers to "other domestic sectors" throughout time; in Germany, likewise, the supply of funds to "other domestic sectors" by "NBFIs" has increased substantially over the past decade. Interconnectedness within the "NBFIs" has also increased substantially in the United States and Germany. Meanwhile, the link between "rest of the world" i.e., foreign entities, and domestic sectors has strengthened in all countries, suggesting that interlinkages in the global financial system are growing.
As seen in Section C of Chapter IV, in March 2020, international financial markets became volatile as NBFIs such as foreign investment funds faced pressures from rapid outflows of funds, which led to increases in securities-related losses, including at Japanese financial institutions. This suggests that, even if activities of NBFIs in Japan's financial system are limited, the system as a whole may be exposed to redemption risks of foreign investment funds indirectly through the overlap of assets held by domestic and foreign entities as a result of, for example, investment trust holdings (Chart IV-3-7). The following examines in detail how the structural changes in global transmission channels of market shocks in recent years are affecting market risks faced by the Japanese financial system.
The analysis employs the fire-sale (FS) model, which has been increasingly used by major central banks in recent years.73 The FS model assumes that the size of price changes in an asset is determined by changes due to the initial price shock and an amplification mechanism through transactions among different entities. In the following, the latter effect will be referred to as the "interlinkage effect" (Chart B5-2).74 The degree of interlinkage effect consists mainly of the following three elements: (1) the degree of portfolio overlap (how similar portfolios are between different entities in terms of market value fluctuations); (2) the portfolio adjustment rate (how much an entity sells assets when prices fall); and (3) the degree of price impact (how much the amount of asset sales of an entity affects market prices).
The following analysis assumes that the global financial network consists of six entities -- "financial institutions," i.e., depository institutions, mainly banks, "investment funds," and "insurance companies and pension funds (ICPFs)" in Japan and these same three entities for the United States and Europe combined -- and estimates the parameters of the three elements above using flow of funds statistics.75
73 As in existing studies, the scope of the analysis is to model not necessarily the fire-sales event itself but a situation in which transactions by an entity induce transactions by other entities through changes in asset prices, which then spread to the entire system. Examples of existing studies are Greenwood, R., Landier, A., and Thesmar, D., "Vulnerable Banks," Journal of Financial Economics, March 2015; Duarte, F. and Eisenbach, T. M., "Fire-Sale Spillovers and Systemic Risk," Federal Reserve Bank of New York Staff Reports, no. 645, December 2019; Mirza, H., Moccero, D., Palligkinis, S., and Pancaro, C., "Fire Sales by Euro Area Banks and Funds: What is their Asset Price Impact?," ECB Working Paper Series, no. 2491, November 2020; Caccioli, F., Ferrara, G., and Ramadiah, A., "Modelling Fire Sale Contagion across Banks and Non-banks," Bank of England Staff Working Paper, no. 878, July 2020. 74 Conceptually, observed changes in asset prices, such as the historical value-at-risk (VaR) values, which are widely used in risk management, can be decomposed into a combination of these two factors. In practice, however, the degree is difficult to quantify because the initial price shock is unobservable. That is, while it is possible to say that the interlinkage effect increased by x percent through time points A and B, it is difficult to say that, of the price change observed at time point A, x percent can be explained by the initial price shock while (100-x) percent can be explained by the interlinkage effect. 75 The estimation of the network follows the approach of Diebold and Yilmaz (Diebold, F. and Yilmaz, K., "On the Network Topology of Variance Decompositions: Measuring the Connectedness of Financial Firms," Journal of Econometrics, 2014). Specifically, a vector autoregression (VAR) model, consisting of six variables for the quarter-on-quarter rate of change in the market value of the total assets held by each entity and six variables for the quarter-on-quarter rate of change in their trading volumes, is estimated using sparse estimation (LASSO estimation), in which a linear restriction is on the sum of the absolute values of the coefficient parameters. The variance decomposition of the VAR model is used to estimate the networks of market value changes and trading volume

103
First, the degree of portfolio overlap was generally low, except for that between domestic and foreign investment funds before the GFC. Since then, however, the portfolio overlap of all three types of entities in Japan with the other types both at home and abroad has increased. The portfolio overlap of Japanese financial institutions has increased with foreign investment funds in addition to domestic ICPFs (Chart B5-3). As a result of this global increase in portfolio overlaps, the impact of price changes resulting from the sale of assets of an entity is likely to be more widespread globally.
changes of each entity. The portfolio overlap is defined as market value changes of other entities' assets, and the portfolio adjustment rate is transaction volume changes of other entities, both of which are changes observed in the case where there is a shock on the market value of a particular entity's asset holdings. The price impact is defined as market value changes of other entities' assets when there is a shock on a particular entity's transaction volume of asset holdings. The estimation period for the VAR model is from the July-September quarter of 1999 to the October-December quarter of 2019, and in order to capture changes in parameter values over time, a rolling estimation is conducted for a window of eight years.
Chart B5-2: Interlinkage effect of the price changes
Asset sales(Q)
(2) Portfolio adjustment rate(3) Price impactHow much an entity sells assets when prices fall.
How much the amount of asset sales of an entity affects market prices.
How similar portfolios are between different entities in terms of market value fluctuations.
Price decline(P)
(1) Portfolio overlap
Priceshock
Chart B5-3: Portfolio overlap
Note: The thickness of a line shows the degree of portfolio overlap between two entities.
July-September quarter of 1999: January-March quarter of 2012: April-June quarter of 2007 October-December quarter of 2019 (before the GFC) (before the COVID-19 outbreak)
Financialinstitutions
Financialinstitutions
Investmentfunds
Investmentfunds
ICPFs
ICPFs
Red: JapanGreen: Overseas Financial
institutions
Financialinstitutions
Investmentfunds
Investmentfunds
ICPFs
ICPFs
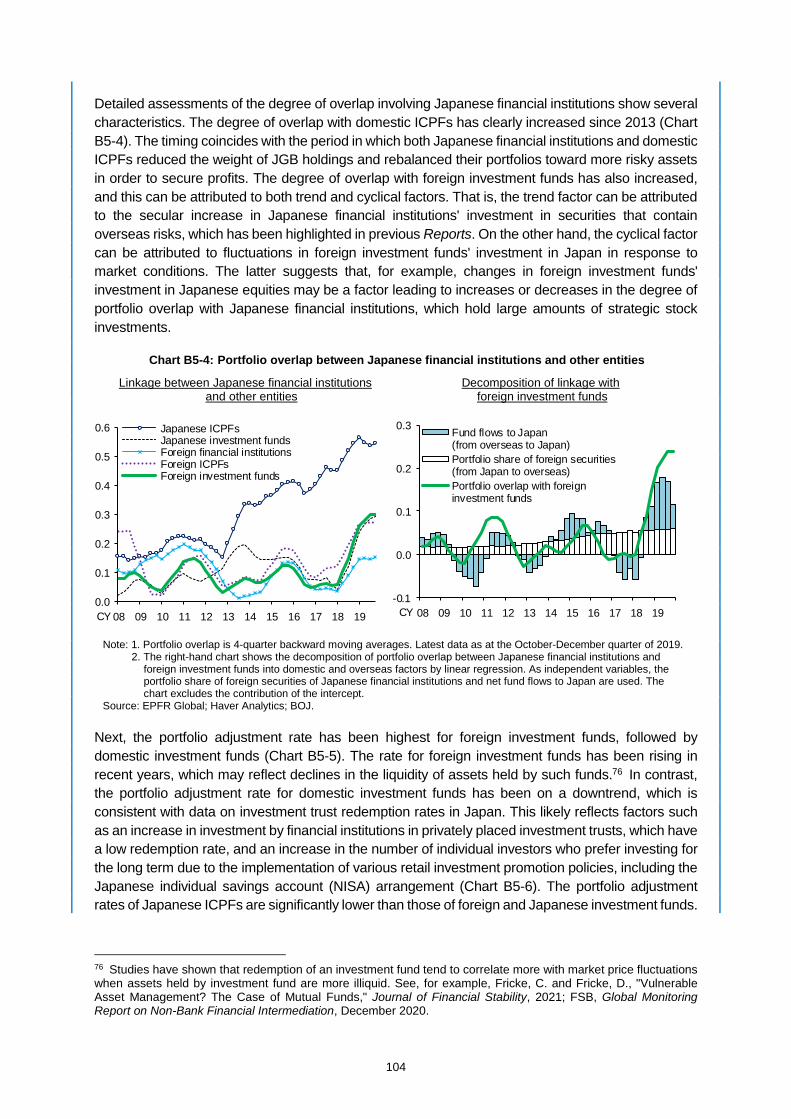
104
Detailed assessments of the degree of overlap involving Japanese financial institutions show several characteristics. The degree of overlap with domestic ICPFs has clearly increased since 2013 (Chart B5-4). The timing coincides with the period in which both Japanese financial institutions and domestic ICPFs reduced the weight of JGB holdings and rebalanced their portfolios toward more risky assets in order to secure profits. The degree of overlap with foreign investment funds has also increased, and this can be attributed to both trend and cyclical factors. That is, the trend factor can be attributed to the secular increase in Japanese financial institutions' investment in securities that contain overseas risks, which has been highlighted in previous Reports. On the other hand, the cyclical factor can be attributed to fluctuations in foreign investment funds' investment in Japan in response to market conditions. The latter suggests that, for example, changes in foreign investment funds' investment in Japanese equities may be a factor leading to increases or decreases in the degree of portfolio overlap with Japanese financial institutions, which hold large amounts of strategic stock investments.
Next, the portfolio adjustment rate has been highest for foreign investment funds, followed by domestic investment funds (Chart B5-5). The rate for foreign investment funds has been rising in recent years, which may reflect declines in the liquidity of assets held by such funds.76 In contrast, the portfolio adjustment rate for domestic investment funds has been on a downtrend, which is consistent with data on investment trust redemption rates in Japan. This likely reflects factors such as an increase in investment by financial institutions in privately placed investment trusts, which have a low redemption rate, and an increase in the number of individual investors who prefer investing for the long term due to the implementation of various retail investment promotion policies, including the Japanese individual savings account (NISA) arrangement (Chart B5-6). The portfolio adjustment rates of Japanese ICPFs are significantly lower than those of foreign and Japanese investment funds.
76 Studies have shown that redemption of an investment fund tend to correlate more with market price fluctuations when assets held by investment fund are more illiquid. See, for example, Fricke, C. and Fricke, D., "Vulnerable Asset Management? The Case of Mutual Funds," Journal of Financial Stability, 2021; FSB, Global Monitoring Report on Non-Bank Financial Intermediation, December 2020.
Chart B5-4: Portfolio overlap between Japanese financial institutions and other entities
Linkage between Japanese financial institutions Decomposition of linkage with and other entities foreign investment funds
Note: 1. Portfolio overlap is 4-quarter backward moving averages. Latest data as at the October-December quarter of 2019. 2. The right-hand chart shows the decomposition of portfolio overlap between Japanese financial institutions and
foreign investment funds into domestic and overseas factors by linear regression. As independent variables, the portfolio share of foreign securities of Japanese financial institutions and net fund flows to Japan are used. The chart excludes the contribution of the intercept.
Source: EPFR Global; Haver Analytics; BOJ.
0.0
0.1
0.2
0.3
0.4
0.5
0.6
08 09 10 11 12 13 14 15 16 17 18 19
Japanese ICPFsJapanese investment fundsForeign financial institutionsForeign ICPFsForeign investment funds
CY -0.1
0.0
0.1
0.2
0.3
08 09 10 11 12 13 14 15 16 17 18 19
Fund flows to Japan(from overseas to Japan)Portfolio share of foreign securities(from Japan to overseas)Portfolio overlap with foreigninvestment funds
CY
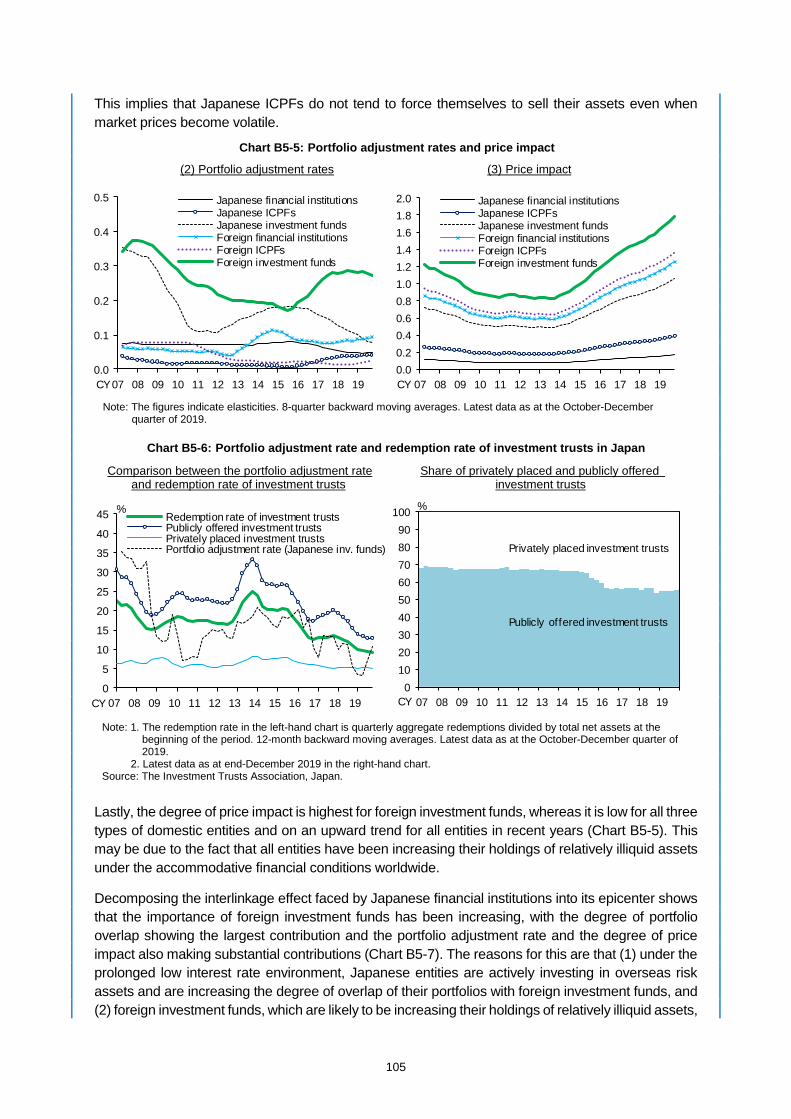
105
This implies that Japanese ICPFs do not tend to force themselves to sell their assets even when market prices become volatile.
Lastly, the degree of price impact is highest for foreign investment funds, whereas it is low for all three types of domestic entities and on an upward trend for all entities in recent years (Chart B5-5). This may be due to the fact that all entities have been increasing their holdings of relatively illiquid assets under the accommodative financial conditions worldwide.
Decomposing the interlinkage effect faced by Japanese financial institutions into its epicenter shows that the importance of foreign investment funds has been increasing, with the degree of portfolio overlap showing the largest contribution and the portfolio adjustment rate and the degree of price impact also making substantial contributions (Chart B5-7). The reasons for this are that (1) under the prolonged low interest rate environment, Japanese entities are actively investing in overseas risk assets and are increasing the degree of overlap of their portfolios with foreign investment funds, and (2) foreign investment funds, which are likely to be increasing their holdings of relatively illiquid assets,
Chart B5-5: Portfolio adjustment rates and price impact
Note: The figures indicate elasticities. 8-quarter backward moving averages. Latest data as at the October-December quarter of 2019.
0.0
0.1
0.2
0.3
0.4
0.5
07 08 09 10 11 12 13 14 15 16 17 18 19
Japanese financial institutionsJapanese ICPFsJapanese investment fundsForeign financial institutionsForeign ICPFsForeign investment funds
CY0.00.20.40.60.81.01.21.41.61.82.0
07 08 09 10 11 12 13 14 15 16 17 18 19
Japanese financial institutionsJapanese ICPFsJapanese investment fundsForeign financial institutionsForeign ICPFsForeign investment funds
CY
(2) Portfolio adjustment rates (3) Price impact
Chart B5-6: Portfolio adjustment rate and redemption rate of investment trusts in Japan
Comparison between the portfolio adjustment rate Share of privately placed and publicly offered and redemption rate of investment trusts investment trusts
Note: 1. The redemption rate in the left-hand chart is quarterly aggregate redemptions divided by total net assets at the beginning of the period. 12-month backward moving averages. Latest data as at the October-December quarter of 2019.
2. Latest data as at end-December 2019 in the right-hand chart. Source: The Investment Trusts Association, Japan.
0
5
10
15
20
25
30
35
40
45
07 08 09 10 11 12 13 14 15 16 17 18 19
Redemption rate of investment trustsPublicly offered investment trustsPrivately placed investment trustsPortfolio adjustment rate (Japanese inv. funds)
CY
%
0102030405060708090
100
07 08 09 10 11 12 13 14 15 16 17 18 19CY
Privately placed investment trusts
Publicly offered investment trusts
%
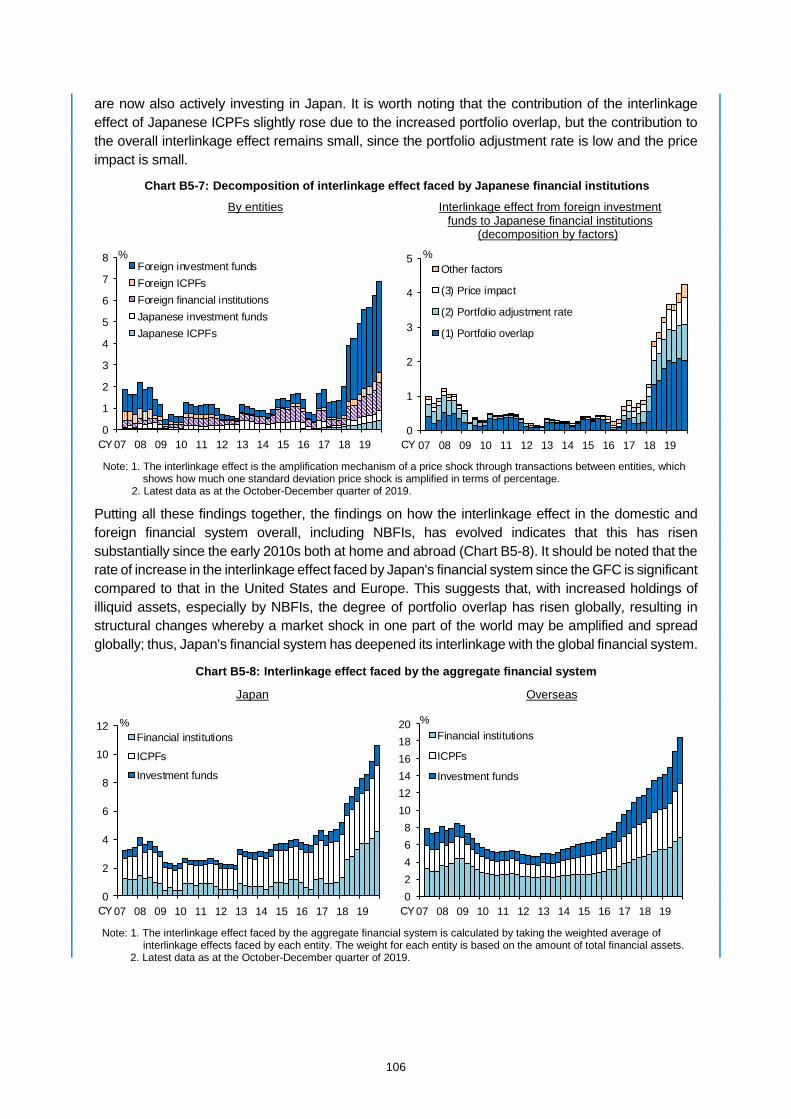
106
are now also actively investing in Japan. It is worth noting that the contribution of the interlinkage effect of Japanese ICPFs slightly rose due to the increased portfolio overlap, but the contribution to the overall interlinkage effect remains small, since the portfolio adjustment rate is low and the price impact is small.
Putting all these findings together, the findings on how the interlinkage effect in the domestic and foreign financial system overall, including NBFIs, has evolved indicates that this has risen substantially since the early 2010s both at home and abroad (Chart B5-8). It should be noted that the rate of increase in the interlinkage effect faced by Japan's financial system since the GFC is significant compared to that in the United States and Europe. This suggests that, with increased holdings of illiquid assets, especially by NBFIs, the degree of portfolio overlap has risen globally, resulting in structural changes whereby a market shock in one part of the world may be amplified and spread globally; thus, Japan's financial system has deepened its interlinkage with the global financial system.
Chart B5-7: Decomposition of interlinkage effect faced by Japanese financial institutions
By entities Interlinkage effect from foreign investment funds to Japanese financial institutions (decomposition by factors)
Note: 1. The interlinkage effect is the amplification mechanism of a price shock through transactions between entities, which shows how much one standard deviation price shock is amplified in terms of percentage.
2. Latest data as at the October-December quarter of 2019.
0
1
2
3
4
5
6
7
8
07 08 09 10 11 12 13 14 15 16 17 18 19
Foreign investment fundsForeign ICPFsForeign financial institutionsJapanese investment fundsJapanese ICPFs
%
CY 0
1
2
3
4
5
07 08 09 10 11 12 13 14 15 16 17 18 19
Other factors
(3) Price impact
(2) Portfolio adjustment rate
(1) Portfolio overlap
%
CY
Chart B5-8: Interlinkage effect faced by the aggregate financial system
Japan Overseas
Note: 1. The interlinkage effect faced by the aggregate financial system is calculated by taking the weighted average of interlinkage effects faced by each entity. The weight for each entity is based on the amount of total financial assets.
2. Latest data as at the October-December quarter of 2019.
02468
101214161820
07 08 09 10 11 12 13 14 15 16 17 18 19
Financial institutions
ICPFs
Investment funds
CY
%
0
2
4
6
8
10
12
07 08 09 10 11 12 13 14 15 16 17 18 19
Financial institutions
ICPFs
Investment funds
CY
%

107
Implications for financial institutions' risk management and macroprudential perspective
As pointed out in Section C of Chapter IV, there were quite a few cases where Japanese financial institutions' securities holdings breached loss-cut rules and alarm points when the market suddenly became volatile in March 2020. The results of the above analysis suggest that the asset price fluctuations that Japanese financial institutions face in the event of stress may be strongly influenced by a number of external factors, such as (1) the degree of overlap between the portfolios of Japanese financial institutions and other entities, (2) how other domestic and foreign entities react to asset price shocks, and (3) how asset prices respond to this reaction. Financial institutions need to be aware of these factors in their investment strategies and risk management.
From a macroprudential perspective, the FSB, various standard setting bodies, and financial authorities of various countries have recognized that fundamental measures may need to be taken and have started discussions to address the vulnerabilities related to investment funds and other entities, reflecting their experiences. One of the focal points of these discussions has been to better understand the systemic risks inherent in the financial system, particularly the interconnectedness and interlinkage among various entities and the cross-border transmission effects, given the growing importance of investment funds in financial intermediation activities. Further analyses like the one presented here are important for promoting future international discussions in this field.

108
Box 6: The impact of floods on firms' financial conditions
In recent years, floods caused by typhoons and torrential rains have often damaged economic activities in Japan. Flood damage is expected to increase as a result of climate change associated with global warming and is recognized as one of the most typical manifestations of the physical risks. Therefore, it is important to quantify the impact of floods. Against this background, this box examines the impact of floods on firms' financial conditions measured by their severity and persistence by size and industry of firms.77
In general, natural disasters, including floods, are extremely localized phenomena, and the precision of the data used to identify natural disasters can have a significant impact on the results of the analysis. Japan has compiled Flood Statistics, which record almost all flood damage that has occurred every year since 1961, making it possible to examine the damage -- such as square meter measurements and the number of buildings damaged -- at the municipality level. For the analysis here, Flood Statistics is used to create a dataset for the period from 1993 to 2018 that matches information on domestic firm-level data provided by Teikoku Databank with information on the flood damage in more than 1,000 municipalities.
Based on this dataset, firms are divided into two groups based on whether or not they were located in areas affected by flooding, and then the change in the averages of firms' financial variables after floods is compared. More specifically, the estimation examines how a firm's year-on-year rate of change in sales and its profit to sales ratio were affected by (1) whether the firm was located in a municipality affected by flooding,78 and (2) the scale of the flood measured in terms of the ratio of the number of affected business facilities to the total number of business facilities in the municipality (hereafter, the ratio of flood-affected business facilities).79
Starting with the short-term impact in the year of the flood,80 the result of the difference-in-differences estimation indicates that floods had negative impacts on the year-on-year rate of change in firms' sales irrespective of the firm size, except for the construction industry (Chart B6-1). However, none of the estimates is statistically significant. On the other hand, with regard to the profit to sales ratio, a significant negative impact is found in the estimation for all firms, for the manufacturing sector and the service sector in the industry-level estimations, and for SMEs in the estimations by firm size. Comparing the estimates by industry and firm size with the distribution of the observed deviation from the average of the profit to sales ratio indicates that the impact is quite large in the manufacturing sector and also large among SMEs. These findings likely reflect that, in the manufacturing sector, tangible fixed assets, which in the case of damage give rise to impairment losses and recovery
77 This box is based on the following paper: Yamamoto, H. and Naka, T., "Quantitative Analysis of the Impact of Floods on Firms' Financial Conditions," Bank of Japan Working Paper, no. 21-J-3, March 2021 (available only in Japanese). 78 Specifically, two types of dummy variables were defined and used to estimate how a firm was affected. The first dummy takes a value of one if the firm is located in a municipality where entities other than business facilities, such as households and public facilities, suffered flood damage, while the second takes a value of one if it is located in a municipality where business facilities suffered damage. 79 Firm fixed effects (such as differences due to firm size) and time fixed effects (such as differences in profit ratios due to differences in economic conditions at the time of the disaster) are controlled for, and thus they do not affect the estimation results. The number of observations in the estimations for firms of all sizes and industries is approximately 15 million for the year-on-year rate of change in firms' sales and approximately 10 million for the profit to sales ratio. 80 In order to ensure that the impact of the floods examined here is of a reasonably large scale, the results are based on the assumption that the ratio of flood-affected business facilities is about 25 percent. This value corresponds to the average of the largest ratio of flood-affected business facilities for each year during the estimation period.
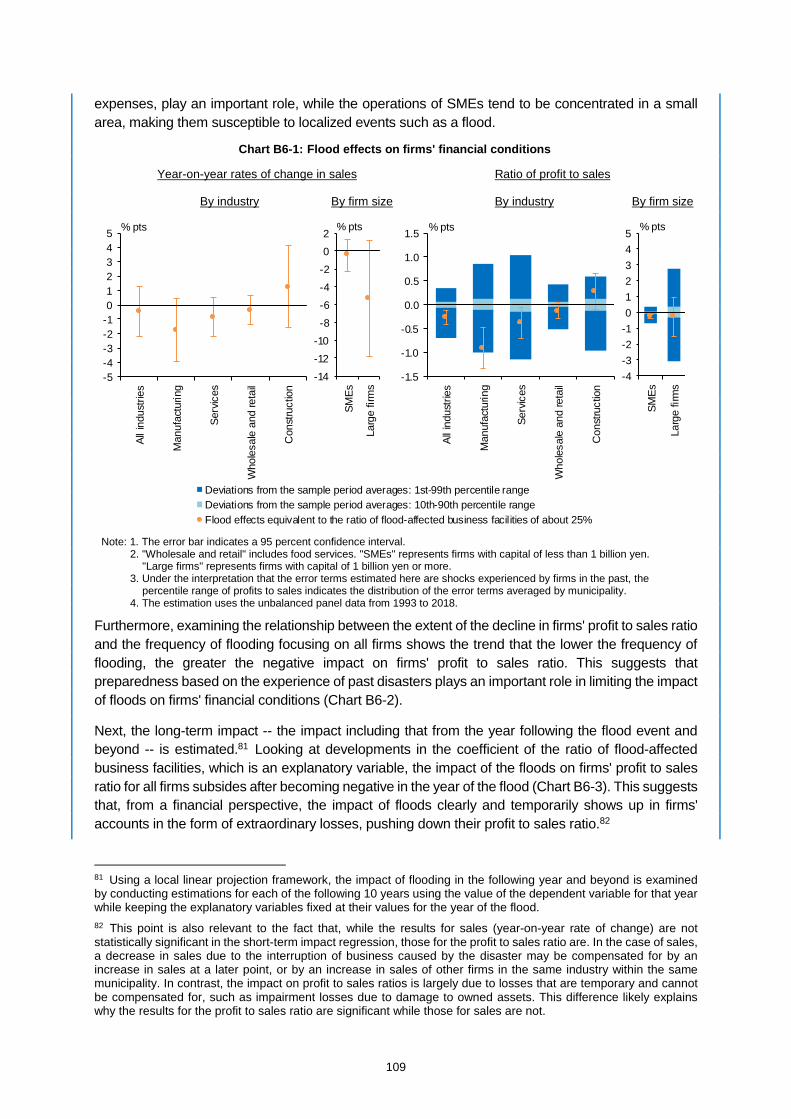
109
expenses, play an important role, while the operations of SMEs tend to be concentrated in a small area, making them susceptible to localized events such as a flood.
Furthermore, examining the relationship between the extent of the decline in firms' profit to sales ratio and the frequency of flooding focusing on all firms shows the trend that the lower the frequency of flooding, the greater the negative impact on firms' profit to sales ratio. This suggests that preparedness based on the experience of past disasters plays an important role in limiting the impact of floods on firms' financial conditions (Chart B6-2).
Next, the long-term impact -- the impact including that from the year following the flood event and beyond -- is estimated.81 Looking at developments in the coefficient of the ratio of flood-affected business facilities, which is an explanatory variable, the impact of the floods on firms' profit to sales ratio for all firms subsides after becoming negative in the year of the flood (Chart B6-3). This suggests that, from a financial perspective, the impact of floods clearly and temporarily shows up in firms' accounts in the form of extraordinary losses, pushing down their profit to sales ratio.82
81 Using a local linear projection framework, the impact of flooding in the following year and beyond is examined by conducting estimations for each of the following 10 years using the value of the dependent variable for that year while keeping the explanatory variables fixed at their values for the year of the flood. 82 This point is also relevant to the fact that, while the results for sales (year-on-year rate of change) are not statistically significant in the short-term impact regression, those for the profit to sales ratio are. In the case of sales, a decrease in sales due to the interruption of business caused by the disaster may be compensated for by an increase in sales at a later point, or by an increase in sales of other firms in the same industry within the same municipality. In contrast, the impact on profit to sales ratios is largely due to losses that are temporary and cannot be compensated for, such as impairment losses due to damage to owned assets. This difference likely explains why the results for the profit to sales ratio are significant while those for sales are not.
Chart B6-1: Flood effects on firms' financial conditions
Year-on-year rates of change in sales Ratio of profit to sales
By industry By firm size By industry By firm size
Note: 1. The error bar indicates a 95 percent confidence interval. 2. "Wholesale and retail" includes food services. "SMEs" represents firms with capital of less than 1 billion yen.
"Large firms" represents firms with capital of 1 billion yen or more. 3. Under the interpretation that the error terms estimated here are shocks experienced by firms in the past, the
percentile range of profits to sales indicates the distribution of the error terms averaged by municipality. 4. The estimation uses the unbalanced panel data from 1993 to 2018.
-1.5
-1.0
-0.5
0.0
0.5
1.0
1.5
All i
ndus
tries
Man
ufac
turin
g
Serv
ices
Who
lesa
le a
nd re
tail
Con
stru
ctio
n
Deviations from the sample period averages: 1st-99th percentile rangeDeviations from the sample period averages: 10th-90th percentile rangeFlood effects equivalent to the ratio of flood-affected business facilities of about 25%
% pts
-4-3-2-1012345
SMEs
Larg
e fir
ms
% pts
-5-4-3-2-1012345
All i
ndus
tries
Man
ufac
turin
g
Serv
ices
Who
lesa
le a
nd re
tail
Con
stru
ctio
n
% pts
-14
-12
-10
-8
-6
-4
-2
0
2
SMEs
Larg
e fir
ms
% pts
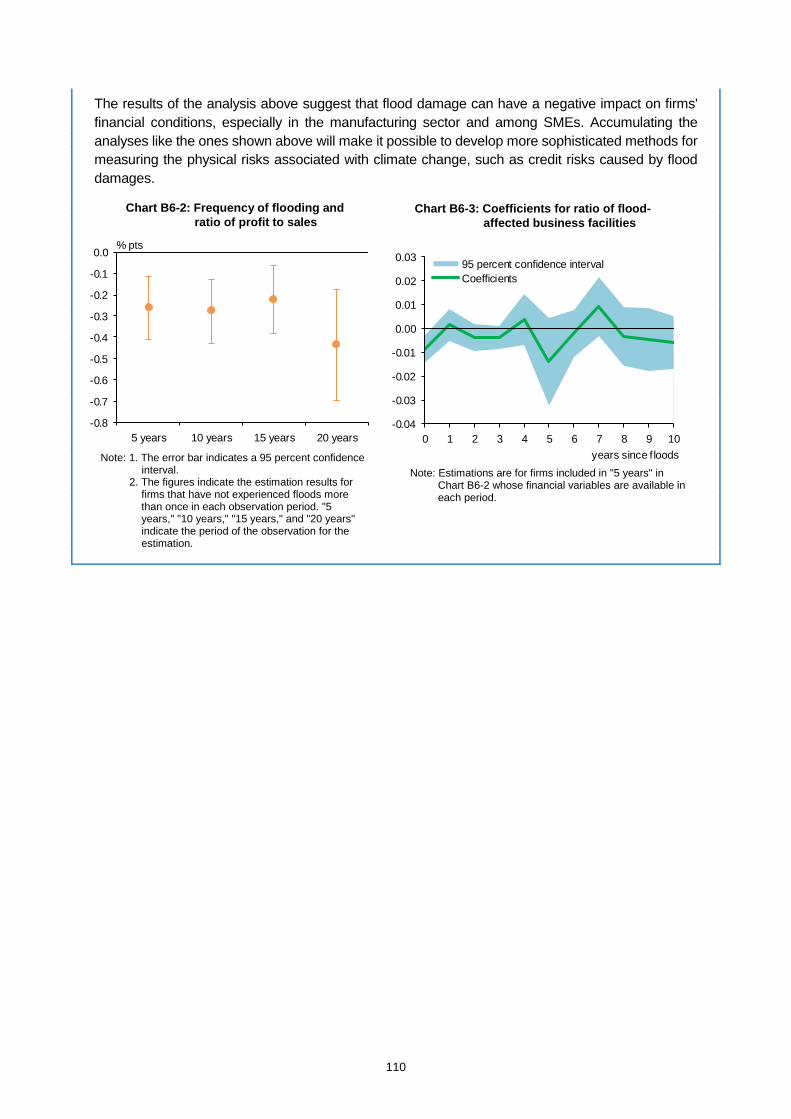
110
The results of the analysis above suggest that flood damage can have a negative impact on firms' financial conditions, especially in the manufacturing sector and among SMEs. Accumulating the analyses like the ones shown above will make it possible to develop more sophisticated methods for measuring the physical risks associated with climate change, such as credit risks caused by flood damages.
Chart B6-2: Frequency of flooding and ratio of profit to sales
Chart B6-3: Coefficients for ratio of flood-affected business facilities
Note: Estimations are for firms included in "5 years" in Chart B6-2 whose financial variables are available in each period.
Note: 1. The error bar indicates a 95 percent confidence interval.
2. The figures indicate the estimation results for firms that have not experienced floods more than once in each observation period. "5 years," "10 years," "15 years," and "20 years" indicate the period of the observation for the estimation.
-0.8
-0.7
-0.6
-0.5
-0.4
-0.3
-0.2
-0.1
0.0
5 years 10 years 15 years 20 years
% pts
-0.04
-0.03
-0.02
-0.01
0.00
0.01
0.02
0.03
0 1 2 3 4 5 6 7 8 9 10
95 percent confidence intervalCoefficients
years since f loods

111
Glossary
Financial statements of financial institutions
Net income = operating profits from core business + realized gains/losses on stockholdings + realized gains/losses on bondholdings – credit costs ± others (such as extraordinary gains/losses)
Gross operating profits from core business = core gross operating profits = net interest income + net non-interest income
Operating profits from core business = pre-provision net revenue (PPNR) excluding trading income = net interest income + net non-interest income – general and administrative expenses
Net interest income = interest income – interest expenses
Net non-interest income = net fees and commissions + profits on specified transactions + other operating profits – realized gains/losses on bondholdings
Overall gains/losses on stockholdings = realized gains/losses on stockholdings + changes in unrealized gains/losses on stockholdings
Realized gains/losses on stockholdings = gains on sales of stocks – losses on sales of stocks – losses on devaluation of stocks
Overall gains/losses on bondholdings = realized gains/losses on bondholdings + changes in unrealized gains/losses on bondholdings
Realized gains/losses on bondholdings = gains on sales of bonds + gains on redemption of bonds – losses on sales of bonds – losses on redemption of bonds – losses on devaluation of bonds
Credit costs = loan-loss provisions + write-offs + losses on credit sales – recoveries of write-offs
Credit cost ratio = credit costs / total loans outstanding
Capital adequacy ratios of internationally active banks
Common equity Tier 1 (CET1) capital ratio = CET1 capital / risk-weighted assets
CET1 capital includes common equities and retained earnings.
Tier 1 capital ratio = Tier 1 capital / risk-weighted assets
Tier 1 capital includes CET1 capital and preferred equities that meet certain conditions.
Total capital adequacy ratio = Total capital / risk-weighted assets
Total capital includes Tier 1 capital and subordinated bonds that meet certain conditions.
Capital adequacy ratios of domestic banks
Core capital ratio = core capital / risk-weighted assets
Core capital includes common equities and retained earnings as well as preferred equities that meet certain conditions.