Embed Size (px)
Citation preview

Financial Sustainability Plan11 January 2021

1
Contents Commissioner’s Foreword 7
Executive Summary 81 Chapter 1: Strategic Context 8
2 Chapter 2: Impact of the pandemic and potential future scenarios 9
3 Chapter 3: Economic fundamentals of TfL business areas 12
4 Chapter 4: Becoming an economic and efficient operator and the public service obligation 16
5 Chapter 5: Achieving financial sustainability 17
6 Chapter 6: Bridging the gap 20
1. Strategic Context 21Chapter Summary 21
TfL’s vital role in London 21
TfL and the London economy 22
Benefits of London and TfL to the wider UK economy 24
TfL’s key role in supporting wider Government objectives 27
Consequences of underinvestment and risks of increased congestion 30
A critical period for transport and London and the wider UK economy 30
2. Impact of the pandemic and potential future scenarios 32Chapter Summary 32
Pre-COVID-19 pandemic funding and financing position 32
Impact of the coronavirus pandemic on demand and revenue in 2020/21 35
Scenarios for medium to long term demand and revenue 37
Future scenarios for the financial sustainability gap 41
3. Economic fundamentals of TfL business areas 51Chapter Summary 51
Buses and streets 52
Rail, Tube and Elizabeth line 59
Property and Land 68
4. Becoming an economic and efficient operator and the public service obligation 73Chapter Summary 73
Introduction 74
The current TfL funding model and the need for change 74
A clear set of objectives for structural reform 75
Creating enhanced statutory public service obligations 76
Conclusion 78

2
5. Achieving Financial Sustainability 79
Chapter Summary 79
Service levels 79
Operating efficiencies 83
Pay, benefits and pensions 88
Prioritisation and efficiency of capital investment 89
Commercial development activities 93
Existing funding levers 95
Other potential funding sources 100
Debt, liquidity and reserves 106
6. Bridging the gap 111
Introduction 111
Target dates for implementation of recommendations 111
Next steps 114
Indicative timeline for future activity 115
3
Figures and Tables Figures
Figure 1: Number of jobs supported by London Underground’s supply chain and amount of funding generated by region 25 Figure 2: Government funding history (excluding Crossrail and one-off funding) 32 Figure 3: Debt profile 32 Figure 4: TfL Group – net cost of operations 2015/16 to 2024/25 (2019 Business Plan) 33 Figure 5: Impact of the coronavirus pandemic on demand levels across TfL services 35 Figure 6: Bus service operation costs per actual revenue vehicle hour 55 Figure 7: Indicative profile of zero emission bus transition programme 56 Figure 8: Indicative profile of zero emission bus transition programme – alternative delivery 57 Figure 9: London Underground & DLR Recovery ratio 2018/19: international comparison 60 Figure 10: London Overground Recovery ratio 2018/19: international comparison 60 Figure 11: London Overground cost per revenue train km 63 Figure 12: Lost customer hours attributed to Rail defects by Line and Year 63 Figure 13: Operating Income and Asset Value Growth in the Housing Growth Plan: 68 Figure 14: Homes delivery from project start date 69 Figure 15: Net and Cumulative Net Capital Cost of Housing Growth Plan 69 Figure 16: London Underground and bus proportion of variable costs over different time horizons 78 Figure 17: Comparison of TfL’s funding arrangements to other urban transport authorities 103
Tables
Table 1: TfL Financial Sustainability Plan scenarios 12 Table 2: TfL Group position for Decarbonise by 2030 13 Table 3: TfL's proposals for achieving financial sustainability 18 Table 4: TfL Group – net cost of operations (2019 Business Plan) 33 Table 5: Impact on 2020/21 revenue compared to the expectations under the 2020/21 Budget 36 Table 6: Forecast of demand changes for rail and bus 37 Table 7: Comparison of operating income to 2029/30 39 Table 8: Long term capital planning scenarios 41 Table 9: Financial sustainability under Decarbonise by 2030 scenario 45 Table 10: Financial sustainability under Limited Recovery scenario 46 Table 11: Financial sustainability under Managed Decline scenario 47 Table 12: Financial sustainability under Rapid Decline scenario 48 Table 13: Main sources of revenue – as per GLA Budget 52 Table 14: Main elements of expenditure– as per GLA Budget 52 Table 15: Buses & streets account for Decarbonise by 2030 net cost of operations 53 Table 16: Income source analysis 54 Table 17: Variable cost recovery 61 Table 18: Forecast savings and risk analysis 62 Table 19: Rail and Tube account for Decarbonise by 2030 net cost of operations 64 Table 20: Property and Land account for decarbonise by 2030 net cost of operations 66 Table 21: Forecast of demand changes for rail and bus in 2031 78 Table 22: Operating efficiencies identified in the 2021/22 GLA Budget 82 Table 23: Deliverability of operating efficiencies 83 Table 24: Strategic criteria for renewals and enhancements 87

4
Table 25: Renewals - breakdown by category - provisional 88 Table 26: Enhancements breakdown by category - provisional 88 Table 27: Total Capital Programme Commitment Status – provisional 89 Table 28: Overview of RUC schemes 96 Table 29: Greater London Boundary Charge 97 Table 30: S&P Criteria 105 Table 31: Indicative target dates for implementation of financial sustainability recommendations 109
5
Glossary BAU Business as Usual BRR Business Rates Retention BSOG Bus Service Operator Grant CAZ Central Activity Zone CBI Confederation of British Industry CCZ Congestion Charge Zone CIPFA Chartered Institute of Public Finance and Accountancy CPOS Compliance, Policing and On Street DaR Dial-a-Ride DfT Department for Transport DLR Docklands Light Railway DVS Direct Vision Standard ECPL Earls Court Properties Limited EV Electric vehicle FTE Full-time equivalent GDP Gross Domestic Product GLA Greater London Authority HIF Housing Infrastructure/Innovations Fund HMT Her Majesty’s Treasury HR Human Resources KAD Keolis Amey Docklands LEZ Low Emission Zone LU London Underground MHCLG Ministry of Housing, Communities and Local Government MoTiON Model of Travel in London MTS Mayor’s Transport Strategy NPL Non-permanent labour ONS Office for National Statistics ORR Office of Rail and Road PCN Penalty Charge Notice PFI Private Finance Initiative PPP Public Private Partnership PTI Platform Train Interface PWLB Public Works Loan Board RAB Regulated Asset Based RCF Revolving Credit Facilities RIS Road Investment Strategy RP Road Period RUC Road User Charging SCADA Supervisory control and data acquisition SFA Step Free Access SITS Surface Intelligent Transport Systems SHE Safety, Health and Environment TfL Transport for London TIES Transport Infrastructure Efficiency Strategy TLRN Transport for London Road Network

6
TOC Train Operating Companies TOL Tram Operations Limited TPH Taxi Private Hire TTLP TTL Properties Limited ULEX ULEZ Expansion 2021 ULEZ Ultra Low Emission Zone VAT Value-added tax VED Vehicle Excise Duty 4LM Four Lines Modernisation programme WLC Whole Life Cost
7
Commissioner’s Foreword Transport for London (TfL) is one of the world’s best known and most successful integrated transport authorities. In just 20 years, TfL has gained global respect for its innovative and progressive approach to the identification of customer needs, delivery of high-quality service and use of mutually beneficial partnerships to maximise stakeholder and consumer value for money.
The global coronavirus pandemic has brutally exposed the vulnerability of TfL’s current funding model, specifically, its unusually high dependence on revenue generated through the fare box, notwithstanding the huge progress in recent years in driving down cost through careful financial stewardship and progressive organisational change.
But with adversity comes huge opportunity. An affordable, sustainable and more diverse long term TfL funding model will benefit both London and the whole country in the national quest to build back better, post-pandemic. We are seeking a funding model closer to that already in place for Network Rail or Highways England, and to be recognised as delivering nationally significant infrastructure improvements. We want to discuss structural reform that will clarify the public service obligations and introduce control periods for capital investment for our Tube, rail and road assets.
Government wishes to procure shovel-ready projects that create wealth and employment, that are consistent with relentless progress to a carbon-free future and that level up the national economy, giving greater priority to investment outside London and the South East. TfL is part of the solution. We stand ready and able to partner with Government in all three strategic objectives.
Our capital expenditure is already biased towards the green recovery and with the right capital investment we can accelerate this to meet the 2030 ambition to decarbonise transport. We are prioritising spend away from central mega projects and can mobilise employment and wealth-creating projects that will deliver tangible, environmental and economic benefits across the UK. As an example, our supply chain for London Underground already supports 43,000 jobs, 68 per cent of which are outside London.
However, in order to assist the national recovery, TfL will need ongoing financial support. This Financial Sustainability Plan shows that by 2023/24, TfL can cover its cost of operation, maintenance and financing, and an increasing proportion of its core renewals, assuming there are no further large economic shocks, with £500m per annum from Vehicle Excise Duty (VED) or a Greater London Boundary Charge. To decarbonise by 2030, we need on average £1.6bn per annum capital funding between 2023/24 and 2029/30.
As a transport authority, TfL is not unique in needing financial support post-pandemic. This is consistent with the requests of other authorities. £1.6bn is approximately 32 per cent of TfL’s pre-pandemic passenger income. The New York MTA have asked for $12bn over a four-year period. This includes $2.3bn in the years immediately after the pandemic (2023–24), which is approximately 37 per cent of MTA’s pre-pandemic passenger income.
Investment in TfL’s long term financial security will drive London’s post-pandemic recovery and thereby the capital’s ongoing fiscal contribution to the UK Exchequer and the national economy. Investment in TfL makes compelling sense and is absolutely necessary, whether through Government funding for major renewals and enhancements, or devolution of funding sources.
As Commissioner, my top priority is to steer TfL through the pandemic and to secure the organisation’s long term financial future. My team and I are committed to reaching a mutually agreeable deal with Government, the benefits of which will be felt across the entire UK, as London’s transport system gets the economy, the capital and the country back to work.
Andy Byford, Commissioner, Transport for London

8
Executive Summary 1 Chapter 1: Strategic Context 1.1 Chapter 1 of the Financial Sustainability Plan sets out TfL’s critical role in supporting the London and UK
economy, its contribution to wider Government objectives and the importance of ensuring TfL is put on a sustainable financial footing.
1.2 Transport has always been a fundamental component of the functioning of cities. Specific issues change over time and the transport demands of a city population will always be evolving, but without successful transport there cannot be successful cities. The pandemic has been possibly the most fundamental short term disruption to city transport ever experienced, with London experiencing the lowest ridership on the Tube since the 19th Century. It is likely to lead to some long term changes in how people travel, but a high-quality transport network will continue to be essential to support the UK and London economy.
1.3 London is a densely populated city, which has witnessed significant growth in recent decades. As in most large cities, it has a busy centre with world-class economic, educational and cultural institutions, which can only function if people from a wide area (both suburbs and areas outside the city) are able to travel medium and long distances from their homes into the centre. London’s transport system means that the city’s future growth can be supported with a lower incremental carbon burden compared to other forms of development in less accessible areas. London’s transport system supports effective networking which enhance the city’s productivity, leading to higher Gross Domestic Product (GDP): investment in a dense transport network in a dense city allows London to continue to contribute significantly to the UK economy and to the Exchequer, and be a part of a UK which can compete globally post-Brexit and post-pandemic.
1.4 In addition, it has numerous residential communities across 33 boroughs with their own local amenities, which again require people to be able to travel, this time over shorter distances, to access communal services, employment and businesses. Transport not only supports the economy and key services but is also vital to the environment and public health, both of which desperately need to be improved in the coming years. These challenges are shared by other cities across the UK, albeit not on the same scale.
1.5 All of these diverse needs mean that the requirements of a large city’s transport network are complex and must accomplish a wide variety of outputs. London needs a high-capacity rail network to support large numbers of people travelling medium and long distances, and connecting between cities, so that wealth and productivity can be shared. It needs a bus network to support more local journeys, provide connectivity to areas the rail network does not reach, and offer an affordable alternative to the car. It needs to support people walking and cycling for the benefit of their local economy, environment and health. It needs roads that can efficiently support the movement of freight and people, without damaging health and wellbeing. It needs to be able to adapt to innovation such as ride hailing apps and micro mobility. Finally, new areas with potential to accommodate additional homes and jobs, need to be invested in and connected to the rest of the city so they can achieve their potential to contribute to economic growth.
1.6 Roads are our most scarce resource. Congestion on London’s roads costs the economy £5.5bn a year. Constrained investment leads to critical road infrastructure needing to be closed such as A40 Westway. Such capacity constraints are why the Tube was invented over 150 years ago and is why we need to continue to invest in London’s Tube and Rail infrastructure to carry as many people as efficiently as possible to support the efficient management of London’s road space.
1.7 Since 2000, TfL has been responsible as London’s spatial and transport planner, system integrator, network manager, regulator, operator and capital delivery body, and accountable to a democratically elected regional Mayor. This has been a period of considerable growth in the UK’s capital city where improvements to the transport network have enabled the population and economy to grow substantially, boosting the UK economy and quality of life for millions of people. TfL has been highly successful in driving modal shift facilitated by high quality public transport and improving walking and cycling facilities. The number of trips made by walking, cycling or public transport has risen from 52 per cent in 2000 to 63 per cent just before the pandemic. Had this shift not taken place, London’s transport CO2 emissions would be around a million tonnes

9
higher per year than they currently are. London has made huge progress, but we must both protect the successes of the past 20 years and capitalise on the opportunities to do more in the future.
1.8 It takes a huge amount of investment to build a transport network, but in London most of the key components are already in place. We now need to take advantage of the investments made by previous generations and unlock their full potential through incremental investments. Doing so will enable more homes to be built in London, the city centre to remain one of the world’s most attractive cultural and commercial destinations and the decarbonisation of the network to support the UK’s climate change targets.
1.9 Without continuous, stable investment to operate and maintain our existing network and ensure it keeps pace with societal expectations, its performance will decline. This will mean fewer people using public transport to travel around London and more people using cars, with all the pollution and congestion that this results in. We know that, just as improving transport supports a city’s success, allowing transport to degrade will have the opposite effect. This is because as the city becomes less attractive and ceases to grow, this will lead to fewer jobs, more social exclusion and a lower contribution to the national economy. London already has some of the most deprived areas in the country and providing connectivity for these areas to access jobs and services is critical to redistributing economic wealth.
1.10 The long term funding structures that supported TfL’s first investment cycle have led to economic growth and efficiency for the taxpayer. Before TfL, London’s transport was characterised by short term funding and prioritisation, inefficiency, poor reliability, a dirty and crime ridden system which discouraged international investment in London, reduced economic growth and widened economic disparity. We are now in danger of undoing the hard-won gains of an efficient system through a return to short term thinking and inefficient investment, unless a longer term funding solution can be found.
1.11 TfL’s finances have developed in the 20 years since it was created as an integrated transport authority. Major changes include the build-up of a considerable debt burden and the reduction and then withdrawal of its government grant. The cumulative impact of these changes means that, even before the coronavirus pandemic, TfL was facing a funding challenge which was forcing the deferral of some asset renewals and threatening its ability to achieve its future objectives. TfL was showing a projected funding gap estimated at £0.5bn to £1bn per annum from the mid-2020s onwards.
1.12 The pandemic has led to a crisis for TfL’s immediate financial position; but with its effect on longer term travel demand in London, it could also impact the organisation’s long term finances and funding gap. A constrained assessment places the long-running demand reduction at 20 per cent below previous forecasts. This would increase the long term funding gap by £1bn per annum.
2 Chapter 2: Impact of the pandemic and potential future scenarios 2.1 Chapter 2 of the Financial Sustainability Plan sets out the impact of the pandemic, financial scenarios and the
resulting impacts on TfL’s operating income. The scenarios are based on variations of long term future demand, options from TfL’s LTCP and have efficiencies and financial levers available to TfL embedded within them.
2.2 The recently published Independent Review commissioned by the Mayor and TfL Board to examine financial sustainability sets out the detailed evolution of TfL’s role as an integrated transport authority, including an articulation of the benefits of this approach. The report also highlights the key developments in TfL’s funding and financing arrangements since TfL was created. This provides important context to the understanding of TfL’s pre-pandemic funding and financing position.
2.3 Prior to the pandemic, TfL’s efficiency programme meant it was on a path to breakeven the cost of operations, maintenance, financing costs and core renewals, with TfL having taken almost £1bn out of its net operating costs over the past four years. Despite this, TfL still required external support for capital investment. Grant levels prior to 2012 demonstrate that the capital’s transport has always needed national support, and in turn has more than delivered back in terms of GDP.
2.4 The pandemic has decimated TfL’s finances and exposed the current funding model (in place since 2015, following the withdrawal of the operating grant for the delivery of transport services) to be overly reliant on fare revenues. Due to the high fixed cost nature of transport infrastructure, reducing operating costs in line with reductions in demand has proved impossible in the short to medium term. TfL’s significant exposure to

10
changes in demand due to its high fixed costs and dependence on fares revenue mean that it is particularly susceptible to potential future recessions. The experience in other cities such as Madrid1 has also demonstrated the long term economic damage of cutting services deeply in response to demand shocks, only to be unable later to rebuild service levels sufficiently and quickly enough when needed to support economic recovery. If London is to have a chance of recovery from the pandemic, closing services for permanent cost reductions should not be considered. On the contrary, TfL needs to continue to invest. In the 1970s Seoul had no subway at all and since then has grown to support an area of 25m people, a huge economic success. This has been done in concert with programmes to improve air quality as well as the introduction of air quality laws in the metropolitan area.
2.5 To keep the city moving throughout the pandemic while supporting the Government’s guidance on social distancing, TfL has run a full service on most modes and more than 100 per cent levels of service on the bus network, and with extremely limited revenue to pay for them. At one metre social distancing even operating 100 per cent levels of service meant that TfL could only carry 21 per cent of pre pandemic passenger levels on the Tube, and 34 per cent on the buses. TfL has had to secure emergency financial support from Government. Despite this support, TfL will have experienced a £800m reduction in its cash reserves, in addition to the need to find an additional £160m of savings in the period from October 2020 to March 2021.
2.6 In the short run, running the maximum service possible will support social distancing during the latest lockdown and as TfL needs to rebuild people’s trust in using the public transport network. This includes supporting those essential workers who have protected the capital and towns and cities everywhere. In the medium term, it is unclear what demand will return to. Cutting services now based on potentially lower demand forecasts risks constraining the recovery and has very limited ability to generate savings in the short term. It also risks undermining public confidence in the availability of services, driving a car-led recovery. Reducing service in the medium term also has limited cost benefits due to high fixed cost, especially in rail. More broadly service reductions undermine shared local and national priorities on air quality, active travel and decarbonisation. Service reductions will limit mode shift to public transport and also remove the industry confidence required to invest in people, skills, innovation.
2.7 The prospect of widespread distribution of safe and effective vaccines in 2021, and subsequent lifting of restrictions, provides some assurance that a significant proportion of pre-COVID-19 travel demand could return over the course of the year. However, supporting the recovery in demand, especially in the central activity zone, will need the right support from other areas of central and local government, including transport.
Uncertainty of the medium to long term demand
2.8 It is also not yet clear how travel patterns will change and how quickly demand levels will return to pre-pandemic levels. This is because the pandemic has resulted in more people working from home, shopping locally or online and making shorter journeys on foot or by bike. These short term changes may have medium to long term impacts on how businesses and neighbourhoods thrive in future. There is still too much uncertainty to make large scale decisions which could negatively impact long term economic recovery.
2.9 TfL is uniquely placed to help drive a strong and resilient future for London and continue supporting a more efficient, productive and sustainable city. However, this is entirely dependent on secure, long term funding that enables it to commit to the next generation of improvements to address London’s transport network needs. Without this investment, costs will escalate due to increased maintenance, as well as an inability to achieve planned efficiencies arising from modernisation of the asset base. The condition of the network will move backwards, reliability will decline, encouraging private car use and the consequent congestion and economic loss, and closures will become necessary where safety cannot be guaranteed.
2.10 TfL would welcome a dialogue with Government on how different scenarios may support an economic recovery and how best to support this progress. Moving forward into this next chapter – rather than back from where we came – will provide opportunities to achieve national ambitions to invest in infrastructure, innovation and people and in doing so make the UK wide supply chain more resilient; improve health outcomes through active travel and air quality; succeed in the Government’s 10-point plan for a green
1 After the 2008 financial crisis Madrid significantly reduced service levels and investment, then struggled when demand returned

11
industrial revolution; support the upcoming National Bus Strategy; and strengthen the UK’s place in the world as a global leader.
2.11 For the purpose of assessing financial sustainability, and because of the level of uncertainty surrounding medium to long term demand, TfL has developed four financial scenarios to seek to define the possible outcomes for the medium to long term (from 23/24 to 29/30). Each of TfL’s four financial scenarios is created by combining a passenger demand scenario with a long term capital planning scenario and funding lever (or additional grant):
Demand scenario + long term capital planning scenario + funding lever or additional grant = outcome for London
2.12 Six possible passenger demand scenarios and three capital planning scenarios have been considered, and these are described below. These are set out in more detail including the percentage changes of each scenario in Section 2.4.
2.13 The passenger demand scenarios follow the five possible future city planning scenarios which show long term demand to 2031, plus an additional hybrid model. The six scenarios are:
• Return to business as usual, representing a London which has bounced back from the crisis and looks relatively similar to expectations pre pandemic;
• Agglomeration x3, the story of an expanding London, where virus related changes to the economy enhance its global competitive advantage;
• London declines, the story of a lower growth London, having to cope with the fallout from the virus and a diminished status in the UK and the wider world;
• Low carbon localism, the story of a smaller but more sustainable London, which has been impacted significantly by the virus and becomes more local as a result;
• Remote revolution, the story of a successful but quite different city, where technology has changed how people live, work and travel.
• Hybrid (+/-), a combination of the outcomes currently thought to be most probable from the scenarios explained above, incorporating changes to working patterns and behaviours. The Hybrid scenario is flexed with +/- variants to reflect the impact of demand of other assumptions in this plan.
2.14 The associated trajectories of revenue growth or decline from the activities has a very significant degree of variability in possible outcomes. Given the high fixed nature of TfL’s operating costs, the resultant impact will be on optimal asset maintenance and capital costs. The assumptions making up each demand scenario are outlined in more detail in Section 2.4. The three long term capital planning scenarios are categorised as below. The details of what programmes are included within each of these scenarios is set out in Section 2.5:
• Safety minimum scenario, which would defer renewals as long as possible while maintaining basic operability and require ceasing the majority of enhancements. This option is not considered viable alongside TfL’s modernisation plans, with reliability and productivity suffering and costs escalating;
• Financially constrained scenario, to deliver a more optimal profile of renewals including replacement of rolling stock at end of design life (but no increase in fleet sizes). Includes a reduced programme of enhancements which would fall well short of that expected by national and local policy. While the most critical locations would be improved, this scenario would not be sufficient to realise the ambitions of a green recovery post-COVID, and many opportunities to support development, decarbonisation and improvements to our services would not be realised
• Policy consistent scenario, this would be much closer to the aspirations set by local and national Government policy. As well as adequate spending on renewals, we would deliver substantial decarbonisation by 2030, prevent a car-led recovery and invest to improve our services and support development of new homes and jobs.
2.15 Combining the assumptions above on capital and passenger demand achieves the four financial scenarios defined below. Further detail of these scenarios, including the financial tables is set out in Section 2.5.
Table 1: TfL Financial Sustainability Plan scenarios

12
Passenger demand scenario
Long term capital planning scenario
VED / Greater London Boundary assumption
Operating and capital funding requirement
post 2023-2030 Decarbonise by 2030
Hybrid (+) Policy consistent £500m per annum VED or Greater London Boundary
Charge
£1.6bn capital funding
Limited recovery
Hybrid Constrained £500m per annum VED or Greater London Boundary
Charge
£1.0bn capital funding
Managed decline
Hybrid (-) Safety minimum £500m VED £300m both operating and capital funding
Rapid decline
London declines
Safety minimum None £1.6bn operating funding
2.16 In the first two scenarios, the assumption is an additional £500m income is generated from retaining London’s VED or from introducing a Greater London Boundary Charge to deliver key Mayor’s Transport Strategy (MTS) objectives and raise essential funds needed to operate the transport network and the provision of other sustainable travel options. This funding is required to cover elements of capital spend which fall in TfL’s operating account, including bus and streets capital expenditure and renewals. The third scenario assumes £500m from VED retention, but that the Greater London Boundary Charge would not be considered due to an inability to invest in public transport services to take up displaced car usage. The fourth scenario assumes no additional levers to raise the £500m. All scenarios include TfL savings assumptions outlined in Chapter 5.
2.17 TfL’s strongly recommended option is Decarbonise by 2030, and this scenario is therefore modelled by business area in section 3 of the Executive Summary and Chapter 3 of the main document. This scenario is the only option which includes adequate funding to meet the Government’s ambitious Net Zero climate change contributions by 2050, of which the transport sector and London’s economy are key components. Additionally, this is the only option which invests to modernise and advance technology of outdated assets and practices and makes rapid progress against wider safety objectives.
3 Chapter 3: Economic fundamentals of TfL business areas 3.1 Chapter 3 sets out details of TfL’s major business areas: Buses and streets, Rail and Tube, and Housing and
Land, including major challenges faced and the varying degrees to which the business areas were on track to achieve financial sustainability pre pandemic.
TfL Group
3.2 Prior to the pandemic, TfL had made significant progress towards financial sustainability on an operating basis (including renewals and financing costs), with a plan to breakeven the cost of operations, maintenance, financing costs and core renewals by 2022/23. However, even prior to the pandemic there remained significant challenges associated with how to fund the capital plan on a long term sustainable basis, including major capital renewals / enhancements (such as replacement investment in life expired rolling stock and signalling).
3.3 While historically TfL has been able to borrow to fund its capital plans, the fact that its debt burden has now reached the limits of affordability means it can no longer continue to borrow significantly in the future. As a result, from 2025 onwards, prior to the pandemic there was expected to be a shortfall of around £1bn per annum in constant prices to deliver the 2019 capital plan.
3.4 The impact of the pandemic has required grant funding to support TfL’s operations as shown by the significant drop in income in Table 2. By 2023/24, TfL can cover the costs of operations, maintenance and financing costs, by 2024/25 it can also start to cover the cost of its core renewals. This assumes £500m funding is received from retained VED or the Greater London Boundary Charge, which is required to cover elements of capital spend which fall in TfL’s operating account and achieve desired policy outcomes, including bus and streets capital expenditure and renewals. For the remaining renewals and enhancements and to decarbonise by 2030, TfL requires £1.6bn per annum.

13
3.5 Note figures relating to the FSP in tables throughout this document are in nominal prices until 2024/25, and thereafter in 2024/25 constant prices.
Table 2: TfL Group position for Decarbonise by 2030
1. Decarbonise by 2030
Hybrid (+) demand + policy consistent capital scenario + £500m per annum from Greater London Boundary Charge or VED retention = Capital funding requirement (including renewals) of £1.6bn average per annum from 2023-30
Ave per annum
Ave per annum
(£m) 20/21 21/22 22/23 23/24 24/25 25/26 26/27 27/28 28/29 29/30 2023-30 2030-40
Passenger Income
1,480 3,276 4,720 5,265 5,684 5,816 6,015 6,222 6,428 6,626 6,008 6,774
Other income 769 1,267 1,992 2,392 2,886 2,836 2,788 2,761 2,743 2,704 2,730 2,714
BRR 969 699 788 706 720 720 720 720 720 720 718 720
Other Grant 87 18 19 14 14 14 14 14 14 14 14 14
Total Income 3,305 5,259 7,519 8,377 9,304 9,385 9,537 9,716 9,905 10,064 9,470 10,221
Operating Cost (6,655) (7,009) (7,481) (7,815) (8,336) (8,325) (8,356) (8,396) (8,449) (8,480) (8,308) (8,480)
Financing (458) (510) (504) (528) (563) (474) (474) (471) (471) (471) (493) (471)
Net Cost of Operation
(3,807)
(2,259) (467) 34 404 586 707 849 985 1,113 668 1,271
Capital Renewals
(366) (805) (872) (1,059) (1,101) (1,240) (1,167) (1,135) (1,235) (1,257) (1,171) (1,195)
Capital Investment (913) (1,410) (1,543) (1,604) (1,700) (2,606) (2,785) (2,813) (2,645) (2,483) (2,376) (1,986)
Capital Funding 1,751 1,346 1,366 1,563 1,341 1,309 1,252 1,228 1,183 1,260 1,305 1,184
Net Surplus (Deficit)
(3,336)
(3,127) (1,515) (1,065) (1,055) (1,950) (1,993) (1,871) (1,712) (1,367) (1,573) (727)
Debt repayment - - - - (185) (179) (358) (349) (336) (324) (247) (257)
Net Surplus (Deficit) including debt repayment
(3,336)
(3,127) (1,515) (1,065) (1,240) (2,129) (2,351) (2,219) (2,049) (1,691) (1,821) (984)
Figures in the table are in nominal prices until 2024/25, and thereafter in 2024/25 constant.
Buses and streets
3.6 The role of TfL as the commissioning authority and regulator of privately-operated bus services in London has been shown to be successful and flexible, with other UK cities aspiring to adopt this as a model. The ‘London model’ successfully leverages private sector investment, innovation and management, but ensures buses go where they are needed and are affordable to use.
3.7 The key financial characteristics for buses are:
• Capital investment in bus renewals and enhancements to the capacity of the bus network are delivered through the bus operating contracts, leveraging private sector investment, and therefore show as operating costs (rather than capital). This efficient off-balance sheet financing model means that buses have a relatively higher operating cost and lower capital investment requirement compared to other modes where TfL makes all the capital investment directly.
• Statutory fares structures mean bus income is insufficient to fund operating costs even after the application of the full amount of TfL’s operating business rates to this area.
14
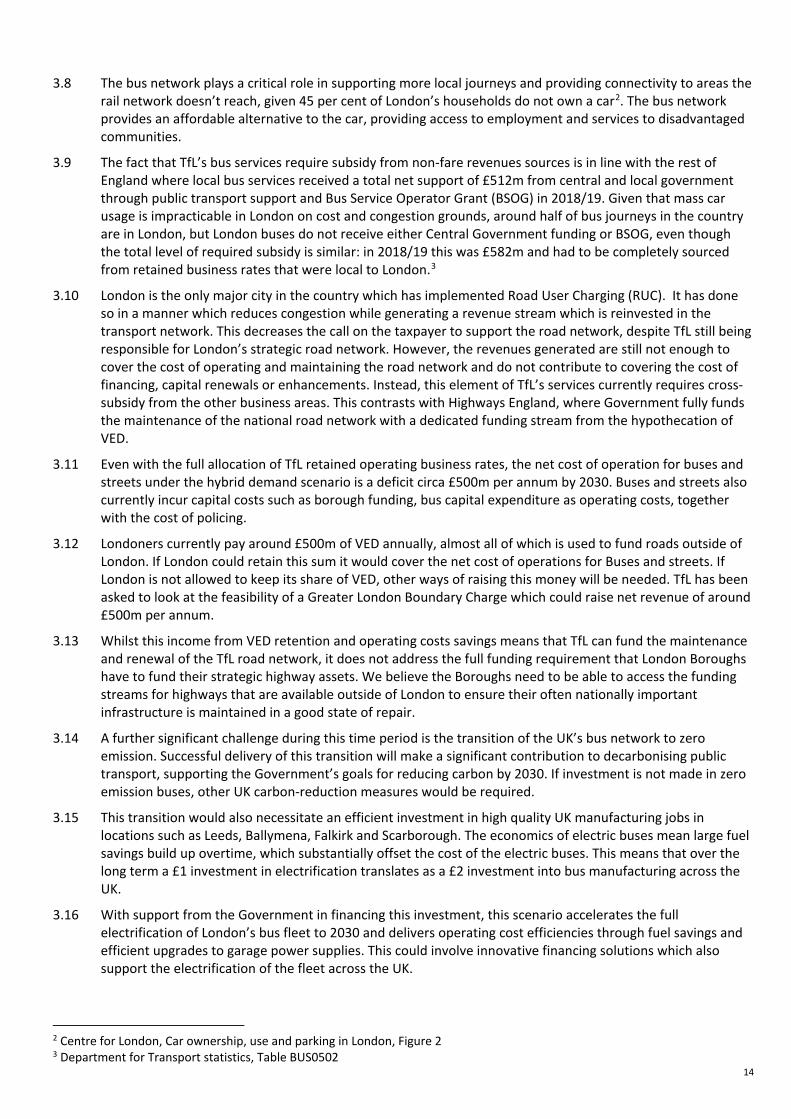
3.8 The bus network plays a critical role in supporting more local journeys and providing connectivity to areas the rail network doesn’t reach, given 45 per cent of London’s households do not own a car2. The bus network provides an affordable alternative to the car, providing access to employment and services to disadvantaged communities.
3.9 The fact that TfL’s bus services require subsidy from non-fare revenues sources is in line with the rest of England where local bus services received a total net support of £512m from central and local government through public transport support and Bus Service Operator Grant (BSOG) in 2018/19. Given that mass car usage is impracticable in London on cost and congestion grounds, around half of bus journeys in the country are in London, but London buses do not receive either Central Government funding or BSOG, even though the total level of required subsidy is similar: in 2018/19 this was £582m and had to be completely sourced from retained business rates that were local to London.3
3.10 London is the only major city in the country which has implemented Road User Charging (RUC). It has done so in a manner which reduces congestion while generating a revenue stream which is reinvested in the transport network. This decreases the call on the taxpayer to support the road network, despite TfL still being responsible for London’s strategic road network. However, the revenues generated are still not enough to cover the cost of operating and maintaining the road network and do not contribute to covering the cost of financing, capital renewals or enhancements. Instead, this element of TfL’s services currently requires cross-subsidy from the other business areas. This contrasts with Highways England, where Government fully funds the maintenance of the national road network with a dedicated funding stream from the hypothecation of VED.
3.11 Even with the full allocation of TfL retained operating business rates, the net cost of operation for buses and streets under the hybrid demand scenario is a deficit circa £500m per annum by 2030. Buses and streets also currently incur capital costs such as borough funding, bus capital expenditure as operating costs, together with the cost of policing.
3.12 Londoners currently pay around £500m of VED annually, almost all of which is used to fund roads outside of London. If London could retain this sum it would cover the net cost of operations for Buses and streets. If London is not allowed to keep its share of VED, other ways of raising this money will be needed. TfL has been asked to look at the feasibility of a Greater London Boundary Charge which could raise net revenue of around £500m per annum.
3.13 Whilst this income from VED retention and operating costs savings means that TfL can fund the maintenance and renewal of the TfL road network, it does not address the full funding requirement that London Boroughs have to fund their strategic highway assets. We believe the Boroughs need to be able to access the funding streams for highways that are available outside of London to ensure their often nationally important infrastructure is maintained in a good state of repair.
3.14 A further significant challenge during this time period is the transition of the UK’s bus network to zero emission. Successful delivery of this transition will make a significant contribution to decarbonising public transport, supporting the Government’s goals for reducing carbon by 2030. If investment is not made in zero emission buses, other UK carbon-reduction measures would be required.
3.15 This transition would also necessitate an efficient investment in high quality UK manufacturing jobs in locations such as Leeds, Ballymena, Falkirk and Scarborough. The economics of electric buses mean large fuel savings build up overtime, which substantially offset the cost of the electric buses. This means that over the long term a £1 investment in electrification translates as a £2 investment into bus manufacturing across the UK.
3.16 With support from the Government in financing this investment, this scenario accelerates the full electrification of London’s bus fleet to 2030 and delivers operating cost efficiencies through fuel savings and efficient upgrades to garage power supplies. This could involve innovative financing solutions which also support the electrification of the fleet across the UK.
2 Centre for London, Car ownership, use and parking in London, Figure 2 3 Department for Transport statistics, Table BUS0502

15
Rail and Tube
3.17 LU operates a largely vertically integrated model, whereby the majority of operational and maintenance staff are directly employed. Prior to the pandemic, it was one of the only major metro operators in Europe and North America to be able to cover its own operating, maintenance and finance costs and was on track to provide significant operating surplus for renewals and enhancements.
3.18 Prior to the pandemic, LU was forecasting a direct operating surplus of £1.2bn by 2022/23 and was also targeting to start covering its longer term capital costs for baseline renewals. The pandemic has thrown off LU’s trajectory to become self-sustaining, with TfL forecasting in its latest submission and publication of the Greater London Authority (GLA) Budget4 a direct operating deficit of £430m in 2021/22 compared to the £1bn surplus target as in the 2019 Business Plan. With the additional delay to the opening of the Elizabeth line, this area is not forecast to achieve a surplus in the current planning period.
3.19 It should be noted that the achievement of much of the current programme of operating efficiencies in London Underground designed to drive modernisation of current working practices and improvements in productivity (outlined in Chapter 5 in Section 5.3) will require capital investment in new trains and signalling that is currently not funded. This is required given the age of certain assets (for example the Bakerloo line fleet which was introduced in 1972). This therefore represents a key risk to the achievement of savings and to this business area achieving financial sustainability.
3.20 Rail (defined as London Overground, Docklands Light Railway (DLR), London Trams and TfL Rail) utilises a concession model for its operations but retains responsibility for capital expenditure. On the DLR and London Trams, TfL owns all the infrastructure, but London Overground and TfL Rail mainly operate on Network Rail infrastructure under track access agreements.
3.21 In the past major rolling stock deals in Rail have been facilitated by the off-balance sheet accounting treatment of operating leases. Due to recent changes in lease accounting rules, future rolling stock deals will be on balance sheet and will therefore impact Government borrowing.
3.22 While Rail was not yet generating an overall surplus, it was planning to invest in its assets from capital business rates to improve these services – including introducing new rolling stock on London Overground and DLR, thereby growing income and moving towards a net operating surplus over time.
3.23 From 2022/23, Crossrail is expected to make a net operating surplus, which will make a significant contribution to the financial sustainability of the Rail business area.
3.24 Furthermore, the Rail and Tube business area is unable to cover the full extent of its capital renewals, and we will need to consider options on how to close that gap. As a result, and given TfL’s borrowing is already at its limits, TfL believes that further Government grant is likely to be required to support capital investment for enhancements while the Rail and Tube business rebuilds to turn a surplus and can borrow sustainably again in the future. This was also recognised in the October 2020 funding agreement.
3.25 While the Tube upgrade programme and the creation and improvement of the Overground and TfL Rail has dramatically improved services for many, those living and working in south London depend more on National Rail for their travel and do not receive the same level of service as elsewhere in London. TfL is willing to work with Government to address this inequality and improve services for those Londoners that are dependent on National Rail services. However, TfL will need appropriate financial support to do so.
Housing and Land
3.26 TfL established its Commercial Development function in 2012 to transform the organisation’s approach to property and consolidate activity relating to the maximisation of value from its land and estate across London.
3.27 As part of the ongoing professionalisation of Commercial Development, TTL Properties Limited (TTLP) was set up in 2014 to hold TfL’s shares in Earls Court Properties Limited (ECPL), TfL’s first major property joint venture. TTPL subsequently became the corporate structure for all commercial property activity within TfL.
4TfL’s submission to the GLA Budget was approved by TfL Board on 9 December 2020

16
Given the current funding challenges and the need to deliver long term stable income growth, TfL has been considering new funding and structuring options for TTLP that would not rely on TfL for any funding.
3.28 TTLP is unique in its position to deliver housing. All TTLP’s development sites have an operational interface, most often with LU. Development adjacent to the rail network is notoriously complex, for example South Kensington, which has a complex programme of interlinked station works and surrounding development. This complexity is simplified by the fact that both teams operate within the same organisation and as such are able to effectively unpick these challenges. TTLP’s most straightforward development sites are LU car parks, though even here current examples are requiring TTLP, alongside the housing, to provide new step free access (Stanmore), new train crew accommodation (Cockfosters) and a new station entrance (Hounslow West).
3.29 Its strategy is based on growing recurring long term income from its land and property activities to provide a source of income towards TfL’s annual operating cost, rather than one-off receipts which would be quickly exhausted. This includes setting out to be one of the largest Build to Rent providers in London with TfL’s major strategic partnership with Grainger Plc, and where necessary to dispose of surplus non-operational assets to generate capital receipts which can be reinvested in TfL’s property business. The current capital plan also includes costs to produce a new head office hub as part of the existing efficiency plans to reduce TfL’s annual operating costs.
3.30 TTLP’s existing investment programme, which totals £1bn over 10 years and delivers 10,000 homes, was devised to require no call upon TfL’s group funding arrangements so that no net transport infrastructure funding would be diverted into property. In the short term, however, there is a net investment required to kick start the housing programme, and hence prior to the coronavirus pandemic, housing and property projects were effectively competing for funding with TfL’s transport-related activity. The impact of the pandemic has further constrained TfL’s ability to make the investment needed to deliver both the new homes and the additional income projected in the current plan, meaning it is at risk and potentially undeliverable.
3.31 However, there is an opportunity to use TTLP’s income stream and asset base to raise commercial funding for future investment. This would require an initial injection of funding from Ministry of Housing, Communities and Local Government (MHCLG), and an ability for TTLP to borrow to raise further capital in the future to reinvest in housing and public services. This would also increase the ambition to deliver 2,000 homes per annum, or up to 50,000 homes over a 25-year period.
3.32 Subject to understanding the appetite and constraints for Government in working in partnership with TTLP, TfL proposes to develop and refine the capital structure options. This will include taking legal and financial advice, producing full value for money analyses, market-testing options, and reviewing the technical feasibility and accounting impacts.
4 Chapter 4: Becoming an economic and efficient operator and the public service obligation
4.1 Chapter 4 of the Financial Sustainability Plan provides an outline of how a clear set of objectives for Structural reform to support the ambition of becoming a more economic and efficient operator could be formulated. This includes a revised planning framework over “control periods” along with new public service obligations and general principles for the management of the strategic transport network on an economic and efficient basis, subject to greater independent assurance and being underpinned in statute.
4.2 Critical to becoming an economic and efficient operator is having sufficient stability of funding to enable TfL to plan and make commitments over the medium to long term.
4.3 The funding crisis has highlighted the lack of an adequate public service obligation for the mass transit services TfL provides, not only for rail and bus transport but also for safer roads, active travel and air quality and decarbonisation. This should be addressed as a matter of urgency. Creating enhanced and clear statutory public service obligations through primary legislation, within which TfL would be required to operate, could enable better recognition of the criticality of TfL’s network and ensure continuity of the services it provides and associated certainty for the maintenance of that network in a good state of repair.
4.4 The local government Section 114 process is not designed for an organisation such as TfL. There is also no statutory mechanism for an operator or funder of last resort. As such the current statutory framework does

17
not reflect the critical importance of TfL’s network and the services it provides as part of a national transport system. A permanent mechanism to ensure the network can be funded to keep going in times of crisis such as the current pandemic needs to be established.
4.5 TfL’s spending plans are currently subject to annual budgets and annual caps on borrowing agreed with Government. This is inconsistent with the commitments we need to make to projects that take many years to design and build and an asset portfolio with an average economic life of 30 years that, in order to be economic and efficient, requires a whole life approach to maintenance and investment.
4.6 We want to discuss with Government the potential for a ‘Revised Structural Framework’ that addresses these issues and enables commitments and relationships to support a more stable and certain programme of service provision and investment, in order to maximise the economic dividend that a devolved London can bring both locally and nationally. This should be while maintaining the benefits of devolution and our role as an integrated transport authority, including the Mayor’s role in setting fares and the transport strategy outcomes that TfL works to deliver.
4.7 Without a clear picture of future resources, TfL simply cannot plan for the future of its network and optimise the benefits it can bring nationally. This short term approach and lack of certainty undermines the ability of the supply chain to invest, limiting job creation, skills development and ability to command more efficient prices for work – for TfL and other transport operators in the UK and beyond.
4.8 TfL therefore faces similar challenges to other transport bodies, such as Highways England prior to its reform. In developing “Action for Roads”, the Department for Transport (DfT) developed a compelling case for fundamental change to the Highways Agency and its relationship with Government to resolve the precise challenges TfL itself now faces. Reform in this area has created a long term, sustainable solution for national and local roads programmes under the Highways Agency’s purview. Other vital public services, such as Network Rail and other utilities, also benefit from a framework of regulation that sets out clear processes grounded in statute for setting high level outputs, financing and investment over the medium term.
4.9 The introduction of a Revised Structural Framework for TfL, taking some of the relevant principles of the sort commonly used to regulate rail networks, airports and other forms of utility type infrastructure, would enable TfL to achieve equivalent security of funding, where better medium to long term planning and greater assurance can deliver more efficient decision making and value for money.
5 Chapter 5: Achieving financial sustainability 5.1 Chapter 5 of the Financial Sustainability Plan sets out the detail of the proposals to address the financial
sustainability challenge outlined above.
5.2 TfL has been very successful as city planner, system integrator, network manager, operator and capital delivery body. However, the current funding model, in place since 2015, and the reliance on fares and annual cycle of decision making are adversely impacting its ability to be an economic and efficient operator. To address this, we have developed a comprehensive plan to put TfL on a financially sustainable footing in the long term.
5.3 Even before the consideration of this Financial Sustainability Plan, TfL was committed to doing everything possible and within its control to recover demand for services more quickly than the scenarios suggested. This includes making services as attractive to customers as possible, through extensive cleaning regimes, safety procedures and marketing campaigns to reinstate passenger confidence. The opening and full running of services on the Elizabeth line will also impact on TfL’s revenues, hence the early transfer of the project to TfL and its Commissioner to achieve the earliest possible opening date.
5.4 The further proposals recommended by TfL that are outlined in this plan are summarised in
Table 3 below, together with references to where they are described in the main body of the document. The Independent Review noted a number of related proposals in their report, and these have been considered when finalising the proposals below.
18
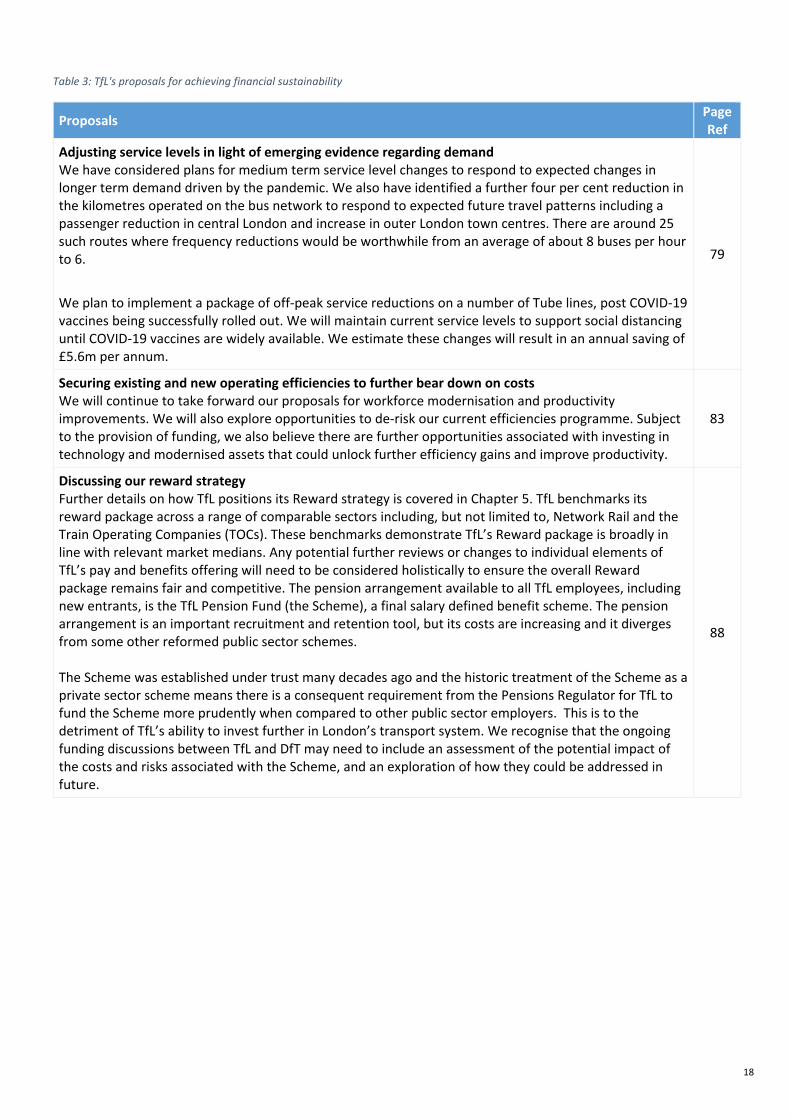
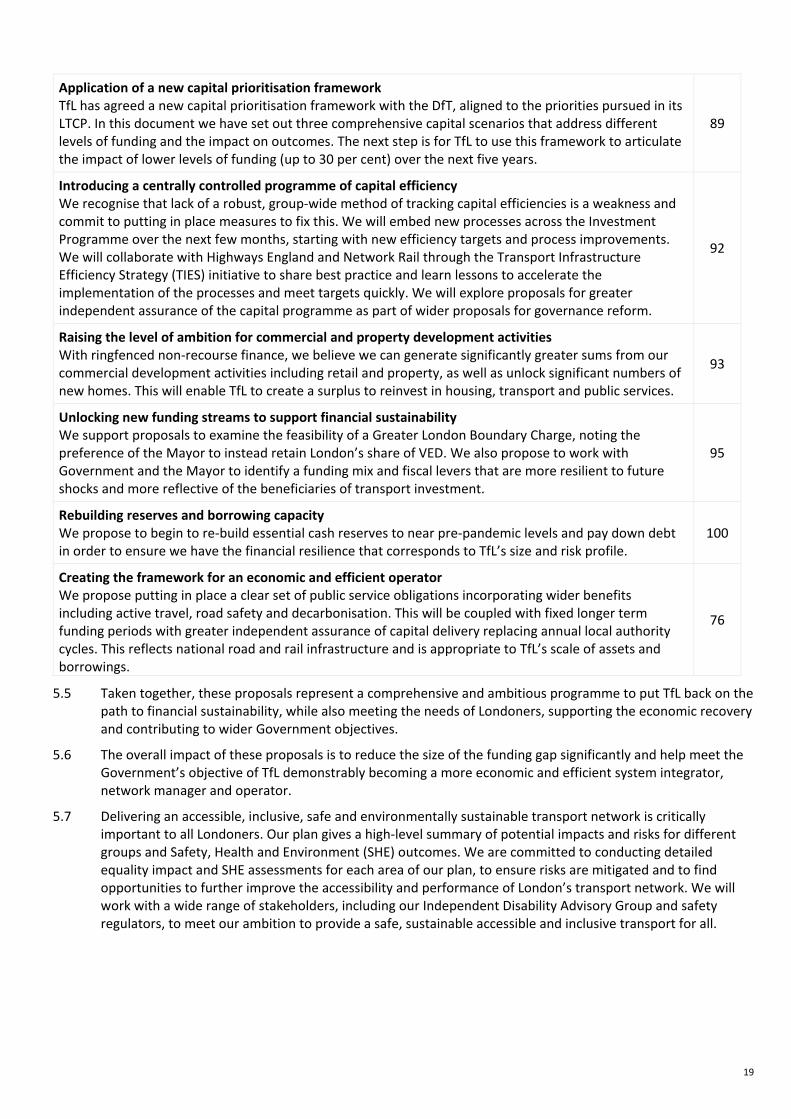
Table 3: TfL's proposals for achieving financial sustainability
Proposals Page Ref
Adjusting service levels in light of emerging evidence regarding demand We have considered plans for medium term service level changes to respond to expected changes in longer term demand driven by the pandemic. We also have identified a further four per cent reduction in the kilometres operated on the bus network to respond to expected future travel patterns including a passenger reduction in central London and increase in outer London town centres. There are around 25 such routes where frequency reductions would be worthwhile from an average of about 8 buses per hour to 6. We plan to implement a package of off-peak service reductions on a number of Tube lines, post COVID-19 vaccines being successfully rolled out. We will maintain current service levels to support social distancing until COVID-19 vaccines are widely available. We estimate these changes will result in an annual saving of £5.6m per annum.
79
Securing existing and new operating efficiencies to further bear down on costs We will continue to take forward our proposals for workforce modernisation and productivity improvements. We will also explore opportunities to de-risk our current efficiencies programme. Subject to the provision of funding, we also believe there are further opportunities associated with investing in technology and modernised assets that could unlock further efficiency gains and improve productivity.
83
Discussing our reward strategy Further details on how TfL positions its Reward strategy is covered in Chapter 5. TfL benchmarks its reward package across a range of comparable sectors including, but not limited to, Network Rail and the Train Operating Companies (TOCs). These benchmarks demonstrate TfL’s Reward package is broadly in line with relevant market medians. Any potential further reviews or changes to individual elements of TfL’s pay and benefits offering will need to be considered holistically to ensure the overall Reward package remains fair and competitive. The pension arrangement available to all TfL employees, including new entrants, is the TfL Pension Fund (the Scheme), a final salary defined benefit scheme. The pension arrangement is an important recruitment and retention tool, but its costs are increasing and it diverges from some other reformed public sector schemes. The Scheme was established under trust many decades ago and the historic treatment of the Scheme as a private sector scheme means there is a consequent requirement from the Pensions Regulator for TfL to fund the Scheme more prudently when compared to other public sector employers. This is to the detriment of TfL’s ability to invest further in London’s transport system. We recognise that the ongoing funding discussions between TfL and DfT may need to include an assessment of the potential impact of the costs and risks associated with the Scheme, and an exploration of how they could be addressed in future.
88
19
Application of a new capital prioritisation framework TfL has agreed a new capital prioritisation framework with the DfT, aligned to the priorities pursued in its LTCP. In this document we have set out three comprehensive capital scenarios that address different levels of funding and the impact on outcomes. The next step is for TfL to use this framework to articulate the impact of lower levels of funding (up to 30 per cent) over the next five years.
89
Introducing a centrally controlled programme of capital efficiency We recognise that lack of a robust, group-wide method of tracking capital efficiencies is a weakness and commit to putting in place measures to fix this. We will embed new processes across the Investment Programme over the next few months, starting with new efficiency targets and process improvements. We will collaborate with Highways England and Network Rail through the Transport Infrastructure Efficiency Strategy (TIES) initiative to share best practice and learn lessons to accelerate the implementation of the processes and meet targets quickly. We will explore proposals for greater independent assurance of the capital programme as part of wider proposals for governance reform.
92
Raising the level of ambition for commercial and property development activities With ringfenced non-recourse finance, we believe we can generate significantly greater sums from our commercial development activities including retail and property, as well as unlock significant numbers of new homes. This will enable TfL to create a surplus to reinvest in housing, transport and public services.
93
Unlocking new funding streams to support financial sustainability We support proposals to examine the feasibility of a Greater London Boundary Charge, noting the preference of the Mayor to instead retain London’s share of VED. We also propose to work with Government and the Mayor to identify a funding mix and fiscal levers that are more resilient to future shocks and more reflective of the beneficiaries of transport investment.
95
Rebuilding reserves and borrowing capacity We propose to begin to re-build essential cash reserves to near pre-pandemic levels and pay down debt in order to ensure we have the financial resilience that corresponds to TfL’s size and risk profile.
100
Creating the framework for an economic and efficient operator We propose putting in place a clear set of public service obligations incorporating wider benefits including active travel, road safety and decarbonisation. This will be coupled with fixed longer term funding periods with greater independent assurance of capital delivery replacing annual local authority cycles. This reflects national road and rail infrastructure and is appropriate to TfL’s scale of assets and borrowings.
76
5.5 Taken together, these proposals represent a comprehensive and ambitious programme to put TfL back on the path to financial sustainability, while also meeting the needs of Londoners, supporting the economic recovery and contributing to wider Government objectives.
5.6 The overall impact of these proposals is to reduce the size of the funding gap significantly and help meet the Government’s objective of TfL demonstrably becoming a more economic and efficient system integrator, network manager and operator.
5.7 Delivering an accessible, inclusive, safe and environmentally sustainable transport network is critically important to all Londoners. Our plan gives a high-level summary of potential impacts and risks for different groups and Safety, Health and Environment (SHE) outcomes. We are committed to conducting detailed equality impact and SHE assessments for each area of our plan, to ensure risks are mitigated and to find opportunities to further improve the accessibility and performance of London’s transport network. We will work with a wide range of stakeholders, including our Independent Disability Advisory Group and safety regulators, to meet our ambition to provide a safe, sustainable accessible and inclusive transport for all.

20
6 Chapter 6: Bridging the gap 6.1 We recognise that many of the proposals set out in this document will take time to develop and implement
and will require significant collaboration between the Government and the Mayor and TfL to ensure successful delivery. We are also aware of the course of the pandemic as we enter a second winter, and that the impact on TfL’s demand is not solvable in the short term by these proposals. A small number of the proposals are however solvable over the next few months, including further analysis of capital investment options. TfL will press ahead with the delivery of these to ensure it is set up to negotiate a sustainable funding deal. A timeline showing proposed next steps and delivery milestones is shown in Section 6.4.
6.2 The contents of this document show that in the medium term TfL can start to close the gap on net cost of operations excluding capital investment and some core renewals across all modes. On buses and streets, post 2023/24 the total funding gap is on average £300m per annum, assuming hypothecation of Business Rates Retention (BRR) and either VED retention or implementation of a Greater London Boundary Charge. However, there is a significant capital investment funding gap on Tube and Rail, where the required capital investments in rolling stock and signalling replacements are substantially more costly.
6.3 It is clear that for TfL to support Government in the delivery of its 10 point decarbonisation plans, and to be able to unlock modernisation and productivity improvements required across the ageing network, funding for enhancements and capital investment is required, with an average group position of £1.6bn per annum additional funding required. Without this funding, TfL would lose out on playing its part in delivering Government objectives for building homes, creating jobs across the UK in sustainable and long standing industries, and making significant progress against Net Zero CO2 emissions by 2030.
6.4 The £1.6bn funding requirement could be achieved by the levers outlined by the London Finance Commissions and TfL’s Independent Review, including retention of VED or Value-added tax (VAT) for London, reformed council tax proposals, other property taxes including stamp duty and capital gains tax, land value capture for major new schemes, RUC above what is already assumed, or additional grant funding.
6.5 With appropriate upfront investment in its housing programme, TfL can maximise creation of value from existing land, which creates the ability to continue raising further capital in future and creating a surplus to reinvest in housing, transport and public services. This would also increase TfL’s ambition to deliver 2,000 homes per annum, or up to 50,000 homes over a 25-year period.
6.6 A reformed structure will be required for TfL to efficiently and economically deliver its ambitions and support the Government decarbonisation plans over the medium to long term. Introducing multi-year ‘control periods’ to give certainty of funding will enable better planning of services and projects. TfL also does not currently have agreement of a minimum service, which should urgently be agreed between the Mayor, Government and TfL.
6.7 Government support will be needed in 2022/23 and potentially beyond dependent on the speed with which the necessary funding schemes can be put in place. TfL’s proposal is therefore for the 2020 H2 funding arrangements to continue through 2021/22, including Government taking revenue risk and TfL taking cost risk. In the period between now and early March 2021 TfL and the Government should work to agree the £3.1bn funding needed for 2021/22 to ensure a settlement is in place ahead of the existing funding deal expiring. TfL, the Mayor and Government should then focus resource on working on a long-term solution from 2022/23 onwards, with the delivery of some of the proposals set out in this document. Similar to the 2020 H2 funding agreement, Government would take revenue risk until a stable demand projection is clear and public transport objectives are agreed.

21
1. Strategic Context This Chapter sets out TfL’s critical role in supporting the London and UK economy, and its contribution to wider Government objectives, in order to frame the requirement for ensuring the provision of transport in London is put on a financially sustainable basis.
Chapter Summary
TfL’s vital role in London London is a densely populated city, which has witnessed significant growth in recent decades. As in most
large cities, it has a busy centre with world-class economic, educational and cultural institutions, which can only function if people from a wide area (both suburbs and areas outside the city) are able to travel medium and long distances from their homes into the dense centre. The density and accessibility of London’s central zone, made possible by its transport system, means that residents and visitors can lead more carbon-friendly lifestyles.
London’s density and accessibility also means that the city’s future growth can be supported with a lower incremental carbon burden compared to other forms of development in less accessible areas. London’s density also supports network effects which enhance the city’s productivity, leading to higher Gross Domestic Product (GDP): a dense transport network in a dense city allows London to continue to contribute significantly to the UK economy, and be a part of a UK which can compete globally post-Brexit and post-pandemic. In addition, London has numerous residential communities across 33 boroughs with their own local amenities, which require people to be able to travel, this time over shorter distances, to access communal services, employment and businesses. Transport not only supports the economy and key services but is also vital to the environment and public health, both of which need to be improved in the coming years. These challenges are shared by other cities across the UK.
All of these diverse needs mean that the requirements of a large city’s transport network are complex and must accomplish a wide variety of things. London needs a high-capacity rail network to support large numbers of people travelling medium and long distances, and connecting between cities, so that wealth and
TfL plays a critical role in supporting London and the UK economy and contributes to wider Government objectives. As such it is vital it has a sustainable financial platform.
London was responsible for 23 per cent of the UK’s total GDP in 2018 and was a net contributor of £38.9bn in taxes to HM Treasury. As TfL is critical to the success of London, it is also therefore critical to the success of the national economy and HM Treasury’s tax base.
TfL’s services drive economic activity, jobs, innovation across the UK; create healthy, connected communities; and attract global interest to live, work and visit London.
TfL also plays a key role in delivering wider national objectives. This includes supporting the recovery from the pandemic through investment in infrastructure, innovation and people; improving health outcomes through active travel and air quality; and strengthening the UK’s place in the world.
TfL’s projects and programmes also provide many opportunities to drive innovation, investment and environmental sustainability across the UK transport community and industry supply chain.
If TfL is not put on a financially sustainable footing, this will reduce the resilience of not only the capital’s economy, but also the supply chain, with adverse impacts on the efficiency of the transport system nationally. There would be negative consequences for both the UK economy and HM Treasury tax receipts without a highly effective TfL to support London’s recovery and future success.

22
productivity can be shared. It needs a bus network to support more local journeys, provide connectivity to areas the rail network doesn’t reach, and offer an affordable alternative to the car. It needs to support people walking and cycling for the benefit of their local economy, environment and health. It needs roads that can efficiently support the movement of freight and people, without damaging impacts on health and wellbeing. It needs to be able to adapt to innovations such as ride hailing apps and micro mobility. Finally, new areas with potential to accommodate additional homes and jobs need to be invested in and connected to the rest of the city so they can achieve their potential to contribute to economic growth.
Since 2000 TfL has been responsible for planning, operating, maintaining and improving London’s strategic transport network. It was established as the integrated transport authority of the newly devolved Greater London Authority (GLA) accountable to the Mayor of London. It was created to provide safe, integrated, efficient and economic transport for all those living in, working in and visiting the nation’s capital.
Since then, TfL has created a network which now includes London Underground (LU), the buses, the Transport for London Road Network (TLRN), London Overground, TfL Rail, the Docklands Light Railway (DLR), London Trams, Santander Cycles, river services, Emirates Air Line and provides licensing to taxi and private hire vehicles. This has brought socio-economic and environmental benefits to the city and its transport network.
TfL acts as spatial and transport planner, policy-maker, operator, maintainer, innovator, regulator, commissioner, curator, convenor and provides housing and delivery of a pipeline of capital projects.
Prior to TfL’s establishment, transport services in London were provided by separate public entities and had suffered from historical underinvestment. The recently Independent Review, published in December 2020, noted that a key strength of the current model is TfL’s ability to act as an integrated authority. This enables to TfL to:
• Balance demand and supply across the different modes (rather than each service operating in a silo); • Provide a coherent service and proposition to customers (including branding, journey planning tools,
fares and ticketing); • Use revenues from one mode to fund improvements to another, creating flexibility in where
improvements can be made; and • Take a clearer overview of the needs of London than more fragmented arrangements, which enables it
to take better account of wider needs and deliver benefits beyond direct optimisation of transport operations.
TfL’s story over the past two decades is one of continually improving safety, efficiency and the customer experience. It has made safety the first priority, introduced integrated ticketing and customer information, contactless payment, the congestion charge and supported the 2012 Olympic Games. It launched its free open data policy which has stimulated huge innovation on the part of third-party apps and other product developers, all supporting more efficient public transport. This has resulted in more people choosing to travel by walking, cycling or public transport (51 per cent in 2000 to 63 per cent in 2019) even while the city grew from 7.1 million people in 2000 to 9 million today.
TfL has therefore played a key role in the past 20 years in supporting a period of considerable growth of the UK’s capital city through improvements to the transport network, which in turn have enabled the population and economy to grow substantially, boosting the UK economy and quality of life for millions of people.
TfL and the London economy Link between public transport services and London’s economy
In connecting businesses to each other, their employees and their customers, transport has a fundamental role to play in supporting the growth of London’s economy. This includes provision of easy access to workplaces, reliable deliveries and servicing, and enabling access to cultural and leisure activities. All of this in turn enables agglomeration effects, leading to employment and higher economic productivity.
Furthermore, accessible public transport helps reduce economic inequalities by providing low-cost, accessible travel options, and helps communities to develop and grow. This includes enabling new, affordable homes, which is especially important given the rate of homebuilding is currently only around half what is required.
23
Transport is key to unlocking housing potential with new rail, bus, cycling and walking links all being necessary. New public transport services will be vital in enabling the 1.3 million new jobs and more than one million new homes that the city has previously been estimated to need by 2041.5
Finally, maintaining and improving London’s transport network will be essential to avoid overcrowding, deteriorating air quality and public spaces becoming ever-more dominated by motor traffic, which all have disproportional effects on the economy and quality of life for Londoners. This will be a key priority post-pandemic in order to ensure London continues to be a place people want to live.
TfL’s success in driving a modal shift over the past decade
London’s economy is largely built on accessibility, starting with its location as the major trading centre for the UK. In 2019, prior to the coronavirus pandemic, more than 9 million trips were made every day by bus, tram, Tube, train and river boat services. At this point, the number of journeys made each day on London’s Underground and rail networks was the same as the rest of the country’s rail services combined. On London’s bus network, a similar number of journeys were made each day as on the rest of the country’s bus services combined, with an average number of bus trips per person over three times the average in England.6
TfL has been highly successful in driving modal shift facilitated by high quality public transport and improving walking and cycling facilities. The number of trips made by walking, cycling or public transport has risen from 51 per cent in 2000 to 63 per cent just before the pandemic.
Use of the public transport system in London has increased by 65 per cent since the year 20007, mostly due to enhanced services and an improved customer experience. Had this shift not taken place, London’s transport CO2 emissions would be around a million tonnes higher per year than they currently are. This has been despite TfL not receiving Central Government grant support towards its operating costs since April 2018, a fall in funding of £1bn a year from 2016/17 and annual funding of TfL now £3.3bn lower than it was in 2010/11 in real terms.8
London’s reduced dependency on private cars has been driven by consistent and bold demand management tools that have also brought in necessary investment, such as the congestion charge, or supported local transport revenues, such as Controlled Parking Zones. The focus on London’s roads network has been explicitly on making most efficient use of the space available to move people, not vehicles. Bus lanes and innovative traffic management prioritise this outcome and the focus on street space allocation to active modes supports it. This has led to road traffic in London reducing by nine per cent between 2000 and 2018, while it has increased by 13 per cent across Great Britain over the same time period.
This has in turn ‘deprioritised’ private car journeys and supported the modal shift to sustainable modes. By providing an efficient and affordable option for journeys that are either impractical or too long to walk or cycle, public transport has helped to reduce Londoners’ dependency on cars during the past 15 years.
This shift to more sustainable transport modes has kept London liveable despite its rapid growth, which is essential if it is to continue contributing to a productive UK economy. It has brought real safety benefits to Londoners, with 65 per cent fewer people killed or seriously injured in 2019 than the 2005 – 2009 average – bucking national trends and those seen in other metropolitan areas.
The shift away from private car use must continue to be able to accommodate the city’s growing demand for travel and ensure that, post-pandemic, London continues to be a place people want to live.
5 Mayor’s Transport Strategy, TfL, March 2018 6 Department for Transport statistics, National Travel Survey, Table NTS9903 7 Mayor’s Transport Strategy, TfL, March 2018 8 Transport Expenditure in London, GLA Economics, January 2020
24
TfL’s role in supporting a green recovery of London’s economy
The restrictions implemented as a core part of the necessary battle against the coronavirus pandemic have temporarily reduced travel and economic activity in London. The pandemic may also impact medium to longer term demand due to the new opportunities arising from remote working.
However, the prospect of widespread distribution of safe and effective vaccines in 2021, and subsequent lifting of restrictions, provides some assurance that a significant proportion of pre-COVID-19 travel demand could return over the course of the year. While the medium to long term impact remains highly uncertain (as set out in Chapter 2), even under conservative estimates of future demand, there remains a very significant baseline of level of services to be maintained.
The GLA and others have also started to analyse London’s economic recovery. While the debate on the future of the city continues, London’s service-related economy and its highly educated workforce mean that it can react flexibly to changing patterns of work9. High property values in Central London suggest vacant buildings will quickly find other uses, and any office space released will be taken up by others or repurposed. Access to the centre will be important for work and amenity purposes. Reports by both the Confederation of British Industry (CBI) and the City of London have emphasised the need for good transport infrastructure as part of the recovery10 11. The GLA have commissioned a substantial piece of research into the future role of the Central Activities Zone which will shape London’s recovery of this economic asset.
As the city begins to recover from the pandemic, TfL can play a key role in supporting a green recovery of London’s economy. TfL’s vision for London is to create a zero-carbon global city, where a sustainable transport network supports a healthy and invigorated capital with opportunity for all. This vision builds on the MTS, which sets the ambitious goal of 80 per cent of all trips being made on foot, by bike or by public transport by 2041.
London already supports a vibrant green economy and TfL can help to grow this by providing sustainable transport options, which will attract new green businesses to the city and support the creation of new green jobs throughout the UK. Above all, it can help avoid a car-based recovery, which will lead to more congestion, choking off London’s recovery, and worsening health issues from poor air quality and a less active population.
Benefits of London and TfL to the wider UK economy Contribution of London to the wider UK economy
London was responsible for 23 per cent of the UK’s total GDP in 2018.12 Growth in London’s economy has been shown to drive growth across the rest of the country,13 and there are many ways in which these spill-over benefits materialise. The rest of the UK is London’s most important trading partner and trade is broadly in balance, so an increase in London’s output will generate greater demand for goods and services from the rest of the UK.14
The higher income through higher productivity that transport projects in London enable results in additional tax revenues. London raises significantly more in tax than it receives, and this surplus benefits the wider UK.15
The Office for National Statistics (ONS) has estimated that London’s total net tax contribution to Her Majesty’s Treasury (HMT) was £38.9bn in 2018/19. This is the largest net tax contribution for any UK region.16
These tax receipts from London help to fund Government spending on education, health and other public services that benefit everyone, not just Londoners. Without a highly effective TfL to support London’s
9 Summarised in Will Coronavirus cause a big city exodus, Overman and Nathan, December 2020 10 CBI London Business Survey, December 2020 11 London Recharged, City of London with Oliver Wyman and Arup, October 2020 12 Regional economic activity by gross domestic product, UK: 1998 to 2018, Office for National Statistics (ONS), December 2019 13 Country and regional public sector finances, ONS, 2017 14 Transport Expenditure in London, GLA Economics, January 2020 15 Transport Expenditure in London, GLA Economics, January 2020 16 Country and Regional Public Sector Finances, FYE 2019: Supplementary Tables
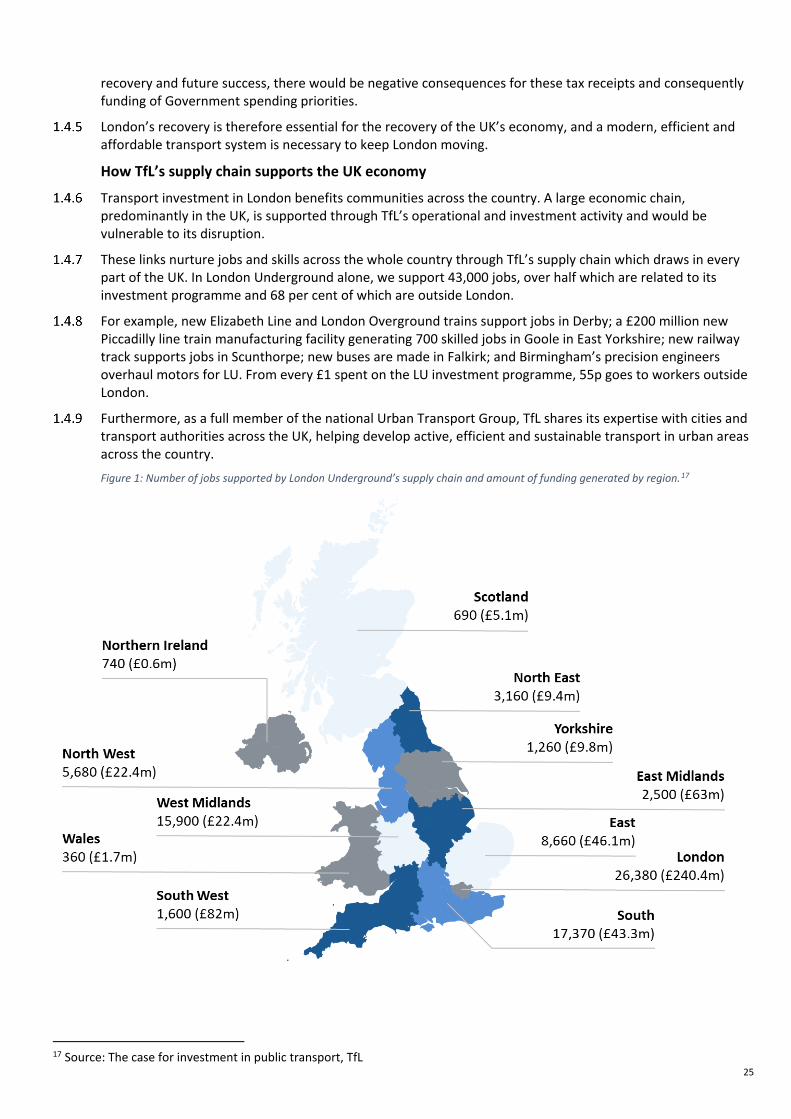
25
recovery and future success, there would be negative consequences for these tax receipts and consequently funding of Government spending priorities.
London’s recovery is therefore essential for the recovery of the UK’s economy, and a modern, efficient and affordable transport system is necessary to keep London moving.
How TfL’s supply chain supports the UK economy
Transport investment in London benefits communities across the country. A large economic chain, predominantly in the UK, is supported through TfL’s operational and investment activity and would be vulnerable to its disruption.
These links nurture jobs and skills across the whole country through TfL’s supply chain which draws in every part of the UK. In London Underground alone, we support 43,000 jobs, over half which are related to its investment programme and 68 per cent of which are outside London.
For example, new Elizabeth Line and London Overground trains support jobs in Derby; a £200 million new Piccadilly line train manufacturing facility generating 700 skilled jobs in Goole in East Yorkshire; new railway track supports jobs in Scunthorpe; new buses are made in Falkirk; and Birmingham’s precision engineers overhaul motors for LU. From every £1 spent on the LU investment programme, 55p goes to workers outside London.
Furthermore, as a full member of the national Urban Transport Group, TfL shares its expertise with cities and transport authorities across the UK, helping develop active, efficient and sustainable transport in urban areas across the country.
Figure 1: Number of jobs supported by London Underground’s supply chain and amount of funding generated by region.17
17 Source: The case for investment in public transport, TfL

26

27
How TfL’s services provide nationally important air, road and rail connections
As a global trading and cultural centre, and as one of the UK’s principal gateways to the world, better international rail and air links are required from London to our global markets. The London airport system (Heathrow, Gatwick, Stansted, Luton, London City and Southend) accounts for circa 60 per cent of all terminal passengers at UK airports, with Heathrow handling the majority of UK’s air freight – 64 per cent in 2018 - followed by East Midlands – 13 per cent.18 TfL supplies many of the vital connections for aviation, as well as the national rail network. High quality international rail services, which are linked by TfL’s network to London and the neighbouring regions, also maintain and strengthen links between the UK and continental Europe’s economic centres. Coupled with improved international air links for destinations further afield, these support economic growth for the entire country, enabling every region to access the global marketplace.
An efficient national strategic road network is needed to cater for the freight, coach services and other traffic that help to keep London and the UK economy operating. In the wider South East and M25 area, in particular, strategic roads must be managed without increasing car dependency within or outside London. TfL’s network, working with Network Rail and Highways England is critical to this objective and progressing to a Net Zero UK transport network.
TfL’s key role in supporting wider Government objectives TfL plays a key role in supporting wider Government objectives. It has a track record of delivering schemes
that help grow the economy, support UK suppliers and encourage lower-carbon and healthy lifestyles. The following sections describe how TfL’s services, and the investment that maintains and improves its underlying infrastructure assets, contributes to key wider Government objectives.
Strengthening the UK’s green recovery
As the UK begins to recover from the pandemic, there is a unique opportunity to shape a green recovery. In June 2019, the UK Government became the first major economy to commit in law to cutting greenhouse gas emissions to “Net Zero” by 2050 and London has a key role to play to ensure the UK meets this target. The Mayor’s vision for London is to create a zero-carbon global city, where a sustainable transport network supports a healthy and invigorated Capital with opportunity for all. In December 2020, following his declaration of a climate emergency, the Mayor brought London’s Zero Carbon target forward to 2030. Reducing London’s carbon emissions will go hand in hand with continuing the recent improvements to the city’s air quality.
Recovery will mean getting people back to work, but this must be done in a way that supports the environment and the health of London’s residents and visitors. Investing in sustainable transport modes can reduce congestion and avoid worsening health issues from poor air quality and a less active population.
London has the lowest CO2 per capita emissions of any region in the UK. This can be attributed to London’s transport system, as well as its high population density and its lower level of industrial facilities than other regions.19 However, despite its low emissions per capita, London’s size results in the capital being responsible for over 10 per cent of England’s carbon dioxide emissions, of which almost 30 per cent come from transport. Encouraging use of more sustainable transport modes and investing to decarbonise London’s transport network will be key in achieving Government’s commitment to Net Zero at a UK level.
Through TfL leading the way on zero-carbon transport and setting and developing standards, it will make it easier for other cities across the UK to follow suit, such as with the ULEZ and Clean Air Zones. These can form the basis of future schemes and help raise public awareness and acceptability and demonstrating effectiveness.
Through London leading the way on driving down emissions and setting tough standards on vehicles in the capital (for example on freight and vans) this results in many of these vehicles subsequently being used across the UK, decreasing emissions from the UK fleet as well as in London. Many companies tend to upgrade whole fleets as a result of our tough standards which broadens the benefits beyond our boundaries.
18 Transport Statistics Great Britain 2019, DfT 19 UK local authority carbon dioxide emissions estimates 2018, BEIS, June 2020
28
TfL estimates that around 3,000 jobs could be secured through investment in our zero-emission bus fleet and enable manufacturers to create around 600 more. TfL has extensive experience in integrating zero-emission buses into our fleet and procure half of all new buses in the UK each year, so TfL can quickly get funding to manufacturers.
TfL is London’s largest consumer of electricity and has embarked on the journey to purchase renewable energy to power all its rail services by 2030, with the ambition to be carbon neutral by 2030. This will play a major role in supporting the Department for Transport’s (DfT) goal for a zero-carbon transport network by 2050, as well as in increasing London’s adaptation and resilience to climate change. The pandemic, however, has resulted in new ways of working that could be accelerated to enable the country to transition to a zero-carbon economy. If this is done successfully and coupled with a carbon neutral transport system, it will boost the economy, create more jobs and help achieve national targets on the environment.
TfL’s supply chain already supports tens of thousands of jobs across the UK. By investing in the decarbonisation of London’s transport network and renewable energy solutions, it will create thousands more jobs and produce innovative solutions, attracting international investment and positioning the UK at the forefront of green innovative technology. This will reduce the cost of technology for wider rollout as seen with London’s investment in hybrid bus technology.
To keep London moving, attractive and resilient to climate changes and future shocks to the economy, the existing transport infrastructure must be kept in a good condition. Targeted and relatively small investments can unlock substantial new capacity.
Prior to the pandemic, TfL carried 49 per cent more people on the Tube and 57 per cent more on buses than in 2001. While the number of bus journeys in Britain has been declining, those in London have been rising, resulting in London representing 46 per cent of all bus journeys compared to 20 per cent in 1986.20 Smart investment will support the further shift to walking, cycling and the use of public transport, with the objective of rising from 63 per cent as it is today to 80 per cent by 2041.21
Active travel
There is longstanding recognition of the interrelation between transport, the environment and health. Transport can affect levels of physical activity, which is a primary contributor to a broad range of chronic diseases such as coronary heart disease, stroke, diabetes and some cancers. Physical activity also has an important role to play in preventing weight gain and obesity and improving mental health.
Most people struggle to set time aside for physical activity, so the best way of keeping active is to build this activity into people’s existing routines. Travel time is one of the few opportunities we have for easily incorporating activity into our day. Most people’s daily public transport journeys contain stages that can be walked or cycled.
Many Londoners already choose to walk and cycle; every day around 6.5 million trips are made on foot and around 600,000 trips entirely by cycle. However, it is estimated that almost 5 million journeys per day that could be walked or cycled are currently made by car. If everyone in London walked or cycled for 20 minutes every day, it would reduce their individual health risks significantly.22
Increased active travel would reduce the burden placed on the NHS, which sees its capacity regularly stretched even in the absence of a pandemic. A doctor is estimated to deliver around 20 years of healthy life through the care they provide each year. If all Londoners walked or cycled for 20 minutes a day, this would deliver at least an additional 60,000 years of healthy life in prevented illness and early death each year, as well as saving the NHS £1.7bn in treatment costs over a 25-year period.23
The Mayor, through TfL and the boroughs, and working with stakeholders, seeks to make London a city where people choose to walk and cycle more often by improving street environments, making it easier for everyone to get around on foot and by cycle, and promoting the benefits of active travel. The Mayor’s Healthy Streets
20 Transport Expenditure in London, GLA Economics, January 2020 21 Mayor’s Transport Strategy, TfL, March 2018 22 Mayor’s Transport Strategy, TfL, March 2018 23 Transport and Health in London – the main impacts of London road transport on health, Greater London Authority, February 2014

29
Approach provides a framework for putting human health and experience at the heart of planning the city. This will be vital in ensuring alternative transport options remain and become increasingly accessible and appealing to all Londoners and avoid a car led recovery.
This approach will reduce health and economic inequalities and help support an ageing population by providing low-cost, accessible travel options for Londoners and its visitors who are currently reliant on cars – or who cannot get around at all. The Mayor’s aim is that, by 2041, all Londoners do at least the 20 minutes of active travel they need to stay healthy each day.
Housing
Over the last two decades, increasing house prices have led to affordability worsening the most in London. In 2019, 8 of the 10 least affordable local authorities in England and Wales were in London.24 Londoners are being priced out of their city by an increasingly unaffordable housing market. Many Londoners are trapped paying rents that they can barely afford for homes that do not meet their needs or aspirations.
The new measures to level-up England’s cities, recover from the pandemic and help provide much-needed new homes announced in December 202025 includes working more closely with the GLA to agree a strengthened role in London for Homes England, proving London’s vital role in meeting government objectives on housing. This will enable Government to work with the GLA, Boroughs and development corporations to help deliver sites in London and the preparation of bids for the new National Homebuilding Fund.
The transport network has a crucial role to play in this. Public transport connections can make parts of London viable places to build homes and create jobs for the first time. Transport can support the delivery of homes and jobs in a way that improves quality of life by:
a) Shaping the type of growth in London, using transport services to create high-density, mixed-use places where people can walk and cycle to local amenities, and use public transport for longer trips (for example, to access densely agglomerated employment centres);
b) Shaping the city, using transport to support and direct good growth, so the potential for new jobs and homes in underdeveloped parts of the city can be unlocked.
Land around stations provides opportunities to create high-density, mixed-use places – new communities that are well connected to local amenities, and to jobs and locations further afield. In recent years, areas around TfL stations have developed twice as quickly as elsewhere. This is because services from these stations provide higher frequencies and better connections to other parts of London.
Improvements in London’s bus network over the last two decades have greatly improved connectivity for many parts of London and as a result have supported population growth across the city. Without this widespread uplift in access to public transport, housing densities would have been lower at many developments. Equally, if London is to deliver enough homes to meet demand, the intensification of existing suburban residential land will have to play a role in growth. The bus network, therefore, is one of the greatest enablers of development potential. This is particularly true for locations away from the immediate catchment area of rail and Tube stations.
Additionally, TfL is the owner of substantial areas of public land in London. In order to facilitate delivery of much needed housing, the Mayor intends to ensure that TfL surplus land is used to maximise affordable housing and so reduce the inequalities in housing provision for those who are from low-income households, younger people and disabled people. The development of TfL’s surplus sites will also act as a catalyst to other landowners, particularly those in the public sector, to bring forward their sites. Where appropriate, TfL will work with adjoining public sector landowners to maximise development opportunities and generate recurring sources of income for reinvestment in the transport network.
For example, at the largest scale, the proposed Bakerloo line extension could potentially have transformative effects, enabling more than 25,000 new homes and 5,000 jobs to be accommodated in the Old Kent Road, Lewisham, Catford and other opportunity areas. On a more localised scale, the extension of the DLR to
24 Housing affordability in England and Wales: 2019, ONS, March 2020 25 https://www.gov.uk/government/news/plan-to-regenerate-england-s-cities-with-new-homes

30
Thamesmead is expected to generate up to 20,000 new homes and at least 8,000 jobs in Thamesmead, with potentially more at Beckton Riverside.
Consequences of underinvestment and risks of increased congestion As life in our cities returns to more normal patterns of behaviour after mobility restrictions are eased, public
transport must remain attractive enough to encourage people to give up the flexibility and privacy of their car. Avoiding a car-dominated recovery will not only ensure safe levels of air pollution, but also make roads less congested and safer. Getting people out of their cars and using public transport or walking and cycling also promotes active travel and brings health benefits.
TfL must continue to deliver these environmental and economic benefits, but it is entirely dependent on secure, long term funding that enables it to commit to the next generation of improvements to London’s transport network. Without this investment, the condition of the network moves backwards, costs increase, reliability declines and closures become necessary where safety cannot be guaranteed. These are not hypothetical situations. Examples include:
• The Bakerloo line trains, which came into service in 1972 and are the oldest trains in service in mainland UK and suffer from age-related failures impairing structural integrity;
• The over 40-year-old Piccadilly line fleet, which has become increasingly unreliable, and which TfL has entered into a long term multi-billion pound contract with Siemens to replace;
• The Rotherhithe Tunnel, which due to its condition has vehicle restrictions that curb commercial activity in London;
• Vauxhall Bridge, which carries over 70,000 vehicles per day and could face usage restrictions within five years absent investment; and
• Brent Cross Structures, which carry over 175,000 vehicles per day which could face additional restrictions and high likelihood of closures absent investment
It is therefore essential to maintain and renew London’s transport assets with modern, well-adapted and energy efficient solutions to safeguard their long term safety and sustainability, ensuring the network can reliably keep London moving, and is adapted and resilient to changes in climate.
A critical period for transport and London and the wider UK economy The funding settlement agreed with Government earlier this year enabled TfL to keep its assets safe and
operable. It also enabled TfL to play its part in London and the UK’s immediate recovery from the pandemic, by progressing schemes focused on safety, active travel and those that enable social distancing. TfL will not balance its budget in 2020/21 as it has had to utilise circa £800m of its reserves. However, TfL has demonstrated a path post 2020/21 to rebuilding reserves and cash balances, which meets CIPFA guidance of having a balanced budget in the medium term.
However, long term funding security is required to cover TfL’s fixed operating and capital costs where revenue has fallen. Without operating funding to cover the revenue shortfall, TfL will be forced to reduce services and close some operations. Without sustained capital funding, TfL will not be able to maintain its assets in the same condition they are today, which will lead to poorer performance, delays and ultimately reducing or closing services.
Without continuous, stable investment to operate and maintain TfL’s existing network and ensure it keeps pace with societal expectations, its performance will decline. This will mean fewer people travelling around London and more people using cars, with all the pollution and congestion that results in. Improving transport supports a city’s success but allowing transport to degrade will have the opposite effect, as the city becomes less attractive and ceases to grow as was seen through the period pre-2000, leading to fewer jobs, more social exclusion and less contribution to the national economy. Historically London has been in this position before and the risk is that there is a return to this situation without adequate investment. Furthermore, London already has some of the most deprived areas in the country, so providing connectivity for these areas to access services is critical to redistributing economic wealth.

31
It takes a huge amount of investment to build a transport network, but in London most of the key components are already in place. Now is the time to take advantage of the investments made by previous generations and unlock their full potential through relatively small investments. Doing so will enable more homes to be built in London, the city centre to remain one of the world’s most attractive cultural and commercial destinations and the decarbonisation of the network to support the UK’s climate change targets.
As described in this document, the long term funding structures that supported TfL’s first investment cycle have led to economic growth and efficiency for the taxpayer. Before TfL, London’s transport was characterised by short term funding and prioritisation, inefficiency, poor reliability, a dirty and crime ridden system which discouraged international investment in London, reduced economic growth and widened economic disparity. There is a risk now of undoing the hard-won gains of an efficient system through a return to short term thinking and inefficient investment, unless a longer term funding solution can be resolved.
TfL has achieved a huge amount over the past 20 years, and can continue to do so, providing an excellent service to users of its services and value to the taxpayer. The independent review of TfL’s funding and financing, suggested options on how this gap should be funded, recognising that government subsidy was critical to maintaining an efficient and economic public transport network.
With sustainable long term funding, and a package of reform measures to ensure value for money, TfL will continue to support London and the UK, aligned with the overall national strategy for streets and buses, track and trains, housing and land, and the green industrial revolution.

32
2. Impact of the pandemic and potential future scenarios This Chapter provides an overview of TfL’s pre-pandemic revenues, costs, funding and financing arrangements; the impact of the coronavirus pandemic on revenues and TfL’s finances under a range of scenarios; and the resulting financial sustainability challenge.
Chapter Summary
Pre-COVID-19 pandemic funding and financing position Brief overview of the evolution of TfL’s funding and financing arrangements
The recently published Independent Review commissioned by the Mayor and TfL Board to examine financial sustainability sets out the detailed evolution of TfL’s role as an integrated transport authority, including an articulation of the benefits of this approach. The report also highlights the following key developments in TfL’s funding and financing arrangements since TfL was created. This provides important context to the understanding of TfL’s pre-pandemic funding and financing position.
TfL’s financial position was relatively strong in its first decade, with low starting debt, strong revenue growth and affordable long term plans. This was supported through 2007 to 2009 by:
• The provision of a 10-year settlement covering the Olympics, including investment in the Overground, and Crossrail 1 construction;
• A significant programme of borrowing by both TfL and the GLA in respect of the investment programme and Crossrail; and
Prior to the coronavirus pandemic, TfL was on a path to cover the cost of operations, maintenance, financing and renewals costs, but capital plans were not funded. The impact of the pandemic on long term demand is unknown, but our analysis shows a fundamental gap in operating and capital accounts.
Prior to the coronavirus pandemic, TfL’s efficiency programme meant it was on a path to breakeven, with TfL having taken almost £1bn out of its net operating costs over the past four years.
In comparison to other operators, TfL’s funding model (which, since 2015 and the withdrawal of the operating grant, is overly reliant on variable fare income) means it is particularly exposed to the effects of COVID-19. This meant that emergency financial support from Government was and continues to be required in the short term. The ongoing uncertainty around demand coupled with TfL’s relatively high fixed cost base mean that financial sustainability cannot be delivered under the current funding structure.
TfL faces ongoing issues regarding its ability to fund capital programmes on a sustainable basis, with over £12bn of debt and aging assets. As such, it requires alternative funding options.
The long term impact of the pandemic on demand is unknown. However, TfL’s modelling of scenarios highlights that there is likely to remain a very significant gap towards TfL achieving financial sustainability.
As such, TfL cannot deliver financial sustainability without a revised governance and funding model to enable it to become an economic and efficient operator. This is considered in Chapter 4, while potential actions to mitigate the gap are outlined in Chapter 5. An interim solution may also be required ahead of wider structural reform, and this is considered further in Chapter 6.

33
• Agreement on two new hypothecated taxes, in the form of the Business Rates Supplement and what became the Mayoral Community Infrastructure Levy.
However, from 2010 onwards several factors have led to a weakening of TfL’s position including:
• Reductions in the operating grant, of £1bn per annum since 2015;
• Delays to the opening of Crossrail, leading to lower revenues, and TfL bearing a portion of the cost overruns; and
• Growing levels of debt, reducing fiscal headroom and meaning that other means are required to finance capital expenditure.
TfL’s remaining operating and capital grants from Central Government were also swapped in three stages for allocations of London’s rates under the Business Rates Retention (BRR) scheme. This was largely positive for TfL and London, until the pandemic impacted the level of funding generated.
These changes are reflected in Figure 2 and Figure 3, which show how TfL’s debt has grown rapidly to a high of almost £13bn by the end of 2020/21, but at the same time, overall non-TfL funding sources have reduced significantly from 2010/11 as a result in reductions in the operating grant.
Figure 2: Government funding history (excluding Crossrail and one-off funding)
Figure 3: Debt profile
Pre-pandemic progress towards financial sustainability
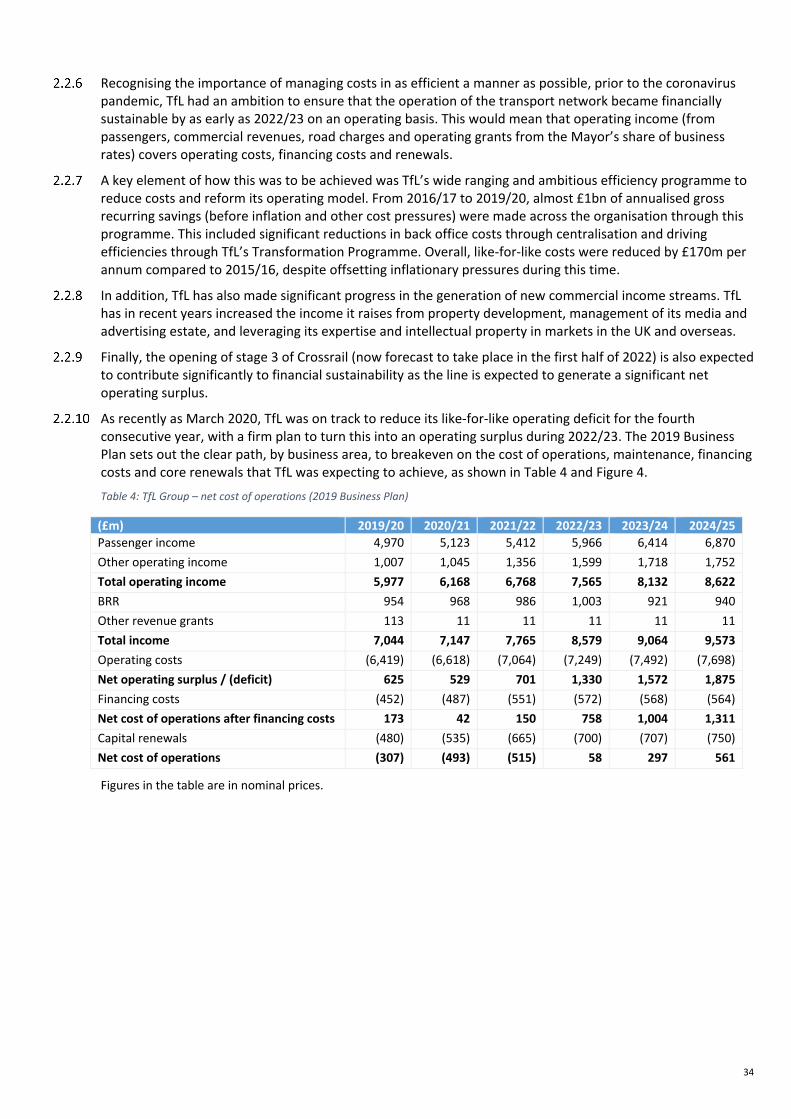
34
Recognising the importance of managing costs in as efficient a manner as possible, prior to the coronavirus pandemic, TfL had an ambition to ensure that the operation of the transport network became financially sustainable by as early as 2022/23 on an operating basis. This would mean that operating income (from passengers, commercial revenues, road charges and operating grants from the Mayor’s share of business rates) covers operating costs, financing costs and renewals.
A key element of how this was to be achieved was TfL’s wide ranging and ambitious efficiency programme to reduce costs and reform its operating model. From 2016/17 to 2019/20, almost £1bn of annualised gross recurring savings (before inflation and other cost pressures) were made across the organisation through this programme. This included significant reductions in back office costs through centralisation and driving efficiencies through TfL’s Transformation Programme. Overall, like-for-like costs were reduced by £170m per annum compared to 2015/16, despite offsetting inflationary pressures during this time.
In addition, TfL has also made significant progress in the generation of new commercial income streams. TfL has in recent years increased the income it raises from property development, management of its media and advertising estate, and leveraging its expertise and intellectual property in markets in the UK and overseas.
Finally, the opening of stage 3 of Crossrail (now forecast to take place in the first half of 2022) is also expected to contribute significantly to financial sustainability as the line is expected to generate a significant net operating surplus.
As recently as March 2020, TfL was on track to reduce its like-for-like operating deficit for the fourth consecutive year, with a firm plan to turn this into an operating surplus during 2022/23. The 2019 Business Plan sets out the clear path, by business area, to breakeven on the cost of operations, maintenance, financing costs and core renewals that TfL was expecting to achieve, as shown in Table 4 and Figure 4.
Table 4: TfL Group – net cost of operations (2019 Business Plan)
(£m) 2019/20 2020/21 2021/22 2022/23 2023/24 2024/25 Passenger income 4,970 5,123 5,412 5,966 6,414 6,870 Other operating income 1,007 1,045 1,356 1,599 1,718 1,752 Total operating income 5,977 6,168 6,768 7,565 8,132 8,622 BRR 954 968 986 1,003 921 940 Other revenue grants 113 11 11 11 11 11 Total income 7,044 7,147 7,765 8,579 9,064 9,573 Operating costs (6,419) (6,618) (7,064) (7,249) (7,492) (7,698) Net operating surplus / (deficit) 625 529 701 1,330 1,572 1,875 Financing costs (452) (487) (551) (572) (568) (564) Net cost of operations after financing costs 173 42 150 758 1,004 1,311 Capital renewals (480) (535) (665) (700) (707) (750) Net cost of operations (307) (493) (515) 58 297 561
Figures in the table are in nominal prices.

35
Figure 4: TfL Group – net cost of operations 2015/16 to 2024/25 (2019 Business Plan)
Pre-pandemic challenges to financial sustainability
While TfL has made significant progress towards financial sustainability on an operating basis (including renewals and financing costs), even prior to the pandemic there remained significant challenges associated with how to fund the capital plan on a long term sustainable basis, including major capital renewals / enhancements (such as replacement investment in life expired rolling stock and signalling).
TfL’s published 2019 Capital Strategy looked at the funding required to maintain the condition of its assets and to enhance the network to achieve the ambitions of the Mayor’s Transport Strategy (MTS) by 2041.
While historically TfL has been able to borrow to fund its capital plans, the fact that its debt burden has now reached the limits of affordability, means it can no longer continue to borrow significantly in future. In the short term, the recent funding settlement required TfL to borrow due to the pandemic despite nearing its debt capacity. This means TfL is unable to borrow post 2020/21, compared to its previous business plan which assumed borrowing in 2021/22 and 2022/23. As a result, from 2025 onwards, even prior to the pandemic, there was expected to be a shortfall of around £1bn per annum in constant prices to deliver the 2019 capital plan.
It should be noted that this shortfall in funding for the capital plan also has the potential to impact the achievement of the operating surplus. This is because the operating efficiencies planned in future years as part of the LU programme of modernisation of current working practices and improvements in productivity will require capital investment in new trains and signalling that are currently not funded.
Impact of the coronavirus pandemic on demand and revenue in 2020/21 Impact on demand in 2020/21
At its peak, TfL passenger demand was reduced by more than 90 per cent compared to last year, with the coronavirus pandemic delivering a very significant shock to the travel patterns of Londoners and those who work across the capital.
This fed through onto the transport network leading to changes in levels of demand as well as changes to mode-shares, timings and trip purposes. At the peak of the crisis, Tube and Rail ridership fell to five per cent of normal levels of demand, bus ridership fell to 15 per cent and Transport for London Road Network (TLRN) traffic fell to about half.
As London emerged from the first lockdown, car use rebounded more rapidly than public transport, and bus use proved more resilient than tube. Cycle Hire normalised more rapidly than Tube, Rail and Buses, and has been mostly above normal demand levels since early May.
While the planned mass distribution of vaccines to the public brings hope of a recovery in demand over the course of 2021, the second lockdown in November 2020, introduction of Tier 4 restrictions in December 2020 and subsequent third national lockdown announced on 4 January means that the nature of the London that will emerge from the coronavirus pandemic remains uncertain.
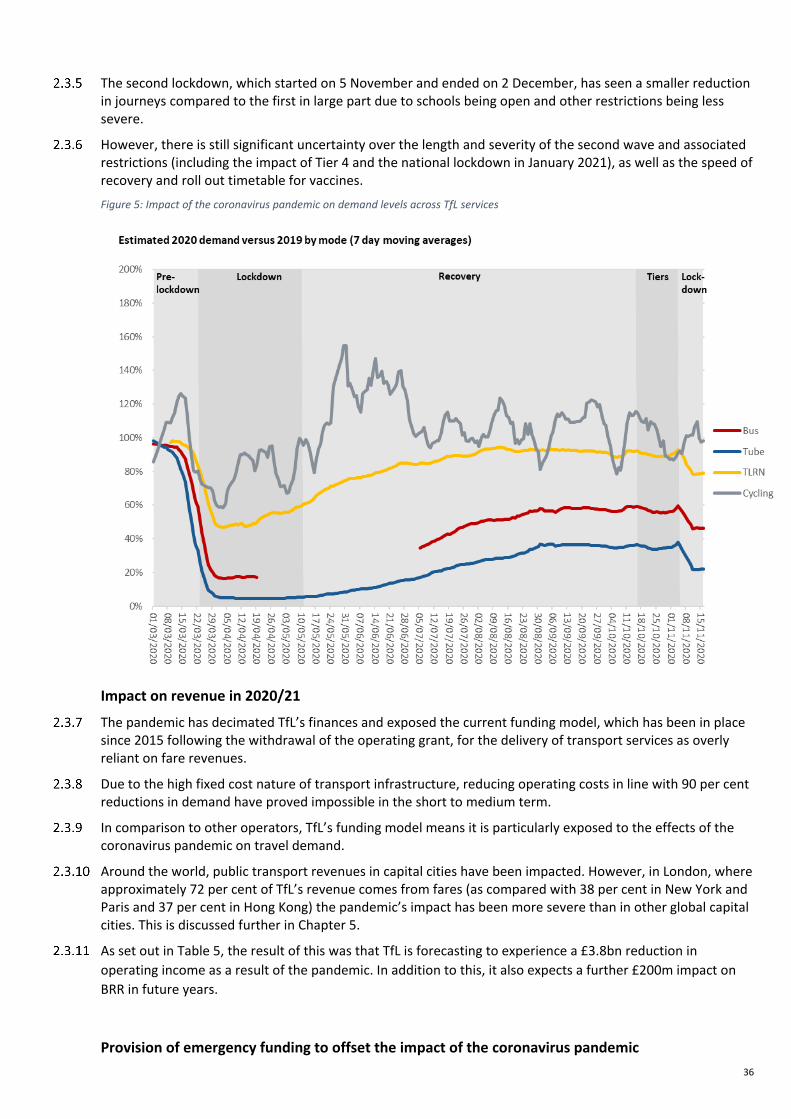
36
The second lockdown, which started on 5 November and ended on 2 December, has seen a smaller reduction in journeys compared to the first in large part due to schools being open and other restrictions being less severe.
However, there is still significant uncertainty over the length and severity of the second wave and associated restrictions (including the impact of Tier 4 and the national lockdown in January 2021), as well as the speed of recovery and roll out timetable for vaccines.
Figure 5: Impact of the coronavirus pandemic on demand levels across TfL services
Impact on revenue in 2020/21
The pandemic has decimated TfL’s finances and exposed the current funding model, which has been in place since 2015 following the withdrawal of the operating grant, for the delivery of transport services as overly reliant on fare revenues.
Due to the high fixed cost nature of transport infrastructure, reducing operating costs in line with 90 per cent reductions in demand have proved impossible in the short to medium term.
In comparison to other operators, TfL’s funding model means it is particularly exposed to the effects of the coronavirus pandemic on travel demand.
Around the world, public transport revenues in capital cities have been impacted. However, in London, where approximately 72 per cent of TfL’s revenue comes from fares (as compared with 38 per cent in New York and Paris and 37 per cent in Hong Kong) the pandemic’s impact has been more severe than in other global capital cities. This is discussed further in Chapter 5.
As set out in Table 5, the result of this was that TfL is forecasting to experience a £3.8bn reduction in operating income as a result of the pandemic. In addition to this, it also expects a further £200m impact on BRR in future years.
Provision of emergency funding to offset the impact of the coronavirus pandemic
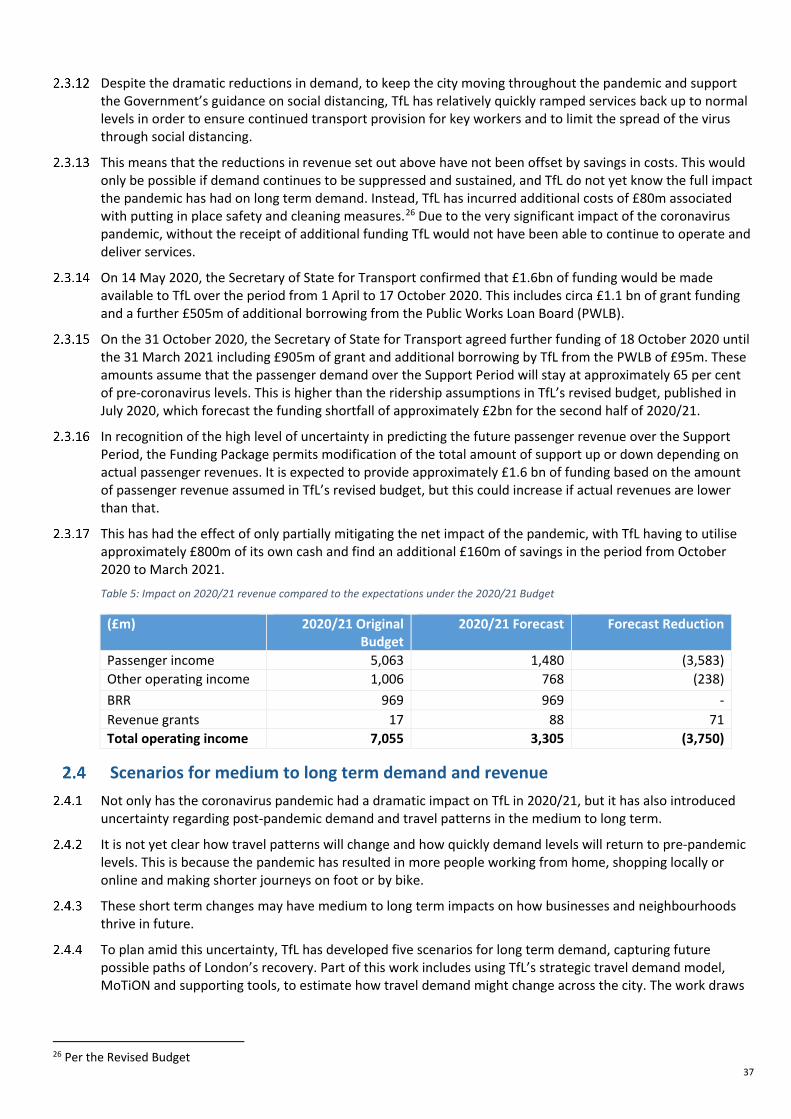
37
Despite the dramatic reductions in demand, to keep the city moving throughout the pandemic and support the Government’s guidance on social distancing, TfL has relatively quickly ramped services back up to normal levels in order to ensure continued transport provision for key workers and to limit the spread of the virus through social distancing.
This means that the reductions in revenue set out above have not been offset by savings in costs. This would only be possible if demand continues to be suppressed and sustained, and TfL do not yet know the full impact the pandemic has had on long term demand. Instead, TfL has incurred additional costs of £80m associated with putting in place safety and cleaning measures.26 Due to the very significant impact of the coronavirus pandemic, without the receipt of additional funding TfL would not have been able to continue to operate and deliver services.
On 14 May 2020, the Secretary of State for Transport confirmed that £1.6bn of funding would be made available to TfL over the period from 1 April to 17 October 2020. This includes circa £1.1 bn of grant funding and a further £505m of additional borrowing from the Public Works Loan Board (PWLB).
On the 31 October 2020, the Secretary of State for Transport agreed further funding of 18 October 2020 until the 31 March 2021 including £905m of grant and additional borrowing by TfL from the PWLB of £95m. These amounts assume that the passenger demand over the Support Period will stay at approximately 65 per cent of pre-coronavirus levels. This is higher than the ridership assumptions in TfL’s revised budget, published in July 2020, which forecast the funding shortfall of approximately £2bn for the second half of 2020/21.
In recognition of the high level of uncertainty in predicting the future passenger revenue over the Support Period, the Funding Package permits modification of the total amount of support up or down depending on actual passenger revenues. It is expected to provide approximately £1.6 bn of funding based on the amount of passenger revenue assumed in TfL’s revised budget, but this could increase if actual revenues are lower than that.
This has had the effect of only partially mitigating the net impact of the pandemic, with TfL having to utilise approximately £800m of its own cash and find an additional £160m of savings in the period from October 2020 to March 2021.
Table 5: Impact on 2020/21 revenue compared to the expectations under the 2020/21 Budget
(£m) 2020/21 Original Budget
2020/21 Forecast Forecast Reduction
Passenger income 5,063 1,480 (3,583) Other operating income 1,006 768 (238) BRR 969 969 - Revenue grants 17 88 71 Total operating income 7,055 3,305 (3,750)
Scenarios for medium to long term demand and revenue Not only has the coronavirus pandemic had a dramatic impact on TfL in 2020/21, but it has also introduced
uncertainty regarding post-pandemic demand and travel patterns in the medium to long term.
It is not yet clear how travel patterns will change and how quickly demand levels will return to pre-pandemic levels. This is because the pandemic has resulted in more people working from home, shopping locally or online and making shorter journeys on foot or by bike.
These short term changes may have medium to long term impacts on how businesses and neighbourhoods thrive in future.
To plan amid this uncertainty, TfL has developed five scenarios for long term demand, capturing future possible paths of London’s recovery. Part of this work includes using TfL’s strategic travel demand model, MoTiON and supporting tools, to estimate how travel demand might change across the city. The work draws
26 Per the Revised Budget
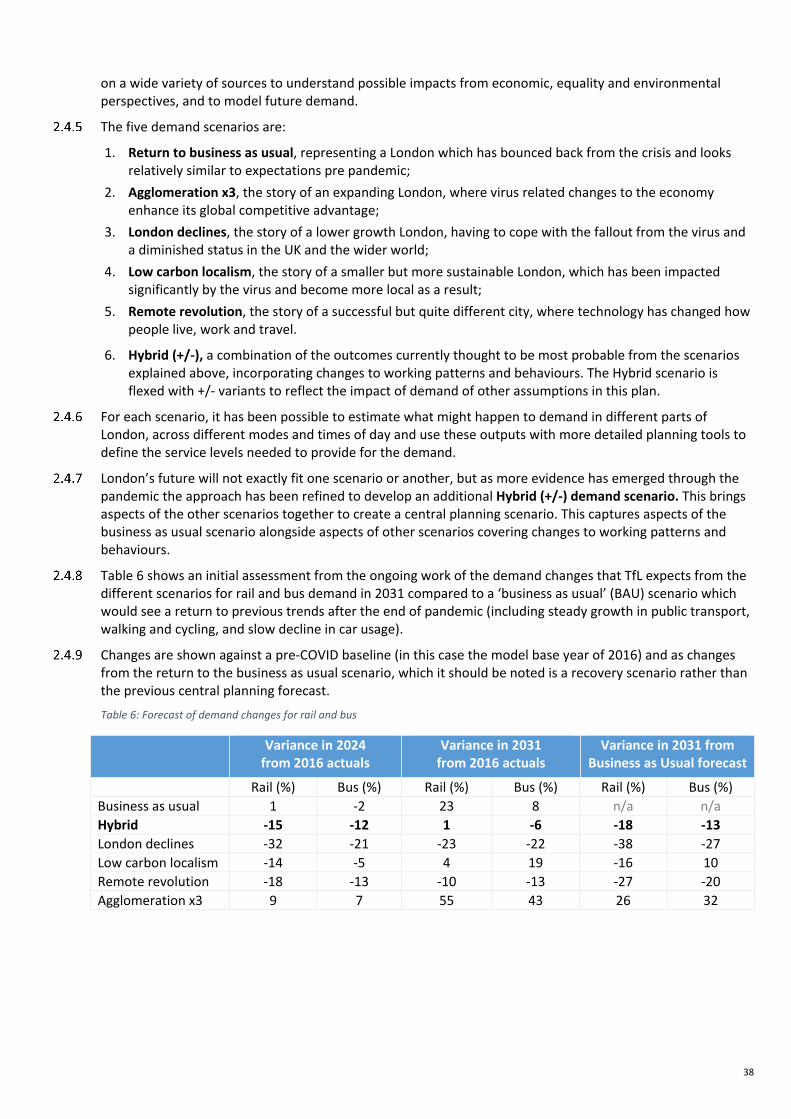
38
on a wide variety of sources to understand possible impacts from economic, equality and environmental perspectives, and to model future demand.
The five demand scenarios are:
1. Return to business as usual, representing a London which has bounced back from the crisis and looks relatively similar to expectations pre pandemic;
2. Agglomeration x3, the story of an expanding London, where virus related changes to the economy enhance its global competitive advantage;
3. London declines, the story of a lower growth London, having to cope with the fallout from the virus and a diminished status in the UK and the wider world;
4. Low carbon localism, the story of a smaller but more sustainable London, which has been impacted significantly by the virus and become more local as a result;
5. Remote revolution, the story of a successful but quite different city, where technology has changed how people live, work and travel.
6. Hybrid (+/-), a combination of the outcomes currently thought to be most probable from the scenarios explained above, incorporating changes to working patterns and behaviours. The Hybrid scenario is flexed with +/- variants to reflect the impact of demand of other assumptions in this plan.
For each scenario, it has been possible to estimate what might happen to demand in different parts of London, across different modes and times of day and use these outputs with more detailed planning tools to define the service levels needed to provide for the demand.
London’s future will not exactly fit one scenario or another, but as more evidence has emerged through the pandemic the approach has been refined to develop an additional Hybrid (+/-) demand scenario. This brings aspects of the other scenarios together to create a central planning scenario. This captures aspects of the business as usual scenario alongside aspects of other scenarios covering changes to working patterns and behaviours.
Table 6 shows an initial assessment from the ongoing work of the demand changes that TfL expects from the different scenarios for rail and bus demand in 2031 compared to a ‘business as usual’ (BAU) scenario which would see a return to previous trends after the end of pandemic (including steady growth in public transport, walking and cycling, and slow decline in car usage).
Changes are shown against a pre-COVID baseline (in this case the model base year of 2016) and as changes from the return to the business as usual scenario, which it should be noted is a recovery scenario rather than the previous central planning forecast.
Table 6: Forecast of demand changes for rail and bus
Variance in 2024 from 2016 actuals
Variance in 2031 from 2016 actuals
Variance in 2031 from Business as Usual forecast
Rail (%) Bus (%) Rail (%) Bus (%) Rail (%) Bus (%)
Business as usual 1 -2 23 8 n/a n/a Hybrid -15 -12 1 -6 -18 -13 London declines -32 -21 -23 -22 -38 -27 Low carbon localism -14 -5 4 19 -16 10 Remote revolution -18 -13 -10 -13 -27 -20 Agglomeration x3 9 7 55 43 26 32

39
Impact on revenue to 2030 under future scenarios
Table 7 compares the impact on operating income for four of the key demand scenarios (Hybrid (+/-) and London declines), as compared with the 2019 Business Plan.
The Hybrid demand scenario (explained in Section 2.4.5 above) has been adjusted to reflect how passenger income will be impacted by other assumptions in TfL’s overall Financial Sustainability Plan scenarios. This has resulted in a ‘Hybrid +’ demand scenario which has higher overall growth from 2026 to reflect higher investment levels inducing journeys, as well as a ‘Hybrid -‘ demand scenario which flattens demand growth from 2026, particularly on buses, to reflect the impact of lower investment and a more car-led recovery.
The revenue numbers in the scenarios set out above have been uplifted to nominal values to provide comparability to the BP 2019.These should therefore not be compared to the numbers used in the four financial scenarios in Section 2.5 which are nominal prices until 2024/25 and thereafter in constant prices.
Table 7 highlights the very significant shortfalls in operating income as a result of the pandemic:
• Under the Hybrid scenario, the impact over the nine years is on average £1.2bn per annum shortfall in nominal prices; while
Importance of the Central Activity Zone (CAZ) to the London and UK economy
The CAZ supports over two million jobs, accounting for 40 per cent of London’s workforce and over 10 per cent of UK GDP. Jobs are dominated by white collar sectors (Professional, Scientific and Technical; Finance and Insurance; and Information and Communication). However, the area’s importance extends beyond this, supporting tourism as well as a strong growth in its residential population.
Access to the CAZ is dominated by public transport. Ninety-five per cent of these trips were made by rail in the AM peak prior to the pandemic. A commuter population entering and leaving an agglomerated centre of employment lends itself to high capacity radial transport network which has built up around London.
Impact of the coronavirus pandemic
Prior to the coronavirus pandemic, trends were already changing, with a 20 per cent falling average space per-in-office-worker in the last 10 years. COVID-19 has accelerated this with nearly 50 per cent of business believing their employees will move towards a hybrid model of working – splitting time between home and office.
Recovery has been strongest amongst motorised highway users across all of London with some suppression in the CAZ due to the reintroduction and changes to the congestion charge. Reduction in car usage within the CAZ gives the opportunity for pushing forward more public realm improvements to improve attractiveness of the CAZ for both leisure and work activities. The GLA have also commissioned a substantial piece of research into the future role of the Central Activities Zone which will shape London’s recovery of this economic asset.
Long term opportunities and threats
1. Rail: While growth may have been lost, maintaining our service levels is essential as well as improving the customer experience across an integrated network.
2. Buses: Focusing on central London grid to work alongside active travel schemes will provide an integrated end to end service. With uncertainty in rail demand and long lead in times to major rail schemes buses provide flexibility, are accessible to all and provide a more affordable method of accessing the CAZ.
3. Cars: There is a risk that the level of general traffic will be incompatible with the reduced capacity needed to support sustainable modes.
4. Walking and cycling: All scenarios suggest that active travel will grow and to capitalise on enthusiasm during lockdown we should invest in re-allocating road space from private cars in a way that allows for mixed use.

40
• Under the London declines scenario, the impact is on average a £2.6bn per annum shortfall in nominal prices.
While TfL can take some actions on costs to mitigate these impacts, it is clear that TfL faces an extremely serious finance challenge given the long term projected impact on operating income, even under a more optimistic Hybrid scenario for demand. This has a significant impact on TfL’s ability to achieve financial sustainability, given its wide range of possible demand and revenue outcomes but relatively fixed and non-variable cost base.
Table 7: Comparison of operating income to 2029/3027
£m, Nominal 2020/21 2021/22 2022/23 2023/24 2024/25 2025/26 2026/27 2027/28 2028/29 2029/30 2019 Business Plan Passenger income 5,123 5,412 5,966 6,414 6,870 7,345 7,696 8,064 8,436 8,780 Other income 1,045 1,356 1,599 1,718 1,752 1,809 1,803 1,822 1,876 1,861 BRR 968 986 1,003 921 940 959 978 998 1,018 1,038 Other Grant 11 11 11 11 11 10 10 10 10 6 Total Operating Income 7,147 7,765 8,579 9,064 9,573 10,123 10,487 10,894 11,340 11,685
Hybrid + Passenger income 1,480 3,276 4,720 5,265 5,684 5,971 6,339 6,730 7,135 7,549 Other income 769 1,267 1,992 2,392 2,886 2,863 2,876 2,912 2,961 2,990 BRR 969 699 788 706 720 734 749 764 779 795 Other Grant 87 18 19 14 14 14 15 15 16 16 Total Operating Income 3,305 5,259 7,519 8,377 9,304 9,582 9,979 10,421 10,891 11,350
Variance to 2019 plan (3,842) (2,506) (1,060) (687) (269) (541) (508) (473) (449) (335)
Hybrid Passenger income 1,480 3,276 4,720 5,265 5,684 5,971 6,276 6,596 6,926 7,257 Other income 769 1,267 1,992 2,392 2,886 2,863 2,876 2,912 2,961 2,990 BRR 969 699 788 706 720 734 749 764 779 795 Other Grant 87 18 19 14 14 14 15 15 16 16 Total Operating Income 3,305 5,259 7,519 8,377 9,304 9,582 9,916 10,287 10,682 11,059
Variance to 2019 plan (3,842) (2,506) (1,060) (687) (269) (541) (571) (607) (658) (626)
Hybrid - Passenger income 1,480 3,276 4,559 5,099 5,511 5,775 6,055 6,349 6,651 6,953 Other income 769 1,267 1,992 2,140 2,327 2,316 2,309 2,319 2,346 2,348 BRR 969 699 788 706 720 734 749 764 779 795 Other Grant 87 18 19 14 14 14 15 15 16 16 Total Operating Income 3,305 5,259 7,358 7,959 8,572 8,839 9,128 9,447 9,792 10,112
Variance to 2019 plan (3,842) (2,506) (1,221) (1,105) (1,001) (1,284) (1,359) (1,447) (1,548) (1,573)
London declines Passenger income 1,480 3,276 4,559 4,569 4,878 5,152 5,318 5,489 5,661 5,835 Other income 769 1,267 1,992 1,869 1,749 1,756 1,727 1,714 1,716 1,695 BRR 969 699 788 706 720 734 749 764 779 795 Other Grant 87 18 19 14 14 14 15 15 16 16 Total Operating Income 3,305 5,259 7,358 7,157 7,361 7,657 7,809 7,983 8,172 8,341
Variance to 2019 plan (3,842) (2,506) (1,221) (1,907) (2,212) (2,466) (2,678) (2,911) (3,168) (3,344)
27 Note: Business Plan 2019 prices are all in nominal prices; demand scenario figures in the table are all in nominal prices
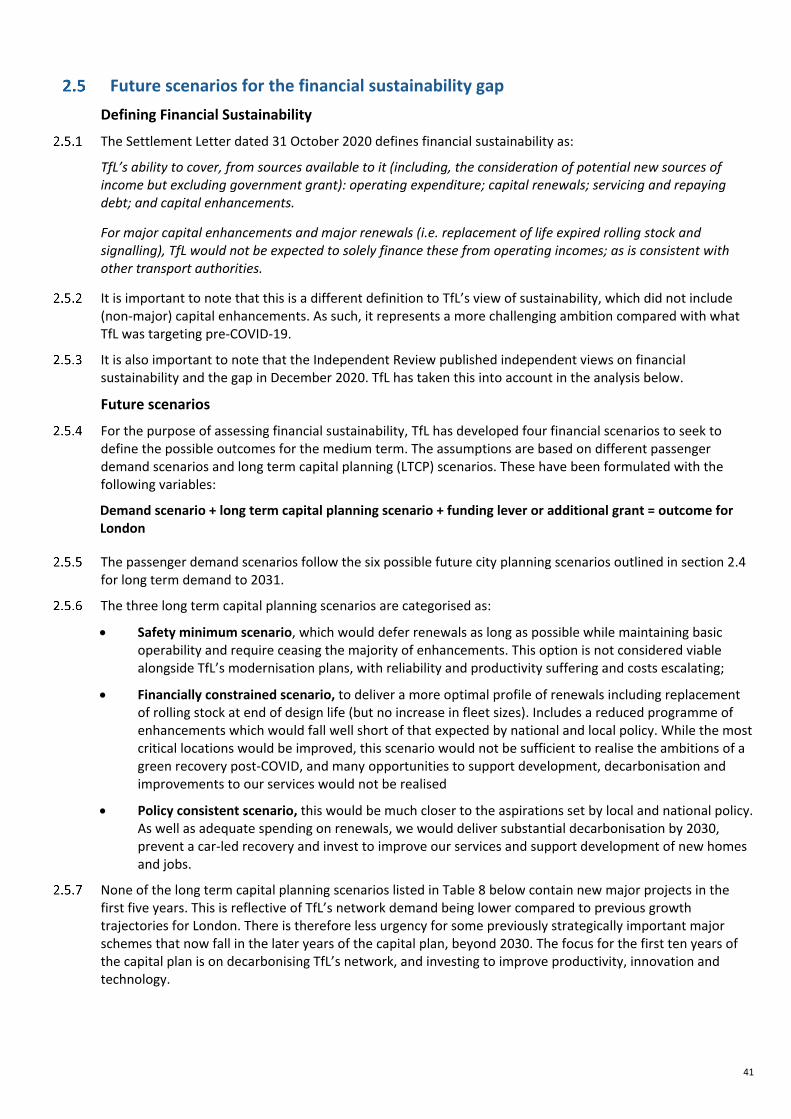
41
Future scenarios for the financial sustainability gap Defining Financial Sustainability
The Settlement Letter dated 31 October 2020 defines financial sustainability as:
TfL’s ability to cover, from sources available to it (including, the consideration of potential new sources of income but excluding government grant): operating expenditure; capital renewals; servicing and repaying debt; and capital enhancements.
For major capital enhancements and major renewals (i.e. replacement of life expired rolling stock and signalling), TfL would not be expected to solely finance these from operating incomes; as is consistent with other transport authorities.
It is important to note that this is a different definition to TfL’s view of sustainability, which did not include (non-major) capital enhancements. As such, it represents a more challenging ambition compared with what TfL was targeting pre-COVID-19.
It is also important to note that the Independent Review published independent views on financial sustainability and the gap in December 2020. TfL has taken this into account in the analysis below.
Future scenarios
For the purpose of assessing financial sustainability, TfL has developed four financial scenarios to seek to define the possible outcomes for the medium term. The assumptions are based on different passenger demand scenarios and long term capital planning (LTCP) scenarios. These have been formulated with the following variables:
Demand scenario + long term capital planning scenario + funding lever or additional grant = outcome for London
The passenger demand scenarios follow the six possible future city planning scenarios outlined in section 2.4 for long term demand to 2031.
The three long term capital planning scenarios are categorised as:
• Safety minimum scenario, which would defer renewals as long as possible while maintaining basic operability and require ceasing the majority of enhancements. This option is not considered viable alongside TfL’s modernisation plans, with reliability and productivity suffering and costs escalating;
• Financially constrained scenario, to deliver a more optimal profile of renewals including replacement of rolling stock at end of design life (but no increase in fleet sizes). Includes a reduced programme of enhancements which would fall well short of that expected by national and local policy. While the most critical locations would be improved, this scenario would not be sufficient to realise the ambitions of a green recovery post-COVID, and many opportunities to support development, decarbonisation and improvements to our services would not be realised
• Policy consistent scenario, this would be much closer to the aspirations set by local and national policy. As well as adequate spending on renewals, we would deliver substantial decarbonisation by 2030, prevent a car-led recovery and invest to improve our services and support development of new homes and jobs.
None of the long term capital planning scenarios listed in Table 8 below contain new major projects in the first five years. This is reflective of TfL’s network demand being lower compared to previous growth trajectories for London. There is therefore less urgency for some previously strategically important major schemes that now fall in the later years of the capital plan, beyond 2030. The focus for the first ten years of the capital plan is on decarbonising TfL’s network, and investing to improve productivity, innovation and technology.

42
Table 8: Long term capital planning scenarios
Area Safety Minimum Constrained Policy Consistent
Renewals and replacements
Fleet and Signalling • Life extend fleets as long as possible – declining reliability / condition, significant life extension costs.
• DLR, Piccadilly fleet in 2020s; Bakerloo 2040; Central, Waterloo & City by 2043
• Signalling life extension; exception of 4LM and Central incremental upgrades
• Fleet replaced at or near end of design life; optimal approach
• Fleets assumed replaced in order of age
• Fleet number replaced on a like for like basis
• Signal upgrade on Piccadilly line. Incremental component upgrades for DLR / Central line. Existing systems on other lines renewed
As Constrained except: • Fleet orders accelerated and
expanded to provide greater capacity to the Tube, notably to the Northern, Jubilee and Piccadilly lines to support economic recovery, housing and take advantage of efficiencies of scale
Other Assets • Minimum level of investment to
keep TfL’s networks safe and operable, but not necessarily reliable, or pleasant to use for customers
• Technology spend remains low compared; no modernisation enabled
• Broadly optimal interventions and sustainable run-rates
• Road network improved from current degraded state
• Designed replace fleet and signals at end of life
• Key tech enablers of LU Modernisation included
As Constrained except: • Optimised from WLC
perspective • LU renewals increased to
support higher frequencies • Assets in good state of repair
Enhancements and extensions
Underground • No LU enhancements included, e.g. no future SFA, station capacity, zero carbon railway operations by 2030, PTI solution, track noise / vibration, cooling mechanisation
• In-delivery projects (e.g. Bank, SFA)
• Two major station capacity upgrades
• Zero carbon railway operations circa 2030
• SFA at 20-30 stations • Track: noise & vibration • Track mechanisation (safety,
efficiency) • Power: SCADA and backup
resilience
As Constrained except: • Circa 7 major station upgrades • Step Free Access ~ 40 stations • PTI solution to improve safety –
Research and Development then implementation at priority sites
Healthy Streets • Committed schemes • Actions from Coroners reports /
prevention of future death notices
• All other work (e.g. Reduction in number of people killed or seriously injured, Safer Junctions, Cycling) would cease
• 20km of cycleway a year • Safer streets and junctions • 2 transformational schemes a year
(e.g. Waterloo, Tolworth) • Urban realm improvement
• 30km of cycleway a year • Safer streets / junctions, more
20mph • 3 transformational schemes a
year • Urban realm improvement
Rail and Sponsored Services
• Only committed and fully third party-funded schemes: DLR Royal Docks stations programme and Housing Infrastructure Fund (HIF) additional capacity
• No devolution or metroisation.
• Support for Great Northern devolution
• Overground and DLR station capacity and accessibility enhancements
• Great Northern devolution • Overground and DLR station
and accessibility enhancements • Expanded cycle hire
Buses • No improvements to bus journey times and bus customer experience after 2022
• No electrification of bus fleet
• Bus electrification 2033 • Bus journey time improvements • Some improvements to bus
customer experience and bus safety
• Bus electrification 2030 • Significant bus priority
including bus transits on major corridors
• Improvements to bus customer experience and bus safety
Air Quality and Environment
• Committed schemes: ULEX, LEZ tightening, DVS, Van Scrappage, DaR fleet renewal
• Increased investment in Electric Vehicle (EV) charging
• Tightening of Direct Vision Standard
As Constrained except: • Next generation RUC • Increased investment in EV
charging

43
• No other air quality improvement initiatives
• Dial-a-Ride electrification. • Investment in ULEX / RUC
infrastructure
Technology • Refresh/recontract of Bus Ops, Compliance, Policing and On Street (CPOS), Cycle Hire, DaR, Surface Intelligent Transport Systems (SITS) and Taxi Private Hire (TPH)
• Takes longer (circa 10.5 years) to make systems (Incl. London Underground, Surface) compliant, supported, maintained and secure from cyber security risks,
• Refresh/recontract of Bus Ops, CPOS, Cycle Hire, DaR, SITS and TPH
• Systems (Incl. London Underground, Surface) meet legal, safety, cybersecurity requirements in 7 years. Improved payments tech to reduce revenue leakage, Mobility as a Service
As Constrained except: • London Underground Tech
enhancements, e.g. proactive fleet maintenance. Integrated customer digital platform (accounts, payments, real-time info) meets MTS mode shift ambitions.
• All systems requirements in 4 years
Property • Dispose of sites rather than develop – losing income. No head office estate improvements –prevent sub-letting to lower net costs.
• Capital neutral throughout. Circa 24,000 homes on TfL land. Investment in head office estate to enable sub-letting.
• Could start plans to deliver 50,000 homes over 25 year horizon, generating surplus to reinvest
Growth Fund • Committed schemes only, so programme would cease after 2025
• Continues at circa £20m per annum. – aims to attract match funding of at least same amount. Based on past performance, could support 145,000 homes
• Increased to £50m per annum to attract match funding of same amount. Based on past performance, could support 280,000 homes.
Media • No enhancements: means loss of advertising income and lower-quality station and bus shelter image
• Steady investment to upgrade advertising assets where financially positive business case exists
As per Constrained scenario
Network extensions • Committed projects only (Northern Line Extension, Barking Riverside, Silvertown). Beyond these, no TfL funding for any schemes
• Thamesmead DLR and Bus Rapid Transit in 2020s, with an allowance included for further extension in 2030s (most likely West London Orbital). 3rd party funding essential for any schemes to progress
As per Constrained except: • Bakerloo line extension in
2030s
The four financial scenarios combine assumptions about demand and capital spend from the three options above. The four resultant financial scenarios are defined below.
The Greater London Boundary Charge is modelled in the first two scenarios consisting of gross revenue and related costs of circa 50 per cent generating net income of £500m per annum. An alternative option proposed would be allocated VED income, which would be solely income to roughly the same value as the net Boundary Charge income. The third scenario assumes £500m from VED retention, but that the Greater London Boundary Charge would not be considered due to an inability to invest in public transport services to take up displaced car usage. All scenarios include TfL savings assumptions outlined in chapter 5.
The level of BRR TfL receives also varies by scenario. The level of economic activity in London is a major driver of both the volume transport demand and the level of business rates. Therefore, the scenarios adjust the level of BRR to align with different passenger income levels.
TfL’s preferred option is Decarbonise by 2030, and this scenario is therefore modelled by business area in section 3 of the Executive Summary. This scenario is the only option which includes adequate funding to meet the Government’s ambitious net zero climate change contributions by 2050, of which the transport sector and London’s economy are key components. Additionally, this is the only option which invests to modernise and advance technology of outdated assets and practices and makes rapid progress against wider safety objectives.
Decarbonise by 2030

44
Hybrid (+) demand + policy consistent capital scenario + £500m per annum from Greater London Boundary Charge or VED retention = Capital funding requirement (including renewals) of £1.6bn average per annum from 2023-30
This scenario assumes lower passenger demand post-pandemic, but that this would over time stabilise and return to slow growth as per the Hybrid (+) scenario. The recovery of demand on Buses in the first 5 years is assumed to be faster than set out in the GLA Budget. An additional one per cent demand growth is assumed beyond 2026 to reflect the benefits of high investment.
BRR also increases in this scenario by five per cent between 2025 and 2030.
This scenario includes the potential Greater London Boundary Charge.
This is the only scenario to include the Policy Consistent capital investment scenario, and it is therefore the only one that achieves the national and local ambitions for London’s transport network. It includes significant funding for green recovery, active travel, decarbonisation, innovation, stimulating development and encouraging increased use of public transport. From the mid-2020s onwards, an uplift is included to passenger revenue to reflect trips attracted to the network as a result of the investment included here.
Limited Recovery
Hybrid demand + Constrained scenario + £500m per annum from Greater London Boundary Charge or VED retention = Capital funding requirement (including renewals) of £1.0bn average per annum from 2023-30
This scenario uses the original Hybrid passenger revenue forecast. It assumes the faster initial recovery of Bus demand compared to the GLA Budget, but not the increase in demand beyond 2026 due to more limited capital investment.
This scenario includes the potential Greater London Boundary Charge. Other income sources, including Business Rates, are forecast to remain at their 2025 level as per the GLA Budget.
The capital investment scenario included here is the Financially Constrained scenario. This would see a stable programme of renewals including replacement of rolling stock at the end of design life, but very little investment to increase public transport capacity. Progress on improving transport outcomes would fall short of the pace envisioned by the MTS and aspirations for safety, decarbonisation, modal shift and home building would not be fully met.
Managed Decline
Hybrid (-) demand + Safety Minimum scenario + £500m per annum from VED retention = Operating funding requirement of £300m per annum from 2023-30, accepting deteriorating outcomes
This scenario starts with the Hybrid (-) passenger revenue assumption as the previous scenarios, but without the faster initial recovery of Bus demand, with then no further growth on buses beyond 2026. This is to reflect the impact of lower investment and a car-led recovery having an effect on the quality and reliability of buses.
BRR also reduces in this scenario by five per cent between 2025 and 2030.
This scenario assumes savings are focused on the capital account, using the Safety Minimum scenario. This would require deferring critical investments as long as possible, while maintaining basic operability, resulting in higher maintenance costs (incorporated into the scenario), more service disruption and lack of support for UK supply chains. Most enhancement programmes would cease, meaning little or no progress in areas such as decarbonisation, accessibility, safety and stimulating development.
The Greater London Boundary Charge would not be possible to implement in this scenario because TfL would not have sufficient funding to invest in alternatives for journeys to be shifted away from private vehicles. Instead a significant contribution from road income such as VED is assumed, which would require government agreement. Business rates income is reduced slightly in this scenario reflecting the reduced scope of the capital programme. Advertising income is assumed to be slightly lower in this scenario due to reduced investment in our media assets.
With effectively no investment to improve the network and no policy interventions such as the Boundary Charge to reduce road congestion, conditions on the road network would likely deteriorate and London

45
would suffer the damaging impacts of a car-led recovery. To reflect this, in this scenario we have assumed lower bus revenue as passengers reduce their usage of a slower and less reliable bus network.
There would be no investment towards decarbonise beyond legal obligations and existing commitments. TfL operations would not meet Net Zero even by 2050. It would not be possible to stimulate active travel or mode shift, leading to a less used and less sustainable bus network and a real risk of a permanent car-led recovery. Whole-life cost would not be managed effectively, with significant peaks and troughs of spend and a large backlog of works left for the future. Higher maintenance costs would be required. Opportunities to improve operating account through property/media investments or enabling modernisation not achieved. There would be no seed money to attract 3rd party match funds (for example MRN/HIF) which may mean opportunities are missed.
After committed projects are completed, there would be no improvement in capacity and connectivity, meaning opportunities for new housing would be lost.
Under this scenario, TfL would accept becoming a second-tier world transport network and probably losing customers as a result. London has been here before, with investment falling significantly in the 1990s. Between 1990/91 and 1998/99, passenger subsidy was removed, the renewals grant dropped 48 per cent and the enhancements grant dropped by 74 per cent. This led to recognition within government of a backlog in asset investment that needed to be rectified through the creation of TfL.
Rapid Decline
London declines demand + Safety Minimum scenario + no lever from Greater London Boundary Charge or VED retention = Operating funding requirement of £1.6bn per annum from 2023-30, accepting deteriorating outcomes
This scenario assumes a severe and ongoing impact on public transport demand based on the London Declines scenario. This would see a smaller and economically weaker London where there is less desire to use public transport post-pandemic.
BRR also reduces in this scenario by 10 per cent between 2025 and 2030.
In response, we have included reductions to our operated bus services to reflect the reduction in demand. Advertising and business rates income are assumed to reduce more significantly due to the weak economy. The Greater London Boundary Charge is not assumed to be implemented in this scenario due to lack of investment in travel alternatives, and no other new roads income is assumed to be possible here.
Investment is the Safety Minimum scenario, with no improvements funded to the network and renewals deferred as long as possible, with significant negative impacts on performance and national supply chains. Higher maintenance costs are incorporated to reflect the increased need for day-to-day repairs in a declining network.
Financial sustainability under the future scenarios Table 9 to Table 12 set out the following for each of the four scenarios:
1. Net cost of operations, which takes into account operating income, other operating grant income, operating costs and financing costs and is therefore closely aligned to the Settlement Letter definition of financial sustainability; and
2. Total surplus / deficit, which also takes into account capital funding, capital renewals and capital investment
Both lines exclude any extraordinary grant. All figures are in nominal until 2024/25, and thereafter in constant prices.
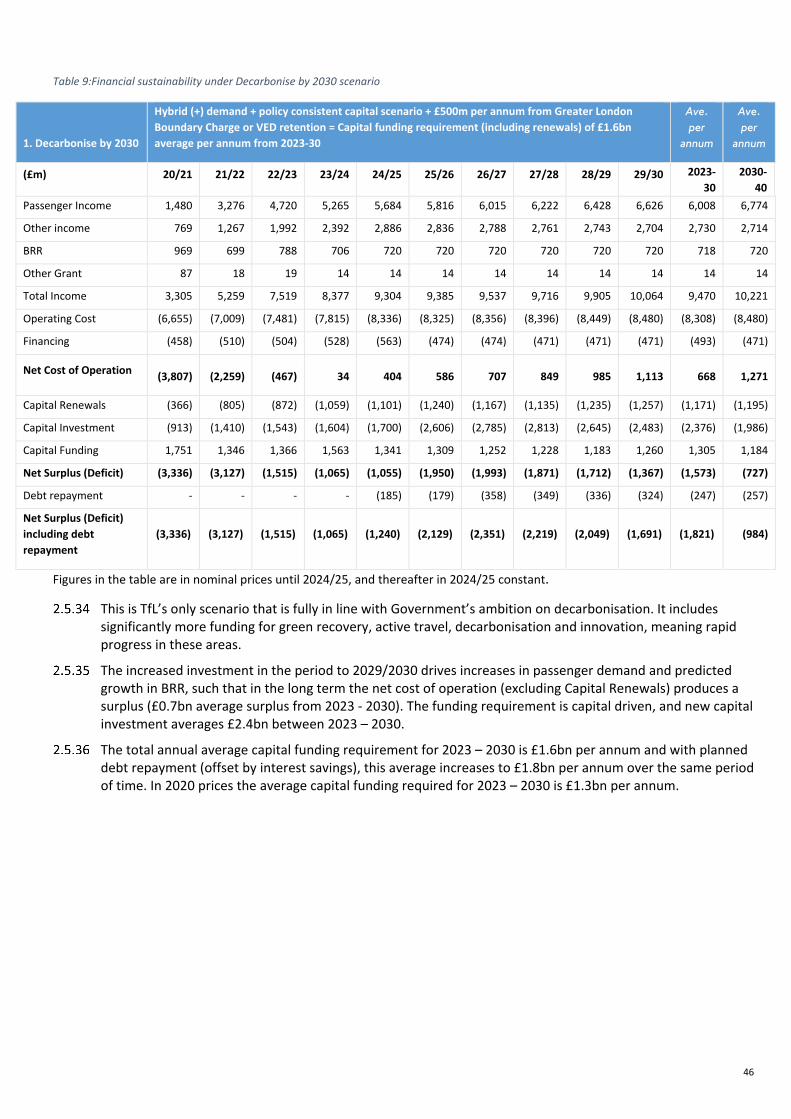
46
Table 9:Financial sustainability under Decarbonise by 2030 scenario
1. Decarbonise by 2030
Hybrid (+) demand + policy consistent capital scenario + £500m per annum from Greater London Boundary Charge or VED retention = Capital funding requirement (including renewals) of £1.6bn average per annum from 2023-30
Ave. per
annum
Ave. per
annum
(£m) 20/21 21/22 22/23 23/24 24/25 25/26 26/27 27/28 28/29 29/30 2023-30
2030-40
Passenger Income 1,480 3,276 4,720 5,265 5,684 5,816 6,015 6,222 6,428 6,626 6,008 6,774
Other income 769 1,267 1,992 2,392 2,886 2,836 2,788 2,761 2,743 2,704 2,730 2,714
BRR 969 699 788 706 720 720 720 720 720 720 718 720
Other Grant 87 18 19 14 14 14 14 14 14 14 14 14
Total Income 3,305 5,259 7,519 8,377 9,304 9,385 9,537 9,716 9,905 10,064 9,470 10,221
Operating Cost (6,655) (7,009) (7,481) (7,815) (8,336) (8,325) (8,356) (8,396) (8,449) (8,480) (8,308) (8,480)
Financing (458) (510) (504) (528) (563) (474) (474) (471) (471) (471) (493) (471)
Net Cost of Operation (3,807) (2,259) (467) 34 404 586 707 849 985 1,113 668 1,271
Capital Renewals (366) (805) (872) (1,059) (1,101) (1,240) (1,167) (1,135) (1,235) (1,257) (1,171) (1,195)
Capital Investment (913) (1,410) (1,543) (1,604) (1,700) (2,606) (2,785) (2,813) (2,645) (2,483) (2,376) (1,986)
Capital Funding 1,751 1,346 1,366 1,563 1,341 1,309 1,252 1,228 1,183 1,260 1,305 1,184
Net Surplus (Deficit) (3,336) (3,127) (1,515) (1,065) (1,055) (1,950) (1,993) (1,871) (1,712) (1,367) (1,573) (727)
Debt repayment - - - - (185) (179) (358) (349) (336) (324) (247) (257)
Net Surplus (Deficit) including debt repayment
(3,336) (3,127) (1,515) (1,065) (1,240) (2,129) (2,351) (2,219) (2,049) (1,691) (1,821) (984)
Figures in the table are in nominal prices until 2024/25, and thereafter in 2024/25 constant.
This is TfL’s only scenario that is fully in line with Government’s ambition on decarbonisation. It includes significantly more funding for green recovery, active travel, decarbonisation and innovation, meaning rapid progress in these areas.
The increased investment in the period to 2029/2030 drives increases in passenger demand and predicted growth in BRR, such that in the long term the net cost of operation (excluding Capital Renewals) produces a surplus (£0.7bn average surplus from 2023 - 2030). The funding requirement is capital driven, and new capital investment averages £2.4bn between 2023 – 2030.
The total annual average capital funding requirement for 2023 – 2030 is £1.6bn per annum and with planned debt repayment (offset by interest savings), this average increases to £1.8bn per annum over the same period of time. In 2020 prices the average capital funding required for 2023 – 2030 is £1.3bn per annum.
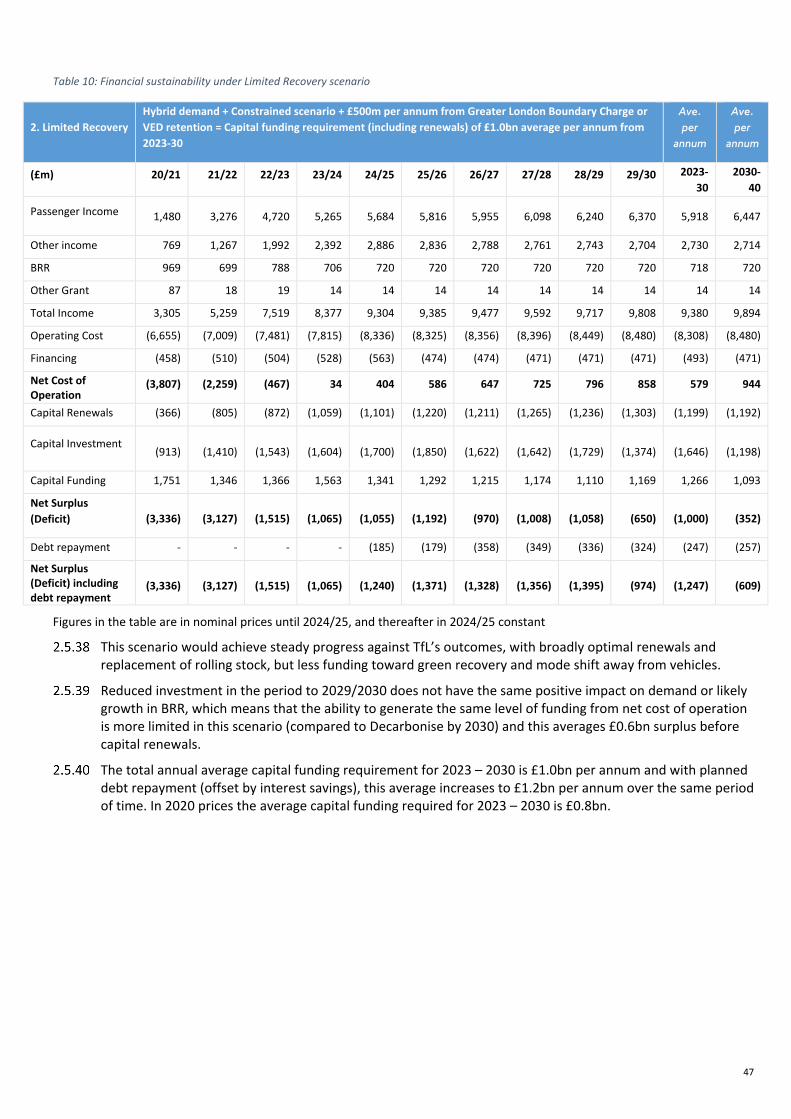
47
Table 10: Financial sustainability under Limited Recovery scenario
2. Limited Recovery Hybrid demand + Constrained scenario + £500m per annum from Greater London Boundary Charge or VED retention = Capital funding requirement (including renewals) of £1.0bn average per annum from 2023-30
Ave. per
annum
Ave. per
annum
(£m) 20/21 21/22 22/23 23/24 24/25 25/26 26/27 27/28 28/29 29/30 2023-30
2030-40
Passenger Income 1,480 3,276 4,720 5,265 5,684 5,816 5,955 6,098 6,240 6,370 5,918 6,447
Other income 769 1,267 1,992 2,392 2,886 2,836 2,788 2,761 2,743 2,704 2,730 2,714
BRR 969 699 788 706 720 720 720 720 720 720 718 720
Other Grant 87 18 19 14 14 14 14 14 14 14 14 14
Total Income 3,305 5,259 7,519 8,377 9,304 9,385 9,477 9,592 9,717 9,808 9,380 9,894
Operating Cost (6,655) (7,009) (7,481) (7,815) (8,336) (8,325) (8,356) (8,396) (8,449) (8,480) (8,308) (8,480)
Financing (458) (510) (504) (528) (563) (474) (474) (471) (471) (471) (493) (471)
Net Cost of Operation
(3,807) (2,259) (467) 34 404 586 647 725 796 858 579 944
Capital Renewals (366) (805) (872) (1,059) (1,101) (1,220) (1,211) (1,265) (1,236) (1,303) (1,199) (1,192)
Capital Investment (913) (1,410) (1,543) (1,604) (1,700) (1,850) (1,622) (1,642) (1,729) (1,374) (1,646) (1,198)
Capital Funding 1,751 1,346 1,366 1,563 1,341 1,292 1,215 1,174 1,110 1,169 1,266 1,093
Net Surplus (Deficit) (3,336) (3,127) (1,515) (1,065) (1,055) (1,192) (970) (1,008) (1,058) (650) (1,000) (352)
Debt repayment - - - - (185) (179) (358) (349) (336) (324) (247) (257)
Net Surplus (Deficit) including debt repayment
(3,336) (3,127) (1,515) (1,065) (1,240) (1,371) (1,328) (1,356) (1,395) (974) (1,247) (609)
Figures in the table are in nominal prices until 2024/25, and thereafter in 2024/25 constant
This scenario would achieve steady progress against TfL’s outcomes, with broadly optimal renewals and replacement of rolling stock, but less funding toward green recovery and mode shift away from vehicles.
Reduced investment in the period to 2029/2030 does not have the same positive impact on demand or likely growth in BRR, which means that the ability to generate the same level of funding from net cost of operation is more limited in this scenario (compared to Decarbonise by 2030) and this averages £0.6bn surplus before capital renewals.
The total annual average capital funding requirement for 2023 – 2030 is £1.0bn per annum and with planned debt repayment (offset by interest savings), this average increases to £1.2bn per annum over the same period of time. In 2020 prices the average capital funding required for 2023 – 2030 is £0.8bn.
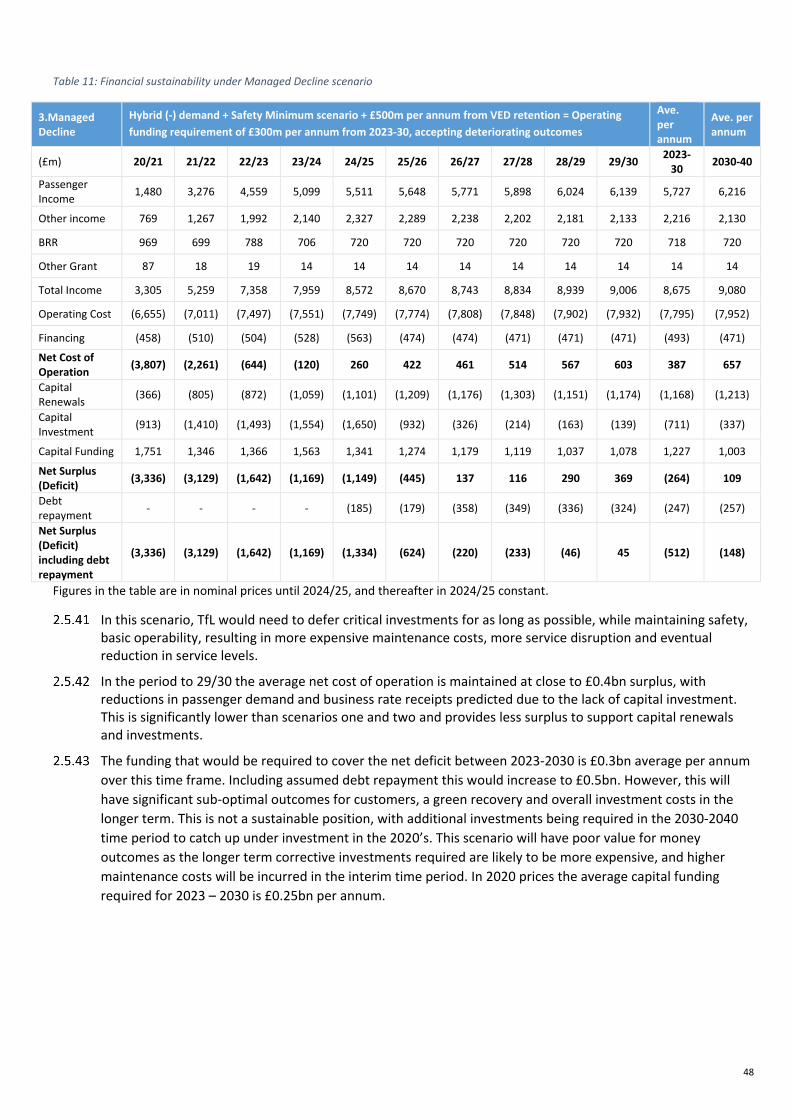
48
Table 11: Financial sustainability under Managed Decline scenario
3.Managed Decline
Hybrid (-) demand + Safety Minimum scenario + £500m per annum from VED retention = Operating funding requirement of £300m per annum from 2023-30, accepting deteriorating outcomes
Ave. per annum
Ave. per annum
(£m) 20/21 21/22 22/23 23/24 24/25 25/26 26/27 27/28 28/29 29/30 2023-30 2030-40
Passenger Income 1,480 3,276 4,559 5,099 5,511 5,648 5,771 5,898 6,024 6,139 5,727 6,216
Other income 769 1,267 1,992 2,140 2,327 2,289 2,238 2,202 2,181 2,133 2,216 2,130
BRR 969 699 788 706 720 720 720 720 720 720 718 720
Other Grant 87 18 19 14 14 14 14 14 14 14 14 14
Total Income 3,305 5,259 7,358 7,959 8,572 8,670 8,743 8,834 8,939 9,006 8,675 9,080
Operating Cost (6,655) (7,011) (7,497) (7,551) (7,749) (7,774) (7,808) (7,848) (7,902) (7,932) (7,795) (7,952)
Financing (458) (510) (504) (528) (563) (474) (474) (471) (471) (471) (493) (471)
Net Cost of Operation (3,807) (2,261) (644) (120) 260 422 461 514 567 603 387 657
Capital Renewals (366) (805) (872) (1,059) (1,101) (1,209) (1,176) (1,303) (1,151) (1,174) (1,168) (1,213)
Capital Investment (913) (1,410) (1,493) (1,554) (1,650) (932) (326) (214) (163) (139) (711) (337)
Capital Funding 1,751 1,346 1,366 1,563 1,341 1,274 1,179 1,119 1,037 1,078 1,227 1,003
Net Surplus (Deficit) (3,336) (3,129) (1,642) (1,169) (1,149) (445) 137 116 290 369 (264) 109
Debt repayment - - - - (185) (179) (358) (349) (336) (324) (247) (257)
Net Surplus (Deficit) including debt repayment
(3,336) (3,129) (1,642) (1,169) (1,334) (624) (220) (233) (46) 45 (512) (148)
Figures in the table are in nominal prices until 2024/25, and thereafter in 2024/25 constant.
In this scenario, TfL would need to defer critical investments for as long as possible, while maintaining safety, basic operability, resulting in more expensive maintenance costs, more service disruption and eventual reduction in service levels.
In the period to 29/30 the average net cost of operation is maintained at close to £0.4bn surplus, with reductions in passenger demand and business rate receipts predicted due to the lack of capital investment. This is significantly lower than scenarios one and two and provides less surplus to support capital renewals and investments.
The funding that would be required to cover the net deficit between 2023-2030 is £0.3bn average per annum over this time frame. Including assumed debt repayment this would increase to £0.5bn. However, this will have significant sub-optimal outcomes for customers, a green recovery and overall investment costs in the longer term. This is not a sustainable position, with additional investments being required in the 2030-2040 time period to catch up under investment in the 2020’s. This scenario will have poor value for money outcomes as the longer term corrective investments required are likely to be more expensive, and higher maintenance costs will be incurred in the interim time period. In 2020 prices the average capital funding required for 2023 – 2030 is £0.25bn per annum.
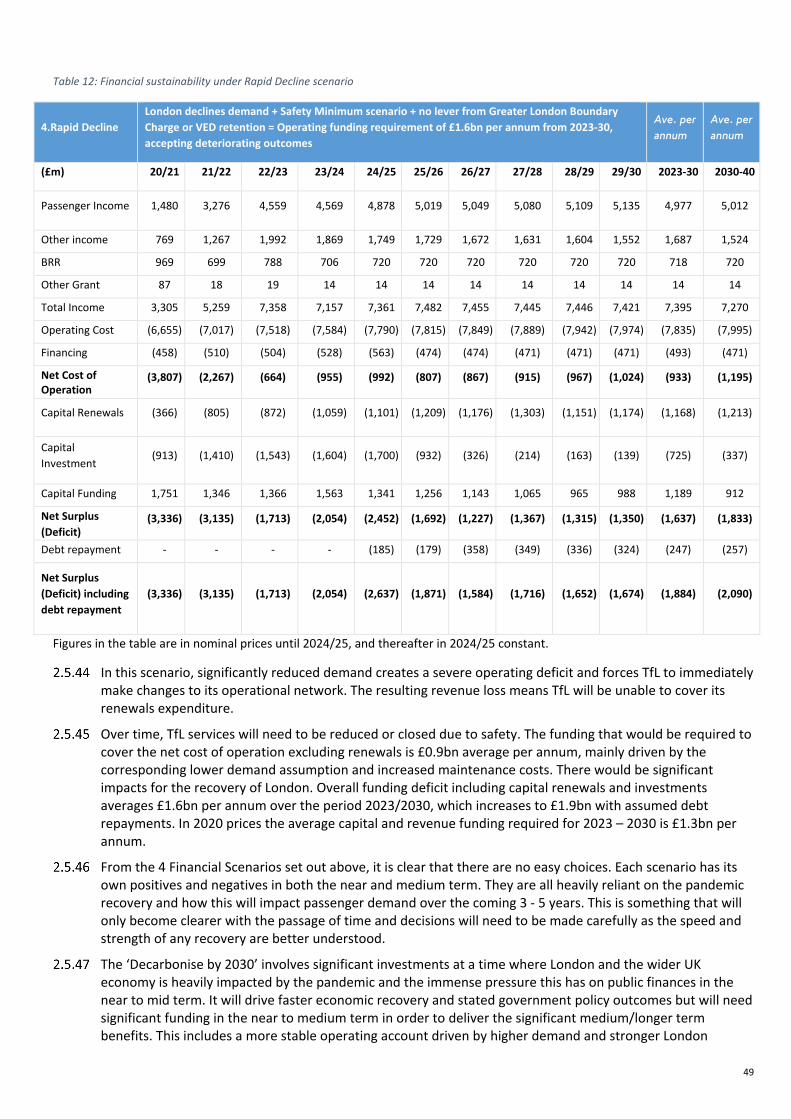
49
Table 12: Financial sustainability under Rapid Decline scenario
4.Rapid Decline London declines demand + Safety Minimum scenario + no lever from Greater London Boundary Charge or VED retention = Operating funding requirement of £1.6bn per annum from 2023-30, accepting deteriorating outcomes
Ave. per annum
Ave. per annum
(£m) 20/21 21/22 22/23 23/24 24/25 25/26 26/27 27/28 28/29 29/30 2023-30 2030-40
Passenger Income 1,480 3,276 4,559 4,569 4,878 5,019 5,049 5,080 5,109 5,135 4,977 5,012
Other income 769 1,267 1,992 1,869 1,749 1,729 1,672 1,631 1,604 1,552 1,687 1,524
BRR 969 699 788 706 720 720 720 720 720 720 718 720
Other Grant 87 18 19 14 14 14 14 14 14 14 14 14
Total Income 3,305 5,259 7,358 7,157 7,361 7,482 7,455 7,445 7,446 7,421 7,395 7,270
Operating Cost (6,655) (7,017) (7,518) (7,584) (7,790) (7,815) (7,849) (7,889) (7,942) (7,974) (7,835) (7,995)
Financing (458) (510) (504) (528) (563) (474) (474) (471) (471) (471) (493) (471)
Net Cost of Operation
(3,807) (2,267) (664) (955) (992) (807) (867) (915) (967) (1,024) (933) (1,195)
Capital Renewals (366) (805) (872) (1,059) (1,101) (1,209) (1,176) (1,303) (1,151) (1,174) (1,168) (1,213)
Capital Investment
(913) (1,410) (1,543) (1,604) (1,700) (932) (326) (214) (163) (139) (725) (337)
Capital Funding 1,751 1,346 1,366 1,563 1,341 1,256 1,143 1,065 965 988 1,189 912
Net Surplus (Deficit)
(3,336) (3,135) (1,713) (2,054) (2,452) (1,692) (1,227) (1,367) (1,315) (1,350) (1,637) (1,833)
Debt repayment - - - - (185) (179) (358) (349) (336) (324) (247) (257)
Net Surplus (Deficit) including debt repayment
(3,336) (3,135) (1,713) (2,054) (2,637) (1,871) (1,584) (1,716) (1,652) (1,674) (1,884) (2,090)
Figures in the table are in nominal prices until 2024/25, and thereafter in 2024/25 constant.
In this scenario, significantly reduced demand creates a severe operating deficit and forces TfL to immediately make changes to its operational network. The resulting revenue loss means TfL will be unable to cover its renewals expenditure.
Over time, TfL services will need to be reduced or closed due to safety. The funding that would be required to cover the net cost of operation excluding renewals is £0.9bn average per annum, mainly driven by the corresponding lower demand assumption and increased maintenance costs. There would be significant impacts for the recovery of London. Overall funding deficit including capital renewals and investments averages £1.6bn per annum over the period 2023/2030, which increases to £1.9bn with assumed debt repayments. In 2020 prices the average capital and revenue funding required for 2023 – 2030 is £1.3bn per annum.
From the 4 Financial Scenarios set out above, it is clear that there are no easy choices. Each scenario has its own positives and negatives in both the near and medium term. They are all heavily reliant on the pandemic recovery and how this will impact passenger demand over the coming 3 - 5 years. This is something that will only become clearer with the passage of time and decisions will need to be made carefully as the speed and strength of any recovery are better understood.
The ‘Decarbonise by 2030’ involves significant investments at a time where London and the wider UK economy is heavily impacted by the pandemic and the immense pressure this has on public finances in the near to mid term. It will drive faster economic recovery and stated government policy outcomes but will need significant funding in the near to medium term in order to deliver the significant medium/longer term benefits. This includes a more stable operating account driven by higher demand and stronger London

50
economic growth. TfL believes that if funded, this scenario will deliver the best outcomes for London and wider UK.
The ‘Rapid Decline’ see significant structural demand reduction, with limited safety focused investment that will drive a gradual decline in TfL’s ability to deliver reliable and appealing services to our customers. The large structural operating deficit will remain and under investment will mean a spiral to an uncertain future for our customers and economically for TfL. TfL does not see this as a viable sustainable option in the near to medium term.
The remaining two scenarios of ‘Limited Recovery’ and ‘Managed Decline’ reflect increasingly lower demand and lower investment than Decarbonise by 2030 and do not deliver a sustainable operating surplus or levels of services that our customers require. They would both have an increasingly detrimental impact to TfL’s financial sustainability and London’s economic recovery. TfL do not see these as medium to long term solutions to financial sustainability.
Irrespective of the scenario, it is clear that TfL cannot reach financial sustainability within its current funding model until 2025/26 at the earliest, and only then through accepting a much lower level of capital spend that would lead to significantly worse outcomes in terms of supporting the economic recovery, air quality, congestion and housing.
Relationship between Crossrail and TfL’s Financial Sustainability
Crossrail presents a significant risk to TfL’s financial sustainability in two ways.
First, TfL’s latest forecasts, including the GLA Budget, assume that the Elizabeth line will generate a significant net operating surplus by 2022/23 and beyond. As a result, in the event that the opening date for the central section (stage 3) falls behind the current planning assumption of first half of 2022, or in the event that demand for the line is less than forecast, this could have a relatively significant impact on TfL’s finances.
Second, in the event that the cost to complete the project exceeds the current funding envelope, it is not yet clear how this would be addressed. TfL is not in a position to provide further funding to the scheme given wider financial pressures and the requirement for ongoing Government support in the short term period in which Crossrail may require additional funds. At present, there is also no further ability for the GLA to contribute additional funding. We are working hard to make sure opportunities for efficiencies and avoiding prolongation in the programme are utilised. Should further funding be required, this will require separate discussion and agreement with Government.

51
3. Economic fundamentals of TfL business areas In order to understand fully how TfL overall can reach financial sustainability it is important to understand the economic fundamentals of the individual business units, and the varying degrees to which (pre-pandemic) they were on track to achieve financial sustainability.
Chapter Summary
Chapter 3 sets out details of TfL’s major business areas: (i) Buses and streets; (ii) Rail and Tube; and (iii) Housing and Land. The Chapter includes details of the major challenges faced and the varying degrees to which the business areas were on track to achieve financial sustainability pre-pandemic. Chapter 3 also sets out potential options for further improvement in financial sustainability in each business area.
Buses and streets The Buses and streets business area is unable to achieve financial sustainability without further income levers. Londoners currently pay around £500m of VED annually, almost all of which is used to fund roads outside of London. If London could retain the £500m that Londoners pay in VED each year, it would cover the net cost of operations for Buses and streets, as well as funding a proportion of new capital investment. If London is not allowed to keep its share of VED, other ways of raising this money will be needed. TfL have been asked to look at the feasibility of a Greater London Boundary Charge which could deliver key MTS objectives and raise net revenue of around £500m per annum.
Rail and Tube Prior to the pandemic, London Underground was one of the only major metro operators in Europe and North America to be able to cover its own operating, maintenance and finance costs and was on track to provide significant operating surplus for renewals and enhancements. The pandemic has thrown off London Underground’s trajectory to become self-sustaining.
Furthermore, this business area is unable to cover the full extent of its capital renewals, and TfL will need to consider options on how to close that gap, such as through target changes to fare structure. As a result, and given TfL’s borrowing is already at its limits, TfL believes that further Government grant is likely to be required to support capital investment for enhancements while the Rail and Tube business rebuilds to turn a surplus and can borrow sustainably again in the future.
Housing and Land Prior to the coronavirus pandemic, housing and property projects were already competing for funding with TfL's transport-related activity. The impact of the pandemic has further constrained TfL’s ability to make the investment decisions needed to deliver both the new homes and the additional income projected in the current plan.
However, there is an opportunity to use Housing and Land’s income stream and asset base to raise commercial funding for future investment. This would require an injection of funding from MHCLG and an ability for TTLP to borrow, to create the ability to continue raising further capital in future and creating a surplus to reinvest in housing and public services. Subject to understanding the appetite and constraints for Government in working in partnership with TTLP, TfL propose to develop and refine the capital structure options.

52
Buses and streets Context and current position
Prior to the pandemic, London’s streets supported almost 80 per cent of trips made in London each day, with the majority of these trips being made by buses, walking or cycling.28
The bus network plays a critical role in supporting more local journeys and providing connectivity to areas the rail network doesn’t reach. The bus network provides an affordable alternative to the car, providing access to employment and services to disadvantaged communities not otherwise served by rail. This is particularly important in London compared to the rest of the country, as approximately half of Londoners do not have access to a car. Even if these Londoners did have access to a car, the road network would not be viable for travel as it would be gridlocked. TfL needs to continue to invest in the bus network so it can adapt to innovations such as ride hailing apps and micro mobility.
The role of TfL as the commissioning authority and regulator of privately-operated bus services in London has been shown to be successful and flexible and is being considered for the model for other cities. The ‘London model’ successfully leverages private sector investment, innovation and management, but ensures buses go where they are needed and are affordable to use. The key financial characteristics for buses are:
• Capital investment in bus renewals and enhancements to the capacity of the bus network are delivered through the bus operating contracts, leveraging private sector investment, and therefore show as operating costs (rather than capital). This efficient off-balance sheet financing model means that buses have a relatively higher operating cost and lower capital investment requirement compared to other modes where TfL makes all the capital investment directly.
• Statutory concessionary fares structures mean bus income is insufficient to fund operating costs even after the application of the full amount of TfL’s operating business rates to this area.
The fact that TfL’s bus services require subsidy from non-fare revenues sources is in line with the rest of England where local bus services received a total net support of £512m from Central and Local Government through public transport support and Bus Service Operator Grant (BSOG) in 2018/19. London no longer receives BSOG, which in 2013 was devolved into the TfL operating grant and retained business rates. The TfL operating grant was then withdrawn in 2018/19.
London’s streets also need to support people walking and cycling for the benefit of their local economy, environment and health. London needs streets that can efficiently support the movement of freight and people, without damaging impacts on health and wellbeing.
Responsibility for managing London’s road network is shared between TfL, Highways England, and the 32 London boroughs, plus the City of London.
• TfL manages the TLRN or London’s ‘red routes’ which is London’s strategic road network, making up five per cent of London’s roads but carrying 30 per cent of traffic. TfL also has the strategic traffic management role for all of London and is responsible for the maintenance, management and operation of the Capital’s 6,000+ sets of traffic lights.
• Highways England manages the national motorway network, including the M25, M1, M4 and M11. These make up 0.4 per cent of roads in London29.
• The London boroughs, and City of London, are responsible for all the remaining roads within their boundaries, which make up circa 95 per of the roads in London.
London is the only major city in the country which has implemented Road User Charging (RUC). It has done so in a manner that reduces congestion while generating a revenue stream which is reinvested in the transport network. However, the revenues generated are still not sufficient to cover the cost of operating and maintaining the road network and do not contribute to covering the cost of financing, capital renewals or enhancements. Instead this element of TfL’s services currently requires cross-subsidy from the other business
28 Source: Data for 2019 from the Travel in London Report 13 29 Source: DfT statistics for Road Lengths (miles) by road type and region and country in Great Britain, 2019
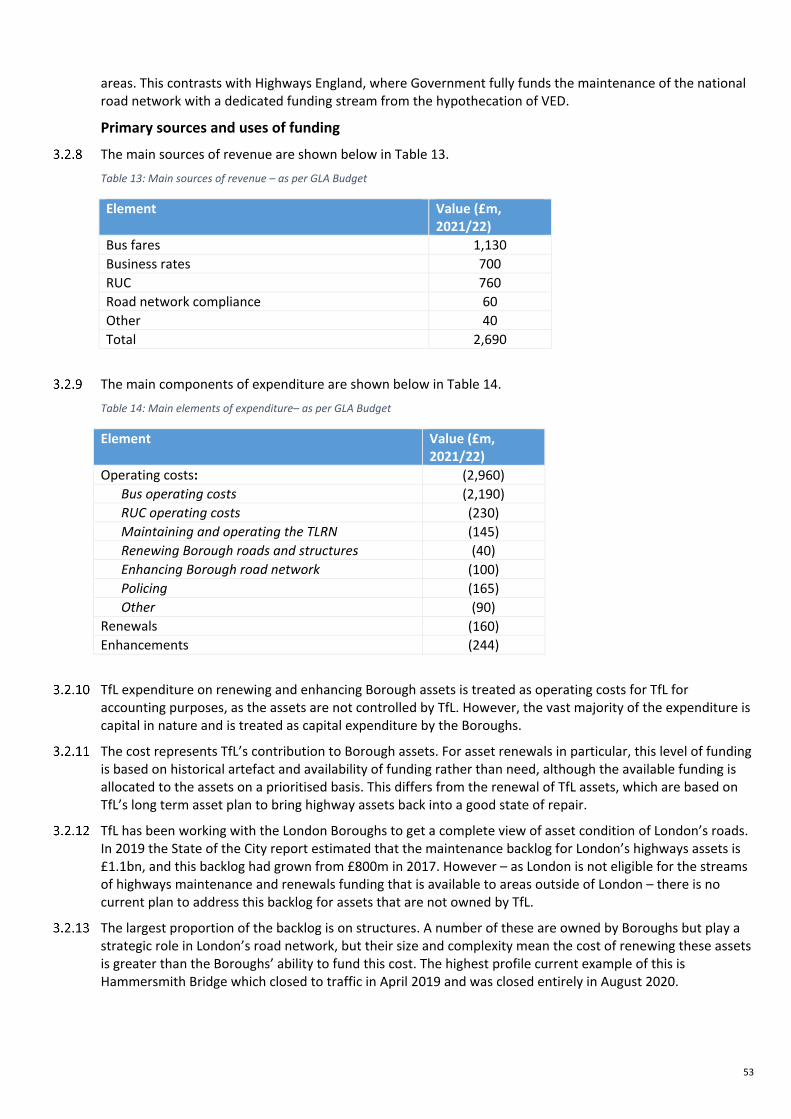
53
areas. This contrasts with Highways England, where Government fully funds the maintenance of the national road network with a dedicated funding stream from the hypothecation of VED.
Primary sources and uses of funding
The main sources of revenue are shown below in Table 13.
Table 13: Main sources of revenue – as per GLA Budget
Element Value (£m, 2021/22)
Bus fares 1,130 Business rates 700 RUC 760 Road network compliance 60 Other 40 Total 2,690
The main components of expenditure are shown below in Table 14.
Table 14: Main elements of expenditure– as per GLA Budget
Element Value (£m, 2021/22)
Operating costs: (2,960) Bus operating costs (2,190) RUC operating costs (230) Maintaining and operating the TLRN (145) Renewing Borough roads and structures (40) Enhancing Borough road network (100) Policing (165) Other (90)
Renewals (160) Enhancements (244)
TfL expenditure on renewing and enhancing Borough assets is treated as operating costs for TfL for accounting purposes, as the assets are not controlled by TfL. However, the vast majority of the expenditure is capital in nature and is treated as capital expenditure by the Boroughs.
The cost represents TfL’s contribution to Borough assets. For asset renewals in particular, this level of funding is based on historical artefact and availability of funding rather than need, although the available funding is allocated to the assets on a prioritised basis. This differs from the renewal of TfL assets, which are based on TfL’s long term asset plan to bring highway assets back into a good state of repair.
TfL has been working with the London Boroughs to get a complete view of asset condition of London’s roads. In 2019 the State of the City report estimated that the maintenance backlog for London’s highways assets is £1.1bn, and this backlog had grown from £800m in 2017. However – as London is not eligible for the streams of highways maintenance and renewals funding that is available to areas outside of London – there is no current plan to address this backlog for assets that are not owned by TfL.
The largest proportion of the backlog is on structures. A number of these are owned by Boroughs but play a strategic role in London’s road network, but their size and complexity mean the cost of renewing these assets is greater than the Boroughs’ ability to fund this cost. The highest profile current example of this is Hammersmith Bridge which closed to traffic in April 2019 and was closed entirely in August 2020.

54
Bus service levels
Under the Hybrid demand scenario, bus demand levels recover to circa 90 per cent of pre-pandemic levels by 2025 and circa 95 per cent by 2031. Prior to that, peak levels of demand in Central London are most adversely affected and recover the slowest. In contrast, quite a lot of activity relocates to London’s suburbs, so trip-making is relatively buoyant, not least off-peak. Indeed, Outer London bus demand has recovered faster than Central / Inner demand to date.
• Outer London bus demand will grow faster than the network average (+1 to +2 per cent in AM, PM, interpeak and evening by 2031 compared to 2016);
• Central London bus trips will shrink in number (-16 per cent in the AM peak and -11 per cent in the PM peak by 2031 compared to 2016).
These forecasts support service changes that at least maintain services in outer London and reduce services in Central London. Central London has many high frequency (5+ buses per hour) trunk bus services. Orthodox service planning says that TfL should run a sufficient peak frequency to meet demand at the busiest part of the route in the busiest direction at the busiest time of day, plus a small margin given the possibility of uneven running due to traffic conditions and so on. With lower demand in Central London TfL will, over time, consider the case for cutting frequencies – especially as routes come up for review prior to re-tendering.
Implementing these reductions saves approximately £40m on a net basis per annum by 2024/25. A proportion of these reductions would be delivered through mid-contract changes, so the total saving would increase at the point these routes are retendered.
Even with the full allocation of TfL retained operating business rates and making these bus service reductions, without a new source of funding, the net cost of operation for buses and streets under the Hybrid demand scenario is approximately £500m per annum by 2030.
Buses and streets – decarbonise by 2030 scenario
The Decarbonise by 2030 scenario assumes TfL can generate £500m per annum from October 2023, either through retaining London VED or implementing the Greater London Boundary Charge. In addition, it assumes the bus network was reduced to match demand. In this scenario, buses and streets can create a net surplus from operations (after BRR) from 2022/23 until 2029/30 (see Table 15).
Table 15: Buses & streets account for Decarbonise by 2030 net cost of operations
1. Decarbonise by 2030 Surface (Excl. Rail)
Hybrid (+) demand + policy consistent capital scenario + £500m per annum from Greater London Boundary Charge or VED retention
Ave. per annum
Ave. per annum
(£m) 20/21 21/22 22/23 23/24 24/25 25/26 26/27 27/28 28/29 29/30 2023-40 2030-40
Passenger Income 679 1,128 1,455 1,502 1,562 1,649 1,670 1,691 1,711 1,732 1,645 1,737
Other income 531 869 1,274 1,521 1,932 1,838 1,783 1,728 1,673 1,618 1,728 1,627
Operating Costs (2,822) (2,952) (3,153) (3,385) (3,716) (3,690) (3,690) (3,690) (3,690) (3,690) (3,650) (3,690)
Finance Costs (32) (33) (35) (36) (39) (33) (33) (33) (33) (33) (35) (33)
Indirect Operating
(138) (125) (108) (105) (107) (107) (107) (107) (107) (107) (107) (107)
Operating BRR 969 699 788 706 720 720 720 720 720 720 718 720
Net Cost of Operation
(812) (413) 221 203 352 376 343 308 274 240 299 254
Capital Renewals (83) (160) (223) (280) (265) (235) (267) (265) (316) (285) (274) (246)
Other Grant 5 5 5 5 5 5 5 5 5 5 5 5
Capital BRR funding (for LIPs)
100 100 100 100 100 100 100 100 100 100 100 100
Capital I t t
(232) (322) (259) (303) (313) (621) (558) (473) (474) (469) (459) (460)

55
Net Surplus (Deficit)
(1,022) (790) (156) (275) (122) (375) (378) (325) (411) (410) (328) (347)
Debt repayment (13) (13) (25) (24) (23) (22) (17) (18)
Net Surplus (Deficit) after Debt repayment
(1,022) (790) (156) (275) (135) (388) (403) (349) (435) (432) (345) (365)
Figures in the table are in nominal prices until 2024/25, and thereafter in 2024/25 constant.
For any further improvement in financial sustainability there are the following main levers:
• Increase existing or planned income sources
• Introduce new income sources
• Increase efficiency (operating costs and capital expenditure)
• Reduce level of renewals
Increase existing or planned income sources
The main opportunity to increase income in 2023/24 is to accelerate the planning assumption of either the devolution of VED or the implementation of the Greater London Boundary Charge sooner than the planning assumption of October 2023. If this was April 2023 it would improve the net cost of operations by approximately £250m. Any implementation of the Greater London Boundary Charge would be subject to the feasibility study, detailed impact assessment, consultation and Mayoral decision. Details of this are included in Section 5.8.
Table 16 below shows TfL’s existing main income sources with a high-level assessment of the potential to increase these further. There is limited scope to make a material impact on the funding gap through these income sources.
Table 16: Income source analysis
Element Commentary
Bus fares See Section 5.7 for further detail on fare levels.
The Hybrid demand scenario is based on passenger numbers returning to 90 per cent of 2019 Business Plan levels. There remains significant uncertainty on demand levels, but this is believed to be the most probable scenario.
Business rates TfL’s full revenue business rates allocation is already allocated to buses and streets. This allocation is reducing due to lower business rate receipts.
RUC The temporary changes to the Congestion Charge have included an increase in the price of the charge to £15. As a planning assumption, this increase has been assumed to be retained, although this will be subject to considering appropriate proposals, a detailed impact assessment, consultation and Mayoral decision.
TfL’s existing RUC schemes are designed to achieve the policy objectives of the scheme rather than raise revenue. There is very limited scope for increasing income further within these current schemes.
Road network compliance
Enforcement activity is designed to drive compliance rather than increasing revenue. The baseline plan targets a further increase in compliance by increasing the level of road network enforcement using automated deployable enforcement cameras.
The value of Penalty Charge Notices (PCNs) is decreasing in real terms which means their deterrent effect is reducing. In 2018, TfL proposed to increase road network compliance PCNs in-line with the PCNs for the Congestion Charge and ULEZ (£160), but
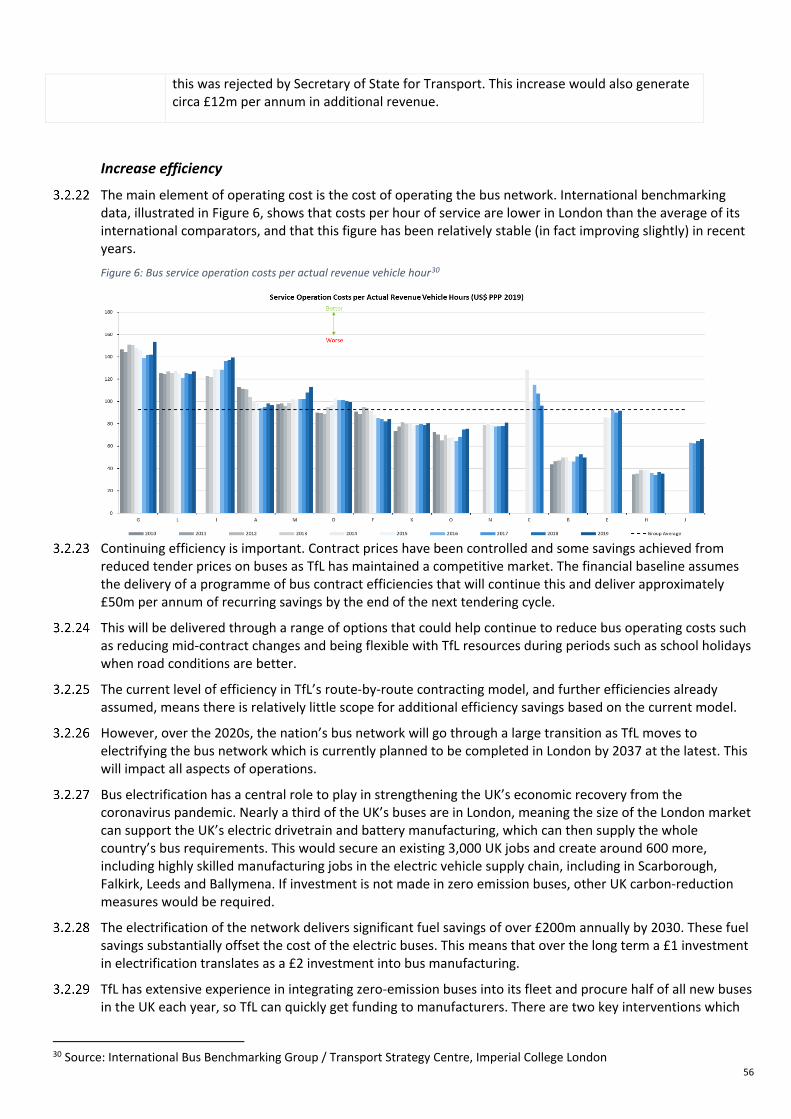
56
this was rejected by Secretary of State for Transport. This increase would also generate circa £12m per annum in additional revenue.
Increase efficiency
The main element of operating cost is the cost of operating the bus network. International benchmarking data, illustrated in Figure 6, shows that costs per hour of service are lower in London than the average of its international comparators, and that this figure has been relatively stable (in fact improving slightly) in recent years.
Figure 6: Bus service operation costs per actual revenue vehicle hour30
Continuing efficiency is important. Contract prices have been controlled and some savings achieved from reduced tender prices on buses as TfL has maintained a competitive market. The financial baseline assumes the delivery of a programme of bus contract efficiencies that will continue this and deliver approximately £50m per annum of recurring savings by the end of the next tendering cycle.
This will be delivered through a range of options that could help continue to reduce bus operating costs such as reducing mid-contract changes and being flexible with TfL resources during periods such as school holidays when road conditions are better.
The current level of efficiency in TfL’s route-by-route contracting model, and further efficiencies already assumed, means there is relatively little scope for additional efficiency savings based on the current model.
However, over the 2020s, the nation’s bus network will go through a large transition as TfL moves to electrifying the bus network which is currently planned to be completed in London by 2037 at the latest. This will impact all aspects of operations.
Bus electrification has a central role to play in strengthening the UK’s economic recovery from the coronavirus pandemic. Nearly a third of the UK’s buses are in London, meaning the size of the London market can support the UK’s electric drivetrain and battery manufacturing, which can then supply the whole country’s bus requirements. This would secure an existing 3,000 UK jobs and create around 600 more, including highly skilled manufacturing jobs in the electric vehicle supply chain, including in Scarborough, Falkirk, Leeds and Ballymena. If investment is not made in zero emission buses, other UK carbon-reduction measures would be required.
The electrification of the network delivers significant fuel savings of over £200m annually by 2030. These fuel savings substantially offset the cost of the electric buses. This means that over the long term a £1 investment in electrification translates as a £2 investment into bus manufacturing.
TfL has extensive experience in integrating zero-emission buses into its fleet and procure half of all new buses in the UK each year, so TfL can quickly get funding to manufacturers. There are two key interventions which
30 Source: International Bus Benchmarking Group / Transport Strategy Centre, Imperial College London

57
can be made, with Government support, to accelerate the electrification to 2030, significantly reduce carbon emissions, support the UK ‘green’ manufacturing industry and deliver operating cost efficiencies. These are ‘grid-to-gate’ garage power supply upgrades and supporting the bus leasing market to smooth the delivery profile of electric buses.
These interventions will also support the Government’s target to reduce carbon emissions by at least 68 per cent by 2030. If investment is not made in zero emission buses, other UK carbon-reduction measures would be required.
Grid to gate
TfL’s route tendering model means that a bus operator typically needs to have won an electric route contract before it can justify investment in upgrading its garage power supply.
The level of upgrades that are currently justifiable are typically incremental upgrades to cover the route electric contract that has been won, rather than the complete upgrade the garage will ultimately require to deliver a full electric operation. These incremental upgrades add significant cost to overall garage electrification.
To address this issue, TfL has developed a grid-to-gate grant funding scheme which would expedite the complete power supply upgrade of all bus garages in London, with each upgrade completed in a single step. The cost of this is approximately £180m, which would ultimately have to be paid through the tendering system over time if the entire bus fleet is to be electrified.
However, financing these upgrades directly delivers operating cost savings of approximately £80m by avoiding inefficient incremental upgrade, coordinates combined garage upgrades and removes operator profit margin and higher financing costs. It also maintains a competitive tendering market for electric bus contracts, which avoids cost risk of approximately £120m.
The grid-to-gate funding scheme is included in TfL’s baseline financial position, along with TfL’s GLA Budget submission and Comprehensive Spending Review submission. However, without future funding certainty, TfL cannot commence this programme. A long term capital settlement, or specific funding for this programme, would unlock these operating cost efficiencies and support the acceleration of the electrification of London’s buses to 2030.
If it is not possible for Government to provide direct funding certainty for this programme, TfL could explore with Government whether they are able to provide a level of guarantee to underwrite either TfL or the operators financing this investment in an efficient manner.
TfL believes the ‘grid-to-gate’ programme would benefit the rest of the country and could be a national scheme to remove a key barrier in electrifying the nation’s bus fleet.
Support for bus leasing
TfL’s ambition is to transition the entire bus fleet to zero emission by 2030. Delivering this through the route tendering programme would create significant peaks and troughs in electric bus delivery due to the contracting cycle and the age of existing vehicles. Figure 7 illustrates this profile.
Figure 7: Indicative profile of zero emission bus transition programme
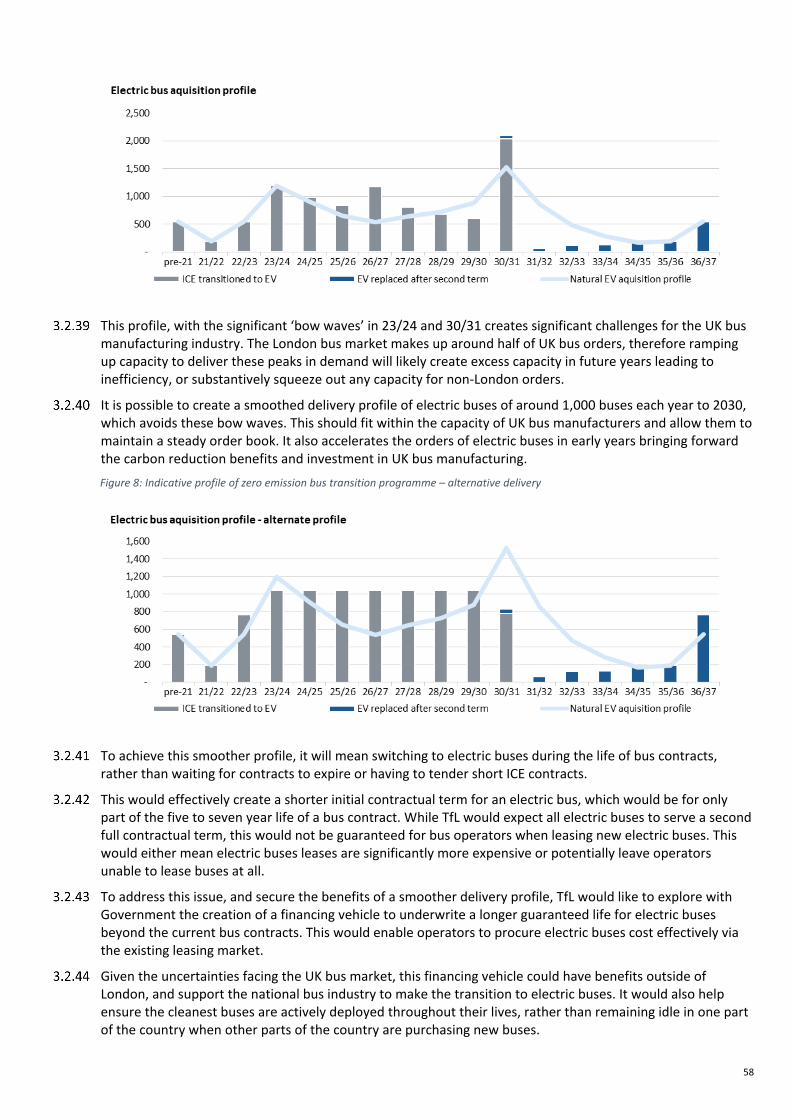
58
This profile, with the significant ‘bow waves’ in 23/24 and 30/31 creates significant challenges for the UK bus manufacturing industry. The London bus market makes up around half of UK bus orders, therefore ramping up capacity to deliver these peaks in demand will likely create excess capacity in future years leading to inefficiency, or substantively squeeze out any capacity for non-London orders.
It is possible to create a smoothed delivery profile of electric buses of around 1,000 buses each year to 2030, which avoids these bow waves. This should fit within the capacity of UK bus manufacturers and allow them to maintain a steady order book. It also accelerates the orders of electric buses in early years bringing forward the carbon reduction benefits and investment in UK bus manufacturing.
Figure 8: Indicative profile of zero emission bus transition programme – alternative delivery
To achieve this smoother profile, it will mean switching to electric buses during the life of bus contracts, rather than waiting for contracts to expire or having to tender short ICE contracts.
This would effectively create a shorter initial contractual term for an electric bus, which would be for only part of the five to seven year life of a bus contract. While TfL would expect all electric buses to serve a second full contractual term, this would not be guaranteed for bus operators when leasing new electric buses. This would either mean electric buses leases are significantly more expensive or potentially leave operators unable to lease buses at all.
To address this issue, and secure the benefits of a smoother delivery profile, TfL would like to explore with Government the creation of a financing vehicle to underwrite a longer guaranteed life for electric buses beyond the current bus contracts. This would enable operators to procure electric buses cost effectively via the existing leasing market.
Given the uncertainties facing the UK bus market, this financing vehicle could have benefits outside of London, and support the national bus industry to make the transition to electric buses. It would also help ensure the cleanest buses are actively deployed throughout their lives, rather than remaining idle in one part of the country when other parts of the country are purchasing new buses.

59
Reduce renewals Businesses across the UK rely on TfL’s road network for access to London’s consumers, with 90 per cent of all
freight transported by road. This means congested roads are a major barrier to economic recovery. A lack of long term certainty of sustained funding for London’s roads meant TfL had to introduce a two-year pause on proactive renewals on its highway assets in 2018. The impacts of the pandemic effectively extended this pause by almost six months.
This has led to deterioration in the state of good repair of TfL’s road assets. To maintain safety, TfL has had to introduce speed and weight restrictions and, in some cases, closures.
Investment is required now to renew key road assets, remove current restrictions and prevent further restrictions and closures, and immediately begin work on several high priority projects, including:
• Rotherhithe Tunnel: TfL could remove the need for several thousand small and medium sized vans to make a 30- to 60-minute detour each day to avoid the tunnel.
• A40 Westway: TfL could prevent unplanned closures and speed restrictions caused by the poor condition of the road and failure of large expansion joints.
• Gallows Corner Flyover: This would prevent unplanned closure due to safety defects and fatigue cracking and remove existing weight and speed restrictions.
Congestion in London now loses the economy £5.5bn per year and drivers in the Capital lose more than 200 hours per year stuck in traffic. If defects are not addressed, they will become safety critical and cause short notice closures for extended periods until repairs can be done, as happened recently with Hammersmith Bridge, which is also a key link for walking, cycling and buses.
Given the deterioration in the state of good repair, and the impact this is having on the reliability and connectivity of the network, TfL does not believe a reduction in the level of asset renewals is a viable option to support financial.
Reduced scope of capital enhancements
The Decarbonise by 2030 scenario is based on the ‘Policy Consistent’ Capital scenario, which brings forward electrification of London’s bus fleet to 2030, continues to invest to increase active travel, uplifts investment in bus priority to ensure buses remain an attractive alternative to the car and upgrades the traffic control system. These investments support a safe and sustainable recovery from the pandemic and ensures the most effective use of limited road space.
The Long term Capital Plan also sets out a Safety Minimum scenario for enhancements. This would mean no further enhancements beyond those currently contractually committed or required for critical safety reasons. This means there would be no electrification of the bus fleet and congestion on London’s roads would significantly increase, increasing carbon emissions and increasing the cost of congestion delays to the economy.
Rail, Tube and Elizabeth line Context and current position
To best understand the context of this till it helpful to consider the various modes separately.
London Underground
Before the Coronavirus pandemic, London Underground carried 1,377 million passenger journeys a year, equating to 82.4 million kilometres operated and delivered exceptionally strong overall customer satisfaction scores of 84 per cent in 2019/20. To deliver this service, our operations are underpinned by a complex and diverse asset base which require ongoing maintenance and renewal, including; 270 stations, 1,107km of track, 620 trains, 448 escalators, 2,255 ticket gates and more than 16,000 bridges and structures.
London Underground, with an annual operating cost of £1.9bn, is responsible for the operation and maintenance of all assets within London Underground, in the same way both Train Operating Companies (TOCs) and Network Rail are for National Rail.

60
In TfL’s 2019 Business Plan, London Underground was forecasting to achieve over £1bn in direct operating surplus by 2021/22, and TfL then expected to start covering an increasing proportion of TfL’s indirect and longer term capital costs for baseline renewals from the following year. Some of TfL’s surplus was also expected to help subsidise its bus operations.
At this time, passenger income was expected to increase on average by 4.3 per cent per annum over the plan period. With the pandemic having had a catastrophic impact on passenger demand and therefore revenues, the new path to achieving an operating surplus will be a long and challenging one.
TfL has continued to operate through the pandemic despite staff absence peaking at 35 per cent and ridership falling as low as four per cent of normal levels. By mid-summer this had grown to 35 per cent of normal levels before falling again in the autumn as further restrictions applied. The most recent news of Tier 4 restrictions immediately resulted in a drop in ridership, with ridership being between 14 per cent and 22 per cent of pre-COVID levels.
Elizabeth line and TfL Rail
As set out in its update in August 2020, the former Crossrail Limited Board’s assessment, based on the best available programme information, was that the central section of the Elizabeth line between Paddington and Abbey Wood will be ready to open in the first half of 2022.
The general uncertainty that surrounds revenue also applies to the Elizabeth line, with a potential longer term risk of around £150m per annum if demand for the new service grows more slowly than predicted. Particular areas of uncertainty include not only the rates of economic growth and post-COVID travel patterns, but also potential impacts on the speed of housing development along the route and the future for specific traffic generators such as Heathrow and Canary Wharf.
London Overground
Since opening in 2007, London Overground has proved TfL’s ability to successfully run high capacity, reliable suburban train services. The Overground is one of the best performing railways in the country and has consistently performed among the top rail services in terms of both reliability and customer satisfaction.
The operating concession is operated by Arriva London Rail, with a 7.5 year contract starting in November 2016. The core track infrastructure is owned and maintained by Network Rail, with the exception of the East London line which is owned and maintained by TfL. The rolling stock is leased by TfL.
DLR
The service is operated under concession by Keolis Amey Dockland (KAD), for which the contract runs until 2025. KAD also maintains the infrastructure, with the exception of the Lewisham branch which was delivered by a Private Finance Initiative (PFI) contract. The PFI ends in March 2021 and this will be incorporated into the KAD contract which will deliver operating synergies. The rolling stock is owned by TfL.
Trams
The service is operated by Tram Operation Limited (TOL) which is part of First Group PLC. This is under a 30 year PFI contract that was let in 2000 and will run to 2030. TOL provides the drivers and management to operate the service. The infrastructure and trams are owned and maintained by TfL.
Financial sustainability options
There are the following main levers considered in this section: • Increase existing or planned income sources • Reduce service levels • Increase operating efficiency • Reduce scope of capital renewals and replacements • Increase capital efficiency
Increase existing or planned income sources
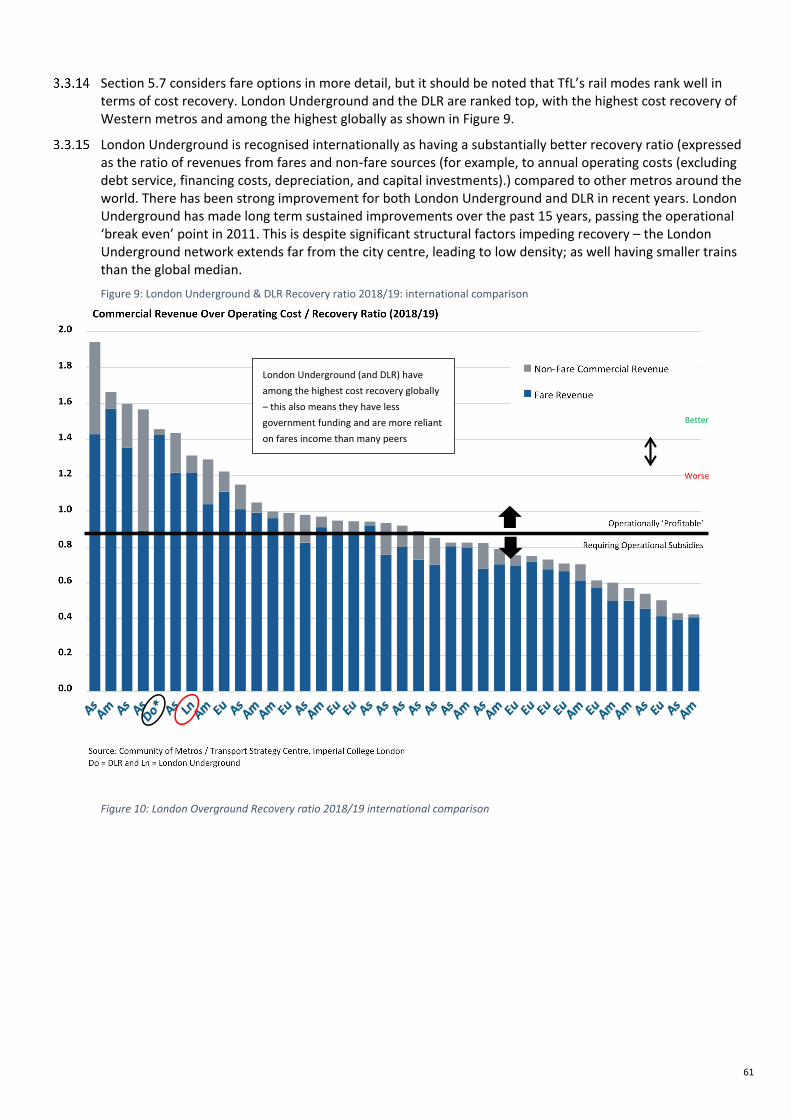
61
Section 5.7 considers fare options in more detail, but it should be noted that TfL’s rail modes rank well in terms of cost recovery. London Underground and the DLR are ranked top, with the highest cost recovery of Western metros and among the highest globally as shown in Figure 9.
London Underground is recognised internationally as having a substantially better recovery ratio (expressed as the ratio of revenues from fares and non‐fare sources (for example, to annual operating costs (excluding debt service, financing costs, depreciation, and capital investments).) compared to other metros around the world. There has been strong improvement for both London Underground and DLR in recent years. London Underground has made long term sustained improvements over the past 15 years, passing the operational ‘break even’ point in 2011. This is despite significant structural factors impeding recovery – the London Underground network extends far from the city centre, leading to low density; as well having smaller trains than the global median.
Figure 9: London Underground & DLR Recovery ratio 2018/19: international comparison
Figure 10: London Overground Recovery ratio 2018/19 international comparison
Better
Worse
London Underground (and DLR) have among the highest cost recovery globally – this also means they have less government funding and are more reliant on fares income than many peers

62
Reduce service levels
Reductions in service levels offer some opportunity to reduce costs. For the Underground this would involve management actions to reduce the different cost elements. For other rail modes this would require commercial negotiation with the concessionaire. In both cases, only reductions in variable costs are realistically achievable in the medium term (which includes any remaining contract life). Variable costs – those that are linked to service volume (power, staff and some maintenance) – are a relatively low proportion of overall costs. For the Underground variable costs represents 28 per cent of the total, 15 per cent for the Overground, 41 per cent for the DLR and 59 per cent for Trams.
In addition to high fixed costs, TfL’s rail networks achieve relatively high revenues per journey (compared to international benchmarks). This makes it worthwhile to maximise the use of assets: a redundant train still bears fixed costs, and higher train frequencies attract marginal additional customer income. As an example, this means that each Underground train only needs to carry 35 passengers to cover the variable cost of operation.
Table 17: Variable cost recovery
Measure Unit Trams DLR London Underground
London Overground
Variable cost of operations % 59% 41% 28% 15%
Revenue £m 23 169 2,785 224
Cost of operations £m 37 117 2,323 338
Variable cost of operations £m 22 48 659 50
Variable cost recovery (pre-COVID)
% 103% 352% 422% 447%
The current plans for the London Underground assume some minor adjustments to service levels, including delaying the re-opening of Night Tube, delaying the re-opening of the Waterloo & City line and implementing a package of off-peak service reductions (after a vaccine has been rolled out). However, there are currently no plans for more significant service reductions as they are not economically viable, even in a reasonable worst-case demand scenario.
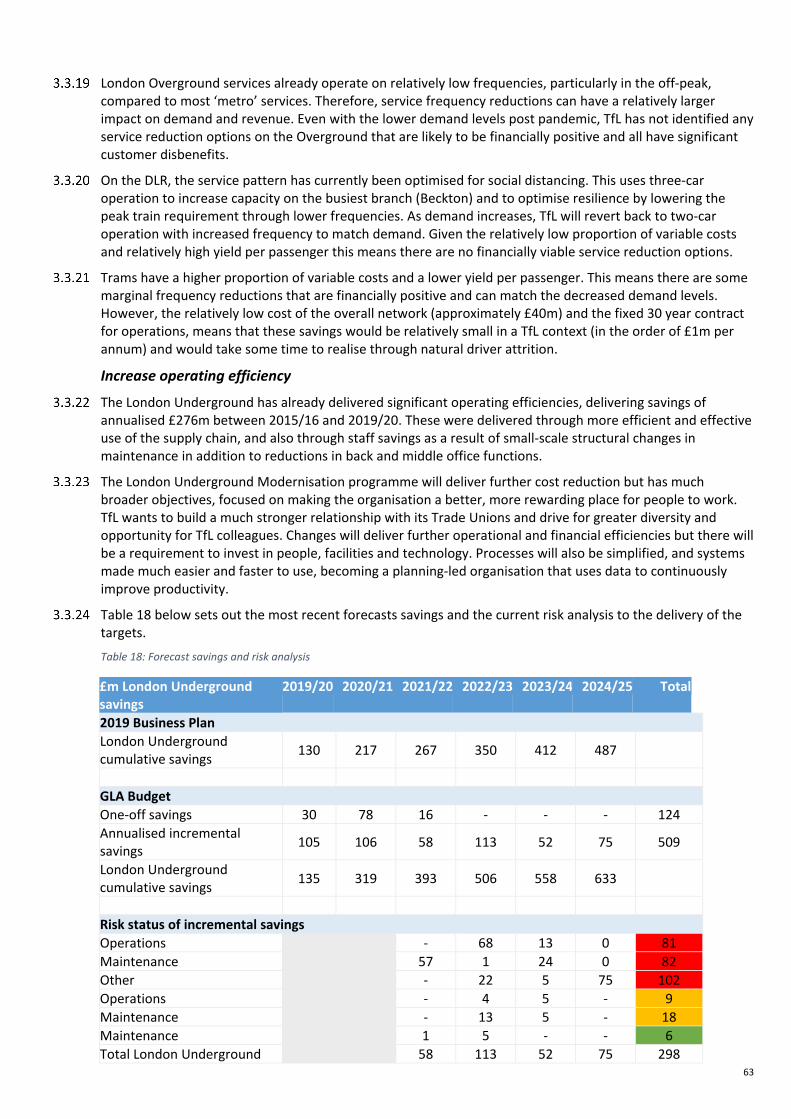
63
London Overground services already operate on relatively low frequencies, particularly in the off-peak, compared to most ‘metro’ services. Therefore, service frequency reductions can have a relatively larger impact on demand and revenue. Even with the lower demand levels post pandemic, TfL has not identified any service reduction options on the Overground that are likely to be financially positive and all have significant customer disbenefits.
On the DLR, the service pattern has currently been optimised for social distancing. This uses three-car operation to increase capacity on the busiest branch (Beckton) and to optimise resilience by lowering the peak train requirement through lower frequencies. As demand increases, TfL will revert back to two-car operation with increased frequency to match demand. Given the relatively low proportion of variable costs and relatively high yield per passenger this means there are no financially viable service reduction options.
Trams have a higher proportion of variable costs and a lower yield per passenger. This means there are some marginal frequency reductions that are financially positive and can match the decreased demand levels. However, the relatively low cost of the overall network (approximately £40m) and the fixed 30 year contract for operations, means that these savings would be relatively small in a TfL context (in the order of £1m per annum) and would take some time to realise through natural driver attrition.
Increase operating efficiency
The London Underground has already delivered significant operating efficiencies, delivering savings of annualised £276m between 2015/16 and 2019/20. These were delivered through more efficient and effective use of the supply chain, and also through staff savings as a result of small-scale structural changes in maintenance in addition to reductions in back and middle office functions.
The London Underground Modernisation programme will deliver further cost reduction but has much broader objectives, focused on making the organisation a better, more rewarding place for people to work. TfL wants to build a much stronger relationship with its Trade Unions and drive for greater diversity and opportunity for TfL colleagues. Changes will deliver further operational and financial efficiencies but there will be a requirement to invest in people, facilities and technology. Processes will also be simplified, and systems made much easier and faster to use, becoming a planning-led organisation that uses data to continuously improve productivity.
Table 18 below sets out the most recent forecasts savings and the current risk analysis to the delivery of the targets.
Table 18: Forecast savings and risk analysis
£m London Underground savings
2019/20 2020/21 2021/22 2022/23 2023/24 2024/25 Total
2019 Business Plan London Underground cumulative savings 130 217 267 350 412 487
GLA Budget One-off savings 30 78 16 - - - 124 Annualised incremental savings 105 106 58 113 52 75 509
London Underground cumulative savings 135 319 393 506 558 633
Risk status of incremental savings Operations - 68 13 0 81 Maintenance 57 1 24 0 82 Other - 22 5 75 102 Operations - 4 5 - 9 Maintenance - 13 5 - 18 Maintenance 1 5 - - 6 Total London Underground 58 113 52 75 298
64
KPMG have analysed the Modernisation programme as part of their review work and have cited that the programme carries significant risk, concluding that for a transformation programme of this scale it is prudent to assume only 70 per cent of forecast benefits will be delivered. Further internal reviews have reached the same conclusion, that it would be unrealistic to build speculative estimates of further savings at this stage. Management capacity is focused on working with thousands of people and suppliers to adapt to organisational and data/technology driven change over the next two years, alongside safely rebuilding passenger service numbers after the pandemic. Any additional opportunities will be used to offset potential under achievement of TfL’s efficiency targets.
TfL believes that the outsourced rail modes operate very efficiently, providing little room for operating efficiencies. This model allows the public sector to make the long term investment in infrastructure, manage the long-term liabilities on rolling stock and retain the difficult to manage demand risk. The private sector manages the day-to-day operators against a performance incentive regime. The lower risk transfer to the private sector means that the expected margins are lower than on national TOC contracts. This model has been highlighted by a number of parliamentary reviews as good practice for rail services in metropolitan areas and TfL expects the Williams Rail Review to highlight this as a model that should be adopted elsewhere in the country.
The DLR is a modern, efficient railway and its operating costs set against the number of trains run each hour are amongst the lowest in TfL’s international benchmarking group. Similarly, London Overground has a relatively low cost per train km, but difference in infrastructure provision does make international comparisons more difficult.
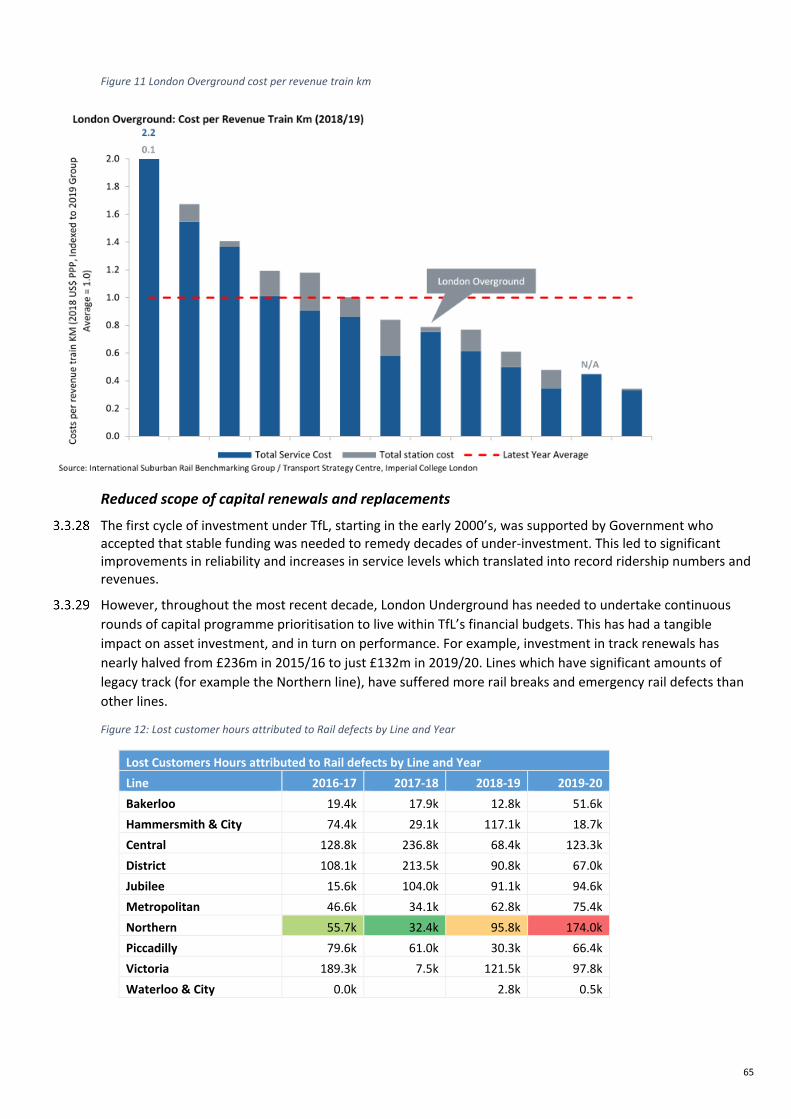
65
Figure 11 London Overground cost per revenue train km
Reduced scope of capital renewals and replacements
The first cycle of investment under TfL, starting in the early 2000’s, was supported by Government who accepted that stable funding was needed to remedy decades of under-investment. This led to significant improvements in reliability and increases in service levels which translated into record ridership numbers and revenues.
However, throughout the most recent decade, London Underground has needed to undertake continuous rounds of capital programme prioritisation to live within TfL’s financial budgets. This has had a tangible impact on asset investment, and in turn on performance. For example, investment in track renewals has nearly halved from £236m in 2015/16 to just £132m in 2019/20. Lines which have significant amounts of legacy track (for example the Northern line), have suffered more rail breaks and emergency rail defects than other lines.
Figure 12: Lost customer hours attributed to Rail defects by Line and Year
Lost Customers Hours attributed to Rail defects by Line and Year Line 2016-17 2017-18 2018-19 2019-20 Bakerloo 19.4k 17.9k 12.8k 51.6k Hammersmith & City 74.4k 29.1k 117.1k 18.7k Central 128.8k 236.8k 68.4k 123.3k District 108.1k 213.5k 90.8k 67.0k Jubilee 15.6k 104.0k 91.1k 94.6k Metropolitan 46.6k 34.1k 62.8k 75.4k Northern 55.7k 32.4k 95.8k 174.0k Piccadilly 79.6k 61.0k 30.3k 66.4k Victoria 189.3k 7.5k 121.5k 97.8k Waterloo & City 0.0k 2.8k 0.5k
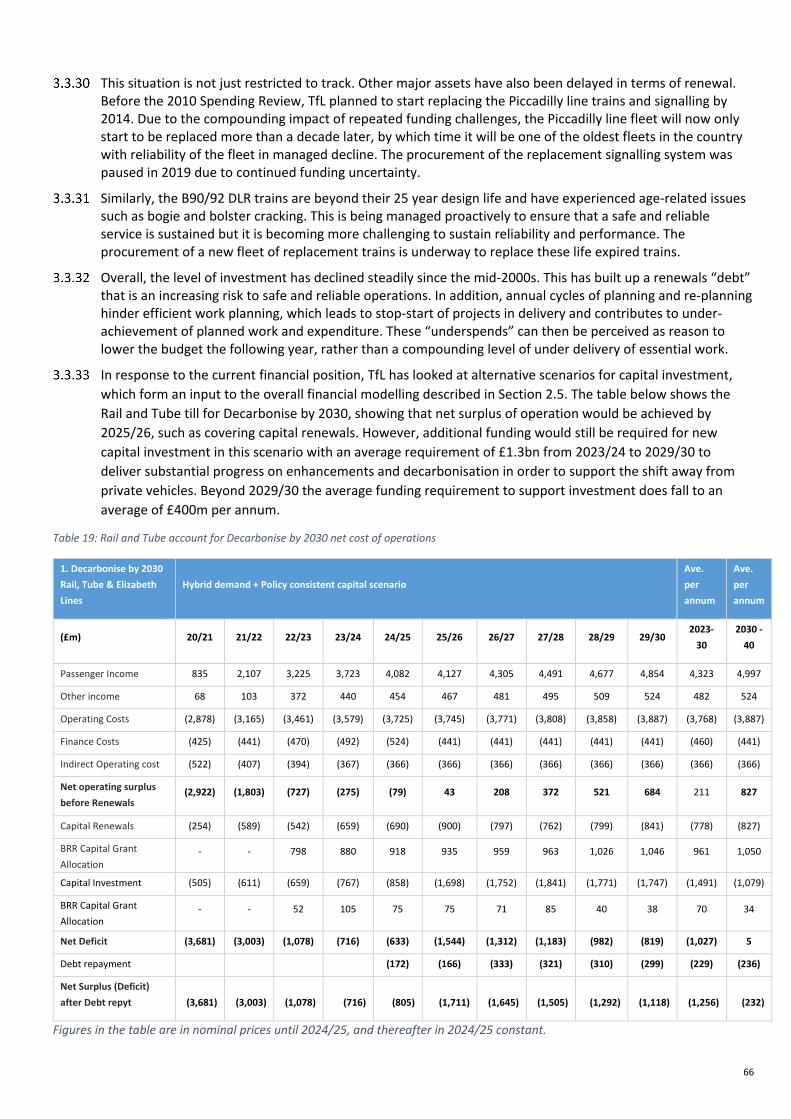
66
This situation is not just restricted to track. Other major assets have also been delayed in terms of renewal. Before the 2010 Spending Review, TfL planned to start replacing the Piccadilly line trains and signalling by 2014. Due to the compounding impact of repeated funding challenges, the Piccadilly line fleet will now only start to be replaced more than a decade later, by which time it will be one of the oldest fleets in the country with reliability of the fleet in managed decline. The procurement of the replacement signalling system was paused in 2019 due to continued funding uncertainty.
Similarly, the B90/92 DLR trains are beyond their 25 year design life and have experienced age-related issues such as bogie and bolster cracking. This is being managed proactively to ensure that a safe and reliable service is sustained but it is becoming more challenging to sustain reliability and performance. The procurement of a new fleet of replacement trains is underway to replace these life expired trains.
Overall, the level of investment has declined steadily since the mid-2000s. This has built up a renewals “debt” that is an increasing risk to safe and reliable operations. In addition, annual cycles of planning and re-planning hinder efficient work planning, which leads to stop-start of projects in delivery and contributes to under-achievement of planned work and expenditure. These “underspends” can then be perceived as reason to lower the budget the following year, rather than a compounding level of under delivery of essential work.
In response to the current financial position, TfL has looked at alternative scenarios for capital investment, which form an input to the overall financial modelling described in Section 2.5. The table below shows the Rail and Tube till for Decarbonise by 2030, showing that net surplus of operation would be achieved by 2025/26, such as covering capital renewals. However, additional funding would still be required for new capital investment in this scenario with an average requirement of £1.3bn from 2023/24 to 2029/30 to deliver substantial progress on enhancements and decarbonisation in order to support the shift away from private vehicles. Beyond 2029/30 the average funding requirement to support investment does fall to an average of £400m per annum.
Table 19: Rail and Tube account for Decarbonise by 2030 net cost of operations
1. Decarbonise by 2030 Rail, Tube & Elizabeth Lines
Hybrid demand + Policy consistent capital scenario Ave. per annum
Ave. per annum
(£m) 20/21 21/22 22/23 23/24 24/25 25/26 26/27 27/28 28/29 29/30 2023-
30 2030 -
40
Passenger Income 835 2,107 3,225 3,723 4,082 4,127 4,305 4,491 4,677 4,854 4,323 4,997
Other income 68 103 372 440 454 467 481 495 509 524 482 524
Operating Costs (2,878) (3,165) (3,461) (3,579) (3,725) (3,745) (3,771) (3,808) (3,858) (3,887) (3,768) (3,887)
Finance Costs (425) (441) (470) (492) (524) (441) (441) (441) (441) (441) (460) (441)
Indirect Operating cost (522) (407) (394) (367) (366) (366) (366) (366) (366) (366) (366) (366)
Net operating surplus before Renewals
(2,922) (1,803) (727) (275) (79) 43 208 372 521 684 211 827
Capital Renewals (254) (589) (542) (659) (690) (900) (797) (762) (799) (841) (778) (827)
BRR Capital Grant Allocation
- - 798 880 918 935 959 963 1,026 1,046 961 1,050
Capital Investment (505) (611) (659) (767) (858) (1,698) (1,752) (1,841) (1,771) (1,747) (1,491) (1,079)
BRR Capital Grant Allocation
- - 52 105 75 75 71 85 40 38 70 34
Net Deficit (3,681) (3,003) (1,078) (716) (633) (1,544) (1,312) (1,183) (982) (819) (1,027) 5
Debt repayment (172) (166) (333) (321) (310) (299) (229) (236)
Net Surplus (Deficit) after Debt repyt (3,681) (3,003) (1,078) (716) (805) (1,711) (1,645) (1,505) (1,292) (1,118) (1,256) (232)
Figures in the table are in nominal prices until 2024/25, and thereafter in 2024/25 constant.

67
TfL has investigated what the impact of a reduced level of capital in the long run would look like. The “Safety Minimum” scenario within the Long term Capital Plan contains the minimum level of investment in renewals to keep networks safe and operable, but not necessarily reliable, or pleasant to use from a customer experience perspective. Failing to invest in the appropriate capital for renewals will lead to a significant increase in operating expenditure, reductions in service levels and reliability driven by the need to implement additional maintenance and apply operational restrictions to maintain safety. In this scenario, it is possible parts of the network may have to be closed if safety cannot be guaranteed. For replacements, this includes life extensions to fleets for as long as possible, resulting in declining reliability and condition. While the committed rolling stock orders on the DLR and Piccadilly lines would be completed, other fleets would be delayed until at least the late 2030s.
Similarly, on signalling, renewals would be constrained to component renewal, except for the completion of Four Lines Modernisation. The opportunity to modernise further lines through digital signalling would not be realised.
Over the long run, this would be an average reduction in capital expenditure of £150m a year (compared to the mid-level LTCP) but comes with significant disbenefits and risks. Whole-life cost would not be managed effectively and would increase, with significant peaks and troughs of spend and a large backlog of works left for the future. The risk against assets (in particular fleet) would be higher.
This scenario would save a small amount of money upfront, but it would create very significant operational challenges and push necessary major investments into an unsustainable bow wave for future decades. The decline in asset condition in this scenario would see reliability reduce and likely require asset closures at times if safety risks increase too high. TfL would require more spending on day-to-day maintenance and would struggle to deliver modernisation savings, due to lack of investment in TfL’s technology, both of which would erode the capital investment savings in this scenario. The required asset modernisation underpins the ongoing delivery of operational efficiency which would otherwise be at risk.
Reduced scope of capital enhancements
The LTCP also sets out a ‘Safety Minimum’ scenario for enhancements. In the near term, this scenario is not radically different from TfL’s current plans due to lack of flexibility around projects already in delivery. However, once these committed projects end, the ‘Safety Minimum’ scenario contains no further enhancements.
This means no zero-carbon railway by 2030 and no further step-free schemes to improve accessibility on the network. Most importantly capacity would also not be increased. This means no substantial increase to train frequencies and also no capacity improvements at pinch points on the network such as Camden Town and Holborn stations. While demand is currently low, this does not render planned capacity schemes unnecessary. Even the worst-case demand predictions only see post-pandemic demand at 2012 levels on TfL’s rail services, and in 2012 crowding levels were considered to be severe.
Over the long run, this ‘Safety Minimum’ scenario would be an average reduction in capital enhancements of £300m a year (compared to the mid-level LTCP). Reductions here are possible, if not recommended, as even the mid-level scenario falls short of Rail’s potential of supporting the national priority of a green economic recovery.
Increase capital efficiency
TfL is already seeking to drive efficiency through its capital programme. The nature of TfL’s financial planning horizons mean that this efficiencies approach is weighted towards shorter term gains within the delivery phase. Chapter 6 covers this in more detail.
There is a significant opportunity to create a more efficient programme of whole life cost (WLC) analysis, evidence based work bank planning over multiple years, and a more established, appropriately resourced capital programme across the Rail and TfL portfolios. This would focus on optimising whole life costs of assets to drive savings through both capital and operating costs. Multi-year certainty would allow the stability in planning required to create this approach, as well as the confidence in the supply chain to help drive value.

68
This efficiency approach also requires significant improvements in data and asset information to make the right decisions at the right time. This includes building on existing data on current condition, forecast condition / degradation, whole-life cost modelling and predictive risk modelling.
Property and Land Commercial Development was set up in TfL in 2012 to transform the organisation’s approach to property.
TTLP was set up in 2014 to hold shares in ECPL, TfL’s first major property joint venture. TTPL subsequently became the corporate structure for all commercial property activity within TfL.
The consolidation of commercial property assets from across the TfL group was an important step in the creation of a ring-fenced, self-financed property company in TfL, with the first tranche of assets transferred in 2019. In November 2020, TfL agreed to fund TTLP with £2.1bn ordinary share capital to create the initial asset base and reflect the asset transfer transactions, with TTLP distributing in return earnings to TfL in the form of dividends.
TTLP’s existing investment programme, which totals £1bn over 10 years, was devised to require no call upon TfL’s group funding arrangements so that no net transport infrastructure funding would be diverted into property. The plan is cumulatively net neutral over 10 years by funding investment from both asset and land sales and development profits.
Under the current arrangements, a significant proportion of the funding in the existing plan comes from the disposal of selected non-operational property assets from across TfL’s portfolio. While property sales are a normal part of managing any commercial asset base, an overdependence can produce poor value for money and be financially unsustainable for the business in the longer term.
Even within this overall capital-neutral plan, there is a need for up-front pump-priming of capital. Prior to the pandemic, housing and property projects were already competing for funding with TfL’s transport-related activity. TfL is now unable to fully support TTLP, severely constraining TTLP’s ability to make the investment decisions needed to deliver both the new homes and the additional income projected in the current plan.
The existing properties in the TTLP portfolio were independently valued in March 2020 (pre pandemic) at £1.5bn with an operating income of £102m. There is a future opportunity to use this income stream and asset base to raise commercial funding for future investment. Access to commercial funding would allow investment at levels well in excess of that envisaged in the current plan.
Table 20 – Property and Land account for decarbonise by 2030 net cost of operations
1. Decarbonise by 2030 Commercial Development
Moderate Capital neutral plan plus Workplace optimisation & Property disposal Ave. per annum
Ave. per annum
(£m) 20/21 21/22 22/23 23/24 24/25 25/26 26/27 27/28 28/29 29/30 2023-30 2030-40
Passenger Income - - - - - - - - - - Other income 42 74 86 109 105 141 134 146 169 169 139 169 Operating Costs (39) (45) (46) (49) (50) (50) (51) (52) (53) (53) (51) (53) Indirect Operating
(13) (14) (14) (14) (14) (14) (14) (14) (14) (14) (14) (14)
Net Cost of
(10) 15 25 46 42 77 69 80 101 102 74 102 Capital Renewals - - - - - - - - - - - - New Capital
(64) (231) (307) (223) (259) (152) (73) (80) (40) (40) (124) (55)
Capital Receipts 105 291 281 384 154 99 64 65 17 76 123 - Net Capital
42 60 (25) 161 (105) (53) (9) (15) (24) 36 (1) (55)
Figures in the table are in nominal prices until 2024/25, and thereafter in 2024/25 constant.
TTLP’s capital-neutral investment plan is shown above, reflecting a plan to deliver against the Mayor’s 10,000-home strategic Transport initiative. As described in section 3.4.16, this does not represent TTLP’s preferred outcome, which would require additional commercial funding to unlock significant housing benefits

69
and carbon-neutral growth outcomes. This more ambitious plan would also deliver a more significant recurring income stream for reinvestment to TfL.
Table 20 shows income levels initially recovering from the pandemic over four years, with assumed rent decreases of 20 per cent impacting income in the early years. Thereafter total income increases as TTLP’s strategic plans for existing estate start to repay. Examples of this include Victoria Island (near Victoria Station) which currently has no rent income, however its arcade is being completely refurbished with shops being reopened which will reintroduce greater, long term income. In Whitechapel, there is an investment plan to repair and refurbish empty units, bringing them into use to increase rent per square foot from newly refurbished, attractive units. TTLP also plans to create new units through agreed and planned changes inside TfL’s stations, including Canary Wharf. Longer term, profits from development schemes as well as TTLP’s Build to Rent programme start to deliver recurring revenue streams. This results in £169m income at the end of 10 years.
The Capital programme reflects the expenditure plans mentioned above, with greater investment going into the Build to Rent programme, which has high upfront capital costs. The capital account also makes provision for a major upfront investment in offices to support achieving reduced occupational costs for TfL. Risks in the programme are mainly on development schemes, however development risk is diffused due to TTLP covering a large number of projects spread across a wide time frame. Commitments are also only entered after having considered risk and returns against TTLP’s set metrics.
The capital programme reflected in Table 20 is largely funded through disposals of future revenue producing assets. The main disposal receipts include Earls Court, Bank, Southwark and North Greenwich. However, all TTLP’s development schemes have land sale receipts up front to fund initial investment. This approach would not represent value for money. The capital-neutral funding restriction has been established as a consequence of lack of investment funding capacity within TfL. More optimum solutions would be possible with greater commercial funding opportunity.
TTLP’s unique position as a Property Company within TfL
All TTLP’s development sites have an operational interface, most often with London Underground. Development adjacent to the rail network is notoriously complex. TTLP’s most straightforward development sites are London Underground car parks, though even here current examples are requiring TTLP, alongside the housing, to provide new step free access (SFA) (Stanmore), new train crew accommodation (Cockfosters) and a new station entrance (Hounslow West).
More complex London Underground development sites include South Kensington, where the Royal Borough of Kensington and Chelsea is requesting that operational improvements to the station to be completed before the commercial development is finished. This required a complete resequencing of delivery of the complex programme between the London Underground and TTLP teams, facilitated by the fact that both teams operate within the same organisation and as such were able to effectively unpick these challenges.
At West Ham a new station entrance is required to unlock a Berkeley Homes development at TwelveTrees Park. In this instance the third-party legal agreements took three years to negotiate, and despite such robust agreements in place such a third-party agreement would have been unable to cope with the resequencing required at South Kensington.
TTLP’s most complex sites have hundreds of operational interfaces across many different parts of TfL. At Earls Court, every company seeking to acquire Capital & Counties’ stake in the 26-acre site wanted TTLP to stay as a joint venture partner because they saw TTLP’s continued involvement as critical to unlocking the opportunity. On sites such as Earls Court, TTLP offers, in particular, deep in-house engineering experience and the practical knowledge to manage TfL’s complex and sometimes conflicting operational requirements.
Experience shows that TTLP having an ongoing financial interest in a development provides a shared objective and encourages TfL operational managers and engineers to work proactively with the developer to resolve issues over the full duration of the scheme. Joint ventures also allow TfL to work through the complex trade-offs between financial return and operational benefits, such as was seen at Finchley Central where TTLP worked closely with London Underground to provide future stabling capacity as part of the development, accepting a reduced land receipt as a result.

70
Where appropriate, TTLP has adopted more straightforward delivery models, for example, utilising the GLA’s new London Development Panel (LDP2) and its Small Sites Small Builders portal. TTLP will continue to use these and similar panels, but across the large, complex development sites, it is difficult to envisage anything other than a TfL-led model. In every leading international example – including MTR in Hong Kong and JR-EAST in Japan – the transport authority owns the property subsidiary. By way of contrast, wherever outsourcing has resulted in a UK public entity setting up a structurally distant property vehicle, the new entity has failed to deliver the expected return.
Housing Growth Plan
Initial forecasts for a new ‘Housing Growth Plan’ indicate the potential for a net investment of £2.5bn over a 25-year period. This investment would create a substantial future endowment for TfL while delivering vital social, environmental and economic benefits. It would also produce a diversified asset base with property and land across a range of sectors including residential for rent and for sale, retail, and commercial (including office, light industrial and logistics).
This plan is deliberately flexible with the ability to adapt to changing market conditions by adjusting the proposed use of sites and / or changing the delivery mechanism (from outright land disposal to joint venture or direct development) or by adjusting the shareholding within individual joint ventures.
The quantum of activity envisaged by the Housing Growth Plan could have a far-reaching impact on the property industry by addressing a number of acknowledged market failures. TTLP already has a successful relationship with the Department for Education, and by March 2021 will have provided over 2,000 people with training in construction skills with hundreds of the trainees already in new employment. A 25-year pipeline of site developments could also provide a major, long term enhancement of construction skills with a focus on Modern Methods of Construction to accelerate pace and sustainability of delivery.
The potential growth in gross operating income and total asset value is as a result of the Housing Growth Plan is shown in Figure 13 below:
Figure 13: Operating Income and Asset Value Growth in the Housing Growth Plan
Most of the 50,000 homes would be built through joint venture partnerships with developers, although other models would be considered in order to optimise pace and sustainable quality as well as financial return. The mix of for-rent and for-sale homes would remain flexible to reflect market appetite, relative pricing, risk and financial return.
Figure 14 shows when each of the residential projects in the plan are currently assumed to start, though in practice there will be a smoother profile of homes delivery as the projects flex to reflect funding, resource and market need.

71
Figure 14: Profile of delivery of homes in Housing Growth Plan
The phasing of this cost is dependent upon the timing of the projects. Indicatively, the phasing of cost and cumulative net cost is shown in Figure 15 below, requiring £450m in the first five years, £790m by year 10 and £2.5bn by year 25.
Figure 15: Net and Cumulative Net Capital Cost of Housing Growth Plan
Property development is capital-intensive but can provide long term, stable income to improve TfL’s financial sustainability. Delivering the Housing Growth Plan will benefit TfL and, through putting workers in affordable homes near jobs, ultimately benefit the whole of the UK economically.
This plan is based on creation and patient exploitation of surplus land. The initial obstacle to delivering the plan’s benefits is access to capital for the investment. The options set out in Section 5 require no legislative change and minimal approval from external stakeholders.
Similar arrangements have been implemented in the past, including Isis Waterside Regeneration, a partnership between British Waterways, Amec and Igloo Regeneration Fund that launched in 2002, and Solum, a partnership between Network Rail and Kier Property, that launched in 2008. The scale here is considerably greater, with a more experienced development function already established within TTLP and a larger development pipeline identified at the outset. As in all such ventures, the relationship between the commercial property function and the operational business (including a retained ‘intelligent client’ capability) will be critical to driving long term value.

72
With independent access to capital funding, TTLP would be able to deliver much-needed housing and improve TfL’s financial position, delivering recurring subsidy for reinvestment in TfL’s services. TTLP and TfL, while operating at arms-length, would be strongly aligned through mutual benefit.
While it may take up to 36 months to put a new commercial funding structure in place, much earlier TTLP could be established as a ring-fenced entity, with its own governance arrangements, business plan and emerging working relationship with TfL via a retained intelligent client team and operating agreement.
Subject to understanding the appetite and constraints for Government in working in partnership with TTLP, TfL propose to develop and refine the capital structure options. This will include taking legal and financial advice, producing full value for money analyses, market-testing options, and reviewing the technical feasibility and accounting impacts.

73
4. Becoming an economic and efficient operator and the public service obligation
Chapter Summary
Greater financial sustainability and stability of funding could be generated by adopting some of the principles used in the structural frameworks for public utilities and infrastructure organisations – within the context of local democratic accountability and the devolved framework in which TfL operates successfully.
TfL’s current funding model has changed from support through long term grant funding from Central Government to an overreliance on fare revenues and insufficient fiscal levers. This change in funding model means that TfL no longer has sufficient funding sources to support (i) operations, (ii) the planning and delivery of the continuous investment required to maintain and renew its network or (iii) cope with significant demand changes.
TfL is classed as a Local Authority for finance purposes. Local Authority annual planning and funding cycles are not consistent with long term service planning and infrastructure management and do not optimise value for money. The legal framework in which TfL operates has no definition for a statutory minimum service, and the pandemic highlighted how the absence of a statutory public service obligation could put at risk the provision and upkeep of public transport services in London.
However, TfL’s current devolved status, and the model of an integrated city and transport planning and delivery authority, do work and facilitate TfL’s critical contribution to the UK. The Independent Review also concluded that TfL should remain as an integrated authority under the Mayor and did not recommend radical change to this model.
The introduction of structural changes, within the existing successful devolved framework, could provide a more stable and transparent framework for the provision of additional funding. These changes could reflect arrangements for other critical national infrastructure assets, such as “control periods”; a focus on investing in asset condition in an economic and efficient way; and enhanced independent assurance of TfL’s efficiency. This would enable greater efficiency and ability to borrow more once financial sustainability is achieved. Agreement between the Mayor and Government on a revised public service obligation is critical to ensure continuity of transport services.
It will be vital to ensure that the Mayor retains control and discretion to fulfil statutory duties, within a framework that gives Government comfort to be able to adequately fund public transport objectives and outcomes and enables TfL to fulfil its obligations to ensure safe, efficient public transport.
TfL recommends that structural reform options, within the existing successful devolved framework are given further consideration over the coming months.
74
Introduction Paragraph 9f of the Settlement Letter dated 31 October 2020 sets out a requirement for the Financial
Sustainability Plan to include:
Consideration of and options for Governance/regulatory frameworks that may enable better stability and sustainability of funding in the medium to long term
This section of the document addresses this requirement and outlines TfL’s views and recommendations.
The current TfL funding model and the need for change TfL was established in 2000 (under the Greater London Authority Act 1999) as one of four functional bodies
of the GLA (comprising the Mayor of London and the London Assembly), to implement the MTS and to provide safe, reliable, integrated transport services in London. Prior to TfL’s establishment, transport services in London were provided by separate public entities and had suffered from historical underinvestment. The success and benefits of the integrated model for transport in London – with TfL as spatial and transport planner, system integrator, network manager, regulator, operator and capital delivery body – is generally accepted and is deemed vital to the success of the city. It is therefore critical that any reform of TfL’s structure preserves TfL’s integrated status.
TfL’s current structural framework and capital structure are a hybrid between a Local Authority and Statutory Corporation:
• TfL is treated as a Local Authority for capital finance purposes. The ONS classifies TfL as part of the “General Government” sector in the National Accounts. The most significant of TfL’s trading subsidiaries, including London Underground, are classified under the “Public Corporation” sector of the National Accounts. Both General Government and Public Corporation borrowing are currently included in Public Sector Net Debt and as such are targeted under the UK’s fiscal framework, resulting in TfL’s borrowing being capped by Government;
• Periodic Spending Reviews involve agreeing the level of TfL’s borrowing on an annual basis with Government (and some specific grants), however there is no legal commitment on the part of the Government to provide any agreed funding or to guarantee TfL’s borrowing. The requirement to borrow in year is subject to a ‘use it or lose it’ arrangement (so cannot be rolled forward to future years). Indeed, until it was phased out, TfL grant funding changed annually, and the long term settlement negotiated in 2008 was subsequently shortened in 2010.
While this hybrid structure was expedient in providing TfL with the powers to discharge its functions, including the power to borrow for investment (introduced in 2004), it is a suboptimal structure for one of the world’s largest integrated public transport agencies. London’s future economic recovery and growth is, to a great extent, dependent on continued investment in transport infrastructure and the provision of a functioning transport network.
This continued investment is unsustainable in the current structure. TfL is over-geared from a debt perspective with insufficient revenues to support the provision of services, the repayment of its existing debt and the continued investment needed in the future.
Funding and a revised framework are required to deliver financial sustainability
The current devolution and funding arrangements do not enable TfL to maximise the benefits that devolution is capable of generating.
Reformed governance arrangements and controls may be required by Government to facilitate the provision of additional capital grant funding arrangements in order to provide Government with further comfort around efficiency, value for money and expenditure prioritisation.
These arrangements must continue to respect the devolved status of transport in London and need to focus on long term growth, efficiency and vision, instead of the short term cycles of funding that result from the status quo, which leads to insufficient and inefficient investment, culminating in lower productivity and lower economic growth for all parties.
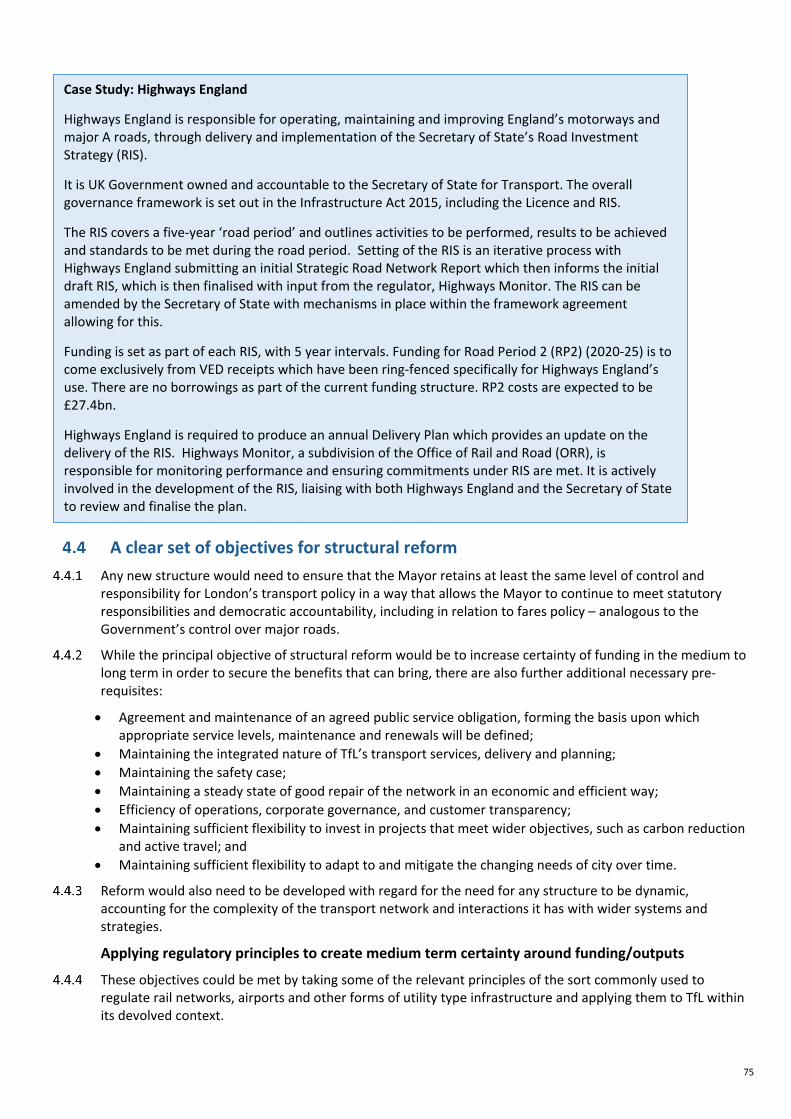
75
A clear set of objectives for structural reform Any new structure would need to ensure that the Mayor retains at least the same level of control and
responsibility for London’s transport policy in a way that allows the Mayor to continue to meet statutory responsibilities and democratic accountability, including in relation to fares policy – analogous to the Government’s control over major roads.
While the principal objective of structural reform would be to increase certainty of funding in the medium to long term in order to secure the benefits that can bring, there are also further additional necessary pre-requisites:
• Agreement and maintenance of an agreed public service obligation, forming the basis upon which appropriate service levels, maintenance and renewals will be defined;
• Maintaining the integrated nature of TfL’s transport services, delivery and planning; • Maintaining the safety case; • Maintaining a steady state of good repair of the network in an economic and efficient way; • Efficiency of operations, corporate governance, and customer transparency; • Maintaining sufficient flexibility to invest in projects that meet wider objectives, such as carbon reduction
and active travel; and • Maintaining sufficient flexibility to adapt to and mitigate the changing needs of city over time.
Reform would also need to be developed with regard for the need for any structure to be dynamic, accounting for the complexity of the transport network and interactions it has with wider systems and strategies.
Applying regulatory principles to create medium term certainty around funding/outputs
These objectives could be met by taking some of the relevant principles of the sort commonly used to regulate rail networks, airports and other forms of utility type infrastructure and applying them to TfL within its devolved context.
Case Study: Highways England
Highways England is responsible for operating, maintaining and improving England’s motorways and major A roads, through delivery and implementation of the Secretary of State’s Road Investment Strategy (RIS).
It is UK Government owned and accountable to the Secretary of State for Transport. The overall governance framework is set out in the Infrastructure Act 2015, including the Licence and RIS.
The RIS covers a five-year ‘road period’ and outlines activities to be performed, results to be achieved and standards to be met during the road period. Setting of the RIS is an iterative process with Highways England submitting an initial Strategic Road Network Report which then informs the initial draft RIS, which is then finalised with input from the regulator, Highways Monitor. The RIS can be amended by the Secretary of State with mechanisms in place within the framework agreement allowing for this.
Funding is set as part of each RIS, with 5 year intervals. Funding for Road Period 2 (RP2) (2020-25) is to come exclusively from VED receipts which have been ring-fenced specifically for Highways England’s use. There are no borrowings as part of the current funding structure. RP2 costs are expected to be £27.4bn.
Highways England is required to produce an annual Delivery Plan which provides an update on the delivery of the RIS. Highways Monitor, a subdivision of the Office of Rail and Road (ORR), is responsible for monitoring performance and ensuring commitments under RIS are met. It is actively involved in the development of the RIS, liaising with both Highways England and the Secretary of State to review and finalise the plan.

76
In common with other regulated sectors, TfL’s capital plans could be made subject to fixed periods (Control Periods) of a prescribed length, perhaps to match the length of a Mayoral cycle in return for government capital funding. This new framework could cover, inter alia, high level outcomes and funding for core asset renewal and maintenance work across all modes for a Control Period in accordance with core principles of value for money, efficiency, whole life approach to asset management and other agreed universal public transport objectives and requirements, against which TfL would need to produce and deliver against a detailed plan of how those outcomes would be met within available funding. The focus should be on high level outcomes and not short term outputs being managed by the TfL Board and scrutinised by the London Assembly.
Further Assurance
TfL’s performance and delivery are already scrutinised through its Boards and Committees and engagement with the Independent Investment Programme Advisory Group and political representatives, including the London Assembly. TfL is committed to transparency and regularly publishes financial and operating performance reports, along with decision papers. However, there could be benefits to an enhanced assurance role undertaken independently of TfL, the Mayor and Government to help to build trust and further transparency and accountability.
An enhanced independent assurance function, building on the remit of IIPAG, could support certain key activities in a reformed structure including:
• providing input on efficiency targets, industry insight and cost benchmarking; • reviewing TfL’s control period plans to assess whether they are deliverable within the proposed financial
resources, sufficiently challenging in relation to efficiencies, and prioritised appropriately in relation to maintenance and renewal of the existing network, providing reports on this.
Creating enhanced statutory public service obligations There is currently no statutory minimum public service obligation that sets out the services or activities TfL
must provide across the majority of its network. TfL is also obliged under the GLA Act to implement the MTS and deliver safe, integrated, efficient and economic transport facilities to, from and within Greater London. When setting any budget, TfL must consider the minimum services to be provided to meet these requirements.
The financial crisis caused by the pandemic and the requirements of local government finance rules, particularly in a Section 114 scenario, demonstrates that the continued provision of public transport services in London is not currently adequately protected in statute. Through the pandemic, TfL was required by Government to keep operating Underground, Rail and bus services at close to pre-pandemic levels, and emergency funding was secured to continue doing so – reflecting the fact that, in current circumstances, the Mayor has insufficient devolved levers.
Creating enhanced and clear statutory public service obligations through primary legislation, within which TfL would be required to operate, could enable better recognition of the criticality of TfL’s network and ensure continuity of the services it provides and associated certainty for the maintenance of that network in a good state of repair. It would also form the basis for funding requirements and arrangements in the future (particularly in extreme circumstances). Any statutory changes could also consider formalising the “control period” approach to planning and funding and would require agreement between the Mayor and Government. It is statutory underpinning of this kind in existing regulatory regimes that helps to provide medium to long term certainty. TfL’s ability to become an economic and efficient operator, provide value for money and apply whole life approaches to asset management and investment, would benefit from a similar legal foundation.
Recommendation 1 TfL recommends that, over the coming months, TfL and the Mayor will work to define appropriate statutory public service obligations to ensure the continuity of public transport provision in London, and discuss these potential obligations with Government.

77
Lack of certainty constrains TfL’s ability to optimise efficient service and investment delivery
TfL’s spending plans are currently subject to annual budgets and agreement of annual caps on borrowing with HMT. TfL has not had a long term funding settlement for over a decade and therefore does not have certainty of its future funding.
This is inconsistent with the commitments TfL needs to make to projects that take many years to design and build and an asset portfolio that, in order to be efficient, requires a whole life approach to maintenance and investment for assets with an average life of 30 years. Without a clear picture of future resources, TfL cannot plan for the future of the network, and the benefits it brings nationally, in an optimal way.
This short term approach and lack of certainty undermines the ability of supply chain to invest, limiting job creation, skills development and ability to command more efficient prices for work. This is both for TfL and other transport operators in the UK and beyond, who can benefit from supplier efficiencies enabled by large-scale TfL orders.
The implications of this lack of certainty will compound over time. Delays to renewals and inability to plan on an efficient whole life basis means impacts such as closures, reliability and punctuality issues, longer journey times. All of these factors impact TfL’s customers and have a negative effect on the economy and growth.
The costs of fixing the network rise exponentially if renewals are not carried out in a timely manner. This is a false economy and represents poor value for money. This is a false economy and represents poor value for money. London has been here before, with investment falling significantly in the 1990s. Between 1990/91 and 1998/99, passenger subsidy was removed, the renewals grant dropped 48 per cent and the enhancements grant dropped by 74 per cent. Increasing renewals debt would have to be corrected at great expense at later date.
Finally, TfL is also over-geared from a debt perspective, and the local government finance rules currently mean it is unable to borrow further.
The case for structural change is well understood by Government
In developing "Action for Roads”, the DfT developed a compelling case for fundamental change to the Highways Agency and its relationship with Government to resolve the precise challenges TfL now faces. Reform in this area has created a long term, sustainable solution for national and local roads programmes under the Highways Agency’s purview.
However, the model applied to the Highways Agency, or in fact other bodies benefitting from long term certainty through regulatory structures such as Network Rail, is not directly applicable to TfL given its devolved status.
For example, a straight application of the Railways Act to TfL would require a separation of TfL into infrastructure and operations and would segregate rail from road and other modes of transport. This would result in a loss of TfL’s ability to integrate services and create multi-modal solutions to transport issues and would fundamentally change the way in which those services would need to be offered, particularly on the Tube. The model applied to Highways England is designed specifically for Central Government funding on a long term basis and would not work with TfL’s devolved structure, nor does it recognise the variability of fares income that TfL faces across the economic cycle.
Regulated Asset Based (RAB) structures, of the type applied by Network Rail, are generally suited to intensive long term asset-based businesses and would be too formulaic to recognise the different business and financial fundamentals of our different modes and the inherent interaction between asset investment and service provision.
Benefits of the potential new Funding Structural Framework
This type of structure may facilitate further devolved powers and greater certainty of funding, while recognising that to achieve that there will be a need to demonstrate TfL is acting in an economic and efficient way. This structure would be in exchange for grant funding / greater fiscal devolution. This approach would:
• Enhance and respect the devolved framework and statutory obligations of the Mayor; • Provide a transparent approach and prioritisation framework for agreeing Control Period plans;

78
• Provide certainty of funding sources and uses over a defined period enabling the greater efficiency, innovation, long term capability and stability in decision making;
• Deliver a well-maintained transport network that is essential for successful national transport system as a whole (given links to local and national road, and the national rail network) and the economic recovery;
• Deliver evidence of value of money for all parties through enhanced independent assurance arrangements, ensuring confidence in that TfL is acting as an ‘economic and efficient’ operator and on what an efficient and sustainable level of funding requirement is to deliver agreed objectives;
• Assist in determining the required level of funding for TfL to become economic and efficient and achieve financial sustainability;
• Provide potential to increase debt capacity if sufficient certainty of funding is provided to enable TfL to reach financial sustainability within a new structural framework; and
• Provide the ability to reduce costs and promote job creation and skills development through the ability to provide better certainty of plans and investment to the supply chain.
Conclusion The introduction of ‘control periods’ with enhanced independent assurance of TfL’s efficiency and other
matters provides a more stable planning and funding environment, which would enable greater efficiency and ability to borrow more once financial sustainability is achieved.
This will ensure that the Mayor retains at least the same democratic control as now and discretion to fulfil statutory duties, within a framework that gives Government sufficient comfort to provide sufficient funding to be able to adequately fund shared transport objectives and outcomes and enable TfL to fulfil its obligations to ensure safe, efficient public transport and achievement of national objectives.
Recommendation 2 TfL recommends that TfL and the Mayor work with Government over the coming months to explore the potential and options for enhancements to TfL’s structural funding framework including multi-year “control periods”, in order to enable TfL to act as an economic and efficient operator and provide a framework for the organisation acceptable to all parties that will facilitate sufficient certainty of funding to enable TfL to reach financial sustainability.

79
5. Achieving Financial Sustainability
This Chapter provides an overview of the actions TfL propose to take forward, alongside structural reform outlined in the previous Chapter, in order support the organisation to achieve a financially sustainable position in the future.
Chapter Summary
Service levels Introduction
In response to DfT’s Settlement Letter, TfL has considered further efficiencies and revenue opportunities available to reach financial sustainability.
1. Service levels: TfL already has plans for incremental service level changes to respond to short term demand. As part of this Financial Sustainability Plan, TfL also propose a four per cent reduction in the kilometres operated on the bus network to respond to expected future demand. Due to the nature of TfL’s services, significant service level reductions will take time to implement and be costly-to-reverse. TfL believe that the decisions on optimal service levels should be made once there is greater evidence regarding post-pandemic travel patterns. As such, TfL would also welcome a dialogue with Government on how different scenarios may support an economic recovery and how best to progress changes to future service levels.
2. Operating efficiencies: TfL will continue to look for further opportunities for efficiencies. However, the current portfolio holds considerable risk, and this suggests that these further opportunities will in the first instance be used to ensure delivery of the currently planned efficiencies. TfL will continue to keep TfL’s organisation size under review, taking into account emerging evidence on future demand, service levels, service quality and capital plans.
3. Pay, benefits and pensions: TfL recommends that any review of the Reward package is considered holistically, and the scope of any review includes all elements of the base pay, pensions and benefits offering.
4. Capital prioritisation and efficiencies: TfL propose to use the agreed updated prioritisation criteria to assess medium term capital plans. TfL will also put in place further measures to improve capital efficiency tracking and improvement processes over the coming months. TfL also proposes to further discuss with Government the funding of renewals spending and infrastructure investment as part of the upcoming funding negotiations.
5. Commercial Development: TfL propose to develop and refine the capital structure options to raise commercial funding for future investment in its Commercial Development business, thereby generating significant future value and delivering up to 50,000 new homes.
6. Existing funding levers: TfL will take forward monitoring and evaluation of the temporary changes to the Congestion Charge. TfL will also continue to prioritise the successful implementation of the expanded ULEZ in October 2021. As instructed by the Mayor, TfL will undertake a feasibility study of a charge for driving into London to address the traffic entering the Capital every day from vehicles registered outside London.
7. Other potential funding sources: TfL proposes that TfL’s funding arrangements are reviewed to ensure suitable diversity and stability of funding, alongside the consideration of a reformed governance and funding model (set out in Chapter 4).
8. Debt, Liquidity and Reserves: TfL proposes to begin to re-build essential cash reserves to near pre-pandemic levels and pay down debt in order to ensure we have the financial resilience that corresponds to TfL’s size and risk profile.

80
Paragraph 9c, the Settlement Letter dated 31 October 2020 sets out a requirement for the Financial Sustainability Plan to include:
An assessment of the impact of demand on sustainability, including modelling of medium term service level requirements against possible demand scenarios post removal of COVID travel restrictions (such as social distancing).
This section of the document examines the scope to adjust medium term service level requirements against the future demand scenarios outlined in Chapter 2. Table 21 outlines these scenarios.
Table 21: Forecast of demand changes for rail and bus in 2031
% Change Change compared to 2016 actual Change compared to 2031 BAU 2031 Scenario Rail (%) Bus (%) Rail (%) Bus (%) Business as usual 23 8 0 0 Hybrid 1 -6 -18 -13London declines -23 -22 -38 -27Low carbon localism 4 19 -16 10 Remote revolution -10 -13 -27 -20Agglomeration x3 55 43 26 32
Considerations regarding the implementation of service level reductions
In the longer run, as travel patterns and demand settle into a new post-pandemic trajectory, different service levels – and therefore investment and operational set-up needed to support them – may be needed. Whatever the longer term position, there are some considerations and practicalities to recognise in service level planning (as detailed below).
Timescales for achieving cost savings from service level reductions
TfL’s view is that reducing services levels significantly will not realise large savings quickly because:
• The high fixed costs of directly operated rail mean that marginal benefits of running high services levels are large, and quick-to-realise savings through service reductions are small; and
• TfL’s bus contracts are long, with mid-contract changes being uneconomical if they are a net reduction.
Figure 16: London Underground and bus proportion of variable costs over different time horizons
Reductions in service levels offer an opportunity to reduce costs. However, for an in-house operation such as LU, only reductions in variable costs are realistically achievable over a shorter timeframe. At 28 per cent, the Underground’s variable costs – those that are linked to service volume (power, staff and some maintenance) – are a relatively low proportion of overall costs.

81
The London Underground achieves relatively high revenues per journey (compared to international benchmarks) and the low proportion of variable cost therefore makes it worthwhile to maximise the use of assets: a redundant train still bears fixed costs, and higher train frequencies attract marginal additional customer income.
Railways have high sunk costs and low marginal costs – they are expensive to buy, but relatively cheap to run, so maximising service is an economically rational approach. The corollary is that it is only economically rational to eliminate that fixed cost over longer time horizons, generally five years or more. And once disposed of, they once more cost a lot to buy and have long lead times – especially for the bespoke designs required for the Tube gauge.
At 62 per cent, and low in absolute terms compared to some other modes, buses have a much higher proportion of variable costs. Buses, being contracted out and for other reasons, are easier to treat flexibly and potentially make quicker service adjustments for. The contracts themselves are efficient, but net reduction mid-contract changes or cancellations are less cost effective /inefficient as there are residual cost commitments (such as bus leases and overhead) that cannot easily be saved in the short term.
Waiting for contracts to lapse to bring about service changes in replacement specification takes longer as most contracts are 5 to 7 years in length to make the business model tenable for the suppliers. Moving resource from inner to outer London is more efficient than simple reductions, as resources can be more effectively redeployed.
Flexibility to respond to market changes
Service changes need to reflect market changes – both those arising as part of longer term COVID-19 behaviour change and those driven by other causes.
Any emerging car-based recovery could be mitigated by making public transport a more attractive alternative. Emerging patterns suggest that, longer term, London may see less peak commuting (or more spread peaks), a higher proportion of leisure and discretionary trips and more trips in outer London and its town centres. The increasing relative importance of discretionary travel will improve the case for off-peak service enhancements, creating an opportunity to “sweat our assets” more.
RUC, considered in Section 5.8 below, will also heavily influence service level considerations, particularly in relation to bus service levels in central and inner London. Assumptions need to be linked across the Financial Sustainability Plan.
Short term savings versus long term investments
Greater short term savings can be achieved by closing lines on a semi-permanent basis and/or retiring old fleet quickly. In the case of the Underground this means writing off the asset and potentially also avoiding associated stabling, depot space, power supply capacity costs. However, should demand return, replacing withdrawn assets would be slow and expensive.
This impacts upcoming investment decisions, where short term decisions have irreversible long term service impacts. For example, assuming signal renewal goes ahead, train frequency for the Piccadilly line is a function of the fleet size ordered. Future-proofed higher train frequencies (for example, 33 tph instead of 27 tph) can be secured in the next 3 years by increasing the number of trains ordered. Additional trains ordered alongside the replacement fleet have a materially lower unit costs than a future stand-alone order. The replacement of the fleet and other assets on the Bakerloo line would be a further decision point.

82
Connectivity, network effects and equality
Equity and connectivity are of key importance in setting routes and service levels. DfT research regarding ‘Inclusive Mobility’31 has shown the benefits of bus networks reachable by five minutes’ walk of homes, which can only realistically be served by a large network of frequency routes whose primary purpose is to provide connectivity to community services, wider transport options, leisure facilities and retail, particularly for lower income groups. These routes, though important for equality and connectivity, often have lower cost recovery.
TfL’s recommendations regarding service levels
The scenarios set out above show that there are currently a wide range of plausible outcomes in terms of future demand. For example, should future demand increase above BAU (as for example, Agglomeration x 3 suggests) then current capacity and service levels will not be able to meet that demand.
Given the length of time required to reduce services, while locations and timings of services may need reshaping to the new reality, it is TfL’s view that there is not yet sufficient evidence to support costly-to-reverse large-scale reductions in levels of service.
In the short term, this is especially the case due to the need at the current time to encourage more public transport use as part of the non-car led COVID recovery, supporting a decarbonised economy and managing road congestion to support productivity.
If cuts are made now public transport will be seen as a less attractive option and this could push people towards cars. This could be difficult to recover and so the perception must be that in the short and medium term public transport is unfaltering – safe, clean, orderly and reliable.
Recommendation 3 Given the range of plausible scenarios for post-pandemic demand, high proportion of fixed costs in rail, and long term nature of bus contracting (mostly 7 years in length), TfL’s view is that in the short term significant service level reductions should be avoided. Instead a core principle of TfL’s service planning should be to serve the demand levels that are common / independent of / resilient to differences in future demand scenarios.
To this end, TfL has already included a number of service level adjustments and reductions in the current base line forecasts (see below).
In addition to these, TfL also now proposes an additional four per cent reduction in the kilometres operated by the bus network by 2024/25. This is believed to have only minimal disbenefits under the Hybrid demand scenario.
In the longer run, as travel patterns and demand settle into a new post-pandemic trajectory, different service levels – and therefore investment and operational set-up needed to support them – may be needed. Should future demand reduce as a result of structural changes related to the pandemic (for example, ‘London declines’ scenario shows 26 per cent rail and 19 per cent bus demand reductions by 2025, compared with pre-COVID) then further reductions in service levels could be justified. In this case, a further £8m per annum of savings, net of lost revenue, could be achieved.
Consideration should be given to over-crowding not being acceptable to the travelling public in a post pandemic world, and therefore capacity will still be a critical component to encouraging passengers to travel.
It should also be noted that even in a realistic worst-case demand scenario, the low variable costs and demand elasticities mean the associated net cost saving would take several years to deliver as well as risking forgoing the benefits of growth.
31 https://assets.publishing.service.gov.uk/government/uploads/system/uploads/attachment_data/file/3695/inclusive-mobility.pdf
83
Recommendation 4 TfL should continue to work closely with Government to monitor demand patterns. Over the longer term, service reductions or re-shaping may need to be considered as post-pandemic travel patterns emerge, particularly under the ‘London declines’ demand scenario. However, consideration should be given to the fact that over-crowding is likely to be less acceptable for the travelling public in a post-pandemic world. TfL therefore recommends that that the value for money of future service level reductions is kept under review, so that this can be considered as new evidence around future demand emerges.
Operating efficiencies Introduction
Paragraph 9a of the Settlement Letter dated 31 October 2020 sets out a requirement for the Financial Sustainability Plan to include:
An assessment of further operating efficiencies beyond the H2 Funding Period, including opportunities to accelerate and improve on the savings included in TfL’s 2019 Business Plan of £722m by 2024, inclusive of savings delivered in 2019/2020 and planned in 2020/2021. This assessment will include a deliverability analysis of the current estimate and also include an analysis of the optimum size for TfL to undertake its activities.
TfL’s current plans to achieve operating efficiencies
As outlined in Chapter 2, 2021/22 will be the sixth year of TfL’s wide-ranging cost reduction programme, which will see over £1bn in gross recurring savings achieved by the end of 2021/22 compared with 2015/16 (before inflation and other cost pressures).
The 2019 Business Plan included £722m of annualised savings to be delivered by 2024/25, building incrementally year on year compared to 2018/19.
TfL closed 2019/20 having made £216m of total savings, £9m higher than the original 2019 Business Plan target.
TfL’s existing plans for changes to service levels London Underground service changes that are aligned with the resilient demand identified by the scenarios are: • Keeping the Night Tube, Night Overground and Waterloo and City line re-opening dates under review
depending on the continuing impact of the pandemic on demand. • Implementing a modest package of off-peak service reductions on certain Tube lines, post the COVID-19
vaccines. TfL will maintain current service levels to support social distancing until the COVID-19 vaccines are widely available. TfL estimates that these changes will result in an annual saving of £5.6m per annum.
It should be noted that these changes are already assumed within TfL’s submission to the Mayor’s Budget but are new since the Revised Budget previously submitted to the Department. This means there is no additional savings to be realised from these proposals.
A similarly aligned set of bus service changes are those that can be made with minimal cost and which can be reinstated relatively quickly if higher demand materialises in the near term – either from the economy, behaviour or road charging: • Central London bus frequency reductions and some route restructuring over 2021 and 2022. There are
around 25 such routes where frequency reductions would be worthwhile from an average of about 8 buses per hour to 6;
• A limited increase of bus services in Outer London town centres as part of a wider review to increase cost recovery in outer London low frequency routes. One such example is the Richmond, Twickenham and Whitton bus route changes made on 12 December 2020, and we are currently consulting on a set of route changes in the Boroughs of Croydon and Sutton.

84
It has subsequently updated its forecasts as per of the 2021/22 GLA Budget, with the latest view being that TfL will achieve a total of £730m of recurring savings through to 2024/25.
Table 22: Operating efficiencies identified in the 2021/22 GLA Budget
Key workstreams (£m)
2019/20 actual
2020/21
forecast
2021/22
forecast
2022/23 forecast
2023/24 forecast
2024/25
forecast
Total
London Underground 135 184 74 113 52 75 633
Surface Transport 49 79 24 20 7 6 185 Professional Services 20 56 - 7 - - 83
Estates and Commercial
12 6 2 4 24 2 50
Total planned savings 216 325 100 144 83 83 951
Of which: Total Recurring savings
186 150 84 144 83 83 730
One off 30 56 16 - - - 102 One off - coronavirus - 119 - - - - 119
Total planned savings 216 325 100 144 83 83 951
Figures in the table are in nominal prices.
In addition to recurring savings, TfL has also made a total of £221m of additional one-off savings in the years 2019/20 to 2021/22, which were not included in the 2019 Business Plan. These relate to such items as deferrals of maintenance activity, lower London Underground traction costs (from running fewer services at the height of the pandemic) and lower bus operating costs (again as a result of reduced service levels).

85
TfL’s assessment of the deliverability of currently planned efficiencies
Table 23 summarises TfL’s views of the deliverability of the currently planned efficiencies.
Table 23: Deliverability of operating efficiencies
Key workstreams (£m) 21/22 forecast
22/23 forecast
23/24 forecast
24/25 forecast
Total RAG
Operations - 68 13 0 81 Red Maintenance 57 1 24 0 82 Red Other - 22 5 75 102 Red Operations - 4 5 - 9 Amber Maintenance - 13 5 - 18 Amber Maintenance 1 5 - - 6 Green Total London Underground 57 113 52 75 298
Bus savings 17 19 6 6 48 Amber Other 7 1 1 - 9 Green Total Surface Transport 24 20 7 6 57
Procurement Op model - 4 - - 4 Amber De-prioritising non-critical spend; recruitment freeze
- 3 - - 3 Green
Total Professional Services - 7 - - 7
Property operations - ops costs 2 - 2 2 6 Green Accommodation Hub strategy (income from subletting/ reduced operating expenditure)
- 4 22 - 26 Amber
Total Estates and Commercial 2 4 24 2 32
Total TfL planned recurring savings 84 144 83 83 394
In summary, of the still to-be-delivered £394m in efficiencies:
• £265m are considered to have increased levels of risk and are labelled Red. This is where workstreams have no or immature plans identified to deliver savings targets.
• £105m have a medium level of risk associated to them and are labelled Amber. This is where workstreams have some plans in place and the detail is being worked through to ensure delivery.
• £24m are considered to have low levels of risk and are therefore labelled Green. These workstream are supported by detailed plans that have been approved.
The current estimated risk to this total is £265m between 2021/22 to 2024/25, amounting to circa 65 per cent of the balance to deliver over this period (and 36 per cent of the full programme).
This compares to KPMG’s estimate of ‘good delivery’ set out in their review commissioned by Government into TfL’s finances (which TfL only saw a partial and redacted version of) being 70 per cent of the initial target in similar transformation exercises. In practice, the level of risk within TfL is likely to be significantly higher than comparable programmes elsewhere.
TfL’s views of opportunities to accelerate and increase identified efficiencies
It is TfL’s view that the savings programme set out above has considerable risks. For example, the current saving programme contains options associated with workforce modernisation and productivity improvements in operational areas. These bring with them challenges associated with a complex Industrial Relations

86
environment. The need to keep the services functioning during change, also adds to the complexity of delivering the savings associated with these proposals.
These risks were noted in both the KPMG review of TfL’s finances commissioned by the DfT (which TfL only saw a partial and redacted version of), and in the Independent Review commissioned by the Mayor of London.
TfL is committed to look for further opportunities for efficiencies in order to achieve the existing savings target and will seek to discuss these with the Mayor and Government once these have been developed in more detail.
However, TfL believes that good portfolio management suggests it is vital to prioritise mitigating the existing risk to currently planned efficiencies rather than adding new targets on top of existing planned savings with high levels of risk at this point in time. Indeed, given the risk to savings programme, this will be a necessity if TfL is to hit the currently planned target.
Recommendation 5 TfL will continue to look for further opportunities for efficiencies. However, the current portfolio holds considerable risk, and this suggests that these further opportunities will, in the first instance, be used to ensure delivery of the currently planned efficiency targets. This will ensure TfL can be accountable for the delivery of the £730m over the period 2019/20-2024/25, which will see TfL £400m smaller in recurring operating costs (before the impacts of inflation and growth) by 2024/25 than it is today.
TfL’s views regarding the optimum sizing of TfL to undertake its activities
In addition to considering the scope for further operating efficiencies, in line with the requirements of the Settlement Letter, TfL have also undertaken an analysis of the optimum sizing of the organisation in light of TfL’s expected future activities.
Baseline size
Since 2016 TfL has reviewed almost 12,000 roles, leading to reductions of almost 4,000 positions - this has saved TfL £148m in total year-on-year. This has included initiating a programme with the aim of reducing the cost of certain back and middle office areas by 30 per cent. With this TfL has reviewed 24 business areas and more than 3,000 roles, removing >500 positions to target approximately £37m per annum of repeatable savings.
TfL has also simplified many back and middle office functions including Engineering, Finance, Commercial, Technology and Data, Project Management Office, Service Planning, Business Services Function, Human Resources (HR), Investment Delivery Planning (sponsorship) and Safety, Health and Environment function. For these areas one pan-TfL department now exists, and this rationalisation has produced efficiencies and a leaner organisation.
TfL has also reduced the number of non-permanent labour (NPL) staff working at TfL by almost 1,500.
Some parts of the back and middle office have been restructured three times in the past five years, reducing in size each time. This has been achieved through removing duplication, streamlining accountabilities and prioritising activity. Recent experiences suggest TfL have diminishing or negative returns from reducing these functions further.
Benchmarks
In some areas, TfL seeks to provide its service at a benchmark comparable cost. Benchmarking data shows:
• Human resources (including activity delivered by Business Services): Available benchmarks have shown the benchmark for HR resources per 100 Full-time equivalent (FTE) is between 1.4 – 1.6 (SHRM Human Capital Benchmarking Report 2017, Bloomberg BNA’s HR Department Benchmarks and Analysis report). The current ratio of HR resources per 100 FTE at TfL is 1.4:100, at the lower end of the industry benchmark.
• Finance: Available benchmarks have shown the median total cost for a Finance function is 0.85 per cent of company revenue (PwC Finance Benchmarking Report 2019-20), although this varies according to

87
turnover and geographical spread. The total cost of Finance will predominately be made up of direct costs such as staff, NPL and outsourcing costs however it also includes indirect costs such as IT expenditure and accommodation costs.
The overall cost of TfL’s finance function is circa 0.75 per cent of budgeted operating revenue (such as, operating revenue generated in a typical year). This would place TfL smaller than the peer median according to the PwC report.
For the purposes of calculating the cost of finance resources, the calculation includes all finance costs within the Chief Financial Officer function as well as the finance element of the BSF (but excludes procurement) as well as an assumed 50 per cent uplift of direct costs to account for indirect costs.
• Technology and Data: Recent benchmarking commissioned from IT specialists Gartner suggests TfL currently spends less than its peers on IT (spend as a percentage of TfL revenue in 2019-20: TfL 3.1 per cent vs transportation peer average 4.65 per cent (transportation peers). This work did point out that TfL have a higher than average FTE, but this is because the approach to insourcing more work that others routinely outsource, which has been market tested and shown to deliver better value, financially and in terms of quality.
In other areas TfL consciously goes above the bare/statutory minimum to ensure TfL can contribute to broader regional and national outcomes, such as a UK that builds back better from the pandemic, walks and cycles being used for more trips, and being an international leader on decarbonisation and air quality.
Optimum organisation size in light of TfL’s expectations of future activities
TfL exists to plan, invest in, operate and maintain an integrated transport system to support delivery of agreed social, economic and environmental outcomes for London and the UK. Within its available funding, TfL resources itself in such a way as to ensure the organisation is capable of making these outcomes a reality in as efficient a way as possible.
While the pandemic has caused a short term reduction in demand and revenue, it is TfL’s view that it is not yet clear that the outcomes needed from TfL have fundamentally changed.
For example, there is wide agreement that London must have a safe, accessible, integrated, reliable, low-carbon transport system. Indeed, achievement of these outcomes will be central to support London and the UK’s recovery from the coronavirus pandemic and the ongoing delivery of the Government’s wider social, economic and environmental goals.
TfL therefore consider that TfL’s objective should be to optimise the organisation’s size within TfL’s current broad model and objectives, and not make major changes that would significantly compromise TfL’s ability to deliver outcomes for London and the wider UK economy.
TfL recognises that this assumption may need to be reviewed in coming months as more evidence emerges on future demand, service levels, service quality and capital plans are refined in light of the potential reprioritisation of TfL’s capital plans.
This could mean that the optimum size of the organisation could reduce in the event that TfL materially reduced or stopped certain activities. However, it is important to note that a change in output volumes would have a differential impact on optimum sizing in different parts of the organisation. For example, the bus network is contracted and therefore a change in bus volumes makes little difference to the long term headcount of the organisation. A change in the size of the capital programme more directly flows through to the required levels of resource in project specification, delivery, commercial functions etc.
Recommendation 6 TfL will continue to keep TfL’s organisation size under review, taking into account emerging evidence on future demand, service levels, service quality and capital plans. However, it is TfL’s view that it is not yet clear that the outcomes needed from TfL have fundamentally changed, nor that the organisation is not correctly sized to deliver these outcomes. Indeed, TfL believes the priority focus now should be on helping London and the UK recover from the pandemic and getting revenue back into London and TfL. This will require a desirable public transport service, winning customers
88
back, support for active travel on a safe and welcoming road network, with all of this supported by ensuring the many changes TfL need to make to support long term financial sustainability are effective and successful.
Pay, benefits and pensions As part of its consideration of potential operating efficiencies, TfL has also examined existing pay, benefits
and pensions.
TfL has always recognised the need to have a Reward strategy that targets a total reward package that is median to market to ensure TfL can attract and retain skilled employees who can deliver TfL’s key objectives and the Mayor’s Transport Strategy. TfL’s Reward offering comprises the below key elements:
• Base pay (including performance awards) • Pensions • Other discretionary benefits (namely travel concessions, private medical insurance, cycle to work
schemes)
Taken holistically, the current Reward offering is benchmarked as median to market level for the majority of roles across TfL. TfL undertakes regular benchmarking analysis, and ensures all roles are benchmarked against appropriate roles and companies in both the public and private sector. For example, in the Engineering Directorate benchmarking analysis would be aligned to organisations with UK construction projects, whilst IT benchmarking would be based on similar sized high-tech roles in comparable UK companies and the technology sector.
The pay benchmark for senior managers and above are on average around 20 per cent lower than the market median. During the current mayoral term there has been significant pay restraint for the senior manager grades, with Managing Directors and Directors receiving no annual base pay increases for over five years.
The current benefits offered to employees, particularly around travel concessions, are in keeping with other transport organisations including Network Rail, Train Operating Companies and Bus Companies.
The pension arrangement available to all TfL employees, including new entrants, is the TfL Pension Fund (the Scheme), a final salary defined benefit scheme. The pension arrangement is an important recruitment and retention tool, but its costs are increasing, and it diverges from some other reformed public sector schemes. The Scheme was established under trust many decades ago and the historic treatment of the Scheme as a private sector scheme means there is a consequent requirement from the Pensions Regulator for TfL to fund the Scheme more prudently when compared to other public sector employers to the detriment of TfL’s ability to invest further in London’s transport system.
TfL currently pays around £370m per annum on pensions (expressed as 33.3 per cent of pensionable pay), of which around £75m is for past service deficit repair based on the 2018 valuation deficit of £603m and around £295m is for the cost of future service benefits.
The scheme’s funding deficit has deteriorated as a result of the continued impact of the coronavirus pandemic on the measurement of the Scheme’s assets and liabilities. In addition, the Pensions Regulator is advocating increased level of prudence in DB schemes. Both of these issues mean that the deficit reduction contributions future service costs payable by TfL may increase further following the actuarial valuation as at 31 March 2021. TfL acknowledges that the ongoing funding discussions between TfL and DfT may need to include an assessment of the potential impact of the costs and risks associated with the TfL Pension Scheme and an exploration of how they could be addressed in future.
The TfL Independent Review suggests that a Commission should be established to provide options to modernise the Scheme. TfL will carefully consider the recommendations in this regard. Should any changes ultimately be proposed, past service benefits would remain unchanged.
It is also important that any potential reviews or changes to individual elements of TfL’s pay and benefits offering are considered holistically. This ensures that the total rewards package is considered in the context of the impact that any future change may have on the overall package that an employee receives, allowing TfL the ability to continue to attract and retain talent by remaining competitive to the market. Any change which makes the package less competitive could result in a significant inability to attract and retain key

89
personnel, and therefore the ability to deliver both the Mayor’s Transport Strategy and other key organisational objectives.
Recommendation 7 TfL acknowledges that the ongoing funding discussions between TfL and DfT may need to include an assessment of the potential impact of the costs and risks associated with the TfL Pension Scheme and an exploration of how they could be addressed in future. TfL recommends that any review of the Reward package is considered holistically, and the scope of any review includes all elements of the base pay, pensions and benefits offering.
Prioritisation and efficiency of capital investment Introduction
Paragraph 9b of the Settlement Letter dated 31 October 2020 sets out a requirement for the Financial Sustainability Plan to include:
An assessment of further capital efficiencies and a review of TfL’s Long Term Capital Plan against a prioritisation framework that will be agreed in advance with DfT. This will focus on safety and state of good repair (as that term is recognised by industry specialists, addressing the ability of an asset to meet its function without posing unacceptable risks) of the existing network as highest priority, with options for varying degrees of investment above this for further discussion and scenarios that demonstrate the impacts of reduction in planned expenditure (with scenarios ranging between 0 per cent and 30 per cent reduction) over the period to 2024/25.
TfL’s 2019 Business Plan proposed an average capital spend of £1.9bn per year, equivalent to 20 per cent of its total expenditure. It is vital that this investment delivers the right outcomes for the network and the city. This optimisation is achieved in two main ways:
• Prioritisation: ensuring that the right projects are in the plan. TfL prioritise renewals on the basis of being a good asset custodian for our existing infrastructure base with a focus on safety, operability, asset condition and performance. For new capital investment, TfL uses the Mayors Transport Strategy to drive improvements in a range of outcomes. In addition to balancing across these asset and transport objectives, TfL’s prioritisation also considers the commitment status of existing projects which constrains the ability to re-prioritise existing plans.
• Efficiency: ensuring that the projects are minimising costs while delivering the planned benefits. TfL has made important strides forward in the past few years, focusing on improvements throughout the lifecycle from planning, procurement and through delivery.
These two approaches ensure that every pound in our plans is delivering the maximum amount of benefit to the transport network and the national economy.
Prioritisation of the investment programme
Updated prioritisation criteria for renewals and enhancements
As part of developing the Financial Sustainability Plan, TfL has refined its existing prioritisation criteria in light of the current environment as well as incorporating feedback provided by KPMG as part of their Government-commissioned review of TfL’s finances in 2020. These criteria were agreed with the DfT on 16 December 2020.
The criteria provide strategic criteria for renewals and enhancements across four categories. The full criteria are contained in the annex and summarised below.
Table 24: Strategic criteria for renewals and enhancements
Renewals Renewals Enhancements Minimum Legal, safety and corrective works. Necessary enhancements to meet
legal obligations

90
Minimum + Target critical asset renewal. Support for critical renewals and regulatory improvements
Central Renewal to maintain condition and performance
Enhancements focused on resilient outcomes and near term priorities.
Desirable Asset investment beyond maintaining condition and performance
Longer term MTS priorities catering for growth
A stable, reliable pipeline of ongoing renewals is essential to maintaining a safe and reliable transport service. Many of our assets have specific design lives that are built and maintained to meet that life span, but beyond this point they are much more likely to fail and should be replaced.
While in individual years it is sometimes possible to defer specific works based on detailed asset knowledge, building up significant amount of such deferrals is not sustainable over the medium and long term. A ‘renewals debt’ of past deferrals creates a larger and larger backlog of investment to be caught up. This debt both makes managing the programme much harder, as more emergency works are likely to be required which are harder to plan, fund and deliver in efficient ways. It also creates performance risks, as assets pushed beyond their design life are more likely to fail, causing delays or in extreme cases the need to restrict or close assets. Peaks and troughs of investment are not an efficient way to manage the whole-life cost of assets with known design lives, and this is widely accepted across comparable organisations such as Network Rail and Highways England.
Alongside the outcome categorisation outlined above, TfL has codified elements of the investment programme as either:
• Committed • Partly committed (such as, breaking commitment has attached costs and disbenefits that need to be
assessed on a case-by-case basis) • Uncommitted
The priority and commitment categorisation alone are not by themselves sufficient to determine our future investment programme. There is a crucial step in assessing the deliverability and appropriateness of a base forecast which will be categorised and used for prioritisation. The, following categorisation, it is essential that binary choices on projects are not made. Using the categories to develop more informed scenarios (taking into account descoping, deferral and other alternatives) allows the outcomes to maximised within a defined affordability level.
Developing the medium term reprioritisation plan
The focus in developing Financial Sustainability has been to develop and agree the prioritisation criteria and approach, as well as use our current five year forecast to test that these criteria can be used as an appropriate part of the decision making process (for example, by providing a spread of investment across categories). This is summarised in Table 25 TO Table 27.
Table 25: Renewals - breakdown by category - provisional
Renewals (£m) 2020/21 2021/22 2022/23 2023/24 2024/25 Minimum 265 568 785 669 636 Minimum + 94 221 230 363 392 Central 46 48 76 95 161 Desirable 2 13 9 4 4
Over-programming (38) (43) (225) (71) (89)
Figures in the table are in nominal prices.
Table 26: Enhancements breakdown by category - provisional
Enhancements (£m) 2020/21 2021/22 2022/23 2023/24 2024/25 Minimum 102 172 103 16 15 Minimum + 304 557 636 851 919

91
Central 437 454 437 398 415 Desirable 38 25 56 84 45
Over-programming (38) (36) (36) (5) 9
Figures in the table are in nominal prices.
Table 27: Total Capital Programme Commitment Status – provisional
Enhancements (£m) 2020/21 2021/22 2022/23 2023/24 2024/25 Committed 841 962 586 301 102 Partly committed 267 648 867 1177 1305 Uncommitted 180 447 879 1001 1179
Over-programming (76) (79) (261) (77) (80)
Figures in the table are in nominal prices.
The categorisation places around three per cent of our total investment into the Desirable category. This low figure in part reflects the fact that many schemes that would be ranked as Desirable have already been deprioritised through previous exercises, so do not feature in the latest forecast. In addition, some schemes which may be considered to be categorised as Desirable given their role in expanding public transport capacity, such as the Barking Riverside Extension or Elephant & Castle station upgrade, are in fact categorised as Central because of their direct link to delivering new housing developments. If the categorisation was were continued over a longer timeframe, the proportion of schemes which are categorised as Desirable would be likely to rise, as schemes which would fall into this area but have recently been deferred (such as Holborn and Camden Town station upgrades) would start to enter the forecast.
The Minimum + scope within Desirable enhancements is driven by TfL’s classification of rolling stock and signalling replacements as new capital investment rather than renewals. Within this timeframe this includes DLR and Piccadilly line fleet replacement.
Note that these figures do include over-programming to adjust for slippage that TfL has traditionally seen in its capital programme. However, this forecast needs to be further refined, including a full review of deliverability and to factor in the appropriate level of efficiency (which is currently being assessed).
The analysis described above has provided a better view of the medium term investment programme and how it fits TfL’s most urgent priorities. However, it has not been possible in the timeframe to take the next step and develop coherent reduction scenarios, which includes reviewing the deliverability the existing forecast.
Recommendation 8 TfL propose to use the updated prioritisation criteria and commitment analysis to produce scenarios for what a coherent investment programme will look like at different cost levels, up to a 30 per cent reduction from the original forecast. This will include a deliverability review of the current forecast and then using the criteria to develop integrated scenarios. Developing these scenarios will include an assessment of safety implications of the potential scenarios, as well as their impacts on different groups through an interim view of an Equality Impact Assessment. TfL expects this work to be completed by March.
Developing new long term capital plan scenarios
Through its LTCP developed in 2020, TfL has already assessed potential future scenarios for its investment programme at different funding levels and taking account of potential future changes in travel demand. It shows what different business areas need to reach different ambition levels over 25 years: firstly, to maintain assets and existing performance levels, as well as how to deliver more ambitious progress including the cost to achieve MTS aims.
Three long term capital planning scenarios have been developed and are categorised as:

92
• Safety minimum scenario, which would defer renewals as long as possible while maintaining basic operability and require ceasing the majority of enhancements. This option is not considered viable alongside TfL’s modernisation plans, with reliability and productivity suffering and costs escalating;
• Financially constrained scenario, to deliver a more optimal profile of renewals including replacement of rolling stock at end of design life (but no increase in fleet sizes). Includes a reduced programme of enhancements which would fall well short of that expected by national and local policy. While the most critical locations would be improved, this scenario would not be sufficient to realise the ambitions of a green recovery post-COVID, and many opportunities to support development, decarbonisation and improvements to our services would not be realised
• Policy consistent scenario, this would be much closer to the aspirations set by local and national policy. As well as adequate spending on renewals, we would deliver substantial decarbonisation by 2030, prevent a car-led recovery and invest to improve our services and support development of new homes and jobs.
Over the next 25 years, the Safety Minimum scenario of the LTCP would represent a 30 per cent reduction against historic funding levels and a 50 per cent reduction against the Policy consistent scenario, which is what is required to deliver the outcomes identified in the Mayor’s Transport Strategy.
The LTCP was developed before the prioritisation criteria above had been identified, but the principles behind it were very similar, with investment in renewals required to maintain performance the highest priority, followed by investment to support a green recovery post-pandemic. The prioritisation also took account of the resilience of different outcomes to different future scenarios for travel demand in London.
Recommendation 9 Given uncertainty of future demand, it is to a certain extent unclear what the long term future investment requirement in London is. However, TfL’s view is that it is better to ensure funding is in place to invest in infrastructure that will stimulate demand and support the supply chain, rather than force through short term cuts that would have long lasting damaging effects on London and the UK economy, and risk creation of a ‘bow wave’ of required renewals spending, or worse, impact safety. This renewals build up cannot just be delayed to a time where TfL is in a less constrained financial position – there is a limited window to carry our renewals (restricted by times when TfL is not running a service) and the compounding effect of paused renewals means that TfL need to work through this backlog without adding to it and increasing safety risk. Following completion of the work to develop revised medium term capital scenarios by the end of March (recommendation 8), TfL propose to further discuss with Government the funding of renewals spending and infrastructure investment as part of the upcoming funding negotiations.
Efficiency of the investment programme
TfL has significantly streamlined its capital expenditure in recent years. This has focused on managing projects carefully throughout the lifecycle, with the following focus areas:
• Value management: removing scope with low levels of benefit relative to their cost. • Value engineering: challenging the delivery method of projects to identify lower cost approaches • Reducing internal delivery costs • Active management of risk: targeted mitigations and offsetting programme opportunities • Maximising third party contributions • Optimising timing of delivery: deferring scope not on the critical path
TfL’s approach to efficiencies is underpinned by a strong commitment to benchmarking most notably through the DfT-sponsored Transport Infrastructure Efficiency Strategy (TIES), which recognised the greatest opportunities for efficiency are during the early stages of investment planning, through collaboration and shared problem solving. TfL will continue to engage and embed the learnings from TIES and associated DfT initiatives such including the National Infrastructure Strategy, Project Speed and the Construction Playbook.
93
However, TfL currently lacks a robust group-wide method of tracking efficiencies (as it already has in place for operating efficiencies) that integrates and builds on the good practice described above.
A mature approach to the reporting and realisation of efficiencies has to be underpinned by multi-year funding certainty. This has allowed Network Rail and Highways England to develop their own efficiencies approaches working with greater certainty with the supply chain.
Recommendation 10 TfL recognises that a robust, group-wide method of tracking capital efficiencies is a weakness and it proposes putting in place measures to fix this. TfL propose to embed new processes across the Investment Programme over the next few months, starting with the overall efficiency targets and process improvements outlined below. There is an opportunity through the TIES initiative to collaborate with Highways England and Network Rail to understand the methodologies for implementing capital efficiency programmes. This will allow successful methodologies and lessons learned to be shared to allow TfL to accelerate the implementation of the processes and meet targets quickly.
Over the next few months, TfL will implement a robust capital efficiencies plan which will build on the Value for Money actions it had already committed to. The proposed key workstreams of the programme are summarised below:
• Quantification and tracking of efficiencies, including better data • Improved project initiation • Standards and engineering • Review of commercial approaches • Improved business case management and focus through the lifecycle stage gates • Improved escalation process for change and clear lifecycle accountabilities
Commercial development activities Introduction
Paragraph 9a of the Settlement Letter dated 31 October 2020 sets out a requirement for the Financial Sustainability Plan to include:
A review of TfL’s commercial development activities with the aim of maximising their use to aid future sustainability, subject to near term affordability. Non-operational assets (including land and property) that are surplus, will not generate future revenues and are not otherwise required for safeguarding activity, will be identified and considered for sale. This review will consider the impact on achieving financial sustainability by FY2023 as well as value for money considerations.
Existing Approach
TTLP was set up in 2014 and became the corporate structure for all commercial property activity within TfL. Given the current funding challenges and the need to deliver long term stable income growth, TfL has been assessing new funding and structuring options for TTLP that would not rely on TfL for any funding.
TTLP manages over 2,500 commercial properties. It also has a programme to deliver over 10,000 new homes across 50 sites throughout London. Almost 1,500 new homes have been completed or are under construction. Planning consents have been achieved for a further 5,800 homes. TTLP is establishing a successful track record of working with commercial partners including in nine corporate joint ventures.
TTLP’s existing investment programme, which totals £1bn over 10 years, was devised to require no call upon TfL’s group funding arrangements so that over ten years no net transport infrastructure funding would be diverted into property. In the short term, however, there is a net investment required to kick start the housing programme, and hence pre COVID-19, housing and property projects were effectively competing for funding with TfL’s transport-related activity. The impact of the coronavirus pandemic has further constrained TfL’s ability to make the investment needed to deliver both the new homes and the additional income projected in the current programme. As such the current programme is at risk and potentially undeliverable.
TTLP’s Housing Growth Plan

94
If TTLP’s income stream and asset base could unlock commercial funding, it would allow investment at levels well in excess of that envisaged in the current plan. Given a net investment of £2.5bn over a 25-year period, TTLP could deliver:
• Up to 50,000 new homes, offering a mix of for-rent and for-sale properties; • £9bn of asset value (up from a current value of £1.5bn in March 2020); • £400m of operating income (up from £102m per annum in 2019/20); and • £250m of net income available as a dividend to TfL per annum (up from £68m per annum in 2019/20).
This programme would create a substantial future endowment for TfL whilst delivering vital social, environmental and economic benefits. Analysis by Deloitte has shown that TTLP’s Housing Growth Plan would be associated with 250,000 jobs (FTE, part time and temporary) through housing construction through to 2037. It would also help address current market failures, including unlocking a major investment in construction skills training and Modern Methods of Construction to accelerate the pace and sustainability of delivery.
The phasing of this cost will be dependent upon the timing of the projects, though indicatively, the cumulative net cost is expected to be £450m in the first five years, £790m by year 10 and £2.5bn by year 25.
TTLP has had very positive engagement with the MHCLG and Homes England, and ongoing funding support will be important in unlocking the largest development projects. TTLP’s sees a strategic partnership with MHCLG and/or Homes England as critical to maximising the benefits of the Housing Growth Plan.
TTLP hopes to work with the MHCLG in developing these plans further. However, it should be noted that the Housing Growth Plan financial forecast has not been integrated into the scenarios described in Chapter 2.
Proposed Funding Model
The main obstacle to delivering TTLP’s Housing Growth Plan is access to capital. The options set out here require no legislative change and minimise approval from external stakeholders.
TTLP has made substantial progress in leveraging land around railway and bus infrastructure. A non-TfL entity will find it more difficult to release land for development. A sufficiently funded entity that is owned by TfL – even if ring-fenced – can work with the operational businesses to create and recycle land value to efficiently deliver homes and income.
Longer term, TTLP is likely to be funded from a combination of grant, debt and equity. Before then, Government pump priming of up to circa £500m over three years would allow TTLP to be more effective and efficient – and therefore more valuable. It would allow the timing of any future decision on equity to be optimised. Bringing in private capital immediately would result in a leakage of value that could otherwise be retained and recycled within the public sector.
Upfront Government funding would also support TfL to assess how TTLP could access debt finance secured only on property assets, not subject to general affordability of TfL’s other debt. Assuming debt can be accessed, TTLP’s balance sheet should be capable of supporting projected borrowings to fund the £2.5bn investment required over the 25-year period, with bankable Loan to Value levels and income generation for interest cover ratios over the lifetime of the plan.
When appropriate, equity investment into TTLP by third parties could be delivered through a range of mechanisms, including share issuance by TTLP; sale by TfL of existing equity shares; pooling of TTLP assets with one or more other asset portfolios in a single vehicle; and preference shares or hybrid debt, which could be applied to TTLP corporately or to specific portfolios of assets. Any sale of TfL shares could be phased, although there is a distinct advantage in reaching a TfL minority ownership stake in order to eradicate the constraints of consolidation in the TfL group.
There will be strong market appetite to invest in TTLP. At the appropriate time, there should be opportunities to trade-off short and long term sustainability for TfL, maintain income and asset value growth, and introduce external expertise and efficiencies to TTLP. Shorter term, however, equity options risk leakage of value before TTLP has delivered low-hanging growth. There may also be short term dilution of the economic gains to TfL in any equity divestment, though a smaller stake could be offset by gains from a greater scale of delivery at faster pace – essentially a smaller piece of a large pie. Further analysis will be required to compare the

95
different capital structure options and opportunities for growth above the base case, and hence determine the fiscal impact on TfL.
Without access to enhanced funding for TTLP, the programme could be funded through sales of income-producing assets and further dilution of TfL’s economic interest at development level. At best, this approach could deliver some, but not all, of the new housing target and would provide little of the potential contribution to TfL’s financial sustainability.
The FSP was asked to consider further disposals of non-income producing assets. The targeted disposal of under-performing assets and the recycling of profits into new opportunities is an active part of TfL’s plans and a list of potential assets for disposal is regularly reviewed. In the current market, a fire sale of assets would be unlikely to achieve best value and would be detrimental to TfL’s sustainability.
Governance
In delivering the Housing Growth Plan, TTLP would quickly become one of the largest developers in London. The risk imported into TfL as a result of this increased activity would justify new, bespoke governance arrangements with additional senior, commercial property expertise. The financial, commercial and other professional support provided to TTLP would also need to be commensurate with a major property company. These new arrangements would be viewed positively by the market and should be undertaken as soon as possible, certainly long before any commercial debt raising or equity sale.
It is important that TTLP retains a positive ongoing relationship with TfL. There are significant benefits for TfL in owning (in whole or in part) a commercial property business that can deliver transport improvements alongside commercial schemes. Working with a retained intelligent client function in TfL, TTLP would be able to build on the work currently underway to review TfL’s wider land holdings to identify other opportunities which have not been included so far within existing development programmes.
Conclusion and Next Steps
TTLP’s Housing Growth Plan provides substantial benefits for TfL and London.
TTLP would like to work with MHCLG to develop the model and plan to consider future funding options for TTLP’s Housing Growth Plan and how future income streams could be integrated to TfL
TTLP’s Housing Growth Plan provides substantial benefits for TfL and London. Ring-fenced, time-bound support from Government would allow TTLP to maintained momentum on housing while putting in place the structure and governance to accelerate delivery. TTLP would ideally also be able to borrow directly for its net capital investment on commercial terms. Longer term, there is the potential to move TTLP outside the TfL Group through a partial sale to one or more external equity investors. In any event, establishing TTLP as a standalone entity is a critical initial step.
Recommendation 11 Subject to understanding the appetite and constraints for Government in working in partnership with TTLP, TfL propose to develop and refine the capital structure options. This will include taking legal and financial advice, producing full value for money analyses, market-testing options, and reviewing the technical feasibility and accounting impacts.
Existing funding levers Introduction
Having considered opportunities for efficiency in operating and capital costs, as well as TfL’s Commercial Development activities, this section of the document considers revenue opportunities associated with existing funding levers that could be used to drive greater financial sustainability of the organisation.
While TfL has set out some of the options and considerations regarding revenue opportunities arising from these existing levers, TfL notes that in many cases decisions around these matters are reserved to the Mayor and/or Government.

96
Fares (including concessions)
In May, TfL agreed a £1.6bn funding deal with the government that included a commitment to increase fares controlled by the Mayor in January 2021 across all modes by Retail Price Index (RPI) +1 per cent. All decisions relating to TfL fares are reserved for the Mayor.
Given the low passenger demand forecast for the early months of 2021, the revenue benefit of the additional one per cent above inflation is estimated to only be approximately £3m within this financial year (but this would grow in future years). If demand is above forecast, this amount would increase (and vice versa).
Additional revenue options could be implemented on top of the basic RPI+1 package including;
• Further RPI increases: Each additional percentage above RPI+1 could generate around £35m per annum (the impact is proportional to demand for travel linked to COVID restrictions). However, this would reduce ridership and the attractiveness of public transport, making a car-led recovery more likely
• Extending zone 1 to Canary Wharf: Zone 1 could be extended eastwards to Canary Wharf. There are some complexities in implementing this. This would reflect change in London geography and would target journeys that are less price elastic. This could generate around £25m per annum beyond 2021/22.
The figures above are based on pre-pandemic TfL passenger demand forecasts. Actual values will be lower due to expected lower levels of demand.
As part of the Settlement Letter dated 31 October, the Mayor has agreed with Government that Government funding will not be used for any concessions above those typically available elsewhere in England, and that the costs of these benefits over 2021/22 will not be met through additional borrowing, savings, service changes or deferrals.
Road User Charging
Role of RUC
RUC plays an important role in managing traffic to enable more sustainable use of London’s limited road space in order to achieve both the long term goals set out in the MTS including reducing traffic and congestion, improving air quality and reducing carbon emissions and reducing road danger.
Achieving these objectives will also help to address the new and pressing challenges presented by the coronavirus pandemic and its aftermath. In particular, RUC schemes contribute to the achievement of the MTS’s 80 per cent sustainable mode share target which will lead to better health for Londoners, mitigate the impacts of climate change and enable both a Green Recovery in the short term and Good Growth in the longer term.
Road pricing can bring about changes in behaviour and lead to positive outcomes if it is developed and implemented appropriately and adapted to respond to changing conditions over time. Current schemes have as their objectives the management of traffic and congestion (Congestion Charge) and the reduction of harmful vehicle emissions (LEZ, ULEZ and ULEX) and all have a traffic reduction effect.
All revenue raised by road pricing must by law be used to implement the MTS.
Vehicle Excise Duty
Approximately £6bn is raised from VED annually in the UK. This VED revenue is hypothecated to a National Roads Fund, with the vast majority of this going to Highways England who only manage 0.4 per cent of roads in London.
While other major roads in London may be able to access a small proportion of National Roads Fund through the Major Roads Network fund, this investment would be very small compared to the amount raised from Londoners paying VED. To date London has not received any of these funds.
This means only a small proportion of the estimated £500m VED paid by Londoners each year is reinvested back into London’s roads. This is despite 90 per cent of the journeys of London car owners being entirely within Greater London, and in addition 25 per cent of road journeys in the capital are made by people who live outside its boundaries.

97
Devolving London’s portion of VED or implementing a new grant from government of an equivalent financial amount, would be appropriate to help maintain the asset quality of London’s road network. This would meet the net cost of operations for buses and streets, in addition to providing a contribution towards funding enhancements.
In addition, London is ineligible to apply for many national schemes that would pay for transport and roads. These include the Transforming Cities Fund established in autumn 2017 to enable greater investment in sustainable transport; the Pothole Action fund; the Local Pinch Point Fund; and the Local Highways Maintenance Challenge Fund.
Making these national schemes available to London would also support the asset quality of London’s road network and could help address the large backlog of maintenance on Borough roads which currently have no identified funding source.
Different RUC options
RUC schemes can take different forms and TfL is considering the role they could play in London in the future to meet MTS policies and proposals. It is important that any future scheme is developed in response to the particular challenges relating to the use of motor vehicles which need to be addressed going forward.
The nature of the challenge and the area in which they are located will help determine which type of scheme will be most effective. Types of scheme under consideration include:
• Reviewing the Central London Congestion Charge to ensure it remains effective in the context of the lasting impacts of the pandemic.
• Extending emissions-based charging (such as ULEZ) to address poor air quality such as extending to inner London 2021.
• A new scheme in Outer London to address non-resident inbound traffic, such as a Greater London Boundary Charge in Outer London to address traffic driving into London.

98
Overview of RUC schemes Table 28: Overview of RUC schemes
Sche
me
Description Go-live date Charging zone/ times/ rate
Expected chargeable vehicle volumes 24/25
Expected net income in 24/25
Cong
estio
n Ch
arge
The congestion charge is a fee imposed on most cars and other motor vehicles being driven within the Congestion Charge Zone (CCZ) in Central London unless they are exempt or subject to 100 per cent discount (eligible residents’ quality for a 90 per cent discount).
Live £15 daily charge within the CCZ 07:00-22:00, every day, except Christmas Day 7am to 10pm. The charge was increased to £15 and the days/hours were extended on a temporary basis in response to the pandemic.
15.4m £245m
ULE
Z (U
ltra
Low
Em
issi
on
Zone
) Cen
tral
The ULEZ is a charge which applies to motor vehicles which are being driven in the CCZ in Central London that don’t meet the schemes emission standards. The primary objective is to help improve air quality.
Live 24 hours a day, 7 days a week, every day of the year, except Christmas Day, same area of Central London as the Congestion Charge. £12.50 for most vehicle types, including cars, motorcycles and vans (up to and including 3.5 tonnes) £100 for heavier vehicles, including lorries (over 3.5 tonnes) and buses/coaches (over 5 tonnes).
0.5m £5m
ULE
Z Ex
pans
ion
From 25 October 2021, the existing Central London ULEZ will expand to create a single larger zone bounded by the North Circular Road (A406) and South Circular Road (A205). The North and South Circular Roads themselves are not included in the zone.
Oct 2021
As per ULEZ Central. 15.1m £205m
Low
Em
issi
on Z
one
(LEZ
)
The Low Emission Zone operates to encourage the most polluting heavy diesel vehicles driving in London to become cleaner. The emissions standards to be compliant with the LEZ will be tightened from 1 March 2021.
Live The LEZ covers most of Greater London and is in operation 24 hours a day, every day of the year.
0.3m £5m
Recommendation 12
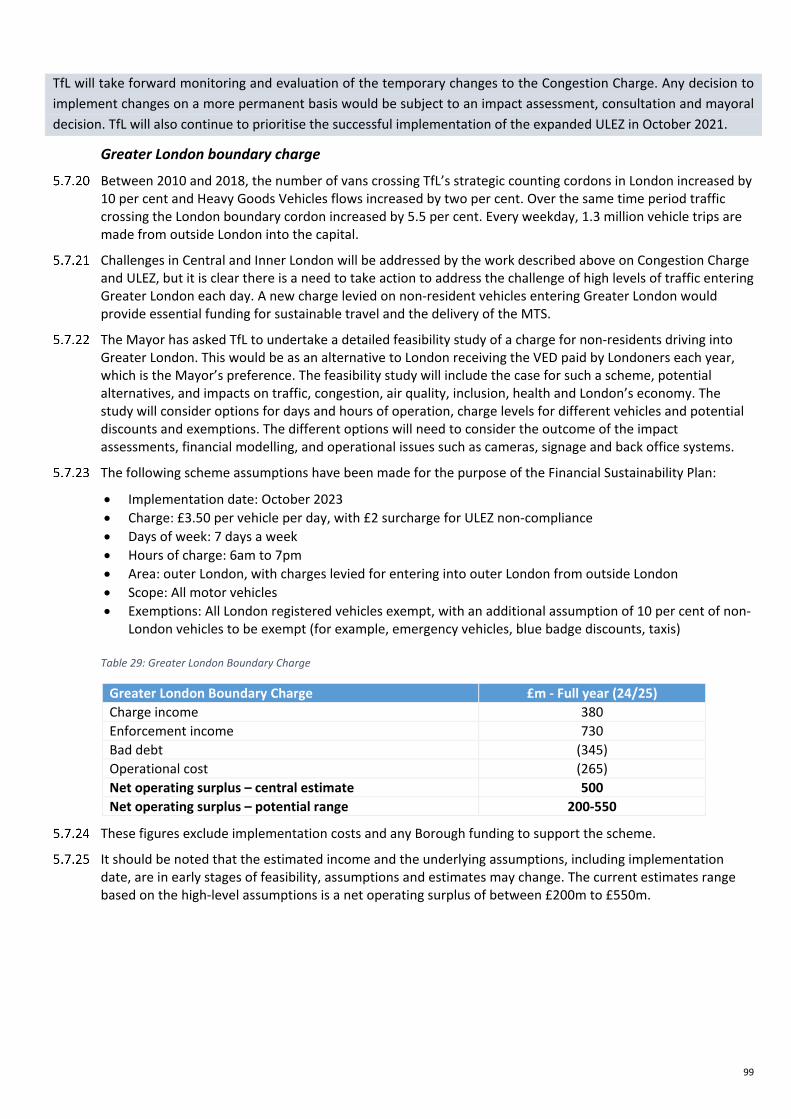
99
TfL will take forward monitoring and evaluation of the temporary changes to the Congestion Charge. Any decision to implement changes on a more permanent basis would be subject to an impact assessment, consultation and mayoral decision. TfL will also continue to prioritise the successful implementation of the expanded ULEZ in October 2021.
Greater London boundary charge
Between 2010 and 2018, the number of vans crossing TfL’s strategic counting cordons in London increased by 10 per cent and Heavy Goods Vehicles flows increased by two per cent. Over the same time period traffic crossing the London boundary cordon increased by 5.5 per cent. Every weekday, 1.3 million vehicle trips are made from outside London into the capital.
Challenges in Central and Inner London will be addressed by the work described above on Congestion Charge and ULEZ, but it is clear there is a need to take action to address the challenge of high levels of traffic entering Greater London each day. A new charge levied on non-resident vehicles entering Greater London would provide essential funding for sustainable travel and the delivery of the MTS.
The Mayor has asked TfL to undertake a detailed feasibility study of a charge for non-residents driving into Greater London. This would be as an alternative to London receiving the VED paid by Londoners each year, which is the Mayor’s preference. The feasibility study will include the case for such a scheme, potential alternatives, and impacts on traffic, congestion, air quality, inclusion, health and London’s economy. The study will consider options for days and hours of operation, charge levels for different vehicles and potential discounts and exemptions. The different options will need to consider the outcome of the impact assessments, financial modelling, and operational issues such as cameras, signage and back office systems.
The following scheme assumptions have been made for the purpose of the Financial Sustainability Plan:
• Implementation date: October 2023 • Charge: £3.50 per vehicle per day, with £2 surcharge for ULEZ non-compliance • Days of week: 7 days a week • Hours of charge: 6am to 7pm • Area: outer London, with charges levied for entering into outer London from outside London • Scope: All motor vehicles • Exemptions: All London registered vehicles exempt, with an additional assumption of 10 per cent of non-
London vehicles to be exempt (for example, emergency vehicles, blue badge discounts, taxis)
Table 29: Greater London Boundary Charge
Greater London Boundary Charge £m - Full year (24/25) Charge income 380 Enforcement income 730 Bad debt (345) Operational cost (265) Net operating surplus – central estimate 500 Net operating surplus – potential range 200-550
These figures exclude implementation costs and any Borough funding to support the scheme.
It should be noted that the estimated income and the underlying assumptions, including implementation date, are in early stages of feasibility, assumptions and estimates may change. The current estimates range based on the high-level assumptions is a net operating surplus of between £200m to £550m.

100
The capital required for the Greater London boundary charge solution would be driven by significant infrastructure and technology requirement developments on the current systems TfL has. The complexity of requirements such as exemptions could also vary cost significantly. Our current outline capital expenditure estimates are between £125m to £175 m.
Recommendation 13 As instructed by the Mayor, in the absence of Government allocating London VED, TfL will undertake a feasibility study of a charge for driving into London to address the traffic entering the Capital every day from vehicles registered outside London and consider the potential for such a scheme to be introduced in the future. This scheme would be considered if VED cannot be allocated to London, or alternatively an amount of grant equivalent to London VED. At the same time TfL will continue to review existing charges across London and investigate the potential for new and more sophisticated technologies to be used to deliver a more integrated system.
Other potential funding sources Introduction
Having considered revenue opportunities associated with existing funding levers, this section sets out considerations regarding potential funding from other sources, external to TfL, and specifically the taxation options.
As with existing funding levers, TfL notes that decisions around funding options require further discussion with the Mayor and/or Government.
This section draws on the work of the two London Finance Commissions under the current Mayor and Mayor Johnson and on the work of the Independent Review published in December 2020.
Considerations regarding potential funding sources
The amount of funding needed from external sources depends on TfL’s needs for operations and investment and what TfL can generate from its own business, and with the Mayor’s agreement, from fares and RUC.
One form of funding through taxation is government grant, paid by the Government to the Mayor and then by the Mayor to TfL, either for investment or at some points for operational support. But the two London Finance Commissions and the Independent Review made the case strongly for the Mayor to be able to raise and retain taxation and charges and to pay these across to TfL as mayoral grant.
This fiscal devolution can be in the form of a ‘slice’ of the taxation already paid by Londoners or London business, as happens with Business Rate Retention, but may also be an ‘increment’ where the Mayor has powers to raise his own taxes or tax supplements as happens with the Mayoral Community Infrastructure Levy. However, any incremental taxes will need to consider how this can be justified, given London’s is already a major net contributor to tax receipts to the rest of the UK (£38.9bn in 2018/19, as outlined in section 1.1 of Chapter 1).
There is a strong case for supporting public transport from both central and local taxation. The economic benefits of public transport supporting Central London are well understood and there are also environmental and social benefits. TfL’s reliance on fares before the crisis was unusual compared to other public transport bodies, in the UK and abroad, as the Independent Review showed, and it made TfL peculiarly vulnerable to the loss of much of its passenger revenue.
London is integrated into the UK economy, with commuters and visitors an important part of the mix. The TfL network goes beyond the political boundary and links closely to the national railway. So there needs to be a mix of funding mechanisms which balance the contributions from residents, business, workers and visitors – as well as users.
But it is for elected politicians to agree what that balance is and what funding streams are most appropriate. As noted elsewhere, TfL’s prime interest is that the core funding is reasonably stable and linked to a medium term plan which ensures renewal and maintenance of the asset base. More variable funding on top of this baseline can be used for enhancement and extension of the network. Some funding diversity would help that stability. A combination of grants, specific taxes, increased property income as well as the farebox could
101
provide this portfolio. Even in the extreme position of 2020, international evidence is that tax receipts fell by less than fares giving authorities with a broader base some protection.
The Mayor’s current fiscal levers
The Mayor’s main current tax revenue source is the BRR. This currently generates circa £1.9bn a year for TfL, as a form of grant replacement. Under the BRR, Central Government holds control over the tax rate, frequency of revaluations, the rules on revenue allocation and any system resets. The Mayor has no decision-making power over this nationally set tax.
The Mayor does have powers to raise two project-specific taxes – Business Rate Supplement and Mayoral Community Infrastructure Levy, but these taxes are currently allocated to Crossrail 1, a point confirmed in the December 2020 Crossrail agreement.
The Mayor’s only other significant tax receipt is from the council tax. This makes a small direct contribution to TfL’s operations of £6m a year.
The two London Finance Commissions set out the arguments for fiscal devolution, which the Independent Review picked up. It argued for a broad tax base for the Mayor, which did not overburden any single group and provided funding diversity. The Independent Review also expressed views that taxes should be based on existing mechanisms, should contain a mixture of ‘slices’ and new London ‘increments’, and should not act as a brake on business and employment.
Potential options for further fiscal devolution
The remainder of this section goes through the main possibilities for other funding, drawing on the work of the Independent Review and the analysis done by NERA in support. For clarity, no assumptions have been made regarding incremental funding from these sources and they are not included in the scenarios set out in Chapter 2.
The broad options for fiscal devolution remain as set out by the commissions and the Independent Review were:
• Vehicle and fuel taxation • Council tax, and other property taxes including stamp duty and capital gains tax • Employment levy • VAT or sales tax • Increased business rates.
The second London Finance Commission also considered options around major new schemes and land value capture.
Vehicle and fuel taxation
There are clear links between vehicle and fuel taxation and the RUC proposals described elsewhere in this document. The burdens for the motorist need to be considered overall as does the balance of charging by central, regional and local government.
In the short term, TfL continues to make the case for a share of the English VED and this was supported by the Independent Review. This is collected by Central Government and allocated to Highways England for investment in the nationwide strategic network. But in London, almost all major roads, such as the North and South Circulars, are a TfL responsibility, with Highways England only responsible for the motorway stubs. The major road network is key for the movement of freight as well as cars and buses.
Consequently, of the estimated £500m VED paid by Londoners each year – based on the numbers of cars registered in London – only a small proportion has been invested back into maintaining London’s roads. In fact, London does not receive any grant for maintenance of London’s strategic road network while Highways England now receives England’s VED for motorways and trunk roads. This is despite 90 per cent of the journeys of London car owners being entirely within Greater London, and in addition 25 per cent of road journeys in the capital are made by people who live outside its boundaries – but no VED is being used to support maintenance of the bulk of major London roads. The Mayor made a clear link between the absence of VED and the possible Greater London Boundary Charge.

102
Council tax
In the medium term, some form of residential property taxation remains a logical option. There are clear links between property values in London and the benefits generated by the public transport network, though residents’ contributions must be part of a wider balance.
Both London Finance Commissions and the Independent Review pointed out the difficulties with the current council tax system in London, which is widely seen as unfit for purpose for how the city finds itself in 2021. The base set in 1991 deliberately compressed the bands, when market prices varied much more than this. There has been no revaluation since 1991, during nearly 30 years in which London house prices have both grown significantly in absolute terms, but more importantly have changed relatively as well. It is also a regressive form of taxation, with the burden falling disproportionately on the poorest Londoners.
According to analysis by the Equality Trust the poorest 10 per cent of households pay eight per cent of their gross income in council tax, compared only around two per cent for the richest 10 per cent.32 Of the assumed increase in local authority core spending power for 2021-22, the Institute of Fiscal Studies has estimated that around three quarters will come from assumed rises in council tax.33 Paul Johnson, the Director of the Institute for Fiscal Studies, has described council tax as "a tax that deliberately sets out to impose a heavier burden on people with the lowest levels of housing consumption and wealth than on those with the highest levels".
Council tax levels have also risen significantly in recent years as a direct result of the Government's decision to pass a greater burden onto council taxpayers for funding local services including policing and fire services. The average council tax for London boroughs excluding the GLA precept has increased by 17 per cent compared to 2016-17 with a further rise of up to five per cent expected in 2021-22. The Mayor's separate precept has increased by 20.3 per cent over the same period from £276 to £332.07 (the policing element increased by 24.8 per cent in line with the Government's expectations as set out in the Home Office police settlement and the non-policing element which mainly funds the London Fire Brigade by 8.2 per cent).
As a result, there are arguments against a short term increase before meaningful reform.
To raise significant levels of income (for example, an illustrative amount of £500m per annum), would require a further precept of between £130 and £170 for a band D property. This would require an agreement on referendum limits and does not get away from all of the downsides of council tax as identified above.
Employment levy
There are domestic and international precedents for an employment levy, as set out in the Independent Review.
The rationale for having employers pay the levy is:
• employers benefit from access to markets and labour the transport system provides, and • the needs of businesses cause peaks in public transport demand and consequently the majority of
investment in public transport designed to increase peak capacity is driven by the needs of businesses
The levy would require primary legislation and would take time to put in place, although a ‘slice’ option based on an agreed allocation of current tax could be done quicker. Based on the example of the Apprenticeship Levy, legislative implementation could take around two years.
According to the Independent Review, an employment levy based on place of work was a practical way of raising significant income but was a tax on London’s success and would raise issues with home workers and so was not recommended.
VAT or sales tax
32 https://www.equalitytrust.org.uk/blog/how-regressive-our-tax-system 33 https://www.lgcplus.com/finance/council-tax-drives-three-quarters-of-spending-power-boost-26-11-2020/
103
VAT supplements are new to the UK, but the tax base is robust and could be adapted to London’s needs over time.
The rationale for an incremental VAT increase dedicated to public transport is that Londoners who benefit from the network pay, whether they use it or not, and people who consume in London are often visitors, tourists and commuters.
The ease with which the ‘slice’ approach could be implemented is also attractive - a contractual type arrangement could be achieved that assigns a proportion of revenue, without needing to implement legislation.
As with VAT devolution in Scotland, the power to raise and set VAT would likely remain with central government, who could change the VAT rate at short notice.
A Mayoral supplement based on the VAT system would track the London economy and be more neutral to employment than an employment levy. It would be a tax on all sales transactions made in London, including on deliveries to London addresses.
Under the ‘slice’ approach the Mayor could agree with the Government that HM Treasury would provide an amount equal to 0.5 per cent VAT in London to TfL on a continuing basis and agree the methodology to calculate this. This could be done immediately.
Under the ‘increment’ approach the Mayor would be permitted to increase VAT charged on all sales in London, including deliveries to London addresses. As an illustrative example, to raise £500m per annum an increase of 0.5 per cent would be necessary. This would raise the VAT rate in London from 20 per cent to 20.5 per cent.
The Independent Review considered that a ‘slice’ approach would be easier to implement in the short to medium term. Overtime, London could migrate to an ‘increment’ position.
Increased business rates
There is a clear benefit to businesses from public transport investment, especially in Central London. However, business rates are already charged at a high tax rate (circa 50 per cent of rateable values), so a further increment on top of the Business Rates System may be difficult. Higher business rates bills may damage businesses’ cashflow and may translate into higher prices for consumers. There was clear nation-wide pressure to reform the business rates system before the coronavirus pandemic and this can only intensify, given the increasing presence of online retailers and is no longer fit for purpose. As such, the Independent Review suggested there could be better choices.
Under BRR scheme in 2020-21 London local government retains 67 per cent of business rates income in 2020/2021 subject to the net tariff and levy on growth payable to MHCLG. This is split 37 per cent GLA / 30 per cent London boroughs and arises from the GLA specific pilot agreed in 2017-18 when TfL's former approximately £1bn DfT investment (capital) grant and the GLA's residual revenue support grant (primarily for the London Fire Brigade) was rolled into the BRR system. These shares will continue into 2021/22 as set out in the provisional local government finance settlement published on 17 December.
A ‘slice’ option for business rates would increase the Mayor’s share of retained business rates, after applying the tariff and levy on growth payable to Government. As an illustrative example, a 5-point increase in share to 42 per cent from the current 37 per cent would be worth £500m per annum. No business would pay more but there would of course be a consequential five per cent reduction (from 33 per cent to 28 per cent) in the central share payment made by London billing authorities to MHCLG which is used to support other local government and fire spending. Alternatively, the GLA is due to pay around £812.4m to MHCLG as a tariff payment through the BRR system in 2021-22 – this being the amount by which Mayor’s 37 per cent share of business rates income in London exceeds the GLA group’s approved settlement funding. This tariff payment essentially represents a subsidy from London business rate payers through the Mayor to fund local government and fire services elsewhere in England. This subsidy could be reduced so that it could be spent locally for the benefit of London business ratepayers who have paid for it.

104
Under an ‘increment’ option the average multiplier could be increased to 52.4p for small businesses (from 49.9p) and to 53.7p (from 51.2p) for large businesses. This would equally achieve £500m per annum. Multiplier rates would vary if only businesses in Inner London or in the Central Activity Zone were subject to the increase. However, it is recognised that applying differential multipliers in London is likely require a change to existing primary legislation, such as the Local Government Finance Act 1988.
Recommendation 14 It is for elected politicians to agree what the balance of funding streams are most appropriate. However, as set out in the comparator analysis below, TfL considers that relative to other urban transport authorities, TfL is unusual in being so reliant on fare income.
TfL proposes that TfL’s funding arrangements are reviewed to ensure suitable diversity and stability of funding. This could be coupled with revised governance arrangements and controls that provide Government with further comfort around efficiency, value for money and expenditure prioritisation in respect of any funding it is providing. These proposals are explored in further detail in Chapter 4.
Comparison of TfL’s funding arrangements to other urban transport authorities
TfL is unusual among transport authorities in major cities in being so reliant on fares income received from public transport passengers.
TfL’s original budget for this year forecast that 72 per cent of operating income would come from passenger revenue. International figures should be used with caution due to differences in reporting formats, but data shown to us by TfL put the equivalent figures at 38 per cent for the New York Metropolitan Transportation Authority, 38 per cent for Paris’s Île-de-France Mobilités and 47 per cent for Madrid’s Consorcio Regional de Transportes de Madrid. Though all transport operators have been subject to severe financial stress as a result of the pandemic, this reliance on fares has left TfL particularly vulnerable to a downturn in ridership.

105
Figure 17: Comparison of TfL’s funding arrangements to other urban transport authorities
106
International Mass Transit Authorities (MTA’s) which are very dependent on regional or national subsidies have been less effected financially by the pandemic. Whist they have seen losses from reduction in dedicated taxes, these have generally been less than the fare box.
Special financial packages have been discussed in the US and Europe with an underlying picture of national governments having to provide support outside their normal arrangements. National support has, however, generally not covered the full funding deficits and further negotiations will be needed in 2021. TfL’s closest comparators are in New York and Paris.
For New York, the second federal bill passed just before Christmas provides more than $4 billion for the city out of a national total of $14 billion (and a total US wide ‘ask’ of $32 billion). The caps for Federal Support levels have been increased from around 30 per cent to 75 per cent operating costs. If achieved this should allow most US transit authorities to get through 2021 without devastating service cuts.
In the Paris region, covered by IDFM (Île-de-France mobilités) the deal with national government in summer 2020 provided for €1bn of grant and €1bn of borrowing against a forecast deficit of €2.6bn. Latest information is that the state may cover the remaining €0.6 billion and discussions are expected for 2021.
Across the country of Germany there has been €2.5bn of federal aid, with the regions expected to match. About 95 per cent of the total cost will be covered at federal/state level as opposed to municipal. Some states are providing funding for 2021 and further negotiations are expected.
Oslo and Copenhagen have reported funding packages agreed through to summer 2021.
Across all cities, there is a clear link between COVID-19 restrictions and lost ridership and fare income. London’s ridership numbers are not exceptional – nor is a request for national support in the billions.
Debt, liquidity and reserves Introduction
Paragraph 9d of the Settlement Letter dated 31 October 2020 sets out a requirement for the Financial Sustainability Plan to include:
A review of TfL’s liquidity position, and review of level of reserves that is appropriate for the risks that TfL faces in the short, medium and long term.
This section of the document addresses this requirement and outlines TfL’s views and recommendations. It also sets out considerations regarding the affordability of TfL’s current debt burden.
Current liquidity policy
TfL’s current Liquidity Policy, as set out in its Treasury Management Policy, was approved in December 2019 following a comprehensive liquidity review, which included credit rating considerations, peer comparison as well as historic and forward-looking analysis of TfL’s cash requirements. The policy states that for prudent financial management purposes, TfL will aim to maintain a minimum level of cash reserves of at least 60 days’ worth of forecast annual operating expenditure, on average, with respect to TfL Group (excluding ring fenced subsidiaries).
The policy represents the minimum level of cash reserves that allows TfL to meet its ongoing payment obligations as well as to provide contingency in case of unexpected events.
In practice, this translates into a requirement to hold a minimum of £1.2bn of cash and short term investments, including coverage of daily fluctuations due timing of payments and receipts of up to £300m.
As part of the 2019 Business Planning process TfL also sought to maintain an additional risk buffer of £600m over and above the £1.2bn in order to further increase resilience by providing an allowance for known risks, such as Brexit.
As a result of continuous focus on rebuilding the reserves, the cash balance at the end of March 2020 stood at a prudent level of £2.2bn. As a result of the pandemic, this reduced to just above £1.2bn in early May 2020, prior to the receipt of government grant under the H1 Extraordinary support agreement.

107
In addition to cash reserves, TfL has access to several external liquidity sources, including Public Works Loan Board, bank overdraft and public markets via its Commercial Paper and bond programmes.
It is important to note that TfL’s ability to use borrowing for liquidity purposes is limited due to restrictions arising from its status as a local authority for finance purposes, historic government agreed borrowing limits and significant amount of existing debt obligations.
Adequacy of reserves
This section considers the adequacy of TfL’s current cash reserves and minimum target levels set out by its liquidity policy in light of the current challenges presented by the pandemic. The minimum levels of liquidity and cash reserves need to be sufficient to allow TfL to navigate through the short, medium and long term without impact to service delivery or its credit rating.
TfL has commissioned independent advice regarding their liquidity policy, which has been referenced through this section.
Credit rating and agencies methodologies
TfL has a strategic aim to as far as possible maintain their credit rating relative to that of the UK government. This is because a deterioration in credit rating is likely to affect TfL’s access to competitively priced sources of finance, increase pension contributions and trigger covenants in a number of finance contracts. Some of these effects have already been seen as a result of recent downgrades, which explicitly highlight liquidity as a key consideration going forward.
The major credit rating agencies set out a number of criteria regarding liquidity, and these directly link TfL’s credit rating to days’ cash on hand as a proportion of operating expenditure.
The latest methodology from S&P states that anything short of 60 days of unrestricted cash and undrawn committed facilities is classed as “highly vulnerable” in terms of liquidity.
Table 30: S&P Criteria
S&P Criteria Extremely Strong
Very Strong
Strong Adequate Vulnerable Highly Vulnerable
Unrestricted Days’ Cash on Hand
>800 800-400 400-250 250-120 120-60 <60
Moody’s also places a strong emphasis on cash, stating that Cash is the paramount resource mass transit systems have to meet expenses, cope with emergencies, and navigate business interruptions. Issuers with a lot of cash and cash equivalents are able to survive temporary disruptions and cash flow shortfalls without missing important payments. A low cash balance indicates poor flexibility to manage contingencies.34
It is clear there is a direct link between number of days of cash to cover operating expenditure and the stand-alone credit rating of TfL under both methodologies, and that 60 days is at the lower end of the rating agencies’ liquidity criteria.
Peer benchmarking
The independent advice commissioned by TfL found that from a group of transport peers including MTR (Hong Kong), MTA (New York), RATP (Paris), SNCF (France), EJRC (Japan) and Deutsche Bahn (Germany) the median days’ cash on hand as a proportion of operating expenditure was 96 days as at the latest annual reporting dates of December 2019 and March 2020.
The advice noted that from this group of peers, a cohort that has since released interim financial reports during the coronavirus pandemic including MTA, MTR, SNCF, EJRC and Deutsche Bahn, TfL has seen the largest drop in actual cash levels, a decrease of 25 per cent from pre-pandemic levels. Cash movements from pre-pandemic levels for the remainder of this cohort were MTR (-15 per cent), Deutsche Bahn (-7 per cent), SNCF (+7 per cent), MTA (+10 per cent) and EJRC (+120 per cent).
34 Moody’s Mass Transit Enterprises Methodology 2017, p.11
108
While being limited by the fact that the benchmarking analysis examined actual cash balances rather than minimum cash, the analysis suggests that most of TfL’s peers hold similar and, in some cases, higher levels of cash to TfL and also that TfL has seen one of the largest drops in cash following the coronavirus pandemic (-25 per cent).
Private sector liquidity management
The independent advice also noted that the approach to liquidity management in the private sector can vary significantly to that of the public sector, driven by a large number of objective and subjective factors including an organisation’s access to funding, sectors, working capital profile, risk profile, risk appetite and overall commercial strategy.
Notwithstanding the above, it was noted that one of the more common approaches to defining minimum liquidity requirements in the private sector is to hold sufficient liquidity in order to meet the day-to-day commitments of the business operations based on a defined rolling period forecast, typically a 13-week rolling forecast (or annual budget). This approach establishes a clear link between the cash flow forecasting process, annual budgeting process and cash funding levels required.
A key point to note is that “sufficient” liquidity is normally based on a combination of cash and financing facilities rather than just “cash on hand”. These private companies also typically have access to alternatives to cash via revolving credit facilities (‘RCF’) or other funding, such as commercial paper programmes.
Alternatives to cash
Based on the private sector analysis performed by the independent advice, it was evident that an RCF type of credit line is one of the most common facilities adopted by private companies as an integral part of their overall liquidity structure.
Due to the rating agencies’ preference for cash, fact that there are no difficulties in accessing a cash reserve in time of need, and fact that a cash reserve provides greater flexibility, the conclusion of the advice was that there are sound reasons for TfL continuing to hold cash rather than substituting this with an RCF. This is despite the cost of carry associated with cash.
Other alternatives to cash could include a form of Government stand-by facility, which depending on terms could potentially act as a substitute form of liquidity allowing TfL to reduce its minimum cash balances.
Conclusion regarding adequacy of reserves
In addition to having to cover the normal operational cash movements and any unexpected events, TfL needs to take into account a number of discrete and general uncertainties such as business interruptions (due to terrorism or industrial action); economic risks and supply chain risks (such as Brexit, ongoing unpredictability due to pandemic); financial or market liquidity shock threatening an ability to refinance commercial paper maturities (currently £600m); and TfL specific funding risks (such as Crossrail’s currently unfunded payments due over the next 18 months and downgrade risk due to performance and the need to post collateral).
The independent advice outlined above points to the fact that holding cash only at the minimum policy level would put TfL significantly below the international peers in the pre-pandemic environment, and the level of 90-100 days (£1.8bn-£2bn) is more in line with the peer group. While the comparison with the private sector companies provides useful context, it highlights significant differences in the approach to managing liquidity, driven by the commercial objectives of the private sector companies as well as different risk profile and appetite. This difference is also captured in the way rating agencies assess liquidity of mass transit entities, placing a strong emphasis on cash and linking it to annual operating costs, rather than net forecast cash requirement.
It is very important to note that while TfL has access to liquidity facilities, such as PWLB and the Commercial Paper programme, these cannot be used to fund operating cost shortfall and therefore are not a substitute for cash to cover longer term uncertainties. The statutory restrictions around prudent borrowing restrict TfL’s ability to react to a liquidity stress by building up liquidity from external sources. The cash buffer is TfL’s only way to deal with a wide range on short and long term uncertainties.
Debt and debt capacity
109
General considerations for affordability of debt
TfL has been increasingly focussed on the long term affordability and sustainability of its indebtedness given the reduction in central government grants, declining passenger numbers, lower cash balances and the overall uncertainty in economic outlook. The significant reduction to TfL’s revenues as a result of the coronavirus pandemic has further impacted affordability of existing borrowing as well as any potential future borrowing.
TfL considers a range of factors when assessing the affordability of debt, including the prudential borrowing framework and certain financial ratios. Affordability can vary over time depending on internal and external factors, such as the level and certainty of our funding streams, existing level of indebtedness and the overall economic environment.
When managing TfL’s borrowing, TfL is required to have regard to the Chartered Institute of Public Finance and Accountancy’s (CIPFA) Prudential Code, under which it must ensure all of its borrowing is prudent and sustainable. TfL must also take into account arrangements for the repayment of debt and consider the impact on overall fiscal sustainability. All borrowing must be for capital purposes.
Under the Local Government Act 2003, the Mayor is required to determine and keep under review how much money TfL can afford to borrow by setting an affordable limit, with borrowing above this level unlawful. As with other Local Authorities, the Government could make regulations as to when and how a determination of a borrowing limit should be made. Alternatively, they could impose a cap on the total level of borrowing if it is believed TfL is borrowing more than it can afford.
TfL’s considers a number of financial ratios that aim to assess its ability to service existing obligations; capacity to service near term liabilities from recurring revenues; any potential additional long term obligations; and capacity to repay debt over the long term. TfL regularly reviews the most appropriate metrics to use for this purpose, including by working with credit rating agencies to assess and evaluate the most relevant considerations.
Approach to debt in financial sustainability plan
In order to demonstrate financial sustainability over the long term, TfL must cover not only the financing costs, but also the debt principal repayments. To reach and maintain financial sustainability TfL will only be able to make debt repayments in the years in which it generates an operating surplus. The amount of debt that can be repaid will be dependent on the size of any operating surplus and the cash available to make repayments, while maintaining the appropriate level of cash reserves.
TfL expects to have £13.1bn of direct debt outstanding at 31 March 2021, with maturities between 2021 and a weighted average tenor of approximately 17 years.
For financial modelling purposes TfL has assumed annual debt repayments based on a 35-year amortisation period, which reflects the long life of infrastructure assets that are usually funded by borrowing. This results in a repayment of approximately £370m in each year, provided no further borrowing is undertaken during this period. In practice, these amounts are likely to vary based on the operating surplus, available cash and existing debt maturity profile, which can be restructured to allow more even annual repayments.
TfL is not planning to undertake any additional borrowing in the next few years due to affordability constraints. It is also unlikely TfL will have sufficient resources to make any principal repayments earlier than 2024/25, including under the £750m facility with the Secretary of State for Transport for the purposes of the Crossrail project, which would need to be refinanced or restructured. In addition to direct borrowing, some other financial obligations are considered as debt for affordability purposes, including leases, Public Private Partnerships and Private Finance Initiative arrangements.
Under the new structure proposed in Chapter 4, TfL envisages that the ongoing affordability of debt will be determined by key financial outputs and will become more defined. Debt capacity and debt limits will no longer be set annually but will form part of the review at the start of the control period, and subject to stable business performance and affordability principles. New debt could be raised to fund investment in transport infrastructure with total amounts being agreed in advance for multi-year control periods.
Recommendation 15

110
TfL believes that it would not be prudent to reduce TfL’s cash balances below the levels that it held prior to the coronavirus pandemic. TfL therefore proposes to begin to re-build essential cash reserves to near pre-pandemic levels and pay down debt in order to ensure TfL has the financial resilience that corresponds to TfL’s size and risk profile. As part of this process, TfL also propose to discuss with Government the restructuring of the repayment profile of the TfL Crossrail £750m Loan.

111
6. Bridging the gap This Chapter sets out the target dates for the implementation of TfL’s recommendations for helping the organisation to achieve financial sustainability over the medium to long term. It also summarises the expected activities required over the course of 2021 to take these recommendations forward.
Introduction The submission of the Financial Sustainability Plan on 11 January 2021 is the start, not the end of the process
for putting TfL on a more sustainable financial footing.
This Chapter brings together the recommendations from Chapters 4 and 5. These represent the interventions and actions TfL needs to take to move towards financial sustainability for actioning after the Financial Sustainability Plan is submitted.
Section 6.2 identifies the initial target dates for the implementation of each recommendation, while Section 6.4 sets out an indicative timeline of key activities over the course of 2021, including milestones and key decision points.
In practice, TfL expects that this plan will evolve and link into a coordinated programme of work, that will require significant levels of resource to take forward.
Target dates for implementation of recommendations Table 31: Indicative target dates for implementation of financial sustainability recommendations
A proposed new Funding Structural Framework for TfL
1. TfL recommends that TfL work with Government and the Mayor over the coming months to define an appropriate public service obligation for the continuity of transport provision in London.
2. TfL recommends that TfL work with Government and the Mayor over the coming months to explore the potential and options for enhancements to TfL’s structural funding framework including multi-year “control periods”, in order to enable TfL to act as an economic and efficient operator and provide a framework for the organisation acceptable to all parties that will facilitate sufficient certainty of funding to enable TfL to reach financial sustainability.
September 2021 (target date by
which exploration of options is to be
completed)
Service levels
3. TfL has already included a number of service level adjustments and reductions in the current base line forecasts. In addition to these, TfL also now proposes an additional 4 per cent reduction in the kilometres operated by the bus network by 2024/25.
July 2021 (target date by which an initial assessment of
bus service capacity changes
will have been completed)
4. TfL should continue to work closely with Government to monitor demand patterns. Over the longer term, service reductions or re-shaping may need to be considered as post-pandemic travel patterns emerge, particularly under the “London declines” demand scenario. However, consideration should be given to the fact that over-crowding is likely to be less acceptable for the travelling public in a post-pandemic
October 2021 (target date for
further review in light of future
demand)
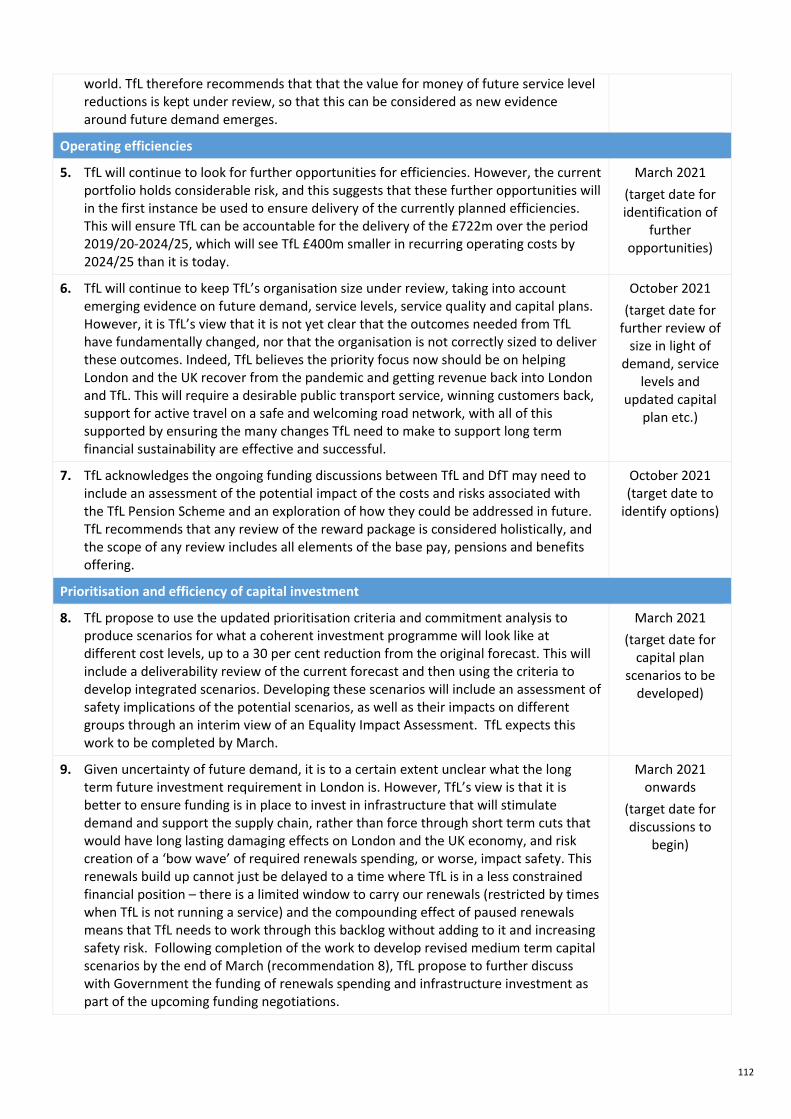
112
world. TfL therefore recommends that that the value for money of future service level reductions is kept under review, so that this can be considered as new evidence around future demand emerges.
Operating efficiencies
5. TfL will continue to look for further opportunities for efficiencies. However, the current portfolio holds considerable risk, and this suggests that these further opportunities will in the first instance be used to ensure delivery of the currently planned efficiencies. This will ensure TfL can be accountable for the delivery of the £722m over the period 2019/20-2024/25, which will see TfL £400m smaller in recurring operating costs by 2024/25 than it is today.
March 2021 (target date for identification of
further opportunities)
6. TfL will continue to keep TfL’s organisation size under review, taking into account emerging evidence on future demand, service levels, service quality and capital plans. However, it is TfL’s view that it is not yet clear that the outcomes needed from TfL have fundamentally changed, nor that the organisation is not correctly sized to deliver these outcomes. Indeed, TfL believes the priority focus now should be on helping London and the UK recover from the pandemic and getting revenue back into London and TfL. This will require a desirable public transport service, winning customers back, support for active travel on a safe and welcoming road network, with all of this supported by ensuring the many changes TfL need to make to support long term financial sustainability are effective and successful.
October 2021 (target date for
further review of size in light of
demand, service levels and
updated capital plan etc.)
7. TfL acknowledges the ongoing funding discussions between TfL and DfT may need to include an assessment of the potential impact of the costs and risks associated with the TfL Pension Scheme and an exploration of how they could be addressed in future. TfL recommends that any review of the reward package is considered holistically, and the scope of any review includes all elements of the base pay, pensions and benefits offering.
October 2021 (target date to
identify options)
Prioritisation and efficiency of capital investment
8. TfL propose to use the updated prioritisation criteria and commitment analysis to produce scenarios for what a coherent investment programme will look like at different cost levels, up to a 30 per cent reduction from the original forecast. This will include a deliverability review of the current forecast and then using the criteria to develop integrated scenarios. Developing these scenarios will include an assessment of safety implications of the potential scenarios, as well as their impacts on different groups through an interim view of an Equality Impact Assessment. TfL expects this work to be completed by March.
March 2021 (target date for
capital plan scenarios to be
developed)
9. Given uncertainty of future demand, it is to a certain extent unclear what the long term future investment requirement in London is. However, TfL’s view is that it is better to ensure funding is in place to invest in infrastructure that will stimulate demand and support the supply chain, rather than force through short term cuts that would have long lasting damaging effects on London and the UK economy, and risk creation of a ‘bow wave’ of required renewals spending, or worse, impact safety. This renewals build up cannot just be delayed to a time where TfL is in a less constrained financial position – there is a limited window to carry our renewals (restricted by times when TfL is not running a service) and the compounding effect of paused renewals means that TfL needs to work through this backlog without adding to it and increasing safety risk. Following completion of the work to develop revised medium term capital scenarios by the end of March (recommendation 8), TfL propose to further discuss with Government the funding of renewals spending and infrastructure investment as part of the upcoming funding negotiations.
March 2021 onwards
(target date for discussions to
begin)

113
10. TfL recognises that a robust, group-wide method of tracking capital efficiencies is a weakness and it proposes putting in place measures to fix this. TfL propose to embed new processes across the Investment Programme over the next few months, starting with the overall efficiency targets and process improvements outlined in this document. There is an opportunity through the TIES initiative to collaborate with Highways England and Network Rail to understand the methodologies for implementing capital efficiency programmes. This will allow successful methodologies and lessons learned to be shared to allow TfL to accelerate the implementation of the processes and meet targets quickly.
July 2021 (target date for
new processes to be embedded)
Commercial Development
11. Subject to understanding the appetite and constraints for Government in working in partnership with TTLP, TfL propose to develop and refine the capital structure options. This will include taking legal and financial advice, producing full value for money analyses, market-testing options, and reviewing the technical feasibility and accounting impacts.
July 2021 (target date for options to be developed)
Existing funding levers
12. TfL will take forward monitoring and evaluation of the temporary changes to the Congestion Charge. Any decision to implement changes on a more permanent basis would be subject to impact assessment, consultation and mayoral decision. TfL will also continue to prioritise the successful implementation of the expanded ULEZ in October 2021.
October 2021 (target date for implementation
of ULEZ)
13. As instructed by the Mayor, in the absence of Government allocating London’s VED, TfL will undertake a feasibility study of a charge for driving into London to address the traffic entering the Capital every day from vehicles registered outside London and consider the potential for such a scheme to be introduced in the future. At the same time TfL will continue to review existing charges across London and investigate the potential for new and more sophisticated technologies to be used to deliver a more integrated system.
September 2021 (target date for
completing feasibility study)
Other funding sources
14. It is for elected politicians to agree what the balance of funding streams are most appropriate. However, as set out in the comparator analysis in Chapter5, TfL considers that relative to other urban transport authorities, TfL is unusual in being so reliant on fare income. TfL proposes that TfL’s funding arrangements are reviewed to ensure suitable diversity and stability of funding. This could be coupled with revised governance arrangements and controls that provide Government with further comfort around efficiency, value for money and expenditure prioritisation in respect of any funding it is providing.
September 2021 (target date for
review of funding sources to be
complete)
Debt, liquidity and reserves
15. TfL proposes to begin to re-build essential cash reserves to near pre-pandemic levels and pay down debt in order to ensure TfL has the financial resilience that corresponds to TfL’s size and risk profile. As part of this process, TfL also propose to discuss with Government the restructuring of the repayment profile of the TfL Crossrail £750m Loan.
October 2021 (target date for
process to rebuild reserves and debt
repayment to commence)
114
Next steps We recognise that many of the proposals set out in this document will take time to develop and implement
and will require significant collaboration between the Government and the Mayor and TfL to ensure successful delivery. We are also aware of the course of the pandemic as we enter a second winter, and that the impact on TfL’s demand is not solvable in the short term by these proposals. A small number of the proposals are however solvable over the next few months, including further analysis of capital investment options. TfL will press ahead with the delivery of these to ensure it is set up to negotiate a sustainable funding deal. A timeline showing proposed next steps and delivery milestones is shown in Section 6.4.
The contents of this document show that in the medium term TfL can start to close the gap on net cost of operations excluding capital investment and some core renewals across all modes. On buses and streets, post 2023/24 the total funding gap is on average £300m per annum, assuming hypothecation of Business Rates Retention (BRR) and either VED retention or implementation of a Greater London Boundary Charge. However, there is a significant capital investment funding gap on Tube and Rail, where the required capital investments in rolling stock and signalling replacements are substantially more costly.
It is clear that for TfL to support Government in the delivery of its 10 point decarbonisation plans, and to be able to unlock modernisation and productivity improvements required across the ageing network, funding for enhancements and capital investment is required, with an average group position of £1.6bn average per annum additional funding required. Without this funding, TfL would lose out on playing its part in delivering Government objectives for building homes, creating jobs across the UK in sustainable and long standing industries, and making significant progress against Net Zero CO2 emissions by 2030.
The £1.6bn funding requirement could be achieved by the levers outlined by the London Finance Commissions and TfL’s Independent Review, including retention of VED or Value-added tax (VAT) for London, reformed council tax proposals, other property taxes including stamp duty and capital gains tax, land value capture for major new schemes, RUC above what is already assumed, or additional grant funding.
With appropriate upfront investment in its housing programme, TfL can maximise creation of value from existing land, which creates the ability to continue raising further capital in future and creating a surplus to reinvest in housing, transport and public services. This would also increase TfL’s ambition to deliver 2,000 homes per annum, or up to 50,000 homes over a 25-year period.
A reformed structure will be required for TfL to efficiently and economically deliver its ambitions and support the Government decarbonisation plans over the medium to long term. Introducing multi-year ‘control periods’ to give certainty of funding will enable better planning of services and projects. TfL also does not currently have agreement of a minimum service, which should urgently be agreed between the Mayor, Government and TfL.
Government support will be needed in 2022/23 and potentially beyond dependent on the speed with which the necessary funding schemes can be put in place. TfL’s proposal is therefore for the 2020 H2 funding arrangements to continue through 2021/22, including Government taking revenue risk and TfL taking cost risk. In the period between now and early March 2021 TfL and the Government should work to agree the £3.1bn funding needed for 2021/22 to ensure a settlement is in place ahead of the existing funding deal expiring. TfL, the Mayor and Government should then focus resource on working on a long-term solution from 2022/23 onwards, with the delivery of some of the proposals set out in this document. Similar to the 2020 H2 funding agreement, Government would take revenue risk until a stable demand projection is clear and public transport objectives are agreed.
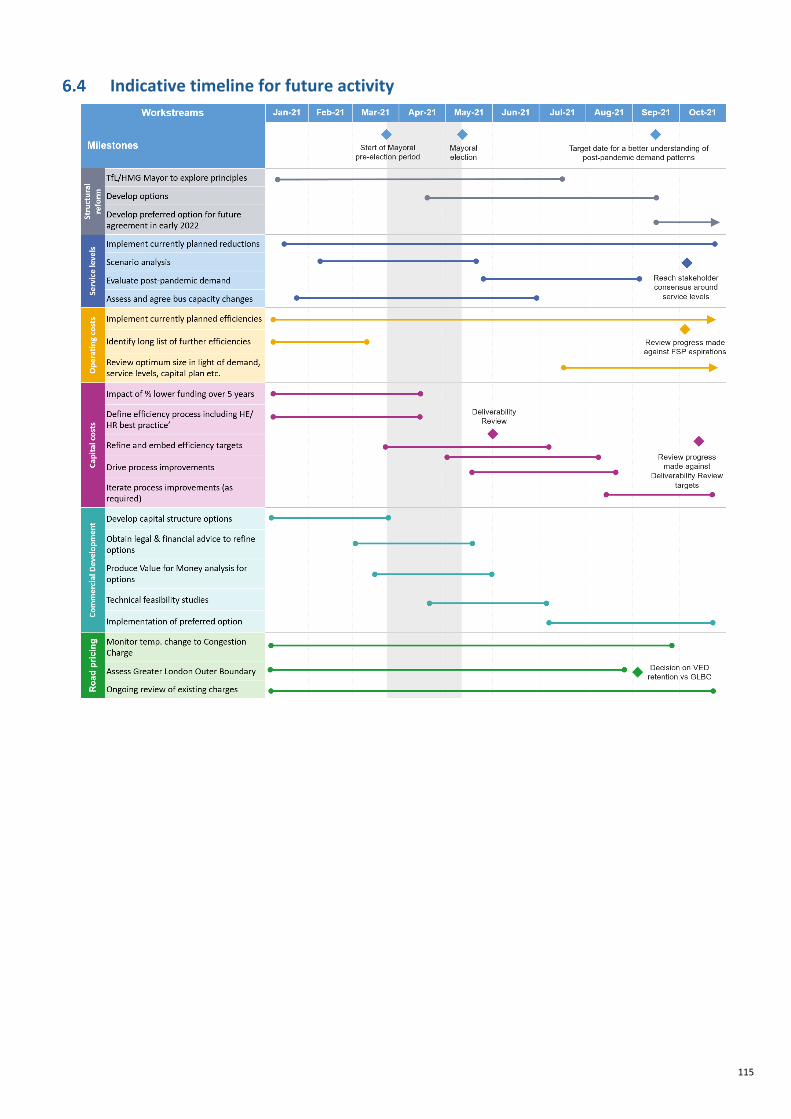
115
Indicative timeline for future activity