Embed Size (px)
Citation preview
FINANCIAL SUMMARY
FY2018 Third Quarter
(April 1, 2017 through December 31, 2017)
English translation from the original Japanese-language document
Cautionary Statement with Respect to Forward-Looking Statements
This report contains projections and other forward-looking statements that involve risks and uncertainties. Our use of the words “expect,” “anticipate,” “estimate,” “forecast,” “plan” and similar expressions is intended to identify such forward-looking statements. Projections and forward-looking statements are based on the current expectations and estimates of Toyota Industries Corporation and its Group companies regarding their plans, outlook, strategies and results for the future. All such projections and forward-looking statements are based on management’s assumptions and beliefs derived from the information available to it at the time of producing this report and are not guarantees of future performance. Toyota Industries corporation and its Group companies undertake no obligation to publicly update or revise any forward-looking statements, whether as a result of new information, future events or otherwise. Therefore, it is advised that you should not rely solely upon these projections and forward-looking statements in making your investment decisions. You should also be aware that certain risks and uncertainties could cause the actual results of Toyota Industries Corporation and its Group companies to differ materially from any projections or forward-looking statements discussed in this report. These risks and uncertainties include, but are not limited to, the following: 1) reliance on a small number of customers, 2) product development capabilities, 3) intellectual property rights, 4) product defects, 5) price competition, 6) reliance on suppliers of raw materials and components, 7) environmental regulations, 8) success or failure of strategic alliances with other companies, 9) exchange rate fluctuations, 10) share price fluctuations, 11) effects of disasters, power blackouts and other incidents, 12) latent risks associated with international activities and 13) retirement benefit liabilities.
February 2, 2018
FY2018 Third Quarter Consolidated Financial Results<IFRS>
(April 1, 2017 - December 31, 2017)
TOYOTA INDUSTRIES CORPORATION Stock exchange listings: Tokyo and Nagoya (Code number: 6201) (URL: https://www.toyota-industries.com/ )
Representative person: Akira Onishi, President, Member of the Board
Contact person: Kuniaki Matsumoto, General Manager of Accounting Department
(Tel. +81-(0)566-22-2511)
The expected date of submission of the quarterly report: February 13, 2018
The expected date of dividends payment: -
Additional documents to supplement quarterly financial results: Yes
Quarterly IR presentation: Yes (For analysts and professional investors)
(Amounts less than one million yen are omitted)
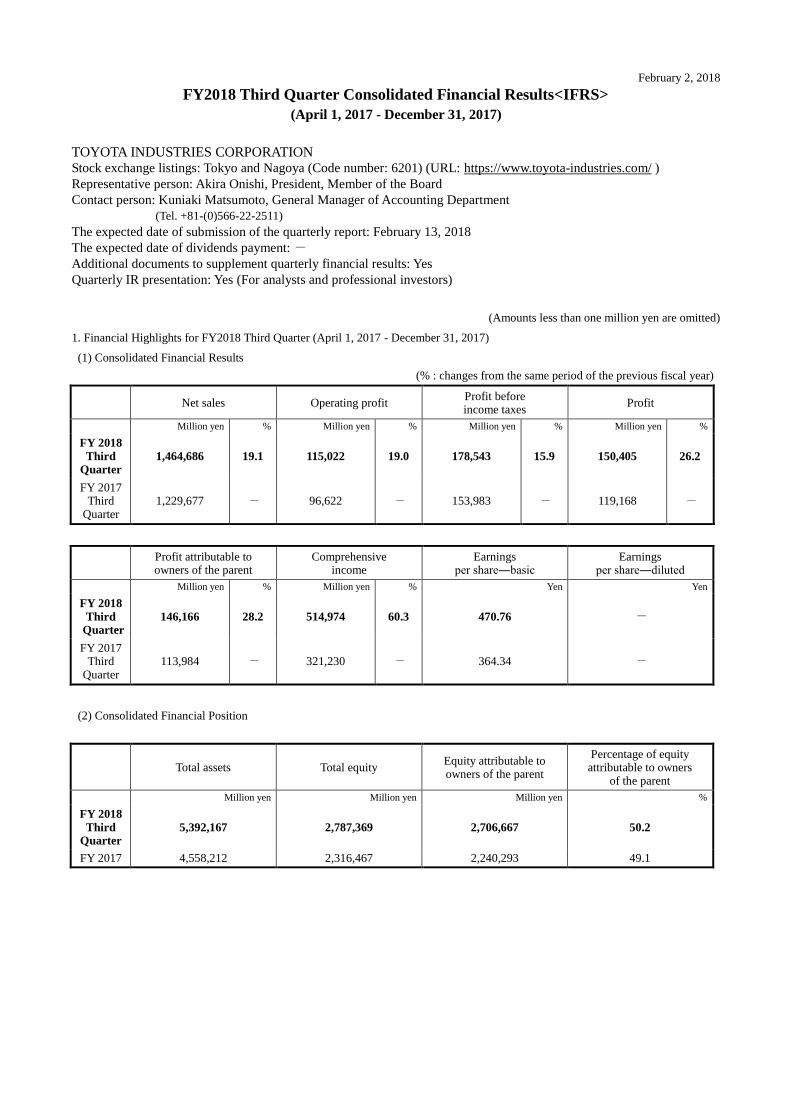
1. Financial Highlights for FY2018 Third Quarter (April 1, 2017 - December 31, 2017)
(1) Consolidated Financial Results
(% : changes from the same period of the previous fiscal year)
Net sales Operating profit Profit before income taxes
Profit
Million yen % Million yen % Million yen % Million yen %
FY 2018
Third Quarter
1,464,686 19.1 115,022 19.0 178,543 15.9 150,405 26.2
FY 2017 Third
Quarter 1,229,677 - 96,622 - 153,983 - 119,168 -
Profit attributable to owners of the parent
Comprehensive income
Earnings per share―basic
Earnings per share―diluted
Million yen % Million yen % Yen Yen
FY 2018
Third Quarter
146,166 28.2 514,974 60.3 470.76 -
FY 2017 Third
Quarter 113,984 - 321,230 - 364.34 -
(2) Consolidated Financial Position
Total assets Total equity Equity attributable to owners of the parent
Percentage of equity attributable to owners
of the parent
Million yen Million yen Million yen %
FY 2018
Third Quarter
5,392,167 2,787,369 2,706,667 50.2
FY 2017 4,558,212 2,316,467 2,240,293 49.1
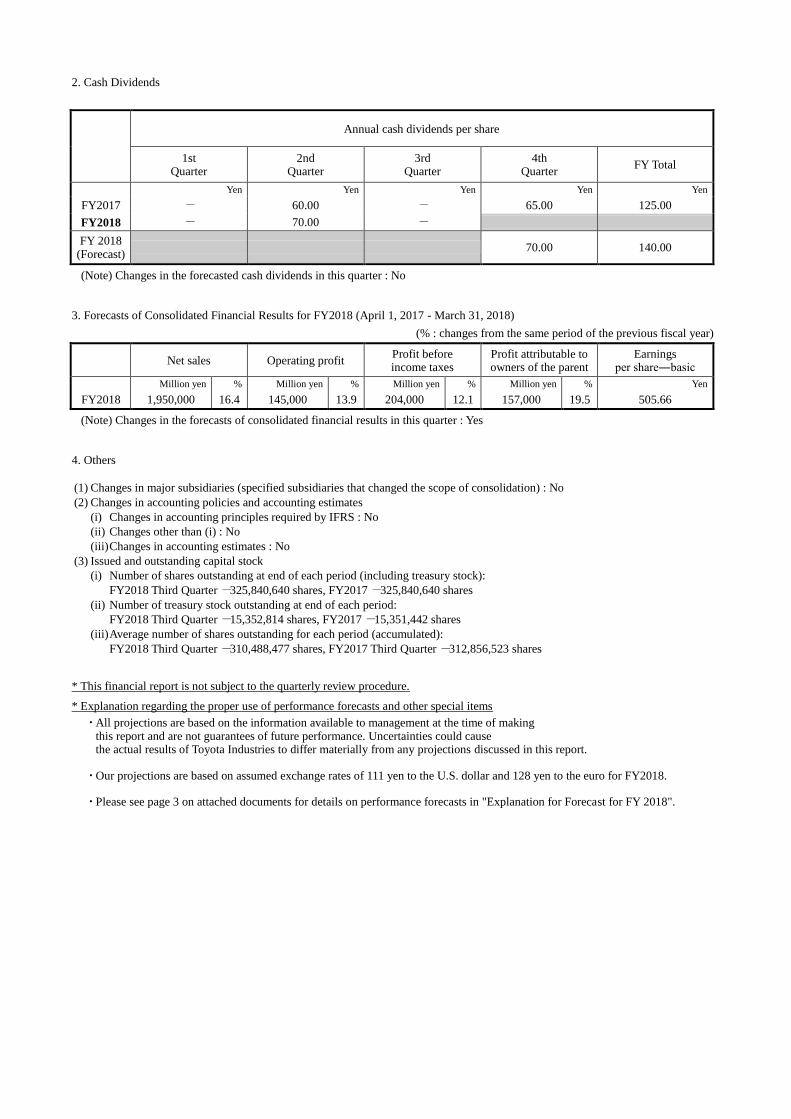
2. Cash Dividends
Annual cash dividends per share
1st Quarter
2nd Quarter
3rd Quarter
4th Quarter
FY Total
Yen Yen Yen Yen Yen
FY2017 - 60.00 - 65.00 125.00
FY2018 - 70.00 -
FY 2018 (Forecast)
70.00 140.00
(Note) Changes in the forecasted cash dividends in this quarter : No
3. Forecasts of Consolidated Financial Results for FY2018 (April 1, 2017 - March 31, 2018)
(% : changes from the same period of the previous fiscal year)
Net sales Operating profit Profit before income taxes
Profit attributable to owners of the parent
Earnings per share―basic
Million yen % Million yen % Million yen % Million yen % Yen
FY2018 1,950,000 16.4 145,000 13.9 204,000 12.1 157,000 19.5 505.66
(Note) Changes in the forecasts of consolidated financial results in this quarter : Yes
4. Others
(1) Changes in major subsidiaries (specified subsidiaries that changed the scope of consolidation) : No
(2) Changes in accounting policies and accounting estimates
(i) Changes in accounting principles required by IFRS : No
(ii) Changes other than (i) : No
(iii) Changes in accounting estimates : No
(3) Issued and outstanding capital stock
(i) Number of shares outstanding at end of each period (including treasury stock):
FY2018 Third Quarter -325,840,640 shares, FY2017 -325,840,640 shares
(ii) Number of treasury stock outstanding at end of each period:
FY2018 Third Quarter -15,352,814 shares, FY2017 -15,351,442 shares
(iii) Average number of shares outstanding for each period (accumulated):
FY2018 Third Quarter -310,488,477 shares, FY2017 Third Quarter -312,856,523 shares
* This financial report is not subject to the quarterly review procedure.
* Explanation regarding the proper use of performance forecasts and other special items
・ All projections are based on the information available to management at the time of making this report and are not guarantees of future performance. Uncertainties could cause the actual results of Toyota Industries to differ materially from any projections discussed in this report.
・ Our projections are based on assumed exchange rates of 111 yen to the U.S. dollar and 128 yen to the euro for FY2018.
・ Please see page 3 on attached documents for details on performance forecasts in "Explanation for Forecast for FY 2018".
― 1 ―
(Attached documents)
Contents
1. Explanation for Quarterly Financial Results ..........................................................................................
(1) Explanation for Business Results ..............................................................................................................
(2) Explanation for Financial Condition ..........................................................................................................
(3) Explanation for Forecast for FY2018 .........................................................................................................
2. Condensed Quarterly Consolidated Financial Statements ......................................................................
(1) Condensed Quarterly Consolidated Financial Position ...............................................................................................
(2) Condensed Quarterly Consolidated Statements of Profit or Loss and
Condensed Quarterly Consolidated Statements of Comprehensive Income ......................................................
(3) Condensed Quarterly Consolidated Statements of Changes in Equity .............................................................
(4) Note on Condensed Quarterly Consolidated Financial Statements ..................................................................
(Note on Premise of Going Concern) ......................................................................................................
(Note on Significant Changes in the Amount of Shareholders' Equity) ..........................................................
(Segment Information) ..........................................................................................................................
2
2
3
3
4
4
6
8
10
10
10
11
― 2 ―
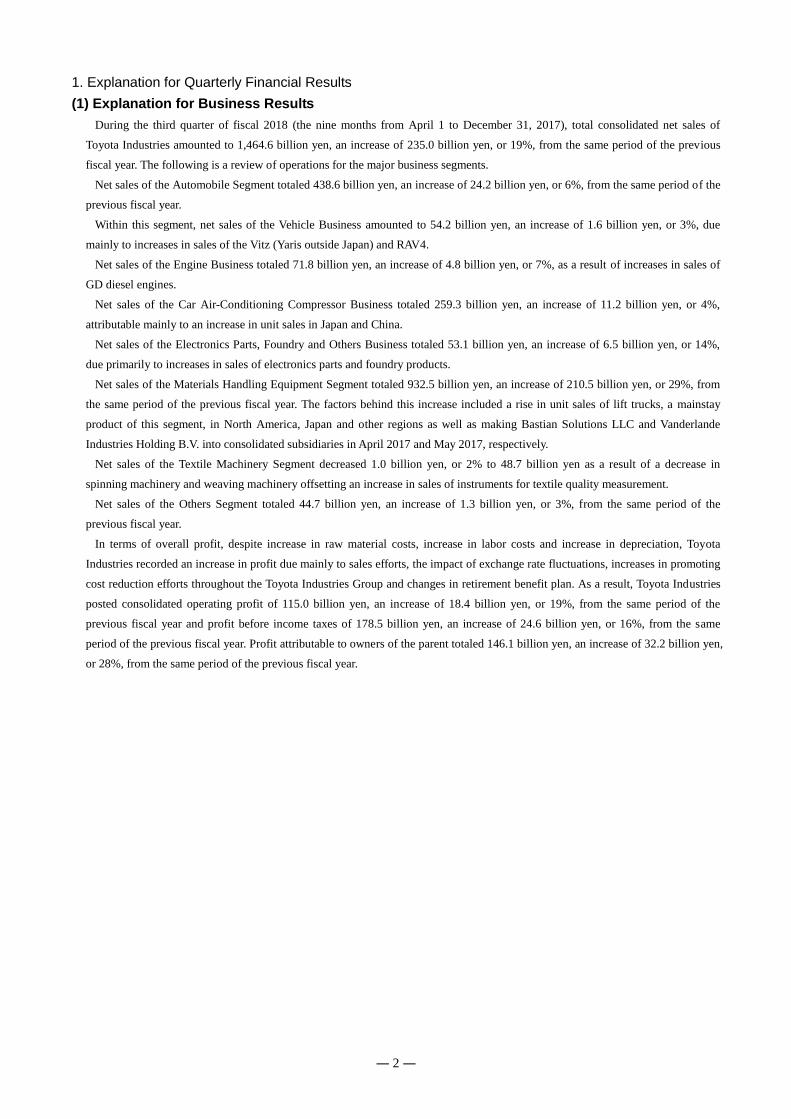
1. Explanation for Quarterly Financial Results
(1) Explanation for Business Results
During the third quarter of fiscal 2018 (the nine months from April 1 to December 31, 2017), total consolidated net sales of
Toyota Industries amounted to 1,464.6 billion yen, an increase of 235.0 billion yen, or 19%, from the same period of the previous
fiscal year. The following is a review of operations for the major business segments.
Net sales of the Automobile Segment totaled 438.6 billion yen, an increase of 24.2 billion yen, or 6%, from the same period of the
previous fiscal year.
Within this segment, net sales of the Vehicle Business amounted to 54.2 billion yen, an increase of 1.6 billion yen, or 3%, due
mainly to increases in sales of the Vitz (Yaris outside Japan) and RAV4.
Net sales of the Engine Business totaled 71.8 billion yen, an increase of 4.8 billion yen, or 7%, as a result of increases in sales of
GD diesel engines.
Net sales of the Car Air-Conditioning Compressor Business totaled 259.3 billion yen, an increase of 11.2 billion yen, or 4%,
attributable mainly to an increase in unit sales in Japan and China.
Net sales of the Electronics Parts, Foundry and Others Business totaled 53.1 billion yen, an increase of 6.5 billion yen, or 14%,
due primarily to increases in sales of electronics parts and foundry products.
Net sales of the Materials Handling Equipment Segment totaled 932.5 billion yen, an increase of 210.5 billion yen, or 29%, from
the same period of the previous fiscal year. The factors behind this increase included a rise in unit sales of lift trucks, a mainstay
product of this segment, in North America, Japan and other regions as well as making Bastian Solutions LLC and Vanderlande
Industries Holding B.V. into consolidated subsidiaries in April 2017 and May 2017, respectively.
Net sales of the Textile Machinery Segment decreased 1.0 billion yen, or 2% to 48.7 billion yen as a result of a decrease in
spinning machinery and weaving machinery offsetting an increase in sales of instruments for textile quality measurement.
Net sales of the Others Segment totaled 44.7 billion yen, an increase of 1.3 billion yen, or 3%, from the same period of the
previous fiscal year.
In terms of overall profit, despite increase in raw material costs, increase in labor costs and increase in depreciation, Toyota
Industries recorded an increase in profit due mainly to sales efforts, the impact of exchange rate fluctuations, increases in promoting
cost reduction efforts throughout the Toyota Industries Group and changes in retirement benefit plan. As a result, Toyota Industries
posted consolidated operating profit of 115.0 billion yen, an increase of 18.4 billion yen, or 19%, from the same period of the
previous fiscal year and profit before income taxes of 178.5 billion yen, an increase of 24.6 billion yen, or 16%, from the same
period of the previous fiscal year. Profit attributable to owners of the parent totaled 146.1 billion yen, an increase of 32.2 billion yen,
or 28%, from the same period of the previous fiscal year.
― 3 ―
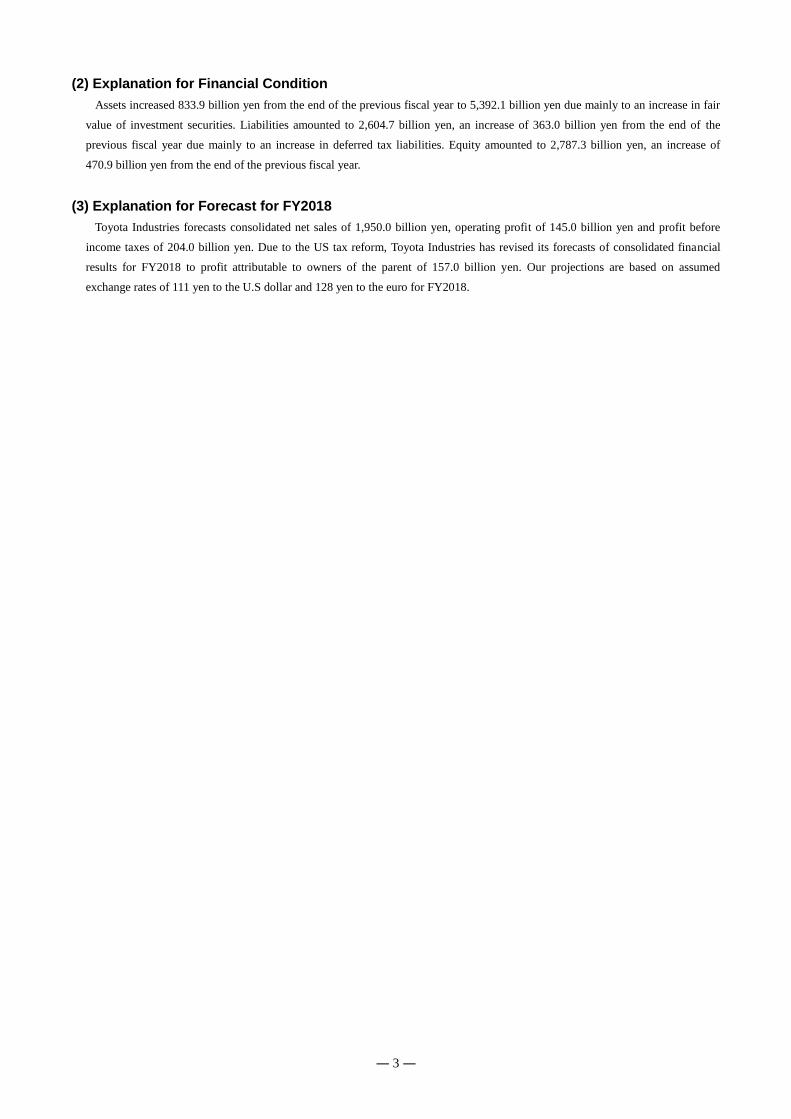
(2) Explanation for Financial Condition
Assets increased 833.9 billion yen from the end of the previous fiscal year to 5,392.1 billion yen due mainly to an increase in fair
value of investment securities. Liabilities amounted to 2,604.7 billion yen, an increase of 363.0 billion yen from the end of the
previous fiscal year due mainly to an increase in deferred tax liabilities. Equity amounted to 2,787.3 billion yen, an increase of
470.9 billion yen from the end of the previous fiscal year.
(3) Explanation for Forecast for FY2018
Toyota Industries forecasts consolidated net sales of 1,950.0 billion yen, operating profit of 145.0 billion yen and profit before
income taxes of 204.0 billion yen. Due to the US tax reform, Toyota Industries has revised its forecasts of consolidated financial
results for FY2018 to profit attributable to owners of the parent of 157.0 billion yen. Our projections are based on assumed
exchange rates of 111 yen to the U.S dollar and 128 yen to the euro for FY2018.
― 4 ―
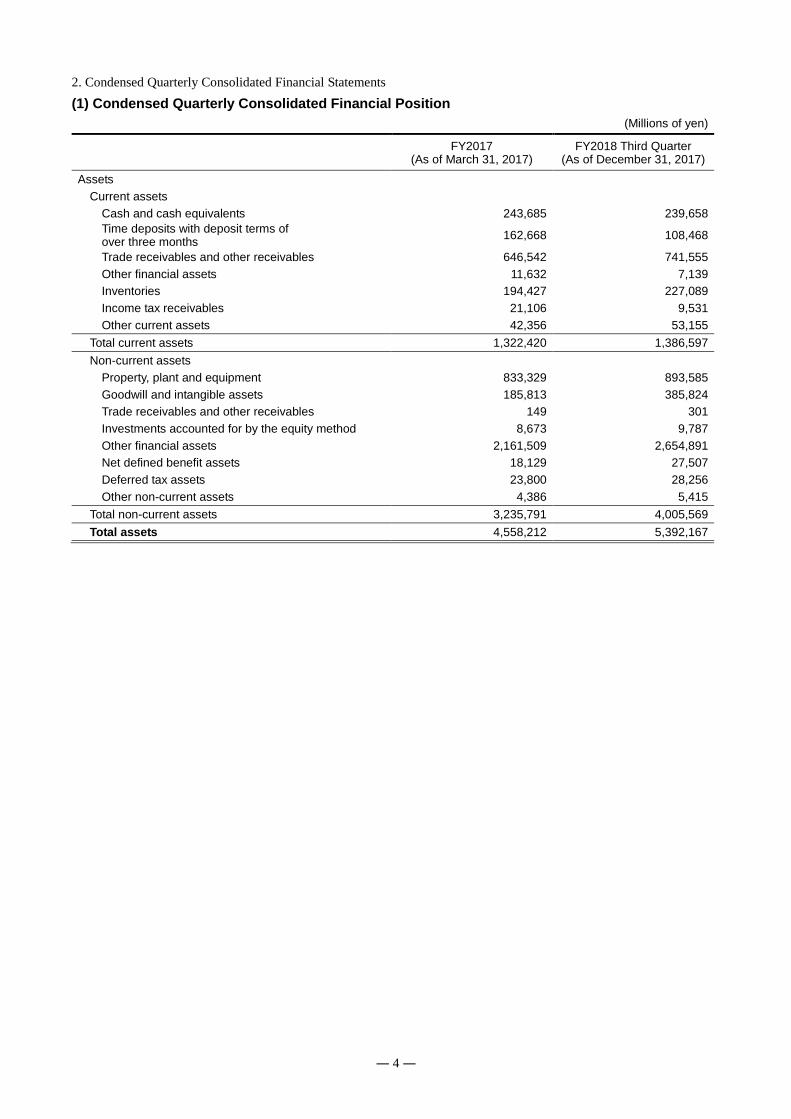
2. Condensed Quarterly Consolidated Financial Statements
(1) Condensed Quarterly Consolidated Financial Position
(Millions of yen)
FY2017
(As of March 31, 2017) FY2018 Third Quarter
(As of December 31, 2017)
Assets
Current assets
Cash and cash equivalents 243,685 239,658
Time deposits with deposit terms of over three months
162,668 108,468
Trade receivables and other receivables 646,542 741,555
Other financial assets 11,632 7,139
Inventories 194,427 227,089
Income tax receivables 21,106 9,531
Other current assets 42,356 53,155
Total current assets 1,322,420 1,386,597
Non-current assets
Property, plant and equipment 833,329 893,585
Goodwill and intangible assets 185,813 385,824
Trade receivables and other receivables 149 301
Investments accounted for by the equity method 8,673 9,787
Other financial assets 2,161,509 2,654,891
Net defined benefit assets 18,129 27,507
Deferred tax assets 23,800 28,256
Other non-current assets 4,386 5,415
Total non-current assets 3,235,791 4,005,569
Total assets 4,558,212 5,392,167
― 5 ―
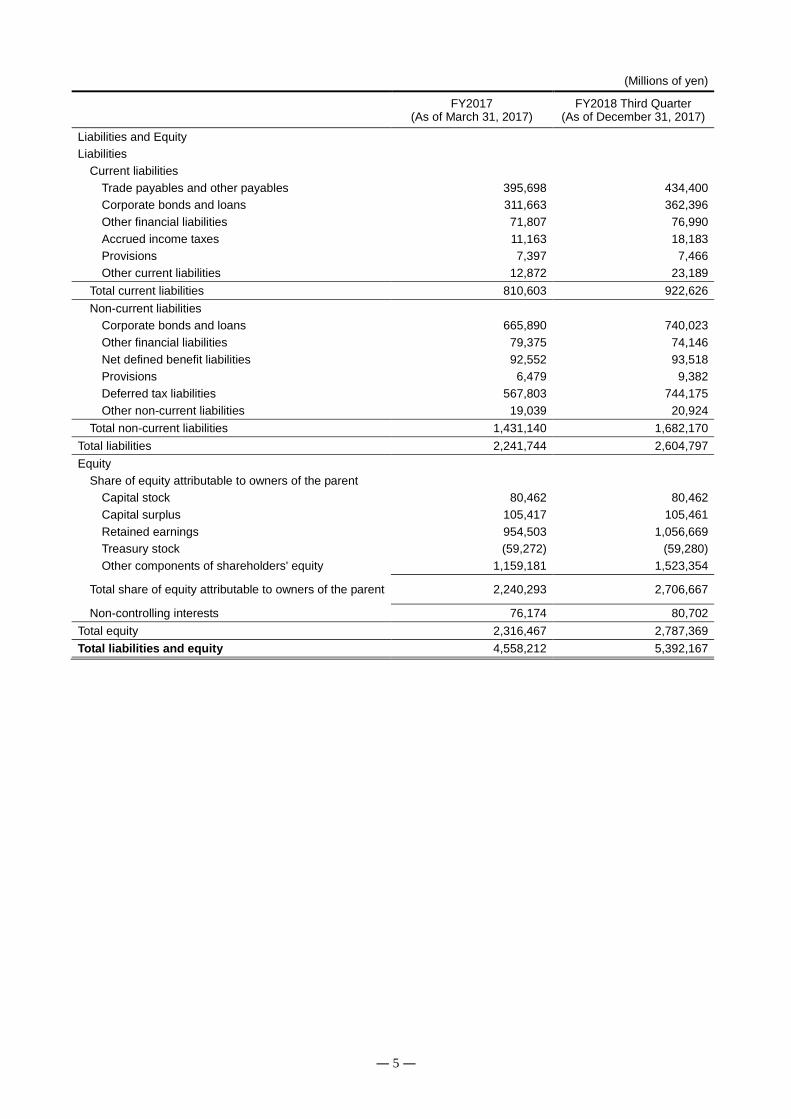
(Millions of yen)
FY2017
(As of March 31, 2017) FY2018 Third Quarter
(As of December 31, 2017)
Liabilities and Equity
Liabilities
Current liabilities
Trade payables and other payables 395,698 434,400
Corporate bonds and loans 311,663 362,396
Other financial liabilities 71,807 76,990
Accrued income taxes 11,163 18,183
Provisions 7,397 7,466
Other current liabilities 12,872 23,189
Total current liabilities 810,603 922,626
Non-current liabilities
Corporate bonds and loans 665,890 740,023
Other financial liabilities 79,375 74,146
Net defined benefit liabilities 92,552 93,518
Provisions 6,479 9,382
Deferred tax liabilities 567,803 744,175
Other non-current liabilities 19,039 20,924
Total non-current liabilities 1,431,140 1,682,170
Total liabilities 2,241,744 2,604,797
Equity
Share of equity attributable to owners of the parent
Capital stock 80,462 80,462
Capital surplus 105,417 105,461
Retained earnings 954,503 1,056,669
Treasury stock (59,272) (59,280)
Other components of shareholders' equity 1,159,181 1,523,354
Total share of equity attributable to owners of the parent 2,240,293 2,706,667
Non-controlling interests 76,174 80,702
Total equity 2,316,467 2,787,369
Total liabilities and equity 4,558,212 5,392,167
― 6 ―
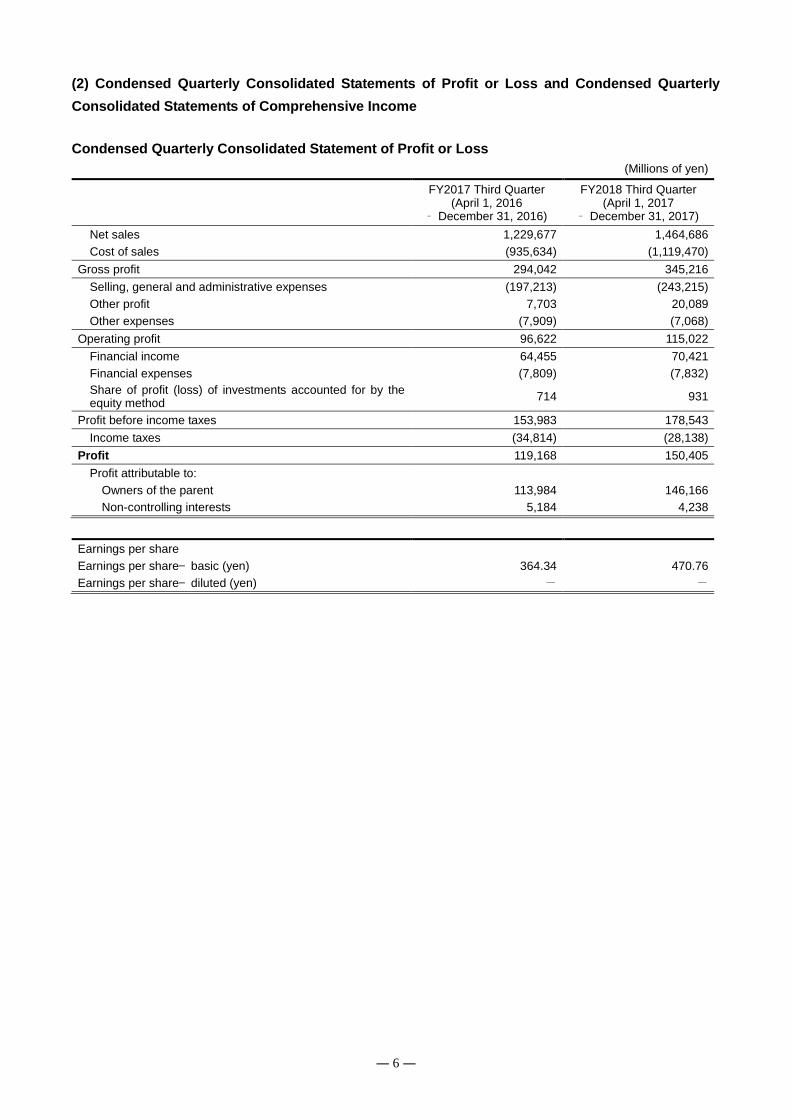
(2) Condensed Quarterly Consolidated Statements of Profit or Loss and Condensed Quarterly
Consolidated Statements of Comprehensive Income
Condensed Quarterly Consolidated Statement of Profit or Loss
(Millions of yen)
FY2017 Third Quarter
(April 1, 2016 – December 31, 2016)
FY2018 Third Quarter (April 1, 2017
– December 31, 2017)
Net sales 1,229,677 1,464,686
Cost of sales (935,634) (1,119,470)
Gross profit 294,042 345,216
Selling, general and administrative expenses (197,213) (243,215)
Other profit 7,703 20,089
Other expenses (7,909) (7,068)
Operating profit 96,622 115,022
Financial income 64,455 70,421
Financial expenses (7,809) (7,832)
Share of profit (loss) of investments accounted for by the equity method
714 931
Profit before income taxes 153,983 178,543
Income taxes (34,814) (28,138)
Profit 119,168 150,405
Profit attributable to:
Owners of the parent 113,984 146,166
Non-controlling interests 5,184 4,238
Earnings per share
Earnings per share— basic (yen) 364.34 470.76
Earnings per share— diluted (yen) - -
― 7 ―
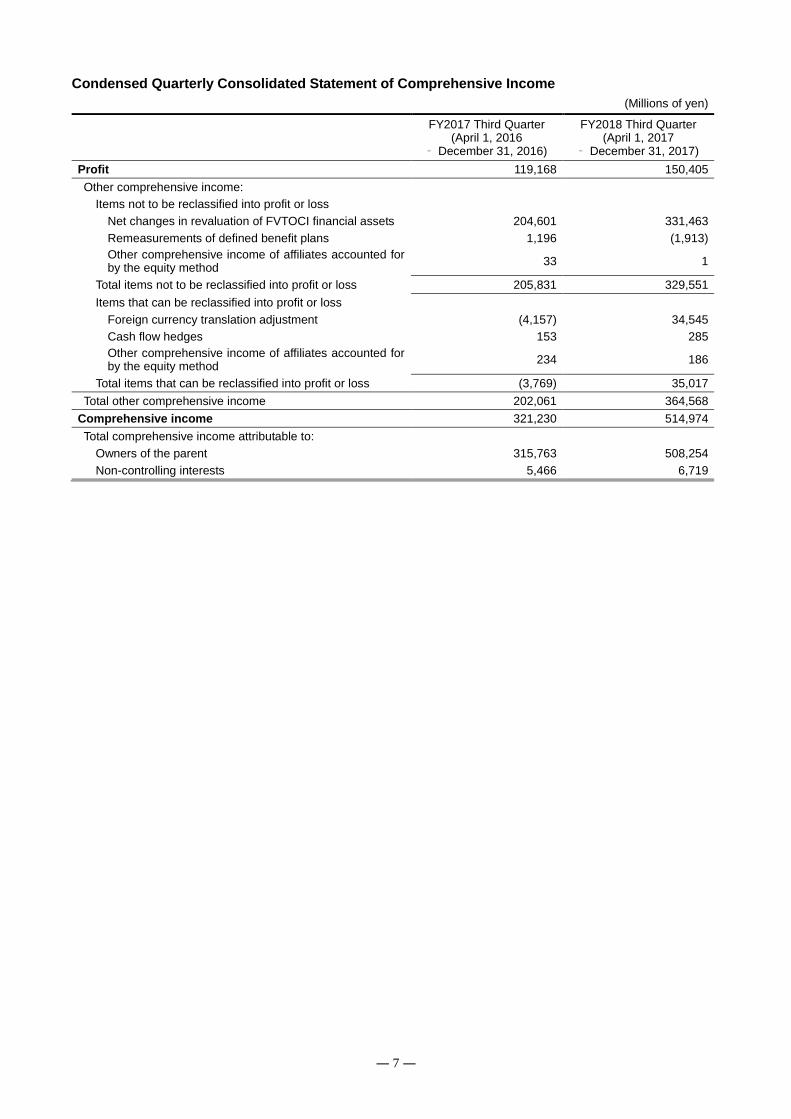
Condensed Quarterly Consolidated Statement of Comprehensive Income
(Millions of yen)
FY2017 Third Quarter
(April 1, 2016 – December 31, 2016)
FY2018 Third Quarter (April 1, 2017
– December 31, 2017)
Profit 119,168 150,405
Other comprehensive income:
Items not to be reclassified into profit or loss
Net changes in revaluation of FVTOCI financial assets 204,601 331,463
Remeasurements of defined benefit plans 1,196 (1,913)
Other comprehensive income of affiliates accounted for by the equity method
33 1
Total items not to be reclassified into profit or loss 205,831 329,551
Items that can be reclassified into profit or loss
Foreign currency translation adjustment (4,157) 34,545
Cash flow hedges 153 285
Other comprehensive income of affiliates accounted for by the equity method
234 186
Total items that can be reclassified into profit or loss (3,769) 35,017
Total other comprehensive income 202,061 364,568
Comprehensive income 321,230 514,974
Total comprehensive income attributable to:
Owners of the parent 315,763 508,254
Non-controlling interests 5,466 6,719
― 8 ―
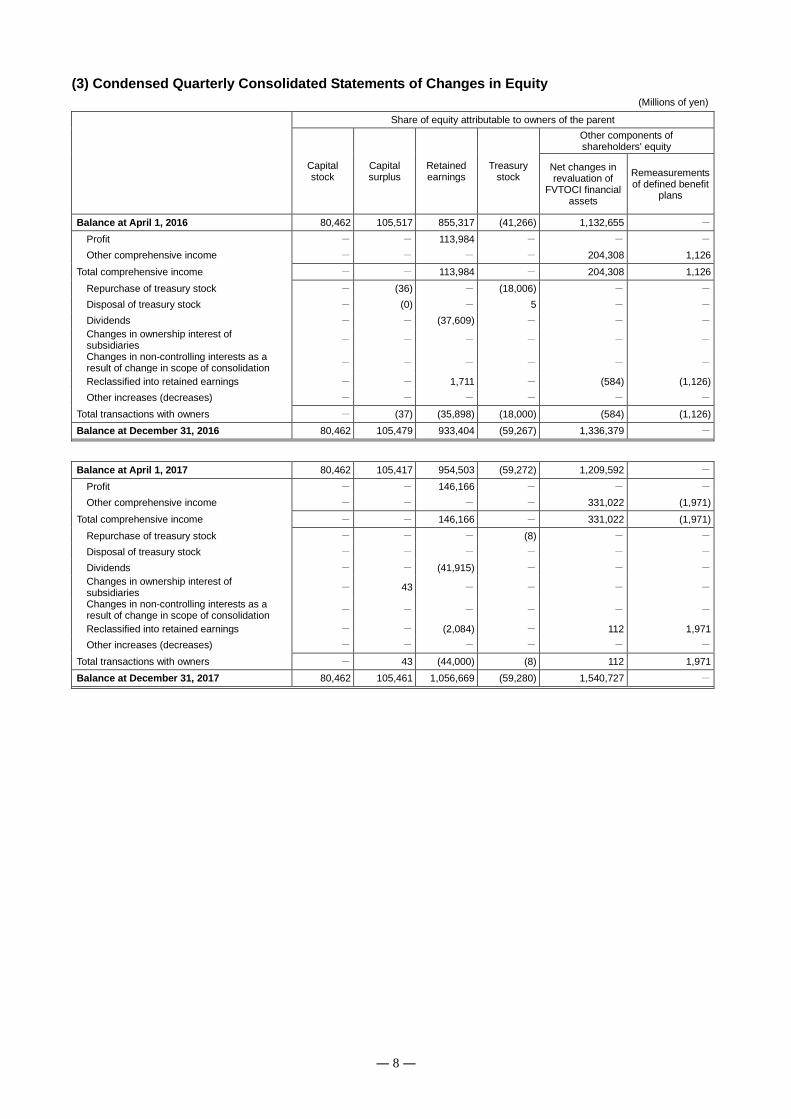
(3) Condensed Quarterly Consolidated Statements of Changes in Equity
(Millions of yen)
Share of equity attributable to owners of the parent
Capital stock
Capital surplus
Retained earnings
Treasury stock
Other components of shareholders' equity
Net changes in revaluation of
FVTOCI financial assets
Remeasurements of defined benefit
plans
Balance at April 1, 2016 80,462 105,517 855,317 (41,266) 1,132,655 -
Profit - - 113,984 - - -
Other comprehensive income - - - - 204,308 1,126
Total comprehensive income - - 113,984 - 204,308 1,126
Repurchase of treasury stock - (36) - (18,006) - -
Disposal of treasury stock - (0) - 5 - -
Dividends - - (37,609) - - -
Changes in ownership interest of subsidiaries
- - - - - -
Changes in non-controlling interests as a result of change in scope of consolidation
- - - - - -
Reclassified into retained earnings - - 1,711 - (584) (1,126)
Other increases (decreases) - - - - - -
Total transactions with owners - (37) (35,898) (18,000) (584) (1,126)
Balance at December 31, 2016 80,462 105,479 933,404 (59,267) 1,336,379 -
Balance at April 1, 2017 80,462 105,417 954,503 (59,272) 1,209,592 -
Profit - - 146,166 - - -
Other comprehensive income - - - - 331,022 (1,971)
Total comprehensive income - - 146,166 - 331,022 (1,971)
Repurchase of treasury stock - - - (8) - -
Disposal of treasury stock - - - - - -
Dividends - - (41,915) - - -
Changes in ownership interest of subsidiaries
- 43 - - - -
Changes in non-controlling interests as a result of change in scope of consolidation
- - - - - -
Reclassified into retained earnings - - (2,084) - 112 1,971
Other increases (decreases) - - - - - -
Total transactions with owners - 43 (44,000) (8) 112 1,971
Balance at December 31, 2017 80,462 105,461 1,056,669 (59,280) 1,540,727 -
― 9 ―
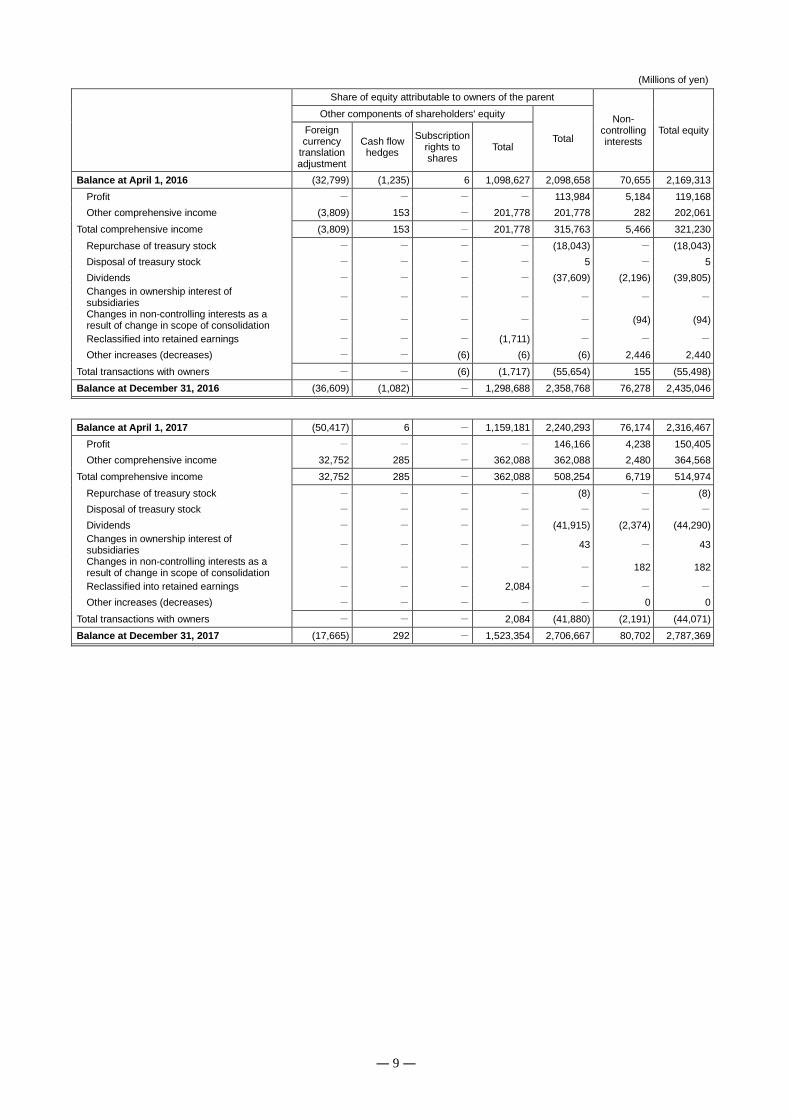
(Millions of yen)
Share of equity attributable to owners of the parent
Non-controlling interests
Total equity
Other components of shareholders' equity
Total Foreign currency
translation adjustment
Cash flow hedges
Subscription rights to shares
Total
Balance at April 1, 2016 (32,799) (1,235) 6 1,098,627 2,098,658 70,655 2,169,313
Profit - - - - 113,984 5,184 119,168
Other comprehensive income (3,809) 153 - 201,778 201,778 282 202,061
Total comprehensive income (3,809) 153 - 201,778 315,763 5,466 321,230
Repurchase of treasury stock - - - - (18,043) - (18,043)
Disposal of treasury stock - - - - 5 - 5
Dividends - - - - (37,609) (2,196) (39,805)
Changes in ownership interest of subsidiaries
- - - - - - -
Changes in non-controlling interests as a result of change in scope of consolidation
- - - - - (94) (94)
Reclassified into retained earnings - - - (1,711) - - -
Other increases (decreases) - - (6) (6) (6) 2,446 2,440
Total transactions with owners - - (6) (1,717) (55,654) 155 (55,498)
Balance at December 31, 2016 (36,609) (1,082) - 1,298,688 2,358,768 76,278 2,435,046
Balance at April 1, 2017 (50,417) 6 - 1,159,181 2,240,293 76,174 2,316,467
Profit - - - - 146,166 4,238 150,405
Other comprehensive income 32,752 285 - 362,088 362,088 2,480 364,568
Total comprehensive income 32,752 285 - 362,088 508,254 6,719 514,974
Repurchase of treasury stock - - - - (8) - (8)
Disposal of treasury stock - - - - - - -
Dividends - - - - (41,915) (2,374) (44,290)
Changes in ownership interest of subsidiaries
- - - - 43 - 43
Changes in non-controlling interests as a result of change in scope of consolidation
- - - - - 182 182
Reclassified into retained earnings - - - 2,084 - - -
Other increases (decreases) - - - - - 0 0
Total transactions with owners - - - 2,084 (41,880) (2,191) (44,071)
Balance at December 31, 2017 (17,665) 292 - 1,523,354 2,706,667 80,702 2,787,369
― 10 ―
(4) Note on Condensed Quarterly Consolidated Financial Statements
(Note on Premise of Going Concern) : No
(Note on Significant Changes in the Amount of Shareholders' Equity)
During the Third quarter of fiscal 2018 (the nine months from April 1 to December 31, 2017), Toyota Industries paid
dividends of 41,915 million yen from retained earnings.
― 11 ―
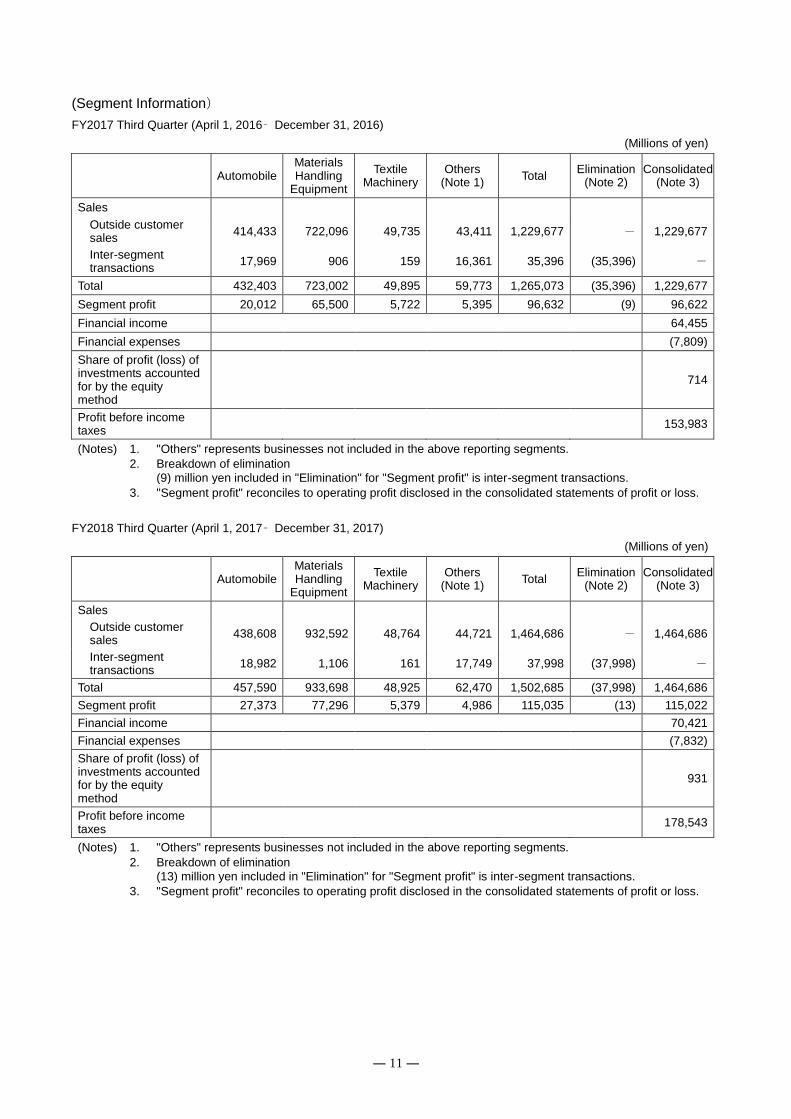
(Segment Information)
FY2017 Third Quarter (April 1, 2016– December 31, 2016)
(Millions of yen)
Automobile Materials Handling
Equipment
Textile Machinery
Others (Note 1)
Total Elimination
(Note 2) Consolidated
(Note 3)
Sales
Outside customer sales
414,433 722,096 49,735 43,411 1,229,677 - 1,229,677
Inter-segment transactions
17,969 906 159 16,361 35,396 (35,396) -
Total 432,403 723,002 49,895 59,773 1,265,073 (35,396) 1,229,677
Segment profit 20,012 65,500 5,722 5,395 96,632 (9) 96,622
Financial income 64,455
Financial expenses (7,809)
Share of profit (loss) of investments accounted for by the equity method
714
Profit before income taxes
153,983
(Notes) 1. "Others" represents businesses not included in the above reporting segments.
2. Breakdown of elimination
(9) million yen included in "Elimination" for "Segment profit" is inter-segment transactions.
3. "Segment profit" reconciles to operating profit disclosed in the consolidated statements of profit or loss.
FY2018 Third Quarter (April 1, 2017– December 31, 2017)
(Millions of yen)
Automobile Materials Handling
Equipment
Textile Machinery
Others (Note 1)
Total Elimination
(Note 2) Consolidated
(Note 3)
Sales
Outside customer sales
438,608 932,592 48,764 44,721 1,464,686 - 1,464,686
Inter-segment transactions
18,982 1,106 161 17,749 37,998 (37,998) -
Total 457,590 933,698 48,925 62,470 1,502,685 (37,998) 1,464,686
Segment profit 27,373 77,296 5,379 4,986 115,035 (13) 115,022
Financial income 70,421
Financial expenses (7,832)
Share of profit (loss) of investments accounted for by the equity method
931
Profit before income taxes
178,543
(Notes) 1. "Others" represents businesses not included in the above reporting segments.
2. Breakdown of elimination
(13) million yen included in "Elimination" for "Segment profit" is inter-segment transactions.
3. "Segment profit" reconciles to operating profit disclosed in the consolidated statements of profit or loss.


![[Overview of the consolidated financial results]...[Overview of the consolidated financial results] We posted revenue of 4,527.1 billion yen, up 2.6 billion yen from the previous year,](https://img.pdfslide.us/doc/110x75/5e2c1adca539961b0e2c7a89/overview-of-the-consolidated-financial-results-overview-of-the-consolidated.jpg)