Embed Size (px)
Citation preview
FINANCIAL SUMMARY
FY2017
(April 1, 2016 through March 31, 2017)
English translation from the original Japanese-language document
Cautionary Statement with Respect to Forward-Looking Statements This report contains projections and other forward-looking statements that involve risks and uncertainties. Our use of the words “expect,” “anticipate,” “estimate,” “forecast,” “plan” and similar expressions is intended to identify such forward-looking statements. Projections and forward-looking statements are based on the current expectations and estimates of Toyota Industries Corporation and its Group companies regarding their plans, outlook, strategies and results for the future. All such projections and forward-looking statements are based on management’s assumptions and beliefs derived from the information available to it at the time of producing this report and are not guarantees of future performance. Toyota Industries corporation and its Group companies undertake no obligation to publicly update or revise any forward-looking statements, whether as a result of new information, future events or otherwise. Therefore, it is advised that you should not rely solely upon these projections and forward-looking statements in making your investment decisions. You should also be aware that certain risks and uncertainties could cause the actual results of Toyota Industries Corporation and its Group companies to differ materially from any projections or forward-looking statements discussed in this report. These risks and uncertainties include, but are not limited to, the following: 1) reliance on a small number of customers, 2) product development capabilities, 3) intellectual property rights, 4) product defects, 5) price competition, 6) reliance on suppliers of raw materials and components, 7) environmental regulations, 8) success or failure of strategic alliances with other companies, 9) exchange rate fluctuations, 10) share price fluctuations, 11) effects of disasters, power blackouts and other incidents, 12) latent risks associated with international activities and 13) retirement benefit liabilities.
April 28, 2017
FY2017 Consolidated Financial Results <Japanese GAAP>
(April 1, 2016 - March 31, 2017)
TOYOTA INDUSTRIES CORPORATIONStock exchange listings: Tokyo and Nagoya (Code number: 6201) (URL: https://www.toyota-industries.com/ )
Representative person: Akira Onishi, President
Contact person: Kuniaki Matsumoto, General Manager of Accounting Department
(Tel. +81-(0)566-22-2511)
The expected date of the Ordinary General Meeting of Shareholders: Jun 9, 2017
The expected date of submission of the securities report: Jun 23, 2017
The expected date of dividends payment: Jun 12, 2017
Additional documents to supplement quarterly financial results: Yes
IR presentation: Yes (For analysts and professional investors)
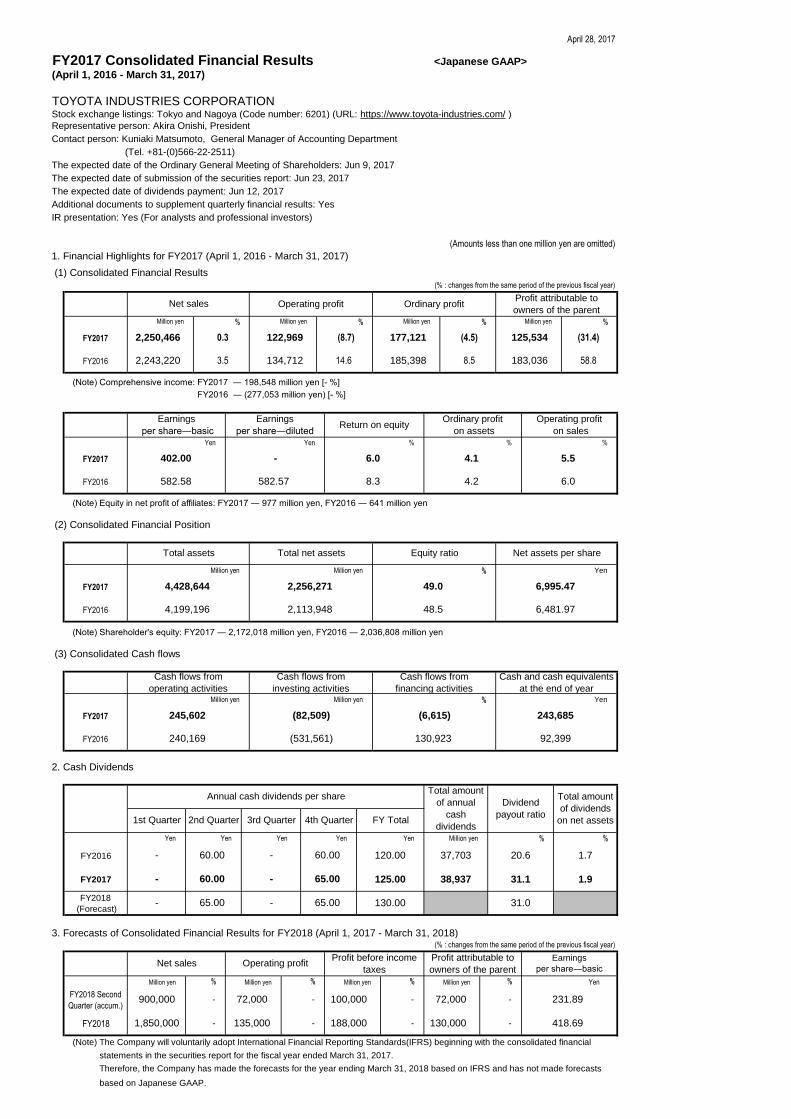
(Amounts less than one million yen are omitted)
1. Financial Highlights for FY2017 (April 1, 2016 - March 31, 2017)
(1) Consolidated Financial Results
(% : changes from the same period of the previous fiscal year)
% % % %
FY2017
FY2016
(Note) Comprehensive income: FY2017 ― 198,548 million yen [- %]
(Note) Comprehensive income: FY2016 ― (277,053 million yen) [- %]
Yen Yen % % %
FY2017
FY2016
(Note) Equity in net profit of affiliates: FY2017 ― 977 million yen, FY2016 ― 641 million yen
(2) Consolidated Financial Position
Million yen Million yen % Yen
FY2017
FY2016
(Note) Shareholder's equity: FY2017 ― 2,172,018 million yen, FY2016 ― 2,036,808 million yen
(3) Consolidated Cash flows
Million yen Million yen % Yen
FY2017
FY2016
2. Cash Dividends
Yen Yen Yen Yen Yen Million yen % %
FY2016
FY2017
FY2018
(Forecast)
3. Forecasts of Consolidated Financial Results for FY2018 (April 1, 2017 - March 31, 2018)(% : changes from the same period of the previous fiscal year)
Million yen % Million yen % Million yen % Million yen % Yen
FY2018 Second
Quarter (accum.)
FY2018
(Note) The Company will voluntarily adopt International Financial Reporting Standards(IFRS) beginning with the consolidated financial
(Note) statements in the securities report for the fiscal year ended March 31, 2017.
(Note) Therefore, the Company has made the forecasts for the year ending March 31, 2018 based on IFRS and has not made forecasts
(Note) based on Japanese GAAP.
Cash flows from
operating activities
Cash flows from
investing activities
Cash flows from
financing activities
Cash and cash equivalents
at the end of year
245,602 (82,509) (6,615) 243,685
240,169 (531,561) 130,923 92,399
135,000 188,000
-
-
100,000- -
Operating profit
on sales
5.5
6.0
Net assets per share
6,995.47
Return on equity
6.0
8.3
Ordinary profit
on assets
4.1
4.2
49.0
Equity ratio
6,481.9748.5
Annual cash dividends per shareTotal amount
of annual
cash
dividends
4,428,644
4,199,196
2,256,271
2,113,948
Profit attributable to
owners of the parent
134,712 185,398 183,036
Million yen Million yen Million yen
125,534177,121
58.8
(31.4)(8.7) (4.5)
14.6 8.5
Ordinary profitOperating profit
Total assets Total net assets
Net sales
582.58 582.57
402.00 -
Million yen
2,243,220
0.3
Earnings
per share―diluted
3.5
Earnings
per share―basic
122,9692,250,466
FY Total
60.00 - 60.00 120.00 37,703 20.6 1.7
- 60.00 - 65.00 125.00 38,937 31.1 1.9
-
Dividend
payout ratio
Total amount
of dividends
on net assets1st Quarter 2nd Quarter 3rd Quarter 4th Quarter
-
- 65.00 - 65.00 130.00 31.0
Profit attributable to
owners of the parentNet sales Operating profit
130,000- -
Earnings
per share―basic
Profit before income
taxes
418.69
72,000 231.89-900,000 72,000
1,850,000
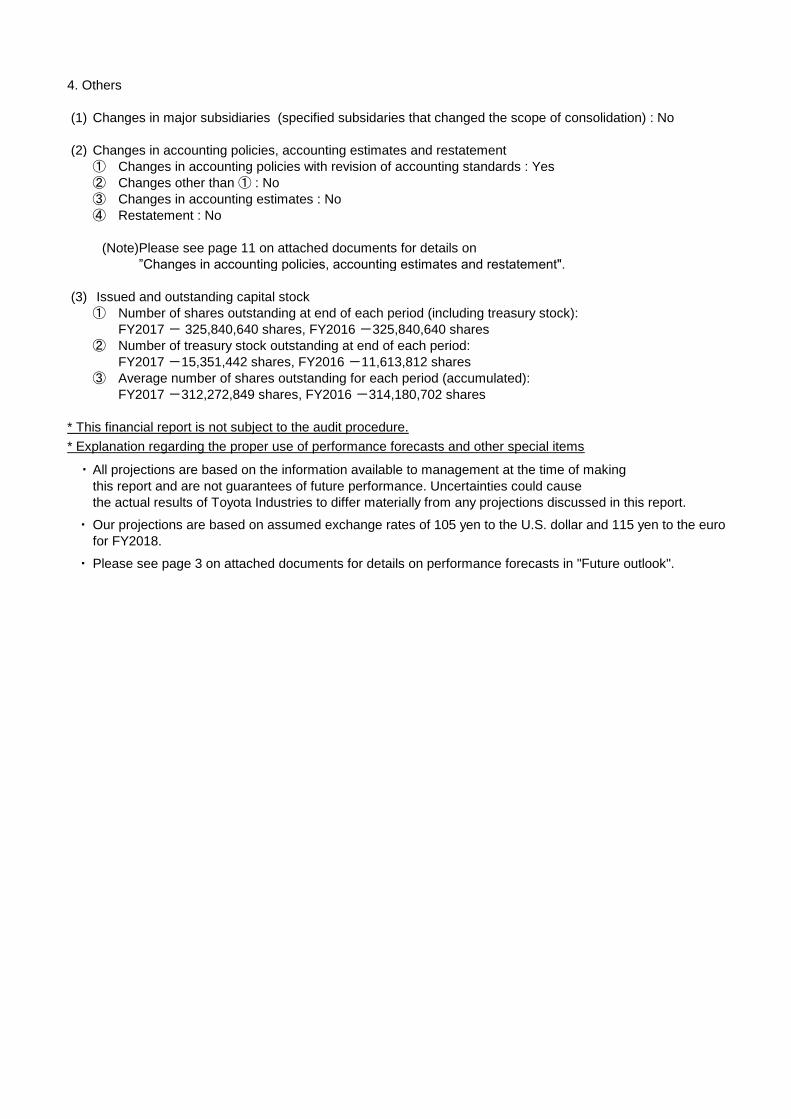
4. Others
(1) Changes in major subsidiaries (specified subsidaries that changed the scope of consolidation) : No
(2)
① Changes in accounting policies with revision of accounting standards : Yes
② Changes other than ① : No
③ Changes in accounting estimates : No
④ Restatement : No
(Note)Please see page 11 on attached documents for details on
(Note)”Changes in accounting policies, accounting estimates and restatement".
(3) Issued and outstanding capital stock
① Number of shares outstanding at end of each period (including treasury stock):
FY2017 - 325,840,640 shares, FY2016 -325,840,640 shares
② Number of treasury stock outstanding at end of each period:
FY2017 -15,351,442 shares, FY2016 -11,613,812 shares
③ Average number of shares outstanding for each period (accumulated):
FY2017 -312,272,849 shares, FY2016 -314,180,702 shares
* This financial report is not subject to the audit procedure.
* Explanation regarding the proper use of performance forecasts and other special items
・ All projections are based on the information available to management at the time of making
・ Our projections are based on assumed exchange rates of 105 yen to the U.S. dollar and 115 yen to the euro
for FY2018.
・ Please see page 3 on attached documents for details on performance forecasts in "Future outlook".
Changes in accounting policies, accounting estimates and restatement
the actual results of Toyota Industries to differ materially from any projections discussed in this report.
this report and are not guarantees of future performance. Uncertainties could cause
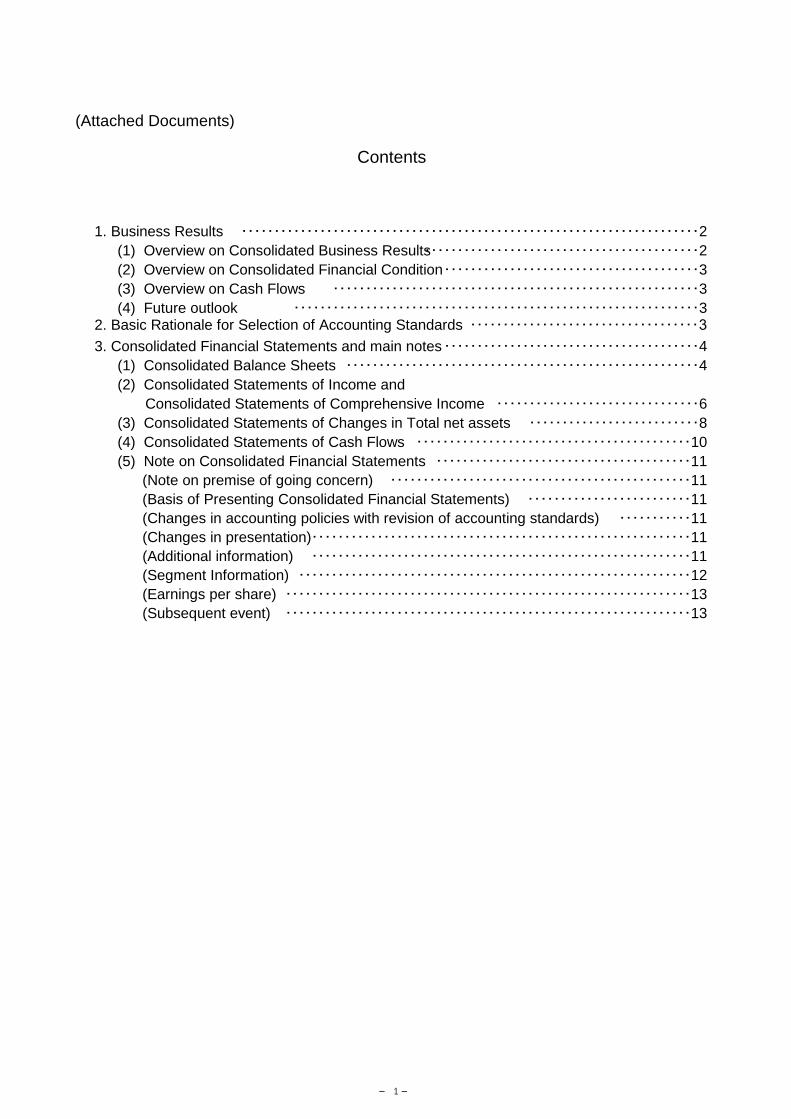
(Attached Documents)
1. Business Results ・・・・・・・・・・・・・・・・・・・・・・・・・・・・・・・・・・・・・・・・・・・・・・・・・・・・・・・・・・・・・・・・・・・・・・2
(1) Overview on Consolidated Business Results・・・・・・・・・・・・・・・・・・・・・・・・・・・・・・・・・・・・・・・・・・2
(2) Overview on Consolidated Financial Condition・・・・・・・・・・・・・・・・・・・・・・・・・・・・・・・・・・・・・・・3
(3) Overview on Cash Flows ・・・・・・・・・・・・・・・・・・・・・・・・・・・・・・・・・・・・・・・・・・・・・・・・・・・・・・・・3
(4) Future outlook ・・・・・・・・・・・・・・・・・・・・・・・・・・・・・・・・・・・・・・・・・・・・・・・・・・・・・・・・・・・・・・32. Basic Rationale for Selection of Accounting Standards ・・・・・・・・・・・・・・・・・・・・・・・・・・・・・・・・・・・3
3. Consolidated Financial Statements and main notes・・・・・・・・・・・・・・・・・・・・・・・・・・・・・・・・・・・・・・・4
(1) Consolidated Balance Sheets ・・・・・・・・・・・・・・・・・・・・・・・・・・・・・・・・・・・・・・・・・・・・・・・・・・・・・・4
(2) Consolidated Statements of Income and
'Consolidated Statements of Comprehensive Income ・・・・・・・・・・・・・・・・・・・・・・・・・・・・・・・6
(3) Consolidated Statements of Changes in Total net assets ・・・・・・・・・・・・・・・・・・・・・・・・・・8
(4) Consolidated Statements of Cash Flows ・・・・・・・・・・・・・・・・・・・・・・・・・・・・・・・・・・・・・・・・・・10
(5) Note on Consolidated Financial Statements ・・・・・・・・・・・・・・・・・・・・・・・・・・・・・・・・・・・・・・・11
(Note on premise of going concern) ・・・・・・・・・・・・・・・・・・・・・・・・・・・・・・・・・・・・・・・・・・・・・・11
(Basis of Presenting Consolidated Financial Statements) ・・・・・・・・・・・・・・・・・・・・・・・・・11
(Changes in accounting policies with revision of accounting standards) ・・・・・・・・・・・11
(Changes in presentation)・・・・・・・・・・・・・・・・・・・・・・・・・・・・・・・・・・・・・・・・・・・・・・・・・・・・・・・・・・11
(Additional information) ・・・・・・・・・・・・・・・・・・・・・・・・・・・・・・・・・・・・・・・・・・・・・・・・・・・・・・・・・・11
(Segment Information) ・・・・・・・・・・・・・・・・・・・・・・・・・・・・・・・・・・・・・・・・・・・・・・・・・・・・・・・・・・・・12
(Earnings per share) ・・・・・・・・・・・・・・・・・・・・・・・・・・・・・・・・・・・・・・・・・・・・・・・・・・・・・・・・・・・・・・13
(Subsequent event) ・・・・・・・・・・・・・・・・・・・・・・・・・・・・・・・・・・・・・・・・・・・・・・・・・・・・・・・・・・・・・・13
Contents
― 1 ―
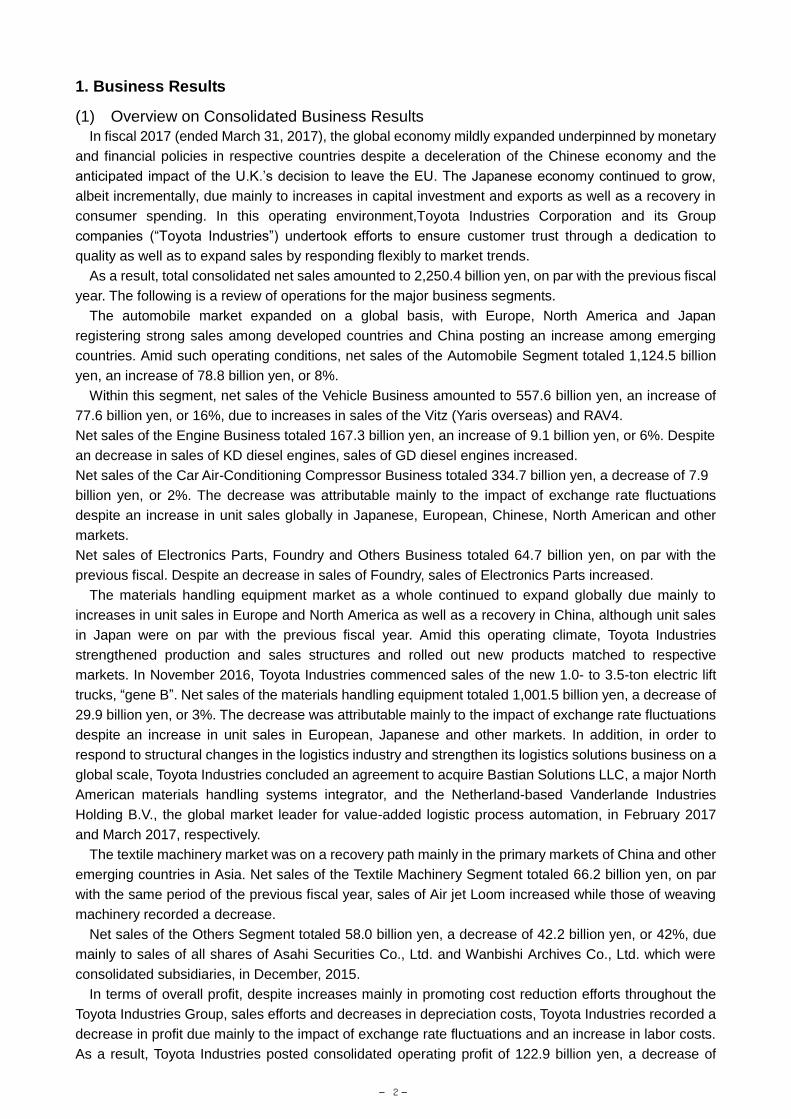
1. Business Results (1) Overview on Consolidated Business Results
In fiscal 2017 (ended March 31, 2017), the global economy mildly expanded underpinned by monetary
and financial policies in respective countries despite a deceleration of the Chinese economy and the
anticipated impact of the U.K.’s decision to leave the EU. The Japanese economy continued to grow,
albeit incrementally, due mainly to increases in capital investment and exports as well as a recovery in
consumer spending. In this operating environment,Toyota Industries Corporation and its Group
companies (“Toyota Industries”) undertook efforts to ensure customer trust through a dedication to
quality as well as to expand sales by responding flexibly to market trends.
As a result, total consolidated net sales amounted to 2,250.4 billion yen, on par with the previous fiscal
year. The following is a review of operations for the major business segments.
The automobile market expanded on a global basis, with Europe, North America and Japan
registering strong sales among developed countries and China posting an increase among emerging
countries. Amid such operating conditions, net sales of the Automobile Segment totaled 1,124.5 billion
yen, an increase of 78.8 billion yen, or 8%.
Within this segment, net sales of the Vehicle Business amounted to 557.6 billion yen, an increase of
77.6 billion yen, or 16%, due to increases in sales of the Vitz (Yaris overseas) and RAV4.
Net sales of the Engine Business totaled 167.3 billion yen, an increase of 9.1 billion yen, or 6%. Despite
an decrease in sales of KD diesel engines, sales of GD diesel engines increased.
Net sales of the Car Air-Conditioning Compressor Business totaled 334.7 billion yen, a decrease of 7.9
billion yen, or 2%. The decrease was attributable mainly to the impact of exchange rate fluctuations
despite an increase in unit sales globally in Japanese, European, Chinese, North American and other
markets.
Net sales of Electronics Parts, Foundry and Others Business totaled 64.7 billion yen, on par with the
previous fiscal. Despite an decrease in sales of Foundry, sales of Electronics Parts increased.
The materials handling equipment market as a whole continued to expand globally due mainly to
increases in unit sales in Europe and North America as well as a recovery in China, although unit sales
in Japan were on par with the previous fiscal year. Amid this operating climate, Toyota Industries
strengthened production and sales structures and rolled out new products matched to respective
markets. In November 2016, Toyota Industries commenced sales of the new 1.0- to 3.5-ton electric lift
trucks, “gene B”. Net sales of the materials handling equipment totaled 1,001.5 billion yen, a decrease of
29.9 billion yen, or 3%. The decrease was attributable mainly to the impact of exchange rate fluctuations
despite an increase in unit sales in European, Japanese and other markets. In addition, in order to
respond to structural changes in the logistics industry and strengthen its logistics solutions business on a
global scale, Toyota Industries concluded an agreement to acquire Bastian Solutions LLC, a major North
American materials handling systems integrator, and the Netherland-based Vanderlande Industries
Holding B.V., the global market leader for value-added logistic process automation, in February 2017
and March 2017, respectively.
The textile machinery market was on a recovery path mainly in the primary markets of China and other
emerging countries in Asia. Net sales of the Textile Machinery Segment totaled 66.2 billion yen, on par
with the same period of the previous fiscal year, sales of Air jet Loom increased while those of weaving
machinery recorded a decrease.
Net sales of the Others Segment totaled 58.0 billion yen, a decrease of 42.2 billion yen, or 42%, due
mainly to sales of all shares of Asahi Securities Co., Ltd. and Wanbishi Archives Co., Ltd. which were
consolidated subsidiaries, in December, 2015.
In terms of overall profit, despite increases mainly in promoting cost reduction efforts throughout the
Toyota Industries Group, sales efforts and decreases in depreciation costs, Toyota Industries recorded a
decrease in profit due mainly to the impact of exchange rate fluctuations and an increase in labor costs.
As a result, Toyota Industries posted consolidated operating profit of 122.9 billion yen, a decrease of
― 2 ―
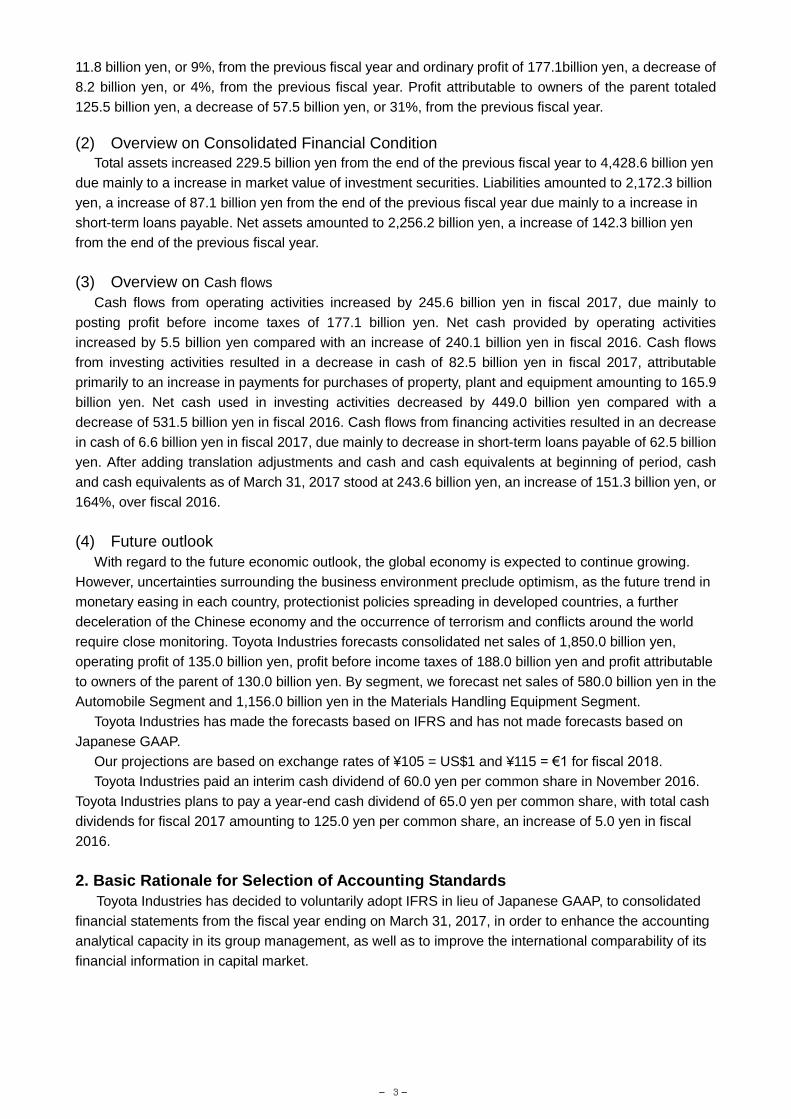
11.8 billion yen, or 9%, from the previous fiscal year and ordinary profit of 177.1billion yen, a decrease of
8.2 billion yen, or 4%, from the previous fiscal year. Profit attributable to owners of the parent totaled
125.5 billion yen, a decrease of 57.5 billion yen, or 31%, from the previous fiscal year.
(2) Overview on Consolidated Financial Condition
Total assets increased 229.5 billion yen from the end of the previous fiscal year to 4,428.6 billion yen
due mainly to a increase in market value of investment securities. Liabilities amounted to 2,172.3 billion
yen, a increase of 87.1 billion yen from the end of the previous fiscal year due mainly to a increase in
short-term loans payable. Net assets amounted to 2,256.2 billion yen, a increase of 142.3 billion yen
from the end of the previous fiscal year.
(3) Overview on Cash flows
Cash flows from operating activities increased by 245.6 billion yen in fiscal 2017, due mainly to
posting profit before income taxes of 177.1 billion yen. Net cash provided by operating activities
increased by 5.5 billion yen compared with an increase of 240.1 billion yen in fiscal 2016. Cash flows
from investing activities resulted in a decrease in cash of 82.5 billion yen in fiscal 2017, attributable
primarily to an increase in payments for purchases of property, plant and equipment amounting to 165.9
billion yen. Net cash used in investing activities decreased by 449.0 billion yen compared with a
decrease of 531.5 billion yen in fiscal 2016. Cash flows from financing activities resulted in an decrease
in cash of 6.6 billion yen in fiscal 2017, due mainly to decrease in short-term loans payable of 62.5 billion
yen. After adding translation adjustments and cash and cash equivalents at beginning of period, cash
and cash equivalents as of March 31, 2017 stood at 243.6 billion yen, an increase of 151.3 billion yen, or
164%, over fiscal 2016.
(4) Future outlook
With regard to the future economic outlook, the global economy is expected to continue growing.
However, uncertainties surrounding the business environment preclude optimism, as the future trend in
monetary easing in each country, protectionist policies spreading in developed countries, a further
deceleration of the Chinese economy and the occurrence of terrorism and conflicts around the world
require close monitoring. Toyota Industries forecasts consolidated net sales of 1,850.0 billion yen,
operating profit of 135.0 billion yen, profit before income taxes of 188.0 billion yen and profit attributable
to owners of the parent of 130.0 billion yen. By segment, we forecast net sales of 580.0 billion yen in the
Automobile Segment and 1,156.0 billion yen in the Materials Handling Equipment Segment.
Toyota Industries has made the forecasts based on IFRS and has not made forecasts based on
Japanese GAAP.
Our projections are based on exchange rates of ¥105 = US$1 and ¥115 = €1 for fiscal 2018.
Toyota Industries paid an interim cash dividend of 60.0 yen per common share in November 2016.
Toyota Industries plans to pay a year-end cash dividend of 65.0 yen per common share, with total cash
dividends for fiscal 2017 amounting to 125.0 yen per common share, an increase of 5.0 yen in fiscal
2016.
2. Basic Rationale for Selection of Accounting Standards
Toyota Industries has decided to voluntarily adopt IFRS in lieu of Japanese GAAP, to consolidated
financial statements from the fiscal year ending on March 31, 2017, in order to enhance the accounting
analytical capacity in its group management, as well as to improve the international comparability of its
financial information in capital market.
― 3 ―
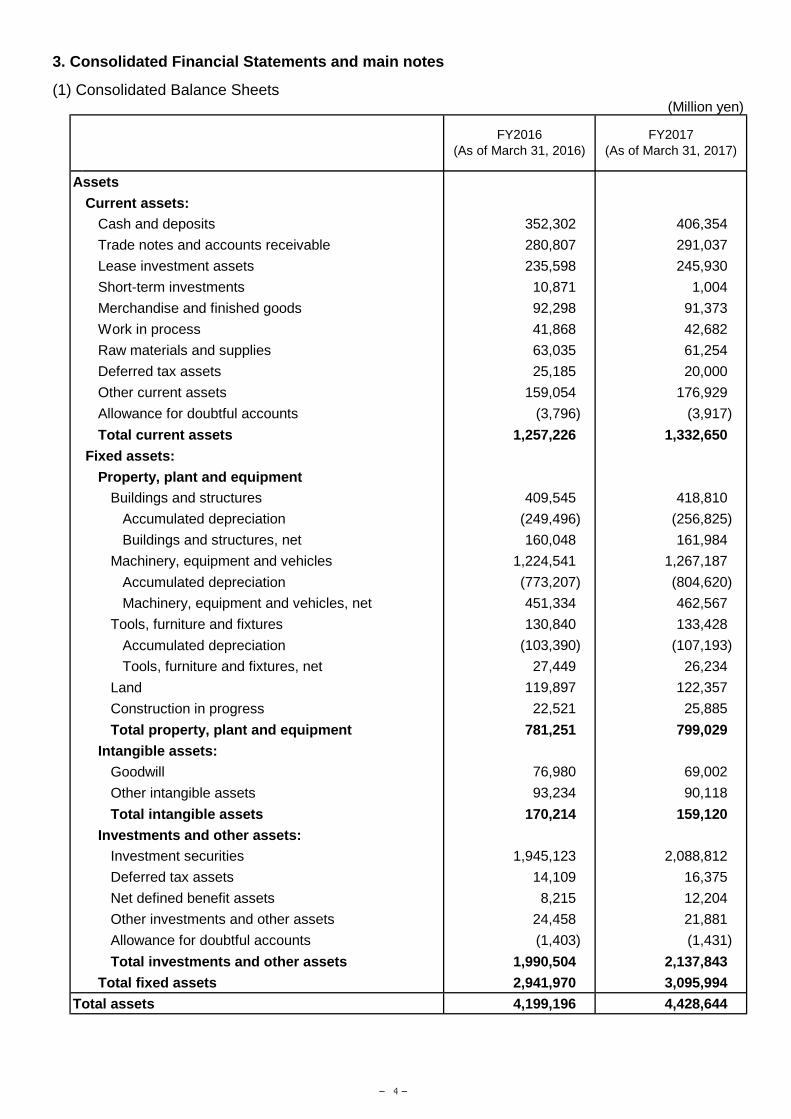
3. Consolidated Financial Statements and main notes
(1) Consolidated Balance Sheets(Million yen)
Assets
Current assets:
Cash and deposits 352,302 406,354
Trade notes and accounts receivable 280,807 291,037
Lease investment assets 235,598 245,930
Short-term investments 10,871 1,004
Merchandise and finished goods 92,298 91,373
Work in process 41,868 42,682
Raw materials and supplies 63,035 61,254
Deferred tax assets 25,185 20,000
Other current assets 159,054 176,929
Allowance for doubtful accounts (3,796) (3,917)
Total current assets 1,257,226 1,332,650
Fixed assets:
Property, plant and equipment
Buildings and structures 409,545 418,810
Accumulated depreciation (249,496) (256,825)
Buildings and structures, net 160,048 161,984
Machinery, equipment and vehicles 1,224,541 1,267,187
Accumulated depreciation (773,207) (804,620)
Machinery, equipment and vehicles, net 451,334 462,567
Tools, furniture and fixtures 130,840 133,428
Accumulated depreciation (103,390) (107,193)
Tools, furniture and fixtures, net 27,449 26,234
Land 119,897 122,357
Construction in progress 22,521 25,885
Total property, plant and equipment 781,251 799,029
Intangible assets:
Goodwill 76,980 69,002
Other intangible assets 93,234 90,118
Total intangible assets 170,214 159,120
Investments and other assets:
Investment securities 1,945,123 2,088,812
Deferred tax assets 14,109 16,375
Net defined benefit assets 8,215 12,204
Other investments and other assets 24,458 21,881
Allowance for doubtful accounts (1,403) (1,431)
Total investments and other assets 1,990,504 2,137,843
Total fixed assets 2,941,970 3,095,994
Total assets 4,199,196 4,428,644
FY2016
(As of March 31, 2016)
FY2017
(As of March 31, 2017)
― 4 ―
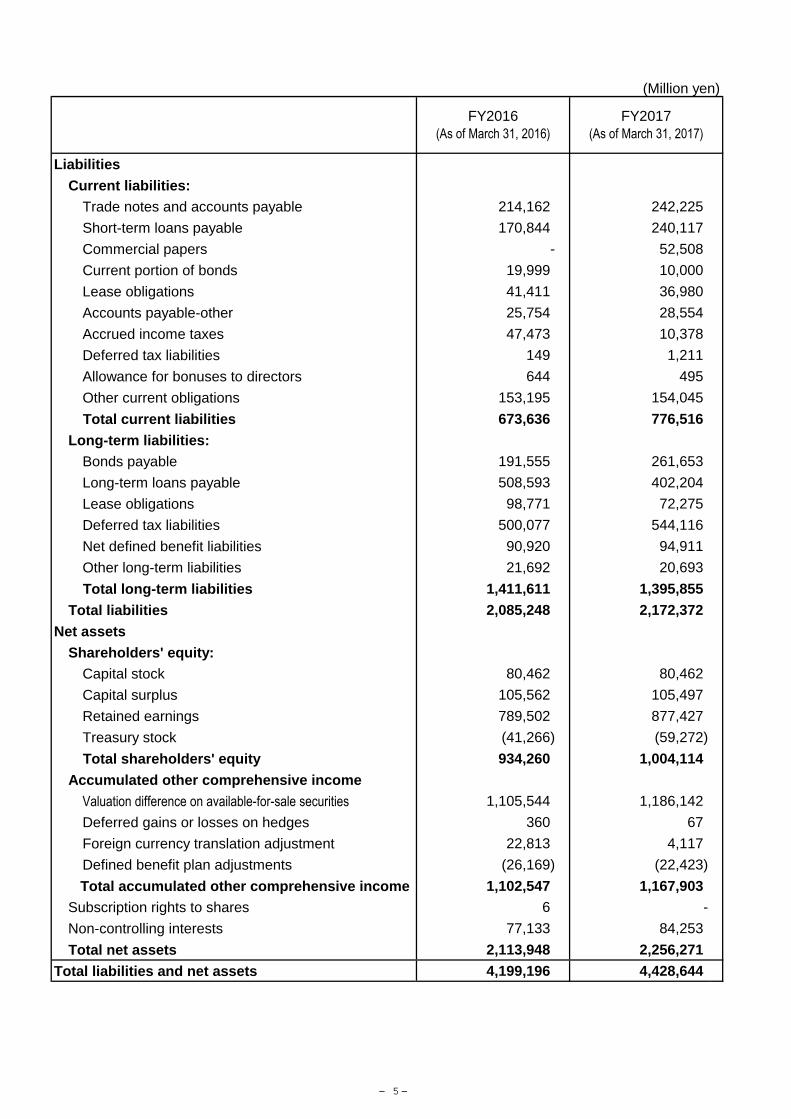
(Million yen)
Liabilities
Current liabilities:
Trade notes and accounts payable 214,162 242,225
Short-term loans payable 170,844 240,117
Commercial papers - 52,508
Current portion of bonds 19,999 10,000
Lease obligations 41,411 36,980
Accounts payable-other 25,754 28,554
Accrued income taxes 47,473 10,378
Deferred tax liabilities 149 1,211
Allowance for bonuses to directors 644 495
Other current obligations 153,195 154,045
Total current liabilities 673,636 776,516
Long-term liabilities:
Bonds payable 191,555 261,653
Long-term loans payable 508,593 402,204
Lease obligations 98,771 72,275
Deferred tax liabilities 500,077 544,116
Net defined benefit liabilities 90,920 94,911
Other long-term liabilities 21,692 20,693
Total long-term liabilities 1,411,611 1,395,855
Total liabilities 2,085,248 2,172,372
Net assets
Shareholders' equity:
Capital stock 80,462 80,462
Capital surplus 105,562 105,497
Retained earnings 789,502 877,427
Treasury stock (41,266) (59,272)
Total shareholders' equity 934,260 1,004,114
Accumulated other comprehensive income
Valuation difference on available-for-sale securities 1,105,544 1,186,142
Deferred gains or losses on hedges 360 67
Foreign currency translation adjustment 22,813 4,117
Defined benefit plan adjustments (26,169) (22,423)
Total accumulated other comprehensive income 1,102,547 1,167,903
Subscription rights to shares 6 -
Non-controlling interests 77,133 84,253
Total net assets 2,113,948 2,256,271
Total liabilities and net assets 4,199,196 4,428,644
FY2016
(As of March 31, 2016)
FY2017
(As of March 31, 2017)
― 5 ―
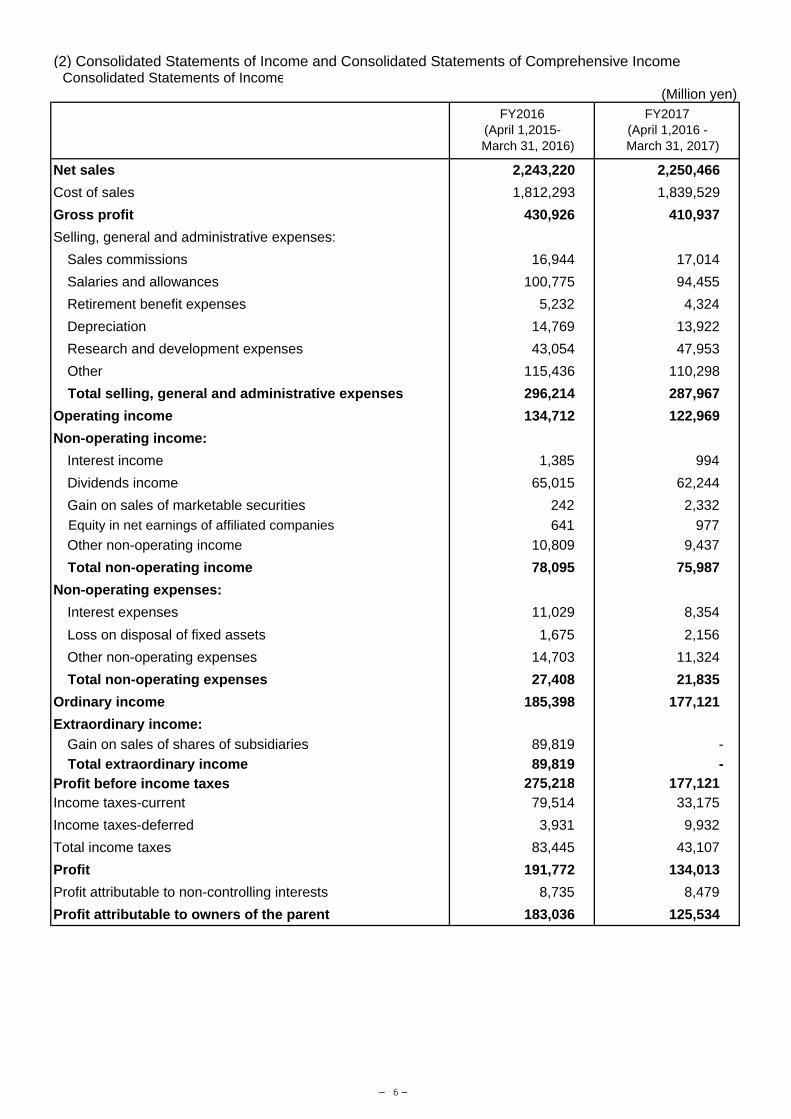
(2) Consolidated Statements of Income and Consolidated Statements of Comprehensive Income Consolidated Statements of Income
(Million yen)
Net sales 2,243,220 2,250,466
Cost of sales 1,812,293 1,839,529
Gross profit 430,926 410,937
Selling, general and administrative expenses:
Sales commissions 16,944 17,014
Salaries and allowances 100,775 94,455
Retirement benefit expenses 5,232 4,324
Depreciation 14,769 13,922
Research and development expenses 43,054 47,953
Other 115,436 110,298
Total selling, general and administrative expenses 296,214 287,967
Operating income 134,712 122,969
Non-operating income:
Interest income 1,385 994
Dividends income 65,015 62,244
Gain on sales of marketable securities 242 2,332
Equity in net earnings of affiliated companies 641 977
Other non-operating income 10,809 9,437
Total non-operating income 78,095 75,987
Non-operating expenses:
Interest expenses 11,029 8,354
Loss on disposal of fixed assets 1,675 2,156
Other non-operating expenses 14,703 11,324
Total non-operating expenses 27,408 21,835
Ordinary income 185,398 177,121
Extraordinary income:
Gain on sales of shares of subsidiaries 89,819 -
Total extraordinary income 89,819 -Profit before income taxes 275,218 177,121Income taxes-current 79,514 33,175
Income taxes-deferred 3,931 9,932
Total income taxes 83,445 43,107
Profit 191,772 134,013
Profit attributable to non-controlling interests 8,735 8,479
Profit attributable to owners of the parent 183,036 125,534
FY2016(April 1,2015-
March 31, 2016)
FY2017(April 1,2016 -
March 31, 2017)
― 6 ―
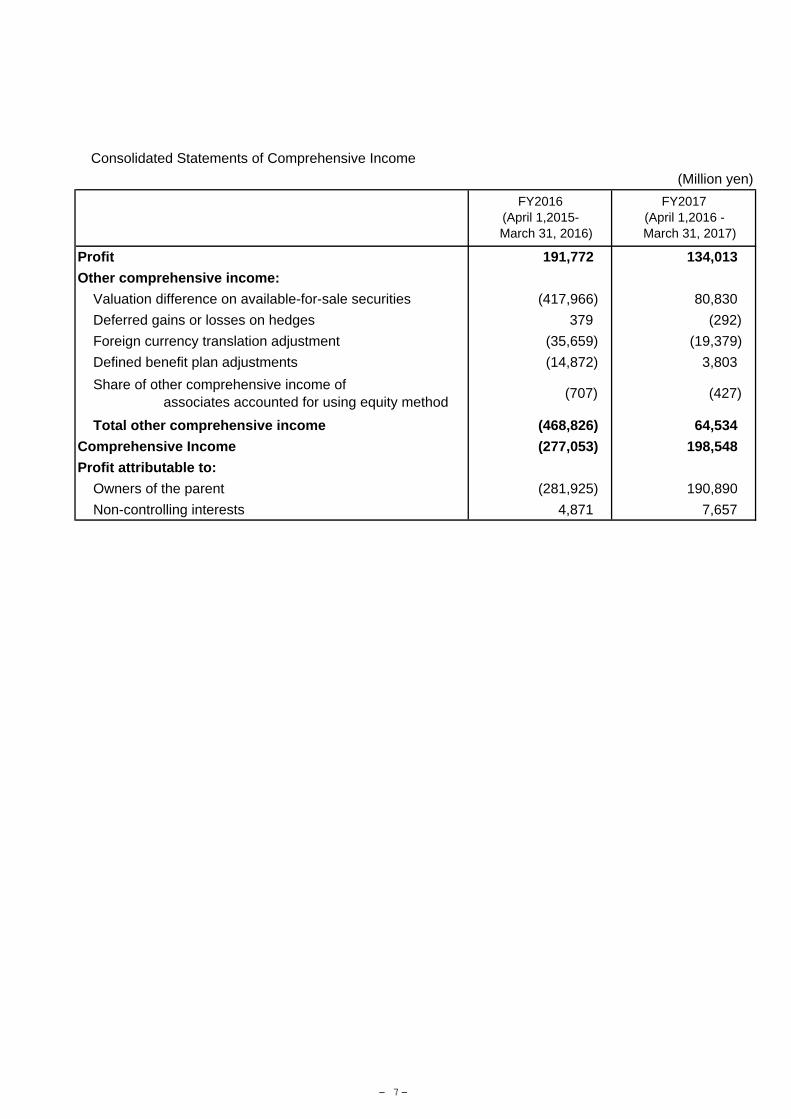
Consolidated Statements of Comprehensive Income
(Million yen)
Profit 191,772 134,013
Other comprehensive income:
Valuation difference on available-for-sale securities (417,966) 80,830
Deferred gains or losses on hedges 379 (292)
Foreign currency translation adjustment (35,659) (19,379)
Defined benefit plan adjustments (14,872) 3,803
Total other comprehensive income (468,826) 64,534
Comprehensive Income (277,053) 198,548
Profit attributable to:
Owners of the parent (281,925) 190,890
Non-controlling interests 4,871 7,657
Share of other comprehensive income of associates accounted for using equity method
FY2016(April 1,2015-
March 31, 2016)
FY2017(April 1,2016 -
March 31, 2017)
(707) (427)
― 7 ―
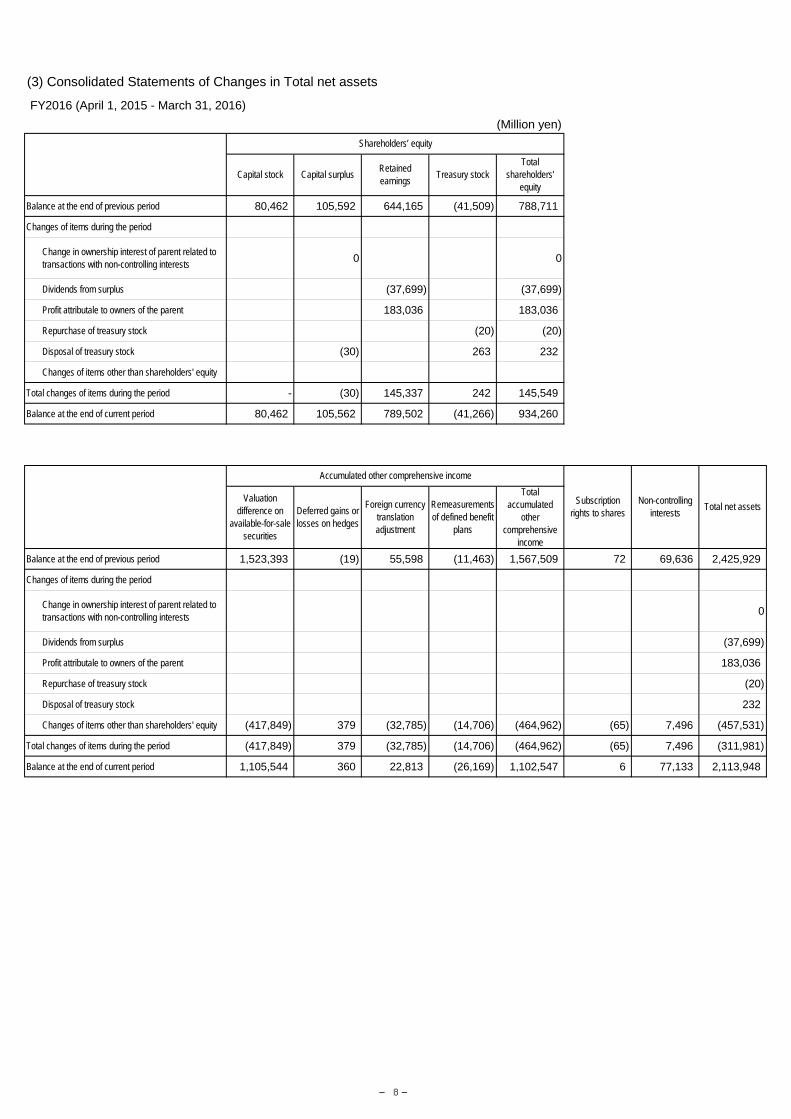
(3) Consolidated Statements of Changes in Total net assets
FY2016 (April 1, 2015 - March 31, 2016)
(Million yen)
Balance at the end of previous period 80,462 105,592 644,165 (41,509) 788,711
Changes of items during the period
Change in ownership interest of parent related totransactions with non-controlling interests
0 0
Dividends from surplus (37,699) (37,699)
Profit attributale to owners of the parent 183,036 183,036
Repurchase of treasury stock (20) (20)
Disposal of treasury stock (30) 263 232
Changes of items other than shareholders' equity
Total changes of items during the period - (30) 145,337 242 145,549
Balance at the end of current period 80,462 105,562 789,502 (41,266) 934,260
Balance at the end of previous period 1,523,393 (19) 55,598 (11,463) 1,567,509 72 69,636 2,425,929
Changes of items during the period
Change in ownership interest of parent related totransactions with non-controlling interests
0
Dividends from surplus (37,699)
Profit attributale to owners of the parent 183,036
Repurchase of treasury stock (20)
Disposal of treasury stock 232
Changes of items other than shareholders' equity (417,849) 379 (32,785) (14,706) (464,962) (65) 7,496 (457,531)
Total changes of items during the period (417,849) 379 (32,785) (14,706) (464,962) (65) 7,496 (311,981)
Balance at the end of current period 1,105,544 360 22,813 (26,169) 1,102,547 6 77,133 2,113,948
Accumulated other comprehensive income
Shareholders’ equity
Capital stock Capital surplusTotal
shareholders’equity
Treasury stockRetainedearnings
Subscriptionrights to shares
Non-controllinginterests
Total net assetsValuation
difference onavailable-for-sale
securities
Deferred gains orlosses on hedges
Foreign currencytranslationadjustment
Remeasurementsof defined benefit
plans
Totalaccumulated
othercomprehensive
income
― 8 ―
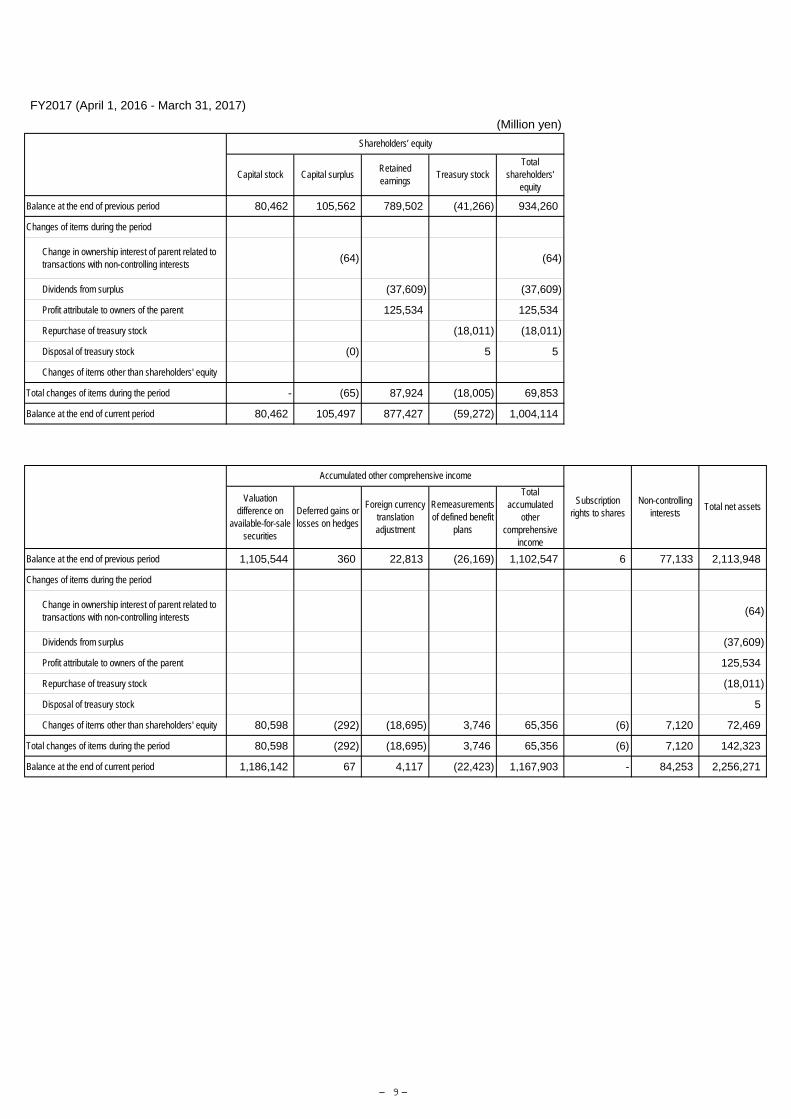
FY2017 (April 1, 2016 - March 31, 2017)
(Million yen)
Balance at the end of previous period 80,462 105,562 789,502 (41,266) 934,260
Changes of items during the period
Change in ownership interest of parent related totransactions with non-controlling interests
(64) (64)
Dividends from surplus (37,609) (37,609)
Profit attributale to owners of the parent 125,534 125,534
Repurchase of treasury stock (18,011) (18,011)
Disposal of treasury stock (0) 5 5
Changes of items other than shareholders' equity
Total changes of items during the period - (65) 87,924 (18,005) 69,853
Balance at the end of current period 80,462 105,497 877,427 (59,272) 1,004,114
Balance at the end of previous period 1,105,544 360 22,813 (26,169) 1,102,547 6 77,133 2,113,948
Changes of items during the period
Change in ownership interest of parent related totransactions with non-controlling interests
(64)
Dividends from surplus (37,609)
Profit attributale to owners of the parent 125,534
Repurchase of treasury stock (18,011)
Disposal of treasury stock 5
Changes of items other than shareholders' equity 80,598 (292) (18,695) 3,746 65,356 (6) 7,120 72,469
Total changes of items during the period 80,598 (292) (18,695) 3,746 65,356 (6) 7,120 142,323
Balance at the end of current period 1,186,142 67 4,117 (22,423) 1,167,903 - 84,253 2,256,271
Accumulated other comprehensive income
Shareholders’ equity
Capital stock Capital surplusTotal
shareholders’equity
Treasury stockRetainedearnings
Subscriptionrights to shares
Non-controllinginterests
Total net assetsValuation
difference onavailable-for-sale
securities
Deferred gains orlosses on hedges
Foreign currencytranslationadjustment
Remeasurementsof defined benefit
plans
Totalaccumulated
othercomprehensive
income
― 9 ―
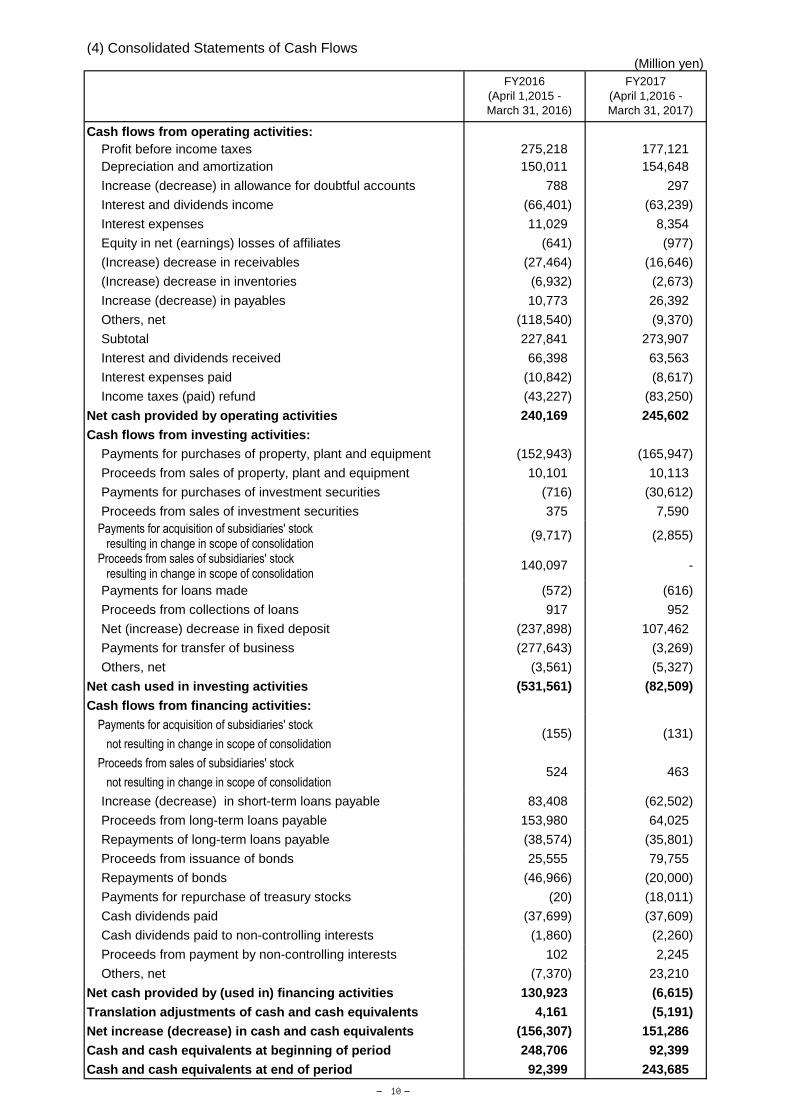
(4) Consolidated Statements of Cash Flows(Million yen)
Cash flows from operating activities:
Profit before income taxes 275,218 177,121
Depreciation and amortization 150,011 154,648
Increase (decrease) in allowance for doubtful accounts 788 297
Interest and dividends income (66,401) (63,239)
Interest expenses 11,029 8,354
Equity in net (earnings) losses of affiliates (641) (977)
(Increase) decrease in receivables (27,464) (16,646)
(Increase) decrease in inventories (6,932) (2,673)
Increase (decrease) in payables 10,773 26,392
Others, net (118,540) (9,370)
Subtotal 227,841 273,907
Interest and dividends received 66,398 63,563
Interest expenses paid (10,842) (8,617)
Income taxes (paid) refund (43,227) (83,250)
Net cash provided by operating activities 240,169 245,602
Cash flows from investing activities:
Payments for purchases of property, plant and equipment (152,943) (165,947)
Proceeds from sales of property, plant and equipment 10,101 10,113
Payments for purchases of investment securities (716) (30,612)
Proceeds from sales of investment securities 375 7,590
Payments for acquisition of subsidiaries' stock resulting in change in scope of consolidation Proceeds from sales of subsidiaries' stock resulting in change in scope of consolidation
Payments for loans made (572) (616)
Proceeds from collections of loans 917 952
Net (increase) decrease in fixed deposit (237,898) 107,462
Payments for transfer of business (277,643) (3,269)
Others, net (3,561) (5,327)
Net cash used in investing activities (531,561) (82,509)
Cash flows from financing activities:
Payments for acquisition of subsidiaries' stock
not resulting in change in scope of consolidation
Proceeds from sales of subsidiaries' stock
not resulting in change in scope of consolidation
Increase (decrease) in short-term loans payable 83,408 (62,502)
Proceeds from long-term loans payable 153,980 64,025
Repayments of long-term loans payable (38,574) (35,801)
Proceeds from issuance of bonds 25,555 79,755
Repayments of bonds (46,966) (20,000)
Payments for repurchase of treasury stocks (20) (18,011)
Cash dividends paid (37,699) (37,609)
Cash dividends paid to non-controlling interests (1,860) (2,260)
Proceeds from payment by non-controlling interests 102 2,245
Others, net (7,370) 23,210
Net cash provided by (used in) financing activities 130,923 (6,615)
Translation adjustments of cash and cash equivalents 4,161 (5,191)
Net increase (decrease) in cash and cash equivalents (156,307) 151,286
Cash and cash equivalents at beginning of period 248,706 92,399
Cash and cash equivalents at end of period 92,399 243,685
(155)
524
(131)
463
140,097 -
FY2016
(April 1,2015 -
March 31, 2016)
FY2017
(April 1,2016 -
March 31, 2017)
(9,717) (2,855)
― 10 ―
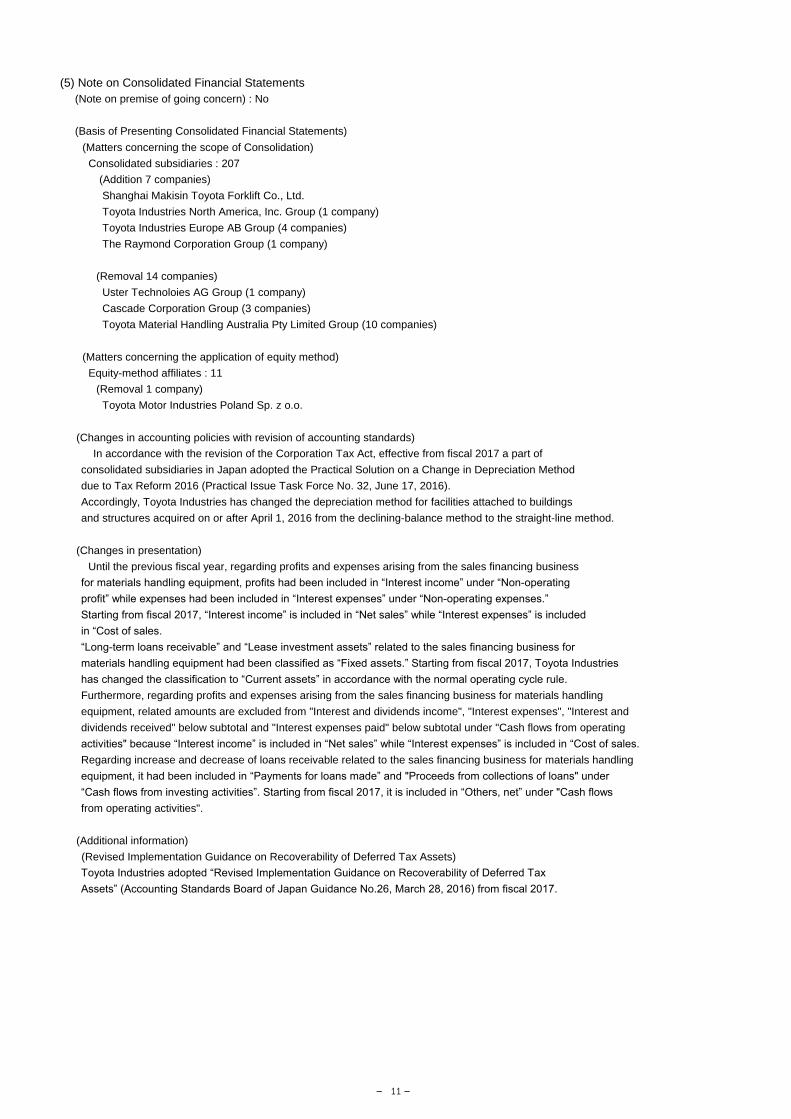
(5) Note on Consolidated Financial Statements
(Note on premise of going concern) : No
(Basis of Presenting Consolidated Financial Statements)
(6) (Matters concerning the scope of Consolidation)
(7) Consolidated subsidiaries : 207
(Addition 7 companies)
Shanghai Makisin Toyota Forklift Co., Ltd.
Toyota Industries North America, Inc. Group (1 company)
Toyota Industries Europe AB Group (4 companies)
The Raymond Corporation Group (1 company)
(Removal 14 companies)
Uster Technoloies AG Group (1 company)
Cascade Corporation Group (3 companies)
Toyota Material Handling Australia Pty Limited Group (10 companies)
(6) (Matters concerning the application of equity method)
(7) Equity-method affiliates : 11
(Removal 1 company)
Toyota Motor Industries Poland Sp. z o.o.
(6) (Changes in accounting policies with revision of accounting standards)
In accordance with the revision of the Corporation Tax Act, effective from fiscal 2017 a part of
consolidated subsidiaries in Japan adopted the Practical Solution on a Change in Depreciation Method
due to Tax Reform 2016 (Practical Issue Task Force No. 32, June 17, 2016).
Accordingly, Toyota Industries has changed the depreciation method for facilities attached to buildings
and structures acquired on or after April 1, 2016 from the declining-balance method to the straight-line method.
(6) (Changes in presentation)
Until the previous fiscal year, regarding profits and expenses arising from the sales financing business
for materials handling equipment, profits had been included in “Interest income” under “Non-operating
profit” while expenses had been included in “Interest expenses” under “Non-operating expenses.”
Starting from fiscal 2017, “Interest income” is included in “Net sales” while “Interest expenses” is included
in “Cost of sales.
“Long-term loans receivable” and “Lease investment assets” related to the sales financing business for
materials handling equipment had been classified as “Fixed assets.” Starting from fiscal 2017, Toyota Industries
has changed the classification to “Current assets” in accordance with the normal operating cycle rule.
Furthermore, regarding profits and expenses arising from the sales financing business for materials handling
equipment, related amounts are excluded from "Interest and dividends income", "Interest expenses", "Interest and
dividends received" below subtotal and "Interest expenses paid" below subtotal under "Cash flows from operating
activities" because “Interest income” is included in “Net sales” while “Interest expenses” is included in “Cost of sales.
Regarding increase and decrease of loans receivable related to the sales financing business for materials handling
equipment, it had been included in “Payments for loans made” and "Proceeds from collections of loans" under
“Cash flows from investing activities”. Starting from fiscal 2017, it is included in “Others, net” under "Cash flows
from operating activities".
(6) (Additional information)
(Revised Implementation Guidance on Recoverability of Deferred Tax Assets)
Toyota Industries adopted “Revised Implementation Guidance on Recoverability of Deferred Tax
Assets” (Accounting Standards Board of Japan Guidance No.26, March 28, 2016) from fiscal 2017.
― 11 ―
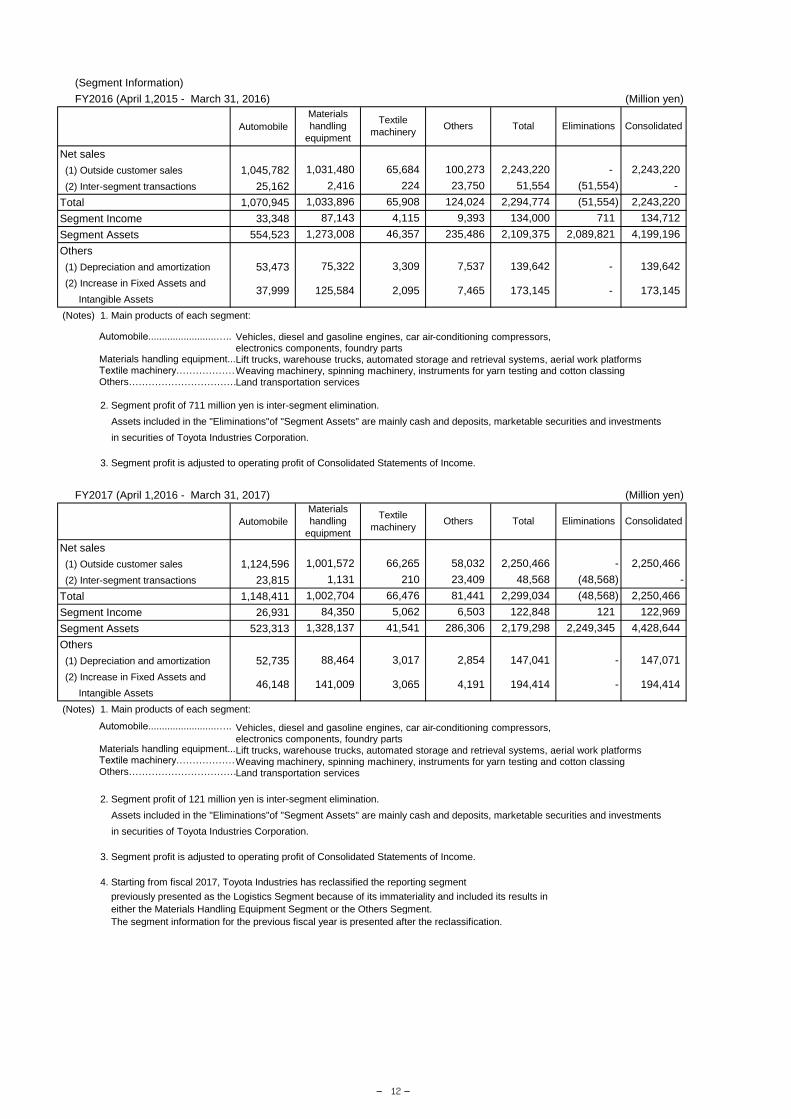
(Segment Information)
FY2016 (April 1,2015 - March 31, 2016) (Million yen)
Automobile
Net sales
(1) Outside customer sales 1,045,782
(2) Inter-segment transactions 25,162
Total 1,070,945
Segment Income 33,348
Segment Assets 554,523
Others
(1) Depreciation and amortization 53,473
(2) Increase in Fixed Assets and
Intangible Assets
(Notes) 1. Main products of each segment:
(Notes) 2. Segment profit of 711 million yen is inter-segment elimination.
Assets included in the "Eliminations"of "Segment Assets" are mainly cash and deposits, marketable securities and investments
in securities of Toyota Industries Corporation.
(Notes) 3. Segment profit is adjusted to operating profit of Consolidated Statements of Income.
FY2017 (April 1,2016 - March 31, 2017) (Million yen)
Automobile
Net sales
(1) Outside customer sales 1,124,596
(2) Inter-segment transactions 23,815
Total 1,148,411
Segment Income 26,931
Segment Assets 523,313
Others
(1) Depreciation and amortization 52,735
(2) Increase in Fixed Assets and
Intangible Assets
(Notes) 1. Main products of each segment:
(Notes) 2. Segment profit of 121 million yen is inter-segment elimination.
Assets included in the "Eliminations"of "Segment Assets" are mainly cash and deposits, marketable securities and investments
in securities of Toyota Industries Corporation.
(Notes) 3. Segment profit is adjusted to operating profit of Consolidated Statements of Income.
(Notes) 4. Starting from fiscal 2017, Toyota Industries has reclassified the reporting segment
(Notes) 4. previously presented as the Logistics Segment because of its immateriality and included its results in
(Notes) 4. either the Materials Handling Equipment Segment or the Others Segment.
(Notes) 4. The segment information for the previous fiscal year is presented after the reclassification.
Materials
handling
equipment
Textile
machineryOthers Total Eliminations Consolidated
1,031,480 65,684
124,024 2,294,774
- 2,243,220100,273 2,243,220
1,033,896
2,416
4,115 9,393 134,000 711 134,712
- 224 23,750 51,554 (51,554)
65,908
2,089,821 4,199,1961,273,008 46,357 235,486 2,109,375
2,243,220(51,554)
87,143
173,145 - 173,145
- 139,64275,322 3,309 7,537 139,642
Materials
handling
equipment
Textile
machineryOthers Total Eliminations Consolidated
58,032 2,250,466 - 2,250,466
1,131 210 23,409 48,568
1,001,572 66,265
122,969
1,002,704 66,476 81,441 2,299,034
6,503 122,848
2,854 147,041 - 147,071
4,428,644
(48,568) -
(48,568) 2,250,466
121
1,328,137
194,41446,148 141,009 3,065 4,191 194,414 -
88,464 3,017
37,999 125,584 2,095 7,465
2,249,34541,541 286,306 2,179,298
84,350 5,062
Vehicles, diesel and gasoline engines, car air-conditioning compressors, electronics components, foundry parts Lift trucks, warehouse trucks, automated storage and retrieval systems, aerial work platforms Weaving machinery, spinning machinery, instruments for yarn testing and cotton classing Land transportation services
Automobile.........................….. Materials handling equipment... Textile machinery……………… Others……………………………
― 12 ―
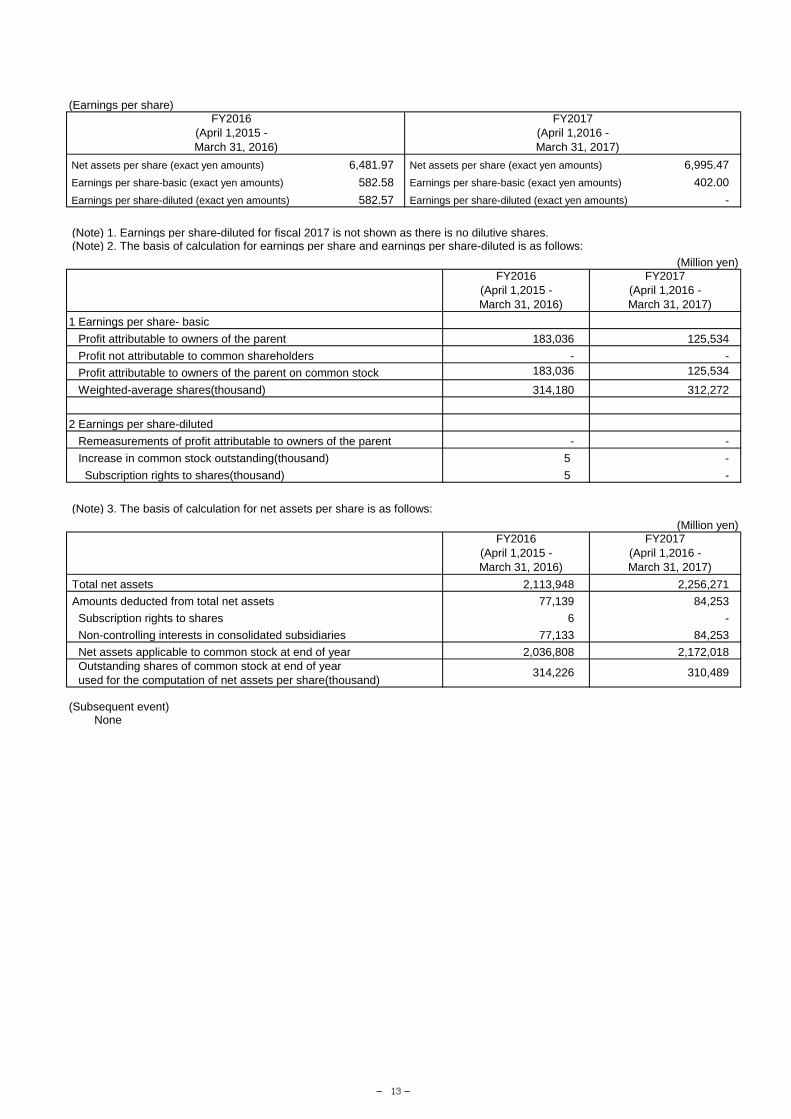
(Earnings per share)
Net assets per share (exact yen amounts) 6,481.97 Net assets per share (exact yen amounts) 6,995.47
Earnings per share-basic (exact yen amounts) 582.58 Earnings per share-basic (exact yen amounts) 402.00
Earnings per share-diluted (exact yen amounts) 582.57 Earnings per share-diluted (exact yen amounts) -
(Note) 1. Earnings per share-diluted for fiscal 2017 is not shown as there is no dilutive shares. (Note) 2. The basis of calculation for earnings per share and earnings per share-diluted is as follows:
(Million yen)
1 Earnings per share- basic
Profit attributable to owners of the parent 183,036 125,534
Profit not attributable to common shareholders - -
Profit attributable to owners of the parent on common stock
Weighted-average shares(thousand) 314,180 312,272
2 Earnings per share-diluted
Remeasurements of profit attributable to owners of the parent - -
Increase in common stock outstanding(thousand) 5 -
Subscription rights to shares(thousand) 5 -
(Note) 3. The basis of calculation for net assets per share is as follows:
(Million yen)
Total net assets 2,113,948 2,256,271
Amounts deducted from total net assets 77,139 84,253
Subscription rights to shares 6 -
Non-controlling interests in consolidated subsidiaries 77,133 84,253
Net assets applicable to common stock at end of year 2,036,808 2,172,018
Outstanding shares of common stock at end of year
used for the computation of net assets per share(thousand)
(Subsequent event) None
183,036 125,534
FY2016
(April 1,2015 -
March 31, 2016)
FY2017
(April 1,2016 -
March 31, 2017)
314,226 310,489
FY2017
(April 1,2016 -
March 31, 2017)
FY2017
(April 1,2016 -
March 31, 2017)
FY2016
(April 1,2015 -
March 31, 2016)
FY2016
(April 1,2015 -
March 31, 2016)
― 13 ―


![Toyota Industries Report 2018 · Toyota Industries’ Value Creation Process Development Basic Philosophy [Respect for the Law] Toyota Industries is determined to comply with the](https://img.pdfslide.us/doc/110x75/5e7740ab1d0c062e440c620d/toyota-industries-report-2018-toyota-industriesa-value-creation-process-development.jpg)