Embed Size (px)
Citation preview

Financial StrategyYasuo Takeuchi
Director, Senior Executive Managing Officer,Head of Corporate Management Office, CFO
Olympus CorporationMarch 30, 2016

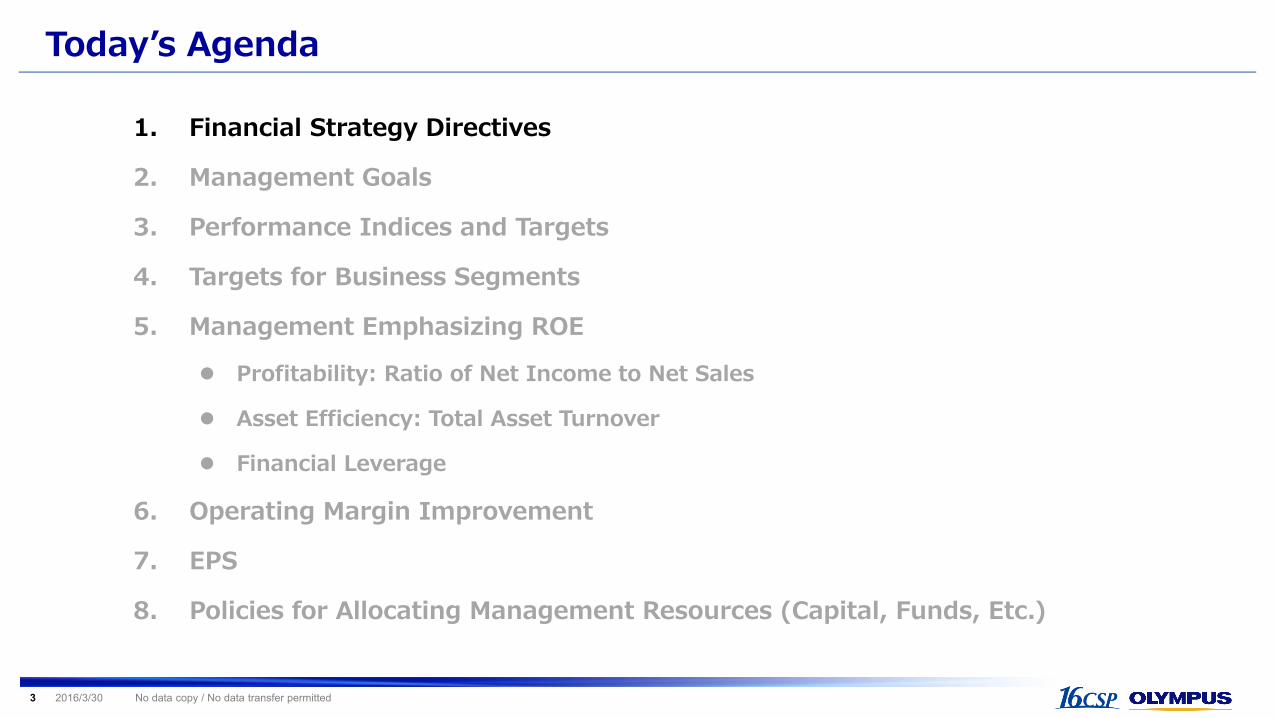
Todayʼs Agenda
1. Financial Strategy Directives
2. Management Goals
3. Performance Indices and Targets
4. Targets for Business Segments
5. Management Emphasizing ROE
Profitability: Ratio of Net Income to Net Sales
Asset Efficiency: Total Asset Turnover
Financial Leverage
6. Operating Margin Improvement
7. EPS
8. Policies for Allocating Management Resources (Capital, Funds, Etc.)
2 2016/3/30 No data copy / No data transfer permitted
Todayʼs Agenda
1. Financial Strategy Directives
2. Management Goals
3. Performance Indices and Targets
4. Targets for Business Segments
5. Management Emphasizing ROE
Profitability: Ratio of Net Income to Net Sales
Asset Efficiency: Total Asset Turnover
Financial Leverage
6. Operating Margin Improvement
7. EPS
8. Policies for Allocating Management Resources (Capital, Funds, Etc.)
3 2016/3/30 No data copy / No data transfer permitted

Financial Strategy Directives
Medium-Term Vision 16CSP
Improve financial soundnessSecure financial soundness
Improve capital efficiency
Directive Ensure financial soundness and improve capital efficiency through efficient cash flow
allocation
Clarify cash flow allocation policies (financial soundness, growth investments, and shareholder returns) and link to accomplishment of management goals
Strengthen financial governance systems and prioritize Groupwide optimization to improve capital efficiency within Group
Increase equity capital Reduce interest-bearing debt Quickly resume dividend payments
Strategically control interest-bearing debt Secure stable equity capital levels Realize phased increase in shareholder returns
4 2016/3/30 No data copy / No data transfer permitted

Todayʼs Agenda
1. Financial Strategy Directives
2. Management Goals
3. Performance Indices and Targets
4. Targets for Business Segments
5. Management Emphasizing ROE
Profitability: Ratio of Net Income to Net Sales
Asset Efficiency: Total Asset Turnover
Financial Leverage
6. Operating Margin Improvement
7. EPS
8. Policies for Allocating Management Resources (Capital, Funds, Etc.)
5 2016/3/30 No data copy / No data transfer permitted

Management Goals Working secure an appropriate level of financial soundness, we will constantly achieve ROE of 15% through
balanced improvements in profitability and business growth as well as financial soundness, and double the bottom line (EPS) over the next five years
Capital Efficiency ROE 15%
Financial Soundness Equity Ratio 50%
Secure appropriate level of financial soundness and then target balanced improvements in profitability and business growth to maintain ROE of 15% over long term
Business Growth EBITDA Double-digit growth* Achieve sales growth that exceeds market growth rates in Medical Business while eliminating operational inefficiencies to
realize high-quality growth Enhance earnings capacity measured by excluding accounting factors (depreciation, amortization of goodwill, etc.)
Profitability Operating margin 15% Improve profitability by boosting earnings in 3 surgical device businesses (GS, URO/GYN, and ENT), advancing selection and
concentration measures in Scientific Solutions Business, and at least breaking even in Imaging Business Reduce manufacturing costs, increase development efficiency, and streamline back-office work and processes to reduce
SG&A expenses and thereby improve profitability
Increase equity capital from perspectives of securing financial soundness matched to risk levels and appropriately managing financial leverage
(FY2016 estimate: 14%)
(FY2016 estimate: 12%)
(FY2021 estimate: ¥240 billion)
(FY2016 estimate: 39%)
(FY2016 estimate: ¥150 billion)
* Compound annual growth rate (CAGR)6

Todayʼs Agenda
1. Financial Strategy Directives
2. Management Goals
3. Performance Indices and Targets
4. Targets for Business Segments
5. Management Emphasizing ROE
Profitability: Ratio of Net Income to Net Sales
Asset Efficiency: Total Asset Turnover
Financial Leverage
6. Operating Margin Improvement
7. EPS
8. Policies for Allocating Management Resources (Capital, Funds, Etc.)
7 2016/3/30 No data copy / No data transfer permitted

8 2016/3/30 No data copy / No data transfer permitted
Performance Indices and Targets
FY2021 (Forecast) FY2016(Forecast)
Net sales ¥1,100 billion CAGR 6% ¥816 billion
Operating income ¥170 billion CAGR 11% ¥100 billion
Free cash flow More than¥250 billion Total in 5 years -
EPS ¥320 - ¥163
Record forecast figures of ¥1,100 billion for net sales and ¥170 billion for operating income in FY2021 by accomplishing management goals
After securing stable financial base, prioritize allocation of funds toward investments in growth fields and use remainder of funds to provide shareholders with appropriate returns that match their expectations (target total return ratio of 30% in future)

Todayʼs Agenda
1. Financial Strategy Directives
2. Management Goals
3. Performance Indices and Targets
4. Targets for Business Segments
5. Management Emphasizing ROE
Profitability: Ratio of Net Income to Net Sales
Asset Efficiency: Total Asset Turnover
Financial Leverage
6. Operating Margin Improvement
7. EPS
8. Policies for Allocating Management Resources (Capital, Funds, Etc.)
9 2016/3/30 No data copy / No data transfer permitted

10 2016/3/30 No data copy / No data transfer permitted
Targets for Business SegmentsNet sales FY2016(Forecast) FY2021(Forecast) CAGRMedical Business 615 900 8%Scientific Solutions Business 106 130 4%Imaging Business 80 55 -7%Others 15 15 0%Elimination or
corporate - - -Total 816 1,100 6%
Operating income FY2016(Forecast) FY2021(Forecast) CAGRMedical Business 137 225 10%Scientific Solutions Business 8 13 10%Imaging Business 0 2 -Others (12)
(70)-
Elimination or corporate (33) -
Total 100 170 11%
Net income FY2016(Forecast) FY2021(Forecast) CAGRTotal 56 110 15%
* Foreign exchange rate assumptions:
・US$ =¥115・Euro =¥130
Medical BUs(CAGR)
GIRBU 7%
GSBU 11%
UGBU 8%
ENTBU 13%
MSBU 5%

Todayʼs Agenda
1. Financial Strategy Directives
2. Management Goals
3. Performance Indices and Targets
4. Targets for Business Segments
5. Management Emphasizing ROE
Profitability: Ratio of Net Income to Net Sales
Asset Efficiency: Total Asset Turnover
Financial Leverage
6. Operating Margin Improvement
7. EPS
8. Policies for Allocating Management Resources (Capital, Funds, Etc.)
11 2016/3/30 No data copy / No data transfer permitted

12 2016/3/30
Management Emphasizing ROE Achieve ROE level necessary to compete with global companies and realize ongoing growth Improve profitability and capital efficiency (growth potential) to maintain ROE of 15% over
long termROE 15%
ProfitabilityAsset efficiency
Financial leverage
Ratio of net incom
e to net sales ×
×
Increase operating margin
Improve balance of other income and expenses
Increase net sales Improve business asset
efficiency Improve corporate
asset efficiency
Manage financial leverage
Conduct BS-based management
Net income
Net sales
Total asset turnover
Net sales
Total assets
Total assets
Equity capital
No data copy / No data transfer permitted
FY2021(Forecast)FY2016(Forecast)
Approx. 10%
Approx. 0.9 times
Approx. 2.0 times
Approx. 7%
Approx. 0.8 times
Approx. 2.6 times
×
×

13 2016/3/30 No data copy / No data transfer permitted
Profitability: Ratio of Net Income to Net Sales
Ratio of net income to net sales
Net income
Net sales
Improve balance of other income and
expenses
Increase operating margin
Reduce ratio of manufacturing costs to net sales (down 1 pt) Reduce ratio of SG&A expenses to net sales (down 2 pt)
Reduce interest burden (strategically control interest-bearing debt)
Manage foreign exchange translation adjustments
10%Approx. 7%
Profitability
FY2021FY2016(Forecast)
15%
FY2016(Forecast)
Approx.12%FY2021
Improve profit margins by increasing business earnings, reducing corporate and manufacturing costs, and managing balance of other income and expenses
FY2016 (Forecast)
¥(14.0 billion)
Lower interest payments by reducing interest-bearing
debt, etc.

14 2016/3/30 No data copy / No data transfer permitted
Asset Efficiency: Total Asset Turnover
Total asset turnover
Net sales
Total assets
Improve total asset efficiency
Increase net sales
Approx. 0.9 times
Approx. 0.8 times
Asset efficiency
FY2021FY2016(Forecast)
Up 35% (¥1,100 billion)
FY2016(Forecast)
¥816 billionFY2021
Maintain high growth rates while managing total assets
Limit increase to approx.20%
FY2016(Forecast)
Approx. ¥1,020 billion
FY2021
Maximize net sales (grow business by steadily advancing BU strategies)• Net sales growth: 46% in Medical Business, 23% in Scientific
Solutions Business
Improve inventory efficiency (optimize inventories through enhanced SCM)
Utilize Medical Business demo products and loaners with higher levels of efficiency
Reduce cash and deposits by managing funds on consolidated basis
Appropriately manage capital tie-up shares• Conduct evaluations from medium-to-long-term perspective
based on Basic Policy for Corporate Governance and curtail or liquidate holdings that lack rationality or necessity
15 2016/3/30 No data copy / No data transfer permitted
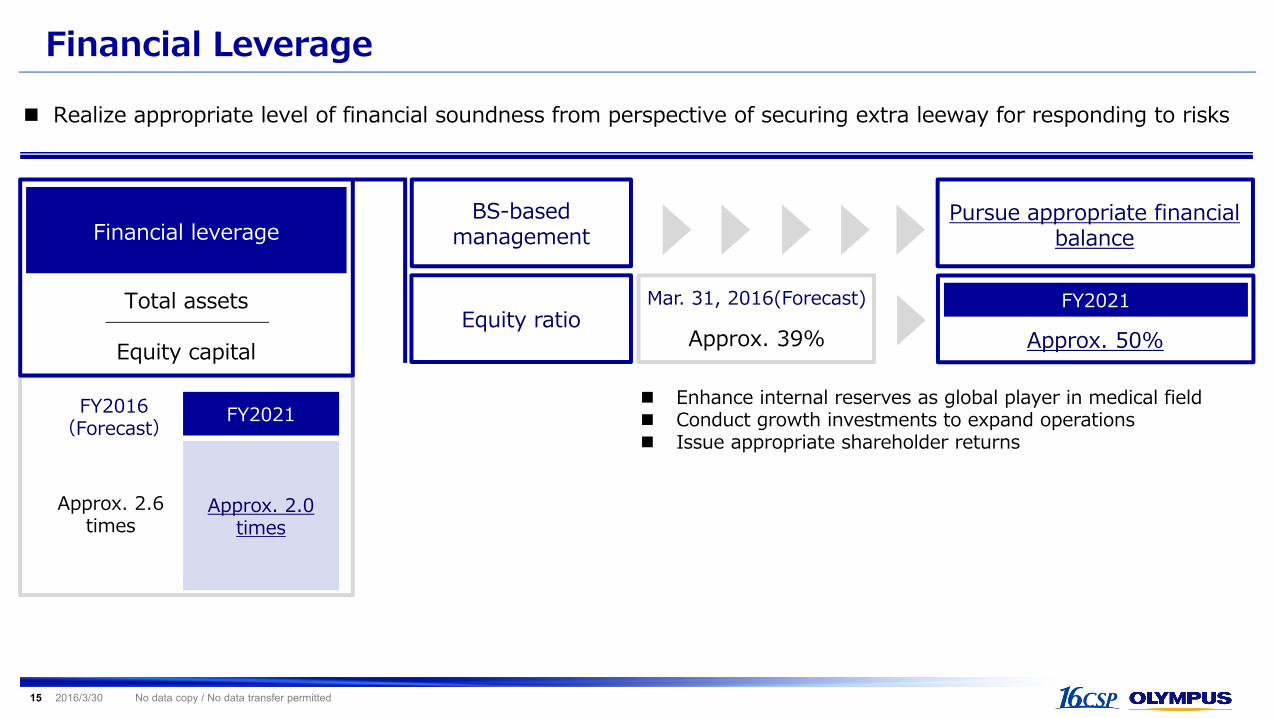
Financial Leverage
Financial leverage
Total assets
Equity capital
BS-based management
Approx. 2.0 times
Approx. 2.6 times
FY2021FY2016(Forecast)
Pursue appropriate financial balance
Realize appropriate level of financial soundness from perspective of securing extra leeway for responding to risks
Enhance internal reserves as global player in medical field Conduct growth investments to expand operations Issue appropriate shareholder returns
Equity ratioApprox. 50%
Mar. 31, 2016(Forecast)
Approx. 39%FY2021

Todayʼs Agenda
16 2016/3/30 No data copy / No data transfer permitted
1. Financial Strategy Directives
2. Management Goals
3. Performance Indices and Targets
4. Targets for Business Segments
5. Management Emphasizing ROE
Profitability: Ratio of Net Income to Net Sales
Asset Efficiency: Total Asset Turnover
Financial Leverage
6. Operating Margin Improvement
7. EPS
8. Policies for Allocating Management Resources (Capital, Funds, Etc.)

17 2016/3/30 No data copy / No data transfer permitted
Operating Margin Improvement Achieve operating margin of 15% (approx. 3 pt increase vs FY2016 estimate)
12%15%
54% 52%
34% 33%
0%
10%
20%
30%
40%
50%
60%
FY2016 FY2021
Operating margin
Improvements on consolidated level
Ratio of SG&A expenses to net sales (2 pt improvement)
22%
25%
8%
10%
0%
4%
0%
5%
10%
15%
20%
25%
30%
FY2016 FY2021
Reduce SG&A expenses by absorbing expense increases associated with growth investments and response to more-stringent regulations through improvements in operational efficiency
Cost of sales ratio
Ratio of SG&A expensesto net sales
Medical Business
Scientific Solutions Business
Imaging Business
Cost of sales ratio(1 pt improvement)
Pursue ongoing cost of sales reductions
Strengthen procurement functions
Operating margin improvements by segment
Medical Business (3 pt improvement)
Improve profitability of gastrointestinal endoscopes
Boost earnings capacity of 3 surgical device businesses
Scientific Solutions Business (2 pt improvement)
Conduct selection and concentration based on customer segment oriented strategies
Imaging Business(4 pt improvement)
Implement ongoing business structure reforms
Focus on sales of high-margin OM-D series cameras and PRO lenses
Todayʼs Agenda
18 2016/3/30 No data copy / No data transfer permitted
1. Financial Strategy Directives
2. Management Goals
3. Performance Indices and Targets
4. Targets for Business Segments
5. Management Emphasizing ROE
Profitability: Ratio of Net Income to Net Sales
Asset Efficiency: Total Asset Turnover
Financial Leverage
6. Operating Margin Improvement
7. EPS
8. Policies for Allocating Management Resources (Capital, Funds, Etc.)

19 2016/3/30 No data copy / No data transfer permitted
EPS
Consistently realize ROE of 15% and double EPS over 5-year period of 16CSP
(JPY)Path to ROE of 15% and doubled EPS
-5%
0%
5%
10%
15%
20%
-50
0
50
100
150
200
250
300
350
FY2013FY2014FY2015FY2016FY2017FY2018FY2019FY2020FY2021
EPS
ROE
Consistently realize ROE of 15% through balanced improvements in profitability, business growth, and financial soundness
Double EPS (vs FY2016)2
1
16CSP
2
1
Double EPS (to ¥320)
¥163
Consistently realize ROE of 15%
Medium-Term Vision

Todayʼs Agenda
20 2016/3/30 No data copy / No data transfer permitted
1. Financial Strategy Directives
2. Management Goals
3. Performance Indices and Targets
4. Targets for Business Segments
5. Management Emphasizing ROE
Profitability: Ratio of Net Income to Net Sales
Asset Efficiency: Total Asset Turnover
Financial Leverage
6. Operating Margin Improvement
7. EPS
8. Policies for Allocating Management Resources (Capital, Funds, Etc.)

21 2016/3/30 No data copy / No data transfer permitted
Policies for Allocating Management Resources (Capital, Funds, Etc.)After securing stable financial base, prioritize allocation of funds toward growth investments in Medical Business and use remainder of funds to provide shareholders with appropriate returns
Growthinvestments
Shareholderreturns
Continue conducting growth investments to accelerate growth speed centered on Medical Business Staff investments: Effectively utilize resources in cross-Company manner
and conduct investments primarily aimed at Medical Business and highly specialized fields
Capital expenditures: Increase amounts of production equipment, demo products, and loaners in conjunction with sales growth centered on Medical Business
R&D investments: Conduct investments with balanced distribution for new product development, next-generation product technology creation, and new technology research
Primarily pursue organic growth while considering M&A when necessary for advancing strategies
Increase total return ratio (to 30%)
Prioritize reinforcement of financial base in consideration of business characteristics and risks and stably increase equity capital (equity ratio of 50%)
Financial soundness
1
2
Internalreserves
Cashoutflows
Management resources(capital, funds, etc.)