Embed Size (px)
Citation preview

Cover
Page 1
Name of entity - UNITED PHOSPHORUS LTD Status - PUBLIC LIMITED COMPANY
Financial Year - 2011-12
Cover
Page 2
Name of entity - UNITED PHOSPHORUS LTD Status - PUBLIC LIMITED COMPANY
Financial Year - 2011-12

Cover
Page 3
Name of entity - UNITED PHOSPHORUS LTD Status - PUBLIC LIMITED COMPANY
Financial Year - 2011-12

fin stat
Page 4
Balance Sheet as at March 31,2012Particular Rs. In Lakhs Rs. In LakhsEquity and Liabilities
Own fundsCapital 9,236.00Reserve and surplus 341,366.00
350,602.00
Non-current liabilitiesLong term borrowing 110,000.00Deffered tax liabilities 8,278.00Other long term liabilities 13,600.00Long term provisions 0.00
Current liabilitiesShort term borrowing 35,158.00Trade payables 61,866.00Other current liabilities 31,392.00Short term provisions 15,516.00
143,932.00
Total 626,412.00
Asset
Non current assetsFixed assets 148,906.00Non-current investment 65,712.00Long term loans, advances and deposities 104,737.00other non-current assets 0.00
Current AssetsCurrent investments 12,500.00Inventories 55,003.00Trade receivables 138,999.00Cash and cash equivalent 9,753.00Short-term loans and advances 81,868.00Other Current assets 8,934.00
307,057.00
Total 626,412.00
Diff 0.00
fin stat
Page 5
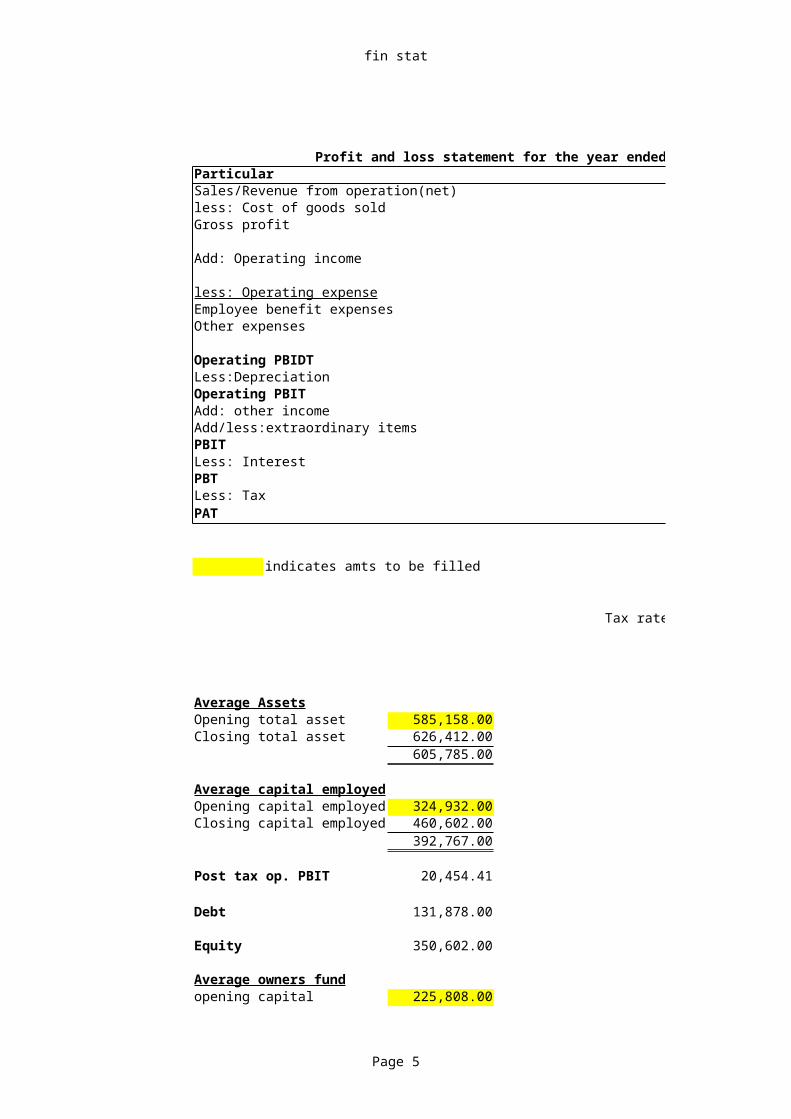
Profit and loss statement for the year ended March 31,2012ParticularSales/Revenue from operation(net)less: Cost of goods soldGross profit
Add: Operating income
less: Operating expenseEmployee benefit expensesOther expenses
Operating PBIDTLess:DepreciationOperating PBITAdd: other incomeAdd/less:extraordinary itemsPBITLess: InterestPBTLess: TaxPAT
indicates amts to be filled
Tax rate
Average AssetsOpening total asset 585,158.00Closing total asset 626,412.00
605,785.00
Average capital employedOpening capital employed 324,932.00Closing capital employed 460,602.00
392,767.00
Post tax op. PBIT 20,454.41
Debt 131,878.00
Equity 350,602.00
Average owners fundopening capital 225,808.00

fin stat
Page 6
closing capital 350,602.00288,205.00
Average inventory 47,953.50

fin stat
Page 7
Profit and loss statement for the year ended March 31,2012Rs. In Lakhs Rs. In Lakhs
321,700.00178,335.00
143,365.00
9,101.00
18,465.0087,667.00
106,132.0046,334.0014,349.0031,985.0015,149.00
0.0047,134.0016,437.0030,697.00
7,993.0022,704.00
0.3605
10.30%20.60%30.90%41.20%51.50%36.05%

Ratio
Page 8
Working capital 163125 Quick asset
Net worth 350,602.00 Book value per share
Profitability ratios Liquidity ratios
Gross profit Margin 44.56% Current ratio
Operating profit margin 9.94% Quick ratio
Net profit margin 7.06% Debt and Risk ratio
Return on asset(ROA) 3.62% Interest coverage ratio
Return on investment(ROI) 3.75% Leverage
Return on net worth(RONW) 6.48% Financial leverage
Return on long term funds 4.44% Low DOL and High DFL is preffered
Return on owners capital 7.88%
Individual Expense ratioSuggestion:
Employee benefit expenses 5.73981971% 1)improve capital turnover ratio and inventory turnover ratioOther expenses 27.25116568% 2)Profitability ratio needs attention

Ratio
Page 9
Quick asset 252054 Closing price on 02/05/2012 119.75
Book value per share 75.92004226 No. of shares 461804274
Liquidity ratios Cash position ratio
Current ratio 2.133347692 Absolute cash ratio 0.154607731
Quick ratio 1.751201956
Debt and Risk ratio Capital structure ratios
Interest coverage ratio 2.867554907 Debt equity ratio 0.376147312
Leverage Debt ratio 29%
Financial leverage 1.535459491 Fixed asset to long term funds 0.323285613
Low DOL and High DFL is preffered Proprietary ratio 56%
1)improve capital turnover ratio and inventory turnover ratio2)Profitability ratio needs attention

Ratio
Page 10
CMP/BV 1.577317
Turnover ratio
Capital turnover ratio 0.819061
Fixed asste turnover ratio 2.160423
Working capital turnover ratio 1.972107
Inventory turnover ratio 3.718915

If you make any changes please share it with everyone