Embed Size (px)
Citation preview
Financial Statements December 31, 2016
IFRS in US$
2
Vale S.A. Financial Statements Contents
Page Report of independent registered public accounting firm 3 Management’s Report on Internal Control over Financial Reporting 5 Consolidated Income Statement 6 Consolidated Statement of Comprehensive Income 7 Consolidated Statement of Cash Flows 8 Consolidated Statement of Financial Position 9 Consolidated Statement of Changes in Equity 10 Notes to the Financial Statements 11
1. Corporate information 2. Basis for preparation of the financial statements 3. Information by business segment and by geographic area 4. Special events occurred during the year 5. Costs and expenses by nature 6. Financial results 7. Deferred revenue - Gold stream transaction 8. Income taxes 9. Basic and diluted earnings (loss) per share 10. Accounts receivable 11. Inventories 12. Recoverable taxes 13. Other financial assets and liabilities 14. Non-current assets and liabilities held for sale and discontinued operations 15. Investments in associates and joint ventures 16. Noncontrolling interest 17. Intangibles 18. Property, plant and equipment 19. Impairment and onerous contracts 20. Loans, borrowings and cash and cash equivalents 21. Liabilities related to associates and joint ventures 22. Risk management 23. Financial instruments classification 24. Fair value estimate 25. Derivative financial instruments 26. Provisions 27. Asset retirement obligations 28. Litigation 29. Employee benefits 30. Stockholders’ equity 31. Related parties 32. Commitments 33. Additional information about derivatives financial instruments
Members of the Board of Directors, Fiscal Council, Advisory Committees and Executive Officers 77
3
Report of Independent Registered Public Accounting Firm The Board of Directors and Stockholders of
Vale S.A.
Rio de Janeiro – RJ We have audited the accompanying consolidated statements of financial position of Vale S.A. and subsidiaries (“Vale” or
“the Company”) as of December 31, 2016 and 2015, and the related consolidated statements of income, comprehensive
income, changes in equity and cash flows for each of the years in the three-year period ended December 31, 2016. We
also have audited Vale’s internal control over financial reporting as of December 31, 2016, based on criteria established
in Internal Control – Integrated Framework (2013) issued by the Committee of Sponsoring Organizations of the
Treadway Commission (COSO). Vale’s management is responsible for these consolidated financial statements, for
maintaining effective internal control over financial reporting, and for its assessment of the effectiveness of internal
control over financial reporting, included in the accompanying Management’s Report on Internal Control over Financial
Reporting. Our responsibility is to express an opinion on these consolidated financial statements and an opinion on Vale’s
internal control over financial reporting based on our audits.
We conducted our audits in accordance with the standards of the Public Company Accounting Oversight Board (United
States). Those standards require that we plan and perform the audit to obtain reasonable assurance about whether the
financial statements are free of material misstatement and whether effective internal control over financial reporting was
maintained in all material respects. Our audits of the consolidated financial statements included examining, on a test
basis, evidence supporting the amounts and disclosures in the financial statements, assessing the accounting principles
used and significant estimates made by management, and evaluating the overall financial statement presentation. Our
audit of internal control over financial reporting included obtaining an understanding of internal control over financial
reporting, assessing the risk that a material weakness exists, and testing and evaluating the design and operating
effectiveness of internal control based on the assessed risk. Our audits also included performing such other procedures as
we considered necessary in the circumstances. We believe that our audits provides a reasonable basis for our opinions.
A company’s internal control over financial reporting is a process designed to provide reasonable assurance regarding the reliability of financial reporting and the preparation of financial statements for external purposes in accordance with generally accepted accounting principles. A company’s internal control over financial reporting includes those policies and procedures that (1) pertain to the maintenance of records that, in reasonable detail, accurately and fairly reflect the transactions and dispositions of the assets of the company; (2) provide reasonable assurance that transactions are recorded as necessary to permit preparation of financial statements in accordance with generally accepted accounting principles, and that receipts and expenditures of the company are being made only in accordance with authorizations of management and directors of the company; and (3) provide reasonable assurance regarding prevention or timely detection of unauthorized acquisition, use, or disposition of the company’s assets that could have a material effect on the financial statements.
KPMG Auditores Independentes Av. Almirante Barroso, 52 - 4º 20031-000 - Rio de Janeiro, RJ - Brasil Caixa Postal 2888 20001-970 - Rio de Janeiro, RJ - Brasil
Central Tel 55 (21) 3515-9400 Fax 55 (21) 3515-9000 Internet www.kpmg.com.br
KPMG Auditores Independentes, uma sociedade simples brasileira e
firma-membro da rede KPMG de firmas-membro independentes e
afiliadas à KPMG International Cooperative (“KPMG International”),
uma entidade suíça.
KPMG Auditores Independentes, a Brazilian entity and a member firm
of the KPMG network of independent member firms affiliated with
KPMG International Cooperative (“KPMG International”), a Swiss
entity.
4
Because of its inherent limitations, internal control over financial reporting may not prevent or detect misstatements.
Also, projections of any evaluation of effectiveness to future periods are subject to the risk that controls may become
inadequate because of changes in conditions, or that the degree of compliance with the policies or procedures may
deteriorate.
In our opinion, the consolidated financial statements referred to above present fairly, in all material respects, the financial
position of Vale S.A. and subsidiaries as of December 31, 2016 and 2015, and the results of its operations and its cash
flows for each of the years in the three-year period ended December 31, 2016, in conformity with International Financial
Reporting Standards as issued by the International Accounting Standards Board. Also in our opinion, Vale maintained, in
all material respects, effective internal control over financial reporting as of December 31, 2016, based on criteria
established in Internal Control – Integrated Framework (2013) issued by the Committee of Sponsoring Organizations of
the Treadway Commission (COSO).
/s/KPMG Auditores Independentes KPMG Auditores Independentes Rio de Janeiro, Brazil February 22, 2017
5
Management’s Report on Internal Control over Financial Reporting The management of Vale S.A (Vale) is responsible for establishing and maintaining adequate internal control over financial reporting. The Vale’s internal control over financial reporting is a process designed to provide reasonable assurance regarding the reliability of financial reporting and the preparation of financial statements for external purposes in accordance with generally accepted accounting principles. The company’s internal control over financial reporting includes those policies and procedures that: (i) pertain to the maintenance of records that, in reasonable detail, accurately and fairly reflect the transactions and dispositions of the assets of the company; (ii) provide reasonable assurance that transactions are recorded to permit preparation of financial statements in accordance with generally accepted accounting principles, and that receipts and expenditures of the company are being made only in accordance with authorizations of management and directors of the company; and (iii) provide reasonable assurance regarding prevention or timely detection of unauthorized acquisition, use, or disposition of the company’s assets that could have a material effect on the financial statements. Because of its inherent limitations, internal control over financial reporting may not prevent or detect misstatements. Also, projections of any evaluation of the effectiveness to future periods are subject to the risk that controls may become inadequate because of changes in conditions, and that the degree of compliance with the policies or procedures may deteriorate. Vale’s management has assessed the effectiveness of the company’s internal control over financial reporting as of December 31, 2016 based on the criteria established in Internal Control – Integrated Framework (2013) issued by the Committee of Sponsoring Organizations of the Treadway Commission (COSO). Based on such assessment and criteria, Vale’s management has concluded that the company’s internal control over financial reporting are effective as of December 31, 2016. The effectiveness of the company’s internal control over financial reporting as of December 31, 2016 has been audited by KPMG Auditores Independentes, an independent registered public accounting firm, as stated in their report which appears herein. February 22nd, 2017 /s/Murilo Ferreira Murilo Ferreira Chief Executive Officer /s/Luciano Siani Luciano Siani Chief Financial Officer and Investors Relations
6
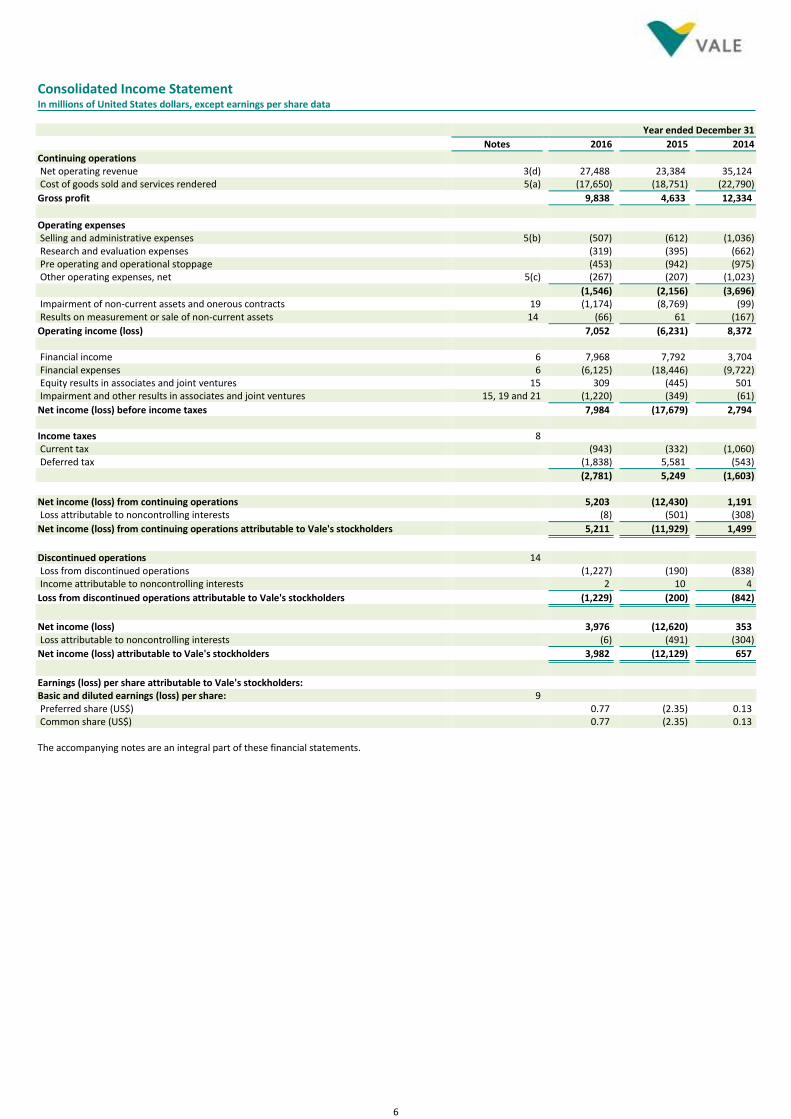
Consolidated Income Statement In millions of United States dollars, except earnings per share data Year ended December 31
Notes 2016 2015 2014
Continuing operations Net operating revenue 3(d) 27,488 23,384 35,124 Cost of goods sold and services rendered 5(a) (17,650) (18,751) (22,790)
Gross profit 9,838 4,633 12,334
Operating expenses Selling and administrative expenses 5(b) (507) (612) (1,036) Research and evaluation expenses (319) (395) (662) Pre operating and operational stoppage (453) (942) (975) Other operating expenses, net 5(c) (267) (207) (1,023)
(1,546) (2,156) (3,696) Impairment of non-current assets and onerous contracts 19 (1,174) (8,769) (99) Results on measurement or sale of non-current assets 14 (66) 61 (167)
Operating income (loss) 7,052 (6,231) 8,372 Financial income 6 7,968 7,792 3,704 Financial expenses 6 (6,125) (18,446) (9,722) Equity results in associates and joint ventures 15 309 (445) 501 Impairment and other results in associates and joint ventures 15, 19 and 21 (1,220) (349) (61)
Net income (loss) before income taxes 7,984 (17,679) 2,794 Income taxes 8 Current tax (943) (332) (1,060) Deferred tax (1,838) 5,581 (543)
(2,781) 5,249 (1,603) Net income (loss) from continuing operations 5,203 (12,430) 1,191 Loss attributable to noncontrolling interests (8) (501) (308)
Net income (loss) from continuing operations attributable to Vale's stockholders 5,211 (11,929) 1,499
Discontinued operations 14 Loss from discontinued operations (1,227) (190) (838) Income attributable to noncontrolling interests 2 10 4
Loss from discontinued operations attributable to Vale's stockholders (1,229) (200) (842)
Net income (loss) 3,976 (12,620) 353 Loss attributable to noncontrolling interests (6) (491) (304)
Net income (loss) attributable to Vale's stockholders 3,982 (12,129) 657
Earnings (loss) per share attributable to Vale's stockholders: Basic and diluted earnings (loss) per share: 9 Preferred share (US$) 0.77 (2.35) 0.13 Common share (US$) 0.77 (2.35) 0.13 The accompanying notes are an integral part of these financial statements.
7
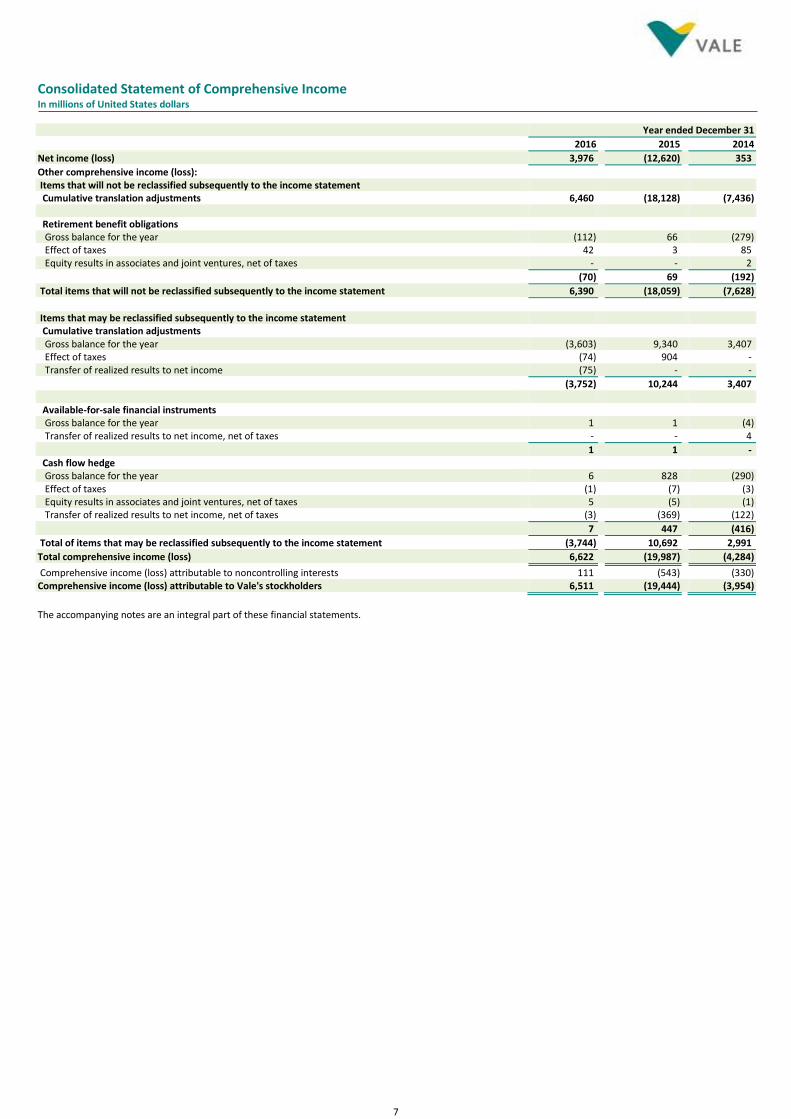
Consolidated Statement of Comprehensive Income In millions of United States dollars Year ended December 31
2016 2015 2014
Net income (loss) 3,976 (12,620) 353
Other comprehensive income (loss): Items that will not be reclassified subsequently to the income statement Cumulative translation adjustments 6,460 (18,128) (7,436) Retirement benefit obligations Gross balance for the year (112) 66 (279) Effect of taxes 42 3 85 Equity results in associates and joint ventures, net of taxes - - 2
(70) 69 (192)
Total items that will not be reclassified subsequently to the income statement 6,390 (18,059) (7,628)
Items that may be reclassified subsequently to the income statement Cumulative translation adjustments Gross balance for the year (3,603) 9,340 3,407 Effect of taxes (74) 904 - Transfer of realized results to net income (75) - -
(3,752) 10,244 3,407 Available-for-sale financial instruments Gross balance for the year 1 1 (4) Transfer of realized results to net income, net of taxes - - 4
1 1 - Cash flow hedge Gross balance for the year 6 828 (290) Effect of taxes (1) (7) (3) Equity results in associates and joint ventures, net of taxes 5 (5) (1) Transfer of realized results to net income, net of taxes (3) (369) (122)
7 447 (416)
Total of items that may be reclassified subsequently to the income statement (3,744) 10,692 2,991
Total comprehensive income (loss) 6,622 (19,987) (4,284)
Comprehensive income (loss) attributable to noncontrolling interests 111 (543) (330) Comprehensive income (loss) attributable to Vale's stockholders 6,511 (19,444) (3,954)
The accompanying notes are an integral part of these financial statements.
8
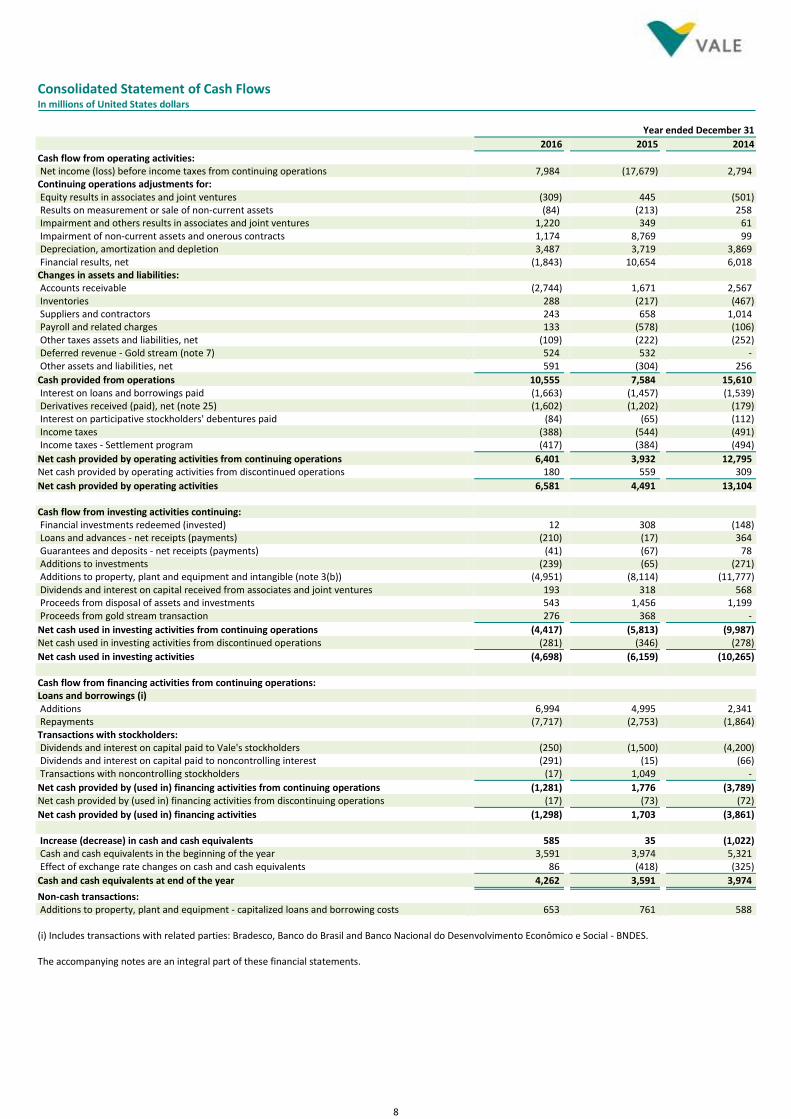
Consolidated Statement of Cash Flows In millions of United States dollars Year ended December 31
2016 2015 2014
Cash flow from operating activities: Net income (loss) before income taxes from continuing operations 7,984 (17,679) 2,794 Continuing operations adjustments for: Equity results in associates and joint ventures (309) 445 (501) Results on measurement or sale of non-current assets (84) (213) 258 Impairment and others results in associates and joint ventures 1,220 349 61 Impairment of non-current assets and onerous contracts 1,174 8,769 99 Depreciation, amortization and depletion 3,487 3,719 3,869 Financial results, net (1,843) 10,654 6,018 Changes in assets and liabilities: Accounts receivable (2,744) 1,671 2,567 Inventories 288 (217) (467) Suppliers and contractors 243 658 1,014 Payroll and related charges 133 (578) (106) Other taxes assets and liabilities, net (109) (222) (252) Deferred revenue - Gold stream (note 7) 524 532 - Other assets and liabilities, net 591 (304) 256
Cash provided from operations 10,555 7,584 15,610 Interest on loans and borrowings paid (1,663) (1,457) (1,539) Derivatives received (paid), net (note 25) (1,602) (1,202) (179) Interest on participative stockholders' debentures paid (84) (65) (112) Income taxes (388) (544) (491) Income taxes - Settlement program (417) (384) (494)
Net cash provided by operating activities from continuing operations 6,401 3,932 12,795 Net cash provided by operating activities from discontinued operations 180 559 309
Net cash provided by operating activities 6,581 4,491 13,104 Cash flow from investing activities continuing: Financial investments redeemed (invested) 12 308 (148) Loans and advances - net receipts (payments) (210) (17) 364 Guarantees and deposits - net receipts (payments) (41) (67) 78 Additions to investments (239) (65) (271) Additions to property, plant and equipment and intangible (note 3(b)) (4,951) (8,114) (11,777) Dividends and interest on capital received from associates and joint ventures 193 318 568 Proceeds from disposal of assets and investments 543 1,456 1,199 Proceeds from gold stream transaction 276 368 -
Net cash used in investing activities from continuing operations (4,417) (5,813) (9,987) Net cash used in investing activities from discontinued operations (281) (346) (278)
Net cash used in investing activities (4,698) (6,159) (10,265) Cash flow from financing activities from continuing operations: Loans and borrowings (i) Additions 6,994 4,995 2,341 Repayments (7,717) (2,753) (1,864) Transactions with stockholders: Dividends and interest on capital paid to Vale's stockholders (250) (1,500) (4,200) Dividends and interest on capital paid to noncontrolling interest (291) (15) (66) Transactions with noncontrolling stockholders (17) 1,049 -
Net cash provided by (used in) financing activities from continuing operations (1,281) 1,776 (3,789) Net cash provided by (used in) financing activities from discontinuing operations (17) (73) (72)
Net cash provided by (used in) financing activities (1,298) 1,703 (3,861) Increase (decrease) in cash and cash equivalents 585 35 (1,022) Cash and cash equivalents in the beginning of the year 3,591 3,974 5,321 Effect of exchange rate changes on cash and cash equivalents 86 (418) (325)
Cash and cash equivalents at end of the year 4,262 3,591 3,974
Non-cash transactions: Additions to property, plant and equipment - capitalized loans and borrowing costs 653 761 588 (i) Includes transactions with related parties: Bradesco, Banco do Brasil and Banco Nacional do Desenvolvimento Econômico e Social - BNDES. The accompanying notes are an integral part of these financial statements.
9
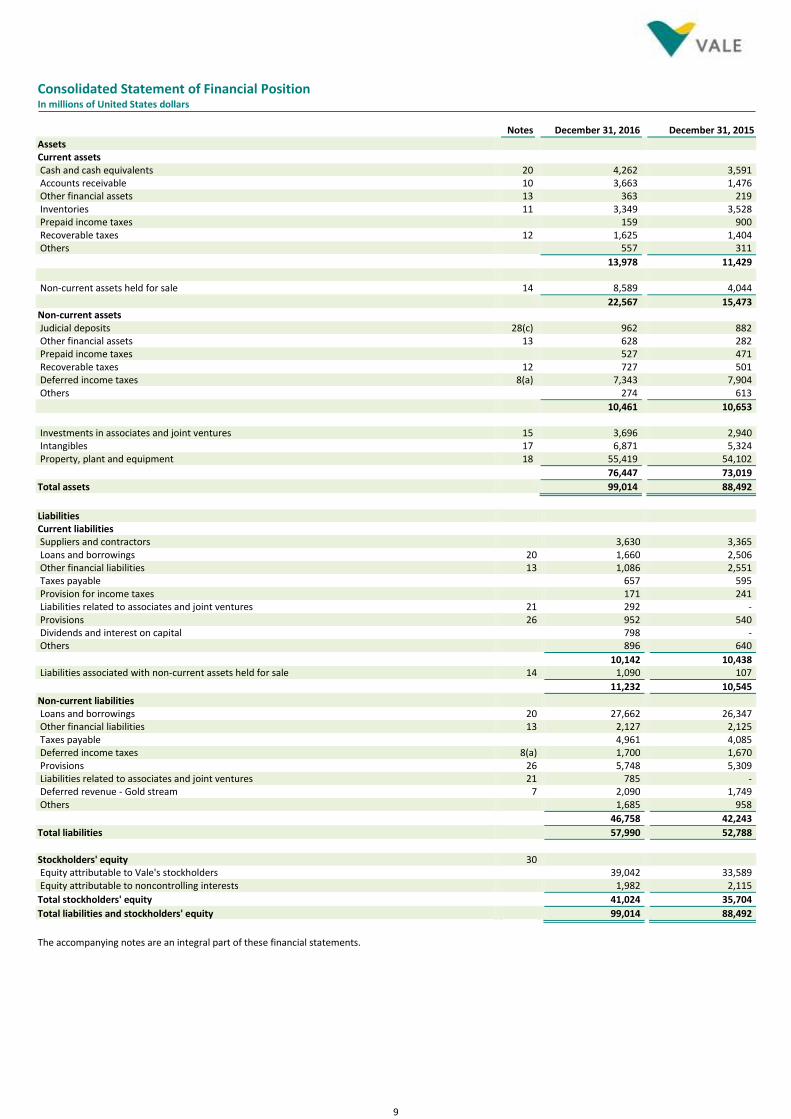
Consolidated Statement of Financial Position In millions of United States dollars Notes December 31, 2016 December 31, 2015
Assets Current assets Cash and cash equivalents 20 4,262 3,591 Accounts receivable 10 3,663 1,476 Other financial assets 13 363 219 Inventories 11 3,349 3,528 Prepaid income taxes 159 900 Recoverable taxes 12 1,625 1,404 Others 557 311
13,978 11,429 Non-current assets held for sale 14 8,589 4,044
22,567 15,473 Non-current assets Judicial deposits 28(c) 962 882 Other financial assets 13 628 282 Prepaid income taxes 527 471 Recoverable taxes 12 727 501 Deferred income taxes 8(a) 7,343 7,904 Others 274 613
10,461 10,653 Investments in associates and joint ventures 15 3,696 2,940 Intangibles 17 6,871 5,324 Property, plant and equipment 18 55,419 54,102
76,447 73,019
Total assets 99,014 88,492
Liabilities Current liabilities Suppliers and contractors 3,630 3,365 Loans and borrowings 20 1,660 2,506 Other financial liabilities 13 1,086 2,551 Taxes payable 657 595 Provision for income taxes 171 241 Liabilities related to associates and joint ventures 21 292 - Provisions 26 952 540 Dividends and interest on capital 798 - Others 896 640
10,142 10,438 Liabilities associated with non-current assets held for sale 14 1,090 107
11,232 10,545
Non-current liabilities Loans and borrowings 20 27,662 26,347 Other financial liabilities 13 2,127 2,125 Taxes payable 4,961 4,085 Deferred income taxes 8(a) 1,700 1,670 Provisions 26 5,748 5,309 Liabilities related to associates and joint ventures 21 785 - Deferred revenue - Gold stream 7 2,090 1,749 Others 1,685 958
46,758 42,243
Total liabilities 57,990 52,788
Stockholders' equity 30 Equity attributable to Vale's stockholders 39,042 33,589 Equity attributable to noncontrolling interests 1,982 2,115
Total stockholders' equity 41,024 35,704
Total liabilities and stockholders' equity 99,014 88,492
The accompanying notes are an integral part of these financial statements.
10
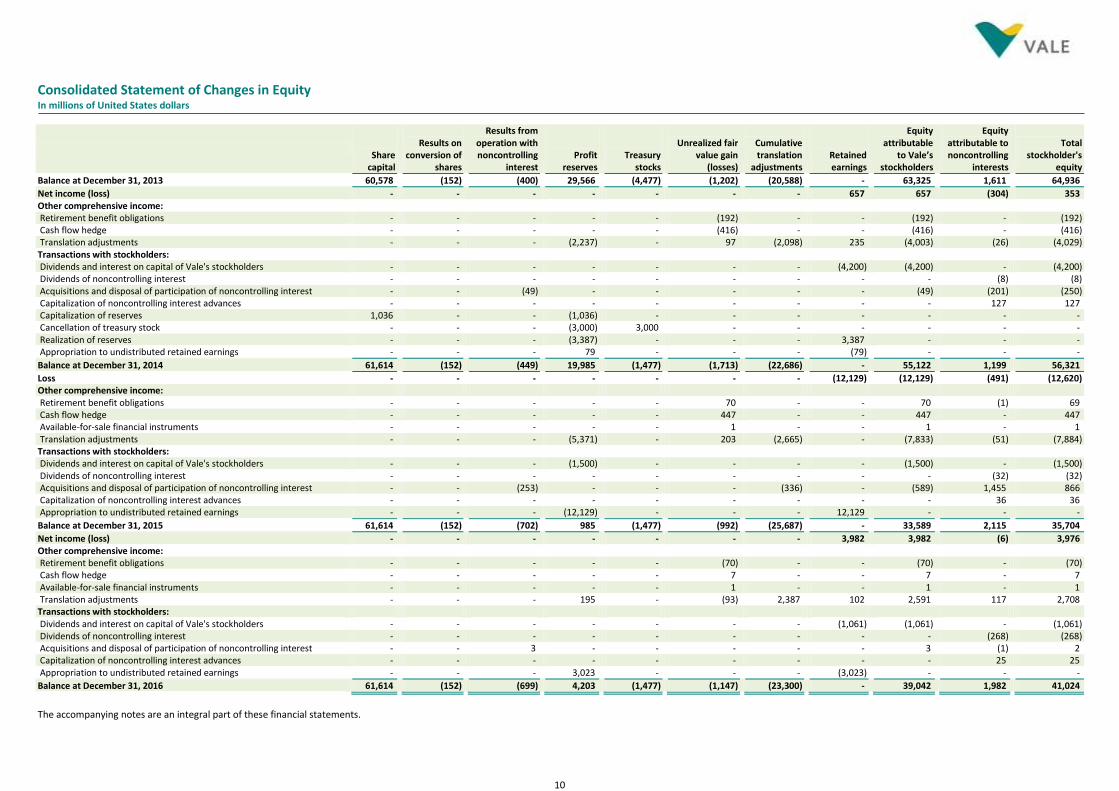
Consolidated Statement of Changes in Equity In millions of United States dollars
Share
capital
Results on conversion of
shares
Results from operation with noncontrolling
interest Profit
reserves Treasury
stocks
Unrealized fair value gain
(losses)
Cumulative translation
adjustments Retained earnings
Equity attributable
to Vale’s stockholders
Equity attributable to noncontrolling
interests
Total stockholder's
equity
Balance at December 31, 2013 60,578 (152) (400) 29,566 (4,477) (1,202) (20,588) - 63,325 1,611 64,936
Net income (loss) - - - - - - - 657 657 (304) 353 Other comprehensive income: Retirement benefit obligations - - - - - (192) - - (192) - (192) Cash flow hedge - - - - - (416) - - (416) - (416) Translation adjustments - - - (2,237) - 97 (2,098) 235 (4,003) (26) (4,029) Transactions with stockholders: Dividends and interest on capital of Vale's stockholders - - - - - - - (4,200) (4,200) - (4,200) Dividends of noncontrolling interest - - - - - - - - - (8) (8) Acquisitions and disposal of participation of noncontrolling interest - - (49) - - - - - (49) (201) (250) Capitalization of noncontrolling interest advances - - - - - - - - - 127 127 Capitalization of reserves 1,036 - - (1,036) - - - - - - - Cancellation of treasury stock - - - (3,000) 3,000 - - - - - - Realization of reserves - - - (3,387) - - - 3,387 - - - Appropriation to undistributed retained earnings - - - 79 - - - (79) - - -
Balance at December 31, 2014 61,614 (152) (449) 19,985 (1,477) (1,713) (22,686) - 55,122 1,199 56,321
Loss - - - - - - - (12,129) (12,129) (491) (12,620) Other comprehensive income: Retirement benefit obligations - - - - - 70 - - 70 (1) 69 Cash flow hedge - - - - - 447 - - 447 - 447 Available-for-sale financial instruments - - - - - 1 - - 1 - 1 Translation adjustments - - - (5,371) - 203 (2,665) - (7,833) (51) (7,884) Transactions with stockholders: Dividends and interest on capital of Vale's stockholders - - - (1,500) - - - - (1,500) - (1,500) Dividends of noncontrolling interest - - - - - - - - - (32) (32) Acquisitions and disposal of participation of noncontrolling interest - - (253) - - - (336) - (589) 1,455 866 Capitalization of noncontrolling interest advances - - - - - - - - - 36 36 Appropriation to undistributed retained earnings - - - (12,129) - - - 12,129 - - -
Balance at December 31, 2015 61,614 (152) (702) 985 (1,477) (992) (25,687) - 33,589 2,115 35,704
Net income (loss) - - - - - - - 3,982 3,982 (6) 3,976 Other comprehensive income: Retirement benefit obligations - - - - - (70) - - (70) - (70) Cash flow hedge - - - - - 7 - - 7 - 7 Available-for-sale financial instruments - - - - - 1 - - 1 - 1 Translation adjustments - - - 195 - (93) 2,387 102 2,591 117 2,708 Transactions with stockholders: Dividends and interest on capital of Vale's stockholders - - - - - - - (1,061) (1,061) - (1,061) Dividends of noncontrolling interest - - - - - - - - - (268) (268) Acquisitions and disposal of participation of noncontrolling interest - - 3 - - - - - 3 (1) 2 Capitalization of noncontrolling interest advances - - - - - - - - - 25 25 Appropriation to undistributed retained earnings - - - 3,023 - - - (3,023) - - -
Balance at December 31, 2016 61,614 (152) (699) 4,203 (1,477) (1,147) (23,300) - 39,042 1,982 41,024
The accompanying notes are an integral part of these financial statements.
11
Notes to the Financial Statements Expressed in millions of United States dollar, unless otherwise stated
1. Corporate information Vale S.A. (the “Parent Company”) is a public company headquartered at 700, Avenida das Américas, Rio de Janeiro, Brazil with securities traded on the stock exchanges of São Paulo - BM&F BOVESPA (Vale3 and Vale5), New York - NYSE (VALE and VALE.P), Paris - NYSE Euronext (Vale3 and Vale5) and Madrid – LATIBEX (XVALO and XVALP). Vale and its direct and indirect subsidiaries (“Vale”, “Group” or “Company”) are global producers of iron ore and iron ore pellets, key raw materials for steelmaking, and producers of nickel, which is used to produce stainless steel and metal alloys employed in the production of several products. The Group also produces copper, metallurgical and thermal coal, potash, phosphates and other fertilizer nutrients, manganese ore, ferroalloys, platinum group metals, gold, silver and cobalt. The information by segment is presented in note 3.
2. Basis for preparation of the financial statements a) Statement of compliance The consolidated financial statements of the Company (“financial statements”) present the accounts of the Group and have been prepared in accordance with the International Financial Reporting Standards (“IFRS”) as issued by the International Accounting Standards Board (“IASB”). b) Basis of presentation The financial statements have been prepared under the historical cost convention as adjusted to reflect: (i) the fair value of financial instruments measured at fair value through income statement or available-for-sale financial instruments measured at fair value through the statement of comprehensive income; and (ii) impairment of assets. The comparative information for the years ended December 31, 2015 and 2014 was re-presented for the purposes of applying IFRS 5 "Non-current assets held for sale and discontinued operations" after approval by the Board of Directors of the sale of the fertilizers assets, as presented in Note 14. Subsequent events were evaluated through February 22, 2017, which is the date the financial statements were approved by the Board of Directors.
c) Consolidation and investments in associates and joint ventures
The financial statements reflect the assets, liabilities and transactions of the Parent Company and its direct and indirect controlled entities (“subsidiaries”). Intercompany balances and transactions, which include unrealized profits, are eliminated. Subsidiaries over which control is achieved through other means, such as stockholders agreement, are also consolidated even if the Company does not own a majority of the voting capital. The entities over which the Company has joint control (“joint ventures”) or significant influence, but not control (“associates”) are presented in note 15. Those investments are accounted for using the equity method. For interests in joint arrangements not classified as ‘joint ventures’ (“joint operations”), the Company recognizes its share of assets, liabilities and net income. Unrealized gains on downstream or upstream transactions between the Company and its associates and joint ventures are eliminated fully or proportionately to the Company’s interest.
12
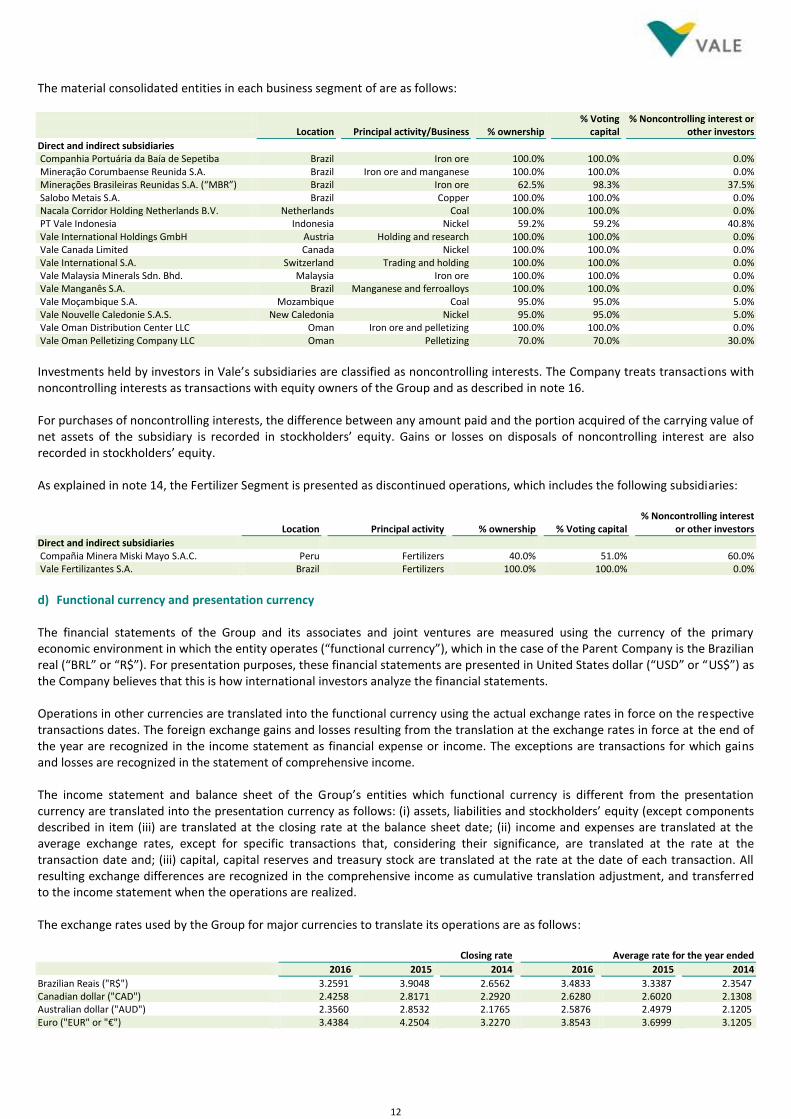
The material consolidated entities in each business segment of are as follows:
Location Principal activity/Business % ownership
% Voting capital
% Noncontrolling interest or other investors
Direct and indirect subsidiaries Companhia Portuária da Baía de Sepetiba Brazil Iron ore 100.0% 100.0% 0.0% Mineração Corumbaense Reunida S.A. Brazil Iron ore and manganese 100.0% 100.0% 0.0% Minerações Brasileiras Reunidas S.A. (“MBR”) Brazil Iron ore 62.5% 98.3% 37.5% Salobo Metais S.A. Brazil Copper 100.0% 100.0% 0.0% Nacala Corridor Holding Netherlands B.V. Netherlands Coal 100.0% 100.0% 0.0% PT Vale Indonesia Indonesia Nickel 59.2% 59.2% 40.8% Vale International Holdings GmbH Austria Holding and research 100.0% 100.0% 0.0% Vale Canada Limited Canada Nickel 100.0% 100.0% 0.0% Vale International S.A. Switzerland Trading and holding 100.0% 100.0% 0.0% Vale Malaysia Minerals Sdn. Bhd. Malaysia Iron ore 100.0% 100.0% 0.0% Vale Manganês S.A. Brazil Manganese and ferroalloys 100.0% 100.0% 0.0% Vale Moçambique S.A. Mozambique Coal 95.0% 95.0% 5.0% Vale Nouvelle Caledonie S.A.S. New Caledonia Nickel 95.0% 95.0% 5.0% Vale Oman Distribution Center LLC Oman Iron ore and pelletizing 100.0% 100.0% 0.0% Vale Oman Pelletizing Company LLC Oman Pelletizing 70.0% 70.0% 30.0%
Investments held by investors in Vale’s subsidiaries are classified as noncontrolling interests. The Company treats transactions with noncontrolling interests as transactions with equity owners of the Group and as described in note 16. For purchases of noncontrolling interests, the difference between any amount paid and the portion acquired of the carrying value of net assets of the subsidiary is recorded in stockholders’ equity. Gains or losses on disposals of noncontrolling interest are also recorded in stockholders’ equity. As explained in note 14, the Fertilizer Segment is presented as discontinued operations, which includes the following subsidiaries:
Location Principal activity % ownership % Voting capital
% Noncontrolling interest or other investors
Direct and indirect subsidiaries Compañia Minera Miski Mayo S.A.C. Peru Fertilizers 40.0% 51.0% 60.0% Vale Fertilizantes S.A. Brazil Fertilizers 100.0% 100.0% 0.0%
d) Functional currency and presentation currency The financial statements of the Group and its associates and joint ventures are measured using the currency of the primary economic environment in which the entity operates (“functional currency”), which in the case of the Parent Company is the Brazilian real (“BRL” or “R$”). For presentation purposes, these financial statements are presented in United States dollar (“USD” or “US$”) as the Company believes that this is how international investors analyze the financial statements. Operations in other currencies are translated into the functional currency using the actual exchange rates in force on the respective transactions dates. The foreign exchange gains and losses resulting from the translation at the exchange rates in force at the end of the year are recognized in the income statement as financial expense or income. The exceptions are transactions for which gains and losses are recognized in the statement of comprehensive income. The income statement and balance sheet of the Group’s entities which functional currency is different from the presentation currency are translated into the presentation currency as follows: (i) assets, liabilities and stockholders’ equity (except components described in item (iii) are translated at the closing rate at the balance sheet date; (ii) income and expenses are translated at the average exchange rates, except for specific transactions that, considering their significance, are translated at the rate at the transaction date and; (iii) capital, capital reserves and treasury stock are translated at the rate at the date of each transaction. All resulting exchange differences are recognized in the comprehensive income as cumulative translation adjustment, and transferred to the income statement when the operations are realized. The exchange rates used by the Group for major currencies to translate its operations are as follows: Closing rate Average rate for the year ended
2016 2015 2014 2016 2015 2014
Brazilian Reais ("R$") 3.2591 3.9048 2.6562 3.4833 3.3387 2.3547 Canadian dollar ("CAD") 2.4258 2.8171 2.2920 2.6280 2.6020 2.1308 Australian dollar ("AUD") 2.3560 2.8532 2.1765 2.5876 2.4979 2.1205 Euro ("EUR" or "€") 3.4384 4.2504 3.2270 3.8543 3.6999 3.1205
13
e) Significant accounting policies The accounting policies applied in financial statements are consistent with those adopted and disclosed in the financial statements of prior years. The Company has not early adopted any standards and interpretations that have been issued or amended but which are not yet in force. The accounting policies of subsidiaries, affiliates and joint ventures are adjusted to ensure consistency with the policies adopted by Vale. Significant and relevant accounting policies for the understanding of the financial statements were included in the respective notes, with a summary of the recognition and measurement basis used by the Company. The brief description of the recent accounting pronouncements issued by the IASB, which are not yet in force, and the current assessment did by the Company of the impacts on its financial statements, subject to changes due to the more analyzes in progress, are detailed below:
– IFRS 9 Financial instrument – In July 2014, the IASB issued the final version of IFRS 9 Financial Instruments that replaces IAS 39 Financial Instruments: Recognition and Measurement. This standard brings new approaches about: (i) classification and measurement of financial assets and liabilities, (ii) impairment and (iii) hedge accounting. This standard shall apply for annual periods beginning on or after January 1, 2018.
The Company does not plan the early adoption of this new standard. Based on the history of financial instruments traded by the Company, it is not expected significant impacts on financial statements by applying the IFRS 9 requirements.
– IFRS 15 Revenue from Contracts with Customers – In May 2014, the IASB issued IFRS 15, which replaces IAS 18 Revenues and the related interpretations. IFRS 15 introduces the five-step model for revenue recognition from contract with a customer. The new standard is based on the principle that revenue is recognized when the control of a good or service to be transferred to a customer in an amount that reflects the consideration to which the entity expects to be entitled in exchange for those goods or services. This standard shall apply for annual periods beginning on or after January 1, 2018.
The Company plans to adopt the new standard on the required effective date using the full retrospective method with the practical expedients approach for concluded contracts. During 2016, the Company performed a preliminary assessment of IFRS 15, which is subject to changes arising from a more detailed analysis of the contracts that are in process. Based on these preliminary analyzes, management is evaluating whether the freight service should be considered a separate performance obligation or not.
The Company expects to disclose quantitative information, if any, prior to the adoption of the standard.
– IFRS 16 Lease – In January 2016, the IASB issued IFRS 16, which replaces IAS 17 Leases and related interpretations. The IFRS 16 set forth that in all leases with a maturity of more than 12 months, with limited exceptions, the lessee must recognize the lease liability in the balance sheet at the present value of the payments, plus costs directly allocated and at the same time that it recognizes a right of use corresponding to the asset. During the term of the lease, the lease liability is adjusted to reflect interest and payment made and the right to use is amortized, similar to the financial lease settled up in accordance with IAS 17. This standard shall apply for annual periods beginning on or after January 1, 2019.
The Company has not yet quantified the impact of adopting IFRS 16 on its assets and liabilities. The quantitative effect of the adoption of IFRS 16 will depend specifically on the Company´s decision related to the method of transition, the use of practical expedients approach and exemptions for recognition, and any additional leases that Company will hold. The Company expects to disclose its transition approach and quantitative information prior to adoption, planned for January 1, 2019.
– IAS 7 Amendments (Disclosure Initiative) – The amendments to IAS 7 Statement of Cash Flows are part of the IASB’s Disclosure Initiative and require an entity to provide disclosures that enable users of financial statements to evaluate cash flows and non-cash changes in liabilities arising from financing activities. On initial application of the amendment, entities are not required to provide comparative information for preceding periods. These amendments are effective for annual periods beginning on or after 1 January 2017, with early application permitted. Application of the amendments will result in additional disclosures provided by the Group. The Company did not early adopt this amendment.
14
f) Critical accounting estimates and judgments The preparation of financial statements requires the use of certain critical accounting estimates, assumptions and judgments by the management of the Company. These estimates are based on the best knowledge and information existing at the balance sheet date. Changes in facts and circumstances may lead to the revision of these estimates. Actual future results may differ from the estimates. The significant estimates, assumptions and judgments used by Company in these financial statements are as follows:
Note Significant estimates, assumptions and judgments 3(c) Consolidation
7 Deferred revenue - Gold stream 8 Deferred income taxes
18 Mineral reserves and mine useful life 19 Impairment of non-current assets 21 Liabilities related to associates and joint ventures 24 Fair values of derivatives and others financial instruments 27 Asset retirement obligation 28 Litigation 29 Post-retirement benefits for employees
3. Information by business segment and by geographic area The Company divided its operations into five reportable segments: Ferrous Minerals, Coal, Base Metals, Fertilizers (presented as discontinued operations) and Others. The segments are aligned with products and reflect the structure used by Management to evaluate group performance. The responsible bodies for making operational decisions, allocating resources and evaluating performance include the Executive Boards and the Board of Directors, which use adjusted EBITDA as a measure of performance. The information presented to the Executive Board on the performance of each segment is derived from the accounting records, adjusted for reallocations between segments. The main activities of the operating segments are as follows: Ferrous minerals - Ferrous minerals comprises the production and extraction of ferrous minerals, as iron ore fines, iron ore pellets and its logistic services (railroads, ports and terminals), manganese and ferroalloys and others ferrous products and services. Coal - Coal comprises the extraction of metallurgical and thermal coal and its logistic services (railroads, ports and terminals). Base metals - Base metals include the production and extraction of non-ferrous minerals, and are presented as nickel and its by-products (ferro-nickel, copper, gold, precious metals and others) and copper (copper concentrated). Fertilizers (Discontinued operations) - Fertilizers include the production of the three major groups of nutrients (potash, phosphate and nitrogen) and other fertilizers products. The group of assets related to this segment is classified as "Non-current assets and liabilities held for sale" (note 14). Others - The segments of others comprise sales and expenses of other products, services and investments in joint ventures and associate in other business.
15
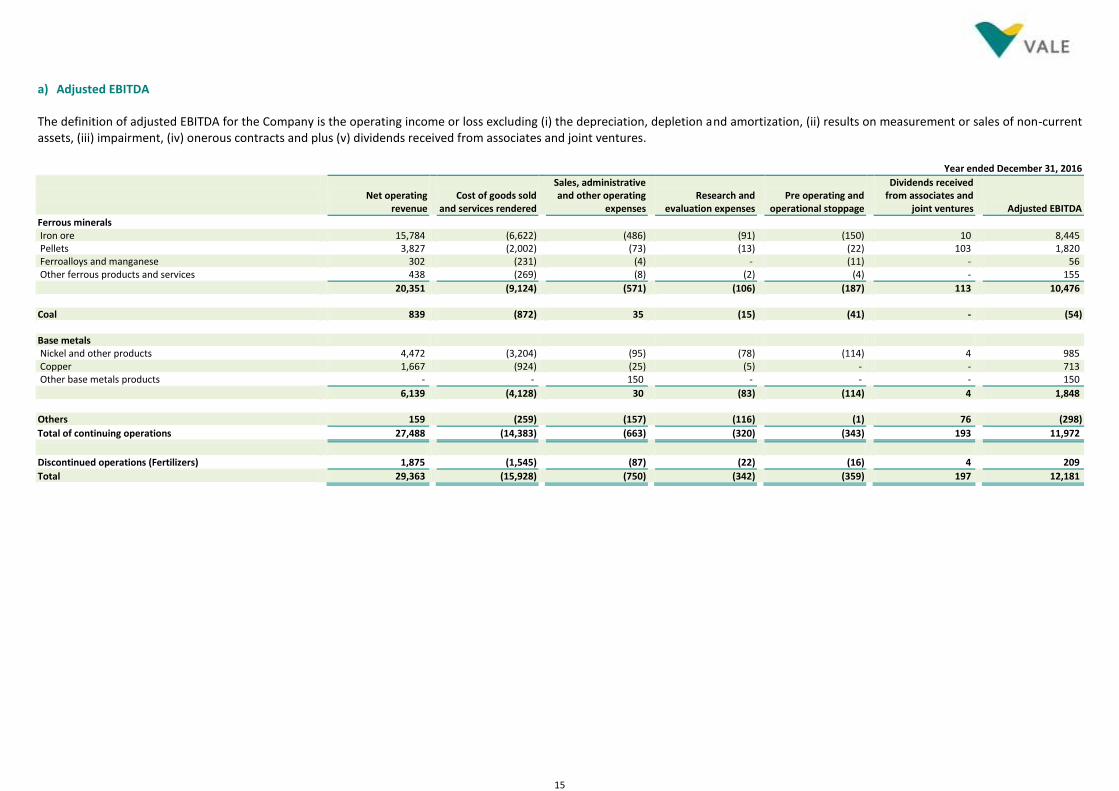
a) Adjusted EBITDA The definition of adjusted EBITDA for the Company is the operating income or loss excluding (i) the depreciation, depletion and amortization, (ii) results on measurement or sales of non-current assets, (iii) impairment, (iv) onerous contracts and plus (v) dividends received from associates and joint ventures. Year ended December 31, 2016
Net operating revenue
Cost of goods sold and services rendered
Sales, administrative and other operating
expenses Research and
evaluation expenses Pre operating and
operational stoppage
Dividends received from associates and
joint ventures Adjusted EBITDA
Ferrous minerals Iron ore 15,784 (6,622) (486) (91) (150) 10 8,445 Pellets 3,827 (2,002) (73) (13) (22) 103 1,820 Ferroalloys and manganese 302 (231) (4) - (11) - 56 Other ferrous products and services 438 (269) (8) (2) (4) - 155
20,351 (9,124) (571) (106) (187) 113 10,476 Coal 839 (872) 35 (15) (41) - (54) Base metals Nickel and other products 4,472 (3,204) (95) (78) (114) 4 985 Copper 1,667 (924) (25) (5) - - 713 Other base metals products - - 150 - - - 150
6,139 (4,128) 30 (83) (114) 4 1,848 Others 159 (259) (157) (116) (1) 76 (298)
Total of continuing operations 27,488 (14,383) (663) (320) (343) 193 11,972
Discontinued operations (Fertilizers) 1,875 (1,545) (87) (22) (16) 4 209
Total 29,363 (15,928) (750) (342) (359) 197 12,181
16
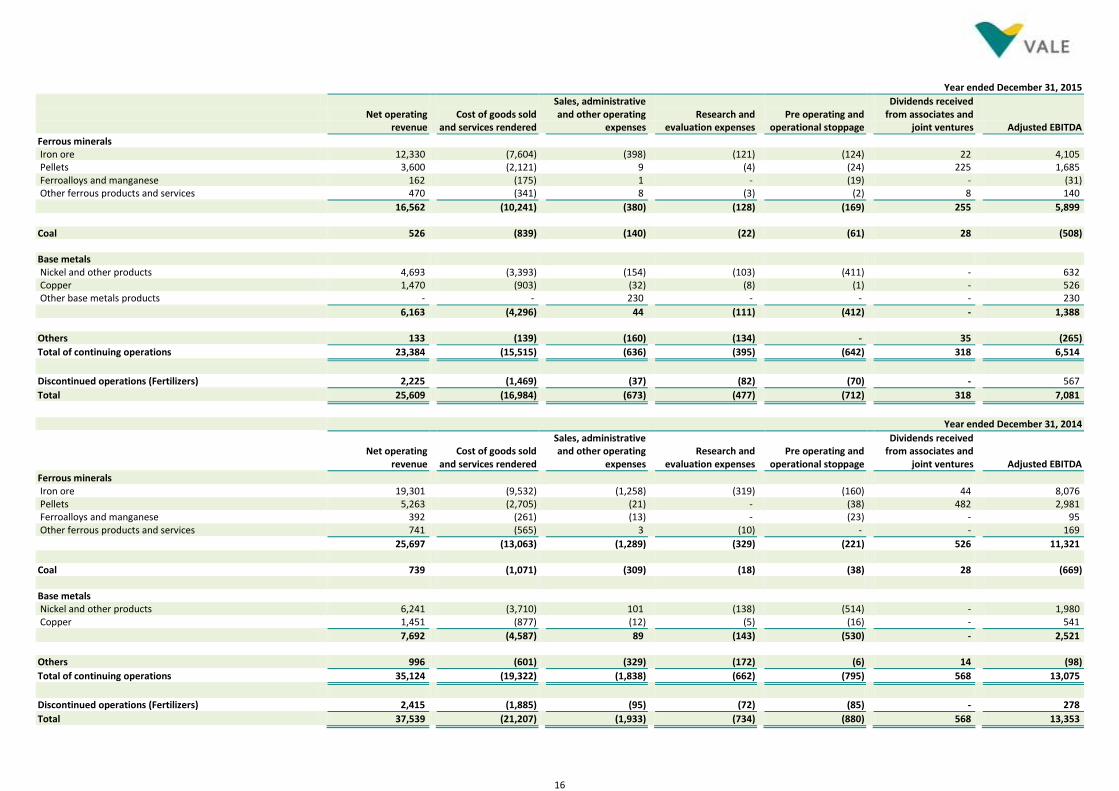
Year ended December 31, 2015
Net operating revenue
Cost of goods sold and services rendered
Sales, administrative and other operating
expenses Research and
evaluation expenses Pre operating and
operational stoppage
Dividends received from associates and
joint ventures Adjusted EBITDA
Ferrous minerals Iron ore 12,330 (7,604) (398) (121) (124) 22 4,105 Pellets 3,600 (2,121) 9 (4) (24) 225 1,685 Ferroalloys and manganese 162 (175) 1 - (19) - (31) Other ferrous products and services 470 (341) 8 (3) (2) 8 140
16,562 (10,241) (380) (128) (169) 255 5,899 Coal 526 (839) (140) (22) (61) 28 (508) Base metals Nickel and other products 4,693 (3,393) (154) (103) (411) - 632 Copper 1,470 (903) (32) (8) (1) - 526 Other base metals products - - 230 - - - 230
6,163 (4,296) 44 (111) (412) - 1,388 Others 133 (139) (160) (134) - 35 (265)
Total of continuing operations 23,384 (15,515) (636) (395) (642) 318 6,514
Discontinued operations (Fertilizers) 2,225 (1,469) (37) (82) (70) - 567
Total 25,609 (16,984) (673) (477) (712) 318 7,081
Year ended December 31, 2014
Net operating revenue
Cost of goods sold and services rendered
Sales, administrative and other operating
expenses Research and
evaluation expenses Pre operating and
operational stoppage
Dividends received from associates and
joint ventures Adjusted EBITDA
Ferrous minerals Iron ore 19,301 (9,532) (1,258) (319) (160) 44 8,076 Pellets 5,263 (2,705) (21) - (38) 482 2,981 Ferroalloys and manganese 392 (261) (13) - (23) - 95 Other ferrous products and services 741 (565) 3 (10) - - 169
25,697 (13,063) (1,289) (329) (221) 526 11,321 Coal 739 (1,071) (309) (18) (38) 28 (669) Base metals Nickel and other products 6,241 (3,710) 101 (138) (514) - 1,980 Copper 1,451 (877) (12) (5) (16) - 541
7,692 (4,587) 89 (143) (530) - 2,521 Others 996 (601) (329) (172) (6) 14 (98)
Total of continuing operations 35,124 (19,322) (1,838) (662) (795) 568 13,075
Discontinued operations (Fertilizers) 2,415 (1,885) (95) (72) (85) - 278
Total 37,539 (21,207) (1,933) (734) (880) 568 13,353
17
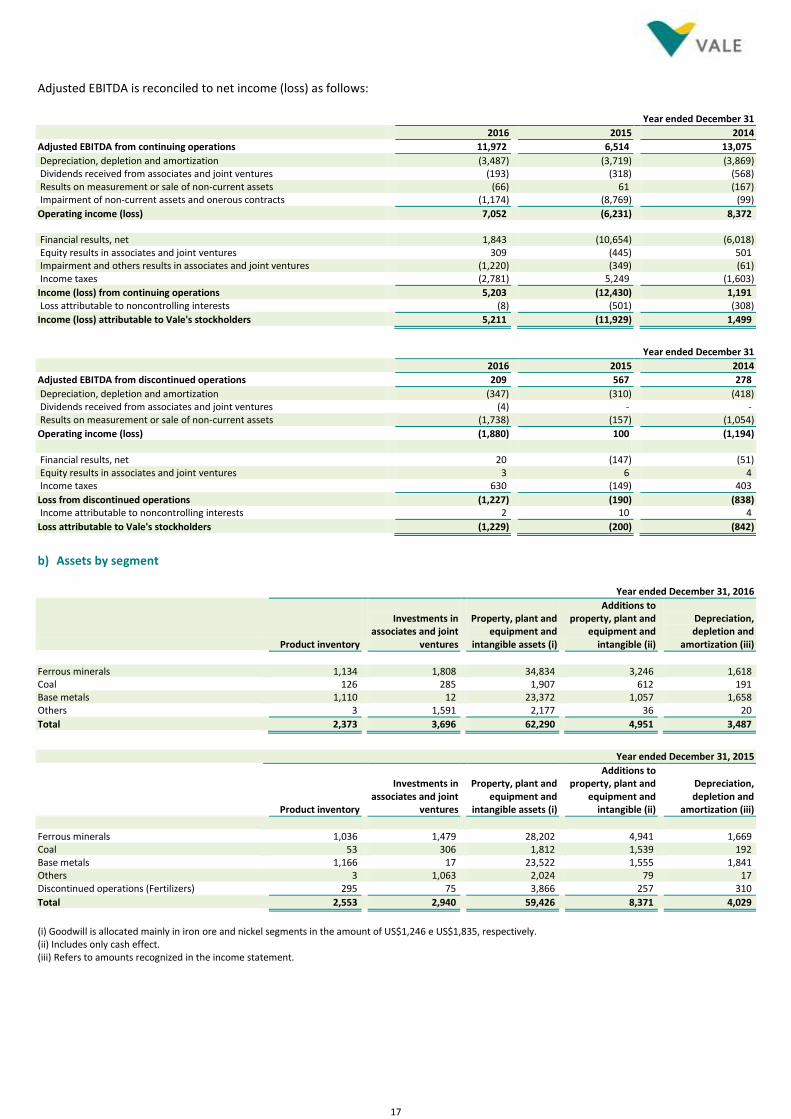
Adjusted EBITDA is reconciled to net income (loss) as follows: Year ended December 31
2016 2015 2014
Adjusted EBITDA from continuing operations 11,972 6,514 13,075
Depreciation, depletion and amortization (3,487) (3,719) (3,869) Dividends received from associates and joint ventures (193) (318) (568) Results on measurement or sale of non-current assets (66) 61 (167) Impairment of non-current assets and onerous contracts (1,174) (8,769) (99)
Operating income (loss) 7,052 (6,231) 8,372 Financial results, net 1,843 (10,654) (6,018) Equity results in associates and joint ventures 309 (445) 501 Impairment and others results in associates and joint ventures (1,220) (349) (61) Income taxes (2,781) 5,249 (1,603)
Income (loss) from continuing operations 5,203 (12,430) 1,191 Loss attributable to noncontrolling interests (8) (501) (308)
Income (loss) attributable to Vale's stockholders 5,211 (11,929) 1,499
Year ended December 31
2016 2015 2014
Adjusted EBITDA from discontinued operations 209 567 278
Depreciation, depletion and amortization (347) (310) (418) Dividends received from associates and joint ventures (4) - - Results on measurement or sale of non-current assets (1,738) (157) (1,054)
Operating income (loss) (1,880) 100 (1,194) Financial results, net 20 (147) (51) Equity results in associates and joint ventures 3 6 4 Income taxes 630 (149) 403
Loss from discontinued operations (1,227) (190) (838) Income attributable to noncontrolling interests 2 10 4
Loss attributable to Vale's stockholders (1,229) (200) (842)
b) Assets by segment Year ended December 31, 2016
Product inventory
Investments in associates and joint
ventures
Property, plant and equipment and
intangible assets (i)
Additions to property, plant and
equipment and intangible (ii)
Depreciation, depletion and
amortization (iii)
Ferrous minerals 1,134 1,808 34,834 3,246 1,618 Coal 126 285 1,907 612 191 Base metals 1,110 12 23,372 1,057 1,658 Others 3 1,591 2,177 36 20
Total 2,373 3,696 62,290 4,951 3,487
Year ended December 31, 2015
Product inventory
Investments in associates and joint
ventures
Property, plant and equipment and
intangible assets (i)
Additions to property, plant and
equipment and intangible (ii)
Depreciation, depletion and
amortization (iii)
Ferrous minerals 1,036 1,479 28,202 4,941 1,669 Coal 53 306 1,812 1,539 192 Base metals 1,166 17 23,522 1,555 1,841 Others 3 1,063 2,024 79 17 Discontinued operations (Fertilizers) 295 75 3,866 257 310
Total 2,553 2,940 59,426 8,371 4,029
(i) Goodwill is allocated mainly in iron ore and nickel segments in the amount of US$1,246 e US$1,835, respectively. (ii) Includes only cash effect. (iii) Refers to amounts recognized in the income statement.
18
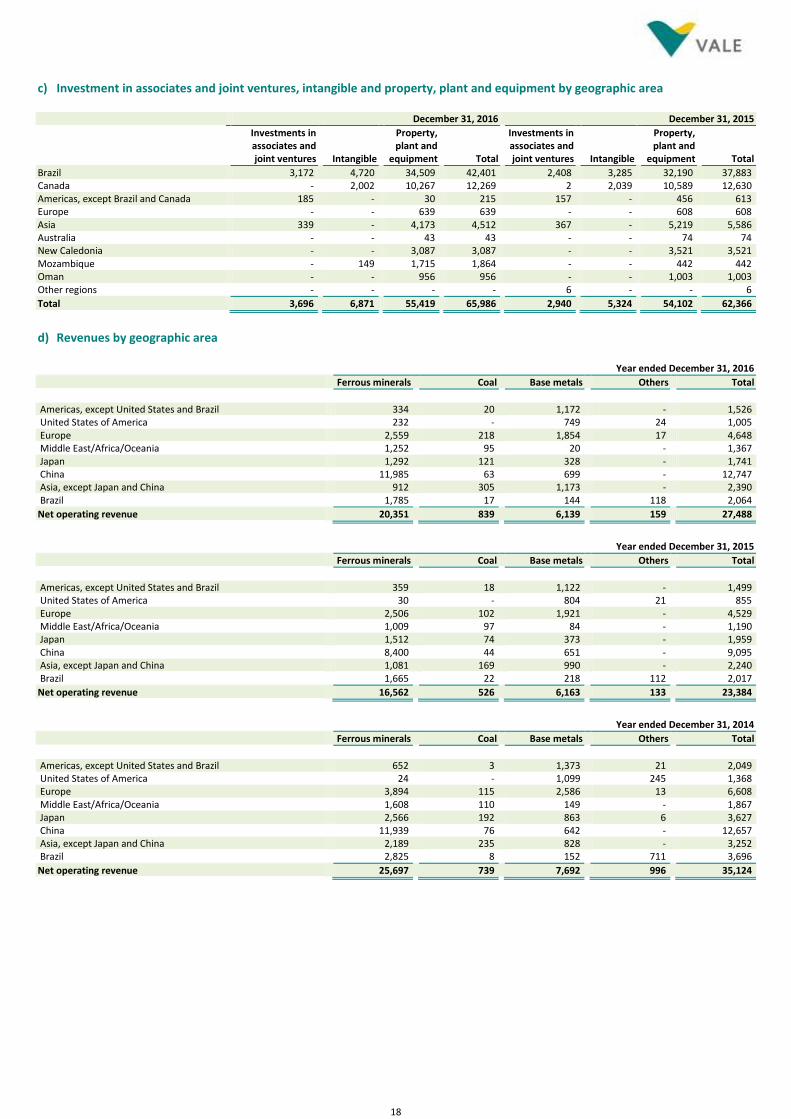
c) Investment in associates and joint ventures, intangible and property, plant and equipment by geographic area December 31, 2016 December 31, 2015
Investments in associates and joint ventures Intangible
Property, plant and
equipment Total
Investments in associates and joint ventures Intangible
Property, plant and
equipment Total
Brazil 3,172 4,720 34,509 42,401 2,408 3,285 32,190 37,883 Canada - 2,002 10,267 12,269 2 2,039 10,589 12,630 Americas, except Brazil and Canada 185 - 30 215 157 - 456 613 Europe - - 639 639 - - 608 608 Asia 339 - 4,173 4,512 367 - 5,219 5,586 Australia - - 43 43 - - 74 74 New Caledonia - - 3,087 3,087 - - 3,521 3,521 Mozambique - 149 1,715 1,864 - - 442 442 Oman - - 956 956 - - 1,003 1,003 Other regions - - - - 6 - - 6
Total 3,696 6,871 55,419 65,986 2,940 5,324 54,102 62,366
d) Revenues by geographic area Year ended December 31, 2016
Ferrous minerals Coal Base metals Others Total
Americas, except United States and Brazil 334 20 1,172 - 1,526 United States of America 232 - 749 24 1,005 Europe 2,559 218 1,854 17 4,648 Middle East/Africa/Oceania 1,252 95 20 - 1,367 Japan 1,292 121 328 - 1,741 China 11,985 63 699 - 12,747 Asia, except Japan and China 912 305 1,173 - 2,390 Brazil 1,785 17 144 118 2,064
Net operating revenue 20,351 839 6,139 159 27,488
Year ended December 31, 2015
Ferrous minerals Coal Base metals Others Total
Americas, except United States and Brazil 359 18 1,122 - 1,499 United States of America 30 - 804 21 855 Europe 2,506 102 1,921 - 4,529 Middle East/Africa/Oceania 1,009 97 84 - 1,190 Japan 1,512 74 373 - 1,959 China 8,400 44 651 - 9,095 Asia, except Japan and China 1,081 169 990 - 2,240 Brazil 1,665 22 218 112 2,017
Net operating revenue 16,562 526 6,163 133 23,384
Year ended December 31, 2014
Ferrous minerals Coal Base metals Others Total
Americas, except United States and Brazil 652 3 1,373 21 2,049 United States of America 24 - 1,099 245 1,368 Europe 3,894 115 2,586 13 6,608 Middle East/Africa/Oceania 1,608 110 149 - 1,867 Japan 2,566 192 863 6 3,627 China 11,939 76 642 - 12,657 Asia, except Japan and China 2,189 235 828 - 3,252 Brazil 2,825 8 152 711 3,696
Net operating revenue 25,697 739 7,692 996 35,124
19
Accounting policy
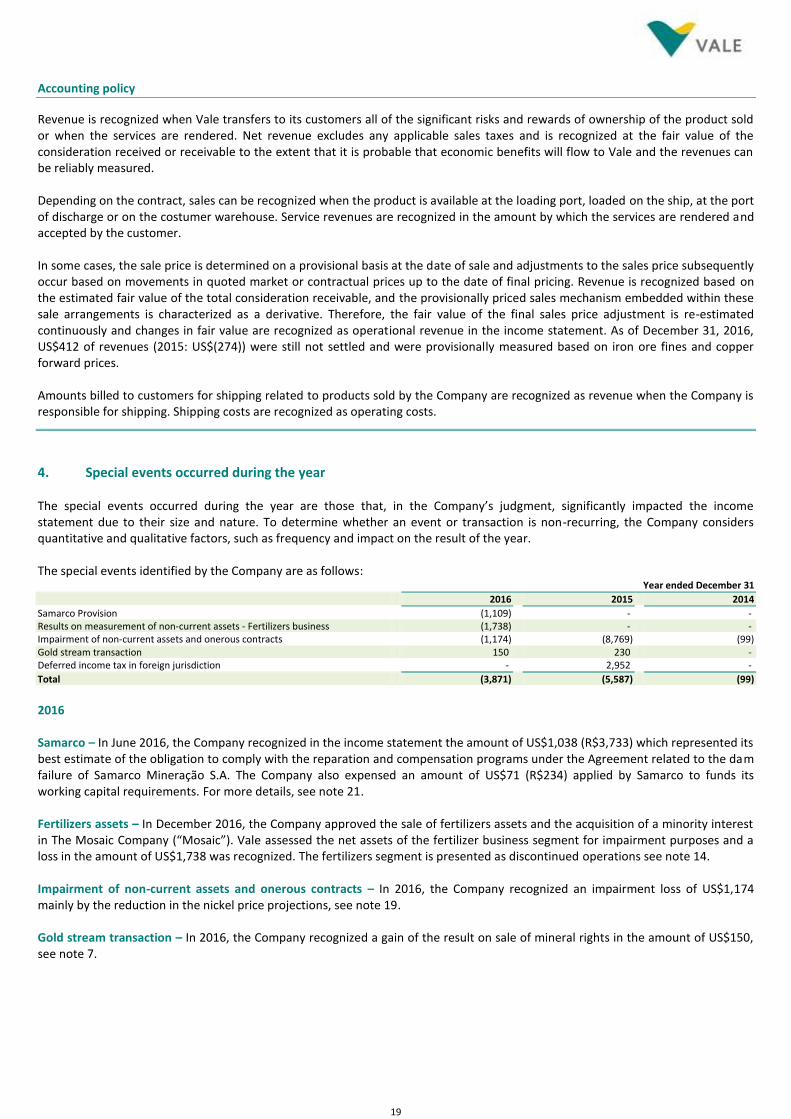
Revenue is recognized when Vale transfers to its customers all of the significant risks and rewards of ownership of the product sold or when the services are rendered. Net revenue excludes any applicable sales taxes and is recognized at the fair value of the consideration received or receivable to the extent that it is probable that economic benefits will flow to Vale and the revenues can be reliably measured. Depending on the contract, sales can be recognized when the product is available at the loading port, loaded on the ship, at the port of discharge or on the costumer warehouse. Service revenues are recognized in the amount by which the services are rendered and accepted by the customer. In some cases, the sale price is determined on a provisional basis at the date of sale and adjustments to the sales price subsequently occur based on movements in quoted market or contractual prices up to the date of final pricing. Revenue is recognized based on the estimated fair value of the total consideration receivable, and the provisionally priced sales mechanism embedded within these sale arrangements is characterized as a derivative. Therefore, the fair value of the final sales price adjustment is re-estimated continuously and changes in fair value are recognized as operational revenue in the income statement. As of December 31, 2016, US$412 of revenues (2015: US$(274)) were still not settled and were provisionally measured based on iron ore fines and copper forward prices. Amounts billed to customers for shipping related to products sold by the Company are recognized as revenue when the Company is responsible for shipping. Shipping costs are recognized as operating costs.
4. Special events occurred during the year The special events occurred during the year are those that, in the Company’s judgment, significantly impacted the income statement due to their size and nature. To determine whether an event or transaction is non-recurring, the Company considers quantitative and qualitative factors, such as frequency and impact on the result of the year. The special events identified by the Company are as follows: Year ended December 31
2016 2015 2014
Samarco Provision (1,109) - - Results on measurement of non-current assets - Fertilizers business (1,738) - - Impairment of non-current assets and onerous contracts (1,174) (8,769) (99) Gold stream transaction 150 230 - Deferred income tax in foreign jurisdiction - 2,952 -
Total (3,871) (5,587) (99)
2016 Samarco – In June 2016, the Company recognized in the income statement the amount of US$1,038 (R$3,733) which represented its best estimate of the obligation to comply with the reparation and compensation programs under the Agreement related to the dam failure of Samarco Mineração S.A. The Company also expensed an amount of US$71 (R$234) applied by Samarco to funds its working capital requirements. For more details, see note 21. Fertilizers assets – In December 2016, the Company approved the sale of fertilizers assets and the acquisition of a minority interest in The Mosaic Company (“Mosaic”). Vale assessed the net assets of the fertilizer business segment for impairment purposes and a loss in the amount of US$1,738 was recognized. The fertilizers segment is presented as discontinued operations see note 14. Impairment of non-current assets and onerous contracts – In 2016, the Company recognized an impairment loss of US$1,174 mainly by the reduction in the nickel price projections, see note 19. Gold stream transaction – In 2016, the Company recognized a gain of the result on sale of mineral rights in the amount of US$150, see note 7.
20
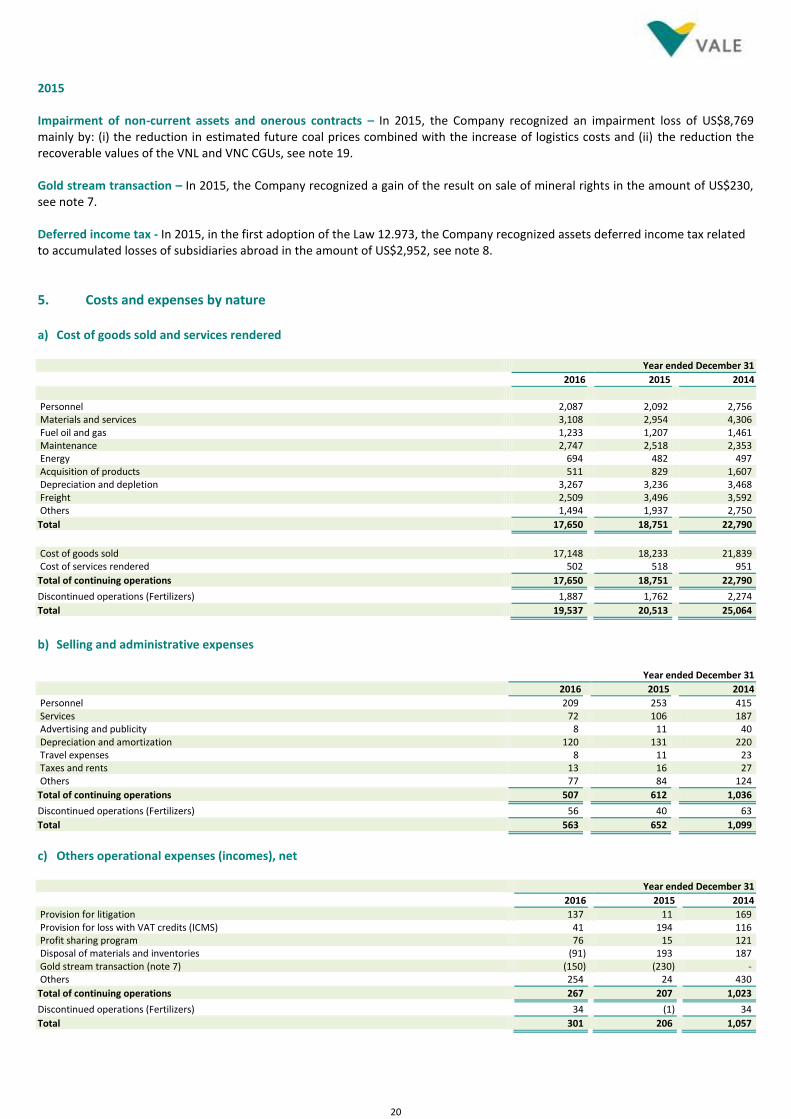
2015 Impairment of non-current assets and onerous contracts – In 2015, the Company recognized an impairment loss of US$8,769 mainly by: (i) the reduction in estimated future coal prices combined with the increase of logistics costs and (ii) the reduction the recoverable values of the VNL and VNC CGUs, see note 19. Gold stream transaction – In 2015, the Company recognized a gain of the result on sale of mineral rights in the amount of US$230, see note 7. Deferred income tax - In 2015, in the first adoption of the Law 12.973, the Company recognized assets deferred income tax related to accumulated losses of subsidiaries abroad in the amount of US$2,952, see note 8.
5. Costs and expenses by nature a) Cost of goods sold and services rendered Year ended December 31
2016 2015 2014
Personnel 2,087 2,092 2,756 Materials and services 3,108 2,954 4,306 Fuel oil and gas 1,233 1,207 1,461 Maintenance 2,747 2,518 2,353 Energy 694 482 497 Acquisition of products 511 829 1,607 Depreciation and depletion 3,267 3,236 3,468 Freight 2,509 3,496 3,592 Others 1,494 1,937 2,750
Total 17,650 18,751 22,790
Cost of goods sold 17,148 18,233 21,839 Cost of services rendered 502 518 951
Total of continuing operations 17,650 18,751 22,790
Discontinued operations (Fertilizers) 1,887 1,762 2,274
Total 19,537 20,513 25,064
b) Selling and administrative expenses Year ended December 31
2016 2015 2014
Personnel 209 253 415 Services 72 106 187 Advertising and publicity 8 11 40 Depreciation and amortization 120 131 220 Travel expenses 8 11 23 Taxes and rents 13 16 27 Others 77 84 124
Total of continuing operations 507 612 1,036
Discontinued operations (Fertilizers) 56 40 63
Total 563 652 1,099
c) Others operational expenses (incomes), net Year ended December 31
2016 2015 2014
Provision for litigation 137 11 169 Provision for loss with VAT credits (ICMS) 41 194 116 Profit sharing program 76 15 121 Disposal of materials and inventories (91) 193 187 Gold stream transaction (note 7) (150) (230) - Others 254 24 430
Total of continuing operations 267 207 1,023
Discontinued operations (Fertilizers) 34 (1) 34
Total 301 206 1,057
21
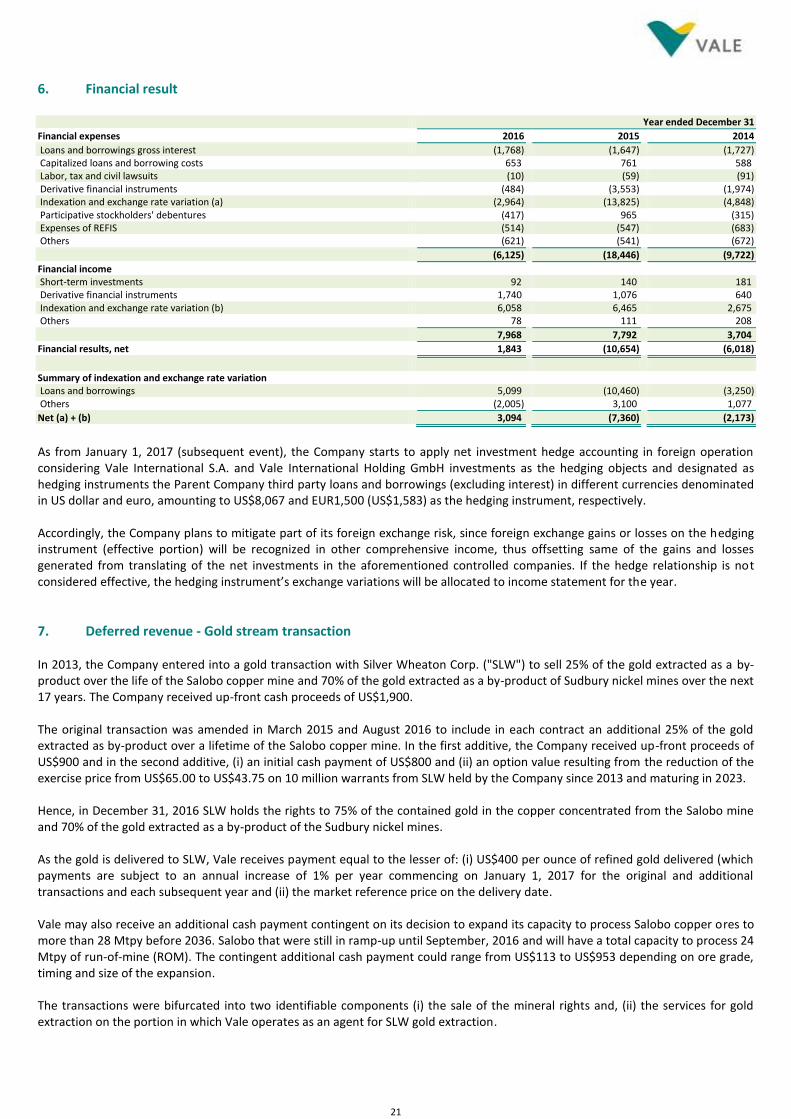
6. Financial result Year ended December 31
Financial expenses 2016 2015 2014
Loans and borrowings gross interest (1,768) (1,647) (1,727) Capitalized loans and borrowing costs 653 761 588 Labor, tax and civil lawsuits (10) (59) (91) Derivative financial instruments (484) (3,553) (1,974) Indexation and exchange rate variation (a) (2,964) (13,825) (4,848) Participative stockholders' debentures (417) 965 (315) Expenses of REFIS (514) (547) (683) Others (621) (541) (672)
(6,125) (18,446) (9,722)
Financial income Short‐term investments 92 140 181 Derivative financial instruments 1,740 1,076 640 Indexation and exchange rate variation (b) 6,058 6,465 2,675 Others 78 111 208
7,968 7,792 3,704
Financial results, net 1,843 (10,654) (6,018)
Summary of indexation and exchange rate variation Loans and borrowings 5,099 (10,460) (3,250) Others (2,005) 3,100 1,077
Net (a) + (b) 3,094 (7,360) (2,173)
As from January 1, 2017 (subsequent event), the Company starts to apply net investment hedge accounting in foreign operation considering Vale International S.A. and Vale International Holding GmbH investments as the hedging objects and designated as hedging instruments the Parent Company third party loans and borrowings (excluding interest) in different currencies denominated in US dollar and euro, amounting to US$8,067 and EUR1,500 (US$1,583) as the hedging instrument, respectively. Accordingly, the Company plans to mitigate part of its foreign exchange risk, since foreign exchange gains or losses on the hedging instrument (effective portion) will be recognized in other comprehensive income, thus offsetting same of the gains and losses generated from translating of the net investments in the aforementioned controlled companies. If the hedge relationship is not considered effective, the hedging instrument’s exchange variations will be allocated to income statement for the year.
7. Deferred revenue - Gold stream transaction In 2013, the Company entered into a gold transaction with Silver Wheaton Corp. ("SLW") to sell 25% of the gold extracted as a by-product over the life of the Salobo copper mine and 70% of the gold extracted as a by-product of Sudbury nickel mines over the next 17 years. The Company received up-front cash proceeds of US$1,900. The original transaction was amended in March 2015 and August 2016 to include in each contract an additional 25% of the gold extracted as by-product over a lifetime of the Salobo copper mine. In the first additive, the Company received up-front proceeds of US$900 and in the second additive, (i) an initial cash payment of US$800 and (ii) an option value resulting from the reduction of the exercise price from US$65.00 to US$43.75 on 10 million warrants from SLW held by the Company since 2013 and maturing in 2023. Hence, in December 31, 2016 SLW holds the rights to 75% of the contained gold in the copper concentrated from the Salobo mine and 70% of the gold extracted as a by-product of the Sudbury nickel mines. As the gold is delivered to SLW, Vale receives payment equal to the lesser of: (i) US$400 per ounce of refined gold delivered (which payments are subject to an annual increase of 1% per year commencing on January 1, 2017 for the original and additional transactions and each subsequent year and (ii) the market reference price on the delivery date. Vale may also receive an additional cash payment contingent on its decision to expand its capacity to process Salobo copper ores to more than 28 Mtpy before 2036. Salobo that were still in ramp-up until September, 2016 and will have a total capacity to process 24 Mtpy of run-of-mine (ROM). The contingent additional cash payment could range from US$113 to US$953 depending on ore grade, timing and size of the expansion. The transactions were bifurcated into two identifiable components (i) the sale of the mineral rights and, (ii) the services for gold extraction on the portion in which Vale operates as an agent for SLW gold extraction.
22
The deferred revenue is recognized based on the units of gold mined compared to the total proven and probable reserves of gold traded with SLW. During the year ended December 31, 2016, 2015 and 2014, the Company recognized US$209, US$106 and US$64, respectively, in the statement of income relating to services rendered in the original and additional transactions. The result on sale of mineral rights from the additional transactions of US$150 and US$230 was recognized in the year ended December 31, 2016 and 2015, respectively, under "Other operating expenses, net". Critical accounting estimates and judgments
Defining the gain on sale of mineral interest and the deferred revenue portion of the transaction requires the use of critical accounting estimates as follows: - Discount rates used to measure the present value of future inflows and outflows; - Allocation of costs between nickel or copper and gold based on relative prices; - Expected margin for the independent elements (sale of mineral rights and service for gold extraction) based on Company’s best estimate.
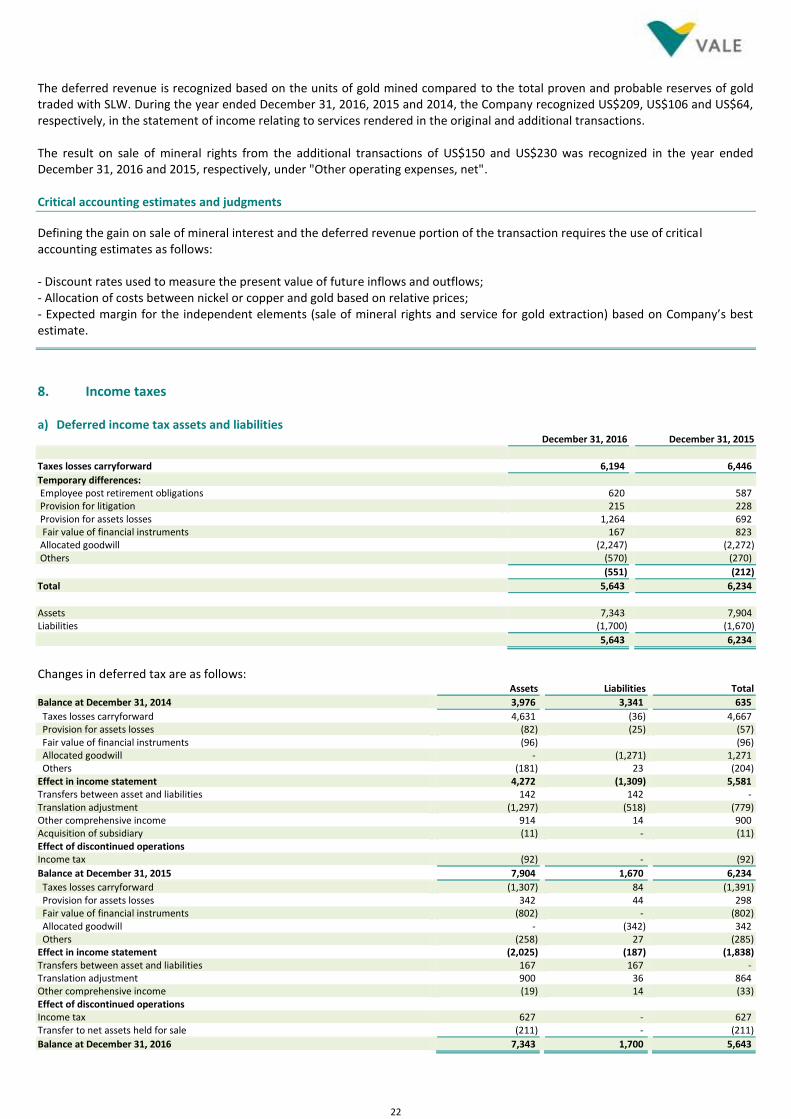
8. Income taxes a) Deferred income tax assets and liabilities December 31, 2016 December 31, 2015
Taxes losses carryforward 6,194 6,446
Temporary differences: Employee post retirement obligations 620 587 Provision for litigation 215 228 Provision for assets losses 1,264 692 Fair value of financial instruments 167 823 Allocated goodwill (2,247) (2,272) Others (570) (270)
(551) (212)
Total 5,643 6,234
Assets 7,343 7,904 Liabilities (1,700) (1,670)
5,643 6,234
Changes in deferred tax are as follows: Assets Liabilities Total
Balance at December 31, 2014 3,976 3,341 635
Taxes losses carryforward 4,631 (36) 4,667 Provision for assets losses (82) (25) (57) Fair value of financial instruments (96) (96) Allocated goodwill - (1,271) 1,271 Others (181) 23 (204) Effect in income statement 4,272 (1,309) 5,581 Transfers between asset and liabilities 142 142 - Translation adjustment (1,297) (518) (779) Other comprehensive income 914 14 900 Acquisition of subsidiary (11) - (11) Effect of discontinued operations Income tax (92) - (92)
Balance at December 31, 2015 7,904 1,670 6,234
Taxes losses carryforward (1,307) 84 (1,391) Provision for assets losses 342 44 298 Fair value of financial instruments (802) - (802) Allocated goodwill - (342) 342 Others (258) 27 (285) Effect in income statement (2,025) (187) (1,838) Transfers between asset and liabilities 167 167 - Translation adjustment 900 36 864 Other comprehensive income (19) 14 (33) Effect of discontinued operations Income tax 627 - 627 Transfer to net assets held for sale (211) - (211)
Balance at December 31, 2016 7,343 1,700 5,643
23
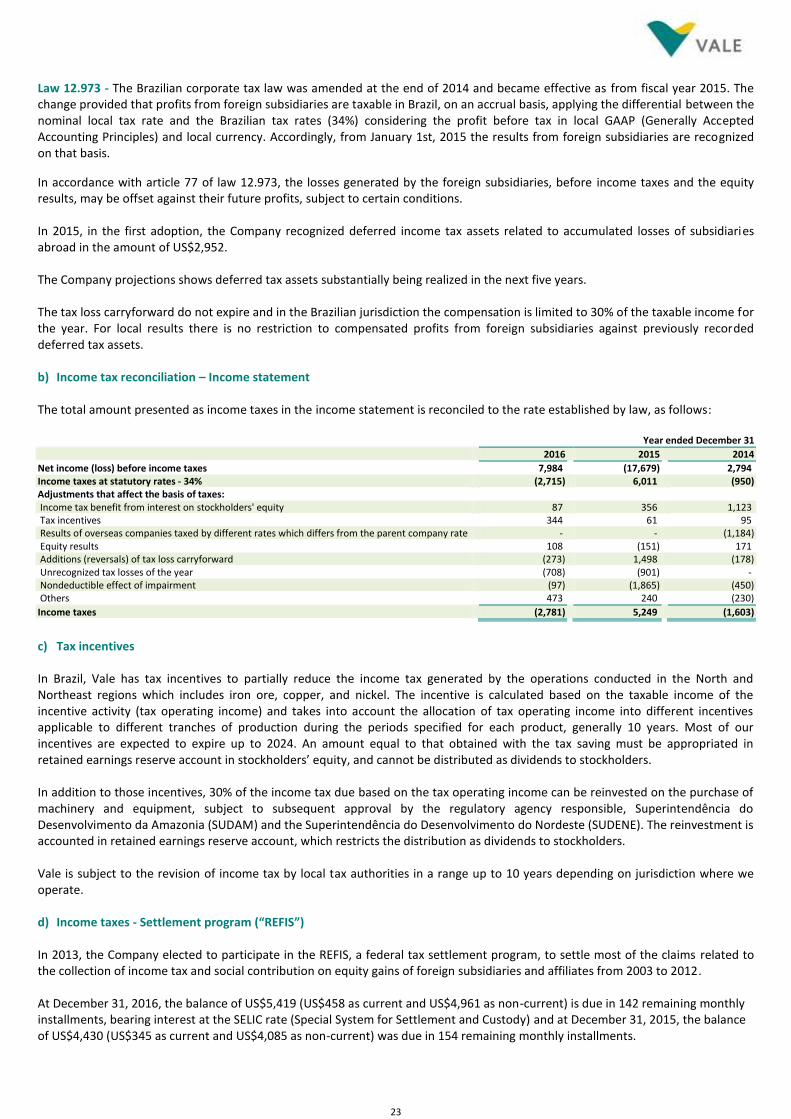
Law 12.973 - The Brazilian corporate tax law was amended at the end of 2014 and became effective as from fiscal year 2015. The change provided that profits from foreign subsidiaries are taxable in Brazil, on an accrual basis, applying the differential between the nominal local tax rate and the Brazilian tax rates (34%) considering the profit before tax in local GAAP (Generally Accepted Accounting Principles) and local currency. Accordingly, from January 1st, 2015 the results from foreign subsidiaries are recognized on that basis.
In accordance with article 77 of law 12.973, the losses generated by the foreign subsidiaries, before income taxes and the equity results, may be offset against their future profits, subject to certain conditions. In 2015, in the first adoption, the Company recognized deferred income tax assets related to accumulated losses of subsidiaries abroad in the amount of US$2,952. The Company projections shows deferred tax assets substantially being realized in the next five years. The tax loss carryforward do not expire and in the Brazilian jurisdiction the compensation is limited to 30% of the taxable income for the year. For local results there is no restriction to compensated profits from foreign subsidiaries against previously recorded deferred tax assets. b) Income tax reconciliation – Income statement The total amount presented as income taxes in the income statement is reconciled to the rate established by law, as follows: Year ended December 31
2016 2015 2014
Net income (loss) before income taxes 7,984 (17,679) 2,794 Income taxes at statutory rates ‐ 34% (2,715) 6,011 (950) Adjustments that affect the basis of taxes: Income tax benefit from interest on stockholders' equity 87 356 1,123 Tax incentives 344 61 95 Results of overseas companies taxed by different rates which differs from the parent company rate - - (1,184) Equity results 108 (151) 171 Additions (reversals) of tax loss carryforward (273) 1,498 (178) Unrecognized tax losses of the year (708) (901) - Nondeductible effect of impairment (97) (1,865) (450) Others 473 240 (230)
Income taxes (2,781) 5,249 (1,603)
c) Tax incentives In Brazil, Vale has tax incentives to partially reduce the income tax generated by the operations conducted in the North and Northeast regions which includes iron ore, copper, and nickel. The incentive is calculated based on the taxable income of the incentive activity (tax operating income) and takes into account the allocation of tax operating income into different incentives applicable to different tranches of production during the periods specified for each product, generally 10 years. Most of our incentives are expected to expire up to 2024. An amount equal to that obtained with the tax saving must be appropriated in retained earnings reserve account in stockholders’ equity, and cannot be distributed as dividends to stockholders. In addition to those incentives, 30% of the income tax due based on the tax operating income can be reinvested on the purchase of machinery and equipment, subject to subsequent approval by the regulatory agency responsible, Superintendência do Desenvolvimento da Amazonia (SUDAM) and the Superintendência do Desenvolvimento do Nordeste (SUDENE). The reinvestment is accounted in retained earnings reserve account, which restricts the distribution as dividends to stockholders. Vale is subject to the revision of income tax by local tax authorities in a range up to 10 years depending on jurisdiction where we operate. d) Income taxes - Settlement program (“REFIS”) In 2013, the Company elected to participate in the REFIS, a federal tax settlement program, to settle most of the claims related to the collection of income tax and social contribution on equity gains of foreign subsidiaries and affiliates from 2003 to 2012. At December 31, 2016, the balance of US$5,419 (US$458 as current and US$4,961 as non-current) is due in 142 remaining monthly installments, bearing interest at the SELIC rate (Special System for Settlement and Custody) and at December 31, 2015, the balance of US$4,430 (US$345 as current and US$4,085 as non-current) was due in 154 remaining monthly installments.
24
Accounting policy
The recognition of income taxes as deferred taxes is based on temporary differences between carrying value and the tax basis of assets and liabilities as well as taxes losses carryforwards. The deferred income taxes assets and liabilities are offset when there is a legally enforceable right on the same taxable entity. The deferred taxes assets arising from taxes losses and temporary differences are not recognized when their recovery amount are not probable. Income taxes are recognized in the income statement, except for items recognized directly in stockholders’ equity. The provision for income tax is calculated individually for each entity in the Group based on Brazilian tax rates, on an accrual basis, by applying the differential between the nominal local tax rates (based on rules in force in the location of the entity) and the Brazilian tax rate.
Critical accounting estimates and judgments
Deferred tax assets arising from tax losses, negative social contribution basis and temporary differences are registered taking into account the analysis of future performance, considering economic and financial projections, prepared based on internal assumptions and macroeconomic, trade and tax scenarios that may be subject to changes in the future. The assumptions of future profits are based on production and sales planning, commodity prices, operational costs, restructuring plans, reclamation and planned capital costs.
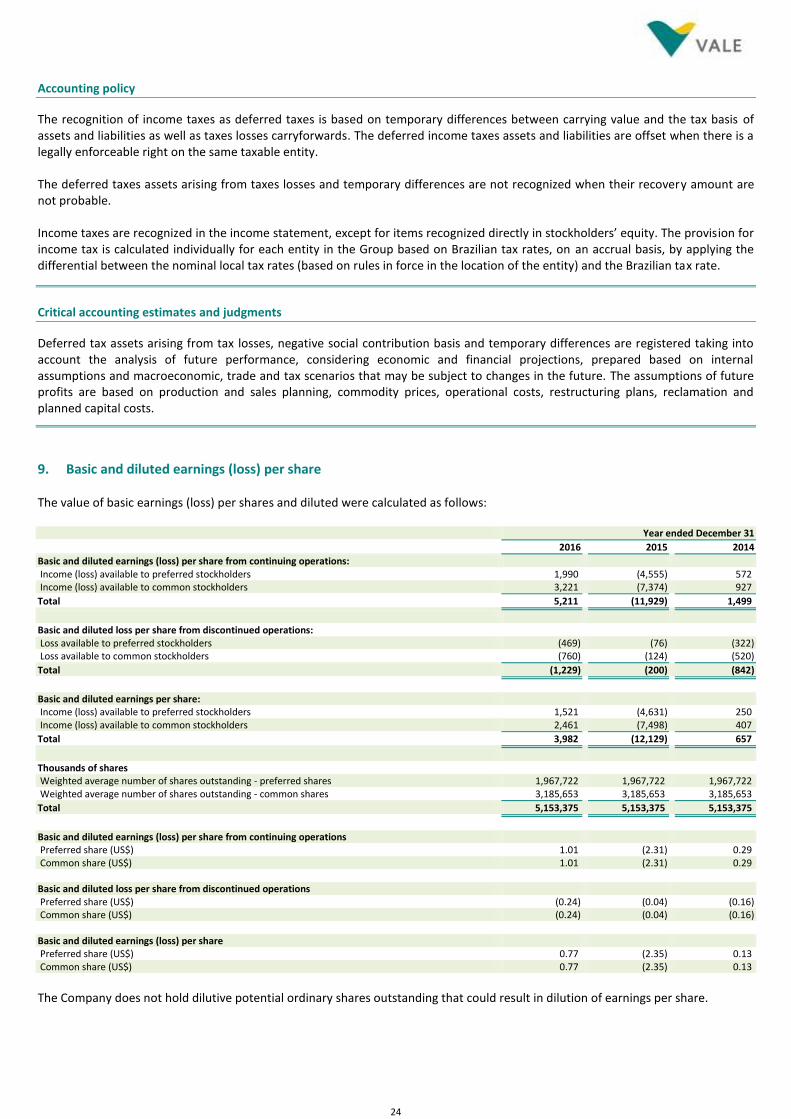
9. Basic and diluted earnings (loss) per share The value of basic earnings (loss) per shares and diluted were calculated as follows: Year ended December 31
2016 2015 2014
Basic and diluted earnings (loss) per share from continuing operations: Income (loss) available to preferred stockholders 1,990 (4,555) 572 Income (loss) available to common stockholders 3,221 (7,374) 927
Total 5,211 (11,929) 1,499
Basic and diluted loss per share from discontinued operations: Loss available to preferred stockholders (469) (76) (322) Loss available to common stockholders (760) (124) (520)
Total (1,229) (200) (842)
Basic and diluted earnings per share: Income (loss) available to preferred stockholders 1,521 (4,631) 250 Income (loss) available to common stockholders 2,461 (7,498) 407
Total 3,982 (12,129) 657
Thousands of shares Weighted average number of shares outstanding - preferred shares 1,967,722 1,967,722 1,967,722 Weighted average number of shares outstanding - common shares 3,185,653 3,185,653 3,185,653
Total 5,153,375 5,153,375 5,153,375
Basic and diluted earnings (loss) per share from continuing operations Preferred share (US$) 1.01 (2.31) 0.29 Common share (US$) 1.01 (2.31) 0.29 Basic and diluted loss per share from discontinued operations Preferred share (US$) (0.24) (0.04) (0.16) Common share (US$) (0.24) (0.04) (0.16) Basic and diluted earnings (loss) per share Preferred share (US$) 0.77 (2.35) 0.13 Common share (US$) 0.77 (2.35) 0.13
The Company does not hold dilutive potential ordinary shares outstanding that could result in dilution of earnings per share.
25
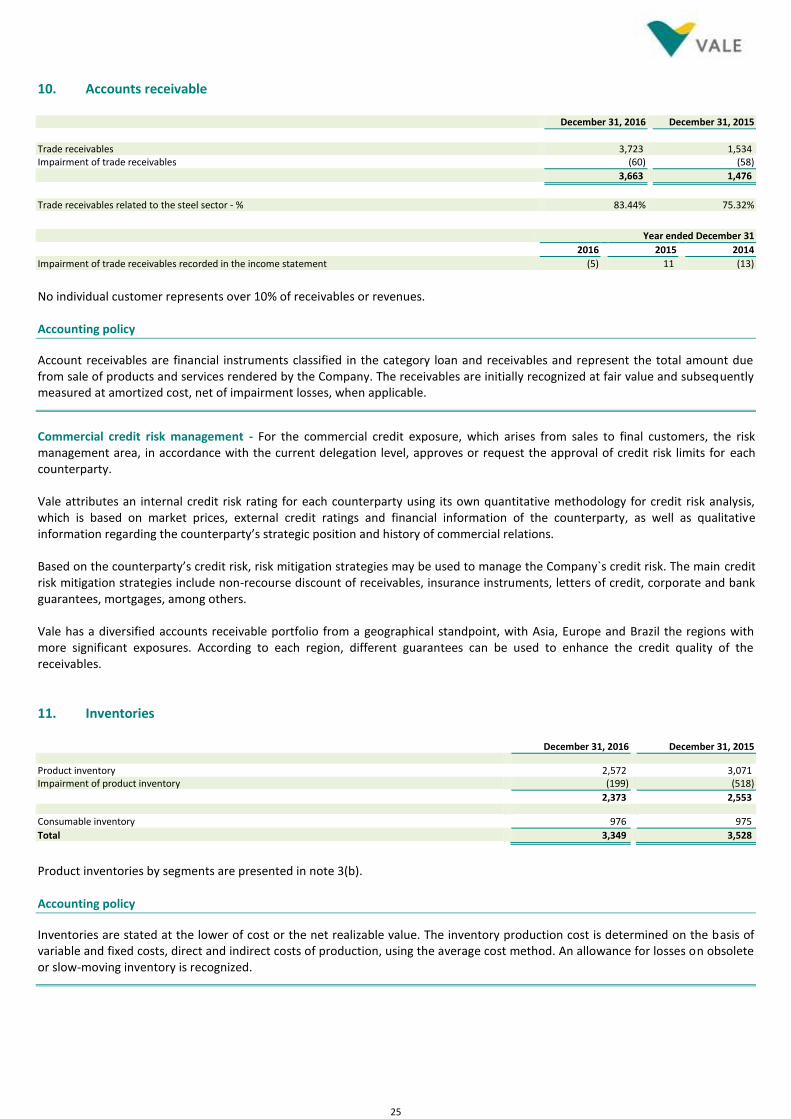
10. Accounts receivable December 31, 2016 December 31, 2015
Trade receivables 3,723 1,534 Impairment of trade receivables (60) (58)
3,663 1,476
Trade receivables related to the steel sector - % 83.44% 75.32%
Year ended December 31
2016 2015 2014
Impairment of trade receivables recorded in the income statement (5) 11 (13)
No individual customer represents over 10% of receivables or revenues. Accounting policy
Account receivables are financial instruments classified in the category loan and receivables and represent the total amount due from sale of products and services rendered by the Company. The receivables are initially recognized at fair value and subsequently measured at amortized cost, net of impairment losses, when applicable.
Commercial credit risk management - For the commercial credit exposure, which arises from sales to final customers, the risk management area, in accordance with the current delegation level, approves or request the approval of credit risk limits for each counterparty. Vale attributes an internal credit risk rating for each counterparty using its own quantitative methodology for credit risk analysis, which is based on market prices, external credit ratings and financial information of the counterparty, as well as qualitative information regarding the counterparty’s strategic position and history of commercial relations. Based on the counterparty’s credit risk, risk mitigation strategies may be used to manage the Company`s credit risk. The main credit risk mitigation strategies include non-recourse discount of receivables, insurance instruments, letters of credit, corporate and bank guarantees, mortgages, among others. Vale has a diversified accounts receivable portfolio from a geographical standpoint, with Asia, Europe and Brazil the regions with more significant exposures. According to each region, different guarantees can be used to enhance the credit quality of the receivables.
11. Inventories December 31, 2016 December 31, 2015
Product inventory 2,572 3,071 Impairment of product inventory (199) (518)
2,373 2,553 Consumable inventory 976 975
Total 3,349 3,528
Product inventories by segments are presented in note 3(b). Accounting policy
Inventories are stated at the lower of cost or the net realizable value. The inventory production cost is determined on the basis of variable and fixed costs, direct and indirect costs of production, using the average cost method. An allowance for losses on obsolete or slow-moving inventory is recognized.
26
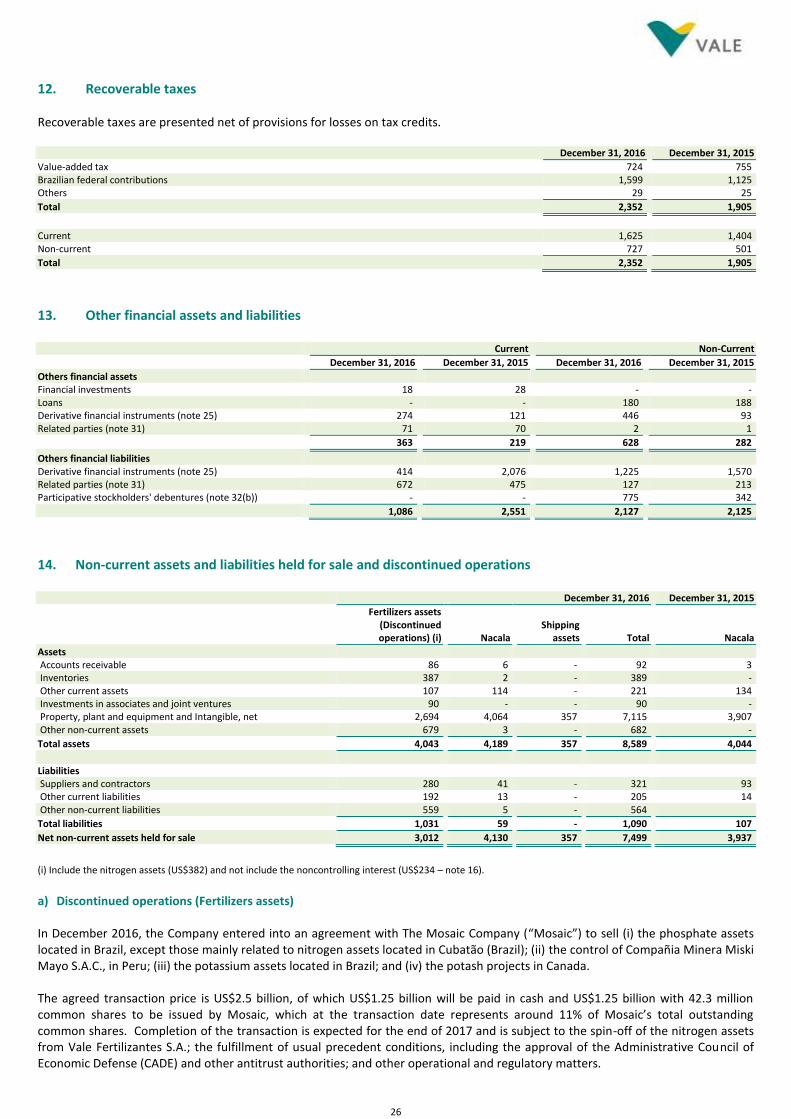
12. Recoverable taxes Recoverable taxes are presented net of provisions for losses on tax credits. December 31, 2016 December 31, 2015
Value-added tax 724 755 Brazilian federal contributions 1,599 1,125 Others 29 25
Total 2,352 1,905
Current 1,625 1,404 Non-current 727 501
Total 2,352 1,905
13. Other financial assets and liabilities Current Non-Current
December 31, 2016 December 31, 2015 December 31, 2016 December 31, 2015
Others financial assets Financial investments 18 28 - - Loans - - 180 188 Derivative financial instruments (note 25) 274 121 446 93 Related parties (note 31) 71 70 2 1
363 219 628 282
Others financial liabilities Derivative financial instruments (note 25) 414 2,076 1,225 1,570 Related parties (note 31) 672 475 127 213 Participative stockholders' debentures (note 32(b)) - - 775 342
1,086 2,551 2,127 2,125
14. Non-current assets and liabilities held for sale and discontinued operations December 31, 2016 December 31, 2015
Fertilizers assets
(Discontinued operations) (i) Nacala
Shipping assets Total Nacala
Assets Accounts receivable 86 6 - 92 3 Inventories 387 2 - 389 - Other current assets 107 114 - 221 134 Investments in associates and joint ventures 90 - - 90 - Property, plant and equipment and Intangible, net 2,694 4,064 357 7,115 3,907 Other non-current assets 679 3 - 682 -
Total assets 4,043 4,189 357 8,589 4,044
Liabilities Suppliers and contractors 280 41 - 321 93 Other current liabilities 192 13 - 205 14 Other non-current liabilities 559 5 - 564
Total liabilities 1,031 59 - 1,090 107
Net non-current assets held for sale 3,012 4,130 357 7,499 3,937
(i) Include the nitrogen assets (US$382) and not include the noncontrolling interest (US$234 – note 16).
a) Discontinued operations (Fertilizers assets) In December 2016, the Company entered into an agreement with The Mosaic Company (“Mosaic”) to sell (i) the phosphate assets located in Brazil, except those mainly related to nitrogen assets located in Cubatão (Brazil); (ii) the control of Compañia Minera Miski Mayo S.A.C., in Peru; (iii) the potassium assets located in Brazil; and (iv) the potash projects in Canada. The agreed transaction price is US$2.5 billion, of which US$1.25 billion will be paid in cash and US$1.25 billion with 42.3 million common shares to be issued by Mosaic, which at the transaction date represents around 11% of Mosaic’s total outstanding common shares. Completion of the transaction is expected for the end of 2017 and is subject to the spin-off of the nitrogen assets from Vale Fertilizantes S.A.; the fulfillment of usual precedent conditions, including the approval of the Administrative Council of Economic Defense (CADE) and other antitrust authorities; and other operational and regulatory matters.
27
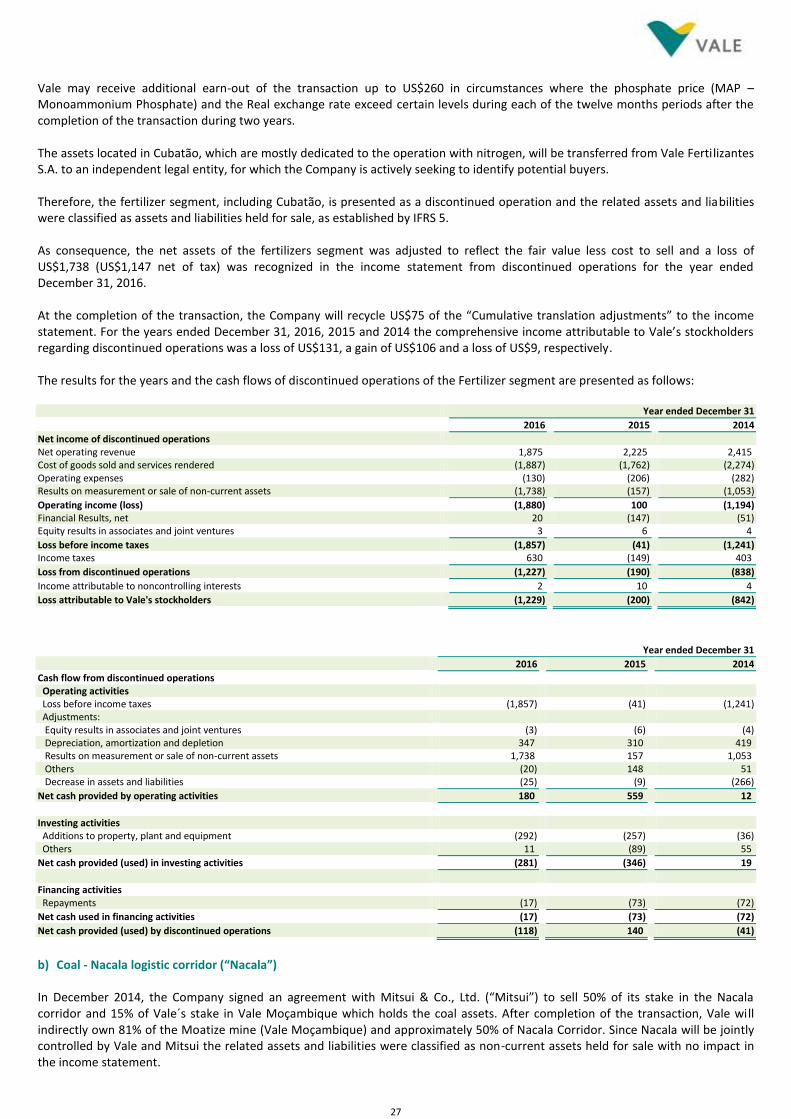
Vale may receive additional earn-out of the transaction up to US$260 in circumstances where the phosphate price (MAP – Monoammonium Phosphate) and the Real exchange rate exceed certain levels during each of the twelve months periods after the completion of the transaction during two years. The assets located in Cubatão, which are mostly dedicated to the operation with nitrogen, will be transferred from Vale Fertilizantes S.A. to an independent legal entity, for which the Company is actively seeking to identify potential buyers. Therefore, the fertilizer segment, including Cubatão, is presented as a discontinued operation and the related assets and liabilities were classified as assets and liabilities held for sale, as established by IFRS 5. As consequence, the net assets of the fertilizers segment was adjusted to reflect the fair value less cost to sell and a loss of US$1,738 (US$1,147 net of tax) was recognized in the income statement from discontinued operations for the year ended December 31, 2016. At the completion of the transaction, the Company will recycle US$75 of the “Cumulative translation adjustments” to the income statement. For the years ended December 31, 2016, 2015 and 2014 the comprehensive income attributable to Vale’s stockholders regarding discontinued operations was a loss of US$131, a gain of US$106 and a loss of US$9, respectively. The results for the years and the cash flows of discontinued operations of the Fertilizer segment are presented as follows: Year ended December 31
2016 2015 2014
Net income of discontinued operations Net operating revenue 1,875 2,225 2,415 Cost of goods sold and services rendered (1,887) (1,762) (2,274) Operating expenses (130) (206) (282) Results on measurement or sale of non-current assets (1,738) (157) (1,053)
Operating income (loss) (1,880) 100 (1,194) Financial Results, net 20 (147) (51) Equity results in associates and joint ventures 3 6 4
Loss before income taxes (1,857) (41) (1,241) Income taxes 630 (149) 403
Loss from discontinued operations (1,227) (190) (838)
Income attributable to noncontrolling interests 2 10 4
Loss attributable to Vale's stockholders (1,229) (200) (842)
Year ended December 31
2016 2015 2014
Cash flow from discontinued operations Operating activities Loss before income taxes (1,857) (41) (1,241) Adjustments: Equity results in associates and joint ventures (3) (6) (4) Depreciation, amortization and depletion 347 310 419 Results on measurement or sale of non-current assets 1,738 157 1,053 Others (20) 148 51 Decrease in assets and liabilities (25) (9) (266)
Net cash provided by operating activities 180 559 12
Investing activities Additions to property, plant and equipment (292) (257) (36) Others 11 (89) 55
Net cash provided (used) in investing activities (281) (346) 19
Financing activities Repayments (17) (73) (72)
Net cash used in financing activities (17) (73) (72)
Net cash provided (used) by discontinued operations (118) 140 (41)
b) Coal - Nacala logistic corridor (“Nacala”) In December 2014, the Company signed an agreement with Mitsui & Co., Ltd. (“Mitsui”) to sell 50% of its stake in the Nacala corridor and 15% of Vale´s stake in Vale Moçambique which holds the coal assets. After completion of the transaction, Vale will indirectly own 81% of the Moatize mine (Vale Moçambique) and approximately 50% of Nacala Corridor. Since Nacala will be jointly controlled by Vale and Mitsui the related assets and liabilities were classified as non-current assets held for sale with no impact in the income statement.
28
In September 2016, the Company reviewed the terms related to this transaction, in which Mitsui agreed to contribute up to US$450, being: (i) US$255 for a 15% of Vale’s stake in the Moatize coal mine; and (ii) an additional contribution of up to US$195 based on meeting certain conditions, including mine performance. Mitsui will also contribute US$348 for a 50% stake in the equity and quasi-equity instruments of the Nacala and extend a long-term facility of US$165. As at December 2016, completion of the transaction remains subject to successful completion of the Project Finance and certain government approvals which are expected to occur in 2017. c) Shipping assets In June 2016, Vale approved a plan to dispose of its fleet of eleven ships. As a consequence, the referenced assets were reclassified to non-current assets held for sale and a loss of US$66 was recorded in the income statement as “Results on measurement or sale of non-current assets”. In the year ended December 31, 2016, the Company concluded the sale of three Very Large Ore Carriers (“VLOC’s”) for US$269 and four Capesize vessels for US$140. There are four vessels that are still held for sale as at December 31, 2016.
Accounting policy
A non-current asset is classified as held for sale if its carrying amount will be recovered principally through a sale transaction rather than through continuing use. The criteria for recognition the non-current assets as held for sale are only considered satisfied when the sale is highly probable and the asset (or disposal group of assets) is available for immediate sale in its present condition. The Company measures the assets held for sale (or group of assets) at the lower of its carrying amount and fair value less costs to sell. If the carrying amount exceeds the fair value less costs to sell an impairment loss is recognized against income. Any subsequent reversal of impairment is recognized only to the extent of the loss previously recognized. The assets and liabilities of a disposal group classified as held for sale are presented separately in the statement of financial position. The classification as a discontinued operation occurs through disposal, or when the operation meets the criteria to be classified as held for sale if this occurs earlier. A discontinued operation is a component of a Group business comprising cash flows and operations that may be clearly distinct from the rest of the Group and that represents an important separate line of business or geographical area of operations. The result of discontinued operations is presented in a single amount in the income statement, including the results after income tax of these operations less any impairment loss. Cash flows attributable to operating, investing and financing activities of discontinued operations are described in a separate note. When an operation is classified as a discontinued operation, the income statements of the prior periods are re-presented as if the operation had been discontinued since the beginning of the comparative period. Any non-controlling interest relating to disposal group will be presented in the stockholders equity not being reclassified as a held for sale.
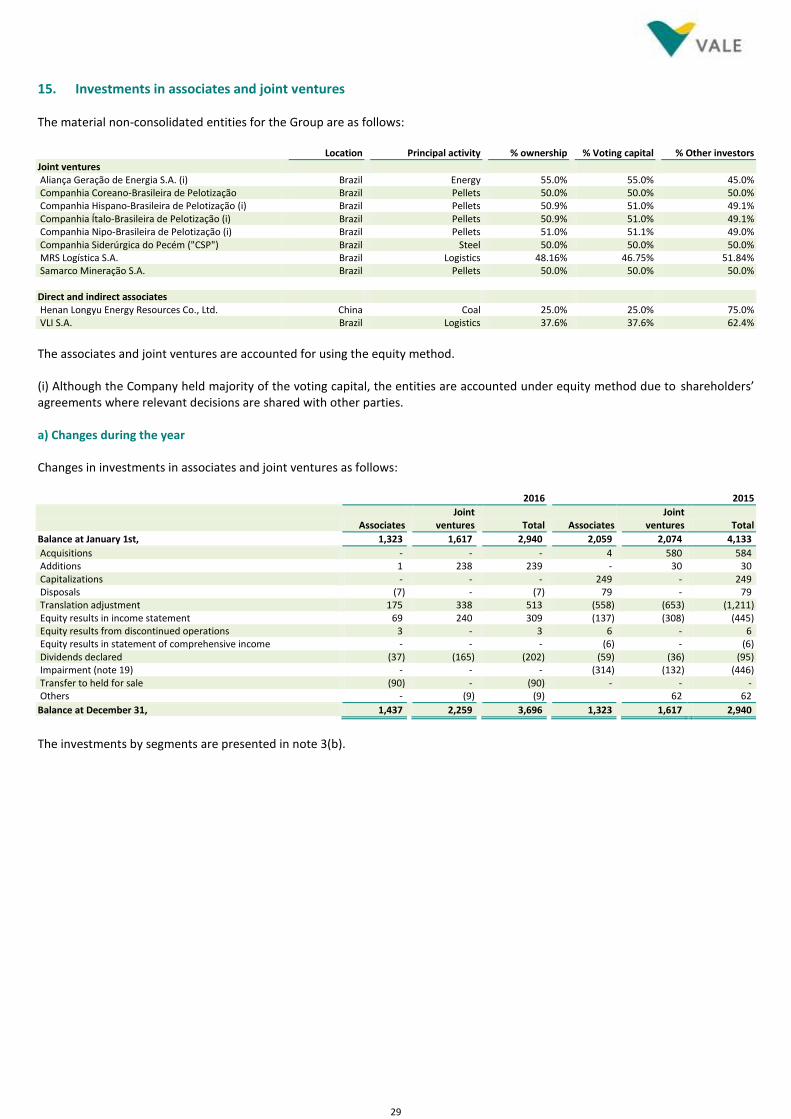
29
15. Investments in associates and joint ventures The material non-consolidated entities for the Group are as follows: Location Principal activity % ownership % Voting capital % Other investors
Joint ventures Aliança Geração de Energia S.A. (i) Brazil Energy 55.0% 55.0% 45.0% Companhia Coreano-Brasileira de Pelotização Brazil Pellets 50.0% 50.0% 50.0% Companhia Hispano-Brasileira de Pelotização (i) Brazil Pellets 50.9% 51.0% 49.1% Companhia Ítalo-Brasileira de Pelotização (i) Brazil Pellets 50.9% 51.0% 49.1% Companhia Nipo-Brasileira de Pelotização (i) Brazil Pellets 51.0% 51.1% 49.0% Companhia Siderúrgica do Pecém ("CSP") Brazil Steel 50.0% 50.0% 50.0% MRS Logística S.A. Brazil Logistics 48.16% 46.75% 51.84% Samarco Mineração S.A. Brazil Pellets 50.0% 50.0% 50.0% Direct and indirect associates Henan Longyu Energy Resources Co., Ltd. China Coal 25.0% 25.0% 75.0% VLI S.A. Brazil Logistics 37.6% 37.6% 62.4%
The associates and joint ventures are accounted for using the equity method. (i) Although the Company held majority of the voting capital, the entities are accounted under equity method due to shareholders’ agreements where relevant decisions are shared with other parties. a) Changes during the year Changes in investments in associates and joint ventures as follows: 2016 2015
Associates Joint
ventures Total Associates Joint
ventures Total
Balance at January 1st, 1,323 1,617 2,940 2,059 2,074 4,133
Acquisitions - - - 4 580 584 Additions 1 238 239 - 30 30 Capitalizations - - - 249 - 249 Disposals (7) - (7) 79 - 79 Translation adjustment 175 338 513 (558) (653) (1,211) Equity results in income statement 69 240 309 (137) (308) (445) Equity results from discontinued operations 3 - 3 6 - 6 Equity results in statement of comprehensive income - - - (6) - (6) Dividends declared (37) (165) (202) (59) (36) (95) Impairment (note 19) - - - (314) (132) (446) Transfer to held for sale (90) - (90) - - - Others - (9) (9) 62 62
Balance at December 31, 1,437 2,259 3,696 1,323 1,617 2,940
The investments by segments are presented in note 3(b).
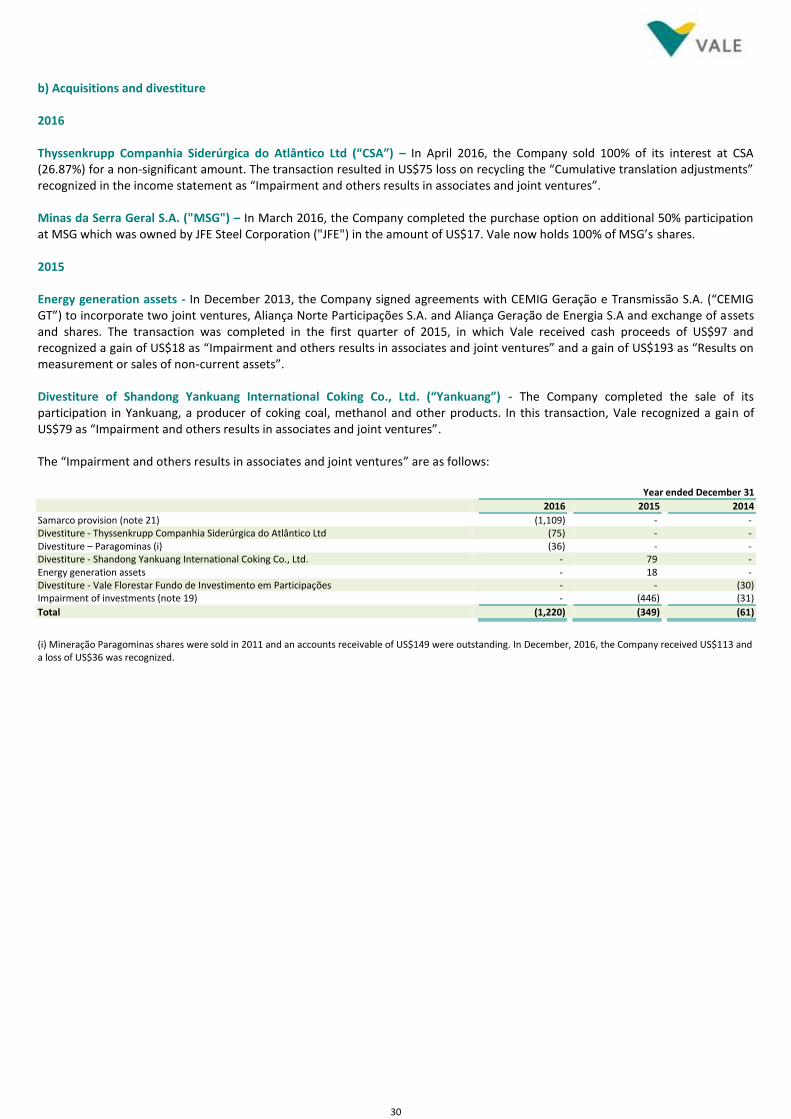
30
b) Acquisitions and divestiture 2016 Thyssenkrupp Companhia Siderúrgica do Atlântico Ltd (“CSA”) – In April 2016, the Company sold 100% of its interest at CSA (26.87%) for a non-significant amount. The transaction resulted in US$75 loss on recycling the “Cumulative translation adjustments” recognized in the income statement as “Impairment and others results in associates and joint ventures”. Minas da Serra Geral S.A. ("MSG") – In March 2016, the Company completed the purchase option on additional 50% participation at MSG which was owned by JFE Steel Corporation ("JFE") in the amount of US$17. Vale now holds 100% of MSG’s shares. 2015 Energy generation assets - In December 2013, the Company signed agreements with CEMIG Geração e Transmissão S.A. (“CEMIG GT”) to incorporate two joint ventures, Aliança Norte Participações S.A. and Aliança Geração de Energia S.A and exchange of assets and shares. The transaction was completed in the first quarter of 2015, in which Vale received cash proceeds of US$97 and recognized a gain of US$18 as “Impairment and others results in associates and joint ventures” and a gain of US$193 as “Results on measurement or sales of non-current assets”. Divestiture of Shandong Yankuang International Coking Co., Ltd. (“Yankuang”) - The Company completed the sale of its participation in Yankuang, a producer of coking coal, methanol and other products. In this transaction, Vale recognized a gain of US$79 as “Impairment and others results in associates and joint ventures”. The “Impairment and others results in associates and joint ventures” are as follows: Year ended December 31
2016 2015 2014
Samarco provision (note 21) (1,109) - - Divestiture - Thyssenkrupp Companhia Siderúrgica do Atlântico Ltd (75) - - Divestiture – Paragominas (i) (36) - - Divestiture - Shandong Yankuang International Coking Co., Ltd. - 79 - Energy generation assets - 18 - Divestiture - Vale Florestar Fundo de Investimento em Participações - - (30) Impairment of investments (note 19) - (446) (31)
Total (1,220) (349) (61)
(i) Mineração Paragominas shares were sold in 2011 and an accounts receivable of US$149 were outstanding. In December, 2016, the Company received US$113 and a loss of US$36 was recognized.
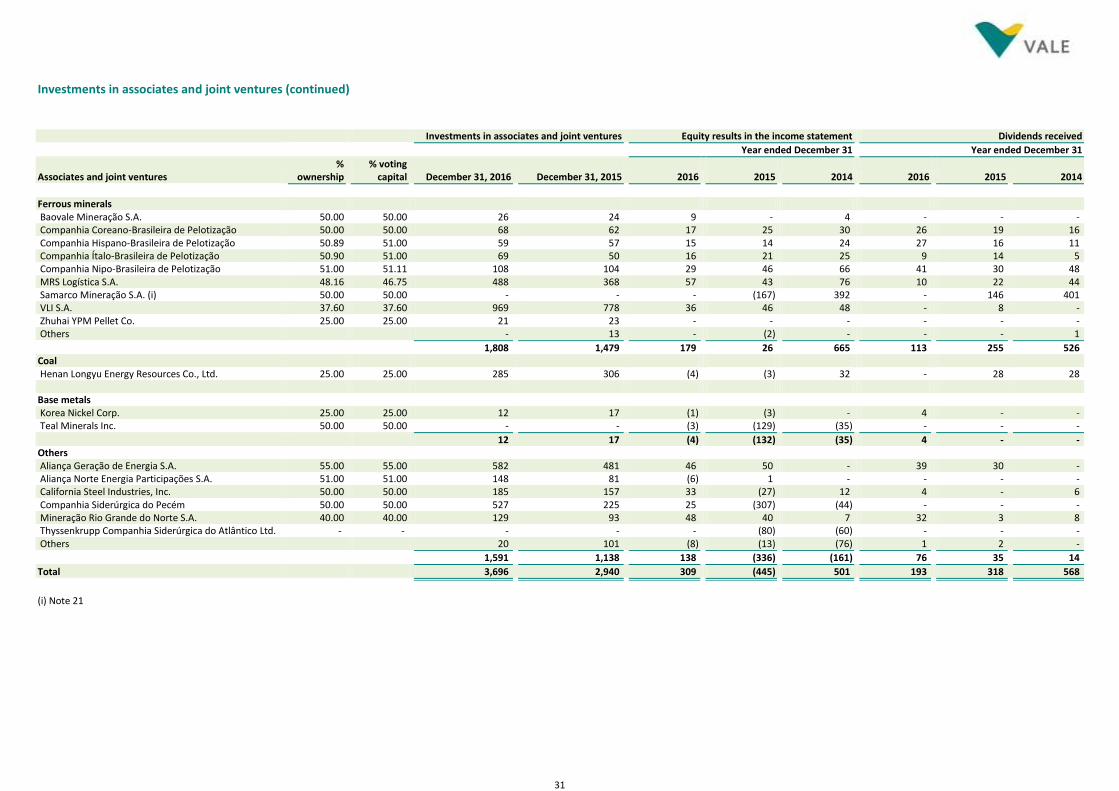
31
Investments in associates and joint ventures (continued)
Investments in associates and joint ventures Equity results in the income statement Dividends received
Year ended December 31 Year ended December 31
Associates and joint ventures %
ownership % voting
capital December 31, 2016 December 31, 2015 2016 2015 2014 2016 2015 2014
Ferrous minerals Baovale Mineração S.A. 50.00 50.00 26 24 9 - 4 - - - Companhia Coreano-Brasileira de Pelotização 50.00 50.00 68 62 17 25 30 26 19 16 Companhia Hispano-Brasileira de Pelotização 50.89 51.00 59 57 15 14 24 27 16 11 Companhia Ítalo-Brasileira de Pelotização 50.90 51.00 69 50 16 21 25 9 14 5 Companhia Nipo-Brasileira de Pelotização 51.00 51.11 108 104 29 46 66 41 30 48 MRS Logística S.A. 48.16 46.75 488 368 57 43 76 10 22 44 Samarco Mineração S.A. (i) 50.00 50.00 - - - (167) 392 - 146 401 VLI S.A. 37.60 37.60 969 778 36 46 48 - 8 - Zhuhai YPM Pellet Co. 25.00 25.00 21 23 - - - - - - Others - 13 - (2) - - - 1
1,808 1,479 179 26 665 113 255 526 Coal Henan Longyu Energy Resources Co., Ltd. 25.00 25.00 285 306 (4) (3) 32 - 28 28 Base metals Korea Nickel Corp. 25.00 25.00 12 17 (1) (3) - 4 - - Teal Minerals Inc. 50.00 50.00 - - (3) (129) (35) - - -
12 17 (4) (132) (35) 4 - - Others Aliança Geração de Energia S.A. 55.00 55.00 582 481 46 50 - 39 30 - Aliança Norte Energia Participações S.A. 51.00 51.00 148 81 (6) 1 - - - - California Steel Industries, Inc. 50.00 50.00 185 157 33 (27) 12 4 - 6 Companhia Siderúrgica do Pecém 50.00 50.00 527 225 25 (307) (44) - - - Mineração Rio Grande do Norte S.A. 40.00 40.00 129 93 48 40 7 32 3 8 Thyssenkrupp Companhia Siderúrgica do Atlântico Ltd. - - - - - (80) (60) - - - Others 20 101 (8) (13) (76) 1 2 -
1,591 1,138 138 (336) (161) 76 35 14
Total 3,696 2,940 309 (445) 501 193 318 568
(i) Note 21
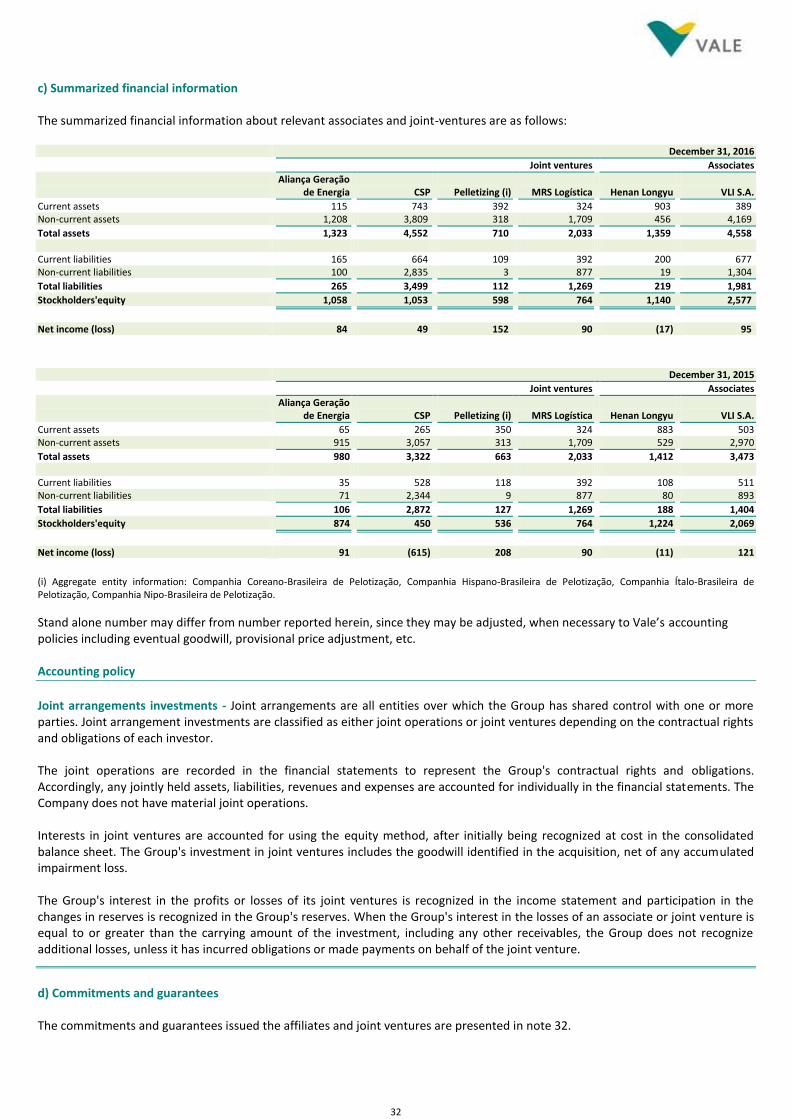
32
c) Summarized financial information The summarized financial information about relevant associates and joint-ventures are as follows:
December 31, 2016
Joint ventures Associates
Aliança Geração
de Energia CSP Pelletizing (i) MRS Logística Henan Longyu VLI S.A.
Current assets 115 743 392 324 903 389 Non-current assets 1,208 3,809 318 1,709 456 4,169
Total assets 1,323 4,552 710 2,033 1,359 4,558
Current liabilities 165 664 109 392 200 677 Non-current liabilities 100 2,835 3 877 19 1,304
Total liabilities 265 3,499 112 1,269 219 1,981
Stockholders'equity 1,058 1,053 598 764 1,140 2,577
Net income (loss) 84 49 152 90 (17) 95
December 31, 2015
Joint ventures Associates
Aliança Geração
de Energia CSP Pelletizing (i) MRS Logística Henan Longyu VLI S.A.
Current assets 65 265 350 324 883 503 Non-current assets 915 3,057 313 1,709 529 2,970
Total assets 980 3,322 663 2,033 1,412 3,473
Current liabilities 35 528 118 392 108 511 Non-current liabilities 71 2,344 9 877 80 893
Total liabilities 106 2,872 127 1,269 188 1,404
Stockholders'equity 874 450 536 764 1,224 2,069
Net income (loss) 91 (615) 208 90 (11) 121
(i) Aggregate entity information: Companhia Coreano-Brasileira de Pelotização, Companhia Hispano-Brasileira de Pelotização, Companhia Ítalo-Brasileira de Pelotização, Companhia Nipo-Brasileira de Pelotização.
Stand alone number may differ from number reported herein, since they may be adjusted, when necessary to Vale’s accounting policies including eventual goodwill, provisional price adjustment, etc. Accounting policy
Joint arrangements investments - Joint arrangements are all entities over which the Group has shared control with one or more parties. Joint arrangement investments are classified as either joint operations or joint ventures depending on the contractual rights and obligations of each investor. The joint operations are recorded in the financial statements to represent the Group's contractual rights and obligations. Accordingly, any jointly held assets, liabilities, revenues and expenses are accounted for individually in the financial statements. The Company does not have material joint operations. Interests in joint ventures are accounted for using the equity method, after initially being recognized at cost in the consolidated balance sheet. The Group's investment in joint ventures includes the goodwill identified in the acquisition, net of any accumulated impairment loss. The Group's interest in the profits or losses of its joint ventures is recognized in the income statement and participation in the changes in reserves is recognized in the Group's reserves. When the Group's interest in the losses of an associate or joint venture is equal to or greater than the carrying amount of the investment, including any other receivables, the Group does not recognize additional losses, unless it has incurred obligations or made payments on behalf of the joint venture.
d) Commitments and guarantees The commitments and guarantees issued the affiliates and joint ventures are presented in note 32.
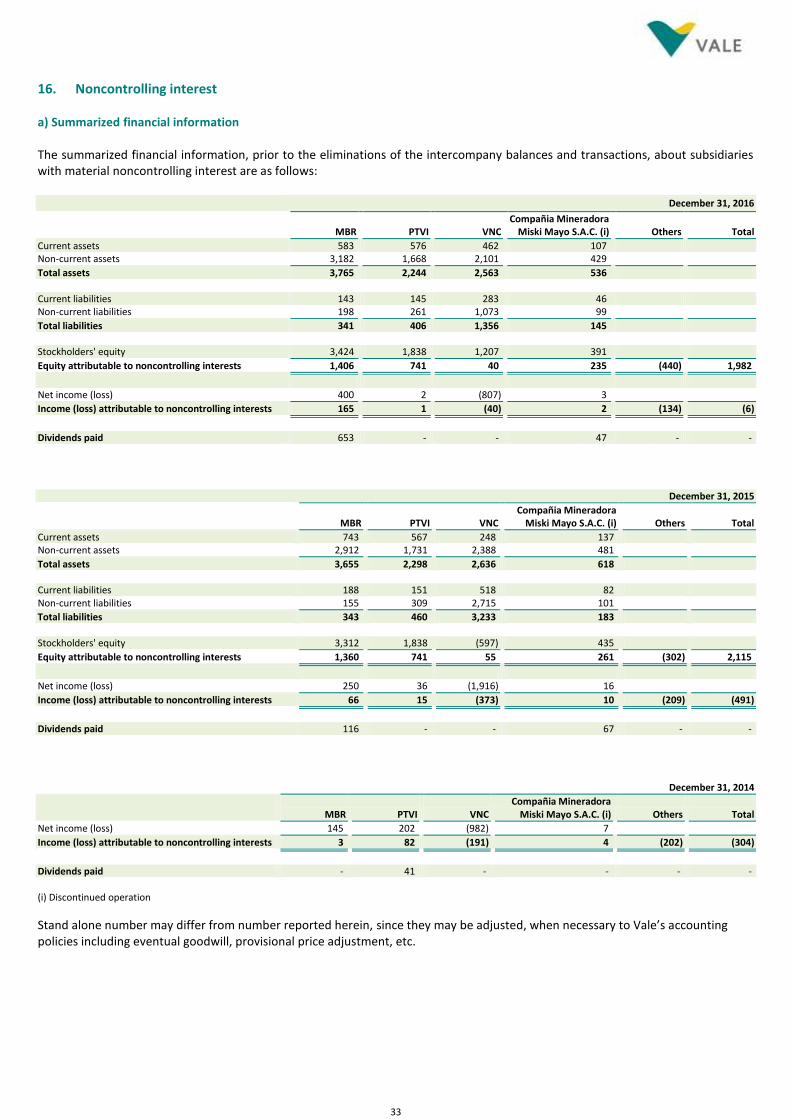
33
16. Noncontrolling interest a) Summarized financial information The summarized financial information, prior to the eliminations of the intercompany balances and transactions, about subsidiaries with material noncontrolling interest are as follows: December 31, 2016
MBR PTVI VNC
Compañia Mineradora Miski Mayo S.A.C. (i) Others Total
Current assets 583 576 462 107 Non-current assets 3,182 1,668 2,101 429
Total assets 3,765 2,244 2,563 536 Current liabilities 143 145 283 46 Non-current liabilities 198 261 1,073 99
Total liabilities 341 406 1,356 145 Stockholders' equity 3,424 1,838 1,207 391
Equity attributable to noncontrolling interests 1,406 741 40 235 (440) 1,982
Net income (loss) 400 2 (807) 3
Income (loss) attributable to noncontrolling interests 165 1 (40) 2 (134) (6)
Dividends paid 653 - - 47 - -
December 31, 2015
MBR PTVI VNC
Compañia Mineradora Miski Mayo S.A.C. (i) Others Total
Current assets 743 567 248 137 Non-current assets 2,912 1,731 2,388 481
Total assets 3,655 2,298 2,636 618 Current liabilities 188 151 518 82 Non-current liabilities 155 309 2,715 101
Total liabilities 343 460 3,233 183 Stockholders' equity 3,312 1,838 (597) 435
Equity attributable to noncontrolling interests 1,360 741 55 261 (302) 2,115
Net income (loss) 250 36 (1,916) 16
Income (loss) attributable to noncontrolling interests 66 15 (373) 10 (209) (491)
Dividends paid 116 - - 67 - -
December 31, 2014
MBR PTVI VNC
Compañia Mineradora Miski Mayo S.A.C. (i) Others Total
Net income (loss) 145 202 (982) 7
Income (loss) attributable to noncontrolling interests 3 82 (191) 4 (202) (304)
Dividends paid - 41 - - - - (i) Discontinued operation
Stand alone number may differ from number reported herein, since they may be adjusted, when necessary to Vale’s accounting policies including eventual goodwill, provisional price adjustment, etc.
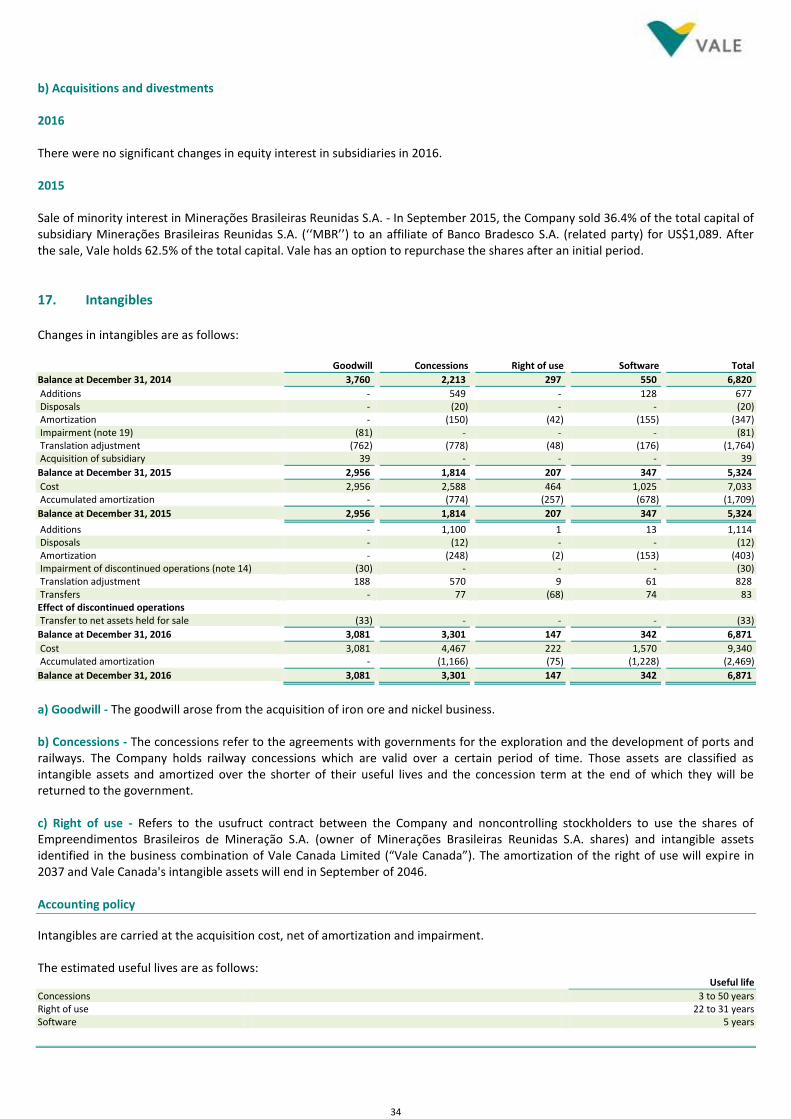
34
b) Acquisitions and divestments 2016 There were no significant changes in equity interest in subsidiaries in 2016. 2015 Sale of minority interest in Minerações Brasileiras Reunidas S.A. - In September 2015, the Company sold 36.4% of the total capital of subsidiary Minerações Brasileiras Reunidas S.A. (‘‘MBR’’) to an affiliate of Banco Bradesco S.A. (related party) for US$1,089. After the sale, Vale holds 62.5% of the total capital. Vale has an option to repurchase the shares after an initial period.
17. Intangibles Changes in intangibles are as follows: Goodwill Concessions Right of use Software Total
Balance at December 31, 2014 3,760 2,213 297 550 6,820
Additions - 549 - 128 677 Disposals - (20) - - (20) Amortization - (150) (42) (155) (347) Impairment (note 19) (81) - - - (81) Translation adjustment (762) (778) (48) (176) (1,764) Acquisition of subsidiary 39 - - - 39
Balance at December 31, 2015 2,956 1,814 207 347 5,324
Cost 2,956 2,588 464 1,025 7,033 Accumulated amortization - (774) (257) (678) (1,709)
Balance at December 31, 2015 2,956 1,814 207 347 5,324
Additions - 1,100 1 13 1,114 Disposals - (12) - - (12) Amortization - (248) (2) (153) (403) Impairment of discontinued operations (note 14) (30) - - - (30) Translation adjustment 188 570 9 61 828 Transfers - 77 (68) 74 83 Effect of discontinued operations Transfer to net assets held for sale (33) - - - (33)
Balance at December 31, 2016 3,081 3,301 147 342 6,871
Cost 3,081 4,467 222 1,570 9,340 Accumulated amortization - (1,166) (75) (1,228) (2,469)
Balance at December 31, 2016 3,081 3,301 147 342 6,871
a) Goodwill - The goodwill arose from the acquisition of iron ore and nickel business. b) Concessions - The concessions refer to the agreements with governments for the exploration and the development of ports and railways. The Company holds railway concessions which are valid over a certain period of time. Those assets are classified as intangible assets and amortized over the shorter of their useful lives and the concession term at the end of which they will be returned to the government. c) Right of use - Refers to the usufruct contract between the Company and noncontrolling stockholders to use the shares of Empreendimentos Brasileiros de Mineração S.A. (owner of Minerações Brasileiras Reunidas S.A. shares) and intangible assets identified in the business combination of Vale Canada Limited (“Vale Canada”). The amortization of the right of use will expire in 2037 and Vale Canada's intangible assets will end in September of 2046. Accounting policy
Intangibles are carried at the acquisition cost, net of amortization and impairment. The estimated useful lives are as follows: Useful life
Concessions 3 to 50 years Right of use 22 to 31 years Software 5 years
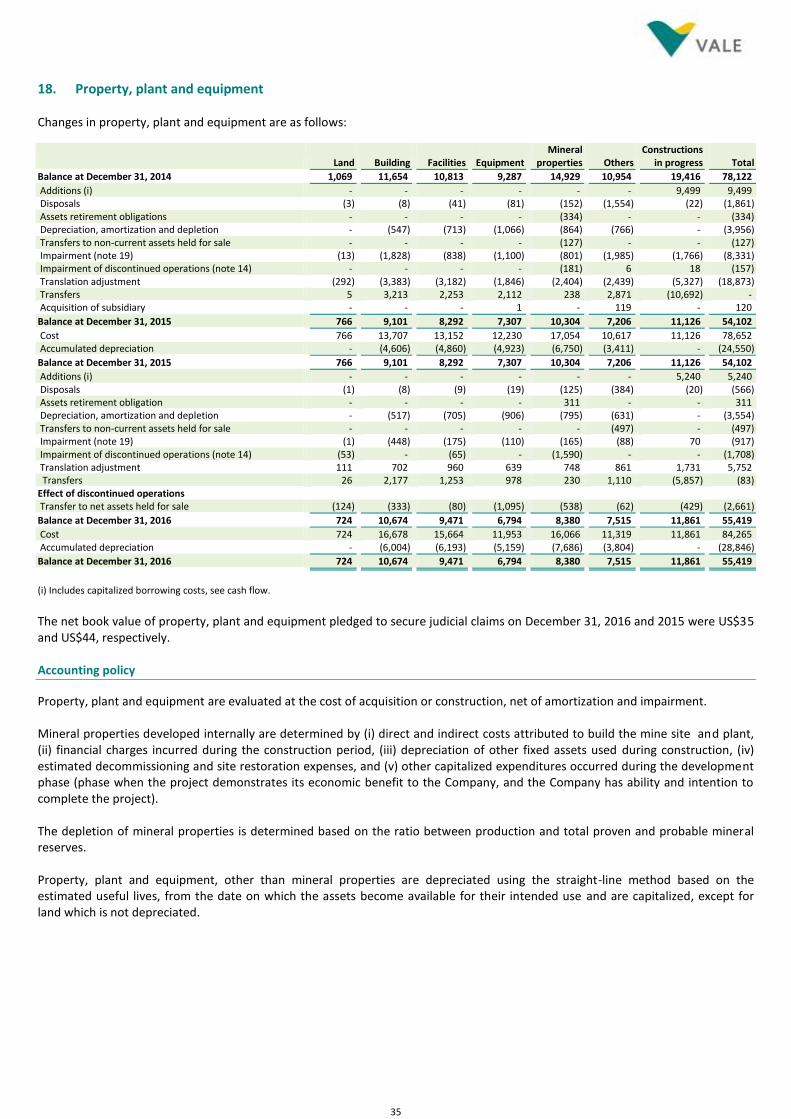
35
18. Property, plant and equipment Changes in property, plant and equipment are as follows:
Land Building Facilities Equipment Mineral
properties Others Constructions
in progress Total
Balance at December 31, 2014 1,069 11,654 10,813 9,287 14,929 10,954 19,416 78,122
Additions (i) - - - - - - 9,499 9,499 Disposals (3) (8) (41) (81) (152) (1,554) (22) (1,861) Assets retirement obligations - - - - (334) - - (334) Depreciation, amortization and depletion - (547) (713) (1,066) (864) (766) - (3,956) Transfers to non-current assets held for sale - - - - (127) - - (127) Impairment (note 19) (13) (1,828) (838) (1,100) (801) (1,985) (1,766) (8,331) Impairment of discontinued operations (note 14) - - - - (181) 6 18 (157) Translation adjustment (292) (3,383) (3,182) (1,846) (2,404) (2,439) (5,327) (18,873) Transfers 5 3,213 2,253 2,112 238 2,871 (10,692) - Acquisition of subsidiary - - - 1 - 119 - 120
Balance at December 31, 2015 766 9,101 8,292 7,307 10,304 7,206 11,126 54,102
Cost 766 13,707 13,152 12,230 17,054 10,617 11,126 78,652 Accumulated depreciation - (4,606) (4,860) (4,923) (6,750) (3,411) - (24,550)
Balance at December 31, 2015 766 9,101 8,292 7,307 10,304 7,206 11,126 54,102
Additions (i) - - - - - - 5,240 5,240 Disposals (1) (8) (9) (19) (125) (384) (20) (566) Assets retirement obligation - - - - 311 - - 311 Depreciation, amortization and depletion - (517) (705) (906) (795) (631) - (3,554) Transfers to non-current assets held for sale - - - - - (497) - (497) Impairment (note 19) (1) (448) (175) (110) (165) (88) 70 (917) Impairment of discontinued operations (note 14) (53) - (65) - (1,590) - - (1,708) Translation adjustment 111 702 960 639 748 861 1,731 5,752 Transfers 26 2,177 1,253 978 230 1,110 (5,857) (83) Effect of discontinued operations Transfer to net assets held for sale (124) (333) (80) (1,095) (538) (62) (429) (2,661)
Balance at December 31, 2016 724 10,674 9,471 6,794 8,380 7,515 11,861 55,419
Cost 724 16,678 15,664 11,953 16,066 11,319 11,861 84,265 Accumulated depreciation - (6,004) (6,193) (5,159) (7,686) (3,804) - (28,846)
Balance at December 31, 2016 724 10,674 9,471 6,794 8,380 7,515 11,861 55,419
(i) Includes capitalized borrowing costs, see cash flow.
The net book value of property, plant and equipment pledged to secure judicial claims on December 31, 2016 and 2015 were US$35 and US$44, respectively. Accounting policy
Property, plant and equipment are evaluated at the cost of acquisition or construction, net of amortization and impairment. Mineral properties developed internally are determined by (i) direct and indirect costs attributed to build the mine site and plant, (ii) financial charges incurred during the construction period, (iii) depreciation of other fixed assets used during construction, (iv) estimated decommissioning and site restoration expenses, and (v) other capitalized expenditures occurred during the development phase (phase when the project demonstrates its economic benefit to the Company, and the Company has ability and intention to complete the project). The depletion of mineral properties is determined based on the ratio between production and total proven and probable mineral reserves. Property, plant and equipment, other than mineral properties are depreciated using the straight-line method based on the estimated useful lives, from the date on which the assets become available for their intended use and are capitalized, except for land which is not depreciated.
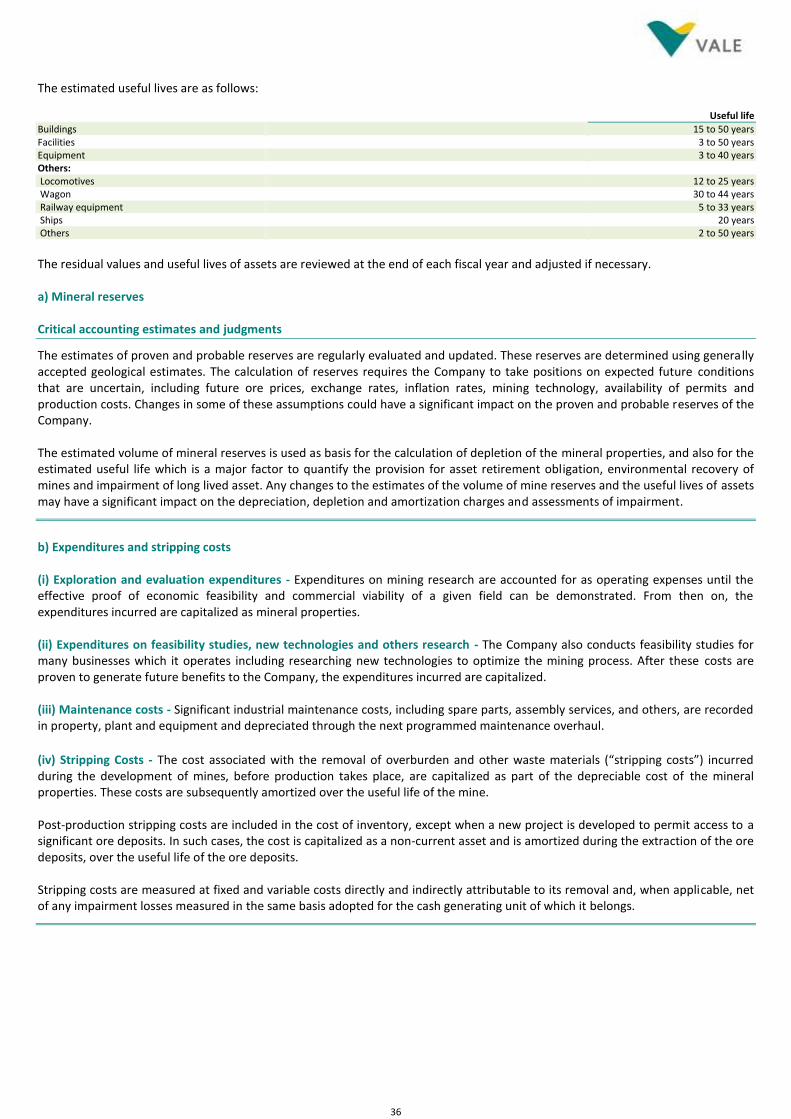
36
The estimated useful lives are as follows: Useful life
Buildings 15 to 50 years Facilities 3 to 50 years Equipment 3 to 40 years Others: Locomotives 12 to 25 years Wagon 30 to 44 years Railway equipment 5 to 33 years Ships 20 years Others 2 to 50 years
The residual values and useful lives of assets are reviewed at the end of each fiscal year and adjusted if necessary. a) Mineral reserves Critical accounting estimates and judgments
The estimates of proven and probable reserves are regularly evaluated and updated. These reserves are determined using generally accepted geological estimates. The calculation of reserves requires the Company to take positions on expected future conditions that are uncertain, including future ore prices, exchange rates, inflation rates, mining technology, availability of permits and production costs. Changes in some of these assumptions could have a significant impact on the proven and probable reserves of the Company. The estimated volume of mineral reserves is used as basis for the calculation of depletion of the mineral properties, and also for the estimated useful life which is a major factor to quantify the provision for asset retirement obligation, environmental recovery of mines and impairment of long lived asset. Any changes to the estimates of the volume of mine reserves and the useful lives of assets may have a significant impact on the depreciation, depletion and amortization charges and assessments of impairment.
b) Expenditures and stripping costs (i) Exploration and evaluation expenditures - Expenditures on mining research are accounted for as operating expenses until the effective proof of economic feasibility and commercial viability of a given field can be demonstrated. From then on, the expenditures incurred are capitalized as mineral properties. (ii) Expenditures on feasibility studies, new technologies and others research - The Company also conducts feasibility studies for many businesses which it operates including researching new technologies to optimize the mining process. After these costs are proven to generate future benefits to the Company, the expenditures incurred are capitalized. (iii) Maintenance costs - Significant industrial maintenance costs, including spare parts, assembly services, and others, are recorded in property, plant and equipment and depreciated through the next programmed maintenance overhaul.
(iv) Stripping Costs - The cost associated with the removal of overburden and other waste materials (“stripping costs”) incurred during the development of mines, before production takes place, are capitalized as part of the depreciable cost of the mineral properties. These costs are subsequently amortized over the useful life of the mine. Post-production stripping costs are included in the cost of inventory, except when a new project is developed to permit access to a significant ore deposits. In such cases, the cost is capitalized as a non-current asset and is amortized during the extraction of the ore deposits, over the useful life of the ore deposits. Stripping costs are measured at fixed and variable costs directly and indirectly attributable to its removal and, when applicable, net of any impairment losses measured in the same basis adopted for the cash generating unit of which it belongs.
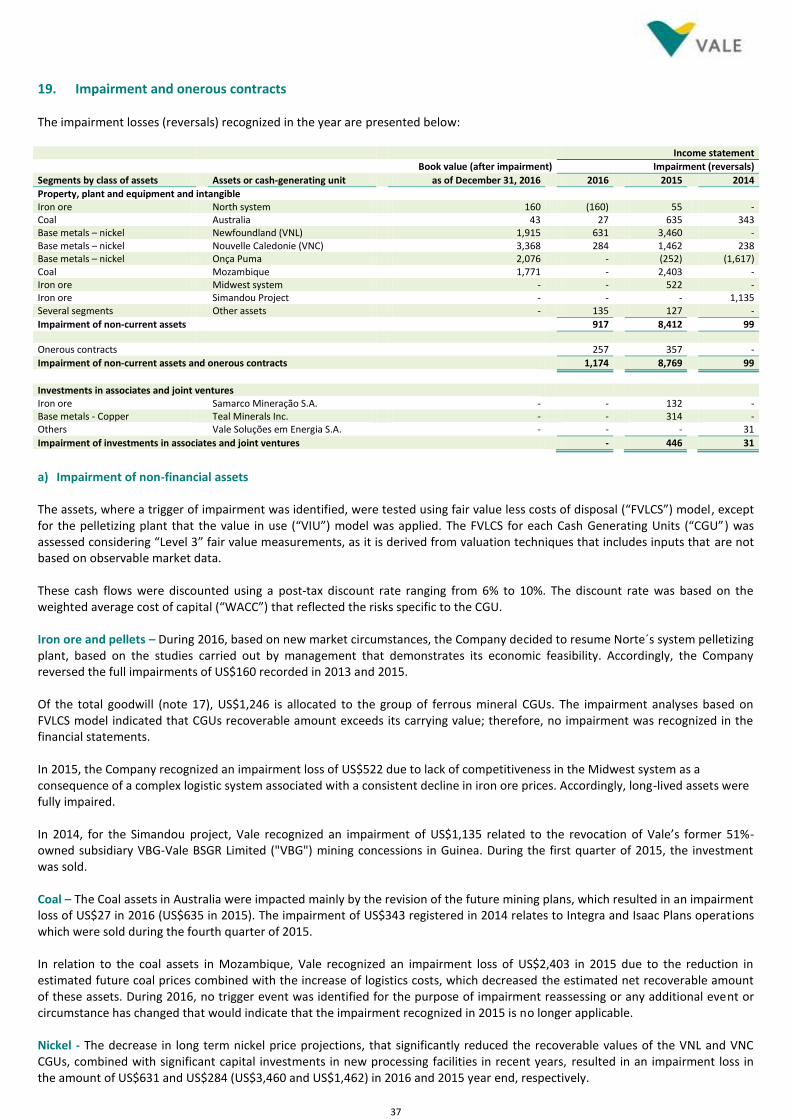
37
19. Impairment and onerous contracts The impairment losses (reversals) recognized in the year are presented below:
Income statement
Book value (after impairment) Impairment (reversals)
Segments by class of assets
Assets or cash-generating unit
as of December 31, 2016
2016
2015
2014
Property, plant and equipment and intangible Iron ore North system 160 (160) 55 -
Coal Australia 43 27 635 343 Base metals – nickel
Newfoundland (VNL)
1,915
631
3,460
-
Base metals – nickel Nouvelle Caledonie (VNC) 3,368 284 1,462 238 Base metals – nickel
Onça Puma
2,076
-
(252)
(1,617)
Coal
Mozambique
1,771
-
2,403
- Iron ore
Midwest system
-
-
522
-
Iron ore
Simandou Project
-
-
-
1,135 Several segments
Other assets
-
135
127
-
Impairment of non-current assets
917
8,412
99
Onerous contracts
257
357
-
Impairment of non-current assets and onerous contracts
1,174
8,769
99
Investments in associates and joint ventures Iron ore
Samarco Mineração S.A.
-
-
132
-
Base metals - Copper
Teal Minerals Inc.
-
-
314
- Others
Vale Soluções em Energia S.A.
-
-
-
31
Impairment of investments in associates and joint ventures
-
446
31
a) Impairment of non-financial assets The assets, where a trigger of impairment was identified, were tested using fair value less costs of disposal (“FVLCS”) model, except for the pelletizing plant that the value in use (“VIU”) model was applied. The FVLCS for each Cash Generating Units (“CGU”) was assessed considering “Level 3” fair value measurements, as it is derived from valuation techniques that includes inputs that are not based on observable market data. These cash flows were discounted using a post-tax discount rate ranging from 6% to 10%. The discount rate was based on the weighted average cost of capital (“WACC”) that reflected the risks specific to the CGU. Iron ore and pellets – During 2016, based on new market circumstances, the Company decided to resume Norte´s system pelletizing plant, based on the studies carried out by management that demonstrates its economic feasibility. Accordingly, the Company reversed the full impairments of US$160 recorded in 2013 and 2015. Of the total goodwill (note 17), US$1,246 is allocated to the group of ferrous mineral CGUs. The impairment analyses based on FVLCS model indicated that CGUs recoverable amount exceeds its carrying value; therefore, no impairment was recognized in the financial statements. In 2015, the Company recognized an impairment loss of US$522 due to lack of competitiveness in the Midwest system as a consequence of a complex logistic system associated with a consistent decline in iron ore prices. Accordingly, long-lived assets were fully impaired. In 2014, for the Simandou project, Vale recognized an impairment of US$1,135 related to the revocation of Vale’s former 51%-owned subsidiary VBG-Vale BSGR Limited ("VBG") mining concessions in Guinea. During the first quarter of 2015, the investment was sold. Coal – The Coal assets in Australia were impacted mainly by the revision of the future mining plans, which resulted in an impairment loss of US$27 in 2016 (US$635 in 2015). The impairment of US$343 registered in 2014 relates to Integra and Isaac Plans operations which were sold during the fourth quarter of 2015. In relation to the coal assets in Mozambique, Vale recognized an impairment loss of US$2,403 in 2015 due to the reduction in estimated future coal prices combined with the increase of logistics costs, which decreased the estimated net recoverable amount of these assets. During 2016, no trigger event was identified for the purpose of impairment reassessing or any additional event or circumstance has changed that would indicate that the impairment recognized in 2015 is no longer applicable. Nickel - The decrease in long term nickel price projections, that significantly reduced the recoverable values of the VNL and VNC CGUs, combined with significant capital investments in new processing facilities in recent years, resulted in an impairment loss in the amount of US$631 and US$284 (US$3,460 and US$1,462) in 2016 and 2015 year end, respectively.
38
The assumption of nickel prices used in the FVLCS calculation for the nickel CGUs is in a range (US$ per ton) from 10,500 to 20,000 (13,000 to 20,000 in 2015). Cash flows used are designed based on the life of each UGC and considering a discount rate ranging from 6% to 8% per year. Of the total goodwill (note 17), US$1,835 is allocated to the group of nickel CGUs. The impairment analyses based on FVLCS model demonstrates that nickel CGUs recoverable amount exceeds its carrying value; therefore no impairment was recognized in the financial statements. In 2014, the Company identified that the indicators which caused an impairment to be recognized in previous years for Onça Puma were no longer applicable. This was mainly due to Onça Puma’s production resuming to normal capacity after the furnace problems in 2012. The total impairment registered in 2012 was reversed in 2014 and 2015. b) Onerous contract The provision recognized in 2016, US$183 is related to the contracts with minimum guaranteed volume for port structure in the Midwest system and US$74 for supply of manganese ore. In 2015, the Company recognized a provision related to the fluvial transportation contract with minimal guarantee volume in the amount of US$357 also in the Midwest system. c) Impairment of investments in associates and joint ventures In 2015, the Company recognized an impairment of US$132 in its investment in Samarco (note 21) and US$314 in Teal Minerals Inc. (“Teal”). Teal recognized an impairment of property, plant and equipment due to the revision of future mining plans and the decrease of the copper price. Accounting policy
Impairment of non-Financial assets - Non-financial assets are reviewed for impairment whenever events or changes in circumstances indicate that the carrying amount might not be recoverable. An impairment loss is recognized for the amount by which the asset´s carrying value exceeds its recoverable amount. The recoverable amount is the higher of an asset’s fair value less costs of disposal (“FVLCS”) and value in use (”VIU”). FVLCS is generally determined as the present value of the estimated future cash flows expected to arise from the continued use of the asset, including any expansion prospects, and its eventual disposal. VIU model is determined as the present value of the estimated future cash flows expected to arise from the continued use of the asset in its present form. Value in use is determined by applying assumptions specific to the Group’s continued use and cannot take into account future development. These assumptions are different to those used in calculating fair value and consequently the VIU calculation is likely to give a different result to a FVLCS calculation.
The future cash flows are based on the current life-of-mine plan or long-term production plan for the cash-generating unit.
Assets that have an indefinite useful life and are not subject to amortization, such as goodwill, are tested annually for impairment.
For the purposes of assessing impairment, assets are grouped at the lowest levels for which there are separately identifiable cash flows (Cash Generating Units (CGUs)). Goodwill is allocated to Cash Generating Units or Cash Generating Units groups that are expected to benefit from the business combinations in which the goodwill arose and are identified in accordance with the operating segment.
Non-current assets (excluding goodwill) in which the Company recognized impairment in the past are reviewed whenever events or changes in circumstances indicate that the impairment may no longer be applicable. In such cases, an impairment reversal will be recognized. Onerous Contracts - For onerous contracts, provision is recognized for the present value of certain long-term contracts where the unavoidable cost of meeting the Company’s obligations exceed the economic benefits to be receive under it.
39
Critical accounting estimates and judgments
The Company determines its cash flows based on the budgets approved by management, which require the use of the following key assumptions: (i) mineral reserves and mineral resources measured by internal experts; (ii) costs and investments based on the best estimate of projects as supported by past performance; (iii) sale prices consistent with projections available in reports published by industry considering the market price when appropriate; (iv) the life of each cash-generating unit (ratio between production and mineral reserves); and (v) discount rates that reflect specific risks relating to the relevant assets in each cash-generating unit. These assumptions are subject to risk and uncertainty; hence there is a possibility that changes in circumstances will change these projections, which may impact the recoverable amount of the assets.
20. Loans, borrowings and cash and cash equivalents a) Net debt The Company evaluates the net debt with the objective of ensuring the continuity of its business in the long term, being able to generate value to its stockholders, through the payment of dividends and capital gain. December 31, 2016 December 31, 2015
Debt contracts in the international markets 21,130 21,671 Debt contracts in Brazil 8,192 7,182
Total of loans and borrowings 29,322 28,853
(-) cash and cash equivalents 4,262 3,591
Net debt 25,060 25,262
b) Cash and cash equivalents Cash and cash equivalents includes cash, immediately redeemable deposits and short-term investments with an insignificant risk of change in value. They are readily convertible to cash, being US$961 denominated in R$, indexed to the Brazilian Interbank Interest rate (“DI Rate”or”CDI”), US$2,899 denominated in US$, mainly time deposits and US$402 denominated in other currencies. c) Loans and borrowings (i) Total debt Current liabilities Non-current liabilities
December 31, 2016 December 31, 2015 December 31, 2016 December 31, 2015
Debt contracts in the international markets Floating rates in: US$ 234 241 5,489 5,174 EUR - - 211 - Fixed rates in: US$ - 1,191 13,083 12,923 EUR - - 1,583 1,633 Other currencies 17 14 209 169 Accrued charges 304 326 - -
555 1,772 20,575 19,899
Debt contracts in Brazil Floating rates in: R$, indexed to TJLP, TR, IPCA, IGP-M and CDI 402 212 5,621 4,709 Basket of currencies and US$ indexed to LIBOR 343 290 1,217 1,342 Fixed rates in: R$ 66 63 216 268 Accrued charges 294 169 33 129
1,105 734 7,087 6,448
1,660 2,506 27,662 26,347
40
The future flows of debt payments principal, per nature of funding and interest are as follows: Principal
Bank loans
Capital markets
Development
agencies
Total
Estimated future interests payments (i)
2017 59 - 1,002 1,061 1,583 2018 1,861 791 1,172 3,824 1,369 2019 1,088 1,000 1,361 3,449 1,211 2020 1,593 1,338 926 3,857 1,010 2021 622 1,342 912 2,876 844 Between 2022 and 2025 1,313 3,292 1,212 5,817 2,299 2026 onwards 81 7,490 236 7,807 5,319
6,617 15,253 6,821 28,691 13,635
(i) Estimated future payments of interest, calculated based on interest rate curves and foreign exchange rates applicable as at December 31, 2016 and considering that all amortization payments and payments at maturity on loans and borrowings will be made on their contracted payments dates. The amount includes the estimated values of future interest payments (not yet accrued), in addition to interest already recognized in the financial statements.
At December 31, 2016, the average annual interest rates by currency are as follows: Average interest rate (i) Total debt
Loans and borrowings Floating rates in: US$ 4.92% 20,615 R$ (ii) 10.94% 6,624 EUR (iii) 3.82% 1,857 Other currencies 3.35% 226
29,322
(i) In order to determine the average interest rate for debt contracts with floating rates, the Company used the last renegotiated rate at December 31, 2016. (ii) R$ denominated debt that bears interest at IPCA, CDI, TR or TJLP, plus spread. For a total of US$4,668, the Company entered into derivative transactions to mitigate the exposure to the cash flow variations of the floating rate debt denominated in R$, resulting in an average cost of 2.42% per year in US$. (iii) Eurobonds, for which the Company entered into derivatives to mitigate the exposure to the cash flow variations of the debt denominated in EUR, resulting in an average cost of 4.33% per year in US$.
ii) Credit and financing lines Available amount
Type Contractual
currency Date of
agreement Period of the
agreement Total amount December 31,
2016
Credit lines Revolving credit facilities US$ May 2015 5 years 3,000 3,000 Revolving credit facilities US$ July 2013 5 years 2,000 2,000 Financing lines BNDES (i) R$ April 2008 10 years 2,249 88 BNDES - CLN 150 R$ September 2012 10 years 1,196 6 BNDES - S11D e S11D Logística R$ May 2014 10 years 1,899 629
(i) Memorandum of understanding signature date, however term is considered from the signature date of each contract amendment. This credit line supported or supports the pelletizing plant VIII, Onça Puma, Salobo I and II and capital expenditure of Itabira projects.
Liquidity risk - To mitigate such risk, Vale has a revolving credit facilities to assist the short term liquidity management and to enable more efficiency in cash management, being consistent with the strategic focus on cost of capital reduction. The revolving credit facilities available today were acquired from a syndicate of several global commercial banks. iii) Funding In January 2016, the Company drew down part of its revolving credit facilities which were fully amortized in November 2016. There was no outstanding debt on this lines at December 31, 2016. In June and August 2016, the Company issued through its wholly owned subsidiary Vale Overseas Limited the guaranteed notes due 2021 and 2026 totaling US$2,250. These notes bear a coupon of 5.875% and 6.250% per year, respectively, payable semi-annually, and were sold at a price of 100.000% of the principal amount. In February 2017 (subsequent event), the Company issued through Vale Overseas Limited guaranteed notes due August 2026 totaling US$1,000. The notes bears 6.250% coupon per year, payable semi-annually, and were sold at a price of 107.793% of the principal amount. The notes will be consolidated with, and form a single series with, Vale Overseas’s US$1,000 6.250% notes due 2026 issued on August, 2016, mentioned above. Vale intends to apply the net proceeds from the offering on the earlier redemption of Vale’s €750 million notes (due in March 2018), which is expected to occur during March 2017.
41
iv) Guarantees As at December 31, 2016 and 2015, loans and borrowings are secured by property, plant and equipment and receivables in the amount of US$472 and US$495, respectively. The securities issued through Vale’s 100%-owned finance subsidiary Vale Overseas Limited are fully and unconditionally guaranteed by Vale. v) Covenants Some of the Company’s debt agreements with lenders contain financial covenants. The main covenants in those agreements require maintaining certain ratios, such as debt to EBITDA (Earnings before Interest Taxes, Depreciation and Amortization) and interest coverage. The Company has not identified any instances of noncompliance as at December 31, 2016 and 2015. Accounting policy
Loans and borrowings are initially measured at fair value, net of transaction costs incurred and are subsequently carried at amortized cost and updated using the effective interest rate method. Any difference between the proceeds (net of transaction costs) and the redemption value is recognized in the Income statement over the period of the loan, using the effective interest rate method. The fees paid in obtaining the loan are recognized as transaction costs. Loans and borrowing costs are capitalized as part of property, plants and equipment if those costs are directly related to a qualified asset. The capitalization occurs until the qualified asset is ready for its intended use. The average capitalization rate is 37%. Borrowing costs that are not capitalized are recognized in the income statement in the period in which they are incurred.
21. Liabilities related to associates and joint ventures Refers to the provision to comply with the obligations under the agreement related to the dam failure of Samarco Mineração S.A. (“Samarco”), which is a Brazilian joint venture between Vale S.A. and BHP Billiton Brasil Ltda. (“BHPB”), as follows: a) Framework agreement Samarco and its shareholders, Vale S.A. and BHPB, entered into an Agreement (“Framework Agreement”) in connection with the US$6.2 billion (R$20.2 billion) lawsuit on March 2, 2016 with the Brazilian federal government, the two Brazilian states affected by the failure (Espírito Santo and Minas Gerais) and other governmental authorities in order to implement the programs for remediation and compensation of the areas and communities affected by Samarco’s dam (Fundão) failure. The Framework Agreement does not contemplate admission of civil, criminal or administrative liability for the Fundão dam failure. The Framework Agreement has a 15-year term, renewable for successive one-year periods until all the obligations under the Framework Agreement have been performed. Under the Framework Agreement, Samarco, Vale S.A. and BHPB have agreed to establish a foundation to develop and implement social and economic remediation and compensation, to be funded by Samarco as follows: US$614 (R$2.0 billion) in 2016, US$368 (R$1.2 billion) in 2017 and US$368 (R$1.2 billion) in 2018. From 2019 to 2021, annual contributions to the foundation will range from US$245 (R$800) to US$491 (R$1.6 billion) based on the projects approved for the relevant year. From 2022 onwards, the annual contributions will be determined on the basis of the amount of funding necessary to complete remaining programs approved for each relevant year. The foundation will allocate an annual amount of US$74 (R$240) over 15 years to the implementation of compensation programs, and these annual amounts are included in the annual contributions described above for the first six years. Through the end of 2018, Samarco is expected to provide US$153 (R$500) for sewage collection and treatment and solid waste disposal under the terms of the Framework Agreement. To the extent that Samarco does not meet its funding obligations to the foundation, each of Vale S.A. and BHPB will provide, under the terms of the Framework Agreement, funds to the Foundation in proportion to its 50% equity interest in Samarco. On June 24, 2016, the Renova Foundation (“Foundation”) was constituted, under the Framework Agreement, to develop and implement the socio-economic restoration and compensation programs. The Foundation began its operations in August of 2016. As the consequence of the dam failure, governmental authorities ordered the suspension of Samarco’s operations.
42
b) Estimates used for the provision Samarco initially expected to resume its operations in the last quarter of 2016. Based on this assumption, Samarco´s cash flow projections indicated that it would be able to generate all or a substantial part of the funding required under the Framework Agreement. This assumption was supported by studies of appropriate technical solutions for the resumption of operations, as well as the progress of the work on the remaining dam structures after the failure and the implementation of the socio-economic and socio-environmental programs contemplated in the Framework Agreement. In light of the stage of procedures necessary to resume operations and the uncertainties related to the licensing approval by governmental authorities during 2016, Samarco revised its assumption and concluded that was unable to make a reliable estimate of how and when its operations will resume. Due to the above, as well as additional uncertainties regarding Samarco's cash flow, Vale S.A. recognized a provision on its interim financial statements as of June 30, 2016, for estimated costs in the amount of US$1,732 (R$5,560) which was discounted at a risk-free rate, resulting in US$1,163 (R$3,733) provision, which represents Vale S.A.’s best estimate of the obligation to comply with the reparation and compensation programs under the Framework Agreement, equivalent to its 50% equity interest in Samarco. In August 2016, Samarco issued non-convertible private debentures which were subscribed equally by Vale S.A. and BHPB, and the resources contributed by Vale S.A. were allocated as follows: (i) US$68 (R$222) was used by Samarco in the reparation programs in accordance with the Framework Agreement, and therefore, applied against the provision of US$1,163 (R$3,733) mentioned above; and (ii) US$71 (R$234) was applied by Samarco’s to fund its working capital, and recognized in Vale’s income statement as “Impairment and other results in associates and joint ventures”. Vale S.A. intends to make available short-term facilities in the first half of 2017 of up to US$115 (R$375) to Samarco to support its operations, without undertaking an obligation to Samarco. Funds for working capital requirements will be released as needed by the shareholders subject to achieving certain milestones. As a result of constituting the Foundation, most of the reparation and compensation programs were transferred from Samarco. Therefore, Vale S.A. made contributions to the Foundation totaling US$71 (R$ 239) to be used in the programs in accordance with the Framework Agreement. As a result of the above mentioned, the movements of the provision during the year are as follows: 2016
Balance on January 1, - Provision recognized 1,163 Payments made (139) Discount rate accretion 72 Translation adjustment (19)
Balance on December 31, 1,077
Current liabilities 292 Non-current liabilities 785
Liabilities 1,077
At each reporting period, Vale S.A. will reassess the key assumptions used by Samarco in the preparation of the projected future cash flows and will adjust the provision, if required. c) Relevant information of Samarco Samarco is a Brazilian entity jointly controlled by Vale S.A. and BHPB, in which each shareholder has a 50% ownership interest. Samarco operates an integrated enterprise consisting of mining, beneficiation and concentration of low-grade iron ore in the municipality of Mariana, in the State of Minas Gerais, as well as the hauling of such concentrated ore through ore pipelines connecting the its two operating plants located in Minas Gerais and Espírito Santo. On November 5, 2015, Samarco experienced the failure of an iron ore tailings dam (“Fundão”) in the state of Minas Gerais, which affected communities and ecosystems, including the Rio Doce river. Following the dam failure, the state government of Minas Gerais ordered the suspension of Samarco’s operations.
43
The summarized financial information about Samarco are as follows: December 31, 2016
Current assets 165 Non-current assets 6,510
Total assets 6,675 Current liabilities 4,853 Non-current liabilities 3,015
Total liabilities 7,868 Stockholders' equity (1,193)
Loss (769)
Under Brazilian legislation and the terms of the joint venture agreement, Vale does not have an obligation to provide funding to Samarco. As a result, Vale’s investment in Samarco was reduced to zero. Since the initial date of the accident, Samarco and its shareholders disbursed the total amount of US$614 (R$2.0 billion) to comply with the obligations under the Framework Agreement. d) Contingencies related to Samarco accident (i) Public civil claim filed by the Federal Government and others The federal government, the two Brazilian states affected by the failure (Espirito Santo and Minas Gerais) and other governmental authorities have initiated a public civil lawsuit against Samarco and its shareholders, Vale S.A. and BHPB, with an estimated value indicated by the plaintiffs of US$6.2 billion (R$20.2 billion). On May 5, 2016, the Framework Agreement, which was signed on March 2, 2016, was ratified by the Federal Regional Court (“TRF”), 1st Region. In June 2016 the Superior Court of Justice (“STJ”) in Brazil issued an interim order, suspending the decision of TRF, which ratified the Framework Agreement until the final judgments of the claim. On August 17, 2016, the TRF of the 1st Region rejected the appeal presented by Samarco, Vale S.A. and BHPB against the interim order, and overruled the judicial decision that ratified the Framework Agreement. This decision of the TRF of the 1st Region, among other measures, confirmed a prior injunction that prohibited the defendants from transferring or conveying any of their interest in its Brazilian iron ore concessions, without, however, limiting their production and commercial activities and ordered a deposit with the court of US$368 (R$1.2 billion) by January 2017. This US$368 (R$1.2 billion) cash deposit was provisionally replaced by the guarantees provided for under the agreements with MPF, as described below. In January 2017 Samarco, Vale S.A. and BHPB entered into two preliminary agreements with the Federal Prosecutor’s Office in Brazil (MPF). The first agreement (“First Agreement”) aims to outline the process and timeline for negotiations of a Final Agreement (“Final Agreement”), expected to occur by June 30th, 2017. This First Agreement sets the ground for conciliation of two public civil actions which aim to establish socio-economic and socio-environmental remediation and compensation programs for the impacts of the Fundão dam failure, respectively: claim nº 023863-07.2016.4.01.3800, filed by the Federal Prosecutors (amounting to US$48 billion (R$155 billion)), as mentioned in item (ii) below, and claim nº 0069758-61.2015.4.01.3400, filed by the Federal Government, the states of Minas Gerais and Espírito Santo and other governmental authorities (amounting to US$6.2 billion (R$ 20.2 billion)). Both claims were filed with the 12
th Judicial Federal Court of Belo Horizonte.
44
The First Agreement provides for: (i) the appointment of experts selected by the Federal Prosecutors and paid for by the companies to conduct a diagnosis and follow the progress of the 41 programs under the Framework Agreement signed on March 2nd, 2016 by the companies and the Federal Government and the states of Minas Gerais and Espírito Santo and other governmental authorities and (ii) holding at least eleven public hearings by April 15th, 2017, five of which are to be held in Minas Gerais, three in Espírito Santo and the remainder in the indigenous territories of the Krenak, Comboios and Caieiras Velhas, in order to allow these communities to take part in the definition of the content of the Final Agreement. Under the First Agreement, Samarco, Vale S.A. and BHPB will provide the 12
th Judicial Federal Court of Belo Horizonte with a
guarantee for fulfillment of the obligations regarding the financing and payment of the socio-environmental and socio-economic remediation programs resulting from the Fundão dam failure, pursuant to the two public civil actions, until the signing of the Final Agreement, amounting to US$675 (R$2.2 billion), of which (i) US$31 (R$100) in financial investments; ii) US$399 (R$1.3 billion) in insurance bonds; and (iii) US$245 (R$800) in assets of Samarco. The guarantee will remain in place until the completion of the negotiations for the Final Agreement or until June 30th, 2017, whichever comes first. In order to implement the First Agreement, it has been requested that the 12
th Judicial Federal Court of Belo Horizonte accept such guarantees until the completion of the
negotiations and the signing of the Final Agreement, or until the parties reach a new agreement regarding the guarantees. If, by June 30
th, the negotiations have not been completed, the Federal Prosecutor’s Office may require that the 12
th Judicial Federal
Court of Belo Horizonte re-institute the order for the deposit of US$368 (R$1.2 billion) in relation to the US$6.2 billion (R$20.2 billion) public civil action, which is currently suspended. In addition, the Second Agreement (Second Agreement) was signed, which establishes a timetable to make funds available to remediate the social, economic and environmental damages caused by the Fundão dam failure in the municipalities of Barra Longa, Rio Doce, Santa Cruz do Escalvado and Ponte Nova, amounting to US$61 (R$200). The terms of the two Agreements are subject to ratification by the courts. (ii) Public civil action filed by Federal Prosecution Office On May 3, 2016, the Federal Prosecution Office (MPF) filed a public civil action against Samarco and its shareholders and presented several demands, including: (i) the adoption of measures for mitigating the social, economic and environmental impacts resulting from the Fundão dam failure and other emergency measures; (ii) the payment of compensation to the community; and (iii) payments for the collective moral damage. The initial action value claimed by the Federal Prosecution Office (MPF) is US$48 billion (R$155 billion). The first conciliatory hearing was held on September 13, 2016. On November 21, 2016, the court ordered that the defendants be served, and the defendants submitted their defense. Given the negotiations of a potential settlement, the parties jointly requested the suspension of the proceeding, in accordance with the First Agreement. (iii) U.S. Securities class action suits On May 2, 2016, Vale S.A. and certain of its officers were named as defendants in securities class action suits in the Federal Court in New York brought by holders of Vale’s American Depositary Receipts under U.S. federal securities laws. The lawsuits allege that Vale S.A. made false and misleading statements or omitted to make disclosures concerning the risks and dangers of the operations of Samarco's Fundão dam and the adequacy of related programs and procedures. The plaintiffs have not specified an amount of alleged damages in these actions. Vale S.A. intends to vigorously and fully defend itself against the allegations. The litigation is at an early stage. On March 7, 2016, the judge overseeing the securities class actions issued an order consolidating these actions and designating lead plaintiffs and counsel. On April 29, 2016, lead plaintiffs filed a Consolidated Amended Complaint that will serve as the operative complaint in the litigation. In July 2016, Vale S.A. and the individual defendants filed a motion to dismiss the Amended Complaint. In August 2016, the plaintiffs submitted their opposition to the motion to dismiss, to which the defendants replied in September 2016. The decision on the motion to dismiss remains pending. (iv) Criminal lawsuit On October 20, 2016, the MPF brought a criminal lawsuit in the Brazilian Federal Justice Court against Vale S.A., BHPB, Samarco, VogBr Recursos Hídricos e Geotecnia Ltda. and 22 individuals for alleged crimes against the environment, urban planning and cultural heritage, flooding, landslide, as well as for alleged crimes against the victims of the Fundão dam failure. On November 16, 2016, the judge received the Federal Prosecutors Office criminal lawsuit and determined the summons of all defendants, granting 30 days each to file their defenses, to count from the day they receive the summon. Vale has already been served and its deadline to present its defense is March 3, 2017. (v) Other lawsuits In addition, Samarco and its shareholders were named as a defendant in several other lawsuits brought by individuals, corporations and governmental entities seeking personal and property damages.
45
These lawsuits and petitions are at early stages, so it is not possible to determine a range of outcomes or reliable estimates of the potential exposure at this time. No contingent liability has been quantified and no provision was recognized for lawsuits related to Samarco´s dam failure. Critical accounting estimates and judgments
The provision requires the use of assumptions that may be mainly affected by: (i) changes in scope of work required under the Framework Agreement as result of further technical analysis, (ii) resolution of uncertainty in respect of the resume the Samarco´s operation; (iii) updates in the discount rate; and (iv) resolution of existing and potential legal claims. As a result, future expenditures may differ from the amounts currently provided and changes to key assumptions could result in a material impact to the amount of the provision in future reporting periods.
22. Risk management Vale considers that an effective risk management is key to support the achievement of the company objectives and to ensure the financial strength and flexibility of the company and the business continuity. Therefore, Vale has developed its risk management strategy in order to provide an integrated approach of the risks the company is exposed to, considering not only the risks generated by variables traded in financial markets (market risk) and those arising from liquidity risk, but also the risk from counterparties obligations (credit risk) and those relating to inadequate or failed internal processes, people, systems or external events (operational risk), among others. a) Risk management policy The Board of Directors established a corporate risk management policy defining principles and guidelines applicable to this process in the company and the corresponding governance structure. This policy determines that corporate risks should be measured and monitored, regularly, in an integrated manner, in order to ensure that the company overall risk level remains aligned with its strategic guidelines. The Executive Risk Management Committee, created by the Board of Directors, is responsible for supporting the Executive Board in the risk management decisions, issuing opinions and recommendations. It is also responsible for the supervision and revision of the principles and instruments of corporate risk management. The Executive Board is responsible for the approval of the policy deployment into norms, rules and responsibilities and for reporting to the Board of Directors about such procedures. The risk management norms and instructions complement the corporate risk management policy and define practices, processes, controls, roles and responsibilities. The Company may, when necessary, allocate specific risk limits to management activities, including but not limited to, market risk limit, corporate and sovereign credit limit, in accordance with the acceptable corporate risk limit. b) Liquidity risk management The liquidity risk arises from the possibility that Vale might not perform its obligations on due dates, as well as face difficulties to meet its cash requirements due to market liquidity constraints. See note 20 "Loans, borrowing and cash and cash equivalents" for details on the Group's liquidity risk. c) Credit risk management Vale’s exposure to credit risk arises from trade receivables, derivative transactions, guarantees, down payment for suppliers and cash investments. Our credit risk management process provides a framework for assessing and managing counterparties’ credit risk and for maintaining our risk at an acceptable level. (i) Commercial credit risk management See note 10 "Accounts receivables" for details on commercial credit risk.
46
(ii) Treasury credit risk management To manage the credit exposure arising from cash investments and derivative instruments, credit limits are approved to each counterparty with whom we have credit exposure. Furthermore, we control the portfolio diversification and monitor different indicators of solvency and liquidity of the different counterparties that were approved for trading. d) Market risk management Vale is exposed to the behavior of several market risk factors that can impact its cash flow. The assessment of this potential impact arising from the volatility of risk factors and their correlations is performed periodically to support the decision making process regarding the risk management strategy, that may incorporate financial instruments, including derivatives. The portfolio of these financial instruments is monitored on a monthly basis, enabling financial results surveillance and its impact on cash flow. Considering the nature of Vale’s business and operations, the main market risk factors which the Company is exposed to are: • Foreign exchange and interest rates; • Product prices and input costs. e) Foreign exchange and interest rate risk The company’s cash flow is subjected to volatility of several currencies, as its product are predominantly priced in US dollar, while most of the costs, disbursements and investments are denominated in other currencies, mainly Brazilian real and Canadian dollar. In order to reduce the potential impact that arises from this currency mismatch, derivatives instruments may be used as a risk mitigation strategy. Vale implements hedge transactions to protect its cash flow against the market risks that arises from its debt obligations – mainly currency volatility. The hedges cover most of the debts in Brazilian reais and euros. We use swap and forward transactions to convert debt linked to Brazilian real and Euros into US dollar, with volumes, flows and settlement dates similar to those of the debt instruments - or sometimes lower, subject to market liquidity conditions. Hedging instruments with shorter settlement dates are renegotiated through time so that their final maturity matches - or becomes closer - to the debts` final maturity. At each settlement date, the results of the swap and forward transactions partially offset the impact of the foreign exchange rate in Vale’s obligations, contributing to stabilize the cash disbursements in US dollar. Vale has also exposure to interest rates risks over loans and financings. The US Dollar floating rate debt in the portfolio consists mainly of loans including export pre-payments, commercial banks and multilateral organizations loans. In general, such debt instruments are indexed to the LIBOR (London Interbank Offer Rate) in US dollar. We take advantage of the potential correlation between commodity prices and U.S. dollar floating interest rates as a partial natural hedge for our cash flow. f) Risk of product and input prices Vale is also exposed to market risks including commodities price and input price volatilities. In accordance with risk management policy, risk mitigation strategies involving commodities can be used to adjust the cash flow risk profile and reduce Vale’s cash flow volatility. For this kind of risk mitigation strategy, Vale uses predominantly forwards, futures or zero-cost collars. g) Operational risk management The operational risk management is the structured approach that Vale uses to manage uncertainty related to possible inadequate or failure in internal processes, people, systems and external events, in accordance with the principles and guidelines of ISO 31000. The main operational risks are periodically monitored, ensuring the effectiveness of preventive and mitigating key controls in place and the execution of the risk treatment strategy (implementation of new or improved controls, changes in the risk environment, risk sharing by contracting insurance, provisioning of resources, etc.). Therefore, the Company seeks to have a clear view of its major risks, the best cost-benefit mitigation plans and the effectiveness of the controls in place, monitoring the potential impact of operational risk and allocating capital efficiently.
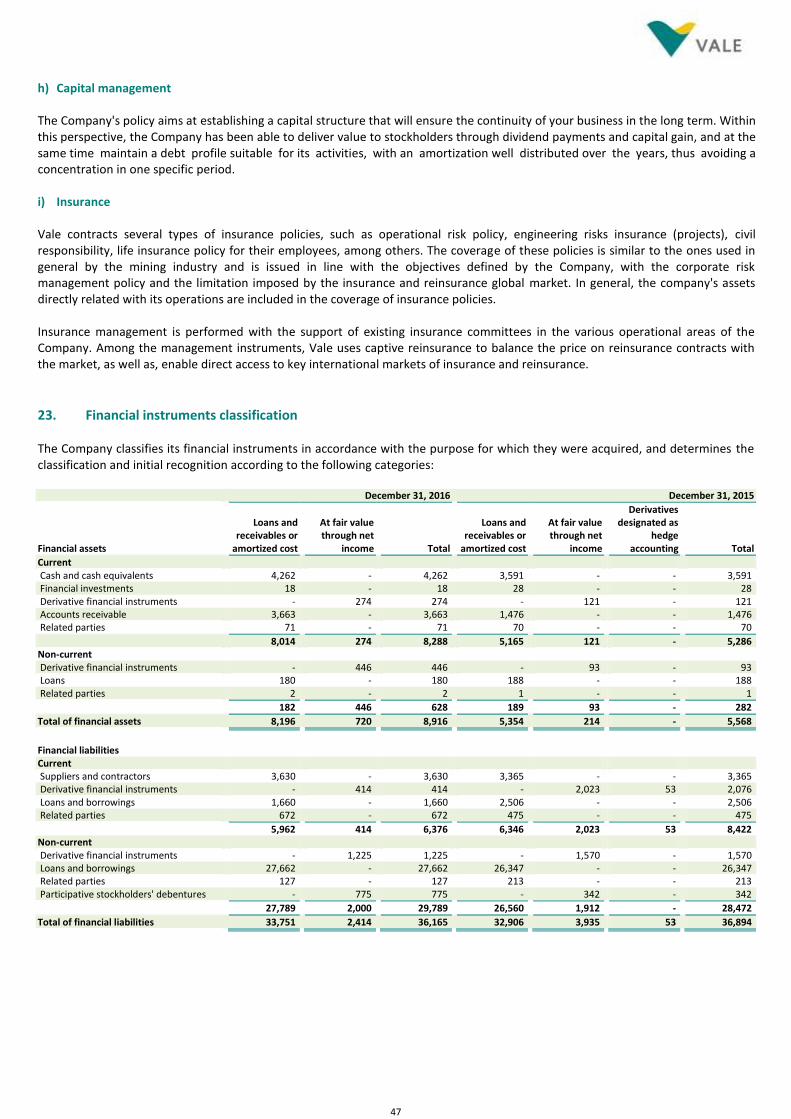
47
h) Capital management The Company's policy aims at establishing a capital structure that will ensure the continuity of your business in the long term. Within this perspective, the Company has been able to deliver value to stockholders through dividend payments and capital gain, and at the same time maintain a debt profile suitable for its activities, with an amortization well distributed over the years, thus avoiding a concentration in one specific period. i) Insurance Vale contracts several types of insurance policies, such as operational risk policy, engineering risks insurance (projects), civil responsibility, life insurance policy for their employees, among others. The coverage of these policies is similar to the ones used in general by the mining industry and is issued in line with the objectives defined by the Company, with the corporate risk management policy and the limitation imposed by the insurance and reinsurance global market. In general, the company's assets directly related with its operations are included in the coverage of insurance policies. Insurance management is performed with the support of existing insurance committees in the various operational areas of the Company. Among the management instruments, Vale uses captive reinsurance to balance the price on reinsurance contracts with the market, as well as, enable direct access to key international markets of insurance and reinsurance.
23. Financial instruments classification The Company classifies its financial instruments in accordance with the purpose for which they were acquired, and determines the classification and initial recognition according to the following categories: December 31, 2016 December 31, 2015
Financial assets
Loans and receivables or
amortized cost
At fair value through net
income Total
Loans and receivables or
amortized cost
At fair value through net
income
Derivatives designated as
hedge accounting Total
Current Cash and cash equivalents 4,262 - 4,262 3,591 - - 3,591 Financial investments 18 - 18 28 - - 28 Derivative financial instruments - 274 274 - 121 - 121 Accounts receivable 3,663 - 3,663 1,476 - - 1,476 Related parties 71 - 71 70 - - 70
8,014 274 8,288 5,165 121 - 5,286 Non-current Derivative financial instruments - 446 446 - 93 - 93 Loans 180 - 180 188 - - 188 Related parties 2 - 2 1 - - 1
182 446 628 189 93 - 282
Total of financial assets 8,196 720 8,916 5,354 214 - 5,568
Financial liabilities Current Suppliers and contractors 3,630 - 3,630 3,365 - - 3,365 Derivative financial instruments - 414 414 - 2,023 53 2,076 Loans and borrowings 1,660 - 1,660 2,506 - - 2,506 Related parties 672 - 672 475 - - 475
5,962 414 6,376 6,346 2,023 53 8,422 Non-current Derivative financial instruments - 1,225 1,225 - 1,570 - 1,570 Loans and borrowings 27,662 - 27,662 26,347 - - 26,347 Related parties 127 - 127 213 - - 213 Participative stockholders' debentures - 775 775 - 342 - 342
27,789 2,000 29,789 26,560 1,912 - 28,472
Total of financial liabilities 33,751 2,414 36,165 32,906 3,935 53 36,894
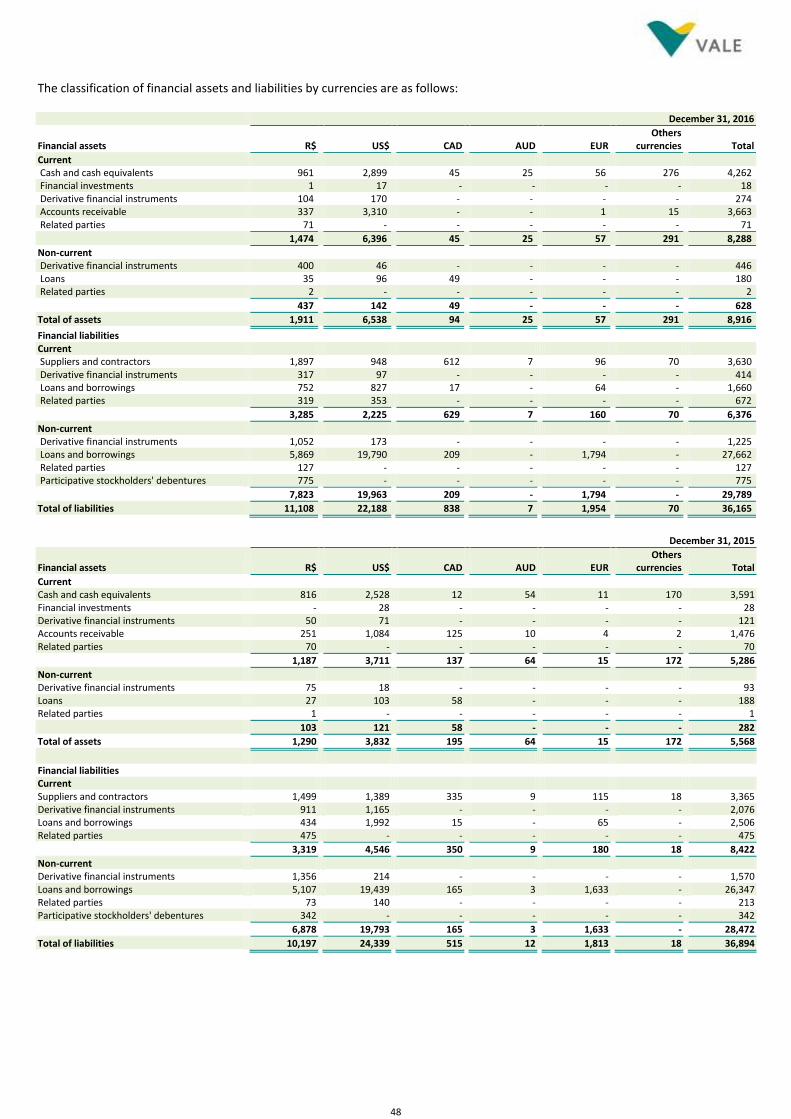
48
The classification of financial assets and liabilities by currencies are as follows: December 31, 2016
Financial assets R$ US$ CAD AUD EUR Others
currencies Total
Current Cash and cash equivalents 961 2,899 45 25 56 276 4,262 Financial investments 1 17 - - - - 18 Derivative financial instruments 104 170 - - - - 274 Accounts receivable 337 3,310 - - 1 15 3,663 Related parties 71 - - - - - 71
1,474 6,396 45 25 57 291 8,288
Non-current Derivative financial instruments 400 46 - - - - 446 Loans 35 96 49 - - - 180 Related parties 2 - - - - - 2
437 142 49 - - - 628
Total of assets 1,911 6,538 94 25 57 291 8,916
Financial liabilities Current Suppliers and contractors 1,897 948 612 7 96 70 3,630 Derivative financial instruments 317 97 - - - - 414 Loans and borrowings 752 827 17 - 64 - 1,660 Related parties 319 353 - - - - 672
3,285 2,225 629 7 160 70 6,376
Non-current Derivative financial instruments 1,052 173 - - - - 1,225 Loans and borrowings 5,869 19,790 209 - 1,794 - 27,662 Related parties 127 - - - - - 127 Participative stockholders' debentures 775 - - - - - 775
7,823 19,963 209 - 1,794 - 29,789
Total of liabilities 11,108 22,188 838 7 1,954 70 36,165
December 31, 2015
Financial assets R$ US$ CAD AUD EUR Others
currencies Total
Current Cash and cash equivalents 816 2,528 12 54 11 170 3,591 Financial investments - 28 - - - - 28 Derivative financial instruments 50 71 - - - - 121 Accounts receivable 251 1,084 125 10 4 2 1,476 Related parties 70 - - - - - 70
1,187 3,711 137 64 15 172 5,286
Non-current Derivative financial instruments 75 18 - - - - 93 Loans 27 103 58 - - - 188 Related parties 1 - - - - - 1
103 121 58 - - - 282
Total of assets 1,290 3,832 195 64 15 172 5,568
Financial liabilities Current Suppliers and contractors 1,499 1,389 335 9 115 18 3,365 Derivative financial instruments 911 1,165 - - - - 2,076 Loans and borrowings 434 1,992 15 - 65 - 2,506 Related parties 475 - - - - - 475
3,319 4,546 350 9 180 18 8,422
Non-current Derivative financial instruments 1,356 214 - - - - 1,570 Loans and borrowings 5,107 19,439 165 3 1,633 - 26,347 Related parties 73 140 - - - - 213 Participative stockholders' debentures 342 - - - - - 342
6,878 19,793 165 3 1,633 - 28,472
Total of liabilities 10,197 24,339 515 12 1,813 18 36,894
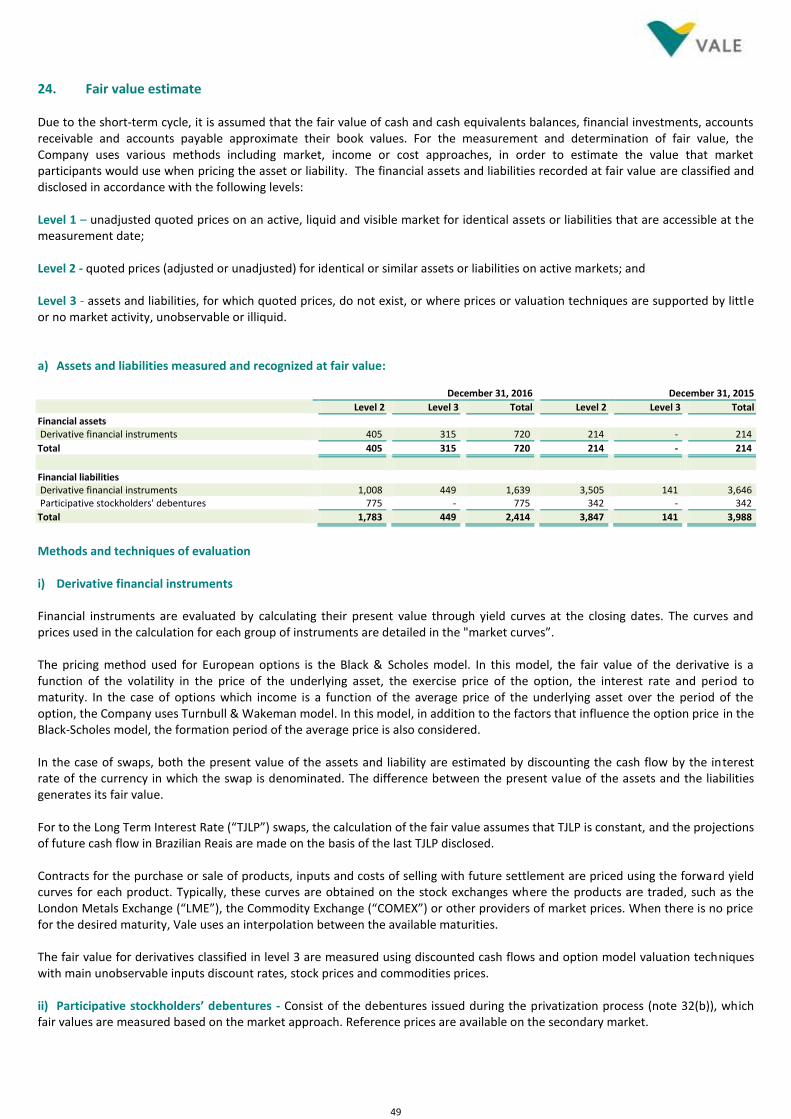
49
24. Fair value estimate Due to the short-term cycle, it is assumed that the fair value of cash and cash equivalents balances, financial investments, accounts receivable and accounts payable approximate their book values. For the measurement and determination of fair value, the Company uses various methods including market, income or cost approaches, in order to estimate the value that market participants would use when pricing the asset or liability. The financial assets and liabilities recorded at fair value are classified and disclosed in accordance with the following levels: Level 1 – unadjusted quoted prices on an active, liquid and visible market for identical assets or liabilities that are accessible at the measurement date; Level 2 - quoted prices (adjusted or unadjusted) for identical or similar assets or liabilities on active markets; and Level 3 - assets and liabilities, for which quoted prices, do not exist, or where prices or valuation techniques are supported by little or no market activity, unobservable or illiquid. a) Assets and liabilities measured and recognized at fair value: December 31, 2016 December 31, 2015
Level 2 Level 3 Total Level 2 Level 3 Total
Financial assets Derivative financial instruments 405 315 720 214 - 214
Total 405 315 720 214 - 214
Financial liabilities Derivative financial instruments 1,008 449 1,639 3,505 141 3,646 Participative stockholders' debentures 775 - 775 342 - 342
Total 1,783 449 2,414 3,847 141 3,988
Methods and techniques of evaluation i) Derivative financial instruments Financial instruments are evaluated by calculating their present value through yield curves at the closing dates. The curves and prices used in the calculation for each group of instruments are detailed in the "market curves”. The pricing method used for European options is the Black & Scholes model. In this model, the fair value of the derivative is a function of the volatility in the price of the underlying asset, the exercise price of the option, the interest rate and period to maturity. In the case of options which income is a function of the average price of the underlying asset over the period of the option, the Company uses Turnbull & Wakeman model. In this model, in addition to the factors that influence the option price in the Black-Scholes model, the formation period of the average price is also considered. In the case of swaps, both the present value of the assets and liability are estimated by discounting the cash flow by the interest rate of the currency in which the swap is denominated. The difference between the present value of the assets and the liabilities generates its fair value. For to the Long Term Interest Rate (“TJLP”) swaps, the calculation of the fair value assumes that TJLP is constant, and the projections of future cash flow in Brazilian Reais are made on the basis of the last TJLP disclosed. Contracts for the purchase or sale of products, inputs and costs of selling with future settlement are priced using the forward yield curves for each product. Typically, these curves are obtained on the stock exchanges where the products are traded, such as the London Metals Exchange (“LME”), the Commodity Exchange (“COMEX”) or other providers of market prices. When there is no price for the desired maturity, Vale uses an interpolation between the available maturities. The fair value for derivatives classified in level 3 are measured using discounted cash flows and option model valuation techniques with main unobservable inputs discount rates, stock prices and commodities prices. ii) Participative stockholders’ debentures - Consist of the debentures issued during the privatization process (note 32(b)), which fair values are measured based on the market approach. Reference prices are available on the secondary market.
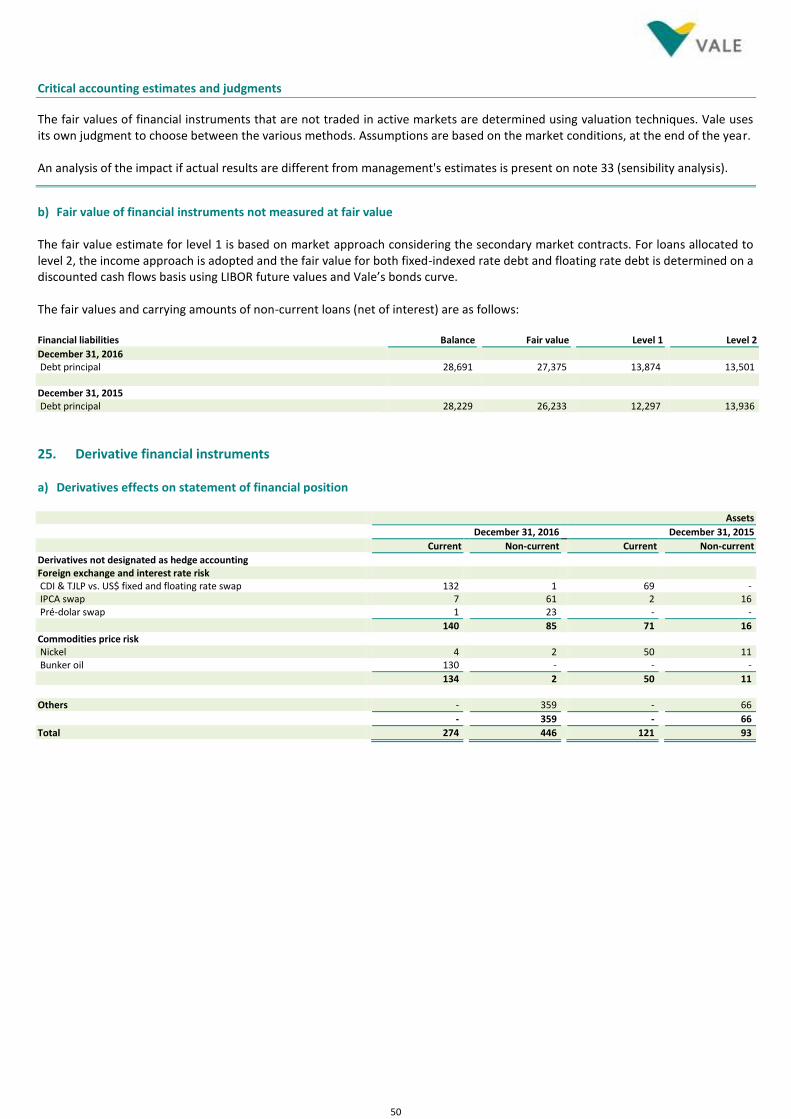
50
Critical accounting estimates and judgments
The fair values of financial instruments that are not traded in active markets are determined using valuation techniques. Vale uses its own judgment to choose between the various methods. Assumptions are based on the market conditions, at the end of the year. An analysis of the impact if actual results are different from management's estimates is present on note 33 (sensibility analysis).
b) Fair value of financial instruments not measured at fair value The fair value estimate for level 1 is based on market approach considering the secondary market contracts. For loans allocated to level 2, the income approach is adopted and the fair value for both fixed-indexed rate debt and floating rate debt is determined on a discounted cash flows basis using LIBOR future values and Vale’s bonds curve. The fair values and carrying amounts of non-current loans (net of interest) are as follows: Financial liabilities Balance Fair value Level 1 Level 2
December 31, 2016 Debt principal 28,691 27,375 13,874 13,501 December 31, 2015 Debt principal 28,229 26,233 12,297 13,936
25. Derivative financial instruments a) Derivatives effects on statement of financial position Assets
December 31, 2016 December 31, 2015
Current Non-current Current Non-current
Derivatives not designated as hedge accounting Foreign exchange and interest rate risk CDI & TJLP vs. US$ fixed and floating rate swap 132 1 69 - IPCA swap 7 61 2 16 Pré-dolar swap 1 23 - -
140 85 71 16 Commodities price risk Nickel 4 2 50 11 Bunker oil 130 - - -
134 2 50 11 Others - 359 - 66
- 359 - 66
Total 274 446 121 93
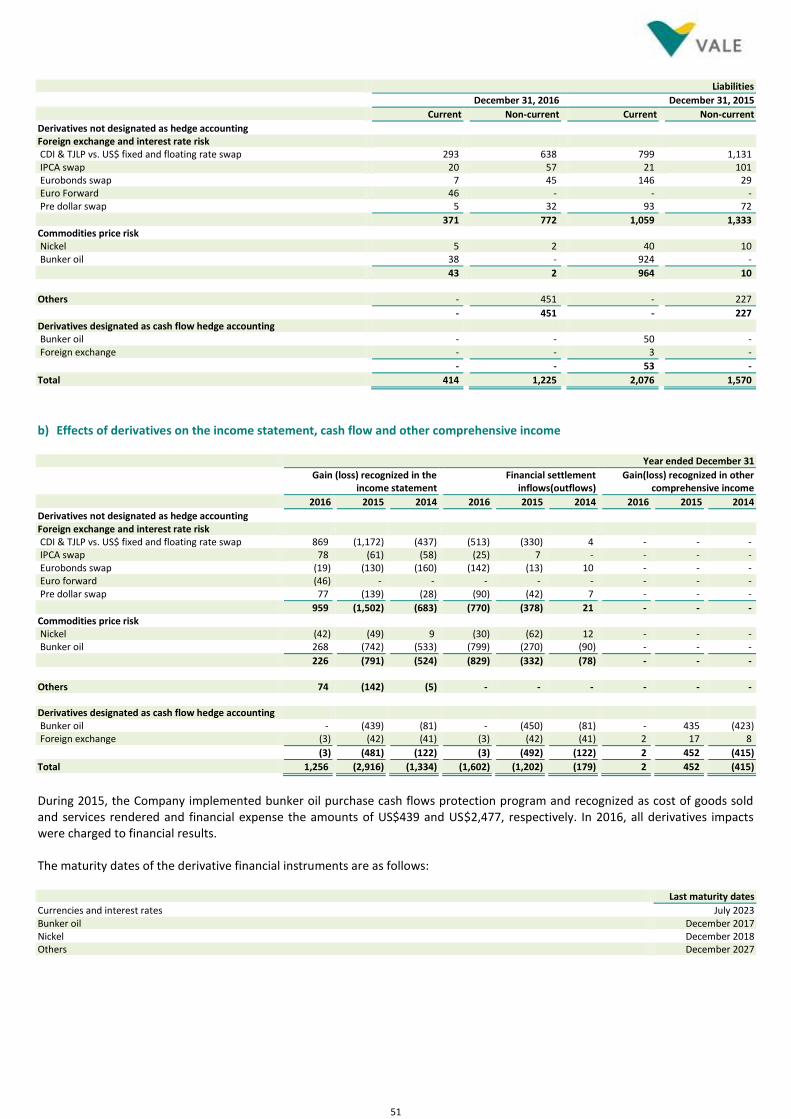
51
Liabilities
December 31, 2016 December 31, 2015
Current Non-current Current Non-current
Derivatives not designated as hedge accounting Foreign exchange and interest rate risk CDI & TJLP vs. US$ fixed and floating rate swap 293 638 799 1,131 IPCA swap 20 57 21 101 Eurobonds swap 7 45 146 29 Euro Forward 46 - - - Pre dollar swap 5 32 93 72
371 772 1,059 1,333 Commodities price risk Nickel 5 2 40 10 Bunker oil 38 - 924 -
43 2 964 10 Others - 451 - 227
- 451 - 227 Derivatives designated as cash flow hedge accounting Bunker oil - - 50 - Foreign exchange - - 3 -
- - 53 -
Total 414 1,225 2,076 1,570
b) Effects of derivatives on the income statement, cash flow and other comprehensive income Year ended December 31
Gain (loss) recognized in the
income statement
Financial settlement inflows(outflows)
Gain(loss) recognized in other
comprehensive income
2016 2015 2014 2016 2015 2014 2016 2015 2014
Derivatives not designated as hedge accounting Foreign exchange and interest rate risk CDI & TJLP vs. US$ fixed and floating rate swap 869 (1,172) (437) (513) (330) 4 - - - IPCA swap 78 (61) (58) (25) 7 - - - - Eurobonds swap (19) (130) (160) (142) (13) 10 - - - Euro forward (46) - - - - - - - - Pre dollar swap 77 (139) (28) (90) (42) 7 - - -
959 (1,502) (683) (770) (378) 21 - - - Commodities price risk Nickel (42) (49) 9 (30) (62) 12 - - - Bunker oil 268 (742) (533) (799) (270) (90) - - -
226 (791) (524) (829) (332) (78) - - - Others 74 (142) (5) - - - - - - Derivatives designated as cash flow hedge accounting Bunker oil - (439) (81) - (450) (81) - 435 (423) Foreign exchange (3) (42) (41) (3) (42) (41) 2 17 8
(3) (481) (122) (3) (492) (122) 2 452 (415)
Total 1,256 (2,916) (1,334) (1,602) (1,202) (179) 2 452 (415)
During 2015, the Company implemented bunker oil purchase cash flows protection program and recognized as cost of goods sold and services rendered and financial expense the amounts of US$439 and US$2,477, respectively. In 2016, all derivatives impacts were charged to financial results. The maturity dates of the derivative financial instruments are as follows: Last maturity dates
Currencies and interest rates July 2023 Bunker oil December 2017 Nickel December 2018 Others December 2027
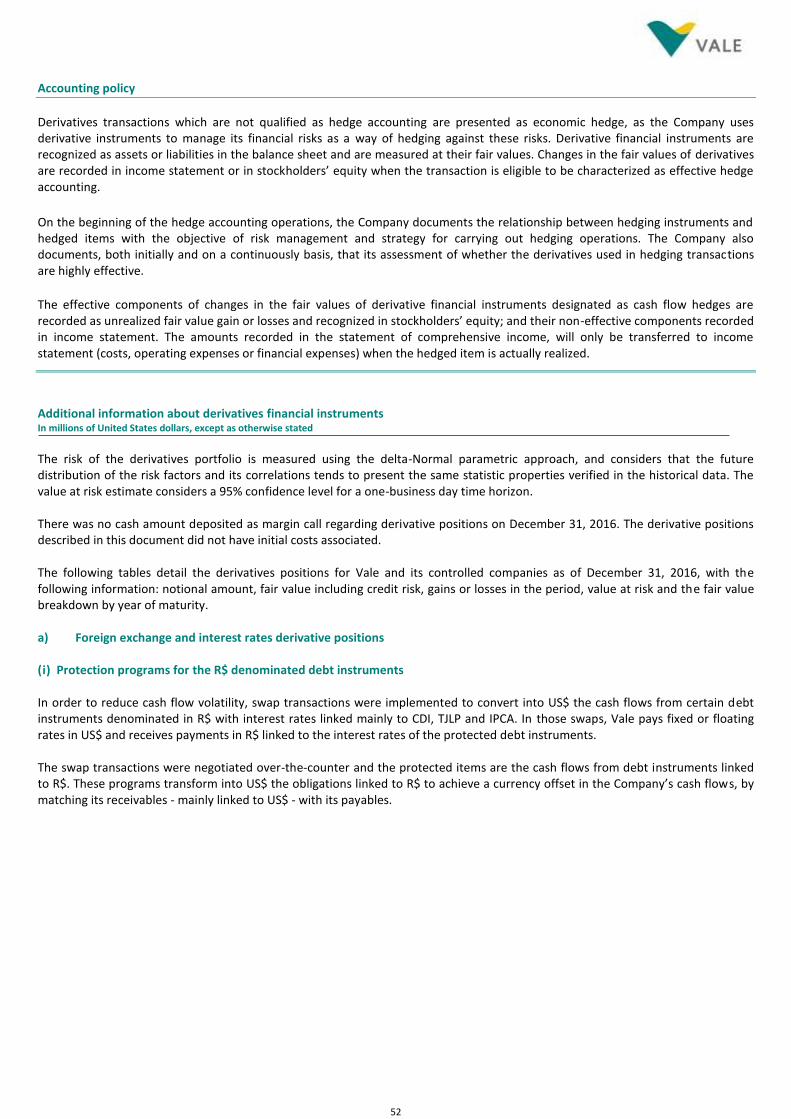
52
Accounting policy
Derivatives transactions which are not qualified as hedge accounting are presented as economic hedge, as the Company uses derivative instruments to manage its financial risks as a way of hedging against these risks. Derivative financial instruments are recognized as assets or liabilities in the balance sheet and are measured at their fair values. Changes in the fair values of derivatives are recorded in income statement or in stockholders’ equity when the transaction is eligible to be characterized as effective hedge accounting.
On the beginning of the hedge accounting operations, the Company documents the relationship between hedging instruments and hedged items with the objective of risk management and strategy for carrying out hedging operations. The Company also documents, both initially and on a continuously basis, that its assessment of whether the derivatives used in hedging transactions are highly effective.
The effective components of changes in the fair values of derivative financial instruments designated as cash flow hedges are recorded as unrealized fair value gain or losses and recognized in stockholders’ equity; and their non-effective components recorded in income statement. The amounts recorded in the statement of comprehensive income, will only be transferred to income statement (costs, operating expenses or financial expenses) when the hedged item is actually realized.
Additional information about derivatives financial instruments In millions of United States dollars, except as otherwise stated
The risk of the derivatives portfolio is measured using the delta-Normal parametric approach, and considers that the future distribution of the risk factors and its correlations tends to present the same statistic properties verified in the historical data. The value at risk estimate considers a 95% confidence level for a one-business day time horizon. There was no cash amount deposited as margin call regarding derivative positions on December 31, 2016. The derivative positions described in this document did not have initial costs associated. The following tables detail the derivatives positions for Vale and its controlled companies as of December 31, 2016, with the following information: notional amount, fair value including credit risk, gains or losses in the period, value at risk and the fair value breakdown by year of maturity. a) Foreign exchange and interest rates derivative positions (i) Protection programs for the R$ denominated debt instruments In order to reduce cash flow volatility, swap transactions were implemented to convert into US$ the cash flows from certain debt instruments denominated in R$ with interest rates linked mainly to CDI, TJLP and IPCA. In those swaps, Vale pays fixed or floating rates in US$ and receives payments in R$ linked to the interest rates of the protected debt instruments. The swap transactions were negotiated over-the-counter and the protected items are the cash flows from debt instruments linked to R$. These programs transform into US$ the obligations linked to R$ to achieve a currency offset in the Company’s cash flows, by matching its receivables - mainly linked to US$ - with its payables.
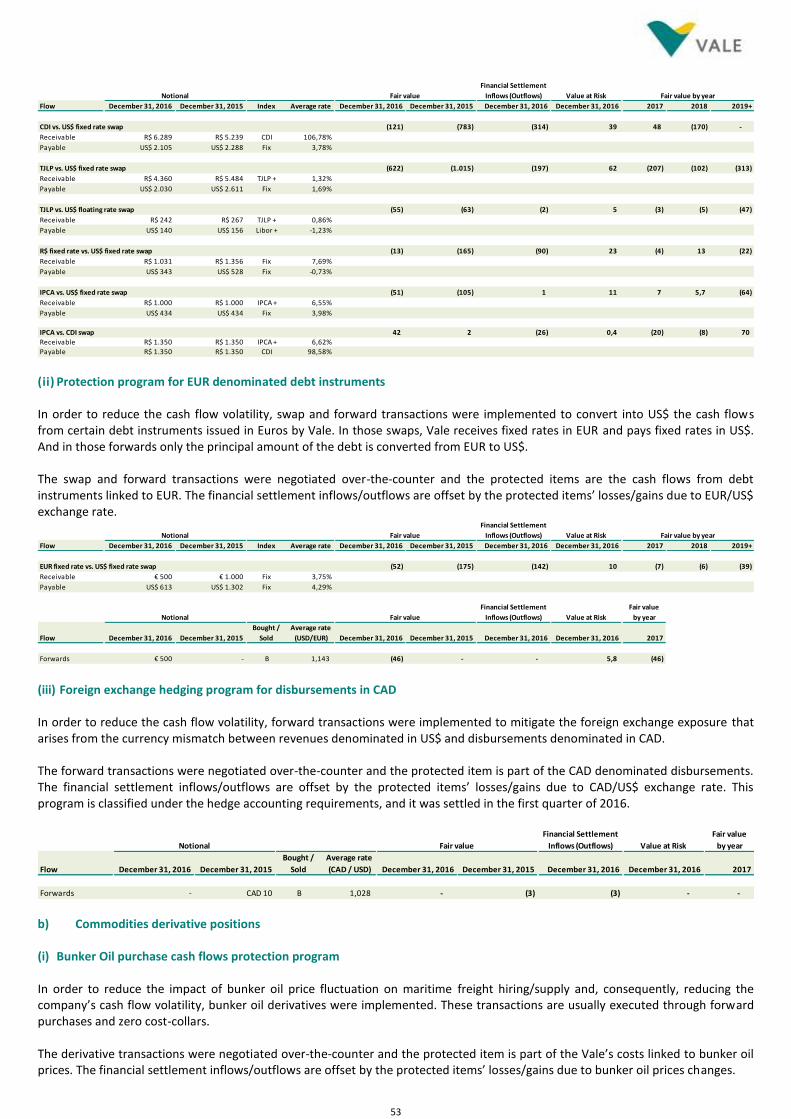
53
(ii) Protection program for EUR denominated debt instruments In order to reduce the cash flow volatility, swap and forward transactions were implemented to convert into US$ the cash flows from certain debt instruments issued in Euros by Vale. In those swaps, Vale receives fixed rates in EUR and pays fixed rates in US$. And in those forwards only the principal amount of the debt is converted from EUR to US$. The swap and forward transactions were negotiated over-the-counter and the protected items are the cash flows from debt instruments linked to EUR. The financial settlement inflows/outflows are offset by the protected items’ losses/gains due to EUR/US$ exchange rate.
(iii) Foreign exchange hedging program for disbursements in CAD In order to reduce the cash flow volatility, forward transactions were implemented to mitigate the foreign exchange exposure that arises from the currency mismatch between revenues denominated in US$ and disbursements denominated in CAD. The forward transactions were negotiated over-the-counter and the protected item is part of the CAD denominated disbursements. The financial settlement inflows/outflows are offset by the protected items’ losses/gains due to CAD/US$ exchange rate. This program is classified under the hedge accounting requirements, and it was settled in the first quarter of 2016.
b) Commodities derivative positions (i) Bunker Oil purchase cash flows protection program In order to reduce the impact of bunker oil price fluctuation on maritime freight hiring/supply and, consequently, reducing the company’s cash flow volatility, bunker oil derivatives were implemented. These transactions are usually executed through forward purchases and zero cost-collars. The derivative transactions were negotiated over-the-counter and the protected item is part of the Vale’s costs linked to bunker oil prices. The financial settlement inflows/outflows are offset by the protected items’ losses/gains due to bunker oil prices changes.
Financial Settlement
Inflows (Outflows) Value at Risk
Flow December 31, 2016 December 31, 2015 Index Average rate December 31, 2016 December 31, 2015 December 31, 2016 December 31, 2016 2017 2018 2019+
CDI vs. US$ fixed rate swap (121) (783) (314) 39 48 (170) -
Receivable R$ 6.289 R$ 5.239 CDI 106,78%
Payable US$ 2.105 US$ 2.288 Fix 3,78%
TJLP vs. US$ fixed rate swap (622) (1.015) (197) 62 (207) (102) (313)
Receivable R$ 4.360 R$ 5.484 TJLP + 1,32%
Payable US$ 2.030 US$ 2.611 Fix 1,69%
TJLP vs. US$ floating rate swap (55) (63) (2) 5 (3) (5) (47)
Receivable R$ 242 R$ 267 TJLP + 0,86%
Payable US$ 140 US$ 156 Libor + -1,23%
R$ fixed rate vs. US$ fixed rate swap (13) (165) (90) 23 (4) 13 (22)
Receivable R$ 1.031 R$ 1.356 Fix 7,69%
Payable US$ 343 US$ 528 Fix -0,73%
IPCA vs. US$ fixed rate swap (51) (105) 1 11 7 5,7 (64)
Receivable R$ 1.000 R$ 1.000 IPCA + 6,55%
Payable US$ 434 US$ 434 Fix 3,98%
IPCA vs. CDI swap 42 2 (26) 0,4 (20) (8) 70
Receivable R$ 1.350 R$ 1.350 IPCA + 6,62%
Payable R$ 1.350 R$ 1.350 CDI 98,58%
Notional Fair value Fair value by year
Financial Settlement
Inflows (Outflows) Value at Risk
Flow December 31, 2016 December 31, 2015 Index Average rate December 31, 2016 December 31, 2015 December 31, 2016 December 31, 2016 2017 2018 2019+
EUR fixed rate vs. US$ fixed rate swap (52) (175) (142) 10 (7) (6) (39)
Receivable € 500 € 1.000 Fix 3,75%
Payable US$ 613 US$ 1.302 Fix 4,29%
Financial Settlement
Inflows (Outflows) Value at Risk
Flow December 31, 2016 December 31, 2015
Bought /
Sold
Average rate
(USD/EUR) December 31, 2016 December 31, 2015 December 31, 2016 December 31, 2016 2017
Forwards € 500 - B 1,143 (46) - - 5,8 (46)
Fair value
by yearNotional Fair value
Fair value by yearNotional Fair value
Financial Settlement
Inflows (Outflows) Value at Risk
Flow December 31, 2016 December 31, 2015
Bought /
Sold
Average rate
(CAD / USD) December 31, 2016 December 31, 2015 December 31, 2016 December 31, 2016 2017
Forwards - CAD 10 B 1,028 - (3) (3) - -
Fair value
by yearFair valueNotional
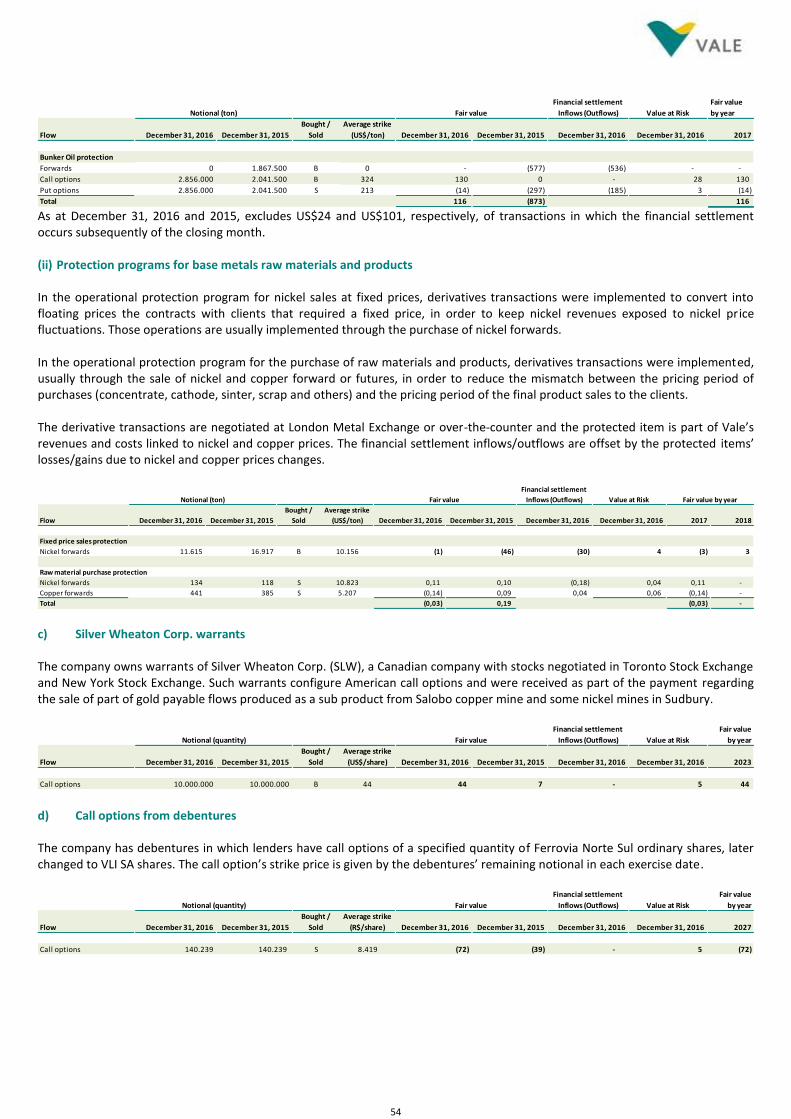
54
As at December 31, 2016 and 2015, excludes US$24 and US$101, respectively, of transactions in which the financial settlement occurs subsequently of the closing month. (ii) Protection programs for base metals raw materials and products
In the operational protection program for nickel sales at fixed prices, derivatives transactions were implemented to convert into floating prices the contracts with clients that required a fixed price, in order to keep nickel revenues exposed to nickel price fluctuations. Those operations are usually implemented through the purchase of nickel forwards. In the operational protection program for the purchase of raw materials and products, derivatives transactions were implemented, usually through the sale of nickel and copper forward or futures, in order to reduce the mismatch between the pricing period of purchases (concentrate, cathode, sinter, scrap and others) and the pricing period of the final product sales to the clients. The derivative transactions are negotiated at London Metal Exchange or over-the-counter and the protected item is part of Vale’s revenues and costs linked to nickel and copper prices. The financial settlement inflows/outflows are offset by the protected items’ losses/gains due to nickel and copper prices changes.
c) Silver Wheaton Corp. warrants The company owns warrants of Silver Wheaton Corp. (SLW), a Canadian company with stocks negotiated in Toronto Stock Exchange and New York Stock Exchange. Such warrants configure American call options and were received as part of the payment regarding the sale of part of gold payable flows produced as a sub product from Salobo copper mine and some nickel mines in Sudbury.
d) Call options from debentures The company has debentures in which lenders have call options of a specified quantity of Ferrovia Norte Sul ordinary shares, later changed to VLI SA shares. The call option’s strike price is given by the debentures’ remaining notional in each exercise date.
Financial settlement
Inflows (Outflows) Value at Risk
Fair value
by year
Flow December 31, 2016 December 31, 2015
Bought /
Sold
Average strike
(US$/ton) December 31, 2016 December 31, 2015 December 31, 2016 December 31, 2016 2017
Bunker Oil protection
Forwards 0 1.867.500 B 0 - (577) (536) - -
Call options 2.856.000 2.041.500 B 324 130 0 - 28 130
Put options 2.856.000 2.041.500 S 213 (14) (297) (185) 3 (14)
Total 116 (873) 116
Notional (ton) Fair value
Financial settlement
Inflows (Outflows) Value at Risk
Flow December 31, 2016 December 31, 2015
Bought /
Sold
Average strike
(US$/ton) December 31, 2016 December 31, 2015 December 31, 2016 December 31, 2016 2017 2018
Fixed price sales protection
Nickel forwards 11.615 16.917 B 10.156 (1) (46) (30) 4 (3) 3
Raw material purchase protection
Nickel forwards 134 118 S 10.823 0,11 0,10 (0,18) 0,04 0,11 -
Copper forwards 441 385 S 5.207 (0,14) 0,09 0,04 0,06 (0,14) -
Total (0,03) 0,19 (0,03) -
Fair value by yearNotional (ton) Fair value
Financial settlement
Inflows (Outflows) Value at Risk
Fair value
by year
Flow December 31, 2016 December 31, 2015
Bought /
Sold
Average strike
(US$/share) December 31, 2016 December 31, 2015 December 31, 2016 December 31, 2016 2023
Call options 10.000.000 10.000.000 B 44 44 7 - 5 44
Notional (quantity) Fair value
Financial settlement
Inflows (Outflows) Value at Risk
Fair value
by year
Flow December 31, 2016 December 31, 2015
Bought /
Sold
Average strike
(R$/share) December 31, 2016 December 31, 2015 December 31, 2016 December 31, 2016 2027
Call options 140.239 140.239 S 8.419 (72) (39) - 5 (72)
Notional (quantity) Fair value
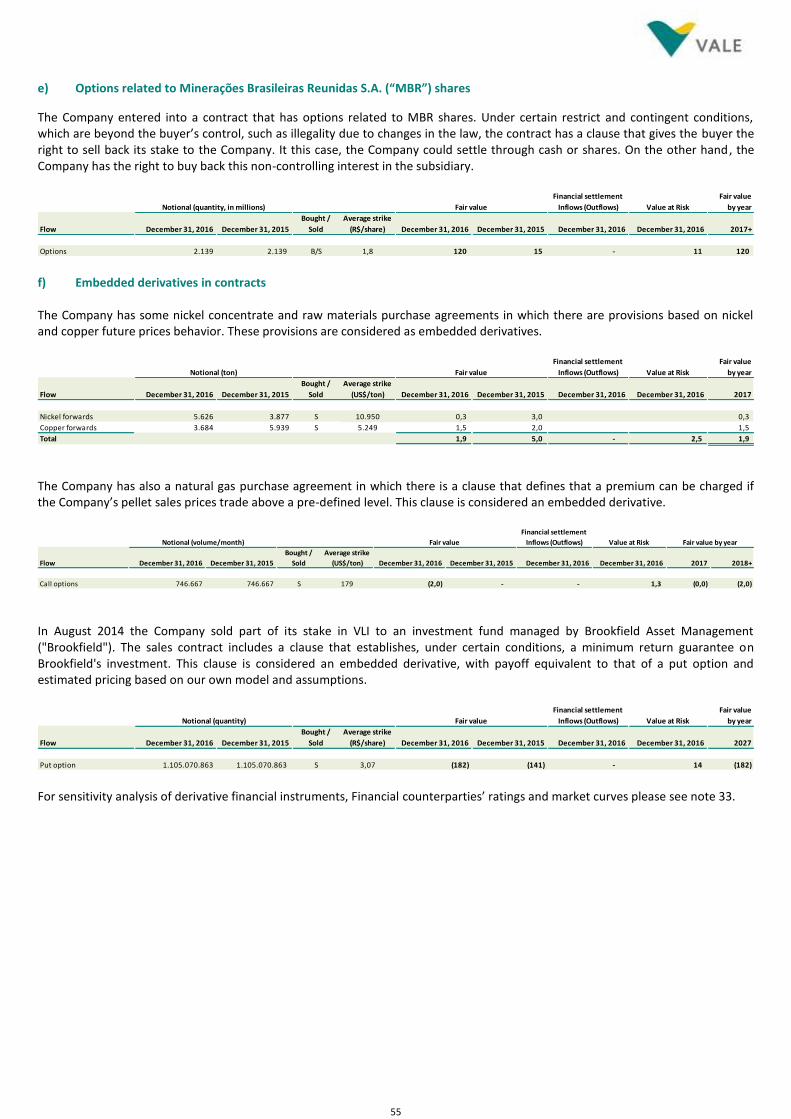
55
e) Options related to Minerações Brasileiras Reunidas S.A. (“MBR”) shares
The Company entered into a contract that has options related to MBR shares. Under certain restrict and contingent conditions, which are beyond the buyer’s control, such as illegality due to changes in the law, the contract has a clause that gives the buyer the right to sell back its stake to the Company. It this case, the Company could settle through cash or shares. On the other hand, the Company has the right to buy back this non-controlling interest in the subsidiary.
f) Embedded derivatives in contracts The Company has some nickel concentrate and raw materials purchase agreements in which there are provisions based on nickel and copper future prices behavior. These provisions are considered as embedded derivatives.
The Company has also a natural gas purchase agreement in which there is a clause that defines that a premium can be charged if the Company’s pellet sales prices trade above a pre-defined level. This clause is considered an embedded derivative.
In August 2014 the Company sold part of its stake in VLI to an investment fund managed by Brookfield Asset Management ("Brookfield"). The sales contract includes a clause that establishes, under certain conditions, a minimum return guarantee on Brookfield's investment. This clause is considered an embedded derivative, with payoff equivalent to that of a put option and estimated pricing based on our own model and assumptions.
For sensitivity analysis of derivative financial instruments, Financial counterparties’ ratings and market curves please see note 33.
Financial settlement
Inflows (Outflows) Value at Risk
Fair value
by year
Flow December 31, 2016 December 31, 2015
Bought /
Sold
Average strike
(R$/share) December 31, 2016 December 31, 2015 December 31, 2016 December 31, 2016 2017+
Options 2.139 2.139 B/S 1,8 120 15 - 11 120
Notional (quantity, in millions) Fair value
Financial settlement
Inflows (Outflows) Value at Risk
Fair value
by year
Flow December 31, 2016 December 31, 2015
Bought /
Sold
Average strike
(US$/ton) December 31, 2016 December 31, 2015 December 31, 2016 December 31, 2016 2017
Nickel forwards 5.626 3.877 S 10.950 0,3 3,0 0,3
Copper forwards 3.684 5.939 S 5.249 1,5 2,0 1,5
Total 1,9 5,0 - 2,5 1,9
Notional (ton) Fair value
Financial settlement
Inflows (Outflows) Value at Risk
Flow December 31, 2016 December 31, 2015
Bought /
Sold
Average strike
(US$/ton) December 31, 2016 December 31, 2015 December 31, 2016 December 31, 2016 2017 2018+
Call options 746.667 746.667 S 179 (2,0) - - 1,3 (0,0) (2,0)
Fair value by yearNotional (volume/month) Fair value
Financial settlement
Inflows (Outflows) Value at Risk
Fair value
by year
Flow December 31, 2016 December 31, 2015
Bought /
Sold
Average strike
(R$/share) December 31, 2016 December 31, 2015 December 31, 2016 December 31, 2016 2027
Put option 1.105.070.863 1.105.070.863 S 3,07 (182) (141) - 14 (182)
Notional (quantity) Fair value
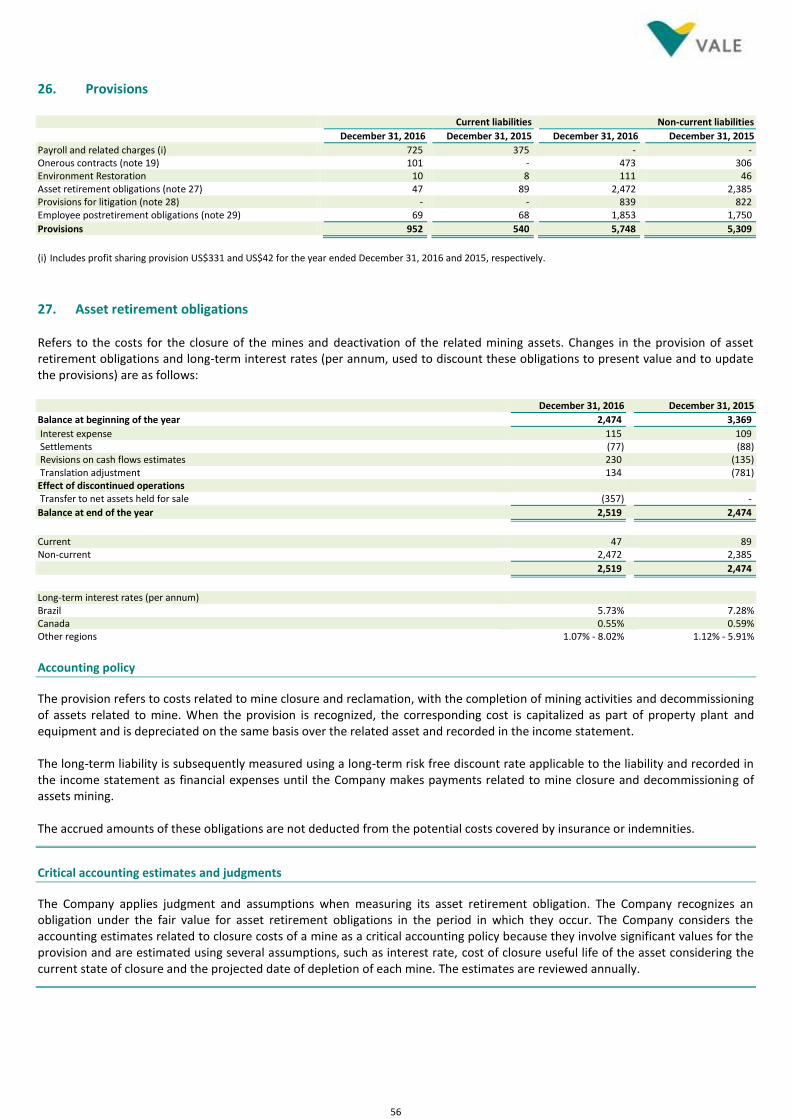
56
26. Provisions Current liabilities Non-current liabilities
December 31, 2016 December 31, 2015 December 31, 2016 December 31, 2015
Payroll and related charges (i) 725 375 - - Onerous contracts (note 19) 101 - 473 306 Environment Restoration 10 8 111 46 Asset retirement obligations (note 27) 47 89 2,472 2,385 Provisions for litigation (note 28) - - 839 822 Employee postretirement obligations (note 29) 69 68 1,853 1,750
Provisions 952 540 5,748 5,309
(i) Includes profit sharing provision US$331 and US$42 for the year ended December 31, 2016 and 2015, respectively.
27. Asset retirement obligations Refers to the costs for the closure of the mines and deactivation of the related mining assets. Changes in the provision of asset retirement obligations and long-term interest rates (per annum, used to discount these obligations to present value and to update the provisions) are as follows: December 31, 2016 December 31, 2015
Balance at beginning of the year 2,474 3,369
Interest expense 115 109 Settlements (77) (88) Revisions on cash flows estimates 230 (135) Translation adjustment 134 (781) Effect of discontinued operations Transfer to net assets held for sale (357) -
Balance at end of the year 2,519 2,474
Current 47 89 Non-current 2,472 2,385
2,519 2,474
Long-term interest rates (per annum) Brazil 5.73% 7.28% Canada 0.55% 0.59% Other regions 1.07% - 8.02% 1.12% - 5.91%
Accounting policy
The provision refers to costs related to mine closure and reclamation, with the completion of mining activities and decommissioning of assets related to mine. When the provision is recognized, the corresponding cost is capitalized as part of property plant and equipment and is depreciated on the same basis over the related asset and recorded in the income statement. The long-term liability is subsequently measured using a long-term risk free discount rate applicable to the liability and recorded in the income statement as financial expenses until the Company makes payments related to mine closure and decommissioning of assets mining. The accrued amounts of these obligations are not deducted from the potential costs covered by insurance or indemnities.
Critical accounting estimates and judgments
The Company applies judgment and assumptions when measuring its asset retirement obligation. The Company recognizes an obligation under the fair value for asset retirement obligations in the period in which they occur. The Company considers the accounting estimates related to closure costs of a mine as a critical accounting policy because they involve significant values for the provision and are estimated using several assumptions, such as interest rate, cost of closure useful life of the asset considering the current state of closure and the projected date of depletion of each mine. The estimates are reviewed annually.
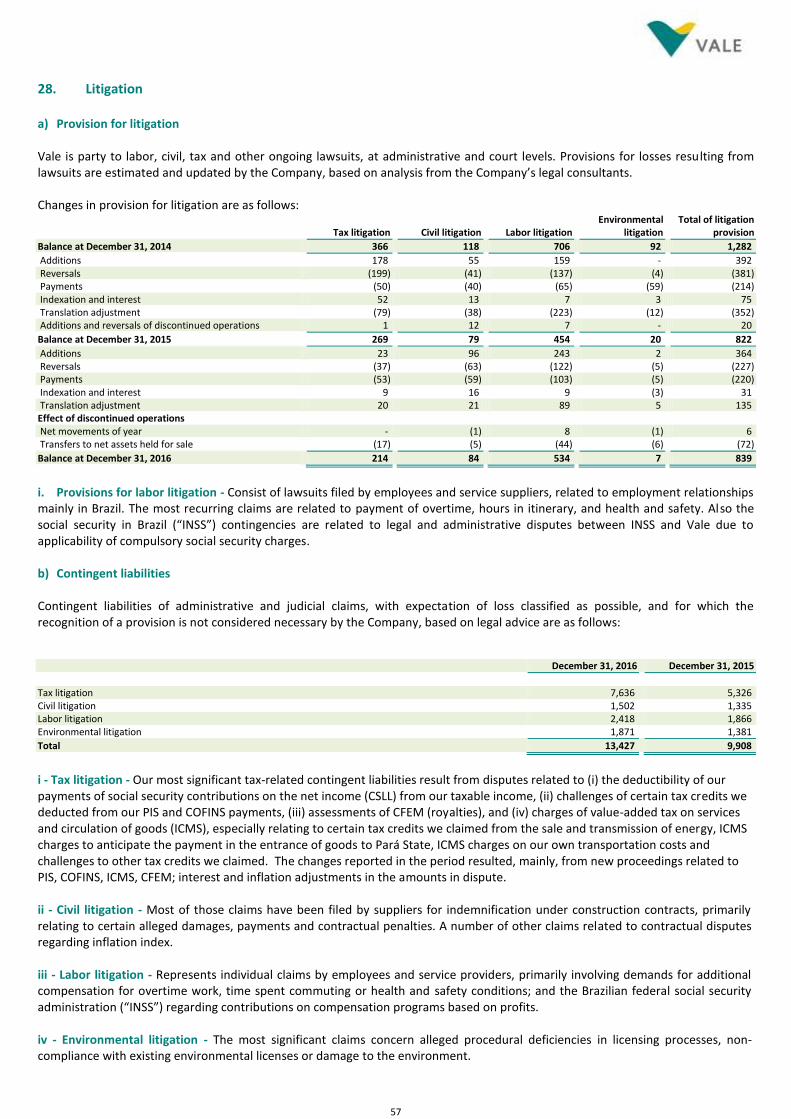
57
28. Litigation a) Provision for litigation Vale is party to labor, civil, tax and other ongoing lawsuits, at administrative and court levels. Provisions for losses resulting from lawsuits are estimated and updated by the Company, based on analysis from the Company’s legal consultants. Changes in provision for litigation are as follows:
Tax litigation Civil litigation Labor litigation
Environmental litigation
Total of litigation provision
Balance at December 31, 2014 366 118 706 92 1,282
Additions 178 55 159 - 392 Reversals (199) (41) (137) (4) (381) Payments (50) (40) (65) (59) (214) Indexation and interest 52 13 7 3 75 Translation adjustment (79) (38) (223) (12) (352) Additions and reversals of discontinued operations 1 12 7 - 20
Balance at December 31, 2015 269 79 454 20 822
Additions 23 96 243 2 364 Reversals (37) (63) (122) (5) (227) Payments (53) (59) (103) (5) (220) Indexation and interest 9 16 9 (3) 31 Translation adjustment 20 21 89 5 135 Effect of discontinued operations Net movements of year - (1) 8 (1) 6 Transfers to net assets held for sale (17) (5) (44) (6) (72)
Balance at December 31, 2016 214 84 534 7 839
i. Provisions for labor litigation - Consist of lawsuits filed by employees and service suppliers, related to employment relationships mainly in Brazil. The most recurring claims are related to payment of overtime, hours in itinerary, and health and safety. Also the social security in Brazil (“INSS”) contingencies are related to legal and administrative disputes between INSS and Vale due to applicability of compulsory social security charges. b) Contingent liabilities Contingent liabilities of administrative and judicial claims, with expectation of loss classified as possible, and for which the recognition of a provision is not considered necessary by the Company, based on legal advice are as follows: December 31, 2016 December 31, 2015
Tax litigation 7,636 5,326 Civil litigation 1,502 1,335 Labor litigation 2,418 1,866 Environmental litigation 1,871 1,381
Total 13,427 9,908
i - Tax litigation - Our most significant tax-related contingent liabilities result from disputes related to (i) the deductibility of our payments of social security contributions on the net income (CSLL) from our taxable income, (ii) challenges of certain tax credits we deducted from our PIS and COFINS payments, (iii) assessments of CFEM (royalties), and (iv) charges of value-added tax on services and circulation of goods (ICMS), especially relating to certain tax credits we claimed from the sale and transmission of energy, ICMS charges to anticipate the payment in the entrance of goods to Pará State, ICMS charges on our own transportation costs and challenges to other tax credits we claimed. The changes reported in the period resulted, mainly, from new proceedings related to PIS, COFINS, ICMS, CFEM; interest and inflation adjustments in the amounts in dispute. ii - Civil litigation - Most of those claims have been filed by suppliers for indemnification under construction contracts, primarily relating to certain alleged damages, payments and contractual penalties. A number of other claims related to contractual disputes regarding inflation index. iii - Labor litigation - Represents individual claims by employees and service providers, primarily involving demands for additional compensation for overtime work, time spent commuting or health and safety conditions; and the Brazilian federal social security administration (“INSS”) regarding contributions on compensation programs based on profits. iv - Environmental litigation - The most significant claims concern alleged procedural deficiencies in licensing processes, non-compliance with existing environmental licenses or damage to the environment.
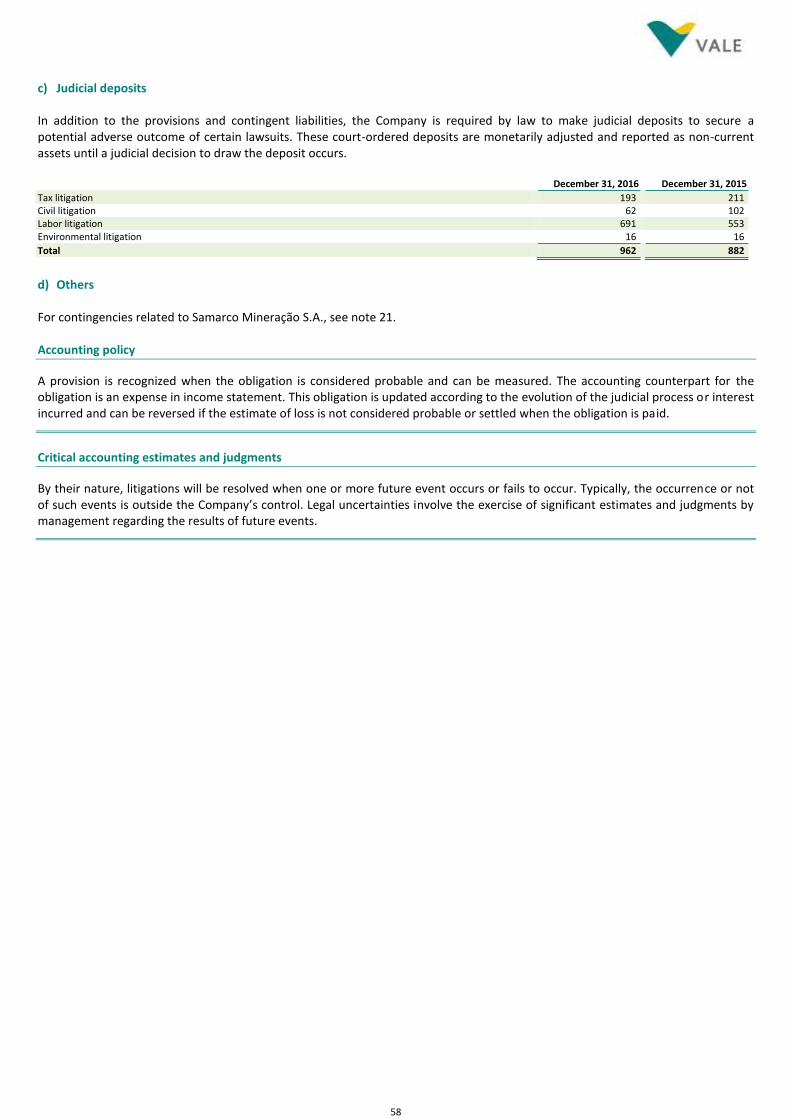
58
c) Judicial deposits In addition to the provisions and contingent liabilities, the Company is required by law to make judicial deposits to secure a potential adverse outcome of certain lawsuits. These court-ordered deposits are monetarily adjusted and reported as non-current assets until a judicial decision to draw the deposit occurs. December 31, 2016 December 31, 2015
Tax litigation 193 211 Civil litigation 62 102 Labor litigation 691 553 Environmental litigation 16 16
Total 962 882
d) Others For contingencies related to Samarco Mineração S.A., see note 21. Accounting policy
A provision is recognized when the obligation is considered probable and can be measured. The accounting counterpart for the obligation is an expense in income statement. This obligation is updated according to the evolution of the judicial process or interest incurred and can be reversed if the estimate of loss is not considered probable or settled when the obligation is paid.
Critical accounting estimates and judgments
By their nature, litigations will be resolved when one or more future event occurs or fails to occur. Typically, the occurrence or not of such events is outside the Company’s control. Legal uncertainties involve the exercise of significant estimates and judgments by management regarding the results of future events.
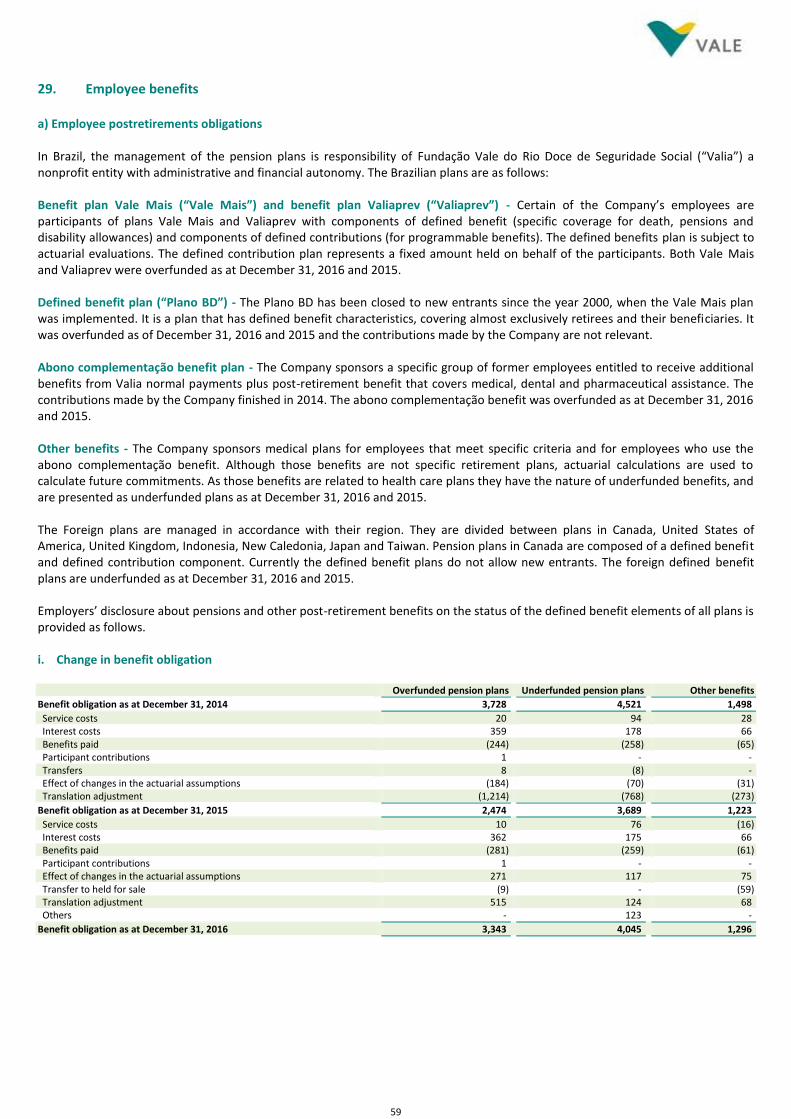
59
29. Employee benefits a) Employee postretirements obligations In Brazil, the management of the pension plans is responsibility of Fundação Vale do Rio Doce de Seguridade Social (“Valia”) a nonprofit entity with administrative and financial autonomy. The Brazilian plans are as follows: Benefit plan Vale Mais (“Vale Mais”) and benefit plan Valiaprev (“Valiaprev”) - Certain of the Company’s employees are participants of plans Vale Mais and Valiaprev with components of defined benefit (specific coverage for death, pensions and disability allowances) and components of defined contributions (for programmable benefits). The defined benefits plan is subject to actuarial evaluations. The defined contribution plan represents a fixed amount held on behalf of the participants. Both Vale Mais and Valiaprev were overfunded as at December 31, 2016 and 2015. Defined benefit plan (“Plano BD”) - The Plano BD has been closed to new entrants since the year 2000, when the Vale Mais plan was implemented. It is a plan that has defined benefit characteristics, covering almost exclusively retirees and their beneficiaries. It was overfunded as of December 31, 2016 and 2015 and the contributions made by the Company are not relevant. Abono complementação benefit plan - The Company sponsors a specific group of former employees entitled to receive additional benefits from Valia normal payments plus post-retirement benefit that covers medical, dental and pharmaceutical assistance. The contributions made by the Company finished in 2014. The abono complementação benefit was overfunded as at December 31, 2016 and 2015. Other benefits - The Company sponsors medical plans for employees that meet specific criteria and for employees who use the abono complementação benefit. Although those benefits are not specific retirement plans, actuarial calculations are used to calculate future commitments. As those benefits are related to health care plans they have the nature of underfunded benefits, and are presented as underfunded plans as at December 31, 2016 and 2015. The Foreign plans are managed in accordance with their region. They are divided between plans in Canada, United States of America, United Kingdom, Indonesia, New Caledonia, Japan and Taiwan. Pension plans in Canada are composed of a defined benefit and defined contribution component. Currently the defined benefit plans do not allow new entrants. The foreign defined benefit plans are underfunded as at December 31, 2016 and 2015. Employers’ disclosure about pensions and other post-retirement benefits on the status of the defined benefit elements of all plans is provided as follows. i. Change in benefit obligation Overfunded pension plans Underfunded pension plans Other benefits
Benefit obligation as at December 31, 2014 3,728 4,521 1,498
Service costs 20 94 28 Interest costs 359 178 66 Benefits paid (244) (258) (65) Participant contributions 1 - - Transfers 8 (8) - Effect of changes in the actuarial assumptions (184) (70) (31) Translation adjustment (1,214) (768) (273)
Benefit obligation as at December 31, 2015 2,474 3,689 1,223
Service costs 10 76 (16) Interest costs 362 175 66 Benefits paid (281) (259) (61) Participant contributions 1 - - Effect of changes in the actuarial assumptions 271 117 75 Transfer to held for sale (9) - (59) Translation adjustment 515 124 68 Others - 123 -
Benefit obligation as at December 31, 2016 3,343 4,045 1,296
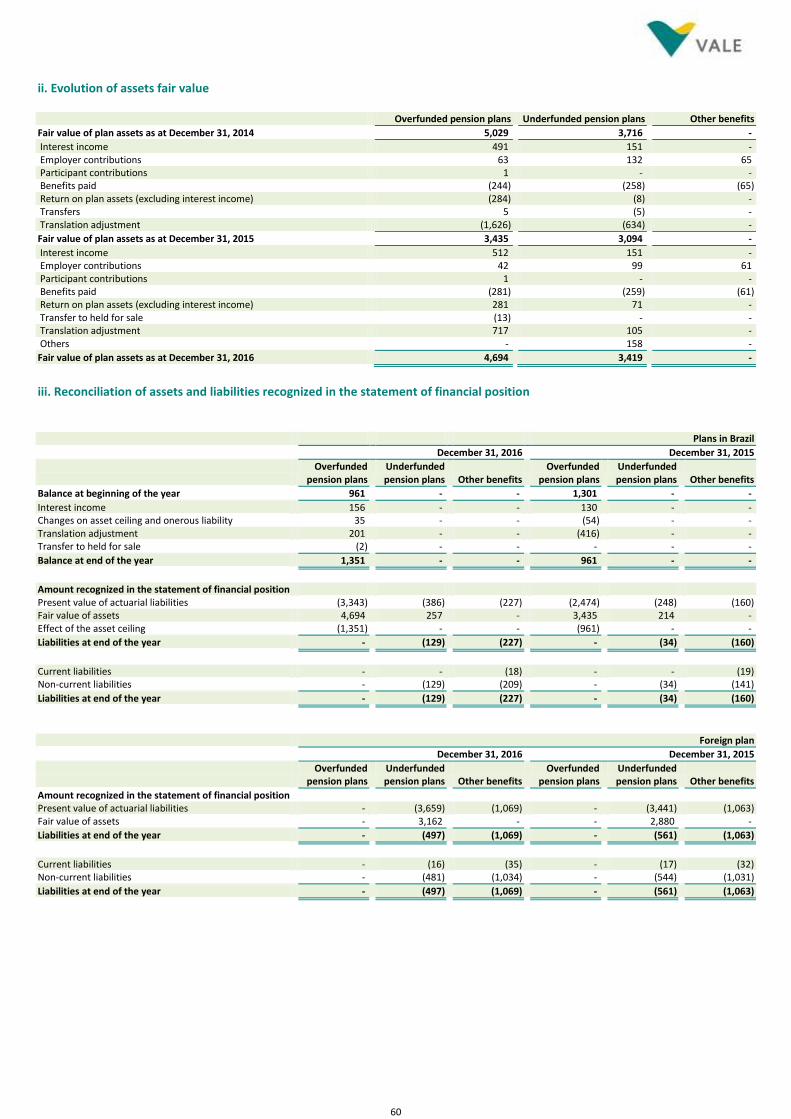
60
ii. Evolution of assets fair value Overfunded pension plans Underfunded pension plans Other benefits
Fair value of plan assets as at December 31, 2014 5,029 3,716 -
Interest income 491 151 - Employer contributions 63 132 65 Participant contributions 1 - - Benefits paid (244) (258) (65) Return on plan assets (excluding interest income) (284) (8) - Transfers 5 (5) - Translation adjustment (1,626) (634) -
Fair value of plan assets as at December 31, 2015 3,435 3,094 -
Interest income 512 151 - Employer contributions 42 99 61 Participant contributions 1 - - Benefits paid (281) (259) (61) Return on plan assets (excluding interest income) 281 71 - Transfer to held for sale (13) - - Translation adjustment 717 105 - Others - 158 -
Fair value of plan assets as at December 31, 2016 4,694 3,419 -
iii. Reconciliation of assets and liabilities recognized in the statement of financial position Plans in Brazil
December 31, 2016 December 31, 2015
Overfunded
pension plans Underfunded pension plans Other benefits
Overfunded pension plans
Underfunded pension plans Other benefits
Balance at beginning of the year 961 - - 1,301 - -
Interest income 156 - - 130 - - Changes on asset ceiling and onerous liability 35 - - (54) - - Translation adjustment 201 - - (416) - - Transfer to held for sale (2) - - - - -
Balance at end of the year 1,351 - - 961 - -
Amount recognized in the statement of financial position Present value of actuarial liabilities (3,343) (386) (227) (2,474) (248) (160) Fair value of assets 4,694 257 - 3,435 214 - Effect of the asset ceiling (1,351) - - (961) - -
Liabilities at end of the year - (129) (227) - (34) (160)
Current liabilities - - (18) - - (19) Non-current liabilities - (129) (209) - (34) (141)
Liabilities at end of the year - (129) (227) - (34) (160)
Foreign plan
December 31, 2016 December 31, 2015
Overfunded
pension plans Underfunded pension plans Other benefits
Overfunded pension plans
Underfunded pension plans Other benefits
Amount recognized in the statement of financial position Present value of actuarial liabilities - (3,659) (1,069) - (3,441) (1,063) Fair value of assets - 3,162 - - 2,880 -
Liabilities at end of the year - (497) (1,069) - (561) (1,063)
Current liabilities - (16) (35) - (17) (32) Non-current liabilities - (481) (1,034) - (544) (1,031)
Liabilities at end of the year - (497) (1,069) - (561) (1,063)
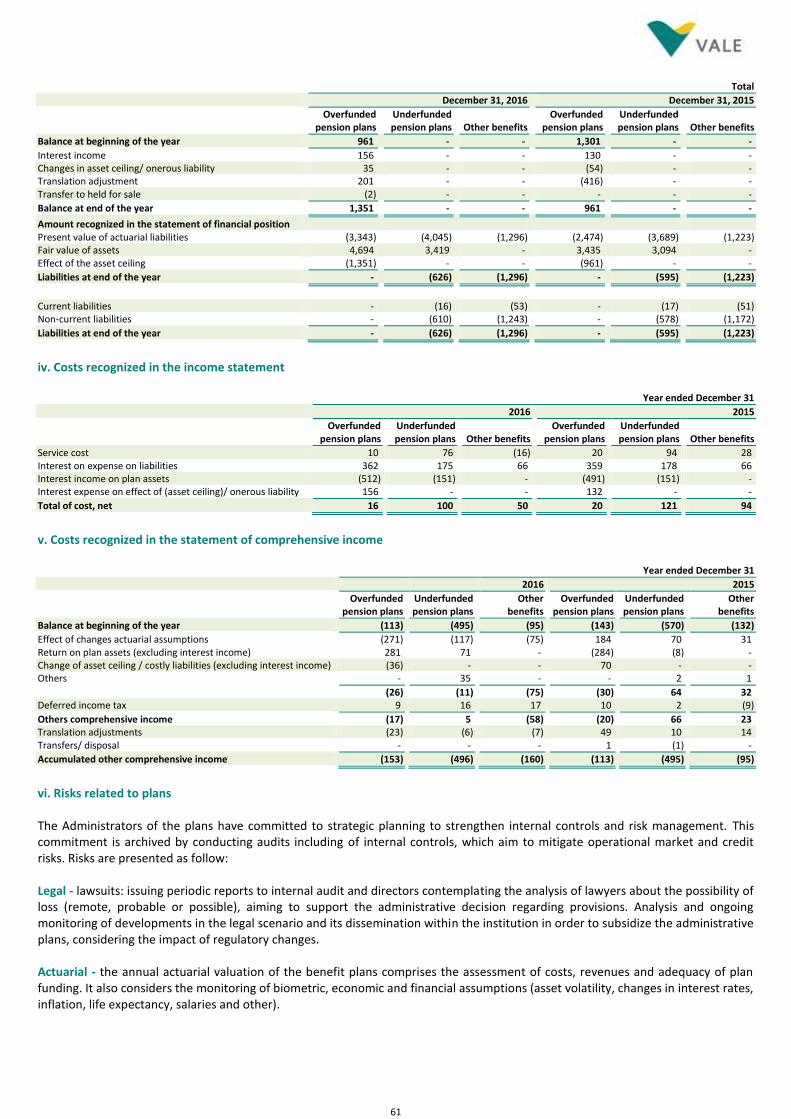
61
Total
December 31, 2016 December 31, 2015
Overfunded
pension plans Underfunded pension plans Other benefits
Overfunded pension plans
Underfunded pension plans Other benefits
Balance at beginning of the year 961 - - 1,301 - -
Interest income 156 - - 130 - - Changes in asset ceiling/ onerous liability 35 - - (54) - - Translation adjustment 201 - - (416) - - Transfer to held for sale (2) - - - - -
Balance at end of the year 1,351 - - 961 - -
Amount recognized in the statement of financial position Present value of actuarial liabilities (3,343) (4,045) (1,296) (2,474) (3,689) (1,223) Fair value of assets 4,694 3,419 - 3,435 3,094 - Effect of the asset ceiling (1,351) - - (961) - -
Liabilities at end of the year - (626) (1,296) - (595) (1,223)
Current liabilities - (16) (53) - (17) (51) Non-current liabilities - (610) (1,243) - (578) (1,172)
Liabilities at end of the year - (626) (1,296) - (595) (1,223)
iv. Costs recognized in the income statement Year ended December 31
2016 2015
Overfunded
pension plans Underfunded pension plans Other benefits
Overfunded pension plans
Underfunded pension plans Other benefits
Service cost 10 76 (16) 20 94 28 Interest on expense on liabilities 362 175 66 359 178 66 Interest income on plan assets (512) (151) - (491) (151) - Interest expense on effect of (asset ceiling)/ onerous liability 156 - - 132 - -
Total of cost, net 16 100 50 20 121 94
v. Costs recognized in the statement of comprehensive income Year ended December 31
2016 2015
Overfunded
pension plans
Underfunded pension plans
Other
benefits
Overfunded pension plans
Underfunded pension plans
Other
benefits
Balance at beginning of the year (113) (495) (95) (143) (570) (132)
Effect of changes actuarial assumptions (271) (117) (75) 184 70 31 Return on plan assets (excluding interest income) 281 71 - (284) (8) - Change of asset ceiling / costly liabilities (excluding interest income) (36) - - 70 - - Others - 35 - - 2 1
(26) (11) (75) (30) 64 32 Deferred income tax 9 16 17 10 2 (9)
Others comprehensive income (17) 5 (58) (20) 66 23 Translation adjustments (23) (6) (7) 49 10 14 Transfers/ disposal - - - 1 (1) -
Accumulated other comprehensive income (153) (496) (160) (113) (495) (95)
vi. Risks related to plans The Administrators of the plans have committed to strategic planning to strengthen internal controls and risk management. This commitment is archived by conducting audits including of internal controls, which aim to mitigate operational market and credit risks. Risks are presented as follow: Legal - lawsuits: issuing periodic reports to internal audit and directors contemplating the analysis of lawyers about the possibility of loss (remote, probable or possible), aiming to support the administrative decision regarding provisions. Analysis and ongoing monitoring of developments in the legal scenario and its dissemination within the institution in order to subsidize the administrative plans, considering the impact of regulatory changes. Actuarial - the annual actuarial valuation of the benefit plans comprises the assessment of costs, revenues and adequacy of plan funding. It also considers the monitoring of biometric, economic and financial assumptions (asset volatility, changes in interest rates, inflation, life expectancy, salaries and other).
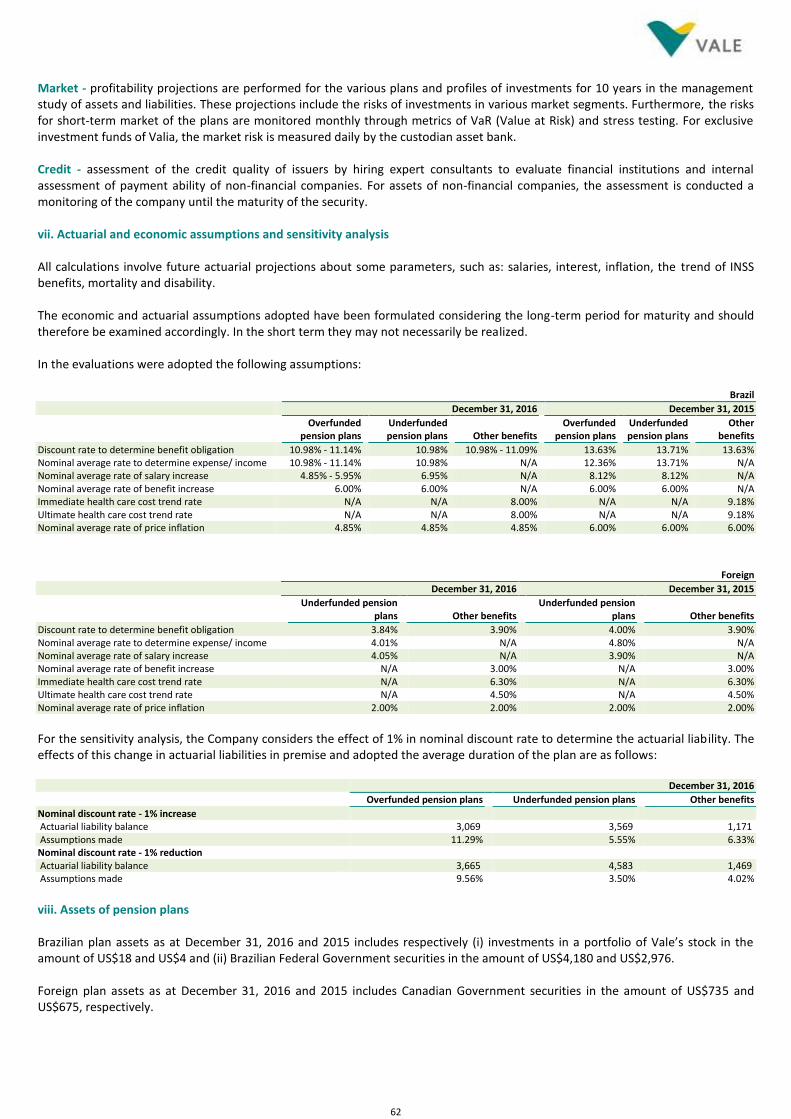
62
Market - profitability projections are performed for the various plans and profiles of investments for 10 years in the management study of assets and liabilities. These projections include the risks of investments in various market segments. Furthermore, the risks for short-term market of the plans are monitored monthly through metrics of VaR (Value at Risk) and stress testing. For exclusive investment funds of Valia, the market risk is measured daily by the custodian asset bank. Credit - assessment of the credit quality of issuers by hiring expert consultants to evaluate financial institutions and internal assessment of payment ability of non-financial companies. For assets of non-financial companies, the assessment is conducted a monitoring of the company until the maturity of the security. vii. Actuarial and economic assumptions and sensitivity analysis All calculations involve future actuarial projections about some parameters, such as: salaries, interest, inflation, the trend of INSS benefits, mortality and disability. The economic and actuarial assumptions adopted have been formulated considering the long-term period for maturity and should therefore be examined accordingly. In the short term they may not necessarily be realized. In the evaluations were adopted the following assumptions: Brazil
December 31, 2016 December 31, 2015
Overfunded
pension plans Underfunded pension plans Other benefits
Overfunded pension plans
Underfunded pension plans
Other benefits
Discount rate to determine benefit obligation 10.98% - 11.14% 10.98% 10.98% - 11.09% 13.63% 13.71% 13.63% Nominal average rate to determine expense/ income 10.98% - 11.14% 10.98% N/A 12.36% 13.71% N/A Nominal average rate of salary increase 4.85% - 5.95% 6.95% N/A 8.12% 8.12% N/A Nominal average rate of benefit increase 6.00% 6.00% N/A 6.00% 6.00% N/A Immediate health care cost trend rate N/A N/A 8.00% N/A N/A 9.18% Ultimate health care cost trend rate N/A N/A 8.00% N/A N/A 9.18% Nominal average rate of price inflation 4.85% 4.85% 4.85% 6.00% 6.00% 6.00%
Foreign
December 31, 2016 December 31, 2015
Underfunded pension
plans Other benefits Underfunded pension
plans Other benefits
Discount rate to determine benefit obligation 3.84% 3.90% 4.00% 3.90% Nominal average rate to determine expense/ income 4.01% N/A 4.80% N/A Nominal average rate of salary increase 4.05% N/A 3.90% N/A Nominal average rate of benefit increase N/A 3.00% N/A 3.00% Immediate health care cost trend rate N/A 6.30% N/A 6.30% Ultimate health care cost trend rate N/A 4.50% N/A 4.50% Nominal average rate of price inflation 2.00% 2.00% 2.00% 2.00%
For the sensitivity analysis, the Company considers the effect of 1% in nominal discount rate to determine the actuarial liability. The effects of this change in actuarial liabilities in premise and adopted the average duration of the plan are as follows: December 31, 2016
Overfunded pension plans Underfunded pension plans Other benefits
Nominal discount rate - 1% increase Actuarial liability balance 3,069 3,569 1,171 Assumptions made 11.29% 5.55% 6.33% Nominal discount rate - 1% reduction Actuarial liability balance 3,665 4,583 1,469 Assumptions made 9.56% 3.50% 4.02%
viii. Assets of pension plans Brazilian plan assets as at December 31, 2016 and 2015 includes respectively (i) investments in a portfolio of Vale’s stock in the amount of US$18 and US$4 and (ii) Brazilian Federal Government securities in the amount of US$4,180 and US$2,976. Foreign plan assets as at December 31, 2016 and 2015 includes Canadian Government securities in the amount of US$735 and US$675, respectively.
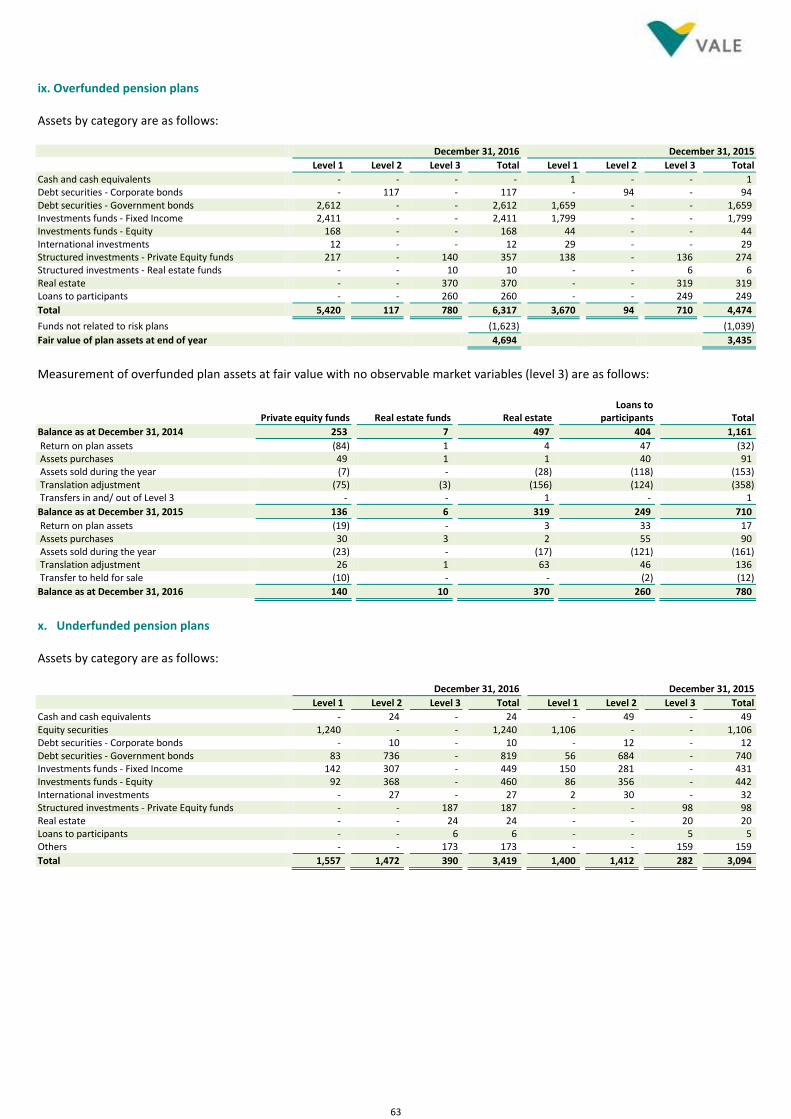
63
ix. Overfunded pension plans Assets by category are as follows: December 31, 2016 December 31, 2015
Level 1 Level 2 Level 3 Total Level 1 Level 2 Level 3 Total
Cash and cash equivalents - - - - 1 - - 1 Debt securities - Corporate bonds - 117 - 117 - 94 - 94 Debt securities - Government bonds 2,612 - - 2,612 1,659 - - 1,659 Investments funds - Fixed Income 2,411 - - 2,411 1,799 - - 1,799 Investments funds - Equity 168 - - 168 44 - - 44 International investments 12 - - 12 29 - - 29 Structured investments - Private Equity funds 217 - 140 357 138 - 136 274 Structured investments - Real estate funds - - 10 10 - - 6 6 Real estate - - 370 370 - - 319 319 Loans to participants - - 260 260 - - 249 249
Total 5,420 117 780 6,317 3,670 94 710 4,474
Funds not related to risk plans (1,623) (1,039)
Fair value of plan assets at end of year 4,694 3,435
Measurement of overfunded plan assets at fair value with no observable market variables (level 3) are as follows:
Private equity funds Real estate funds Real estate
Loans to participants Total
Balance as at December 31, 2014 253 7 497 404 1,161
Return on plan assets (84) 1 4 47 (32) Assets purchases 49 1 1 40 91 Assets sold during the year (7) - (28) (118) (153) Translation adjustment (75) (3) (156) (124) (358) Transfers in and/ out of Level 3 - - 1 - 1
Balance as at December 31, 2015 136 6 319 249 710
Return on plan assets (19) - 3 33 17 Assets purchases 30 3 2 55 90 Assets sold during the year (23) - (17) (121) (161) Translation adjustment 26 1 63 46 136 Transfer to held for sale (10) - - (2) (12)
Balance as at December 31, 2016 140 10 370 260 780
x. Underfunded pension plans Assets by category are as follows: December 31, 2016 December 31, 2015
Level 1 Level 2 Level 3 Total Level 1 Level 2 Level 3 Total
Cash and cash equivalents - 24 - 24 - 49 - 49 Equity securities 1,240 - - 1,240 1,106 - - 1,106 Debt securities - Corporate bonds - 10 - 10 - 12 - 12 Debt securities - Government bonds 83 736 - 819 56 684 - 740 Investments funds - Fixed Income 142 307 - 449 150 281 - 431 Investments funds - Equity 92 368 - 460 86 356 - 442 International investments - 27 - 27 2 30 - 32 Structured investments - Private Equity funds - - 187 187 - - 98 98 Real estate - - 24 24 - - 20 20 Loans to participants - - 6 6 - - 5 5 Others - - 173 173 - - 159 159
Total 1,557 1,472 390 3,419 1,400 1,412 282 3,094
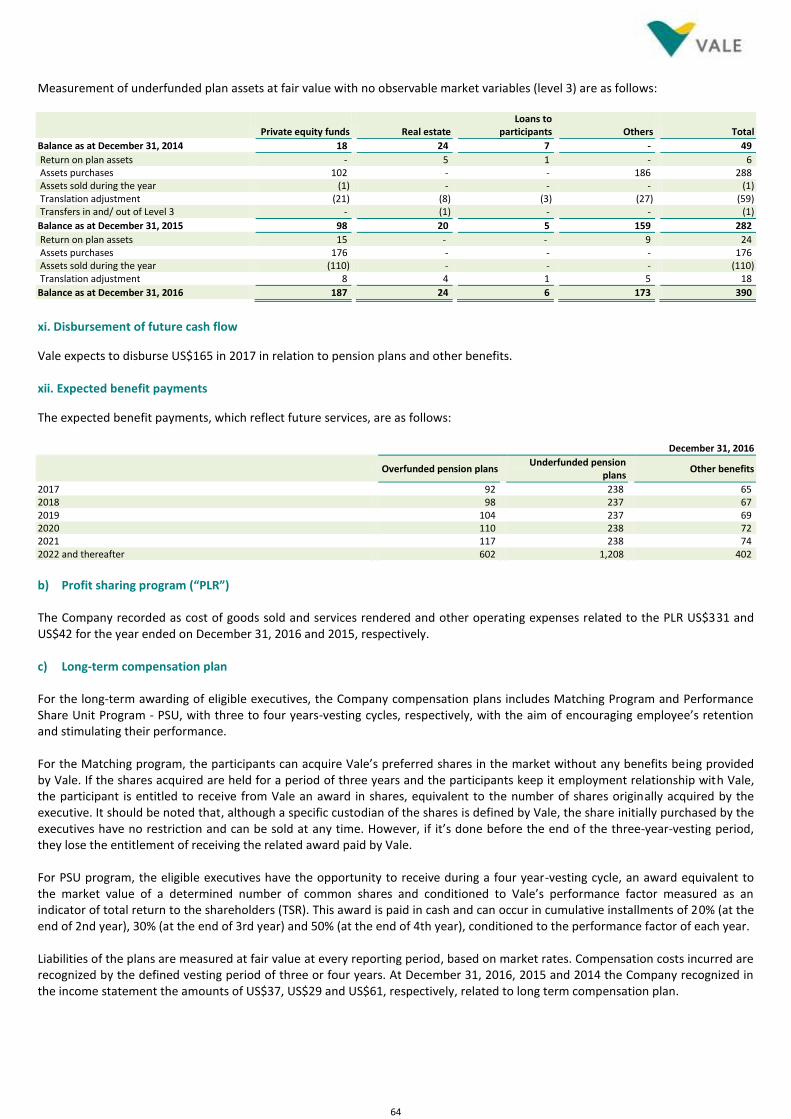
64
Measurement of underfunded plan assets at fair value with no observable market variables (level 3) are as follows:
Private equity funds Real estate Loans to
participants Others Total
Balance as at December 31, 2014 18 24 7 - 49
Return on plan assets - 5 1 - 6 Assets purchases 102 - - 186 288 Assets sold during the year (1) - - - (1) Translation adjustment (21) (8) (3) (27) (59) Transfers in and/ out of Level 3 - (1) - - (1)
Balance as at December 31, 2015 98 20 5 159 282
Return on plan assets 15 - - 9 24 Assets purchases 176 - - - 176 Assets sold during the year (110) - - - (110) Translation adjustment 8 4 1 5 18
Balance as at December 31, 2016 187 24 6 173 390
xi. Disbursement of future cash flow
Vale expects to disburse US$165 in 2017 in relation to pension plans and other benefits. xii. Expected benefit payments
The expected benefit payments, which reflect future services, are as follows: December 31, 2016
Overfunded pension plans Underfunded pension
plans Other benefits
2017 92 238 65 2018 98 237 67 2019 104 237 69 2020 110 238 72 2021 117 238 74 2022 and thereafter 602 1,208 402
b) Profit sharing program (“PLR”) The Company recorded as cost of goods sold and services rendered and other operating expenses related to the PLR US$331 and US$42 for the year ended on December 31, 2016 and 2015, respectively. c) Long-term compensation plan For the long-term awarding of eligible executives, the Company compensation plans includes Matching Program and Performance Share Unit Program - PSU, with three to four years-vesting cycles, respectively, with the aim of encouraging employee’s retention and stimulating their performance. For the Matching program, the participants can acquire Vale’s preferred shares in the market without any benefits being provided by Vale. If the shares acquired are held for a period of three years and the participants keep it employment relationship with Vale, the participant is entitled to receive from Vale an award in shares, equivalent to the number of shares originally acquired by the executive. It should be noted that, although a specific custodian of the shares is defined by Vale, the share initially purchased by the executives have no restriction and can be sold at any time. However, if it’s done before the end of the three-year-vesting period, they lose the entitlement of receiving the related award paid by Vale. For PSU program, the eligible executives have the opportunity to receive during a four year-vesting cycle, an award equivalent to the market value of a determined number of common shares and conditioned to Vale’s performance factor measured as an indicator of total return to the shareholders (TSR). This award is paid in cash and can occur in cumulative installments of 20% (at the end of 2nd year), 30% (at the end of 3rd year) and 50% (at the end of 4th year), conditioned to the performance factor of each year. Liabilities of the plans are measured at fair value at every reporting period, based on market rates. Compensation costs incurred are recognized by the defined vesting period of three or four years. At December 31, 2016, 2015 and 2014 the Company recognized in the income statement the amounts of US$37, US$29 and US$61, respectively, related to long term compensation plan.
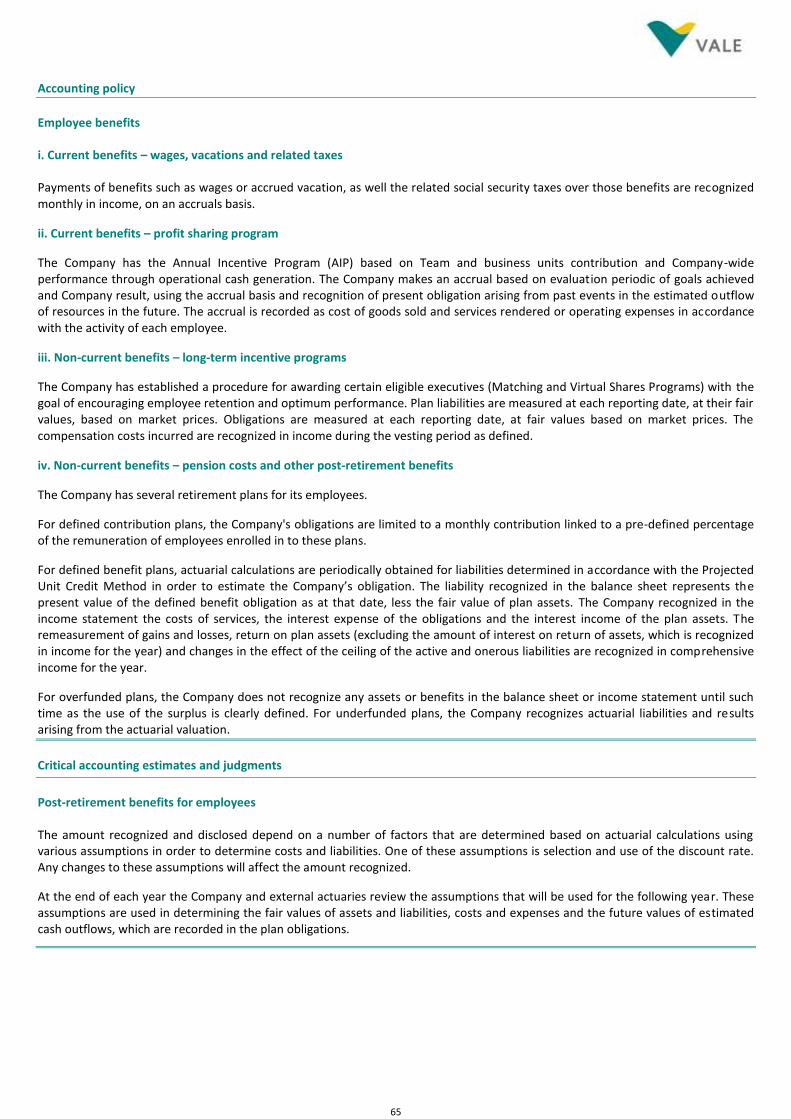
65
Accounting policy
Employee benefits i. Current benefits – wages, vacations and related taxes Payments of benefits such as wages or accrued vacation, as well the related social security taxes over those benefits are recognized monthly in income, on an accruals basis.
ii. Current benefits – profit sharing program
The Company has the Annual Incentive Program (AIP) based on Team and business units contribution and Company-wide performance through operational cash generation. The Company makes an accrual based on evaluation periodic of goals achieved and Company result, using the accrual basis and recognition of present obligation arising from past events in the estimated outflow of resources in the future. The accrual is recorded as cost of goods sold and services rendered or operating expenses in accordance with the activity of each employee.
iii. Non-current benefits – long-term incentive programs
The Company has established a procedure for awarding certain eligible executives (Matching and Virtual Shares Programs) with the goal of encouraging employee retention and optimum performance. Plan liabilities are measured at each reporting date, at their fair values, based on market prices. Obligations are measured at each reporting date, at fair values based on market prices. The compensation costs incurred are recognized in income during the vesting period as defined.
iv. Non-current benefits – pension costs and other post-retirement benefits
The Company has several retirement plans for its employees.
For defined contribution plans, the Company's obligations are limited to a monthly contribution linked to a pre-defined percentage of the remuneration of employees enrolled in to these plans.
For defined benefit plans, actuarial calculations are periodically obtained for liabilities determined in accordance with the Projected Unit Credit Method in order to estimate the Company’s obligation. The liability recognized in the balance sheet represents the present value of the defined benefit obligation as at that date, less the fair value of plan assets. The Company recognized in the income statement the costs of services, the interest expense of the obligations and the interest income of the plan assets. The remeasurement of gains and losses, return on plan assets (excluding the amount of interest on return of assets, which is recognized in income for the year) and changes in the effect of the ceiling of the active and onerous liabilities are recognized in comprehensive income for the year.
For overfunded plans, the Company does not recognize any assets or benefits in the balance sheet or income statement until such time as the use of the surplus is clearly defined. For underfunded plans, the Company recognizes actuarial liabilities and results arising from the actuarial valuation.
Critical accounting estimates and judgments
Post-retirement benefits for employees The amount recognized and disclosed depend on a number of factors that are determined based on actuarial calculations using various assumptions in order to determine costs and liabilities. One of these assumptions is selection and use of the discount rate. Any changes to these assumptions will affect the amount recognized.
At the end of each year the Company and external actuaries review the assumptions that will be used for the following year. These assumptions are used in determining the fair values of assets and liabilities, costs and expenses and the future values of estimated cash outflows, which are recorded in the plan obligations.
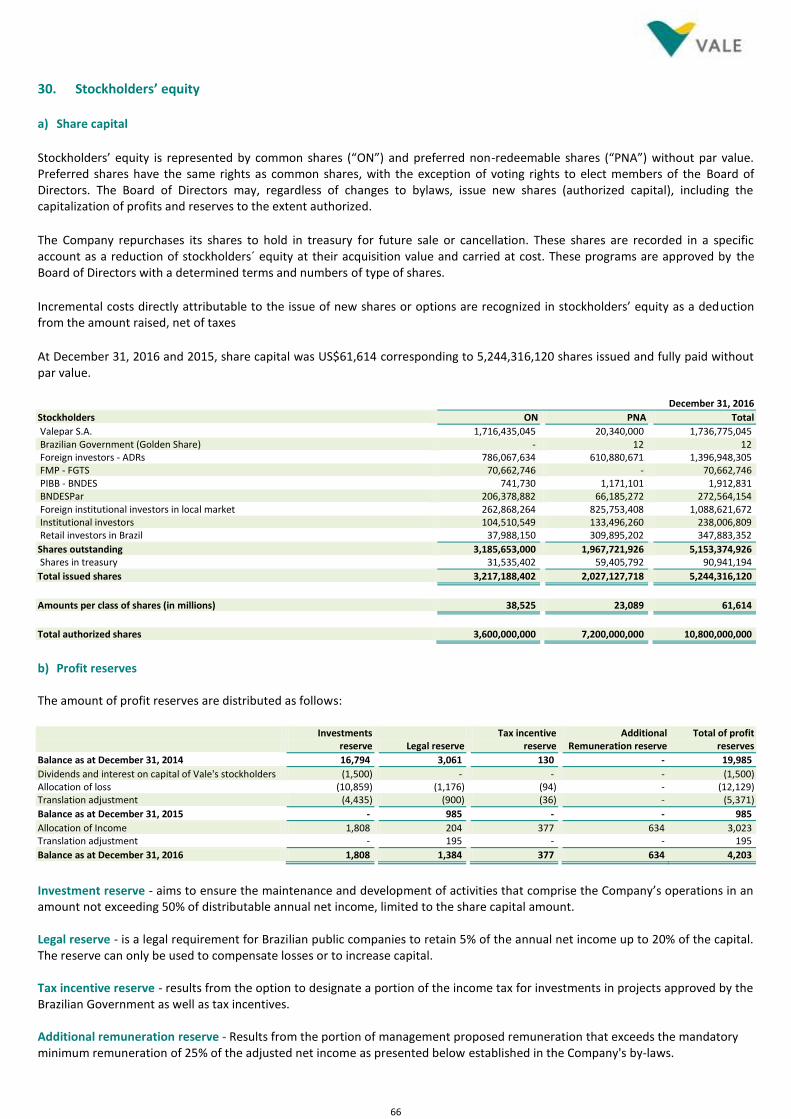
66
30. Stockholders’ equity a) Share capital
Stockholders’ equity is represented by common shares (“ON”) and preferred non-redeemable shares (“PNA”) without par value. Preferred shares have the same rights as common shares, with the exception of voting rights to elect members of the Board of Directors. The Board of Directors may, regardless of changes to bylaws, issue new shares (authorized capital), including the capitalization of profits and reserves to the extent authorized.
The Company repurchases its shares to hold in treasury for future sale or cancellation. These shares are recorded in a specific account as a reduction of stockholders´ equity at their acquisition value and carried at cost. These programs are approved by the Board of Directors with a determined terms and numbers of type of shares.
Incremental costs directly attributable to the issue of new shares or options are recognized in stockholders’ equity as a deduction from the amount raised, net of taxes
At December 31, 2016 and 2015, share capital was US$61,614 corresponding to 5,244,316,120 shares issued and fully paid without par value. December 31, 2016
Stockholders ON PNA Total
Valepar S.A. 1,716,435,045 20,340,000 1,736,775,045 Brazilian Government (Golden Share) - 12 12 Foreign investors - ADRs 786,067,634 610,880,671 1,396,948,305 FMP - FGTS 70,662,746 - 70,662,746 PIBB - BNDES 741,730 1,171,101 1,912,831 BNDESPar 206,378,882 66,185,272 272,564,154 Foreign institutional investors in local market 262,868,264 825,753,408 1,088,621,672 Institutional investors 104,510,549 133,496,260 238,006,809 Retail investors in Brazil 37,988,150 309,895,202 347,883,352
Shares outstanding 3,185,653,000 1,967,721,926 5,153,374,926 Shares in treasury 31,535,402 59,405,792 90,941,194
Total issued shares 3,217,188,402 2,027,127,718 5,244,316,120
Amounts per class of shares (in millions) 38,525 23,089 61,614
Total authorized shares 3,600,000,000 7,200,000,000 10,800,000,000
b) Profit reserves The amount of profit reserves are distributed as follows:
Investments
reserve Legal reserve Tax incentive
reserve Additional
Remuneration reserve Total of profit
reserves
Balance as at December 31, 2014 16,794 3,061 130 - 19,985
Dividends and interest on capital of Vale's stockholders (1,500) - - - (1,500) Allocation of loss (10,859) (1,176) (94) - (12,129) Translation adjustment (4,435) (900) (36) - (5,371)
Balance as at December 31, 2015 - 985 - - 985
Allocation of Income 1,808 204 377 634 3,023 Translation adjustment - 195 - - 195
Balance as at December 31, 2016 1,808 1,384 377 634 4,203
Investment reserve - aims to ensure the maintenance and development of activities that comprise the Company’s operations in an amount not exceeding 50% of distributable annual net income, limited to the share capital amount. Legal reserve - is a legal requirement for Brazilian public companies to retain 5% of the annual net income up to 20% of the capital. The reserve can only be used to compensate losses or to increase capital. Tax incentive reserve - results from the option to designate a portion of the income tax for investments in projects approved by the Brazilian Government as well as tax incentives. Additional remuneration reserve - Results from the portion of management proposed remuneration that exceeds the mandatory minimum remuneration of 25% of the adjusted net income as presented below established in the Company's by-laws.
67
c) Unrealized fair value gain (losses)
Retirement benefit
obligations Cash flow hedge Available-for-sale financial
instruments Conversion shares Total gain (losses)
Balance as at December 31, 2014 (845) (453) (2) (413) (1,713)
Other comprehensive income 70 447 1 - 518 Translation adjustment 72 - - 131 203
Balance as at December 31, 2015 (703) (6) (1) (282) (992)
Other comprehensive income (70) 7 1 - (62) Translation adjustment (36) (1) - (56) (93)
Balance as at December 31, 2016 (809) - - (338) (1,147)
d) Remuneration to the Company’s stockholders Vale's by-laws determine the minimum remuneration to stockholders of 25% of net income, after adjustments from Brazil’s legal requirements which based on our adjusted net income as shown below resulted in R$3,459 (US$1,061). In December, 2016 R$857 (US$250) was anticipated and the remaining balance of R$2,602 (US$811) was accounted for in short term liability as “Dividends and interest on capital”. Additionally, in our by-laws preferred shares class A are entitled to receive priority dividends corresponding to (i) at least 3% (three percent) of the shareholders’ equity share value, calculated based on the financial statements used as reference for the payment of dividends or (ii) 6% (six percent) calculated over the part of capital represented by this class of shares, whichever is the higher among them. Accordingly, management proposed and the Board of Directors approved the proposal for additional dividends payments of R$2,065 (US$634) to equalize preferred and common share remuneration. The amount was classified as “Additional Remuneration reserve” until it is approved in the annual general meeting. All remuneration paid and proposed during the year was based on interest on equity. The proposal of stockholders' remuneration was calculated in R$. The equivalent amount in US$ are as follows: 2016
Net income of the year 3,982 Legal reserve (204) Tax incentive reserve (272)
Adjusted net income 3,506 Allocation of net income (1,913) Cumulative translation adjustments 102
1,695
Remuneration: Mandatory minimum 1,061 Additional remuneration 634
1,695
Remuneration by nature: Interest on capital 1,695
1,695
Total remuneration per share 0.328883933
The amounts paid to stockholders, by nature of remuneration, are as follows: Dividends Interest on capital Total Amount per share
Amounts paid in 2014 First installment - April - 2,100 2,100 0.407499945 Second installment - October 717 1,383 2,100 0.407499945
Total 717 3,483 4,200
Amounts paid in 2015 First installment - April - 1,000 1,000 0.194047593 Second installment - October 500 - 500 0.097023796
Total 500 1,000 1,500
Amounts paid in 2016 First installment - December - 250 250 0.048511898
Total - 250 250
68
e) New shareholders' agreement – Subsequent event. On February 20, 2017 the Company announced that a new shareholders’ agreement was filed at the Company’s headquarters, executed by Litel Participações S.A., Litela Participações S.A., Bradespar S.A., Mitsui & Co., Ltd. and BNDES Participações S.A. – BNDESPAR (“Valepar Agreement”), as shareholders of Valepar S.A. (“Valepar”), jointly referred to as “Shareholders”, which sha ll enter into force after the expiration of Valepar’s current Shareholders’ Agreement on May 10, 2017. The Valepar Agreement, along with the standard provisions in connection with voting rights and right of first refusal for the acquisition of the Shareholders’ shares, provides for the submission to the Company of a proposal for the purpose of enabling the listing of Vale on BM&FBOVESPA’s Novo Mercado special segment (Brazil) and making Vale a company without defined control (“Proposal”). The Proposal is binding on the Shareholders, and it is subject to approval by the Company’s corporate bodies. The Valepar Agreement will have a term of 6 months, counting from the date it takes effect. The transaction envisaged by the Proposal is composed of a series of indivisible and interdependent steps, whose effectiveness is subject to the successful performance of the other steps. The Proposal comprises, beyond the performance of all acts and procedures imposed by the applicable legal provisions and rules: (i) Voluntary conversion of Vale class A preferred shares into common shares, based on the conversion rate of 0.9342 common shares for each Vale class A preferred share, based on the average closing price of the common shares and preferred shares over the last 30 trading sessions on the BM&FBOVESPA prior to February 17, 2017 (inclusive), weighted by the volume of shares traded in such trading sessions; (ii) Amendment of Vale’s bylaws, so as to adjust it, as much as possible, to BM&FBOVESPA’s Novo Mercado special segment rules so Vale may be effectively listed on such special segment; (iii) The merger of Valepar into Vale at an exchange ratio that contemplates a 10% increase in the number of shares held by the shareholders of Valepar compared to Valepar’s current shareholding interest, and represents a dilution of approximately 3% of the shareholding interest held by the other shareholders in Vale. In line with the provisions of item “iii” above, Valepar’s shareholders will receive 1.2065 Vale common shares for each Valepar share held by them. As a result, Vale will issue 173,543,667 new common shares, all registered and without par value, in favor of Valepar’s shareholders. Consequently, Valepar’s shareholders will own a total of 1,908,980,340 Vale common shares after the merger of Valepar. The goodwill balance carried on Valepar’s financial statements and its potential tax benefit use by Vale will not be subject to capitalization in favor of Valepar’s shareholders, but will be for the benefit of all Vale’s shareholders. Valepar will hold at the time of the merger enough cash and cash equivalents to fully settle its liabilities. The implementation of the Proposal is subject to (i) the approval of the Proposal, including the merger of Valepar into Vale, by Valepar’s and Vale’s corporate bodies; and (ii) the acceptance by at least 54.09% of class A preferred shares of the voluntary conversion, as mentioned in item “i” above, within the maximum term of 45 days from the shareholders’ meeting decision on the matter, resulting in a combined shareholding interest held by the Shareholders of less than 50% of Vale’s total common shares. Valepar and the Shareholders will not exercise their voting right at Vale’s shareholders’ meetings that consider the voluntary conversion of the Vale class A preferred shares into common shares and the merger of Valepar. The holders of American Depositary Shares representing class A preferred shares of Vale will be able to elect voluntary conversion into American Depositary Shares representing common shares of Vale, on the same terms available to holders of class A preferred shares. Class A preferred shares, and preferred ADSs, that do not elect voluntary conversion will remain outstanding. On the date of effectiveness of the merger of Valepar into Vale, if the merger is approved, the Shareholders will execute a new shareholders’ agreement (“Vale Agreement”) that will bind only 20% of the totality of Vale’s common shares, and will be in force until November 9, 2020, with no provision for renewal. For 6 months from the date of entry into force of the Vale Agreement, the Shareholders will be obligated not to transfer, by any means, either directly or indirectly, Vale shares they receive as a result of the implementation of the Proposal (“Lock-Up”), except for (i) the transfer of Vale’s shares by the Shareholders to their affiliates and their current shareholders, provided that such transferred shares shall remain subject to the Lock-Up, and (ii) the transfer of shares held by the Shareholders prior to the merger of Valepar.
69
Accounting policy
The stockholder’s remuneration is paid on dividends and interest on capital. This remuneration is recognized as a liability in the financial statements of the Company based on bylaws. Any amount above the minimum compulsory remuneration approved by the bylaws shall only be recognized in current liabilities on the date that is approved by stockholders. The Company is permitted to distribute interest attributable to stockholders’ equity. The calculation is based on the stockholders’ equity amounts as stated in the statutory accounting records and the interest rate applied may not exceed the Brazilian Government Long-term Interest Rate (“TJLP”) determined by the Central Bank of Brazil. Also, such interest may not exceed 50% of the net income for the year or 50% of retained earnings plus profit reserves as determined by Brazilian corporate law. The benefit to the Company, as opposed to making a dividend payment, is a reduction in the income tax burden because this interest charge is tax deductible in Brazil. Income tax of 15% is withheld on behalf of the stockholders relative to the interest distribution. Under Brazilian law, interest attributed to stockholders’ equity is considered as part of the annual minimum mandatory dividend. This notional interest distribution is treated for accounting purposes as a deduction from stockholders' equity in a manner similar to a dividend and the tax deductibility recorded in the income statement.
31. Related parties Transactions with related parties are made by the Company at arm´s-length, observing the price and usual market conditions and therefore do not generate any undue benefit to their counterparties or loss to the Company. In the normal course of operations, Vale enters into contracts with related parties (associates, joint ventures and stockholders), related to the sale and purchase of products and services, loans, derivatives, leasing of assets, sale of raw material and railway transportation services. The balances of these related party transactions and their effects on the financial statements are as follows: Assets
December 31, 2016 December 31, 2015
Cash and
cash equivalents
Derivative financial
instruments Accounts
receivable Related parties
Cash and cash
equivalents
Derivative financial
instruments Accounts
receivable Related parties
Banco Bradesco S.A. 522 324 - - 37 66 - - Banco do Brasil S.A. 57 34 - - 395 16 - - Companhia Coreano-Brasileira de Pelotização - - - 5 - - - 6 Companhia Hispano-Brasileira de Pelotização - - 1 - - - 1 4 Companhia Ítalo-Brasileira de Pelotização - - - 8 - - - 8 Companhia Nipo-Brasileira de Pelotização - - - 15 - - - 9 Companhia Siderúrgica do Pecem - - 37 - - - - - Consórcio Rebocadores da Baia de São Marcos - - 10 - - - 15 - Mitsui & Co., Ltd. - - 4 - - - 1 - MRS Logística S.A. - - - 24 - - - 17 VLI - - 9 12 - - 34 10 Others - - 46 9 - - 27 17
Total 579 358 107 73 432 82 78 71
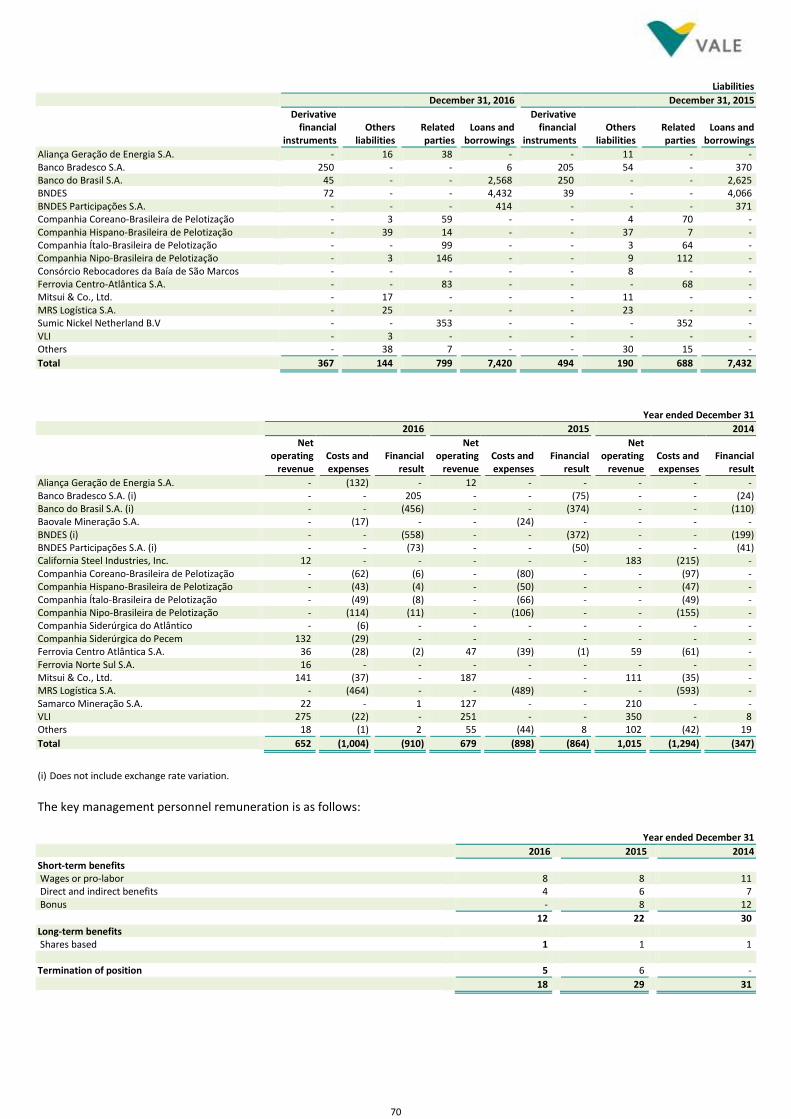
70
Liabilities
December 31, 2016 December 31, 2015
Derivative
financial instruments
Others liabilities
Related parties
Loans and borrowings
Derivative financial
instruments Others
liabilities Related parties
Loans and borrowings
Aliança Geração de Energia S.A. - 16 38 - - 11 - - Banco Bradesco S.A. 250 - - 6 205 54 - 370 Banco do Brasil S.A. 45 - - 2,568 250 - - 2,625 BNDES 72 - - 4,432 39 - - 4,066 BNDES Participações S.A. - - - 414 - - - 371 Companhia Coreano-Brasileira de Pelotização - 3 59 - - 4 70 - Companhia Hispano-Brasileira de Pelotização - 39 14 - - 37 7 - Companhia Ítalo-Brasileira de Pelotização - - 99 - - 3 64 - Companhia Nipo-Brasileira de Pelotização - 3 146 - - 9 112 - Consórcio Rebocadores da Baía de São Marcos - - - - - 8 - - Ferrovia Centro-Atlântica S.A. - - 83 - - - 68 - Mitsui & Co., Ltd. - 17 - - - 11 - - MRS Logística S.A. - 25 - - - 23 - - Sumic Nickel Netherland B.V - - 353 - - - 352 - VLI - 3 - - - - - - Others - 38 7 - - 30 15 -
Total 367 144 799 7,420 494 190 688 7,432
Year ended December 31
2016 2015 2014
Net
operating revenue
Costs and expenses
Financial result
Net operating
revenue Costs and expenses
Financial result
Net operating
revenue Costs and expenses
Financial result
Aliança Geração de Energia S.A. - (132) - 12 - - - - - Banco Bradesco S.A. (i) - - 205 - - (75) - - (24) Banco do Brasil S.A. (i) - - (456) - - (374) - - (110) Baovale Mineração S.A. - (17) - - (24) - - - - BNDES (i) - - (558) - - (372) - - (199) BNDES Participações S.A. (i) - - (73) - - (50) - - (41) California Steel Industries, Inc. 12 - - - - - 183 (215) - Companhia Coreano-Brasileira de Pelotização - (62) (6) - (80) - - (97) - Companhia Hispano-Brasileira de Pelotização - (43) (4) - (50) - - (47) - Companhia Ítalo-Brasileira de Pelotização - (49) (8) - (66) - - (49) - Companhia Nipo-Brasileira de Pelotização - (114) (11) - (106) - - (155) - Companhia Siderúrgica do Atlântico - (6) - - - - - - - Companhia Siderúrgica do Pecem 132 (29) - - - - - - - Ferrovia Centro Atlântica S.A. 36 (28) (2) 47 (39) (1) 59 (61) - Ferrovia Norte Sul S.A. 16 - - - - - - - - Mitsui & Co., Ltd. 141 (37) - 187 - - 111 (35) - MRS Logística S.A. - (464) - - (489) - - (593) - Samarco Mineração S.A. 22 - 1 127 - - 210 - - VLI 275 (22) - 251 - - 350 - 8 Others 18 (1) 2 55 (44) 8 102 (42) 19
Total 652 (1,004) (910) 679 (898) (864) 1,015 (1,294) (347)
(i) Does not include exchange rate variation.
The key management personnel remuneration is as follows: Year ended December 31
2016 2015 2014
Short‐term benefits Wages or pro‐labor 8 8 11 Direct and indirect benefits 4 6 7 Bonus - 8 12
12 22 30 Long‐term benefits Shares based 1 1 1 Termination of position 5 6 -
18 29 31
71
32. Commitments a) Base metals operations i) Nickel Operations – New Caledonia In regards to the construction and installation of the nickel plant in New Caledonia, Vale Canada Limited (“Vale Canada”) provided guarantees in respect of a special financing arrangement, structured under French tax law, to BNP Paribas (agent for the benefit of certain French institutional tax investors). The guarantees relate to lease finance payments due from Vale Nouvelle-Calédonie S.A.S. (“VNC”) to a special purpose company held by the French tax investors in respect of certain assets of the plant. Consistent with VNC’s commitments under the financing structure, these assets were substantially complete as at December 31, 2012. Vale Canada has committed that these assets will operate for a five year period following substantial completion. Vale Canada believes the likelihood of the guarantees being called upon is remote. ii) Nickel Operations – Indonesia In October 2014, Vale subsidiary PT Vale Indonesia Tbk (“PTVI”), a public company in Indonesia, renegotiated its agreement with the Government to operate (known as the Contract of Work (“CoW”)). The renegotiation included an undertaking by PTVI to further divest 20% of its shares to Indonesian participants (approximately 20% of PTVI’s shares already being registered on the Indonesian stock exchange) within five years. This undertaking will be fulfilled by PTVI’s existing major shareholders, being Vale Canada and Sumitomo Metal Mining, Co., Ltd., on a pro rata basis. iii) Nickel Operations – Canada The subsidiaries Vale Canada, Vale Newfoundland & Labrador Limited (“VNLL”) and the Province of Newfoundland and Labrador (the “Province”) signed a Development Agreement with respect to the development and operation of the Voisey’s Bay mine along with certain other obligations with respect to processing in the Province and the export of nickel and copper concentrate. On December 19, 2014, the Sixth Amendment to the Development Agreement was executed. The Sixth Amendment includes operational and other key commitments in the Development Agreement. As such, under the Development Agreement, as amended, VNLL has a potential obligation secured by letters of credit and other security, which may become due and payable in the event that certain commitments in relation to the construction of the underground mine are delayed or not met. iv) Other In the course of the operations the Company has provided other letters of credit, guarantees and surety bonds in the amount of US$1.1 billion that are associated with items such as environment reclamation, asset retirement obligation commitments, insurance, electricity commitments, post-retirement benefits, community service commitments and import and export duties. b) Participative stockholders’ debentures At the time of its privatization in 1997, Vale issued debentures to then-existing stockholders, including the Brazilian Government. The debentures’ terms were set to ensure that pre-privatization stockholders would participate in potential future benefits that might be obtained from exploiting mineral resources. A total of 388,559,056 debentures were issued with a par value of R$0.01 (one cent of Brazilian Real), whose value will be inflation-indexed the General Market Price Index (“IGP-M”), as set out in the Issue Deed. The Company paid as semiannual remuneration the amount of US$84 (R$268) and US$65 (R$209), respectively, for the year ended December 31, 2016 and 2015.
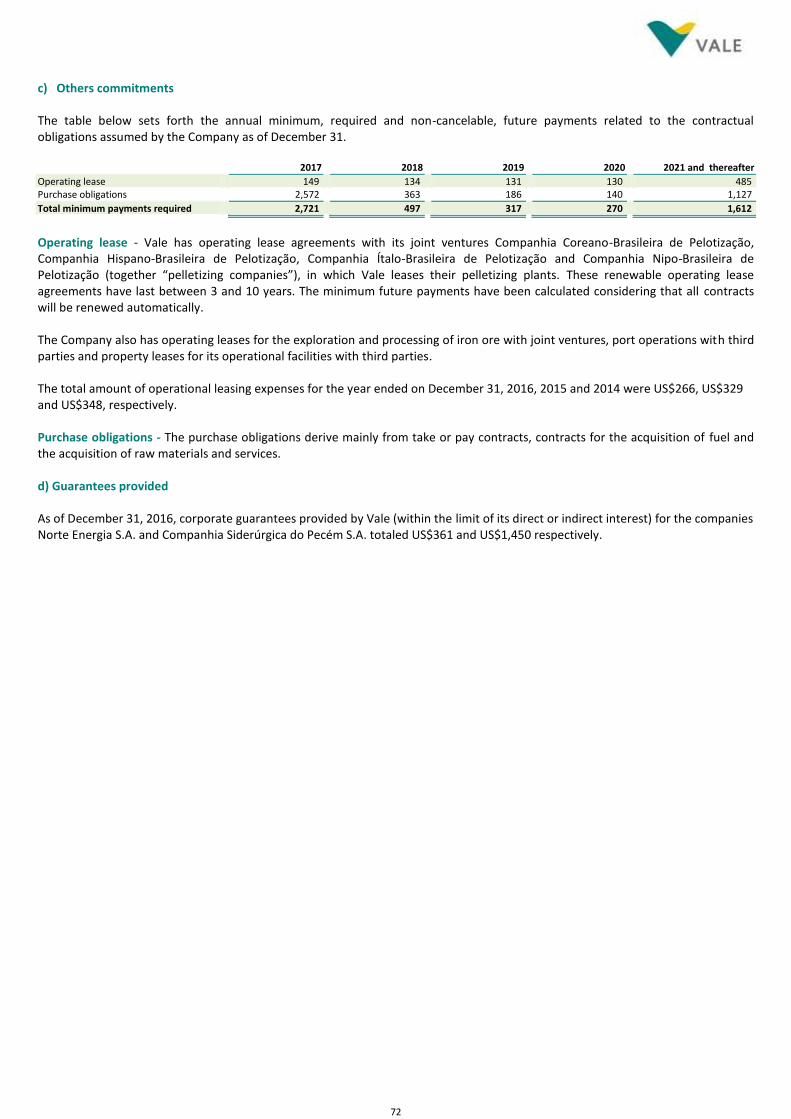
72
c) Others commitments The table below sets forth the annual minimum, required and non-cancelable, future payments related to the contractual obligations assumed by the Company as of December 31.
2017 2018 2019 2020 2021 and thereafter
Operating lease 149 134 131 130 485 Purchase obligations 2,572 363 186 140 1,127
Total minimum payments required 2,721 497 317 270 1,612
Operating lease - Vale has operating lease agreements with its joint ventures Companhia Coreano-Brasileira de Pelotização, Companhia Hispano-Brasileira de Pelotização, Companhia Ítalo-Brasileira de Pelotização and Companhia Nipo-Brasileira de Pelotização (together “pelletizing companies”), in which Vale leases their pelletizing plants. These renewable operating lease agreements have last between 3 and 10 years. The minimum future payments have been calculated considering that all contracts will be renewed automatically. The Company also has operating leases for the exploration and processing of iron ore with joint ventures, port operations with third parties and property leases for its operational facilities with third parties. The total amount of operational leasing expenses for the year ended on December 31, 2016, 2015 and 2014 were US$266, US$329 and US$348, respectively. Purchase obligations - The purchase obligations derive mainly from take or pay contracts, contracts for the acquisition of fuel and the acquisition of raw materials and services. d) Guarantees provided As of December 31, 2016, corporate guarantees provided by Vale (within the limit of its direct or indirect interest) for the companies Norte Energia S.A. and Companhia Siderúrgica do Pecém S.A. totaled US$361 and US$1,450 respectively.
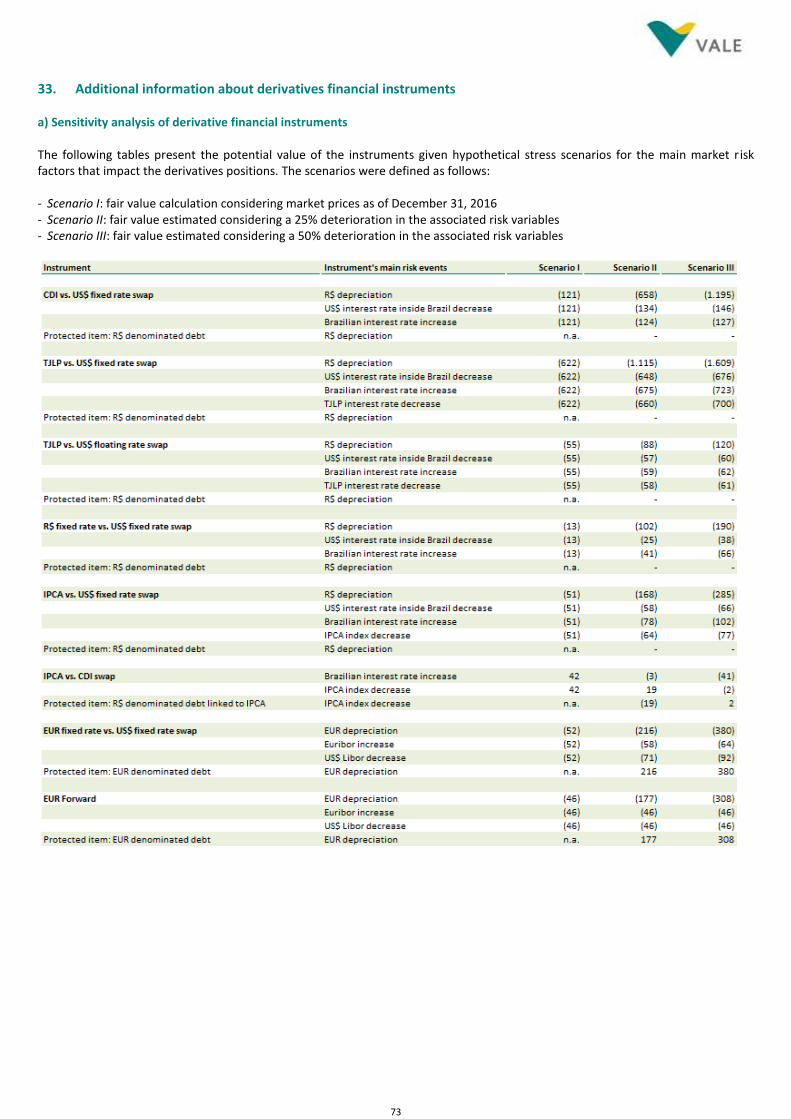
73
33. Additional information about derivatives financial instruments a) Sensitivity analysis of derivative financial instruments The following tables present the potential value of the instruments given hypothetical stress scenarios for the main market risk factors that impact the derivatives positions. The scenarios were defined as follows: - Scenario I: fair value calculation considering market prices as of December 31, 2016 - Scenario II: fair value estimated considering a 25% deterioration in the associated risk variables - Scenario III: fair value estimated considering a 50% deterioration in the associated risk variables
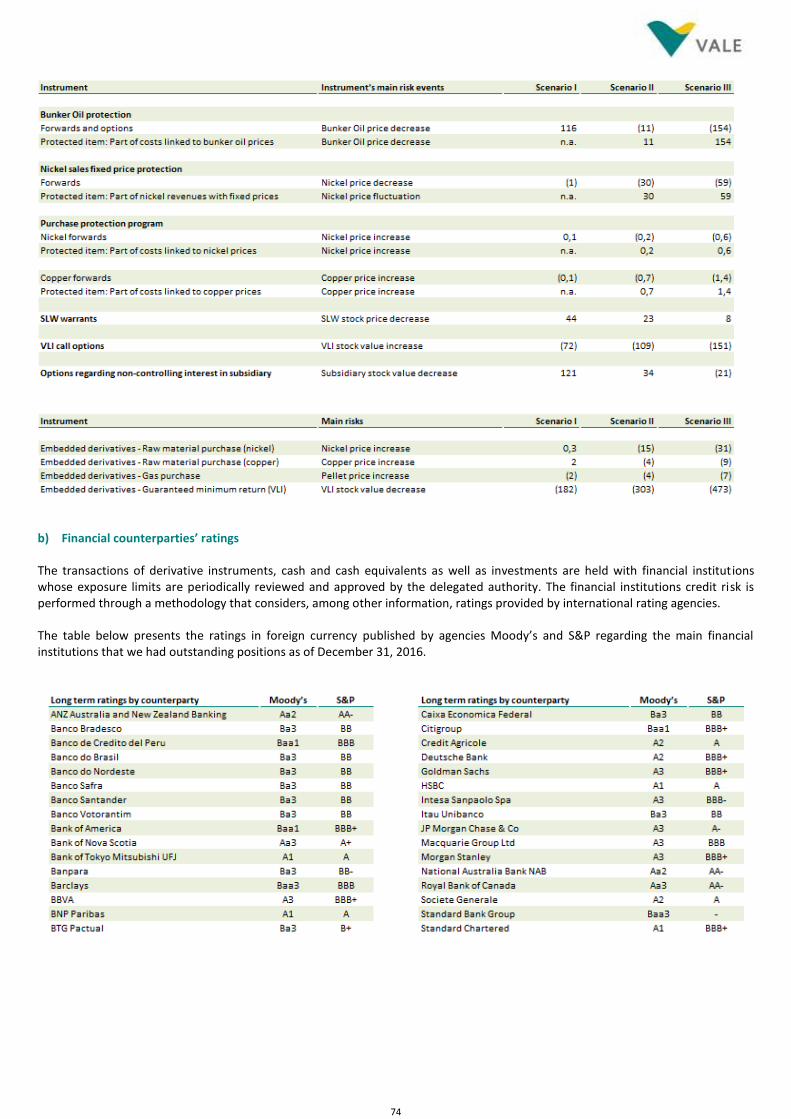
74
b) Financial counterparties’ ratings The transactions of derivative instruments, cash and cash equivalents as well as investments are held with financial institutions whose exposure limits are periodically reviewed and approved by the delegated authority. The financial institutions credit risk is performed through a methodology that considers, among other information, ratings provided by international rating agencies. The table below presents the ratings in foreign currency published by agencies Moody’s and S&P regarding the main financial institutions that we had outstanding positions as of December 31, 2016.
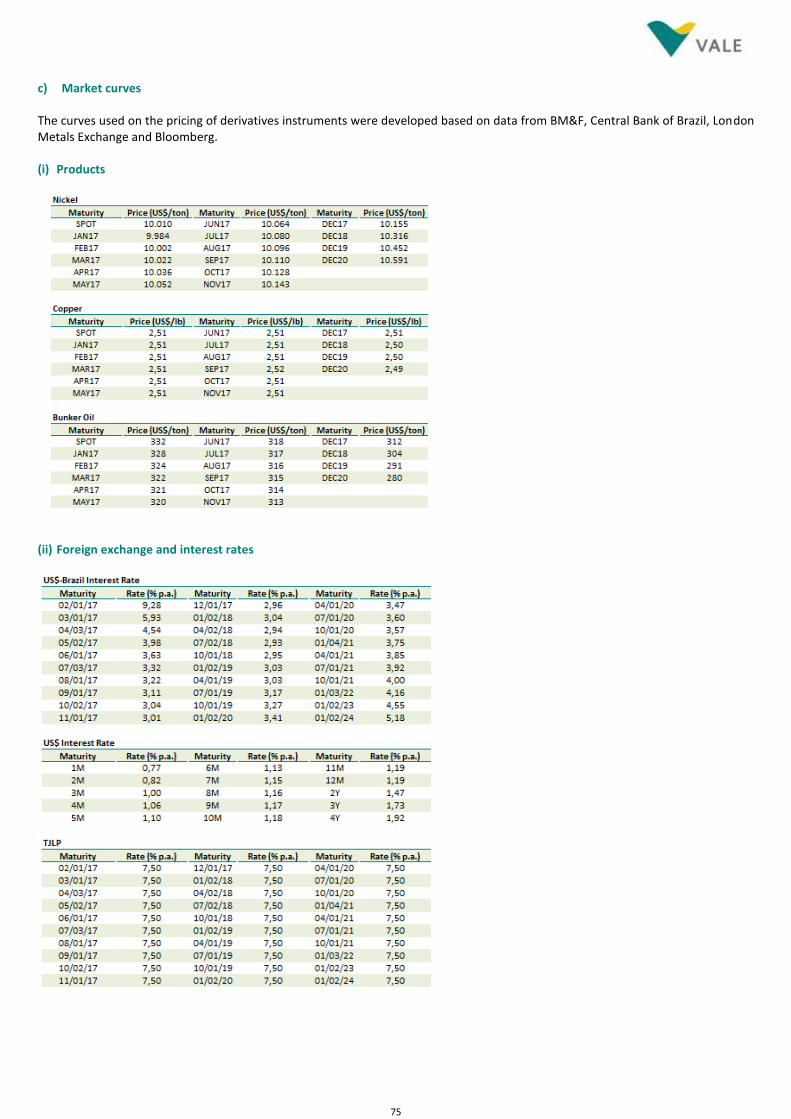
75
c) Market curves The curves used on the pricing of derivatives instruments were developed based on data from BM&F, Central Bank of Brazil, London Metals Exchange and Bloomberg. (i) Products
(ii) Foreign exchange and interest rates
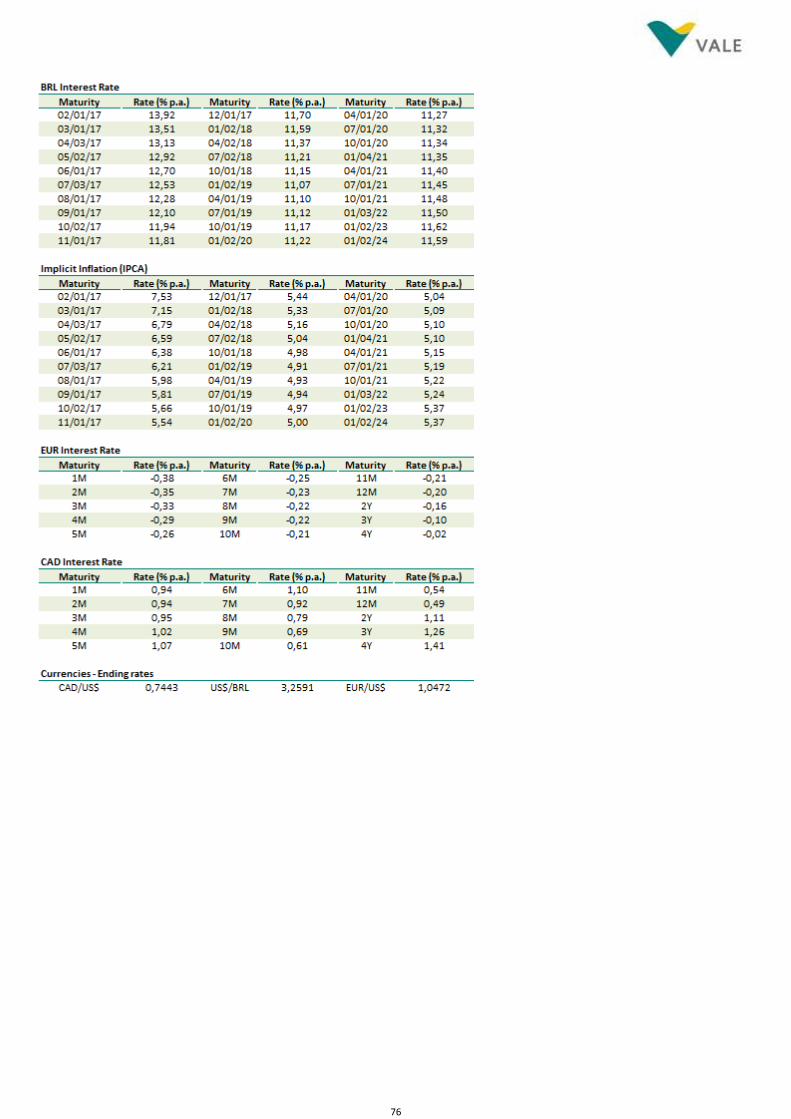
76
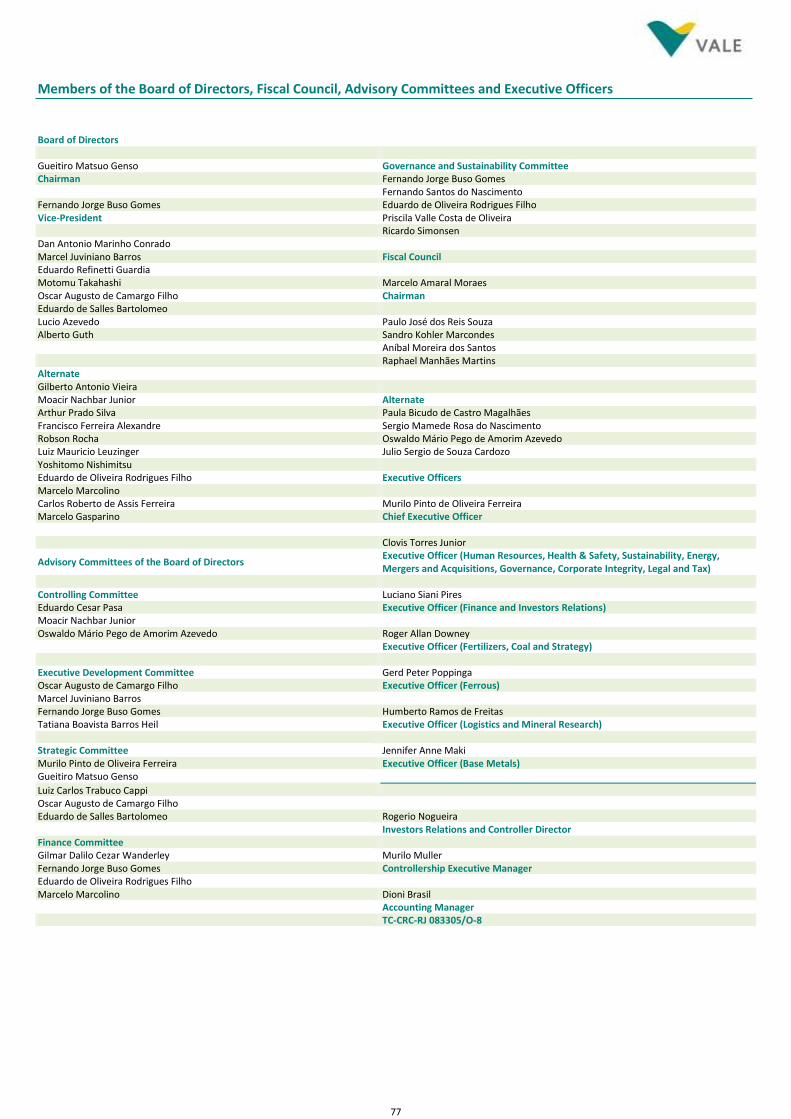
77
Members of the Board of Directors, Fiscal Council, Advisory Committees and Executive Officers
Board of Directors Gueitiro Matsuo Genso Governance and Sustainability Committee Chairman Fernando Jorge Buso Gomes Fernando Santos do Nascimento Fernando Jorge Buso Gomes Eduardo de Oliveira Rodrigues Filho Vice-President Priscila Valle Costa de Oliveira Ricardo Simonsen Dan Antonio Marinho Conrado Marcel Juviniano Barros Fiscal Council Eduardo Refinetti Guardia Motomu Takahashi Marcelo Amaral Moraes Oscar Augusto de Camargo Filho Chairman Eduardo de Salles Bartolomeo Lucio Azevedo Paulo José dos Reis Souza Alberto Guth Sandro Kohler Marcondes Aníbal Moreira dos Santos Raphael Manhães Martins Alternate Gilberto Antonio Vieira Moacir Nachbar Junior Alternate Arthur Prado Silva Paula Bicudo de Castro Magalhães Francisco Ferreira Alexandre Sergio Mamede Rosa do Nascimento Robson Rocha Oswaldo Mário Pego de Amorim Azevedo Luiz Mauricio Leuzinger Julio Sergio de Souza Cardozo Yoshitomo Nishimitsu Eduardo de Oliveira Rodrigues Filho Executive Officers Marcelo Marcolino Carlos Roberto de Assis Ferreira Murilo Pinto de Oliveira Ferreira Marcelo Gasparino Chief Executive Officer Clovis Torres Junior
Advisory Committees of the Board of Directors Executive Officer (Human Resources, Health & Safety, Sustainability, Energy, Mergers and Acquisitions, Governance, Corporate Integrity, Legal and Tax)
Controlling Committee Luciano Siani Pires Eduardo Cesar Pasa Executive Officer (Finance and Investors Relations) Moacir Nachbar Junior Oswaldo Mário Pego de Amorim Azevedo Roger Allan Downey Executive Officer (Fertilizers, Coal and Strategy) Executive Development Committee Gerd Peter Poppinga Oscar Augusto de Camargo Filho Executive Officer (Ferrous) Marcel Juviniano Barros Fernando Jorge Buso Gomes Humberto Ramos de Freitas Tatiana Boavista Barros Heil Executive Officer (Logistics and Mineral Research) Strategic Committee Jennifer Anne Maki Murilo Pinto de Oliveira Ferreira Executive Officer (Base Metals) Gueitiro Matsuo Genso
Luiz Carlos Trabuco Cappi Oscar Augusto de Camargo Filho Eduardo de Salles Bartolomeo Rogerio Nogueira Investors Relations and Controller Director Finance Committee Gilmar Dalilo Cezar Wanderley Murilo Muller Fernando Jorge Buso Gomes Controllership Executive Manager Eduardo de Oliveira Rodrigues Filho Marcelo Marcolino Dioni Brasil Accounting Manager TC-CRC-RJ 083305/O-8