Embed Size (px)
Citation preview
FINANCIAL STATEMENTS Q1 2019 29/05/2019
FINANCIAL STATEMENTS Q1 2019
2
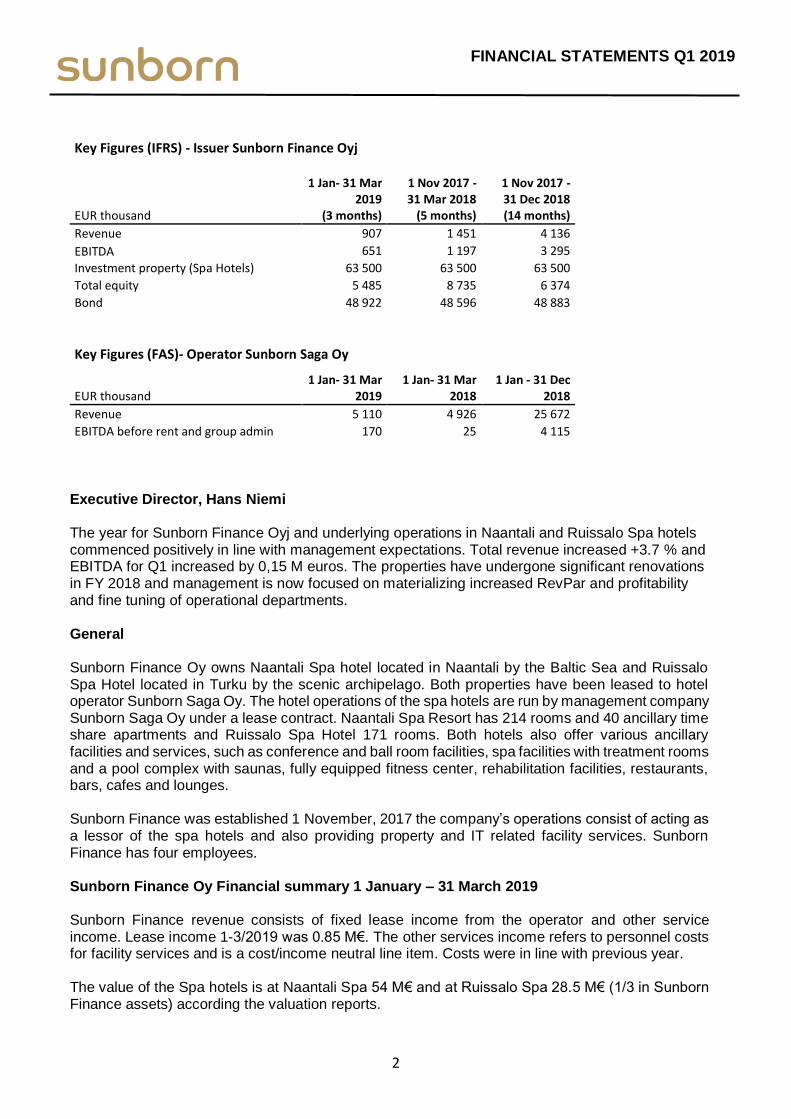
Key Figures (IFRS) - Issuer Sunborn Finance Oyj
EUR thousand
1 Jan- 31 Mar 2019
(3 months)
1 Nov 2017 - 31 Mar 2018
(5 months)
1 Nov 2017 - 31 Dec 2018 (14 months)
Revenue 907 1 451 4 136
EBITDA 651 1 197 3 295
Investment property (Spa Hotels) 63 500 63 500 63 500
Total equity 5 485 8 735 6 374
Bond 48 922 48 596 48 883
Key Figures (FAS)- Operator Sunborn Saga Oy
EUR thousand 1 Jan- 31 Mar
2019 1 Jan- 31 Mar
2018 1 Jan - 31 Dec
2018
Revenue 5 110 4 926 25 672
EBITDA before rent and group admin 170 25 4 115
Executive Director, Hans Niemi The year for Sunborn Finance Oyj and underlying operations in Naantali and Ruissalo Spa hotels commenced positively in line with management expectations. Total revenue increased +3.7 % and EBITDA for Q1 increased by 0,15 M euros. The properties have undergone significant renovations in FY 2018 and management is now focused on materializing increased RevPar and profitability and fine tuning of operational departments. General Sunborn Finance Oy owns Naantali Spa hotel located in Naantali by the Baltic Sea and Ruissalo Spa Hotel located in Turku by the scenic archipelago. Both properties have been leased to hotel operator Sunborn Saga Oy. The hotel operations of the spa hotels are run by management company Sunborn Saga Oy under a lease contract. Naantali Spa Resort has 214 rooms and 40 ancillary time share apartments and Ruissalo Spa Hotel 171 rooms. Both hotels also offer various ancillary facilities and services, such as conference and ball room facilities, spa facilities with treatment rooms and a pool complex with saunas, fully equipped fitness center, rehabilitation facilities, restaurants, bars, cafes and lounges. Sunborn Finance was established 1 November, 2017 the company’s operations consist of acting as a lessor of the spa hotels and also providing property and IT related facility services. Sunborn Finance has four employees. Sunborn Finance Oy Financial summary 1 January – 31 March 2019 Sunborn Finance revenue consists of fixed lease income from the operator and other service income. Lease income 1-3/2019 was 0.85 M€. The other services income refers to personnel costs for facility services and is a cost/income neutral line item. Costs were in line with previous year. The value of the Spa hotels is at Naantali Spa 54 M€ and at Ruissalo Spa 28.5 M€ (1/3 in Sunborn Finance assets) according the valuation reports.
FINANCIAL STATEMENTS Q1 2019
3
Sunborn Saga Oy Financial summary 1 January – 31 March 2019 Turnover 1-3/2019 vs 1-3/2018 was 5,1 M€ (4,9 M€), +4% increase. Room capacity in Naantali Spa was lower in Q1 vs Q1/2018 due to unexpected delays in material supplies and contractors warranty repairs. In January the capacity was 30 rooms lower per day in the respective month in 2018. After the renovations were finished in February and March all kpis showed positive development. In February and March revPAR growth was +4%. Corporate segment demand continued at a lower level whereas leisure segment started to grow especially in February and March. F&B sales increased in comparison to 2018, whereas treatments and rehabitation sales decreased due to lower demand. Leisure and corporate room revenue in Ruissalo Spa increased magnificiently, +7% in Q1 2019. Specially FIT leisure clients increased by 15% in comparison to 2018. Growth in rehab and health care segment revenue in Ruissalo was 10%. OCC-% in Ruissalo increased by 15%. OCC % in Naantali is not comparable due to room renovations. Eastern period in March and weekends in general were successful in Q1 in both properties, whereas demand on weekdays was lower in whole market area. Unfortunately Naantali did not have total capacity to offer on peek days in January when the demand was higher on Fridays and Saturdays.
Refurbishment and renovation Q1 sales in Naantali Spa as expected was influenced by the room renovations impacting on the amount of total visitors and capacity. Due to delays and problems in material supplies the renovations program was behind schedule and works continued in January and in March. A refurbishment of a number of suites will be undertaken during Q2 2019. Renovations will also continue in 2019 in the public areas eg. in the lobby, but these projects are expected to have little impact in room sales and revenue. Feedback concerning the renovated rooms has been excellent and customer satisfaction figures and NPS score have increased significantly. Management expects and has budgeted for increases in ADR and revenue for 2019 as a result of the completed works. The work for the new strategy of the company for 2019-2021 was finalized in Q1 and launched to supervisors in March. Implementation to whole personnel will take place in Q2. Sunborn Saga focuses on improving customer experience in form of new products and better service. Strategic growth organically is one of the key targets. Naantali Spa seeks growth by increasing the number of foreign visitors especially from Scandinavia, Russia and Asia and by attracting more corporate clients, whereas Ruissalo Spa will increase business in the rehabilitation segment. The long-term continued success of the company is enabled by committed employees. The financial target is to reach a higher than five per cent annual average organic net sales growth and comparable EBIT of higher than 10 per cent of net sales.
Notable events during and after the end of the reporting period
The issuer completed the listing of the Senior Secured Floating Rate Bond to Nasdaq Helsinki on 8 February, 2019. Business environment
FINANCIAL STATEMENTS Q1 2019
4
No notable changes in the business environment. Issuer is a SPV with no other purpose than owning the Naantali and Ruissalo spa hotel properties. The hotels are leased out to Sunborn Saga Oy through a lease agreement. Sunborn Saga Oy pays Sunborn Finance Oy a fixed sum of 281 600 € per month in lease. Guest satisfaction continues to be good in Naantali reflected by Booking.com rating of 8.0/10, Hotels.com rating of 8.2/10, Expedia.com 4.1/5 and in Ruissalo by Booking.com rating of 7.8/10, Hotels.com rating of 7.8/10, Expedia.com 3.7/5. Estimated future development The company estimates that its financial performance and debt service capacity will remain stable. Short-term risks and uncertainties The Company´s financial risks related to business are market risk (including interest rate risk), credit risk, liquidity risk and refinancing risk. Floating interest rate risk has not been hedged. Financial risk management carried out by the management of the Company aims to protect the Company against unfavorable developments in the financial markets and ensure the performance. The management review financial risks on regular basis to manage financial risk position and decide on necessary actions.
FINANCIAL STATEMENTS Q1 2019
5
Sunborn Finance Oyj
INTERIM REPORT 1 January - 31 March 2019
FINANCIAL STATEMENTS Q1 2019
6
CONTENTS
CONTENTS ............................................................................................................................. 6
CONSOLIDATED STATEMENT OF COMPREHENSIVE INCOME (IFRS) .......................................... 7
CONSOLIDATED BALANCE SHEET (IFRS) .................................................................................. 8
CONSOLIDATED STATEMENT OF CHANGES IN EQUITY (IFRS) ................................................... 9
CONSOLIDATED STATEMENT OF CASH FLOWS (IFRS) ............................................................ 10
NOTES TO THE FINANCIAL STATEMENTS (IFRS) ..................................................................... 11
1. General information ................................................................................................ 11
2. Summary of significant accounting policies ............................................................. 11
3. Critical accounting estimates and management judgement ..................................... 12
4. Revenue ................................................................................................................... 13
5. Investment property ................................................................................................ 14
6. Borrowings............................................................................................................... 14
7. Transactions with related parties ............................................................................. 15
8. Subsequent events .................................................................................................... 16
Appendix 1 SUNBORN SAGA (FAS) ....................................................................................... 17

FINANCIAL STATEMENTS Q1 2019
7
CONSOLIDATED STATEMENT OF COMPREHENSIVE INCOME (IFRS)
EUR thousand Note
1 Jan - 31 Mar
2019
1 Nov 2017 -
31 Mar 2018
1 Nov 2017 -
31 Dec 2018
Revenue 3 907 1 451 4 136
Changes in fair value of investment property 4 -1 101 - -2909 Personnel expenses -60 -76 -319 Operating expenses -195 -177 -523
Operating profit -450 1 197 386
Interest expenses on borrowings -662 -2 408 -4 548
Profit before taxes -1 111 -1 211 -4 162
Change in deferred tax 222 242 832
Result for the period -889 -969 -3 330
The above statement of comprehensive income should be read in conjunction with the accompanying notes.
FINANCIAL STATEMENTS Q1 2019
8
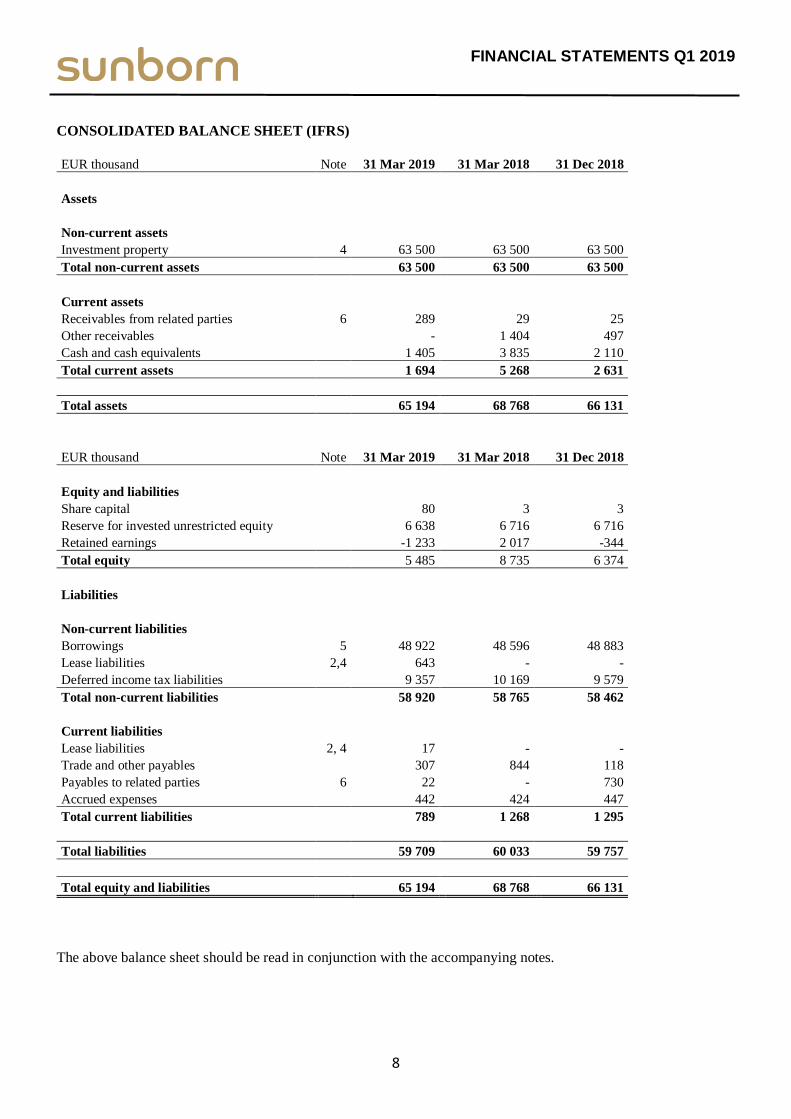
CONSOLIDATED BALANCE SHEET (IFRS)
EUR thousand Note 31 Mar 2019 31 Mar 2018 31 Dec 2018
Assets
Non-current assets Investment property 4 63 500 63 500 63 500
Total non-current assets 63 500 63 500 63 500
Current assets Receivables from related parties 6 289 29 25
Other receivables - 1 404 497
Cash and cash equivalents 1 405 3 835 2 110
Total current assets 1 694 5 268 2 631
Total assets 65 194 68 768 66 131
EUR thousand Note 31 Mar 2019 31 Mar 2018 31 Dec 2018
Equity and liabilities Share capital 80 3 3
Reserve for invested unrestricted equity 6 638 6 716 6 716
Retained earnings -1 233 2 017 -344
Total equity 5 485 8 735 6 374
Liabilities
Non-current liabilities Borrowings 5 48 922 48 596 48 883
Lease liabilities 2,4 643 - -
Deferred income tax liabilities 9 357 10 169 9 579
Total non-current liabilities 58 920 58 765 58 462
Current liabilities Lease liabilities 2, 4 17 - -
Trade and other payables 307 844 118
Payables to related parties 6 22 - 730
Accrued expenses 442 424 447
Total current liabilities 789 1 268 1 295
Total liabilities 59 709 60 033 59 757
Total equity and liabilities 65 194 68 768 66 131
The above balance sheet should be read in conjunction with the accompanying notes.
FINANCIAL STATEMENTS Q1 2019
9
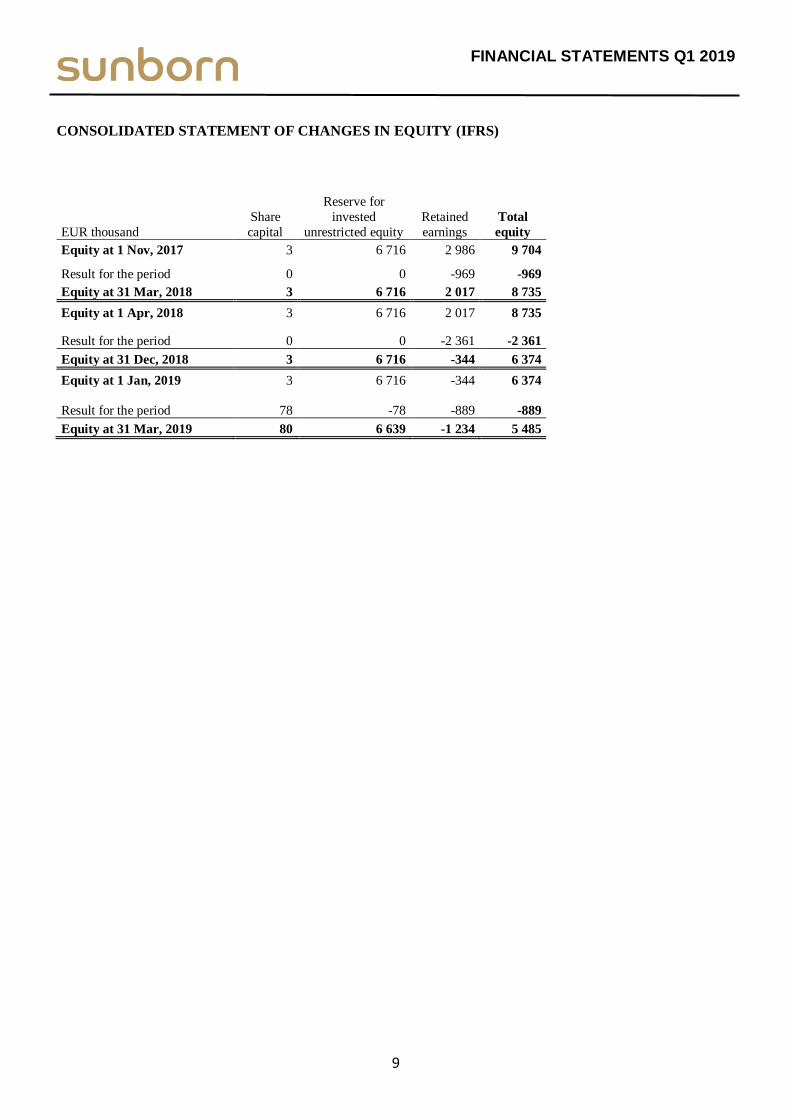
CONSOLIDATED STATEMENT OF CHANGES IN EQUITY (IFRS)
EUR thousand
Share
capital
Reserve for
invested
unrestricted equity
Retained
earnings
Total
equity
Equity at 1 Nov, 2017 3 6 716 2 986 9 704
Result for the period 0 0 -969 -969
Equity at 31 Mar, 2018 3 6 716 2 017 8 735
Equity at 1 Apr, 2018 3 6 716 2 017 8 735
Result for the period 0 0 -2 361 -2 361
Equity at 31 Dec, 2018 3 6 716 -344 6 374
Equity at 1 Jan, 2019 3 6 716 -344 6 374
Result for the period 78 -78 -889 -889
Equity at 31 Mar, 2019 80 6 639 -1 234 5 485

FINANCIAL STATEMENTS Q1 2019
10
CONSOLIDATED STATEMENT OF CASH FLOWS (IFRS)
EUR thousand Note
1 Jan -
31 March 2019
1 Nov 2017 -
31 March 2018
1 Nov 2017 -
31 Dec 2018
Cash flows from operating activities
Result before tax -1 111 -1 211 -4 162
Adjustments for
Change in fair value of investment property 4 1 101 0 2 909
Interest expenses on borrowings 662 2 408 4 548
Change of working capital
Change in trade and other receivables 233 -832 79
Change in trade and other payables -504 -4 11
Net cash flows from operating activities 380 362 3 384
Cash used in investing activities
Capital Expenditure 4 -451 0 -2 909
Net cash flows used in investing activities -451 0 -2 909
Cash flows from financing activities
Proceeds from borrowings - 50 000 50 000
Repayment of borrowings from parent company - -44 028 -44 028
Transaction costs paid - -2 648 -2 648
Interest paid -633 -1 179 -3 018
Net cash flows from financing activities -633 2 146 306
Cash and cash equivalents at the beginning of period 2 110 1 328 1 328
Change in cash and cash equivalents -705 2 507 782
Cash and cash equivalents at the end of period 1 405 3 835 2 110
FINANCIAL STATEMENTS Q1 2019
11
NOTES TO THE FINANCIAL STATEMENTS (IFRS)
1. General information
Sunborn Finance Oyj is a public limited liability company (“the Company”) incorporated in Finland. The registered
address of Sunborn Finance Oyj is Juhana Herttuan puistokatu 23, Turku, Finland. Sunborn Finance Oyj was
established on November 1, 2017 through a partial demerger of Sunborn Oy. Sunborn Finance owns spa hotel
“Naantali Spa” and approximately 30% of the “Ruissalo Spa” (together “hotels”) properties located in south west
Finland. Naantali Spa has 218 and Ruissalo Spa 171 hotel rooms with several event rooms, restaurants, bars, café’s
and lounges, spa facilities, pools and fitness centre. The Company was established for purpose of owning the hotels.
The hotel operations of the spa hotels Naantali Spa and Ruissalo Spa, (together “Spa hotels”), are operated by
Sunborn Saga Oy (“Sunborn Saga”), a subsidiary of Sunborn Oy, in accordance with a lease contract between
Sunborn Finance and Sunborn Saga. Sunborn Finance provides also property management and IT support services and has four employees. Two of these employees were transferred to the Company in connection with the partial
demerger and two were transferred from Sunborn Saga at the beginning of the year 2018.
Sunborn Finance is wholly owned by Pekka Niemi, Ritva Niemi, Hans Niemi and Jari Niemi (together, the “Niemi
Family”). The Niemi Family also controls the Sunborn Group, Sunborn Oy being the parent company of the Group.
Sunborn Group’s focus is on the development of luxury spa and yacht hotels, restaurants and other high-quality
property in the hospitality sector. Sunborn Group currently has operations in Finland, Denmark, UK, Germany,
Spain, Malaysia and Gibraltar, and operates under several individual brands. Sunborn Saga’s operations consist of
hotel, spa and restaurant operations in the Spa hotels and in other restaurants.
As at 27 December 2018 Sunborn Finance Oy acquired dormant subsidiary for administrative purposes thus became
the parent company of the group.
The financial information presented in interim financial statements for the 3-month period ended March 31, 2019
and 5-month period ended March 31, 2018 are based on actual figures of Sunborn Finance Oyj (“the Company”) as
an independent company after the consummation of the demerger as at November 1, 2017.
These interim financial statements are unaudited.
2. Summary of significant accounting policies
Basis of preparation
This condensed interim financial report for three months ended March 31, 2019 have been prepared in accordance
with International Financial Reporting Standards (IFRS) and IAS 34 interim Financial Reporting, as adopted by the
European Union.
The condensed interim year financial report does not include all the information and notes that are presented in the
annual financial statements.
The accounting policies and measurement principles remain unchanged in comparison with as has been presented in
Note 2 in the Annual Report 2018, except for the adoption of IFRS 16 Leases as set out below.
The financial statements are presented in thousands of euros unless otherwise stated. All figures presented have been
rounded and consequently the sum of individual figures may deviate from the presented sum figure.
FINANCIAL STATEMENTS Q1 2019
12
IFRS 16 Leases
On January 1, 2019, Sunborn Finance Oyj adopted IFRS 16, “Leases”. The Company applied the modified
retrospective approach and did not restate comparative figures for prior periods. IFRS 16 defines the recognition,
measurement, presentation and disclosure requirements on leases.
The standard introduces a single lessee accounting model requiring lessees to recognize assets and liabilities for all
leases, unless the lease term is 12 months or less, or the underlying asset has a low value.
Lessor accounting remains largely unchanged from IAS 17.
Sunborn Finance as Lessor
Currently, the Group leases the Naantali Spa and Ruissalo Spa hotels to Sunborn Saga, which is a related party of
the Group. The management has assessed that the adoption of IFRS 16 will not have material impact on lessor
accounting, the contracts will continue to be accounted for as operating lease.
Sunborn Finance as Lessee
The Group only has lease contracts related to land and water areas from the city of Naantali which are impacted by
the adoption of IFRS 16. The leases of land and water area will end in 2055 and 2035 respectively. On adoption of
IFRS 16, the Company recognised a lease liability in relation to these leases.
These liabilities are measured initially at the present value of the remaining lease payments, discounted using the
lessee’s incremental borrowing rate as of 1 January 2019. Due to the similar characteristics of these two leases, the
Group used a single discount rate of 6,34 % to discount the future cash flows, based on management estimation. The
associated right of use asset is presented as investment property and is at 1 January 2019 initially recognised at the
amount equal to the lease liability. Subsequently, the right of use assets are measured at fair value in accordance with
the Group’s accounting policy for investment property.
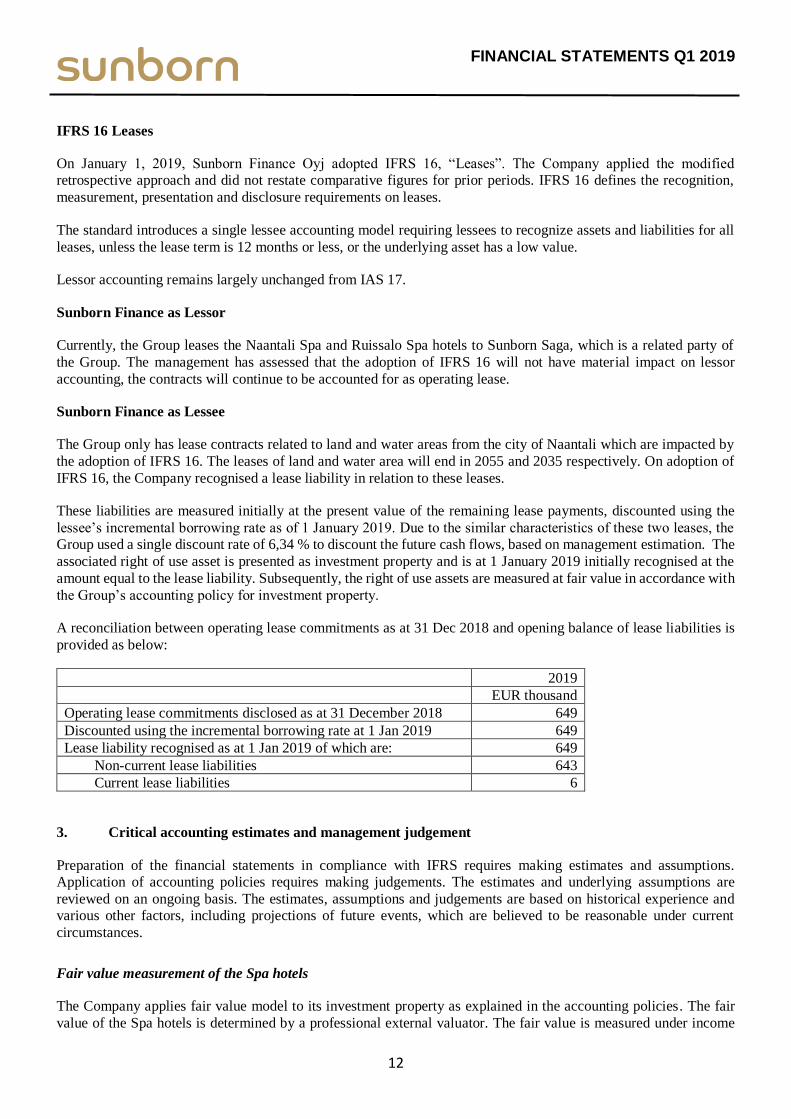
A reconciliation between operating lease commitments as at 31 Dec 2018 and opening balance of lease liabilities is
provided as below:
2019
EUR thousand
Operating lease commitments disclosed as at 31 December 2018 649
Discounted using the incremental borrowing rate at 1 Jan 2019 649
Lease liability recognised as at 1 Jan 2019 of which are: 649
Non-current lease liabilities 643
Current lease liabilities 6
3. Critical accounting estimates and management judgement
Preparation of the financial statements in compliance with IFRS requires making estimates and assumptions.
Application of accounting policies requires making judgements. The estimates and underlying assumptions are
reviewed on an ongoing basis. The estimates, assumptions and judgements are based on historical experience and
various other factors, including projections of future events, which are believed to be reasonable under current
circumstances.
Fair value measurement of the Spa hotels
The Company applies fair value model to its investment property as explained in the accounting policies. The fair
value of the Spa hotels is determined by a professional external valuator. The fair value is measured under income
FINANCIAL STATEMENTS Q1 2019
13
approach and reflects, among other things, rental income from current leases and other assumptions market
participants would make when pricing the property under current market conditions.
In making the valuations, the investment property is considered in its highest and best use. The fair value of the new
part of the Ruissalo Spa is based on the fair value of the property as a whole and has been separated from the total
fair value of the Ruissalo Spa based on management estimation which is based on the relative surface areas of the
new part and the old part. The management estimation has also been supported by independent valuator.
Fair valuations are divided to levels 1-3 in fair value hierarchy depending on to what extent the value is based on
observable inputs. Fair values of the group’s investment property are classified in level 3, because the inputs in the
valuation models are based on unobservable information. There have not been any changes in the inputs or the
relevant market during the periods presented. Accordingly, there have not been any material changes to the fair values
of the spa hotels.
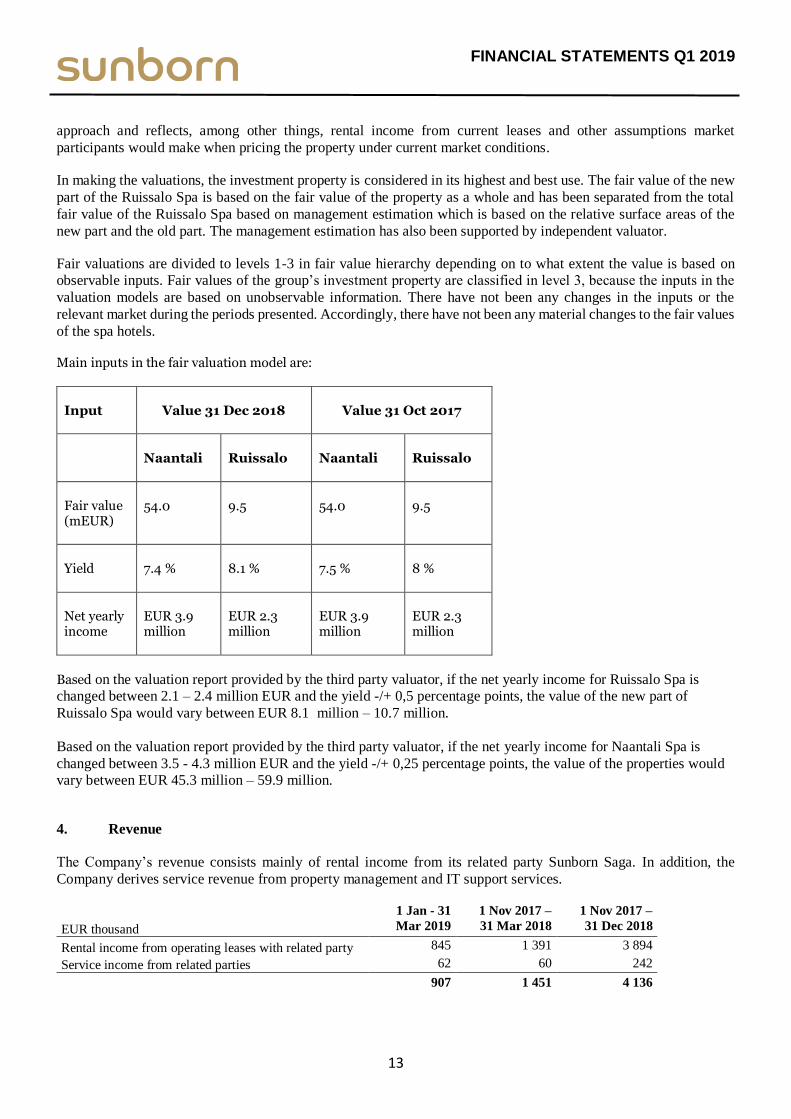
Main inputs in the fair valuation model are:
Input Value 31 Dec 2018 Value 31 Oct 2017
Naantali Ruissalo Naantali Ruissalo
Fair value (mEUR)
54.0 9.5 54.0 9.5
Yield 7.4 % 8.1 % 7.5 % 8 %
Net yearly income
EUR 3.9 million
EUR 2.3 million
EUR 3.9 million
EUR 2.3 million
Based on the valuation report provided by the third party valuator, if the net yearly income for Ruissalo Spa is
changed between 2.1 – 2.4 million EUR and the yield -/+ 0,5 percentage points, the value of the new part of
Ruissalo Spa would vary between EUR 8.1 million – 10.7 million.
Based on the valuation report provided by the third party valuator, if the net yearly income for Naantali Spa is
changed between 3.5 - 4.3 million EUR and the yield -/+ 0,25 percentage points, the value of the properties would vary between EUR 45.3 million – 59.9 million.
4. Revenue
The Company’s revenue consists mainly of rental income from its related party Sunborn Saga. In addition, the
Company derives service revenue from property management and IT support services.
EUR thousand
1 Jan - 31
Mar 2019
1 Nov 2017 –
31 Mar 2018
1 Nov 2017 –
31 Dec 2018
Rental income from operating leases with related party 845 1 391 3 894
Service income from related parties 62 60 242
907 1 451 4 136
FINANCIAL STATEMENTS Q1 2019
14
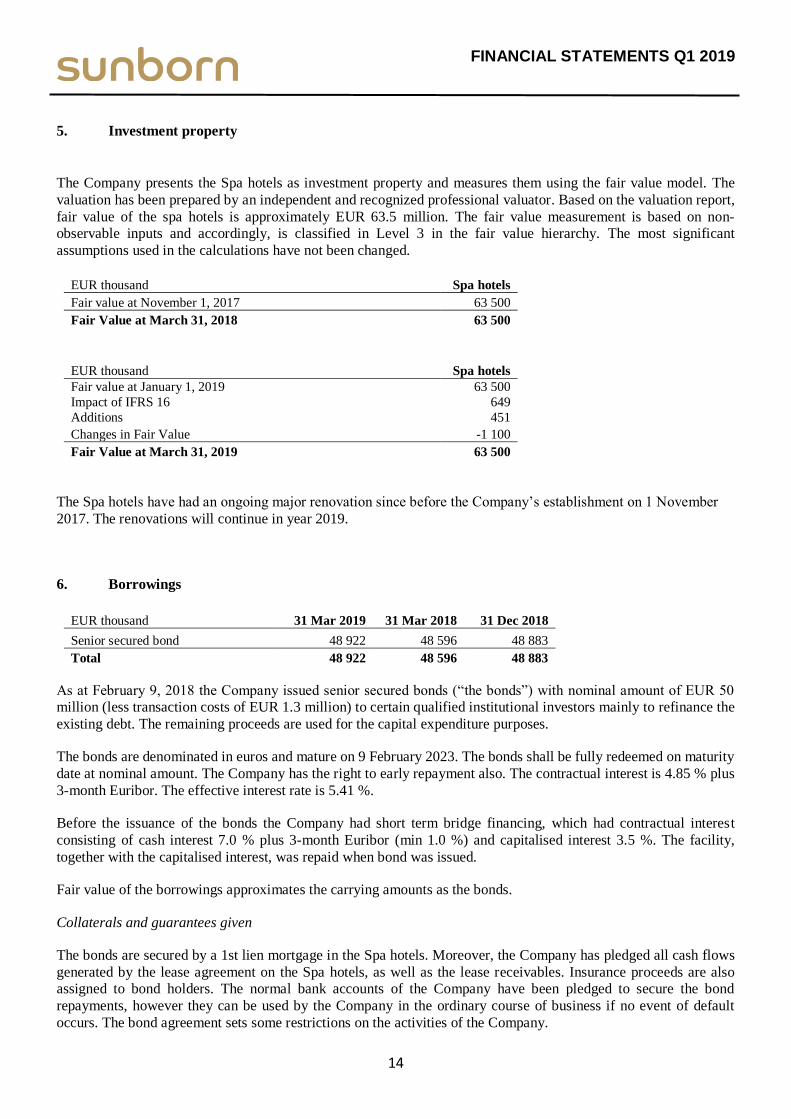
5. Investment property
The Company presents the Spa hotels as investment property and measures them using the fair value model. The
valuation has been prepared by an independent and recognized professional valuator. Based on the valuation report,
fair value of the spa hotels is approximately EUR 63.5 million. The fair value measurement is based on non-
observable inputs and accordingly, is classified in Level 3 in the fair value hierarchy. The most significant
assumptions used in the calculations have not been changed.
EUR thousand
Spa hotels
Fair value at November 1, 2017 63 500
Fair Value at March 31, 2018 63 500
EUR thousand
Spa hotels
Fair value at January 1, 2019
Impact of IFRS 16
Additions
63 500
649
451
Changes in Fair Value -1 100
Fair Value at March 31, 2019 63 500
The Spa hotels have had an ongoing major renovation since before the Company’s establishment on 1 November
2017. The renovations will continue in year 2019.
6. Borrowings
EUR thousand 31 Mar 2019 31 Mar 2018 31 Dec 2018
Senior secured bond 48 922 48 596 48 883 Total 48 922 48 596 48 883
As at February 9, 2018 the Company issued senior secured bonds (“the bonds”) with nominal amount of EUR 50
million (less transaction costs of EUR 1.3 million) to certain qualified institutional investors mainly to refinance the
existing debt. The remaining proceeds are used for the capital expenditure purposes.
The bonds are denominated in euros and mature on 9 February 2023. The bonds shall be fully redeemed on maturity
date at nominal amount. The Company has the right to early repayment also. The contractual interest is 4.85 % plus
3-month Euribor. The effective interest rate is 5.41 %.
Before the issuance of the bonds the Company had short term bridge financing, which had contractual interest
consisting of cash interest 7.0 % plus 3-month Euribor (min 1.0 %) and capitalised interest 3.5 %. The facility,
together with the capitalised interest, was repaid when bond was issued.
Fair value of the borrowings approximates the carrying amounts as the bonds.
Collaterals and guarantees given
The bonds are secured by a 1st lien mortgage in the Spa hotels. Moreover, the Company has pledged all cash flows
generated by the lease agreement on the Spa hotels, as well as the lease receivables. Insurance proceeds are also
assigned to bond holders. The normal bank accounts of the Company have been pledged to secure the bond
repayments, however they can be used by the Company in the ordinary course of business if no event of default
occurs. The bond agreement sets some restrictions on the activities of the Company.
FINANCIAL STATEMENTS Q1 2019
15
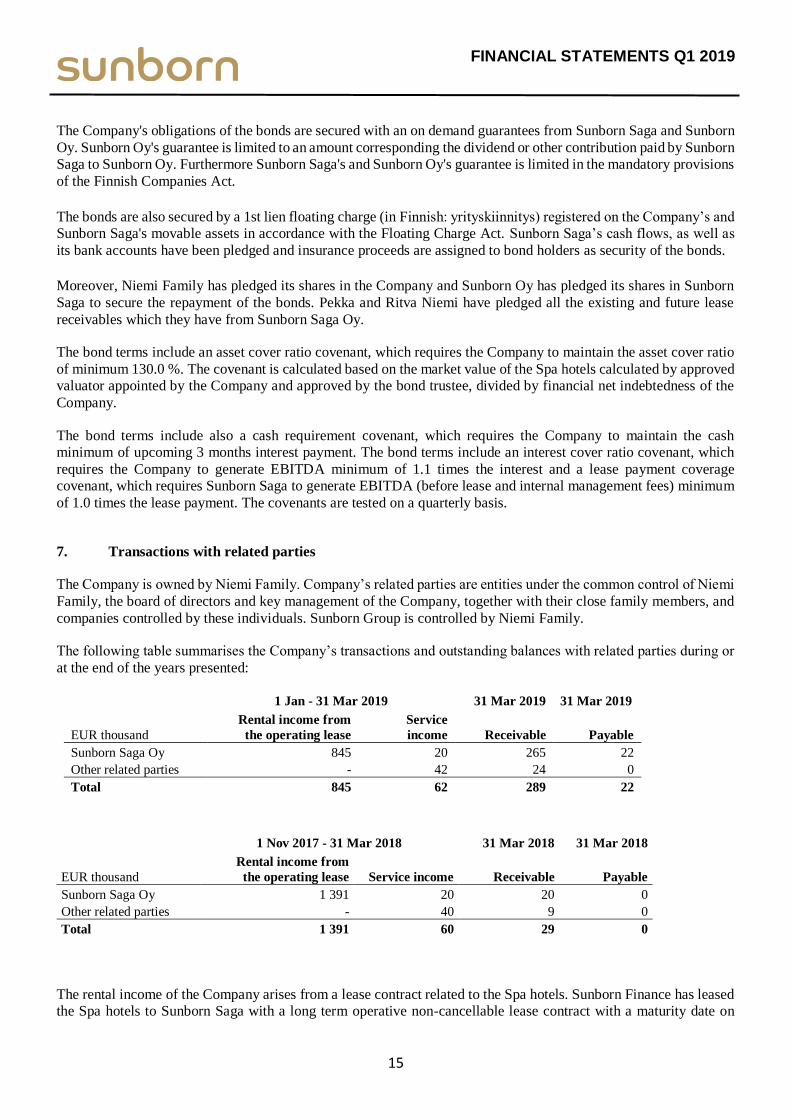
The Company's obligations of the bonds are secured with an on demand guarantees from Sunborn Saga and Sunborn
Oy. Sunborn Oy's guarantee is limited to an amount corresponding the dividend or other contribution paid by Sunborn
Saga to Sunborn Oy. Furthermore Sunborn Saga's and Sunborn Oy's guarantee is limited in the mandatory provisions
of the Finnish Companies Act.
The bonds are also secured by a 1st lien floating charge (in Finnish: yrityskiinnitys) registered on the Company’s and
Sunborn Saga's movable assets in accordance with the Floating Charge Act. Sunborn Saga’s cash flows, as well as
its bank accounts have been pledged and insurance proceeds are assigned to bond holders as security of the bonds.
Moreover, Niemi Family has pledged its shares in the Company and Sunborn Oy has pledged its shares in Sunborn
Saga to secure the repayment of the bonds. Pekka and Ritva Niemi have pledged all the existing and future lease
receivables which they have from Sunborn Saga Oy.
The bond terms include an asset cover ratio covenant, which requires the Company to maintain the asset cover ratio
of minimum 130.0 %. The covenant is calculated based on the market value of the Spa hotels calculated by approved valuator appointed by the Company and approved by the bond trustee, divided by financial net indebtedness of the
Company.
The bond terms include also a cash requirement covenant, which requires the Company to maintain the cash
minimum of upcoming 3 months interest payment. The bond terms include an interest cover ratio covenant, which
requires the Company to generate EBITDA minimum of 1.1 times the interest and a lease payment coverage
covenant, which requires Sunborn Saga to generate EBITDA (before lease and internal management fees) minimum
of 1.0 times the lease payment. The covenants are tested on a quarterly basis.
7. Transactions with related parties
The Company is owned by Niemi Family. Company’s related parties are entities under the common control of Niemi
Family, the board of directors and key management of the Company, together with their close family members, and
companies controlled by these individuals. Sunborn Group is controlled by Niemi Family.
The following table summarises the Company’s transactions and outstanding balances with related parties during or
at the end of the years presented:
1 Jan - 31 Mar 2019 31 Mar 2019 31 Mar 2019
EUR thousand
Rental income from
the operating lease
Service
income Receivable Payable
Sunborn Saga Oy 845 20 265 22
Other related parties - 42 24 0
Total 845 62 289 22
1 Nov 2017 - 31 Mar 2018 31 Mar 2018 31 Mar 2018
EUR thousand
Rental income from
the operating lease Service income Receivable Payable
Sunborn Saga Oy 1 391 20 20 0
Other related parties - 40 9 0
Total 1 391 60 29 0
The rental income of the Company arises from a lease contract related to the Spa hotels. Sunborn Finance has leased
the Spa hotels to Sunborn Saga with a long term operative non-cancellable lease contract with a maturity date on
FINANCIAL STATEMENTS Q1 2019
16
November 1, 2027. A new 10-year lease contract for the Spa hotels was signed between Sunborn Saga and the
Company as at November 1, 2017. The rent in the contracts is set at market level.
The Company has paid management fee to Sunborn Oy as presented in the table above.
Sunborn Saga has guaranteed the senior unsecured bonds of the Company. Detailed information on the guarantee is
given in note 5. Borrowings.
8. Subsequent events
Share capital was increased from reserves of the invested unrestricted equity by EUR 77 500 in January 2019. After
this transaction, the Company’s share capital amounts to EUR 80 thousand.
The Company completed the listing of the Senior Secured Floating Rate Bond to Nasdaq Helsinki on 8th February,
2019.
FINANCIAL STATEMENTS Q1 2019
17
Appendix 1 SUNBORN SAGA (FAS)
Sunborn Saga Oy
INTERIM REPORT 1 January - 31 March 2019
(FAS) Sunborn Saga's interim financial report has been prepared in accordance with the Finnish Accounting Standards
(Finnish Accounting Act and Ordinance and related instructions and statements issued by the Accounting Board
operating under the auspices of the Ministry of Economic Affairs and Employment). For the purposes of this
interim financial information profit and loss statement, balance sheet and cash flow statement of Sunborn Saga
have been presented as required by the terms of the bond issued by Sunborn Finance. Sunborn Saga is the
guarantor of the bond.
FINANCIAL STATEMENTS Q1 2019
18
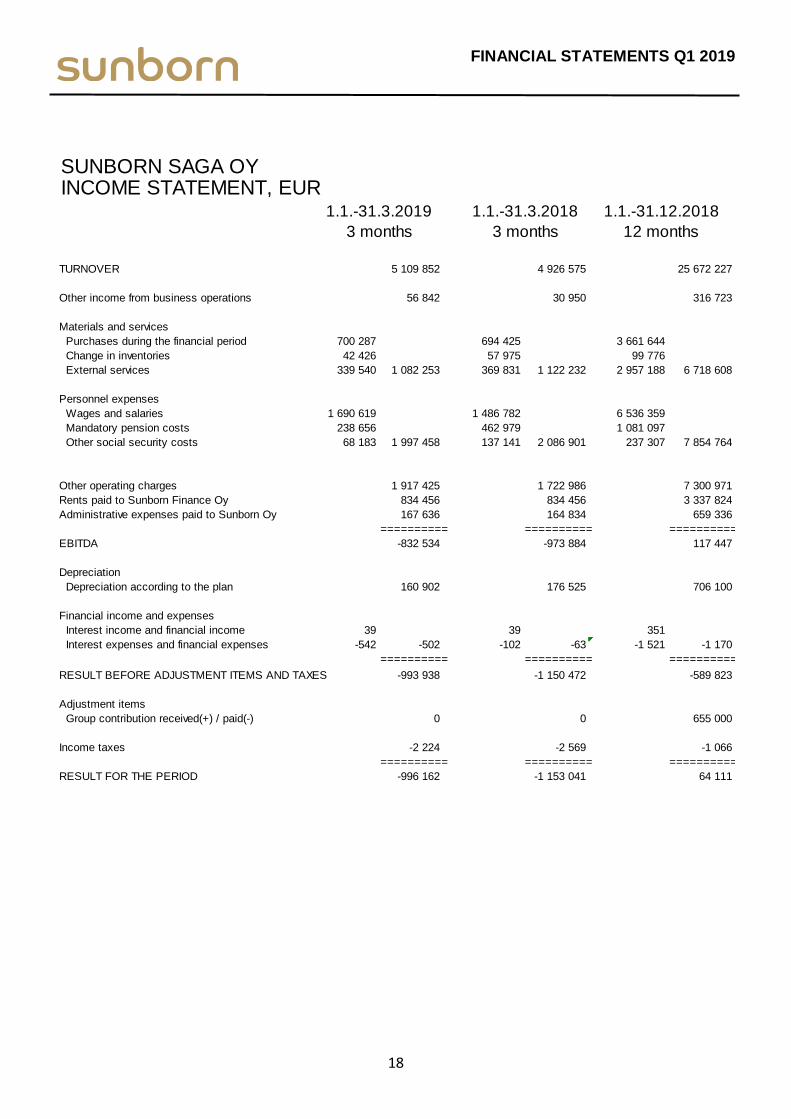
SUNBORN SAGA OYINCOME STATEMENT, EUR
TURNOVER 5 109 852 4 926 575 25 672 227
Other income from business operations 56 842 30 950 316 723
Materials and services
Purchases during the financial period 700 287 694 425 3 661 644
Change in inventories 42 426 57 975 99 776
External services 339 540 1 082 253 369 831 1 122 232 2 957 188 6 718 608
Personnel expenses
Wages and salaries 1 690 619 1 486 782 6 536 359
Mandatory pension costs 238 656 462 979 1 081 097
Other social security costs 68 183 1 997 458 137 141 2 086 901 237 307 7 854 764
Other operating charges 1 917 425 1 722 986 7 300 971
Rents paid to Sunborn Finance Oy 834 456 834 456 3 337 824
Administrative expenses paid to Sunborn Oy 167 636 164 834 659 336
========== ========== ==========
EBITDA -832 534 -973 884 117 447
Depreciation
Depreciation according to the plan 160 902 176 525 706 100
Financial income and expenses
Interest income and financial income 39 39 351
Interest expenses and financial expenses -542 -502 -102 -63 -1 521 -1 170
========== ========== ==========
RESULT BEFORE ADJUSTMENT ITEMS AND TAXES -993 938 -1 150 472 -589 823
Adjustment items
Group contribution received(+) / paid(-) 0 0 655 000
Income taxes -2 224 -2 569 -1 066
========== ========== ==========
RESULT FOR THE PERIOD -996 162 -1 153 041 64 111
1.1.-31.3.2019
3 months
1.1.-31.3.2018
3 months
1.1.-31.12.2018
12 months
FINANCIAL STATEMENTS Q1 2019
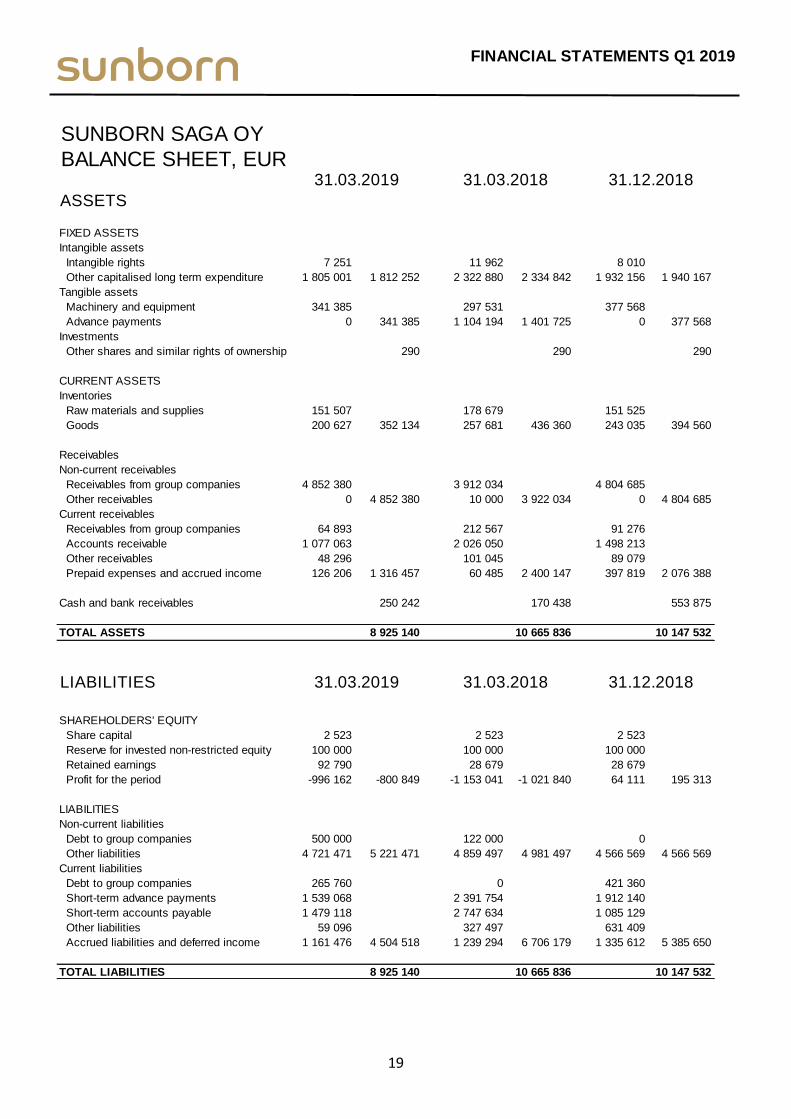
19
SUNBORN SAGA OY
BALANCE SHEET, EUR
ASSETS
FIXED ASSETS
Intangible assets
Intangible rights 7 251 11 962 8 010
Other capitalised long term expenditure 1 805 001 1 812 252 2 322 880 2 334 842 1 932 156 1 940 167
Tangible assets
Machinery and equipment 341 385 297 531 377 568
Advance payments 0 341 385 1 104 194 1 401 725 0 377 568
Investments
Other shares and similar rights of ownership 290 290 290
CURRENT ASSETS
Inventories
Raw materials and supplies 151 507 178 679 151 525
Goods 200 627 352 134 257 681 436 360 243 035 394 560
Receivables
Non-current receivables
Receivables from group companies 4 852 380 3 912 034 4 804 685
Other receivables 0 4 852 380 10 000 3 922 034 0 4 804 685
Current receivables
Receivables from group companies 64 893 212 567 91 276
Accounts receivable 1 077 063 2 026 050 1 498 213
Other receivables 48 296 101 045 89 079
Prepaid expenses and accrued income 126 206 1 316 457 60 485 2 400 147 397 819 2 076 388
Cash and bank receivables 250 242 170 438 553 875
TOTAL ASSETS 8 925 140 10 665 836 10 147 532
LIABILITIES
SHAREHOLDERS' EQUITY
Share capital 2 523 2 523 2 523
Reserve for invested non-restricted equity 100 000 100 000 100 000
Retained earnings 92 790 28 679 28 679
Profit for the period -996 162 -800 849 -1 153 041 -1 021 840 64 111 195 313
LIABILITIES
Non-current liabilities
Debt to group companies 500 000 122 000 0
Other liabilities 4 721 471 5 221 471 4 859 497 4 981 497 4 566 569 4 566 569
Current liabilities
Debt to group companies 265 760 0 421 360
Short-term advance payments 1 539 068 2 391 754 1 912 140
Short-term accounts payable 1 479 118 2 747 634 1 085 129
Other liabilities 59 096 327 497 631 409
Accrued liabilities and deferred income 1 161 476 4 504 518 1 239 294 6 706 179 1 335 612 5 385 650
TOTAL LIABILITIES 8 925 140 10 665 836 10 147 532
31.12.2018
31.12.2018
31.03.2019
31.03.2019
31.03.2018
31.03.2018
FINANCIAL STATEMENTS Q1 2019
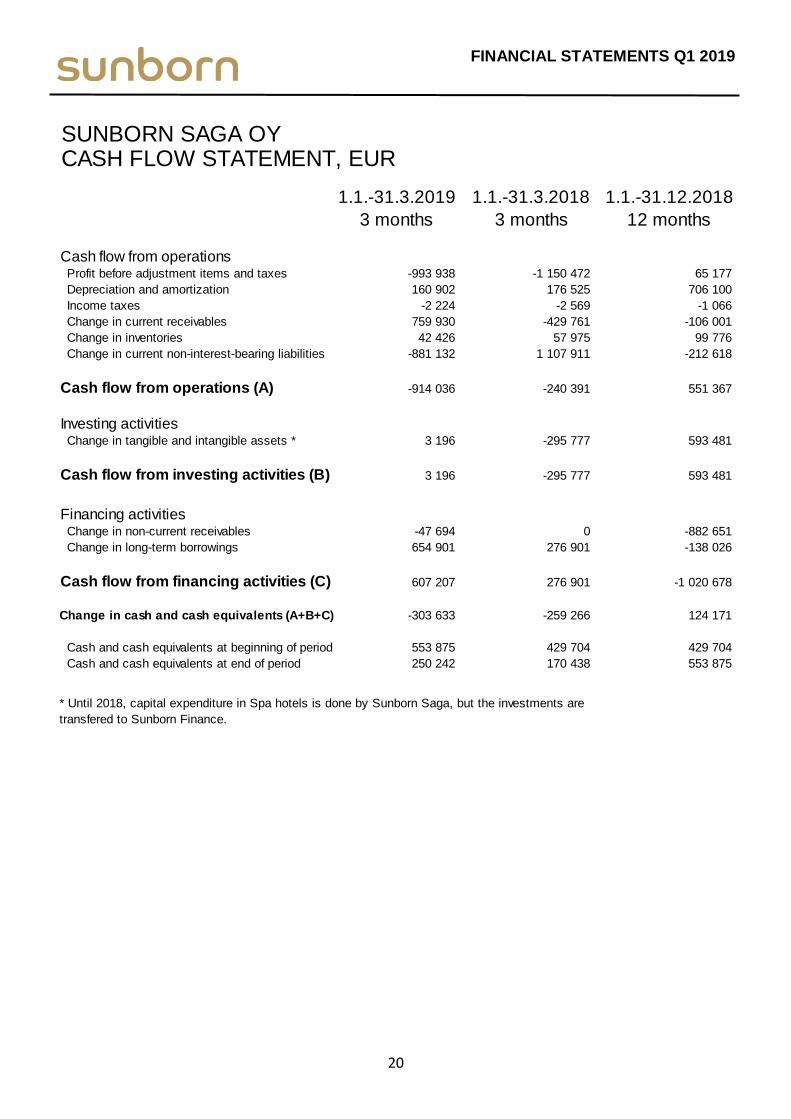
20
SUNBORN SAGA OYCASH FLOW STATEMENT, EUR
1.1.-31.3.2019 1.1.-31.3.2018 1.1.-31.12.2018
3 months 3 months 12 months
Cash flow from operations Profit before adjustment items and taxes -993 938 -1 150 472 65 177
Depreciation and amortization 160 902 176 525 706 100
Income taxes -2 224 -2 569 -1 066
Change in current receivables 759 930 -429 761 -106 001
Change in inventories 42 426 57 975 99 776
Change in current non-interest-bearing liabilities -881 132 1 107 911 -212 618
Cash flow from operations (A) -914 036 -240 391 551 367
Investing activities Change in tangible and intangible assets * 3 196 -295 777 593 481
Cash flow from investing activities (B) 3 196 -295 777 593 481
Financing activities Change in non-current receivables -47 694 0 -882 651
Change in long-term borrowings 654 901 276 901 -138 026
Cash flow from financing activities (C) 607 207 276 901 -1 020 678
Change in cash and cash equivalents (A+B+C) -303 633 -259 266 124 171
Cash and cash equivalents at beginning of period 553 875 429 704 429 704
Cash and cash equivalents at end of period 250 242 170 438 553 875
* Until 2018, capital expenditure in Spa hotels is done by Sunborn Saga, but the investments are
transfered to Sunborn Finance.