Embed Size (px)
Citation preview
107ANNUAL REPORT 2018
PERFORMANCEREVIEW
CORPORATEGOVERNANCE
SUSTAINABILITYSTATEMENT
FINANCIALSTATEMENTS
OTHERINFORMATION
108 Directors’ Report
112 Statement by Directors
112 Statutory Declaration
113 Independent Auditors’ Report
117 Income Statements
118 Statements of Comprehensive Income
119 Statements of Financial Position
120 Statements of Changes in Equity
121 Statements of Cash Flows
123 Notes to the Financial Statements
FINANCIAL STATEMENTS
DIRECTORS’ REPORT
The Directors have pleasure in submitting their report together with the audited fi nancial statements of the Group and of the Company for the fi nancial
year ended 31 March 2018.
PRINCIPAL ACTIVITIES
The Company is an investment holding company, principally engaged in the provision of management services to its subsidiaries.
The principal activities of the subsidiaries are as disclosed in Note 17 to the fi nancial statements.
RESULTS
Group Company
RM’000 RM’000
Net profi t for the fi nancial year 140,865 6,872
There were no material transfers to or from reserves or provisions during the fi nancial year other than as disclosed in the fi nancial statements.
In the opinion of the Directors, the results of the operations of the Company during the fi nancial year were not substantially affected by any item,
transaction or event of a material and unusual nature.
DIVIDEND
Since the end of the previous fi nancial year, no dividend has been paid or declared by the Company.
SIGNIFICANT EVENTS
a) Transfer of general and family retakaful businesses
On 1 December 2017, the transfer of the general and family retakaful businesses between 2 subsidiaries, Malaysian Reinsurance Berhad and
Sinar Seroja Berhad (formerly known as MNRB Retakaful Berhad) was completed.
b) Splitting of family and general takaful business licenses
In accordance with the requirements of the Islamic Financial Service Act 2013 (“IFSA 2013”) a takaful operator that carries on both classes of
family and general takaful businesses required take steps to split the businesses into separate legal entities before 1 July 2018.
A new company was incorporated on 5 June 2017 as a wholly-owned subsidiary of Takaful Ikhlas Berhad (“TIB”) to take over its general takaful
business once the necessary approval has been obtained from BNM.
Further details of the above signifi cant events are disclosed in Note 40 to the fi nancial statements.
108 MNRB HOLDINGS BERHAD (13487-A)
KEYMESSAGES LEADERSHIP
CORPORATE DISCLOSURES
STRATEGICREVIEW
DIRECTORS
The names of the Directors of the Company in offi ce since the beginning of the fi nancial year to the date of this report are:
Dato Sharkawi bin Alis
Mohd Din bin Merican
Hijah Arifakh binti Othman
Mustaffa bin Ahmad
Rosinah binti Mohd Salleh
Arul Sothy Mylvaganam
Noor Rida binti Hamzah
Datuk Johar bin Che Mat (Appointed with effect from 1 October 2017)
George Oommen (Appointed with effect from 1 January 2018)
Megat Dziauddin bin Megat Mahmud (Resigned with effect from 30 June 2017)
Paisol bin Ahmad (Retired with effect from 24 August 2017)
The names of the Directors of the Company’s subsidiaries in offi ce since the beginning of the fi nancial year to the date of this report (not including
those Directors listed above) are:
Directors Subsidiaries
Zainudin bin Ishak Malaysian Reinsurance Berhad (“MRE”),
(resigned to be a Director of MRE effective from Malaysian Re (Dubai) Ltd. (“MRDL”)
2 March 2018) and MMIP Services Sdn. Bhd. (“MSSB”)
Md Adnan bin Md Zain MRE and Takaful Ikhlas Berhad (“TIB”)
Datin Zaimah binti Zakaria MRE and Sinar Seroja Berhad (“SSB”)
(formerly known as MNRB Retakaful Berhad)
Datuk Nik Moustpha bin Nik Hassan TIB and SSB
Norazman bin Hashim MSSB
Yahaya bin Besah
(resigned effective from 3 July 2017) SSB
Dr. Syed Musa bin Syed Jaafar Alhabshi
(resigned effective from 22 July 2017) SSB
Datuk Ab Latiff bin Abu Bakar
(resigned to be a Director effective from 7 January 2018) TIB
DIRECTORS’ BENEFITS
Neither at the end of the fi nancial year, nor at any time during that year, did there subsist any arrangement to which the Company was a party, whereby
the Directors might acquire benefi ts by means of acquisition of shares in or debentures of the Company or any other body corporate.
Since the end of the previous fi nancial year, no Director has received or become entitled to receive any benefi t (other than benefi ts included in the
aggregate amount of emoluments received or due and receivable by the Directors from the Company or the fi xed salary and benefi ts receivable as a
full-time employee of the Company as disclosed in Notes 9, 10 and 32 to the fi nancial statements or benefi ts receivable from related corporations) by
reason of a contract made by the Company or a related corporation with the Director or with a fi rm of which the Director is a member, or with a company
in which the Director has a substantial fi nancial interest to be disclosed under Fifth Schedule, Part I Section 3 of the Companies Act, 2016.
During the fi nancial year, the Company purchased a Directors and Offi cers Liability Insurance cover to provide indemnity to all directors of the MNRB
Group for a limit of RM50,000,000 at a premium of RM67,000.
109ANNUAL REPORT 2018
PERFORMANCEREVIEW
CORPORATEGOVERNANCE
SUSTAINABILITYSTATEMENT
FINANCIALSTATEMENTS
OTHERINFORMATION
DIRECTORS’ REPORT
OTHER STATUTORY INFORMATION
(a) Prior to issuance of income statements and statements of fi nancial position of the Group and the Company, the Directors took reasonable
steps:
(i) to ascertain that proper action had been taken in relation to the writing off of bad debts and the making of allowance for doubtful debts
and satisfi ed themselves that there were no known bad debts and that adequate allowance had been made for doubtful debts; and
(ii) to ensure that any current assets which were unlikely to realise their values as shown in the accounting records in the ordinary course of
business had been written down to an amount which they might be expected so to realise.
(b) At the date of this report, the Directors are not aware of any circumstances which would render:
(i) it necessary to write-off any bad debts or the amount of the provision for doubtful debts in the fi nancial statements of the Group and of
the Company inadequate to any substantial extent; and
(ii) the values attributed to the current assets in the fi nancial statements of the Group and of the Company misleading.
(c) At the date of this report, the Directors are not aware of any circumstances which have arisen which would render adherence to the existing
method of valuation of assets or liabilities of the Group and of the Company misleading or inappropriate.
(d) At the date of this report, the Directors are not aware of any circumstances not otherwise dealt with in this report or in the fi nancial statements
of the Group and of the Company which would render any amount stated in the fi nancial statements misleading.
(e) As at the date of this report, there does not exist:
(i) any charge on the assets of the Group or of the Company which has arisen since the end of the fi nancial year which secures the liabilities
of any other person; or
(ii) any contingent liability of the Group or of the Company which has arisen since the end of the fi nancial year other than those arising in the
normal course of business of the Group and of the Company.
(f ) In the opinion of the Directors:
(i) no contingent liability or other liability has become enforceable or is likely to become enforceable within the period of twelve months after
the end of the fi nancial year which will or may affect the ability of the Group or of the Company to meet their obligations when they fall
due; and
(ii) no item, transaction or event of a material and unusual nature has arisen in the interval between the end of the fi nancial year and the
date of this report which is likely to affect substantially the results of the operations of the Group or of the Company for the fi nancial year
in which this report is made.
For the purpose of paragraphs (e)(ii) and (f )(i) above, contingent or other liabilities do not include liabilities arising from reinsurance, takaful and
retakaful contracts underwritten in the ordinary course of business of the reinsurance/retakaful and takaful subsidiaries and associate companies.
110 MNRB HOLDINGS BERHAD (13487-A)
KEYMESSAGES LEADERSHIP
CORPORATE DISCLOSURES
STRATEGICREVIEW
AUDITORS
The retiring auditors, Messrs. Ernst & Young, have expressed their willingness to accept re-appointment. Details of Auditors’ remuneration for their
service as auditors are disclosed in Note 9 of the statutory fi nancial statements.
Signed on behalf of the Board in accordance with a resolution of the Directors dated 29 June 2018.
Dato Sharkawi bin Alis Mohd Din bin Merican
Kuala Lumpur, Malaysia
111ANNUAL REPORT 2018
PERFORMANCEREVIEW
CORPORATEGOVERNANCE
SUSTAINABILITYSTATEMENT
FINANCIALSTATEMENTS
OTHERINFORMATION
We, Dato Sharkawi bin Alis and Mohd Din bin Merican, being two of the Directors of MNRB Holdings Berhad, do hereby state that, in the opinion of
the Directors, the accompanying fi nancial statements set out on pages 117 to 227 are drawn up in accordance with Malaysian Financial Reporting
Standards, International Financial Reporting Standards and the requirements of the Companies Act, 2016 in Malaysia, so as to give a true and fair view
of the fi nancial position of the Company and of the Group as at 31 March 2018 and of the results and the cash fl ows of the Company and of the Group
for the year then ended.
Signed on behalf of the Board in accordance with a resolution of the Directors dated 29 June 2018.
Dato Sharkawi bin Alis Mohd Din bin Merican
Kuala Lumpur, Malaysia
STATEMENT BY DIRECTORS
STATUTORY DECLARATION
Pursuant to Section 251(2) of the Companies Act, 2016
Pursuant to Section 251(1)(b) of the Companies Act, 2016
I, Norazman bin Hashim, being the offi cer primarily responsible for the fi nancial management of MNRB Holdings Berhad, do solemnly and sincerely
declare that the accompanying fi nancial statements set out on pages 117 to 227 are in my opinion correct, and I make this solemn declaration
conscientiously believing the same to be true and by virtue of the provisions of the Statutory Declarations Act, 1960.
Subscribed and solemnly declared by )
the abovenamed Norazman bin Hashim )
at Kuala Lumpur in Wilayah Persekutuan )
on 29 June 2018. ) Norazman bin Hashim
Before me,
Commissioner of Oaths
112 MNRB HOLDINGS BERHAD (13487-A)
KEYMESSAGES LEADERSHIP
CORPORATE DISCLOSURES
STRATEGICREVIEW
INDEPENDENT AUDITORS’ REPORTto the members of MNRB Holdings Berhad (Incorporated in Malaysia)
REPORT ON THE AUDIT OF THE FINANCIAL STATEMENTS
Opinion
We have audited the fi nancial statements of MNRB Holdings Berhad, which comprise the statements of fi nancial position as at 31 March 2018 of the
Group and of the Company, and the income statements, statements of comprehensive income, statements of changes in equity and statements of cash
fl ows of the Group and of the Company for the year then ended, and notes to the fi nancial statements, including a summary of signifi cant accounting
policies, as set out on pages 117 to 227.
In our opinion, the accompanying fi nancial statements give a true and fair view of the fi nancial position of the Group and of the Company as at
31 March 2018, and of their fi nancial performance and their cash fl ows for the year then ended in accordance with Malaysian Financial Reporting
Standards, International Financial Reporting Standards and the requirements of the Companies Act, 2016 in Malaysia.
Basis for opinion
We conducted our audit in accordance with approved standards on auditing in Malaysia and International Standards on Auditing. Our responsibilities
under those standards are further described in the Auditors’ responsibilities for the audit of the fi nancial statements section of our report. We believe
that the audit evidence we have obtained is suffi cient and appropriate to provide a basis for our audit opinion.
Independence and other ethical responsibilities
We are independent of the Group and of the Company in accordance with the By-Laws (on Professional Ethics, Conduct and Practice) of the Malaysian
Institute of Accountants (“By-Laws”) and the International Ethics Standards Board for Accountants’ Code of Ethics for Professional Accountants
(“IESBA Code”), and we have fulfi lled our other ethical responsibilities in accordance with the By-Laws and the IESBA Code.
Key audit matters
Key audit matters are those matters that, in our professional judgement, were of most signifi cance in our audit of the fi nancial statements of the Group
and of the Company for the current year. The key audit matters for the audit of the fi nancial statements of the Group and the Company are described
below. These matters were addressed in the context of our audit of the fi nancial statements of the Group and the Company as a whole, and in forming
our opinion thereon, and we do not provide a separate opinion on these matters. For the matters below, our description of how our audit addressed
these matters is provided in that context.
We have fulfi lled the responsibilities described in the Auditors’ responsibilities for the audit of the fi nancial statements section of our report, including
in relation to these matters. Accordingly, our audit included the performance of procedures designed to respond to our assessment of the risks of
material misstatement of the fi nancial statements. The results of our audit procedures, including the procedures performed to address the matters
below, provide the basis of our audit opinion on the accompanying fi nancial statements.
1. Insurance/takaful contract liabilities of the Group
The Group’s insurance/takaful contract liabilities as at 31 March 2018 amounted to RM5.3 billion (as disclosed in Note 20 to the fi nancial statements)
or approximately 83% of its total liabilities. The insurance/takaful contract liabilities include the following liabilities of the reinsurance/retakaful
subsidiary, Malaysian Reinsurance Berhad and the takaful subsidiary, Takaful Ikhlas Berhad:
(a) Premium/contribution and claim liabilities of the general reinsurance/retakaful and takaful businesses;
(b) Actuarial liabilities of the family retakaful and takaful businesses;
(c) Investment-linked participants’ account of the family takaful business; and
(d) Expense liabilities in respect of the shareholder’s fund of the takaful and retakaful businesses.
These liabilities have been estimated based on standard actuarial valuation methodologies and other estimation models as allowed under the Risk-
Based Capital Framework and Risk-Based Capital Framework for Takaful Operators issued by Bank Negara Malaysia as well as the accounting policies
described in Notes 2.4, 2.5 and 2.6 for the valuation of the insurance/takaful contract liabilities of the Group.
113ANNUAL REPORT 2018
PERFORMANCEREVIEW
CORPORATEGOVERNANCE
SUSTAINABILITYSTATEMENT
FINANCIALSTATEMENTS
OTHERINFORMATION
REPORT ON THE AUDIT OF THE FINANCIAL STATEMENTS (CONT’D)
Key audit matters (Cont’d)
1. Insurance/takaful contract liabilities of the Group (Cont’d)
The complexity of the actuarial valuation methodologies and other estimation models applied to derive the insurance/takaful contract liabilitites
may give rise to estimation errors as a result of inadequate or incomplete data, the design and application of the relevant valuation models by the
management’s experts (i.e. the Appointed Actuaries) and the use of inappropriate assumptions. Siginifi cant professional judgement is applied by the
Group in deriving the assumptions (as described in Note 3 to the fi nancial statements) and any signifi cant changes thereon may have a material effect
on the insurance/takaful contract liabilities.
Our audit procedures were focused on the following key areas:
• Understanding and documenting the qualifi cations, objectivity and independence of the Appointed Actuaries tasked with estimating the
insurance/takaful contract liabilities of the Group;
• Reviewing the reports prepared by the Appointed Actuaries in respect of the insurance/takaful contract liabilities of the Group;
• Assessing the valuation methodologies applied by the Group to derive the insurance/takaful contract liabilities;
• Assessing the design and testing the operating effectiveness of key internal controls over the actuarial valuation process with respect to fi nancial
reporting, including the bases used by the Group in determining and approving the key assumptions applied;
• Assessing the experience analyses of the reinsurance, retakaful and takaful business used during the setting of the key assumptions to derive
the insurance/takaful contract liabilities and challenging the rationale applied by the Appointed Actuaries and management in deriving those
assumptions. In addition and where appropriate, comparisons have also been made against other industry constituents and the experience of
the respective subsidiaries;
• Testing the completeness and suffi ciency of data used in the valuation of insurance/takaful contract liabilities including reviewing the data
extraction process and reconciliations carried out by the Group. These tests also included control tests performed on selected samples of claims
reserves, claims paid and reinsurance policies and retakaful and takaful certifi cates issued by the Group to ascertain effectiveness of operating
controls over quality and accuracy of the underlying data;
• Performing audit tests on the model review process applied by management in respect of the family takaful business and independently
reviewing the results thereon;
• Performing independent analyses and re-computation of the general reinsurance/retakaful/takaful contract liabilities for selected classes of
business, focusing on the most signifi cant business portfolio and those which may potentially result in signifi cant deviations in estimates.
We compared our independent analyses and recomputations to those performed by management to ascertain if the reserves were suffi cient and
within range of our independent analyses;
• Performing tests on the UPR/UCR calculations produced by management and thereafter, comparing the UPR/UCR against the URR valuation
performed by the Appointed Actuaries to ascertain if adequate reserves have been established for the general reinsurance, retakaful and takaful
business;
• Performing tests on the UWF calculations produced by management and thereafter, comparing the UWF against the UER valuation performed by
the Appointed Actuaries to ascertain if adequate reserves have been established for the shareholder’s fund of the retakaful and takaful business;
• Reviewing the Liability Adequacy Test results performed by the reinsurance, retakaful and takaful subsidiaries;
• Auditing the fair value of fi nancial assets and adequacy of liabilities of the investment-linked funds of the family takaful business;
• Performing control tests over the creation and cancellation of units of the investment-linked funds as well as calculation of Net Asset Values; and
• Assessing the adequacy of disclosures made in the fi nancial statements in respect of the insurance/takaful contract liabilities of the Group.
We have also engaged our Actuarial Services professionals in accordance with the requirements of International Standard on Auditing 620: Reliance on
the Work of an Auditors’ Expert to assist us in performing certain audit procedures on the insurance/takaful contract liabilities of the Group.
INDEPENDENT AUDITORS’ REPORTto the members of MNRB Holdings Berhad (Incorporated in Malaysia)
114 MNRB HOLDINGS BERHAD (13487-A)
KEYMESSAGES LEADERSHIP
CORPORATE DISCLOSURES
STRATEGICREVIEW
REPORT ON THE AUDIT OF THE FINANCIAL STATEMENTS (CONT’D)
Key audit matters (Cont’d)
2. Tax Recoverable
As disclosed in Note 22 to the fi nancial statements, the Company has disputed the additional tax assessments and penalties raised by the Inland
Revenue Board of Malaysia (“IRB”), amounting to approximately RM19.7 million. The Company has disputed the claims by stating that there is no
legal and factual basis for the assessments raised. The tax matter is in the preliminary stage and may take extended years to resolve. In addition, the
Company has tax recoverable amounting to approximately RM17.6 million (2017: tax payable of RM2.6 million) as at 31 March 2018. The eventual
resolution of the tax matter above is uncertain and could result in a material amount of tax payable or reversal of tax recoverable and, accordingly, we
consider this area to be an area of audit focus.
As part of our audit procedures, we have involved our tax specialists in reviewing correspondences between the Company and external legal counsel
to obtain an understanding of the matter. We have enquired and discussed with management on the developments in legal proceedings and obtained
confi rmations from the Company’s external legal counsel to compare the expert opinions to management’s position. We also considered the objectivity,
independence and expertise of the legal advisers and we also assessed the basis adopted by the legal advisers in their evaluations of the possible
outcome of the litigations and claims.
Information other than the fi nancial statements and auditors’ report thereon
The directors of the Company are responsible for the other information. The other information comprises the information included in the Annual Report,
but does not include the fi nancial statements of the Group and of the Company and our auditors’ report thereon.
Our opinion on the fi nancial statements of the Group and of the Company does not cover the other information and we do not express any form of
assurance conclusion thereon.
In connection with our audit of the fi nancial statements of the Group and of the Company, our responsibility is to read the other information and,
in doing so, consider whether the other information is materially inconsistent with the fi nancial statements of the Group and of the Company or our
knowledge obtained in the audit or otherwise appears to be materially misstated.
If, based on the work we have performed, we conclude that there is a material misstatement of this other information, we are required to report that
fact. We have nothing to report in this regard.
Responsibilities of the directors for the fi nancial statements
The directors of the Company are responsible for the preparation of fi nancial statements of the Group and of the Company that give a true and fair
view in accordance with Malaysian Financial Reporting Standards, International Financial Reporting Standards and the requirements of the Companies
Act, 2016 in Malaysia. The directors are also responsible for such internal control as the directors determine is necessary to enable the preparation of
fi nancial statements of the Group and of the Company that are free from material misstatement, whether due to fraud or error.
In preparing the fi nancial statements of the Group and of the Company, the directors are responsible for assessing the Group’s and the Company’s
ability to continue as a going concern, disclosing, as applicable, matters related to going concern and using the going concern basis of accounting unless
the directors either intend to liquidate the Group or the Company or to cease operations, or have no realistic alternative but to do so.
Auditors’ responsibilities for the audit of the fi nancial statements
Our objectives are to obtain reasonable assurance about whether the fi nancial statements of the Group and of the Company as a whole are free from
material misstatement, whether due to fraud or error, and to issue an auditors’ report that includes our opinion. Reasonable assurance is a high level of
assurance, but is not a guarantee that an audit conducted in accordance with approved standards on auditing in Malaysia and International Standards
on Auditing will always detect a material misstatement when it exists. Misstatements can arise from fraud or error and are considered material if,
individually or in the aggregate, they could reasonably be expected to infl uence the economic decisions of users taken on the basis of these fi nancial
statements.
115ANNUAL REPORT 2018
PERFORMANCEREVIEW
CORPORATEGOVERNANCE
SUSTAINABILITYSTATEMENT
FINANCIALSTATEMENTS
OTHERINFORMATION
REPORT ON THE AUDIT OF THE FINANCIAL STATEMENTS (CONT’D)
Auditors’ responsibilities for the audit of the fi nancial statements (Cont’d)
As part of an audit in accordance with approved standards on auditing in Malaysia and International Standards on Auditing, we exercise professional
judgement and maintain professional scepticism throughout the audit. We also:
• Identify and assess the risks of material misstatement of the fi nancial statements of the Group and of the Company, whether due to fraud or
error, design and perform audit procedures responsive to those risks, and obtain audit evidence that is suffi cient and appropriate to provide a
basis for our opinion. The risk of not detecting a material misstatement resulting from fraud is higher than for one resulting from error, as fraud
may involve collusion, forgery, intentional omissions, misrepresentations, or the override of internal control.
• Obtain an understanding of internal control relevant to the audit in order to design audit procedures that are appropriate in the circumstances,
but not for the purpose of expressing an opinion on the effectiveness of the Group’s and the Company’s internal control.
• Evaluate the appropriateness of accounting policies used and the reasonableness of accounting estimates and related disclosures.
• Conclude on the appropriateness of the directors’ use of the going concern basis of accounting and, based on the audit evidence obtained,
whether a material uncertainty exists related to events or conditions that may cast signifi cant doubt on the Group’s or the Company’s ability to
continue as a going concern. If we conclude that a material uncertainty exists, we are required to draw attention in our auditors’ report to the
related disclosures in the fi nancial statements of the Group and of the Company or, if such disclosures are inadequate, to modify our opinion.
Our conclusions are based on the audit evidence obtained up to the date of our auditors’ report. However, future events or conditions may cause
the Group or the Company to cease to continue as a going concern.
• Evaluate the overall presentation, structure and content of the fi nancial statements of the Group and of the Company, including the disclosures,
and whether the fi nancial statements of the Group and of the Company represent the underlying transactions and events in a manner that
achieves fair presentation.
• Obtain suffi cient appropriate audit evidence regarding the fi nancial information of the entities or business activities within the Group to express
an opinion on the fi nancial statements of the Group. We are responsible for the direction, supervision and performance of the group audit. We
remain solely responsible for our audit opinion.
We communicate with the directors regarding, among other matters, the planned scope and timing of the audit and signifi cant audit fi ndings, including
any signifi cant defi ciencies in internal control that we identify during our audit.
We also provide the directors with a statement that we have complied with relevant ethical requirements regarding independence, and to communicate
with them all relationships and other matters that may reasonably be thought to bear on our independence, and where applicable, related safeguards.
From the matters communicated with the directors, we determine those matters that were of most signifi cance in the audit of the fi nancial statements
of the Group and of the Company for the current year and are therefore the key audit matters. We describe these matters in our auditors’ report unless
law or regulation precludes public disclosure about the matter or when, in extremely rare circumstances, we determine that a matter should not be
communicated in our report because the adverse consequences of doing so would reasonably be expected to outweigh the public interest benefi ts of
such communication.
OTHER MATTERS
This report is made solely to the members of the Company, as a body, in accordance with Section 266 of the Companies Act, 2016 in Malaysia and for
no other purpose. We do not assume responsibility to any other person for the content of this report.
Ernst & Young Dato’ Abdul Rauf Bin Rashid
AF: 0039 No. 02305/05/2020 J
Chartered Accountants Chartered Accountant
Kuala Lumpur, Malaysia
29 June 2018
INDEPENDENT AUDITORS’ REPORTto the members of MNRB Holdings Berhad (Incorporated in Malaysia)
116 MNRB HOLDINGS BERHAD (13487-A)
KEYMESSAGES LEADERSHIP
CORPORATE DISCLOSURES
STRATEGICREVIEW
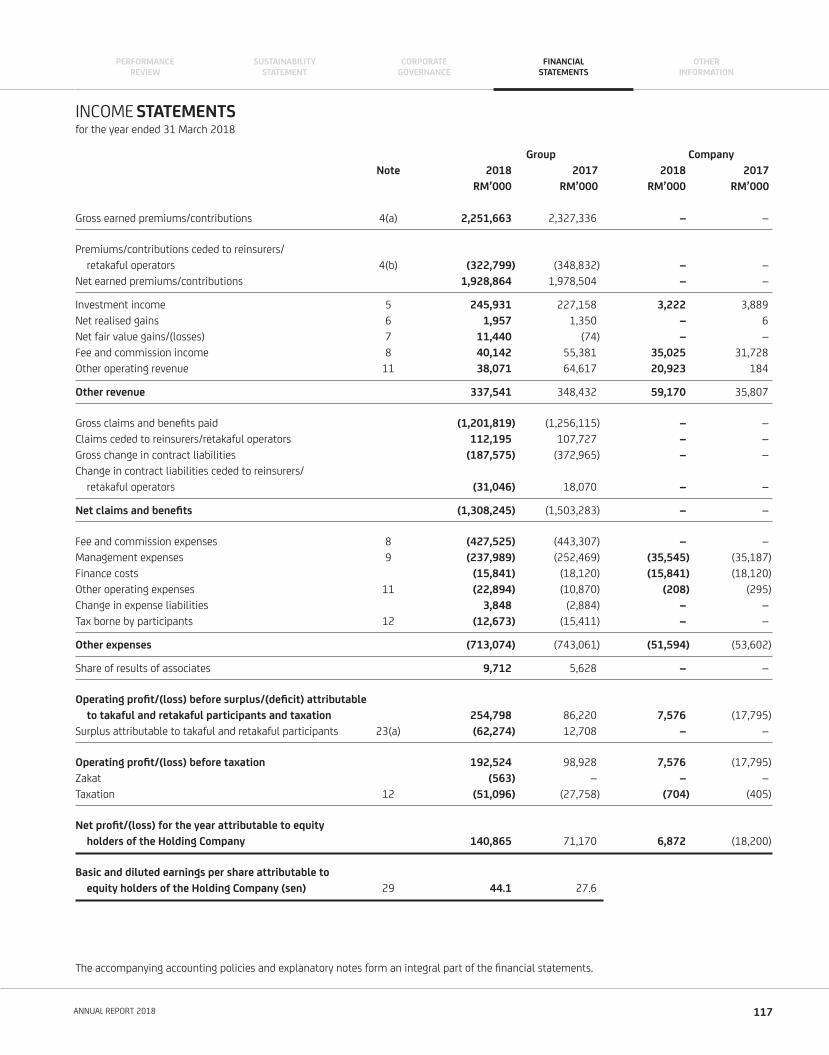
Group Company
Note 2018 2017 2018 2017
RM’000 RM’000 RM’000 RM’000
Gross earned premiums/contributions 4(a) 2,251,663 2,327,336 – –
Premiums/contributions ceded to reinsurers/
retakaful operators 4(b) (322,799) (348,832) – –
Net earned premiums/contributions 1,928,864 1,978,504 – –
Investment income 5 245,931 227,158 3,222 3,889
Net realised gains 6 1,957 1,350 – 6
Net fair value gains/(losses) 7 11,440 (74) – –
Fee and commission income 8 40,142 55,381 35,025 31,728
Other operating revenue 11 38,071 64,617 20,923 184
Other revenue 337,541 348,432 59,170 35,807
Gross claims and benefi ts paid (1,201,819) (1,256,115) – –
Claims ceded to reinsurers/retakaful operators 112,195 107,727 – –
Gross change in contract liabilities (187,575) (372,965) – –
Change in contract liabilities ceded to reinsurers/
retakaful operators (31,046) 18,070 – –
Net claims and benefi ts (1,308,245) (1,503,283) – –
Fee and commission expenses 8 (427,525) (443,307) – –
Management expenses 9 (237,989) (252,469) (35,545) (35,187)
Finance costs (15,841) (18,120) (15,841) (18,120)
Other operating expenses 11 (22,894) (10,870) (208) (295)
Change in expense liabilities 3,848 (2,884) – –
Tax borne by participants 12 (12,673) (15,411) – –
Other expenses (713,074) (743,061) (51,594) (53,602)
Share of results of associates 9,712 5,628 – –
Operating profi t/(loss) before surplus/(defi cit) attributable
to takaful and retakaful participants and taxation 254,798 86,220 7,576 (17,795)
Surplus attributable to takaful and retakaful participants 23(a) (62,274) 12,708 – –
Operating profi t/(loss) before taxation 192,524 98,928 7,576 (17,795)
Zakat (563) – – –
Taxation 12 (51,096) (27,758) (704) (405)
Net profi t/(loss) for the year attributable to equity
holders of the Holding Company 140,865 71,170 6,872 (18,200)
Basic and diluted earnings per share attributable to
equity holders of the Holding Company (sen) 29 44.1 27.6
The accompanying accounting policies and explanatory notes form an integral part of the fi nancial statements.
INCOME STATEMENTSfor the year ended 31 March 2018
117ANNUAL REPORT 2018
PERFORMANCEREVIEW
CORPORATEGOVERNANCE
SUSTAINABILITYSTATEMENT
FINANCIALSTATEMENTS
OTHERINFORMATION
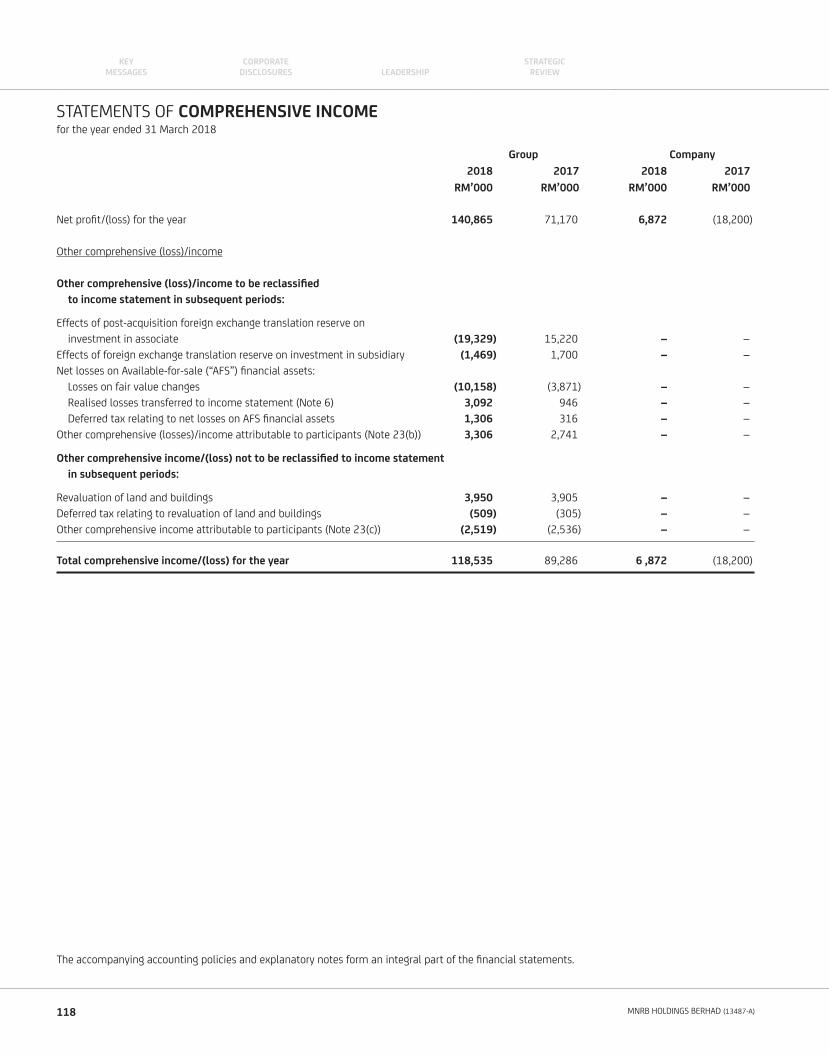
Group Company
2018 2017 2018 2017
RM’000 RM’000 RM’000 RM’000
Net profi t/(loss) for the year 140,865 71,170 6,872 (18,200)
Other comprehensive (loss)/income
Other comprehensive (loss)/income to be reclassifi ed
to income statement in subsequent periods:
Effects of post-acquisition foreign exchange translation reserve on
investment in associate (19,329) 15,220 – –
Effects of foreign exchange translation reserve on investment in subsidiary (1,469) 1,700 – –
Net losses on Available-for-sale (“AFS”) fi nancial assets:
Losses on fair value changes (10,158) (3,871) – –
Realised losses transferred to income statement (Note 6) 3,092 946 – –
Deferred tax relating to net losses on AFS fi nancial assets 1,306 316 – –
Other comprehensive (losses)/income attributable to participants (Note 23(b)) 3,306 2,741 – –
Other comprehensive income/(loss) not to be reclassifi ed to income statement
in subsequent periods:
Revaluation of land and buildings 3,950 3,905 – –
Deferred tax relating to revaluation of land and buildings (509) (305) – –
Other comprehensive income attributable to participants (Note 23(c)) (2,519) (2,536) – –
Total comprehensive income/(loss) for the year 118,535 89,286 6 ,872 (18,200)
The accompanying accounting policies and explanatory notes form an integral part of the fi nancial statements.
STATEMENTS OF COMPREHENSIVE INCOMEfor the year ended 31 March 2018
118 MNRB HOLDINGS BERHAD (13487-A)
KEYMESSAGES LEADERSHIP
CORPORATE DISCLOSURES
STRATEGICREVIEW
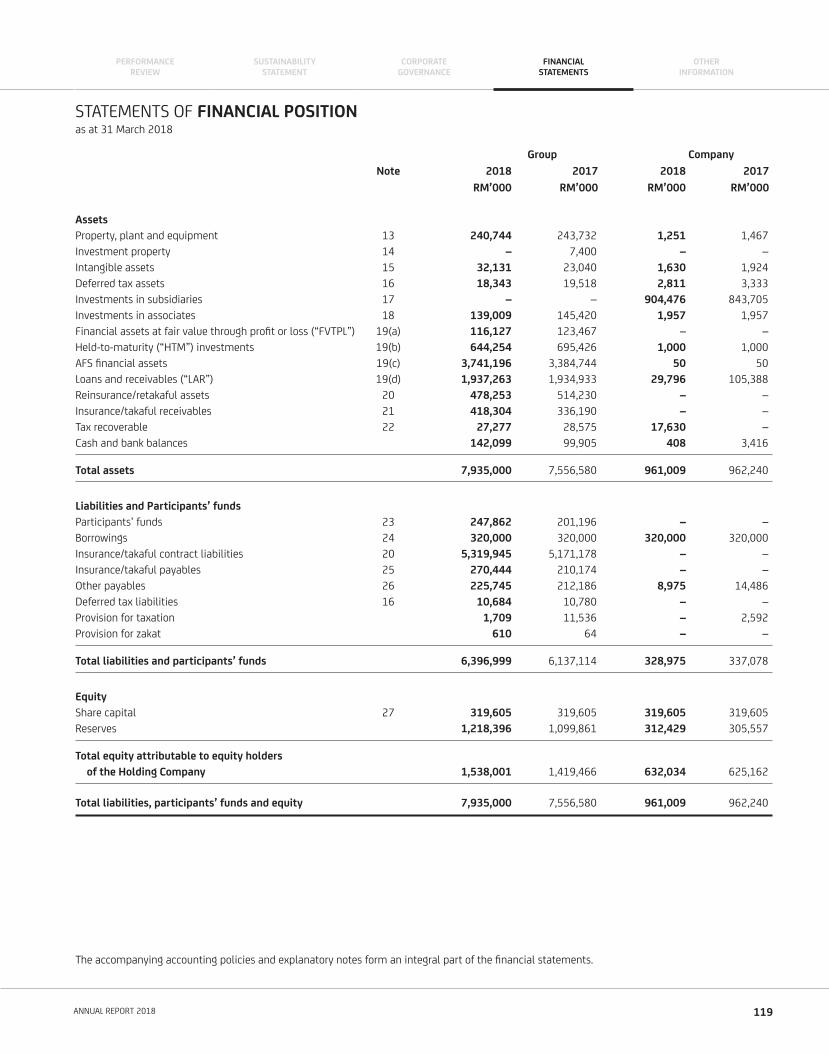
STATEMENTS OF FINANCIAL POSITIONas at 31 March 2018
Group Company
Note 2018 2017 2018 2017
RM’000 RM’000 RM’000 RM’000
Assets
Property, plant and equipment 13 240,744 243,732 1,251 1,467
Investment property 14 – 7,400 – –
Intangible assets 15 32,131 23,040 1,630 1,924
Deferred tax assets 16 18,343 19,518 2,811 3,333
Investments in subsidiaries 17 – – 904,476 843,705
Investments in associates 18 139,009 145,420 1,957 1,957
Financial assets at fair value through profi t or loss (“FVTPL”) 19(a) 116,127 123,467 – –
Held-to-maturity (“HTM”) investments 19(b) 644,254 695,426 1,000 1,000
AFS fi nancial assets 19(c) 3,741,196 3,384,744 50 50
Loans and receivables (“LAR”) 19(d) 1,937,263 1,934,933 29,796 105,388
Reinsurance/retakaful assets 20 478,253 514,230 – –
Insurance/takaful receivables 21 418,304 336,190 – –
Tax recoverable 22 27,277 28,575 17,630 –
Cash and bank balances 142,099 99,905 408 3,416
Total assets 7,935,000 7,556,580 961,009 962,240
Liabilities and Participants’ funds
Participants’ funds 23 247,862 201,196 – –
Borrowings 24 320,000 320,000 320,000 320,000
Insurance/takaful contract liabilities 20 5,319,945 5,171,178 – –
Insurance/takaful payables 25 270,444 210,174 – –
Other payables 26 225,745 212,186 8,975 14,486
Deferred tax liabilities 16 10,684 10,780 – –
Provision for taxation 1,709 11,536 – 2,592
Provision for zakat 610 64 – –
Total liabilities and participants’ funds 6,396,999 6,137,114 328,975 337,078
Equity
Share capital 27 319,605 319,605 319,605 319,605
Reserves 1,218,396 1,099,861 312,429 305,557
Total equity attributable to equity holders
of the Holding Company 1,538,001 1,419,466 632,034 625,162
Total liabilities, participants’ funds and equity 7,935,000 7,556,580 961,009 962,240
The accompanying accounting policies and explanatory notes form an integral part of the fi nancial statements.
119ANNUAL REPORT 2018
PERFORMANCEREVIEW
CORPORATEGOVERNANCE
SUSTAINABILITYSTATEMENT
FINANCIALSTATEMENTS
OTHERINFORMATION
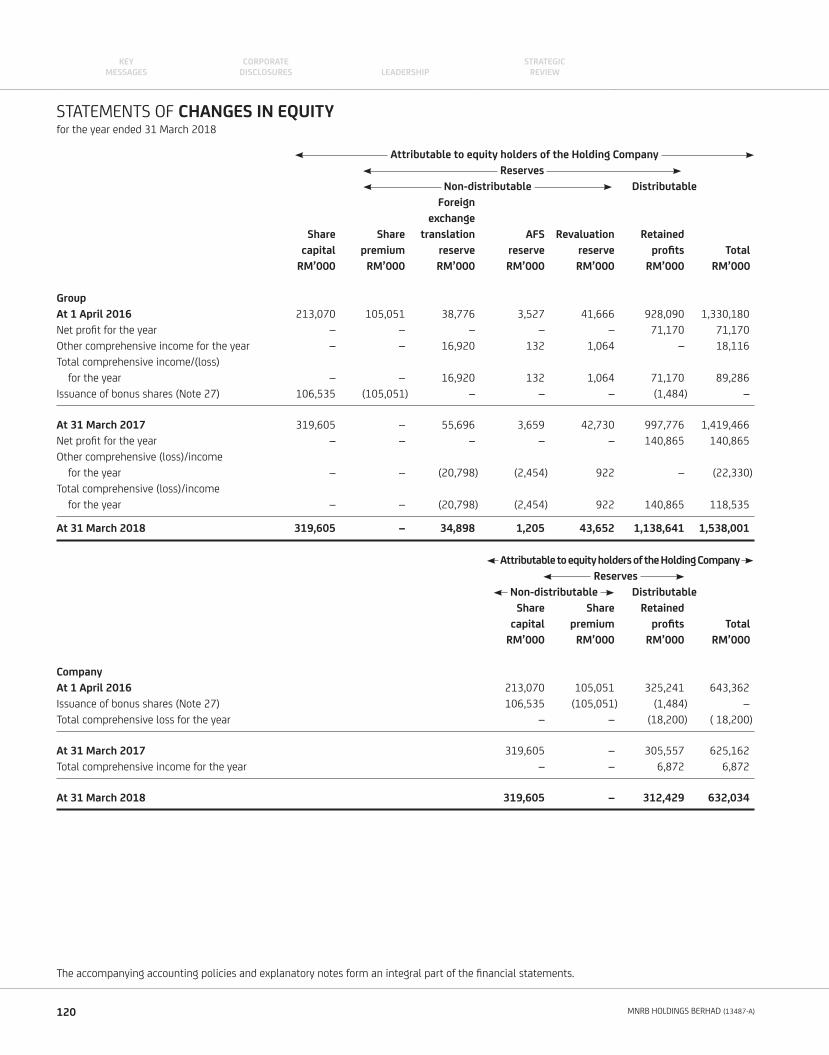
Attributable to equity holders of the Holding Company
Reserves
Non-distributable Distributable
Foreign
exchange
Share Share translation AFS Revaluation Retained
capital premium reserve reserve reserve profi ts Total
RM’000 RM’000 RM’000 RM’000 RM’000 RM’000 RM’000
Group
At 1 April 2016 213,070 105,051 38,776 3,527 41,666 928,090 1,330,180
Net profi t for the year – – – – – 71,170 71,170
Other comprehensive income for the year – – 16,920 132 1,064 – 18,116
Total comprehensive income/(loss)
for the year – – 16,920 132 1,064 71,170 89,286
Issuance of bonus shares (Note 27) 106,535 (105,051) – – – (1,484) –
At 31 March 2017 319,605 – 55,696 3,659 42,730 997,776 1,419,466
Net profi t for the year – – – – – 140,865 140,865
Other comprehensive (loss)/income
for the year – – (20,798) (2,454) 922 – (22,330)
Total comprehensive (loss)/income
for the year – – (20,798) (2,454) 922 140,865 118,535
At 31 March 2018 319,605 – 34,898 1,205 43,652 1,138,641 1,538,001
Attributable to equity holders of the Holding Company
Reserves
Non-distributable Distributable
Share Share Retained
capital premium profi ts Total
RM’000 RM’000 RM’000 RM’000
Company
At 1 April 2016 213,070 105,051 325,241 643,362
Issuance of bonus shares (Note 27) 106,535 (105,051) (1,484) –
Total comprehensive loss for the year – – (18,200) ( 18,200)
At 31 March 2017 319,605 – 305,557 625,162
Total comprehensive income for the year – – 6,872 6,872
At 31 March 2018 319,605 – 312,429 632,034
The accompanying accounting policies and explanatory notes form an integral part of the fi nancial statements.
STATEMENTS OF CHANGES IN EQUITYfor the year ended 31 March 2018
120 MNRB HOLDINGS BERHAD (13487-A)
KEYMESSAGES LEADERSHIP
CORPORATE DISCLOSURES
STRATEGICREVIEW
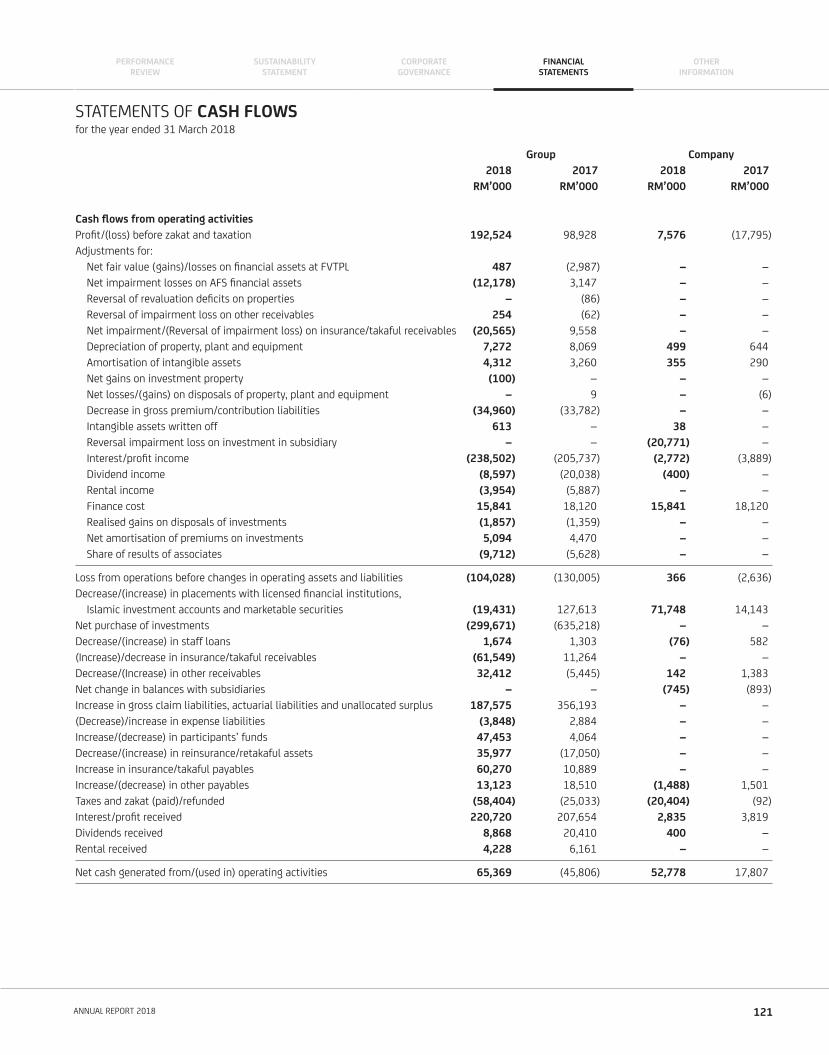
STATEMENTS OF CASH FLOWSfor the year ended 31 March 2018
Group Company
2018 2017 2018 2017
RM’000 RM’000 RM’000 RM’000
Cash fl ows from operating activities
Profi t/(loss) before zakat and taxation 192,524 98,928 7,576 (17,795)
Adjustments for:
Net fair value (gains)/losses on fi nancial assets at FVTPL 487 (2,987) – –
Net impairment losses on AFS fi nancial assets (12,178) 3,147 – –
Reversal of revaluation defi cits on properties – (86) – –
Reversal of impairment loss on other receivables 254 (62) – –
Net impairment/(Reversal of impairment loss) on insurance/takaful receivables (20,565) 9,558 – –
Depreciation of property, plant and equipment 7,272 8,069 499 644
Amortisation of intangible assets 4,312 3,260 355 290
Net gains on investment property (100) – – –
Net losses/(gains) on disposals of property, plant and equipment – 9 – (6)
Decrease in gross premium/contribution liabilities (34,960) (33,782) – –
Intangible assets written off 613 – 38 –
Reversal impairment loss on investment in subsidiary – – (20,771) –
Interest/profi t income (238,502) (205,737) (2,772) (3,889)
Dividend income (8,597) (20,038) (400) –
Rental income (3,954) (5,887) – –
Finance cost 15,841 18,120 15,841 18,120
Realised gains on disposals of investments (1,857) (1,359) – –
Net amortisation of premiums on investments 5,094 4,470 – –
Share of results of associates (9,712) (5,628) – –
Loss from operations before changes in operating assets and liabilities (104,028) (130,005) 366 (2,636)
Decrease/(increase) in placements with licensed fi nancial institutions,
Islamic investment accounts and marketable securities (19,431) 127,613 71,748 14,143
Net purchase of investments (299,671) (635,218) – –
Decrease/(increase) in staff loans 1,674 1,303 (76) 582
(Increase)/decrease in insurance/takaful receivables (61,549) 11,264 – –
Decrease/(Increase) in other receivables 32,412 (5,445) 142 1,383
Net change in balances with subsidiaries – – (745) (893)
Increase in gross claim liabilities, actuarial liabilities and unallocated surplus 187,575 356,193 – –
(Decrease)/increase in expense liabilities (3,848) 2,884 – –
Increase/(decrease) in participants’ funds 47,453 4,064 – –
Decrease/(increase) in reinsurance/retakaful assets 35,977 (17,050) – –
Increase in insurance/takaful payables 60,270 10,889 – –
Increase/(decrease) in other payables 13,123 18,510 (1,488) 1,501
Taxes and zakat (paid)/refunded (58,404) (25,033) (20,404) (92)
Interest/profi t received 220,720 207,654 2,835 3,819
Dividends received 8,868 20,410 400 –
Rental received 4,228 6,161 – –
Net cash generated from/(used in) operating activities 65,369 (45,806) 52,778 17,807
121ANNUAL REPORT 2018
PERFORMANCEREVIEW
CORPORATEGOVERNANCE
SUSTAINABILITYSTATEMENT
FINANCIALSTATEMENTS
OTHERINFORMATION
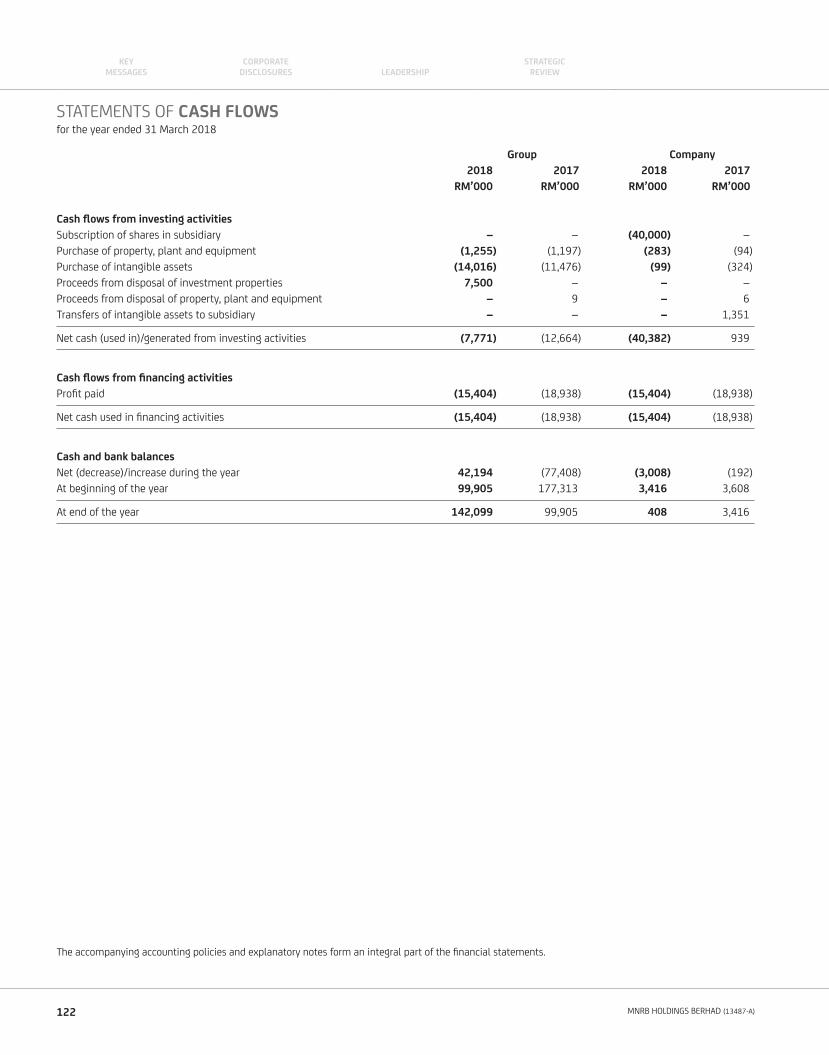
Group Company
2018 2017 2018 2017
RM’000 RM’000 RM’000 RM’000
Cash fl ows from investing activities
Subscription of shares in subsidiary – – (40,000) –
Purchase of property, plant and equipment (1,255) (1,197) (283) (94)
Purchase of intangible assets (14,016) (11,476) (99) (324)
Proceeds from disposal of investment properties 7,500 – – –
Proceeds from disposal of property, plant and equipment – 9 – 6
Transfers of intangible assets to subsidiary – – – 1,351
Net cash (used in)/generated from investing activities (7,771) (12,664) (40,382) 939
Cash fl ows from fi nancing activities
Profi t paid (15,404) (18,938) (15,404) (18,938)
Net cash used in fi nancing activities (15,404) (18,938) (15,404) (18,938)
Cash and bank balances
Net (decrease)/increase during the year 42,194 (77,408) (3,008) (192)
At beginning of the year 99,905 177,313 3,416 3,608
At end of the year 142,099 99,905 408 3,416
The accompanying accounting policies and explanatory notes form an integral part of the fi nancial statements.
STATEMENTS OF CASH FLOWSfor the year ended 31 March 2018
122 MNRB HOLDINGS BERHAD (13487-A)
KEYMESSAGES LEADERSHIP
CORPORATE DISCLOSURES
STRATEGICREVIEW
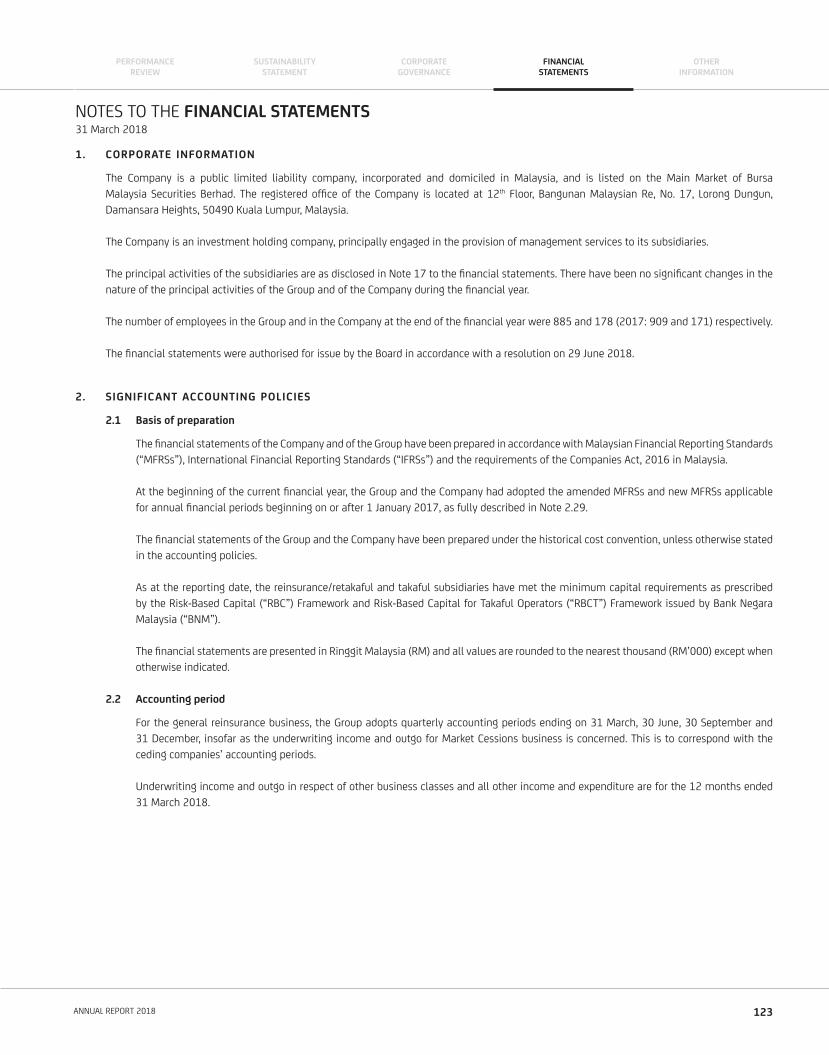
1. CORPORATE INFORMATION
The Company is a public limited liability company, incorporated and domiciled in Malaysia, and is listed on the Main Market of Bursa
Malaysia Securities Berhad. The registered offi ce of the Company is located at 12th Floor, Bangunan Malaysian Re, No. 17, Lorong Dungun,
Damansara Heights, 50490 Kuala Lumpur, Malaysia.
The Company is an investment holding company, principally engaged in the provision of management services to its subsidiaries.
The principal activities of the subsidiaries are as disclosed in Note 17 to the fi nancial statements. There have been no signifi cant changes in the
nature of the principal activities of the Group and of the Company during the fi nancial year.
The number of employees in the Group and in the Company at the end of the fi nancial year were 885 and 178 (2017: 909 and 171) respectively.
The fi nancial statements were authorised for issue by the Board in accordance with a resolution on 29 June 2018.
2. SIGNIFICANT ACCOUNTING POLICIES
2.1 Basis of preparation
The fi nancial statements of the Company and of the Group have been prepared in accordance with Malaysian Financial Reporting Standards
(“MFRSs”), International Financial Reporting Standards (“IFRSs”) and the requirements of the Companies Act, 2016 in Malaysia.
At the beginning of the current fi nancial year, the Group and the Company had adopted the amended MFRSs and new MFRSs applicable
for annual fi nancial periods beginning on or after 1 January 2017, as fully described in Note 2.29.
The fi nancial statements of the Group and the Company have been prepared under the historical cost convention, unless otherwise stated
in the accounting policies.
As at the reporting date, the reinsurance/retakaful and takaful subsidiaries have met the minimum capital requirements as prescribed
by the Risk-Based Capital (“RBC”) Framework and Risk-Based Capital for Takaful Operators (“RBCT”) Framework issued by Bank Negara
Malaysia (“BNM”).
The fi nancial statements are presented in Ringgit Malaysia (RM) and all values are rounded to the nearest thousand (RM’000) except when
otherwise indicated.
2.2 Accounting period
For the general reinsurance business, the Group adopts quarterly accounting periods ending on 31 March, 30 June, 30 September and
31 December, insofar as the underwriting income and outgo for Market Cessions business is concerned. This is to correspond with the
ceding companies’ accounting periods.
Underwriting income and outgo in respect of other business classes and all other income and expenditure are for the 12 months ended
31 March 2018.
NOTES TO THE FINANCIAL STATEMENTS31 March 2018
123ANNUAL REPORT 2018
PERFORMANCEREVIEW
CORPORATEGOVERNANCE
SUSTAINABILITYSTATEMENT
FINANCIALSTATEMENTS
OTHERINFORMATION
2. SIGNIFICANT ACCOUNTING POLICIES (CONT’D)
2.3 Subsidiaries, associates and basis of consolidation
(a) Subsidiaries
A subsidiary is an entity over which the Company has all the following:
(i) power over the investee (i.e., existing rights that give it the current ability to direct the relevant activities of the investee);
(ii) exposure, or rights, to variable returns from its investment with the investee; and
(iii) the ability to use its power over the investee to affect its returns.
The Company re-assesses whether or not it controls an investee if facts and circumstances indicate that there are changes to one
or more of the three elements of control.
Generally, there is a presumption that a majority of voting rights result in control. To support this presumption and when the
Company has less than a majority of the voting or similar rights of an investee, the Company considers all relevant facts and
circumstances in assessing whether it has power over an investee, including:
(i) the contractual arrangement with the other vote holders of the investee;
(ii) rights arising from other contractual arrangements; and
(iii) the Company’s voting rights and potential voting rights.
In the Company’s separate fi nancial statements, investments in subsidiaries are stated at cost less any accumulated impairment
losses. On disposal of such investments, the difference between net disposal proceeds and their carrying amounts is included in the
income statement.
(b) Basis of consolidation
The consolidated fi nancial statements comprise the fi nancial statements of the Company and its subsidiaries as at the reporting
date. The fi nancial statements of the subsidiaries used in the preparation of the consolidated fi nancial statements are prepared for
the same reporting date as the Company.
Subsidiaries are consolidated from the date of acquisition, being the date on which the Company obtains control, and continue to
be consolidated until the date that such control ceases. In preparing the consolidated fi nancial statements, all intra-Group assets
and liabilities, equity, income, expenses and cash fl ows relating to transactions between members of the Group are eliminated in
full. Uniform accounting policies are adopted in the consolidated fi nancial statements for like transactions and events in similar
circumstances.
Acquisitions of subsidiaries are accounted for using the acquisition method. The acquisition method of accounting involves allocating
the cost of the acquisition to the fair value of the assets acquired and liabilities and contingent liabilities assumed at the date of
acquisition. The cost of an acquisition is measured as the aggregate of the fair values, at the date of exchange, of the assets given,
liabilities incurred or assumed, and equity instruments issued, plus any costs directly attributable to the acquisition.
Any excess of the cost of the acquisition over the Company’s interest in the net fair value of the identifi able assets, liabilities and
contingent liabilities represents goodwill. Any excess of the Company’s interest in the net fair value of the identifi able assets,
liabilities and contingent liabilities over the cost of acquisition is recognised immediately in the income statement.
NOTES TO THE FINANCIAL STATEMENTS31 March 2018
124 MNRB HOLDINGS BERHAD (13487-A)
KEYMESSAGES LEADERSHIP
CORPORATE DISCLOSURES
STRATEGICREVIEW
2. SIGNIFICANT ACCOUNTING POLICIES (CONT’D)
2.3 Subsidiaries, associates and basis of consolidation (Cont’d)
(c) Takaful and retakaful operations and funds
Under the concept of takaful/retakaful, participants/cedants make contributions to a pool which is managed by a third party with
the overall aim of using the monies to aid fellow participants in times of need. Accordingly, TIB and MRE’s Retakaful Division
(“MRRD”) manage the general and family takaful and retakaful funds in line with the principles of Wakalah (agency). Under the
Wakalah model, TIB/MRRD is not a participant in the fund but manages the funds (including the relevant assets and liabilities)
towards the purpose outlined above.
In accordance with the Islamic Financial Services Act (“IFSA”) 2013, the assets and liabilities of the takaful/retakaful funds are
segregated from those of the shareholder’s funds of TIB/MRRD: a concept known as segregation of funds. However, in compliance
with MFRS 10 Consolidated Financial Statements, the assets, liabilities, income and expenses of the takaful and retakaful funds are
consolidated with those of the shareholder’s funds to represent the control possessed by TIB and MRRD over the respective funds.
In preparing the Group fi nancial statements, the balances and transactions of the shareholder’s funds of TIB and MRRD were
amalgamated and combined with those of the takaful and retakaful funds respectively. Interfund balances, transactions and
unrealised gains or losses are eliminated in full during amalgamation and consolidation.
The takaful and retakaful funds of TIB and MRRD are consolidated and amalgamated from the date of control and continue to be
consolidated until the date such control ceases.
(d) Associates
Associates are entities in which the Group has signifi cant infl uence and that is neither a subsidiary nor an interest in a joint venture.
Signifi cant infl uence is the power to participate in the fi nancial and operating policy decisions of the investee but not in control or
joint control over those policies.
Investments in associates are accounted for in the consolidated fi nancial statements using the equity method of accounting.
Under the equity method, the investments in associates are carried in the consolidated statement of fi nancial position at cost
adjusted for post-acquisition changes in the Group’s share of net assets of the associates. The Group’s share of the net profi t or loss
of the associates is recognised in the consolidated income statement. Where there has been a change recognised directly in the
equity of the associates, the Group recognises its share of such changes.
In applying the equity method, unrealised gains and losses on transactions between the Group and the associates are eliminated
to the extent of the Group’s interest in the associates. After application of the equity method, the Group determines whether
it is necessary to recognise any additional impairment loss with respect to the Group’s net investments in the associates.
The investments in associates are accounted for using the equity method from the date the Group obtains signifi cant infl uence until
the date the Group ceases to have signifi cant infl uence over the associates or the investments become subsidiaries.
Goodwill relating to an associate is included in the carrying amount of the investment and is not amortised. Any excess of the
Group’s share of the net fair value of the associates’ identifi able assets, liabilities and contingent liabilities over the cost of the
investments is excluded from the carrying amount of the investments and is instead included as income in the determination of
the Group’s share of the associates’ profi t or loss in the period in which the investments are acquired.
When the Group’s share of losses in associates equal or exceed its interest in the associates, including any long-term interests that,
in substance, form part of the Group’s net investments in the associates, the Group does not recognise further losses, unless it has
incurred obligations or made payments on behalf of the associates.
125ANNUAL REPORT 2018
PERFORMANCEREVIEW
CORPORATEGOVERNANCE
SUSTAINABILITYSTATEMENT
FINANCIALSTATEMENTS
OTHERINFORMATION
2. SIGNIFICANT ACCOUNTING POLICIES (CONT’D)
2.3 Subsidiaries, associates and basis of consolidation (Cont’d)
(d) Associates (Cont’d)
The most recent available audited fi nancial statements of the associates are used by the Group in applying the equity method.
Where the dates of the audited fi nancial statements used are not co-terminous with those of the Group, the share of results is
derived from the last audited fi nancial statements available and management fi nancial statements to the end of the accounting
period. Uniform accounting polices are adopted for like transactions and events in similar circumstances.
In the Company’s separate fi nancial statements, investments in associates are stated at cost less any accumulated impairment
losses.
On disposal of such investments, the difference between net disposal proceeds and the carrying amount is included in the income
statement.
2.4 General reinsurance, takaful and retakaful underwriting results
The general reinsurance, takaful and retakaful underwriting results are determined after taking into account premiums/contributions,
reinsurance/retakaful/retrotakaful costs, commissions, movements in premium/contribution liabilities, net claims incurred and wakalah
fees.
The general takaful and retakaful funds are maintained in accordance with the IFSA 2013 and consist of the accumulated surplus/defi cit
in the funds, AFS reserves and revaluation surplus. Any defi cit will be made good by the shareholder’s fund via a loan or Qard.
In general takaful and retakaful funds, the surplus distributable to the participants is determined after deducting retakaful/retrotakaful
costs, movements in contribution liabilities, commissions, net claims incurred, wakalah fees, expenses, taxation and surplus administration
charges. The surplus may be distributed to the shareholder and participants in accordance with the terms and conditions of the respective
contracts or as prescribed by the Group Shariah Committee.
(a) Premium and contribution recognition
Gross premiums/contributions are recognised in a fi nancial period in respect of risks assumed during the particular fi nancial period.
Gross premiums/contributions include premium/contribution income in relation to direct general business, inwards facultative
business, inwards proportional treaty reinsurance/retakaful and inwards non-proportional treaty reinsurance/retakaful.
Contributions from direct businesses are recognised following individual risks’ inception dates. Inwards facultative premiums/
contributions are recognised in the fi nancial period in respect of the facultative risk assumed during the particular fi nancial period
following individual risks inception dates.
Inwards proportional treaty premiums/contributions are recognised on the basis of periodic advices received from cedants given
that the periodic advices refl ect the individual underlying risks being incepted and reinsured/covered at various inception dates of
these risks and contractually accounted for under the terms of the proportional reinsurance/retakaful treaty.
Premium/contribution income on inwards non-proportional treaties, which cover losses occurring during a specifi ed treaty period,
are recognised based on the contractual premiums/contributions already established at the start of the treaty period under the
terms and conditions of each contract.
31 March 2018
NOTES TO THE FINANCIAL STATEMENTS
126 MNRB HOLDINGS BERHAD (13487-A)
KEYMESSAGES LEADERSHIP
CORPORATE DISCLOSURES
STRATEGICREVIEW
2. SIGNIFICANT ACCOUNTING POLICIES (CONT’D)
2.4 General reinsurance, takaful and retakaful underwriting results (Cont’d)
(b) Premium and contribution liabilities
Premium/contribution liabilities represent the future obligations on insurance/takaful contracts as represented by premiums/
contributions received for risks that have not yet expired. The movement in premium/contribution liabilities is released over the
term of the insurance/takaful contracts and recognised as earned premium/contribution income.
Premium/contribution liabilities are reported at the higher of the aggregate of the unearned premium reserves (“UPR”)/unearned
contribution reserves (“UCR”) respectively for all lines of business or the best estimate value of the unexpired risk reserves (“URR”)
and a provision of risk margin for adverse deviation (“PRAD”) calculated at 75% confi dence level at the end of the fi nancial year.
(i) Unexpired risk reserves
The URR is a prospective estimate of the expected future payments arising from future events insured or covered under
policies or contracts in force as at the end of the fi nancial year and also includes allowance for expenses, including overheads
and costs of reinsurance/retakaful, expected to be incurred during the unexpired period in administering these policies or
contracts and settling the relevant claims, and shall allow for expected future premium/contribution refunds.
URR is estimated via an actuarial valuation performed by qualifi ed actuary, using a mathematical method of estimation
similar to incurred but not reported (“IBNR”) claims.
(ii) Unearned premium and contribution reserves
The UPR/UCR represents the portion of the net premiums/contributions of insurance/takaful contracts written that relate to
the unexpired periods of the contracts at the end of the fi nancial year. The UCR is computed on net contribution income with
a further deduction for wakalah fee expenses to refl ect the wakalah business principle. The methods of computation of UPR/
UCR are as follows:
- For inwards proportional treaty reinsurance/retakaful business, UPR/UCR is computed on the 1/8th method commencing
from the quarter corresponding to the reporting quarter of the treaty statement;
- For inwards non-proportional treaty reinsurance/retakaful business, UPR/UCR is computed at 1/2 of the last quarter
Minimum Deposit Premiums/Contributions received;
- For inwards facultative reinsurance/retakaful business, UPR/UCR is computed on the 1/8th method commencing from
the date of inception;
- Time apportionment method for all classes of general takaful business within Malaysia except Marine and Aviation
Cargo; and
- 25% method for Marine and Aviation Cargo.
(c) Claim liabilities
The amount of outstanding claims is the best estimate value of claim liabilities, which include provision for claims reported, claims
incurred but not enough reserved (“IBNER”) and IBNR claims together with related expenses less recoveries to settle the present
obligation as well as a PRAD calculated at 75% confi dence level at the end of the fi nancial year. Liabilities for outstanding claims are
recognised when a claimable event occurs and/or as advised/notifi ed. IBNER and IBNR claims are based on an actuarial valuation
by qualifi ed actuary, using a mathematical method of estimation based on, amongst others, actual claims development patterns.
127ANNUAL REPORT 2018
PERFORMANCEREVIEW
CORPORATEGOVERNANCE
SUSTAINABILITYSTATEMENT
FINANCIALSTATEMENTS
OTHERINFORMATION
2. SIGNIFICANT ACCOUNTING POLICIES (CONT’D)
2.4 General reinsurance, takaful and retakaful underwriting results (Cont’d)
(d) Liability adequacy test
At each reporting date, the Group reviews all insurance/takaful contract liabilities to ensure that the carrying amount of the liabilities
is suffi cient or adequate to cover the obligations of the Group, contractual or otherwise, with respect to insurance/takaful contracts
issued. In performing this review, the Group compares all contractual cash fl ows against the carrying value of insurance/takaful
contract liabilities. Any defi ciency is recognised in the income statement.
The estimation of claim liabilities and premium/contribution liabilities performed at the reporting date is part of the liability
adequacy tests performed by the Group.
(e) Acquisition costs and commission expenses
The acquisition costs and commission expenses, which are costs directly incurred in acquiring and renewing reinsurance/takaful/
retakaful business, are recognised as incurred and properly allocated to the periods in which it is probable they give rise to income.
2.5 Family takaful and retakaful underwriting results
The family takaful and retakaful underwriting results are determined after taking into account contributions, retakaful/retrotakaful costs,
commissions, net benefi ts incurred and wakalah fees.
The family takaful and retakaful funds are maintained in accordance with the requirements of the IFSA 2013 and consist of the
accumulated surplus/defi cit in the funds, AFS reserves and revaluation surplus. The family takaful and retakaful funds surplus/defi cit
is determined by an annual actuarial valuation of the funds. Any actuarial defi cit in the family takaful and retakaful funds will be
made good by the shareholder’s fund via a loan or Qard.
In the family takaful and retakaful funds, the surplus distributable to the participants is determined after deducting retakaful/retrotakaful
costs, net benefi ts incurred, wakalah fees, expenses, taxation and surplus administration charges. The surplus may be distributed to the
shareholder and participants in accordance with the terms and conditions of the respective contracts or as prescribed by the Group Shariah
Committee.
(a) Contribution recognition
Takaful contribution is recognised as soon as the amount of contribution can be reliably measured in accordance with the principles
of Shariah. First year contribution is recognised on the assumption of risks and subsequent takaful contributions are recognised
on due dates. Takaful contributions outstanding at the reporting date are recognised as income for the period provided they are
within the grace period allowed for payment and there are suffi cient funds available in the participants’ accounts to cover such
contributions due.
Retakaful contributions are recognised in respect of risks assumed during a particular fi nancial period. Inward treaty retakaful
contributions are recognised on the basis of statements received from ceding companies.
(b) Contract liabilities
Family takaful contract liabilities are recognised when contracts are in-force and contributions are charged. Liabilities of benefi ts
payable of the family retakaful fund are recognised as advised by ceding companies.
For a one year family contract or a one year extension to a family contract covering contingencies other than life or survival, the
liabilities for such family takaful contracts comprise contribution and claim liabilities with an appropriate allowance for PRAD from
the expected experience.
NOTES TO THE FINANCIAL STATEMENTS31 March 2018
128 MNRB HOLDINGS BERHAD (13487-A)
KEYMESSAGES LEADERSHIP
CORPORATE DISCLOSURES
STRATEGICREVIEW
2. SIGNIFICANT ACCOUNTING POLICIES (CONT’D)
2.5 Family takaful and retakaful underwriting results (Cont’d)
(b) Contract liabilities (Cont’d)
Liabilities of family takaful business are determined in accordance with valuation guidelines for takaful operators issued by
Bank Negara Malaysia (“BNM”). All family takaful liabilities are valued using a prospective actuarial valuation based on the sum
of the present value of future benefi ts and expenses less future gross considerations arising from the contracts, discounted at
the appropriate risk discount rate. This method is known as the gross contribution valuation method. In the case of a family
contract where a part of, or the whole of, the contributions are accumulated in a fund, the accumulated amounts as declared to
the participants are set as the liabilities. Zerorisation is applied at contract level and no contract is treated as an asset under the
valuation method adopted.
The family takaful contract liabilities are derecognised when the contracts expire, are discharged or are cancelled. At each reporting
date, an assessment is made of whether the recognised family takaful contract liabilities are adequate by performing a liability
adequacy test as disclosed in Note 2.5(d).
In respect of the family takaful and retakaful risk fund, the expected future cash fl ows of benefi ts are determined using best
estimate assumptions with an appropriate allowance for PRAD from expected experience such that an overall level of suffi ciency of
contract reserves at a 75% confi dence level is secured. For investment-linked business, the fund value is treated as liabilities.
The distribution of surplus, arising from the difference between the value of the family fund and its liabilities, including retained
surplus, if declared, could only be distributed to the participants after deducting the surplus administration charge.
If the difference between the value of the family fund and the liabilities results in a defi cit, the defi cit is made good via a Qard from
the shareholder’s funds which will be repaid when the fund returns to a surplus position.
(c) Creation/cancellation of units of family takaful fund
Amounts received for units created represent contributions paid by participants or unitholders as payment for new contracts
or subsequent payments to increase the amount of the contracts. Creation/cancellation of units are recognised in the fi nancial
statements at the next valuation date, after the request to purchase/sell units are received from the participants or unitholders.
(d) Liability adequacy test
At each reporting date, the Group reviews all takaful contract liabilities to ensure that the carrying amount of the liabilities
is suffi cient or adequate to cover the obligations of the Group, contractual or otherwise, with respect to takaful contracts issued.
In performing this review, the Group compares all contractual cash fl ows against the carrying value of takaful contract liabilities.
Any defi ciency is recognised in the income statement.
2.6 Shareholder’s fund relating to takaful and retakaful business
(a) Commission expenses
Commission expenses, which are costs directly incurred in securing contributions on takaful contracts, are recognised as incurred
and properly allocated to the periods in which it is probable they give rise to income. Commission expenses are recognised in the
income statement at an agreed percentage for each contract underwritten. This is in accordance with the principles of Wakalah
as approved by the Group Shariah Committee and as agreed between the participants and TIB/MRRD.
129ANNUAL REPORT 2018
PERFORMANCEREVIEW
CORPORATEGOVERNANCE
SUSTAINABILITYSTATEMENT
FINANCIALSTATEMENTS
OTHERINFORMATION
2. SIGNIFICANT ACCOUNTING POLICIES (CONT’D)
2.6 Shareholder’s fund relating to takaful and retakaful business (Cont’d)
(b) Expense liabilities
The expense liabilities of the shareholder’s fund consist of expense liabilities relating to the management of the general takaful and
retakaful funds and the family takaful and retakaful funds which are based on estimations performed by qualifi ed actuaries. The
movement in expense liabilities is released over the term of the takaful contracts and recognised in the income statement.
(i) Expense liabilities of general takaful and retakaful funds
The expense liabilities of the general takaful and retakaful funds are reported at the higher of the aggregate of the reserves
for unearned wakalah fees (“UWF”) and the best estimate value of the provision for unexpired expense reserves (“UER”) and
a PRAD at a 75% confi dence level at the end of the fi nancial year.
Unexpired expense reserves
The UER is determined based on the expected future expenses payable by the shareholder’s funds in managing the general
takaful and retakaful funds for the full contractual obligation of the takaful and retakaful contracts as at the end of the
fi nancial year, less any expected cash fl ows from future wakalah fee income, and any other income due to the shareholder’s
funds that can be determined with reasonable certainty, including a PRAD calculated at a 75% confi dence level. The method
used to value the UER is consistent with the method used in estimating the URR as disclosed in Note 2.4(b)(i).
Reserves for unearned wakalah fees
The UWF represent the portion of wakalah fee income that relate to the unexpired periods of contracts at the end of the
fi nancial year. The method used in computing UWF is consistent with the methods used in the calculation of the UCR as
disclosed in Note 2.4(b)(ii).
(ii) Expense liabilities of family takaful and retakaful funds
The valuation of expense liabilities in relation to contracts of the family takaful and retakaful funds is conducted separately
by the Appointed Actuaries. The method used to value expense liabilities is consistent with the method used to value takaful
and retakaful liabilities of the corresponding family takaful and retakaful contracts. In valuing the expense liabilities, the
present value of expected future expenses payable by the shareholder’s funds in managing the takaful and retakaful funds
for the full contractual obligation of the takaful and retakaful contracts less any expected cash fl ows from future wakalah fee
income, and any other income due to the shareholder’s funds that can be determined with reasonable certainty, are taken
into consideration. The estimation includes a PRAD at a 75% confi dence level.
(iii) Liability adequacy test
At each reporting date, the Group reviews the expense liabilities to ensure that the carrying amount is suffi cient or adequate
to cover the obligations of the Group for all managed takaful and retakaful contracts. In performing this review, the Group
considers all contractual cash fl ows and compares this against the carrying value of expense liabilities. Any defi ciency is
recognised in the income statement.
2.7 Product classifi cation
Financial risk is the risk of a possible future change in one or more of a specifi ed interest/profi t rate, fi nancial instrument price, commodity
price, foreign exchange rate, index of price or rate, credit rating or credit index or other variable, provided in the case of a non-fi nancial
variable that the variable is not specifi c to a party to the contract. Insurance/underwriting risk is the risk other than fi nancial risk.
NOTES TO THE FINANCIAL STATEMENTS31 March 2018
130 MNRB HOLDINGS BERHAD (13487-A)
KEYMESSAGES LEADERSHIP
CORPORATE DISCLOSURES
STRATEGICREVIEW
2. SIGNIFICANT ACCOUNTING POLICIES (CONT’D)
2.7 Product classifi cation (Cont’d)
An insurance/takaful contract is a contract under which the reinsurance, takaful and retakaful subsidiaries have accepted signifi cant
insurance/underwriting risk from another party by agreeing to compensate the party if a specifi ed uncertain future event adversely affects
the party. As a general guideline, the reinsurance, takaful and retakaful subsidiaries determine whether signifi cant insurance/underwriting
risk has been accepted by comparing claims/benefi ts payable on the occurrence of the event with claims/benefi ts payable if the event had
not occurred.
Conversely, investment contracts are those contracts that transfer fi nancial risk with no signifi cant insurance/underwriting risk.
Once a contract has been classifi ed as an insurance/takaful contract, it remains an insurance/takaful contract for the remainder of its
life-time, even if the insurance/underwriting risk reduces signifi cantly during the period, unless all rights and obligations expire or are
extinguished.
2.8 Reinsurance and retakaful
The reinsurance/retakaful and takaful subsidiaries cede insurance/underwriting risk in the normal course of business. Ceded reinsurance
and retakaful arrangements do not relieve the reinsurance/retakaful and takaful subsidiaries from their obligations to cedants/participants.
For both ceded and assumed reinsurance and retakaful, premiums/contributions and claims/benefi ts are presented on a gross basis.
Reinsurance and retakaful arrangements entered into by the reinsurance/retakaful and takaful subsidiaries that meet the classifi cation
requirements of insurance/takaful contracts as described in Note 2.7 are accounted for as noted below. Arrangements that do not meet
these classifi cation requirements are accounted for as fi nancial assets.
Reinsurance and retakaful assets represent amounts recoverable from reinsurers and retakaful operators for insurance and takaful contract
liabilities which have yet to be settled at the reporting date. Amounts recoverable from reinsurers and retakaful operators are measured
consistently with the amounts associated with the underlying insurance and takaful contracts and the terms of the relevant reinsurance
and retakaful arrangement.
At each reporting date, the reinsurance/retakaful and takaful subsidiaries assess whether objective evidence exists that reinsurance
and retakaful assets are impaired. Objective evidence of impairment for reinsurance and retakaful assets are similar to those noted for
insurance and takaful receivables. If any such evidence exists, the amount of the impairment loss is measured as the difference between
the asset’s carrying amount and the present value of estimated future cash fl ows discounted at the fi nancial asset’s original effective
interest/profi t rate. The impairment loss is recognised in the income statement. Reinsurance and retakaful assets are derecognised when
the contractual rights expire or are extinguished or when the contract is transferred to another party.
2.9 Property, plant and equipment and depreciation
(a) Recognition and measurement
All items of property, plant and equipment are initially recorded at cost. Subsequent to recognition, plant and equipment are
stated at cost less accumulated depreciation and any impairment losses, whilst properties are stated at revalued amounts less
subsequent accumulated depreciation and subsequent impairment losses. Cost includes expenditures that are directly attributable
to the acquisition of the asset.
In respect of freehold land and buildings, valuations are performed with suffi cient frequency to ensure that the carrying amount
does not differ materially from the fair value of the freehold land and buildings at the reporting date.
Any revaluation surplus is recognised in other comprehensive income and accumulated in equity under the asset revaluation reserve,
except to the extent that it reverses a revaluation decrease of the same asset previously recognised in the income statement, in
which case the increase is recognised in the income statement. A revaluation defi cit is recognised in the income statement, except
to the extent that it offsets an existing surplus on the same asset carried in the asset revaluation reserve.
131ANNUAL REPORT 2018
PERFORMANCEREVIEW
CORPORATEGOVERNANCE
SUSTAINABILITYSTATEMENT
FINANCIALSTATEMENTS
OTHERINFORMATION
2. SIGNIFICANT ACCOUNTING POLICIES (CONT’D)
2.9 Property, plant and equipment and depreciation (Cont’d)
(a) Recognition and measurement (Cont’d)
Any accumulated depreciation as at the revaluation date is eliminated against the gross carrying amount of the asset and the net
amount is restated to the revalued amount of the asset. On disposal of property, plant and equipment, the difference between net
proceeds and the carrying amount is recognised in the income statement and the unutilised portion of the revaluation surplus on
that item is taken directly to retained profi ts.
(b) Subsequent costs
The cost of replacing part of an item of property, plant and equipment is recognised in the carrying amount of the item if it is
probable that the future economic benefi ts embodied within the part will fl ow to the Group and its cost can be measured reliably.
The costs of the day-to-day servicing of property, plant and equipment are recognised in the income statement as incurred.
(c) Depreciation
Freehold land has an unlimited useful life and therefore is not depreciated. Leased properties are depreciated over the shorter of the
lease term and their useful lives.
Work in progress is also not depreciated as it is not available for use. When work in progress is completed and the asset is available
for use, it is reclassifi ed to the relevant category of property, plant and equipment and depreciation of the asset begins. During the
period in which the asset is not yet available for use, it is tested for impairment annually.
Depreciation of other property, plant and equipment is provided for on a straight-line basis to write off the cost of each asset to its
residual value over its estimated useful life, at the following annual rates:
Buildings 2% to 3%
Computer equipment 10% to 33.3%
Offi ce equipment 10% to 33.3%
Furniture and fi ttings 10% to 15%
Motor vehicles 20%
The residual values, useful lives and depreciation method are reviewed at the end of each fi nancial year to ensure that the amount,
method and period of depreciation are consistent with previous estimates and the expected pattern of consumption of the future
economic benefi ts embodied in the items of property, plant and equipment.
2.10 Investment properties
Investment properties are properties which are held either to earn rental income and/or for capital appreciation. Such properties are
measured initially at cost, including transaction costs. Subsequent to initial recognition, investment properties are stated at fair value.
Fair value is arrived at by reference to market evidence of transaction prices for similar properties and is performed by registered
independent valuers having an appropriate recognised professional qualifi cation and recent experience in the location and category of the
properties being valued.
Gains or losses arising from changes in the fair values of investment properties are recognised in the income statement in the year in
which they arise.
Investment properties are derecognised when either they have been disposed of or when the investment properties are permanently
withdrawn from use and no future economic benefi t is expected from the disposals. Any gains or losses on the retirement or disposal of
an investment property are recognised in the income statement in the year in which they arise.
NOTES TO THE FINANCIAL STATEMENTS31 March 2018
132 MNRB HOLDINGS BERHAD (13487-A)
KEYMESSAGES LEADERSHIP
CORPORATE DISCLOSURES
STRATEGICREVIEW
2. SIGNIFICANT ACCOUNTING POLICIES (CONT’D)
2.10 Investment properties (Cont’d)
Transfers are made to or from investment property only when there is a change in use. For a transfer from owner-occupied property
to investment property, any excess of the property’s carrying value over its fair value is accounted for as a revaluation surplus which
is recognised in other comprehensive income. Any defi cit between the property’s carrying value and its fair value is recognised as an
impairment loss in the income statement. Subsequent to the date of change in use, the property is measured similar to other investment
properties. Any revaluation surplus previously recognised in other comprehensive income is transferred to the income statement only
upon disposal of the property.
2.11 Intangible assets
All intangible assets are initially recorded at cost. Subsequent to recognition, intangible assets are stated at cost less any accumulated
amortisation and any impairment losses. Cost includes expenditures that are directly attributable to the acquisition of the asset.
On disposal of intangible assets, the difference between net proceeds and the carrying amount is recognised in the income statement.
The useful lives of intangible assets are assessed to be either fi nite or indefi nite. Intangible assets with fi nite lives are amortised on
a straight-line basis over the estimated economic useful lives and assessed for impairment whenever there is an indication that the
intangible assets may be impaired. The amortisation period and the amortisation method for an intangible asset with a fi nite useful life
are reviewed annually at the end of each reporting period. Amortisation is charged to the income statement.
Intangible assets with indefi nite useful lives are not amortised but tested for impairment annually or more frequently if events or changes
in circumstances indicate that the carrying value may be impaired either individually or at the cash-generating unit level. The useful life
of an intangible asset with an indefi nite life is also reviewed annually to determine whether the useful life assessment continues to be
supportable.
(a) Software development in progress
Software development in progress represent development expenditure on software. Following the initial recognition of the
development expenditure, the cost model is applied requiring the asset to be carried at cost less any accumulated impairment
losses. When development is complete and the asset is available for use, it is reclassifi ed to computer software and amortisation of
the asset begins. It is amortised over the period of expected future use. During the period in which the asset is not yet available for
use, it is tested for impairment annually.
(b) Computer software and licences
The useful lives of computer software and licences are considered to be fi nite because computer software and licences are
susceptible to technological obsolescence.
The acquired computer software and licences are amortised using the straight-line method over their estimated useful lives.
Impairment is assessed whenever there is an indication of impairment and the amortisation period and method are also reviewed
annually at the end of each fi nancial year.
2.12 Financial assets
(a) Initial recognition and measurement
Financial assets are recognised in the statements of fi nancial position when, and only when, the Group and the Company become
a party to the contractual provisions of the instrument.
A fi nancial asset is recognised initially at its fair value plus, in the case of a fi nancial asset not at FVTPL, transaction costs that are
directly attributable to the acquisition of the fi nancial asset.
133ANNUAL REPORT 2018
PERFORMANCEREVIEW
CORPORATEGOVERNANCE
SUSTAINABILITYSTATEMENT
FINANCIALSTATEMENTS
OTHERINFORMATION
2. SIGNIFICANT ACCOUNTING POLICIES (CONT’D)
2.12 Financial assets (Cont’d)
(a) Initial recognition and measurement (Cont’d)
An embedded derivative is recognised separately from the host contract and accounted for as a derivative if, and only if, it is not
closely related to the economic characteristics and risks of the host contract and the host contract is not categorised at FVTPL.
The host contract, in the event an embedded derivative is recognised separately, is accounted for in accordance with the policy
applicable to the nature of the host contract.
(b) Classifi cation and subsequent measurement
The Group and the Company determine the classifi cation of its fi nancial assets at initial recognition and this depends on the purpose
for which the investments were acquired or originated. The following classifi cations are used by the Group and the Company in
categorising its fi nancial assets:
(i) Financial assets at FVTPL
Financial assets are classifi ed as fi nancial assets at FVTPL if they are held for trading or are designated as such upon initial
recognition. Financial assets held for trading are derivatives (including separated embedded derivatives) or fi nancial assets
acquired principally for the purpose of selling in the near term.
Subsequent to initial recognition, fi nancial assets at FVTPL are measured at fair value. Any gains or losses arising from
changes in fair value are recognised in the income statement. Net gains or net losses on fi nancial assets at FVTPL do not
include exchange differences, interest/profi t income and dividend income. Exchange differences, interest/profi t income and
dividend income on fi nancial assets at FVTPL are recognised in the appropriate categories of income and expenses in the
income statement.
(ii) HTM investments
Financial assets with fi xed or determinable payments and fi xed maturities are classifi ed as HTM when the Group and the
Company have the positive intention and ability to hold the investments to maturity.
Subsequent to initial recognition, HTM investments are measured at amortised cost using the effective interest/yield
method less any accumulated impairment losses. Gains and losses are recognised in the income statement when the HTM
investments are derecognised or impaired, and through the amortisation process.
(iii) Loans and receivables
Financial assets with fi xed or determinable payments that are not quoted in an active market are classifi ed as loans and
receivables.
Subsequent to initial recognition, loans and receivables are measured at amortised cost using the effective interest/yield
method. Gains and losses are recognised in the income statement when the loans and receivables are derecognised or
impaired, and through the amortisation process.
NOTES TO THE FINANCIAL STATEMENTS31 March 2018
134 MNRB HOLDINGS BERHAD (13487-A)
KEYMESSAGES LEADERSHIP
CORPORATE DISCLOSURES
STRATEGICREVIEW
2. SIGNIFICANT ACCOUNTING POLICIES (CONT’D)
2.12 Financial assets (Cont’d)
(b) Classifi cation and subsequent measurement (Cont’d)
(iv) AFS fi nancial assets
AFS fi nancial assets are fi nancial assets that are designated as available for sale or are not classifi ed in any of the three
preceding categories.
After initial recognition, AFS fi nancial assets are subsequently measured at fair value. Any gains or losses from changes
in fair value of the fi nancial asset are recognised in other comprehensive income, except that impairment losses, foreign
exchange gains and losses on monetary instruments and interest/profi t calculated using the effective interest/yield method
are recognised in the income statement. The cumulative gain or loss previously recognised is reclassifi ed from other
comprehensive income to the income statement as a reclassifi cation adjustment when the fi nancial asset is derecognised.
Interest/profi t income calculated using the effective interest/yield method is recognised in the income statement.
Investments in equity instruments whose fair value cannot be reliably measured are measured at cost less accumulated
impairment losses.
(c) Derecognition
A fi nancial asset is derecognised when the contractual right to receive cash fl ows from the asset has expired or the Group and the
Company have transferred their rights to receive cash fl ows from the asset or have assumed an obligation to pay the received cash
fl ows in full. On derecognition of a fi nancial asset in its entirety, the difference between the carrying amount and the sum of the
consideration received and any cumulative gain or loss that had been recognised in other comprehensive income is recognised in
the income statement.
(d) Offsetting of fi nancial instruments
Financial assets and fi nancial liabilities are offset and the net amount is reported in the statements of fi nancial position if there is
a currently enforceable legal right to offset the recognised amounts and there is an intention to settle on a net basis, to realise the
assets and settle the liabilities simultaneously.
2.13 Fair value measurement
The Group and the Company measure fi nancial instruments such as fi nancial assets at FVTPL and non-fi nancial assets such as investment
properties and self-occupied properties at fair value at each reporting date. Also, fair values of fi nancial instruments measured at amortised
cost are disclosed in Notes 19 and 39.
Fair value is the price that would be received to sell an asset or paid to transfer a liability in an orderly transaction between market
participants at the measurement date. The fair value measurement is based on the presumption that the transaction to sell the asset or
transfer the liability takes place either:
(a) In the principal market for the asset or liability; or
(b) In the absence of a principal market, in the most advantageous market for the asset or liability.
The principal or the most advantageous market must be accessible by the Group and the Company.
The fair value of an asset or a liability is measured using the assumptions that market participants would use when pricing the asset or
liability, assuming that market participants act in their economic best interest. A fair value measurement of a non-fi nancial asset takes
into account a market participant’s ability to generate economic benefi ts by using the asset in its highest and best use or by selling it to
another market participant that would use the asset in its highest and best use.
135ANNUAL REPORT 2018
PERFORMANCEREVIEW
CORPORATEGOVERNANCE
SUSTAINABILITYSTATEMENT
FINANCIALSTATEMENTS
OTHERINFORMATION
2. SIGNIFICANT ACCOUNTING POLICIES (CONT’D)
2.13 Fair value measurement (Cont’d)
The Group and the Company use valuation techniques that are appropriate in the circumstances and for which suffi cient data are available
to measure fair value, maximising the use of relevant observable inputs and minimising the use of unobservable inputs.
All assets and liabilities for which fair value is measured or disclosed in the fi nancial statements are categorised within the fair value
hierarchy, described as follows, based on the lowest level input that is signifi cant to the fair value measurement as a whole:
Level 1 – Quoted prices (unadjusted) in active markets for identical assets or liabilities
Level 2 – Inputs that are based on observable market data, either directly or indirectly
Level 3 – Inputs that are not based on observable market data
An annual valuation is performed to refl ect the fair value of the Group’s self-occupied property and investment properties. At the end of
each fi nancial year, accredited independent valuers having appropriate recognised professional qualifi cation are appointed to perform the
annual valuation. The valuation techniques used by the accredited independent valuers are verifi ed to ensure that they are in accordance
with the requirements of MFRS 13 Fair Value Measurement.
For assets and liabilities that are recognised in the fi nancial statements on a recurring basis, the Group and the Company determine
whether transfers have occurred between levels in the hierarchy by re-assessing categorisation (based on the lowest level input that
is signifi cant to the fair value measurement as a whole) at the end of each reporting period. The fair value hierarchy of assets that are
measured at fair value and/or for which fair value are disclosed is presented in Note 39.
2.14 Impairment of assets
(a) Financial assets
The Group and the Company assess at the end of each reporting period whether there is any objective evidence that a fi nancial asset
or a group of fi nancial assets is impaired.
(i) Financial assets carried at amortised cost
The Group and the Company fi rst assess whether objective evidence of impairment exists individually for fi nancial assets
that are individually signifi cant, and individually or collectively for fi nancial assets that are not individually signifi cant. If it is
determined that no objective evidence of impairment exists for an individually assessed fi nancial asset, whether signifi cant or
not, the asset is included in a group of fi nancial assets with similar credit risk characteristics and that group of fi nancial assets
is collectively assessed for impairment. Assets that are individually assessed for impairment and for which an impairment
loss is or continues to be recognised are not included in a collective assessment of impairment. The impairment assessment
is performed at the end of each reporting period.
If there is objective evidence that an impairment loss on assets carried at amortised cost has been incurred, the amount of
the impairment loss is measured as the difference between the asset’s carrying amount and the present value of estimated
future cash fl ows (excluding future expected credit losses that have not been incurred) discounted at the fi nancial asset’s
original effective interest/yield rate. The carrying amount of the asset is reduced and the loss is recorded in the income
statement.
If, in a subsequent period, the amount of the impairment loss decreases and the decrease can be related objectively to an
event occurring after the impairment was recognised, the previously recognised impairment loss is reversed. Any subsequent
reversal of an impairment loss is recognised in the income statement, to the extent that the carrying value of the asset does
not exceed its amortised cost at the reversal date.
NOTES TO THE FINANCIAL STATEMENTS31 March 2018
136 MNRB HOLDINGS BERHAD (13487-A)
KEYMESSAGES LEADERSHIP
CORPORATE DISCLOSURES
STRATEGICREVIEW
2. SIGNIFICANT ACCOUNTING POLICIES (CONT’D)
2.14 Impairment of assets (Cont’d)
(a) Financial assets (Cont’d)
(ii) AFS fi nancial assets
Signifi cant or prolonged decline in fair value below cost, signifi cant fi nancial diffi culties of the issuer or obligor, and the
disappearance of an active trading market are considerations to determine whether there is objective evidence that
investment securities classifi ed as AFS fi nancial assets are impaired.
If an AFS fi nancial asset is impaired, an amount comprising the difference between its cost (net of any principal payment
and amortisation) and its current fair value, less any impairment loss previously recognised in the income statement, is
transferred from equity to the income statement.
Impairment losses on AFS equity investments are not reversed in the income statement in subsequent periods. Increases in
fair value, if any, subsequent to impairment loss is recognised in other comprehensive income. For AFS debt investments,
impairment losses are subsequently reversed in the income statement if an increase in the fair value of the investment can
be objectively related to an event occurring after the recognition of the impairment loss in the income statement.
(b) Non-fi nancial assets
The carrying amounts of non-fi nancial assets are reviewed at the end of each reporting period to determine whether there is
any indication of impairment. If any such indication exists, then the asset’s recoverable amount is estimated. For the purpose of
impairment testing, assets are grouped together into the smallest group of assets that generates cash infl ows from continuing
use that are largely independent of the cash infl ows of other assets or groups of assets (the “cash-generating unit”). The goodwill
acquired in a business combination, for the purpose of impairment testing, is allocated to cash-generating units that are expected
to benefi t from the synergies of the combination.
The recoverable amount of an asset or cash-generating unit is the greater of its value in use and its fair value less costs to sell.
In assessing value in use, the estimated future cash fl ows are discounted to their present value using a pre-tax discount rate that
refl ects current market assessments of the time value of money and the risks specifi c to the asset. An impairment loss is recognised
if the carrying amount of an asset or its cash-generating unit exceeds its recoverable amount.
Impairment losses are recognised in the income statement. Impairment losses recognised in respect of cash-generating units are
allocated fi rst to reduce the carrying amount of the other assets in the unit (or groups of units) on a pro rata basis.
An impairment loss in respect of goodwill is not reversed. In respect of other assets, impairment losses recognised in prior periods
are assessed at the end of each reporting period for any indications that the losses have decreased or no longer exist.
An impairment loss is reversed if there has been a change in the estimates used to determine the recoverable amount since the
last impairment loss was recognised. An impairment loss is reversed only to the extent that the asset’s carrying amount does not
exceed the carrying amount that would have been determined, net of depreciation or amortisation, if no impairment loss had
been recognised. Reversals of impairment losses are credited to the income statement in the period in which the reversals are
recognised.
137ANNUAL REPORT 2018
PERFORMANCEREVIEW
CORPORATEGOVERNANCE
SUSTAINABILITYSTATEMENT
FINANCIALSTATEMENTS
OTHERINFORMATION
2. SIGNIFICANT ACCOUNTING POLICIES (CONT’D)
2.15 Non-current assets held for sale
Non-current assets are classifi ed as held for sale if their carrying amount will be recovered principally through a sale transaction rather
than through continuing use. This condition is regarded as met only when the sale is highly probable and the asset is available for
immediate sale in its present condition subject only to terms that are usual and customary.
Immediately before classifi cation as held for sale, the non-current assets are measured in accordance with applicable MFRSs. On initial
classifi cation as held for sale, non-current assets are then measured at the lower of its carrying amount and fair value less costs to sell.
Any difference is included in the income statement. Non-current assets classifi ed as held for sale are not depreciated.
2.16 Measurement and impairment of Qard
Any defi cits in the takaful/retakaful funds are made good via a loan or Qard, granted by the shareholder’s funds to the takaful/retakaful
funds. The Qard is stated at cost less any impairment losses in the shareholder’s funds. In the takaful/retakaful funds, the Qard is stated
at cost.
The Qard shall be repaid from future surpluses of the takaful/retakaful funds.
The Qard is tested for impairment on an annual basis via an assessment of the estimated surpluses or cash fl ows from the takaful/
retakaful funds to determine whether there is any objective evidence of impairment. If the Qard is impaired, an amount comprising the
difference between its cost and its recoverable amount, less any impairment loss previously recognised, is recognised in the income
statement.
Impairment losses are subsequently reversed in the income statement if objective evidence exists that the Qard is no longer impaired.
2.17 Share capital and dividend expenses
An equity instrument is any contract that evidences a residual interest in the assets of the Company after deducting all of its liabilities.
Ordinary shares are recorded at the proceeds received, net of directly attributable incremental transaction costs. Ordinary shares are
classifi ed as equity. Dividends on ordinary shares are recognised in equity in the period in which they are declared.
2.18 Cash and cash equivalents
Cash and cash equivalents include cash in hand and at banks, excluding fi xed and call deposits with licensed fi nancial institutions, which
have an insignifi cant risk of changes in value. The statement of cash fl ows has been prepared using the indirect method.
2.19 Insurance and takaful receivables
Insurance/takaful receivables are amounts receivable under the contractual terms of an insurance/takaful contract. On initial recognition,
insurance/takaful receivables are measured at fair value based on the consideration receivable. Subsequent to initial recognition, insurance/
takaful receivables are measured at amortised cost, using the effective interest/yield method.
Insurance/takaful receivables are assessed at each reporting date for objective evidence of impairment. If any such evidence exists, the
amount of impairment loss is measured as the difference between the asset’s carrying amount and the present value of estimated future
cash fl ows discounted at the insurance/takaful receivable’s original effective interest/yield rate. The impairment loss is recognised in the
income statement. The basis for recognition of such impairment loss is as described in Note 2.14(a)(i).
Insurance/takaful receivables are derecognised when the rights to receive cash fl ows from them have expired or when they have been
transferred and the Group has also substantially transferred all risks and rewards of ownership.
NOTES TO THE FINANCIAL STATEMENTS31 March 2018
138 MNRB HOLDINGS BERHAD (13487-A)
KEYMESSAGES LEADERSHIP
CORPORATE DISCLOSURES
STRATEGICREVIEW
2. SIGNIFICANT ACCOUNTING POLICIES (CONT’D)
2.20 Borrowings
All borrowings are classifi ed as other fi nancial liabilities and are recognised initially at fair value plus directly attributable transaction
costs. The profi ts payable are recognised as fi nance costs in the income statement in the period in which they are incurred.
After initial recognition, profi t-bearing borrowings are subsequently measured at amortised cost using the effective profi t rate method.
Gains and losses are recognised in the income statement when the liabilities are derecognised as well as through the effective profi t rate
method.
2.21 Leases
(a) Classifi cation
A lease is recognised as a fi nance lease if it substantially transfers to the Group all the risks and rewards incidental to ownership.
Leases of land and buildings are classifi ed as operating or fi nance leases in the same way as leases of other assets. The land and
buildings elements of a lease of land and buildings are considered separately for the purposes of lease classifi cation. All leases that
do not substantially transfer all risks and rewards are classifi ed as operating leases, with the following exceptions:
(i) Property held under operating leases that would otherwise meet the defi nition of an investment property is classifi ed as
an investment property on a case-by-case basis and, if classifi ed as investment property, is accounted for as if held under a
fi nance lease, as disclosed in Note 2.10; and
(ii) Land held for own use under an operating lease, the fair value of which cannot be measured separately from the fair value
of a building situated thereon at the inception of the lease, is accounted for as being held under a fi nance lease, unless the
building is also clearly held under an operating lease.
(b) Finance leases - the Group as lessee
Assets acquired by way of hire purchase or fi nance lease are stated at an amount equal to the lower of their fair value and the
present value of the minimum lease payments at the inception of the lease, less accumulated depreciation and impairment losses.
The corresponding liability is included in the statements of fi nancial position as borrowings. In calculating the present value of
the minimum lease payments, the discount factor used is the interest/profi t rate implicit in the lease, when it is impracticable to
determine; otherwise, the Group and the Company’s incremental borrowing rate is used. Any initial direct costs are also added to
the carrying amount of such assets.
Lease payments are apportioned between the fi nance costs and the reduction of the outstanding liability. Finance costs, which
represent the difference between the total leasing commitments and the fair value of the assets acquired, are recognised in the
income statement over the term of the relevant lease so as to produce a constant periodic rate of charge on the remaining balance
of the obligations for each accounting period.
The depreciation policy for leased assets is in accordance with that for depreciable property, plant and equipment as described in
Note 2.9(c).
(c) Operating leases - the Group as lessee
Operating lease payments are recognised as an expense on a straight-line basis over the term of the relevant lease. The aggregate
benefi t of incentives provided by the lessor is recognised as a reduction of rental expense over the lease term on a straight-line
basis.
In the case of a lease of land and buildings, the minimum lease payments or the upfront payments made are allocated, whenever
necessary, between the land and the buildings elements in proportion to the relative fair values of leasehold interests in the land
element and buildings element of the lease at the inception of the lease. The up-front payments represent prepaid lease payments
and are amortised on a straight-line basis over the lease term.
139ANNUAL REPORT 2018
PERFORMANCEREVIEW
CORPORATEGOVERNANCE
SUSTAINABILITYSTATEMENT
FINANCIALSTATEMENTS
OTHERINFORMATION
2. SIGNIFICANT ACCOUNTING POLICIES (CONT’D)
2.21 Leases (Cont’d)
(d) Operating leases - the Group as lessor
Assets leased out under operating leases are presented in the statement of fi nancial position according to the nature of the assets.
Rental income from operating leases is recognised on a straight-line basis over the term of the relevant lease, as disclosed in
Note 2.27(b). Initial direct costs incurred in negotiating and arranging an operating lease are added to the carrying amount of the
leased asset and recognised on a straight-line basis over the lease term.
2.22 Financial liabilities
Financial liabilities are classifi ed according to the substance of the contractual arrangements entered into and the defi nitions of a fi nancial
liability.
Financial liabilities, within the scope of MFRS 139 Financial Instruments: Recognition and Measurement, are recognised in the statements
of fi nancial position when, and only when, the Group and/or the Company become a party to the contractual provisions of the fi nancial
instrument. Financial liabilities are classifi ed as either fi nancial liabilities at FVTPL or other fi nancial liabilities.
(a) Financial liabilities at FVTPL
Financial liabilities at FVTPL include fi nancial liabilities held for trading and fi nancial liabilities designated upon initial recognition
as at FVTPL.
Financial liabilities held for trading include derivatives entered into by the Group and the Company that do not meet the hedge
accounting criteria. Derivative liabilities are initially measured at fair value and subsequently stated at fair value, with any resultant
gains or losses recognised in the income statement. Net gains or losses on derivatives include exchange differences.
The Group and the Company had not designated any fi nancial liabilities as at FVTPL nor were there any fi nancial liabilities held for
trading during and at the end of the fi nancial year.
(b) Other fi nancial liabilities
The Group’s and the Company’s other fi nancial liabilities include borrowings, insurance/takaful payables and other payables.
Insurance/takaful and other payables are recognised initially at fair value plus directly attributable transaction costs and
subsequently measured at amortised cost using the effective interest/yield method.
For other fi nancial liabilities, gains and losses are recognised in the income statement when the liabilities are derecognised, and
through the amortisation process.
A fi nancial liability is derecognised when the obligation under the liability is extinguished. When an existing fi nancial liability is
replaced by another from the same lender on substantially different terms, or the terms of an existing liability are substantially
modifi ed, such an exchange or modifi cation is treated as a derecognition of the original liability and the recognition of a new
liability, and the difference in the respective carrying amounts is recognised in the income statement.
2.23 Provisions
Provisions are recognised when the Group has a present obligation as a result of a past event and it is probable that an outfl ow of
resources embodying economic benefi ts will be required to settle the obligation, and a reliable estimate of the amount can be made.
Provisions are reviewed at each reporting date and adjusted to refl ect the current best estimate. Where the effect of the time value of
money is material, the amount of provision is the present value of the expenditure expected to be required to settle the obligation.
NOTES TO THE FINANCIAL STATEMENTS31 March 2018
140 MNRB HOLDINGS BERHAD (13487-A)
KEYMESSAGES LEADERSHIP
CORPORATE DISCLOSURES
STRATEGICREVIEW
2. SIGNIFICANT ACCOUNTING POLICIES (CONT’D)
2.24 Income tax
Income tax on profi t or loss for the year comprises current and deferred tax. Current tax is the expected amount of income taxes payable
in respect of the taxable profi t for the year and is measured using the tax rates that have been enacted at the end of the fi nancial year.
Deferred tax is provided for, using the liability method, on temporary differences at the end of the fi nancial year between the tax bases
of assets and liabilities and their carrying amounts in the fi nancial statements. In principle, deferred tax liabilities are recognised for
all taxable temporary differences and deferred tax assets are recognised for all deductible temporary differences, unused tax losses
and unused tax credits to the extent that it is probable that taxable profi ts will be available against which the deductible temporary
differences, unused tax losses and unused tax credits can be utilised. Deferred tax is not recognised if the temporary difference arises
from the initial recognition of an asset or liability in a transaction which is not a business combination and, at the time of the transaction,
affects neither accounting profi t nor taxable profi t.
Deferred tax is measured at the tax rates that are expected to apply in the period when the asset is realised or the liability is settled,
based on tax rates that have been enacted or substantively enacted at the end of the fi nancial year. Deferred tax is recognised in the
income statement, except when it arises from a transaction which is recognised directly in other comprehensive income, in which case
the deferred tax is also charged or credited directly in other comprehensive income.
2.25 Employee benefi ts
(a) Short-term benefi ts
Wages, salaries, bonuses and social security contributions are recognised as an expense in the year in which the associated
services are rendered by employees of the Group. Short-term accumulating compensated absences such as paid annual leave are
recognised when services are rendered by employees that increase their entitlement to future compensated balances. Short-term
non-accumulating compensated absences such as sick leave are recognised when the absences occur.
(b) Defi ned contribution plan
As required by law, the Group makes contributions to the national pension scheme, the Employees Provident Fund (“EPF”). The
Group also makes additional contributions to the EPF for eligible employees by reference to their earnings. Such contributions are
recognised as an expense in the income statement as incurred.
(c) Employees’ terminal benefi ts
As required by law in the United Arab Emirates, the Group makes provision for terminal benefi ts for employees of its Dubai subsidiary,
based on the employees’ salaries and number of years of service. The terminal benefi ts are paid to the employees on termination
or completion of their terms of employment.
2.26 Foreign currencies
(a) Functional and presentation currency
The individual fi nancial statements of each entity in the Group are measured using the currency of the primary economic environment
in which the entity operates (“the functional currency”). The consolidated fi nancial statements are presented in Ringgit Malaysia
(“RM”), which is also the Company’s functional currency.
(b) Foreign currency transactions
In preparing the fi nancial statements, transactions in currencies other than the functional currency (“foreign currencies”) are
recorded in the functional currency using the exchange rates prevailing at the dates of the transactions. At each reporting date,
monetary items denominated in foreign currencies are retranslated at the rates prevailing on the reporting date. Non-monetary
items carried at fair value that are denominated in foreign currencies are retranslated at the rates prevailing on the date when
the fair value was determined. Non-monetary items that are measured in terms of historical cost in a foreign currency are not
retranslated.
141ANNUAL REPORT 2018
PERFORMANCEREVIEW
CORPORATEGOVERNANCE
SUSTAINABILITYSTATEMENT
FINANCIALSTATEMENTS
OTHERINFORMATION
2. SIGNIFICANT ACCOUNTING POLICIES (CONT’D)
2.26 Foreign currencies (Cont’d)
(b) Foreign currency transactions (Cont’d)
Exchange differences arising on the settlement of monetary items or on translating monetary items at the reporting date are
recognised in the income statements except for exchange differences arising on monetary items that form part of the Group’s net
investment in foreign operations, which are recognised intially in other comprehensive income and accumulated under the foreign
currency translation reserve in equity. The foreign currency translation reserve is reclassifi ed from equity to the income statement
of the Group on disposal of the foreign operation.
Exchange differences arising on the retranslation of non-monetary items carried at fair value are included in the income statement
for the period except for differences arising on the retranslation of non-monetary items in respect of which gains and losses are
recognised directly in other comprehensive income. Exchange differences arising from such non-monetary items are also recognised
directly in other comprehensive income.
(c) Foreign operations
The results and fi nancial position of foreign operations that have a functional currency different from the presentation currency of
the consolidated fi nancial statements are translated into RM as follows:
(i) Assets and liabilities for each statement of fi nancial position presented are translated at the closing rate prevailing at the
reporting date;
(ii) Income and expenses for each income statement are translated at average exchange rates for the year, which approximates
the exchange rates at the dates of the transactions;
(iii) All resulting exchange differences are taken to the foreign currency translation reserve within equity; and
(iv) The results of an associate, Labuan Reinsurance (L) Limited, are translated at the closing rate prevailing at the reporting date
with respect to the carrying amount of the investment in associate, and at the exchange rate at the date of the transactions
with respect to the share of profi ts or losses. All resulting translation differences are included in the foreign exchange
translation reserve in shareholders’ equity.
2.27 Revenue recognition
Revenue is recognised to the extent that it is probable that the economic benefi ts fl ow to the Group and the Company and the revenue can
be reliably measured. Revenue is measured at the fair value of consideration received or receivable.
(a) Interest and profi t income
Interest and profi t income are recognised using the effective interest/yield method.
(b) Rental income
Rental income is accounted for on a straight-line basis over the lease terms. The aggregate costs of incentives provided to lessees
are recognised as a reduction of rental income over the lease term on a straight-line basis.
(c) Dividend income
Dividend income is recognised when the right to receive payment is established.
NOTES TO THE FINANCIAL STATEMENTS31 March 2018
142 MNRB HOLDINGS BERHAD (13487-A)
KEYMESSAGES LEADERSHIP
CORPORATE DISCLOSURES
STRATEGICREVIEW
2. SIGNIFICANT ACCOUNTING POLICIES (CONT’D)
2.27 Revenue recognition (Cont’d)
(d) Management fees
Management fees are recognised when services are rendered.
(e) Wakalah fees
Wakalah fees are recognised as soon as the amount of contribution can be reliably measured in accordance with the principles of
Shariah.
(f) Premiums and contributions income
Premiums/contributions are recognised in accordance with the policies stated in Notes 2.4(a) and 2.5(a).
2.28 Zakat
Zakat represents an obligatory amount payable by the takaful subsidiary and retakaful division to comply with the principles of Shariah.
Zakat is computed using a method as recommended by the Group Shariah Committee (“GSC”) and approved by the Board. Only the
zakat that is attributable to the individual and corporate Muslim shareholders of the holding company was provided for in the fi nancial
statements. The zakat computation is reviewed by the GSC. The Board has the discretion to pay additional quantum above the obligatory
amount payable.
2.29 Changes in Accounting Policies
The accounting policies adopted by the Group and the Company are consistent with those of the previous fi nancial year except for the
following:
Adoption of MFRS and amendments/improvements to MFRSs
At the beginning of the current fi nancial year, the Group and the Company adopted the following amendments/improvements to MFRSs
mandatory for annual periods beginning on or after 1 January 2017 as follows:
Effective for annual periods
Description beginning on or after
MFRS 107 Statement of Cash Flows - Disclosures Initiatives (Amendments to MFRS 107) 1 January 2017
MFRS 112 Income Taxes - Recognition of Deferred Tax for Unrealised Losses (Amendments to MFRS 112) 1 January 2017
Amendment to MFRS 12 Disclosure of Interests in Other Entities
(Annual Improvements to MFRS Standards 2014 - 2016 Cycle) 1 January 2017
The adoption of the above amendments/improvements to MFRSs did not have any signifi cant effect on the disclosures or amounts
recognised in the Group’s and the Company’s fi nancial statements.
143ANNUAL REPORT 2018
PERFORMANCEREVIEW
CORPORATEGOVERNANCE
SUSTAINABILITYSTATEMENT
FINANCIALSTATEMENTS
OTHERINFORMATION
2. SIGNIFICANT ACCOUNTING POLICIES (CONT’D)
2.30 Standards and amendments/improvements to published standards and interpretation that are issued but not yet effective
The standards and amendments/improvements to published standards and interpretation that are issued but not yet effective up to the
date of issuance of the Group’s and the Company’s fi nancial statements are disclosed below. The Group and the Company intends to adopt
these standards and amendments/improvements to standards and interpretation, if applicable, when they become effective:
Effective for annual periods
Description beginning on or after
Amendment to MFRS 1 First-time Adoption of Malaysian Financial Reporting Standards
(Annual Improvements to MFRS Standards 2014 - 2016 Cycle) 1 January 2018
Amendments to MFRS 2 Classifi cation and Measurement Payment Transactions 1 January 2018
MFRS 9 Financial Instruments 1 January 2018
MFRS 15 Revenue from Contracts with Customers 1 January 2018
Amendments to MFRS 140 Transfers of Investment Property 1 January 2018
Amendments to MFRS 4 Applying MFRS 9 Financial Instruments with MFRS 4 Insurance Contracts 1 January 2018
Amendments to MFRS 128 Investments in Associates and Joint Ventures
(Annual Improvements to MFRS Standards 2014 - 2016 Cycle) 1 January 2018
IC Interpretation 22 Foreign Currency Transactions and Advance Consideration 1 January 2018
IC Interpretation 23 Uncertainty over Income Tax Treatments 1 January 2019
Annual improvements to MFRS Standards 2015 - 2017 Cycle 1 January 2019
MFRS 16 Leases 1 January 2019
Amendments to MFRS 119 (Plan Amendment, Curtailment or Settlement) 1 January 2019
Amendments to MFRS 128 (Long-term Interests in Associates and Joint Ventures) 1 January 2019
Amendments to MFRS 9 Prepayment Features with Negative Compensations 1 January 2019
Amendments to References to the Conceptual Framework in MFRS Standards 1 January 2020
MFRS 17 Insurance Contracts 1 January 2021
Amendments to MFRS 10 Consolidated Financial Statements To be announced
and MFRS 128 Investment in Associates and Joint Ventures by MASB
The Directors are of the opinion that the adoption of the above standards and amendments/improvements to standards and interpretation
are not expected to have a material impact on the fi nancial statements in the period of initial application except as discussed below:
MFRS 9 Financial Instruments (“MFRS 9”)
The International Accounting Standards Board (“IASB”) issued the fi nal version of IFRS 9 Financial Instruments which refl ects all phases
of the fi nancial instruments project and replaces IAS 39 Financial Instruments: Recognition and Measurement and all previous versions
of IFRS 9. The standard introduces new requirements for classifi cation and measurement, impairment and hedge accounting. IFRS 9 is
effective for annual periods beginning on or after 1 January 2018, with early application permitted. Retrospective application is required,
but restatement of comparative information is not compulsory.
MFRS 9 was issued by the MASB in respect of its application in Malaysia. It is equivalent to IFRS 9 as issued by IASB, including the effective
and issuance dates.
The Group and Company has adopted the new standard on the required effective date, being 1 April 2018. The Group and Company has
performed a gap assessment on the three main aspects of MFRS 9.
NOTES TO THE FINANCIAL STATEMENTS31 March 2018
144 MNRB HOLDINGS BERHAD (13487-A)
KEYMESSAGES LEADERSHIP
CORPORATE DISCLOSURES
STRATEGICREVIEW
2. SIGNIFICANT ACCOUNTING POLICIES (CONT’D)
2.30 Standards and amendments/improvements to published standards and interpretation that are issued but not yet effective (Cont’d)
MFRS 9 Financial Instruments (“MFRS 9”) (Cont’d)
The areas with expected impact from application of MFRS 9 are summarised below:
(i) Classifi cation and measurement
The classifi cation and measurement of fi nancial assets is determined on the basis of the contractual cash fl ow characteristics and
the objective of the business model associated with holding the asset. Key changes include:
• The held-to-maturity (“HTM”) and available-for-sale (“AFS”) asset categories will be removed;
• Financial assets will be measured at amortised cost (“AC”) if the assets are held within a business model whose objective is
to hold fi nancial assets in order to collect contractual cash fl ows which represent solely payments of principal and interest;
• A new asset category measured at fair value through other comprehensive income (“FVOCI”) is introduced. This applies to
debt instruments with contractual cash fl ow characteristics that are solely payments of principle and interest and held in a
model whose objective is achieved by both collecting contractual cash fl ows and selling fi nancial assets;
• A new asset category for non-traded equity investments measured at FVOCI is introduced. Equity instruments where an
election has not been made to measure those assets at FVOCI, will be measured at FVTPL;
• Financial assets will be measured at FVTPL if the assets are held for trading or fi nancial assets do not qualify to be measured
at AC or at FVOCI; and
• Classifi cation of fi nancial liabilities will remain largely unchanged, other than the fair value gains and losses attributable to
changes in ‘own credit risk’ for fi nancial liabilities designated and measured at FVTPL to be presented in OCI. The remainder
of the change in fair value is presented in profi t or loss, unless presentation of the fair value change in respect of the liability’s
credit risk in OCI would create or enlarge an accounting mismatch in profi t or loss.
Under the business model test, the Company’s debt instruments would be classifi ed under FVOCI or FVTPL while all equities would
be classifi ed under FVTPL.
The total equity of the Group is expected to increase by approximately 2% by applying the classifi cation and measurement
requirements.
LAR are held to collect contractual cash fl ows and are representing solely payments of principal and interest. Thus, the Group
and the Company expects that these will continue to be measured at amortised cost under MFRS 9. However, the Group and the
Company will analyse the contractual cash fl ow characteristics of those instruments in more detail before concluding whether all
those instruments meet the criteria for amortised cost measurement under MFRS 9.
The total equity of the Group is expected to increase by 2% by applying the classifi cation and measurement requirements.
(ii) Impairment of fi nancial assets
The MFRS 9 impairment requirements are based on an expected credit loss (“ECL”) model that replaces the Incurred Loss model
under the current accounting standard. The ECL model applies to fi nancial assets measured at AC or at FVOCI, irrevocable loan
commitments and fi nancial guarantee contracts, which will include loans, advances and fi nancing and debt instruments held by
the Company. The ECL model also applies to contract assets under MFRS 15 Revenue from Contracts with Customers and lease
receivables under MFRS 117 Leases.
145ANNUAL REPORT 2018
PERFORMANCEREVIEW
CORPORATEGOVERNANCE
SUSTAINABILITYSTATEMENT
FINANCIALSTATEMENTS
OTHERINFORMATION
2. SIGNIFICANT ACCOUNTING POLICIES (CONT’D)
2.30 Standards and amendments/improvements to published standards and interpretation that are issued but not yet effective (Cont’d)
MFRS 9 Financial Instruments (“MFRS 9”) (Cont’d)
(ii) Impairment of fi nancial assets (Cont’d)
The measurement of expected loss will involve increased complexity and judgement that include:
• Determining a signifi cant increase in credit risk (“SICR”) since initial recognition.
The Group and Company will recognise either a 12-month (Stage 1) or lifetime ECL (Stage 2 and 3), depending on whether
there has been an SICR since initial recognition. When making the assessment of a SICR, the Group and Company uses the
change in the risk of default occurring over the expected life of the fi nancial instrument instead of the change in amount
of expected credit losses. To make the assessment, the Group and Company compares the risk of a default occurring on the
fi nancial instrument as at the reporting date with the risk of a default occurring on the fi nancial instrument as at the date
of initial recognition and considers reasonable and supportable information, available without undue cost or effort, that is
indicative of signifi cant increases in credit risk since initial recognition.
• Mapping of external credit rating models
The Group and Company utilises its existing external credit rating models to assign credit ratings to the individual instruments
in its investment portfolio. Based on the Group and Company’s review and testing, the following key features of the models
that are consistent with and therefore comply with MFRS 9 requirements for the assessment of credit risk are as follows:
(a) The ratings represent individual assessment of the credit risk of the fi nancial instrument in question (as opposed to
collective assessment);
(b) The models cover fi xed income instruments regardless of whether or not they are externally rated;
(c) A wide range of current and historical information is considered, including published fi nancial statements, qualitative
information about an obligor’s industry characteristics, competitive positioning, management, fi nancial policy and
fi nancial fl exibility;
(d) In addition, forward-looking information is incorporated into the credit rating process; and
• Derivation of probability of default
The Group and Company’s current defi nition of default for debt instruments is when the borrower is unlikely to fulfi l its credit
obligations to the Group and Company on the scheduled payment dates. The Group and Company assessed the defi nition of
default by considering the MFRS 9 defi nition of “credit impaired” which includes:
(a) Signifi cant fi nancial diffi culty of the issuer or the borrower;
(b) A breach of contract, such as a default or a past due event;
(c) The lender(s) of the borrower, for economic or contractual reasons relating to the borrower’s fi nancial diffi culty, having
granted to the borrower a concession(s) that the lender(s) would not otherwise consider;
(d) It is becoming probable that the borrower will enter bankruptcy or other fi nancial reorganisation;
(e) The disappearance of an active market for the fi nancial asset because of fi nancial diffi culties; or
(f ) The purchase or orgination of a financial asset at a deep discount that reflects the incurred credit losses.
NOTES TO THE FINANCIAL STATEMENTS31 March 2018
146 MNRB HOLDINGS BERHAD (13487-A)
KEYMESSAGES LEADERSHIP
CORPORATE DISCLOSURES
STRATEGICREVIEW
2. SIGNIFICANT ACCOUNTING POLICIES (CONT’D)
2.30 Standards and amendments/improvements to published standards and interpretation that are issued but not yet effective (Cont’d)
MFRS 9 Financial Instruments (“MFRS 9”) (Cont’d)
(ii) Impairment of fi nancial assets (Cont’d)
• ECL measurement
MFRS 9 does not distinguish between individual assessment and collective assessment. Therefore, the Group and Company
decided to continue measuring the impairment on an individual transaction basis for fi nancial assets that are deemed to be
individually signifi cant.
There are three main components to measure ECL which are probability of default (“PD”), loss given default model (“LGD”)
and the exposure at default (“EAD”).
The Group and Company relies on professional services provided by a credit rating agency to provide the default rate for all its debts
instruments which incorporates all the requirements above.
Impairment of insurance/takaful receivables
The approach for impairment model for insurance/takaful receivables are more simplifi ed as compared to the impairment model
for fi nancial assets. MFRS 9 includes the requirement or policy choice to apply the simplifi ed approach that does not require entities
to track changes in credit risk and the practical expedient to calculate ECLs on insurance/takaful receivables using a provision
matrix with the usage of forward-looking information in determining of expected credit losses, including the use of macroeconomic
information.
The total equity of the Group and Company is expected to increase by approximately 1% by applying the classifi cation and
measurement requirements.
(iii) Hedge accounting
The requirements for general hedge accounting have been simplifi ed for hedge effectiveness testing and may result in more
designations of hedged items for accounting purposes.
The Group and the Company does not expect a signifi cant impact to the fi nancial statements on applying the hedge accounting.
MFRS 15 Revenue from Contracts with Customers (“MFRS 15”)
MFRS 15 was issued in 2014 and establishes a fi ve-step model to account for revenue arising from contracts with customers. Under
MFRS 15, revenue is recognised at an amount that refl ects the consideration to which an entity expects to be entitled in exchange for
transferring goods or services to a customer.
The new revenue standard will supersede all current revenue recognition requirements under MFRS. Either a full retrospective application
or a modifi ed retrospective application is required for annual periods beginning on or after 1 January 2018. Early adoption is permitted.
The Group and the Company expects to apply MFRS 15 fully retrospective. Given that reinsurance, retakaful and takaful contracts are
scoped out of MFRS 15, the Group and the Company expects the main impact of the new standard to be on the accounting for income from
administrative and investment management services to related corporations. The Group and the Company does not expect the impact to
be signifi cant.
147ANNUAL REPORT 2018
PERFORMANCEREVIEW
CORPORATEGOVERNANCE
SUSTAINABILITYSTATEMENT
FINANCIALSTATEMENTS
OTHERINFORMATION
2. SIGNIFICANT ACCOUNTING POLICIES (CONT’D)
2.30 Standards and amendments/improvements to published standards and interpretation that are issued but not yet effective (Cont’d)
MFRS 16 Leases (“MFRS 16”)
MFRS 16 sets out the principles for the recognition, measurement, presentation and disclosure of leases and requires lessees to account
for all leases under a single on balance sheet model, similar to the accounting for fi nance leases under MFRS 117. The standard will
supersede MFRS 117 Leases, IC Interpretation 4 Determining whether an Arrangement contains a Lease, IC Interpretation 115 Operating
Lease - Incentives and IC Interpretation 127 Evaluating the Substance of Transactions Involving the Legal Form of a Lease.
(i) Lessee
At the commencement date of a lease, a lessee will recognise a liability to make lease payments and an asset representing the
right to use the underlying asset during the lease term. Subsequently, lessees will be required to recognise interest expense on the
lease liability and the depreciation expense on the right-of-use asset.
(ii) Lessor
Lessor accounting under MFRS 16 is substantially the same as the accounting under MFRS 117. Lessors will continue to classify all
leases using the same classifi cation principle as in MFRS 117 and distinguish between two types of leases: operating and fi nance
leases.
The standard is effective for annual periods beginning on or after 1 January 2019. Early application is permitted but not before an entity
applies MFRS 15. A lessee can choose to apply the standard using either a full retrospective or a modifi ed retrospective approach. The
Group and the Company plans to assess the potential effect of MFRS 16 on its fi nancial statement in the near future.
MFRS 10 Consolidated Financial Statements (Amendments to MFRS 10) and MFRS 128 Investment in Associates and Joint
Ventures (Amendments to MFRS 128): Sale or Contribution of Assets between an Investor and its Associate or Joint Venture
(Amendments to MFRS 128)
The amendments address the confl ict between MFRS 10 and MFRS 128 in dealing with the loss of control of a subsidiary that is sold or
contributed to an associate or joint venture.
The amendments require the full gain to be recognised when the assets are transferred to an associate or joint venture which meets the
defi nition of a business as defi ned in MFRS 3 Business Combinations. Any gain or loss on assets transferred to an associate or joint venture
that do not meet the defi nition of a business would be recognised only to the extent of the unrelated investors’ interest in the associate or
joint venture. The amendments are applied prospectively effective for periods beginning on or after 1 January 2016, with early application
permitted.
On 31 December 2015, MASB announced to defer the effective date of the amendments, except for the amendments which clarify how
an entity should determine any gain or loss it recognises when assets are sold or contributed between the entity and an associate or
joint venture in which it invests, where early application still permitted. The deferment is in line with the IASB’s recent decision which
removed the requirement to apply Sale or Contribution of Assets between an Investor and its Associate or Joint Venture (Amendments
to MFRS 10 and MFRS 128) by 2016. The IASB’s reason for making the decision to defer the effective date is that the IASB is planning a
broader review that may result in the simplifi cation of accounting for such transactions and of other aspects of accounting for associates
and joint ventures. The Group and the Company does not anticipate signifi cant impact to the fi nancial statements upon adoption of the
amendments.
NOTES TO THE FINANCIAL STATEMENTS31 March 2018
148 MNRB HOLDINGS BERHAD (13487-A)
KEYMESSAGES LEADERSHIP
CORPORATE DISCLOSURES
STRATEGICREVIEW
2. SIGNIFICANT ACCOUNTING POLICIES (CONT’D)
2.30 Standards and amendments/improvements to published standards and interpretation that are issued but not yet effective (Cont’d)
Applying MFRS 9 Financial Instruments with MFRS 4 Insurance Contracts (Amendments to MFRS 4)
In December 2016, the MASB issued amendments to MFRS 4 to address issues arising from the different effective dates of MFRS 9 and
the upcoming new insurance contracts standard (IFRS 17) to be issued by the International Accounting Standards Board.
The amendments introduce two alternative options for entities issuing contracts within the scope of MFRS 4, notably a temporary
exemption and an overlay approach. The temporary exemption enables eligible entities to defer the implementation date of MFRS 9 for
annual periods beginning before 1 January 2021 at the latest whilst the overlay approach allows an entity applying MFRS 9 to reclassify
between profi t or loss and other comprehensive income an amount that results in the profi t or loss at the end of the reporting period for
the designated fi nancial assets being the same as if an entity had applied MFRS 139 to these designated fi nancial assets.
The Group and the Company has opted not to utilise the exemptions permitted under this Amendment and will fully adopt MFRS 9
effective on 1 January 2018.
MFRS 17 Insurance Contracts
MFRS 17 will replace MFRS 4 Insurance Contracts issued in 2005. MFRS 17 provides a comprehensive model for insurance contracts,
covering all relevant accounting aspects.
The main features of the new accounting model for insurance contracts are as follows:
• The measurement of the present value of future cash fl ows, incorporating an explicit risk adjustment, remeasured at every reporting
period (the fulfi lment cash fl ows);
• A Contractual Service Margin (“CSM”) that is equal and opposite to any day one gain in the fulfi lment cash fl ows of a group of
contracts, representing the unearned profi tability of the takaful certifi cates to be recognised in statement of comprehensive income
over the service period (i.e., coverage period);
• Certain changes in the expected present value of future cash fl ows are adjusted against the CSM and thereby recognised in
statement of comprehensive income over the remaining contractual service period;
• The effect of changes in discount rates will be reported in either profi t or loss or other comprehensive income, determined by an
accounting policy choice;
• The presentation of insurance revenue and insurance service expenses in the statement of comprehensive income based on the
concept of services provided during the period;
• Amounts that the participants will always receive, regardless of whether an insured event happens (non-distinct investment
components) are not presented in the Income statements, but are recognised directly on the Statements of fi nancial position;
• Insurance services results (earned revenue less incurred claims) are presented separately from the insurance fi nance income or
expense; and
• Extensive disclosures to provide information on the recognised amounts from insurance/takaful contracts and the nature and extent
of risks arising from these contracts.
The Group and the Company has established a project team with assistance from consultants to plan and manage the implementation of
MFRS 17 and is in the process of assessing the gaps and the fi nancial implications for adopting the new standard.
149ANNUAL REPORT 2018
PERFORMANCEREVIEW
CORPORATEGOVERNANCE
SUSTAINABILITYSTATEMENT
FINANCIALSTATEMENTS
OTHERINFORMATION
3. SIGNIFICANT ACCOUNTING ESTIMATES AND JUDGEMENTS
The preparation of the Group and the Company’s fi nancial statements requires management to make judgements, estimates and assumptions
that affect the reported amount of revenues, expenses, assets and liabilities at the reporting date. However, uncertainty about these assumptions
and estimates could result in outcomes that could require a material adjustment to the carrying amount of the asset or liability affected in the
future.
3.1 Critical judgements made in applying accounting policies
The following are the judgements made by management in the process of applying the Group’s accounting policies that have the most
signifi cant effect on the amounts recognised in the fi nancial statements. Judgements are continually evaluated and are based on historical
experiences and other factors, including expectations of future events that are believed to be reasonable under the circumstances.
Impairment of AFS fi nancial assets
The Group reviews its debt securities classifi ed as AFS fi nancial assets at each reporting date to assess whether they are impaired.
The Group also records impairment charges on AFS equity investments when there has been a signifi cant or prolonged decline in the fair
value below their cost.
The determination of what is “signifi cant” or “prolonged” requires judgement. In making this judgement, the Group evaluates, among
other factors, historical share price movements and the duration and extent to which the fair value of an investment is less than its cost.
3.2 Key sources of estimation uncertainty
The key assumptions concerning the future, and other key sources of estimation uncertainty at the reporting date, that have a signifi cant
risk of causing a material adjustment to the carrying amounts of assets and liabilities within the next fi nancial year are discussed below.
(a) General reinsurance, takaful and retakaful businesses
The principal uncertainty in the general reinsurance, takaful and retakaful businesses arises from the technical provisions which
include the estimation of premium/contribution and claim liabilities. Premium/contribution liabilities are recorded as the higher of
UPR/UCR and URR while claim liabilities mainly comprise provision for claims reported and IBNER and IBNR claims.
Generally, claim liabilities are determined based upon previous claims experience, existing knowledge of events, the terms and
conditions of the relevant policies and interpretation of circumstances. Particularly relevant is past experience with similar cases,
historical claims development trends, legislative changes, judicial decisions and economic conditions. It is certain that actual future
premium/contribution and claim liabilities will not exactly develop as projected and may vary from the projection.
The estimates of premium/contribution and claim liabilities are therefore sensitive to various factors and uncertainties.
The establishment of technical provisions is an inherently uncertain process and, as a consequence of this uncertainty, the
eventual settlement of premium/contribution and claim liabilities may vary from the initial estimates. The sensitivity of these
assumptions and their impact to results and the equity position of the businesses are disclosed in Note 35(a)(iv), 35(b)(iv) and
35(d)(iv).
At each reporting date, the estimates of premium/contribution and claim liabilities are re-assessed for adequacy by the Appointed
Actuaries and changes will be refl ected as adjustments to these liabilities. The appointment of the actuaries is approved by BNM.
(b) Family takaful and retakaful businesses
The estimation of the ultimate liability arising from claims made under the family takaful and retakaful businesses is a critical
accounting estimate. There are several sources of uncertainty that need to be considered in the estimation of the liabilities that the
family takaful and retakaful funds will ultimately be required to pay as claims/benefi ts.
NOTES TO THE FINANCIAL STATEMENTS31 March 2018
150 MNRB HOLDINGS BERHAD (13487-A)
KEYMESSAGES LEADERSHIP
CORPORATE DISCLOSURES
STRATEGICREVIEW
3. SIGNIFICANT ACCOUNTING ESTIMATES AND JUDGEMENTS (CONT’D)
3.2 Key sources of estimation uncertainty (Cont’d)
(b) Family takaful and retakaful businesses (Cont’d)
For family takaful and retakaful contracts, estimates are made for future deaths, disabilities, maturities, investment returns,
voluntary terminations and expenses in accordance with contractual and regulatory requirements. The family takaful and retakaful
funds base the estimate of expected number of deaths on statutory mortality tables, adjusted where appropriate to refl ect the
funds’ unique risk exposures. The estimated number of deaths determines the value of possible future benefi ts to be paid out, which
will be factored into ensuring suffi cient cover by reserves, which in return is monitored against current and future contributions.
For those contracts that cover risks related to disability, estimates are made based on recent past experience and emerging trends.
However, epidemics as well as wide ranging changes to lifestyle, could result in signifi cant changes to the expected future exposures.
All of these will give rise to estimation uncertainties of the projected ultimate liabilities of the family takaful and retakaful funds.
The sensitivity of the actuarial liabilities of the family takaful and retakaful funds to changes in assumptions are detailed in
Note 35(c)(iii) and 35(e)(iii).
At each reporting date, these estimates are re-assessed for adequacy and changes will be refl ected as adjustments to the liabilities
by the Appointed Actuaries. The appoinment of the actuaries is approved by BNM.
(c) Expense Liabilities
The expense liabilities of the shareholder’s fund consist of expense liabilities of the general takaful, general retakaful, family takaful
and family retakaful fund which are based on estimations performed by qualifi ed actuaries. The estimation methods are explained
in Note 2.6. The qualifi ed actuaries estimate the expected management expenses required to manage the contracts less any
expected cash fl ows from future wakalah fee income based on the qualifi ed actuaries’ assumptions and observations of the actual
experiences. The estimates of expense liabilities are therefore sensitive to various factors and uncertainties.
The establishment of technical provisions is an inherently uncertain process and, as a consequence of this uncertainty, the
eventual settlement of expense liabilities may vary from the initial estimates. At each reporting date, the estimates of expense
liabilities are re-assessed for adequacy by the appointed actuaries and changes will be refl ected as adjustments to these liabilities.
The appointment of the Appointed Actuaries is approved by BNM.
4. NET EARNED PREMIUMS/CONTRIBUTIONS
Group
2018 2017
RM’000 RM’000
(a) Gross earned premiums/contributions
Insurance and takaful contracts 2,216,703 2,293,554
Change in premium/contribution liabilities 34,960 33,782
2,251,663 2,327,336
(b) Premiums/contributions ceded to reinsurers/retakaful operators
Insurance and takaful contracts (317,868) (347,812)
Change in premium/contribution liabilities (4,931) (1,020)
(322,799) (348,832)
Net earned premiums/contributions 1,928,864 1,978,504
151ANNUAL REPORT 2018
PERFORMANCEREVIEW
CORPORATEGOVERNANCE
SUSTAINABILITYSTATEMENT
FINANCIALSTATEMENTS
OTHERINFORMATION
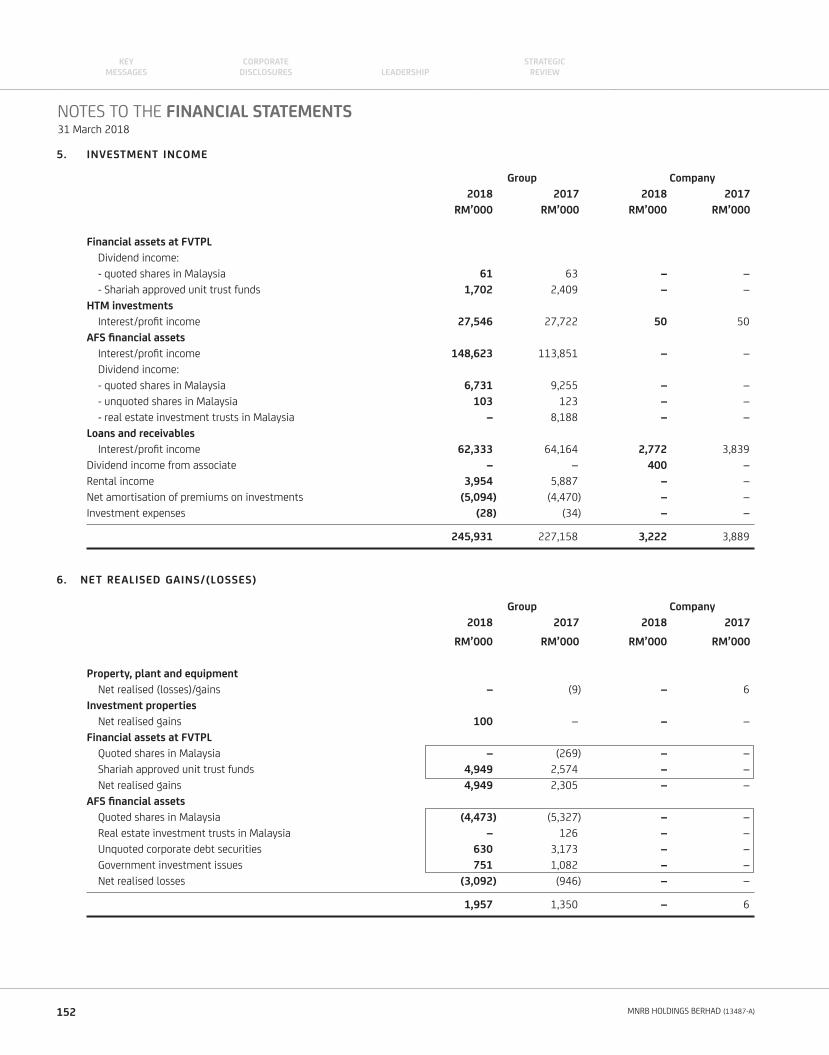
5. INVESTMENT INCOME
Group Company
2018 2017 2018 2017
RM’000 RM’000 RM’000 RM’000
Financial assets at FVTPL
Dividend income:
- quoted shares in Malaysia 61 63 – –
- Shariah approved unit trust funds 1,702 2,409 – –
HTM investments
Interest/profi t income 27,546 27,722 50 50
AFS fi nancial assets
Interest/profi t income 148,623 113,851 – –
Dividend income:
- quoted shares in Malaysia 6,731 9,255 – –
- unquoted shares in Malaysia 103 123 – –
- real estate investment trusts in Malaysia – 8,188 – –
Loans and receivables
Interest/profi t income 62,333 64,164 2,772 3,839
Dividend income from associate – – 400 –
Rental income 3,954 5,887 – –
Net amortisation of premiums on investments (5,094) (4,470) – –
Investment expenses (28) (34) – –
245,931 227,158 3,222 3,889
6. NET REALISED GAINS/(LOSSES)
Group Company
2018 2017 2018 2017
RM’000 RM’000 RM’000 RM’000
Property, plant and equipment
Net realised (losses)/gains – (9) – 6
Investment properties
Net realised gains 100 – – –
Financial assets at FVTPL
Quoted shares in Malaysia – (269) – –
Shariah approved unit trust funds 4,949 2,574 – –
Net realised gains 4,949 2,305 – –
AFS fi nancial assets
Quoted shares in Malaysia (4,473) (5,327) – –
Real estate investment trusts in Malaysia – 126 – –
Unquoted corporate debt securities 630 3,173 – –
Government investment issues 751 1,082 – –
Net realised losses (3,092) (946) – –
1,957 1,350 – 6
NOTES TO THE FINANCIAL STATEMENTS31 March 2018
152 MNRB HOLDINGS BERHAD (13487-A)
KEYMESSAGES LEADERSHIP
CORPORATE DISCLOSURES
STRATEGICREVIEW
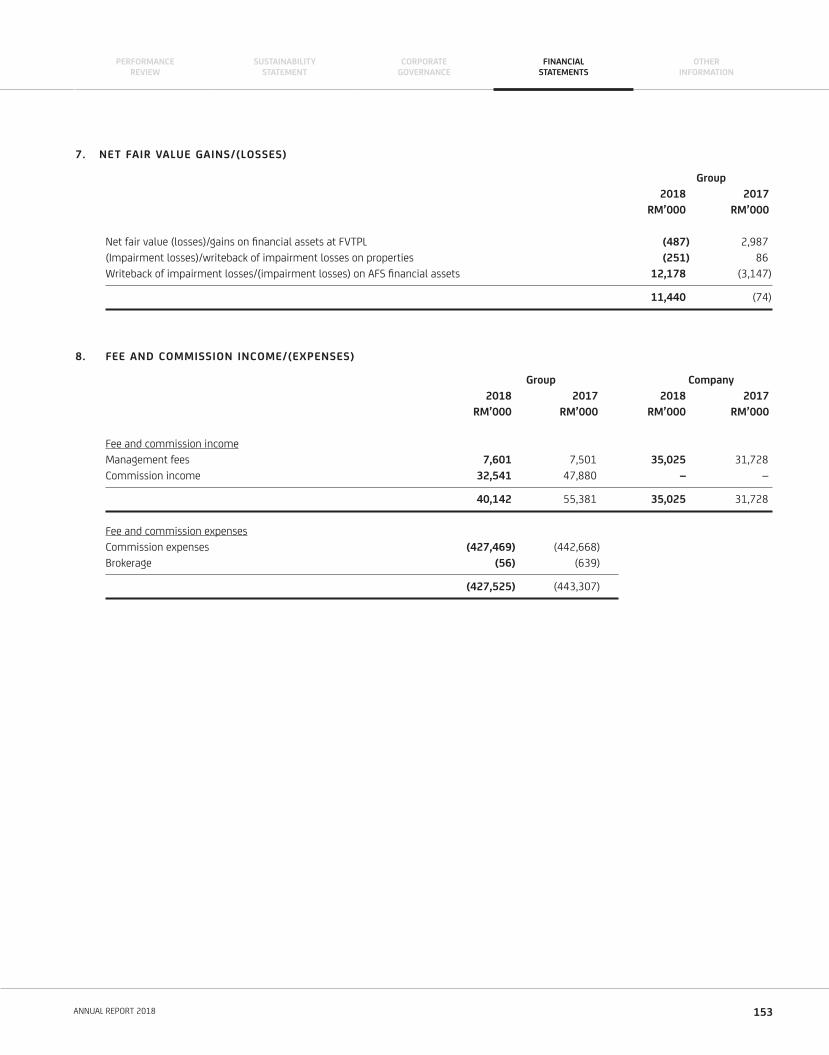
7. NET FAIR VALUE GAINS/(LOSSES)
Group
2018 2017
RM’000 RM’000
Net fair value (losses)/gains on fi nancial assets at FVTPL (487) 2,987
(Impairment losses)/writeback of impairment losses on properties (251) 86
Writeback of impairment losses/(impairment losses) on AFS fi nancial assets 12,178 (3,147)
11,440 (74)
8. FEE AND COMMISSION INCOME/(EXPENSES)
Group Company
2018 2017 2018 2017
RM’000 RM’000 RM’000 RM’000
Fee and commission income
Management fees 7,601 7,501 35,025 31,728
Commission income 32,541 47,880 – –
40,142 55,381 35,025 31,728
Fee and commission expenses
Commission expenses (427,469) (442,668)
Brokerage (56) (639)
(427,525) (443,307)
153ANNUAL REPORT 2018
PERFORMANCEREVIEW
CORPORATEGOVERNANCE
SUSTAINABILITYSTATEMENT
FINANCIALSTATEMENTS
OTHERINFORMATION
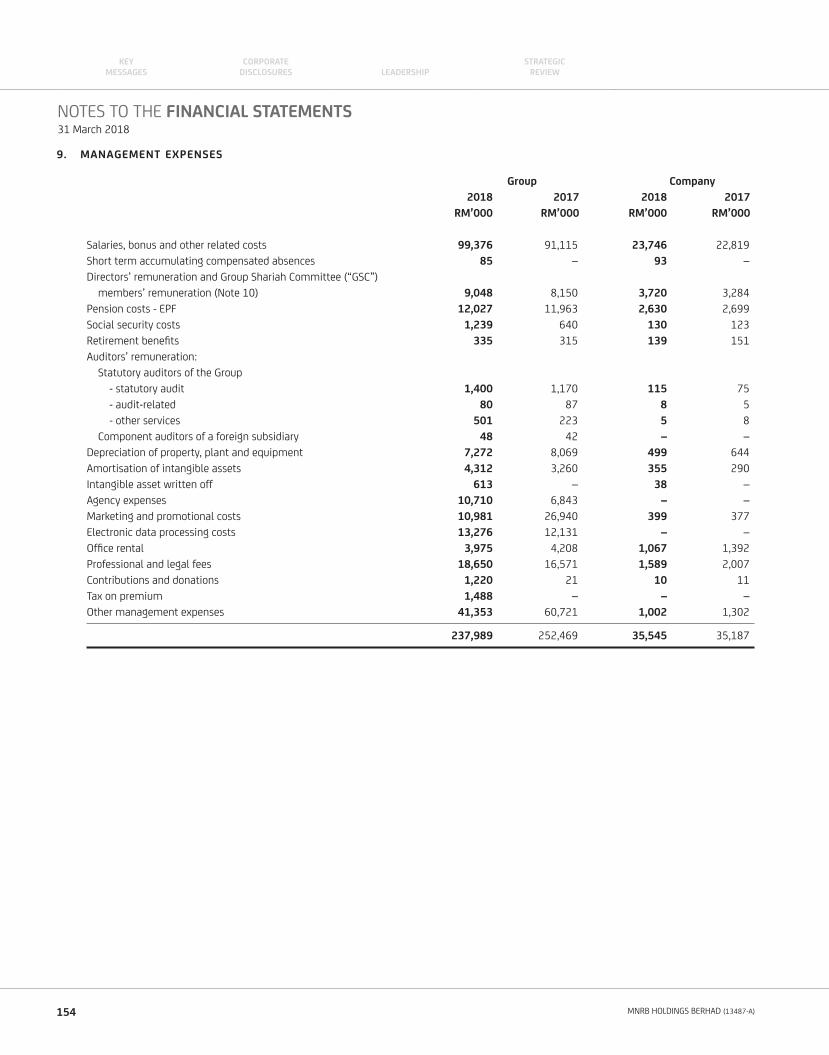
9. MANAGEMENT EXPENSES
Group Company
2018 2017 2018 2017
RM’000 RM’000 RM’000 RM’000
Salaries, bonus and other related costs 99,376 91,115 23,746 22,819
Short term accumulating compensated absences 85 – 93 –
Directors’ remuneration and Group Shariah Committee (“GSC”)
members’ remuneration (Note 10) 9,048 8,150 3,720 3,284
Pension costs - EPF 12,027 11,963 2,630 2,699
Social security costs 1,239 640 130 123
Retirement benefi ts 335 315 139 151
Auditors’ remuneration:
Statutory auditors of the Group
- statutory audit 1,400 1,170 115 75
- audit-related 80 87 8 5
- other services 501 223 5 8
Component auditors of a foreign subsidiary 48 42 – –
Depreciation of property, plant and equipment 7,272 8,069 499 644
Amortisation of intangible assets 4,312 3,260 355 290
Intangible asset written off 613 – 38 –
Agency expenses 10,710 6,843 – –
Marketing and promotional costs 10,981 26,940 399 377
Electronic data processing costs 13,276 12,131 – –
Offi ce rental 3,975 4,208 1,067 1,392
Professional and legal fees 18,650 16,571 1,589 2,007
Contributions and donations 1,220 21 10 11
Tax on premium 1,488 – – –
Other management expenses 41,353 60,721 1,002 1,302
237,989 252,469 35,545 35,187
NOTES TO THE FINANCIAL STATEMENTS31 March 2018
154 MNRB HOLDINGS BERHAD (13487-A)
KEYMESSAGES LEADERSHIP
CORPORATE DISCLOSURES
STRATEGICREVIEW
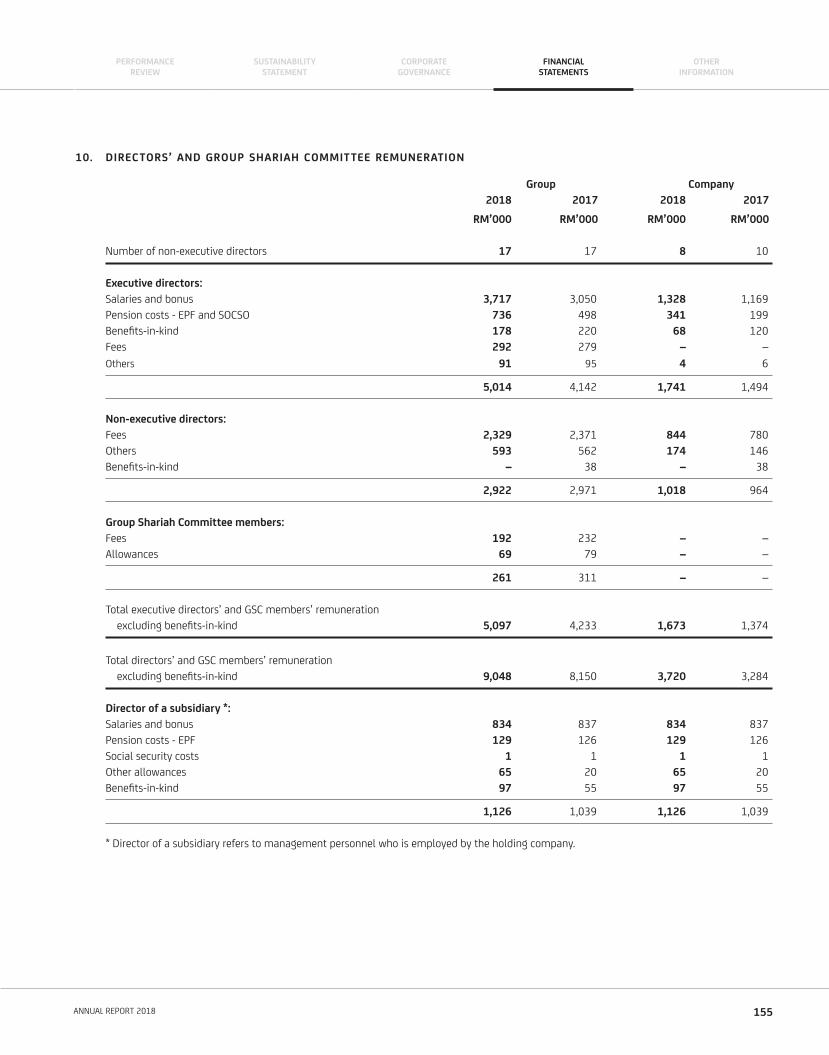
10. DIRECTORS’ AND GROUP SHARIAH COMMITTEE REMUNERATION
Group Company
2018 2017 2018 2017
RM’000 RM’000 RM’000 RM’000
Number of non-executive directors 17 17 8 10
Executive directors:
Salaries and bonus 3,717 3,050 1,328 1,169
Pension costs - EPF and SOCSO 736 498 341 199
Benefi ts-in-kind 178 220 68 120
Fees 292 279 – –
Others 91 95 4 6
5,014 4,142 1,741 1,494
Non-executive directors:
Fees 2,329 2,371 844 780
Others 593 562 174 146
Benefi ts-in-kind – 38 – 38
2,922 2,971 1,018 964
Group Shariah Committee members:
Fees 192 232 – –
Allowances 69 79 – –
261 311 – –
Total executive directors’ and GSC members’ remuneration
excluding benefi ts-in-kind 5,097 4,233 1,673 1,374
Total directors’ and GSC members’ remuneration
excluding benefi ts-in-kind 9,048 8,150 3,720 3,284
Director of a subsidiary *:
Salaries and bonus 834 837 834 837
Pension costs - EPF 129 126 129 126
Social security costs 1 1 1 1
Other allowances 65 20 65 20
Benefi ts-in-kind 97 55 97 55
1,126 1,039 1,126 1,039
* Director of a subsidiary refers to management personnel who is employed by the holding company.
155ANNUAL REPORT 2018
PERFORMANCEREVIEW
CORPORATEGOVERNANCE
SUSTAINABILITYSTATEMENT
FINANCIALSTATEMENTS
OTHERINFORMATION
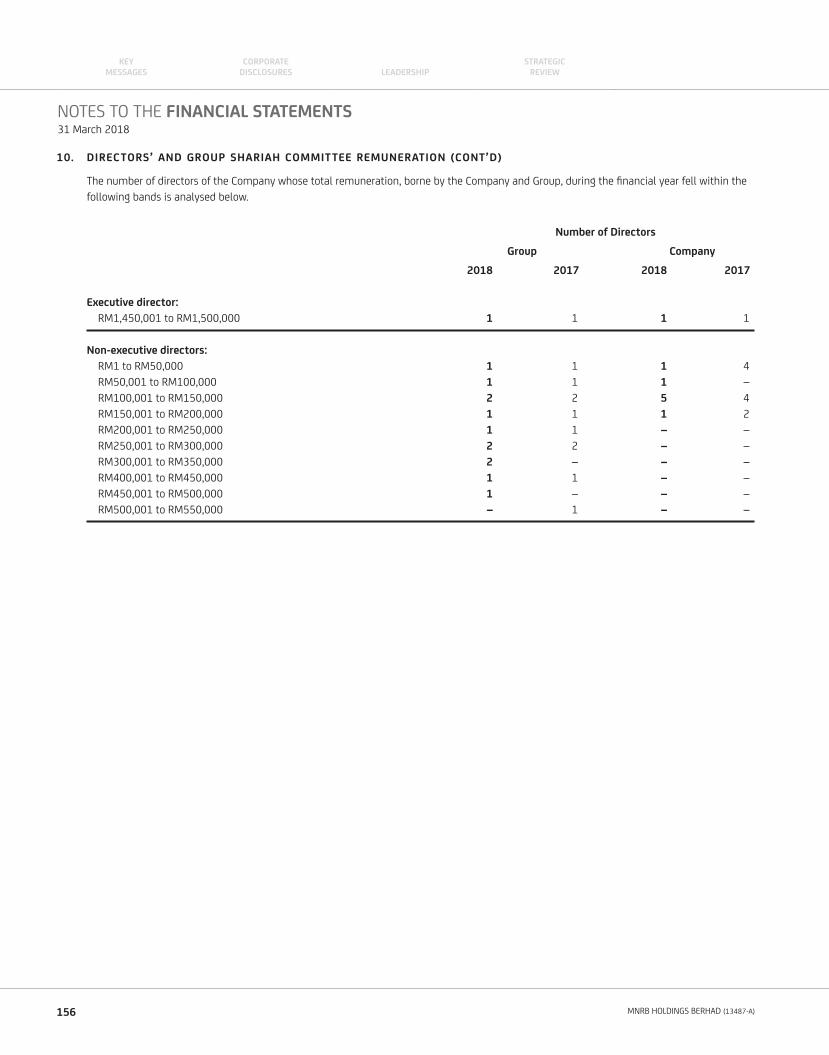
10. DIRECTORS’ AND GROUP SHARIAH COMMITTEE REMUNERATION (CONT’D)
The number of directors of the Company whose total remuneration, borne by the Company and Group, during the fi nancial year fell within the
following bands is analysed below.
Number of Directors
Group Company
2018 2017 2018 2017
Executive director:
RM1,450,001 to RM1,500,000 1 1 1 1
Non-executive directors:
RM1 to RM50,000 1 1 1 4
RM50,001 to RM100,000 1 1 1 –
RM100,001 to RM150,000 2 2 5 4
RM150,001 to RM200,000 1 1 1 2
RM200,001 to RM250,000 1 1 – –
RM250,001 to RM300,000 2 2 – –
RM300,001 to RM350,000 2 – – –
RM400,001 to RM450,000 1 1 – –
RM450,001 to RM500,000 1 – – –
RM500,001 to RM550,000 – 1 – –
NOTES TO THE FINANCIAL STATEMENTS31 March 2018
156 MNRB HOLDINGS BERHAD (13487-A)
KEYMESSAGES LEADERSHIP
CORPORATE DISCLOSURES
STRATEGICREVIEW
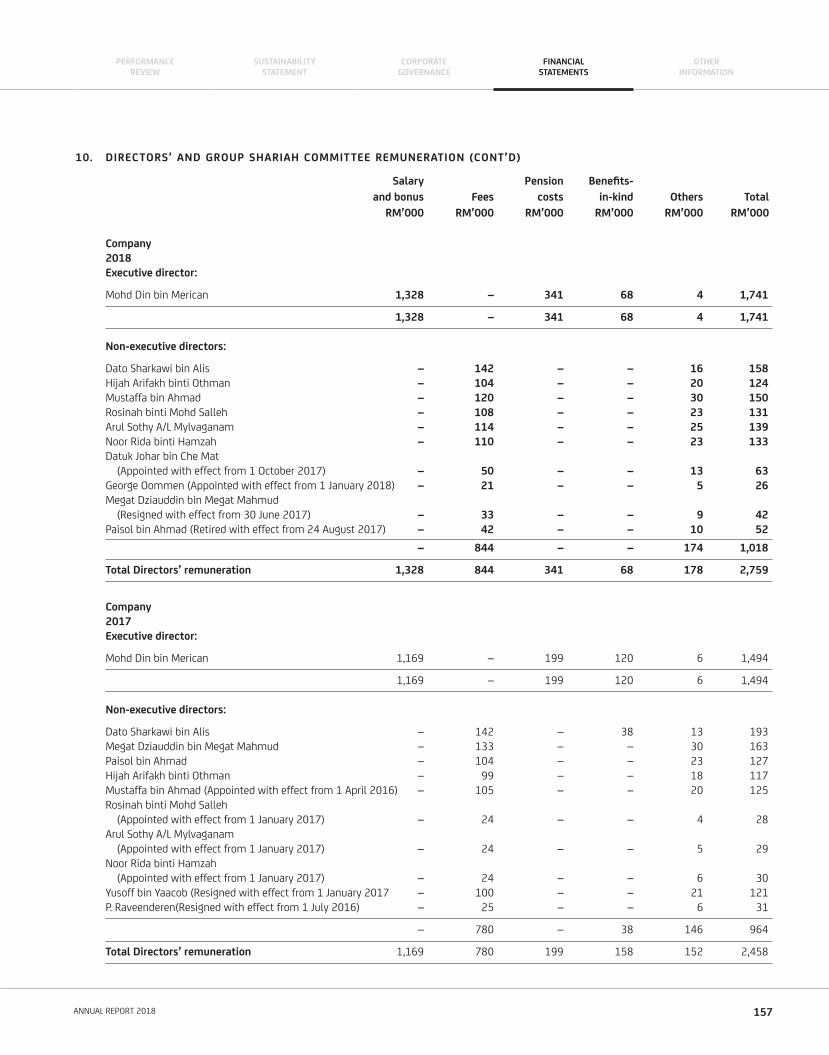
10. DIRECTORS’ AND GROUP SHARIAH COMMITTEE REMUNERATION (CONT’D)
Salary Pension Benefi ts-
and bonus Fees costs in-kind Others Total
RM’000 RM’000 RM’000 RM’000 RM’000 RM’000
Company
2018
Executive director:
Mohd Din bin Merican 1,328 – 341 68 4 1,741
1,328 – 341 68 4 1,741
Non-executive directors:
Dato Sharkawi bin Alis – 142 – – 16 158
Hijah Arifakh binti Othman – 104 – – 20 124
Mustaffa bin Ahmad – 120 – – 30 150
Rosinah binti Mohd Salleh – 108 – – 23 131
Arul Sothy A/L Mylvaganam – 114 – – 25 139
Noor Rida binti Hamzah – 110 – – 23 133
Datuk Johar bin Che Mat
(Appointed with effect from 1 October 2017) – 50 – – 13 63
George Oommen (Appointed with effect from 1 January 2018) – 21 – – 5 26
Megat Dziauddin bin Megat Mahmud
(Resigned with effect from 30 June 2017) – 33 – – 9 42
Paisol bin Ahmad (Retired with effect from 24 August 2017) – 42 – – 10 52
– 844 – – 174 1,018
Total Directors’ remuneration 1,328 844 341 68 178 2,759
Company
2017
Executive director:
Mohd Din bin Merican 1,169 – 199 120 6 1,494
1,169 – 199 120 6 1,494
Non-executive directors:
Dato Sharkawi bin Alis – 142 – 38 13 193
Megat Dziauddin bin Megat Mahmud – 133 – – 30 163
Paisol bin Ahmad – 104 – – 23 127
Hijah Arifakh binti Othman – 99 – – 18 117
Mustaffa bin Ahmad (Appointed with effect from 1 April 2016) – 105 – – 20 125
Rosinah binti Mohd Salleh
(Appointed with effect from 1 January 2017) – 24 – – 4 28
Arul Sothy A/L Mylvaganam
(Appointed with effect from 1 January 2017) – 24 – – 5 29
Noor Rida binti Hamzah
(Appointed with effect from 1 January 2017) – 24 – – 6 30
Yusoff bin Yaacob (Resigned with effect from 1 January 2017 – 100 – – 21 121
P. Raveenderen(Resigned with effect from 1 July 2016) – 25 – – 6 31
– 780 – 38 146 964
Total Directors’ remuneration 1,169 780 199 158 152 2,458
157ANNUAL REPORT 2018
PERFORMANCEREVIEW
CORPORATEGOVERNANCE
SUSTAINABILITYSTATEMENT
FINANCIALSTATEMENTS
OTHERINFORMATION
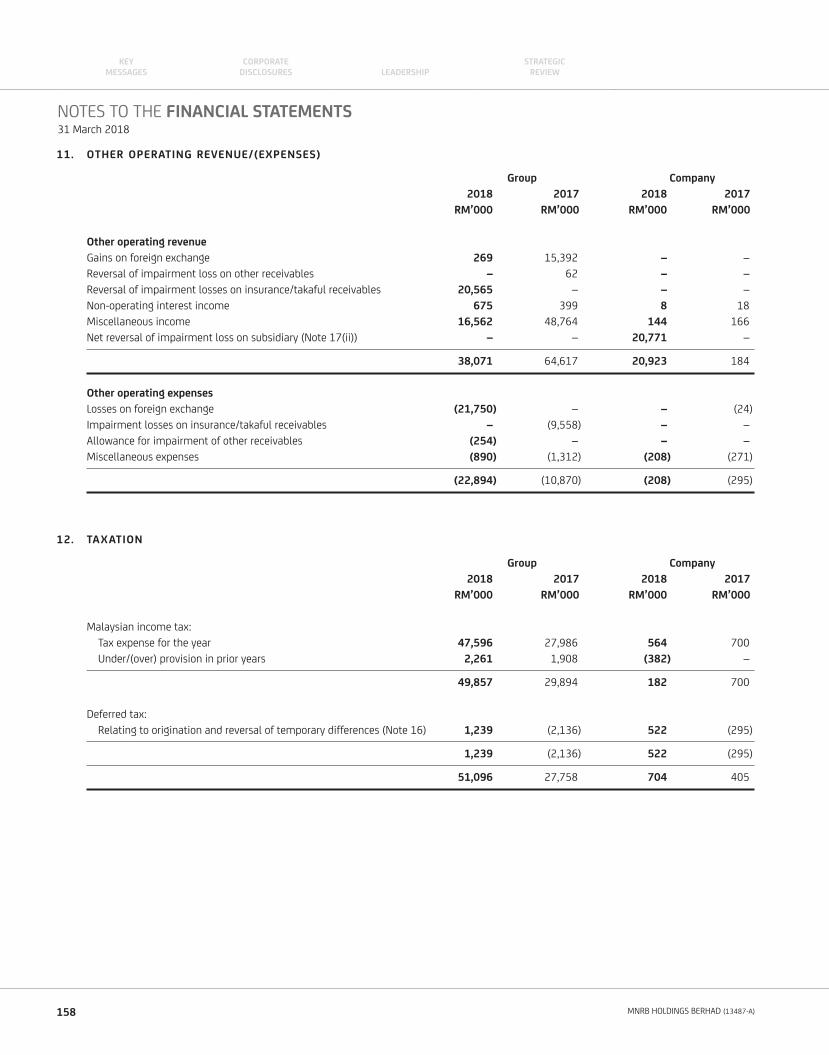
11. OTHER OPERATING REVENUE/(EXPENSES)
Group Company
2018 2017 2018 2017
RM’000 RM’000 RM’000 RM’000
Other operating revenue
Gains on foreign exchange 269 15,392 – –
Reversal of impairment loss on other receivables – 62 – –
Reversal of impairment losses on insurance/takaful receivables 20,565 – – –
Non-operating interest income 675 399 8 18
Miscellaneous income 16,562 48,764 144 166
Net reversal of impairment loss on subsidiary (Note 17(ii)) – – 20,771 –
38,071 64,617 20,923 184
Other operating expenses
Losses on foreign exchange (21,750) – – (24)
Impairment losses on insurance/takaful receivables – (9,558) – –
Allowance for impairment of other receivables (254) – – –
Miscellaneous expenses (890) (1,312) (208) (271)
(22,894) (10,870) (208) (295)
12. TAXATION
Group Company
2018 2017 2018 2017
RM’000 RM’000 RM’000 RM’000
Malaysian income tax:
Tax expense for the year 47,596 27,986 564 700
Under/(over) provision in prior years 2,261 1,908 (382) –
49,857 29,894 182 700
Deferred tax:
Relating to origination and reversal of temporary differences (Note 16) 1,239 (2,136) 522 (295)
1,239 (2,136) 522 (295)
51,096 27,758 704 405
NOTES TO THE FINANCIAL STATEMENTS31 March 2018
158 MNRB HOLDINGS BERHAD (13487-A)
KEYMESSAGES LEADERSHIP
CORPORATE DISCLOSURES
STRATEGICREVIEW
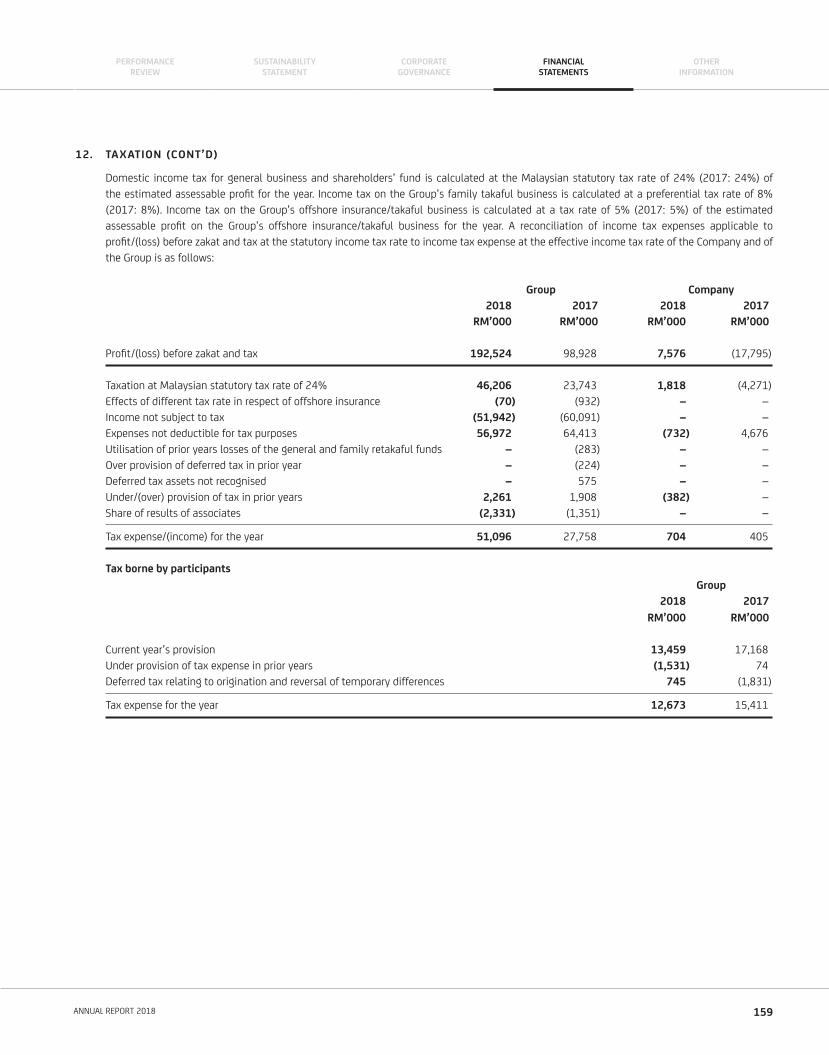
12. TAXATION (CONT’D)
Domestic income tax for general business and shareholders’ fund is calculated at the Malaysian statutory tax rate of 24% (2017: 24%) of
the estimated assessable profi t for the year. Income tax on the Group’s family takaful business is calculated at a preferential tax rate of 8%
(2017: 8%). Income tax on the Group’s offshore insurance/takaful business is calculated at a tax rate of 5% (2017: 5%) of the estimated
assessable profi t on the Group’s offshore insurance/takaful business for the year. A reconciliation of income tax expenses applicable to
profi t/(loss) before zakat and tax at the statutory income tax rate to income tax expense at the effective income tax rate of the Company and of
the Group is as follows:
Group Company
2018 2017 2018 2017
RM’000 RM’000 RM’000 RM’000
Profi t/(loss) before zakat and tax 192,524 98,928 7,576 (17,795)
Taxation at Malaysian statutory tax rate of 24% 46,206 23,743 1,818 (4,271)
Effects of different tax rate in respect of offshore insurance (70) (932) – –
Income not subject to tax (51,942) (60,091) – –
Expenses not deductible for tax purposes 56,972 64,413 (732) 4,676
Utilisation of prior years losses of the general and family retakaful funds – (283) – –
Over provision of deferred tax in prior year – (224) – –
Deferred tax assets not recognised – 575 – –
Under/(over) provision of tax in prior years 2,261 1,908 (382) –
Share of results of associates (2,331) (1,351) – –
Tax expense/(income) for the year 51,096 27,758 704 405
Tax borne by participants
Group
2018 2017
RM’000 RM’000
Current year’s provision 13,459 17,168
Under provision of tax expense in prior years (1,531) 74
Deferred tax relating to origination and reversal of temporary differences 745 (1,831)
Tax expense for the year 12,673 15,411
159ANNUAL REPORT 2018
PERFORMANCEREVIEW
CORPORATEGOVERNANCE
SUSTAINABILITYSTATEMENT
FINANCIALSTATEMENTS
OTHERINFORMATION
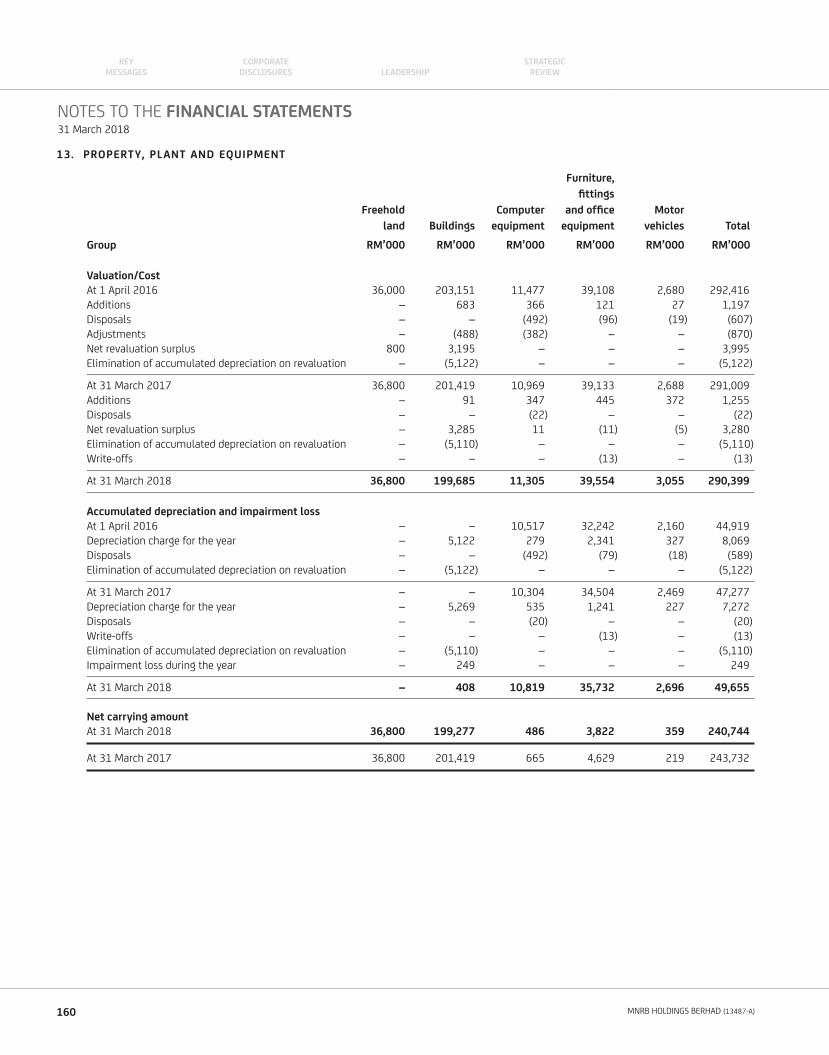
13. PROPERTY, PLANT AND EQUIPMENT
Furniture,
fi ttings
Freehold Computer and offi ce Motor
land Buildings equipment equipment vehicles Total
Group RM’000 RM’000 RM’000 RM’000 RM’000 RM’000
Valuation/Cost
At 1 April 2016 36,000 203,151 11,477 39,108 2,680 292,416
Additions – 683 366 121 27 1,197
Disposals – – (492) (96) (19) (607)
Adjustments – (488) (382) – – (870)
Net revaluation surplus 800 3,195 – – – 3,995
Elimination of accumulated depreciation on revaluation – (5,122) – – – (5,122)
At 31 March 2017 36,800 201,419 10,969 39,133 2,688 291,009
Additions – 91 347 445 372 1,255
Disposals – – (22) – – (22)
Net revaluation surplus – 3,285 11 (11) (5) 3,280
Elimination of accumulated depreciation on revaluation – (5,110) – – – (5,110)
Write-offs – – – (13) – (13)
At 31 March 2018 36,800 199,685 11,305 39,554 3,055 290,399
Accumulated depreciation and impairment loss
At 1 April 2016 – – 10,517 32,242 2,160 44,919
Depreciation charge for the year – 5,122 279 2,341 327 8,069
Disposals – – (492) (79) (18) (589)
Elimination of accumulated depreciation on revaluation – (5,122) – – – (5,122)
At 31 March 2017 – – 10,304 34,504 2,469 47,277
Depreciation charge for the year – 5,269 535 1,241 227 7,272
Disposals – – (20) – – (20)
Write-offs – – – (13) – (13)
Elimination of accumulated depreciation on revaluation – (5,110) – – – (5,110)
Impairment loss during the year – 249 – – – 249
At 31 March 2018 – 408 10,819 35,732 2,696 49,655
Net carrying amount
At 31 March 2018 36,800 199,277 486 3,822 359 240,744
At 31 March 2017 36,800 201,419 665 4,629 219 243,732
NOTES TO THE FINANCIAL STATEMENTS31 March 2018
160 MNRB HOLDINGS BERHAD (13487-A)
KEYMESSAGES LEADERSHIP
CORPORATE DISCLOSURES
STRATEGICREVIEW
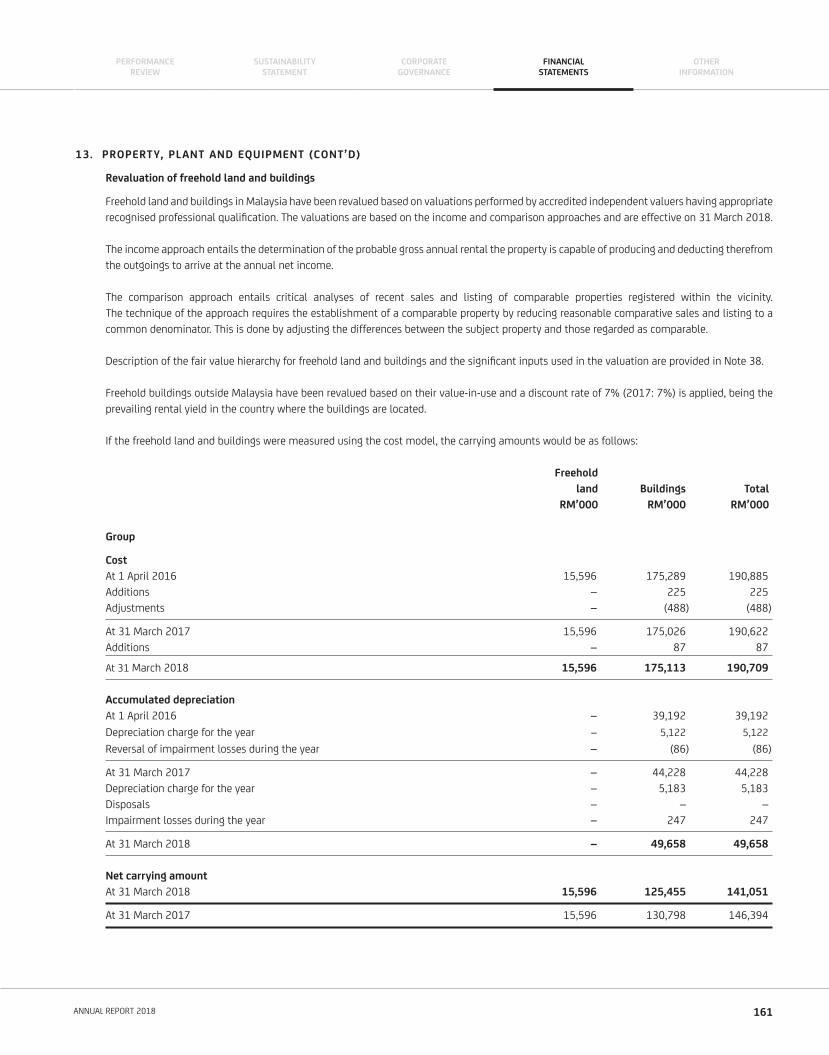
13. PROPERTY, PLANT AND EQUIPMENT (CONT’D)
Revaluation of freehold land and buildings
Freehold land and buildings in Malaysia have been revalued based on valuations performed by accredited independent valuers having appropriate
recognised professional qualifi cation. The valuations are based on the income and comparison approaches and are effective on 31 March 2018.
The income approach entails the determination of the probable gross annual rental the property is capable of producing and deducting therefrom
the outgoings to arrive at the annual net income.
The comparison approach entails critical analyses of recent sales and listing of comparable properties registered within the vicinity.
The technique of the approach requires the establishment of a comparable property by reducing reasonable comparative sales and listing to a
common denominator. This is done by adjusting the differences between the subject property and those regarded as comparable.
Description of the fair value hierarchy for freehold land and buildings and the signifi cant inputs used in the valuation are provided in Note 38.
Freehold buildings outside Malaysia have been revalued based on their value-in-use and a discount rate of 7% (2017: 7%) is applied, being the
prevailing rental yield in the country where the buildings are located.
If the freehold land and buildings were measured using the cost model, the carrying amounts would be as follows:
Freehold
land Buildings Total
RM’000 RM’000 RM’000
Group
Cost
At 1 April 2016 15,596 175,289 190,885
Additions – 225 225
Adjustments – (488) (488)
At 31 March 2017 15,596 175,026 190,622
Additions – 87 87
At 31 March 2018 15,596 175,113 190,709
Accumulated depreciation
At 1 April 2016 – 39,192 39,192
Depreciation charge for the year – 5,122 5,122
Reversal of impairment losses during the year – (86) (86)
At 31 March 2017 – 44,228 44,228
Depreciation charge for the year – 5,183 5,183
Disposals – – –
Impairment losses during the year – 247 247
At 31 March 2018 – 49,658 49,658
Net carrying amount
At 31 March 2018 15,596 125,455 141,051
At 31 March 2017 15,596 130,798 146,394
161ANNUAL REPORT 2018
PERFORMANCEREVIEW
CORPORATEGOVERNANCE
SUSTAINABILITYSTATEMENT
FINANCIALSTATEMENTS
OTHERINFORMATION
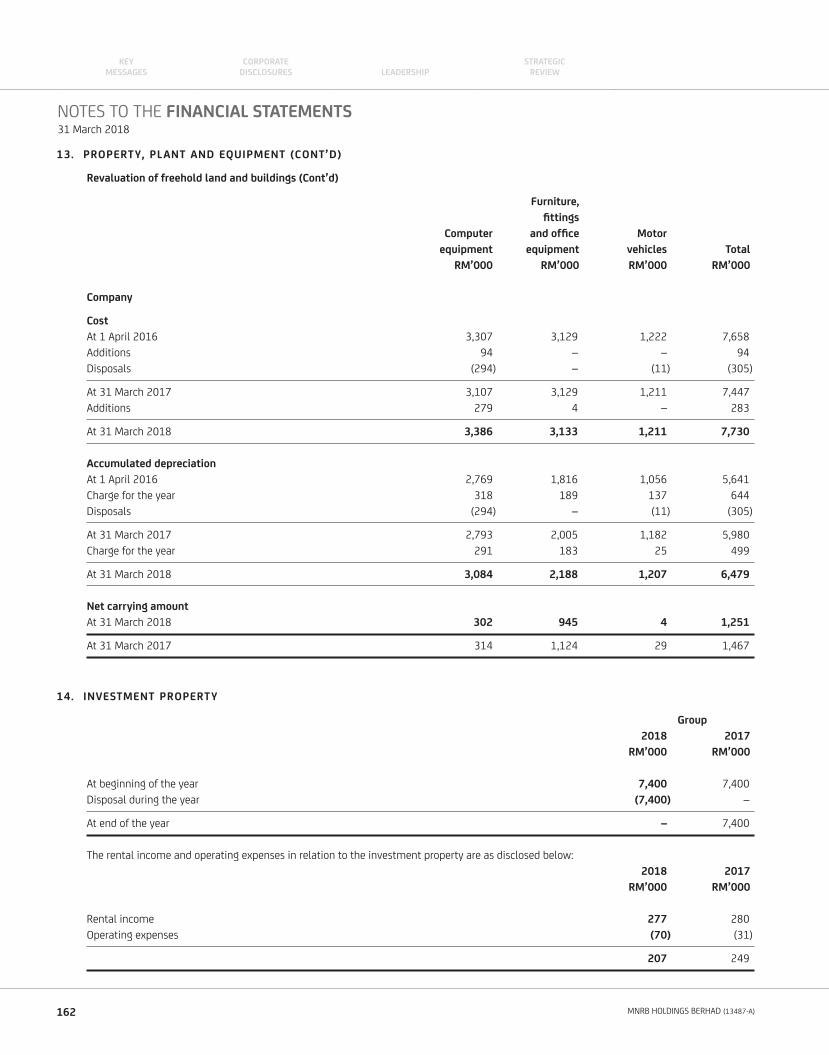
13. PROPERTY, PLANT AND EQUIPMENT (CONT’D)
Revaluation of freehold land and buildings (Cont’d)
Furniture,
fi ttings
Computer and offi ce Motor
equipment equipment vehicles Total
RM’000 RM’000 RM’000 RM’000
Company
Cost
At 1 April 2016 3,307 3,129 1,222 7,658
Additions 94 – – 94
Disposals (294) – (11) (305)
At 31 March 2017 3,107 3,129 1,211 7,447
Additions 279 4 – 283
At 31 March 2018 3,386 3,133 1,211 7,730
Accumulated depreciation
At 1 April 2016 2,769 1,816 1,056 5,641
Charge for the year 318 189 137 644
Disposals (294) – (11) (305)
At 31 March 2017 2,793 2,005 1,182 5,980
Charge for the year 291 183 25 499
At 31 March 2018 3,084 2,188 1,207 6,479
Net carrying amount
At 31 March 2018 302 945 4 1,251
At 31 March 2017 314 1,124 29 1,467
14. INVESTMENT PROPERTY
Group
2018 2017
RM’000 RM’000
At beginning of the year 7,400 7,400
Disposal during the year (7,400) –
At end of the year – 7,400
The rental income and operating expenses in relation to the investment property are as disclosed below:
2018 2017
RM’000 RM’000
Rental income 277 280
Operating expenses (70) (31)
207 249
NOTES TO THE FINANCIAL STATEMENTS31 March 2018
162 MNRB HOLDINGS BERHAD (13487-A)
KEYMESSAGES LEADERSHIP
CORPORATE DISCLOSURES
STRATEGICREVIEW
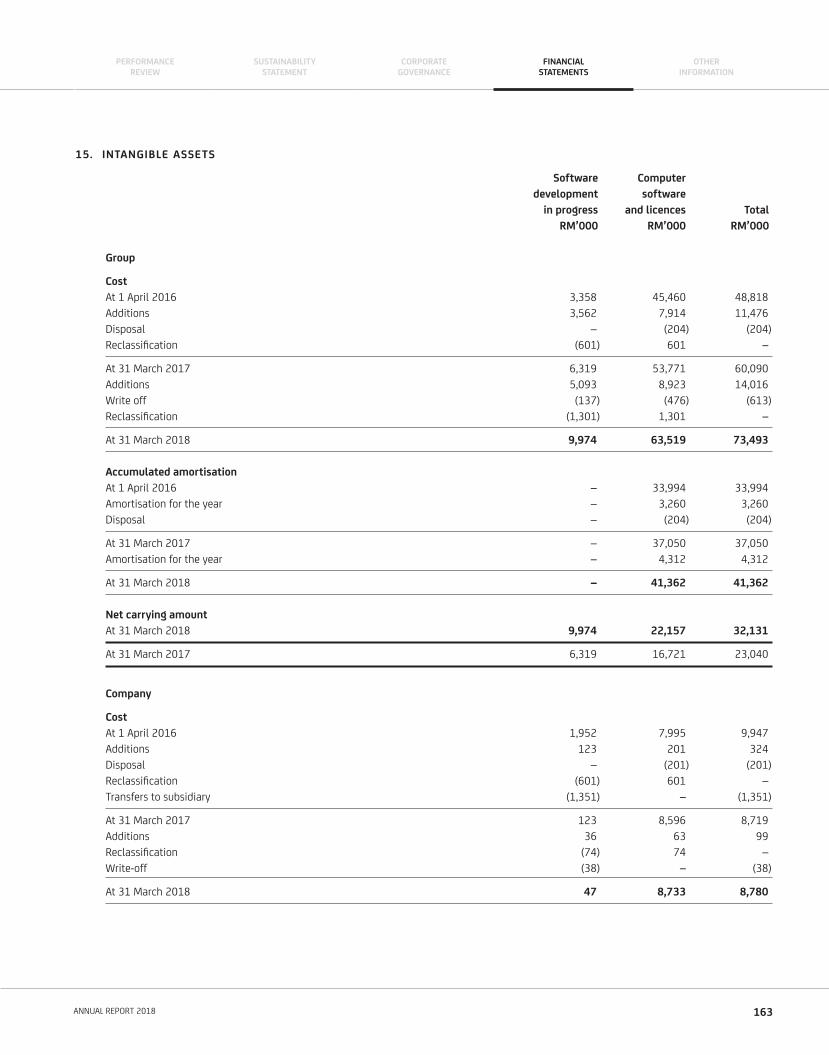
15. INTANGIBLE ASSETS
Software Computer
development software
in progress and licences Total
RM’000 RM’000 RM’000
Group
Cost
At 1 April 2016 3,358 45,460 48,818
Additions 3,562 7,914 11,476
Disposal – (204) (204)
Reclassifi cation (601) 601 –
At 31 March 2017 6,319 53,771 60,090
Additions 5,093 8,923 14,016
Write off (137) (476) (613)
Reclassifi cation (1,301) 1,301 –
At 31 March 2018 9,974 63,519 73,493
Accumulated amortisation
At 1 April 2016 – 33,994 33,994
Amortisation for the year – 3,260 3,260
Disposal – (204) (204)
At 31 March 2017 – 37,050 37,050
Amortisation for the year – 4,312 4,312
At 31 March 2018 – 41,362 41,362
Net carrying amount
At 31 March 2018 9,974 22,157 32,131
At 31 March 2017 6,319 16,721 23,040
Company
Cost
At 1 April 2016 1,952 7,995 9,947
Additions 123 201 324
Disposal – (201) (201)
Reclassifi cation (601) 601 –
Transfers to subsidiary (1,351) – (1,351)
At 31 March 2017 123 8,596 8,719
Additions 36 63 99
Reclassifi cation (74) 74 –
Write-off (38) – (38)
At 31 March 2018 47 8,733 8,780
163ANNUAL REPORT 2018
PERFORMANCEREVIEW
CORPORATEGOVERNANCE
SUSTAINABILITYSTATEMENT
FINANCIALSTATEMENTS
OTHERINFORMATION
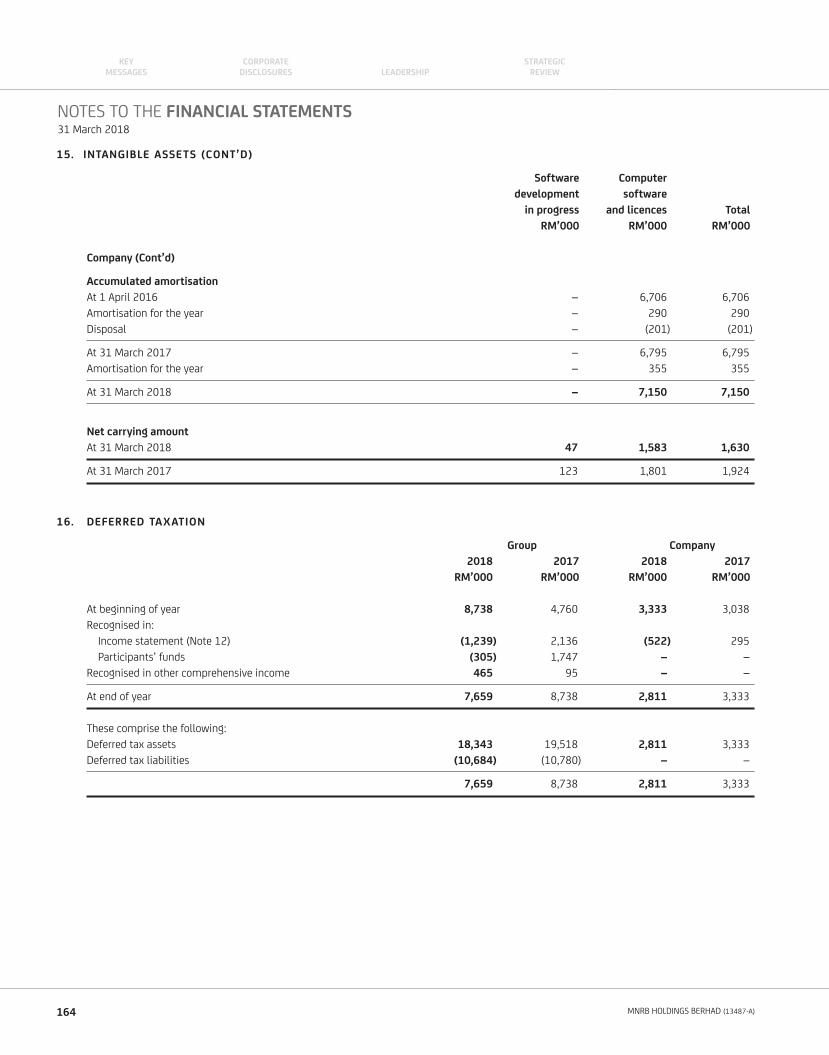
15. INTANGIBLE ASSETS (CONT’D)
Software Computer
development software
in progress and licences Total
RM’000 RM’000 RM’000
Company (Cont’d)
Accumulated amortisation
At 1 April 2016 – 6,706 6,706
Amortisation for the year – 290 290
Disposal – (201) (201)
At 31 March 2017 – 6,795 6,795
Amortisation for the year – 355 355
At 31 March 2018 – 7,150 7,150
Net carrying amount
At 31 March 2018 47 1,583 1,630
At 31 March 2017 123 1,801 1,924
16. DEFERRED TAXATION
Group Company
2018 2017 2018 2017
RM’000 RM’000 RM’000 RM’000
At beginning of year 8,738 4,760 3,333 3,038
Recognised in:
Income statement (Note 12) (1,239) 2,136 (522) 295
Participants’ funds (305) 1,747 – –
Recognised in other comprehensive income 465 95 – –
At end of year 7,659 8,738 2,811 3,333
These comprise the following:
Deferred tax assets 18,343 19,518 2,811 3,333
Deferred tax liabilities (10,684) (10,780) – –
7,659 8,738 2,811 3,333
NOTES TO THE FINANCIAL STATEMENTS31 March 2018
164 MNRB HOLDINGS BERHAD (13487-A)
KEYMESSAGES LEADERSHIP
CORPORATE DISCLOSURES
STRATEGICREVIEW
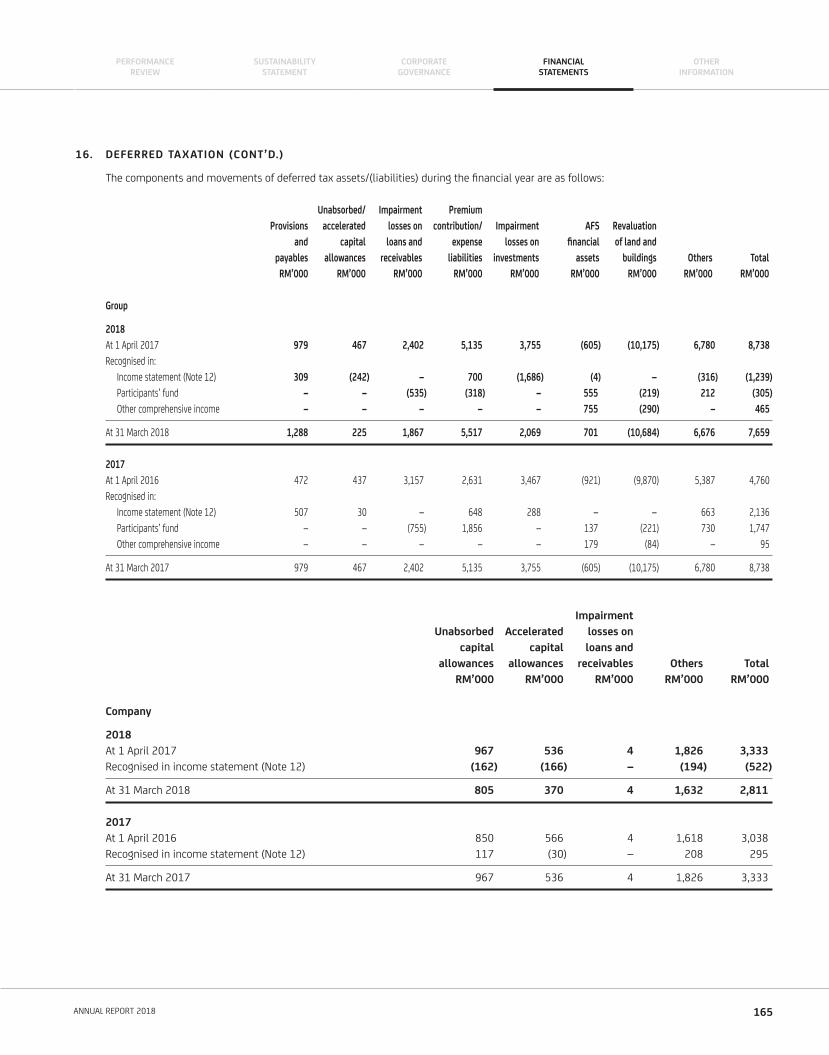
16. DEFERRED TAXATION (CONT’D.)
The components and movements of deferred tax assets/(liabilities) during the fi nancial year are as follows:
Unabsorbed/ Impairment Premium
Provisions accelerated losses on contribution/ Impairment AFS Revaluation
and capital loans and expense losses on fi nancial of land and
payables allowances receivables liabilities investments assets buildings Others Total
RM’000 RM’000 RM’000 RM’000 RM’000 RM’000 RM’000 RM’000 RM’000
Group
2018
At 1 April 2017 979 467 2,402 5,135 3,755 (605) (10,175) 6,780 8,738
Recognised in:
Income statement (Note 12) 309 (242) – 700 (1,686) (4) – (316) (1,239)
Participants’ fund – – (535) (318) – 555 (219) 212 (305)
Other comprehensive income – – – – – 755 (290) – 465
At 31 March 2018 1,288 225 1,867 5,517 2,069 701 (10,684) 6,676 7,659
2017
At 1 April 2016 472 437 3,157 2,631 3,467 (921) (9,870) 5,387 4,760
Recognised in:
Income statement (Note 12) 507 30 – 648 288 – – 663 2,136
Participants’ fund – – (755) 1,856 – 137 (221) 730 1,747
Other comprehensive income – – – – – 179 (84) – 95
At 31 March 2017 979 467 2,402 5,135 3,755 (605) (10,175) 6,780 8,738
Impairment
Unabsorbed Accelerated losses on
capital capital loans and
allowances allowances receivables Others Total
RM’000 RM’000 RM’000 RM’000 RM’000
Company
2018
At 1 April 2017 967 536 4 1,826 3,333
Recognised in income statement (Note 12) (162) (166) – (194) (522)
At 31 March 2018 805 370 4 1,632 2,811
2017
At 1 April 2016 850 566 4 1,618 3,038
Recognised in income statement (Note 12) 117 (30) – 208 295
At 31 March 2017 967 536 4 1,826 3,333
165ANNUAL REPORT 2018
PERFORMANCEREVIEW
CORPORATEGOVERNANCE
SUSTAINABILITYSTATEMENT
FINANCIALSTATEMENTS
OTHERINFORMATION
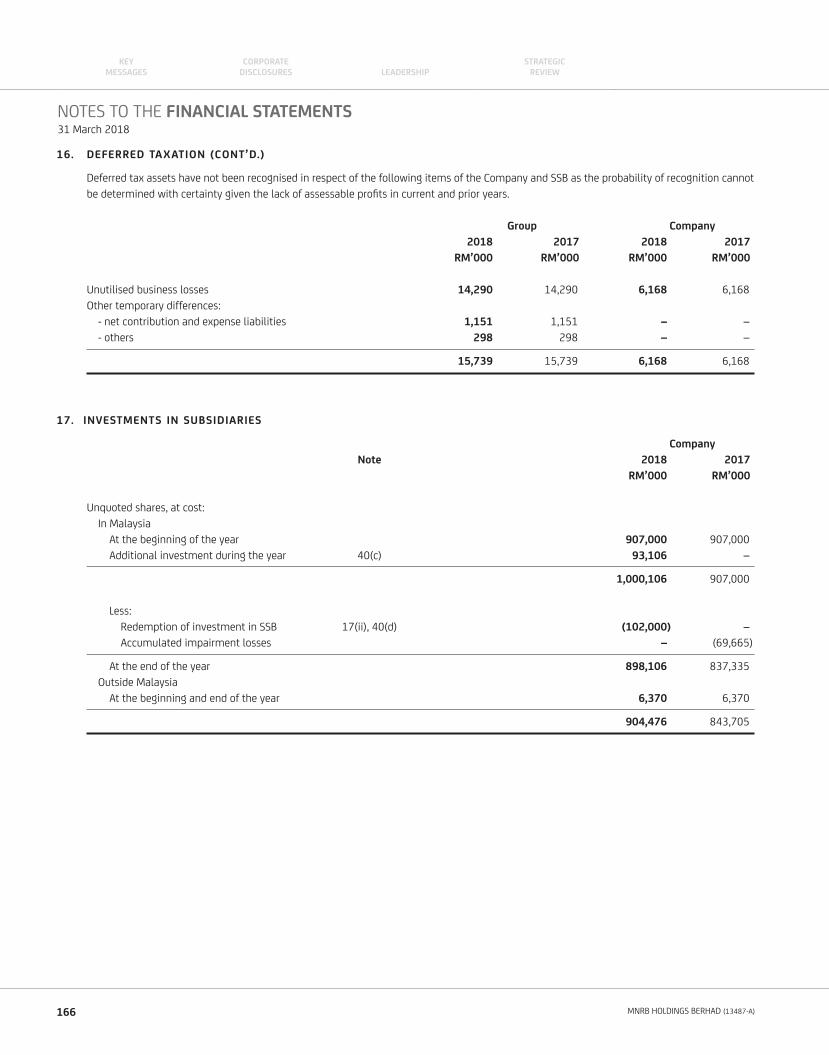
16. DEFERRED TAXATION (CONT’D.)
Deferred tax assets have not been recognised in respect of the following items of the Company and SSB as the probability of recognition cannot
be determined with certainty given the lack of assessable profi ts in current and prior years.
Group Company
2018 2017 2018 2017
RM’000 RM’000 RM’000 RM’000
Unutilised business losses 14,290 14,290 6,168 6,168
Other temporary differences:
- net contribution and expense liabilities 1,151 1,151 – –
- others 298 298 – –
15,739 15,739 6,168 6,168
17. INVESTMENTS IN SUBSIDIARIES
Company
Note 2018 2017
RM’000 RM’000
Unquoted shares, at cost:
In Malaysia
At the beginning of the year 907,000 907,000
Additional investment during the year 40(c) 93,106 –
1,000,106 907,000
Less:
Redemption of investment in SSB 17(ii), 40(d) (102,000) –
Accumulated impairment losses – (69,665)
At the end of the year 898,106 837,335
Outside Malaysia
At the beginning and end of the year 6,370 6,370
904,476 843,705
NOTES TO THE FINANCIAL STATEMENTS31 March 2018
166 MNRB HOLDINGS BERHAD (13487-A)
KEYMESSAGES LEADERSHIP
CORPORATE DISCLOSURES
STRATEGICREVIEW
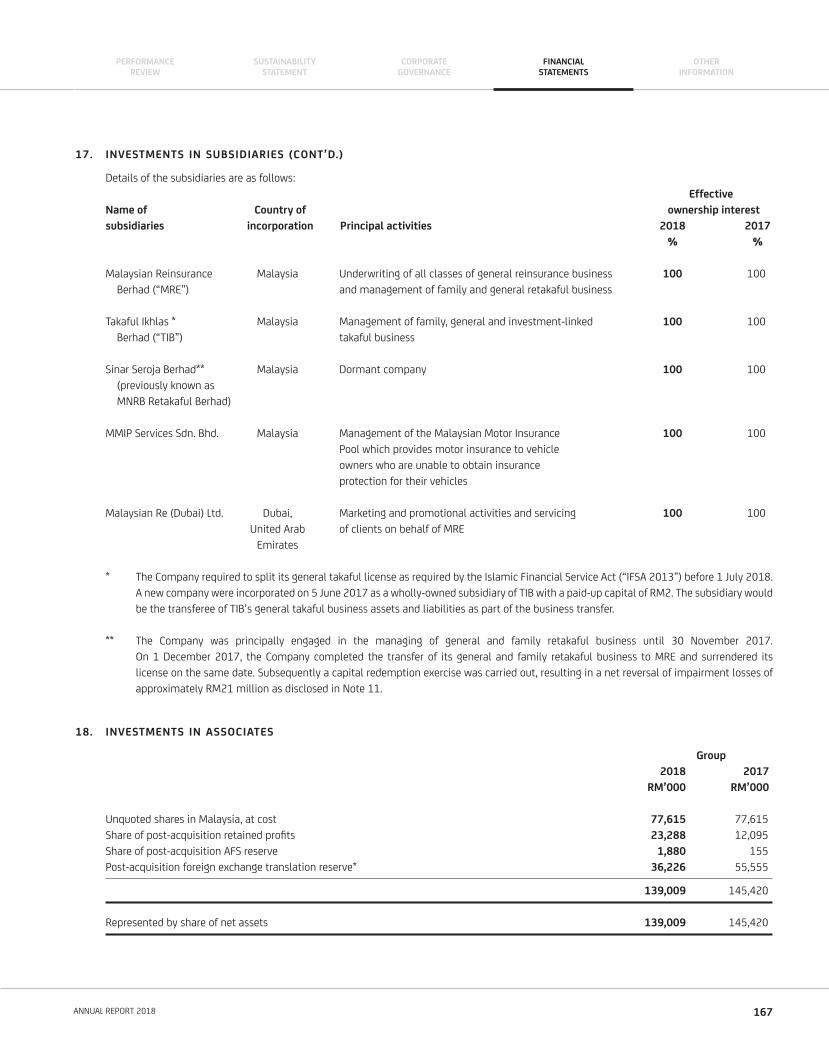
17. INVESTMENTS IN SUBSIDIARIES (CONT’D.)
Details of the subsidiaries are as follows:
Effective
Name of Country of ownership interest
subsidiaries incorporation Principal activities 2018 2017
% %
Malaysian Reinsurance Malaysia Underwriting of all classes of general reinsurance business 100 100
Berhad (“MRE”) and management of family and general retakaful business
Takaful Ikhlas * Malaysia Management of family, general and investment-linked 100 100
Berhad (“TIB”) takaful business
Sinar Seroja Berhad** Malaysia Dormant company 100 100
(previously known as
MNRB Retakaful Berhad)
MMIP Services Sdn. Bhd. Malaysia Management of the Malaysian Motor Insurance 100 100
Pool which provides motor insurance to vehicle
owners who are unable to obtain insurance
protection for their vehicles
Malaysian Re (Dubai) Ltd. Dubai, Marketing and promotional activities and servicing 100 100
United Arab of clients on behalf of MRE
Emirates
* The Company required to split its general takaful license as required by the Islamic Financial Service Act (“IFSA 2013”) before 1 July 2018.
A new company were incorporated on 5 June 2017 as a wholly-owned subsidiary of TIB with a paid-up capital of RM2. The subsidiary would
be the transferee of TIB’s general takaful business assets and liabilities as part of the business transfer.
** The Company was principally engaged in the managing of general and family retakaful business until 30 November 2017.
On 1 December 2017, the Company completed the transfer of its general and family retakaful business to MRE and surrendered its
license on the same date. Subsequently a capital redemption exercise was carried out, resulting in a net reversal of impairment losses of
approximately RM21 million as disclosed in Note 11.
18. INVESTMENTS IN ASSOCIATES
Group
2018 2017
RM’000 RM’000
Unquoted shares in Malaysia, at cost 77,615 77,615
Share of post-acquisition retained profi ts 23,288 12,095
Share of post-acquisition AFS reserve 1,880 155
Post-acquisition foreign exchange translation reserve* 36,226 55,555
139,009 145,420
Represented by share of net assets 139,009 145,420
167ANNUAL REPORT 2018
PERFORMANCEREVIEW
CORPORATEGOVERNANCE
SUSTAINABILITYSTATEMENT
FINANCIALSTATEMENTS
OTHERINFORMATION
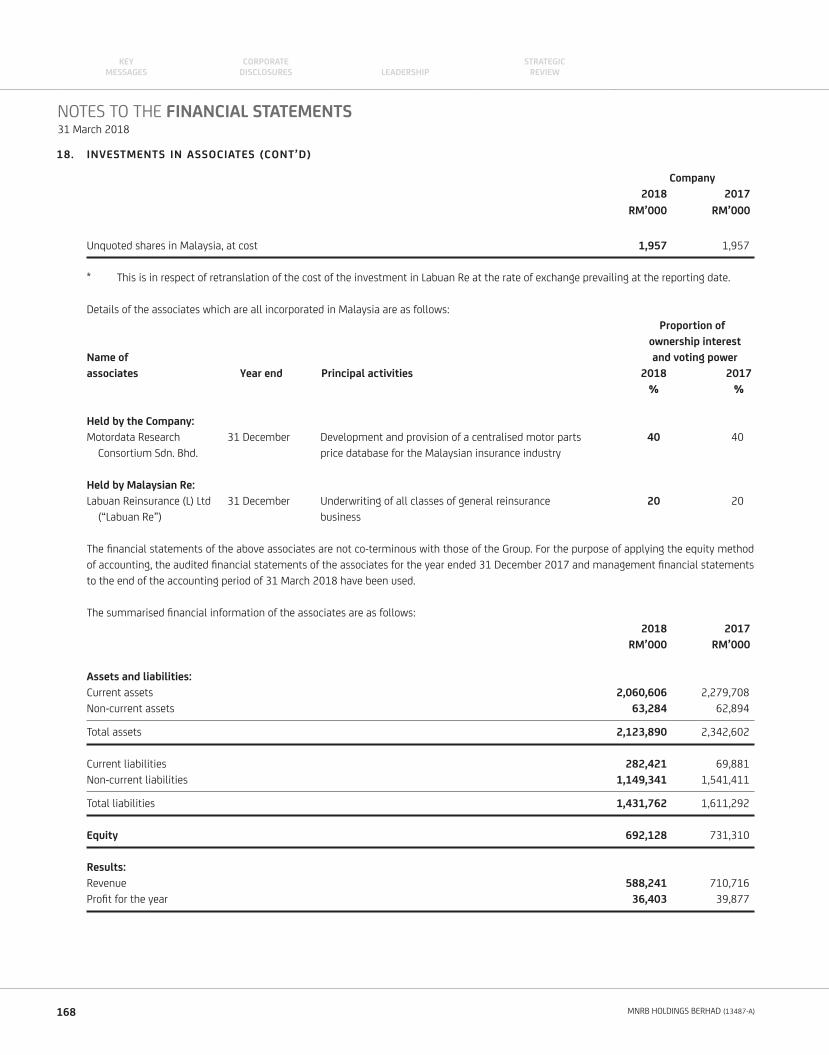
18. INVESTMENTS IN ASSOCIATES (CONT’D)
Company
2018 2017
RM’000 RM’000
Unquoted shares in Malaysia, at cost 1,957 1,957
* This is in respect of retranslation of the cost of the investment in Labuan Re at the rate of exchange prevailing at the reporting date.
Details of the associates which are all incorporated in Malaysia are as follows:
Proportion of
ownership interest
Name of and voting power
associates Year end Principal activities 2018 2017
% %
Held by the Company:
Motordata Research 31 December Development and provision of a centralised motor parts 40 40
Consortium Sdn. Bhd. price database for the Malaysian insurance industry
Held by Malaysian Re:
Labuan Reinsurance (L) Ltd 31 December Underwriting of all classes of general reinsurance 20 20
(“Labuan Re”) business
The fi nancial statements of the above associates are not co-terminous with those of the Group. For the purpose of applying the equity method
of accounting, the audited fi nancial statements of the associates for the year ended 31 December 2017 and management fi nancial statements
to the end of the accounting period of 31 March 2018 have been used.
The summarised fi nancial information of the associates are as follows:
2018 2017
RM’000 RM’000
Assets and liabilities:
Current assets 2,060,606 2,279,708
Non-current assets 63,284 62,894
Total assets 2,123,890 2,342,602
Current liabilities 282,421 69,881
Non-current liabilities 1,149,341 1,541,411
Total liabilities 1,431,762 1,611,292
Equity 692,128 731,310
Results:
Revenue 588,241 710,716
Profi t for the year 36,403 39,877
NOTES TO THE FINANCIAL STATEMENTS31 March 2018
168 MNRB HOLDINGS BERHAD (13487-A)
KEYMESSAGES LEADERSHIP
CORPORATE DISCLOSURES
STRATEGICREVIEW
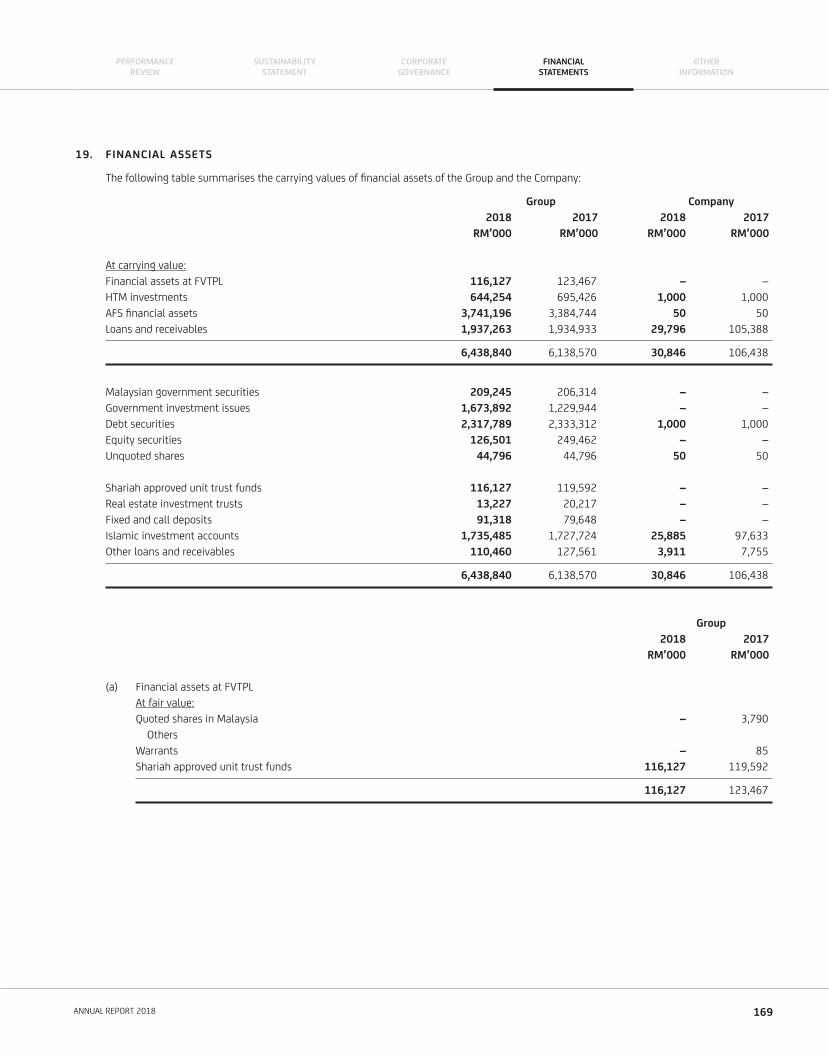
19. FINANCIAL ASSETS
The following table summarises the carrying values of fi nancial assets of the Group and the Company:
Group Company
2018 2017 2018 2017
RM’000 RM’000 RM’000 RM’000
At carrying value:
Financial assets at FVTPL 116,127 123,467 – –
HTM investments 644,254 695,426 1,000 1,000
AFS fi nancial assets 3,741,196 3,384,744 50 50
Loans and receivables 1,937,263 1,934,933 29,796 105,388
6,438,840 6,138,570 30,846 106,438
Malaysian government securities 209,245 206,314 – –
Government investment issues 1,673,892 1,229,944 – –
Debt securities 2,317,789 2,333,312 1,000 1,000
Equity securities 126,501 249,462 – –
Unquoted shares 44,796 44,796 50 50
Shariah approved unit trust funds 116,127 119,592 – –
Real estate investment trusts 13,227 20,217 – –
Fixed and call deposits 91,318 79,648 – –
Islamic investment accounts 1,735,485 1,727,724 25,885 97,633
Other loans and receivables 110,460 127,561 3,911 7,755
6,438,840 6,138,570 30,846 106,438
Group
2018 2017
RM’000 RM’000
(a) Financial assets at FVTPL
At fair value:
Quoted shares in Malaysia – 3,790
Others
Warrants – 85
Shariah approved unit trust funds 116,127 119,592
116,127 123,467
169ANNUAL REPORT 2018
PERFORMANCEREVIEW
CORPORATEGOVERNANCE
SUSTAINABILITYSTATEMENT
FINANCIALSTATEMENTS
OTHERINFORMATION
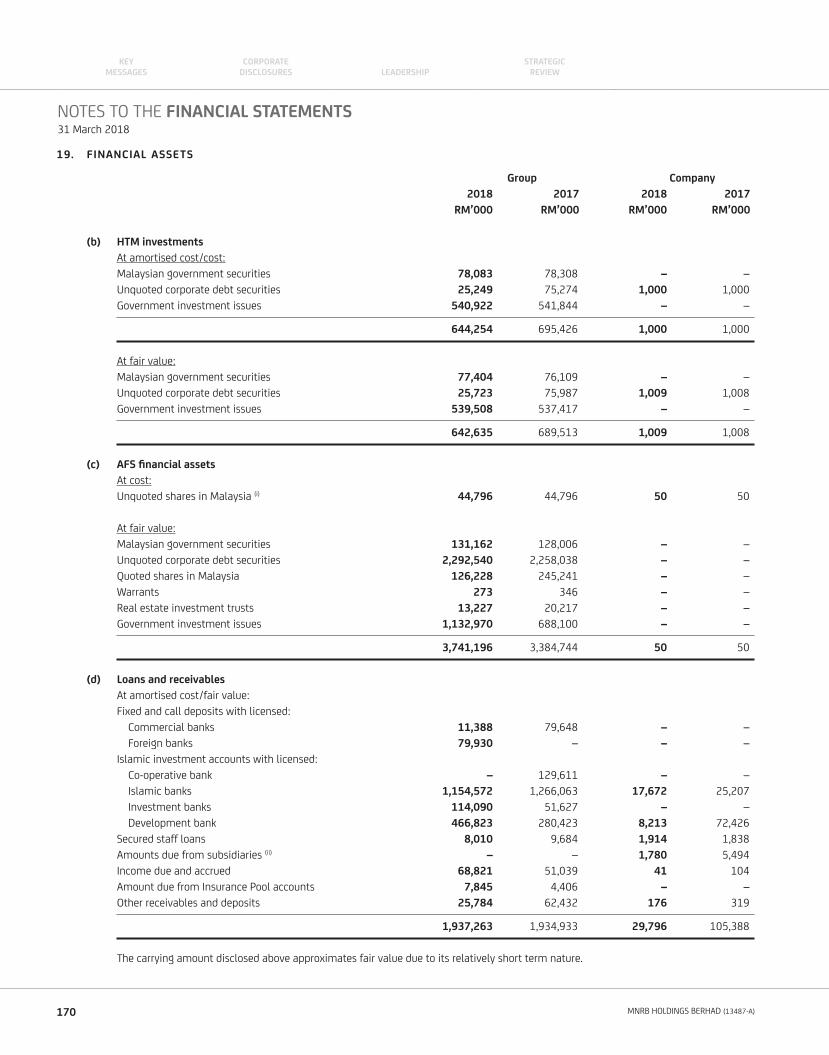
19. FINANCIAL ASSETS
Group Company
2018 2017 2018 2017
RM’000 RM’000 RM’000 RM’000
(b) HTM investments
At amortised cost/cost:
Malaysian government securities 78,083 78,308 – –
Unquoted corporate debt securities 25,249 75,274 1,000 1,000
Government investment issues 540,922 541,844 – –
644,254 695,426 1,000 1,000
At fair value:
Malaysian government securities 77,404 76,109 – –
Unquoted corporate debt securities 25,723 75,987 1,009 1,008
Government investment issues 539,508 537,417 – –
642,635 689,513 1,009 1,008
(c) AFS fi nancial assets
At cost:
Unquoted shares in Malaysia (i) 44,796 44,796 50 50
At fair value:
Malaysian government securities 131,162 128,006 – –
Unquoted corporate debt securities 2,292,540 2,258,038 – –
Quoted shares in Malaysia 126,228 245,241 – –
Warrants 273 346 – –
Real estate investment trusts 13,227 20,217 – –
Government investment issues 1,132,970 688,100 – –
3,741,196 3,384,744 50 50
(d) Loans and receivables
At amortised cost/fair value:
Fixed and call deposits with licensed:
Commercial banks 11,388 79,648 – –
Foreign banks 79,930 – – –
Islamic investment accounts with licensed:
Co-operative bank – 129,611 – –
Islamic banks 1,154,572 1,266,063 17,672 25,207
Investment banks 114,090 51,627 – –
Development bank 466,823 280,423 8,213 72,426
Secured staff loans 8,010 9,684 1,914 1,838
Amounts due from subsidiaries (ii) – – 1,780 5,494
Income due and accrued 68,821 51,039 41 104
Amount due from Insurance Pool accounts 7,845 4,406 – –
Other receivables and deposits 25,784 62,432 176 319
1,937,263 1,934,933 29,796 105,388
The carrying amount disclosed above approximates fair value due to its relatively short term nature.
NOTES TO THE FINANCIAL STATEMENTS31 March 2018
170 MNRB HOLDINGS BERHAD (13487-A)
KEYMESSAGES LEADERSHIP
CORPORATE DISCLOSURES
STRATEGICREVIEW
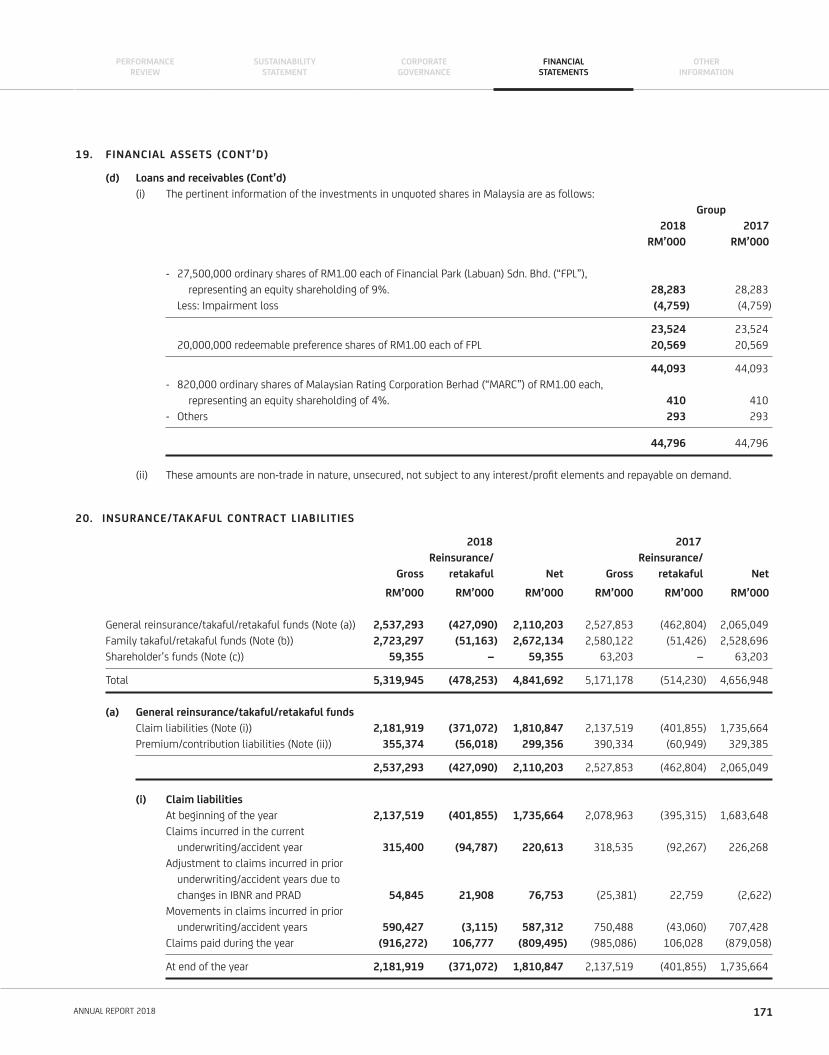
19. FINANCIAL ASSETS (CONT’D)
(d) Loans and receivables (Cont’d)
(i) The pertinent information of the investments in unquoted shares in Malaysia are as follows:
Group
2018 2017
RM’000 RM’000
- 27,500,000 ordinary shares of RM1.00 each of Financial Park (Labuan) Sdn. Bhd. (“FPL”),
representing an equity shareholding of 9%. 28,283 28,283
Less: Impairment loss (4,759) (4,759)
23,524 23,524
20,000,000 redeemable preference shares of RM1.00 each of FPL 20,569 20,569
44,093 44,093
- 820,000 ordinary shares of Malaysian Rating Corporation Berhad (“MARC”) of RM1.00 each,
representing an equity shareholding of 4%. 410 410
- Others 293 293
44,796 44,796
(ii) These amounts are non-trade in nature, unsecured, not subject to any interest/profi t elements and repayable on demand.
20. INSURANCE/TAKAFUL CONTRACT LIABILITIES
2018 2017
Reinsurance/ Reinsurance/
Gross retakaful Net Gross retakaful Net
RM’000 RM’000 RM’000 RM’000 RM’000 RM’000
General reinsurance/takaful/retakaful funds (Note (a)) 2,537,293 (427,090) 2,110,203 2,527,853 (462,804) 2,065,049
Family takaful/retakaful funds (Note (b)) 2,723,297 (51,163) 2,672,134 2,580,122 (51,426) 2,528,696
Shareholder’s funds (Note (c)) 59,355 – 59,355 63,203 – 63,203
Total 5,319,945 (478,253) 4,841,692 5,171,178 (514,230) 4,656,948
(a) General reinsurance/takaful/retakaful funds
Claim liabilities (Note (i)) 2,181,919 (371,072) 1,810,847 2,137,519 (401,855) 1,735,664
Premium/contribution liabilities (Note (ii)) 355,374 (56,018) 299,356 390,334 (60,949) 329,385
2,537,293 (427,090) 2,110,203 2,527,853 (462,804) 2,065,049
(i) Claim liabilities
At beginning of the year 2,137,519 (401,855) 1,735,664 2,078,963 (395,315) 1,683,648
Claims incurred in the current
underwriting/accident year 315,400 (94,787) 220,613 318,535 (92,267) 226,268
Adjustment to claims incurred in prior
underwriting/accident years due to
changes in IBNR and PRAD 54,845 21,908 76,753 (25,381) 22,759 (2,622)
Movements in claims incurred in prior
underwriting/accident years 590,427 (3,115) 587,312 750,488 (43,060) 707,428
Claims paid during the year (916,272) 106,777 (809,495) (985,086) 106,028 (879,058)
At end of the year 2,181,919 (371,072) 1,810,847 2,137,519 (401,855) 1,735,664
171ANNUAL REPORT 2018
PERFORMANCEREVIEW
CORPORATEGOVERNANCE
SUSTAINABILITYSTATEMENT
FINANCIALSTATEMENTS
OTHERINFORMATION
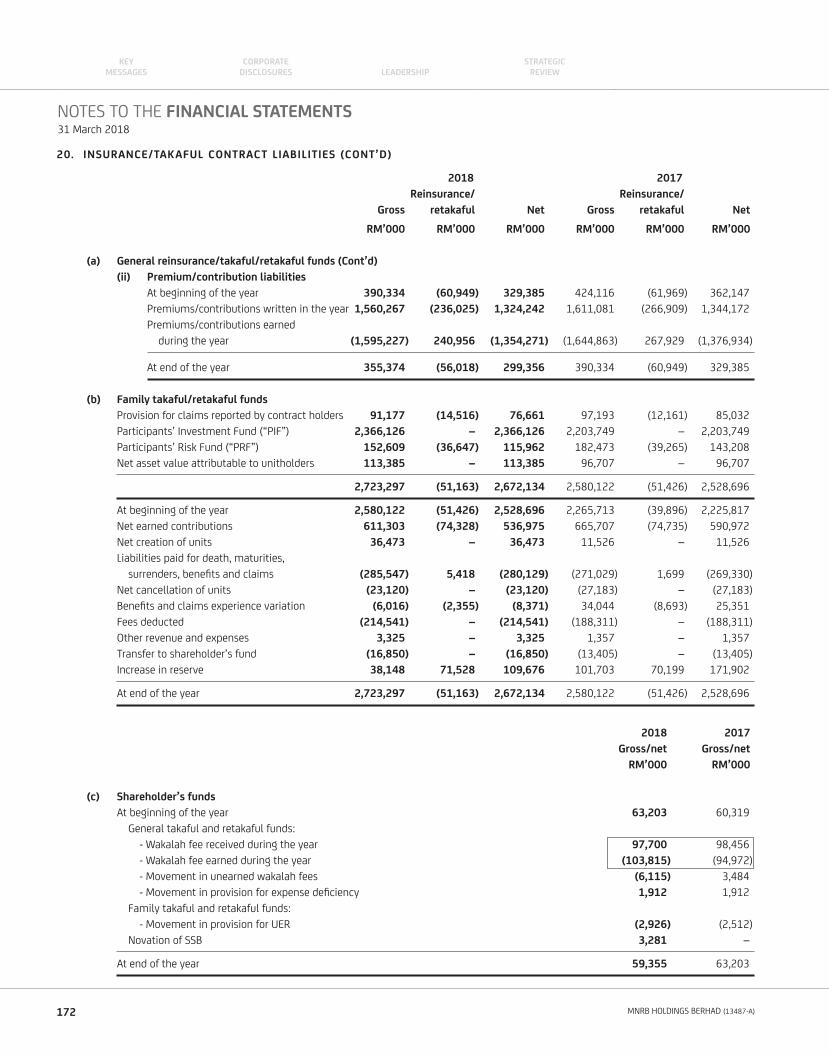
20. INSURANCE/TAKAFUL CONTRACT LIABILITIES (CONT’D)
2018 2017
Reinsurance/ Reinsurance/
Gross retakaful Net Gross retakaful Net
RM’000 RM’000 RM’000 RM’000 RM’000 RM’000
(a) General reinsurance/takaful/retakaful funds (Cont’d)
(ii) Premium/contribution liabilities
At beginning of the year 390,334 (60,949) 329,385 424,116 (61,969) 362,147
Premiums/contributions written in the year 1,560,267 (236,025) 1,324,242 1,611,081 (266,909) 1,344,172
Premiums/contributions earned
during the year (1,595,227) 240,956 (1,354,271) (1,644,863) 267,929 (1,376,934)
At end of the year 355,374 (56,018) 299,356 390,334 (60,949) 329,385
(b) Family takaful/retakaful funds
Provision for claims reported by contract holders 91,177 (14,516) 76,661 97,193 (12,161) 85,032
Participants’ Investment Fund (“PIF”) 2,366,126 – 2,366,126 2,203,749 – 2,203,749
Participants’ Risk Fund (“PRF”) 152,609 (36,647) 115,962 182,473 (39,265) 143,208
Net asset value attributable to unitholders 113,385 – 113,385 96,707 – 96,707
2,723,297 (51,163) 2,672,134 2,580,122 (51,426) 2,528,696
At beginning of the year 2,580,122 (51,426) 2,528,696 2,265,713 (39,896) 2,225,817
Net earned contributions 611,303 (74,328) 536,975 665,707 (74,735) 590,972
Net creation of units 36,473 – 36,473 11,526 – 11,526
Liabilities paid for death, maturities,
surrenders, benefi ts and claims (285,547) 5,418 (280,129) (271,029) 1,699 (269,330)
Net cancellation of units (23,120) – (23,120) (27,183) – (27,183)
Benefi ts and claims experience variation (6,016) (2,355) (8,371) 34,044 (8,693) 25,351
Fees deducted (214,541) – (214,541) (188,311) – (188,311)
Other revenue and expenses 3,325 – 3,325 1,357 – 1,357
Transfer to shareholder’s fund (16,850) – (16,850) (13,405) – (13,405)
Increase in reserve 38,148 71,528 109,676 101,703 70,199 171,902
At end of the year 2,723,297 (51,163) 2,672,134 2,580,122 (51,426) 2,528,696
2018 2017
Gross/net Gross/net
RM’000 RM’000
(c) Shareholder’s funds
At beginning of the year 63,203 60,319
General takaful and retakaful funds:
- Wakalah fee received during the year 97,700 98,456
- Wakalah fee earned during the year (103,815) (94,972)
- Movement in unearned wakalah fees (6,115) 3,484
- Movement in provision for expense defi ciency 1,912 1,912
Family takaful and retakaful funds:
- Movement in provision for UER (2,926) (2,512)
Novation of SSB 3,281 –
At end of the year 59,355 63,203
NOTES TO THE FINANCIAL STATEMENTS31 March 2018
172 MNRB HOLDINGS BERHAD (13487-A)
KEYMESSAGES LEADERSHIP
CORPORATE DISCLOSURES
STRATEGICREVIEW
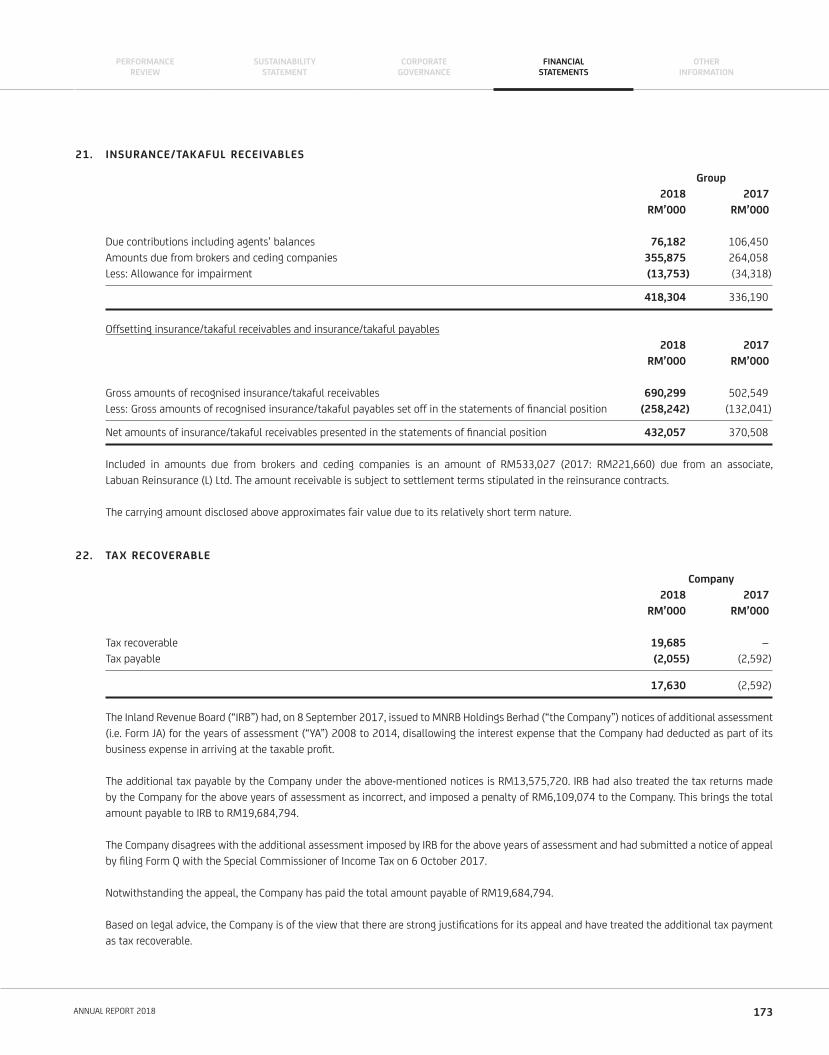
21. INSURANCE/TAKAFUL RECEIVABLES
Group
2018 2017
RM’000 RM’000
Due contributions including agents’ balances 76,182 106,450
Amounts due from brokers and ceding companies 355,875 264,058
Less: Allowance for impairment (13,753) (34,318)
418,304 336,190
Offsetting insurance/takaful receivables and insurance/takaful payables
2018 2017
RM’000 RM’000
Gross amounts of recognised insurance/takaful receivables 690,299 502,549
Less: Gross amounts of recognised insurance/takaful payables set off in the statements of fi nancial position (258,242) (132,041)
Net amounts of insurance/takaful receivables presented in the statements of fi nancial position 432,057 370,508
Included in amounts due from brokers and ceding companies is an amount of RM533,027 (2017: RM221,660) due from an associate,
Labuan Reinsurance (L) Ltd. The amount receivable is subject to settlement terms stipulated in the reinsurance contracts.
The carrying amount disclosed above approximates fair value due to its relatively short term nature.
22. TAX RECOVERABLE
Company
2018 2017
RM’000 RM’000
Tax recoverable 19,685 –
Tax payable (2,055) (2,592)
17,630 (2,592)
The Inland Revenue Board (“IRB”) had, on 8 September 2017, issued to MNRB Holdings Berhad (“the Company”) notices of additional assessment
(i.e. Form JA) for the years of assessment (“YA”) 2008 to 2014, disallowing the interest expense that the Company had deducted as part of its
business expense in arriving at the taxable profi t.
The additional tax payable by the Company under the above-mentioned notices is RM13,575,720. IRB had also treated the tax returns made
by the Company for the above years of assessment as incorrect, and imposed a penalty of RM6,109,074 to the Company. This brings the total
amount payable to IRB to RM19,684,794.
The Company disagrees with the additional assessment imposed by IRB for the above years of assessment and had submitted a notice of appeal
by fi ling Form Q with the Special Commissioner of Income Tax on 6 October 2017.
Notwithstanding the appeal, the Company has paid the total amount payable of RM19,684,794.
Based on legal advice, the Company is of the view that there are strong justifi cations for its appeal and have treated the additional tax payment
as tax recoverable.
173ANNUAL REPORT 2018
PERFORMANCEREVIEW
CORPORATEGOVERNANCE
SUSTAINABILITYSTATEMENT
FINANCIALSTATEMENTS
OTHERINFORMATION
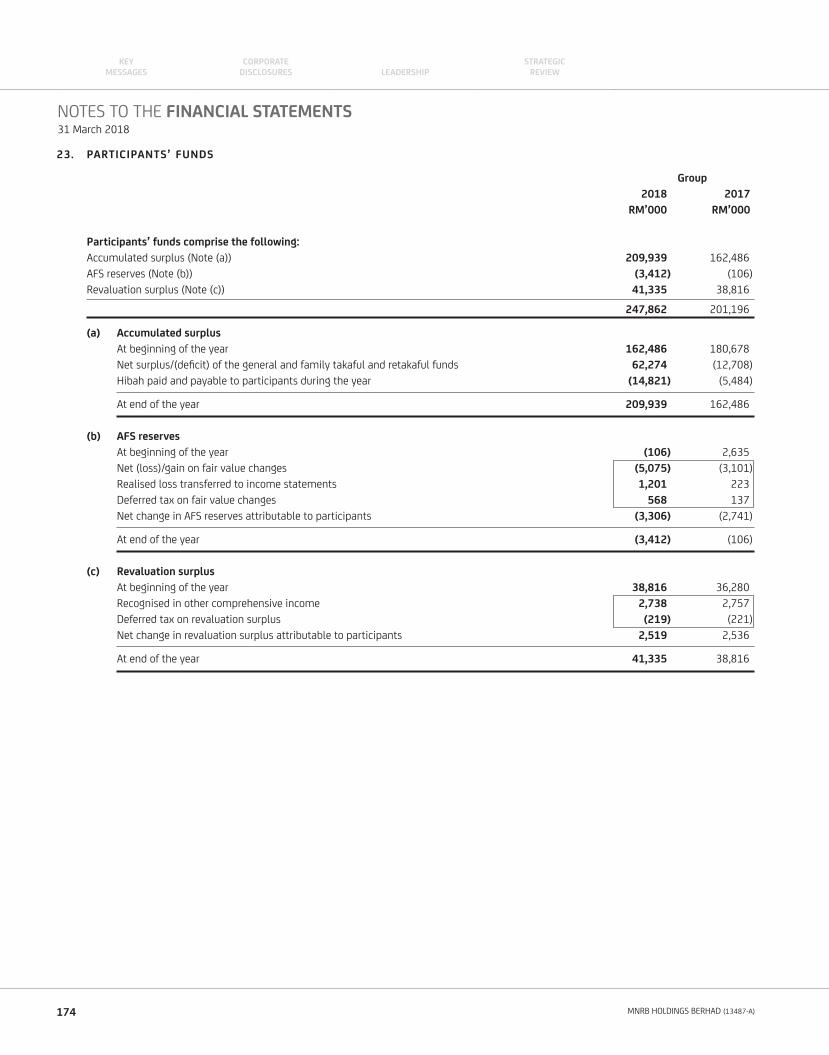
23. PARTICIPANTS’ FUNDS
Group
2018 2017
RM’000 RM’000
Participants’ funds comprise the following:
Accumulated surplus (Note (a)) 209,939 162,486
AFS reserves (Note (b)) (3,412) (106)
Revaluation surplus (Note (c)) 41,335 38,816
247,862 201,196
(a) Accumulated surplus
At beginning of the year 162,486 180,678
Net surplus/(defi cit) of the general and family takaful and retakaful funds 62,274 (12,708)
Hibah paid and payable to participants during the year (14,821) (5,484)
At end of the year 209,939 162,486
(b) AFS reserves
At beginning of the year (106) 2,635
Net (loss)/gain on fair value changes (5,075) (3,101)
Realised loss transferred to income statements 1,201 223
Deferred tax on fair value changes 568 137
Net change in AFS reserves attributable to participants (3,306) (2,741)
At end of the year (3,412) (106)
(c) Revaluation surplus
At beginning of the year 38,816 36,280
Recognised in other comprehensive income 2,738 2,757
Deferred tax on revaluation surplus (219) (221)
Net change in revaluation surplus attributable to participants 2,519 2,536
At end of the year 41,335 38,816
NOTES TO THE FINANCIAL STATEMENTS31 March 2018
174 MNRB HOLDINGS BERHAD (13487-A)
KEYMESSAGES LEADERSHIP
CORPORATE DISCLOSURES
STRATEGICREVIEW
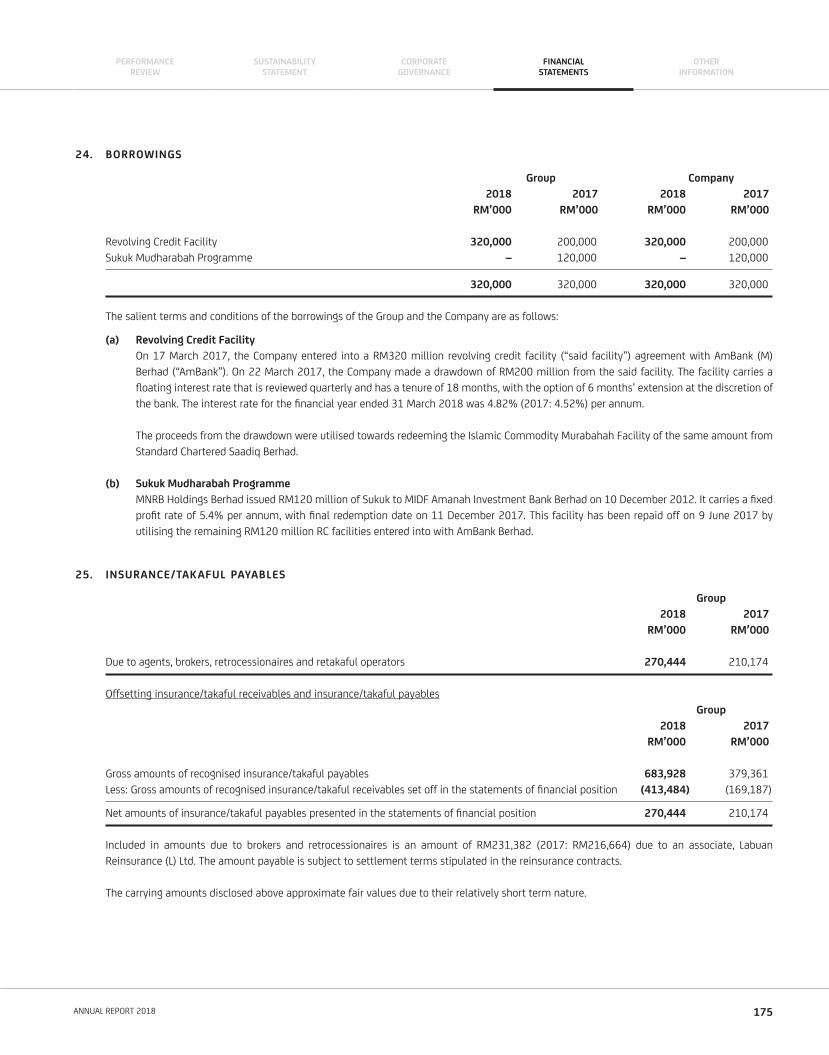
24. BORROWINGS
Group Company
2018 2017 2018 2017
RM’000 RM’000 RM’000 RM’000
Revolving Credit Facility 320,000 200,000 320,000 200,000
Sukuk Mudharabah Programme – 120,000 – 120,000
320,000 320,000 320,000 320,000
The salient terms and conditions of the borrowings of the Group and the Company are as follows:
(a) Revolving Credit Facility
On 17 March 2017, the Company entered into a RM320 million revolving credit facility (“said facility”) agreement with AmBank (M)
Berhad (“AmBank”). On 22 March 2017, the Company made a drawdown of RM200 million from the said facility. The facility carries a
fl oating interest rate that is reviewed quarterly and has a tenure of 18 months, with the option of 6 months’ extension at the discretion of
the bank. The interest rate for the fi nancial year ended 31 March 2018 was 4.82% (2017: 4.52%) per annum.
The proceeds from the drawdown were utilised towards redeeming the Islamic Commodity Murabahah Facility of the same amount from
Standard Chartered Saadiq Berhad.
(b) Sukuk Mudharabah Programme
MNRB Holdings Berhad issued RM120 million of Sukuk to MIDF Amanah Investment Bank Berhad on 10 December 2012. It carries a fi xed
profi t rate of 5.4% per annum, with fi nal redemption date on 11 December 2017. This facility has been repaid off on 9 June 2017 by
utilising the remaining RM120 million RC facilities entered into with AmBank Berhad.
25. INSURANCE/TAKAFUL PAYABLES
Group
2018 2017
RM’000 RM’000
Due to agents, brokers, retrocessionaires and retakaful operators 270,444 210,174
Offsetting insurance/takaful receivables and insurance/takaful payables
Group
2018 2017
RM’000 RM’000
Gross amounts of recognised insurance/takaful payables 683,928 379,361
Less: Gross amounts of recognised insurance/takaful receivables set off in the statements of fi nancial position (413,484) (169,187)
Net amounts of insurance/takaful payables presented in the statements of fi nancial position 270,444 210,174
Included in amounts due to brokers and retrocessionaires is an amount of RM231,382 (2017: RM216,664) due to an associate, Labuan
Reinsurance (L) Ltd. The amount payable is subject to settlement terms stipulated in the reinsurance contracts.
The carrying amounts disclosed above approximate fair values due to their relatively short term nature.
175ANNUAL REPORT 2018
PERFORMANCEREVIEW
CORPORATEGOVERNANCE
SUSTAINABILITYSTATEMENT
FINANCIALSTATEMENTS
OTHERINFORMATION
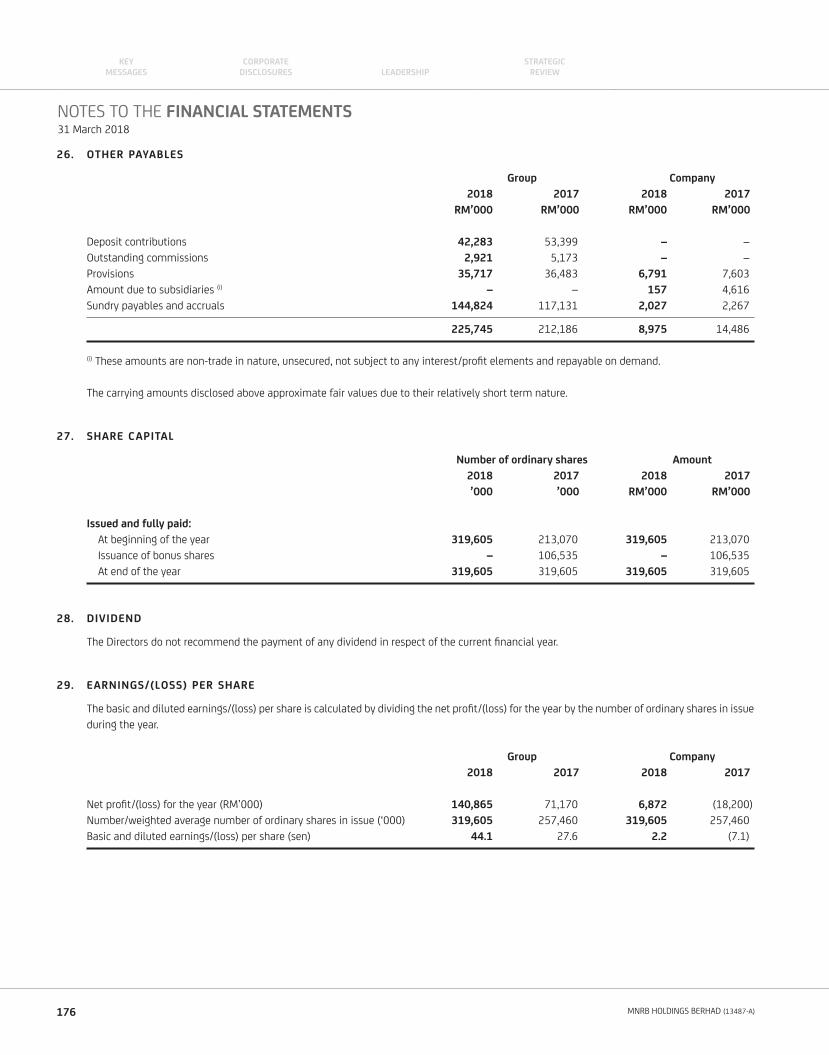
26. OTHER PAYABLES
Group Company
2018 2017 2018 2017
RM’000 RM’000 RM’000 RM’000
Deposit contributions 42,283 53,399 – –
Outstanding commissions 2,921 5,173 – –
Provisions 35,717 36,483 6,791 7,603
Amount due to subsidiaries (i) – – 157 4,616
Sundry payables and accruals 144,824 117,131 2,027 2,267
225,745 212,186 8,975 14,486
(i) These amounts are non-trade in nature, unsecured, not subject to any interest/profi t elements and repayable on demand.
The carrying amounts disclosed above approximate fair values due to their relatively short term nature.
27. SHARE CAPITAL
Number of ordinary shares Amount
2018 2017 2018 2017
’000 ’000 RM’000 RM’000
Issued and fully paid:
At beginning of the year 319,605 213,070 319,605 213,070
Issuance of bonus shares – 106,535 – 106,535
At end of the year 319,605 319,605 319,605 319,605
28. DIVIDEND
The Directors do not recommend the payment of any dividend in respect of the current fi nancial year.
29. EARNINGS/(LOSS) PER SHARE
The basic and diluted earnings/(loss) per share is calculated by dividing the net profi t/(loss) for the year by the number of ordinary shares in issue
during the year.
Group Company
2018 2017 2018 2017
Net profi t/(loss) for the year (RM’000) 140,865 71,170 6,872 (18,200)
Number/weighted average number of ordinary shares in issue (‘000) 319,605 257,460 319,605 257,460
Basic and diluted earnings/(loss) per share (sen) 44.1 27.6 2.2 (7.1)
NOTES TO THE FINANCIAL STATEMENTS31 March 2018
176 MNRB HOLDINGS BERHAD (13487-A)
KEYMESSAGES LEADERSHIP
CORPORATE DISCLOSURES
STRATEGICREVIEW
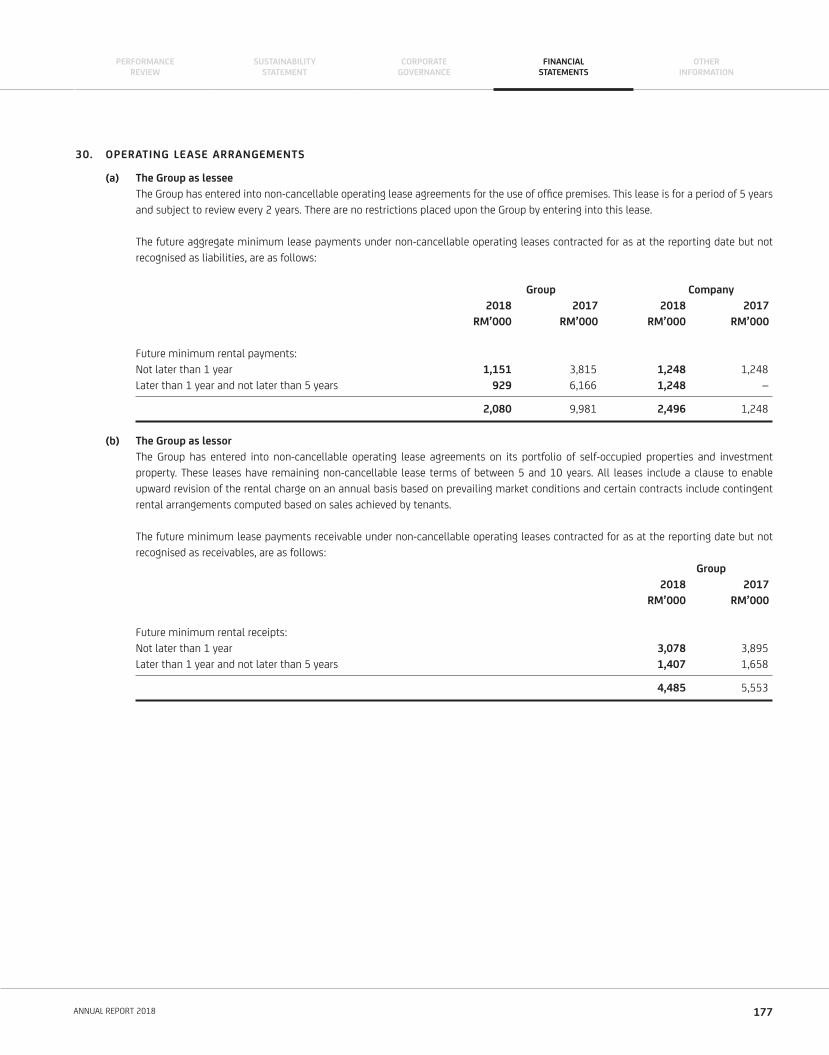
30. OPERATING LEASE ARRANGEMENTS
(a) The Group as lessee
The Group has entered into non-cancellable operating lease agreements for the use of offi ce premises. This lease is for a period of 5 years
and subject to review every 2 years. There are no restrictions placed upon the Group by entering into this lease.
The future aggregate minimum lease payments under non-cancellable operating leases contracted for as at the reporting date but not
recognised as liabilities, are as follows:
Group Company
2018 2017 2018 2017
RM’000 RM’000 RM’000 RM’000
Future minimum rental payments:
Not later than 1 year 1,151 3,815 1,248 1,248
Later than 1 year and not later than 5 years 929 6,166 1,248 –
2,080 9,981 2,496 1,248
(b) The Group as lessor
The Group has entered into non-cancellable operating lease agreements on its portfolio of self-occupied properties and investment
property. These leases have remaining non-cancellable lease terms of between 5 and 10 years. All leases include a clause to enable
upward revision of the rental charge on an annual basis based on prevailing market conditions and certain contracts include contingent
rental arrangements computed based on sales achieved by tenants.
The future minimum lease payments receivable under non-cancellable operating leases contracted for as at the reporting date but not
recognised as receivables, are as follows:
Group
2018 2017
RM’000 RM’000
Future minimum rental receipts:
Not later than 1 year 3,078 3,895
Later than 1 year and not later than 5 years 1,407 1,658
4,485 5,553
177ANNUAL REPORT 2018
PERFORMANCEREVIEW
CORPORATEGOVERNANCE
SUSTAINABILITYSTATEMENT
FINANCIALSTATEMENTS
OTHERINFORMATION
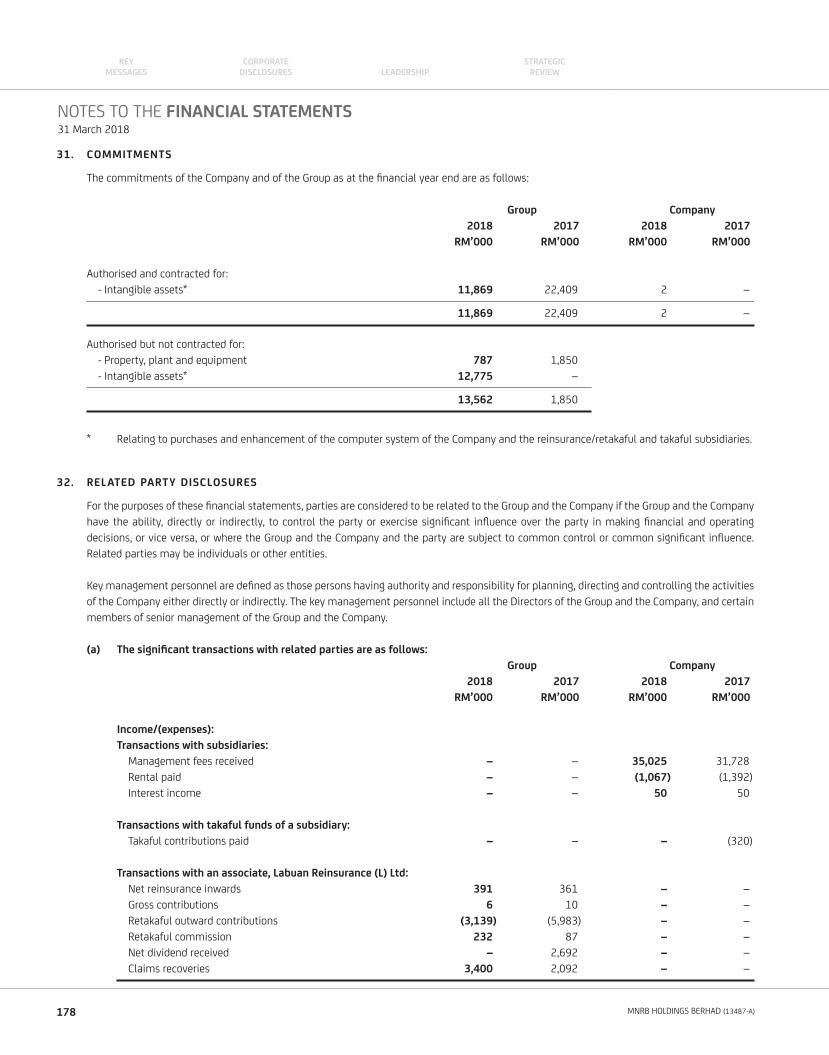
31. COMMITMENTS
The commitments of the Company and of the Group as at the fi nancial year end are as follows:
Group Company
2018 2017 2018 2017
RM’000 RM’000 RM’000 RM’000
Authorised and contracted for:
- Intangible assets* 11,869 22,409 2 –
11,869 22,409 2 –
Authorised but not contracted for:
- Property, plant and equipment 787 1,850
- Intangible assets* 12,775 –
13,562 1,850
* Relating to purchases and enhancement of the computer system of the Company and the reinsurance/retakaful and takaful subsidiaries.
32. RELATED PARTY DISCLOSURES
For the purposes of these fi nancial statements, parties are considered to be related to the Group and the Company if the Group and the Company
have the ability, directly or indirectly, to control the party or exercise signifi cant infl uence over the party in making fi nancial and operating
decisions, or vice versa, or where the Group and the Company and the party are subject to common control or common signifi cant infl uence.
Related parties may be individuals or other entities.
Key management personnel are defi ned as those persons having authority and responsibility for planning, directing and controlling the activities
of the Company either directly or indirectly. The key management personnel include all the Directors of the Group and the Company, and certain
members of senior management of the Group and the Company.
(a) The signifi cant transactions with related parties are as follows:
Group Company
2018 2017 2018 2017
RM’000 RM’000 RM’000 RM’000
Income/(expenses):
Transactions with subsidiaries:
Management fees received – – 35,025 31,728
Rental paid – – (1,067) (1,392)
Interest income – – 50 50
Transactions with takaful funds of a subsidiary:
Takaful contributions paid – – – (320)
Transactions with an associate, Labuan Reinsurance (L) Ltd:
Net reinsurance inwards 391 361 – –
Gross contributions 6 10 – –
Retakaful outward contributions (3,139) (5,983) – –
Retakaful commission 232 87 – –
Net dividend received – 2,692 – –
Claims recoveries 3,400 2,092 – –
NOTES TO THE FINANCIAL STATEMENTS31 March 2018
178 MNRB HOLDINGS BERHAD (13487-A)
KEYMESSAGES LEADERSHIP
CORPORATE DISCLOSURES
STRATEGICREVIEW
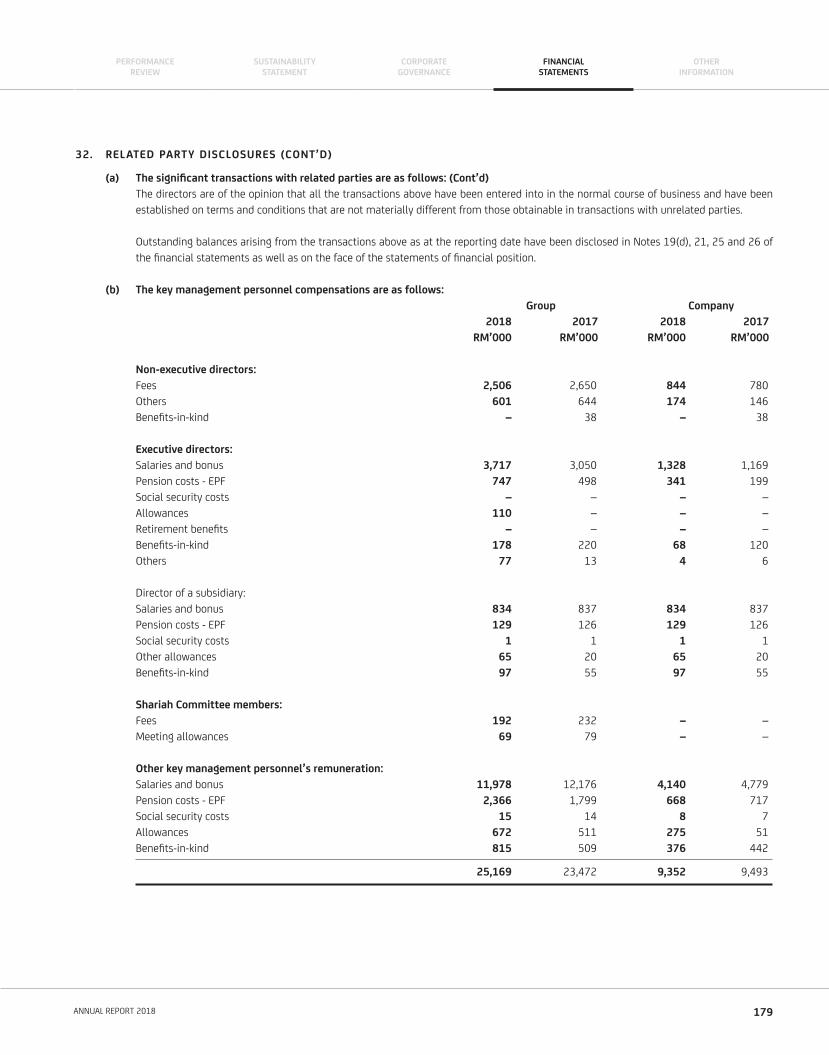
32. RELATED PARTY DISCLOSURES (CONT’D)
(a) The signifi cant transactions with related parties are as follows: (Cont’d)
The directors are of the opinion that all the transactions above have been entered into in the normal course of business and have been
established on terms and conditions that are not materially different from those obtainable in transactions with unrelated parties.
Outstanding balances arising from the transactions above as at the reporting date have been disclosed in Notes 19(d), 21, 25 and 26 of
the fi nancial statements as well as on the face of the statements of fi nancial position.
(b) The key management personnel compensations are as follows:
Group Company
2018 2017 2018 2017
RM’000 RM’000 RM’000 RM’000
Non-executive directors:
Fees 2,506 2,650 844 780
Others 601 644 174 146
Benefi ts-in-kind – 38 – 38
Executive directors:
Salaries and bonus 3,717 3,050 1,328 1,169
Pension costs - EPF 747 498 341 199
Social security costs – – – –
Allowances 110 – – –
Retirement benefi ts – – – –
Benefi ts-in-kind 178 220 68 120
Others 77 13 4 6
Director of a subsidiary:
Salaries and bonus 834 837 834 837
Pension costs - EPF 129 126 129 126
Social security costs 1 1 1 1
Other allowances 65 20 65 20
Benefi ts-in-kind 97 55 97 55
Shariah Committee members:
Fees 192 232 – –
Meeting allowances 69 79 – –
Other key management personnel’s remuneration:
Salaries and bonus 11,978 12,176 4,140 4,779
Pension costs - EPF 2,366 1,799 668 717
Social security costs 15 14 8 7
Allowances 672 511 275 51
Benefi ts-in-kind 815 509 376 442
25,169 23,472 9,352 9,493
179ANNUAL REPORT 2018
PERFORMANCEREVIEW
CORPORATEGOVERNANCE
SUSTAINABILITYSTATEMENT
FINANCIALSTATEMENTS
OTHERINFORMATION
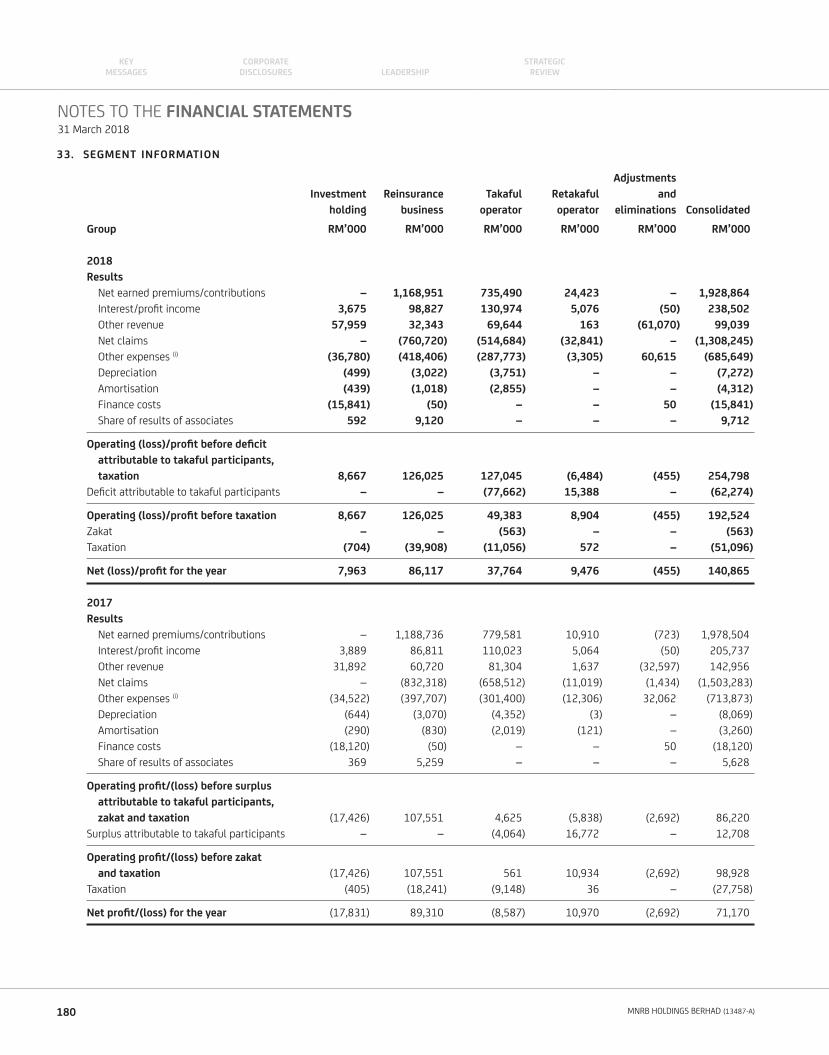
33. SEGMENT INFORMATION
Adjustments
Investment Reinsurance Takaful Retakaful and
holding business operator operator eliminations Consolidated
Group RM’000 RM’000 RM’000 RM’000 RM’000 RM’000
2018
Results
Net earned premiums/contributions – 1,168,951 735,490 24,423 – 1,928,864
Interest/profi t income 3,675 98,827 130,974 5,076 (50) 238,502
Other revenue 57,959 32,343 69,644 163 (61,070) 99,039
Net claims – (760,720) (514,684) (32,841) – (1,308,245)
Other expenses (i) (36,780) (418,406) (287,773) (3,305) 60,615 (685,649)
Depreciation (499) (3,022) (3,751) – – (7,272)
Amortisation (439) (1,018) (2,855) – – (4,312)
Finance costs (15,841) (50) – – 50 (15,841)
Share of results of associates 592 9,120 – – – 9,712
Operating (loss)/profi t before defi cit
attributable to takaful participants,
taxation 8,667 126,025 127,045 (6,484) (455) 254,798
Defi cit attributable to takaful participants – – (77,662) 15,388 – (62,274)
Operating (loss)/profi t before taxation 8,667 126,025 49,383 8,904 (455) 192,524
Zakat – – (563) – – (563)
Taxation (704) (39,908) (11,056) 572 – (51,096)
Net (loss)/profi t for the year 7,963 86,117 37,764 9,476 (455) 140,865
2017
Results
Net earned premiums/contributions – 1,188,736 779,581 10,910 (723) 1,978,504
Interest/profi t income 3,889 86,811 110,023 5,064 (50) 205,737
Other revenue 31,892 60,720 81,304 1,637 (32,597) 142,956
Net claims – (832,318) (658,512) (11,019) (1,434) (1,503,283)
Other expenses (i) (34,522) (397,707) (301,400) (12,306) 32,062 (713,873)
Depreciation (644) (3,070) (4,352) (3) – (8,069)
Amortisation (290) (830) (2,019) (121) – (3,260)
Finance costs (18,120) (50) – – 50 (18,120)
Share of results of associates 369 5,259 – – – 5,628
Operating profi t/(loss) before surplus
attributable to takaful participants,
zakat and taxation (17,426) 107,551 4,625 (5,838) (2,692) 86,220
Surplus attributable to takaful participants – – (4,064) 16,772 – 12,708
Operating profi t/(loss) before zakat
and taxation (17,426) 107,551 561 10,934 (2,692) 98,928
Taxation (405) (18,241) (9,148) 36 – (27,758)
Net profi t/(loss) for the year (17,831) 89,310 (8,587) 10,970 (2,692) 71,170
NOTES TO THE FINANCIAL STATEMENTS31 March 2018
180 MNRB HOLDINGS BERHAD (13487-A)
KEYMESSAGES LEADERSHIP
CORPORATE DISCLOSURES
STRATEGICREVIEW
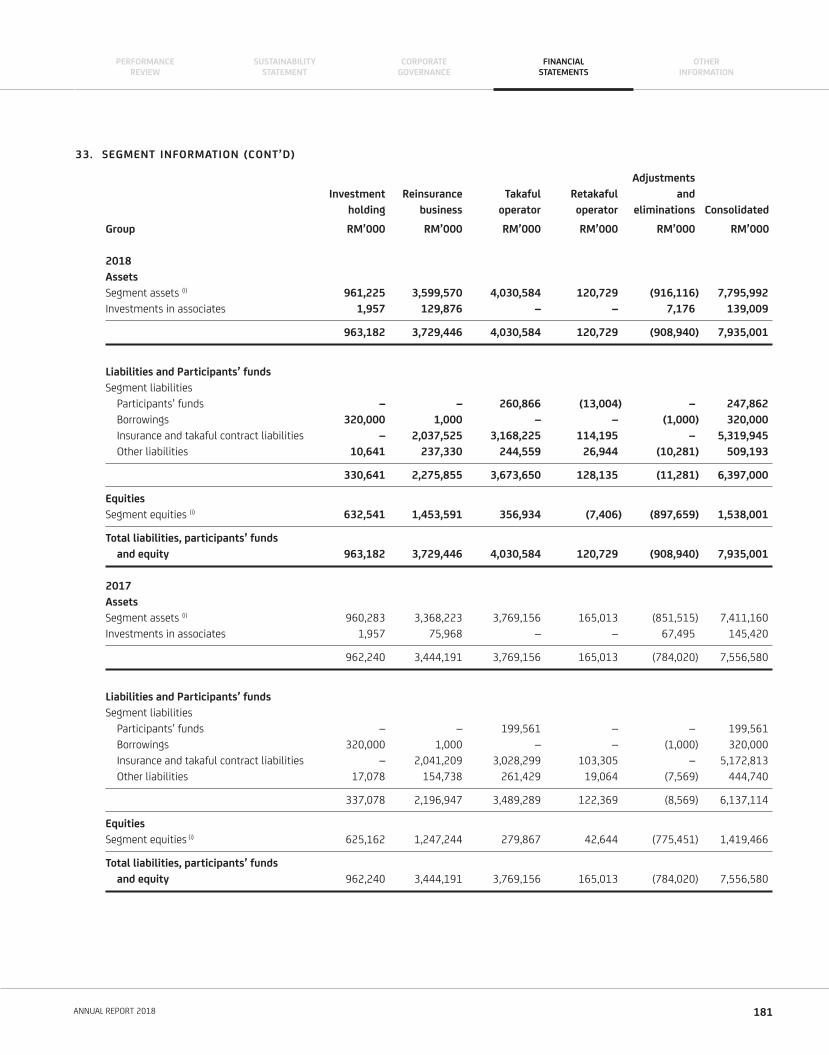
33. SEGMENT INFORMATION (CONT’D)
Adjustments
Investment Reinsurance Takaful Retakaful and
holding business operator operator eliminations Consolidated
Group RM’000 RM’000 RM’000 RM’000 RM’000 RM’000
2018
Assets
Segment assets (i) 961,225 3,599,570 4,030,584 120,729 (916,116) 7,795,992
Investments in associates 1,957 129,876 – – 7,176 139,009
963,182 3,729,446 4,030,584 120,729 (908,940) 7,935,001
Liabilities and Participants’ funds
Segment liabilities
Participants’ funds – – 260,866 (13,004) – 247,862
Borrowings 320,000 1,000 – – (1,000) 320,000
Insurance and takaful contract liabilities – 2,037,525 3,168,225 114,195 – 5,319,945
Other liabilities 10,641 237,330 244,559 26,944 (10,281) 509,193
330,641 2,275,855 3,673,650 128,135 (11,281) 6,397,000
Equities
Segment equities (i) 632,541 1,453,591 356,934 (7,406) (897,659) 1,538,001
Total liabilities, participants’ funds
and equity 963,182 3,729,446 4,030,584 120,729 (908,940) 7,935,001
2017
Assets
Segment assets (i) 960,283 3,368,223 3,769,156 165,013 (851,515) 7,411,160
Investments in associates 1,957 75,968 – – 67,495 145,420
962,240 3,444,191 3,769,156 165,013 (784,020) 7,556,580
Liabilities and Participants’ funds
Segment liabilities
Participants’ funds – – 199,561 – – 199,561
Borrowings 320,000 1,000 – – (1,000) 320,000
Insurance and takaful contract liabilities – 2,041,209 3,028,299 103,305 – 5,172,813
Other liabilities 17,078 154,738 261,429 19,064 (7,569) 444,740
337,078 2,196,947 3,489,289 122,369 (8,569) 6,137,114
Equities
Segment equities (i) 625,162 1,247,244 279,867 42,644 (775,451) 1,419,466
Total liabilities, participants’ funds
and equity 962,240 3,444,191 3,769,156 165,013 (784,020) 7,556,580
181ANNUAL REPORT 2018
PERFORMANCEREVIEW
CORPORATEGOVERNANCE
SUSTAINABILITYSTATEMENT
FINANCIALSTATEMENTS
OTHERINFORMATION
33. SEGMENT INFORMATION (CONT’D)
(i) Included in segment assets is a Qard granted to the general and family retakaful funds by the shareholder’s fund of the retakaful division
of reinsurance subsidiary, amounting to RM84.6 million (2017: RM84.6 million). Qard represents a loan to the general and family retakaful
funds to make good any underwriting defi cit experienced during a fi nancial period. These balances, including the impairment losses
recognised thereon amounting to RM72.1 million (2017: RM72.1 million), have been eliminated in full upon consolidation.
34. RISK MANAGEMENT FRAMEWORK
The Group Enterprise Risk Management (“ERM”) Framework was established to determine the level of risk acceptable to the Group relating to its
core operations by setting the appropriate Board approved limits for adherence by management, after taking into account the risk parameters,
the nature, the size and the mix and complexity of business and operations. An enterprise risk management process is adopted to identify and
evaluate key business risks that may affect the organisation and to establish and implement an appropriate system of internal controls to
manage these risks while ensuring full and effective control over signifi cant strategic, fi nancial, organisational and compliance matters.
The Group ERM Framework aims to serve as a guide for the effective management of risk throughout the Group. The Framework is intended to
provide guidance to the Group in performing its risk management roles and responsibilities and ultimately aims to support the achievement of
the Group’s strategic and fi nancial objectives.
The primary objectives of the Group ERM Framework are as follows:
(i) Provides a single point of reference for managing risk of the Group in a systematic and structured way;
(ii) Embeds the Risk Management process and ensures it is an integral part of the Group’s planning process at a strategic and operational
level;
(iii) Facilitates effective risk oversight through a clear internal risk governance structure and responsibilities;
(iv) Helps create a risk awareness culture from a strategic, operational and individual perspective; and
(v) Standardises risk terminologies across the Group to facilitate a consistent and uniform approach in managing risk.
In pursuit of the above objectives, it is the Group’s policy to adhere to good governance standards and implement best practices with regards to
risk management principles. The Group also aims to uphold high standards of business practices in all its activities.
(a) Risk management governance
The Risk Management Governance structure is as follows:
(i) The Board had established a dedicated Board Committee known as the Risk Management Committee of the Board (“RMCB”) to
oversee the implementation of an enterprise-wide risk management framework. This is replicated at each of the main operating
subsidiaries;
(ii) The Board had also established a dedicated Investment Committee to further oversee risks associated with investments and assets
allocation. This is also replicated at each of the main operating subsidiaries;
(iii) The Operational Risk Management Committee (“ORMC”), which comprises the President & Group Chief Executive Offi cer and Senior
Management, implements the risk management processes, provides assurance to the Board that the processes have been carried
out effectively and inculcates a risk management culture on an enterprise-wide basis. The ORMC is also established at each of the
main operating subsidiaries;
(iv) The Group Chief Risk Offi cer (“GCRO”) and Risk Management Department established the infrastructure and facilitate the risk
management processes in the Company and across the subsidiaries through the adoption of the Group ERM Framework;
(v) At the operational level, the implementation of risk management processes in the day to day operations of the Group is consistent
with the Group ERM Framework;
(vi) The Line Managers of each department within the Group are responsible for using the various components of the Group ERM
Framework as an integral part of the business processes and procedures.
NOTES TO THE FINANCIAL STATEMENTS31 March 2018
182 MNRB HOLDINGS BERHAD (13487-A)
KEYMESSAGES LEADERSHIP
CORPORATE DISCLOSURES
STRATEGICREVIEW
34. RISK MANAGEMENT FRAMEWORK (CONT’D)
(a) Risk management governance (Cont’d)
In addition to the above, the Group has established Investment Policies at each main operating subsidiary to ensure proper risk management
by investing in low-risk assets, deposits with licensed fi nancial institutions, debt securities and other marketable securities. The Group
investment strategy is towards capital preservation, return maximization and liquidity management.
Further, each main operating subsidiary had put in place the following policies to ensure proper risk management:
(i) Underwriting Policy where each subsidiary’s underwriting strategy is to have an acceptable mix and spread of business portfolio by:
• observing underwriting guidelines and limits; and
• applying prudential standards in the assessment of security of its key retrocessionaires/retrotakaful/retakaful providers
(“counterparties”).
In this respect, each main operating subsidiary complies with the relevant regulatory guidelines in the underwriting of risks.
(ii) Claims Reserving Policy where claim liabilities are determined based on historical claims trends, existing knowledge of events,
terms and conditions of policies/certifi cates and assessment of circumstances. Past experience with similar events, historical claims
development trends, legislative changes, judicial decisions and economic conditions are particularly relevant in claims reserving.
(b) Capital management objectives, policies and approach
The Capital Management Plan (“CMP”) is designed and implemented at the main operating subsidiaries to ensure an effective management
of their respective capital and maximise the Group’s value by optimising capital structure and enhancing capital effi ciency.
Under the CMP, the main operating subsidiaries measure and monitor their respective capital position mainly via the Capital Adequacy
Ratio (“CAR”).
The CMP identifi es certain trigger points of the CAR position and further describes a set of corrective action plans that will be implemented
towards maintaining an adequate level of capital. It is intended that capital will be utilised more effi ciently in a controlled manner so that
the main operating subsidiaries will be able to manage their capital position above the respective internal target.
Capital management objectives
The main objective of capital management is to monitor and maintain, at all times, an appropriate level of capital to commensurate with
the main operating subsidiaries’ business operations and the resultant risk profi le. The key objective of the CMP is to trigger appropriate
action plans to be taken by the Board and the management of the main operating subsidiaries in the event of internal capital levels falling
below the internal target requirement. This includes remedial actions that must be undertaken by the main operating subsidiaries’ Board
and management to improve the capital position.
Capital management policies
The key capital management policies are as follows:
(i) Ensure the Group has adequate capital to support its business objectives; and
(ii) Establish responsibility of the main operating subsidiaries’ Board and management in developing an internal capital adequacy
assessment process and setting capital targets which commensurate with its business operations and the resultant risk profi le and
control environment.
Approach to capital management
The main operating subsidiaries conduct stress tests in compliance with BNM’s Policy Document on Stress Testing. The impact of the
adverse scenarios on the capital position of the main operating subsidiaries is assessed on a quarterly basis, focusing on short to medium
term views.
183ANNUAL REPORT 2018
PERFORMANCEREVIEW
CORPORATEGOVERNANCE
SUSTAINABILITYSTATEMENT
FINANCIALSTATEMENTS
OTHERINFORMATION
34. RISK MANAGEMENT FRAMEWORK (CONT’D)
(c) Regulatory framework
The Company and its main operating subsidiaries are required to comply with the Financial Services Act (“FSA”) 2013 and Islamic Financial
Services Act (“IFSA”) 2013.
In line with the RBC Framework and RBCT Framework requirements on capital adequacy, the main operating subsidiaries actively manage
their capital by taking into account the potential impact of business exposure on their business strategies, risk profi les and overall
resilience.
In addition, the Company is required to comply with the Listing Requirements of Bursa Malaysia Securities Berhad’s (“Bursa”), Capital
Markets and Services Act 2007, Companies Act 2016 and other relevant Acts.
35. UNDERWRITING RISK
(a) General reinsurance/retakaful
(i) Nature of risk
The reinsurance/retakaful subsidiary principally underwrites all classes of general reinsurance/retakaful business. Risks under these
contracts usually cover a twelve-month duration other than some long term contracts which may cover up to 3 years or more.
The most signifi cant risk arises from adverse claims development and occurrence of new catastrophe losses. These risks vary
signifi cantly in relation to economic conditions and territories from which the risks are underwritten.
The above risks are mitigated by diversifi cation across a large portfolio of business to ensure a balanced mix and spread of business.
Diversifi cation through the implementation of underwriting strategies and claim management policies reduces the volatility of risks
and improves the overall portfolio experience, and also ensures that its insurance contract liabilities are adequate.
The reinsurance/retakaful subsidiary also manages its risk exposure through the use of retrocession programmes which are reviewed
annually by the ORMC and RMCB, and subsequently approved by the Board. Prudent standards are applied in placement of the
reinsurance subsidiary’s key retrocessionaires.
Stress Testing is performed on a quarterly basis. The purpose of the Stress Testing is to test the solvency of the general reinsurance/
retakaful business under the various scenarios according to regulatory guidelines, simulating drastic changes in major parameters
such as new business volume and investment environment.
NOTES TO THE FINANCIAL STATEMENTS31 March 2018
184 MNRB HOLDINGS BERHAD (13487-A)
KEYMESSAGES LEADERSHIP
CORPORATE DISCLOSURES
STRATEGICREVIEW
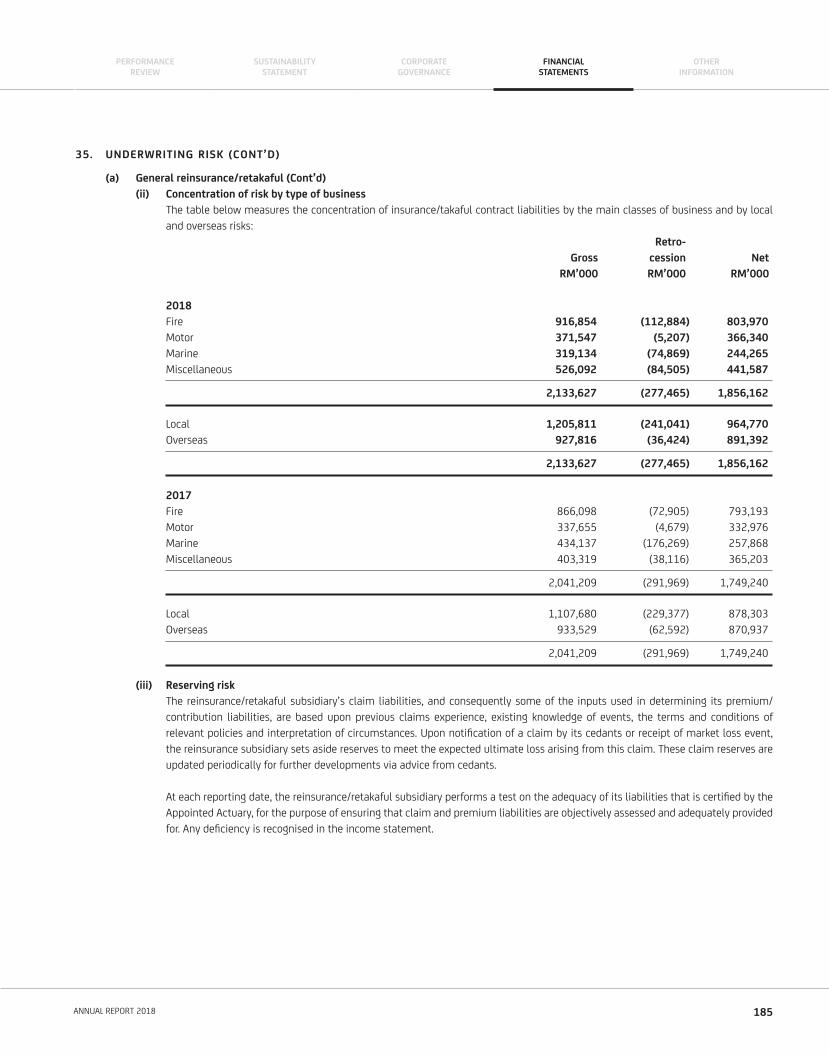
35. UNDERWRITING RISK (CONT’D)
(a) General reinsurance/retakaful (Cont’d)
(ii) Concentration of risk by type of business
The table below measures the concentration of insurance/takaful contract liabilities by the main classes of business and by local
and overseas risks:
Retro-
Gross cession Net
RM’000 RM’000 RM’000
2018
Fire 916,854 (112,884) 803,970
Motor 371,547 (5,207) 366,340
Marine 319,134 (74,869) 244,265
Miscellaneous 526,092 (84,505) 441,587
2,133,627 (277,465) 1,856,162
Local 1,205,811 (241,041) 964,770
Overseas 927,816 (36,424) 891,392
2,133,627 (277,465) 1,856,162
2017
Fire 866,098 (72,905) 793,193
Motor 337,655 (4,679) 332,976
Marine 434,137 (176,269) 257,868
Miscellaneous 403,319 (38,116) 365,203
2,041,209 (291,969) 1,749,240
Local 1,107,680 (229,377) 878,303
Overseas 933,529 (62,592) 870,937
2,041,209 (291,969) 1,749,240
(iii) Reserving risk
The reinsurance/retakaful subsidiary’s claim liabilities, and consequently some of the inputs used in determining its premium/
contribution liabilities, are based upon previous claims experience, existing knowledge of events, the terms and conditions of
relevant policies and interpretation of circumstances. Upon notifi cation of a claim by its cedants or receipt of market loss event,
the reinsurance subsidiary sets aside reserves to meet the expected ultimate loss arising from this claim. These claim reserves are
updated periodically for further developments via advice from cedants.
At each reporting date, the reinsurance/retakaful subsidiary performs a test on the adequacy of its liabilities that is certifi ed by the
Appointed Actuary, for the purpose of ensuring that claim and premium liabilities are objectively assessed and adequately provided
for. Any defi ciency is recognised in the income statement.
185ANNUAL REPORT 2018
PERFORMANCEREVIEW
CORPORATEGOVERNANCE
SUSTAINABILITYSTATEMENT
FINANCIALSTATEMENTS
OTHERINFORMATION
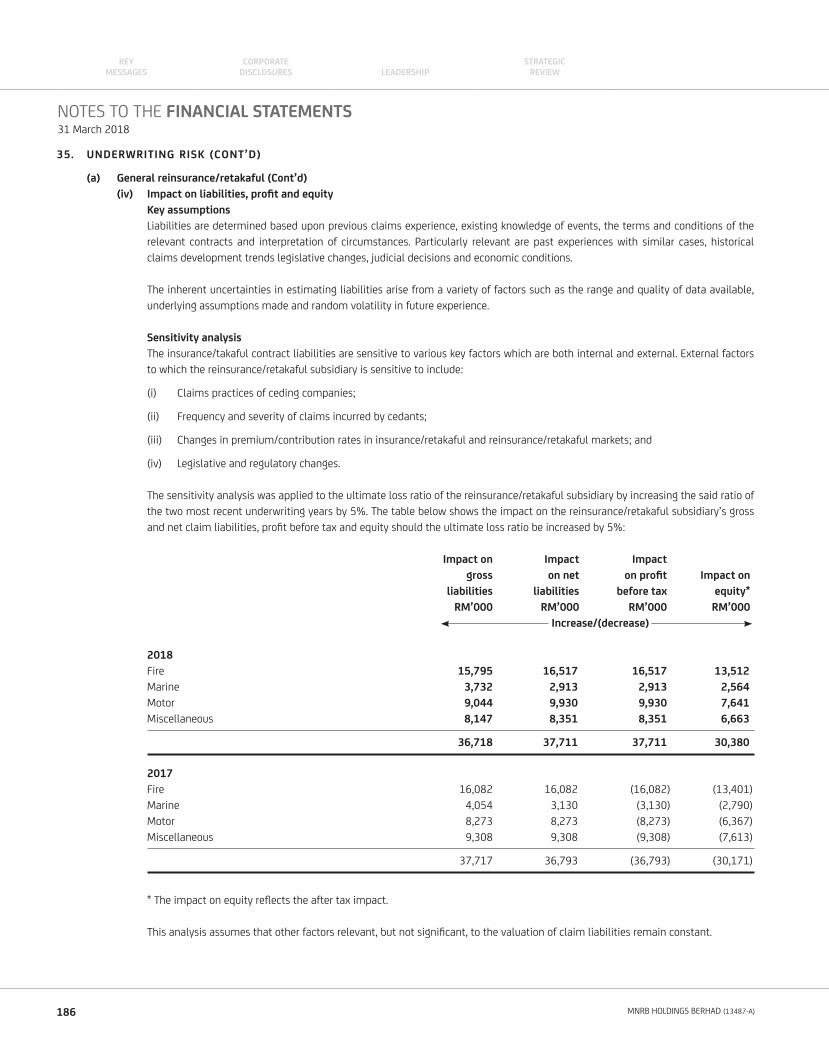
35. UNDERWRITING RISK (CONT’D)
(a) General reinsurance/retakaful (Cont’d)
(iv) Impact on liabilities, profi t and equity
Key assumptions
Liabilities are determined based upon previous claims experience, existing knowledge of events, the terms and conditions of the
relevant contracts and interpretation of circumstances. Particularly relevant are past experiences with similar cases, historical
claims development trends legislative changes, judicial decisions and economic conditions.
The inherent uncertainties in estimating liabilities arise from a variety of factors such as the range and quality of data available,
underlying assumptions made and random volatility in future experience.
Sensitivity analysis
The insurance/takaful contract liabilities are sensitive to various key factors which are both internal and external. External factors
to which the reinsurance/retakaful subsidiary is sensitive to include:
(i) Claims practices of ceding companies;
(ii) Frequency and severity of claims incurred by cedants;
(iii) Changes in premium/contribution rates in insurance/retakaful and reinsurance/retakaful markets; and
(iv) Legislative and regulatory changes.
The sensitivity analysis was applied to the ultimate loss ratio of the reinsurance/retakaful subsidiary by increasing the said ratio of
the two most recent underwriting years by 5%. The table below shows the impact on the reinsurance/retakaful subsidiary’s gross
and net claim liabilities, profi t before tax and equity should the ultimate loss ratio be increased by 5%:
Impact on Impact Impact
gross on net on profi t Impact on
liabilities liabilities before tax equity*
RM’000 RM’000 RM’000 RM’000
Increase/(decrease)
2018
Fire 15,795 16,517 16,517 13,512
Marine 3,732 2,913 2,913 2,564
Motor 9,044 9,930 9,930 7,641
Miscellaneous 8,147 8,351 8,351 6,663
36,718 37,711 37,711 30,380
2017
Fire 16,082 16,082 (16,082) (13,401)
Marine 4,054 3,130 (3,130) (2,790)
Motor 8,273 8,273 (8,273) (6,367)
Miscellaneous 9,308 9,308 (9,308) (7,613)
37,717 36,793 (36,793) (30,171)
* The impact on equity refl ects the after tax impact.
This analysis assumes that other factors relevant, but not signifi cant, to the valuation of claim liabilities remain constant.
NOTES TO THE FINANCIAL STATEMENTS31 March 2018
186 MNRB HOLDINGS BERHAD (13487-A)
KEYMESSAGES LEADERSHIP
CORPORATE DISCLOSURES
STRATEGICREVIEW
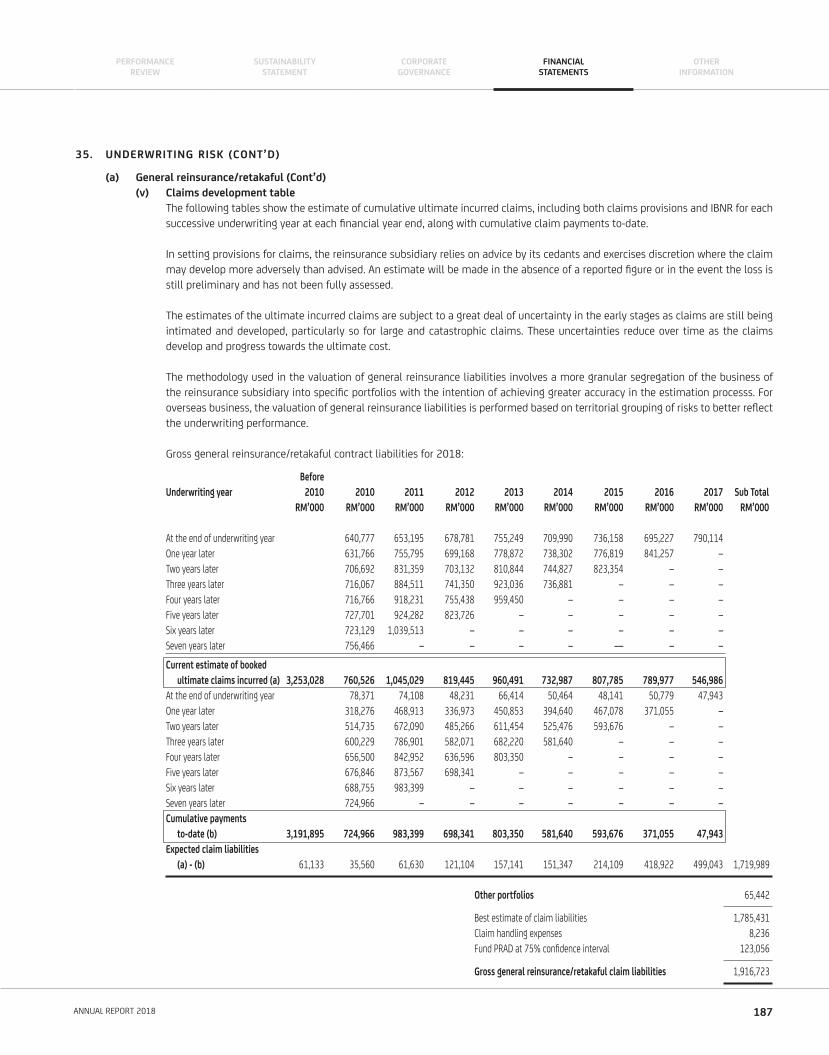
35. UNDERWRITING RISK (CONT’D)
(a) General reinsurance/retakaful (Cont’d)
(v) Claims development table
The following tables show the estimate of cumulative ultimate incurred claims, including both claims provisions and IBNR for each
successive underwriting year at each fi nancial year end, along with cumulative claim payments to-date.
In setting provisions for claims, the reinsurance subsidiary relies on advice by its cedants and exercises discretion where the claim
may develop more adversely than advised. An estimate will be made in the absence of a reported fi gure or in the event the loss is
still preliminary and has not been fully assessed.
The estimates of the ultimate incurred claims are subject to a great deal of uncertainty in the early stages as claims are still being
intimated and developed, particularly so for large and catastrophic claims. These uncertainties reduce over time as the claims
develop and progress towards the ultimate cost.
The methodology used in the valuation of general reinsurance liabilities involves a more granular segregation of the business of
the reinsurance subsidiary into specifi c portfolios with the intention of achieving greater accuracy in the estimation processs. For
overseas business, the valuation of general reinsurance liabilities is performed based on territorial grouping of risks to better refl ect
the underwriting performance.
Gross general reinsurance/retakaful contract liabilities for 2018:
Before
Underwriting year 2010 2010 2011 2012 2013 2014 2015 2016 2017 Sub Total
RM’000 RM’000 RM’000 RM’000 RM’000 RM’000 RM’000 RM’000 RM’000 RM’000
At the end of underwriting year 640,777 653,195 678,781 755,249 709,990 736,158 695,227 790,114
One year later 631,766 755,795 699,168 778,872 738,302 776,819 841,257 –
Two years later 706,692 831,359 703,132 810,844 744,827 823,354 – –
Three years later 716,067 884,511 741,350 923,036 736,881 – – –
Four years later 716,766 918,231 755,438 959,450 – – – –
Five years later 727,701 924,282 823,726 – – – – –
Six years later 723,129 1,039,513 – – – – – –
Seven years later 756,466 – – – – –– – –
Current estimate of booked
ultimate claims incurred (a) 3,253,028 760,526 1,045,029 819,445 960,491 732,987 807,785 789,977 546,986
At the end of underwriting year 78,371 74,108 48,231 66,414 50,464 48,141 50,779 47,943
One year later 318,276 468,913 336,973 450,853 394,640 467,078 371,055 –
Two years later 514,735 672,090 485,266 611,454 525,476 593,676 – –
Three years later 600,229 786,901 582,071 682,220 581,640 – – –
Four years later 656,500 842,952 636,596 803,350 – – – –
Five years later 676,846 873,567 698,341 – – – – –
Six years later 688,755 983,399 – – – – – –
Seven years later 724,966 – – – – – – –
Cumulative payments
to-date (b) 3,191,895 724,966 983,399 698,341 803,350 581,640 593,676 371,055 47,943
Expected claim liabilities
(a) - (b) 61,133 35,560 61,630 121,104 157,141 151,347 214,109 418,922 499,043 1,719,989
Other portfolios 65,442
Best estimate of claim liabilities 1,785,431
Claim handling expenses 8,236
Fund PRAD at 75% confi dence interval 123,056
Gross general reinsurance/retakaful claim liabilities 1,916,723
187ANNUAL REPORT 2018
PERFORMANCEREVIEW
CORPORATEGOVERNANCE
SUSTAINABILITYSTATEMENT
FINANCIALSTATEMENTS
OTHERINFORMATION
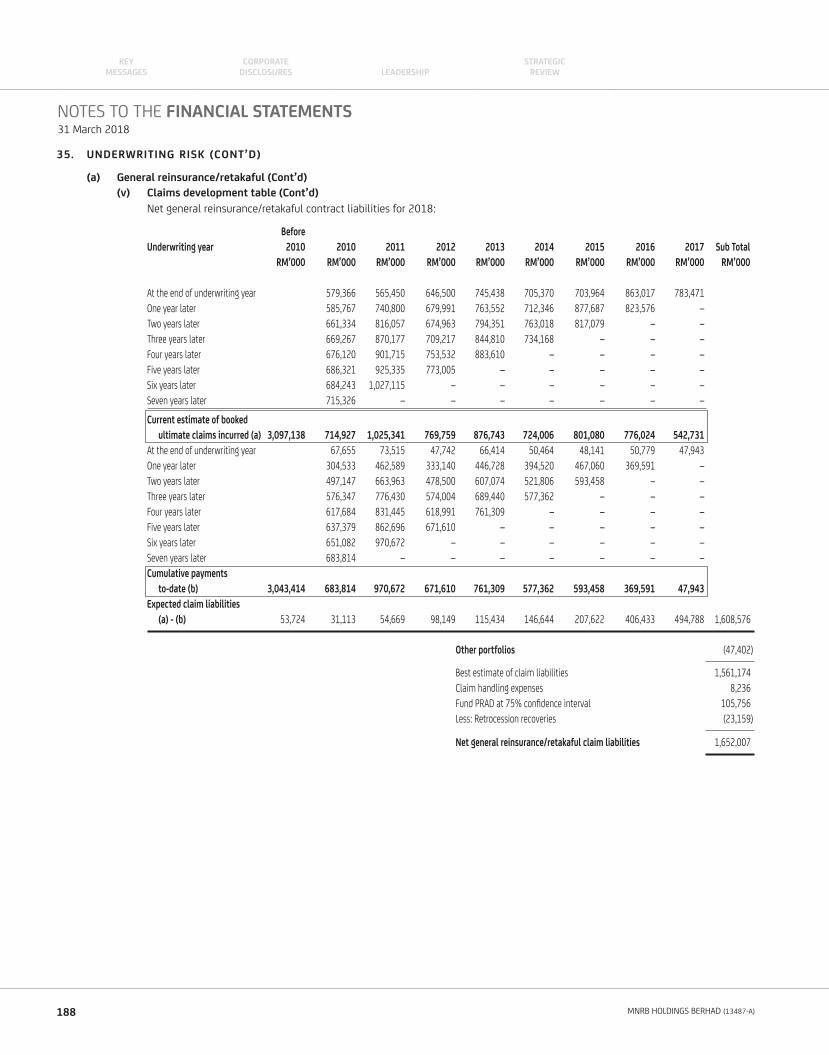
35. UNDERWRITING RISK (CONT’D)
(a) General reinsurance/retakaful (Cont’d)
(v) Claims development table (Cont’d)
Net general reinsurance/retakaful contract liabilities for 2018:
Before
Underwriting year 2010 2010 2011 2012 2013 2014 2015 2016 2017 Sub Total
RM’000 RM’000 RM’000 RM’000 RM’000 RM’000 RM’000 RM’000 RM’000 RM’000
At the end of underwriting year 579,366 565,450 646,500 745,438 705,370 703,964 863,017 783,471
One year later 585,767 740,800 679,991 763,552 712,346 877,687 823,576 –
Two years later 661,334 816,057 674,963 794,351 763,018 817,079 – –
Three years later 669,267 870,177 709,217 844,810 734,168 – – –
Four years later 676,120 901,715 753,532 883,610 – – – –
Five years later 686,321 925,335 773,005 – – – – –
Six years later 684,243 1,027,115 – – – – – –
Seven years later 715,326 – – – – – – –
Current estimate of booked
ultimate claims incurred (a) 3,097,138 714,927 1,025,341 769,759 876,743 724,006 801,080 776,024 542,731
At the end of underwriting year 67,655 73,515 47,742 66,414 50,464 48,141 50,779 47,943
One year later 304,533 462,589 333,140 446,728 394,520 467,060 369,591 –
Two years later 497,147 663,963 478,500 607,074 521,806 593,458 – –
Three years later 576,347 776,430 574,004 689,440 577,362 – – –
Four years later 617,684 831,445 618,991 761,309 – – – –
Five years later 637,379 862,696 671,610 – – – – –
Six years later 651,082 970,672 – – – – – –
Seven years later 683,814 – – – – – – –
Cumulative payments
to-date (b) 3,043,414 683,814 970,672 671,610 761,309 577,362 593,458 369,591 47,943
Expected claim liabilities
(a) - (b) 53,724 31,113 54,669 98,149 115,434 146,644 207,622 406,433 494,788 1,608,576
Other portfolios (47,402)
Best estimate of claim liabilities 1,561,174
Claim handling expenses 8,236
Fund PRAD at 75% confi dence interval 105,756
Less: Retrocession recoveries (23,159)
Net general reinsurance/retakaful claim liabilities 1,652,007
NOTES TO THE FINANCIAL STATEMENTS31 March 2018
188 MNRB HOLDINGS BERHAD (13487-A)
KEYMESSAGES LEADERSHIP
CORPORATE DISCLOSURES
STRATEGICREVIEW
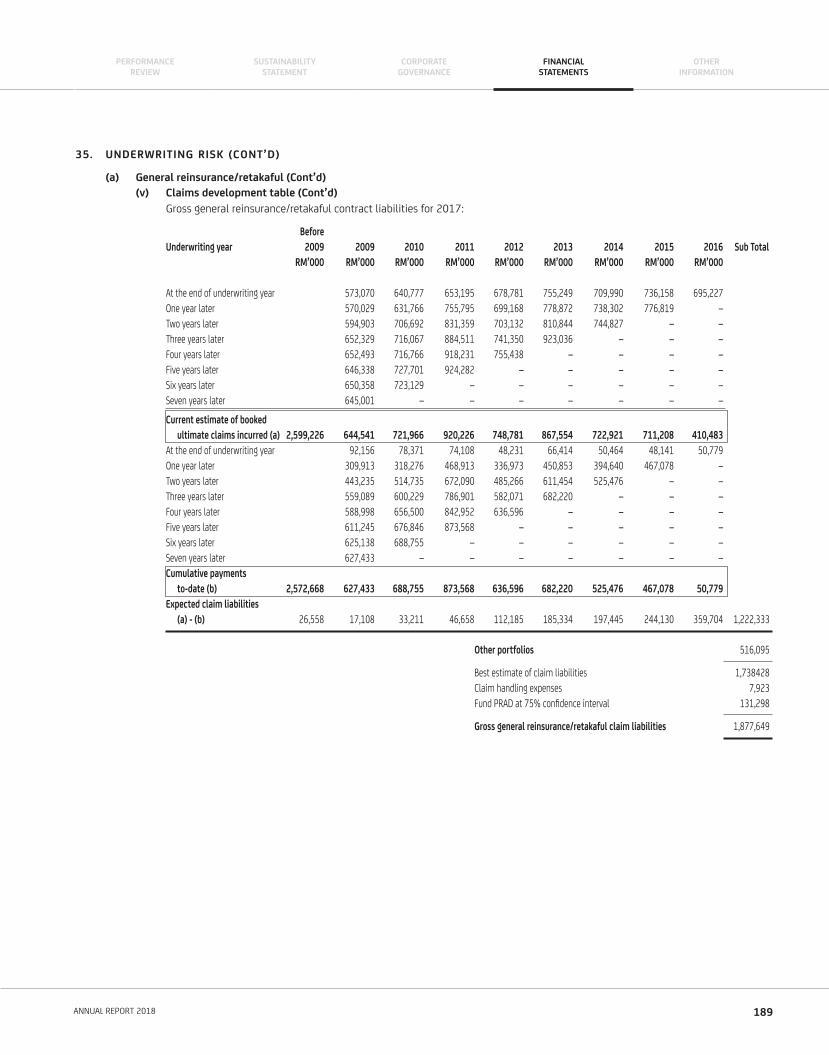
35. UNDERWRITING RISK (CONT’D)
(a) General reinsurance/retakaful (Cont’d)
(v) Claims development table (Cont’d)
Gross general reinsurance/retakaful contract liabilities for 2017:
Before
Underwriting year 2009 2009 2010 2011 2012 2013 2014 2015 2016 Sub Total
RM’000 RM’000 RM’000 RM’000 RM’000 RM’000 RM’000 RM’000 RM’000
At the end of underwriting year 573,070 640,777 653,195 678,781 755,249 709,990 736,158 695,227
One year later 570,029 631,766 755,795 699,168 778,872 738,302 776,819 –
Two years later 594,903 706,692 831,359 703,132 810,844 744,827 – –
Three years later 652,329 716,067 884,511 741,350 923,036 – – –
Four years later 652,493 716,766 918,231 755,438 – – – –
Five years later 646,338 727,701 924,282 – – – – –
Six years later 650,358 723,129 – – – – – –
Seven years later 645,001 – – – – – – –
Current estimate of booked
ultimate claims incurred (a) 2,599,226 644,541 721,966 920,226 748,781 867,554 722,921 711,208 410,483
At the end of underwriting year 92,156 78,371 74,108 48,231 66,414 50,464 48,141 50,779
One year later 309,913 318,276 468,913 336,973 450,853 394,640 467,078 –
Two years later 443,235 514,735 672,090 485,266 611,454 525,476 – –
Three years later 559,089 600,229 786,901 582,071 682,220 – – –
Four years later 588,998 656,500 842,952 636,596 – – – –
Five years later 611,245 676,846 873,568 – – – – –
Six years later 625,138 688,755 – – – – – –
Seven years later 627,433 – – – – – – –
Cumulative payments
to-date (b) 2,572,668 627,433 688,755 873,568 636,596 682,220 525,476 467,078 50,779
Expected claim liabilities
(a) - (b) 26,558 17,108 33,211 46,658 112,185 185,334 197,445 244,130 359,704 1,222,333
Other portfolios 516,095
Best estimate of claim liabilities 1,738428
Claim handling expenses 7,923
Fund PRAD at 75% confi dence interval 131,298
Gross general reinsurance/retakaful claim liabilities 1,877,649
189ANNUAL REPORT 2018
PERFORMANCEREVIEW
CORPORATEGOVERNANCE
SUSTAINABILITYSTATEMENT
FINANCIALSTATEMENTS
OTHERINFORMATION
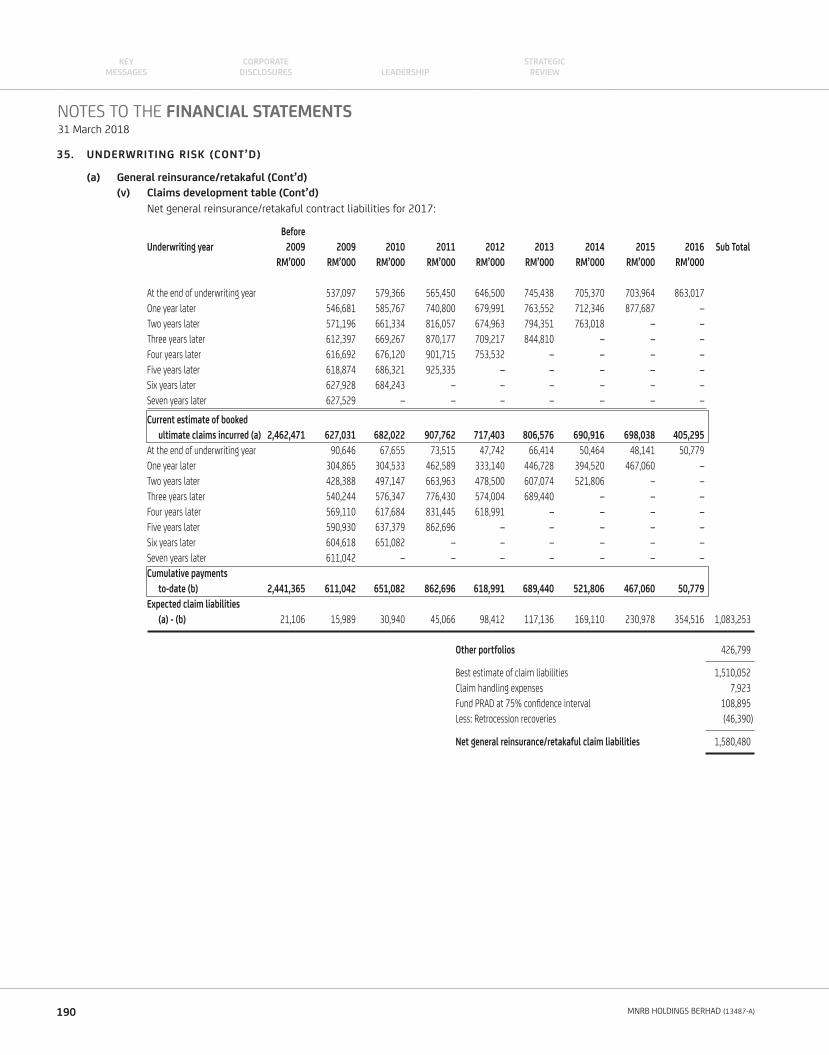
35. UNDERWRITING RISK (CONT’D)
(a) General reinsurance/retakaful (Cont’d)
(v) Claims development table (Cont’d)
Net general reinsurance/retakaful contract liabilities for 2017:
Before
Underwriting year 2009 2009 2010 2011 2012 2013 2014 2015 2016 Sub Total
RM’000 RM’000 RM’000 RM’000 RM’000 RM’000 RM’000 RM’000 RM’000
At the end of underwriting year 537,097 579,366 565,450 646,500 745,438 705,370 703,964 863,017
One year later 546,681 585,767 740,800 679,991 763,552 712,346 877,687 –
Two years later 571,196 661,334 816,057 674,963 794,351 763,018 – –
Three years later 612,397 669,267 870,177 709,217 844,810 – – –
Four years later 616,692 676,120 901,715 753,532 – – – –
Five years later 618,874 686,321 925,335 – – – – –
Six years later 627,928 684,243 – – – – – –
Seven years later 627,529 – – – – – – –
Current estimate of booked
ultimate claims incurred (a) 2,462,471 627,031 682,022 907,762 717,403 806,576 690,916 698,038 405,295
At the end of underwriting year 90,646 67,655 73,515 47,742 66,414 50,464 48,141 50,779
One year later 304,865 304,533 462,589 333,140 446,728 394,520 467,060 –
Two years later 428,388 497,147 663,963 478,500 607,074 521,806 – –
Three years later 540,244 576,347 776,430 574,004 689,440 – – –
Four years later 569,110 617,684 831,445 618,991 – – – –
Five years later 590,930 637,379 862,696 – – – – –
Six years later 604,618 651,082 – – – – – –
Seven years later 611,042 – – – – – – –
Cumulative payments
to-date (b) 2,441,365 611,042 651,082 862,696 618,991 689,440 521,806 467,060 50,779
Expected claim liabilities
(a) - (b) 21,106 15,989 30,940 45,066 98,412 117,136 169,110 230,978 354,516 1,083,253
Other portfolios 426,799
Best estimate of claim liabilities 1,510,052
Claim handling expenses 7,923
Fund PRAD at 75% confi dence interval 108,895
Less: Retrocession recoveries (46,390)
Net general reinsurance/retakaful claim liabilities 1,580,480
NOTES TO THE FINANCIAL STATEMENTS31 March 2018
190 MNRB HOLDINGS BERHAD (13487-A)
KEYMESSAGES LEADERSHIP
CORPORATE DISCLOSURES
STRATEGICREVIEW
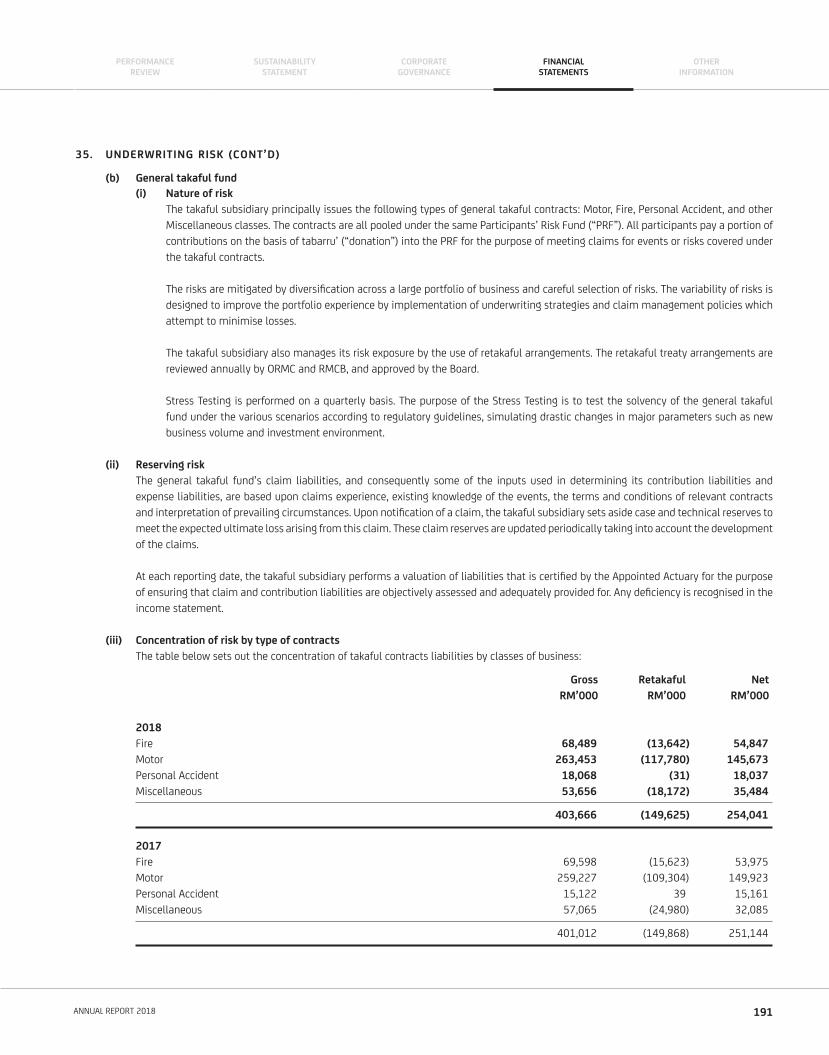
35. UNDERWRITING RISK (CONT’D)
(b) General takaful fund
(i) Nature of risk
The takaful subsidiary principally issues the following types of general takaful contracts: Motor, Fire, Personal Accident, and other
Miscellaneous classes. The contracts are all pooled under the same Participants’ Risk Fund (“PRF”). All participants pay a portion of
contributions on the basis of tabarru’ (“donation”) into the PRF for the purpose of meeting claims for events or risks covered under
the takaful contracts.
The risks are mitigated by diversifi cation across a large portfolio of business and careful selection of risks. The variability of risks is
designed to improve the portfolio experience by implementation of underwriting strategies and claim management policies which
attempt to minimise losses.
The takaful subsidiary also manages its risk exposure by the use of retakaful arrangements. The retakaful treaty arrangements are
reviewed annually by ORMC and RMCB, and approved by the Board.
Stress Testing is performed on a quarterly basis. The purpose of the Stress Testing is to test the solvency of the general takaful
fund under the various scenarios according to regulatory guidelines, simulating drastic changes in major parameters such as new
business volume and investment environment.
(ii) Reserving risk
The general takaful fund’s claim liabilities, and consequently some of the inputs used in determining its contribution liabilities and
expense liabilities, are based upon claims experience, existing knowledge of the events, the terms and conditions of relevant contracts
and interpretation of prevailing circumstances. Upon notifi cation of a claim, the takaful subsidiary sets aside case and technical reserves to
meet the expected ultimate loss arising from this claim. These claim reserves are updated periodically taking into account the development
of the claims.
At each reporting date, the takaful subsidiary performs a valuation of liabilities that is certifi ed by the Appointed Actuary for the purpose
of ensuring that claim and contribution liabilities are objectively assessed and adequately provided for. Any defi ciency is recognised in the
income statement.
(iii) Concentration of risk by type of contracts
The table below sets out the concentration of takaful contracts liabilities by classes of business:
Gross Retakaful Net
RM’000 RM’000 RM’000
2018
Fire 68,489 (13,642) 54,847
Motor 263,453 (117,780) 145,673
Personal Accident 18,068 (31) 18,037
Miscellaneous 53,656 (18,172) 35,484
403,666 (149,625) 254,041
2017
Fire 69,598 (15,623) 53,975
Motor 259,227 (109,304) 149,923
Personal Accident 15,122 39 15,161
Miscellaneous 57,065 (24,980) 32,085
401,012 (149,868) 251,144
191ANNUAL REPORT 2018
PERFORMANCEREVIEW
CORPORATEGOVERNANCE
SUSTAINABILITYSTATEMENT
FINANCIALSTATEMENTS
OTHERINFORMATION
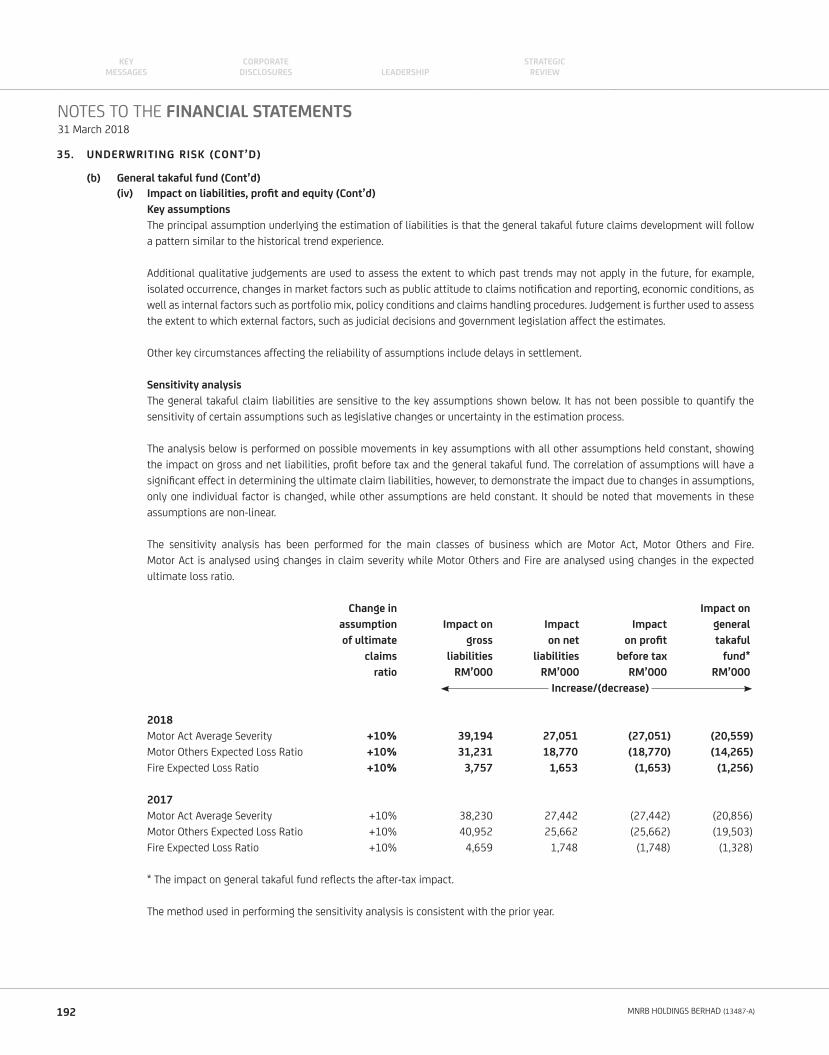
35. UNDERWRITING RISK (CONT’D)
(b) General takaful fund (Cont’d)
(iv) Impact on liabilities, profi t and equity (Cont’d)
Key assumptions
The principal assumption underlying the estimation of liabilities is that the general takaful future claims development will follow
a pattern similar to the historical trend experience.
Additional qualitative judgements are used to assess the extent to which past trends may not apply in the future, for example,
isolated occurrence, changes in market factors such as public attitude to claims notifi cation and reporting, economic conditions, as
well as internal factors such as portfolio mix, policy conditions and claims handling procedures. Judgement is further used to assess
the extent to which external factors, such as judicial decisions and government legislation affect the estimates.
Other key circumstances affecting the reliability of assumptions include delays in settlement.
Sensitivity analysis
The general takaful claim liabilities are sensitive to the key assumptions shown below. It has not been possible to quantify the
sensitivity of certain assumptions such as legislative changes or uncertainty in the estimation process.
The analysis below is performed on possible movements in key assumptions with all other assumptions held constant, showing
the impact on gross and net liabilities, profi t before tax and the general takaful fund. The correlation of assumptions will have a
signifi cant effect in determining the ultimate claim liabilities, however, to demonstrate the impact due to changes in assumptions,
only one individual factor is changed, while other assumptions are held constant. It should be noted that movements in these
assumptions are non-linear.
The sensitivity analysis has been performed for the main classes of business which are Motor Act, Motor Others and Fire.
Motor Act is analysed using changes in claim severity while Motor Others and Fire are analysed using changes in the expected
ultimate loss ratio.
Change in Impact on
assumption Impact on Impact Impact general
of ultimate gross on net on profi t takaful
claims liabilities liabilities before tax fund*
ratio RM’000 RM’000 RM’000 RM’000
Increase/(decrease)
2018
Motor Act Average Severity +10% 39,194 27,051 (27,051) (20,559)
Motor Others Expected Loss Ratio +10% 31,231 18,770 (18,770) (14,265)
Fire Expected Loss Ratio +10% 3,757 1,653 (1,653) (1,256)
2017
Motor Act Average Severity +10% 38,230 27,442 (27,442) (20,856)
Motor Others Expected Loss Ratio +10% 40,952 25,662 (25,662) (19,503)
Fire Expected Loss Ratio +10% 4,659 1,748 (1,748) (1,328)
* The impact on general takaful fund refl ects the after-tax impact.
The method used in performing the sensitivity analysis is consistent with the prior year.
NOTES TO THE FINANCIAL STATEMENTS31 March 2018
192 MNRB HOLDINGS BERHAD (13487-A)
KEYMESSAGES LEADERSHIP
CORPORATE DISCLOSURES
STRATEGICREVIEW
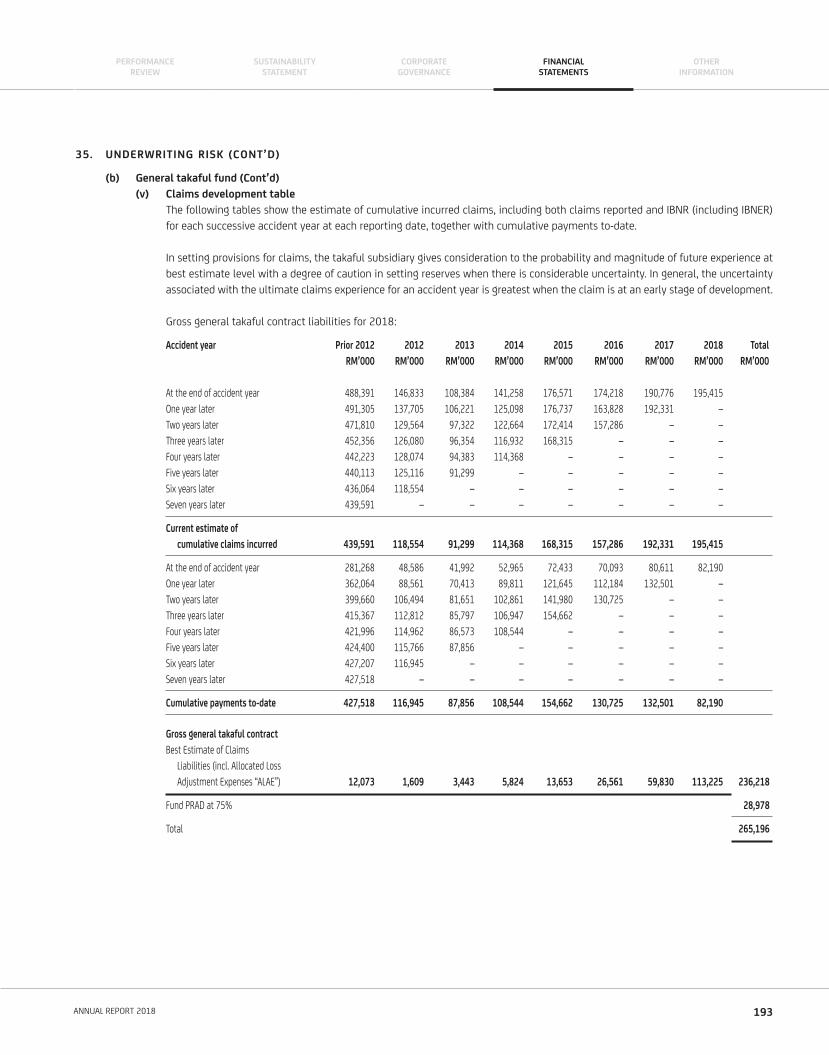
35. UNDERWRITING RISK (CONT’D)
(b) General takaful fund (Cont’d)
(v) Claims development table
The following tables show the estimate of cumulative incurred claims, including both claims reported and IBNR (including IBNER)
for each successive accident year at each reporting date, together with cumulative payments to-date.
In setting provisions for claims, the takaful subsidiary gives consideration to the probability and magnitude of future experience at
best estimate level with a degree of caution in setting reserves when there is considerable uncertainty. In general, the uncertainty
associated with the ultimate claims experience for an accident year is greatest when the claim is at an early stage of development.
Gross general takaful contract liabilities for 2018:
Accident year Prior 2012 2012 2013 2014 2015 2016 2017 2018 Total
RM’000 RM’000 RM’000 RM’000 RM’000 RM’000 RM’000 RM’000 RM’000
At the end of accident year 488,391 146,833 108,384 141,258 176,571 174,218 190,776 195,415
One year later 491,305 137,705 106,221 125,098 176,737 163,828 192,331 –
Two years later 471,810 129,564 97,322 122,664 172,414 157,286 – –
Three years later 452,356 126,080 96,354 116,932 168,315 – – –
Four years later 442,223 128,074 94,383 114,368 – – – –
Five years later 440,113 125,116 91,299 – – – – –
Six years later 436,064 118,554 – – – – – –
Seven years later 439,591 – – – – – – –
Current estimate of
cumulative claims incurred 439,591 118,554 91,299 114,368 168,315 157,286 192,331 195,415
At the end of accident year 281,268 48,586 41,992 52,965 72,433 70,093 80,611 82,190
One year later 362,064 88,561 70,413 89,811 121,645 112,184 132,501 –
Two years later 399,660 106,494 81,651 102,861 141,980 130,725 – –
Three years later 415,367 112,812 85,797 106,947 154,662 – – –
Four years later 421,996 114,962 86,573 108,544 – – – –
Five years later 424,400 115,766 87,856 – – – – –
Six years later 427,207 116,945 – – – – – –
Seven years later 427,518 – – – – – – –
Cumulative payments to-date 427,518 116,945 87,856 108,544 154,662 130,725 132,501 82,190
Gross general takaful contract
Best Estimate of Claims
Liabilities (incl. Allocated Loss
Adjustment Expenses “ALAE”) 12,073 1,609 3,443 5,824 13,653 26,561 59,830 113,225 236,218
Fund PRAD at 75% 28,978
Total 265,196
193ANNUAL REPORT 2018
PERFORMANCEREVIEW
CORPORATEGOVERNANCE
SUSTAINABILITYSTATEMENT
FINANCIALSTATEMENTS
OTHERINFORMATION
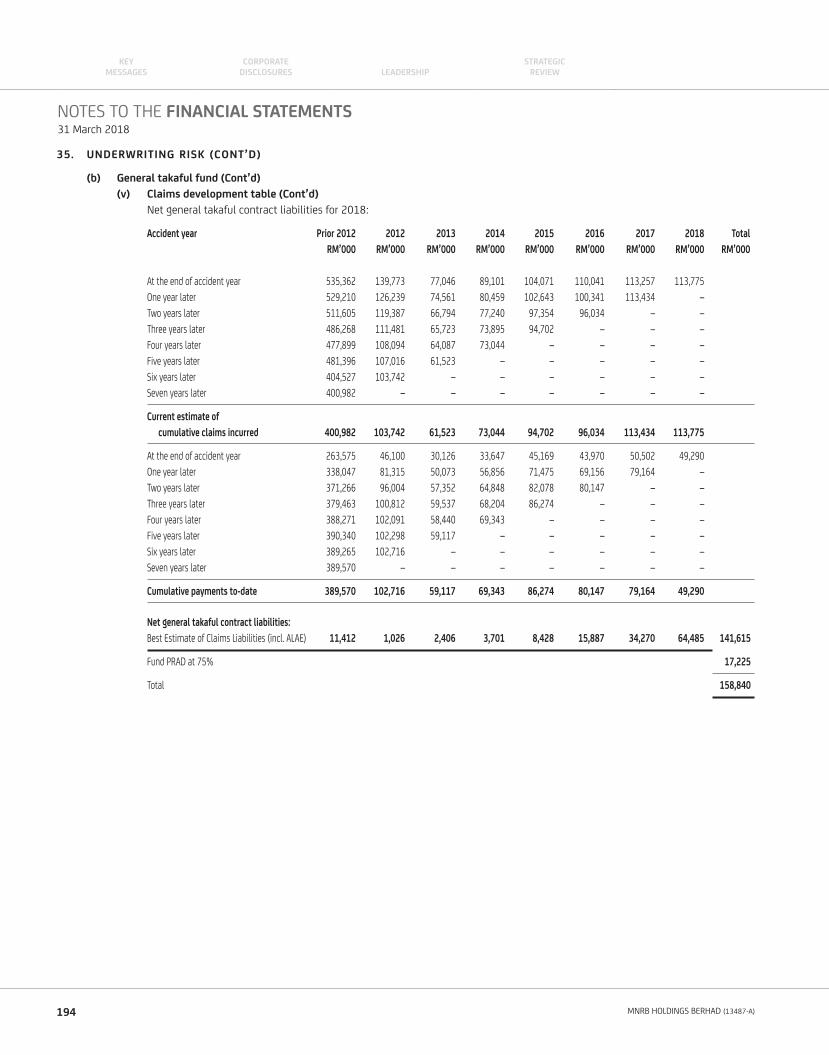
35. UNDERWRITING RISK (CONT’D)
(b) General takaful fund (Cont’d)
(v) Claims development table (Cont’d)
Net general takaful contract liabilities for 2018:
Accident year Prior 2012 2012 2013 2014 2015 2016 2017 2018 Total
RM’000 RM’000 RM’000 RM’000 RM’000 RM’000 RM’000 RM’000 RM’000
At the end of accident year 535,362 139,773 77,046 89,101 104,071 110,041 113,257 113,775
One year later 529,210 126,239 74,561 80,459 102,643 100,341 113,434 –
Two years later 511,605 119,387 66,794 77,240 97,354 96,034 – –
Three years later 486,268 111,481 65,723 73,895 94,702 – – –
Four years later 477,899 108,094 64,087 73,044 – – – –
Five years later 481,396 107,016 61,523 – – – – –
Six years later 404,527 103,742 – – – – – –
Seven years later 400,982 – – – – – – –
Current estimate of
cumulative claims incurred 400,982 103,742 61,523 73,044 94,702 96,034 113,434 113,775
At the end of accident year 263,575 46,100 30,126 33,647 45,169 43,970 50,502 49,290
One year later 338,047 81,315 50,073 56,856 71,475 69,156 79,164 –
Two years later 371,266 96,004 57,352 64,848 82,078 80,147 – –
Three years later 379,463 100,812 59,537 68,204 86,274 – – –
Four years later 388,271 102,091 58,440 69,343 – – – –
Five years later 390,340 102,298 59,117 – – – – –
Six years later 389,265 102,716 – – – – – –
Seven years later 389,570 – – – – – – –
Cumulative payments to-date 389,570 102,716 59,117 69,343 86,274 80,147 79,164 49,290
Net general takaful contract liabilities:
Best Estimate of Claims Liabilities (incl. ALAE) 11,412 1,026 2,406 3,701 8,428 15,887 34,270 64,485 141,615
Fund PRAD at 75% 17,225
Total 158,840
NOTES TO THE FINANCIAL STATEMENTS31 March 2018
194 MNRB HOLDINGS BERHAD (13487-A)
KEYMESSAGES LEADERSHIP
CORPORATE DISCLOSURES
STRATEGICREVIEW
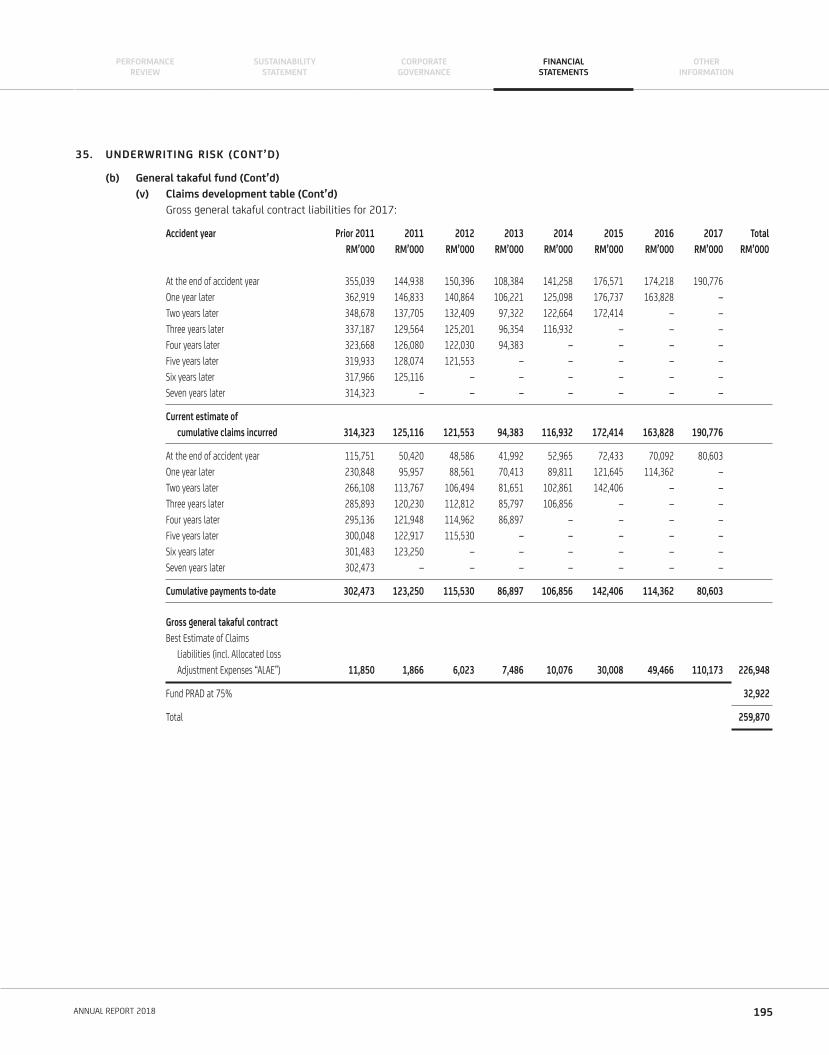
35. UNDERWRITING RISK (CONT’D)
(b) General takaful fund (Cont’d)
(v) Claims development table (Cont’d)
Gross general takaful contract liabilities for 2017:
Accident year Prior 2011 2011 2012 2013 2014 2015 2016 2017 Total
RM’000 RM’000 RM’000 RM’000 RM’000 RM’000 RM’000 RM’000 RM’000
At the end of accident year 355,039 144,938 150,396 108,384 141,258 176,571 174,218 190,776
One year later 362,919 146,833 140,864 106,221 125,098 176,737 163,828 –
Two years later 348,678 137,705 132,409 97,322 122,664 172,414 – –
Three years later 337,187 129,564 125,201 96,354 116,932 – – –
Four years later 323,668 126,080 122,030 94,383 – – – –
Five years later 319,933 128,074 121,553 – – – – –
Six years later 317,966 125,116 – – – – – –
Seven years later 314,323 – – – – – – –
Current estimate of
cumulative claims incurred 314,323 125,116 121,553 94,383 116,932 172,414 163,828 190,776
At the end of accident year 115,751 50,420 48,586 41,992 52,965 72,433 70,092 80,603
One year later 230,848 95,957 88,561 70,413 89,811 121,645 114,362 –
Two years later 266,108 113,767 106,494 81,651 102,861 142,406 – –
Three years later 285,893 120,230 112,812 85,797 106,856 – – –
Four years later 295,136 121,948 114,962 86,897 – – – –
Five years later 300,048 122,917 115,530 – – – – –
Six years later 301,483 123,250 – – – – – –
Seven years later 302,473 – – – – – – –
Cumulative payments to-date 302,473 123,250 115,530 86,897 106,856 142,406 114,362 80,603
Gross general takaful contract
Best Estimate of Claims
Liabilities (incl. Allocated Loss
Adjustment Expenses “ALAE”) 11,850 1,866 6,023 7,486 10,076 30,008 49,466 110,173 226,948
Fund PRAD at 75% 32,922
Total 259,870
195ANNUAL REPORT 2018
PERFORMANCEREVIEW
CORPORATEGOVERNANCE
SUSTAINABILITYSTATEMENT
FINANCIALSTATEMENTS
OTHERINFORMATION
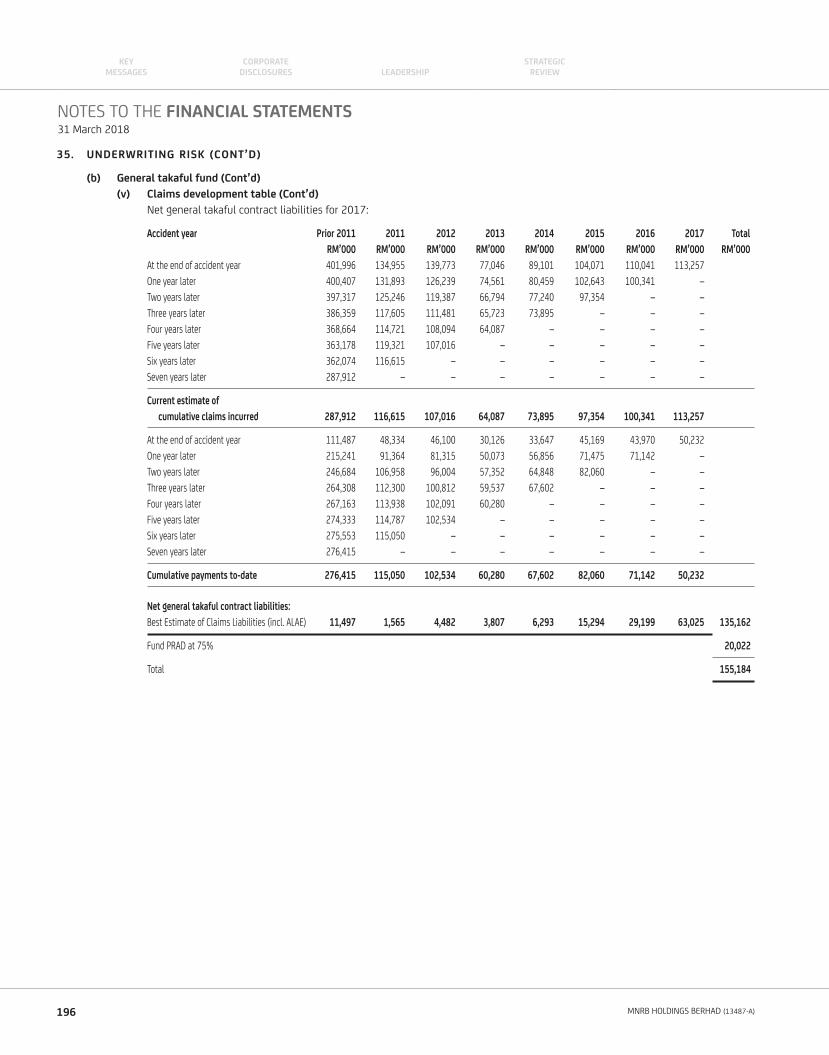
35. UNDERWRITING RISK (CONT’D)
(b) General takaful fund (Cont’d)
(v) Claims development table (Cont’d)
Net general takaful contract liabilities for 2017:
Accident year Prior 2011 2011 2012 2013 2014 2015 2016 2017 Total
RM’000 RM’000 RM’000 RM’000 RM’000 RM’000 RM’000 RM’000 RM’000
At the end of accident year 401,996 134,955 139,773 77,046 89,101 104,071 110,041 113,257
One year later 400,407 131,893 126,239 74,561 80,459 102,643 100,341 –
Two years later 397,317 125,246 119,387 66,794 77,240 97,354 – –
Three years later 386,359 117,605 111,481 65,723 73,895 – – –
Four years later 368,664 114,721 108,094 64,087 – – – –
Five years later 363,178 119,321 107,016 – – – – –
Six years later 362,074 116,615 – – – – – –
Seven years later 287,912 – – – – – – –
Current estimate of
cumulative claims incurred 287,912 116,615 107,016 64,087 73,895 97,354 100,341 113,257
At the end of accident year 111,487 48,334 46,100 30,126 33,647 45,169 43,970 50,232
One year later 215,241 91,364 81,315 50,073 56,856 71,475 71,142 –
Two years later 246,684 106,958 96,004 57,352 64,848 82,060 – –
Three years later 264,308 112,300 100,812 59,537 67,602 – – –
Four years later 267,163 113,938 102,091 60,280 – – – –
Five years later 274,333 114,787 102,534 – – – – –
Six years later 275,553 115,050 – – – – – –
Seven years later 276,415 – – – – – – –
Cumulative payments to-date 276,415 115,050 102,534 60,280 67,602 82,060 71,142 50,232
Net general takaful contract liabilities:
Best Estimate of Claims Liabilities (incl. ALAE) 11,497 1,565 4,482 3,807 6,293 15,294 29,199 63,025 135,162
Fund PRAD at 75% 20,022
Total 155,184
NOTES TO THE FINANCIAL STATEMENTS31 March 2018
196 MNRB HOLDINGS BERHAD (13487-A)
KEYMESSAGES LEADERSHIP
CORPORATE DISCLOSURES
STRATEGICREVIEW
35. UNDERWRITING RISK (CONT’D)
(c) Family takaful fund
(i) Nature of risk
The takaful subsidiary principally issues the following types of family takaful certifi cates: Ordinary Takaful Plans, Mortgage Takaful
Plans, Group Takaful Plans and Investment-linked Takaful Plans. The certifi cates are segregated into 2 separate funds: Participants’
Risk Fund (“PRF”) and Participants’ Investment Fund (“PIF”).
The PRF is compulsory for all certifi cates and refers to the fund used to pool the portion of contributions paid by participants on
the basis of tabarru’ (donation) for the purpose of meeting claims on events/risks covered under the takaful certifi cates. Under the
tabarru’ contract, the fund is collectively owned by the pool of participants. In managing the PRF, the takaful subsidiary adopts an
appropriate set of policies and procedures to ensure the availability of funds to meet takaful benefi ts when due.
The PIF refers to the fund in which a portion of the contributions paid by takaful participants for a takaful certifi cate is allocated for
the purpose of savings and/or investment. The PIF is individually owned by participants. In managing the PIF, the takaful subsidiary
adopts appropriate investment and management strategies to achieve returns that are in line with the participants’ reasonable
expectations and where relevant, to ensure the availability of funds for future tabarru’ apportionment into the PRF. The investment
risk exposure for the PIF is borne by the participants. For investment-linked takaful, the PIF refers to the unit fund(s).
Family takaful underwriting risk exists from the anti-selection process and inadequacy of PRF to meet future claims arising from
family takaful certifi cates. The risks arise when actual claims experience is different from the assumptions used in setting the prices
for products and establishing the technical provisions and liabilities for claims. Other sources of risks include certifi cate lapses and
certifi cate claims such as mortality and morbidity experience.
The takaful subsidiary utilises retakaful arrangements to manage the mortality and morbidity risks. Retakaful structures are set
based on the risk appetite of the takaful subsidiary. The retakaful treaty arrangements are reviewed by the ORMC and RMCB, and
approved by the Board.
The takaful subsidiary reviews the actual experience of mortality, morbidity, lapses and surrenders, as well as expenses to ensure
that appropriate policies, guidelines and limits are put in place to manage these risks.
The PIF is supported by the investment profi t from the fund and the distribution surplus from PRF, if any. In the event of volatile
investment climate and/or unusual claims experience, the investment profi t and surplus distribution to the participants may reduce.
Stress Testing is performed on a quarterly basis. The purpose of the Stress Testing is to test the solvency of the family takaful
fund under the various scenarios according to regulatory guidelines, simulating drastic changes in major parameters such as new
business volume, investment environment, mortality/morbidity patterns.
197ANNUAL REPORT 2018
PERFORMANCEREVIEW
CORPORATEGOVERNANCE
SUSTAINABILITYSTATEMENT
FINANCIALSTATEMENTS
OTHERINFORMATION
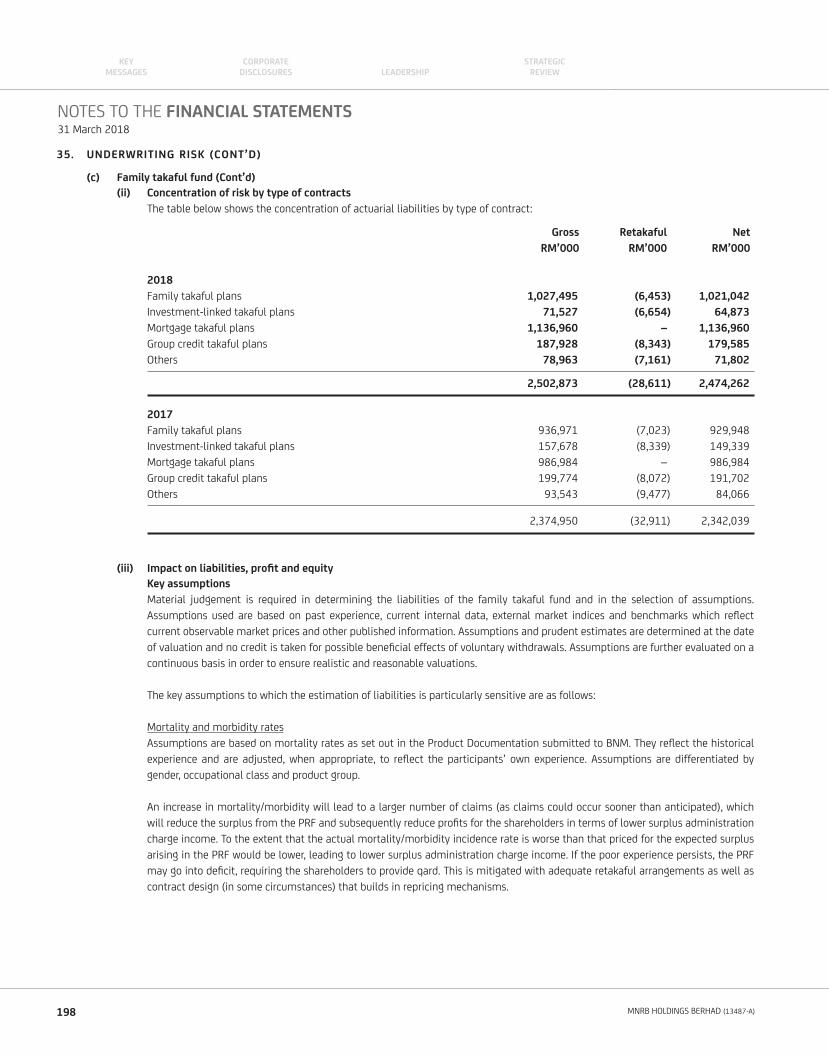
35. UNDERWRITING RISK (CONT’D)
(c) Family takaful fund (Cont’d)
(ii) Concentration of risk by type of contracts
The table below shows the concentration of actuarial liabilities by type of contract:
Gross Retakaful Net
RM’000 RM’000 RM’000
2018
Family takaful plans 1,027,495 (6,453) 1,021,042
Investment-linked takaful plans 71,527 (6,654) 64,873
Mortgage takaful plans 1,136,960 – 1,136,960
Group credit takaful plans 187,928 (8,343) 179,585
Others 78,963 (7,161) 71,802
2,502,873 (28,611) 2,474,262
2017
Family takaful plans 936,971 (7,023) 929,948
Investment-linked takaful plans 157,678 (8,339) 149,339
Mortgage takaful plans 986,984 – 986,984
Group credit takaful plans 199,774 (8,072) 191,702
Others 93,543 (9,477) 84,066
2,374,950 (32,911) 2,342,039
(iii) Impact on liabilities, profi t and equity
Key assumptions
Material judgement is required in determining the liabilities of the family takaful fund and in the selection of assumptions.
Assumptions used are based on past experience, current internal data, external market indices and benchmarks which refl ect
current observable market prices and other published information. Assumptions and prudent estimates are determined at the date
of valuation and no credit is taken for possible benefi cial effects of voluntary withdrawals. Assumptions are further evaluated on a
continuous basis in order to ensure realistic and reasonable valuations.
The key assumptions to which the estimation of liabilities is particularly sensitive are as follows:
Mortality and morbidity rates
Assumptions are based on mortality rates as set out in the Product Documentation submitted to BNM. They refl ect the historical
experience and are adjusted, when appropriate, to refl ect the participants’ own experience. Assumptions are differentiated by
gender, occupational class and product group.
An increase in mortality/morbidity will lead to a larger number of claims (as claims could occur sooner than anticipated), which
will reduce the surplus from the PRF and subsequently reduce profi ts for the shareholders in terms of lower surplus administration
charge income. To the extent that the actual mortality/morbidity incidence rate is worse than that priced for the expected surplus
arising in the PRF would be lower, leading to lower surplus administration charge income. If the poor experience persists, the PRF
may go into defi cit, requiring the shareholders to provide qard. This is mitigated with adequate retakaful arrangements as well as
contract design (in some circumstances) that builds in repricing mechanisms.
NOTES TO THE FINANCIAL STATEMENTS31 March 2018
198 MNRB HOLDINGS BERHAD (13487-A)
KEYMESSAGES LEADERSHIP
CORPORATE DISCLOSURES
STRATEGICREVIEW
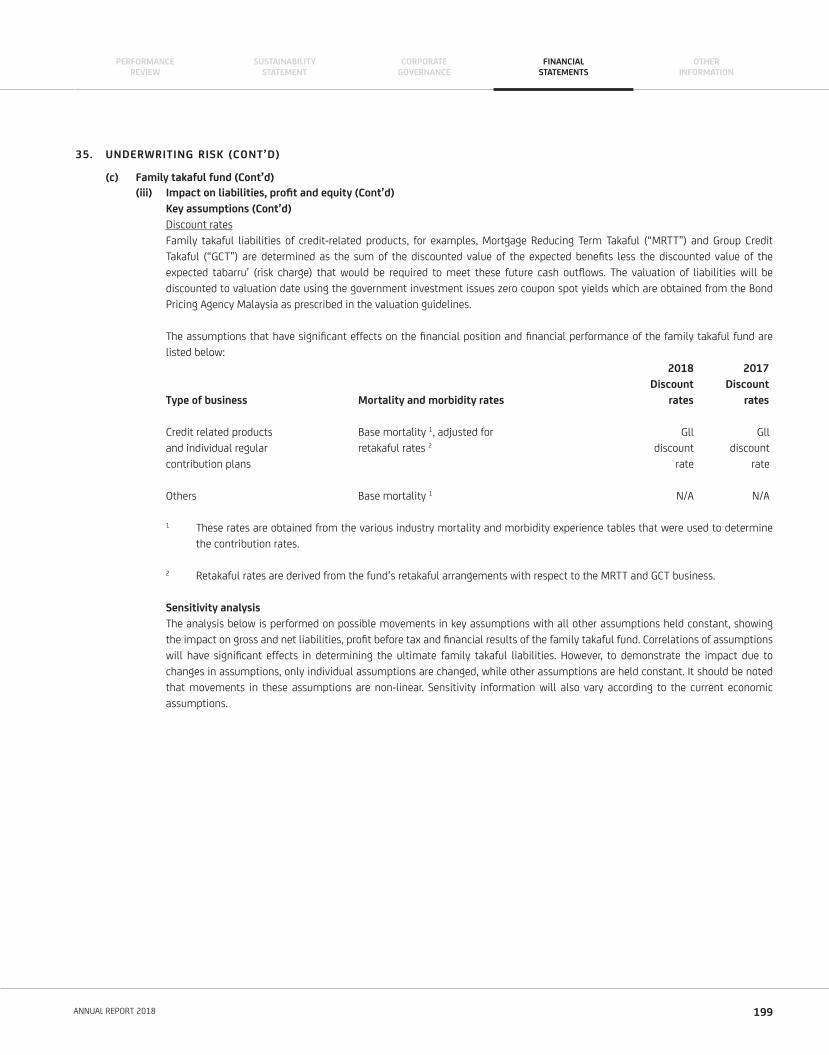
35. UNDERWRITING RISK (CONT’D)
(c) Family takaful fund (Cont’d)
(iii) Impact on liabilities, profi t and equity (Cont’d)
Key assumptions (Cont’d)
Discount rates
Family takaful liabilities of credit-related products, for examples, Mortgage Reducing Term Takaful (“MRTT”) and Group Credit
Takaful (“GCT”) are determined as the sum of the discounted value of the expected benefi ts less the discounted value of the
expected tabarru’ (risk charge) that would be required to meet these future cash outfl ows. The valuation of liabilities will be
discounted to valuation date using the government investment issues zero coupon spot yields which are obtained from the Bond
Pricing Agency Malaysia as prescribed in the valuation guidelines.
The assumptions that have signifi cant effects on the fi nancial position and fi nancial performance of the family takaful fund are
listed below:
2018 2017
Discount Discount
Type of business Mortality and morbidity rates rates rates
Credit related products Base mortality 1, adjusted for Gll Gll
and individual regular retakaful rates 2 discount discount
contribution plans rate rate
Others Base mortality 1 N/A N/A
1 These rates are obtained from the various industry mortality and morbidity experience tables that were used to determine
the contribution rates.
2 Retakaful rates are derived from the fund’s retakaful arrangements with respect to the MRTT and GCT business.
Sensitivity analysis
The analysis below is performed on possible movements in key assumptions with all other assumptions held constant, showing
the impact on gross and net liabilities, profi t before tax and fi nancial results of the family takaful fund. Correlations of assumptions
will have signifi cant effects in determining the ultimate family takaful liabilities. However, to demonstrate the impact due to
changes in assumptions, only individual assumptions are changed, while other assumptions are held constant. It should be noted
that movements in these assumptions are non-linear. Sensitivity information will also vary according to the current economic
assumptions.
199ANNUAL REPORT 2018
PERFORMANCEREVIEW
CORPORATEGOVERNANCE
SUSTAINABILITYSTATEMENT
FINANCIALSTATEMENTS
OTHERINFORMATION
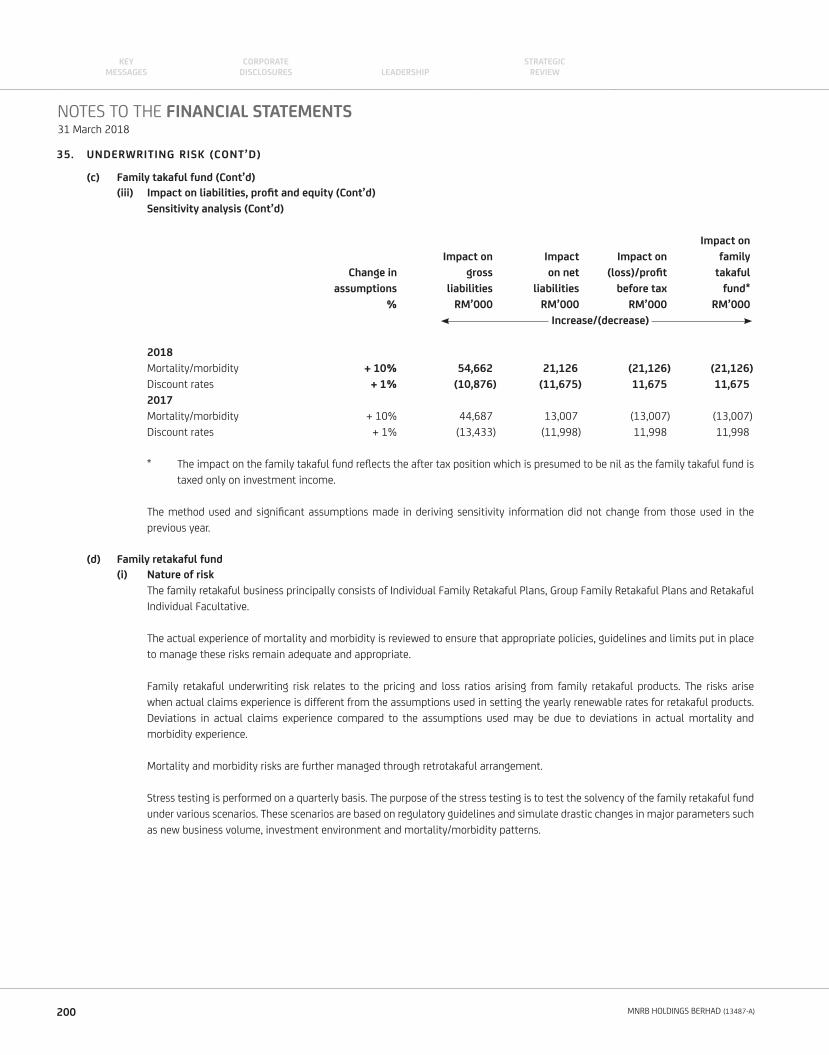
35. UNDERWRITING RISK (CONT’D)
(c) Family takaful fund (Cont’d)
(iii) Impact on liabilities, profi t and equity (Cont’d)
Sensitivity analysis (Cont’d)
Impact on
Impact on Impact Impact on family
Change in gross on net (loss)/profi t takaful
assumptions liabilities liabilities before tax fund*
% RM’000 RM’000 RM’000 RM’000
Increase/(decrease)
2018
Mortality/morbidity + 10% 54,662 21,126 (21,126) (21,126)
Discount rates + 1% (10,876) (11,675) 11,675 11,675
2017
Mortality/morbidity + 10% 44,687 13,007 (13,007) (13,007)
Discount rates + 1% (13,433) (11,998) 11,998 11,998
* The impact on the family takaful fund refl ects the after tax position which is presumed to be nil as the family takaful fund is
taxed only on investment income.
The method used and signifi cant assumptions made in deriving sensitivity information did not change from those used in the
previous year.
(d) Family retakaful fund
(i) Nature of risk
The family retakaful business principally consists of Individual Family Retakaful Plans, Group Family Retakaful Plans and Retakaful
Individual Facultative.
The actual experience of mortality and morbidity is reviewed to ensure that appropriate policies, guidelines and limits put in place
to manage these risks remain adequate and appropriate.
Family retakaful underwriting risk relates to the pricing and loss ratios arising from family retakaful products. The risks arise
when actual claims experience is different from the assumptions used in setting the yearly renewable rates for retakaful products.
Deviations in actual claims experience compared to the assumptions used may be due to deviations in actual mortality and
morbidity experience.
Mortality and morbidity risks are further managed through retrotakaful arrangement.
Stress testing is performed on a quarterly basis. The purpose of the stress testing is to test the solvency of the family retakaful fund
under various scenarios. These scenarios are based on regulatory guidelines and simulate drastic changes in major parameters such
as new business volume, investment environment and mortality/morbidity patterns.
NOTES TO THE FINANCIAL STATEMENTS31 March 2018
200 MNRB HOLDINGS BERHAD (13487-A)
KEYMESSAGES LEADERSHIP
CORPORATE DISCLOSURES
STRATEGICREVIEW
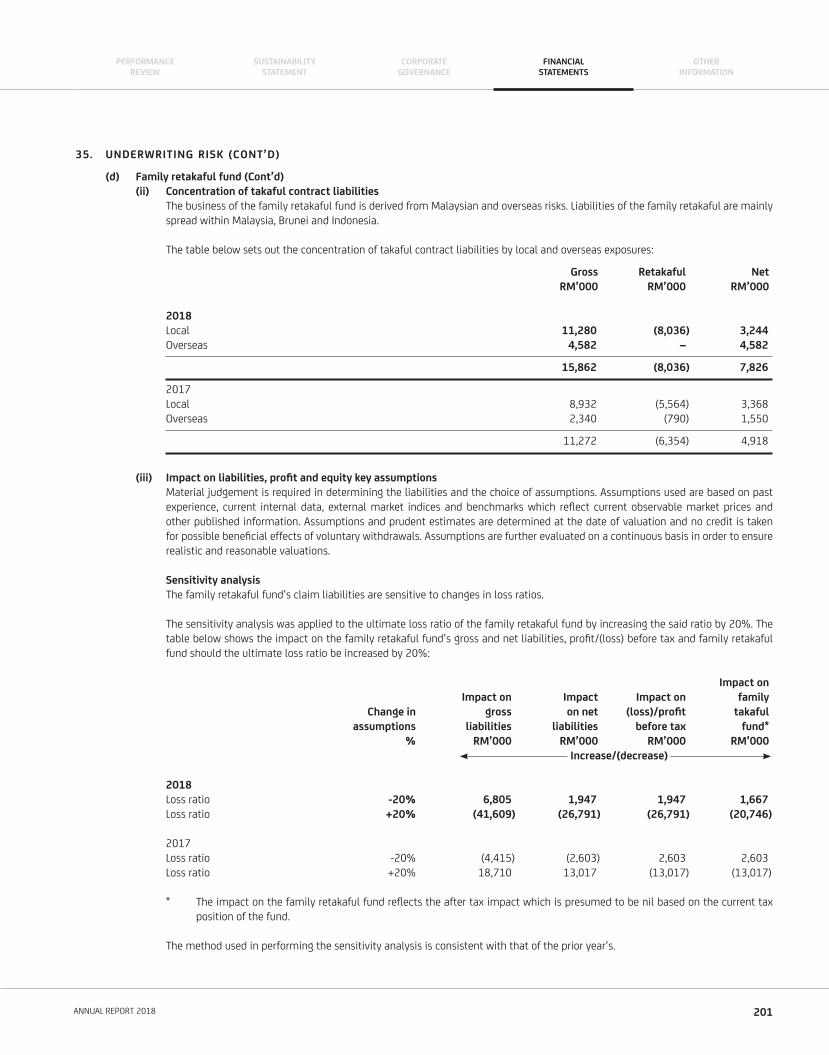
35. UNDERWRITING RISK (CONT’D)
(d) Family retakaful fund (Cont’d)
(ii) Concentration of takaful contract liabilities
The business of the family retakaful fund is derived from Malaysian and overseas risks. Liabilities of the family retakaful are mainly
spread within Malaysia, Brunei and Indonesia.
The table below sets out the concentration of takaful contract liabilities by local and overseas exposures:
Gross Retakaful Net
RM’000 RM’000 RM’000
2018
Local 11,280 (8,036) 3,244
Overseas 4,582 – 4,582
15,862 (8,036) 7,826
2017
Local 8,932 (5,564) 3,368
Overseas 2,340 (790) 1,550
11,272 (6,354) 4,918
(iii) Impact on liabilities, profi t and equity key assumptions
Material judgement is required in determining the liabilities and the choice of assumptions. Assumptions used are based on past
experience, current internal data, external market indices and benchmarks which refl ect current observable market prices and
other published information. Assumptions and prudent estimates are determined at the date of valuation and no credit is taken
for possible benefi cial effects of voluntary withdrawals. Assumptions are further evaluated on a continuous basis in order to ensure
realistic and reasonable valuations.
Sensitivity analysis
The family retakaful fund’s claim liabilities are sensitive to changes in loss ratios.
The sensitivity analysis was applied to the ultimate loss ratio of the family retakaful fund by increasing the said ratio by 20%. The
table below shows the impact on the family retakaful fund’s gross and net liabilities, profi t/(loss) before tax and family retakaful
fund should the ultimate loss ratio be increased by 20%:
Impact on
Impact on Impact Impact on family
Change in gross on net (loss)/profi t takaful
assumptions liabilities liabilities before tax fund*
% RM’000 RM’000 RM’000 RM’000
Increase/(decrease)
2018
Loss ratio -20% 6,805 1,947 1,947 1,667
Loss ratio +20% (41,609) (26,791) (26,791) (20,746)
2017
Loss ratio -20% (4,415) (2,603) 2,603 2,603
Loss ratio +20% 18,710 13,017 (13,017) (13,017)
* The impact on the family retakaful fund refl ects the after tax impact which is presumed to be nil based on the current tax
position of the fund.
The method used in performing the sensitivity analysis is consistent with that of the prior year’s.
201ANNUAL REPORT 2018
PERFORMANCEREVIEW
CORPORATEGOVERNANCE
SUSTAINABILITYSTATEMENT
FINANCIALSTATEMENTS
OTHERINFORMATION
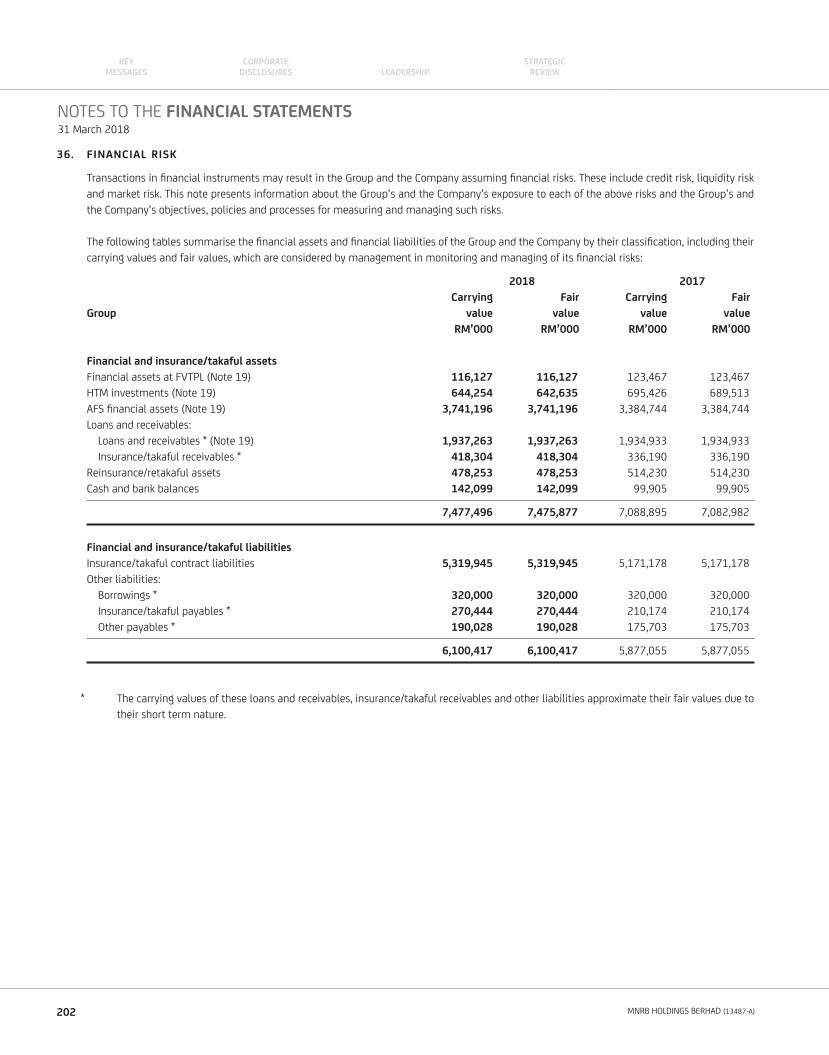
36. FINANCIAL RISK
Transactions in fi nancial instruments may result in the Group and the Company assuming fi nancial risks. These include credit risk, liquidity risk
and market risk. This note presents information about the Group’s and the Company’s exposure to each of the above risks and the Group’s and
the Company’s objectives, policies and processes for measuring and managing such risks.
The following tables summarise the fi nancial assets and fi nancial liabilities of the Group and the Company by their classifi cation, including their
carrying values and fair values, which are considered by management in monitoring and managing of its fi nancial risks:
2018 2017
Carrying Fair Carrying Fair
Group value value value value
RM’000 RM’000 RM’000 RM’000
Financial and insurance/takaful assets
Financial assets at FVTPL (Note 19) 116,127 116,127 123,467 123,467
HTM investments (Note 19) 644,254 642,635 695,426 689,513
AFS fi nancial assets (Note 19) 3,741,196 3,741,196 3,384,744 3,384,744
Loans and receivables:
Loans and receivables * (Note 19) 1,937,263 1,937,263 1,934,933 1,934,933
Insurance/takaful receivables * 418,304 418,304 336,190 336,190
Reinsurance/retakaful assets 478,253 478,253 514,230 514,230
Cash and bank balances 142,099 142,099 99,905 99,905
7,477,496 7,475,877 7,088,895 7,082,982
Financial and insurance/takaful liabilities
Insurance/takaful contract liabilities 5,319,945 5,319,945 5,171,178 5,171,178
Other liabilities:
Borrowings * 320,000 320,000 320,000 320,000
Insurance/takaful payables * 270,444 270,444 210,174 210,174
Other payables * 190,028 190,028 175,703 175,703
6,100,417 6,100,417 5,877,055 5,877,055
* The carrying values of these loans and receivables, insurance/takaful receivables and other liabilities approximate their fair values due to
their short term nature.
NOTES TO THE FINANCIAL STATEMENTS31 March 2018
202 MNRB HOLDINGS BERHAD (13487-A)
KEYMESSAGES LEADERSHIP
CORPORATE DISCLOSURES
STRATEGICREVIEW
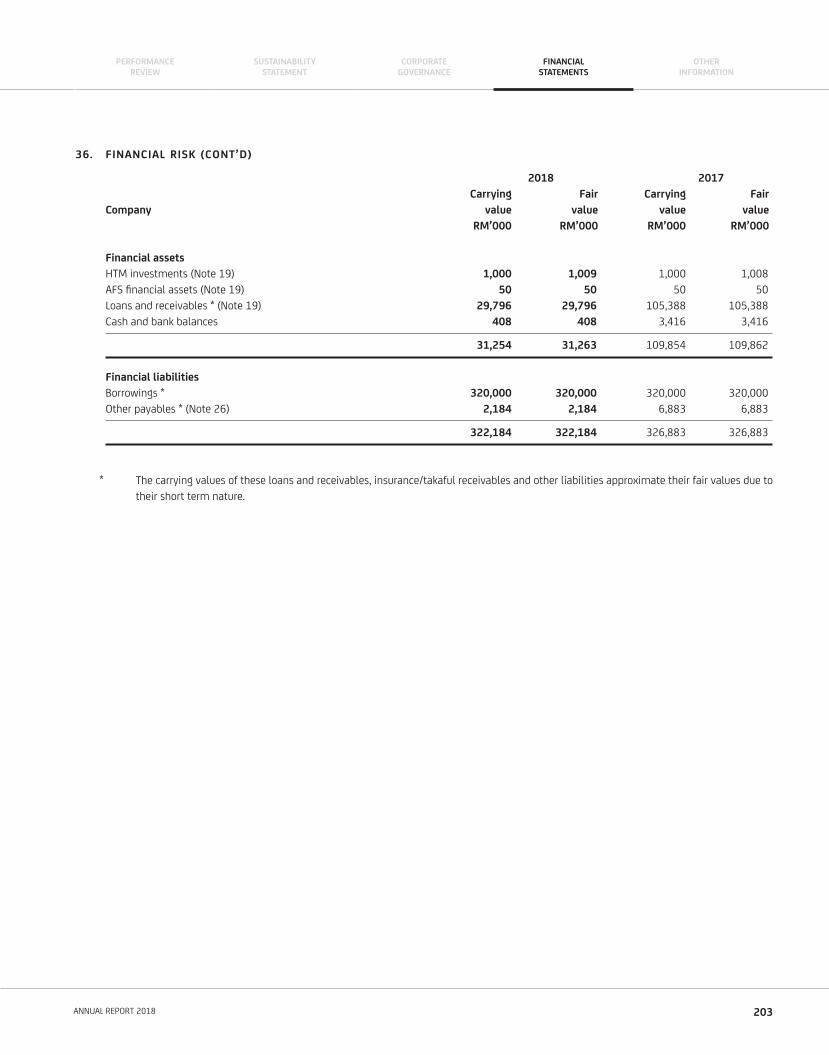
36. FINANCIAL RISK (CONT’D)
2018 2017
Carrying Fair Carrying Fair
Company value value value value
RM’000 RM’000 RM’000 RM’000
Financial assets
HTM investments (Note 19) 1,000 1,009 1,000 1,008
AFS fi nancial assets (Note 19) 50 50 50 50
Loans and receivables * (Note 19) 29,796 29,796 105,388 105,388
Cash and bank balances 408 408 3,416 3,416
31,254 31,263 109,854 109,862
Financial liabilities
Borrowings * 320,000 320,000 320,000 320,000
Other payables * (Note 26) 2,184 2,184 6,883 6,883
322,184 322,184 326,883 326,883
* The carrying values of these loans and receivables, insurance/takaful receivables and other liabilities approximate their fair values due to
their short term nature.
203ANNUAL REPORT 2018
PERFORMANCEREVIEW
CORPORATEGOVERNANCE
SUSTAINABILITYSTATEMENT
FINANCIALSTATEMENTS
OTHERINFORMATION
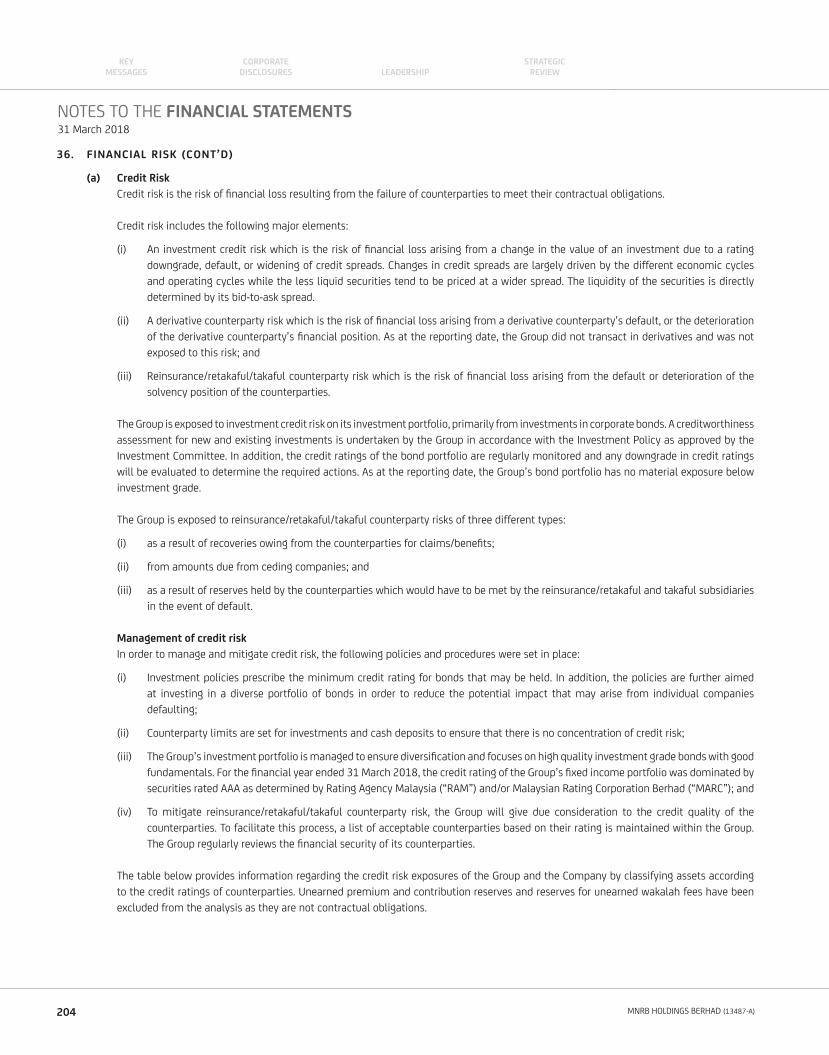
36. FINANCIAL RISK (CONT’D)
(a) Credit Risk
Credit risk is the risk of fi nancial loss resulting from the failure of counterparties to meet their contractual obligations.
Credit risk includes the following major elements:
(i) An investment credit risk which is the risk of fi nancial loss arising from a change in the value of an investment due to a rating
downgrade, default, or widening of credit spreads. Changes in credit spreads are largely driven by the different economic cycles
and operating cycles while the less liquid securities tend to be priced at a wider spread. The liquidity of the securities is directly
determined by its bid-to-ask spread.
(ii) A derivative counterparty risk which is the risk of fi nancial loss arising from a derivative counterparty’s default, or the deterioration
of the derivative counterparty’s fi nancial position. As at the reporting date, the Group did not transact in derivatives and was not
exposed to this risk; and
(iii) Reinsurance/retakaful/takaful counterparty risk which is the risk of fi nancial loss arising from the default or deterioration of the
solvency position of the counterparties.
The Group is exposed to investment credit risk on its investment portfolio, primarily from investments in corporate bonds. A creditworthiness
assessment for new and existing investments is undertaken by the Group in accordance with the Investment Policy as approved by the
Investment Committee. In addition, the credit ratings of the bond portfolio are regularly monitored and any downgrade in credit ratings
will be evaluated to determine the required actions. As at the reporting date, the Group’s bond portfolio has no material exposure below
investment grade.
The Group is exposed to reinsurance/retakaful/takaful counterparty risks of three different types:
(i) as a result of recoveries owing from the counterparties for claims/benefi ts;
(ii) from amounts due from ceding companies; and
(iii) as a result of reserves held by the counterparties which would have to be met by the reinsurance/retakaful and takaful subsidiaries
in the event of default.
Management of credit risk
In order to manage and mitigate credit risk, the following policies and procedures were set in place:
(i) Investment policies prescribe the minimum credit rating for bonds that may be held. In addition, the policies are further aimed
at investing in a diverse portfolio of bonds in order to reduce the potential impact that may arise from individual companies
defaulting;
(ii) Counterparty limits are set for investments and cash deposits to ensure that there is no concentration of credit risk;
(iii) The Group’s investment portfolio is managed to ensure diversifi cation and focuses on high quality investment grade bonds with good
fundamentals. For the fi nancial year ended 31 March 2018, the credit rating of the Group’s fi xed income portfolio was dominated by
securities rated AAA as determined by Rating Agency Malaysia (“RAM”) and/or Malaysian Rating Corporation Berhad (“MARC”); and
(iv) To mitigate reinsurance/retakaful/takaful counterparty risk, the Group will give due consideration to the credit quality of the
counterparties. To facilitate this process, a list of acceptable counterparties based on their rating is maintained within the Group.
The Group regularly reviews the fi nancial security of its counterparties.
The table below provides information regarding the credit risk exposures of the Group and the Company by classifying assets according
to the credit ratings of counterparties. Unearned premium and contribution reserves and reserves for unearned wakalah fees have been
excluded from the analysis as they are not contractual obligations.
NOTES TO THE FINANCIAL STATEMENTS31 March 2018
204 MNRB HOLDINGS BERHAD (13487-A)
KEYMESSAGES LEADERSHIP
CORPORATE DISCLOSURES
STRATEGICREVIEW
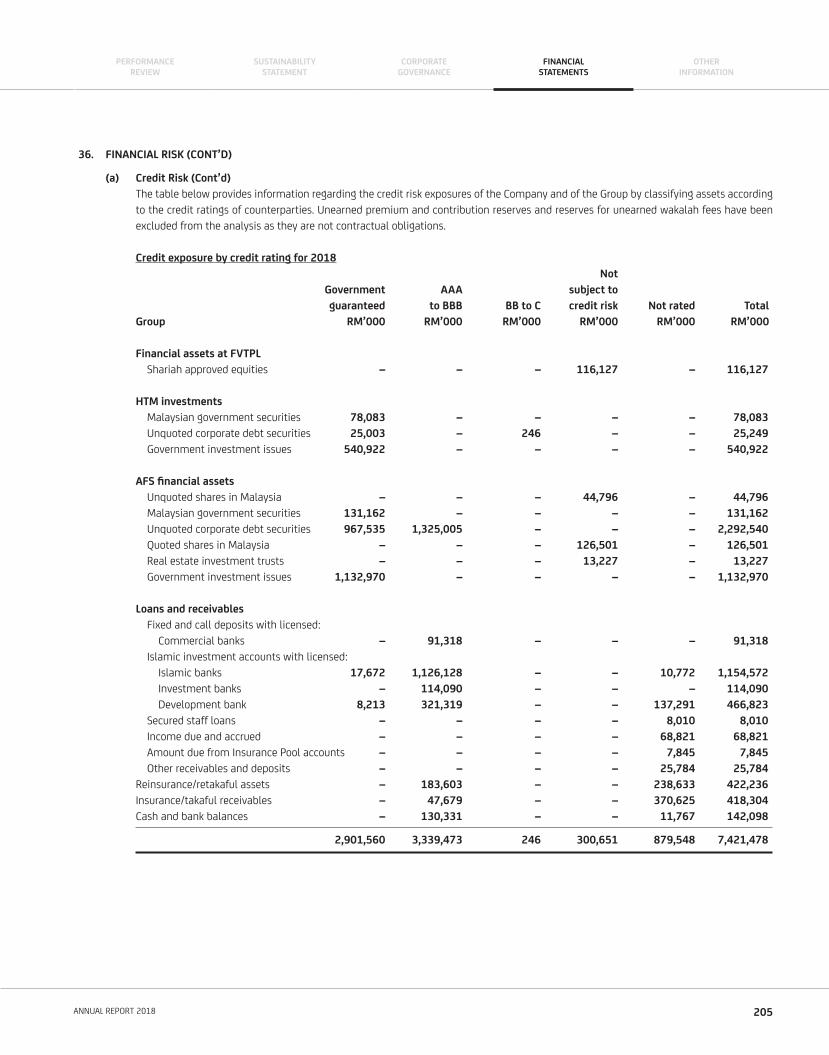
36. FINANCIAL RISK (CONT’D)
(a) Credit Risk (Cont’d)
The table below provides information regarding the credit risk exposures of the Company and of the Group by classifying assets according
to the credit ratings of counterparties. Unearned premium and contribution reserves and reserves for unearned wakalah fees have been
excluded from the analysis as they are not contractual obligations.
Credit exposure by credit rating for 2018
Not
Government AAA subject to
guaranteed to BBB BB to C credit risk Not rated Total
Group RM’000 RM’000 RM’000 RM’000 RM’000 RM’000
Financial assets at FVTPL
Shariah approved equities – – – 116,127 – 116,127
HTM investments
Malaysian government securities 78,083 – – – – 78,083
Unquoted corporate debt securities 25,003 – 246 – – 25,249
Government investment issues 540,922 – – – – 540,922
AFS fi nancial assets
Unquoted shares in Malaysia – – – 44,796 – 44,796
Malaysian government securities 131,162 – – – – 131,162
Unquoted corporate debt securities 967,535 1,325,005 – – – 2,292,540
Quoted shares in Malaysia – – – 126,501 – 126,501
Real estate investment trusts – – – 13,227 – 13,227
Government investment issues 1,132,970 – – – – 1,132,970
Loans and receivables
Fixed and call deposits with licensed:
Commercial banks – 91,318 – – – 91,318
Islamic investment accounts with licensed:
Islamic banks 17,672 1,126,128 – – 10,772 1,154,572
Investment banks – 114,090 – – – 114,090
Development bank 8,213 321,319 – – 137,291 466,823
Secured staff loans – – – – 8,010 8,010
Income due and accrued – – – – 68,821 68,821
Amount due from Insurance Pool accounts – – – – 7,845 7,845
Other receivables and deposits – – – – 25,784 25,784
Reinsurance/retakaful assets – 183,603 – – 238,633 422,236
Insurance/takaful receivables – 47,679 – – 370,625 418,304
Cash and bank balances – 130,331 – – 11,767 142,098
2,901,560 3,339,473 246 300,651 879,548 7,421,478
205ANNUAL REPORT 2018
PERFORMANCEREVIEW
CORPORATEGOVERNANCE
SUSTAINABILITYSTATEMENT
FINANCIALSTATEMENTS
OTHERINFORMATION
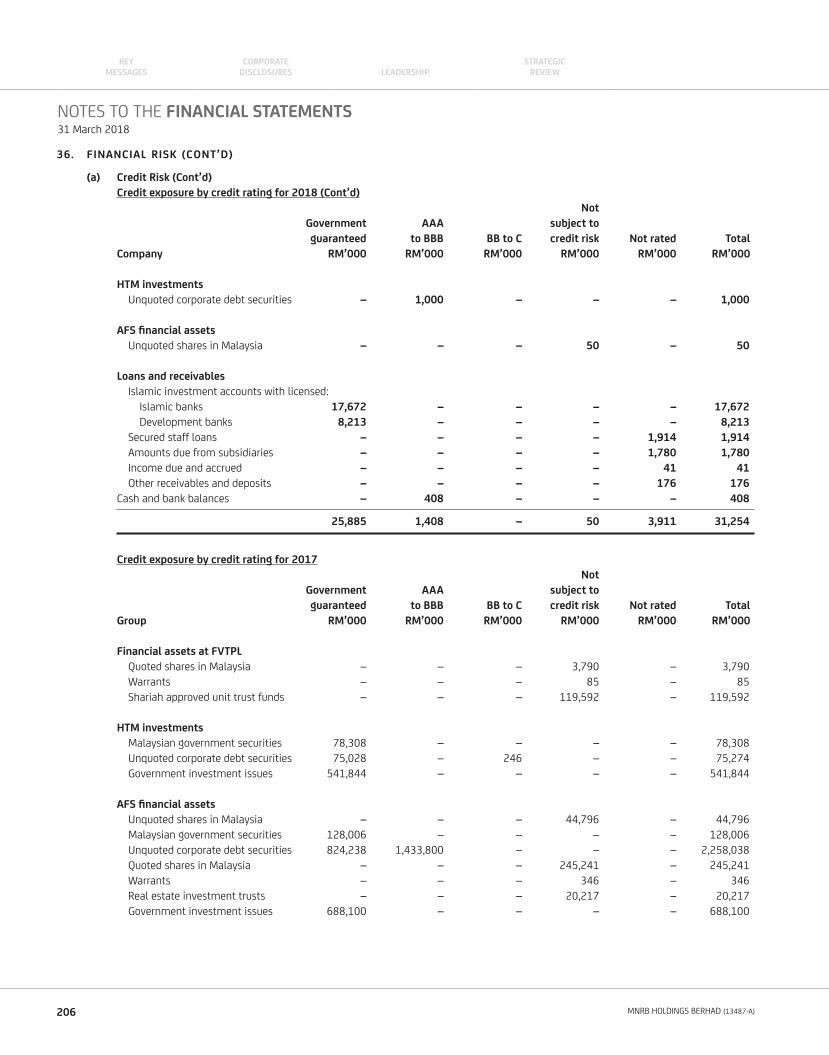
36. FINANCIAL RISK (CONT’D)
(a) Credit Risk (Cont’d)
Credit exposure by credit rating for 2018 (Cont’d)
Not
Government AAA subject to
guaranteed to BBB BB to C credit risk Not rated Total
Company RM’000 RM’000 RM’000 RM’000 RM’000 RM’000
HTM investments
Unquoted corporate debt securities – 1,000 – – – 1,000
AFS fi nancial assets
Unquoted shares in Malaysia – – – 50 – 50
Loans and receivables
Islamic investment accounts with licensed:
Islamic banks 17,672 – – – – 17,672
Development banks 8,213 – – – – 8,213
Secured staff loans – – – – 1,914 1,914
Amounts due from subsidiaries – – – – 1,780 1,780
Income due and accrued – – – – 41 41
Other receivables and deposits – – – – 176 176
Cash and bank balances – 408 – – – 408
25,885 1,408 – 50 3,911 31,254
Credit exposure by credit rating for 2017
Not
Government AAA subject to
guaranteed to BBB BB to C credit risk Not rated Total
Group RM’000 RM’000 RM’000 RM’000 RM’000 RM’000
Financial assets at FVTPL
Quoted shares in Malaysia – – – 3,790 – 3,790
Warrants – – – 85 – 85
Shariah approved unit trust funds – – – 119,592 – 119,592
HTM investments
Malaysian government securities 78,308 – – – – 78,308
Unquoted corporate debt securities 75,028 – 246 – – 75,274
Government investment issues 541,844 – – – – 541,844
AFS fi nancial assets
Unquoted shares in Malaysia – – – 44,796 – 44,796
Malaysian government securities 128,006 – – – – 128,006
Unquoted corporate debt securities 824,238 1,433,800 – – – 2,258,038
Quoted shares in Malaysia – – – 245,241 – 245,241
Warrants – – – 346 – 346
Real estate investment trusts – – – 20,217 – 20,217
Government investment issues 688,100 – – – – 688,100
NOTES TO THE FINANCIAL STATEMENTS31 March 2018
206 MNRB HOLDINGS BERHAD (13487-A)
KEYMESSAGES LEADERSHIP
CORPORATE DISCLOSURES
STRATEGICREVIEW
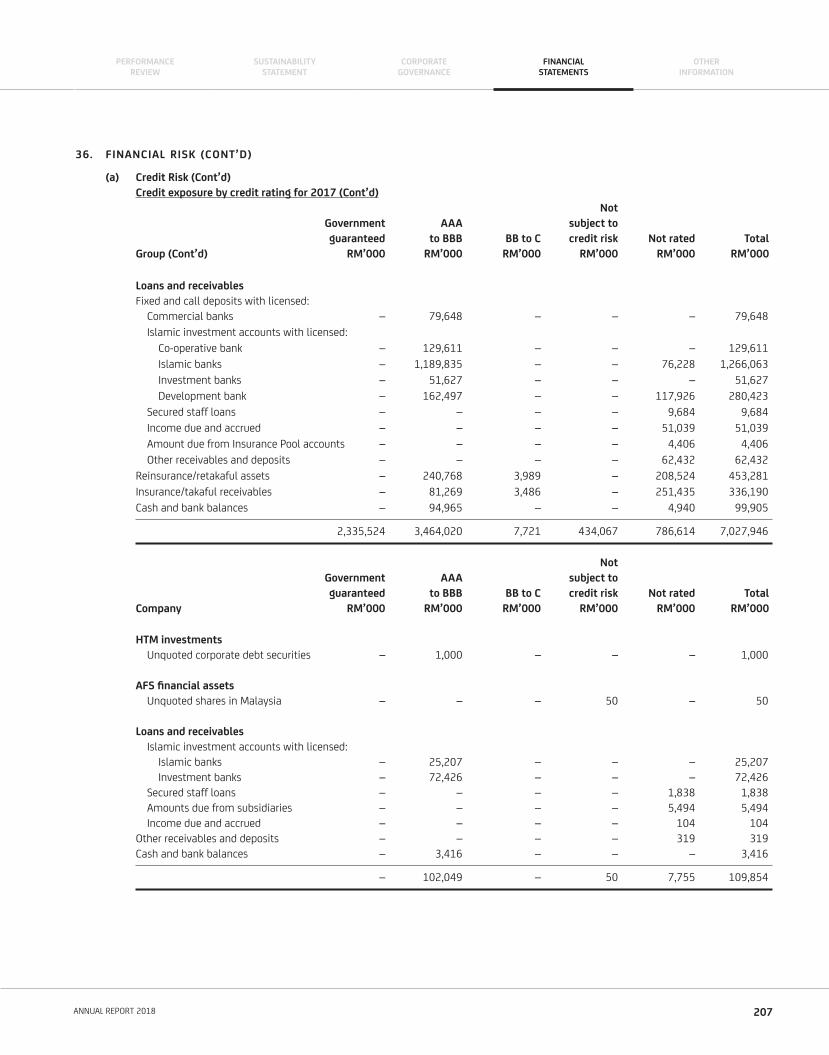
36. FINANCIAL RISK (CONT’D)
(a) Credit Risk (Cont’d)
Credit exposure by credit rating for 2017 (Cont’d)
Not
Government AAA subject to
guaranteed to BBB BB to C credit risk Not rated Total
Group (Cont’d) RM’000 RM’000 RM’000 RM’000 RM’000 RM’000
Loans and receivables
Fixed and call deposits with licensed:
Commercial banks – 79,648 – – – 79,648
Islamic investment accounts with licensed:
Co-operative bank – 129,611 – – – 129,611
Islamic banks – 1,189,835 – – 76,228 1,266,063
Investment banks – 51,627 – – – 51,627
Development bank – 162,497 – – 117,926 280,423
Secured staff loans – – – – 9,684 9,684
Income due and accrued – – – – 51,039 51,039
Amount due from Insurance Pool accounts – – – – 4,406 4,406
Other receivables and deposits – – – – 62,432 62,432
Reinsurance/retakaful assets – 240,768 3,989 – 208,524 453,281
Insurance/takaful receivables – 81,269 3,486 – 251,435 336,190
Cash and bank balances – 94,965 – – 4,940 99,905
2,335,524 3,464,020 7,721 434,067 786,614 7,027,946
Not
Government AAA subject to
guaranteed to BBB BB to C credit risk Not rated Total
Company RM’000 RM’000 RM’000 RM’000 RM’000 RM’000
HTM investments
Unquoted corporate debt securities – 1,000 – – – 1,000
AFS fi nancial assets
Unquoted shares in Malaysia – – – 50 – 50
Loans and receivables
Islamic investment accounts with licensed:
Islamic banks – 25,207 – – – 25,207
Investment banks – 72,426 – – – 72,426
Secured staff loans – – – – 1,838 1,838
Amounts due from subsidiaries – – – – 5,494 5,494
Income due and accrued – – – – 104 104
Other receivables and deposits – – – – 319 319
Cash and bank balances – 3,416 – – – 3,416
– 102,049 – 50 7,755 109,854
207ANNUAL REPORT 2018
PERFORMANCEREVIEW
CORPORATEGOVERNANCE
SUSTAINABILITYSTATEMENT
FINANCIALSTATEMENTS
OTHERINFORMATION
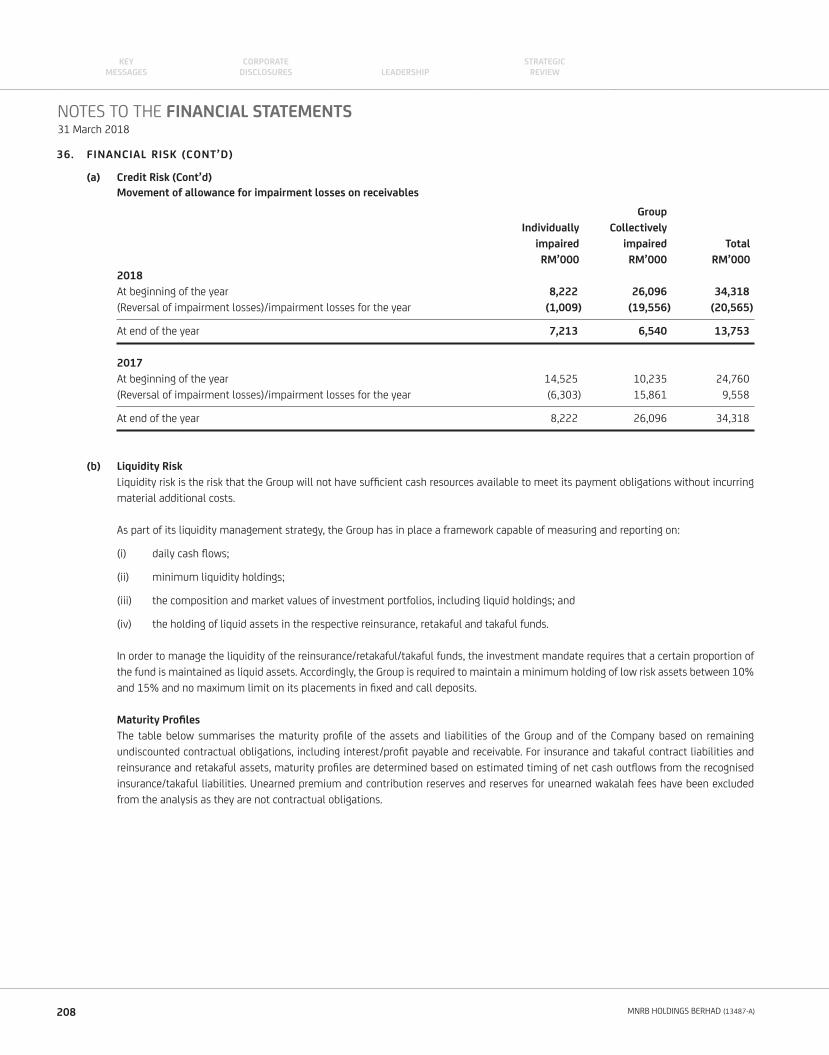
36. FINANCIAL RISK (CONT’D)
(a) Credit Risk (Cont’d)
Movement of allowance for impairment losses on receivables
Group
Individually Collectively
impaired impaired Total
RM’000 RM’000 RM’000
2018
At beginning of the year 8,222 26,096 34,318
(Reversal of impairment losses)/impairment losses for the year (1,009) (19,556) (20,565)
At end of the year 7,213 6,540 13,753
2017
At beginning of the year 14,525 10,235 24,760
(Reversal of impairment losses)/impairment losses for the year (6,303) 15,861 9,558
At end of the year 8,222 26,096 34,318
(b) Liquidity Risk
Liquidity risk is the risk that the Group will not have suffi cient cash resources available to meet its payment obligations without incurring
material additional costs.
As part of its liquidity management strategy, the Group has in place a framework capable of measuring and reporting on:
(i) daily cash fl ows;
(ii) minimum liquidity holdings;
(iii) the composition and market values of investment portfolios, including liquid holdings; and
(iv) the holding of liquid assets in the respective reinsurance, retakaful and takaful funds.
In order to manage the liquidity of the reinsurance/retakaful/takaful funds, the investment mandate requires that a certain proportion of
the fund is maintained as liquid assets. Accordingly, the Group is required to maintain a minimum holding of low risk assets between 10%
and 15% and no maximum limit on its placements in fi xed and call deposits.
Maturity Profi les
The table below summarises the maturity profi le of the assets and liabilities of the Group and of the Company based on remaining
undiscounted contractual obligations, including interest/profi t payable and receivable. For insurance and takaful contract liabilities and
reinsurance and retakaful assets, maturity profi les are determined based on estimated timing of net cash outfl ows from the recognised
insurance/takaful liabilities. Unearned premium and contribution reserves and reserves for unearned wakalah fees have been excluded
from the analysis as they are not contractual obligations.
NOTES TO THE FINANCIAL STATEMENTS31 March 2018
208 MNRB HOLDINGS BERHAD (13487-A)
KEYMESSAGES LEADERSHIP
CORPORATE DISCLOSURES
STRATEGICREVIEW
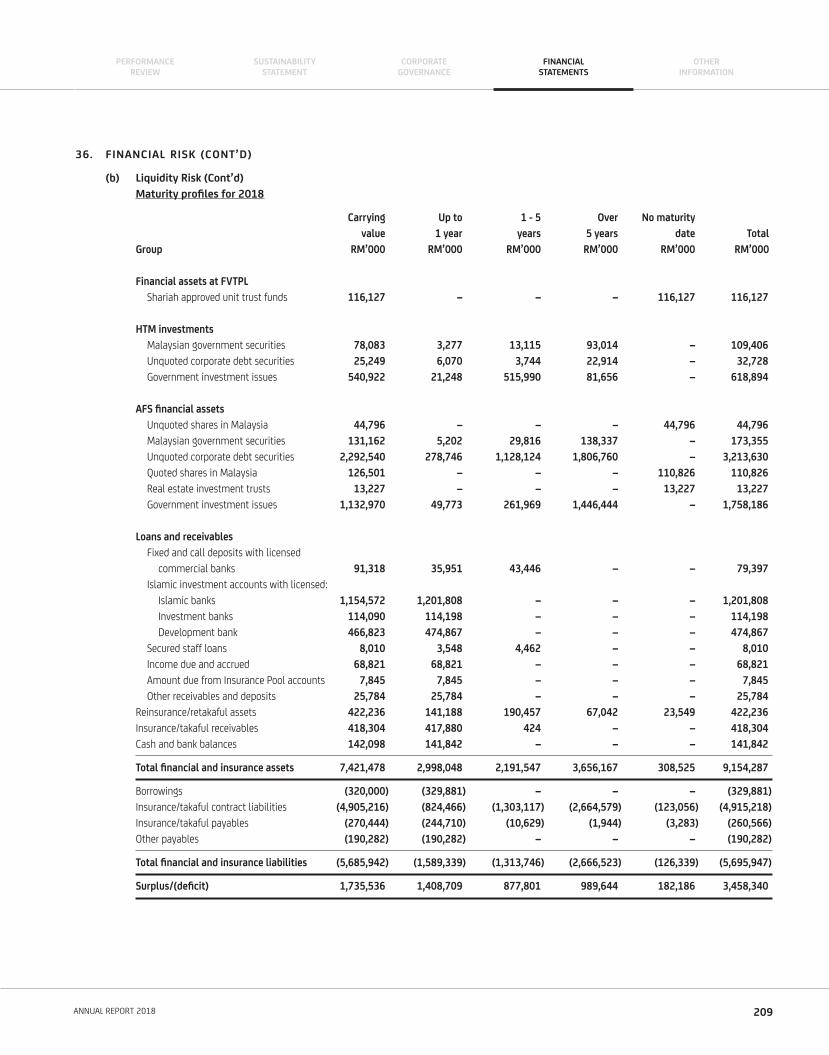
36. FINANCIAL RISK (CONT’D)
(b) Liquidity Risk (Cont’d)
Maturity profi les for 2018
Carrying Up to 1 - 5 Over No maturity
value 1 year years 5 years date Total
Group RM’000 RM’000 RM’000 RM’000 RM’000 RM’000
Financial assets at FVTPL
Shariah approved unit trust funds 116,127 – – – 116,127 116,127
HTM investments
Malaysian government securities 78,083 3,277 13,115 93,014 – 109,406
Unquoted corporate debt securities 25,249 6,070 3,744 22,914 – 32,728
Government investment issues 540,922 21,248 515,990 81,656 – 618,894
AFS fi nancial assets
Unquoted shares in Malaysia 44,796 – – – 44,796 44,796
Malaysian government securities 131,162 5,202 29,816 138,337 – 173,355
Unquoted corporate debt securities 2,292,540 278,746 1,128,124 1,806,760 – 3,213,630
Quoted shares in Malaysia 126,501 – – – 110,826 110,826
Real estate investment trusts 13,227 – – – 13,227 13,227
Government investment issues 1,132,970 49,773 261,969 1,446,444 – 1,758,186
Loans and receivables
Fixed and call deposits with licensed
commercial banks 91,318 35,951 43,446 – – 79,397
Islamic investment accounts with licensed:
Islamic banks 1,154,572 1,201,808 – – – 1,201,808
Investment banks 114,090 114,198 – – – 114,198
Development bank 466,823 474,867 – – – 474,867
Secured staff loans 8,010 3,548 4,462 – – 8,010
Income due and accrued 68,821 68,821 – – – 68,821
Amount due from Insurance Pool accounts 7,845 7,845 – – – 7,845
Other receivables and deposits 25,784 25,784 – – – 25,784
Reinsurance/retakaful assets 422,236 141,188 190,457 67,042 23,549 422,236
Insurance/takaful receivables 418,304 417,880 424 – – 418,304
Cash and bank balances 142,098 141,842 – – – 141,842
Total fi nancial and insurance assets 7,421,478 2,998,048 2,191,547 3,656,167 308,525 9,154,287
Borrowings (320,000) (329,881) – – – (329,881)
Insurance/takaful contract liabilities (4,905,216) (824,466) (1,303,117) (2,664,579) (123,056) (4,915,218)
Insurance/takaful payables (270,444) (244,710) (10,629) (1,944) (3,283) (260,566)
Other payables (190,282) (190,282) – – – (190,282)
Total fi nancial and insurance liabilities (5,685,942) (1,589,339) (1,313,746) (2,666,523) (126,339) (5,695,947)
Surplus/(defi cit) 1,735,536 1,408,709 877,801 989,644 182,186 3,458,340
209ANNUAL REPORT 2018
PERFORMANCEREVIEW
CORPORATEGOVERNANCE
SUSTAINABILITYSTATEMENT
FINANCIALSTATEMENTS
OTHERINFORMATION
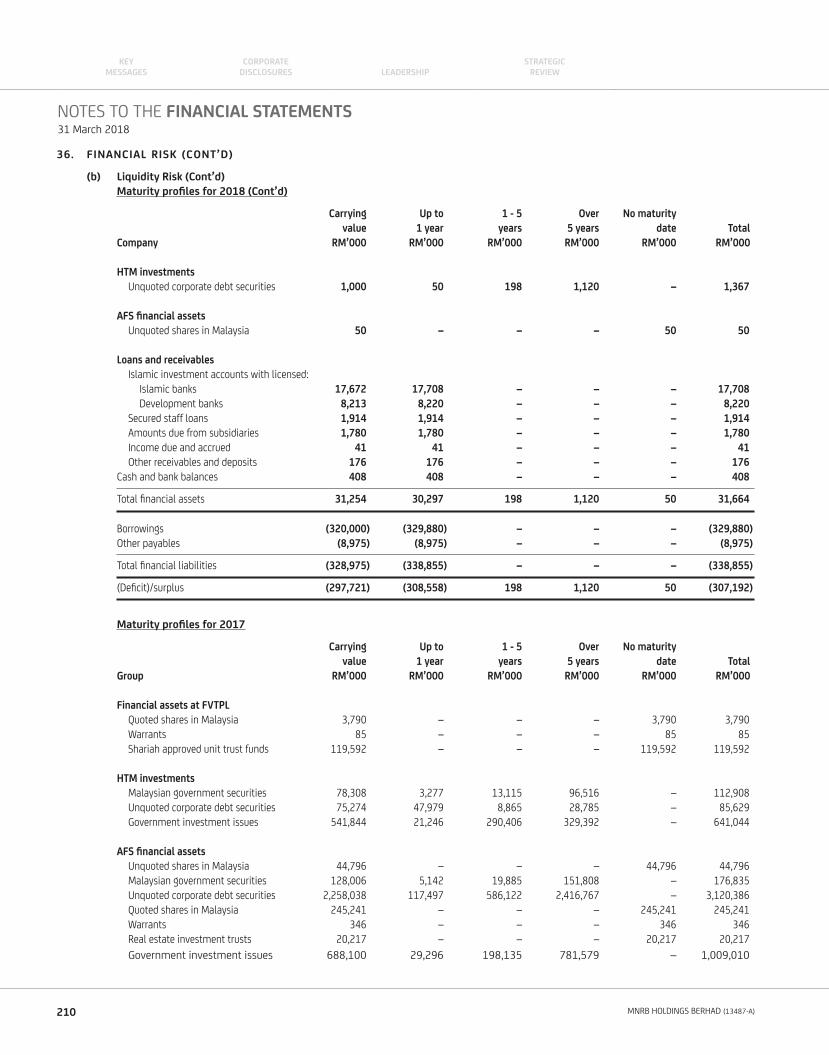
36. FINANCIAL RISK (CONT’D)
(b) Liquidity Risk (Cont’d)
Maturity profi les for 2018 (Cont’d)
Carrying Up to 1 - 5 Over No maturity
value 1 year years 5 years date Total
Company RM’000 RM’000 RM’000 RM’000 RM’000 RM’000
HTM investments
Unquoted corporate debt securities 1,000 50 198 1,120 – 1,367
AFS fi nancial assets
Unquoted shares in Malaysia 50 – – – 50 50
Loans and receivables
Islamic investment accounts with licensed:
Islamic banks 17,672 17,708 – – – 17,708
Development banks 8,213 8,220 – – – 8,220
Secured staff loans 1,914 1,914 – – – 1,914
Amounts due from subsidiaries 1,780 1,780 – – – 1,780
Income due and accrued 41 41 – – – 41
Other receivables and deposits 176 176 – – – 176
Cash and bank balances 408 408 – – – 408
Total fi nancial assets 31,254 30,297 198 1,120 50 31,664
Borrowings (320,000) (329,880) – – – (329,880)
Other payables (8,975) (8,975) – – – (8,975)
Total fi nancial liabilities (328,975) (338,855) – – – (338,855)
(Defi cit)/surplus (297,721) (308,558) 198 1,120 50 (307,192)
Maturity profi les for 2017
Carrying Up to 1 - 5 Over No maturity
value 1 year years 5 years date Total
Group RM’000 RM’000 RM’000 RM’000 RM’000 RM’000
Financial assets at FVTPL
Quoted shares in Malaysia 3,790 – – – 3,790 3,790
Warrants 85 – – – 85 85
Shariah approved unit trust funds 119,592 – – – 119,592 119,592
HTM investments
Malaysian government securities 78,308 3,277 13,115 96,516 – 112,908
Unquoted corporate debt securities 75,274 47,979 8,865 28,785 – 85,629
Government investment issues 541,844 21,246 290,406 329,392 – 641,044
AFS fi nancial assets
Unquoted shares in Malaysia 44,796 – – – 44,796 44,796
Malaysian government securities 128,006 5,142 19,885 151,808 – 176,835
Unquoted corporate debt securities 2,258,038 117,497 586,122 2,416,767 – 3,120,386
Quoted shares in Malaysia 245,241 – – – 245,241 245,241
Warrants 346 – – – 346 346
Real estate investment trusts 20,217 – – – 20,217 20,217
Government investment issues 688,100 29,296 198,135 781,579 – 1,009,010
NOTES TO THE FINANCIAL STATEMENTS31 March 2018
210 MNRB HOLDINGS BERHAD (13487-A)
KEYMESSAGES LEADERSHIP
CORPORATE DISCLOSURES
STRATEGICREVIEW
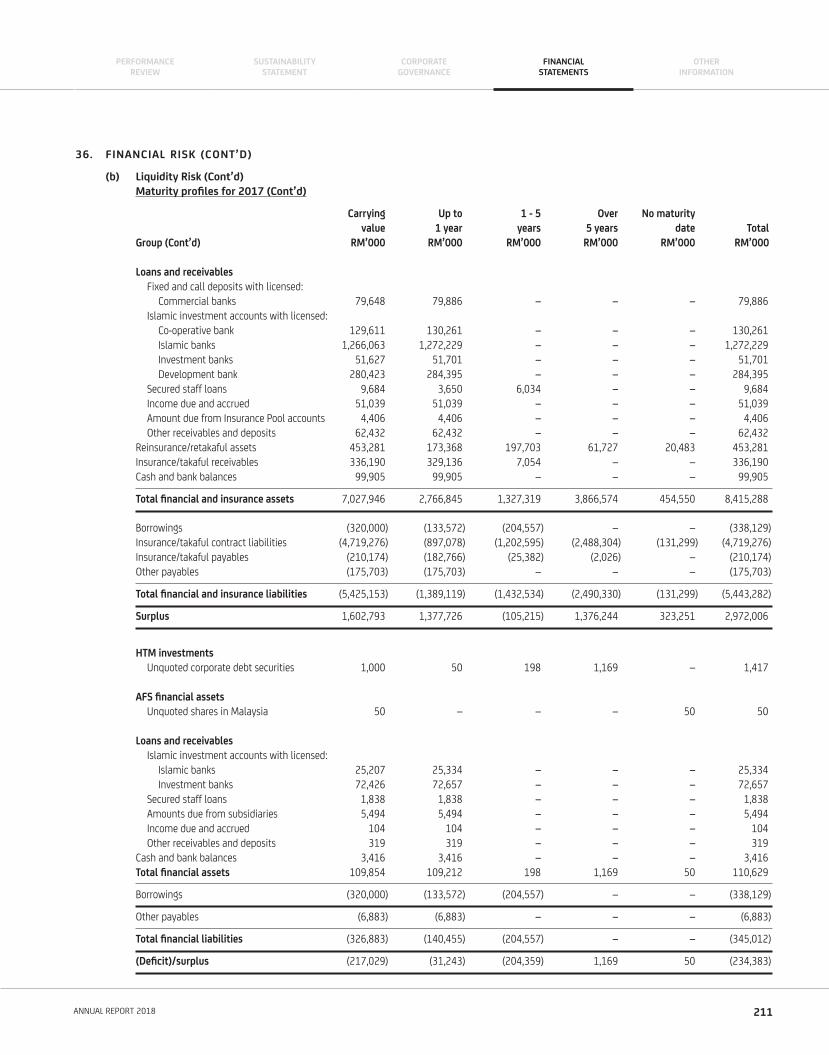
36. FINANCIAL RISK (CONT’D)
(b) Liquidity Risk (Cont’d)
Maturity profi les for 2017 (Cont’d)
Carrying Up to 1 - 5 Over No maturity
value 1 year years 5 years date Total
Group (Cont’d) RM’000 RM’000 RM’000 RM’000 RM’000 RM’000
Loans and receivables
Fixed and call deposits with licensed:
Commercial banks 79,648 79,886 – – – 79,886
Islamic investment accounts with licensed:
Co-operative bank 129,611 130,261 – – – 130,261
Islamic banks 1,266,063 1,272,229 – – – 1,272,229
Investment banks 51,627 51,701 – – – 51,701
Development bank 280,423 284,395 – – – 284,395
Secured staff loans 9,684 3,650 6,034 – – 9,684
Income due and accrued 51,039 51,039 – – – 51,039
Amount due from Insurance Pool accounts 4,406 4,406 – – – 4,406
Other receivables and deposits 62,432 62,432 – – – 62,432
Reinsurance/retakaful assets 453,281 173,368 197,703 61,727 20,483 453,281
Insurance/takaful receivables 336,190 329,136 7,054 – – 336,190
Cash and bank balances 99,905 99,905 – – – 99,905
Total fi nancial and insurance assets 7,027,946 2,766,845 1,327,319 3,866,574 454,550 8,415,288
Borrowings (320,000) (133,572) (204,557) – – (338,129)
Insurance/takaful contract liabilities (4,719,276) (897,078) (1,202,595) (2,488,304) (131,299) (4,719,276)
Insurance/takaful payables (210,174) (182,766) (25,382) (2,026) – (210,174)
Other payables (175,703) (175,703) – – – (175,703)
Total fi nancial and insurance liabilities (5,425,153) (1,389,119) (1,432,534) (2,490,330) (131,299) (5,443,282)
Surplus 1,602,793 1,377,726 (105,215) 1,376,244 323,251 2,972,006
HTM investments
Unquoted corporate debt securities 1,000 50 198 1,169 – 1,417
AFS fi nancial assets
Unquoted shares in Malaysia 50 – – – 50 50
Loans and receivables
Islamic investment accounts with licensed:
Islamic banks 25,207 25,334 – – – 25,334
Investment banks 72,426 72,657 – – – 72,657
Secured staff loans 1,838 1,838 – – – 1,838
Amounts due from subsidiaries 5,494 5,494 – – – 5,494
Income due and accrued 104 104 – – – 104
Other receivables and deposits 319 319 – – – 319
Cash and bank balances 3,416 3,416 – – – 3,416
Total fi nancial assets 109,854 109,212 198 1,169 50 110,629
Borrowings (320,000) (133,572) (204,557) – – (338,129)
Other payables (6,883) (6,883) – – – (6,883)
Total fi nancial liabilities (326,883) (140,455) (204,557) – – (345,012)
(Defi cit)/surplus (217,029) (31,243) (204,359) 1,169 50 (234,383)
211ANNUAL REPORT 2018
PERFORMANCEREVIEW
CORPORATEGOVERNANCE
SUSTAINABILITYSTATEMENT
FINANCIALSTATEMENTS
OTHERINFORMATION
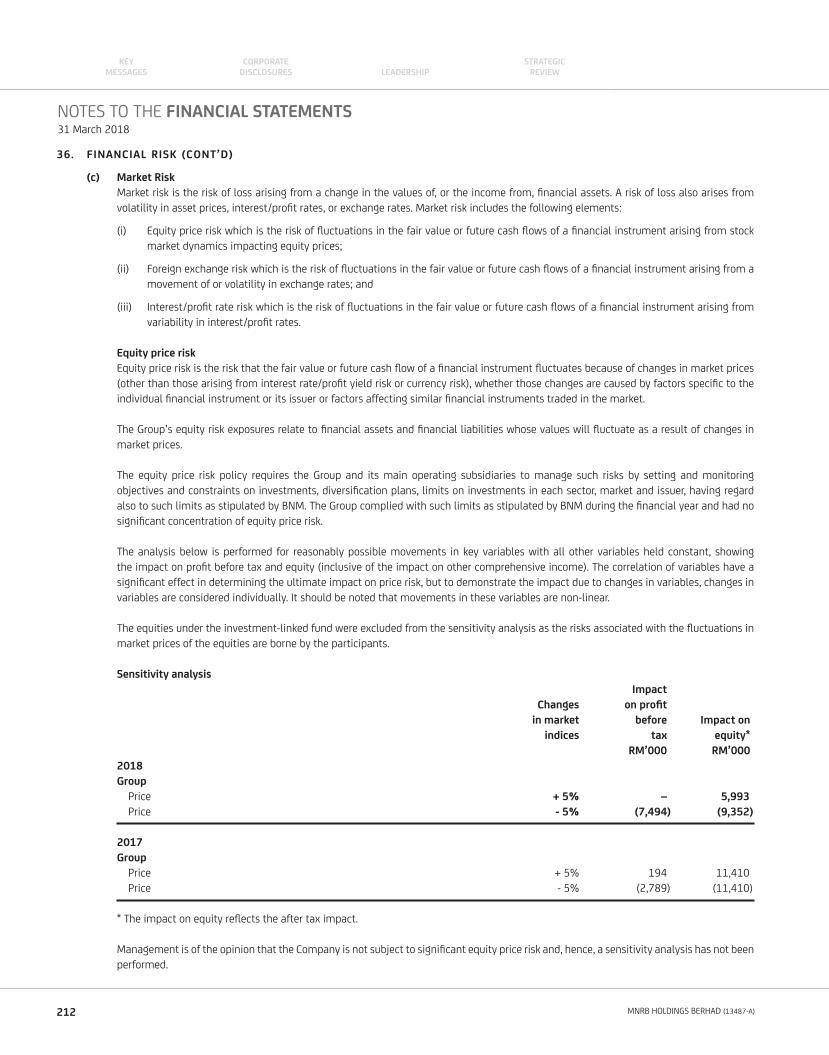
36. FINANCIAL RISK (CONT’D)
(c) Market Risk
Market risk is the risk of loss arising from a change in the values of, or the income from, fi nancial assets. A risk of loss also arises from
volatility in asset prices, interest/profi t rates, or exchange rates. Market risk includes the following elements:
(i) Equity price risk which is the risk of fl uctuations in the fair value or future cash fl ows of a fi nancial instrument arising from stock
market dynamics impacting equity prices;
(ii) Foreign exchange risk which is the risk of fl uctuations in the fair value or future cash fl ows of a fi nancial instrument arising from a
movement of or volatility in exchange rates; and
(iii) Interest/profi t rate risk which is the risk of fl uctuations in the fair value or future cash fl ows of a fi nancial instrument arising from
variability in interest/profi t rates.
Equity price risk
Equity price risk is the risk that the fair value or future cash fl ow of a fi nancial instrument fl uctuates because of changes in market prices
(other than those arising from interest rate/profi t yield risk or currency risk), whether those changes are caused by factors specifi c to the
individual fi nancial instrument or its issuer or factors affecting similar fi nancial instruments traded in the market.
The Group’s equity risk exposures relate to fi nancial assets and fi nancial liabilities whose values will fl uctuate as a result of changes in
market prices.
The equity price risk policy requires the Group and its main operating subsidiaries to manage such risks by setting and monitoring
objectives and constraints on investments, diversifi cation plans, limits on investments in each sector, market and issuer, having regard
also to such limits as stipulated by BNM. The Group complied with such limits as stipulated by BNM during the fi nancial year and had no
signifi cant concentration of equity price risk.
The analysis below is performed for reasonably possible movements in key variables with all other variables held constant, showing
the impact on profi t before tax and equity (inclusive of the impact on other comprehensive income). The correlation of variables have a
signifi cant effect in determining the ultimate impact on price risk, but to demonstrate the impact due to changes in variables, changes in
variables are considered individually. It should be noted that movements in these variables are non-linear.
The equities under the investment-linked fund were excluded from the sensitivity analysis as the risks associated with the fl uctuations in
market prices of the equities are borne by the participants.
Sensitivity analysis
Impact
Changes on profi t
in market before Impact on
indices tax equity*
RM’000 RM’000
2018
Group
Price + 5% – 5,993
Price - 5% (7,494) (9,352)
2017
Group
Price + 5% 194 11,410
Price - 5% (2,789) (11,410)
* The impact on equity refl ects the after tax impact.
Management is of the opinion that the Company is not subject to signifi cant equity price risk and, hence, a sensitivity analysis has not been
performed.
NOTES TO THE FINANCIAL STATEMENTS31 March 2018
212 MNRB HOLDINGS BERHAD (13487-A)
KEYMESSAGES LEADERSHIP
CORPORATE DISCLOSURES
STRATEGICREVIEW
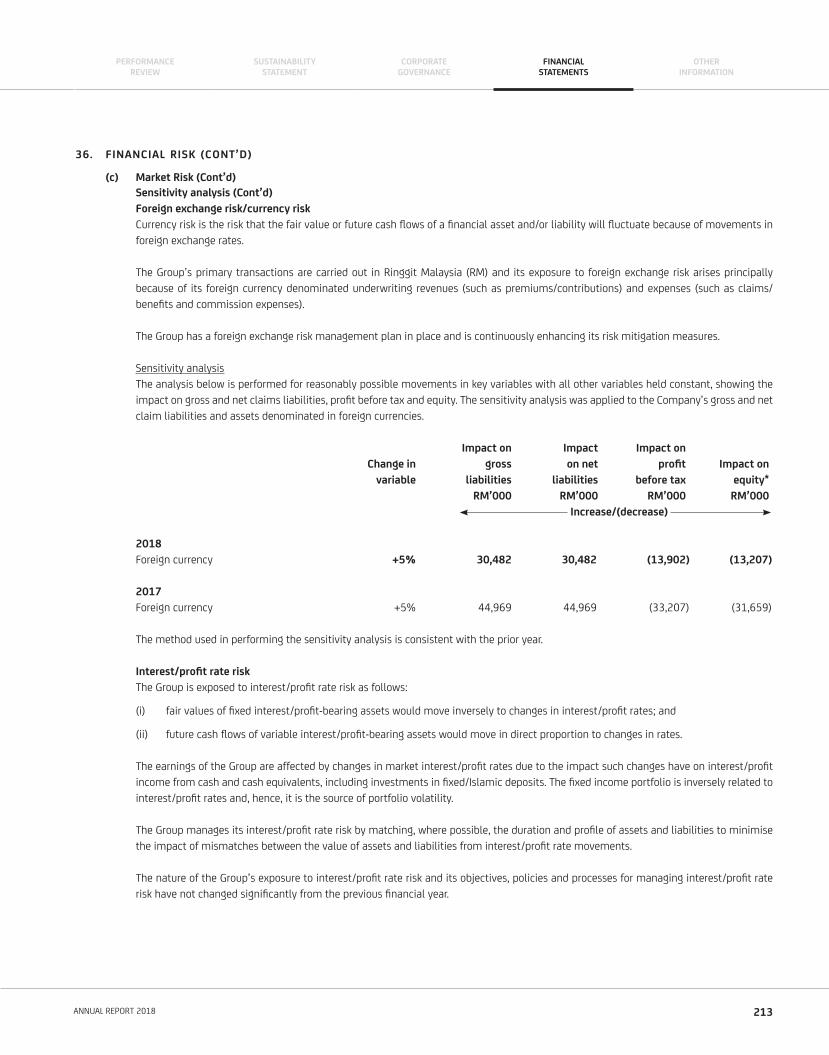
36. FINANCIAL RISK (CONT’D)
(c) Market Risk (Cont’d)
Sensitivity analysis (Cont’d)
Foreign exchange risk/currency risk
Currency risk is the risk that the fair value or future cash fl ows of a fi nancial asset and/or liability will fl uctuate because of movements in
foreign exchange rates.
The Group’s primary transactions are carried out in Ringgit Malaysia (RM) and its exposure to foreign exchange risk arises principally
because of its foreign currency denominated underwriting revenues (such as premiums/contributions) and expenses (such as claims/
benefi ts and commission expenses).
The Group has a foreign exchange risk management plan in place and is continuously enhancing its risk mitigation measures.
Sensitivity analysis
The analysis below is performed for reasonably possible movements in key variables with all other variables held constant, showing the
impact on gross and net claims liabilities, profi t before tax and equity. The sensitivity analysis was applied to the Company’s gross and net
claim liabilities and assets denominated in foreign currencies.
Impact on Impact Impact on
Change in gross on net profi t Impact on
variable liabilities liabilities before tax equity*
RM’000 RM’000 RM’000 RM’000
Increase/(decrease)
2018
Foreign currency +5% 30,482 30,482 (13,902) (13,207)
2017
Foreign currency +5% 44,969 44,969 (33,207) (31,659)
The method used in performing the sensitivity analysis is consistent with the prior year.
Interest/profi t rate risk
The Group is exposed to interest/profi t rate risk as follows:
(i) fair values of fi xed interest/profi t-bearing assets would move inversely to changes in interest/profi t rates; and
(ii) future cash fl ows of variable interest/profi t-bearing assets would move in direct proportion to changes in rates.
The earnings of the Group are affected by changes in market interest/profi t rates due to the impact such changes have on interest/profi t
income from cash and cash equivalents, including investments in fi xed/Islamic deposits. The fi xed income portfolio is inversely related to
interest/profi t rates and, hence, it is the source of portfolio volatility.
The Group manages its interest/profi t rate risk by matching, where possible, the duration and profi le of assets and liabilities to minimise
the impact of mismatches between the value of assets and liabilities from interest/profi t rate movements.
The nature of the Group’s exposure to interest/profi t rate risk and its objectives, policies and processes for managing interest/profi t rate
risk have not changed signifi cantly from the previous fi nancial year.
213ANNUAL REPORT 2018
PERFORMANCEREVIEW
CORPORATEGOVERNANCE
SUSTAINABILITYSTATEMENT
FINANCIALSTATEMENTS
OTHERINFORMATION
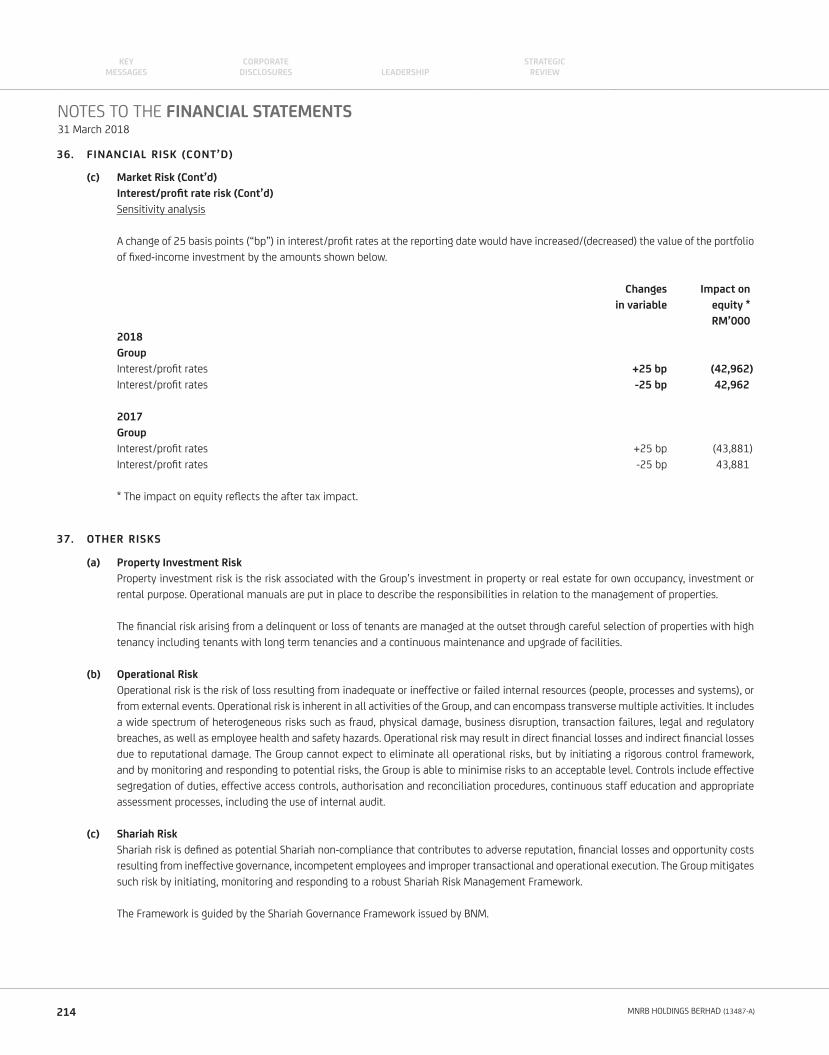
36. FINANCIAL RISK (CONT’D)
(c) Market Risk (Cont’d)
Interest/profi t rate risk (Cont’d)
Sensitivity analysis
A change of 25 basis points (“bp”) in interest/profi t rates at the reporting date would have increased/(decreased) the value of the portfolio
of fi xed-income investment by the amounts shown below.
Changes Impact on
in variable equity *
RM’000
2018
Group
Interest/profi t rates +25 bp (42,962)
Interest/profi t rates -25 bp 42,962
2017
Group
Interest/profi t rates +25 bp (43,881)
Interest/profi t rates -25 bp 43,881
* The impact on equity refl ects the after tax impact.
37. OTHER RISKS
(a) Property Investment Risk
Property investment risk is the risk associated with the Group’s investment in property or real estate for own occupancy, investment or
rental purpose. Operational manuals are put in place to describe the responsibilities in relation to the management of properties.
The fi nancial risk arising from a delinquent or loss of tenants are managed at the outset through careful selection of properties with high
tenancy including tenants with long term tenancies and a continuous maintenance and upgrade of facilities.
(b) Operational Risk
Operational risk is the risk of loss resulting from inadequate or ineffective or failed internal resources (people, processes and systems), or
from external events. Operational risk is inherent in all activities of the Group, and can encompass transverse multiple activities. It includes
a wide spectrum of heterogeneous risks such as fraud, physical damage, business disruption, transaction failures, legal and regulatory
breaches, as well as employee health and safety hazards. Operational risk may result in direct fi nancial losses and indirect fi nancial losses
due to reputational damage. The Group cannot expect to eliminate all operational risks, but by initiating a rigorous control framework,
and by monitoring and responding to potential risks, the Group is able to minimise risks to an acceptable level. Controls include effective
segregation of duties, effective access controls, authorisation and reconciliation procedures, continuous staff education and appropriate
assessment processes, including the use of internal audit.
(c) Shariah Risk
Shariah risk is defi ned as potential Shariah non-compliance that contributes to adverse reputation, fi nancial losses and opportunity costs
resulting from ineffective governance, incompetent employees and improper transactional and operational execution. The Group mitigates
such risk by initiating, monitoring and responding to a robust Shariah Risk Management Framework.
The Framework is guided by the Shariah Governance Framework issued by BNM.
NOTES TO THE FINANCIAL STATEMENTS31 March 2018
214 MNRB HOLDINGS BERHAD (13487-A)
KEYMESSAGES LEADERSHIP
CORPORATE DISCLOSURES
STRATEGICREVIEW
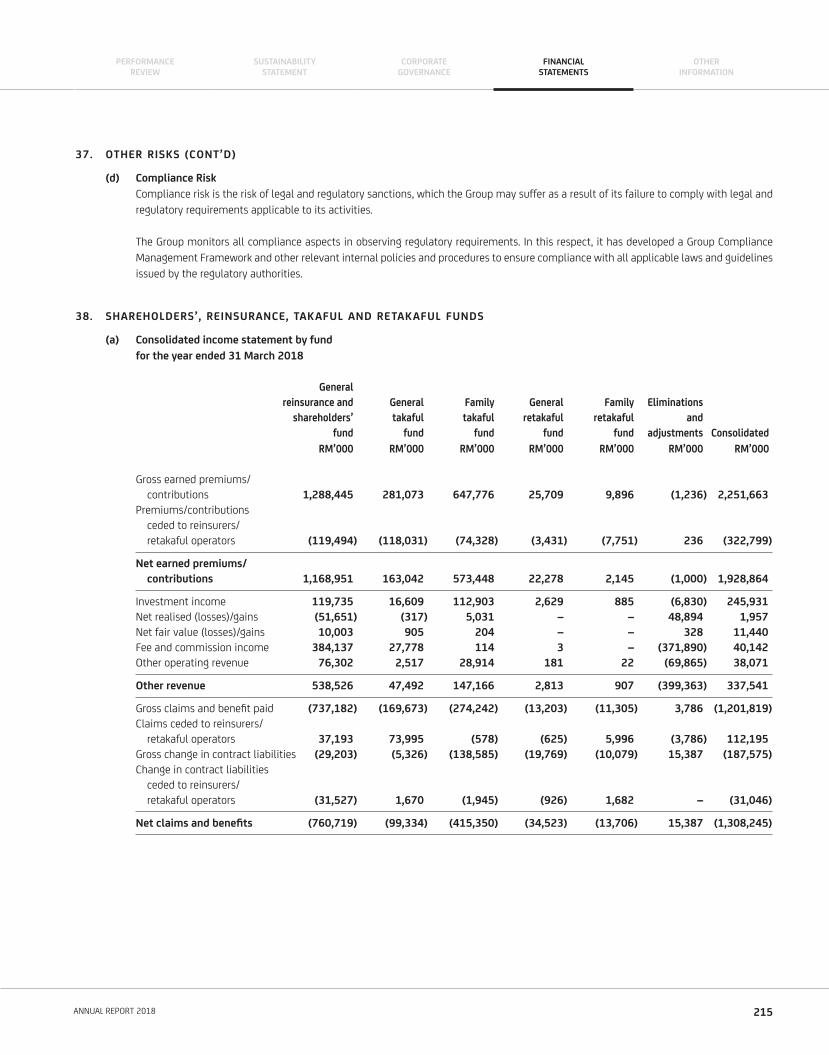
37. OTHER RISKS (CONT’D)
(d) Compliance Risk
Compliance risk is the risk of legal and regulatory sanctions, which the Group may suffer as a result of its failure to comply with legal and
regulatory requirements applicable to its activities.
The Group monitors all compliance aspects in observing regulatory requirements. In this respect, it has developed a Group Compliance
Management Framework and other relevant internal policies and procedures to ensure compliance with all applicable laws and guidelines
issued by the regulatory authorities.
38. SHAREHOLDERS’, REINSURANCE, TAKAFUL AND RETAKAFUL FUNDS
(a) Consolidated income statement by fund
for the year ended 31 March 2018
General
reinsurance and General Family General Family Eliminations
shareholders’ takaful takaful retakaful retakaful and
fund fund fund fund fund adjustments Consolidated
RM’000 RM’000 RM’000 RM’000 RM’000 RM’000 RM’000
Gross earned premiums/
contributions 1,288,445 281,073 647,776 25,709 9,896 (1,236) 2,251,663
Premiums/contributions
ceded to reinsurers/
retakaful operators (119,494) (118,031) (74,328) (3,431) (7,751) 236 (322,799)
Net earned premiums/
contributions 1,168,951 163,042 573,448 22,278 2,145 (1,000) 1,928,864
Investment income 119,735 16,609 112,903 2,629 885 (6,830) 245,931
Net realised (losses)/gains (51,651) (317) 5,031 – – 48,894 1,957
Net fair value (losses)/gains 10,003 905 204 – – 328 11,440
Fee and commission income 384,137 27,778 114 3 – (371,890) 40,142
Other operating revenue 76,302 2,517 28,914 181 22 (69,865) 38,071
Other revenue 538,526 47,492 147,166 2,813 907 (399,363) 337,541
Gross claims and benefi t paid (737,182) (169,673) (274,242) (13,203) (11,305) 3,786 (1,201,819)
Claims ceded to reinsurers/
retakaful operators 37,193 73,995 (578) (625) 5,996 (3,786) 112,195
Gross change in contract liabilities (29,203) (5,326) (138,585) (19,769) (10,079) 15,387 (187,575)
Change in contract liabilities
ceded to reinsurers/
retakaful operators (31,527) 1,670 (1,945) (926) 1,682 – (31,046)
Net claims and benefi ts (760,719) (99,334) (415,350) (34,523) (13,706) 15,387 (1,308,245)
215ANNUAL REPORT 2018
PERFORMANCEREVIEW
CORPORATEGOVERNANCE
SUSTAINABILITYSTATEMENT
FINANCIALSTATEMENTS
OTHERINFORMATION
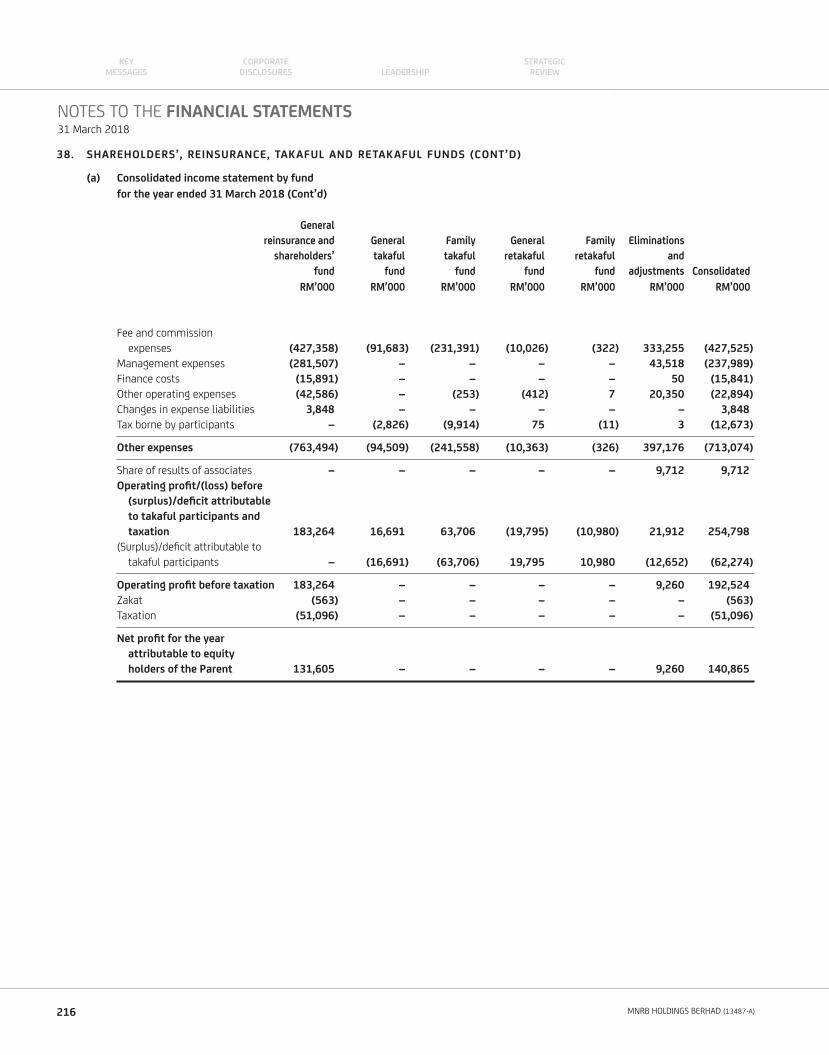
38. SHAREHOLDERS’, REINSURANCE, TAKAFUL AND RETAKAFUL FUNDS (CONT’D)
(a) Consolidated income statement by fund
for the year ended 31 March 2018 (Cont’d)
General
reinsurance and General Family General Family Eliminations
shareholders’ takaful takaful retakaful retakaful and
fund fund fund fund fund adjustments Consolidated
RM’000 RM’000 RM’000 RM’000 RM’000 RM’000 RM’000
Fee and commission
expenses (427,358) (91,683) (231,391) (10,026) (322) 333,255 (427,525)
Management expenses (281,507) – – – – 43,518 (237,989)
Finance costs (15,891) – – – – 50 (15,841)
Other operating expenses (42,586) – (253) (412) 7 20,350 (22,894)
Changes in expense liabilities 3,848 – – – – – 3,848
Tax borne by participants – (2,826) (9,914) 75 (11) 3 (12,673)
Other expenses (763,494) (94,509) (241,558) (10,363) (326) 397,176 (713,074)
Share of results of associates – – – – – 9,712 9,712
Operating profi t/(loss) before
(surplus)/defi cit attributable
to takaful participants and
taxation 183,264 16,691 63,706 (19,795) (10,980) 21,912 254,798
(Surplus)/defi cit attributable to
takaful participants – (16,691) (63,706) 19,795 10,980 (12,652) (62,274)
Operating profi t before taxation 183,264 – – – – 9,260 192,524
Zakat (563) – – – – – (563)
Taxation (51,096) – – – – – (51,096)
Net profi t for the year
attributable to equity
holders of the Parent 131,605 – – – – 9,260 140,865
NOTES TO THE FINANCIAL STATEMENTS31 March 2018
216 MNRB HOLDINGS BERHAD (13487-A)
KEYMESSAGES LEADERSHIP
CORPORATE DISCLOSURES
STRATEGICREVIEW
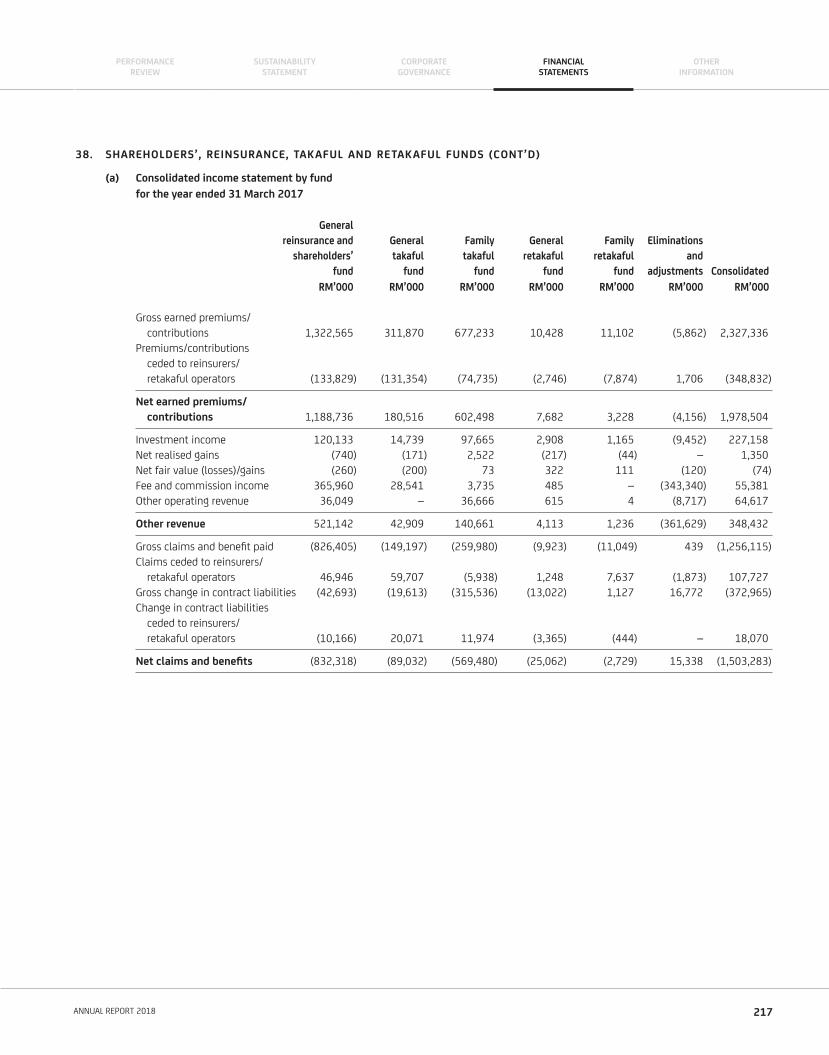
38. SHAREHOLDERS’, REINSURANCE, TAKAFUL AND RETAKAFUL FUNDS (CONT’D)
(a) Consolidated income statement by fund
for the year ended 31 March 2017
General
reinsurance and General Family General Family Eliminations
shareholders’ takaful takaful retakaful retakaful and
fund fund fund fund fund adjustments Consolidated
RM’000 RM’000 RM’000 RM’000 RM’000 RM’000 RM’000
Gross earned premiums/
contributions 1,322,565 311,870 677,233 10,428 11,102 (5,862) 2,327,336
Premiums/contributions
ceded to reinsurers/
retakaful operators (133,829) (131,354) (74,735) (2,746) (7,874) 1,706 (348,832)
Net earned premiums/
contributions 1,188,736 180,516 602,498 7,682 3,228 (4,156) 1,978,504
Investment income 120,133 14,739 97,665 2,908 1,165 (9,452) 227,158
Net realised gains (740) (171) 2,522 (217) (44) – 1,350
Net fair value (losses)/gains (260) (200) 73 322 111 (120) (74)
Fee and commission income 365,960 28,541 3,735 485 – (343,340) 55,381
Other operating revenue 36,049 – 36,666 615 4 (8,717) 64,617
Other revenue 521,142 42,909 140,661 4,113 1,236 (361,629) 348,432
Gross claims and benefi t paid (826,405) (149,197) (259,980) (9,923) (11,049) 439 (1,256,115)
Claims ceded to reinsurers/
retakaful operators 46,946 59,707 (5,938) 1,248 7,637 (1,873) 107,727
Gross change in contract liabilities (42,693) (19,613) (315,536) (13,022) 1,127 16,772 (372,965)
Change in contract liabilities
ceded to reinsurers/
retakaful operators (10,166) 20,071 11,974 (3,365) (444) – 18,070
Net claims and benefi ts (832,318) (89,032) (569,480) (25,062) (2,729) 15,338 (1,503,283)
217ANNUAL REPORT 2018
PERFORMANCEREVIEW
CORPORATEGOVERNANCE
SUSTAINABILITYSTATEMENT
FINANCIALSTATEMENTS
OTHERINFORMATION
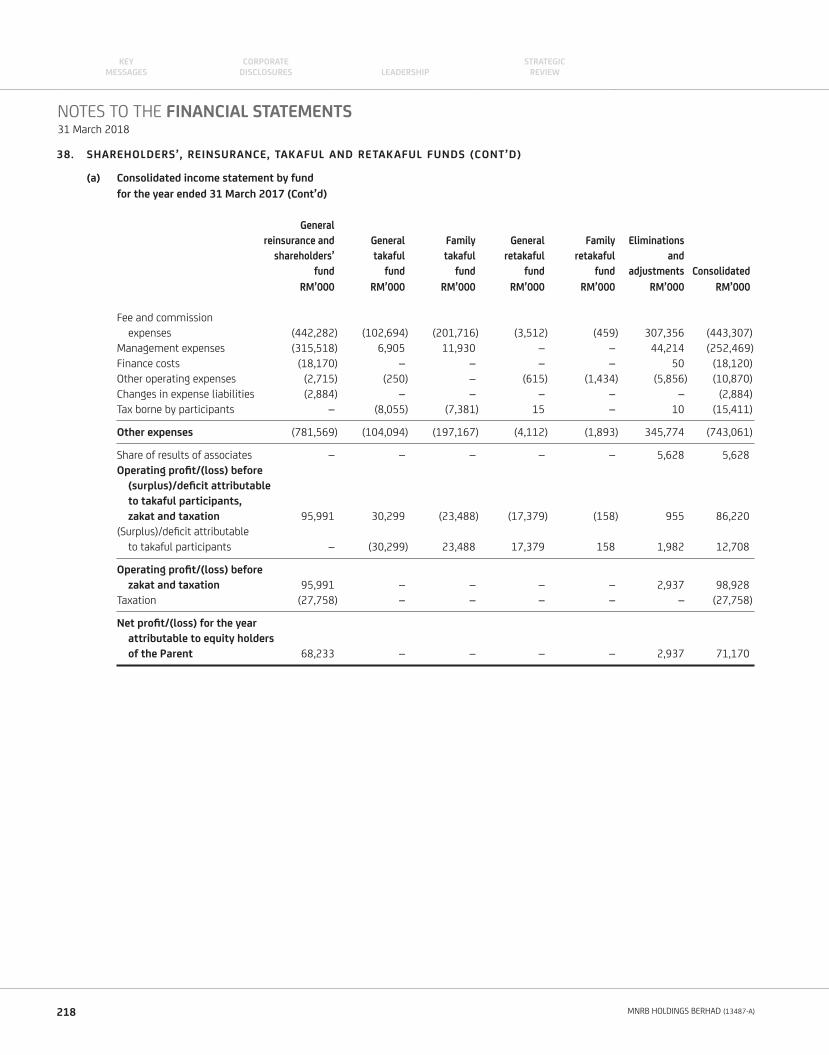
38. SHAREHOLDERS’, REINSURANCE, TAKAFUL AND RETAKAFUL FUNDS (CONT’D)
(a) Consolidated income statement by fund
for the year ended 31 March 2017 (Cont’d)
General
reinsurance and General Family General Family Eliminations
shareholders’ takaful takaful retakaful retakaful and
fund fund fund fund fund adjustments Consolidated
RM’000 RM’000 RM’000 RM’000 RM’000 RM’000 RM’000
Fee and commission
expenses (442,282) (102,694) (201,716) (3,512) (459) 307,356 (443,307)
Management expenses (315,518) 6,905 11,930 – – 44,214 (252,469)
Finance costs (18,170) – – – – 50 (18,120)
Other operating expenses (2,715) (250) – (615) (1,434) (5,856) (10,870)
Changes in expense liabilities (2,884) – – – – – (2,884)
Tax borne by participants – (8,055) (7,381) 15 – 10 (15,411)
Other expenses (781,569) (104,094) (197,167) (4,112) (1,893) 345,774 (743,061)
Share of results of associates – – – – – 5,628 5,628
Operating profi t/(loss) before
(surplus)/defi cit attributable
to takaful participants,
zakat and taxation 95,991 30,299 (23,488) (17,379) (158) 955 86,220
(Surplus)/defi cit attributable
to takaful participants – (30,299) 23,488 17,379 158 1,982 12,708
Operating profi t/(loss) before
zakat and taxation 95,991 – – – – 2,937 98,928
Taxation (27,758) – – – – – (27,758)
Net profi t/(loss) for the year
attributable to equity holders
of the Parent 68,233 – – – – 2,937 71,170
NOTES TO THE FINANCIAL STATEMENTS31 March 2018
218 MNRB HOLDINGS BERHAD (13487-A)
KEYMESSAGES LEADERSHIP
CORPORATE DISCLOSURES
STRATEGICREVIEW
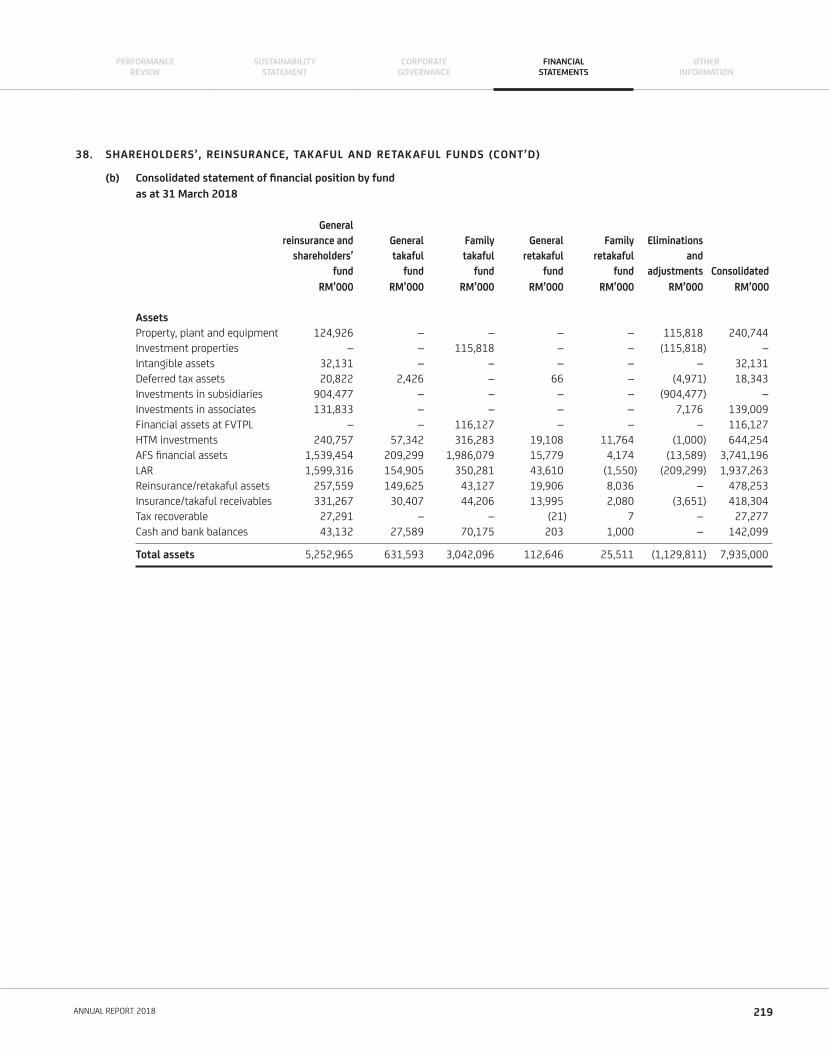
38. SHAREHOLDERS’, REINSURANCE, TAKAFUL AND RETAKAFUL FUNDS (CONT’D)
(b) Consolidated statement of fi nancial position by fund
as at 31 March 2018
General
reinsurance and General Family General Family Eliminations
shareholders’ takaful takaful retakaful retakaful and
fund fund fund fund fund adjustments Consolidated
RM’000 RM’000 RM’000 RM’000 RM’000 RM’000 RM’000
Assets
Property, plant and equipment 124,926 – – – – 115,818 240,744
Investment properties – – 115,818 – – (115,818) –
Intangible assets 32,131 – – – – – 32,131
Deferred tax assets 20,822 2,426 – 66 – (4,971) 18,343
Investments in subsidiaries 904,477 – – – – (904,477) –
Investments in associates 131,833 – – – – 7,176 139,009
Financial assets at FVTPL – – 116,127 – – – 116,127
HTM investments 240,757 57,342 316,283 19,108 11,764 (1,000) 644,254
AFS fi nancial assets 1,539,454 209,299 1,986,079 15,779 4,174 (13,589) 3,741,196
LAR 1,599,316 154,905 350,281 43,610 (1,550) (209,299) 1,937,263
Reinsurance/retakaful assets 257,559 149,625 43,127 19,906 8,036 – 478,253
Insurance/takaful receivables 331,267 30,407 44,206 13,995 2,080 (3,651) 418,304
Tax recoverable 27,291 – – (21) 7 – 27,277
Cash and bank balances 43,132 27,589 70,175 203 1,000 – 142,099
Total assets 5,252,965 631,593 3,042,096 112,646 25,511 (1,129,811) 7,935,000
219ANNUAL REPORT 2018
PERFORMANCEREVIEW
CORPORATEGOVERNANCE
SUSTAINABILITYSTATEMENT
FINANCIALSTATEMENTS
OTHERINFORMATION
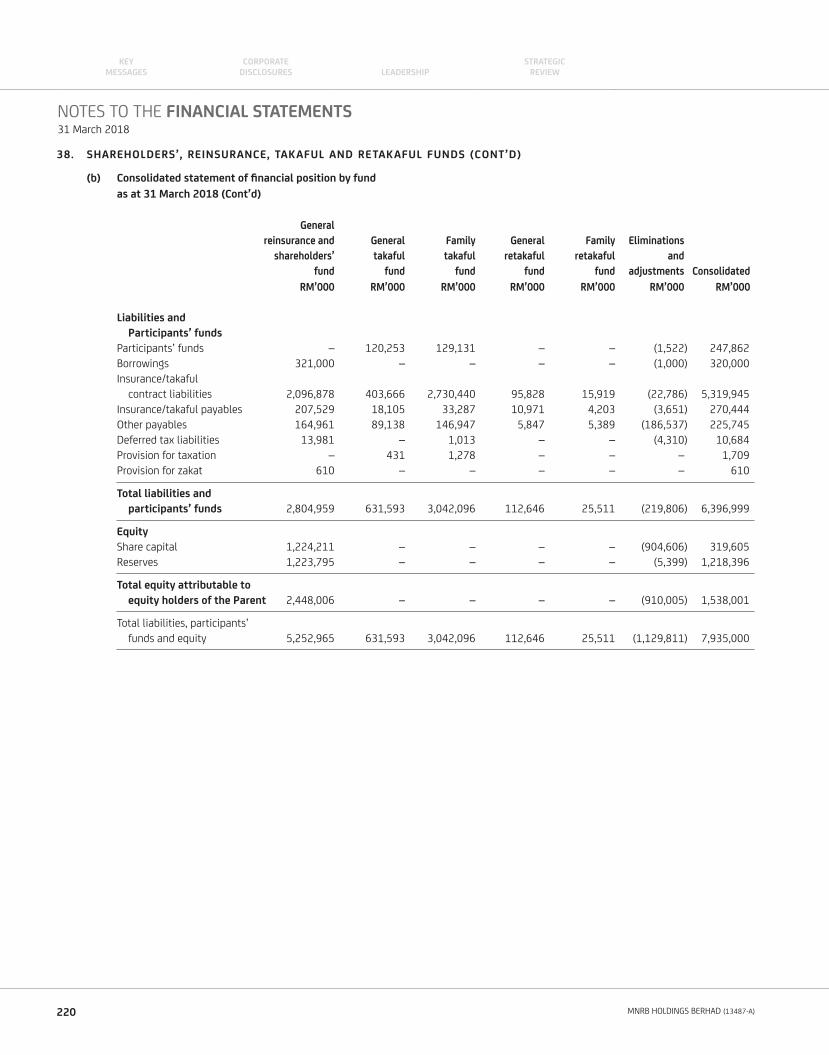
38. SHAREHOLDERS’, REINSURANCE, TAKAFUL AND RETAKAFUL FUNDS (CONT’D)
(b) Consolidated statement of fi nancial position by fund
as at 31 March 2018 (Cont’d)
General
reinsurance and General Family General Family Eliminations
shareholders’ takaful takaful retakaful retakaful and
fund fund fund fund fund adjustments Consolidated
RM’000 RM’000 RM’000 RM’000 RM’000 RM’000 RM’000
Liabilities and
Participants’ funds
Participants’ funds – 120,253 129,131 – – (1,522) 247,862
Borrowings 321,000 – – – – (1,000) 320,000
Insurance/takaful
contract liabilities 2,096,878 403,666 2,730,440 95,828 15,919 (22,786) 5,319,945
Insurance/takaful payables 207,529 18,105 33,287 10,971 4,203 (3,651) 270,444
Other payables 164,961 89,138 146,947 5,847 5,389 (186,537) 225,745
Deferred tax liabilities 13,981 – 1,013 – – (4,310) 10,684
Provision for taxation – 431 1,278 – – – 1,709
Provision for zakat 610 – – – – – 610
Total liabilities and
participants’ funds 2,804,959 631,593 3,042,096 112,646 25,511 (219,806) 6,396,999
Equity
Share capital 1,224,211 – – – – (904,606) 319,605
Reserves 1,223,795 – – – – (5,399) 1,218,396
Total equity attributable to
equity holders of the Parent 2,448,006 – – – – (910,005) 1,538,001
Total liabilities, participants’
funds and equity 5,252,965 631,593 3,042,096 112,646 25,511 (1,129,811) 7,935,000
NOTES TO THE FINANCIAL STATEMENTS31 March 2018
220 MNRB HOLDINGS BERHAD (13487-A)
KEYMESSAGES LEADERSHIP
CORPORATE DISCLOSURES
STRATEGICREVIEW
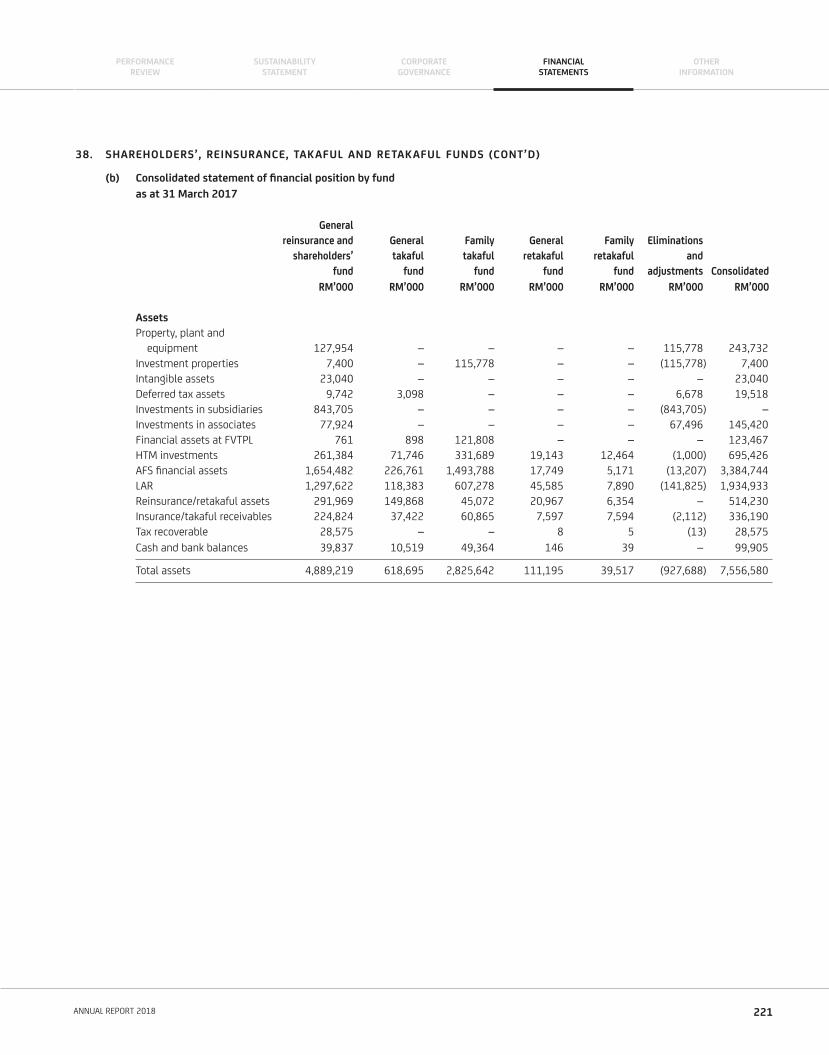
38. SHAREHOLDERS’, REINSURANCE, TAKAFUL AND RETAKAFUL FUNDS (CONT’D)
(b) Consolidated statement of fi nancial position by fund
as at 31 March 2017
General
reinsurance and General Family General Family Eliminations
shareholders’ takaful takaful retakaful retakaful and
fund fund fund fund fund adjustments Consolidated
RM’000 RM’000 RM’000 RM’000 RM’000 RM’000 RM’000
Assets
Property, plant and
equipment 127,954 – – – – 115,778 243,732
Investment properties 7,400 – 115,778 – – (115,778) 7,400
Intangible assets 23,040 – – – – – 23,040
Deferred tax assets 9,742 3,098 – – – 6,678 19,518
Investments in subsidiaries 843,705 – – – – (843,705) –
Investments in associates 77,924 – – – – 67,496 145,420
Financial assets at FVTPL 761 898 121,808 – – – 123,467
HTM investments 261,384 71,746 331,689 19,143 12,464 (1,000) 695,426
AFS fi nancial assets 1,654,482 226,761 1,493,788 17,749 5,171 (13,207) 3,384,744
LAR 1,297,622 118,383 607,278 45,585 7,890 (141,825) 1,934,933
Reinsurance/retakaful assets 291,969 149,868 45,072 20,967 6,354 – 514,230
Insurance/takaful receivables 224,824 37,422 60,865 7,597 7,594 (2,112) 336,190
Tax recoverable 28,575 – – 8 5 (13) 28,575
Cash and bank balances 39,837 10,519 49,364 146 39 – 99,905
Total assets 4,889,219 618,695 2,825,642 111,195 39,517 (927,688) 7,556,580
221ANNUAL REPORT 2018
PERFORMANCEREVIEW
CORPORATEGOVERNANCE
SUSTAINABILITYSTATEMENT
FINANCIALSTATEMENTS
OTHERINFORMATION
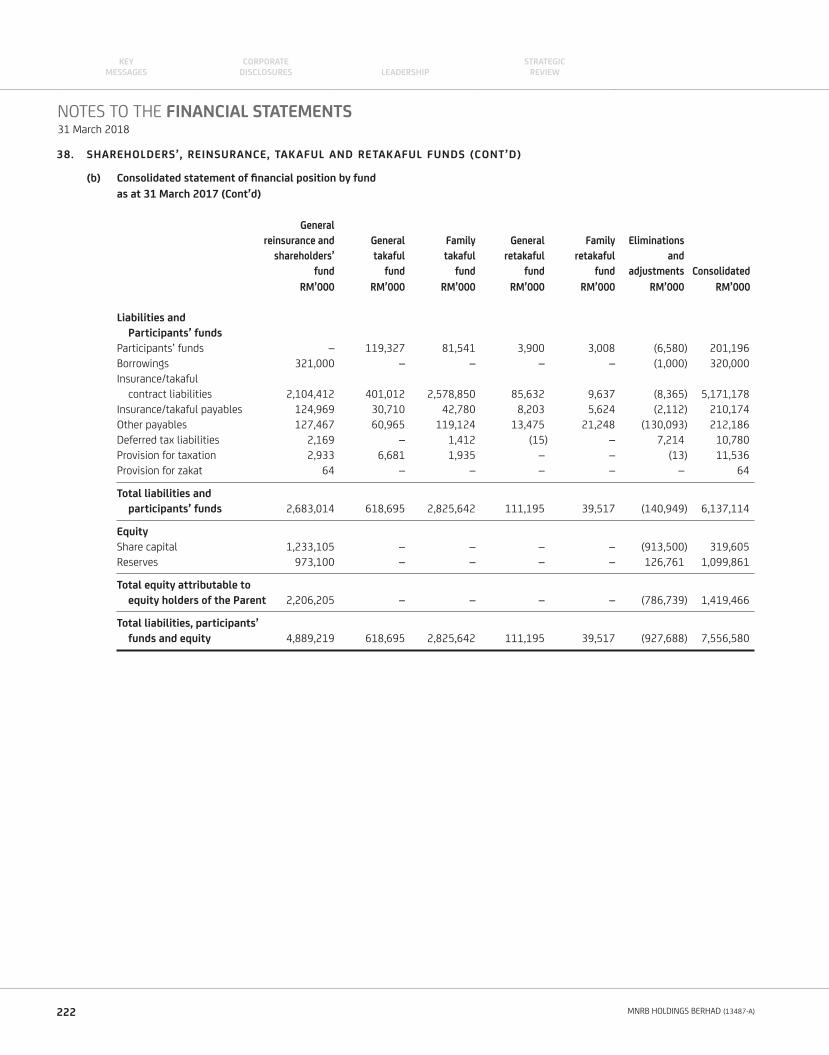
38. SHAREHOLDERS’, REINSURANCE, TAKAFUL AND RETAKAFUL FUNDS (CONT’D)
(b) Consolidated statement of fi nancial position by fund
as at 31 March 2017 (Cont’d)
General
reinsurance and General Family General Family Eliminations
shareholders’ takaful takaful retakaful retakaful and
fund fund fund fund fund adjustments Consolidated
RM’000 RM’000 RM’000 RM’000 RM’000 RM’000 RM’000
Liabilities and
Participants’ funds
Participants’ funds – 119,327 81,541 3,900 3,008 (6,580) 201,196
Borrowings 321,000 – – – – (1,000) 320,000
Insurance/takaful
contract liabilities 2,104,412 401,012 2,578,850 85,632 9,637 (8,365) 5,171,178
Insurance/takaful payables 124,969 30,710 42,780 8,203 5,624 (2,112) 210,174
Other payables 127,467 60,965 119,124 13,475 21,248 (130,093) 212,186
Deferred tax liabilities 2,169 – 1,412 (15) – 7,214 10,780
Provision for taxation 2,933 6,681 1,935 – – (13) 11,536
Provision for zakat 64 – – – – – 64
Total liabilities and
participants’ funds 2,683,014 618,695 2,825,642 111,195 39,517 (140,949) 6,137,114
Equity
Share capital 1,233,105 – – – – (913,500) 319,605
Reserves 973,100 – – – – 126,761 1,099,861
Total equity attributable to
equity holders of the Parent 2,206,205 – – – – (786,739) 1,419,466
Total liabilities, participants’
funds and equity 4,889,219 618,695 2,825,642 111,195 39,517 (927,688) 7,556,580
NOTES TO THE FINANCIAL STATEMENTS31 March 2018
222 MNRB HOLDINGS BERHAD (13487-A)
KEYMESSAGES LEADERSHIP
CORPORATE DISCLOSURES
STRATEGICREVIEW
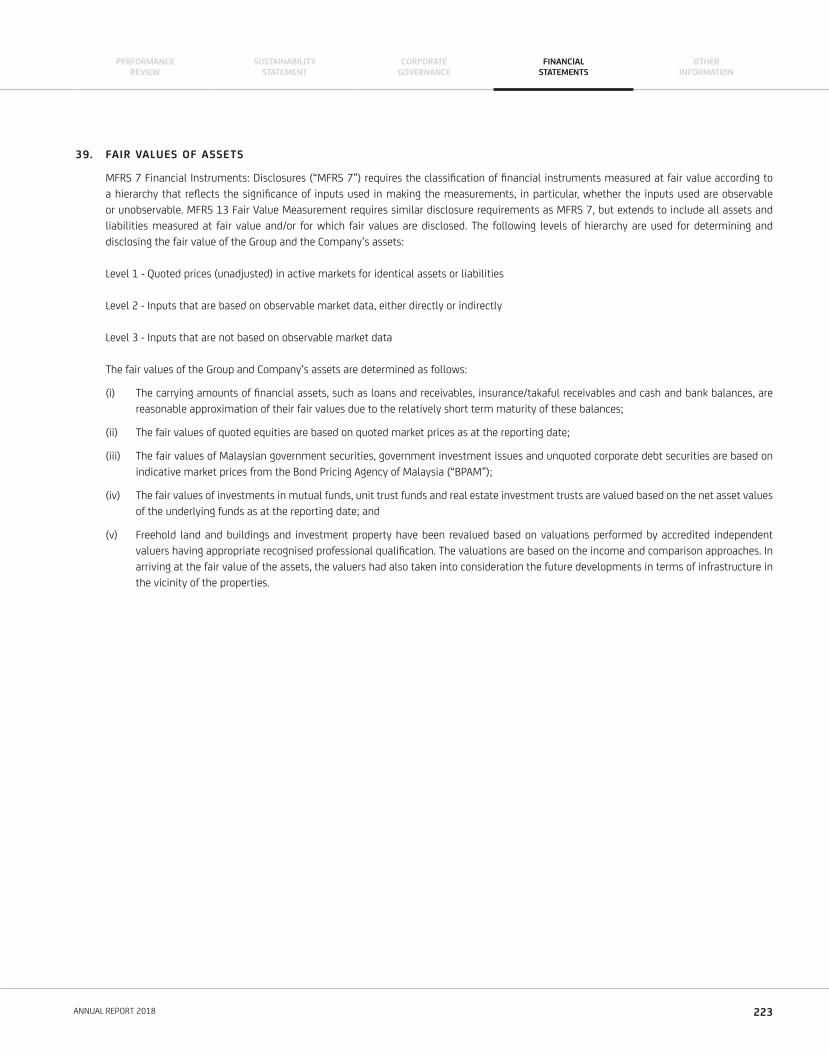
39. FAIR VALUES OF ASSETS
MFRS 7 Financial Instruments: Disclosures (“MFRS 7”) requires the classifi cation of fi nancial instruments measured at fair value according to
a hierarchy that refl ects the signifi cance of inputs used in making the measurements, in particular, whether the inputs used are observable
or unobservable. MFRS 13 Fair Value Measurement requires similar disclosure requirements as MFRS 7, but extends to include all assets and
liabilities measured at fair value and/or for which fair values are disclosed. The following levels of hierarchy are used for determining and
disclosing the fair value of the Group and the Company’s assets:
Level 1 - Quoted prices (unadjusted) in active markets for identical assets or liabilities
Level 2 - Inputs that are based on observable market data, either directly or indirectly
Level 3 - Inputs that are not based on observable market data
The fair values of the Group and Company’s assets are determined as follows:
(i) The carrying amounts of fi nancial assets, such as loans and receivables, insurance/takaful receivables and cash and bank balances, are
reasonable approximation of their fair values due to the relatively short term maturity of these balances;
(ii) The fair values of quoted equities are based on quoted market prices as at the reporting date;
(iii) The fair values of Malaysian government securities, government investment issues and unquoted corporate debt securities are based on
indicative market prices from the Bond Pricing Agency of Malaysia (“BPAM”);
(iv) The fair values of investments in mutual funds, unit trust funds and real estate investment trusts are valued based on the net asset values
of the underlying funds as at the reporting date; and
(v) Freehold land and buildings and investment property have been revalued based on valuations performed by accredited independent
valuers having appropriate recognised professional qualifi cation. The valuations are based on the income and comparison approaches. In
arriving at the fair value of the assets, the valuers had also taken into consideration the future developments in terms of infrastructure in
the vicinity of the properties.
223ANNUAL REPORT 2018
PERFORMANCEREVIEW
CORPORATEGOVERNANCE
SUSTAINABILITYSTATEMENT
FINANCIALSTATEMENTS
OTHERINFORMATION
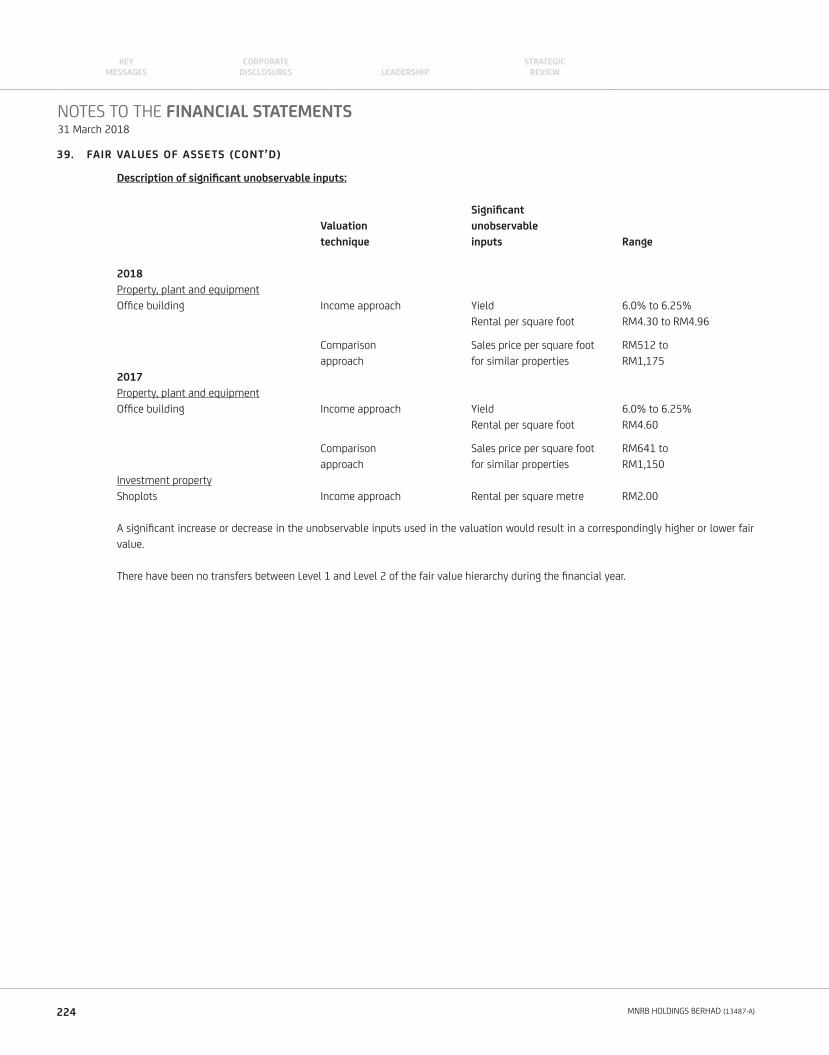
39. FAIR VALUES OF ASSETS (CONT’D)
Description of signifi cant unobservable inputs:
Signifi cant
Valuation unobservable
technique inputs Range
2018
Property, plant and equipment
Offi ce building Income approach Yield 6.0% to 6.25%
Rental per square foot RM4.30 to RM4.96
Comparison Sales price per square foot RM512 to
approach for similar properties RM1,175
2017
Property, plant and equipment
Offi ce building Income approach Yield 6.0% to 6.25%
Rental per square foot RM4.60
Comparison Sales price per square foot RM641 to
approach for similar properties RM1,150
Investment property
Shoplots Income approach Rental per square metre RM2.00
A signifi cant increase or decrease in the unobservable inputs used in the valuation would result in a correspondingly higher or lower fair
value.
There have been no transfers between Level 1 and Level 2 of the fair value hierarchy during the fi nancial year.
NOTES TO THE FINANCIAL STATEMENTS31 March 2018
224 MNRB HOLDINGS BERHAD (13487-A)
KEYMESSAGES LEADERSHIP
CORPORATE DISCLOSURES
STRATEGICREVIEW
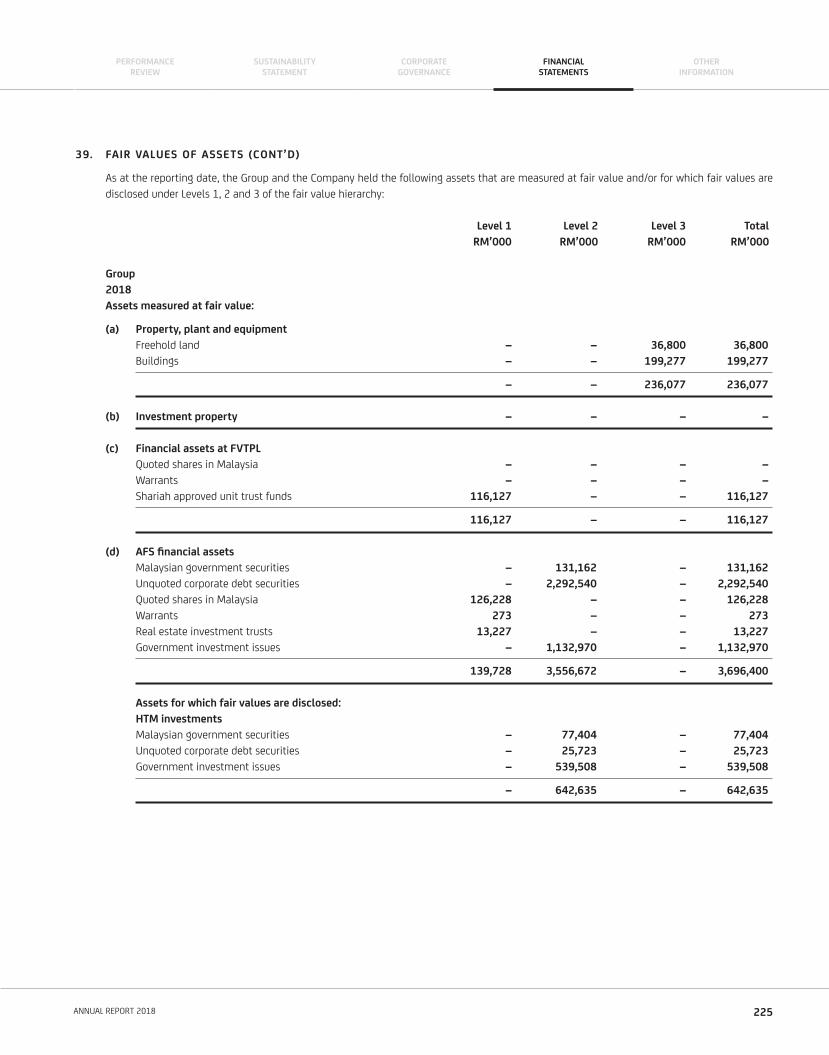
39. FAIR VALUES OF ASSETS (CONT’D)
As at the reporting date, the Group and the Company held the following assets that are measured at fair value and/or for which fair values are
disclosed under Levels 1, 2 and 3 of the fair value hierarchy:
Level 1 Level 2 Level 3 Total
RM’000 RM’000 RM’000 RM’000
Group
2018
Assets measured at fair value:
(a) Property, plant and equipment
Freehold land – – 36,800 36,800
Buildings – – 199,277 199,277
– – 236,077 236,077
(b) Investment property – – – –
(c) Financial assets at FVTPL
Quoted shares in Malaysia – – – –
Warrants – – – –
Shariah approved unit trust funds 116,127 – – 116,127
116,127 – – 116,127
(d) AFS fi nancial assets
Malaysian government securities – 131,162 – 131,162
Unquoted corporate debt securities – 2,292,540 – 2,292,540
Quoted shares in Malaysia 126,228 – – 126,228
Warrants 273 – – 273
Real estate investment trusts 13,227 – – 13,227
Government investment issues – 1,132,970 – 1,132,970
139,728 3,556,672 – 3,696,400
Assets for which fair values are disclosed:
HTM investments
Malaysian government securities – 77,404 – 77,404
Unquoted corporate debt securities – 25,723 – 25,723
Government investment issues – 539,508 – 539,508
– 642,635 – 642,635
225ANNUAL REPORT 2018
PERFORMANCEREVIEW
CORPORATEGOVERNANCE
SUSTAINABILITYSTATEMENT
FINANCIALSTATEMENTS
OTHERINFORMATION
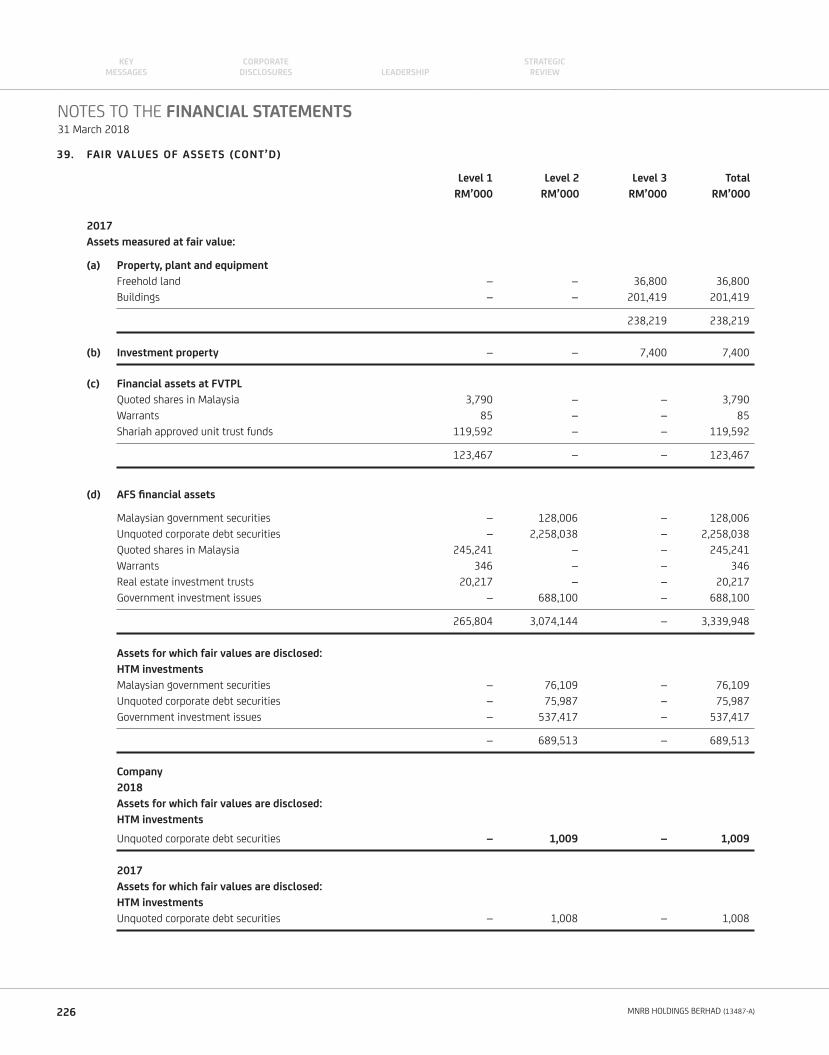
39. FAIR VALUES OF ASSETS (CONT’D)
Level 1 Level 2 Level 3 Total
RM’000 RM’000 RM’000 RM’000
2017
Assets measured at fair value:
(a) Property, plant and equipment
Freehold land – – 36,800 36,800
Buildings – – 201,419 201,419
238,219 238,219
(b) Investment property – – 7,400 7,400
(c) Financial assets at FVTPL
Quoted shares in Malaysia 3,790 – – 3,790
Warrants 85 – – 85
Shariah approved unit trust funds 119,592 – – 119,592
123,467 – – 123,467
(d) AFS fi nancial assets
Malaysian government securities – 128,006 – 128,006
Unquoted corporate debt securities – 2,258,038 – 2,258,038
Quoted shares in Malaysia 245,241 – – 245,241
Warrants 346 – – 346
Real estate investment trusts 20,217 – – 20,217
Government investment issues – 688,100 – 688,100
265,804 3,074,144 – 3,339,948
Assets for which fair values are disclosed:
HTM investments
Malaysian government securities – 76,109 – 76,109
Unquoted corporate debt securities – 75,987 – 75,987
Government investment issues – 537,417 – 537,417
– 689,513 – 689,513
Company
2018
Assets for which fair values are disclosed:
HTM investments
Unquoted corporate debt securities – 1,009 – 1,009
2017
Assets for which fair values are disclosed:
HTM investments
Unquoted corporate debt securities – 1,008 – 1,008
NOTES TO THE FINANCIAL STATEMENTS31 March 2018
226 MNRB HOLDINGS BERHAD (13487-A)
KEYMESSAGES LEADERSHIP
CORPORATE DISCLOSURES
STRATEGICREVIEW
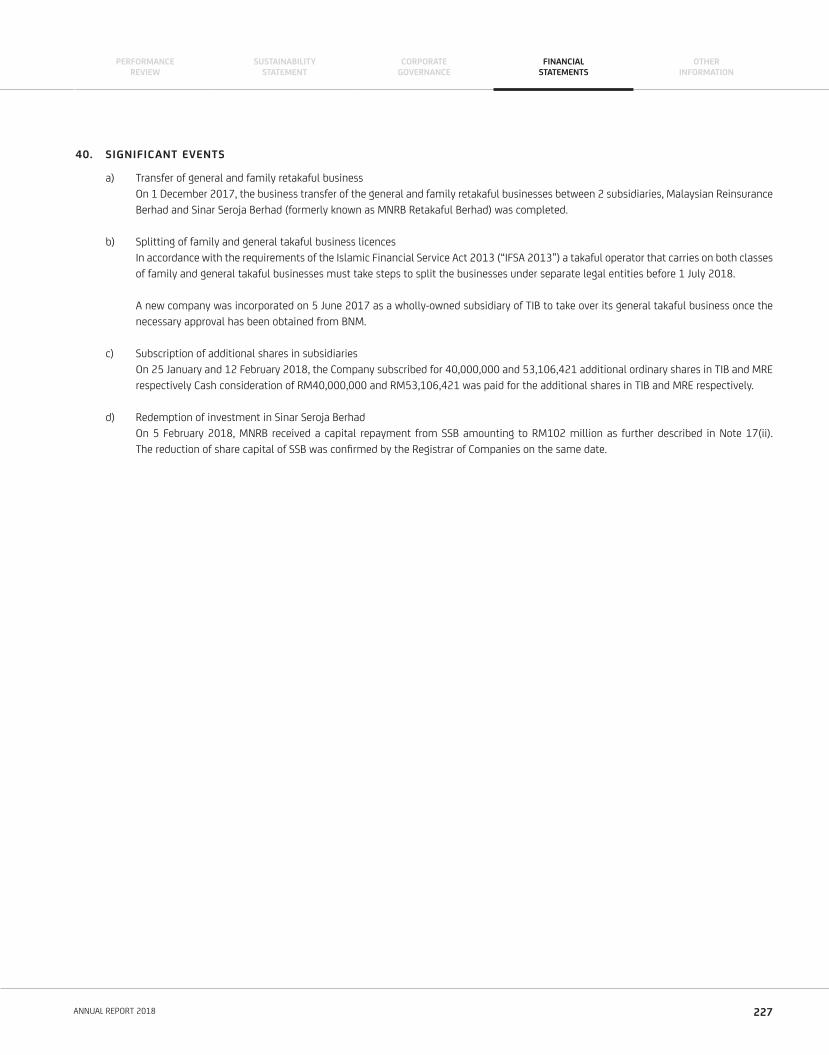
40. SIGNIFICANT EVENTS
a) Transfer of general and family retakaful business
On 1 December 2017, the business transfer of the general and family retakaful businesses between 2 subsidiaries, Malaysian Reinsurance
Berhad and Sinar Seroja Berhad (formerly known as MNRB Retakaful Berhad) was completed.
b) Splitting of family and general takaful business licences
In accordance with the requirements of the Islamic Financial Service Act 2013 (“IFSA 2013”) a takaful operator that carries on both classes
of family and general takaful businesses must take steps to split the businesses under separate legal entities before 1 July 2018.
A new company was incorporated on 5 June 2017 as a wholly-owned subsidiary of TIB to take over its general takaful business once the
necessary approval has been obtained from BNM.
c) Subscription of additional shares in subsidiaries
On 25 January and 12 February 2018, the Company subscribed for 40,000,000 and 53,106,421 additional ordinary shares in TIB and MRE
respectively Cash consideration of RM40,000,000 and RM53,106,421 was paid for the additional shares in TIB and MRE respectively.
d) Redemption of investment in Sinar Seroja Berhad
On 5 February 2018, MNRB received a capital repayment from SSB amounting to RM102 million as further described in Note 17(ii).
The reduction of share capital of SSB was confi rmed by the Registrar of Companies on the same date.
227ANNUAL REPORT 2018
PERFORMANCEREVIEW
CORPORATEGOVERNANCE
SUSTAINABILITYSTATEMENT
FINANCIALSTATEMENTS
OTHERINFORMATION
![Takaful Insurance final for print out [Read-Only]€¦ · What is Takaful Insurance ? • Takaful—“bear ye one another’s burden.” Takaful insurance is based on the concept](https://img.pdfslide.us/doc/110x75/5f09a9447e708231d427e84c/takaful-insurance-final-for-print-out-read-only-what-is-takaful-insurance-a.jpg)