Embed Size (px)
Citation preview

Financial Statements June 30, 2016 American Indian College Fund (With Comparative Totals for 2015)
American Indian College Fund Table of Contents
June 30, 2016
Independent Auditor’s Report .................................................................................................................................... 1
Financial Statements
Statement of Financial Position ........................................................................................................................... 3 Statement of Activities ........................................................................................................................................ 4 Statement of Functional Expenses ....................................................................................................................... 5 Statement of Cash Flows ..................................................................................................................................... 6 Notes to Financial Statements ............................................................................................................................. 7

www.eidebai l ly.com
440 Indiana St., Ste. 200 | Golden, CO 80401-5021 | TF 877.882.7929 | T 303.986.2454 | F 303.980.5029 | EOE
1
Independent Auditor’s Report The Board of Trustees American Indian College Fund Denver, Colorado Report on the Financial Statements We have audited the accompanying financial statements of American Indian College Fund which comprise the statement of financial position as of June 30, 2016, and the related statements of activities, functional expenses, and cash flows for the year then ended, and the related notes to the financial statements. Management’s Responsibility for the Financial Statements Management is responsible for the preparation and fair presentation of these financial statements in accordance with accounting principles generally accepted in the United States of America; this includes the design, implementation, and maintenance of internal control relevant to the preparation and fair presentation of financial statements that are free from material misstatement, whether due to fraud or error. Auditor’s Responsibility Our responsibility is to express an opinion on these financial statements based on our audit. We conducted our audit in accordance with auditing standards generally accepted in the United States of America. Those standards require that we plan and perform the audit to obtain reasonable assurance about whether the financial statements are free from material misstatement. An audit involves performing procedures to obtain audit evidence about the amounts and disclosures in the financial statements. The procedures selected depend on the auditor’s judgment, including the assessment of the risks of material misstatement of the financial statements, whether due to fraud or error. In making those risk assessments, the auditor considers internal control relevant to the entity’s preparation and fair presentation of the financial statements in order to design audit procedures that are appropriate in the circumstances, but not for the purpose of expressing an opinion on the effectiveness of the entity’s internal control. Accordingly, we express no such opinion. An audit also includes evaluating the appropriateness of accounting policies used and the reasonableness of significant accounting estimates made by management, as well as evaluating the overall presentation of the financial statements. We believe that the audit evidence we have obtained is sufficient and appropriate to provide a basis for our audit opinion. Opinion In our opinion, the financial statements referred to above present fairly, in all material respects, the financial position of American Indian College Fund as of June 30, 2016, and the changes in its net assets and its cash flows for the year then ended in accordance with accounting principles generally accepted in the United States of America.

2
Report on Summarized Comparative Information We have previously audited American Indian College Fund’s 2015 financial statements, and we expressed an unmodified audit opinion on those audited financial statements in our report dated October 6, 2015. In our opinion, the summarized comparative information presented herein as of and for the year ended June 30, 2015 is consistent, in all material respects, with the audited financial statements from which it has been derived.
Golden, Colorado October 15, 2016

See Notes to Financial Statements 3
American Indian College Fund Statement of Financial Position
June 30, 2016 (with comparative totals for 2015)
2016 2015Assets
Cash and cash equivalents 2,306,446$ 1,836,950$ Operating investments 13,570,841 17,724,545 Prepaid expenses and other assets 165,267 129,916 Promises to give, net 6,002,046 4,318,228 Donated assets held for resale 42,492 42,842 Property and equipment, net 2,165,029 955,673 Investments held for others 600,292 622,390 Endowment
Cash and cash equivalents 118,821 1,180,003 Promises to give, net 416,200 69,000 Investments 49,332,624 46,008,513
Total assets 74,720,058$ 72,888,060$
Liabilities and Net AssetsAccounts payable and accrued expenses 525,772$ 646,674$ Investments held for others 600,292 622,390
Total liabilities 1,126,064 1,269,064
Net AssetsUnrestricted
Undesignated 7,842,965 12,788,809 Board-designated endowment 16,448,395 14,026,127
24,291,360 26,814,936 Temporarily restricted 21,124,209 17,623,789 Permanently restricted 28,178,425 27,180,271
Total net assets 73,593,994 71,618,996 Total liabilities and net assets 74,720,058$ 72,888,060$
See Notes to Financial Statements 4
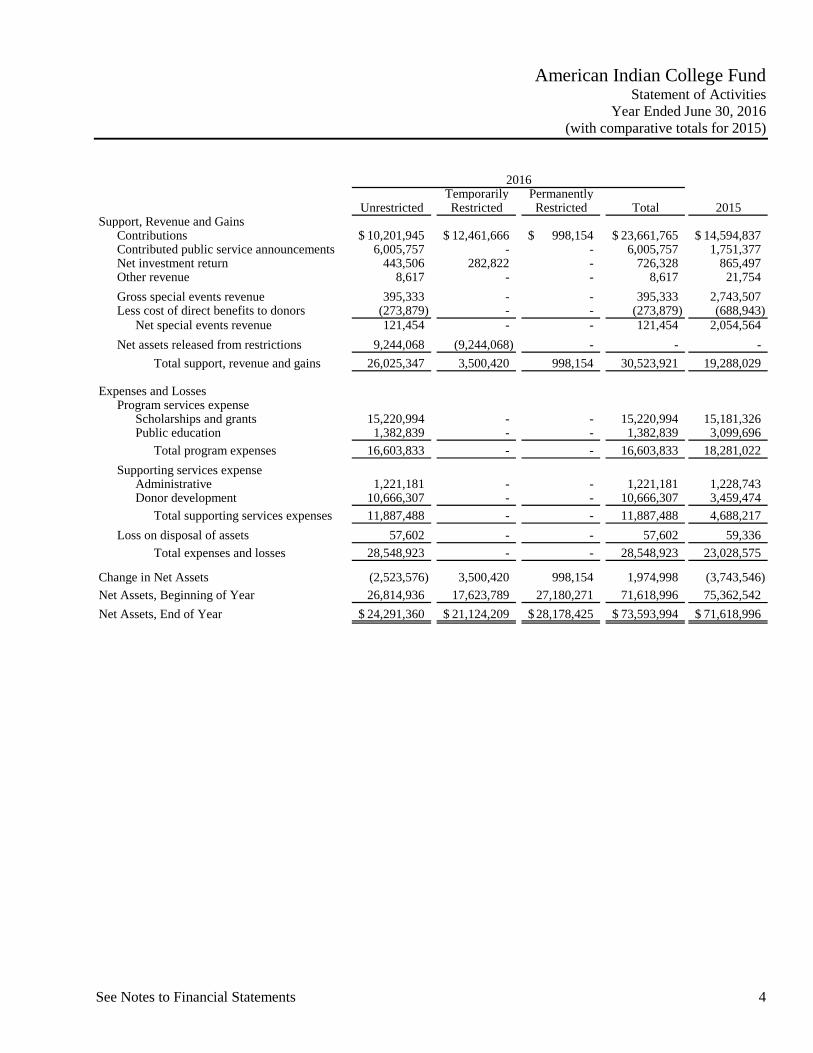
American Indian College Fund Statement of Activities
Year Ended June 30, 2016 (with comparative totals for 2015)
Temporarily PermanentlyUnrestricted Restricted Restricted Total 2015
Support, Revenue and GainsContributions 10,201,945$ 12,461,666$ 998,154$ 23,661,765$ 14,594,837$ Contributed public service announcements 6,005,757 - - 6,005,757 1,751,377 Net investment return 443,506 282,822 - 726,328 865,497 Other revenue 8,617 - - 8,617 21,754 Gross special events revenue 395,333 - - 395,333 2,743,507 Less cost of direct benefits to donors (273,879) - - (273,879) (688,943)
Net special events revenue 121,454 - - 121,454 2,054,564 Net assets released from restrictions 9,244,068 (9,244,068) - - -
Total support, revenue and gains 26,025,347 3,500,420 998,154 30,523,921 19,288,029
Expenses and LossesProgram services expense
Scholarships and grants 15,220,994 - - 15,220,994 15,181,326 Public education 1,382,839 - - 1,382,839 3,099,696
Total program expenses 16,603,833 - - 16,603,833 18,281,022 Supporting services expense
Administrative 1,221,181 - - 1,221,181 1,228,743 Donor development 10,666,307 - - 10,666,307 3,459,474
Total supporting services expenses 11,887,488 - - 11,887,488 4,688,217 Loss on disposal of assets 57,602 - - 57,602 59,336
Total expenses and losses 28,548,923 - - 28,548,923 23,028,575
Change in Net Assets (2,523,576) 3,500,420 998,154 1,974,998 (3,743,546) Net Assets, Beginning of Year 26,814,936 17,623,789 27,180,271 71,618,996 75,362,542 Net Assets, End of Year 24,291,360$ 21,124,209$ 28,178,425$ 73,593,994$ 71,618,996$
2016

See Notes to Financial Statements 5
American Indian College Fund Statement of Functional Expenses
Year Ended June 30, 2016 (with comparative totals for 2015)
Scholarships and Grants Public Education Total Administrative
DonorDevelopment Total 2015
Salaries 1,216,341$ 353,265$ 1,569,606$ 516,162$ 1,142,907$ 3,228,675$ 3,010,426$ Payroll taxes and benefits 349,542 110,425 459,967 162,809 313,185 935,961 875,449 Scholarships and grants 12,849,254 58,925 12,908,179 500 5,720 12,914,399 12,910,980 Advertising and marketing 41,467 292,726 334,193 - 2,615,048 2,949,241 1,746,899 Professional fees 229,696 88,863 318,559 425,305 444,810 1,188,674 1,175,513 Building and equipment 44,889 10,251 55,140 41,696 28,165 125,001 82,097 Cost of direct benefits to donors - - - - 273,879 273,879 688,943 Travel and meals 164,184 38,532 202,716 63,696 169,345 435,757 576,346 Board meetings - - - 113,600 - 113,600 104,614 Office expenses 35,478 13,065 48,543 18,561 51,796 118,900 115,097 Publications, dues and subscriptions 41,839 17,058 58,897 11,902 12,032 82,831 93,057 Bank charges - - - 67,647 - 67,647 62,942 Programatic conferences 106,676 - 106,676 - - 106,676 98,835 Staff development - 2,631 2,631 55,062 17,772 75,465 73,075 Insurance 16,539 4,788 21,327 7,475 15,233 44,035 42,636 Other expenses 3,028 23,163 26,191 40,739 46,318 113,248 114,741 Information technology 64,258 12,764 77,022 12,956 84,325 174,303 137,448 Noncash expenses
Donated public service announcements - 339,953 339,953 - 5,665,804 6,005,757 2,043,159 Depreciation 57,803 16,430 74,233 24,034 53,847 152,114 78,580
Total expenses by function 15,220,994 1,382,839 16,603,833 1,562,144 10,940,186 29,106,163 24,030,837 Less expenses included with revenues
on the statement of activitiesCost of direct benefits to donors - - - - (273,879) (273,879) (688,943) Expense on rental property - - - - - - (14,665) Investment management fees - - - (340,963) - (340,963) (357,990)
Total expenses included in the expense section on the statement of activities 15,220,994$ 1,382,839$ 16,603,833$ 1,221,181$ 10,666,307$ 28,491,321$ 22,969,239$
Program Services2016

See Notes to Financial Statements 6
American Indian College Fund Statement of Cash Flows
Year Ended June 30, 2016 (with comparative totals for 2015)
2016 2015Cash Flows from Operating Activities
Change in net assets 1,974,998$ (3,743,546)$ Adjustments to reconcile change in net assets to net cashfrom (used for) operating activities
Depreciation 152,114 78,580 Realized and unrealized (gain) loss on operating investments (207,121) 22,147 Loss on disposal of assets 57,602 59,336 Contributed property and equipment capitalized - 1,722 Contributions restricted to endowment (998,154) (1,133,339) Endowment net investment return (331,346) (620,634)
Changes in operating assets and liabilitiesPromises to give, net (1,683,818) (1,550,207) Prepaid expenses and other assets (35,351) 17,859 Accounts payable and accrued expenses (120,902) 166,763 Advance for administrative costs - (471,000) Agency liability - (2,847,093)
Net Cash used for Operating Activities (1,191,978) (10,019,412)
Cash Flows from (used for) Investing ActivitiesPurchases of operating investments (139,175) (206,170) Proceeds from sales of operating investments 4,500,000 4,000,000 Purchases of property and equipment (1,419,072) (333,422) Proceeds from sales of property and equipment 350 829,962 (Additions to) withdrawal from endowment (2,992,765) (769,604)
Net Cash from (used for) Investing Activities (50,662) 3,520,766
Cash Flows from Financing ActivitiesCollections of contributions restricted to endowment 1,712,136 1,008,396
Net Cash from Financing Activities 1,712,136 1,008,396
Net Change in Cash and Cash Equivalents 469,496 (5,490,250) Cash and Cash Equivalents, Beginning of Year 1,836,950 7,327,200 Cash and Cash Equivalents, End of Year 2,306,446$ 1,836,950$

7
American Indian College Fund Notes to Financial Statements
June 30, 2016 Note 1 - Principal Activity and Significant Accounting Policies Organization The American Indian College Fund (the College Fund, we, us, our) transforms Indian higher education by funding and creating awareness of the unique, community-based accredited tribal colleges and universities, offering students access to knowledge, skills, and cultural values which enhance their communities and the country as a whole. During our 2016 fiscal year, we provided scholarships to over 4,100 students seeking to better their lives through higher education. We also provided support for tribal college needs, ranging from capital support to cultural preservation curricula. The College Fund serves large proportions of non-traditional students, those with dependent family members, first-generation college students, and many others who previously had little to no support for post-secondary education. The College Fund receives no local, state tax, or federal support. We work with the private sector to raise funds crucial to the success of American Indian students in achieving their academic and career-readiness goals. Comparative Financial Information The accompanying financial statements include certain prior-year summarized comparative information in total but not by net asset class. Such information does not include sufficient detail to constitute a presentation in conformity with accounting principles generally accepted in the United States of America (GAAP). Accordingly, such information should be read in conjunction with our audited financial statements for the year ended June 30, 2015, from which the summarized information was derived. Cash and Cash Equivalents We consider all cash and highly liquid financial instruments with original maturities of three months or less, and which are neither held for nor restricted by donors for long-term purposes, to be cash and cash equivalents. Cash and highly liquid financial instruments restricted to permanent endowment or other long-term purposes are excluded from this definition. Investments We record investment purchases at cost, or if donated, at fair value on the date of donation. Thereafter, investments are reported at their fair values in the statement of financial position. Net investment return is reported in the statement of activities and consists of interest and dividend income, realized and unrealized capital gains and losses, less investment management and custodial fees. Promises to Give We record unconditional promises to give expected to be collected within one year at net realizable value. Unconditional promises to give expected to be collected in future years are initially recorded at fair value using present value techniques incorporating risk-adjusted discount rates designed to reflect the assumptions market participants would use in pricing the asset. In subsequent years, amortization of the discounts is included in contribution revenue in the statement of activities. We determine the allowance for uncollectable promises to give based on historical experience, an assessment of economic conditions, and a review of subsequent collections. Promises to give are written off when deemed uncollectable. At June 30, 2016 we determined that no allowance was necessary.

American Indian College Fund Notes to Financial Statements
June 30, 2016
8
Property and Equipment We record property and equipment additions over $1,000 at cost, or if donated, at fair value on the date of donation. Depreciation is computed using the straight-line method over the estimated useful lives of the assets ranging from three to thirty-one-and-one-half years. When assets are sold or otherwise disposed of, the cost and related depreciation are removed from the accounts, and any resulting gain or loss is included in the statement of activities. Costs of maintenance and repairs that do not improve or extend the useful lives of the respective assets are expensed currently. We review the carrying values of property and equipment for impairment whenever events or circumstances indicate that the carrying value of an asset may not be recoverable from the estimated future cash flows expected to result from its use and eventual disposition. When considered impaired, an impairment loss is recognized to the extent carrying value exceeds the fair value of the asset. There were no indicators of asset impairment during the year ended June 30, 2016. Investments Held For Others We manage investments on behalf of the tribal colleges and universities. Assets received, investment return, and distributions are recorded as an increase or decrease in the asset and the related liability. Perpetual Trust We are the sole irrevocable beneficiary and trustee of a perpetual trust. The trust provides for the distribution of the net income of the trust to us; however, the assets of the trust are to be maintained in perpetuity. Trust assets are included in the Endowment. Net Assets Net assets, revenues, gains, and losses are classified based on the existence or absence of donor-imposed restrictions. Accordingly, net assets and changes therein are classified and reported as follows: Unrestricted Net Assets – Net assets available for use in general operations. Unrestricted board-designated net assets consist of net assets designated by the Board of Trustees for endowment. Temporarily Restricted Net Assets – Net assets subject to donor restrictions that may or will be met by expenditures or our actions and/or the passage of time, and certain income earned on permanently restricted net assets that have not yet been appropriated for expenditure by our Board of Trustees. We report contributions as temporarily restricted support if they are received with donor stipulations that limit the use of the donated assets. When a donor restriction expires, that is, when a stipulated time restriction ends or purpose restriction is accomplished, temporarily restricted net assets are reclassified to unrestricted net assets and reported in the statement of activities as net assets released from restrictions. Permanently Restricted Net Assets – Net assets whose use is limited by donor-imposed restrictions that neither expire by the passage of time nor can be fulfilled or otherwise removed by our actions. The restrictions stipulate that resources be maintained permanently but permit us to expend the income generated in accordance with the provisions of the agreements.

American Indian College Fund Notes to Financial Statements
June 30, 2016
9
Revenue and Revenue Recognition Revenue is recognized when earned. Contributions are recognized when cash, securities or other assets, an unconditional promise to give, or notification of a beneficial interest is received. Conditional promises to give are not recognized until the conditions on which they depend have been substantially met. Donated Services and In-Kind Contributions Volunteers contribute significant amounts of time to our program services, administration, and fundraising and development activities; however, the financial statements do not reflect the value of these contributed services because they do not meet recognition criteria prescribed by generally accepted accounting principles. Contributed goods are recorded at fair value at the date of donation. We record donated professional services at the respective fair values of the services received. During the year ended June 30, 2016, we received donated television and radio air time and magazine and newspaper print space, with a total estimated value of $6,005,757 to broadcast and publish our public service announcements. Advertising Costs Advertising costs, which include donated advertising, are expensed as incurred, and totaled $8,954,998 during the year ended June 30, 2016. Functional Allocation of Expenses The costs of program and supporting services activities have been summarized on a functional basis in the statement of activities. The statement of functional expenses present the natural classification detail of expenses by function. Accordingly, certain costs have been allocated among the programs and supporting services benefited. This allocation includes $339,953 and $5,665,804 in donated advertising allocated respectively to public education and donor development. Income Taxes The College Fund is organized as a Washington, D.C. nonprofit corporation and has been recognized by the Internal Revenue Service (IRS) as exempt from federal income taxes under Section 501(a) of the Internal Revenue Code as an organization described in Section 501(c)(3), qualifies for the charitable contribution deduction under Section 170(b)(1)(A)(vi), and has been determined not to be a private foundation under Section 509(a)(1). We are annually required to file a Return of Organization Exempt from Income Tax (Form 990) with the IRS. In addition, we are subject to income tax on net income that is derived from business activities that are unrelated to our exempt purpose. We have filed an Exempt Organization Business Income Tax Return (Form 990-T) with the IRS. We did not incur significant income tax expense during the year ended June 30, 2016. We believe that we have appropriate support for any tax positions taken affecting our annual filing requirements, and as such, do not have any uncertain tax positions that are material to the financial statements. We would recognize future accrued interest and penalties related to unrecognized tax benefits and liabilities in income tax expense if such interest and penalties are incurred. The College Fund’s Forms 990-T and other income tax filings required by state, local, or non-U.S. tax authorities are no longer subject to tax examination for years before 2013.
American Indian College Fund Notes to Financial Statements
June 30, 2016
10
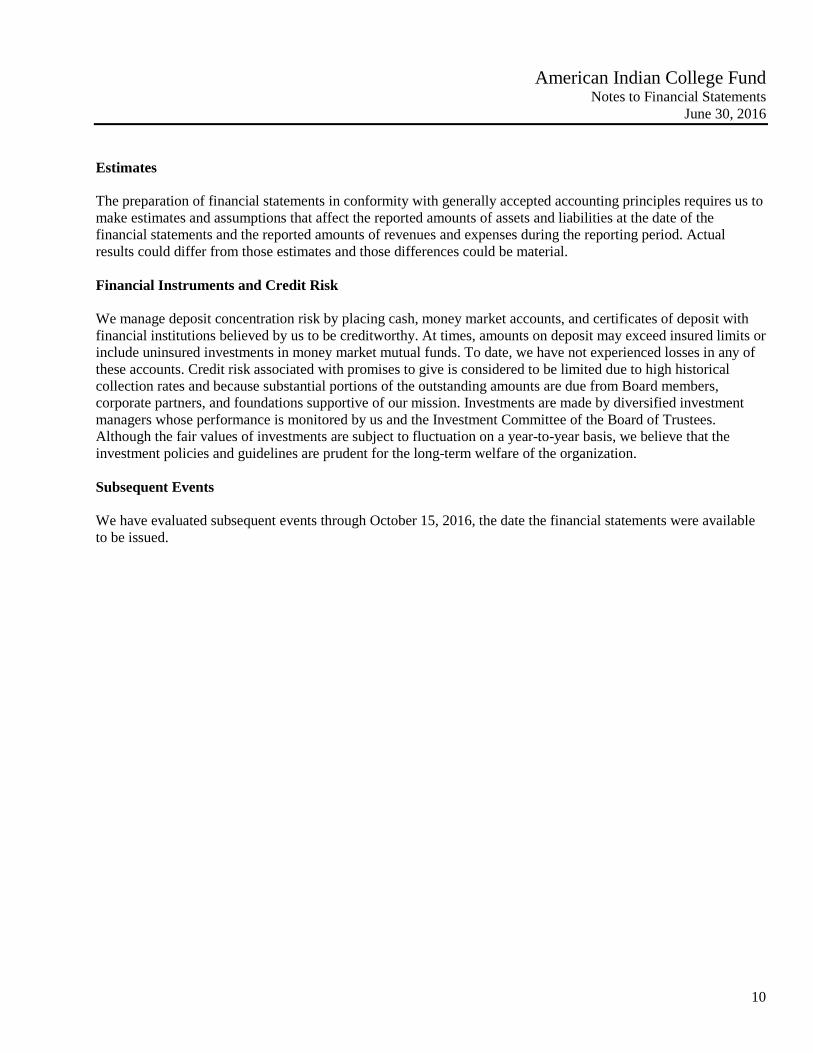
Estimates The preparation of financial statements in conformity with generally accepted accounting principles requires us to make estimates and assumptions that affect the reported amounts of assets and liabilities at the date of the financial statements and the reported amounts of revenues and expenses during the reporting period. Actual results could differ from those estimates and those differences could be material. Financial Instruments and Credit Risk We manage deposit concentration risk by placing cash, money market accounts, and certificates of deposit with financial institutions believed by us to be creditworthy. At times, amounts on deposit may exceed insured limits or include uninsured investments in money market mutual funds. To date, we have not experienced losses in any of these accounts. Credit risk associated with promises to give is considered to be limited due to high historical collection rates and because substantial portions of the outstanding amounts are due from Board members, corporate partners, and foundations supportive of our mission. Investments are made by diversified investment managers whose performance is monitored by us and the Investment Committee of the Board of Trustees. Although the fair values of investments are subject to fluctuation on a year-to-year basis, we believe that the investment policies and guidelines are prudent for the long-term welfare of the organization. Subsequent Events We have evaluated subsequent events through October 15, 2016, the date the financial statements were available to be issued.

American Indian College Fund Notes to Financial Statements
June 30, 2016
11
Note 2 - Fair Value Measurements and Disclosures We report certain assets at fair value in the financial statements. Fair value is the price that would be received to sell an asset in an orderly transaction in the principal, or most advantageous, market at the measurement date under current market conditions regardless of whether that price is directly observable or estimated using another valuation technique. Inputs used to determine fair value refer broadly to the assumptions that market participants would use in pricing the asset, including assumptions about risk. Inputs may be observable or unobservable. Observable inputs are inputs that reflect the assumptions market participants would use in pricing the asset based on market data obtained from sources independent of the reporting entity. Unobservable inputs are inputs that reflect the reporting entity’s own assumptions about the assumptions market participants would use in pricing the asset based on the best information available. A three-tier hierarchy categorizes the inputs as follows: Level 1 – Quoted prices (unadjusted) in active markets for identical assets that we can access at the measurement date. Level 2 – Inputs other than quoted prices included within Level 1 that are observable for the asset, either directly or indirectly. These include quoted prices for similar assets in active markets, quoted prices for identical or similar assets in markets that are not active, inputs other than quoted prices that are observable for the asset, and market-corroborated inputs. Level 3 – Unobservable inputs for the asset. In these situations, we develop inputs using the best information available in the circumstances. In some cases, the inputs used to measure the fair value of an asset might be categorized within different levels of the fair value hierarchy. In those cases, the fair value measurement is categorized in its entirety in the same level of the fair value hierarchy as the lowest level input that is significant to the entire measurement. Assessing the significance of a particular input to entire measurement requires judgment, taking into account factors specific to the asset. The categorization of an asset within the hierarchy is based upon the pricing transparency of the asset and does not necessarily correspond to our assessment of the quality, risk or liquidity profile of the asset. A significant portion of our investment assets are classified within Level 1 because they are comprised of open-end mutual funds, domestic equities, and exchange traded master energy limited partnerships with readily determinable fair values based on daily redemption values and closing market prices. Domestic corporate bonds, U.S. Government obligations and domestic asset-backed mortgage securities are valued by the custodians of the securities using pricing models based on credit quality, time to maturity, stated interest rates and market-rate assumptions, and are classified within Level 2. We use Net Asset Value (NAV) per share, or its equivalent, such as member units or an ownership interest in partners’ capital, to estimate the fair values of a domestic fixed income fund, a domestic growth fund, pooled hedge funds, and a pooled floating-rate fund which do not have readily determinable fair values. Investments valued at NAV are classified within Level 2 because we have the ability to redeem the investments at NAV at the measurement date or within the near term.

American Indian College Fund Notes to Financial Statements
June 30, 2016
12
The following table presents assets measured at fair value on a recurring basis, except those measured at cost as identified below, at June 30, 2016:
QuotedPrices in Significant
Active Markets Other Significantfor Identical Observable Unobservable
Assets Inputs InputsTotal (Level 1) (Level 2) (Level 3)
Operating investmentsCash and money market funds (at cost) 457,985$ -$ -$ -$ Domestic equities 48,231 48,231 - - Debt securities
Domestic corporate bonds 9,941,152 - 9,941,152 - U.S. Government obligations 1,272,271 - 1,272,271 - Domestic asset-backed
mortgage securities 1,851,202 - 1,851,202 -
13,570,841$ 48,231$ 13,064,625$ -$
Endowment investmentsCash and money market funds (at cost) 1,391,243$ -$ -$ -$ Domestic equities 97,428 97,428 - - Debt securities
Domestic corporate bonds 2,903,903 - 2,903,903 - Domestic equity index mutual funds 25,289,468 25,289,468 - - Investments in funds and partnerships
Exchange traded energy master limited partnerships 2,424,188 2,424,188 - -
Domestic fixed-income fund 4,343,968 - 4,343,968 - Domestic growth fund 3,814,635 - 3,814,635 - Pooled hedge funds 4,792,634 - 4,792,634 - Pooled floating-rate fund 4,275,157 - 4,275,157 -
49,332,624$ 27,811,084$ 20,130,297$ -$
Fair Value Measurements at Report Date Using

American Indian College Fund Notes to Financial Statements
June 30, 2016
13
QuotedPrices in Significant
Active Markets Other Significantfor Identical Observable Unobservable
Assets Inputs InputsTotal (Level 1) (Level 2) (Level 3)
Investments held for othersCash and money market funds (at cost) 16,929$ -$ -$ -$ Domestic equities 1,186 1,186 - - Debt securities
Domestic corporate bonds 35,335 - 35,335 - Domestic equity index mutual funds 307,729 307,729 - - Investments in funds and partnerships
Exchange traded energy master limited partnerships 29,498 29,498 - -
Domestic fixed-income fund 52,859 - 52,859 - Domestic growth fund 46,417 - 46,417 - Pooled hedge funds 58,318 - 58,318 - Pooled floating-rate fund 52,021 - 52,021 -
600,292$ 338,413$ 244,950$ -$
Fair Value Measurements at Report Date Using
Investments in certain entities that calculate NAV per share are as follows at June 30, 2016:
Number of Unfunded Redemption RedemptionInvestments Fair value Commitments Frequency Notice Period
Domestic fixed-income fund 1 4,396,827$ -$ Daily NoneDomestic growth fund 1 3,861,052 - 25% Quarterly 90 DaysPooled hedge funds 2 4,850,952 - Monthly 30 DaysPooled floating-rate fund 1 4,327,178 - Quarterly 30 Days
17,436,009$ -$
Domestic Fixed Income Fund – Fund focused on fixed income investments primarily in the United States. Domestic Growth Fund – Fund that utilizes a multi-manager structure to pursue a variety of long-term growth strategies. The fund is a comingled investment that seeks, over time, to achieve long-term return while attempting to limit volatility. Pooled Hedge Funds – Funds that can invest in multiple strategies, including long and short positions in liquid global equity, exchange traded funds, futures, forwards, swaps, currency and futures options contracts. Fund managers may invest in value, growth, or event-driven equity opportunities and typically are not restricted by market capitalization, industry sector, or geography. Leverage may be utilized, which can magnify changes in the values of the underlying securities.

American Indian College Fund Notes to Financial Statements
June 30, 2016
14
Pooled Floating-Rate Fund – Fund seeks to maximize total returns by investing primarily in senior secured, floating rate loans of non-investment grade companies, and can invest in a variety of strategies. The fund also invests in floating rate bonds, notes or other debentures. Note 3 - Net Investment Return Net investment return consists of the following for the year ended June 30, 2016:
Operating investmentsInterest and dividends 323,088$ Net realized and unrealized gain (loss) 207,121 Less investment management and custodial fees (135,227)
394,982
Endowment investmentsInterest and dividends 602,148 Net realized and unrealized gain (loss) (65,066) Less investment management and custodial fees (205,736)
331,346
726,328$
Promises to Give Unconditional promises to give are estimated to be collected as follows at June 30, 2016:
Within one year 3,475,246$ In one to five years 2,933,000 In excess of five years 10,000
6,418,246$
Promises to give appear as follows in the statement of financial position:
Promises to give, net 6,002,046$ Endowment promises to give, net 416,200
6,418,246$
Promises to give due in more than one year are not discounted to present value because the amount of the discount is immaterial.
American Indian College Fund Notes to Financial Statements
June 30, 2016
15
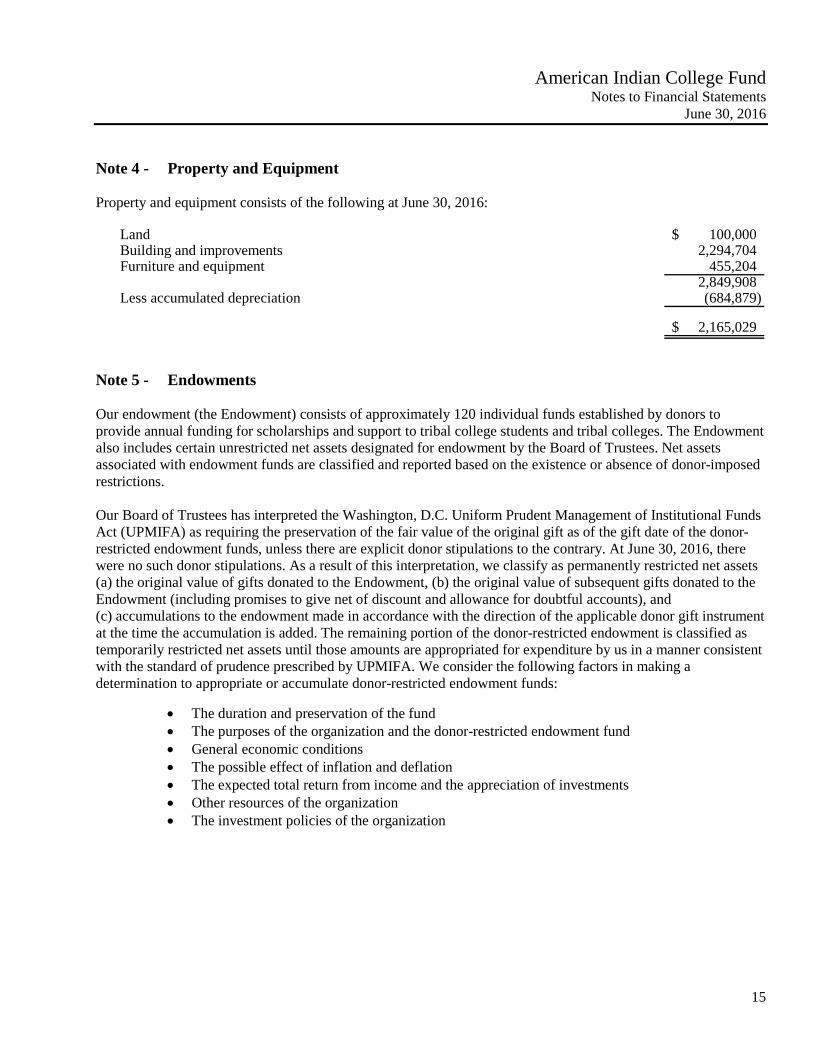
Note 4 - Property and Equipment Property and equipment consists of the following at June 30, 2016:
Land 100,000$ Building and improvements 2,294,704Furniture and equipment 455,204
2,849,908 Less accumulated depreciation (684,879)
2,165,029$
Note 5 - Endowments Our endowment (the Endowment) consists of approximately 120 individual funds established by donors to provide annual funding for scholarships and support to tribal college students and tribal colleges. The Endowment also includes certain unrestricted net assets designated for endowment by the Board of Trustees. Net assets associated with endowment funds are classified and reported based on the existence or absence of donor-imposed restrictions. Our Board of Trustees has interpreted the Washington, D.C. Uniform Prudent Management of Institutional Funds Act (UPMIFA) as requiring the preservation of the fair value of the original gift as of the gift date of the donor-restricted endowment funds, unless there are explicit donor stipulations to the contrary. At June 30, 2016, there were no such donor stipulations. As a result of this interpretation, we classify as permanently restricted net assets (a) the original value of gifts donated to the Endowment, (b) the original value of subsequent gifts donated to the Endowment (including promises to give net of discount and allowance for doubtful accounts), and (c) accumulations to the endowment made in accordance with the direction of the applicable donor gift instrument at the time the accumulation is added. The remaining portion of the donor-restricted endowment is classified as temporarily restricted net assets until those amounts are appropriated for expenditure by us in a manner consistent with the standard of prudence prescribed by UPMIFA. We consider the following factors in making a determination to appropriate or accumulate donor-restricted endowment funds:
• The duration and preservation of the fund • The purposes of the organization and the donor-restricted endowment fund • General economic conditions • The possible effect of inflation and deflation • The expected total return from income and the appreciation of investments • Other resources of the organization • The investment policies of the organization

American Indian College Fund Notes to Financial Statements
June 30, 2016
16
As of June 30, 2016, we had the following endowment net asset composition by type of fund:
Temporarily PermanentlyUnrestricted Restricted Restricted Total
Board-designated endowment 16,448,395$ -$ -$ 16,448,395$ Leibowitz trust - - 2,606,721 2,606,721 Donor-restricted endowment - 5,240,825 25,571,704 30,812,529
16,448,395$ 5,240,825$ 28,178,425$ 49,867,645$
Investment and Spending Policies We have adopted investment and spending policies for the Endowment that attempt to provide a predictable stream of funding for operations. Over time, long-term rates of return should be equal to an amount sufficient to maintain the purchasing power of the Endowment assets, to provide the necessary capital to fund the spending policy, and to cover the costs of managing the Endowment investments. Actual returns in any given year may vary from this amount. To satisfy this long-term rate-of-return objective, the investment portfolio is structured on a total-return approach through which investment returns are achieved through both capital appreciation (realized and unrealized) and current yield (interest and dividends). Our Board of Trustees appropriates amounts for distribution each year as necessary to fund scholarship and grant expenses as determined by the Board of Trustees. In establishing this policy, the Board of Trustees considered the long-term expected return on the endowment and current needs. Accordingly, over the long term, we expect the current spending policy to preserve the permanently restricted net assets of the endowment. This is consistent with our objective to preserve the original fair values of the original gifts made to the Endowment as well as to provide an opportunity for real growth through new gifts and undistributed investment return. Changes in Endowment net assets for the year ended June 30, 2016 are as follows:
Temporarily PermanentlyUnrestricted Restricted Restricted Total
Endowment net assets, beginning of year 14,026,127$ 6,051,118$ 27,180,271$ 47,257,516$ Investment return
Investment income, net of fees 127,331 269,080 - 396,411 Net realized and unrealized gain (loss) (44,493) (20,572) - (65,065)
82,838 248,508 - 331,346
Contributions - - 998,154 998,154 Distributions (485,570) (1,058,801) - (1,544,371) Addition to board-designated
endowment funds 2,825,000 - - 2,825,000
Endowment net assets, end of year 16,448,395$ 5,240,825$ 28,178,425$ 49,867,645$

American Indian College Fund Notes to Financial Statements
June 30, 2016
17
Note 6 - Restricted Net Assets Temporarily restricted net assets at June 30, 2016, consist of:
Promises to give that are not restricted by donors,but which are unavailable for expenditure until due 1,223,295$
Restricted by donors forScholarships and other support 5,577,741 PhD and masters fellowships 777,351 Cultural preservation program 247,771 Early childhood education project 1,007,546 Achieving the Dream project 58,920 TCUs building sustainability pathways project 754,966 Research initiative 686,225 Arts and energy infrastructure project 2,671,337 Native Pathways to college 2,359,245 Other grants and programs 518,987
Unspent appreciation of Endowment funds whichmust be appropriated for expenditure before use
Restricted by donors forScholarships 3,581,488 Cutural preservation 1,220,738 TCU support, staff development and other 438,599
5,240,825
21,124,209$

American Indian College Fund Notes to Financial Statements
June 30, 2016
18
Net assets were released from restrictions as follows during the year ended June 30, 2016:
Expiration of time restrictions 525,000$
Satisfaction of purpose restrictionsScholarships and other support 4,705,272 PhD, masters and research fellowships 339,192 Cultural preservation program 379,747 Tribal College leaders program 79,708 Early childhood education project 730,546 Achieving the Dream project 110,045 TCUs building sustainability pathways project 398,714 Research initiative 390,909 Arts and energy infrastructure project 328,663 Native Pathways to college 40,755 Other grants and programs 156,716
7,660,267
Restricted-purpose appropriationsScholarships 832,931 Cutural preservation 176,000 TCU support, staff development and other 49,870
1,058,801
9,244,068$
Permanently restricted net assets consist of a perpetual trust and endowment funds restricted by donors for investment in perpetuity. Distributions from the perpetual trust and earnings on endowment funds are available for the purposes specified by the donors, or in certain cases, for our unrestricted use. The permanently restricted net assets balances, classified by restriction on the use of earnings, are as follows at June 30, 2016:
Perpetual trust - distributions available for general use 2,606,721$ Endowment
Scholarships 20,687,568 Cutural preservation 3,020,000 TCU support, staff development and other 1,864,136
25,571,704
28,178,425$
Note 7 - Employee Benefits We sponsor a tax-deferred plan (the Plan) qualified under Section 403(b) of the Internal Revenue Code covering substantially all full-time employees. The plan provides that employees who have attained the age of 21 may voluntarily contribute a percentage of their earnings to the Plan, up to the maximum contribution allowed by the IRS. Employer contributions are discretionary and are determined and authorized by the Board of Trustees annually. During the year ended June 30, 2016, we contributed 2% of each qualifying employee’s wages and matched employee voluntary contributions up to 5%, resulting in contributions to the plan of approximately $163,000.

American Indian College Fund Notes to Financial Statements
June 30, 2016
19
Note 8 - Related Party Transactions Certain members of our Board of Trustees also serve as tribal college presidents. Those colleges are eligible, along with all other tribal colleges, to receive scholarship and other direct funding awards from the College Fund. Typically awards are distributed on an objective or equal basis among all the tribal colleges. During 2016, approximately $2.9 million was distributed to tribal colleges whose presidents also serve as Trustees for the College Fund. Note 9 - Contributions by Source During the year ended June 30, 2016, contributions were received from the following sources:
Individuals 6,030,771$ Bequests 5,735,895 Corporations and corporate foundations 2,442,185 Charitable foundations 9,452,914
23,661,765$