Embed Size (px)
Citation preview
FINANCIAL STATEMENTS FOR THE PERIOD
ENDED 30 JUNE 2017
UNITYKAPITAL ASSURANCE PLC
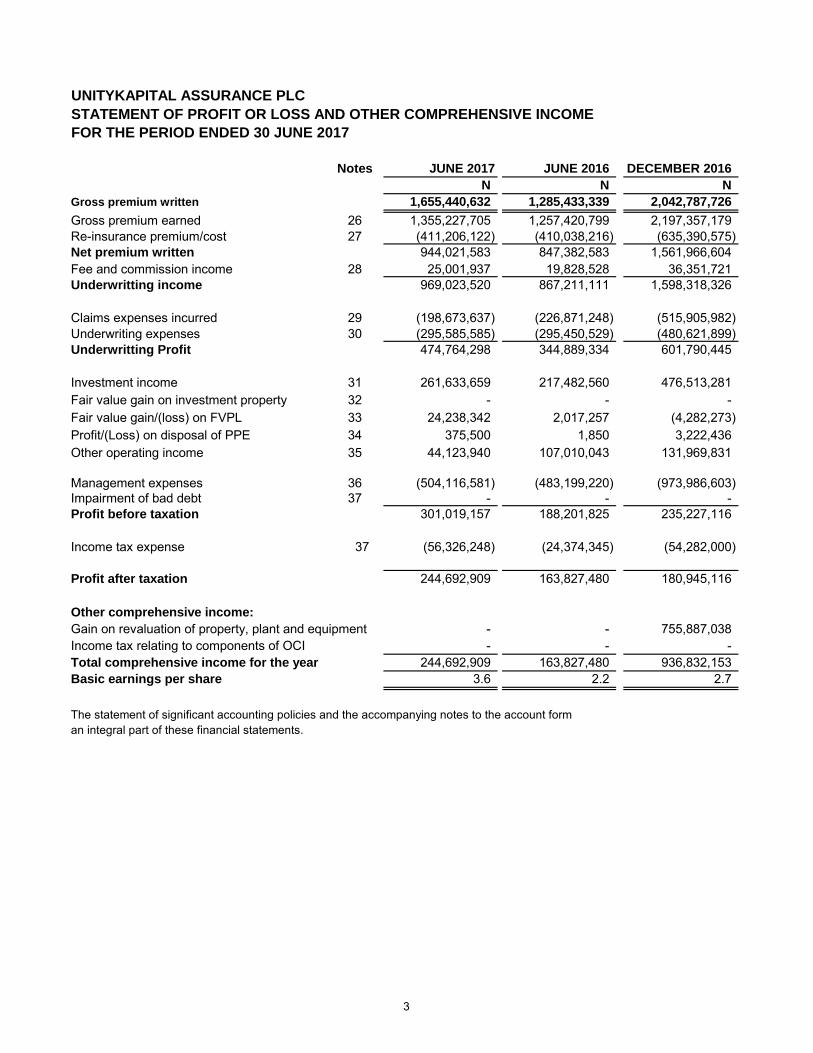
STATEMENT OF PROFIT OR LOSS AND OTHER COMPREHENSIVE INCOME
FOR THE PERIOD ENDED 30 JUNE 2017
Notes JUNE 2017 JUNE 2016 DECEMBER 2016
N N N
Gross premium written 1,655,440,632 1,285,433,339 2,042,787,726
Gross premium earned 26 1,355,227,705 1,257,420,799 2,197,357,179 Re-insurance premium/cost 27 (411,206,122) (410,038,216) (635,390,575) Net premium written 944,021,583 847,382,583 1,561,966,604 Fee and commission income 28 25,001,937 19,828,528 36,351,721 Underwritting income 969,023,520 867,211,111 1,598,318,326
Claims expenses incurred 29 (198,673,637) (226,871,248) (515,905,982) Underwriting expenses 30 (295,585,585) (295,450,529) (480,621,899) Underwritting Profit 474,764,298 344,889,334 601,790,445
Investment income 31 261,633,659 217,482,560 476,513,281 Fair value gain on investment property 32 - - - Fair value gain/(loss) on FVPL 33 24,238,342 2,017,257 (4,282,273) Profit/(Loss) on disposal of PPE 34 375,500 1,850 3,222,436 Other operating income 35 44,123,940 107,010,043 131,969,831
Management expenses 36 (504,116,581) (483,199,220) (973,986,603) Impairment of bad debt 37 - - - Profit before taxation 301,019,157 188,201,825 235,227,116
Income tax expense 37 (56,326,248) (24,374,345) (54,282,000)
Profit after taxation 244,692,909 163,827,480 180,945,116
Other comprehensive income:
Gain on revaluation of property, plant and equipment - - 755,887,038 Income tax relating to components of OCI - - - Total comprehensive income for the year 244,692,909 163,827,480 936,832,153 Basic earnings per share 3.6 2.2 2.7
The statement of significant accounting policies and the accompanying notes to the account form an integral part of these financial statements.
3
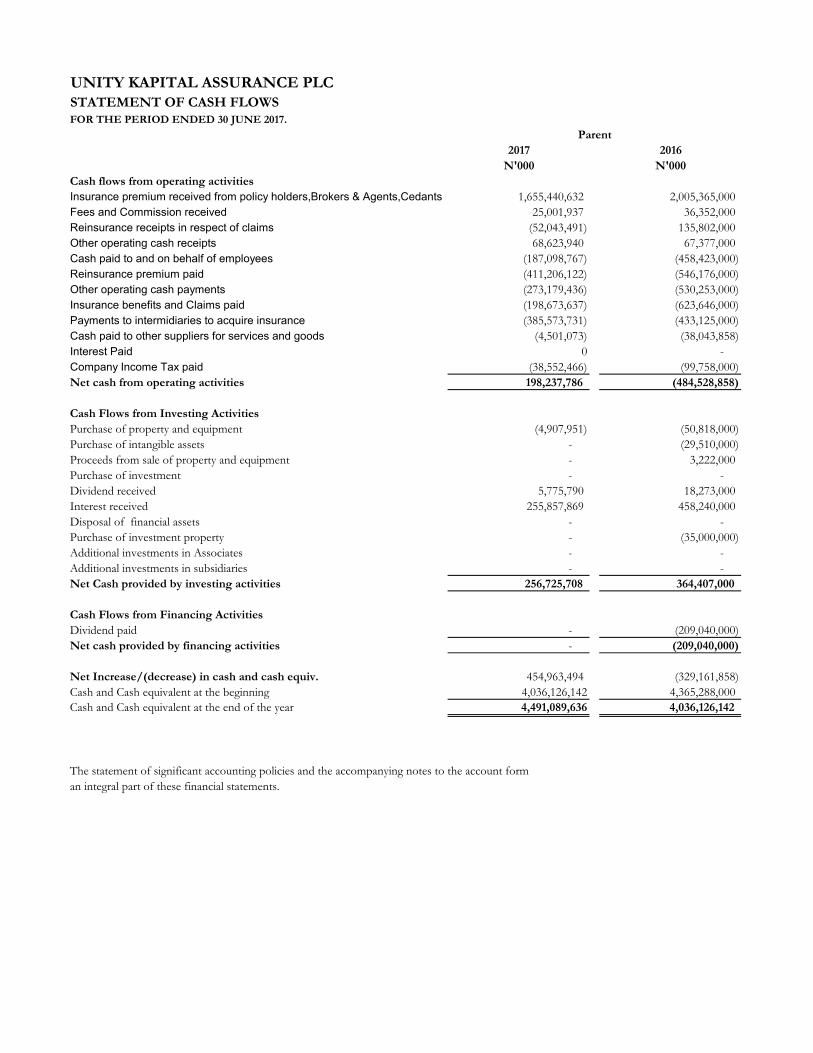
UNITY KAPITAL ASSURANCE PLC
STATEMENT OF CASH FLOWS
FOR THE PERIOD ENDED 30 JUNE 2017.
2017 2016
N'000 N'000
Cash flows from operating activities
Insurance premium received from policy holders,Brokers & Agents,Cedants 1,655,440,632 2,005,365,000
Fees and Commission received 25,001,937 36,352,000
Reinsurance receipts in respect of claims (52,043,491) 135,802,000
Other operating cash receipts 68,623,940 67,377,000
Cash paid to and on behalf of employees (187,098,767) (458,423,000)
Reinsurance premium paid (411,206,122) (546,176,000)
Other operating cash payments (273,179,436) (530,253,000)
Insurance benefits and Claims paid (198,673,637) (623,646,000)
Payments to intermidiaries to acquire insurance (385,573,731) (433,125,000)
Cash paid to other suppliers for services and goods (4,501,073) (38,043,858)
Interest Paid 0 -
Company Income Tax paid (38,552,466) (99,758,000)
Net cash from operating activities 198,237,786 (484,528,858)
Cash Flows from Investing Activities
Purchase of property and equipment (4,907,951) (50,818,000)
Purchase of intangible assets - (29,510,000)
Proceeds from sale of property and equipment - 3,222,000
Purchase of investment - -
Dividend received 5,775,790 18,273,000
Interest received 255,857,869 458,240,000
Disposal of financial assets - -
Purchase of investment property - (35,000,000)
Additional investments in Associates - -
Additional investments in subsidiaries - -
Net Cash provided by investing activities 256,725,708 364,407,000
Cash Flows from Financing Activities
Dividend paid - (209,040,000)
Net cash provided by financing activities - (209,040,000)
Net Increase/(decrease) in cash and cash equiv. 454,963,494 (329,161,858)
Cash and Cash equivalent at the beginning 4,036,126,142 4,365,288,000
Cash and Cash equivalent at the end of the year 4,491,089,636 4,036,126,142
The statement of significant accounting policies and the accompanying notes to the account form
an integral part of these financial statements.
Parent
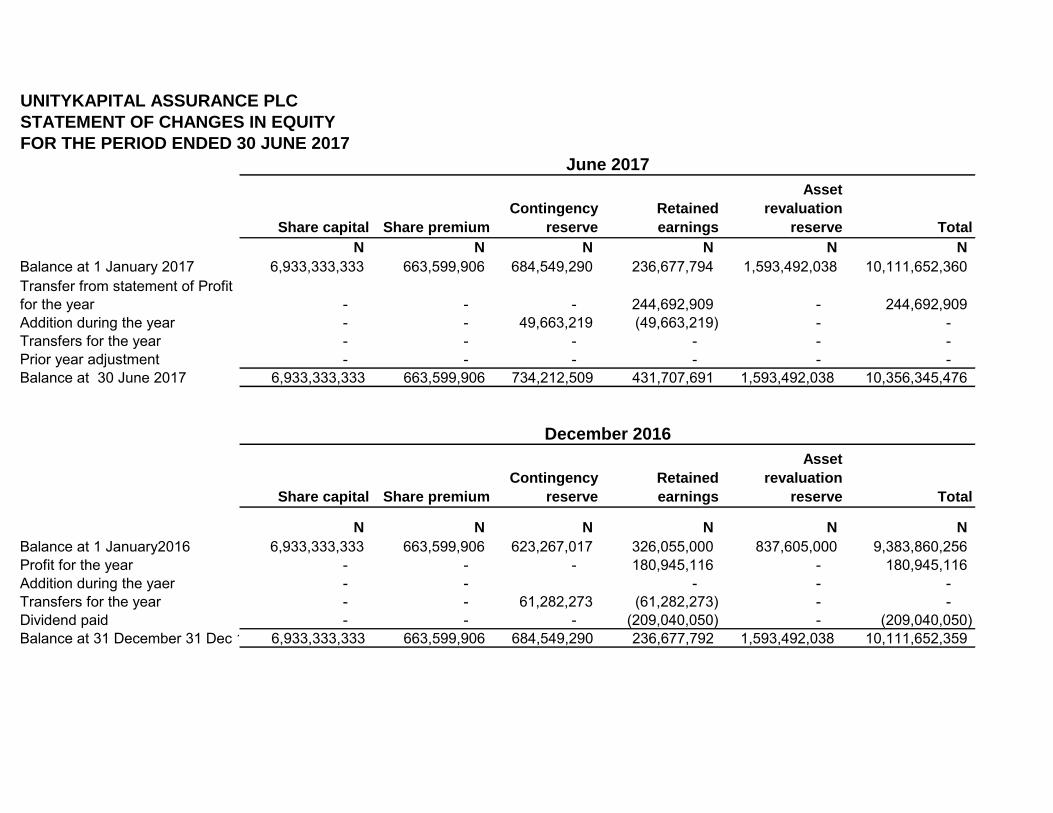
UNITYKAPITAL ASSURANCE PLC
STATEMENT OF CHANGES IN EQUITY
FOR THE PERIOD ENDED 30 JUNE 2017
Share capital Share premium
Contingency
reserve
Retained
earnings
Asset
revaluation
reserve Total
N N N N N N
Balance at 1 January 2017 6,933,333,333 663,599,906 684,549,290 236,677,794 1,593,492,038 10,111,652,360
- - - 244,692,909 - 244,692,909 Addition during the year - - 49,663,219 (49,663,219) - - Transfers for the year - - - - - - Prior year adjustment - - - - - - Balance at 30 June 2017 6,933,333,333 663,599,906 734,212,509 431,707,691 1,593,492,038 10,356,345,476
Share capital Share premium
Contingency
reserve
Retained
earnings
Asset
revaluation
reserve Total
N N N N N N
Balance at 1 January2016 6,933,333,333 663,599,906 623,267,017 326,055,000 837,605,000 9,383,860,256 Profit for the year - - - 180,945,116 - 180,945,116 Addition during the yaer - - - - - Transfers for the year - - 61,282,273 (61,282,273) - - Dividend paid - - - (209,040,050) - (209,040,050) Balance at 31 December 31 Dec 16 6,933,333,333 663,599,906 684,549,290 236,677,792 1,593,492,038 10,111,652,359
June 2017
December 2016
Transfer from statement of Profit for the year
UNITYKAPITAL ASSURANCE PLC `NOTES TO THE FINANCIAL STATEMENTS
FOR THE PERIOD ENDED 30 JUNE 2017
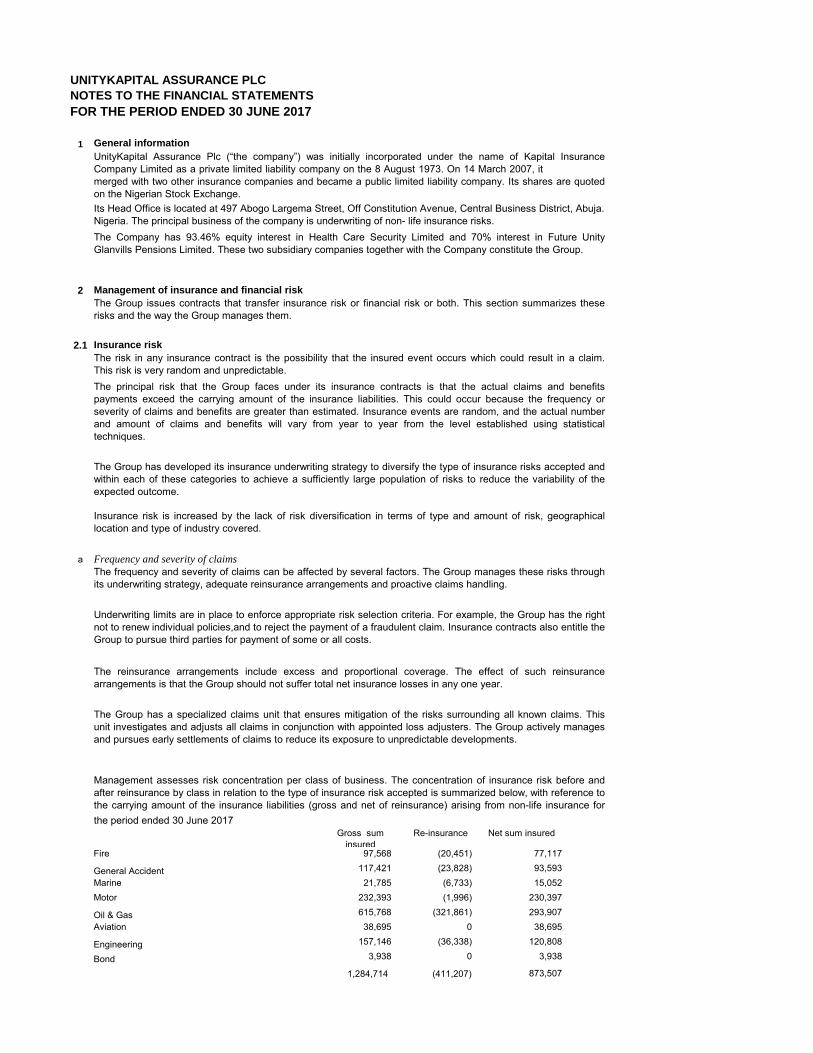
1 General information
2 Management of insurance and financial risk
2.1 Insurance risk
a Frequency and severity of claims
Gross sum insured
Re-insurance Net sum insured
Fire 97,568 (20,451) 77,117
General Accident 117,421 (23,828) 93,593 Marine 21,785 (6,733) 15,052 Motor 232,393 (1,996) 230,397
Oil & Gas 615,768 (321,861) 293,907 Aviation 38,695 0 38,695
Engineering 157,146 (36,338) 120,808
Bond 3,938 0 3,938
1,284,714 (411,207) 873,507
The frequency and severity of claims can be affected by several factors. The Group manages these risks throughits underwriting strategy, adequate reinsurance arrangements and proactive claims handling.
Underwriting limits are in place to enforce appropriate risk selection criteria. For example, the Group has the rightnot to renew individual policies,and to reject the payment of a fraudulent claim. Insurance contracts also entitle theGroup to pursue third parties for payment of some or all costs.
The reinsurance arrangements include excess and proportional coverage. The effect of such reinsurancearrangements is that the Group should not suffer total net insurance losses in any one year.
The Group has a specialized claims unit that ensures mitigation of the risks surrounding all known claims. Thisunit investigates and adjusts all claims in conjunction with appointed loss adjusters. The Group actively managesand pursues early settlements of claims to reduce its exposure to unpredictable developments.
The Group has developed its insurance underwriting strategy to diversify the type of insurance risks accepted andwithin each of these categories to achieve a sufficiently large population of risks to reduce the variability of theexpected outcome.
Insurance risk is increased by the lack of risk diversification in terms of type and amount of risk, geographicallocation and type of industry covered.
UnityKapital Assurance Plc (“the company”) was initially incorporated under the name of Kapital InsuranceCompany Limited as a private limited liability company on the 8 August 1973. On 14 March 2007, itmerged with two other insurance companies and became a public limited liability company. Its shares are quotedon the Nigerian Stock Exchange.Its Head Office is located at 497 Abogo Largema Street, Off Constitution Avenue, Central Business District, Abuja. Nigeria. The principal business of the company is underwriting of non- life insurance risks.The Company has 93.46% equity interest in Health Care Security Limited and 70% interest in Future UnityGlanvills Pensions Limited. These two subsidiary companies together with the Company constitute the Group.
The Group issues contracts that transfer insurance risk or financial risk or both. This section summarizes theserisks and the way the Group manages them.
The risk in any insurance contract is the possibility that the insured event occurs which could result in a claim.This risk is very random and unpredictable.The principal risk that the Group faces under its insurance contracts is that the actual claims and benefitspayments exceed the carrying amount of the insurance liabilities. This could occur because the frequency orseverity of claims and benefits are greater than estimated. Insurance events are random, and the actual numberand amount of claims and benefits will vary from year to year from the level established using statisticaltechniques.
Management assesses risk concentration per class of business. The concentration of insurance risk before andafter reinsurance by class in relation to the type of insurance risk accepted is summarized below, with reference tothe carrying amount of the insurance liabilities (gross and net of reinsurance) arising from non-life insurance forthe period ended 30 June 2017
UNITYKAPITAL ASSURANCE PLC
NOTES TO THE FINANCIAL STATEMENTS
FOR THE PERIOD ENDED 30 JUNE 2017
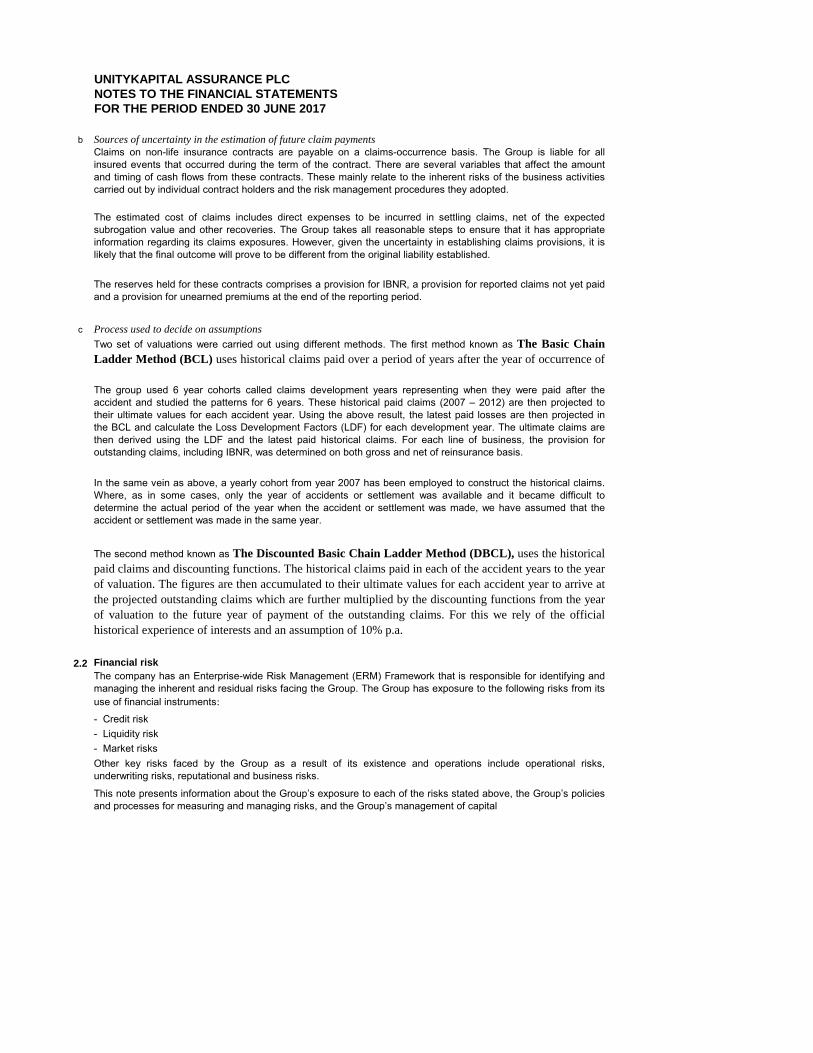
b Sources of uncertainty in the estimation of future claim payments
c Process used to decide on assumptions
2.2 Financial risk
- Credit risk - Liquidity risk - Market risks
Claims on non-life insurance contracts are payable on a claims-occurrence basis. The Group is liable for allinsured events that occurred during the term of the contract. There are several variables that affect the amountand timing of cash flows from these contracts. These mainly relate to the inherent risks of the business activitiescarried out by individual contract holders and the risk management procedures they adopted.
The estimated cost of claims includes direct expenses to be incurred in settling claims, net of the expectedsubrogation value and other recoveries. The Group takes all reasonable steps to ensure that it has appropriateinformation regarding its claims exposures. However, given the uncertainty in establishing claims provisions, it islikely that the final outcome will prove to be different from the original liability established.
The reserves held for these contracts comprises a provision for IBNR, a provision for reported claims not yet paidand a provision for unearned premiums at the end of the reporting period.
Two set of valuations were carried out using different methods. The first method known as The Basic Chain
Ladder Method (BCL) uses historical claims paid over a period of years after the year of occurrence of
the insured risk.
The group used 6 year cohorts called claims development years representing when they were paid after theaccident and studied the patterns for 6 years. These historical paid claims (2007 – 2012) are then projected totheir ultimate values for each accident year. Using the above result, the latest paid losses are then projected inthe BCL and calculate the Loss Development Factors (LDF) for each development year. The ultimate claims arethen derived using the LDF and the latest paid historical claims. For each line of business, the provision foroutstanding claims, including IBNR, was determined on both gross and net of reinsurance basis.
In the same vein as above, a yearly cohort from year 2007 has been employed to construct the historical claims.Where, as in some cases, only the year of accidents or settlement was available and it became difficult todetermine the actual period of the year when the accident or settlement was made, we have assumed that theaccident or settlement was made in the same year.
The second method known as The Discounted Basic Chain Ladder Method (DBCL), uses the historical
paid claims and discounting functions. The historical claims paid in each of the accident years to the year
of valuation. The figures are then accumulated to their ultimate values for each accident year to arrive at
the projected outstanding claims which are further multiplied by the discounting functions from the year
of valuation to the future year of payment of the outstanding claims. For this we rely of the official
historical experience of interests and an assumption of 10% p.a.
The company has an Enterprise-wide Risk Management (ERM) Framework that is responsible for identifying andmanaging the inherent and residual risks facing the Group. The Group has exposure to the following risks from itsuse of financial instruments:
Other key risks faced by the Group as a result of its existence and operations include operational risks,underwriting risks, reputational and business risks.
This note presents information about the Group’s exposure to each of the risks stated above, the Group’s policiesand processes for measuring and managing risks, and the Group’s management of capital
UNITYKAPITAL ASSURANCE PLC
NOTES TO THE FINANCIAL STATEMENTS
FOR THE PERIOD ENDED 30 JUNE 2017
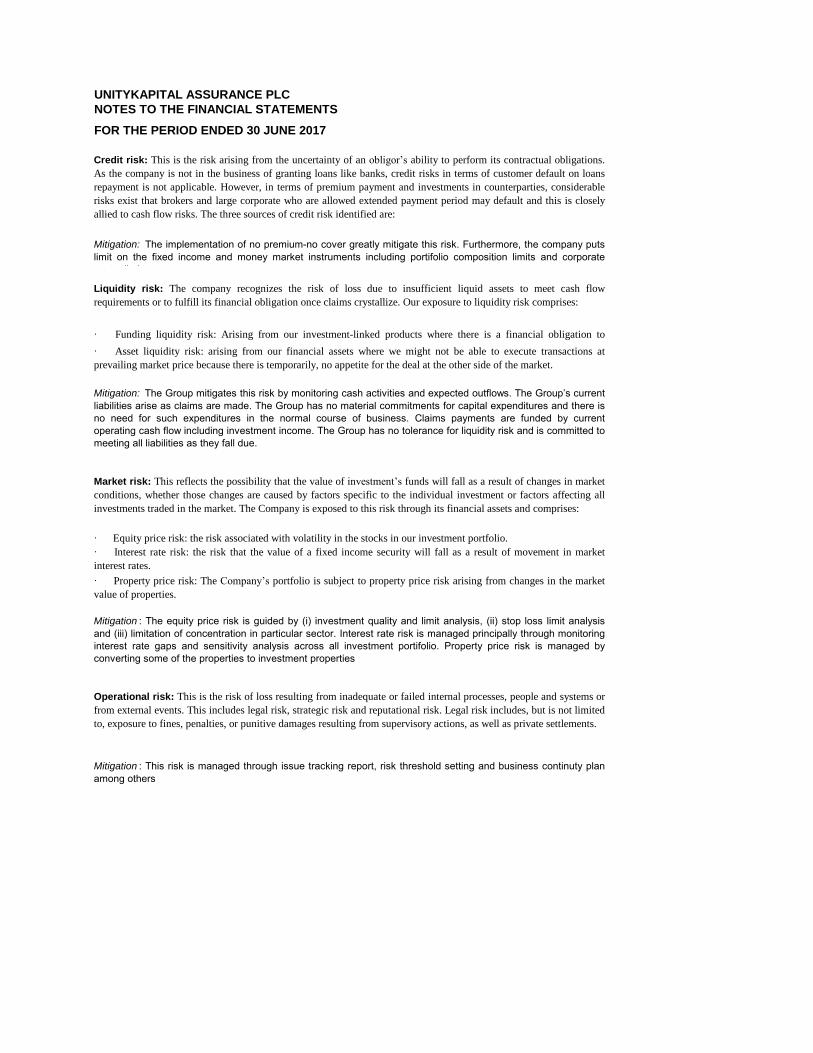
· Equity price risk: the risk associated with volatility in the stocks in our investment portfolio.
· Interest rate risk: the risk that the value of a fixed income security will fall as a result of movement in market
interest rates.
· Property price risk: The Company’s portfolio is subject to property price risk arising from changes in the market
value of properties.
Mitigation : The equity price risk is guided by (i) investment quality and limit analysis, (ii) stop loss limit analysisand (iii) limitation of concentration in particular sector. Interest rate risk is managed principally through monitoringinterest rate gaps and sensitivity analysis across all investment portifolio. Property price risk is managed byconverting some of the properties to investment properties
Credit risk: This is the risk arising from the uncertainty of an obligor’s ability to perform its contractual obligations.
As the company is not in the business of granting loans like banks, credit risks in terms of customer default on loans
repayment is not applicable. However, in terms of premium payment and investments in counterparties, considerable
risks exist that brokers and large corporate who are allowed extended payment period may default and this is closely
allied to cash flow risks. The three sources of credit risk identified are:
Mitigation: The implementation of no premium-no cover greatly mitigate this risk. Furthermore, the company putslimit on the fixed income and money market instruments including portifolio composition limits and corporatesector limits.
Liquidity risk: The company recognizes the risk of loss due to insufficient liquid assets to meet cash flow
requirements or to fulfill its financial obligation once claims crystallize. Our exposure to liquidity risk comprises:
· Funding liquidity risk: Arising from our investment-linked products where there is a financial obligation to
customers. · Asset liquidity risk: arising from our financial assets where we might not be able to execute transactions at
prevailing market price because there is temporarily, no appetite for the deal at the other side of the market.
Mitigation: The Group mitigates this risk by monitoring cash activities and expected outflows. The Group’s currentliabilities arise as claims are made. The Group has no material commitments for capital expenditures and there isno need for such expenditures in the normal course of business. Claims payments are funded by currentoperating cash flow including investment income. The Group has no tolerance for liquidity risk and is committed tomeeting all liabilities as they fall due.
Market risk: This reflects the possibility that the value of investment’s funds will fall as a result of changes in market
conditions, whether those changes are caused by factors specific to the individual investment or factors affecting all
investments traded in the market. The Company is exposed to this risk through its financial assets and comprises:
Operational risk: This is the risk of loss resulting from inadequate or failed internal processes, people and systems or
from external events. This includes legal risk, strategic risk and reputational risk. Legal risk includes, but is not limited
to, exposure to fines, penalties, or punitive damages resulting from supervisory actions, as well as private settlements.
Mitigation : This risk is managed through issue tracking report, risk threshold setting and business continuty planamong others
UNITYKAPITAL ASSURANCE PLC
NOTES TO THE FINANCIAL STATEMENTS
FOR THE PERIOD ENDED 30 JUNE 2017
2.3 Capital management
Mitigation : This is managed through consistent monitoring of produst lines' profitability.
Reputational risk: The Company is exposed to this risk through events that damage its image amongst stakeholders
and the public which may impair the ability to retain generate and drive sustainable business.We understand that
reputational risk is the biggest risk to our business as it poses a special threat to the confidence of our customers,
regulators and industry.
Mitigation : The company's reputed values set a tone for acceptable behaviours required for all staff members.These are consistently assessed and managed within the company's business process.
Underwriting risk: Our activities are primarily concerned with the pricing, acceptance and management of risks
arising from our contracts with customers. It entails the risk that:
· The prices charged by the company for insurance contracts will be ultimately inadequate to support the future
obligations arising from those contracts, risk exposure under its insurance contracts that were unanticipated in the
design and pricing of the insurance contract;
The Group’s objectives with respect to capital management are to maintain a capital base that is structure toexceed regulatory and to best utilize capital allocations.
Insurance industry regulator measures the financial strength of Non-life insurers using a solvency margin model,NAICOM generally expect non-life insurers to comply with this capital adequacy requirement.
Section 24 of the Insurance Act 2003 define Solvency Margin of a Non-life insurer as the difference between theadmissible assets and liabilities and this shall not be less than 15% of Net Premium Income (Gross PremiumIncome less Re-insurance premium paid) or the minimum capital base (3 billion) whichever is higher.
This test compares insurers’ capital against the risk profile. The regulator indicated that insurers should produce aminimum solvency margin of 100%. During the year, the company has consistently exceeded this minimum. Theregulator has the authority to request more extensive reporting and can place restrictions on the company’soperations if the company falls below this requirement and deemed necessary.
· risks are not adequately ceded to reinsurers exposing the company to potential high claims pay-out;
· many more claims occur than expected or that some claims that occur are much larger than expected claims
resulting in unexpected losses and; · The company’s policyholder will act in ways that are unanticipated and have an adverse effect on the company.
Mitigation : The company manages its underwriting risk by diversification across large portfolio of insurance as wellas re-insurance arrngement.
Business risk: Business risk relates to the potential erosion of our market position or revenue shortfall compared to
the cost base due to strategic and/or reputational reasons.
` `
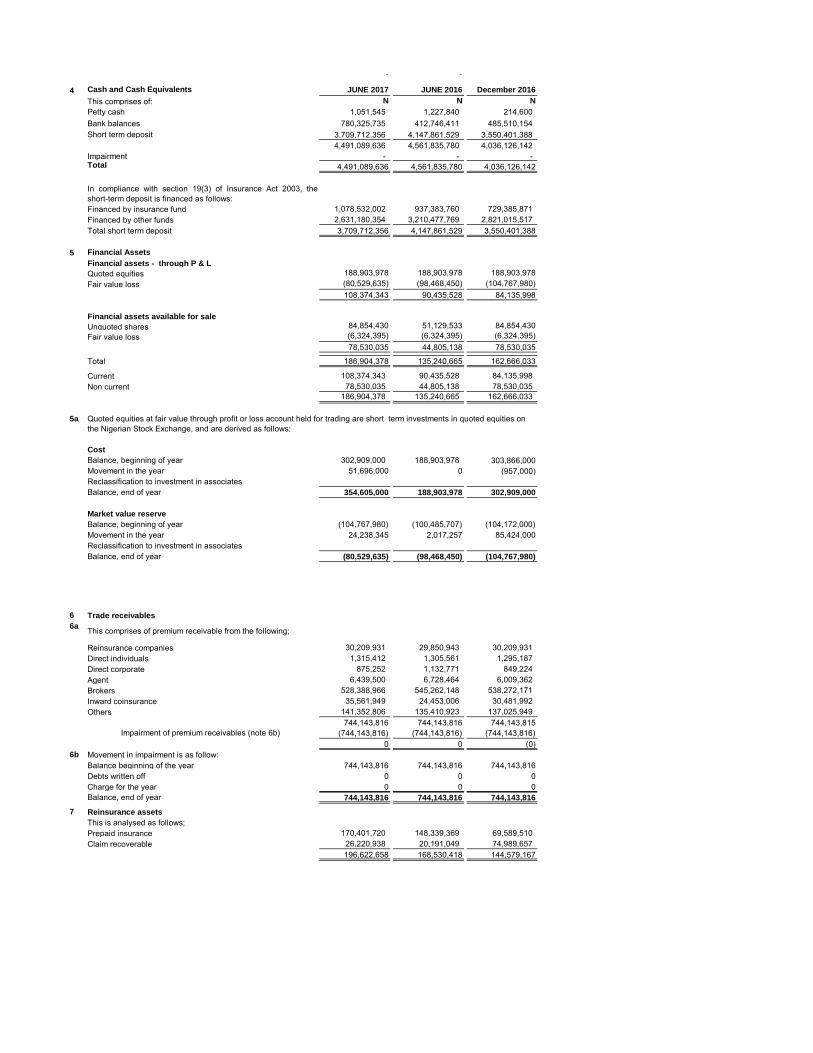
4 Cash and Cash Equivalents JUNE 2017 JUNE 2016 December 2016
This comprises of: N N N
Petty cash 1,051,545 1,227,840 214,600 780,325,735 412,746,411 485,510,154
Short term deposit 3,709,712,356 4,147,861,529 3,550,401,388 4,491,089,636 4,561,835,780 4,036,126,142
Impairment - - - Total 4,491,089,636 4,561,835,780 4,036,126,142
Financed by insurance fund 1,078,532,002 937,383,760 729,385,871 Financed by other funds 2,631,180,354 3,210,477,769 2,821,015,517 Total short term deposit 3,709,712,356 4,147,861,529 3,550,401,388
5 Financial Assets
Financial assets - through P & L
Quoted equities 188,903,978 188,903,978 188,903,978 Fair value loss (80,529,635) (98,468,450) (104,767,980)
108,374,343 90,435,528 84,135,998
Financial assets available for sale
Unquoted shares 84,854,430 51,129,533 84,854,430 Fair value loss (6,324,395) (6,324,395) (6,324,395)
78,530,035 44,805,138 78,530,035
Total 186,904,378 135,240,665 162,666,033
Current 108,374,343 90,435,528 84,135,998 Non current 78,530,035 44,805,138 78,530,035
186,904,378 135,240,665 162,666,033
5a
Cost
Balance, beginning of year 302,909,000 188,903,978 303,866,000 Movement in the year 51,696,000 0 (957,000)
Balance, end of year 354,605,000 188,903,978 302,909,000
Market value reserve
Balance, beginning of year (104,767,980) (100,485,707) (104,172,000)Movement in the year 24,238,345 2,017,257 85,424,000
Balance, end of year (80,529,635) (98,468,450) (104,767,980)
6 Trade receivables
6a
Reinsurance companies 30,209,931 29,850,943 30,209,931 Direct individuals 1,315,412 1,305,561 1,295,187 Direct corporate 875,252 1,132,771 849,224 Agent 6,439,500 6,728,464 6,009,362 Brokers 528,388,966 545,262,148 538,272,171 Inward coinsurance 35,561,949 24,453,006 30,481,992 Others 141,352,806 135,410,923 137,025,949
744,143,816 744,143,816 744,143,815 (744,143,816) (744,143,816) (744,143,816)
0 0 (0)6b Movement in impairment is as follow:
Balance beginning of the year 744,143,816 744,143,816 744,143,816 Debts written off 0 0 0 Charge for the year 0 0 0 Balance, end of year 744,143,816 744,143,816 744,143,816
7 Reinsurance assets
This is analysed as follows;Prepaid insurance 170,401,720 148,339,369 69,589,510 Claim recoverable 26,220,938 20,191,049 74,989,657
196,622,658 168,530,418 144,579,167
This comprises of premium receivable from the following;
Impairment of premium receivables (note 6b)
Bank balances
In compliance with section 19(3) of Insurance Act 2003, theshort-term deposit is financed as follows:
Quoted equities at fair value through profit or loss account held for trading are short term investments in quoted equities on the Nigerian Stock Exchange, and are derived as follows:
Reclassification to investment in associates
Reclassification to investment in associates
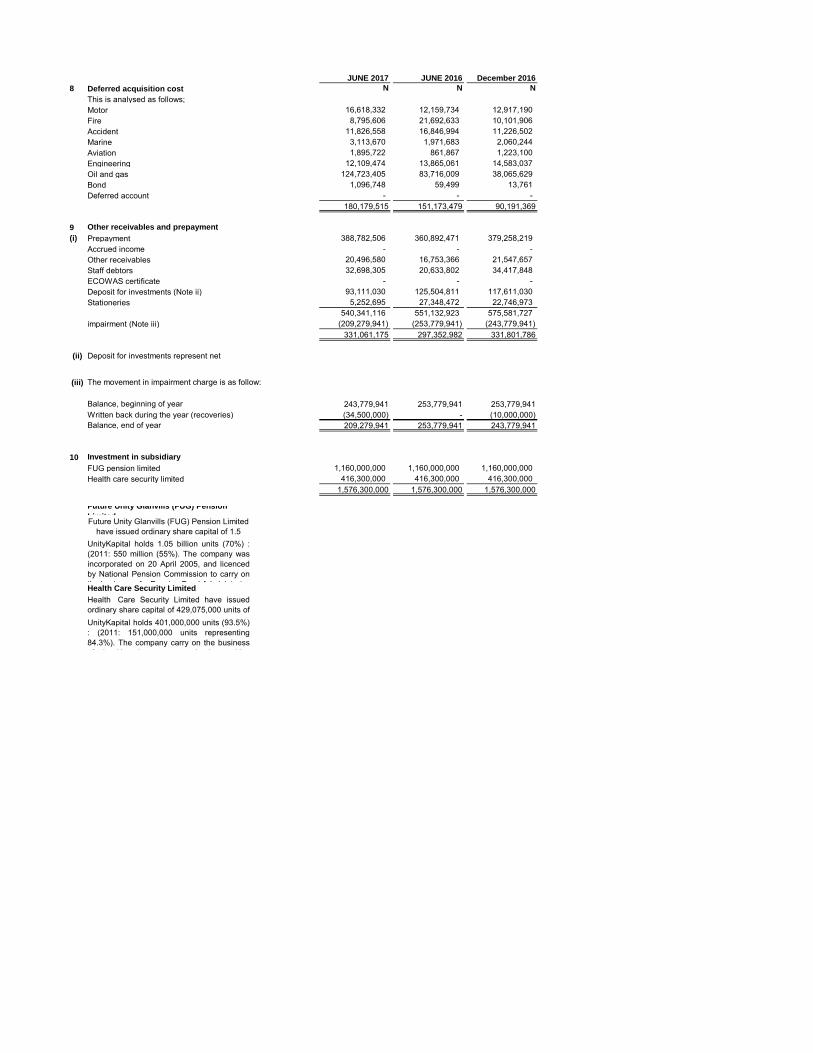
JUNE 2017 JUNE 2016 December 2016
8 Deferred acquisition cost N N N
This is analysed as follows;Motor 16,618,332 12,159,734 12,917,190 Fire 8,795,606 21,692,633 10,101,906 Accident 11,826,558 16,846,994 11,226,502 Marine 3,113,670 1,971,683 2,060,244 Aviation 1,895,722 861,867 1,223,100 Engineering 12,109,474 13,865,061 14,583,037 Oil and gas 124,723,405 83,716,009 38,065,629 Bond 1,096,748 59,499 13,761 Deferred account - - -
180,179,515 151,173,479 90,191,369
9 Other receivables and prepayment
(i) Prepayment 388,782,506 360,892,471 379,258,219 Accrued income - - - Other receivables 20,496,580 16,753,366 21,547,657 Staff debtors 32,698,305 20,633,802 34,417,848 ECOWAS certificate - - - Deposit for investments (Note ii) 93,111,030 125,504,811 117,611,030 Stationeries 5,252,695 27,348,472 22,746,973
540,341,116 551,132,923 575,581,727 impairment (Note iii) (209,279,941) (253,779,941) (243,779,941)
331,061,175 297,352,982 331,801,786
(ii) Deposit for investments represent net balances with stockbrokers for the purchase
(iii)
Balance, beginning of year 243,779,941 253,779,941 253,779,941 Written back during the year (recoveries) (34,500,000) - (10,000,000)Balance, end of year 209,279,941 253,779,941 243,779,941
10 Investment in subsidiary
FUG pension limited 1,160,000,000 1,160,000,000 1,160,000,000 Health care security limited 416,300,000 416,300,000 416,300,000
1,576,300,000 1,576,300,000 1,576,300,000
Future Unity Glanvills (FUG) Pension
LimitedFuture Unity Glanvills (FUG) Pension Limited have issued ordinary share capital of 1.5 billion units of N1 each. (2011: 1 billion UnityKapital holds 1.05 billion units (70%) :
(2011: 550 million (55%). The company wasincorporated on 20 April 2005, and licencedby National Pension Commission to carry onthe business of a Pension Fund Administrator Health Care Security Limited
Health Care Security Limited have issuedordinary share capital of 429,075,000 units ofN1 each (2011: 179,075,000 units).UnityKapital holds 401,000,000 units (93.5%): (2011: 151,000,000 units representing84.3%). The company carry on the businessof a health maintenance organisation, and its
The movement in impairment charge is as follow:
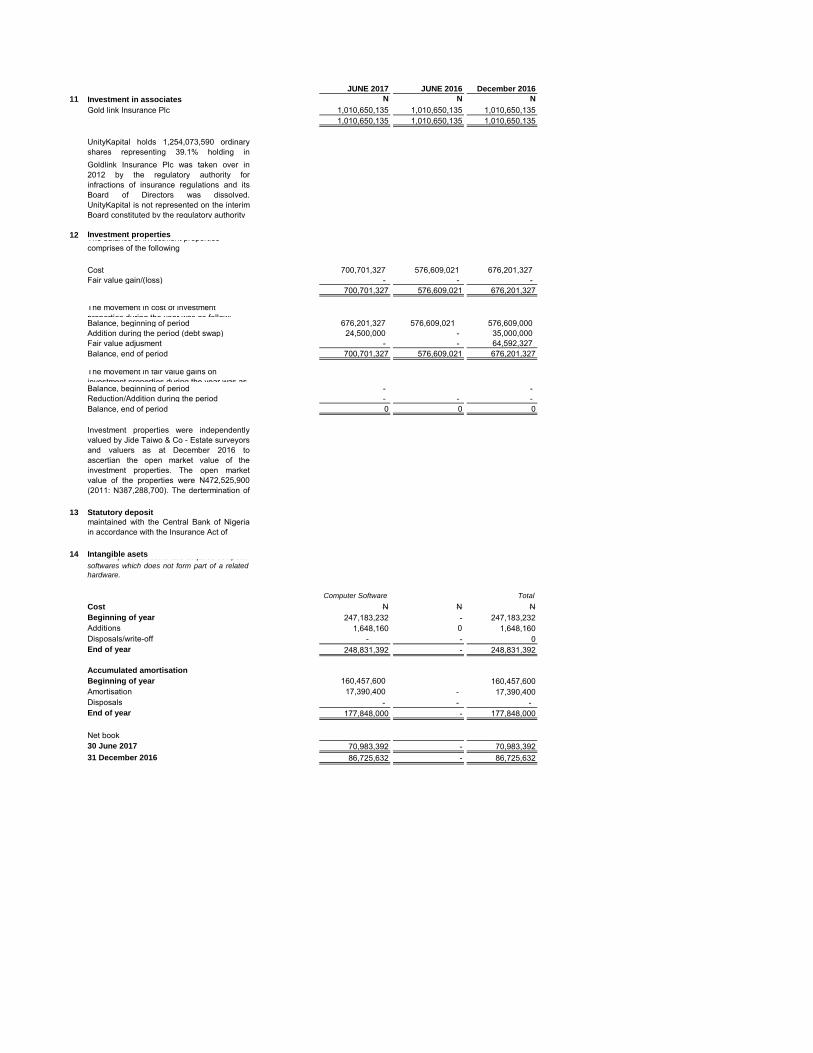
JUNE 2017 JUNE 2016 December 2016
11 Investment in associates N N N
Gold link Insurance Plc 1,010,650,135 1,010,650,135 1,010,650,135 1,010,650,135 1,010,650,135 1,010,650,135
UnityKapital holds 1,254,073,590 ordinaryshares representing 39.1% holding inGoldlink Insurance Plc as at 31/12/2012 Goldlink Insurance Plc was taken over in2012 by the regulatory authority forinfractions of insurance regulations and itsBoard of Directors was dissolved.UnityKapital is not represented on the interimBoard constituted by the regulatory authority
12 Investment propertiesThe balance of investment properties comprises of the following
Cost 700,701,327 576,609,021 676,201,327 Fair value gain/(loss) - - -
700,701,327 576,609,021 676,201,327
The movement in cost of investment properties during the year was as follow:Balance, beginning of period 676,201,327 576,609,021 576,609,000 Addition during the period (debt swap) 24,500,000 - 35,000,000 Fair value adjusment - - 64,592,327 Balance, end of period 700,701,327 576,609,021 676,201,327
The movement in fair value gains on investment properties during the year was as Balance, beginning of period - - Reduction/Addition during the period - - - Balance, end of period 0 0 0
Investment properties were independentlyvalued by Jide Taiwo & Co - Estate surveyorsand valuers as at December 2016 toascertian the open market value of theinvestment properties. The open marketvalue of the properties were N472,525,900(2011: N387,288,700). The dertermination ofopen market value of the investment
13 Statutory depositThis represents the mandatory depositmaintained with the Central Bank of Nigeriain accordance with the Insurance Act of
14 Intangible asetsThis comprises Goodwill and acquired computer
softwares which does not form part of a related
hardware.
Computer Software Total
Cost N N NBeginning of year 247,183,232 - 247,183,232 Additions 1,648,160 0 1,648,160 Disposals/write-off - - 0 End of year 248,831,392 - 248,831,392
Accumulated amortisation
Beginning of year 160,457,600 160,457,600 Amortisation 17,390,400 - 17,390,400 Disposals - - - End of year 177,848,000 - 177,848,000
Net book30 June 2017 70,983,392 - 70,983,392 31 December 2016 86,725,632 - 86,725,632
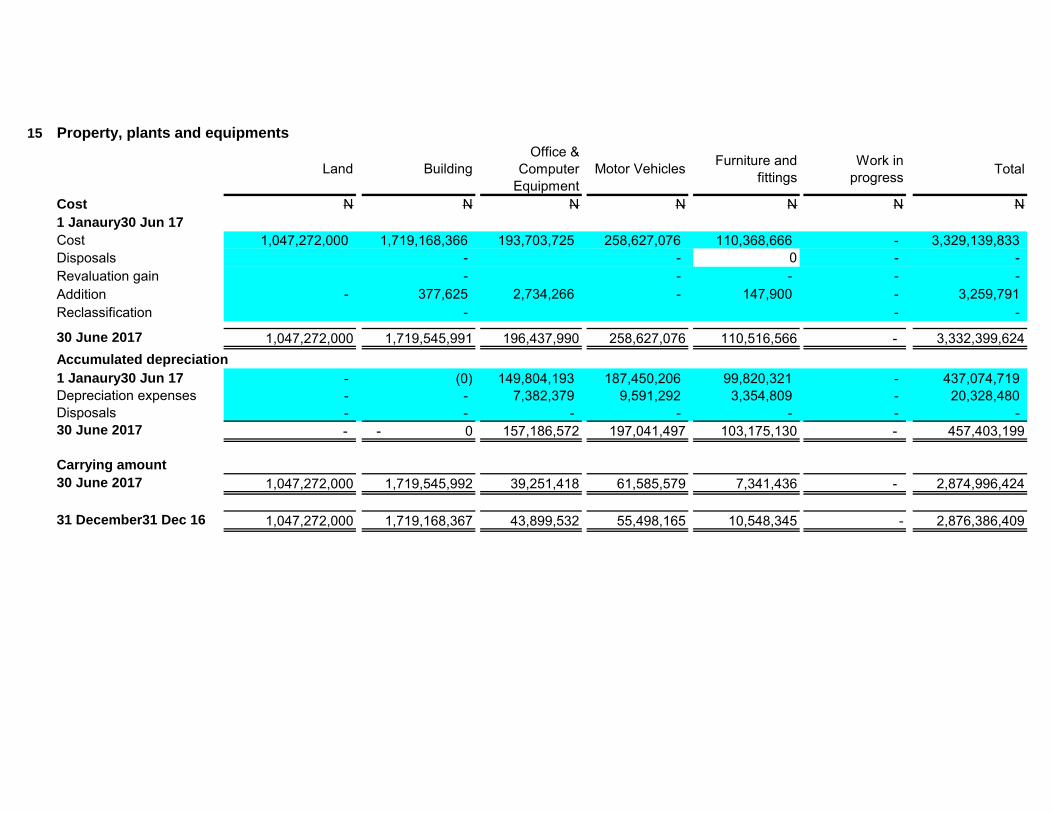
15 Property, plants and equipments
Land BuildingOffice &
Computer Equipment
Motor Vehicles Furniture and fittings
Work in progress Total
Cost N N N N N N N1 Janaury30 Jun 17
Cost 1,047,272,000 1,719,168,366 193,703,725 258,627,076 110,368,666 - 3,329,139,833 Disposals - - 0 - - Revaluation gain - - - - - Addition - 377,625 2,734,266 - 147,900 - 3,259,791 Reclassification - - -
30 June 2017 1,047,272,000 1,719,545,991 196,437,990 258,627,076 110,516,566 - 3,332,399,624 Accumulated depreciation
1 Janaury30 Jun 17 - (0) 149,804,193 187,450,206 99,820,321 - 437,074,719 Depreciation expenses - - 7,382,379 9,591,292 3,354,809 - 20,328,480 Disposals - - - - - - - 30 June 2017 - - 0 157,186,572 197,041,497 103,175,130 - 457,403,199
Carrying amount
30 June 2017 1,047,272,000 1,719,545,992 39,251,418 61,585,579 7,341,436 - 2,874,996,424
31 December31 Dec 16 1,047,272,000 1,719,168,367 43,899,532 55,498,165 10,548,345 - 2,876,386,409
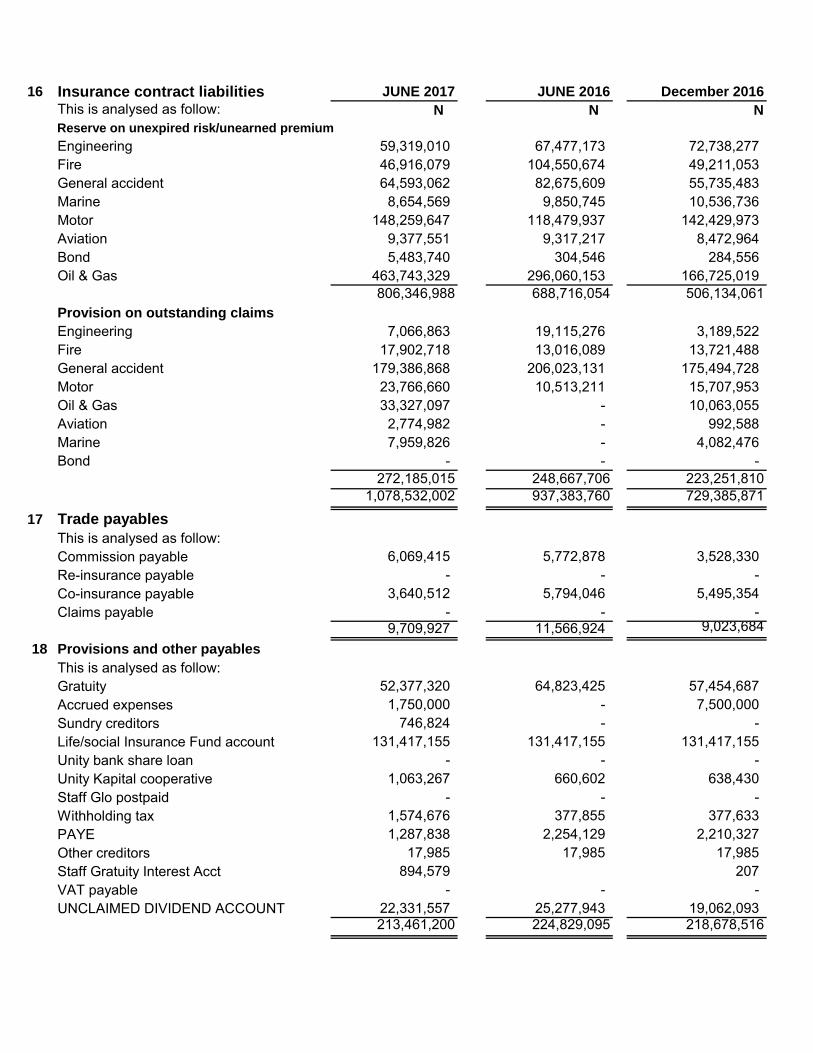
16 Insurance contract liabilities JUNE 2017 JUNE 2016 December 2016
This is analysed as follow: N N N
Reserve on unexpired risk/unearned premium
Engineering 59,319,010 67,477,173 72,738,277 Fire 46,916,079 104,550,674 49,211,053 General accident 64,593,062 82,675,609 55,735,483 Marine 8,654,569 9,850,745 10,536,736 Motor 148,259,647 118,479,937 142,429,973 Aviation 9,377,551 9,317,217 8,472,964 Bond 5,483,740 304,546 284,556 Oil & Gas 463,743,329 296,060,153 166,725,019
806,346,988 688,716,054 506,134,061 Provision on outstanding claims
Engineering 7,066,863 19,115,276 3,189,522 Fire 17,902,718 13,016,089 13,721,488 General accident 179,386,868 206,023,131 175,494,728 Motor 23,766,660 10,513,211 15,707,953 Oil & Gas 33,327,097 - 10,063,055 Aviation 2,774,982 - 992,588 Marine 7,959,826 - 4,082,476 Bond - - -
272,185,015 248,667,706 223,251,810 1,078,532,002 937,383,760 729,385,871
17 Trade payables
This is analysed as follow:Commission payable 6,069,415 5,772,878 3,528,330 Re-insurance payable - - - Co-insurance payable 3,640,512 5,794,046 5,495,354 Claims payable - - -
9,709,927 11,566,924 9,023,684 18 Provisions and other payables
This is analysed as follow:Gratuity 52,377,320 64,823,425 57,454,687 Accrued expenses 1,750,000 - 7,500,000 Sundry creditors 746,824 - - Life/social Insurance Fund account 131,417,155 131,417,155 131,417,155 Unity bank share loan - - - Unity Kapital cooperative 1,063,267 660,602 638,430 Staff Glo postpaid - - - Withholding tax 1,574,676 377,855 377,633 PAYE 1,287,838 2,254,129 2,210,327 Other creditors 17,985 17,985 17,985 Staff Gratuity Interest Acct 894,579 207 VAT payable - - - UNCLAIMED DIVIDEND ACCOUNT 22,331,557 25,277,943 19,062,093
213,461,200 224,829,095 218,678,516
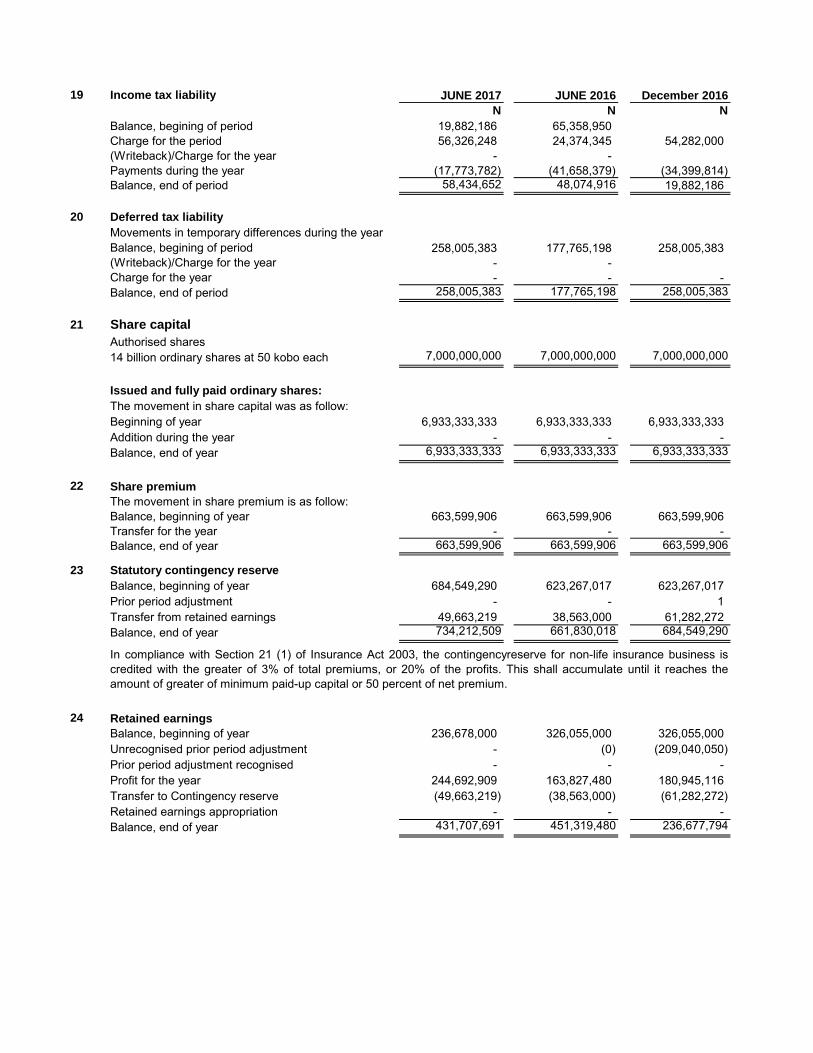
19 Income tax liability JUNE 2017 JUNE 2016 December 2016
N N N
Balance, begining of period 19,882,186 65,358,950 Charge for the period 56,326,248 24,374,345 54,282,000 (Writeback)/Charge for the year - - Payments during the year (17,773,782) (41,658,379) (34,399,814) Balance, end of period 58,434,652 48,074,916 19,882,186
20 Deferred tax liability
Movements in temporary differences during the yearBalance, begining of period 258,005,383 177,765,198 258,005,383 (Writeback)/Charge for the year - - Charge for the year - - - Balance, end of period 258,005,383 177,765,198 258,005,383
21 Share capital
Authorised shares14 billion ordinary shares at 50 kobo each 7,000,000,000 7,000,000,000 7,000,000,000
Issued and fully paid ordinary shares:
The movement in share capital was as follow:Beginning of year 6,933,333,333 6,933,333,333 6,933,333,333 Addition during the year - - - Balance, end of year 6,933,333,333 6,933,333,333 6,933,333,333
22 Share premium
The movement in share premium is as follow:Balance, beginning of year 663,599,906 663,599,906 663,599,906 Transfer for the year - - - Balance, end of year 663,599,906 663,599,906 663,599,906
23
Balance, beginning of year 684,549,290 623,267,017 623,267,017 Prior period adjustment - - 1 Transfer from retained earnings 49,663,219 38,563,000 61,282,272 Balance, end of year 734,212,509 661,830,018 684,549,290
24 Retained earnings
Balance, beginning of year 236,678,000 326,055,000 326,055,000 Unrecognised prior period adjustment - (0) (209,040,050) Prior period adjustment recognised - - - Profit for the year 244,692,909 163,827,480 180,945,116 Transfer to Contingency reserve (49,663,219) (38,563,000) (61,282,272) Retained earnings appropriation - - - Balance, end of year 431,707,691 451,319,480 236,677,794
In compliance with Section 21 (1) of Insurance Act 2003, the contingencyreserve for non-life insurance business iscredited with the greater of 3% of total premiums, or 20% of the profits. This shall accumulate until it reaches theamount of greater of minimum paid-up capital or 50 percent of net premium.
Statutory contingency reserve
JUNE 2017 JUNE 2016 December 2016
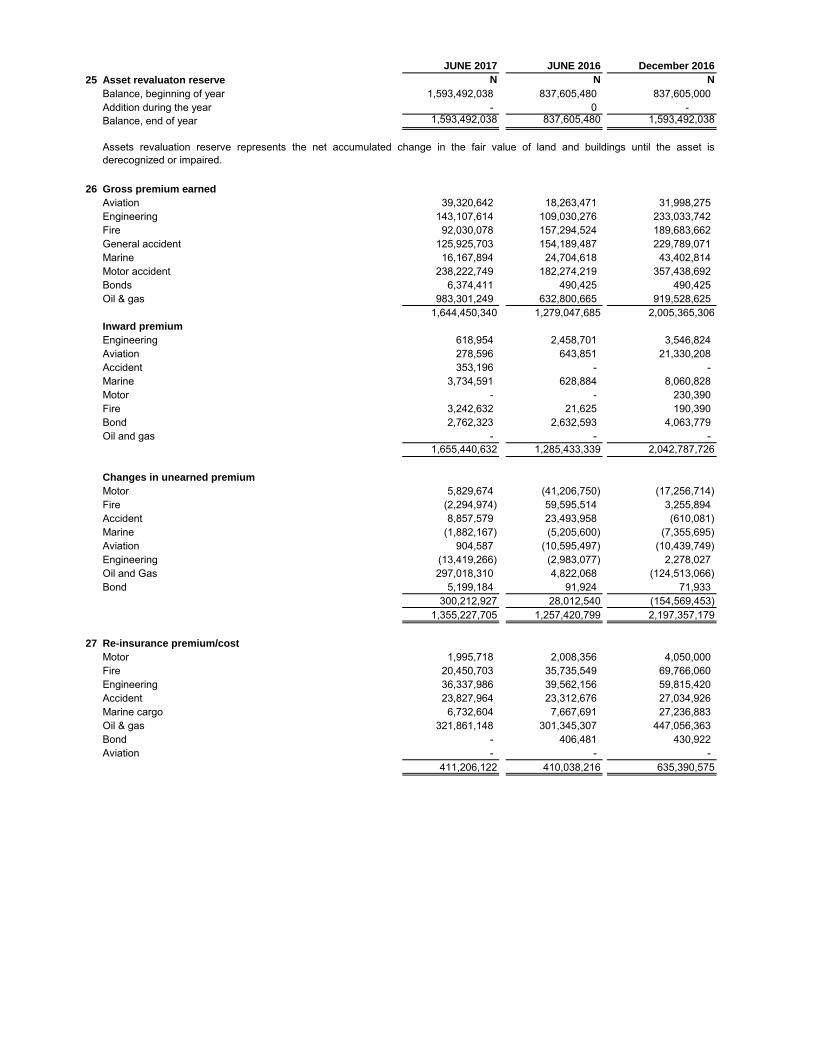
25 Asset revaluaton reserve N N N
Balance, beginning of year 1,593,492,038 837,605,480 837,605,000 Addition during the year - 0 - Balance, end of year 1,593,492,038 837,605,480 1,593,492,038
26 Gross premium earned
Aviation 39,320,642 18,263,471 31,998,275 Engineering 143,107,614 109,030,276 233,033,742 Fire 92,030,078 157,294,524 189,683,662 General accident 125,925,703 154,189,487 229,789,071 Marine 16,167,894 24,704,618 43,402,814 Motor accident 238,222,749 182,274,219 357,438,692 Bonds 6,374,411 490,425 490,425 Oil & gas 983,301,249 632,800,665 919,528,625
1,644,450,340 1,279,047,685 2,005,365,306 Inward premium
Engineering 618,954 2,458,701 3,546,824 Aviation 278,596 643,851 21,330,208 Accident 353,196 - - Marine 3,734,591 628,884 8,060,828 Motor - - 230,390 Fire 3,242,632 21,625 190,390 Bond 2,762,323 2,632,593 4,063,779 Oil and gas - - -
1,655,440,632 1,285,433,339 2,042,787,726
Changes in unearned premium
Motor 5,829,674 (41,206,750) (17,256,714) Fire (2,294,974) 59,595,514 3,255,894 Accident 8,857,579 23,493,958 (610,081) Marine (1,882,167) (5,205,600) (7,355,695) Aviation 904,587 (10,595,497) (10,439,749) Engineering (13,419,266) (2,983,077) 2,278,027 Oil and Gas 297,018,310 4,822,068 (124,513,066) Bond 5,199,184 91,924 71,933
300,212,927 28,012,540 (154,569,453)1,355,227,705 1,257,420,799 2,197,357,179
27 Re-insurance premium/cost
Motor 1,995,718 2,008,356 4,050,000 Fire 20,450,703 35,735,549 69,766,060 Engineering 36,337,986 39,562,156 59,815,420 Accident 23,827,964 23,312,676 27,034,926 Marine cargo 6,732,604 7,667,691 27,236,883 Oil & gas 321,861,148 301,345,307 447,056,363 Bond - 406,481 430,922 Aviation - - -
411,206,122 410,038,216 635,390,575
Assets revaluation reserve represents the net accumulated change in the fair value of land and buildings until the asset isderecognized or impaired.
JUNE 2017 JUNE 2016 December 2016
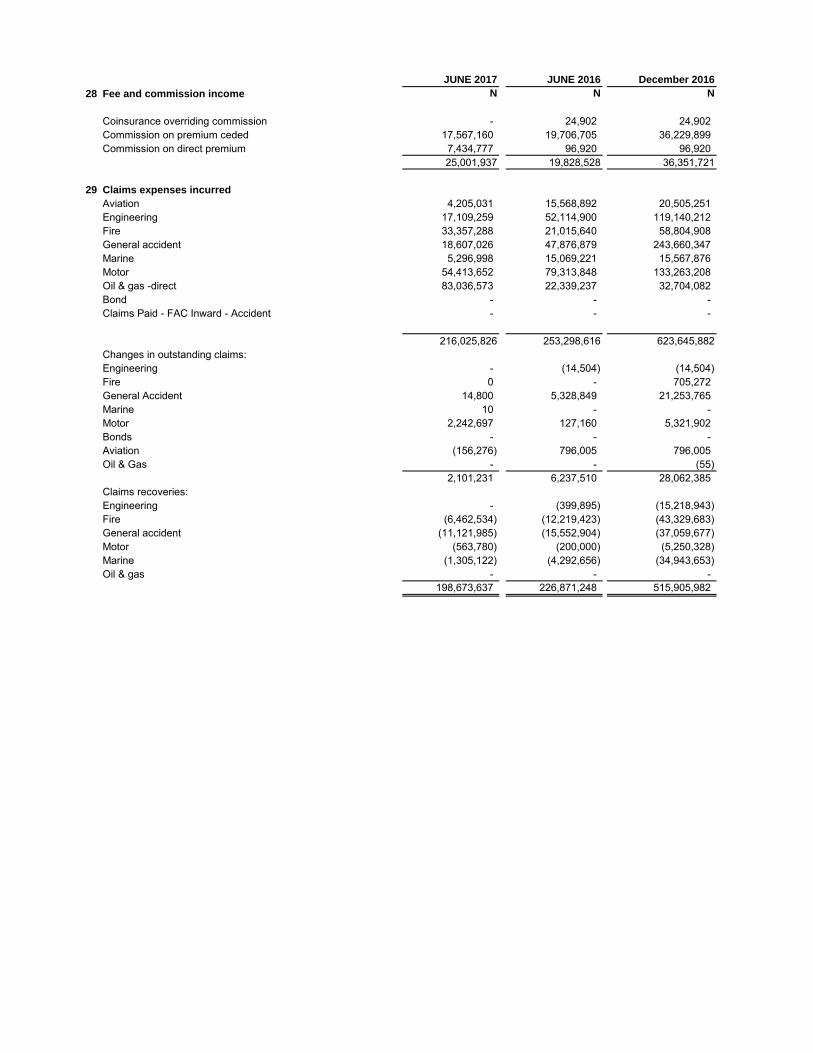
28 Fee and commission income N N N
Coinsurance overriding commission - 24,902 24,902 Commission on premium ceded 17,567,160 19,706,705 36,229,899 Commission on direct premium 7,434,777 96,920 96,920
25,001,937 19,828,528 36,351,721
29 Claims expenses incurred
Aviation 4,205,031 15,568,892 20,505,251 Engineering 17,109,259 52,114,900 119,140,212 Fire 33,357,288 21,015,640 58,804,908 General accident 18,607,026 47,876,879 243,660,347 Marine 5,296,998 15,069,221 15,567,876 Motor 54,413,652 79,313,848 133,263,208 Oil & gas -direct 83,036,573 22,339,237 32,704,082 Bond - - - Claims Paid - FAC Inward - Accident - - -
216,025,826 253,298,616 623,645,882 Changes in outstanding claims:Engineering - (14,504) (14,504) Fire 0 - 705,272 General Accident 14,800 5,328,849 21,253,765 Marine 10 - - Motor 2,242,697 127,160 5,321,902 Bonds - - - Aviation (156,276) 796,005 796,005 Oil & Gas - - (55)
2,101,231 6,237,510 28,062,385 Claims recoveries:Engineering - (399,895) (15,218,943) Fire (6,462,534) (12,219,423) (43,329,683) General accident (11,121,985) (15,552,904) (37,059,677) Motor (563,780) (200,000) (5,250,328) Marine (1,305,122) (4,292,656) (34,943,653) Oil & gas - - -
198,673,637 226,871,248 515,905,982
JUNE 2017 JUNE 2016 December 2016
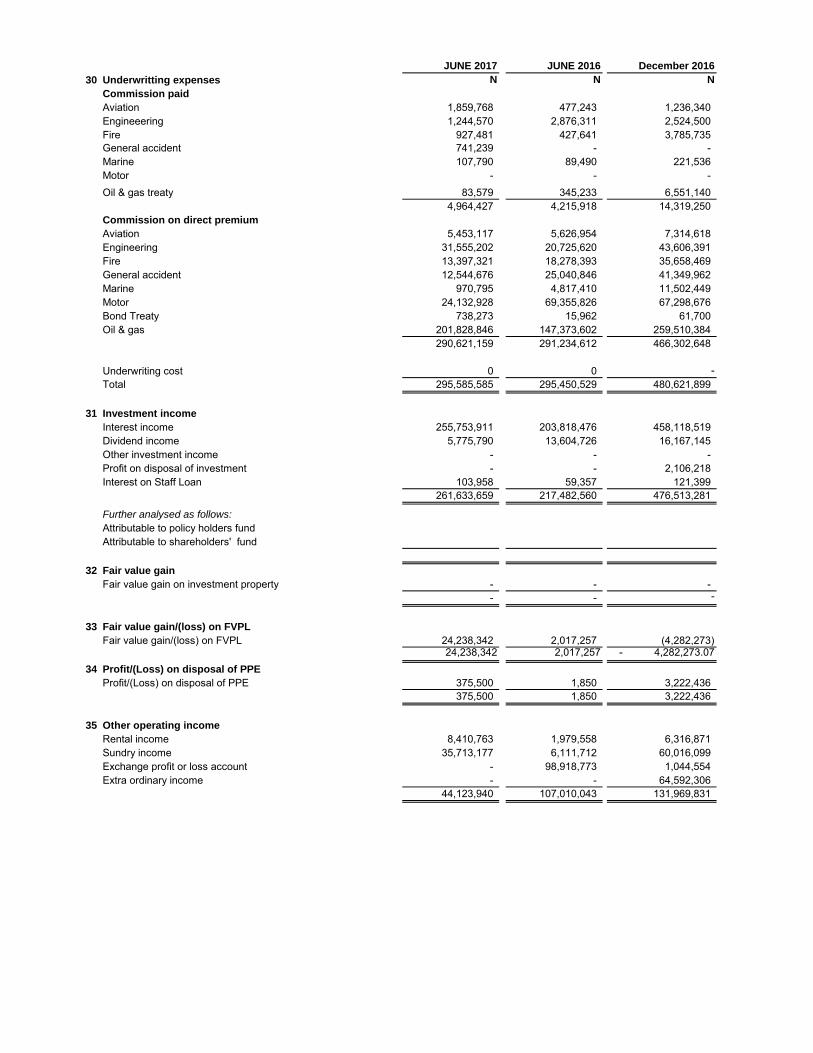
30 Underwritting expenses N N N
Commission paid
Aviation 1,859,768 477,243 1,236,340 Engineeering 1,244,570 2,876,311 2,524,500 Fire 927,481 427,641 3,785,735 General accident 741,239 - - Marine 107,790 89,490 221,536 Motor - - - Oil & gas treaty 83,579 345,233 6,551,140
4,964,427 4,215,918 14,319,250Commission on direct premium
Aviation 5,453,117 5,626,954 7,314,618 Engineering 31,555,202 20,725,620 43,606,391 Fire 13,397,321 18,278,393 35,658,469 General accident 12,544,676 25,040,846 41,349,962 Marine 970,795 4,817,410 11,502,449 Motor 24,132,928 69,355,826 67,298,676 Bond Treaty 738,273 15,962 61,700 Oil & gas 201,828,846 147,373,602 259,510,384
290,621,159 291,234,612 466,302,648
Underwriting cost 0 0 - Total 295,585,585 295,450,529 480,621,899
31 Investment income
Interest income 255,753,911 203,818,476 458,118,519 Dividend income 5,775,790 13,604,726 16,167,145 Other investment income - - - Profit on disposal of investment - - 2,106,218 Interest on Staff Loan 103,958 59,357 121,399
261,633,659 217,482,560 476,513,281
Further analysed as follows:
Attributable to policy holders fundAttributable to shareholders' fund
32 Fair value gain
Fair value gain on investment property - - - - - -
33 Fair value gain/(loss) on FVPL
Fair value gain/(loss) on FVPL 24,238,342 2,017,257 (4,282,273) 24,238,342 2,017,257 - 4,282,273.07
34 Profit/(Loss) on disposal of PPE
Profit/(Loss) on disposal of PPE 375,500 1,850 3,222,436 375,500 1,850 3,222,436
35 Other operating income
Rental income 8,410,763 1,979,558 6,316,871 Sundry income 35,713,177 6,111,712 60,016,099 Exchange profit or loss account - 98,918,773 1,044,554 Extra ordinary income - - 64,592,306
44,123,940 107,010,043 131,969,831
JUNE 2017 'JUNE 2016 December 2016
N N N
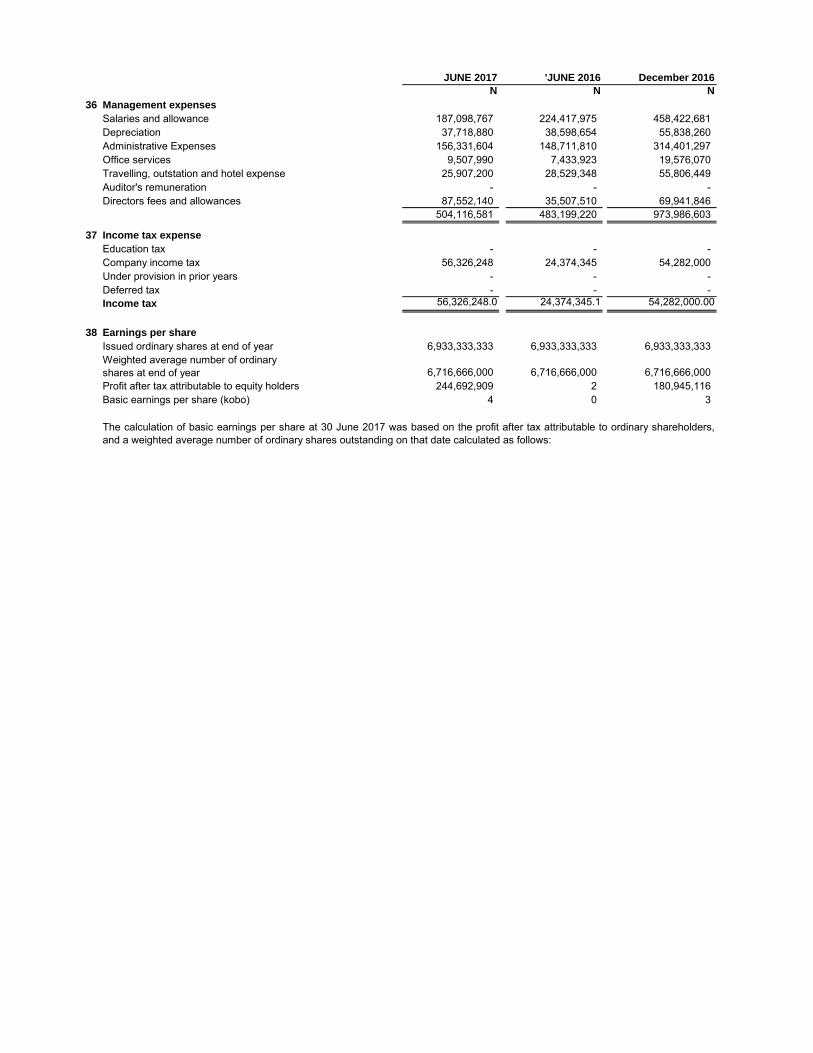
36 Management expenses
Salaries and allowance 187,098,767 224,417,975 458,422,681 Depreciation 37,718,880 38,598,654 55,838,260 Administrative Expenses 156,331,604 148,711,810 314,401,297 Office services 9,507,990 7,433,923 19,576,070 Travelling, outstation and hotel expense 25,907,200 28,529,348 55,806,449 Auditor's remuneration - - - Directors fees and allowances 87,552,140 35,507,510 69,941,846
504,116,581 483,199,220 973,986,603
37 Income tax expense
Education tax - - - Company income tax 56,326,248 24,374,345 54,282,000 Under provision in prior years - - - Deferred tax - - - Income tax 56,326,248.0 24,374,345.1 54,282,000.00
38 Earnings per share
Issued ordinary shares at end of year 6,933,333,333 6,933,333,333 6,933,333,333 Weighted average number of ordinary shares at end of year 6,716,666,000 6,716,666,000 6,716,666,000 Profit after tax attributable to equity holders 244,692,909 2 180,945,116 Basic earnings per share (kobo) 4 0 3
The calculation of basic earnings per share at 30 June 2017 was based on the profit after tax attributable to ordinary shareholders,and a weighted average number of ordinary shares outstanding on that date calculated as follows:
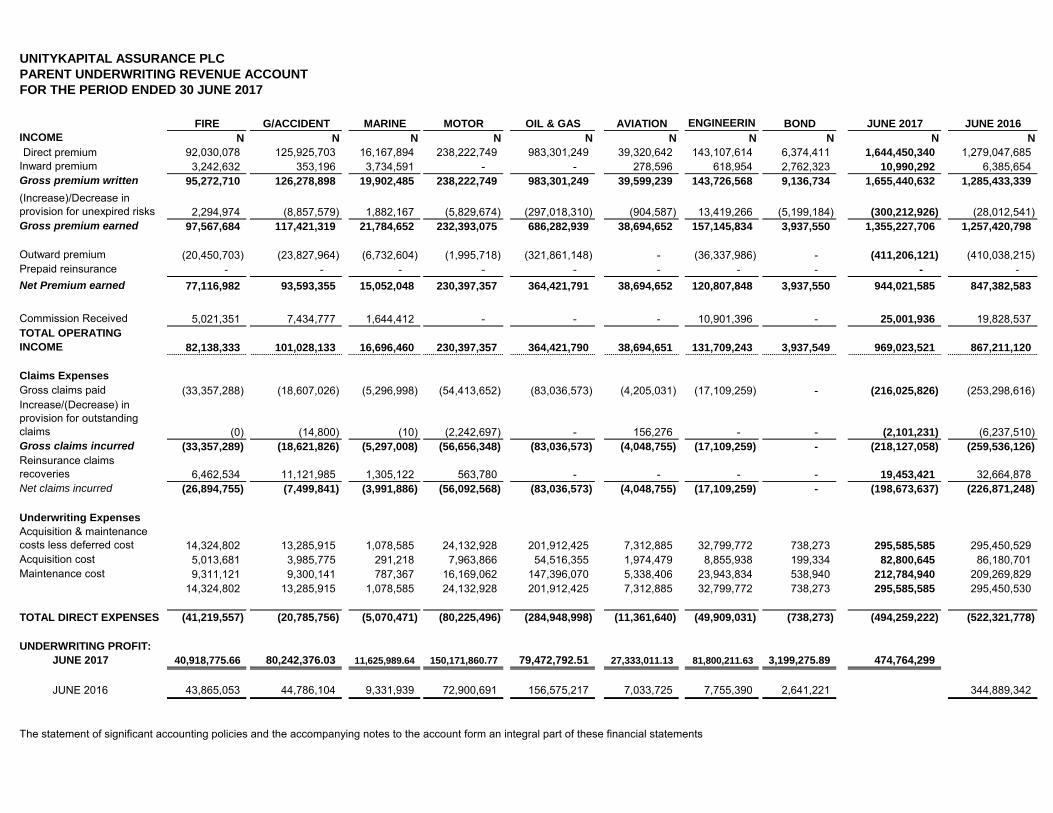
UNITYKAPITAL ASSURANCE PLC
PARENT UNDERWRITING REVENUE ACCOUNT
FOR THE PERIOD ENDED 30 JUNE 2017
FIRE G/ACCIDENT MARINE MOTOR OIL & GAS AVIATION
ENGINEERIN BOND JUNE 2017 JUNE 2016
INCOME N N N N N N N N N N
Direct premium 92,030,078 125,925,703 16,167,894 238,222,749 983,301,249 39,320,642 143,107,614 6,374,411 1,644,450,340 1,279,047,685 Inward premium 3,242,632 353,196 3,734,591 - - 278,596 618,954 2,762,323 10,990,292 6,385,654 Gross premium written 95,272,710 126,278,898 19,902,485 238,222,749 983,301,249 39,599,239 143,726,568 9,136,734 1,655,440,632 1,285,433,339
(Increase)/Decrease in provision for unexpired risks 2,294,974 (8,857,579) 1,882,167 (5,829,674) (297,018,310) (904,587) 13,419,266 (5,199,184) (300,212,926) (28,012,541) Gross premium earned 97,567,684 117,421,319 21,784,652 232,393,075 686,282,939 38,694,652 157,145,834 3,937,550 1,355,227,706 1,257,420,798
Outward premium (20,450,703) (23,827,964) (6,732,604) (1,995,718) (321,861,148) - (36,337,986) - (411,206,121) (410,038,215) Prepaid reinsurance - - - - - - - - - - Net Premium earned 77,116,982 93,593,355 15,052,048 230,397,357 364,421,791 38,694,652 120,807,848 3,937,550 944,021,585 847,382,583
Commission Received 5,021,351 7,434,777 1,644,412 - - - 10,901,396 - 25,001,936 19,828,537 TOTAL OPERATING
INCOME 82,138,333 101,028,133 16,696,460 230,397,357 364,421,790 38,694,651 131,709,243 3,937,549 969,023,521 867,211,120
Claims Expenses
Gross claims paid (33,357,288) (18,607,026) (5,296,998) (54,413,652) (83,036,573) (4,205,031) (17,109,259) - (216,025,826) (253,298,616) Increase/(Decrease) in provision for outstanding claims (0) (14,800) (10) (2,242,697) - 156,276 - - (2,101,231) (6,237,510) Gross claims incurred (33,357,289) (18,621,826) (5,297,008) (56,656,348) (83,036,573) (4,048,755) (17,109,259) - (218,127,058) (259,536,126)
Reinsurance claims recoveries 6,462,534 11,121,985 1,305,122 563,780 - - - - 19,453,421 32,664,878 Net claims incurred (26,894,755) (7,499,841) (3,991,886) (56,092,568) (83,036,573) (4,048,755) (17,109,259) - (198,673,637) (226,871,248)
Underwriting Expenses
Acquisition & maintenance costs less deferred cost 14,324,802 13,285,915 1,078,585 24,132,928 201,912,425 7,312,885 32,799,772 738,273 295,585,585 295,450,529 Acquisition cost 5,013,681 3,985,775 291,218 7,963,866 54,516,355 1,974,479 8,855,938 199,334 82,800,645 86,180,701 Maintenance cost 9,311,121 9,300,141 787,367 16,169,062 147,396,070 5,338,406 23,943,834 538,940 212,784,940 209,269,829
14,324,802 13,285,915 1,078,585 24,132,928 201,912,425 7,312,885 32,799,772 738,273 295,585,585 295,450,530
TOTAL DIRECT EXPENSES (41,219,557) (20,785,756) (5,070,471) (80,225,496) (284,948,998) (11,361,640) (49,909,031) (738,273) (494,259,222) (522,321,778)
UNDERWRITING PROFIT:
JUNE 2017 40,918,775.66 80,242,376.03 11,625,989.64 150,171,860.77 79,472,792.51 27,333,011.13 81,800,211.63 3,199,275.89 474,764,299
JUNE 2016 43,865,053 44,786,104 9,331,939 72,900,691 156,575,217 7,033,725 7,755,390 2,641,221 344,889,342
The statement of significant accounting policies and the accompanying notes to the account form an integral part of these financial statements