Embed Size (px)
Citation preview

33ADELAIDE BRIGHTON LTD ANNUAL REPORT 2016

34
Financial statements contents
ADELAIDE BRIGHTON LTD ANNUAL REPORT 2016
. . . . . . . . . . . . . . . . . . . . . . . . . . . . . . . . . . . . . . . . . . . . . . . . . . . . . . . . . . . . . . . . . . . . . . . . . . . . . . . . . . . . . . . . . . . . . . . . . . . . . . . . . .
. . . . . . . . . . . . . . . . . . . . . . . . . . . . . . . . . . . . . . . . . . . . . . . . . . . . . . . . . . . . . . . . . . . . . . . . . . . . . . . . . . . . . . . . . . . . . . . .
. . . . . . . . . . . . . . . . . . . . . . . . . . . . . . . . . . . . . . . . . . . . . . . . . . . . . . . . . . . . . . . . . . . . . . . . . . . . . . . . . . . . . . . . . . . . . .
. . . . . . . . . . . . . . . . . . . . . . . . . . . . . . . . . . . . . . . . . . . . . . . . . . . . . . . . . . . . . . . . . . . . . . . . . . . . . . . . . . . . . . . . . .
. . . . . . . . . . . . . . . . . . . . . . . . . . . . . . . .
. . . . . . . . . . . . . . . . . . . . . . . . . . . . . . . . . . . . . . . . . . . . . . . . . . . . . . . . . . . . . . . . . . . . . . . . . .
. . . . . . . . . . . . . . . . . . . . . . . . . . . . . . . . . . . . . . . . . . . . . . . . . . . . . . . . . . . . . . . . . . . . . . . . . . . . . . . . . . . . . . . . . . . . . . . . . . . . . . . . . . . . . . . . . . . .
. . . . . . . . . . . . . . . . . . . . . . . . . . . . . . . . . . . . . . . . . . . . . . . . . . . . . . . . . . . . . . . . . . . . . . . . . . . . . . . . . . . . . . . . .
. . . . . . . . . . . . . . . . . . . . . . . . . . . . . . . . . . . . . . . . . . . . . . . . . . . . . . . . . . . . . . . . . . . . . . . . . . . . . . . . . . . . . . . . . . . . . . . . . . . . . . . . . . . . . . . . . . . . . . . . . . . . . . . . . . . . . . . . .
. . . . . . . . . . . . . . . . . . . . . . . . . . . . . . . . . . . . . . . . . . . . . . . . . . . . . . . . . . . . . . . . . . . . . . . . . . . . . . . . . . . . . . . . . . . . . . . . . . . . . . . . . . . . . . . . . . . . . . . . . . . . . . . . . . . . . . . . . . . . . . . . . .
. . . . . . . . . . . . . . . . . . . . . . . . . . . . . . . . . . . . . . . . . . . . . .. . . . . . . . . . . . . . . . . . . . . . . . . . . . . . . . . . . . .
. . . . . . . . . . . . . . . . . . . . . . . . . . . . . . . . . . . . . . . . . . . . . . . . . . . . . . . . . . . . . . . . . . . . . . . . . . . . . . . . . . . . . . . . . . . . . . . . . . . . . . . . . . . . . . . .
. . . . . . . . . . . . . . . . . . . . . . . . . . . . . . . . . . . . . . . . . . . . . . . . . . . . . . . . . . . . . . . . . . . . . . . . . . . . . . . . . . . . . . . . . . . . . . . . .
. . . . . . . . . . . . . . . . . . . . . . . . . . . . . . . . . . . . . . . . . . . . . . . . . . . . . . . . . . . . . . . . . . . . . . . . . . . . . . . . . . . . . . . . . . . . . . . . . . .
. . . . . . . . . . . . . . . . . . . . . . . . . . . . . . . . . . . . . . . . . . . .. . . . . . . . . . . . . . . . . . . . . . . . . . . . . . . . . . . . . . . . . . . . . .
. . . . . . . . . . . . . . . . . . . . . . . . . . . . . . . . . . . . . . . . . . . . . . . . . . . . . . .. . . . . . . . . . . . . . . . . . . . . . . . . . . . . . . . . . . . .
. . . . . . . . . . . . . . . . . . . . . . . . . . . . . . . . . . . . . . . . . . . . . . . . . . . . . . . . . . . . . . . . . . . . . . . . . . . . . . . . . . . . . . . . . .
. . . . . . . . . . . . . . . . . . . . . . . . . . . . . . . . . . . . . . . . . . . . . . . . . . . . . .. . . . . . . . . . . . . . . . . . .
. . . . . . . . . . . . . . . . . . . . . . . . . . . . . . . . . . . . . . . . . . . . . . . . . .
. . . . . . . . . . . . . . . . . . . . . . . . . . . . . . . . . . . . . . . . . . . . . . . . . . . . . . . . . . . . . . . . . . . . . . . . . . . . . . . . . . . . . . . . . . . . . . . . . . . . . .
. . . . . . . . . . . . . . . . . . . . . . . . . . . . . . . . . . . . . . . . . . . . . . . . . . . . . . . . . . . . . . . . . . . . .
. . . . . . . . . . . . . . . . . . . . . . . . . . . . . . . . . . . . . . . . . . . . . . . . . .. . . . . . . . . . . . . . . . . . . . . . . . . . . . . . . . . . . . . .
. . . . . . . . . . . . . . . . . . . . . . . . . . . . . . . . . . . . . . . . . . . . . . . . . . . . . . . . . . . . . .
35 42 44 61 62 63 64 65
66 67 67 68 69 71 72 73 73 74 75 76 77 78 78 79 80 81 83 84 85 86 90 91 91 91 92 93 94 95 96 96 97 98 99
100 100 101 104
Directors’ reportRemuneration reportRemuneration report contentsIncome statementStatement of comprehensive incomeBalance sheetStatement of changes in equityStatement of cash flowsNotes1 Summary of significant accounting policies2 Critical accounting estimates and assumptions3 Revenue and other income4 Expenses5 Income tax6 Cash and cash equivalents7 Trade and other receivables8 Inventories9 Assets classified as held for sale10 Joint arrangements and associate11 Property, plant and equipment12 Intangible assets13 Impairment tests14 Trade and other payables15 Borrowings and lease commitments16 Provisions17 Other liabilites18 Retirement benefit obligations19 Share Capital20 Reserves and retained earnings21 Dividends22 Financial risk management23 Fair value measurements24 Contingencies25 Commitments for capital expenditure26 Share-based payment plans27 Remuneration of auditors28 Related parties29 Subsidiaries and transactions with non-controlling interests30 Deed of cross guarantee31 Reconciliation of profit after income tax to net cash inflow from operating activities32 Earnings per share33 Segment reporting34 Parent entity financial information35 Events occurring after the balance sheet dateDirectors’ declarationAuditor’s independence declarationIndependent auditor’s report to the members of Adelaide Brighton LtdFinancial history

35ADELAIDE BRIGHTON LTD ANNUAL REPORT 2016
ConsolidatedStatutory Results 2016 2015 $ million $ millionRevenue 1,396.2 1,413.1
Depreciation, amortisation and impairments (78.1) (77.8)
Earnings before interest and tax (“EBIT”) 266.1 298.6
Net finance cost (11.5) (13.0)
Profit before tax 254.6 285.6
Income tax expense (68.4) (77.8)
Net profit after tax 186.2 207.8
Attributable to:
Members of Adelaide Brighton Ltd (“NPAT”) 186.3 207.9
Non-controlling interests (0.1) (0.1)
Basic earnings per share (cents) 28.7 32.0
Ordinary dividend per share (cents) 20.0 19.0
Special dividend per share (cents) 8.0 8.0
Franking (%) 100 100
Net debt ($ million) 288.5 297.2
Net debt/equity (%) 23.6 24.6
Directors’ report
Net profit after taxAdelaide Brighton’s long term strategy has positioned the Company to be resilient to the cyclical nature of construction markets and in 2016 has seen the Group grow net profit after tax (excluding property) by 3.1%. This was despite a decline in sales volume of 20% in Western Australia and the Northern Territory, and electricity market disruptions which impacted profit before tax by $9 million.
Reported net profit after tax attributable to members (NPAT) for the year ended 31 December 2016 declined 10.4% to $186.3 million primarily due to lower property profits compared to the previous corresponding period. Property contributed $7.9 million to NPAT, compared to $34.9 million in 2015.
RevenueRevenue of $1,396.2 million was 1.2% lower than in 2015, due to reduced demand for cement from residential and resource construction projects in Western Australia and the Northern Territory. By contrast, continued strength in the residential sector and a ramp up in infrastructure projects in the eastern states and South Australia lifted demand for cement, clinker, concrete and aggregates in these markets. Excluding the impact of lower freight revenue, Group revenue increased slightly versus previous corresponding period.
Earnings before interest and taxEarnings before interest and tax (EBIT) decreased 10.9% from the prior year to $266.1 million on an EBIT margin of 19.1%. Excluding property profits, EBIT grew 1.6% on 2015 to $257.7 million, while the EBIT margin improved from 17.9% in 2015 to 18.5% in 2016.
MarginsEBIT margins excluding property improved as a result of price increases, cost initiatives and higher joint venture earnings. These more than offset the impact of lower cement volumes and electricity supply disruptions in South Australia. Import costs were higher due to the weaker Australian dollar. Joint arrangements and associate earnings increased from $21.5 million in 2015 to $30.9 million in 2016 reflecting improved demand and higher cement prices on the east coast of Australia.
Operating cash flow and debtOperating cash flow increased 8.0% from the prior year to $248.4 million, driven by improved operating profit and stronger cash conversion. Property sales contributed $20.6 million to cash flow, bringing sales in the last four years to $85 million. The estimate of the sales value of the remaining property pipeline over the next decade exceeds $120 million. Gearing reduced to 23.6% at year end, assisted by strong operating cash flows and property sale proceeds.
Directors’ report
The Directors present their report on the consolidated entity (the Group) consisting of Adelaide Brighton Limited (the Company) and the entities it controlled at the end of, or during, the year ended 31 December 2016.
Directors
The Directors of the Company, at any time during or since the end of the financial year and up to the date of this report, are:LV Hosking RD BarroGF Pettigrew KB Scott-MackenzieAM TanseyM Brydon
Principal activities
During the year the principal activities of the Group consisted of the manufacture and distribution of cement, and cementitious products, lime, premixed concrete, aggregates, sand and concrete products.
Review of operations
A summary of the financial results for the year ended 31 December 2016 is set out below:
ADELAIDE BRIGHTON LTD ANNUAL REPORT 2016 36
Earnings per share Earnings per share (EPS) were 28.7 cents, while EPS
excluding property profits increased 3.0% from the prior year to 27.5 cents.
Dividends A final ordinary fully franked dividend of 11.5 cents
per share and a fully franked special dividend of 4.0 cents per share were declared, bringing total dividends for FY 2016 to 28.0 cents fully franked. The record date for the final 2016 dividend is 28 March 2017 with payment on 12 April 2017.
The special dividend takes into consideration Adelaide Brighton’s strong cash flow, low gearing, current capital expenditure outlook and availability of franking credits.
Demand overview Demand in east coast markets remained strong in
the second half of 2016. Residential activity was robust in Victoria, New South Wales and Queensland, while South Australia returned to growth. Non-residential building and infrastructure activity also underpinned demand in these markets.
In New South Wales, strong residential activity was augmented by non-residential building and transport infrastructure projects. In Victoria, multi-residential activity remained a key source of demand and was further supported by non-residential building.
South east Queensland markets continue to improve, particularly the Gold Coast and Sunshine Coast regions. Increasing South Australian demand was driven by several infrastructure projects and stronger demand from mining operations.
Cement demand declined sharply in Western Australia and the Northern Territory, given weak residential and non-residential activity and lower sales volumes to resource construction projects. Western Australian lime demand was stable over the year, with a small improvement in the second half, while Northern Territory lime demand was also stable.
Cement and clinker
Cement and clinker sales volumes decreased 4% compared to 2015. Volumes declined in Western Australia and the Northern Territory by approximately 20% due to completion of a number of major resources projects and weakening residential and commercial activity.
This was partially offset by higher sales to construction markets in New South Wales, Victoria and south east Queensland, and a return to normal sales to a major mining customer in South Australia.
Cement sales in South Australia were also assisted by the start of major infrastructure projects, which are anticipated to ramp up over 2017 and continue into 2018.
While cement selling prices increased in almost all markets, geographic mix resulted in a lower weighted average price predominantly in the first half of the year.
Overall cement margins declined due to lower volumes, and higher energy and import costs. The impact of the Western Australia and Northern Territory demand downturn has been moderated by the company’s strategy to rationalise inefficient production, expand import operations and lower supply costs, and an improvement in the performance of businesses on the east coast.
(i) Energy disruptions Energy in South Australia had an unfavourable
pre-tax impact of $13 million versus pcp.
$9 million of this was a result of the market wide disruptions to electricity supply in that state. The disruptions caused higher electricity and gas prices, production losses at Adelaide Brighton plants and subsequent reduced sales to customers whose production facilities were temporarily suspended.
The disruption resulted from the closure of generation capacity in South Australia, the temporary closure of the Heywood interconnector in July 2016 and the severe weather event that disrupted electricity supplies in September 2016.
The Birkenhead and Angaston operations were not physically damaged by the weather events and electricity market disruption was mitigated through managing production and the use of alternative energy sources.
(ii) Imports Imports remain a key component of the Adelaide
Brighton growth strategy, leveraging the domestic production footprint of the Group and providing highly competitive supply into key markets. Import volumes declined slightly to 2.0 million tonnes as a result of the lower sales volumes in Western Australia and the Northern Territory. Import costs increased by $7 million before tax, due to the decline in the Australian dollar compared to the previous year.
(iii) Operational Improvement Adelaide Brighton continues to identify opportunities
for operational improvement including the rationalisation of inefficient production, reducing energy costs and other efficiency improvements to ensure the operations achieve optimal performance.
Lime
Lime sales volumes in 2016 were similar to the prior year, with demand from the non-alumina sector stabilising after a period of recovery and demand from the alumina sector improving slightly in the second half.
Lime margins improved as a result of lower operating costs, with natural gas contract negotiations delivering pre-tax benefits of $8 million. A small investment in loading capability delivered benefits through more efficient use of rail transport. Maintenance and transport costs have also benefited from contract renegotiations.
Concrete and Aggregates
Concrete and aggregate volumes increased due to strong demand in the eastern states, particularly New South Wales and Queensland. Average selling prices for concrete were up 3.7% and aggregates prices increased significantly more than CPI, with demand from all major concrete and aggregates markets improving.
The recovery in South Australian concrete and aggregates volumes continued in the second half. The outlook for demand in South Australia appears favourable given major infrastructure projects. Sales volumes were also strong in New South Wales, Victoria and Queensland.
Sydney aggregates markets continue to be supported by the depletion of traditional reserves and increasing reliance on product from further afield. The New South Wales quarry operations are competitively positioned to supply demand growth in Sydney.
Improved volumes and cost control measures resulted in flat or reduced unit production costs. Margins were enhanced by cost control, logistical improvements and increased pricing.
Concrete Products
After a solid first half, sales declined slightly in the second half so that full year revenue increased 0.9% to $149.2 million. Volumes were affected in South Australia and Victoria by weather. There were also delays in supply to several projects and competitive pressures in some markets. Adelaide Brighton has taken a proactive stance to increase returns in the business through cost reductions and price increases. This approach has meant in some cases losing unprofitable business but has contributed to a significant improvement in earnings.
ADELAIDE BRIGHTON LTD ANNUAL REPORT 2016 37
Operational improvement initiatives have introduced flexibility into the Concrete Products operations, contributing to a significant increase to gross margins compared to 2015 despite a small reduction in volumes.
Adelaide Brighton has lifted efficiency in the masonry business through plant rationalisation, tolling arrangements, a range of operational improvements and transport efficiencies. Equipment upgrades continued during the year, with components of two manufacturing plants replaced as part of ongoing operational improvement initiatives.
In addition, the business has made a significant investment in product innovation to lift the presence of masonry within the building products industry, which offers exciting revenue opportunities for the business in the medium term.
The concrete products business is also an important and growing customer for the cement, aggregates and sand business, which offers vertical integration benefits for the Company.
Excluding property profits (nil 2016, pre-tax $1.9 million 2015), EBIT improved 20% compared to 2015, reflecting a significant lift in EBIT margins in the second half.
Joint arrangements and associates
Independent Cement and Lime’s sales volumes increased reflecting continued strength in construction activity across the New South Wales and Victoria markets. Higher selling prices, strong demand and an easing of input cost pressures supported an increased contribution from $7.9 million to $10.5 million profit after tax, a 33% increase.
Sunstate’s contribution to Group earnings increased by 33% from $8.3 million to $11.0 million, helped by residential demand across south east Queensland and projects, particularly in the Gold Coast and Sunshine Coast regions. Volumes, prices and margins were all higher than the prior corresponding period.
Mawsons earnings improved by 45% on 2015 driven largely by strong demand for higher margin quarry products to major projects. Most of this demand occurred in the second half of the year. This was moderated by competitive pressure impacting premixed concrete margins.
Aalborg Portland Malaysia Sdn. Bhd. contribution to Group earnings improved by more than 200%. An improvement in production output following the full commissioning of the kiln upgrade led to higher sales volumes and better operating cost performance compared to 2015.
Strategic developments
Adelaide Brighton continues its successful long term strategy to grow shareholder returns through investment in three key areas:
1 Cost reduction and operational improvement across the Group;
2 Growth of the lime business to supply the resources sector in WA, SA and NT; and
3 Focused and relevant vertical integration into downstream aggregates, concrete, logistics and masonry.
Growing shareholder value In implementing its growth strategy,
Adelaide Brighton pays particular attention at the business and corporate level to certain important drivers of long term shareholder value:
> Financial performance - delivering attractive return on capital.
> Market leadership - to maximise operating efficiencies in production, logistics and marketing.
> Risk management - maintaining a strong balance sheet and minimising operational risks.
> Capital management - efficient utilisation of capital and returns to shareholders.
> Governance and social licence - licence to operate on behalf of shareholders and stakeholders.
1 Cost reduction and continuous improvement
Consistent focus on operational improvement initiatives
Adelaide Brighton has focussed on improving the operational performance of its business, taking a long term view of customer and market trends to match operational capacity and resilience along with efficiency and cost performance.
Cost initiatives delivered incremental benefits of $16 million on a pre-tax basis compared to 2015. These initiatives related to:
> Energy Incremental cost savings of $9 million were
delivered during the year primarily driven by an $8 million reduction in natural gas costs in the WA lime business. Electricity load management, and the ramp-up in usage of alternative fuels at the Birkenhead operations as a substitute for natural gas, also delivered benefits.
> Operational rationalisation Headcount reductions resulted in savings of
$1 million in 2016. The full benefit from this rationalisation will be realised in 2017 with an additional $1 million of incremental savings.
> Other Benefits of $6 million were achieved through a range
of other initiatives, including improved efficiency in transport and usage of alternative materials.
Import strategy delivers competitive supply into key markets
Adelaide Brighton is Australia’s largest importer of cementitious materials (cement, clinker and blast furnace slag) utilising more than two million tonnes of imported product per annum, across multiple import facilities located in key markets across Australia.
This industry leading position enhances supply chain efficiency in procurement, transport, storage and distribution. The use of imported materials allows the supply of competitively priced product into a range of markets where demand exceeds the Company’s manufacturing capacity. It enables Adelaide Brighton’s domestic production assets to operate at full utilisation, which underpins its competitive position and shareholder returns.
The import strategy is supported by long term agreements with two Japanese suppliers for grey clinker, Aalborg Portland Malaysia Sdn. Bhd. for white clinker and a major Japanese trading house for the supply of granulated blast furnace slag.
The benefits of this strategy have been evident in the Western Australian cement business. While demand has turned down, the business has greater operational flexibility and now operates at lower cost than before the rationalisation. As a result, it is very well positioned to benefit from any recovery in demand.
Investment in operational improvement Further savings are anticipated in 2017 from the
rationalisation of specialty cement production at the Angaston (South Australia) facility.
The rationalisation of speciality cement production from the Angaston facility, leveraging the extensive importation network of the Group, will result in annualised EBIT savings of approximately $3 million. Earnings will be adversely impacted in 2017 by one-off charges associated with this initiative of $2.9 million before tax.
Land sales program Adelaide Brighton has been actively engaged in
selling and preparing for sale properties released by the rationalisation and improvement program. In many cases this includes re-zoning to realise greater value over time.
Since the beginning of 2013, cash proceeds from the property program have been $85 million. This includes transactions in 2016 that realised $20.6 million in cash proceeds and $7.9 million NPAT.
Estimated proceeds from the sale of properties in the next 10 years could realise in excess of $120 million in proceeds with an expected EBIT margin on these sales of circa 85% and an effective tax rate of approximately 20%.
38ADELAIDE BRIGHTON LTD ANNUAL REPORT 2016
2 Lime growth
Positioned for demand growth Adelaide Brighton’s Munster, Western Australia,
lime business is underpinned by low cost long term resource reserves secured by State Agreement and long term statutory approvals. Long term demand growth is driven by the globally competitive Western Australian resources sector.
The two lime kilns are amongst the largest globally and are currently at 80% operating capacity. Through the Munster plant’s low cost position and reduction in the cost of energy in Western Australia, operating margins improved significantly in 2016.
Lime sales volume has recently improved due to a recovery in the non-alumina sector, which represents about 30% of Western Australia’s lime demand. This sector achieves higher selling prices, but remains the most exposed to ongoing import competition. There has been increased demand in particular from gold projects but there has also been improvement in the broader resources sector.
The Western Australian alumina sector remains among the lowest cost globally, underpinning its long term growth. There are currently a number of production expansions slated for the alumina producers, that once fully operational have the potential to add 15% to lime demand in Western Australia in the medium to longer term. The timing of these proposed expansions remains dependent on the dynamics of the alumina sector, but an increase in alumina fundamentals appears to be underway.
3 Downstream integration
Further downstream acquisitions Adelaide Brighton continues to pursue its strategy of
acquiring quality concrete and aggregate businesses that enhance its long term competitive position and shareholder value. Over the last decade it has built a concrete and aggregates business of scale that offers strong regional positions and strategic aggregates reserves that underpin returns to shareholders.
The business is complementary to the cement and lime operations and provides attractive diversification benefits as well as the ability to capture a greater share of the construction materials production and distribution value chain.
Continuing this strategy, Adelaide Brighton has agreed to acquire the Central Pre-Mix Concrete and Quarry business (Central), an integrated concrete and aggregate operation with five concrete plants and a hard rock aggregate quarry serving the metropolitan Melbourne market, the largest premixed concrete market in Australia.
The purchase price of approximately $61 million, including transaction costs, represents 7.0 times 2016 calendar year EBITDA. Adelaide Brighton completed the acquisition effective 1 March 2017 and it is expected to be earnings accretive (excluding transaction costs) in 2017.
It is expected that 2017 EBITDA for the acquired business will increase on 2016. After funding and transaction costs the purchase will be earnings neutral in 2017. Transaction costs of circa $3 million (mainly stamp duty) will be expensed in 2017.
Central will provide access to strategically located and high quality assets, entry to the Melbourne aggregates market and an increase in the scale of Adelaide Brighton’s concrete and quarry business in Melbourne. The acquired business also offers operating synergies with the existing Melbourne operations and the prospect of further bolt on investments to enhance the overall regional position.
The premixed concrete and aggregates acquisitions in 2014 and 2015 in South Australia and Queensland are exceeding earnings expectations with a positive outlook.
Operational results
Cash flow Operating cash flow increased by $18.5 million
to $248.4 million in 2016. The increase was attributable to stronger cash conversion of revenues and dividends from joint ventures, partially offset by increased tax payments.
Capital expenditure was $86.5 million. Stay in business capital of $49.7 million represents 64% of depreciation and amortisation. Stay in business expenditure was higher than prior corresponding period with $19.2 million spent on concrete plants in Sydney that are being relocated due to urban growth. Development capital increased $2.3 million to $36.8 million for organic projects that will improve costs and expand production capacity. Cash proceeds of $23.2 million from the sale of assets includes $20.6 million from the disposal of property.
Dividends paid to shareholders increased 28% to $178.5 million. Despite this, strong cash flow, which included property proceeds, reduced net debt by $8.7 million to $288.5 million and net debt to equity gearing fell from 24.6% to 23.6% over the year.
Balance sheet Net assets increased $12.8 million to
$1,220.1 million as a result of the $186.2 million net profit after tax for the year less the payment of dividends of $178.5 million.
Working capital increased modestly. Debtor days sales outstanding reduced versus the prior corresponding period and doubtful debt provision reduced to $1.2 million (0.09% of revenue) compared to $1.8 million (0.13% of revenue) in the prior corresponding period.
Strong cash flows reduced net debt by $8.7 million to $288.5 million. Net debt to equity gearing of 23.6% at year end was below the targeted range of 25% to 45%.
To maximise shareholder returns, Adelaide Brighton seeks to ensure the balance sheet is efficiently utilised while retaining the flexibility to fund the long term growth strategy as opportunities are identified. Total debt facilities of $540 million have the following maturity profile:
Facility expiry date January 2018 January 2019
Facility value $330 million $210 million
Income statement Freight revenue declined by $28.5 million due to
a decrease in sales volumes of cement to remote resource projects. Freight and distribution costs on these sales declined by a similar amount. However, offsetting this reduction, increased deliveries of premixed concrete increased freight and distribution costs. Premixed concrete is sold on a delivered basis and as such concrete freight revenue is included in total segment operating revenue and not identified separately as freight revenue.
The 71.8% decrease in other income to $14.5 million was driven by pre-tax property profits in 2016 of $8.4 million, a decline of $36.6 million from 2015 property profits of $45.0 million.
Net finance costs decreased from $13.0 million to $11.5 million in 2016 primarily as a result of the continuation of low underlying market interest rates.
Tax expense of $68.4 million decreased $9.4 million from 2015 and represents an effective tax rate of 26.9% (2015: 27.2%). The lower effective tax rate in 2016 is due to the higher contribution from equity accounted joint ventures in the Group’s profit before tax and the recognition of $1.9 million of tax losses associated with property disposals. Excluding property profits or one-off impacts, the Group’s ongoing tax rate is expected be in the range of 27% to 28%.
The movement in the value of the Australian Dollar against the Malaysian Ringgit during the year resulted in a $0.9 million loss being recognised in other comprehensive income. The loss reflects movements in the Australian Dollar value of the Group’s investment in Aalborg Portland Malaysia Sdn. Bhd.
39ADELAIDE BRIGHTON LTD ANNUAL REPORT 2016
An unrealised gain of $1.3 million on the fair value of cash flow hedges used by Adelaide Brighton as part of its foreign currency risk management approach was recognised in other comprehensive income (2015: $1.3 million loss). The unreaslised gain is the result of a decline in the value of the Australian Dollar against the United States Dollar at year end compared to the rates at the time the hedge contracts were entered into.
An actuarial gain of $1.7 million (2015: $4.5 million) related to the defined benefit superannuation plan was recognised through other comprehensive income. The gain was primarily due to the improvement in value of investments held by the fund up to the end of the year and an increase in discount rate used to calculate the defined superannuation benefit liability.
Dividends paid or declared by the Company
During the 2016 financial year, the following dividends were paid:
> A final dividend in respect of the year ended 31 December 2015 of 15.0 cents per share (fully franked) was paid on 12 April 2016. This dividend totalled $97,332,862; and
> An interim dividend in respect of the year ended 31 December 2016 of 12.5 cents per share (fully franked) was paid on 12 October 2016. This dividend totalled $81,206,796.
Since the end of the financial year the Directors have approved the payment of a final dividend of 15.5 cents per share (fully franked), comprising an ordinary dividend of 11.5 cents per share and a special dividend of 4 cents per share. The final dividend is to be paid on 12 April 2017.
State of affairs
Other than set out in the Review of Operations, no significant changes occurred in the state of affairs of the Group during the financial year.
Events subsequent to the end of the financial year
Subsequent to reporting date, Adelaide Brighton had agreed to acquire the Central Pre-Mix Concrete (Central) business, an integrated concrete and aggregate operation with five concrete plants and a hard rock aggregate quarry serving the metropolitan Melbourne market. The purchase price of approximately $61 million, including transaction costs of $3 million, represents 7.0 times 2016 calendar year earnings before interest, tax, depreciation and amortisation.
Adelaide Brighton completed the acquisition effective 1 March 2017.
Other than the purchase of Central, no matter or circumstance has arisen since 31 December 2016 that has significantly affected, or may significantly affect the Group’s operations, the results of those operations, or the Group’s state of affairs in future financial years.
Likely developments and expected results of operations
2017 is expected to see strong demand for most products particularly on the east coast, improved pricing and further efficiency improvements.
2017 sales volumes of cement and clinker is expected to be higher than 2016. It is expected that demand in Western Australia and the Northern Territory will stabilise and that demand will improve in South Australia due to major infrastructure projects. Cement and clinker demand on the east coast is expected to benefit from increasing demand from infrastructure projects.
Sales volumes of premixed concrete and aggregates are expected to increase in 2017 due to infrastructure projects on the east coast and South Australia. The Central acquisition will also add further sales.
Price increases have been announced for the first half of 2017 in cement, aggregates, concrete and concrete products. Geographic mix change is anticipated to have a more limited impact on weighted average cement prices in 2017.
A number of factors are supportive of higher prices including strengthening demand and capacity utilisation.
Concrete prices are expected to again increase by more than CPI. Aggregate prices are anticipated to increase significantly above CPI, particularly in Sydney where average delivered costs have risen substantially as the industry moves to supply from further afield as traditional sources have depleted.
Lime sales volumes are expected to be higher in 2017. Margin increases are expected in 2017 however, the threat of small scale lime imports in Western Australia and the Northern Territory remains.
The joint venture operations in Australia are anticipated to benefit from stronger demand and higher prices on the east coast, while Aalborg Portland Cement should continue to see the benefit of expanded production.
Import costs are expected to be lower in 2017 due to savings in shipping, materials purchasing and favourable foreign currency outcomes.
Foreign currency exchange rates for the expected cost of cement, clinker and slag imports have been hedged through to October 2017.
Efficiency remains a key operational priority as part of a rolling program of cost reduction to sustain leading margins and shareholder returns.
Proceeds from property sales could be $10 - $15 million over the next two years.
To maximise shareholder returns, Adelaide Brighton seeks to ensure the balance sheet is efficiently utilised while retaining the flexibility to fund long term growth as opportunities are identified. Prudent capital management remains an important part of this approach.
Environmental performance
The Group is subject to various Commonwealth, State and Territory laws concerning the environmental performance of Adelaide Brighton’s operations.
Environmental performance is monitored by site and business division, and information about the Group’s performance is reported to and reviewed by the Group’s senior management, the Board’s Safety, Health & Environment Committee, and the Board.
The Group’s major operations have ongoing dialogue with the relevant authorities responsible for monitoring or regulating the environmental impact of Group operations.
Group entities respond as required to requests made by regulatory authorities, including requests for information and site inspections.
In 2015, the New South Wales Environment Protection Authority (“NSW EPA”) investigated Hurd Haulage Pty Ltd’s (“Hurd Haulage”) disposal of concrete wash-out. That investigation was concluded and resulted in Hurd Haulage and the NSW EPA entering into an Enforceable Undertaking on 2 December 2016. The Enforceable Undertaking requires Hurd Haulage to implement agreed environmental measures such as developing a training module and updating its written compliance systems regarding waste disposal requirements under the Protection of the Environment Operations Act 1997 (NSW). Hurd Haulage was also required to provide $72,000 funding to two local LandCare groups for environmental works and pay the NSW EPA’s legal and investigation costs in the amount of $16,250.

40ADELAIDE BRIGHTON LTD ANNUAL REPORT 2016
On 6 January 2016, Hurd Haulage provided the NSW EPA with a report about exceedance (57mg/L reported compared with 30mg/L permitted) of the Total Suspended Solids limit from discharges made from the Grants Head Quarry on 24 December 2015 and 4 January 2016. In April 2016, the NSW EPA issued a “show cause” letter to Hurd, inviting it to provide written submissions and Hurd provided these. After taking into account the various matters put by Hurd Haulage, on 6 September 2016, the NSW EPA issued an official caution with no penalty or other sanction.
In 2015, the NSW EPA also investigated Morgan Cement International Pty Ltd (“MCI”) concerning the unexpected overflow of ground granulated blast furnace slag from a storage silo at MCI’s premises at Port Kembla, New South Wales, on Saturday 14 March 2015. MCI cooperated with the NSW EPA’s investigation which concluded in March 2016. The NSW EPA determined to commence prosecution proceedings in the Land and Environment Court of New South Wales regarding the incident. It alleged that MCI committed an offence against section 64(1) of the Protection of the Environment Operations Act 1997 (NSW) in that MCI breached a condition of its environment protection licence by failing to maintain a certain item of plant in a proper and efficient condition. MCI pleaded guilty to the alleged offence at the earliest opportunity and the sentencing hearing was held on 31 October 2016. On 2 November 2016, the Court delivered judgment convicting MCI of the offence as charged, fining MCI $50,250 and ordering MCI to pay the NSW EPA’s agreed legal and investigation costs of $55,492.50. MCI was also ordered to publish a notice regarding its conviction in specified newspapers and an industry publication. This was MCI’s first conviction for an environmental offence. MCI has since complied with the Court’s orders and implemented equipment and system upgrades at the premises to minimise the risk of a similar incident in the future.
The South Australian Environment Protection Authority (“EPA SA”) investigated Adelaide Brighton Cement Ltd (“ABCL”), in relation to an emission from the ship loading boom at ABCL’s Birkenhead plant in South Australia in March 2016. ABCL cooperated with the EPA SA’s investigation, and no further action has been undertaken by the EPA SA in relation to the incident to date.
Directors’ meetings
The number of Directors’ meetings and meetings of committees of Directors held during the financial year and the number of meetings attended by each Director is as follows:
Director Board Meetings Audit, Risk and Nomination, Independent Safety, Health & Compliance Remuneration & Directors’ Environment Committee Governance Committee Committee Committee
A H A H A H A H A H
LV Hosking 11 11 4 4 4 4 0 0 - -R Barro 11 11 - - - - - - 2 2GF Pettigrew 11 11 4 4 4 4 0 0 2 2KB Scott-Mackenzie 9 11 - - 4 4 0 0 2 2AM Tansey 11 11 4 4 4 4 0 0 - -M Brydon (1) 11 11 - - - - 0 0 - -
A Number of meetings attended.H Number of meetings held during period of office.(1) Mr Brydon was appointed as a member of the Independent Directors’ Committee from 23 February 2016.
Director profiles
Information relating to Directors’ qualifications, experience and special responsibilities are set out on pages 30 and 31 of the Annual Report.
Directors’ interests
The relevant interest of each Director in the share capital of the Company at the date of this report is as follows:
Ordinary shares
LV Hosking 4,851RD Barro 227,579,355GF Pettigrew 7,739KB Scott-Mackenzie 5,000AM Tansey 10,000M Brydon 39,296
Full details of the interests in share capital of Directors of the Company are set out in the Remuneration Report on pages 42 to 60 of this report.
Director and executive remuneration
Details of the Company’s remuneration policies and the nature and amount of the remuneration of the Directors and certain senior executives are set out in the Remuneration Report on pages 42 to 60 of this report.
Company Secretaries
The Company’s principal Company Secretary is Marcus Clayton, who has been employed by the Company in the two separate offices of General Counsel and Company Secretary since 24 February 2003. He is a legal practitioner admitted in South Australia with 28 years experience.
Two other employees of the Company also hold the office of Company Secretary to assist with secretarial duties should the principal Company Secretary be absent: the Company’s Chief Financial Officer, Michael Kelly, a Certified Practising Accountant who has been a Company Secretary since 23 November 2010 and the Group’s Corporate Affairs Adviser, Luba Alexander, who has been a Company Secretary since 22 March 2001.
Indemnification and insurance of officers
Rule 9 of the Company’s constitution provides that the Company indemnifies each person who is or who has been an “officer” of the Company on a full indemnity basis and to the full extent permitted by law, against liabilities incurred by that person in their capacity as an officer of the Company or of a related body corporate.
Rule 9.1 of the constitution defines “officers” to mean:
> Each person who is or has been a Director, alternate Director or executive officer of the Company or of a related body corporate of the Company who in that capacity is or was a nominee of the Company; and
> Such other officers or former officers of the Company or of its related bodies corporate as the Directors in each case determine.
Additionally the Company has entered into Deeds of Access, Indemnity and Insurance with all Directors of the Company and its wholly owned subsidiaries. These deeds provide for indemnification on a full indemnity basis and to the full extent permitted by law against all losses or liabilities incurred by the person as an officer of the relevant company. The indemnity is a continuing obligation and is enforceable by an officer even if he or she has ceased to be an officer of the relevant company or its related bodies corporate.
The Company was not liable during 2016 under such indemnities.
41ADELAIDE BRIGHTON LTD ANNUAL REPORT 2016
Rule 9.5 of the constitution provides that the Company may purchase and maintain insurance or pay or agree to pay a premium for insurance for “officers” (as defined in the constitution) against liabilities incurred by the officer in his or her capacity as an officer of the Company or of a related body corporate, including liability for negligence or for reasonable costs and expenses incurred in defending proceedings, whether civil or criminal.
During the year the Company paid the premiums in respect of Directors’ and Officers’ Liability Insurance to cover the Directors and Secretaries of the Company and its subsidiaries, and the General Managers of each of the divisions of the Group, for the period 1 May 2016 to 30 April 2017. Due to confidentiality obligations under that policy, the premium payable and further details in respect of the nature of the liabilities insured against cannot be disclosed.
Proceedings on behalf of the Company
No person has applied for leave of the Court to bring proceedings on behalf of the Company or to intervene in any proceedings to which the Company is a party for the purpose of taking responsibility on behalf of the Company for all or any part of those proceedings. The Company was not a party to any such proceedings during the year.
Non-audit services
The Company may decide to employ the auditor on assignments additional to their statutory audit duties where the auditor’s experience and expertise with the Company and the Group are important.
Details of the amounts paid or payable to PricewaterhouseCoopers for audit and non-audit services provided during the year are set out in Note 27 to the Financial Statements on page 92 of this report.
The Board of Directors has considered the position and, in accordance with the advice received from the Audit, Risk and Compliance Committee, is satisfied that the provision of the non-audit services is compatible with the general standard of independence for auditors imposed by the Corporations Act 2001. The Directors are satisfied that the provision of non-audit services by the auditor, as set out in Note 27, did not compromise the auditor’s independence requirements of the Corporations Act 2001 for the following reasons:
> All non-audit services have been reviewed by the Audit, Risk and Compliance Committee to ensure they do not impact the impartiality and objectivity of the auditor; and
> None of the services undermine the general principles relating to auditor independence as set out in APES 110 Code of Ethics for Professional Accountants.
Auditor’s independence declaration
A copy of the auditor’s independence declaration as required under section 307C of the Corporations Act 2001 is set out on page 100.
Rounding off
The Company is of a kind referred to in ASIC Corporations (Rounding in Financial/Directors’ Reports) instrument 2016/191 relating to the “rounding off” of amounts in the Directors’ report. In accordance with that instrument, amounts in the financial report and Directors’ report have been rounded off to the nearest one hundred thousand dollars, unless otherwise stated.
Shares under option
Unissued ordinary shares under option relate to Awards associated with the Company’s Executive Performance Share Plan. Outstanding Awards at the date of this report are as follows:
Date Awards Expiry date Number of granted Awards
1 January 2013 30 September 2017 745,9551 January 2014 30 September 2018 676,2191 January 2015 30 September 2019 795,7611 Janaury 2016 30 September 2020 701,889
2,919,824
The exercise price for these Awards is nil. Further details of Awards are set out in Note 26 and the Remuneration Report.
Registered office
The registered office of the Company is Level 1, 157 Grenfell Street, Adelaide, South Australia 5000.
Corporate governance statement
The corporate governance statement is available on the Adelaide Brighton Limited website and may be accessed via the following URL:
adbri.com.au/ourresponsibilities#governance-exp
Signed in accordance with a resolution of the Directors
M Brydon Director Dated 17 March 2017
42ADELAIDE BRIGHTON LTD ANNUAL REPORT 2016
Adelaide Brighton Ltd
Dear Fellow Shareholders
On behalf of the Board and as Chair of the Nomination, Remuneration and Governance Committee, I am pleased to present the Adelaide Brighton 2016 Remuneration Report.
Our remuneration framework incorporates robust performance measures linked to our strategic plans and which provide remuneration outcomes that reflect our business performance over the annual cycle and the longer term. The remuneration policies of Adelaide Brighton continue to focus on attracting and retaining the best talent to deliver our strategic objectives and align executive rewards with the creation and delivery of shareholder value.
2016 performanceAdelaide Brighton’s long term strategy of product and geographic diversification has repositioned the Company to benefit from the strong infrastructure and residential market on the east coast of Australia. This strategy includes vertical integration into premixed concrete and concrete products, the development of a meaningful quarry business and a focus on ongoing operational improvement.
This repositioning has sustained the Company to be resilient to the cyclical nature of construction markets and in 2016 the Group grew net profit after tax (excluding property) by 3.1%. This was despite a decline in sales volume of 20% in the key Northern Territory and Western Australian markets and electricity market disruptions which impacted profit before tax by $9 million.
We continue to generate strong cash flows allowing us to invest in a number of growth projects, pay increased dividends while retaining a strong balance sheet with gearing near the bottom of the Board’s target range.
We were pleased to reward shareholders by paying fully franked ordinary dividends for the 2016 year of 20 cents per share and special dividends of 8.0 cents per share, bringing total dividends for 2016 to 28.0 cents fully franked.
Overall our long term strategy of diversification has continued to support continued improvement in returns despite some difficult markets.
2016 Remuneration Initiatives
During the year we conducted a remuneration benchmarking review of the annual fixed remuneration for the CEO and Managing Director and Key Management Personnel. This review took into account comparison of the role to market benchmarks and market trends in relation to fixed remuneration and the competency and capability of the individual in relation to the requirements of the role. The comparator group for the benchmark review was the ASX51-150. Adelaide Brighton, at a market capitalisation of approximately $3.5bn, sits at the 65th percentile of the ASX51-150 by market capitalisation. Following from this positioning within the ASX51-150, the focus for Adelaide Brighton should be on remuneration levels that sit between the median and the 75th percentile of the comparator group. The CEO and Managing Director total remuneration sits at the 65th percentile, with the average total remuneration of other key management personnel sitting below the median.
As discussed above, fixed remuneration levels remain modest relative to peers of a similar market capitalisation. Executive salary increases were between 5 to 7 percent from 1 January 2016 and the increases recognised a number of the executives were relatively new in their roles.
Non-executive Director base and Committee fees were increased by approximately 4% for the 2016 financial year to ensure the fees paid to non-executive Directors remain competitive with fees paid by comparable companies.
Remuneration report
43ADELAIDE BRIGHTON LTD ANNUAL REPORT 2016
Short Term Incentive
Adelaide Brighton delivered a strong financial performance in 2016 despite difficult market conditions. Net profit after tax (the measure used for assessment of short term incentive outcomes), excluding property transactions, was up 3.1% compared to the prior year.
Short term incentive outcomes for executives were lower than in the prior year reflecting the Board’s discretion to exclude property transactions from NPAT. Excluding property, NPAT was 99.1% of target.
The Board set relevant and challenging non-financial targets for the individual KMP in 2016. Performance against these non-financial targets was assessed impacting individual KMP outcomes.
The overall result was short term incentives for KMP vesting in the range of 48.9% to 68.9% of their potential maximum, recognising the strong management performance during the year, which delivered an increase in NPAT (excluding property) despite a significant downturn in the Company’s key markets of Western Australia and the Northern Territory, and difficulties in the South Australian energy market.
2016 saw the introduction of a short term deferred element into our annual short term incentive program. For the 2016 year, 25% of the short term incentive will be deferred, increasing to 50% from 2017. The short term incentive deferral is intended to emphasise the need for management to continue to make decisions that deliver our annual targets in a manner that is consistent with delivering sustainable growth in value for our shareholders.
Long Term Incentive
Tranche 2 of the 2012 long term incentive grant was tested. This vested at 100%, having exceeded the 75th percentile against the relative total shareholder return (TSR) performance condition and having achieved 100% vesting against the compound annual growth in earnings per share (EPS) target based on EPS growth of 10.1% over the performance period. These LTI outcomes are consistent with delivery of long term value to shareholders with the Company achieving a TSR of 92.3% over the measurement period.
Board renewal
The Directors recognise the importance of Board renewal. Directors have reviewed the Board’s composition and continue their commitment and focus on Board renewal and increased diversity.
Taking into consideration the Board skills matrix and matching those skills to our strategic plans, the Board has considered new Director appointments and expects to announce a new appointment to the Board in the near future.
Conclusion
These remuneration outcomes reflect the level of performance achieved against our applicable targets during 2016.
We have prepared the 2016 Remuneration Report in line with our objective of transparency in explaining our remuneration framework and practices and the link between Company and individual performance and incentive remuneration outcomes.
We continue to seek feedback on our Remuneration Report and continually look at ways to improve and include this feedback into our remuneration practices and this report. We look forward to welcoming you to the 2017 Annual General Meeting.
Arlene TanseyChairman of Nomination, Remuneration and Governance Committee

44
Remuneration report contents
ADELAIDE BRIGHTON LTD AND ITS CONTROLLED ENTITIES
FOR THE YEAR ENDED 31 DECEMBER 2016
Introduction and Key Management Personnel1 Executive remuneration policy and framework 1.1 Remuneration policy 1.2 Remuneration framework 1.3 Remuneration governance - responsibility for setting remuneration2 Overview of Company performance 2.1 Financial performance in 2016 2.2 Long term financial highlights3 Linking remuneration to Company performance 3.1 Short Term Incentive 3.1.1 Short Term Incentive - performance measures 3.1.2 Short Term Incentive - financial outcomes 3.2 Long Term Incentive 3.2.1 Long Term Incentive - outcomes4 Executive remuneration 4.1 Fixed annual remuneration 4.2 At-risk remuneration - Short Term Incentive 4.3 At-risk remuneration - Long Term Incentive5 Executive Service Agreements6 Non-executive Directors’ fees 6.1 Policy and approach to setting fees7 Key Management Personnel disclosure tables 7.1 Non-executive Directors’ statutory remuneration 7.2 Executive statutory remuneration 7.3 Equity holdings of Key Management Personnel
45 45 45 46 48 48 48 49 50 50 50 52 53 53 54 54 54 56 57 57 57 58 58 5960
. . . . . . . . . . . . . . . . . . . . . . . . . . . . . . . . . . . . . . . . . . . . .
. . . . . . . . . . . . . . . . . . . . . . . . . . . . . . . . . . . . . . . . . . . . . . . . . . . . . . . . . . . . . . . . . . . . . . . . . .
. . . . . . . . . . . . . . . . . . . . . . . . . . . . . . . . .
. . . . . . . . . . . . . . . . . . . . . . . . . . . . . . . . . . . . . . . . . . . . . . . . . . . . . . . . . . . . . . .
. . . . . . . . . . . . . . . . . . . . . . . . . . . . . . . . . . . . . . . . . . . . . . . . . . . . . . . . . .
. . . . . . . . . . . . . . . . . . . . . . . . . . . . . . . . . . . . . . . . .
. . . . . . . . . . . . . . . . . . . . . . . . . . . . . . . . . . . . . . . . . . . . . . . . . . . . . . . . . . . . . . . . . . . . .
. . . . . . . . . . . . . . . . . . . . . . . . . . . . . . . . . . . . . . . . . . . . . . . . . . . . . . . . . . . . . . . . . . . . . . . . . .
. . . . . . . . . . . . . . . . . . . . . . . . . . . . . . . . . . . . . . . . . .
. . . . . . . . . . . . . . . . . . . . . . . . . . . . . . . . . .. . . . . . . . . . . . . . . . . . . . . . . . . . . . . . . . . . .
. . . . . . . . . . . . . . . . . . . . . . . . . . .. . . . . . . . . . . . . . . . . . . .
. . . . . . . . . . . . . . . . .. . . . . . . . . . . . . . . . . . . . . . . . . . . . .
. . . . . . . . . . . . . . . . . .

45ADELAIDE BRIGHTON LTD AND ITS CONTROLLED ENTITIES
FOR THE YEAR ENDED 31 DECEMBER 2016
The Directors of Adelaide Brighton Limited (the Company) present the Remuneration Report (Report) for the Company and the Group for the financial year ended 31 December 2016. The Report outlines the remuneration arrangements in place for the Key Management Personnel (KMP) of the Company and is prepared in accordance with section 300A of the Corporations Act 2001. This Report, which forms part of the Directors’ Report, has been audited by PricewaterhouseCoopers.
The KMP of Adelaide Brighton comprises all Directors and those Executives who have authority and responsibility for the planning, directing and controlling of the activities of the Group. In this Report, ‘Executives’ refers to members of the Group executive team identified as KMP.
During the year, Brad Lemmon, former Regional Executive General Manager, Cement and Lime (WA/NT) was appointed Executive General Manager, Cement and Lime, and Michael Miller, former Regional Executive General Manager, Cement and Lime (SA/NSW) was appointed Executive General Manager, Marketing and International Trade. This organisational restructure resulted in a review of KMP, with the Board determining that Michael Miller, in his role as Executive General Manager, Marketing and International Trade, no longer meets the definition of KMP. Following from this, Michael Miller is disclosed as a KMP for part of the 2016 financial year only.
The KMP detailed in this Report for the 2016 financial year are:
Section 1 - Executive remuneration policy and framework
1.1 Remuneration policy
The Board ensures remuneration policies are clearly aligned with the Group strategy, which is focused on maintaining and growing long term shareholder value. In determining executive remuneration, the Board has adopted a policy that aims to:
> Be competitive in the market place in which the Group operates in order to attract, reward, motivate and retain a highly capable executive team;
> Reward individual performance, responsibility and potential;
> Drive leadership performance and behaviours that reinforce the Group’s short and long term strategic and operational objectives;
> Provide a common interest between executives and shareholders by linking the rewards that accrue to executives to the creation of long term value for shareholders;
> Have regard to market practice and market conditions; and
> Provide transparency and clarity on what, to whom and on what basis remuneration has been paid.
The governance of remuneration outcomes is a key focus of the Board and the Nomination, Remuneration and Governance (NRG) Committee. Remuneration policies are regularly reviewed to ensure that remuneration for executives continue to remain aligned with Company performance.
Table 1
Name Role
ExecutivesM Brydon CEO and Managing Director (CEO & MD) M Kelly Chief Financial Officer (CFO)G Agriogiannis Executive General Manager, Concrete and AggregatesAL Dell Executive General Manager, Concrete ProductsBD Lemmon Executive General Manager, Cement and Lime (1) Former KMPMF Miller Former Regional Executive General Manager, Cement and Lime SA/NSW (2)
DirectorsLV Hosking Non-executive ChairmanRD Barro Non-executive DirectorGF Pettigrew Non-executive DirectorKB Scott-Mackenzie Non-executive DirectorAM Tansey Non-executive Director
(1) Appointed Executive General Manager, Cement and Lime on 1 May 2016, previously Regional Executive Manager, Cement and Lime (WA/NT).
(2) Appointed Executive General Manager, Marketing and International Trade on 1 May 2016.
Remuneration report
46ADELAIDE BRIGHTON LTD AND ITS CONTROLLED ENTITIES
FOR THE YEAR ENDED 31 DECEMBER 2016
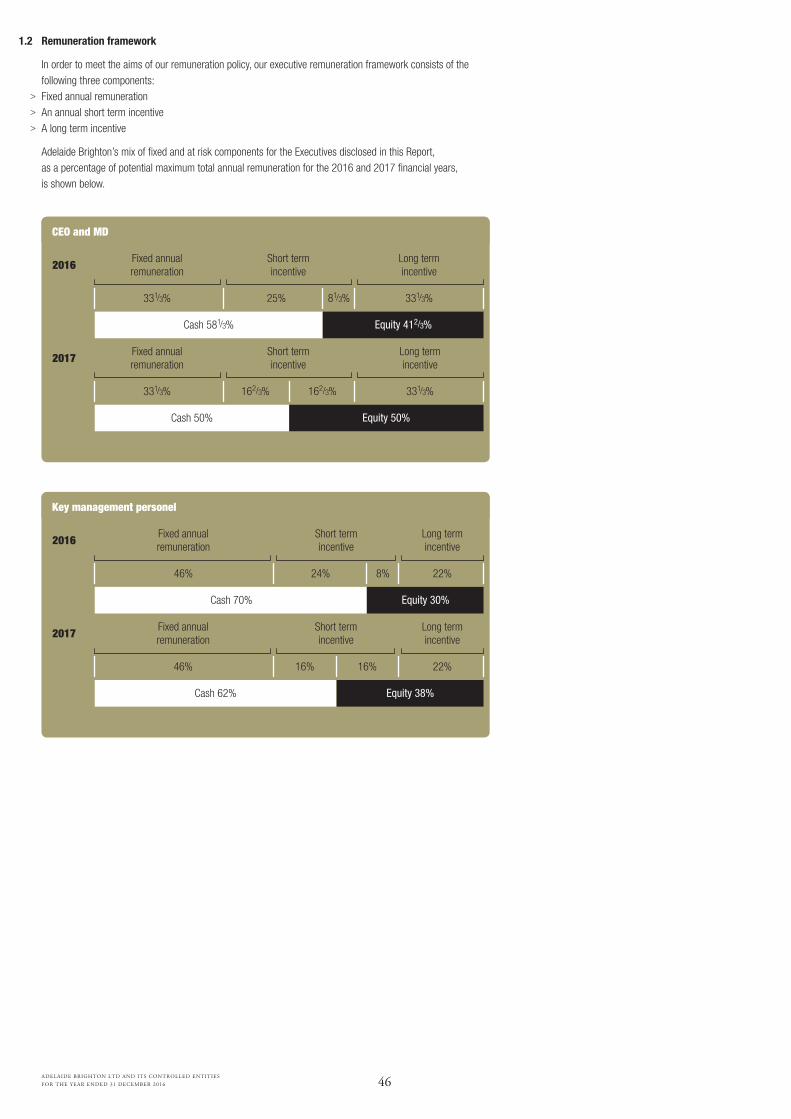
1.2 Remuneration framework
In order to meet the aims of our remuneration policy, our executive remuneration framework consists of the following three components:
> Fixed annual remuneration > An annual short term incentive > A long term incentive
Adelaide Brighton’s mix of fixed and at risk components for the Executives disclosed in this Report, as a percentage of potential maximum total annual remuneration for the 2016 and 2017 financial years, is shown below.
CEO and MD
Key management personel
Fixed annual remuneration
331/3%
Fixed annual remuneration
46%
Fixed annual remuneration
331/3%
Fixed annual remuneration
46%
Short term incentive
Short term incentive
Short term incentive
Short term incentive
Long term incentive
331/3%
Long term incentive
22%24% 8%
Long term incentive
22%
Long term incentive
331/3%
2016
2017
2016
2017
Cash 581/3% Equity 412/3%
Cash 70% Equity 30%
Cash 50%
Cash 62%
81/3%25%
162/3% 162/3%
16% 16%
Equity 50%
Equity 38%
47ADELAIDE BRIGHTON LTD AND ITS CONTROLLED ENTITIES
FOR THE YEAR ENDED 31 DECEMBER 2016
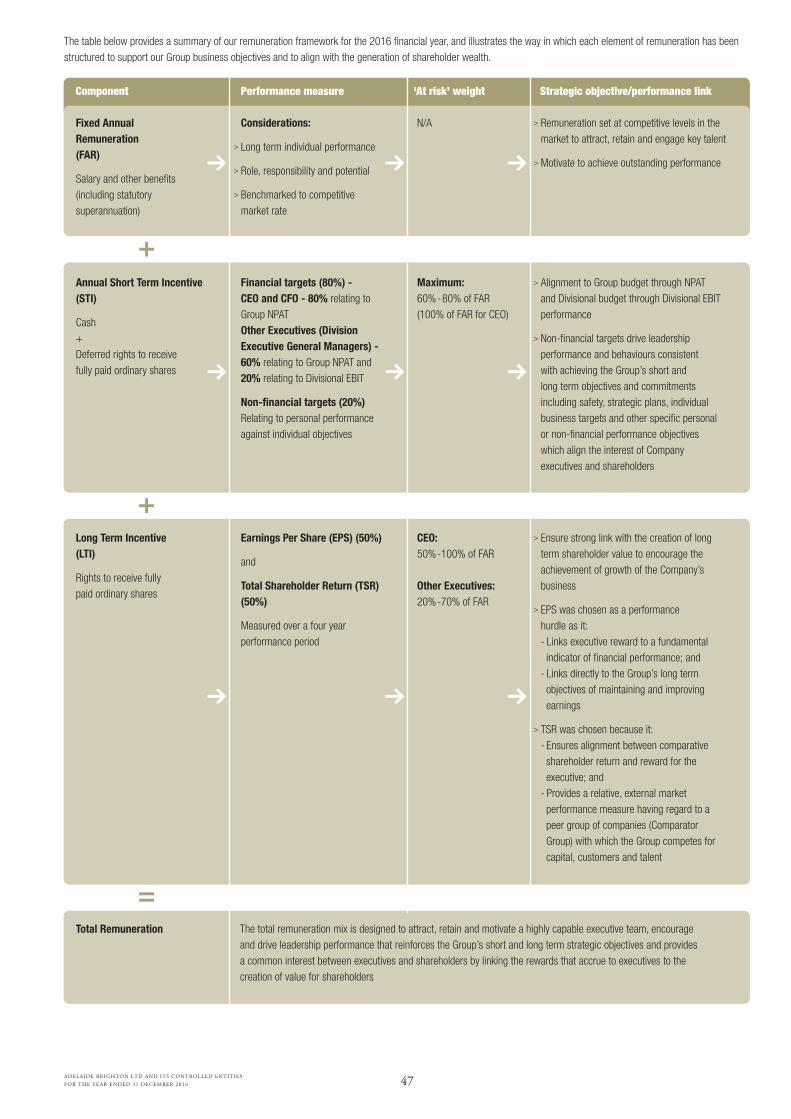
The table below provides a summary of our remuneration framework for the 2016 financial year, and illustrates the way in which each element of remuneration has been structured to support our Group business objectives and to align with the generation of shareholder wealth.
Component Performance measure ‘At risk’ weight Strategic objective/performance link
Considerations:
Long term individual performance
Role, responsibility and potential
Benchmarked to competitive market rate
Financial targets (80%) - CEO and CFO - 80% relating to Group NPATOther Executives (Division Executive General Managers) - 60% relating to Group NPAT and 20% relating to Divisional EBIT
Non-financial targets (20%) Relating to personal performanceagainst individual objectives
Earnings Per Share (EPS) (50%)
and
Total Shareholder Return (TSR) (50%)
Measured over a four year performance period
>
>
>
>
>
>
>
>
>
>
N/A
Maximum:60%-80% of FAR(100% of FAR for CEO)
CEO:50%-100% of FAR
Other Executives:20%-70% of FAR
Remuneration set at competitive levels in the market to attract, retain and engage key talent
Motivate to achieve outstanding performance
Alignment to Group budget through NPAT and Divisional budget through Divisional EBIT performance
Non-financial targets drive leadership performance and behaviours consistent with achieving the Group’s short and long term objectives and commitments including safety, strategic plans, individual business targets and other specific personal or non-financial performance objectives which align the interest of Company executives and shareholders
Ensure strong link with the creation of long term shareholder value to encourage the achievement of growth of the Company’s business
EPS was chosen as a performance hurdle as it:- Links executive reward to a fundamental indicator of financial performance; and - Links directly to the Group’s long term objectives of maintaining and improving earnings
TSR was chosen because it:- Ensures alignment between comparative shareholder return and reward for the executive; and- Provides a relative, external market performance measure having regard to a peer group of companies (Comparator Group) with which the Group competes for capital, customers and talent
The total remuneration mix is designed to attract, retain and motivate a highly capable executive team, encourage and drive leadership performance that reinforces the Group’s short and long term strategic objectives and provides a common interest between executives and shareholders by linking the rewards that accrue to executives to the creation of value for shareholders
Fixed Annual Remuneration (FAR)
Salary and other benefits(including statutorysuperannuation)
Annual Short Term Incentive(STI)
Cash+Deferred rights to receive fully paid ordinary shares
Long Term Incentive(LTI)
Rights to receive fully paid ordinary shares
Total Remuneration
48ADELAIDE BRIGHTON LTD AND ITS CONTROLLED ENTITIES
FOR THE YEAR ENDED 31 DECEMBER 2016
Section 2 - Overview of Company performance
2.1 Financial performance in 2016
The Directors are pleased to present Adelaide Brighton Limited’s financial performance for 2016.
> NPAT (excluding property) increased by 3.1%, despite a decline in sales volume of 20% in Western Australia and Northern Territory, and electricity market disruptions which impacted profit before tax by $9 million.
> Revenue of $1,396.2 million was 1.2% lower than 2015 due to reduced demand for cement from residential and resource construction projects in Western Australia and the Northern Territory which was balanced by continued strength in the residential sector and increase in infrastructure projects in the eastern states and South Australia.
> Excluding property profits, EBIT grew 1.6% on 2015 to $257.7 million.
Adelaide Brighton’s diversified business model and focus on operational improvement supported the Group’s long term growth strategy despite a decline in cement volumes in the key markets of Western Australia and Northern Territory. Strategic initiatives which contributed to the Company’s financial performance in 2016 included:
> Delivery of $16 million in cost initiatives on a pre-tax basis compared to 2015 which included $9 million in energy cost savings through the reduction in natural gas costs in the Western Australian lime business; electricity load management and increased use of alternative fuels at the Birkenhead operations as a substitute for natural gas; operational rationalisation savings of $1 million through headcount reductions and $6 million in benefits from a range of initiatives including improved efficiency in transport and usage of alternative materials.
> Competitive supply into key markets through the Company’s import strategy. The benefits have been evident in the Western Australian cement business where the Company was able to scale back imports when market demand turned down giving the business greater operational flexibility at a lower cost structure than before the rationalisation.
> Our land sales program has delivered cash proceeds since 2013 of $85 million. This includes transactions in 2016 that realised $20.6 million in cash proceeds and $7.9 million NPAT.
> The contribution from our longer term investments in aggregates is a feature of the 2016 results and reflects the realisation of our long term vertical integration strategy as a major contributor to shareholder returns.
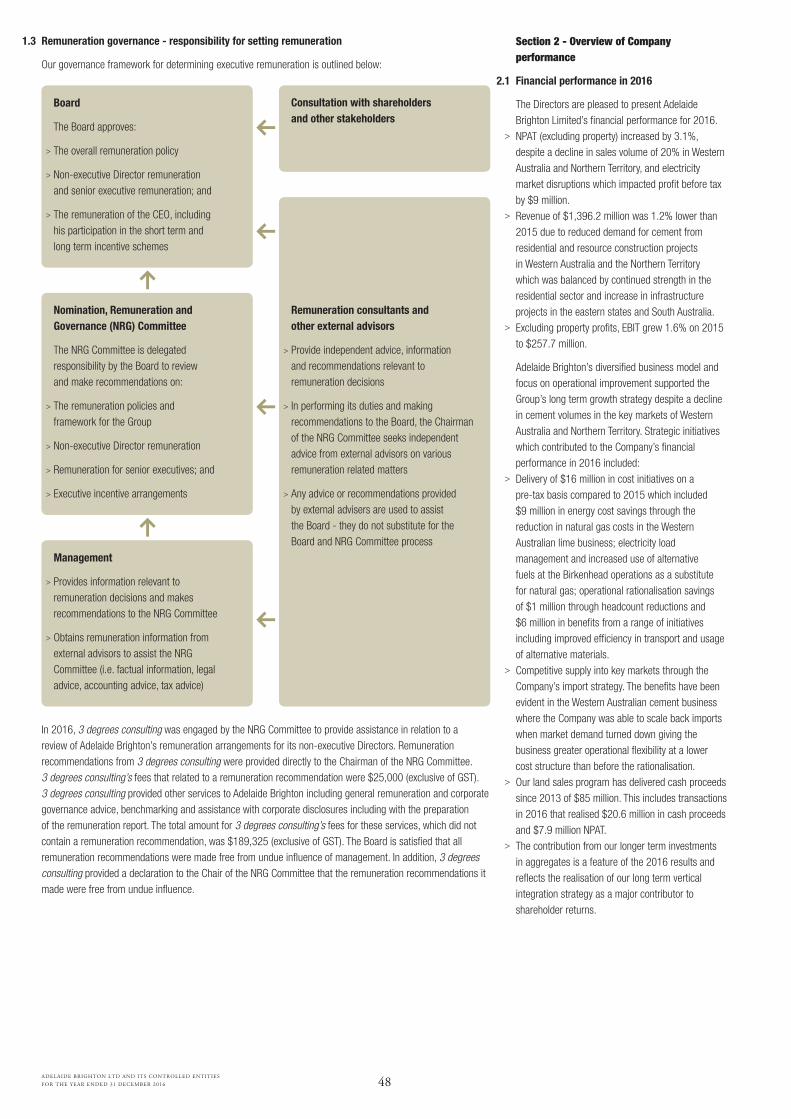
1.3 Remuneration governance - responsibility for setting remuneration
Our governance framework for determining executive remuneration is outlined below:
>
>
>
>
>
>
>
>
>
>
>
>
Board
The Board approves:
The overall remuneration policy
Non-executive Director remuneration and senior executive remuneration; and
The remuneration of the CEO, including his participation in the short term and long term incentive schemes
Consultation with shareholders and other stakeholders
Nomination, Remuneration and Governance (NRG) Committee
The NRG Committee is delegated responsibility by the Board to review and make recommendations on:
The remuneration policies and framework for the Group
Non-executive Director remuneration
Remuneration for senior executives; and
Executive incentive arrangements
Remuneration consultants and other external advisors
Provide independent advice, information and recommendations relevant to remuneration decisions
In performing its duties and making recommendations to the Board, the Chairman of the NRG Committee seeks independent advice from external advisors on various remuneration related matters
Any advice or recommendations provided by external advisers are used to assist the Board - they do not substitute for the Board and NRG Committee process
Management
Provides information relevant to remuneration decisions and makes recommendations to the NRG Committee
Obtains remuneration information from external advisors to assist the NRG Committee (i.e. factual information, legal advice, accounting advice, tax advice)
In 2016, 3 degrees consulting was engaged by the NRG Committee to provide assistance in relation to a review of Adelaide Brighton’s remuneration arrangements for its non-executive Directors. Remuneration recommendations from 3 degrees consulting were provided directly to the Chairman of the NRG Committee. 3 degrees consulting’s fees that related to a remuneration recommendation were $25,000 (exclusive of GST). 3 degrees consulting provided other services to Adelaide Brighton including general remuneration and corporate governance advice, benchmarking and assistance with corporate disclosures including with the preparation of the remuneration report. The total amount for 3 degrees consulting’s fees for these services, which did not contain a remuneration recommendation, was $189,325 (exclusive of GST). The Board is satisfied that all remuneration recommendations were made free from undue influence of management. In addition, 3 degrees consulting provided a declaration to the Chair of the NRG Committee that the remuneration recommendations it made were free from undue influence.
49ADELAIDE BRIGHTON LTD AND ITS CONTROLLED ENTITIES
FOR THE YEAR ENDED 31 DECEMBER 2016
Table 2
2016 2015 Variance 2016 2015 Variance $m $m % $m $m %
Reported Reported (excluding property)
Revenue 1,396.2 1,413.1 (1.2) 1,396.2 1,413.1 (1.2)
EBITDA 344.2 376.4 (8.6) 335.8 331.4 1.3
EBIT 266.1 298.6 (10.9) 257.7 253.6 1.6
NPAT 186.3 207.9 (10.4) 178.4 173.0 3.1
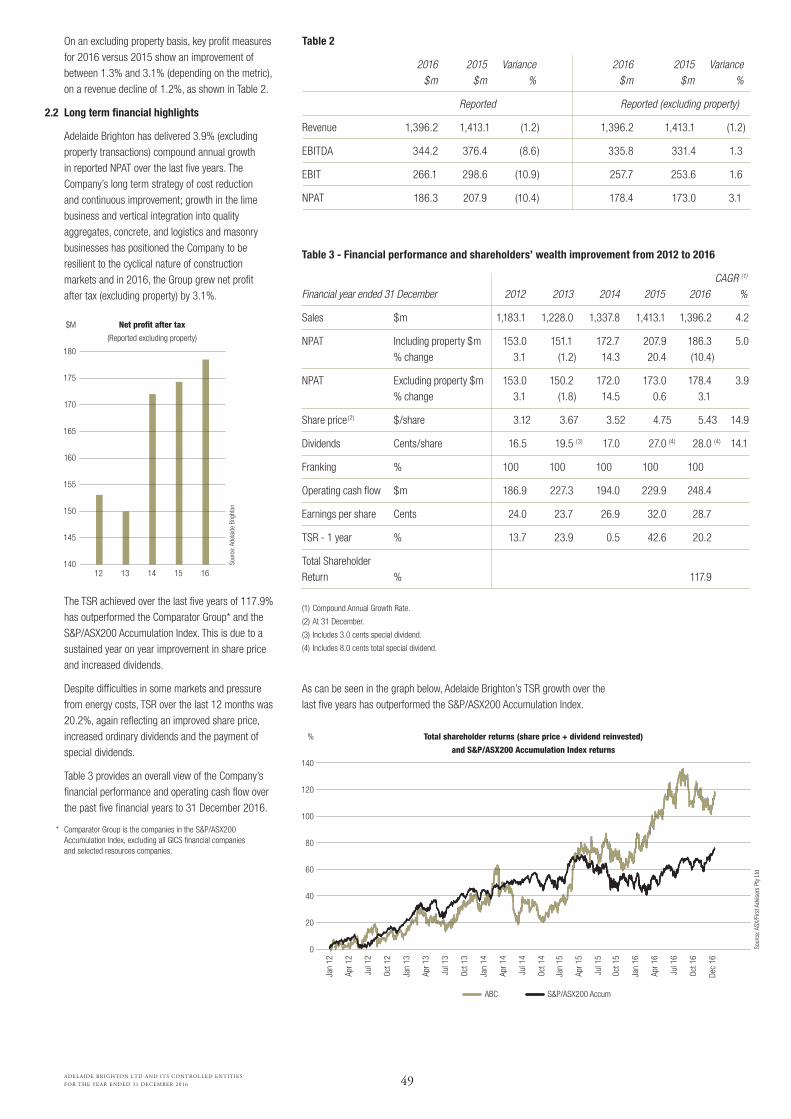
On an excluding property basis, key profit measures for 2016 versus 2015 show an improvement of between 1.3% and 3.1% (depending on the metric), on a revenue decline of 1.2%, as shown in Table 2.
2.2 Long term financial highlights
Adelaide Brighton has delivered 3.9% (excluding property transactions) compound annual growth in reported NPAT over the last five years. The Company’s long term strategy of cost reduction and continuous improvement; growth in the lime business and vertical integration into quality aggregates, concrete, and logistics and masonry businesses has positioned the Company to be resilient to the cyclical nature of construction markets and in 2016, the Group grew net profit after tax (excluding property) by 3.1%.
The TSR achieved over the last five years of 117.9% has outperformed the Comparator Group* and the S&P/ASX200 Accumulation Index. This is due to a sustained year on year improvement in share price and increased dividends.
Despite difficulties in some markets and pressure from energy costs, TSR over the last 12 months was 20.2%, again reflecting an improved share price, increased ordinary dividends and the payment of special dividends.
Table 3 provides an overall view of the Company’s financial performance and operating cash flow over the past five financial years to 31 December 2016.
* Comparator Group is the companies in the S&P/ASX200 Accumulation Index, excluding all GICS financial companies and selected resources companies.
Table 3 - Financial performance and shareholders’ wealth improvement from 2012 to 2016
CAGR (1)
Financial year ended 31 December 2012 2013 2014 2015 2016 %
Sales $m 1,183.1 1,228.0 1,337.8 1,413.1 1,396.2 4.2
NPAT Including property $m 153.0 151.1 172.7 207.9 186.3 5.0 % change 3.1 (1.2) 14.3 20.4 (10.4)
NPAT Excluding property $m 153.0 150.2 172.0 173.0 178.4 3.9 % change 3.1 (1.8) 14.5 0.6 3.1
Share price(2) $/share 3.12 3.67 3.52 4.75 5.43 14.9
Dividends Cents/share 16.5 19.5 (3) 17.0 27.0 (4) 28.0 (4) 14.1
Franking % 100 100 100 100 100
Operating cash flow $m 186.9 227.3 194.0 229.9 248.4
Earnings per share Cents 24.0 23.7 26.9 32.0 28.7
TSR - 1 year % 13.7 23.9 0.5 42.6 20.2
Total Shareholder Return % 117.9
(1) Compound Annual Growth Rate.
(2) At 31 December.
(3) Includes 3.0 cents special dividend.
(4) Includes 8.0 cents total special dividend.
As can be seen in the graph below, Adelaide Brighton’s TSR growth over the last five years has outperformed the S&P/ASX200 Accumulation Index.
Net profit after tax
(Reported excluding property)
Sour
ce: A
dela
ide
Brig
hton
$M
180
175
170
165
160
155
150
145
14012 13 14 15 16
ABC S&P/ASX200 Accum
%
140
120
100
80
60
40
20
0
Total shareholder returns (share price + dividend reinvested)
and S&P/ASX200 Accumulation Index returnsSo
urce
: ASX
/Firs
t Adv
iser
s Pt
y Lt
d
Jan
12
Apr
12
Jul
12
Oct
12
Jan
13
Apr
13
Jul
13
Oct 1
3
Jan
14
Apr
14
Jul
14
Oct
14
Jan
15
Apr
15
Jul
15
Oct
15
Jan
16
Apr
16
Jul
16
Oct
16
Dec
16

50ADELAIDE BRIGHTON LTD AND ITS CONTROLLED ENTITIES
FOR THE YEAR ENDED 31 DECEMBER 2016
Section 3 - Linking remuneration to Company performance
This section explains how the Group’s performance has driven Short Term Incentive and Long Term Incentive outcomes for our Executives during 2016. Strong Company performance across key indicators is reflected in the remuneration outcomes during the year.
3.1 Short Term Incentive
3.1.1 Short Term Incentive - performance measures
The “financial metrics” for the Group is NPAT and EBIT for Divisions. Actual financial metrics are compared to target. The Board has discretion to adjust NPAT for target assessment.
The strategic initiatives focus on three interdependent areas: operational excellence, market leadership and vertical integration, with key foundation drivers being growth in our core business and opportunities for transformational deals.
A range of metrics focused on safety, engagement, building capability, retaining company knowledge and diversity with specific metrics for:> Leadership in safety> Employee engagement> Development of capability> Deepening succession pools> Increasing diversity of candidate pools.
Specific operational targets focused on productivity gains, cost reduction, operational improvement and improved asset management towards achieving improved return on investment.
The Board believes the financial measure aligns the interests of Executives with shareholders, ensuring the KMP are rewarded on the Group’s annual business objectives, ensuring Executives create sustainable value for shareholders. The comparison to budget allows for recognition of the cyclical nature of the industry in which the Company operates and forward looking factors that can be incorporated into a budget, while the stretch targets provide incentives beyond budget to enhance shareholder returns.
Proactively responding to market developments and implementing strategies to drive sustainable growth are critical to delivering the strategy and the creation of shareholder value.
Having the right people in management and senior leadership roles is critical to our long term success. The CEO and Managing Director plays an important role in this process and he is assessed on his ability to manage talent and succession risks at senior management levels.
Specific measures and initiatives were identified to ensure the delivery of sustainable operations and shareholder return.
Performance measures Reason chosen
Fina
ncia
lSt
rate
gic
Peop
leOp
erat
ion
exce
llenc
e
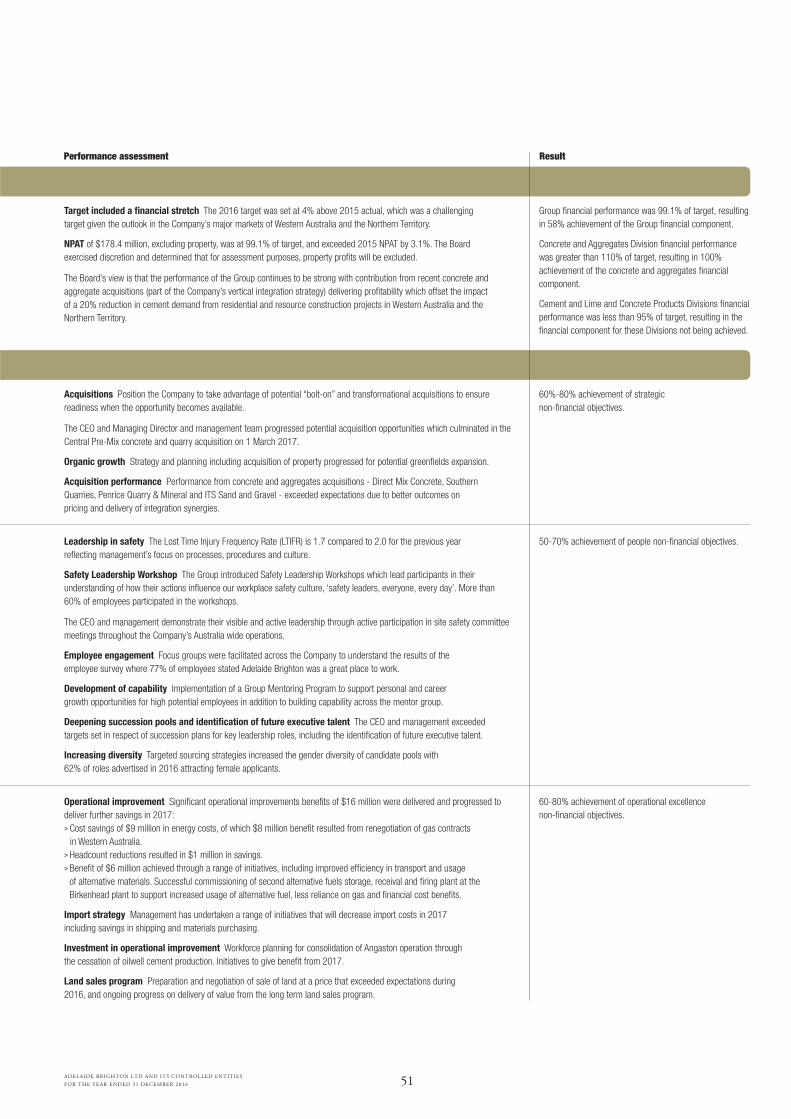
Financial performance
Non-financial performance
51ADELAIDE BRIGHTON LTD AND ITS CONTROLLED ENTITIES
FOR THE YEAR ENDED 31 DECEMBER 2016
Target included a financial stretch The 2016 target was set at 4% above 2015 actual, which was a challenging target given the outlook in the Company’s major markets of Western Australia and the Northern Territory.
NPAT of $178.4 million, excluding property, was at 99.1% of target, and exceeded 2015 NPAT by 3.1%. The Board exercised discretion and determined that for assessment purposes, property profits will be excluded.
The Board’s view is that the performance of the Group continues to be strong with contribution from recent concrete and aggregate acquisitions (part of the Company’s vertical integration strategy) delivering profitability which offset the impact of a 20% reduction in cement demand from residential and resource construction projects in Western Australia and the Northern Territory.
Acquisitions Position the Company to take advantage of potential “bolt-on” and transformational acquisitions to ensure readiness when the opportunity becomes available.
The CEO and Managing Director and management team progressed potential acquisition opportunities which culminated in the Central Pre-Mix concrete and quarry acquisition on 1 March 2017.
Organic growth Strategy and planning including acquisition of property progressed for potential greenfields expansion.
Acquisition performance Performance from concrete and aggregates acquisitions - Direct Mix Concrete, Southern Quarries, Penrice Quarry & Mineral and ITS Sand and Gravel - exceeded expectations due to better outcomes on pricing and delivery of integration synergies.
Leadership in safety The Lost Time Injury Frequency Rate (LTIFR) is 1.7 compared to 2.0 for the previous year reflecting management’s focus on processes, procedures and culture.
Safety Leadership Workshop The Group introduced Safety Leadership Workshops which lead participants in their understanding of how their actions influence our workplace safety culture, ‘safety leaders, everyone, every day’. More than 60% of employees participated in the workshops.
The CEO and management demonstrate their visible and active leadership through active participation in site safety committee meetings throughout the Company’s Australia wide operations.
Employee engagement Focus groups were facilitated across the Company to understand the results of the employee survey where 77% of employees stated Adelaide Brighton was a great place to work.
Development of capability Implementation of a Group Mentoring Program to support personal and career growth opportunities for high potential employees in addition to building capability across the mentor group.
Deepening succession pools and identification of future executive talent The CEO and management exceeded targets set in respect of succession plans for key leadership roles, including the identification of future executive talent.
Increasing diversity Targeted sourcing strategies increased the gender diversity of candidate pools with 62% of roles advertised in 2016 attracting female applicants.
Operational improvement Significant operational improvements benefits of $16 million were delivered and progressed to deliver further savings in 2017:> Cost savings of $9 million in energy costs, of which $8 million benefit resulted from renegotiation of gas contracts in Western Australia.> Headcount reductions resulted in $1 million in savings.> Benefit of $6 million achieved through a range of initiatives, including improved efficiency in transport and usage of alternative materials. Successful commissioning of second alternative fuels storage, receival and firing plant at the Birkenhead plant to support increased usage of alternative fuel, less reliance on gas and financial cost benefits.
Import strategy Management has undertaken a range of initiatives that will decrease import costs in 2017 including savings in shipping and materials purchasing.
Investment in operational improvement Workforce planning for consolidation of Angaston operation through the cessation of oilwell cement production. Initiatives to give benefit from 2017.
Land sales program Preparation and negotiation of sale of land at a price that exceeded expectations during 2016, and ongoing progress on delivery of value from the long term land sales program.
Group financial performance was 99.1% of target, resulting in 58% achievement of the Group financial component.
Concrete and Aggregates Division financial performance was greater than 110% of target, resulting in 100% achievement of the concrete and aggregates financial component.
Cement and Lime and Concrete Products Divisions financial performance was less than 95% of target, resulting in the financial component for these Divisions not being achieved.
60%-80% achievement of strategic non-financial objectives.
50-70% achievement of people non-financial objectives.
60-80% achievement of operational excellence non-financial objectives.
Performance assessment Result
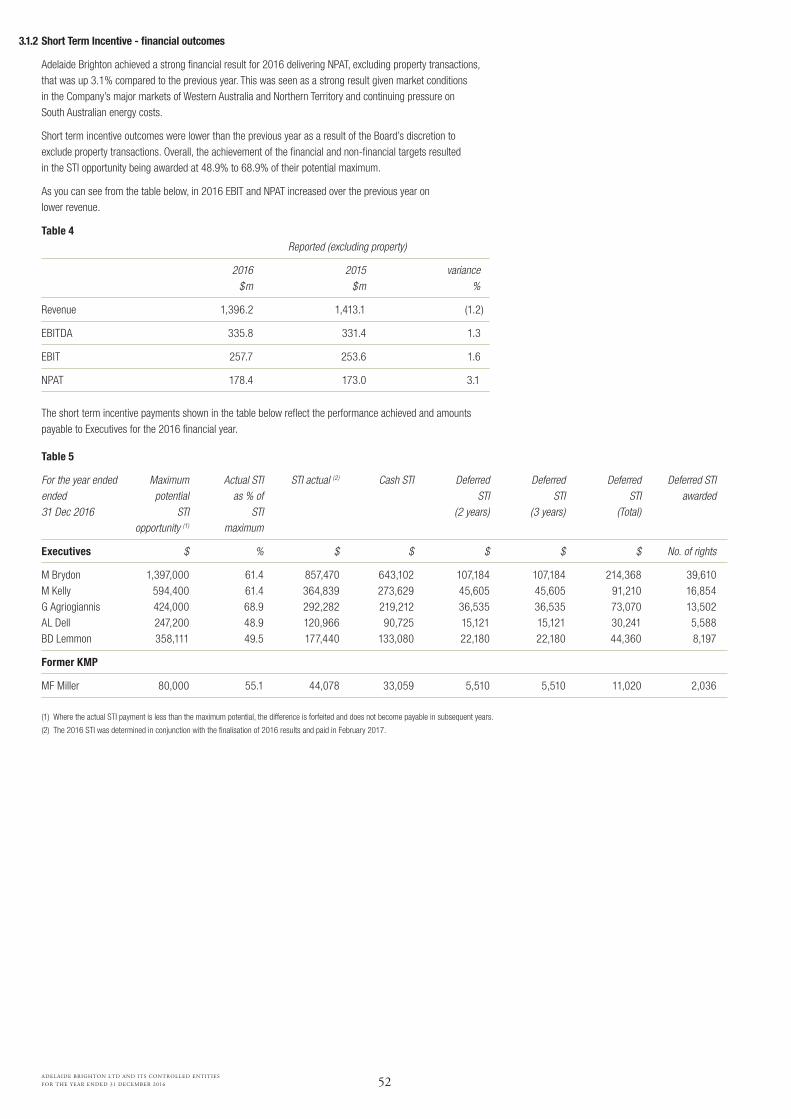
52ADELAIDE BRIGHTON LTD AND ITS CONTROLLED ENTITIES
FOR THE YEAR ENDED 31 DECEMBER 2016
3.1.2 Short Term Incentive - financial outcomes
Adelaide Brighton achieved a strong financial result for 2016 delivering NPAT, excluding property transactions, that was up 3.1% compared to the previous year. This was seen as a strong result given market conditions in the Company’s major markets of Western Australia and Northern Territory and continuing pressure on South Australian energy costs.
Short term incentive outcomes were lower than the previous year as a result of the Board’s discretion to exclude property transactions. Overall, the achievement of the financial and non-financial targets resulted in the STI opportunity being awarded at 48.9% to 68.9% of their potential maximum.
As you can see from the table below, in 2016 EBIT and NPAT increased over the previous year on lower revenue.
Table 4 Reported (excluding property)
2016 2015 variance $m $m %
Revenue 1,396.2 1,413.1 (1.2)
EBITDA 335.8 331.4 1.3
EBIT 257.7 253.6 1.6
NPAT 178.4 173.0 3.1
The short term incentive payments shown in the table below reflect the performance achieved and amounts payable to Executives for the 2016 financial year.
Table 5
For the year ended Maximum Actual STI STI actual (2) Cash STI Deferred Deferred Deferred Deferred STI ended potential as % of STI STI STI awarded 31 Dec 2016 STI STI (2 years) (3 years) (Total) opportunity (1) maximum
Executives $ % $ $ $ $ $ No. of rights
M Brydon 1,397,000 61.4 857,470 643,102 107,184 107,184 214,368 39,610M Kelly 594,400 61.4 364,839 273,629 45,605 45,605 91,210 16,854G Agriogiannis 424,000 68.9 292,282 219,212 36,535 36,535 73,070 13,502AL Dell 247,200 48.9 120,966 90,725 15,121 15,121 30,241 5,588BD Lemmon 358,111 49.5 177,440 133,080 22,180 22,180 44,360 8,197
Former KMP
MF Miller 80,000 55.1 44,078 33,059 5,510 5,510 11,020 2,036
(1) Where the actual STI payment is less than the maximum potential, the difference is forfeited and does not become payable in subsequent years.
(2) The 2016 STI was determined in conjunction with the finalisation of 2016 results and paid in February 2017.
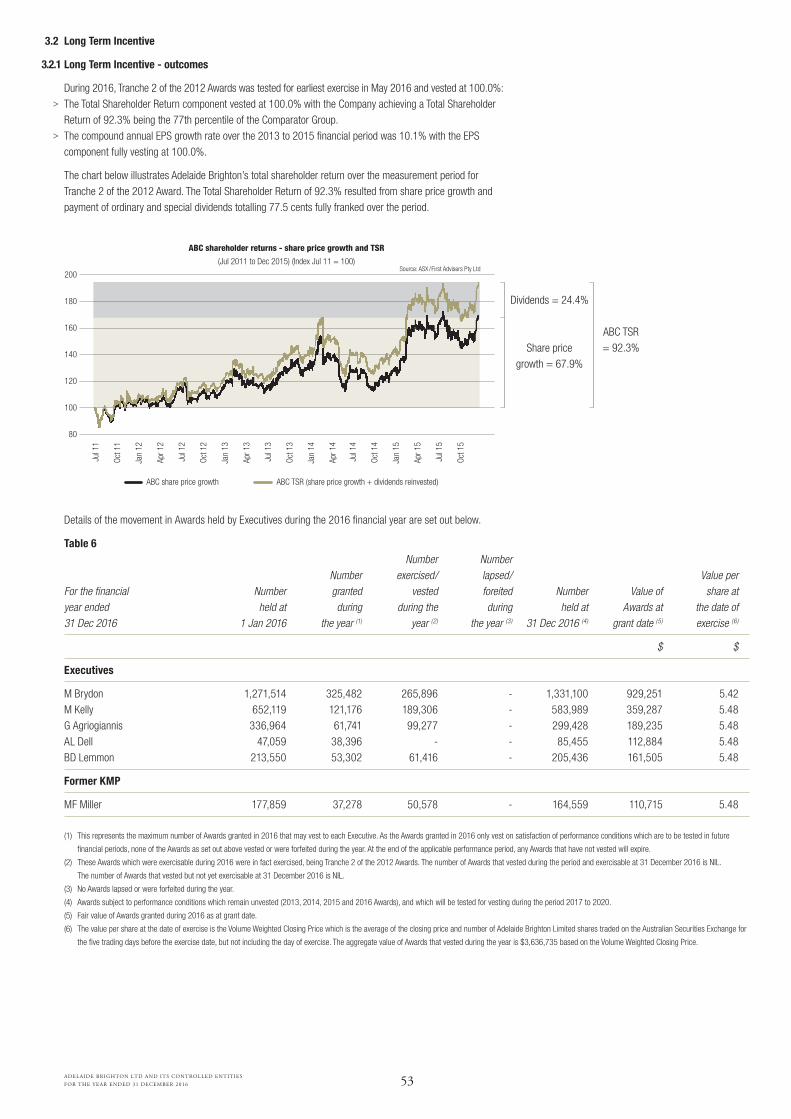
53ADELAIDE BRIGHTON LTD AND ITS CONTROLLED ENTITIES
FOR THE YEAR ENDED 31 DECEMBER 2016
3.2 Long Term Incentive
3.2.1 Long Term Incentive - outcomes
During 2016, Tranche 2 of the 2012 Awards was tested for earliest exercise in May 2016 and vested at 100.0%: > The Total Shareholder Return component vested at 100.0% with the Company achieving a Total Shareholder
Return of 92.3% being the 77th percentile of the Comparator Group. > The compound annual EPS growth rate over the 2013 to 2015 financial period was 10.1% with the EPS
component fully vesting at 100.0%.
The chart below illustrates Adelaide Brighton’s total shareholder return over the measurement period for Tranche 2 of the 2012 Award. The Total Shareholder Return of 92.3% resulted from share price growth and payment of ordinary and special dividends totalling 77.5 cents fully franked over the period.
Details of the movement in Awards held by Executives during the 2016 financial year are set out below.
Table 6 Number Number Number exercised/ lapsed/ Value perFor the financial Number granted vested foreited Number Value of share atyear ended held at during during the during held at Awards at the date of31 Dec 2016 1 Jan 2016 the year (1) year (2) the year (3) 31 Dec 2016 (4) grant date (5) exercise (6)
$ $
Executives
M Brydon 1,271,514 325,482 265,896 - 1,331,100 929,251 5.42M Kelly 652,119 121,176 189,306 - 583,989 359,287 5.48G Agriogiannis 336,964 61,741 99,277 - 299,428 189,235 5.48AL Dell 47,059 38,396 - - 85,455 112,884 5.48BD Lemmon 213,550 53,302 61,416 - 205,436 161,505 5.48
Former KMP
MF Miller 177,859 37,278 50,578 - 164,559 110,715 5.48
(1) This represents the maximum number of Awards granted in 2016 that may vest to each Executive. As the Awards granted in 2016 only vest on satisfaction of performance conditions which are to be tested in future
financial periods, none of the Awards as set out above vested or were forfeited during the year. At the end of the applicable performance period, any Awards that have not vested will expire.
(2) These Awards which were exercisable during 2016 were in fact exercised, being Tranche 2 of the 2012 Awards. The number of Awards that vested during the period and exercisable at 31 December 2016 is NIL.
The number of Awards that vested but not yet exercisable at 31 December 2016 is NIL.
(3) No Awards lapsed or were forfeited during the year.
(4) Awards subject to performance conditions which remain unvested (2013, 2014, 2015 and 2016 Awards), and which will be tested for vesting during the period 2017 to 2020.
(5) Fair value of Awards granted during 2016 as at grant date.
(6) The value per share at the date of exercise is the Volume Weighted Closing Price which is the average of the closing price and number of Adelaide Brighton Limited shares traded on the Australian Securities Exchange for
the five trading days before the exercise date, but not including the day of exercise. The aggregate value of Awards that vested during the year is $3,636,735 based on the Volume Weighted Closing Price.
Dividends = 24.4%
Share pricegrowth = 67.9%
ABC TSR= 92.3%
ABC share price growth ABC TSR (share price growth + dividends reinvested)
200
180
160
140
120
100
80
ABC shareholder returns - share price growth and TSR
(Jul 2011 to Dec 2015) (Index Jul 11 = 100)Source: ASX /First Advisers Pty Ltd
Jul
11
Oct
11
Jan
12
Apr
12
Jul
12
Oct
12
Jan
13
Apr 1
3
Jul
13
Oct
13
Jan
14
Apr
14
Jul
14
Oct
14
Jan
15
Apr
15
Jul
15
Oct
15
54ADELAIDE BRIGHTON LTD AND ITS CONTROLLED ENTITIES
FOR THE YEAR ENDED 31 DECEMBER 2016
Section 4 - Executive remuneration
4.1 Fixed annual remuneration
The amount of fixed remuneration for an individual executive (expressed as a total amount of salary and other benefits, including superannuation contributions) is set with regard to the size and nature of an executive’s role, the long term performance of an individual, his or her future potential within the Group and market practice. The Company’s stated approach is also to set fixed remuneration levels at relatively modest levels compared to peers for executives who are new to their roles and to then progressively increase remuneration based on individual performance in that role.
Fixed remuneration is reviewed annually having regard to relevant factors including performance, market conditions (both generally and in the markets in which the Group operates), growth and comparable roles within peer companies and similar roles across a comparator group comprising those companies in the ASX 51-150. For someone who has performed successfully in their role for a number of years, FAR set between the median and 75th percentile of the comparator would be expected.
From 1 January 2016 the Board resolved to increase fixed remuneration across the executive team by 5 to 7 per cent, in line with the Company’s policy of setting remuneration levels based on the size and nature of an executive’s role (and impact of the role on the business) and individual performance in roles. Fixed remuneration levels continue to remain conservative relative to peer companies of a similar market capitalisation.
4.2 At-risk remuneration - Short Term Incentive
Adelaide Brighton’s STI is the Company’s at risk short term incentive component of the remuneration mix for senior executives, including Executives.
A summary of the key features of the 2016 STI is as follows:
Form and purpose of the STI
Who participates in the STI? Participation in the STI is generally offered to the CEO and Managing Director and senior executives who are able to have a direct impact on the Group’s performance against the relevant performance hurdles.
Why does the Board consider the STI The STI is designed to put a meaningful proportion of senior executives’ remuneration at risk, to be deliveredan appropriate incentive? on the achievement of performance targets linked to the Group’s annual business objectives, ensuring senior
executives create sustainable value for shareholders.
Does the STI comprise a deferred component? Yes.
For STI awards for the 2016 financial year, 25% of awards will be deferred into rights to receive fully paid ordinary shares in Adelaide Brighton (issued at no cost to the executive) subject to disposal restrictions (Deferred Rights) (see below).
For STI awards for the 2017 financial year onwards, 50% of STI awards will be deferred (unless otherwise determined by the Board).
Performance conditions
When and how are the STI performance conditions set? All performance conditions are set by the Board and agreed with the executive, in general, by the end of February in each year.
In approving financial targets under the STI, the Board considers a number of factors, including the industry in which we operate and the extraneous factors including market conditions that impact our financial performance and those of our competitors. These include the dynamics of the construction and resources industries, exchange rates and energy considerations.
Our management team has responded well to external pressures over recent years, and has generated positive return for longer term shareholders in a challenging environment.
Accordingly, the Board strongly believes that our STI targets need to be set in this context in order to continue to attract and motivate a highly capable senior executive team who can drive the continued delivery of strong results for shareholders over the longer term.
Reward opportunity
What level of reward can be earned under the STI? STI outcomes of financial targets vest progressively in accordance with the following scale:
Financial target achieved STI % for financial target
Below 95% Nil 95% 50% Between 95% and 110% Pro rata 110% or above 100%
Non-financial objectives are set at a stretch level of performance.
55ADELAIDE BRIGHTON LTD AND ITS CONTROLLED ENTITIES
FOR THE YEAR ENDED 31 DECEMBER 2016
Governance
How is performance against the performance All performance conditions under the STI are clearly defined and measurable.conditions assessed?
Historically, the STI scheme used budgeted PBT as the metric for determining financial performance. The measure was changed to NPAT for the 2016 year for target setting and measuring Group financial performance for the purposes of the STI as this more closely reflects the shareholder experience. Divisional financial performance will continue to be based on EBIT performance.
In respect of the financial targets, the Board compares the actual NPAT earned against the budgeted NPAT for the year, and assesses the degree to which the Group met these targets. The Board may adjust for exceptional, abnormal or extraordinary factors which may have affected the Group’s performance during the year.
There were no significant items during the year and reported profit equalled statutory profit. However, in assessing the 2016 STI, the Board adjusted the NPAT used for STI purposes to exclude property profits.
The Board also considers the NRG Committee’s assessment of the CEO and Managing Director’s performance against the agreed non-financial targets, and that of the senior executives (based on the recommendation of the CEO and Managing Director).
When is performance against the Assessment of performance against the performance hurdles for the relevant year is determined at the Februaryperformance conditions determined meeting of the NRG Committee and the Board, in conjunction with finalisation of the Group’s full year results.and the award made available?
The cash award is paid following the release of the Company’s full year results in February. The remainder of the award (the Deferred Rights) is made available as reasonably practical after the announcement of the Company’s full year result.
What disposal restrictions apply to the The Deferred Rights will be divided into two equal tranches:Deferred Rights (and to dividends and > the Deferred Rights in Tranche 1 and the shares acquired on their exercise may not be sold or otherwisevoting rights attached)? disposed of until after 31 December 2018 (2 year disposal restriction); and > the Deferred Rights in Tranche 2 and the shares acquired on their exercise may not be sold or otherwise disposed of until after 31 December 2019 (3 year disposal restriction).
No dividends (or voting rights) are received on the Deferred Rights during the disposal restrictions.
Does the Board have an overriding discretion? The Board has absolute discretion in relation to assessing performance and determining the amount, if any, of STI awards.
Is there an ability to ‘claw back’ Yes. The STI Plan Rules provide the Board with a broad ability to claw back awards if considered appropriate. in appropriate circumstances?
In addition to the STI Plan Rules, the Board also has a formal Clawback Policy which provides the Board with the ability to reduce, forfeit or require repayment of incentives which vest (or may vest) in the case of a material misstatement in Company financial results, serious misconduct by a participant or in circumstances where incentive awards or vesting is based on incorrect information not of a financial nature.
Cessation of employment or a change of control
What happens to STI awards on Generally, if an Executive resigns or is terminated for cause, all STI entitlements will be forfeited.cessation of employment?
The STI Plan Rules provide that in other circumstances, and at the discretion of the Board, award opportunities will be pro-rata reduced to reflect the proportion of the measurement period not worked. Any disposal restrictions applicable to shares acquired upon the exercise of Deferred Rights will be lifted on cessation of employment.
How would a change of control of the In the event of a takeover bid (or other transaction likely to result in a change in control of the Company), Group impact on STI entitlements? the Board has absolute discretion to take any action as provided under the STI Plan Rules.

56ADELAIDE BRIGHTON LTD AND ITS CONTROLLED ENTITIES
FOR THE YEAR ENDED 31 DECEMBER 2016
4.3 At-risk remuneration - Long Term Incentive
The Company makes annual grants of Awards under the Executive Performance Share Plan (Plan) to all senior executives who are eligible to participate.
A summary of the key features of the Plan as it applies to the 2016 LTI Award is as follows:
Driving performance
Who participates and how does the The LTI is offered to senior executives whose behaviour and performance have a direct impact on the Group’sPlan drive performance and align long term performance. Its purpose is to focus executives on the Group’s long term business strategy to createparticipants’ interests with shareholders? and protect shareholder value over a four year performance period, thus aligning executives’ interests more
closely with shareholders.
Vesting, performance conditions and reward opportunity
What is the vesting / performance period? The 2016 Awards will be tested and become exercisable to the extent of any vesting from 1 May 2020.
What happens on the exercise of Awards? Shares are delivered to the executive on the exercise of the Awards. Awards are granted at no cost to the executive and no amount is payable by the executive on the exercise of the Awards.
Any unexercised 2016 Awards will expire on 30 September 2020.
How is the TSR performance condition measured The Company’s TSR performance must equal or exceed the growth in the returns of the median companies ofand what amount can be earned? the S&P/ASX 200 Accumulation Index (XJO Al), excluding all GICS Financial companies and selected resources
companies over the period from 31 December 2015 to 31 December 2019.
The 2016 Awards vest progressively in accordance with the following scale:
TSR growth relative percentile ranking % of Awards subject to TSR hurdle to vest
Below 50% Nil 50% 50% Between 50% and 75% Pro rata 75% or above 100%
How is the EPS performance condition calculated The EPS performance hurdle requires the compound annual growth in EPS of the Company over the relevantand what amount can be earned? performance period to equal or exceed 5% per annum before any Awards will vest.
Awards under the 2016 Award are to vest progressively in accordance with the following scale:
Compound annual growth in EPS % of Awards subject to EPS hurdle to vest
Below 5% per annum Nil 5% per annum 50% Between 5% and 10% per annum Pro rata 10% per annum or above 100%
Is re-testing permitted? No. Re-testing of either of the performance conditions applicable to a tranche of Awards is not permitted.
Governance
Is there ability to ‘claw back’ Yes. The rules of the Plan have, for some time, provided the Board with a broad ability to claw back Awards in appropriate circumstances? if considered appropriate.
In addition to the rules of the Plan, the Board also has a formal Clawback Policy which provides the Board with the ability to reduce, forfeit or require repayment of incentives which vest (or may vest) in the case of a material misstatement in Company financial results, serious misconduct by a Participant or in circumstances where incentive awards or vesting is based on incorrect information not of a financial nature.
What other conditions apply to the Awards An executive’s entitlement to shares under an Award may also be adjusted to take account of capital(including voting rights and dividends)? reconstructions and bonus issues.
The rules of the Plan contain a restriction on removing the ‘at-risk’ aspect of the instruments granted to executives. Plan participants may not enter into any transaction designed to remove the ‘at-risk’ aspect of an instrument before it becomes exercisable (eg. hedging the Awards).
Until the Awards vest, executives have no legal or beneficial interest in Adelaide Brighton Limited shares, no entitlement to receive dividends and no voting rights in relation to any securities granted under the 2016 Award, or any of the other Awards.
Any shares allocated to the executive following exercise of an Award may only be dealt with in accordance with the Company’s Share Trading Policy and subject to the generally applicable insider trading prohibitions.
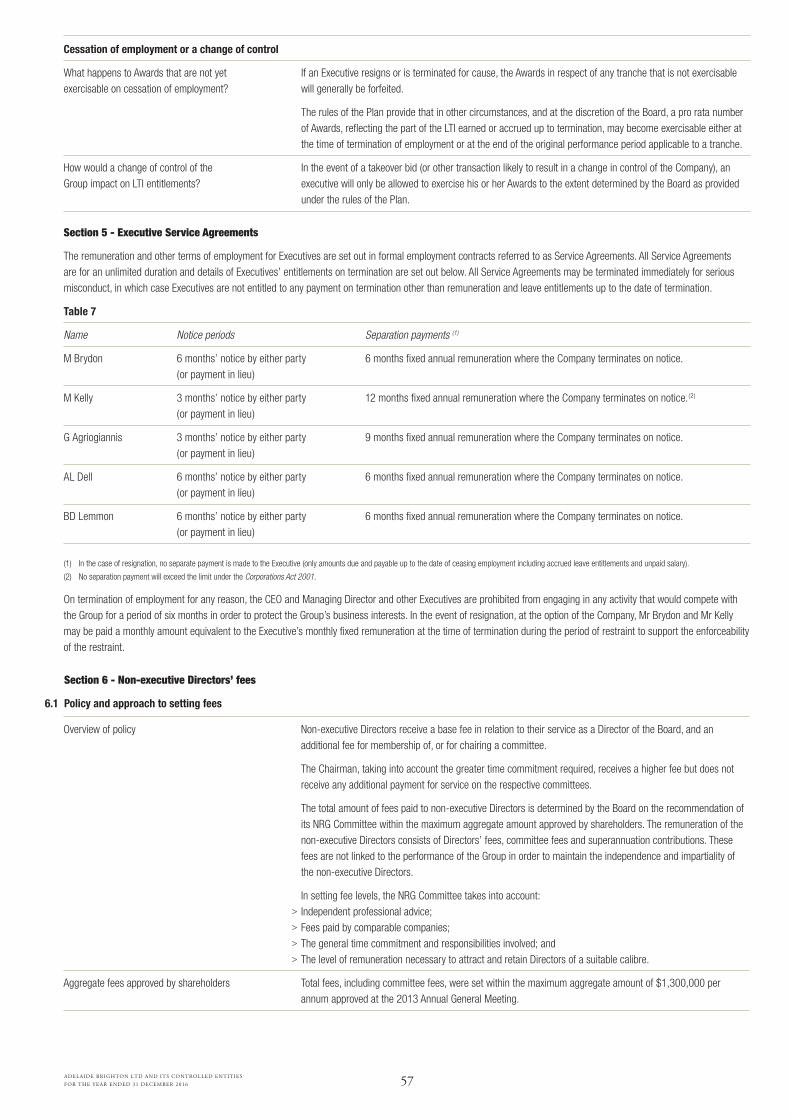
57ADELAIDE BRIGHTON LTD AND ITS CONTROLLED ENTITIES
FOR THE YEAR ENDED 31 DECEMBER 2016
Overview of policy Non-executive Directors receive a base fee in relation to their service as a Director of the Board, and an additional fee for membership of, or for chairing a committee.
The Chairman, taking into account the greater time commitment required, receives a higher fee but does not receive any additional payment for service on the respective committees.
The total amount of fees paid to non-executive Directors is determined by the Board on the recommendation of its NRG Committee within the maximum aggregate amount approved by shareholders. The remuneration of the non-executive Directors consists of Directors’ fees, committee fees and superannuation contributions. These fees are not linked to the performance of the Group in order to maintain the independence and impartiality of the non-executive Directors.
In setting fee levels, the NRG Committee takes into account: > Independent professional advice; >Fees paid by comparable companies; >The general time commitment and responsibilities involved; and >The level of remuneration necessary to attract and retain Directors of a suitable calibre.
Aggregate fees approved by shareholders Total fees, including committee fees, were set within the maximum aggregate amount of $1,300,000 per annum approved at the 2013 Annual General Meeting.
Cessation of employment or a change of control
What happens to Awards that are not yet If an Executive resigns or is terminated for cause, the Awards in respect of any tranche that is not exercisableexercisable on cessation of employment? will generally be forfeited.
The rules of the Plan provide that in other circumstances, and at the discretion of the Board, a pro rata number of Awards, reflecting the part of the LTI earned or accrued up to termination, may become exercisable either at the time of termination of employment or at the end of the original performance period applicable to a tranche.
How would a change of control of the In the event of a takeover bid (or other transaction likely to result in a change in control of the Company), anGroup impact on LTI entitlements? executive will only be allowed to exercise his or her Awards to the extent determined by the Board as provided
under the rules of the Plan.
Section 5 - Executive Service Agreements
The remuneration and other terms of employment for Executives are set out in formal employment contracts referred to as Service Agreements. All Service Agreements are for an unlimited duration and details of Executives’ entitlements on termination are set out below. All Service Agreements may be terminated immediately for serious misconduct, in which case Executives are not entitled to any payment on termination other than remuneration and leave entitlements up to the date of termination.
Table 7
Name Notice periods Separation payments (1)
M Brydon 6 months’ notice by either party 6 months fixed annual remuneration where the Company terminates on notice. (or payment in lieu)
M Kelly 3 months’ notice by either party 12 months fixed annual remuneration where the Company terminates on notice.(2)
(or payment in lieu)
G Agriogiannis 3 months’ notice by either party 9 months fixed annual remuneration where the Company terminates on notice. (or payment in lieu)
AL Dell 6 months’ notice by either party 6 months fixed annual remuneration where the Company terminates on notice. (or payment in lieu)
BD Lemmon 6 months’ notice by either party 6 months fixed annual remuneration where the Company terminates on notice. (or payment in lieu)
(1) In the case of resignation, no separate payment is made to the Executive (only amounts due and payable up to the date of ceasing employment including accrued leave entitlements and unpaid salary).
(2) No separation payment will exceed the limit under the Corporations Act 2001.
On termination of employment for any reason, the CEO and Managing Director and other Executives are prohibited from engaging in any activity that would compete with the Group for a period of six months in order to protect the Group’s business interests. In the event of resignation, at the option of the Company, Mr Brydon and Mr Kelly may be paid a monthly amount equivalent to the Executive’s monthly fixed remuneration at the time of termination during the period of restraint to support the enforceability of the restraint.
Section 6 - Non-executive Directors’ fees
6.1 Policy and approach to setting fees

58ADELAIDE BRIGHTON LTD AND ITS CONTROLLED ENTITIES
FOR THE YEAR ENDED 31 DECEMBER 2016
Base fees for 2016 Fees for the Chairman of the Board and the non-executive Director base fee were increased by approximately 4% for the 2016 financial year.
Fees payable to non-executive Directors are inclusive of contributions to superannuation.
Base fees (Board) $ $
Non-executive Chairman (1) 330,000
Non-executive Director 110,000
Committee fees Committee chair Committee member
Audit, Risk and Compliance Committee 25,411 14,294
Nomination, Remuneration and Governance Committee 25,411 14,294
Safety, Health and Environment Committee 25,411 14,294
(1) The Chairman of the Board receives no additional fee for Committee work.
In accordance with the Company’s constitution, Directors are also permitted to be paid additional fees for special duties or exertions. Such fees may or may not be included in the aggregate amount approved by shareholders, as determined by the Directors. No such fees were paid during the year.
Directors are also entitled to be reimbursed for all business related expenses, including travel, as may be incurred in the discharge of their duties.
Post-employment Fees and allowances benefits
Directors’ Committee fees base fees (incl. (incl. SuperannuationNon-executive Director Year superannuation) superannuation) Total contributions (1)
$ $ $ $
LV Hosking 2016 330,000 - 330,000 23,449(Chairman) 2015 317,642 - 317,642 23,449
RD Barro 2016 110,000 14,294 124,294 10,783 2015 105,881 14,294 120,175 10,426
GF Pettigrew 2016 110,000 53,999 163,999 14,909 2015 105,881 53,999 159,880 14,535
KB Scott-Mackenzie 2016 110,000 39,705 149,705 12,998 2015 105,881 39,705 145,586 12,631
AM Tansey 2016 110,000 39,705 149,705 12,998 2015 105,881 39,705 145,586 12,631
Total non-executive 2016 770,000 147,703 917,703 75,137Directors’ remuneration 2015 741,166 147,703 888,869 73,672
(1) Superannuation contributions are made on behalf of non-executive Directors which satisfy the Group’s obligations under applicable Superannuation Guarantee Charge legislation.
Section 7 - Key Management Personnel disclosure tables
7.1 Non-executive Directors’ statutory remuneration
Details of non-executive Directors’ remuneration are set out in the following table:
Table 8
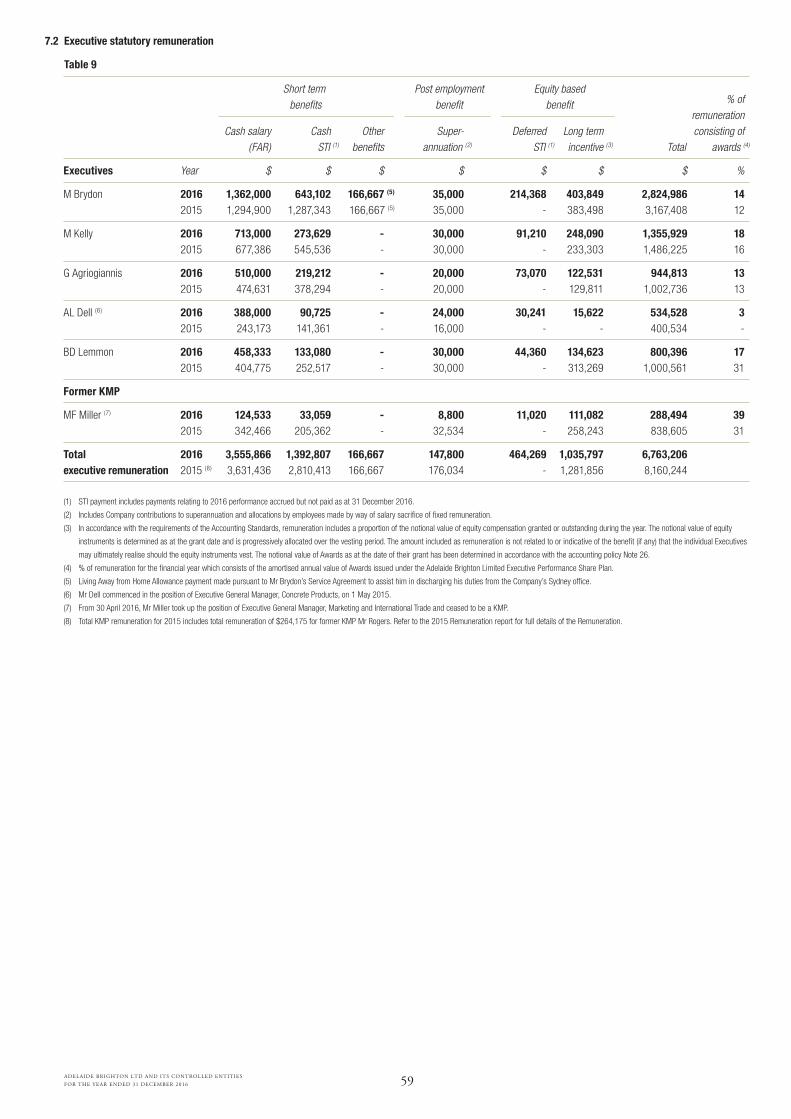
59ADELAIDE BRIGHTON LTD AND ITS CONTROLLED ENTITIES
FOR THE YEAR ENDED 31 DECEMBER 2016
7.2 Executive statutory remuneration
Table 9
% of remuneration Cash salary Cash Other Super- Deferred Long term consisting of (FAR) STI (1) benefits annuation (2) STI (1) incentive (3) Total awards (4)
Executives Year $ $ $ $ $ $ $ %
M Brydon 2016 1,362,000 643,102 166,667 (5) 35,000 214,368 403,849 2,824,986 14 2015 1,294,900 1,287,343 166,667 (5) 35,000 - 383,498 3,167,408 12
M Kelly 2016 713,000 273,629 - 30,000 91,210 248,090 1,355,929 18 2015 677,386 545,536 - 30,000 - 233,303 1,486,225 16
G Agriogiannis 2016 510,000 219,212 - 20,000 73,070 122,531 944,813 13 2015 474,631 378,294 - 20,000 - 129,811 1,002,736 13
AL Dell (6) 2016 388,000 90,725 - 24,000 30,241 15,622 534,528 3 2015 243,173 141,361 - 16,000 - - 400,534 -
BD Lemmon 2016 458,333 133,080 - 30,000 44,360 134,623 800,396 17 2015 404,775 252,517 - 30,000 - 313,269 1,000,561 31
Former KMP
MF Miller (7) 2016 124,533 33,059 - 8,800 11,020 111,082 288,494 39 2015 342,466 205,362 - 32,534 - 258,243 838,605 31
Total 2016 3,555,866 1,392,807 166,667 147,800 464,269 1,035,797 6,763,206 executive remuneration 2015 (8) 3,631,436 2,810,413 166,667 176,034 - 1,281,856 8,160,244
(1) STI payment includes payments relating to 2016 performance accrued but not paid as at 31 December 2016.
(2) Includes Company contributions to superannuation and allocations by employees made by way of salary sacrifice of fixed remuneration.
(3) In accordance with the requirements of the Accounting Standards, remuneration includes a proportion of the notional value of equity compensation granted or outstanding during the year. The notional value of equity
instruments is determined as at the grant date and is progressively allocated over the vesting period. The amount included as remuneration is not related to or indicative of the benefit (if any) that the individual Executives
may ultimately realise should the equity instruments vest. The notional value of Awards as at the date of their grant has been determined in accordance with the accounting policy Note 26.
(4) % of remuneration for the financial year which consists of the amortised annual value of Awards issued under the Adelaide Brighton Limited Executive Performance Share Plan.
(5) Living Away from Home Allowance payment made pursuant to Mr Brydon’s Service Agreement to assist him in discharging his duties from the Company’s Sydney office.
(6) Mr Dell commenced in the position of Executive General Manager, Concrete Products, on 1 May 2015.
(7) From 30 April 2016, Mr Miller took up the position of Executive General Manager, Marketing and International Trade and ceased to be a KMP.
(8) Total KMP remuneration for 2015 includes total remuneration of $264,175 for former KMP Mr Rogers. Refer to the 2015 Remuneration report for full details of the Remuneration.
Short term Post employment Equity based benefits benefit benefit
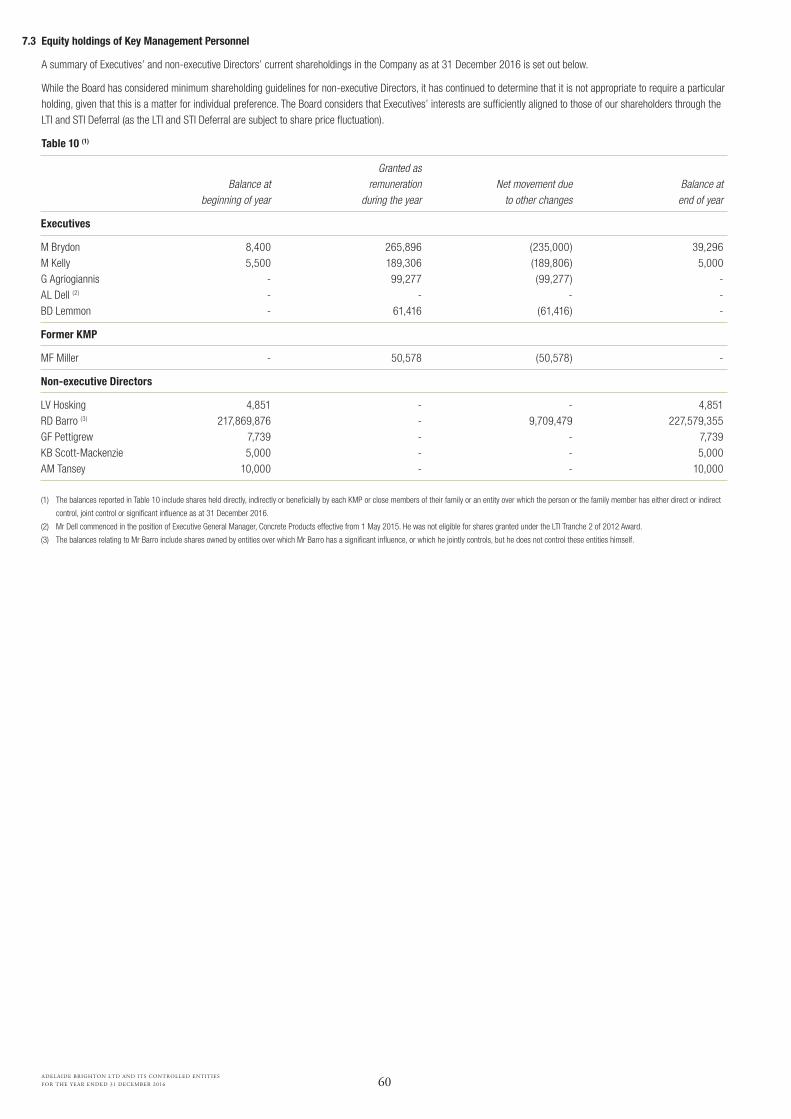
60ADELAIDE BRIGHTON LTD AND ITS CONTROLLED ENTITIES
FOR THE YEAR ENDED 31 DECEMBER 2016
Granted as Balance at remuneration Net movement due Balance at beginning of year during the year to other changes end of year
Executives
M Brydon 8,400 265,896 (235,000) 39,296M Kelly 5,500 189,306 (189,806) 5,000G Agriogiannis - 99,277 (99,277) -AL Dell (2) - - - -BD Lemmon - 61,416 (61,416) -
Former KMP
MF Miller - 50,578 (50,578) -
Non-executive Directors
LV Hosking 4,851 - - 4,851RD Barro (3) 217,869,876 - 9,709,479 227,579,355GF Pettigrew 7,739 - - 7,739KB Scott-Mackenzie 5,000 - - 5,000AM Tansey 10,000 - - 10,000
(1) The balances reported in Table 10 include shares held directly, indirectly or beneficially by each KMP or close members of their family or an entity over which the person or the family member has either direct or indirect
control, joint control or significant influence as at 31 December 2016.
(2) Mr Dell commenced in the position of Executive General Manager, Concrete Products effective from 1 May 2015. He was not eligible for shares granted under the LTI Tranche 2 of 2012 Award.
(3) The balances relating to Mr Barro include shares owned by entities over which Mr Barro has a significant influence, or which he jointly controls, but he does not control these entities himself.
7.3 Equity holdings of Key Management Personnel
A summary of Executives’ and non-executive Directors’ current shareholdings in the Company as at 31 December 2016 is set out below.
While the Board has considered minimum shareholding guidelines for non-executive Directors, it has continued to determine that it is not appropriate to require a particular holding, given that this is a matter for individual preference. The Board considers that Executives’ interests are sufficiently aligned to those of our shareholders through the LTI and STI Deferral (as the LTI and STI Deferral are subject to share price fluctuation).
Table 10 (1)
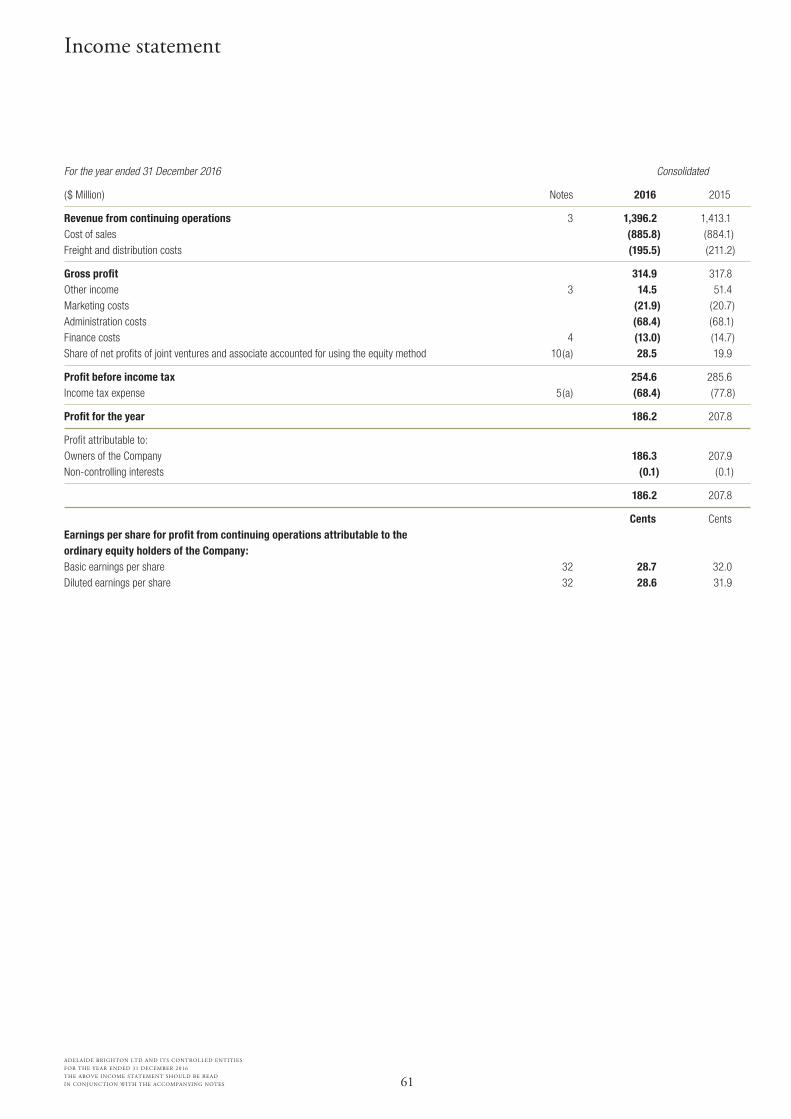
61
ADELAIDE BRIGHTON LTD AND ITS CONTROLLED ENTITIES
FOR THE YEAR ENDED 31 DECEMBER 2016
THE ABOVE INCOME STATEMENT SHOULD BE READ
IN CONJUNCTION WITH THE ACCOMPANYING NOTES
For the year ended 31 December 2016 Consolidated
($ Million) Notes 2016 2015
Revenue from continuing operations 3 1,396.2 1,413.1Cost of sales (885.8) (884.1)Freight and distribution costs (195.5) (211.2)
Gross profit 314.9 317.8Other income 3 14.5 51.4Marketing costs (21.9) (20.7)Administration costs (68.4) (68.1)Finance costs 4 (13.0) (14.7)Share of net profits of joint ventures and associate accounted for using the equity method 10(a) 28.5 19.9
Profit before income tax 254.6 285.6Income tax expense 5(a) (68.4) (77.8)
Profit for the year 186.2 207.8
Profit attributable to:Owners of the Company 186.3 207.9Non-controlling interests (0.1) (0.1)
186.2 207.8
Cents CentsEarnings per share for profit from continuing operations attributable to the ordinary equity holders of the Company:Basic earnings per share 32 28.7 32.0Diluted earnings per share 32 28.6 31.9
Income statement
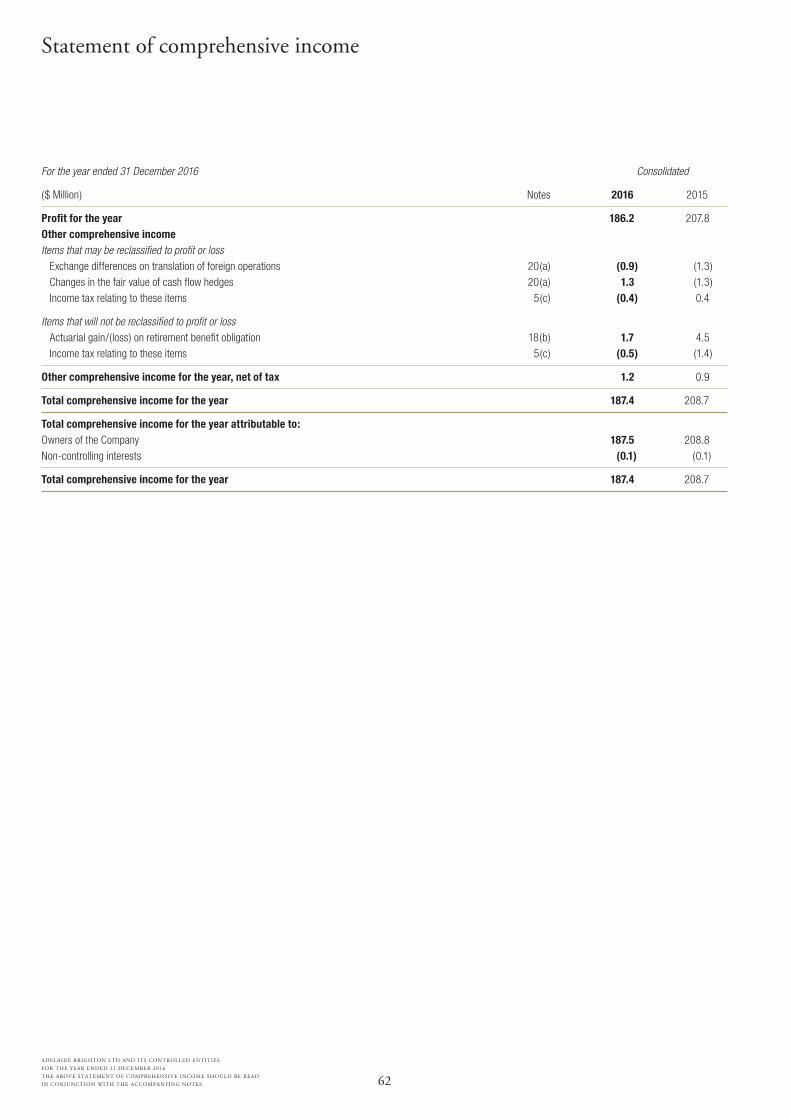
62
ADELAIDE BRIGHTON LTD AND ITS CONTROLLED ENTITIES
FOR THE YEAR ENDED 31 DECEMBER 2016
THE ABOVE STATEMENT OF COMPREHENSIVE INCOME SHOULD BE READ
IN CONJUNCTION WITH THE ACCOMPANYING NOTES
For the year ended 31 December 2016 Consolidated
($ Million) Notes 2016 2015
Profit for the year 186.2 207.8Other comprehensive income Items that may be reclassified to profit or loss Exchange differences on translation of foreign operations 20(a) (0.9) (1.3) Changes in the fair value of cash flow hedges 20(a) 1.3 (1.3) Income tax relating to these items 5(c) (0.4) 0.4
Items that will not be reclassified to profit or loss Actuarial gain/(loss) on retirement benefit obligation 18(b) 1.7 4.5 Income tax relating to these items 5(c) (0.5) (1.4)
Other comprehensive income for the year, net of tax 1.2 0.9
Total comprehensive income for the year 187.4 208.7
Total comprehensive income for the year attributable to: Owners of the Company 187.5 208.8Non-controlling interests (0.1) (0.1)
Total comprehensive income for the year 187.4 208.7
Statement of comprehensive income
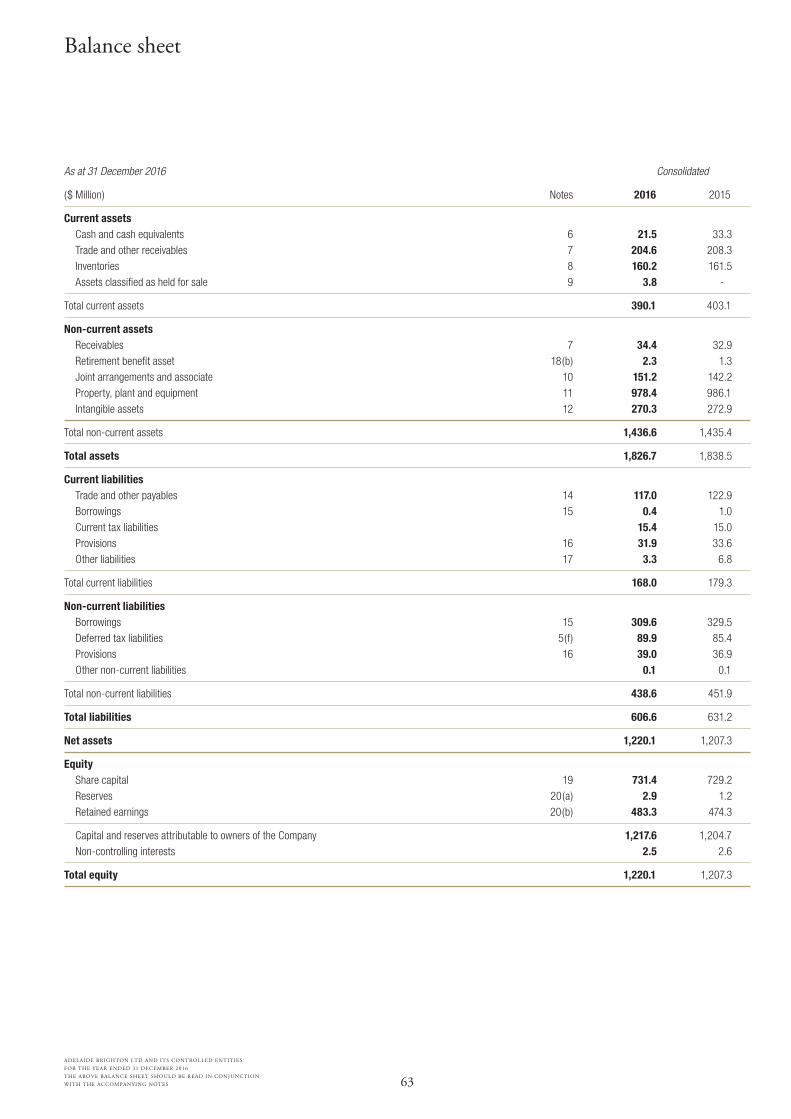
ADELAIDE BRIGHTON LTD AND ITS CONTROLLED ENTITIES
FOR THE YEAR ENDED 31 DECEMBER 2016
THE ABOVE BALANCE SHEET SHOULD BE READ IN CONJUNCTION
WITH THE ACCOMPANYING NOTES 63
Balance sheet
As at 31 December 2016 Consolidated
($ Million) Notes 2016 2015
Current assets Cash and cash equivalents 6 21.5 33.3Trade and other receivables 7 204.6 208.3Inventories 8 160.2 161.5Assets classified as held for sale 9 3.8 -
Total current assets 390.1 403.1
Non-current assets Receivables 7 34.4 32.9Retirement benefit asset 18(b) 2.3 1.3Joint arrangements and associate 10 151.2 142.2Property, plant and equipment 11 978.4 986.1Intangible assets 12 270.3 272.9
Total non-current assets 1,436.6 1,435.4
Total assets 1,826.7 1,838.5
Current liabilities Trade and other payables 14 117.0 122.9Borrowings 15 0.4 1.0Current tax liabilities 15.4 15.0Provisions 16 31.9 33.6Other liabilities 17 3.3 6.8
Total current liabilities 168.0 179.3
Non-current liabilities Borrowings 15 309.6 329.5Deferred tax liabilities 5(f) 89.9 85.4Provisions 16 39.0 36.9Other non-current liabilities 0.1 0.1
Total non-current liabilities 438.6 451.9
Total liabilities 606.6 631.2
Net assets 1,220.1 1,207.3
Equity Share capital 19 731.4 729.2Reserves 20(a) 2.9 1.2Retained earnings 20(b) 483.3 474.3
Capital and reserves attributable to owners of the Company 1,217.6 1,204.7Non-controlling interests 2.5 2.6
Total equity 1,220.1 1,207.3
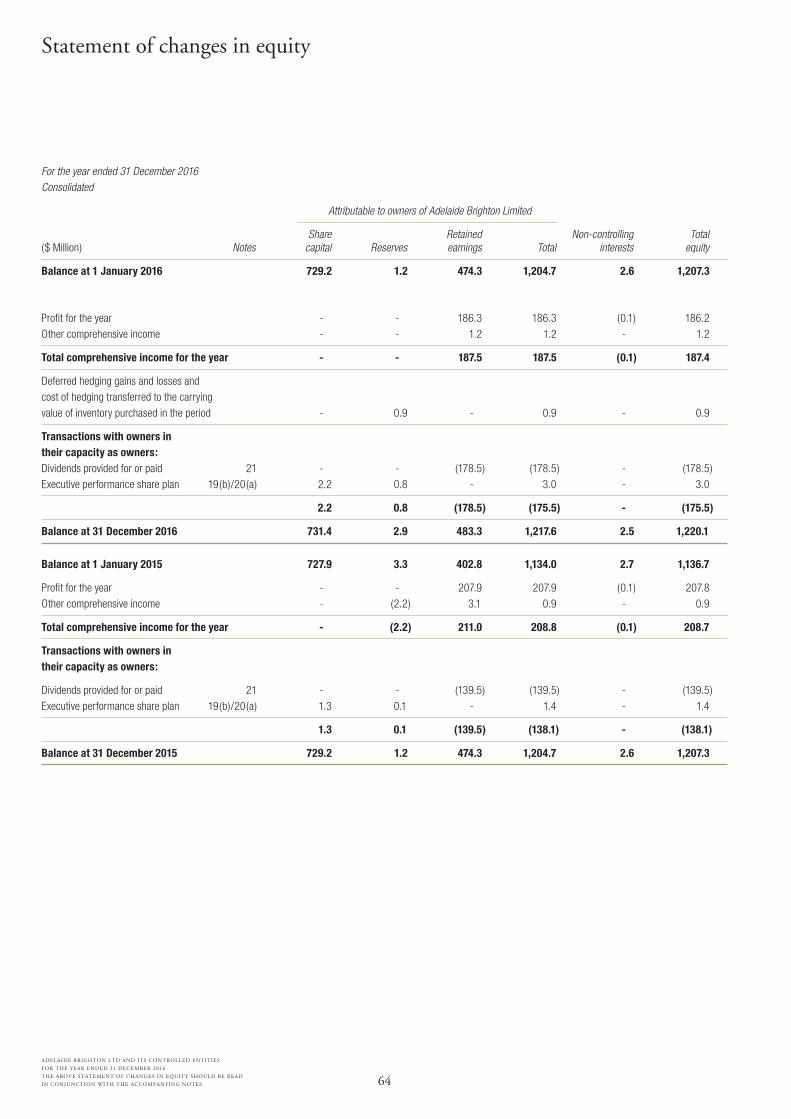
64
ADELAIDE BRIGHTON LTD AND ITS CONTROLLED ENTITIES
FOR THE YEAR ENDED 31 DECEMBER 2016
THE ABOVE STATEMENT OF CHANGES IN EQUITY SHOULD BE READ
IN CONJUNCTION WITH THE ACCOMPANYING NOTES
Statement of changes in equity
For the year ended 31 December 2016 Consolidated
Attributable to owners of Adelaide Brighton Limited
Share Retained Non-controlling Total ($ Million) Notes capital Reserves earnings Total interests equity
Balance at 1 January 2016 729.2 1.2 474.3 1,204.7 2.6 1,207.3
Profit for the year - - 186.3 186.3 (0.1) 186.2Other comprehensive income - - 1.2 1.2 - 1.2
Total comprehensive income for the year - - 187.5 187.5 (0.1) 187.4
Deferred hedging gains and losses and cost of hedging transferred to the carrying value of inventory purchased in the period - 0.9 - 0.9 - 0.9
Transactions with owners in their capacity as owners: Dividends provided for or paid 21 - - (178.5) (178.5) - (178.5)Executive performance share plan 19(b)/20(a) 2.2 0.8 - 3.0 - 3.0
2.2 0.8 (178.5) (175.5) - (175.5)
Balance at 31 December 2016 731.4 2.9 483.3 1,217.6 2.5 1,220.1
Balance at 1 January 2015 727.9 3.3 402.8 1,134.0 2.7 1,136.7
Profit for the year - - 207.9 207.9 (0.1) 207.8Other comprehensive income - (2.2) 3.1 0.9 - 0.9
Total comprehensive income for the year - (2.2) 211.0 208.8 (0.1) 208.7
Transactions with owners in their capacity as owners:
Dividends provided for or paid 21 - - (139.5) (139.5) - (139.5)Executive performance share plan 19(b)/20(a) 1.3 0.1 - 1.4 - 1.4
1.3 0.1 (139.5) (138.1) - (138.1)
Balance at 31 December 2015 729.2 1.2 474.3 1,204.7 2.6 1,207.3

65
ADELAIDE BRIGHTON LTD AND ITS CONTROLLED ENTITIES
FOR THE YEAR ENDED 31 DECEMBER 2016
THE ABOVE STATEMENT OF CASH FLOWS SHOULD BE READ
IN CONJUNCTION WITH THE ACCOMPANYING NOTES
Statement of cash flows
For the year ended 31 December 2016 Consolidated
($ Million) Notes 2016 2015
Cash flows from operating activities Receipts from customers (inclusive of goods and services tax) 1,536.1 1,545.8Payments to suppliers and employees (inclusive of goods and services tax) (1,239.1) (1,272.1)Joint venture distributions received 18.6 16.2Interest received 1.5 1.7Interest paid (12.1) (13.0)Other income 6.2 5.6Income taxes paid (67.2) (58.5)Income taxes refunded 4.4 4.2
Net cash inflow from operating activities 31 248.4 229.9
Cash flows from investing activities Payments for property, plant, equipment and intangibles (86.5) (74.3)Payments for acquisition of businesses, net of cash acquired - (6.5)Proceeds from sale of property, plant and equipment 23.2 50.8Loans to joint venture entities (2.0) (0.9)Repayment of loans from other parties 0.6 0.6
Net cash outflow from investing activities (64.7) (30.3)
Cash flows from financing activities Proceeds from issue of shares 4.0 2.8Repayment of borrowings (21.0) (61.5)Dividends paid to Company’s shareholders 21 (178.5) (139.5)
Net cash outflow from financing activities (195.5) (198.2)
Net (decrease)/increase in cash and cash equivalents (11.8) 1.4Cash and cash equivalents at the beginning of the year 33.3 31.8Effects of exchange rate changes on cash and cash equivalents - 0.1
Cash and cash equivalents at the end of the year 6 21.5 33.3

66
ADELAIDE BRIGHTON LTD AND ITS CONTROLLED ENTITIES
FOR THE YEAR ENDED 31 DECEMBER 2016
NOTES TO AND FORMING PART OF
THE CONSOLIDATED FINANCIAL STATEMENTS
1 Summary of significant accounting policies
Adelaide Brighton Limited (the Company) is a company limited by shares, incorporated and domiciled in Australia whose shares are publicly traded on the Australian Securities Exchange (ASX).
The financial report was authorised for issue by the Directors on 17 March 2017. The Directors have the power to amend and reissue the financial statements.
The principal accounting policies adopted in the preparation of these consolidated financial statements are either set out below or included in the accompanying notes. These policies have been consistently applied to all the years presented. Unless otherwise stated the financial statements are for the consolidated entity consisting of Adelaide Brighton Limited and its subsidiaries.
(a) Basis of preparation
These general purpose financial statements have been prepared in accordance with Australian Accounting Standards and Interpretations issued by the Australian Accounting Standards Board and the Corporations Act 2001. The Company is a for-profit entity for the purpose of preparing the financial statements.
Comparative information has been re-stated where appropriate to enhance comparability.
Historical cost convention These financial statements have been prepared
under the historical cost convention, except for the circumstances where the fair value method has been applied as detailed in the accounting policies.
Compliance with IFRS The consolidated financial statements of the
Adelaide Brighton Limited group also comply with International Financial Reporting Standards (IFRS) as issued by the International Accounting Standards Board (IASB).
New accounting standards and interpretations Certain new accounting standards and
interpretations have been published that are not mandatory for 31 December 2016 reporting periods. The Group’s assessment of the impact of these new standards and interpretations is set out below.
AASB 15 Revenue From Contracts With Customers
AASB 15 Revenue From Contracts With Customers will replace AASB 118 which covers contracts for goods and services and AASB 111 which covers construction contracts. The new standard replaces the existing notion of risk and rewards with the notion of control to recognise when a good or service transfers to a customer. The Group performed a preliminary assessment of the impact of the new standard and based on the results do not believe that the standard will have a material impact on the financial statements. The standard is mandatory for financial years commencing on or after 1 January 2018 and Adelaide Brighton will adopt the standard at that time.
AASB 16 Leases
AASB 16 Leases will replace the current standard on lease accounting, AASB 117. AASB 16 introduces a single lessee accounting model and requires the lessee to recognise assets and liabilities for all leases with a term of more than 12 months, unless the underlying asset is of low value. A lessee is required to recognise a right-of-use asset representing its right to use the underlying leased asset and a lease liability representing its obligations to make lease payments. A preliminary assessment of the impact of the standard has been undertaken by the Group. Based upon current leases, adopting the standard would result in the recognition of a right of use asset with a value of $14.0 million and a corresponding liability at 31 December 2016, and reduce 2016 net profit after tax by $0.7 million. The standard is mandatory for financial years commencing on or after 1 January 2019 and Adelaide Brighton will adopt the standard at that time.
(b) Principles of consolidation
(i) Subsidiaries The consolidated financial statements incorporate
the assets and liabilities of all subsidiaries controlled by Adelaide Brighton Limited as at 31 December 2016 and the results of all subsidiaries for the year then ended. The Company and its subsidiaries together are referred to in this financial report as “the Group”.
Subsidiaries are entities over which the Group has control. The Group controls an entity when the Group is exposed to, or has rights to, variable returns from its involvement with the entity and has the ability to affect those returns through its power to direct the activities of the entity.
Subsidiaries are fully consolidated from the date on which control is transferred to the Group. They are deconsolidated from the date that control ceases. The acquisition method of accounting is used to account for business combinations by the Group (refer to Note 1(d)).
Intercompany transactions, balances and unrealised gains on transactions between Group companies are eliminated. Unrealised losses are also eliminated unless the transaction provides evidence of the impairment of the asset transferred. Accounting policies of subsidiaries have been changed where necessary to ensure consistency with the policies adopted by the Group.
(ii) Employee Share Trust The Group has formed a trust to administer the
Group’s employee share scheme. The company that acts as the Trustee is consolidated as the company is controlled by the Group. The Adelaide Brighton employee share plan trust is not consolidated as it is not controlled by the Group.
(iii) Non-controlling interests Non-controlling interests in the results and equity
of subsidiaries are shown separately in the consolidated income statement and balance sheet respectively. The Group treats transactions with non-controlling interests that do not result in a loss of control as transactions with equity owners of the Group. For changes in ownership interests, the difference between any consideration paid and the relevant share acquired of the carrying value of net assets of the subsidiary is deducted from equity.
(c) Foreign currency translation
(i) Functional and presentation currency Items included in the financial statements of each
of the Group’s entities are measured using the currency of the primary economic environment in which the entity operates (‘the functional currency’). The consolidated financial statements are presented in Australian Dollars, which is Adelaide Brighton Limited’s functional and presentation currency.
(ii) Transactions and balances Foreign currency transactions are translated
into the functional currency using the exchange rates prevailing at the dates of the transactions. Foreign exchange gains and losses resulting from the settlement of such transactions and from the translation at year end exchange rates of monetary assets and liabilities denominated in foreign currencies are recognised in the income statement or deferred in equity if the gain or loss relate to a qualifying cash flow hedge.
Notes to the consolidated financial statements
67
ADELAIDE BRIGHTON LTD AND ITS CONTROLLED ENTITIES
FOR THE YEAR ENDED 31 DECEMBER 2016
NOTES TO AND FORMING PART OF
THE CONSOLIDATED FINANCIAL STATEMENTS
1 Summary of significant accounting policies (continued)
(c) Foreign currency translation (continued)
(iii) Foreign operations The results and financial position of all the foreign
operations that have a functional currency different from the presentation currency are translated into the presentation currency as follows:
> Assets and liabilities for each balance sheet presented are translated at the closing rate at the date of that balance sheet;
> Income and expenses for each income statement and statement of comprehensive income are translated at average exchange rates (unless this is not a reasonable approximation of the cumulative effect of the rates prevailing on the transaction dates, in which case income and expenses are translated at the dates of the transactions); and
> All resulting exchange differences are recognised in other comprehensive income.
On consolidation, exchange differences arising from the translation of any net investment in foreign entities, and of borrowings and other financial instruments designated as hedges of such investments, are recognised in other comprehensive income.
When a foreign operation is sold or any borrowings forming part of the net investment are repaid, a proportionate share of such exchange differences is reclassified to profit or loss, as part of the gain or loss on sale where applicable.
(d) Business combinations
The acquisition method of accounting is used to account for all business combinations, including business combinations involving equities or businesses under common control, regardless of whether equity instruments or other assets are acquired. The consideration transferred for the acquisition of a subsidiary comprises the fair values of the assets transferred, the liabilities incurred and the equity interests issued by the Group. The consideration transferred also includes the fair value of any contingent consideration arrangement and the fair value of any pre-existing equity interest in the subsidiary. Acquisition-related costs are expensed as incurred. Identifiable assets acquired and liabilities and contingent liabilities assumed in a business combination are, with limited exceptions, measured initially at their fair values at the acquisition date. On an acquisition-by-acquisition basis, the Group recognises any non-controlling interest in the acquiree either at fair value or at the non-controlling interest’s proportionate share of the acquiree’s net identifiable assets.
The excess of the consideration transferred, the amount of any non-controlling interest in the acquiree and the acquisition date fair value of any previous equity interest in the acquiree over the fair value of the Group’s share of the net identifiable assets acquired is recorded as goodwill. If those amounts are less than the fair value of the net identifiable assets of the subsidiary acquired and the measurement of all amounts has been reviewed, the difference is recognised directly in profit or loss as a bargain purchase.
Where settlement of any part of cash consideration is deferred, the amounts payable in the future are discounted to their present value as at the date of exchange. The discount rate used is the entity’s incremental borrowing rate, being the rate at which a similar borrowing could be obtained from an independent financier under comparable terms and conditions.
Contingent consideration is classified either as equity or a financial liability. Amounts classified as a financial liability are subsequently remeasured to fair value with changes in fair value recognised in the income statement.
(e) Rounding of amounts
The Company is of a kind referred to in the Australian Securities and Investments Commission Corporations (Rounding in Financial / Directors’ Reports) Instrument 2016/191, relating to the “rounding off’’ of amounts in the financial report. Amounts in the financial report have been rounded off in accordance with that instrument to the nearest one hundred thousand dollars, unless otherwise stated.
(f) Goods and Services Tax (GST)
Revenues, expenses and assets are recognised net of the amount of associated GST, unless the GST incurred is not recoverable from the taxation authority. In this case it is recognised as part of the cost of acquisition of the asset or as part of the expense.
Receivables and payables are stated inclusive of the amount of GST receivable or payable. The net amount of GST recoverable from, or payable to, the taxation authority is included with other receivables or payables in the balance sheet.
Cash flows are presented on a gross basis. The GST components of cash flows arising from investing or financing activities which are recoverable from, or payable to the taxation authority, are presented as operating cash flows.
2 Critical accounting estimates and assumptions
The Group makes estimates and assumptions in preparing the financial statements. The resulting accounting estimates will, by definition, seldom equal the related actual results. This note provides an overview of the areas that involved a higher degree of judgement or complexity and of items which are more likely to be materially adjusted due to estimates and assumptions differeing to actual outcomes. The areas involving significant estimates and assumptions are listed below.
> Impairment of assets - Note 13 > Provisions for close down and restoration costs -
Note 16(iv) > Defined benefit superannuation plan - Note 18
Detailed information about each of these estimates and assumptions is included in Notes 13, 16(iv) and 18 together with information about the basis of calculation for each affected line item in the financial statements.
3 Revenue and other income
Accounting policy - revenue recognition
Revenue is recognised for the major business activities as follows:
(i) Sales revenue Revenue from the sale of goods is measured at the
fair value of the consideration received or receivable, net of returns, trade discounts and volume rebates. Revenue is recognised when the significant risks and rewards of ownership have been transferred to the buyer, recovery of the consideration is considered probable, the associated costs of goods can be estimated reliably, there is no continuing management involvement with the goods and the amount of revenue can be measured reliably. Sales of services are recognised in the period in which the services are rendered.
(ii) Interest income Interest income is recognised using the effective
interest rate method.
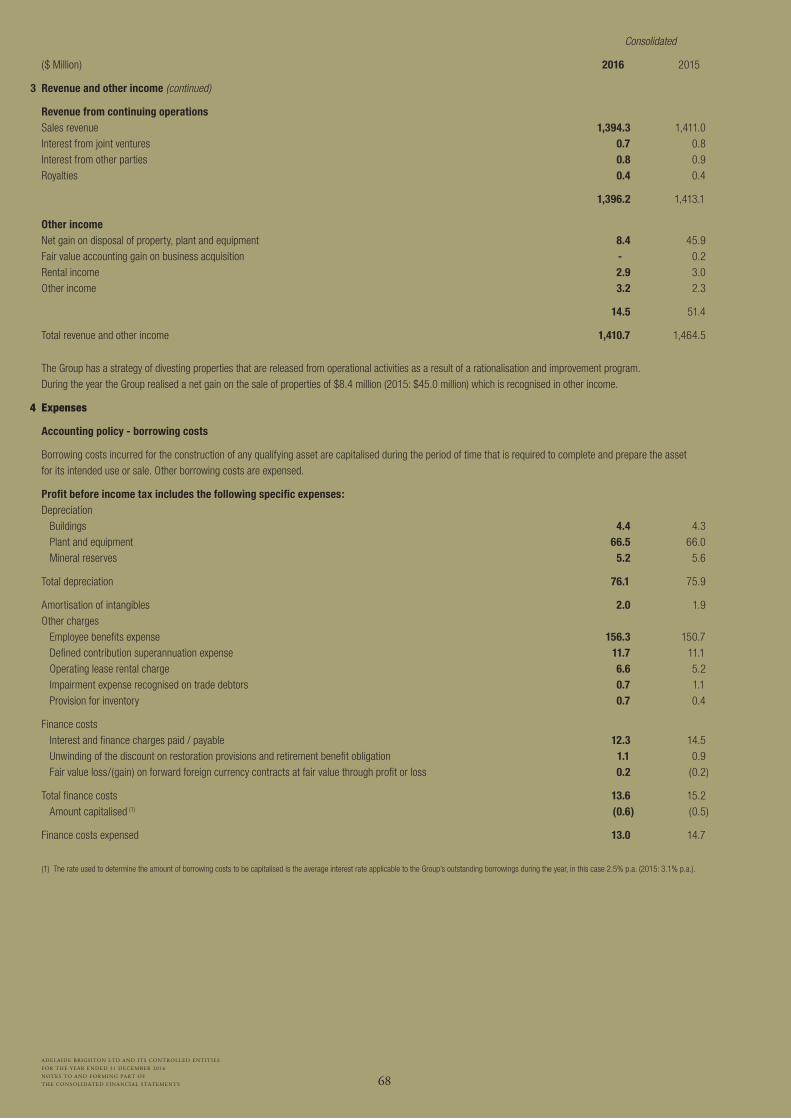
68
ADELAIDE BRIGHTON LTD AND ITS CONTROLLED ENTITIES
FOR THE YEAR ENDED 31 DECEMBER 2016
NOTES TO AND FORMING PART OF
THE CONSOLIDATED FINANCIAL STATEMENTS
Consolidated
($ Million) 2016 2015
3 Revenue and other income (continued)
Revenue from continuing operations Sales revenue 1,394.3 1,411.0 Interest from joint ventures 0.7 0.8 Interest from other parties 0.8 0.9 Royalties 0.4 0.4
1,396.2 1,413.1
Other income Net gain on disposal of property, plant and equipment 8.4 45.9 Fair value accounting gain on business acquisition - 0.2 Rental income 2.9 3.0 Other income 3.2 2.3
14.5 51.4
Total revenue and other income 1,410.7 1,464.5
The Group has a strategy of divesting properties that are released from operational activities as a result of a rationalisation and improvement program. During the year the Group realised a net gain on the sale of properties of $8.4 million (2015: $45.0 million) which is recognised in other income.
4 Expenses
Accounting policy - borrowing costs
Borrowing costs incurred for the construction of any qualifying asset are capitalised during the period of time that is required to complete and prepare the asset for its intended use or sale. Other borrowing costs are expensed.
Profit before income tax includes the following specific expenses: Depreciation Buildings 4.4 4.3 Plant and equipment 66.5 66.0 Mineral reserves 5.2 5.6
Total depreciation 76.1 75.9
Amortisation of intangibles 2.0 1.9 Other charges Employee benefits expense 156.3 150.7 Defined contribution superannuation expense 11.7 11.1 Operating lease rental charge 6.6 5.2 Impairment expense recognised on trade debtors 0.7 1.1 Provision for inventory 0.7 0.4
Finance costs Interest and finance charges paid / payable 12.3 14.5 Unwinding of the discount on restoration provisions and retirement benefit obligation 1.1 0.9 Fair value loss/(gain) on forward foreign currency contracts at fair value through profit or loss 0.2 (0.2)
Total finance costs 13.6 15.2 Amount capitalised (1) (0.6) (0.5)
Finance costs expensed 13.0 14.7
(1) The rate used to determine the amount of borrowing costs to be capitalised is the average interest rate applicable to the Group’s outstanding borrowings during the year, in this case 2.5% p.a. (2015: 3.1% p.a.).
69
ADELAIDE BRIGHTON LTD AND ITS CONTROLLED ENTITIES
FOR THE YEAR ENDED 31 DECEMBER 2016
NOTES TO AND FORMING PART OF
THE CONSOLIDATED FINANCIAL STATEMENTS
5 Income tax
Accounting policy - income tax
The income tax expense or revenue for the period is the tax payable on the current period’s taxable income based on the applicable income tax rate for each jurisdiction adjusted by changes in deferred tax assets and liabilities attributable to temporary differences and to previously unrecognised tax losses. The current income tax charge is calculated on the basis of tax laws enacted or substantively enacted at the end of the reporting period.
Deferred tax assets and liabilities are recognised for temporary differences at the tax rates expected to apply when the assets are recovered or liabilities are settled, based on those tax rates which are enacted or substantively enacted for each jurisdiction. The relevant tax rates are applied to the cumulative amounts of deductible and taxable temporary differences to measure the deferred tax asset or liability. An exception is made for certain temporary differences arising from the initial recognition of an asset or a liability. No deferred tax asset or liability is recognised in relation to these temporary differences if they arose in a transaction, other than a business combination, that at the time of the transaction did not affect either accounting or taxable profit or loss.
Deferred tax assets are recognised for deductible temporary differences and unused tax losses only if it is probable that future taxable amounts will be available to utilise those temporary differences and losses. Deferred tax liabilities and assets are not recognised for temporary differences between the carrying amount and tax bases of investments in controlled entities where the parent entity is able to control the timing of the reversal of the temporary differences and it is probable that the differences will not reverse in the foreseeable future.
Deferred tax assets and liabilities are offset when there is a legally enforceable right to offset current tax assets and liabilities and when the deferred tax balances relate to the same taxation authority. Current tax assets and tax liabilities are offset where the entity has a legally enforceable right to offset and intends either to settle on a net basis, or to realise the asset and settle the liability simultaneously.
Current and deferred tax is recognised in profit and loss, except to the extent it relates to items recognised in other comprehensive income or directly in equity. In this case, the tax is also recognised in other comprehensive income or directly in equity, respectively.
Tax consolidation Adelaide Brighton Limited and its wholly owned
Australian subsidiaries implemented the tax consolidation legislation as of 1 January 2004. Adelaide Brighton Limited, as the head entity in the tax consolidated group, recognises current tax liabilities and tax losses (subject to meeting the “probable test”) relating to all transactions, events and balances of the tax consolidated group as if those transactions, events and balances were its own.
The entities in the tax consolidated group are part of a tax sharing agreement which, in the opinion of the Directors, limits the joint and several liability of the wholly-owned entities in the case of default by the head entity, Adelaide Brighton Limited.
Amounts receivable or payable under a tax sharing agreement with the tax consolidated entities are recognised separately as tax-related amounts receivable or payable. Expenses and revenues arising under the tax sharing agreement are recognised as a component of income tax expense.
The wholly owned entities fully compensate Adelaide Brighton Limited for any current tax payable assumed and are compensated by Adelaide Brighton Limited for any current tax receivable and deferred tax assets relating to unused tax losses or unused tax credits that are transferred to Adelaide Brighton Limited under the tax consolidation legislation. The funding amounts are determined by reference to the amounts recognised in the wholly owned entities’ financial statements.
Individual tax consolidated entities recognise tax expenses and revenues and current and deferred tax balances in relation to their own taxable income, temporary differences and tax losses using the separate taxpayer within the group method. Entities calculate their current and deferred tax balances on the basis that they are subject to tax as part of the tax consolidated group.
Deferred tax balances relating to assets that had their tax values reset on joining the tax consolidated group have been remeasured based on the carrying amount of those assets in the tax consolidated group and their reset tax values. The adjustment to these deferred tax balances is recognised in the consolidated financial statements against income tax expense.
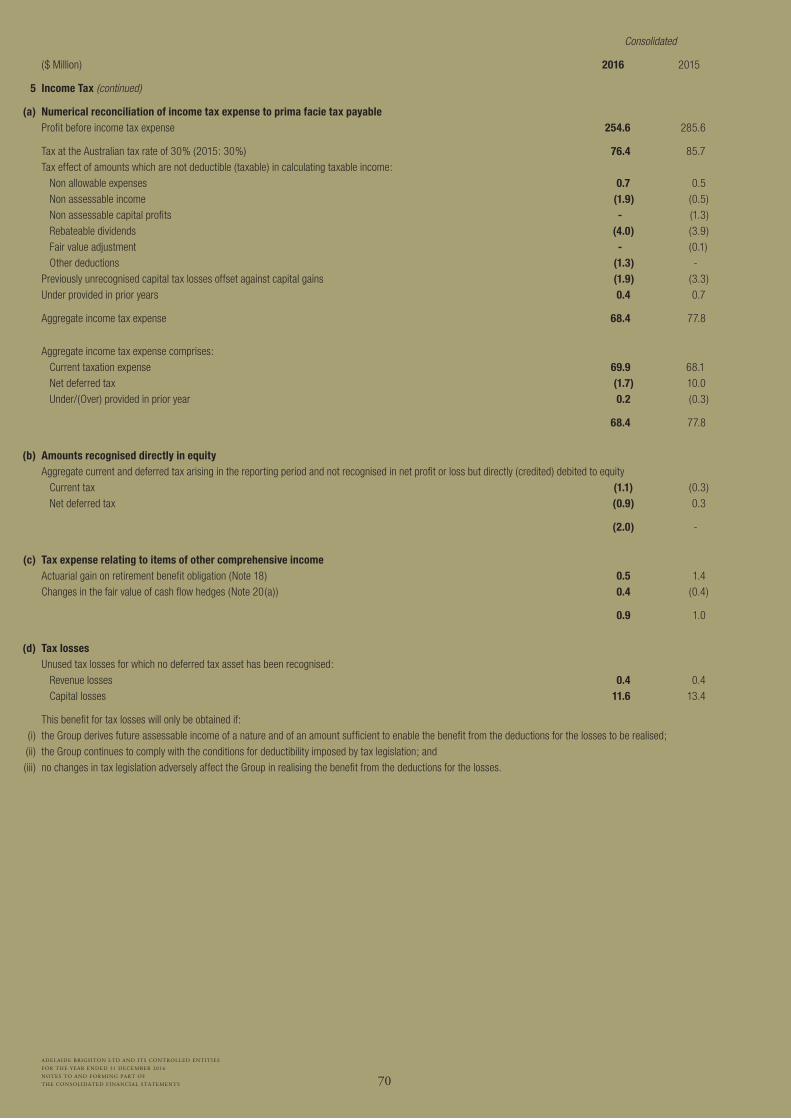
70
ADELAIDE BRIGHTON LTD AND ITS CONTROLLED ENTITIES
FOR THE YEAR ENDED 31 DECEMBER 2016
NOTES TO AND FORMING PART OF
THE CONSOLIDATED FINANCIAL STATEMENTS
Consolidated
($ Million) 2016 2015
5 Income Tax (continued)
(a) Numerical reconciliation of income tax expense to prima facie tax payable Profit before income tax expense 254.6 285.6
Tax at the Australian tax rate of 30% (2015: 30%) 76.4 85.7 Tax effect of amounts which are not deductible (taxable) in calculating taxable income: Non allowable expenses 0.7 0.5 Non assessable income (1.9) (0.5) Non assessable capital profits - (1.3) Rebateable dividends (4.0) (3.9) Fair value adjustment - (0.1) Other deductions (1.3) - Previously unrecognised capital tax losses offset against capital gains (1.9) (3.3) Under provided in prior years 0.4 0.7
Aggregate income tax expense 68.4 77.8
Aggregate income tax expense comprises: Current taxation expense 69.9 68.1 Net deferred tax (1.7) 10.0 Under/(Over) provided in prior year 0.2 (0.3)
68.4 77.8
(b) Amounts recognised directly in equity Aggregate current and deferred tax arising in the reporting period and not recognised in net profit or loss but directly (credited) debited to equity Current tax (1.1) (0.3) Net deferred tax (0.9) 0.3
(2.0) -
(c) Tax expense relating to items of other comprehensive income Actuarial gain on retirement benefit obligation (Note 18) 0.5 1.4 Changes in the fair value of cash flow hedges (Note 20(a)) 0.4 (0.4)
0.9 1.0
(d) Tax losses Unused tax losses for which no deferred tax asset has been recognised: Revenue losses 0.4 0.4 Capital losses 11.6 13.4
This benefit for tax losses will only be obtained if: (i) the Group derives future assessable income of a nature and of an amount sufficient to enable the benefit from the deductions for the losses to be realised; (ii) the Group continues to comply with the conditions for deductibility imposed by tax legislation; and (iii) no changes in tax legislation adversely affect the Group in realising the benefit from the deductions for the losses.
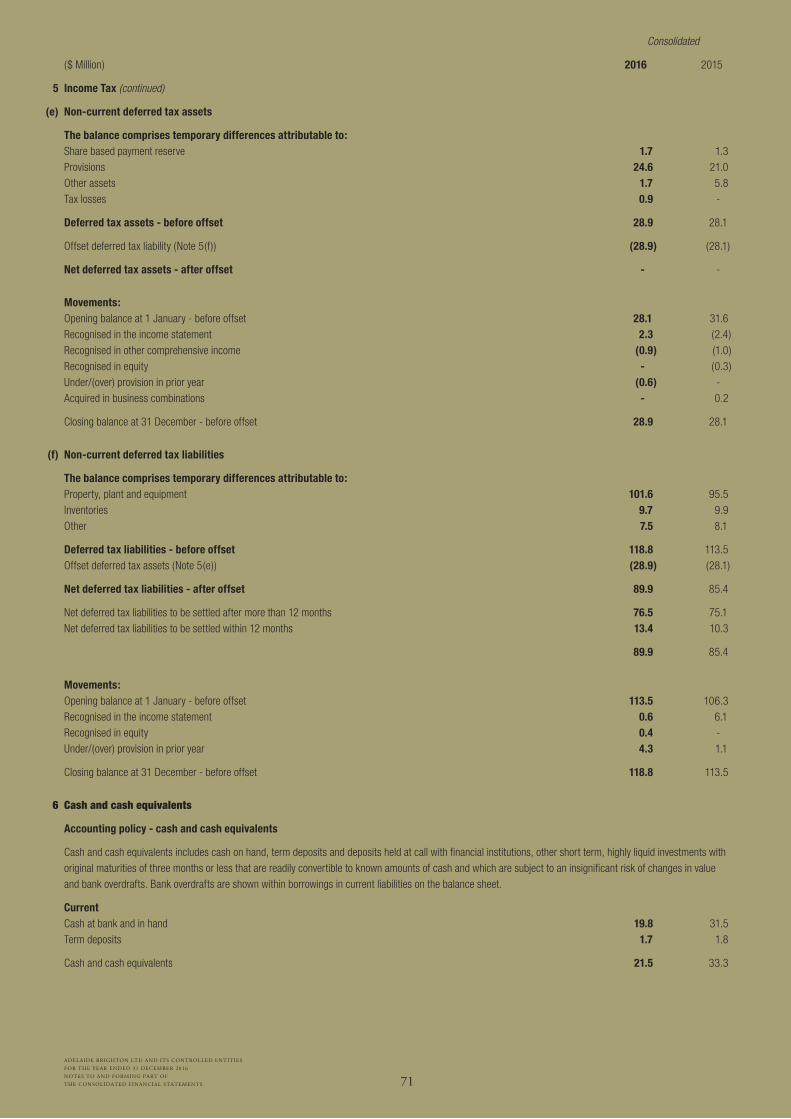
71
ADELAIDE BRIGHTON LTD AND ITS CONTROLLED ENTITIES
FOR THE YEAR ENDED 31 DECEMBER 2016
NOTES TO AND FORMING PART OF
THE CONSOLIDATED FINANCIAL STATEMENTS
Consolidated
($ Million) 2016 2015
5 Income Tax (continued)
(e) Non-current deferred tax assets
The balance comprises temporary differences attributable to: Share based payment reserve 1.7 1.3 Provisions 24.6 21.0 Other assets 1.7 5.8 Tax losses 0.9 -
Deferred tax assets - before offset 28.9 28.1
Offset deferred tax liability (Note 5(f)) (28.9) (28.1)
Net deferred tax assets - after offset - -
Movements: Opening balance at 1 January - before offset 28.1 31.6 Recognised in the income statement 2.3 (2.4) Recognised in other comprehensive income (0.9) (1.0) Recognised in equity - (0.3) Under/(over) provision in prior year (0.6) - Acquired in business combinations - 0.2
Closing balance at 31 December - before offset 28.9 28.1
(f) Non-current deferred tax liabilities
The balance comprises temporary differences attributable to: Property, plant and equipment 101.6 95.5 Inventories 9.7 9.9 Other 7.5 8.1
Deferred tax liabilities - before offset 118.8 113.5 Offset deferred tax assets (Note 5(e)) (28.9) (28.1)
Net deferred tax liabilities - after offset 89.9 85.4
Net deferred tax liabilities to be settled after more than 12 months 76.5 75.1 Net deferred tax liabilities to be settled within 12 months 13.4 10.3
89.9 85.4
Movements: Opening balance at 1 January - before offset 113.5 106.3 Recognised in the income statement 0.6 6.1 Recognised in equity 0.4 - Under/(over) provision in prior year 4.3 1.1
Closing balance at 31 December - before offset 118.8 113.5
6 Cash and cash equivalents
Accounting policy - cash and cash equivalents
Cash and cash equivalents includes cash on hand, term deposits and deposits held at call with financial institutions, other short term, highly liquid investments with original maturities of three months or less that are readily convertible to known amounts of cash and which are subject to an insignificant risk of changes in value and bank overdrafts. Bank overdrafts are shown within borrowings in current liabilities on the balance sheet.
Current Cash at bank and in hand 19.8 31.5 Term deposits 1.7 1.8
Cash and cash equivalents 21.5 33.3
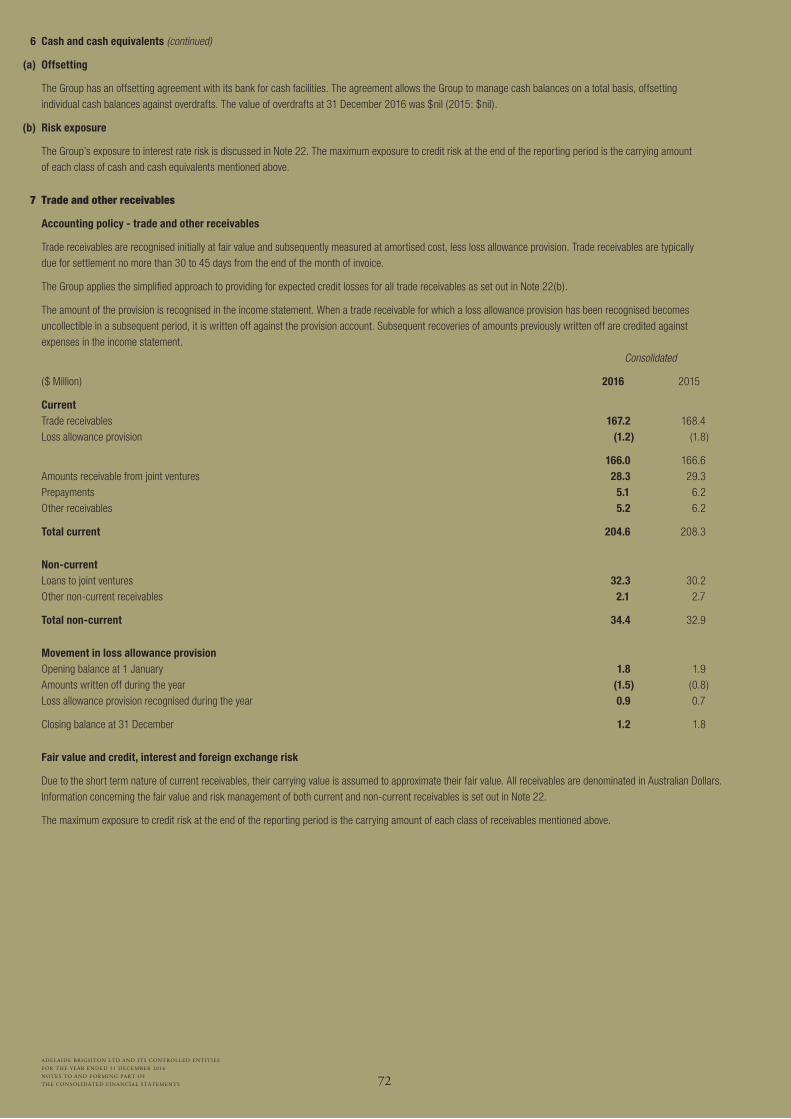
72
ADELAIDE BRIGHTON LTD AND ITS CONTROLLED ENTITIES
FOR THE YEAR ENDED 31 DECEMBER 2016
NOTES TO AND FORMING PART OF
THE CONSOLIDATED FINANCIAL STATEMENTS
6 Cash and cash equivalents (continued)
(a) Offsetting
The Group has an offsetting agreement with its bank for cash facilities. The agreement allows the Group to manage cash balances on a total basis, offsetting individual cash balances against overdrafts. The value of overdrafts at 31 December 2016 was $nil (2015: $nil).
(b) Risk exposure
The Group’s exposure to interest rate risk is discussed in Note 22. The maximum exposure to credit risk at the end of the reporting period is the carrying amount of each class of cash and cash equivalents mentioned above.
7 Trade and other receivables
Accounting policy - trade and other receivables
Trade receivables are recognised initially at fair value and subsequently measured at amortised cost, less loss allowance provision. Trade receivables are typically due for settlement no more than 30 to 45 days from the end of the month of invoice.
The Group applies the simplified approach to providing for expected credit losses for all trade receivables as set out in Note 22(b).
The amount of the provision is recognised in the income statement. When a trade receivable for which a loss allowance provision has been recognised becomes uncollectible in a subsequent period, it is written off against the provision account. Subsequent recoveries of amounts previously written off are credited against expenses in the income statement.
Consolidated
($ Million) 2016 2015
Current Trade receivables 167.2 168.4 Loss allowance provision (1.2) (1.8)
166.0 166.6 Amounts receivable from joint ventures 28.3 29.3 Prepayments 5.1 6.2 Other receivables 5.2 6.2
Total current 204.6 208.3
Non-current Loans to joint ventures 32.3 30.2 Other non-current receivables 2.1 2.7
Total non-current 34.4 32.9
Movement in loss allowance provision Opening balance at 1 January 1.8 1.9 Amounts written off during the year (1.5) (0.8) Loss allowance provision recognised during the year 0.9 0.7
Closing balance at 31 December 1.2 1.8
Fair value and credit, interest and foreign exchange risk
Due to the short term nature of current receivables, their carrying value is assumed to approximate their fair value. All receivables are denominated in Australian Dollars. Information concerning the fair value and risk management of both current and non-current receivables is set out in Note 22.
The maximum exposure to credit risk at the end of the reporting period is the carrying amount of each class of receivables mentioned above.

73
ADELAIDE BRIGHTON LTD AND ITS CONTROLLED ENTITIES
FOR THE YEAR ENDED 31 DECEMBER 2016
NOTES TO AND FORMING PART OF
THE CONSOLIDATED FINANCIAL STATEMENTS
Consolidated
($ Million) 2016 2015
8 Inventories
Accounting policy - inventories
Raw materials and stores, work in progress and finished goods are stated at the lower of cost and net realisable value. Cost comprises direct materials, direct labour and an appropriate proportion of variable and fixed overhead expenditure, the latter being allocated on the basis of normal operating capacity. Costs are assigned to individual items of inventory on the basis of weighted average costs. Cost includes the reclassification from equity of any gains or losses on qualifying cashflow hedges relating to purchases of raw materials.
Net realisable value is the estimated selling price in the ordinary course of business less the estimated costs of completion and the estimated costs necessary to make the sale.
Inventory quantities are verified through stocktakes where inventory is either counted or, in the case of bulk materials, volumetric surveys are converted to weight using density factors. Certain volumetric surveys are performed by independent surveyors utilising aerial and laser surveys.
Current Finished goods 70.6 70.4 Raw materials and work in progress 60.1 60.2 Engineering spare parts stores 29.5 30.9
160.2 161.5
Inventory expense
Inventories recognised as expense during the year ended 31 December 2016 and included in cost of sales amounted to $808.3 million (2015: $825.6 million).
9 Assets classified as held for sale
Accounting policy - assets held for sale
Non-current assets (or disposal groups) are classified as held for sale and stated at the lower of their carrying amount and fair value less costs to sell if their carrying amount will be recovered principally through a sale transaction rather than through continuing use and a sale is considered highly probable.
An impairment loss is recognised for any initial or subsequent write down of the asset (or disposal group) to fair value less costs to sell. A gain is recognised for any subsequent increases in fair value less costs to sell an asset (or disposal group), but not in excess of any cumulative impairment loss previously recognised. A gain or loss not previously recognised by the date of the sale of the noncurrent asset (or disposal group) is recognised at the date of de-recognition.
Non-current assets (including those that are part of a disposal group) are not depreciated or amortised while they are classified as held for sale. Interest and other expenses attributable to the liabilities of a disposal group classified as held for sale continue to be recognised.
Non-current assets classified as held for sale and the assets of a disposal group classified as held for sale are presented separately from the other assets in the balance sheet. The liabilities of a disposal group classified as held for sale are presented separately from other liabilities in the balance sheet.
Signed contracts are in existence for the sale of these assets held for sale and the assets are held at their carrying value. The timing is normal for the nature of the contract for sale in the Concrete Products segment.
Current Land and buildings 1.3 - Plant and equipment 2.5 -
3.8 -
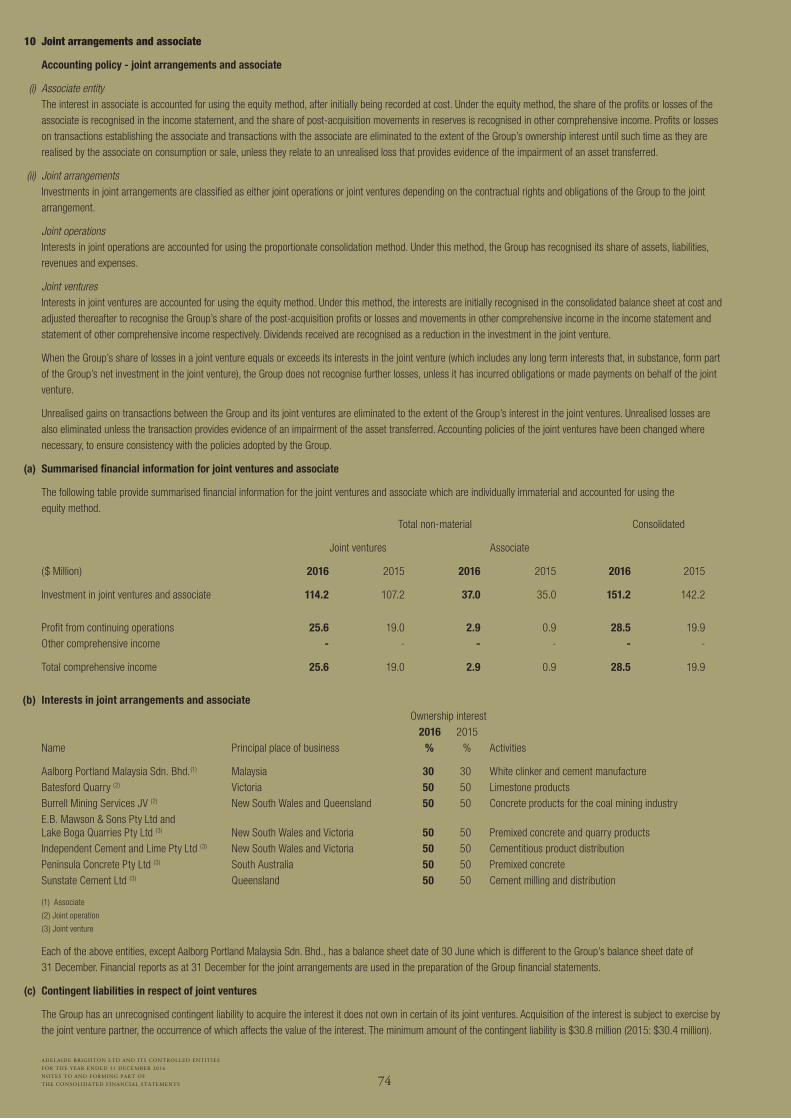
74
ADELAIDE BRIGHTON LTD AND ITS CONTROLLED ENTITIES
FOR THE YEAR ENDED 31 DECEMBER 2016
NOTES TO AND FORMING PART OF
THE CONSOLIDATED FINANCIAL STATEMENTS
10 Joint arrangements and associate
Accounting policy - joint arrangements and associate
(i) Associate entity The interest in associate is accounted for using the equity method, after initially being recorded at cost. Under the equity method, the share of the profits or losses of the
associate is recognised in the income statement, and the share of post-acquisition movements in reserves is recognised in other comprehensive income. Profits or losses on transactions establishing the associate and transactions with the associate are eliminated to the extent of the Group’s ownership interest until such time as they are realised by the associate on consumption or sale, unless they relate to an unrealised loss that provides evidence of the impairment of an asset transferred.
(ii) Joint arrangements Investments in joint arrangements are classified as either joint operations or joint ventures depending on the contractual rights and obligations of the Group to the joint
arrangement.
Joint operations Interests in joint operations are accounted for using the proportionate consolidation method. Under this method, the Group has recognised its share of assets, liabilities,
revenues and expenses.
Joint ventures Interests in joint ventures are accounted for using the equity method. Under this method, the interests are initially recognised in the consolidated balance sheet at cost and
adjusted thereafter to recognise the Group’s share of the post-acquisition profits or losses and movements in other comprehensive income in the income statement and statement of other comprehensive income respectively. Dividends received are recognised as a reduction in the investment in the joint venture.
When the Group’s share of losses in a joint venture equals or exceeds its interests in the joint venture (which includes any long term interests that, in substance, form part of the Group’s net investment in the joint venture), the Group does not recognise further losses, unless it has incurred obligations or made payments on behalf of the joint venture.
Unrealised gains on transactions between the Group and its joint ventures are eliminated to the extent of the Group’s interest in the joint ventures. Unrealised losses are also eliminated unless the transaction provides evidence of an impairment of the asset transferred. Accounting policies of the joint ventures have been changed where necessary, to ensure consistency with the policies adopted by the Group.
(a) Summarised financial information for joint ventures and associate
The following table provide summarised financial information for the joint ventures and associate which are individually immaterial and accounted for using the equity method.
Total non-material Consolidated
Joint ventures Associate
($ Million) 2016 2015 2016 2015 2016 2015
Investment in joint ventures and associate 114.2 107.2 37.0 35.0 151.2 142.2
Profit from continuing operations 25.6 19.0 2.9 0.9 28.5 19.9 Other comprehensive income - - - - - -
Total comprehensive income 25.6 19.0 2.9 0.9 28.5 19.9
(b) Interests in joint arrangements and associate Ownership interest 2016 2015 Name Principal place of business % % Activities
Aalborg Portland Malaysia Sdn. Bhd.(1) Malaysia 30 30 White clinker and cement manufacture Batesford Quarry (2) Victoria 50 50 Limestone products Burrell Mining Services JV (2) New South Wales and Queensland 50 50 Concrete products for the coal mining industry E.B. Mawson & Sons Pty Ltd and
Lake Boga Quarries Pty Ltd (3) New South Wales and Victoria 50 50 Premixed concrete and quarry products Independent Cement and Lime Pty Ltd (3) New South Wales and Victoria 50 50 Cementitious product distribution Peninsula Concrete Pty Ltd (3) South Australia 50 50 Premixed concrete Sunstate Cement Ltd (3) Queensland 50 50 Cement milling and distribution
(1) Associate
(2) Joint operation
(3) Joint venture
Each of the above entities, except Aalborg Portland Malaysia Sdn. Bhd., has a balance sheet date of 30 June which is different to the Group’s balance sheet date of 31 December. Financial reports as at 31 December for the joint arrangements are used in the preparation of the Group financial statements.
(c) Contingent liabilities in respect of joint ventures
The Group has an unrecognised contingent liability to acquire the interest it does not own in certain of its joint ventures. Acquisition of the interest is subject to exercise by the joint venture partner, the occurrence of which affects the value of the interest. The minimum amount of the contingent liability is $30.8 million (2015: $30.4 million).
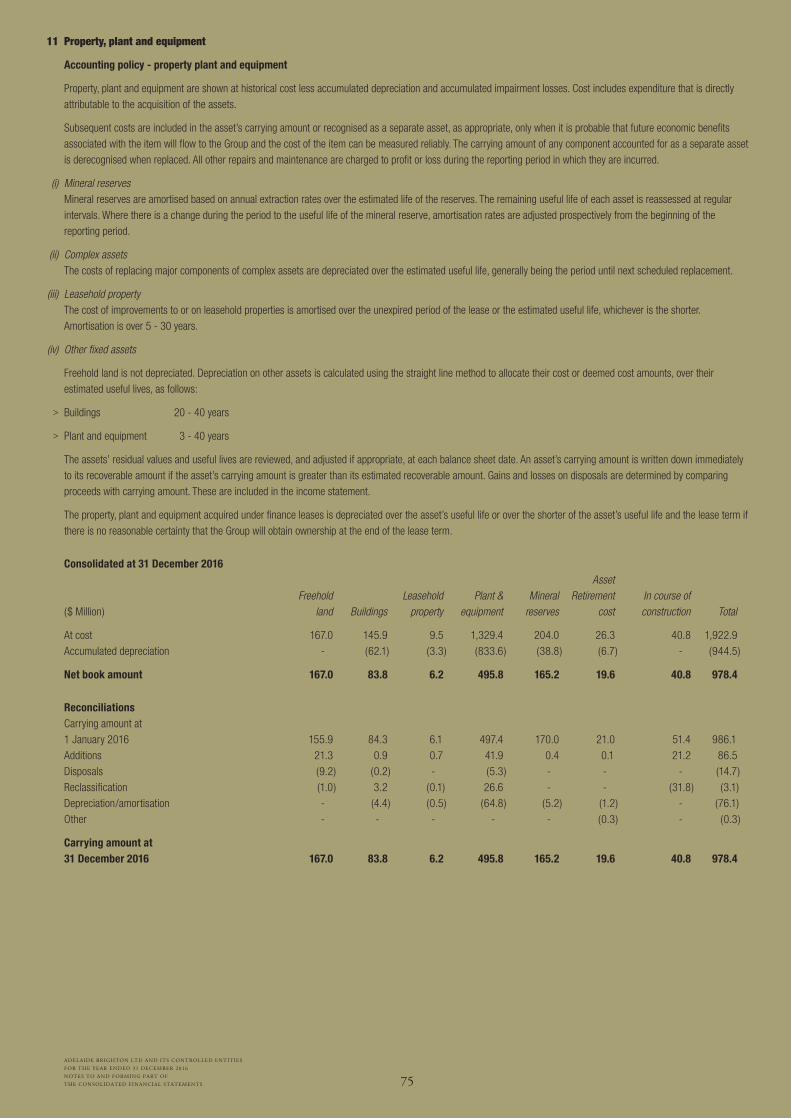
75
ADELAIDE BRIGHTON LTD AND ITS CONTROLLED ENTITIES
FOR THE YEAR ENDED 31 DECEMBER 2016
NOTES TO AND FORMING PART OF
THE CONSOLIDATED FINANCIAL STATEMENTS
11 Property, plant and equipment
Accounting policy - property plant and equipment
Property, plant and equipment are shown at historical cost less accumulated depreciation and accumulated impairment losses. Cost includes expenditure that is directly attributable to the acquisition of the assets.
Subsequent costs are included in the asset’s carrying amount or recognised as a separate asset, as appropriate, only when it is probable that future economic benefits associated with the item will flow to the Group and the cost of the item can be measured reliably. The carrying amount of any component accounted for as a separate asset is derecognised when replaced. All other repairs and maintenance are charged to profit or loss during the reporting period in which they are incurred.
(i) Mineral reserves Mineral reserves are amortised based on annual extraction rates over the estimated life of the reserves. The remaining useful life of each asset is reassessed at regular
intervals. Where there is a change during the period to the useful life of the mineral reserve, amortisation rates are adjusted prospectively from the beginning of the reporting period.
(ii) Complex assets The costs of replacing major components of complex assets are depreciated over the estimated useful life, generally being the period until next scheduled replacement.
(iii) Leasehold property The cost of improvements to or on leasehold properties is amortised over the unexpired period of the lease or the estimated useful life, whichever is the shorter.
Amortisation is over 5 - 30 years.
(iv) Other fixed assets
Freehold land is not depreciated. Depreciation on other assets is calculated using the straight line method to allocate their cost or deemed cost amounts, over their estimated useful lives, as follows:
> Buildings 20 - 40 years
> Plant and equipment 3 - 40 years
The assets’ residual values and useful lives are reviewed, and adjusted if appropriate, at each balance sheet date. An asset’s carrying amount is written down immediately to its recoverable amount if the asset’s carrying amount is greater than its estimated recoverable amount. Gains and losses on disposals are determined by comparing proceeds with carrying amount. These are included in the income statement.
The property, plant and equipment acquired under finance leases is depreciated over the asset’s useful life or over the shorter of the asset’s useful life and the lease term if there is no reasonable certainty that the Group will obtain ownership at the end of the lease term.
Consolidated at 31 December 2016 Asset Freehold Leasehold Plant & Mineral Retirement In course of ($ Million) land Buildings property equipment reserves cost construction Total
At cost 167.0 145.9 9.5 1,329.4 204.0 26.3 40.8 1,922.9 Accumulated depreciation - (62.1) (3.3) (833.6) (38.8) (6.7) - (944.5)
Net book amount 167.0 83.8 6.2 495.8 165.2 19.6 40.8 978.4
Reconciliations Carrying amount at 1 January 2016 155.9 84.3 6.1 497.4 170.0 21.0 51.4 986.1 Additions 21.3 0.9 0.7 41.9 0.4 0.1 21.2 86.5 Disposals (9.2) (0.2) - (5.3) - - - (14.7) Reclassification (1.0) 3.2 (0.1) 26.6 - - (31.8) (3.1) Depreciation/amortisation - (4.4) (0.5) (64.8) (5.2) (1.2) - (76.1) Other - - - - - (0.3) - (0.3)
Carrying amount at 31 December 2016 167.0 83.8 6.2 495.8 165.2 19.6 40.8 978.4
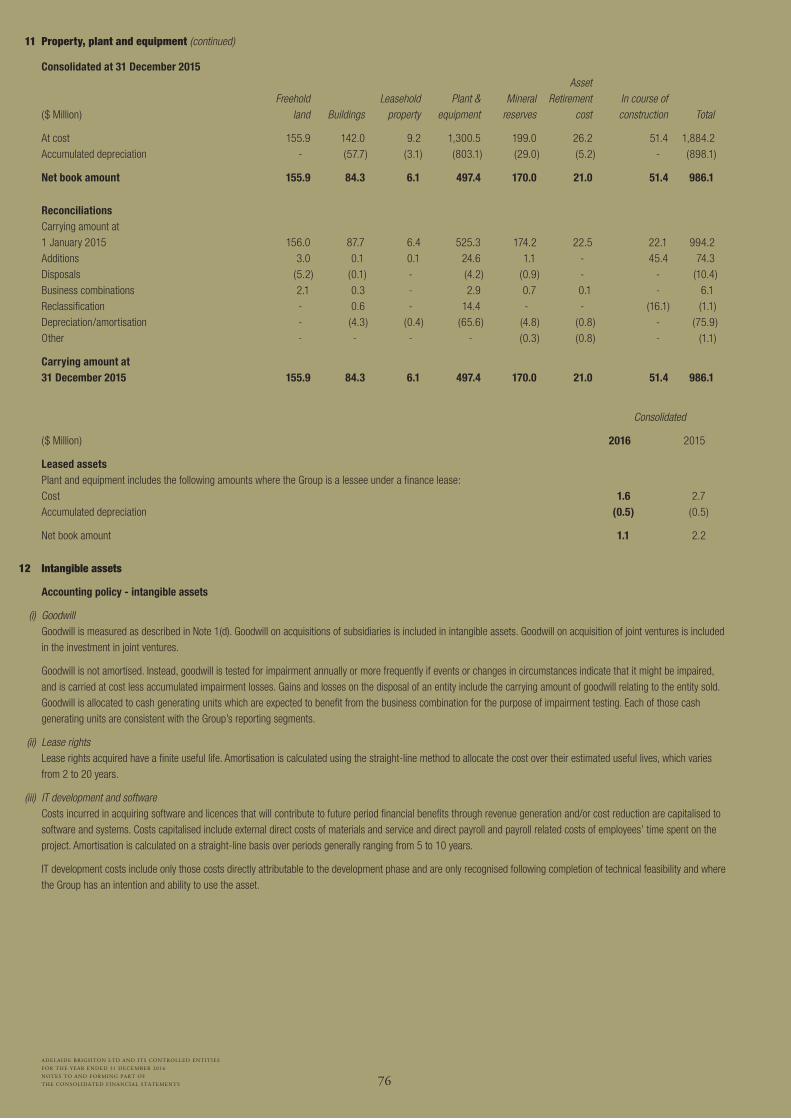
76
ADELAIDE BRIGHTON LTD AND ITS CONTROLLED ENTITIES
FOR THE YEAR ENDED 31 DECEMBER 2016
NOTES TO AND FORMING PART OF
THE CONSOLIDATED FINANCIAL STATEMENTS
11 Property, plant and equipment (continued)
Consolidated at 31 December 2015 Asset Freehold Leasehold Plant & Mineral Retirement In course of ($ Million) land Buildings property equipment reserves cost construction Total
At cost 155.9 142.0 9.2 1,300.5 199.0 26.2 51.4 1,884.2 Accumulated depreciation - (57.7) (3.1) (803.1) (29.0) (5.2) - (898.1)
Net book amount 155.9 84.3 6.1 497.4 170.0 21.0 51.4 986.1
Reconciliations Carrying amount at
1 January 2015 156.0 87.7 6.4 525.3 174.2 22.5 22.1 994.2 Additions 3.0 0.1 0.1 24.6 1.1 - 45.4 74.3 Disposals (5.2) (0.1) - (4.2) (0.9) - - (10.4) Business combinations 2.1 0.3 - 2.9 0.7 0.1 - 6.1 Reclassification - 0.6 - 14.4 - - (16.1) (1.1) Depreciation/amortisation - (4.3) (0.4) (65.6) (4.8) (0.8) - (75.9) Other - - - - (0.3) (0.8) - (1.1)
Carrying amount at 31 December 2015 155.9 84.3 6.1 497.4 170.0 21.0 51.4 986.1
Consolidated
($ Million) 2016 2015
Leased assets Plant and equipment includes the following amounts where the Group is a lessee under a finance lease: Cost 1.6 2.7 Accumulated depreciation (0.5) (0.5)
Net book amount 1.1 2.2
12 Intangible assets
Accounting policy - intangible assets
(i) Goodwill Goodwill is measured as described in Note 1(d). Goodwill on acquisitions of subsidiaries is included in intangible assets. Goodwill on acquisition of joint ventures is included
in the investment in joint ventures.
Goodwill is not amortised. Instead, goodwill is tested for impairment annually or more frequently if events or changes in circumstances indicate that it might be impaired, and is carried at cost less accumulated impairment losses. Gains and losses on the disposal of an entity include the carrying amount of goodwill relating to the entity sold. Goodwill is allocated to cash generating units which are expected to benefit from the business combination for the purpose of impairment testing. Each of those cash generating units are consistent with the Group’s reporting segments.
(ii) Lease rights Lease rights acquired have a finite useful life. Amortisation is calculated using the straight-line method to allocate the cost over their estimated useful lives, which varies
from 2 to 20 years.
(iii) IT development and software Costs incurred in acquiring software and licences that will contribute to future period financial benefits through revenue generation and/or cost reduction are capitalised to
software and systems. Costs capitalised include external direct costs of materials and service and direct payroll and payroll related costs of employees’ time spent on the project. Amortisation is calculated on a straight-line basis over periods generally ranging from 5 to 10 years.
IT development costs include only those costs directly attributable to the development phase and are only recognised following completion of technical feasibility and where the Group has an intention and ability to use the asset.

77
ADELAIDE BRIGHTON LTD AND ITS CONTROLLED ENTITIES
FOR THE YEAR ENDED 31 DECEMBER 2016
NOTES TO AND FORMING PART OF
THE CONSOLIDATED FINANCIAL STATEMENTS
12 Intangible assets (continued) Consolidated
Other ($ Million) Goodwill Software intangibles Total
31 December 2016 Cost 248.7 18.0 13.3 280.0 Accumulated amortisation - (8.6) (1.1) (9.7)
Carrying amount at 31 December 2016 248.7 9.4 12.2 270.3
Opening balance at 1 January 2016 248.7 11.2 13.0 272.9 Reclassification - (0.1) (0.5) (0.6) Additions in current year - - - - Amortisation charge - (1.7) (0.3) (2.0)
Closing balance at 31 December 2016 248.7 9.4 12.2 270.3
31 December 2015 Cost 248.7 18.1 13.9 280.7 Accumulated amortisation - (6.9) (0.9) (7.8)
Carrying amount at 31 December 2015 248.7 11.2 13.0 272.9
Opening balance at 1 January 2015 248.7 11.2 6.5 266.4 Reclassification - 1.1 - 1.1 Additions in current year - 0.5 6.8 7.3 Amortisation charge - (1.6) (0.3) (1.9)
Closing balance at 31 December 2015 248.7 11.2 13.0 272.9
13 Impairment tests
Goodwill is not subject to amortisation and is tested annually for impairment or more frequently if events or changes in circumstances indicate that they might be impaired. Other assets are tested for impairment whenever events or changes in circumstances indicate that the carrying amount may not be recoverable.
An impairment loss is recognised for the amount by which the asset’s carrying amount exceeds its recoverable amount. The recoverable amount is the higher of an asset’s fair value less costs to sell and value in use. For the purposes of assessing impairment, assets are grouped at the lowest levels for which there are separately identifiable cash flows which are largely independent of the cash flows from other assets or groups of assets (cash generating units). Non-financial assets other than goodwill that suffered an impairment are reviewed for possible reversal of the impairment at each reporting date.
(a) Goodwill is allocated to the Group’s cash-generating units (CGUs) identified according to business segments. A segment level summary of the goodwill allocation is presented below.
Consolidated
($ Million) 2016 2015
Cement and Lime 134.0 134.0 Concrete and Aggregates 105.9 105.9
Cement, Lime, Concrete and Aggregates segment 239.9 239.9 Concrete Products segment 8.8 8.8
248.7 248.7
The recoverable amount of a CGU is determined based on value-in-use calculations. These calculations use cash flow projections based on 2016 actual results and 2017 financial budgets approved by the Board. Projected cash flows are forecast for a period of greater than 5 years to incorporate the construction cycle into demand assumptions for modelling purposes. The growth rate does not exceed the long term average growth rate for the industry in which the CGU operates.
(b) Key assumptions used for value-in-use calculations
Gross margin (1) Growth rate (2) Discount rate (3)
2016 2015 2016 2015 2016 2015
Cement, Lime, Concrete and Aggregates 37.5 36.6 1.3 1.4 10.4 9.6 Concrete Products 24.9 24.5 1.2 2.0 10.9 10.0
(1) Budgeted gross margin (excluding fixed production costs).
(2) Weighted average growth rate used to extrapolate cash flows beyond the specific market forecast period of up to 11 years.
(3) Pre-tax discount rate applied to cash flow projections.
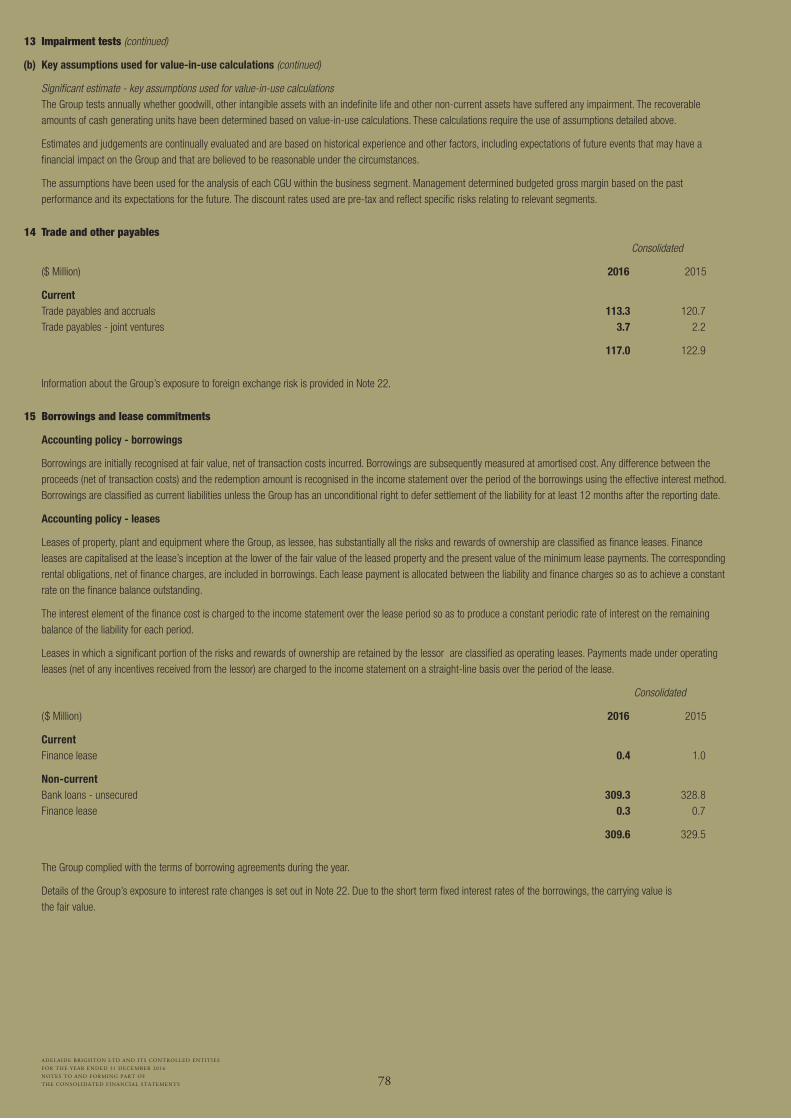
78
ADELAIDE BRIGHTON LTD AND ITS CONTROLLED ENTITIES
FOR THE YEAR ENDED 31 DECEMBER 2016
NOTES TO AND FORMING PART OF
THE CONSOLIDATED FINANCIAL STATEMENTS
13 Impairment tests (continued)
(b) Key assumptions used for value-in-use calculations (continued)
Significant estimate - key assumptions used for value-in-use calculations The Group tests annually whether goodwill, other intangible assets with an indefinite life and other non-current assets have suffered any impairment. The recoverable
amounts of cash generating units have been determined based on value-in-use calculations. These calculations require the use of assumptions detailed above.
Estimates and judgements are continually evaluated and are based on historical experience and other factors, including expectations of future events that may have a financial impact on the Group and that are believed to be reasonable under the circumstances.
The assumptions have been used for the analysis of each CGU within the business segment. Management determined budgeted gross margin based on the past performance and its expectations for the future. The discount rates used are pre-tax and reflect specific risks relating to relevant segments.
14 Trade and other payables Consolidated
($ Million) 2016 2015
Current Trade payables and accruals 113.3 120.7 Trade payables - joint ventures 3.7 2.2
117.0 122.9
Information about the Group’s exposure to foreign exchange risk is provided in Note 22.
15 Borrowings and lease commitments
Accounting policy - borrowings
Borrowings are initially recognised at fair value, net of transaction costs incurred. Borrowings are subsequently measured at amortised cost. Any difference between the proceeds (net of transaction costs) and the redemption amount is recognised in the income statement over the period of the borrowings using the effective interest method. Borrowings are classified as current liabilities unless the Group has an unconditional right to defer settlement of the liability for at least 12 months after the reporting date.
Accounting policy - leases
Leases of property, plant and equipment where the Group, as lessee, has substantially all the risks and rewards of ownership are classified as finance leases. Finance leases are capitalised at the lease’s inception at the lower of the fair value of the leased property and the present value of the minimum lease payments. The corresponding rental obligations, net of finance charges, are included in borrowings. Each lease payment is allocated between the liability and finance charges so as to achieve a constant rate on the finance balance outstanding.
The interest element of the finance cost is charged to the income statement over the lease period so as to produce a constant periodic rate of interest on the remaining balance of the liability for each period.
Leases in which a significant portion of the risks and rewards of ownership are retained by the lessor are classified as operating leases. Payments made under operating leases (net of any incentives received from the lessor) are charged to the income statement on a straight-line basis over the period of the lease.
Consolidated
($ Million) 2016 2015
Current Finance lease 0.4 1.0
Non-current Bank loans - unsecured 309.3 328.8
Finance lease 0.3 0.7
309.6 329.5
The Group complied with the terms of borrowing agreements during the year.
Details of the Group’s exposure to interest rate changes is set out in Note 22. Due to the short term fixed interest rates of the borrowings, the carrying value is the fair value.

79
ADELAIDE BRIGHTON LTD AND ITS CONTROLLED ENTITIES
FOR THE YEAR ENDED 31 DECEMBER 2016
NOTES TO AND FORMING PART OF
THE CONSOLIDATED FINANCIAL STATEMENTS
15 Borrowings and lease commitments (continued) Consolidated
($ Million) 2016 2015
Lease commitments - finance leases Commitments in relation to finance leases for various plant and equipment are payable as follows: Within one year 0.4 1.1 Later than one year but not later than five years 0.4 0.7
Minimum lease payments 0.8 1.8 Future finance charges (0.1) (0.1)
Total lease liabilities 0.7 1.7
The present value of finance lease liabilities is as follows: Within one year 0.4 1.0 Later than one year but not later than five years 0.3 0.7
Minimum lease payments 0.7 1.7
Lease commitments - operating leases Commitments in relation to operating leases contracted for at the reporting date, but not recognised as liabilities, are payable as follows: Within one year 4.8 4.4 Later than one year but not later than five years 12.9 8.9 Later than five years 8.0 9.1
25.7 22.4
Commitments for operating lease payments relate mainly to rental leases on property. The Group leases various properties under non-cancellable operating leases which contain varying terms, escalation clauses and renewal rights. On renewal, the terms of the leases are either renegotiated or the expiry date is extended under pre-negotiated terms.
16 Provisions
Accounting policy - provisions
Provisions are recognised if, as a result of a past event, the Group has a present legal or constructive obligation that can be estimated reliably, and it is probable that an outflow of economic benefits will be required to settle the obligation.
Where there are a number of similar obligations, the likelihood that an outflow will be required in settlement is determined by considering the class of obligations as a whole. A provision is recognised even if the likelihood of an outflow with respect to any one item included in the same class of obligations may be small.
Provisions are measured at the present value of management’s best estimate of the expenditure required to settle the present obligation at the reporting date. Non-employee benefit provisions are determined by discounting the expected future cash flows at a pre-tax rate that reflects current market assessments of the time value of money and the risks specific to the liability. The increase in the provision due to the passage of time is recognised as interest expense.
(i) Short term employee benefit obligations Liabilities for wages and salaries, including non-monetary benefits, annual leave and accumulating sick leave expected to be settled within 12 months after the end of the
period in which the employees render the related service are recognised in respect of employees’ services up to the end of the reporting period and are measured at the amounts expected to be paid when the liabilities are settled. The liability for annual leave and accumulating sick leave is recognised in the provision for employee benefits. All other short-term employee benefit obligations are presented as payables.
(ii) Long term employee benefit obligations The liability for long service leave and annual leave which is not expected to be settled within 12 months after the end of the period in which the employees render the
related service is recognised in the provision for employee benefits and measured as the present value of expected future payments to be made in respect of services provided by employees up to the end of the reporting period using the projected unit credit method. Consideration is given to expected future wage and salary levels, experience of employee departures and periods of service. Expected future payments are discounted using market yields at the end of the reporting period on high quality corporate bonds with terms to maturity and currency that match, as closely as possible, the estimated future cash outflows.
(iii) Workers’ compensation Certain entities within the Group are self insured for workers’ compensation purposes. For self-insured entities, provision is made that covers incidents that have occurred
and have been reported together with an allowance for incurred but not reported claims. The provision is based on an actuarial assessment.
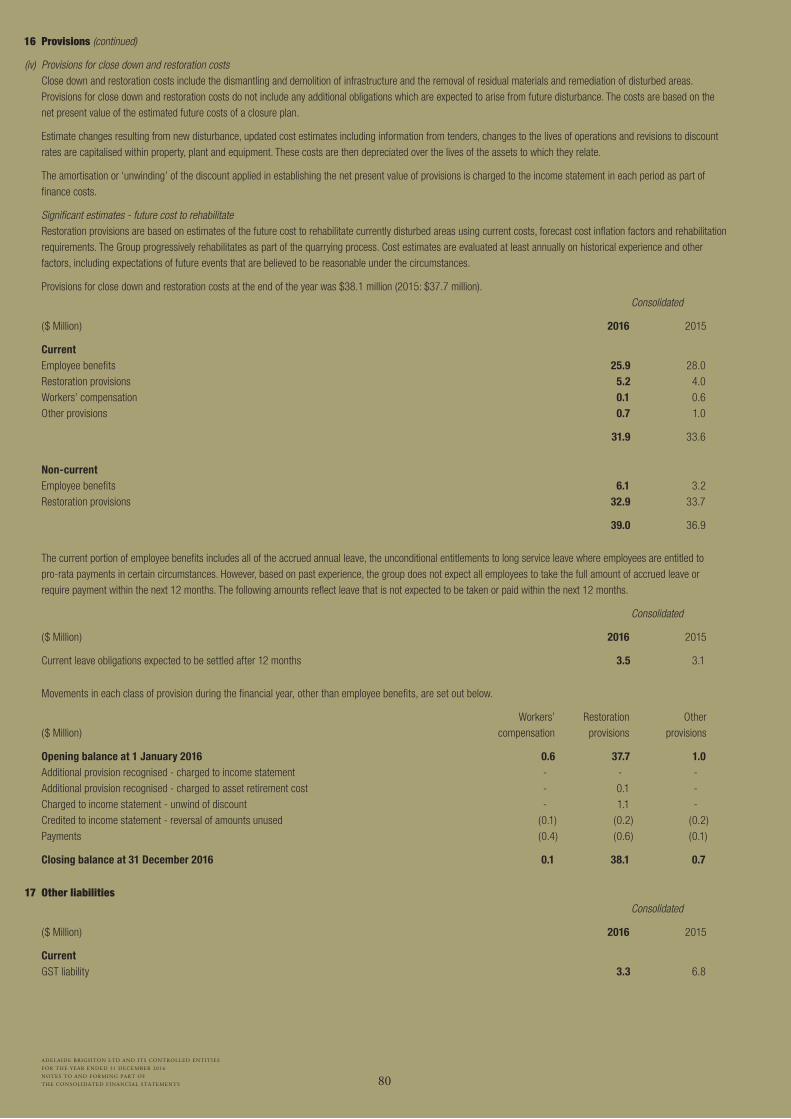
80
ADELAIDE BRIGHTON LTD AND ITS CONTROLLED ENTITIES
FOR THE YEAR ENDED 31 DECEMBER 2016
NOTES TO AND FORMING PART OF
THE CONSOLIDATED FINANCIAL STATEMENTS
16 Provisions (continued)
(iv) Provisions for close down and restoration costs Close down and restoration costs include the dismantling and demolition of infrastructure and the removal of residual materials and remediation of disturbed areas.
Provisions for close down and restoration costs do not include any additional obligations which are expected to arise from future disturbance. The costs are based on the net present value of the estimated future costs of a closure plan.
Estimate changes resulting from new disturbance, updated cost estimates including information from tenders, changes to the lives of operations and revisions to discount rates are capitalised within property, plant and equipment. These costs are then depreciated over the lives of the assets to which they relate.
The amortisation or ‘unwinding’ of the discount applied in establishing the net present value of provisions is charged to the income statement in each period as part of finance costs.
Significant estimates - future cost to rehabilitate Restoration provisions are based on estimates of the future cost to rehabilitate currently disturbed areas using current costs, forecast cost inflation factors and rehabilitation
requirements. The Group progressively rehabilitates as part of the quarrying process. Cost estimates are evaluated at least annually on historical experience and other factors, including expectations of future events that are believed to be reasonable under the circumstances.
Provisions for close down and restoration costs at the end of the year was $38.1 million (2015: $37.7 million). Consolidated
($ Million) 2016 2015
Current Employee benefits 25.9 28.0 Restoration provisions 5.2 4.0 Workers’ compensation 0.1 0.6 Other provisions 0.7 1.0
31.9 33.6
Non-current Employee benefits 6.1 3.2 Restoration provisions 32.9 33.7
39.0 36.9
The current portion of employee benefits includes all of the accrued annual leave, the unconditional entitlements to long service leave where employees are entitled to pro-rata payments in certain circumstances. However, based on past experience, the group does not expect all employees to take the full amount of accrued leave or require payment within the next 12 months. The following amounts reflect leave that is not expected to be taken or paid within the next 12 months.
Consolidated
($ Million) 2016 2015
Current leave obligations expected to be settled after 12 months 3.5 3.1
Movements in each class of provision during the financial year, other than employee benefits, are set out below.
Workers’ Restoration Other ($ Million) compensation provisions provisions
Opening balance at 1 January 2016 0.6 37.7 1.0 Additional provision recognised - charged to income statement - - - Additional provision recognised - charged to asset retirement cost - 0.1 - Charged to income statement - unwind of discount - 1.1 - Credited to income statement - reversal of amounts unused (0.1) (0.2) (0.2) Payments (0.4) (0.6) (0.1)
Closing balance at 31 December 2016 0.1 38.1 0.7
17 Other liabilities Consolidated
($ Million) 2016 2015
Current GST liability 3.3 6.8
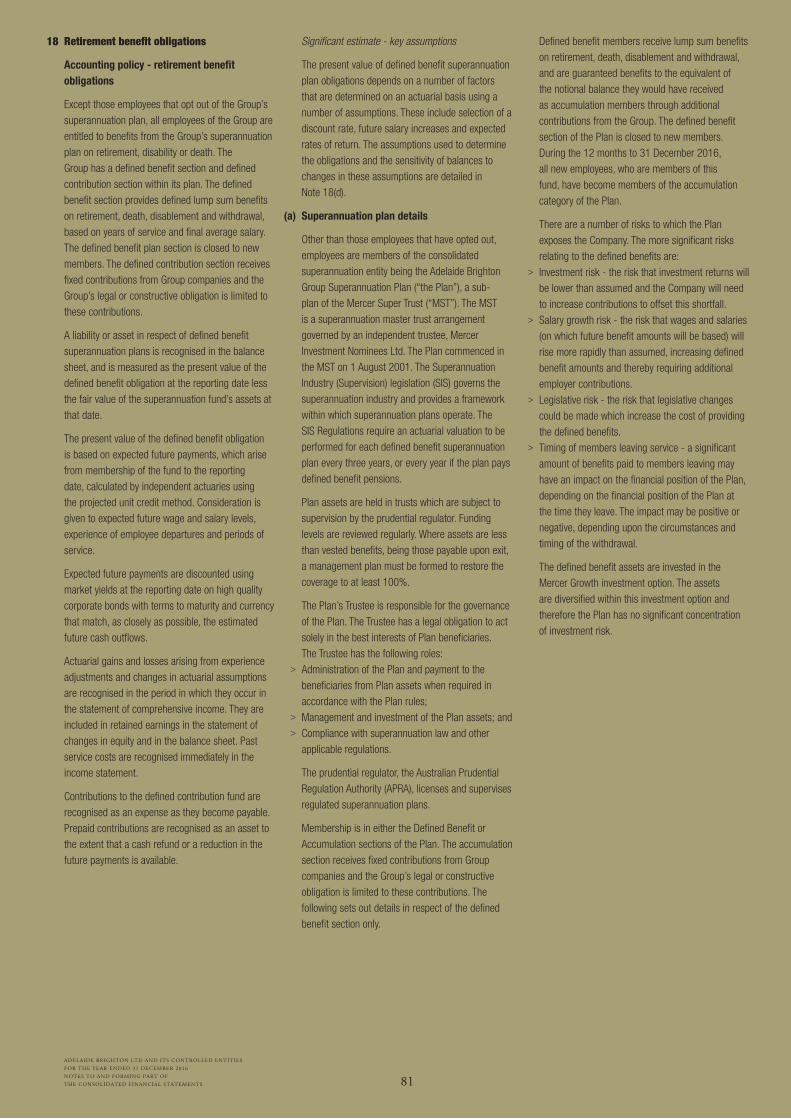
81
ADELAIDE BRIGHTON LTD AND ITS CONTROLLED ENTITIES
FOR THE YEAR ENDED 31 DECEMBER 2016
NOTES TO AND FORMING PART OF
THE CONSOLIDATED FINANCIAL STATEMENTS
18 Retirement benefit obligations
Accounting policy - retirement benefit obligations
Except those employees that opt out of the Group’s superannuation plan, all employees of the Group are entitled to benefits from the Group’s superannuation plan on retirement, disability or death. The Group has a defined benefit section and defined contribution section within its plan. The defined benefit section provides defined lump sum benefits on retirement, death, disablement and withdrawal, based on years of service and final average salary. The defined benefit plan section is closed to new members. The defined contribution section receives fixed contributions from Group companies and the Group’s legal or constructive obligation is limited to these contributions.
A liability or asset in respect of defined benefit superannuation plans is recognised in the balance sheet, and is measured as the present value of the defined benefit obligation at the reporting date less the fair value of the superannuation fund’s assets at that date.
The present value of the defined benefit obligation is based on expected future payments, which arise from membership of the fund to the reporting date, calculated by independent actuaries using the projected unit credit method. Consideration is given to expected future wage and salary levels, experience of employee departures and periods of service.
Expected future payments are discounted using market yields at the reporting date on high quality corporate bonds with terms to maturity and currency that match, as closely as possible, the estimated future cash outflows.
Actuarial gains and losses arising from experience adjustments and changes in actuarial assumptions are recognised in the period in which they occur in the statement of comprehensive income. They are included in retained earnings in the statement of changes in equity and in the balance sheet. Past service costs are recognised immediately in the income statement.
Contributions to the defined contribution fund are recognised as an expense as they become payable. Prepaid contributions are recognised as an asset to the extent that a cash refund or a reduction in the future payments is available.
Significant estimate - key assumptions
The present value of defined benefit superannuation plan obligations depends on a number of factors that are determined on an actuarial basis using a number of assumptions. These include selection of a discount rate, future salary increases and expected rates of return. The assumptions used to determine the obligations and the sensitivity of balances to changes in these assumptions are detailed in Note 18(d).
(a) Superannuation plan details
Other than those employees that have opted out, employees are members of the consolidated superannuation entity being the Adelaide Brighton Group Superannuation Plan (“the Plan”), a sub-plan of the Mercer Super Trust (“MST”). The MST is a superannuation master trust arrangement governed by an independent trustee, Mercer Investment Nominees Ltd. The Plan commenced in the MST on 1 August 2001. The Superannuation Industry (Supervision) legislation (SIS) governs the superannuation industry and provides a framework within which superannuation plans operate. The SIS Regulations require an actuarial valuation to be performed for each defined benefit superannuation plan every three years, or every year if the plan pays defined benefit pensions.
Plan assets are held in trusts which are subject to supervision by the prudential regulator. Funding levels are reviewed regularly. Where assets are less than vested benefits, being those payable upon exit, a management plan must be formed to restore the coverage to at least 100%.
The Plan’s Trustee is responsible for the governance of the Plan. The Trustee has a legal obligation to act solely in the best interests of Plan beneficiaries. The Trustee has the following roles:
> Administration of the Plan and payment to the beneficiaries from Plan assets when required in accordance with the Plan rules;
> Management and investment of the Plan assets; and > Compliance with superannuation law and other
applicable regulations.
The prudential regulator, the Australian Prudential Regulation Authority (APRA), licenses and supervises regulated superannuation plans.
Membership is in either the Defined Benefit or Accumulation sections of the Plan. The accumulation section receives fixed contributions from Group companies and the Group’s legal or constructive obligation is limited to these contributions. The following sets out details in respect of the defined benefit section only.
Defined benefit members receive lump sum benefits on retirement, death, disablement and withdrawal, and are guaranteed benefits to the equivalent of the notional balance they would have received as accumulation members through additional contributions from the Group. The defined benefit section of the Plan is closed to new members. During the 12 months to 31 December 2016, all new employees, who are members of this fund, have become members of the accumulation category of the Plan.
There are a number of risks to which the Plan exposes the Company. The more significant risks relating to the defined benefits are:
> Investment risk - the risk that investment returns will be lower than assumed and the Company will need to increase contributions to offset this shortfall.
> Salary growth risk - the risk that wages and salaries (on which future benefit amounts will be based) will rise more rapidly than assumed, increasing defined benefit amounts and thereby requiring additional employer contributions.
> Legislative risk - the risk that legislative changes could be made which increase the cost of providing the defined benefits.
> Timing of members leaving service - a significant amount of benefits paid to members leaving may have an impact on the financial position of the Plan, depending on the financial position of the Plan at the time they leave. The impact may be positive or negative, depending upon the circumstances and timing of the withdrawal.
The defined benefit assets are invested in the Mercer Growth investment option. The assets are diversified within this investment option and therefore the Plan has no significant concentration of investment risk.
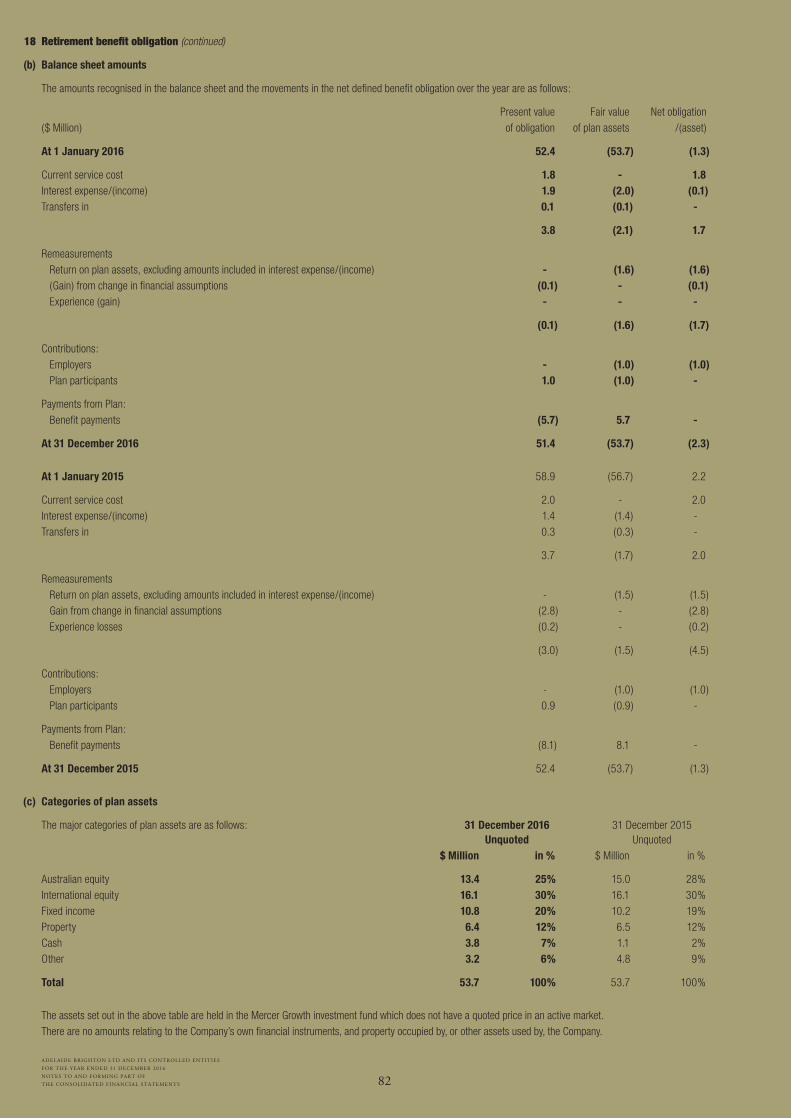
82
ADELAIDE BRIGHTON LTD AND ITS CONTROLLED ENTITIES
FOR THE YEAR ENDED 31 DECEMBER 2016
NOTES TO AND FORMING PART OF
THE CONSOLIDATED FINANCIAL STATEMENTS
18 Retirement benefit obligation (continued)
(b) Balance sheet amounts
The amounts recognised in the balance sheet and the movements in the net defined benefit obligation over the year are as follows:
Present value Fair value Net obligation ($ Million) of obligation of plan assets /(asset)
At 1 January 2016 52.4 (53.7) (1.3)
Current service cost 1.8 - 1.8 Interest expense/(income) 1.9 (2.0) (0.1) Transfers in 0.1 (0.1) -
3.8 (2.1) 1.7
Remeasurements Return on plan assets, excluding amounts included in interest expense/(income) - (1.6) (1.6)
(Gain) from change in financial assumptions (0.1) - (0.1) Experience (gain) - - -
(0.1) (1.6) (1.7)
Contributions: Employers - (1.0) (1.0) Plan participants 1.0 (1.0) -
Payments from Plan: Benefit payments (5.7) 5.7 -
At 31 December 2016 51.4 (53.7) (2.3)
At 1 January 2015 58.9 (56.7) 2.2
Current service cost 2.0 - 2.0 Interest expense/(income) 1.4 (1.4) - Transfers in 0.3 (0.3) -
3.7 (1.7) 2.0
Remeasurements Return on plan assets, excluding amounts included in interest expense/(income) - (1.5) (1.5) Gain from change in financial assumptions (2.8) - (2.8) Experience losses (0.2) - (0.2)
(3.0) (1.5) (4.5)
Contributions: Employers - (1.0) (1.0) Plan participants 0.9 (0.9) -
Payments from Plan: Benefit payments (8.1) 8.1 -
At 31 December 2015 52.4 (53.7) (1.3)
(c) Categories of plan assets
The major categories of plan assets are as follows: 31 December 2016 31 December 2015 Unquoted Unquoted $ Million in % $ Million in %
Australian equity 13.4 25% 15.0 28% International equity 16.1 30% 16.1 30% Fixed income 10.8 20% 10.2 19% Property 6.4 12% 6.5 12% Cash 3.8 7% 1.1 2% Other 3.2 6% 4.8 9%
Total 53.7 100% 53.7 100%
The assets set out in the above table are held in the Mercer Growth investment fund which does not have a quoted price in an active market. There are no amounts relating to the Company’s own financial instruments, and property occupied by, or other assets used by, the Company.
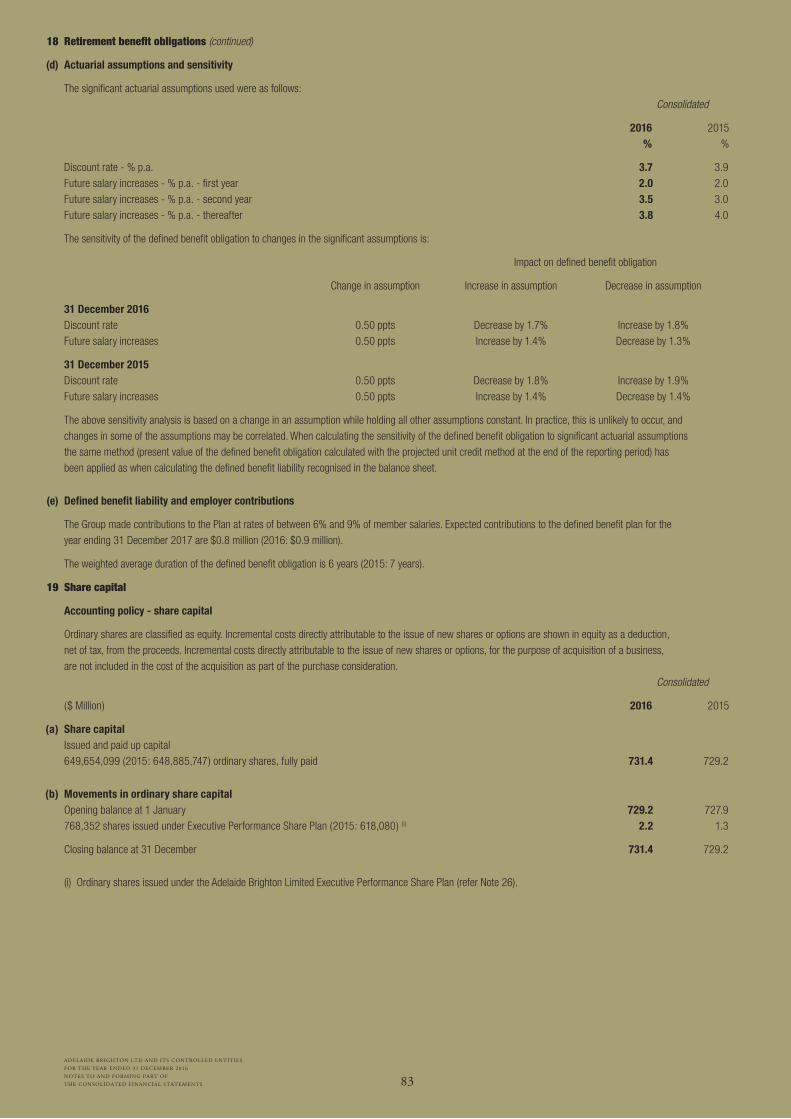
83
ADELAIDE BRIGHTON LTD AND ITS CONTROLLED ENTITIES
FOR THE YEAR ENDED 31 DECEMBER 2016
NOTES TO AND FORMING PART OF
THE CONSOLIDATED FINANCIAL STATEMENTS
18 Retirement benefit obligations (continued)
(d) Actuarial assumptions and sensitivity
The significant actuarial assumptions used were as follows: Consolidated
2016 2015 % %
Discount rate - % p.a. 3.7 3.9 Future salary increases - % p.a. - first year 2.0 2.0 Future salary increases - % p.a. - second year 3.5 3.0 Future salary increases - % p.a. - thereafter 3.8 4.0
The sensitivity of the defined benefit obligation to changes in the significant assumptions is:
Impact on defined benefit obligation
Change in assumption Increase in assumption Decrease in assumption
31 December 2016 Discount rate 0.50 ppts Decrease by 1.7% Increase by 1.8% Future salary increases 0.50 ppts Increase by 1.4% Decrease by 1.3%
31 December 2015 Discount rate 0.50 ppts Decrease by 1.8% Increase by 1.9% Future salary increases 0.50 ppts Increase by 1.4% Decrease by 1.4%
The above sensitivity analysis is based on a change in an assumption while holding all other assumptions constant. In practice, this is unlikely to occur, and changes in some of the assumptions may be correlated. When calculating the sensitivity of the defined benefit obligation to significant actuarial assumptions the same method (present value of the defined benefit obligation calculated with the projected unit credit method at the end of the reporting period) has been applied as when calculating the defined benefit liability recognised in the balance sheet.
(e) Defined benefit liability and employer contributions
The Group made contributions to the Plan at rates of between 6% and 9% of member salaries. Expected contributions to the defined benefit plan for the year ending 31 December 2017 are $0.8 million (2016: $0.9 million).
The weighted average duration of the defined benefit obligation is 6 years (2015: 7 years).
19 Share capital
Accounting policy - share capital
Ordinary shares are classified as equity. Incremental costs directly attributable to the issue of new shares or options are shown in equity as a deduction, net of tax, from the proceeds. Incremental costs directly attributable to the issue of new shares or options, for the purpose of acquisition of a business, are not included in the cost of the acquisition as part of the purchase consideration.
Consolidated
($ Million) 2016 2015
(a) Share capital Issued and paid up capital 649,654,099 (2015: 648,885,747) ordinary shares, fully paid 731.4 729.2
(b) Movements in ordinary share capital Opening balance at 1 January 729.2 727.9 768,352 shares issued under Executive Performance Share Plan (2015: 618,080) (i) 2.2 1.3
Closing balance at 31 December 731.4 729.2
(i) Ordinary shares issued under the Adelaide Brighton Limited Executive Performance Share Plan (refer Note 26).

84
ADELAIDE BRIGHTON LTD AND ITS CONTROLLED ENTITIES
FOR THE YEAR ENDED 31 DECEMBER 2016
NOTES TO AND FORMING PART OF
THE CONSOLIDATED FINANCIAL STATEMENTS
19 Share capital (continued)
(c) Ordinary shares
Ordinary shares entitle the holder to participate in dividends and the proceeds on winding up the Company in proportion to the number of and amounts paid on the shares held. On a show of hands every holder of ordinary shares present at a meeting in person or by proxy, is entitled to one vote and, on a poll, each share is entitled to one vote.
Ordinary shares have no par value and the Company does not have a limited amount of authorised capital.
(d) Dividend Reinvestment Plan
Under the Dividend Reinvestment Plan (DRP), holders of ordinary shares may elect to have all or part of their dividend entitlements satisfied by the issue of new ordinary shares rather than by being paid in cash. Shares are issued under the DRP at a price determined by the Board. The operation of the DRP for any dividend is at the discretion of the Board, which suspended the DRP in February 2015 with immediate effect, and has not been reactivated since that time.
(e) Capital risk management
The Group’s objectives when managing capital are to safeguard the ability to continue as a going concern, continuing to provide returns for shareholders and benefits for other stakeholders, and to maintain an optimal capital structure to reduce the cost of capital.
In order to maintain or adjust the capital structure, the Group may adjust the amount of dividends paid to shareholders, issue shares as well as issue new debt or redeem existing debt. The Group monitors capital on the basis of the gearing ratio. Adelaide Brighton’s target gearing ratio is 25% to 45%.
The gearing ratio at 31 December 2016 and 31 December 2015 was as follows:
Consolidated
($ Million) 2016 2015
Total borrowings 310.0 330.5 Less: cash and cash equivalents (21.5) (33.3)
Net debt 288.5 297.2 Total equity 1,220.1 1,207.3 Gearing ratio 23.6% 24.6%
(f) Employee share scheme and options
Information relating to the employee share schemes, including details of shares issued under the schemes is set out in Note 26.
20 Reserves and retained earnings
(a) Reserves Foreign currency translation reserve (0.7) 0.2 Share-based payment reserve 2.7 1.9 Cash flow hedge reserve 0.9 (0.9)
2.9 1.2
Foreign currency translation reserve Opening balance at 1 January 0.2 1.5 Currency translation differences arising during the year (0.9) (1.3)
Closing balance at 31 December (0.7) 0.2
Share-based payment reserve Opening balance at 1 January 1.9 1.8 Awards expense 1.0 1.3 Deferred tax 0.9 (0.3) Issue of shares to employees (1.1) (0.9)
Closing balance at 31 December 2.7 1.9
Cash flow hedge reserve Opening balance at 1 January (0.9) - Revaluation - gross 1.3 (1.3) Reclassified to the carrying amount of inventory 1.3 - Deferred tax on movement in reserve (0.8) 0.4
Closing balance at 31 December 0.9 (0.9)

85
ADELAIDE BRIGHTON LTD AND ITS CONTROLLED ENTITIES
FOR THE YEAR ENDED 31 DECEMBER 2016
NOTES TO AND FORMING PART OF
THE CONSOLIDATED FINANCIAL STATEMENTS
20 Reserves and retained earnings (continued)
Nature and purpose of reserves
Foreign currency translation Exchange differences arising on translation of foreign controlled entities and the foreign associate are recognised in other comprehensive income as described in Note 1(c)
and accumulated in a separate reserve within equity. The cumulative amount is reclassified to the income statement when the net investment is disposed of.
Share-based payment The share-based payment reserve is used to recognise the fair value of awards issued but not exercised. Refer Note 26.
Cash flow hedge reserve The cash flow hedge reserve is used to recognise the accumulated movement in fair value of instruments that qualify for hedge accounting. The accumulated amount of a
hedging instrument is transferred to the carrying value of inventory on recognition or, for hedges of items that are not non-financial assets or non-financial liabilities, to the income statement at the time of recognising the item in the income statement.
(b) Retained earnings Consolidated
($ Million) 2016 2015
Opening balance at 1 January 474.3 402.8 Net profit for the year 186.3 207.9 Actuarial gain/(loss) on defined benefit obligation net of tax 1.2 3.1 Dividends (178.5) (139.5)
Closing balance at 31 December 483.3 474.3
21 Dividends
Dividends paid during the year The Company
($ Million) 2016 2015
2015 final dividend of 15.0 cents (2014 - 9.5 cents) per fully paid ordinary share, franked at 100% (2014 - 100%) paid on 12 April 2016 97.3 61.6
2016 interim dividend of 12.5 cents (2015 - 12 cents) per fully paid ordinary share, franked at 100% (2015 - 100%) paid on 12 October 2016 81.2 77.9
Total dividends - paid in cash 178.5 139.5
Dividend not recognised at year end
Since the end of the year the Directors have recommended the payment of a final dividend of 15.5 cents (2015: 15.0 cents) per fully paid share, franked at 100% (2015: 100%).The aggregate amount of the proposed final dividend to be paid on 12 April 2017, not recognised as a liability at the end of the reporting period, is
100.7 97.3
Franked dividend
The franked portion of the dividend proposed as at 31 December 2016 will be franked out of existing franking credits or out of franking credits arising from the payment of income tax in the year ending 31 December 2017.
Consolidated
($ Million) 2016 2015
Franking credits available for subsequent financial years based on a tax rate of 30% (2015: 30%) 120.8 130.3
The above amounts represent the balance of the franking account as at the end of the financial year, adjusted for:
(a) franking credits that will arise from the payment of any current tax liability;
(b) franking debits that will arise from the payment of dividends recognised as a liability at the reporting date; and
(c) franking credits that will arise from the receipt of dividends recognised as receivables at the reporting date.
The impact on the franking account of the dividend recommended by the Directors since year end, but not recognised as a liability at year end, will be a reduction in the franking account of $43.2 million (2015: $41.7 million).
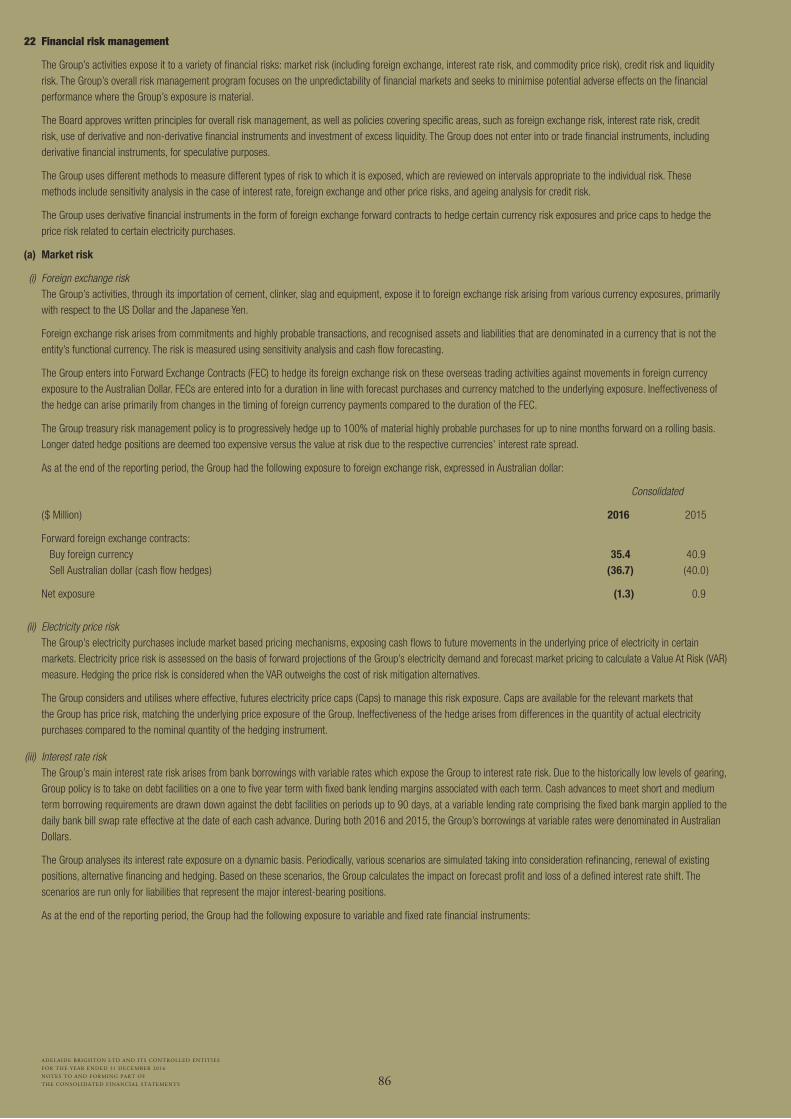
86
ADELAIDE BRIGHTON LTD AND ITS CONTROLLED ENTITIES
FOR THE YEAR ENDED 31 DECEMBER 2016
NOTES TO AND FORMING PART OF
THE CONSOLIDATED FINANCIAL STATEMENTS
22 Financial risk management
The Group’s activities expose it to a variety of financial risks: market risk (including foreign exchange, interest rate risk, and commodity price risk), credit risk and liquidity risk. The Group’s overall risk management program focuses on the unpredictability of financial markets and seeks to minimise potential adverse effects on the financial performance where the Group’s exposure is material.
The Board approves written principles for overall risk management, as well as policies covering specific areas, such as foreign exchange risk, interest rate risk, credit risk, use of derivative and non-derivative financial instruments and investment of excess liquidity. The Group does not enter into or trade financial instruments, including derivative financial instruments, for speculative purposes.
The Group uses different methods to measure different types of risk to which it is exposed, which are reviewed on intervals appropriate to the individual risk. These methods include sensitivity analysis in the case of interest rate, foreign exchange and other price risks, and ageing analysis for credit risk.
The Group uses derivative financial instruments in the form of foreign exchange forward contracts to hedge certain currency risk exposures and price caps to hedge the price risk related to certain electricity purchases.
(a) Market risk
(i) Foreign exchange risk The Group’s activities, through its importation of cement, clinker, slag and equipment, expose it to foreign exchange risk arising from various currency exposures, primarily
with respect to the US Dollar and the Japanese Yen.
Foreign exchange risk arises from commitments and highly probable transactions, and recognised assets and liabilities that are denominated in a currency that is not the entity’s functional currency. The risk is measured using sensitivity analysis and cash flow forecasting.
The Group enters into Forward Exchange Contracts (FEC) to hedge its foreign exchange risk on these overseas trading activities against movements in foreign currency exposure to the Australian Dollar. FECs are entered into for a duration in line with forecast purchases and currency matched to the underlying exposure. Ineffectiveness of the hedge can arise primarily from changes in the timing of foreign currency payments compared to the duration of the FEC.
The Group treasury risk management policy is to progressively hedge up to 100% of material highly probable purchases for up to nine months forward on a rolling basis. Longer dated hedge positions are deemed too expensive versus the value at risk due to the respective currencies’ interest rate spread.
As at the end of the reporting period, the Group had the following exposure to foreign exchange risk, expressed in Australian dollar:
Consolidated
($ Million) 2016 2015
Forward foreign exchange contracts: Buy foreign currency 35.4 40.9 Sell Australian dollar (cash flow hedges) (36.7) (40.0)
Net exposure (1.3) 0.9
(ii) Electricity price risk The Group’s electricity purchases include market based pricing mechanisms, exposing cash flows to future movements in the underlying price of electricity in certain
markets. Electricity price risk is assessed on the basis of forward projections of the Group’s electricity demand and forecast market pricing to calculate a Value At Risk (VAR) measure. Hedging the price risk is considered when the VAR outweighs the cost of risk mitigation alternatives.
The Group considers and utilises where effective, futures electricity price caps (Caps) to manage this risk exposure. Caps are available for the relevant markets that the Group has price risk, matching the underlying price exposure of the Group. Ineffectiveness of the hedge arises from differences in the quantity of actual electricity purchases compared to the nominal quantity of the hedging instrument.
(iii) Interest rate risk The Group’s main interest rate risk arises from bank borrowings with variable rates which expose the Group to interest rate risk. Due to the historically low levels of gearing,
Group policy is to take on debt facilities on a one to five year term with fixed bank lending margins associated with each term. Cash advances to meet short and medium term borrowing requirements are drawn down against the debt facilities on periods up to 90 days, at a variable lending rate comprising the fixed bank margin applied to the daily bank bill swap rate effective at the date of each cash advance. During both 2016 and 2015, the Group’s borrowings at variable rates were denominated in Australian Dollars.
The Group analyses its interest rate exposure on a dynamic basis. Periodically, various scenarios are simulated taking into consideration refinancing, renewal of existing positions, alternative financing and hedging. Based on these scenarios, the Group calculates the impact on forecast profit and loss of a defined interest rate shift. The scenarios are run only for liabilities that represent the major interest-bearing positions.
As at the end of the reporting period, the Group had the following exposure to variable and fixed rate financial instruments:
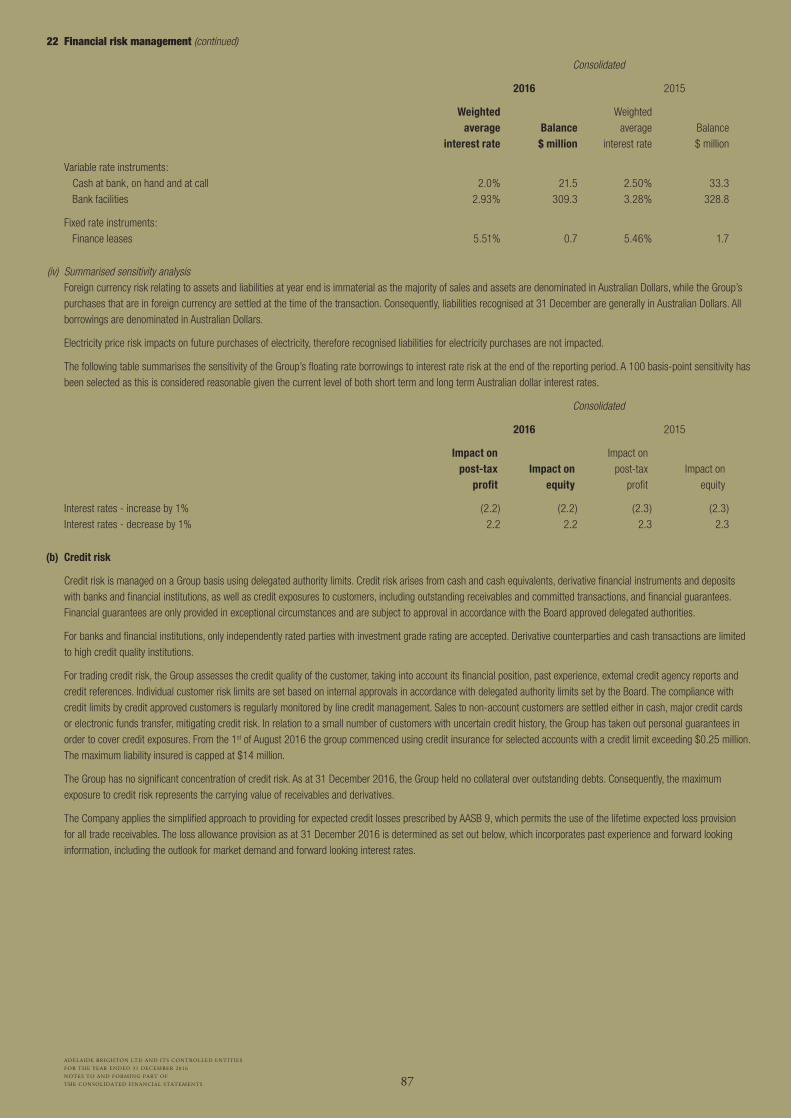
87
ADELAIDE BRIGHTON LTD AND ITS CONTROLLED ENTITIES
FOR THE YEAR ENDED 31 DECEMBER 2016
NOTES TO AND FORMING PART OF
THE CONSOLIDATED FINANCIAL STATEMENTS
22 Financial risk management (continued)
Consolidated
2016 2015
Weighted Weighted average Balance average Balance interest rate $ million interest rate $ million
Variable rate instruments: Cash at bank, on hand and at call 2.0% 21.5 2.50% 33.3 Bank facilities 2.93% 309.3 3.28% 328.8
Fixed rate instruments: Finance leases 5.51% 0.7 5.46% 1.7
(iv) Summarised sensitivity analysis Foreign currency risk relating to assets and liabilities at year end is immaterial as the majority of sales and assets are denominated in Australian Dollars, while the Group’s
purchases that are in foreign currency are settled at the time of the transaction. Consequently, liabilities recognised at 31 December are generally in Australian Dollars. All borrowings are denominated in Australian Dollars.
Electricity price risk impacts on future purchases of electricity, therefore recognised liabilities for electricity purchases are not impacted.
The following table summarises the sensitivity of the Group’s floating rate borrowings to interest rate risk at the end of the reporting period. A 100 basis-point sensitivity has been selected as this is considered reasonable given the current level of both short term and long term Australian dollar interest rates.
Consolidated
2016 2015
Impact on Impact on post-tax Impact on post-tax Impact on profit equity profit equity
Interest rates - increase by 1% (2.2) (2.2) (2.3) (2.3) Interest rates - decrease by 1% 2.2 2.2 2.3 2.3
(b) Credit risk
Credit risk is managed on a Group basis using delegated authority limits. Credit risk arises from cash and cash equivalents, derivative financial instruments and deposits with banks and financial institutions, as well as credit exposures to customers, including outstanding receivables and committed transactions, and financial guarantees. Financial guarantees are only provided in exceptional circumstances and are subject to approval in accordance with the Board approved delegated authorities.
For banks and financial institutions, only independently rated parties with investment grade rating are accepted. Derivative counterparties and cash transactions are limited to high credit quality institutions.
For trading credit risk, the Group assesses the credit quality of the customer, taking into account its financial position, past experience, external credit agency reports and credit references. Individual customer risk limits are set based on internal approvals in accordance with delegated authority limits set by the Board. The compliance with credit limits by credit approved customers is regularly monitored by line credit management. Sales to non-account customers are settled either in cash, major credit cards or electronic funds transfer, mitigating credit risk. In relation to a small number of customers with uncertain credit history, the Group has taken out personal guarantees in order to cover credit exposures. From the 1st of August 2016 the group commenced using credit insurance for selected accounts with a credit limit exceeding $0.25 million. The maximum liability insured is capped at $14 million.
The Group has no significant concentration of credit risk. As at 31 December 2016, the Group held no collateral over outstanding debts. Consequently, the maximum exposure to credit risk represents the carrying value of receivables and derivatives.
The Company applies the simplified approach to providing for expected credit losses prescribed by AASB 9, which permits the use of the lifetime expected loss provision for all trade receivables. The loss allowance provision as at 31 December 2016 is determined as set out below, which incorporates past experience and forward looking information, including the outlook for market demand and forward looking interest rates.
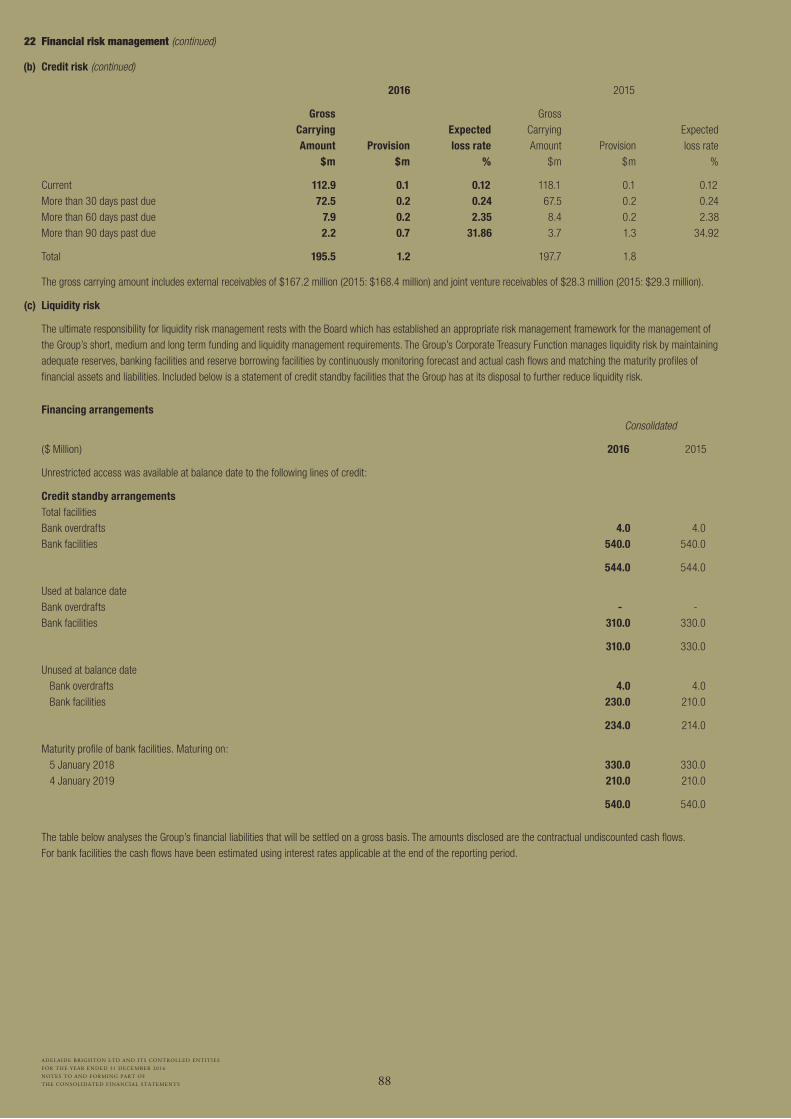
88
ADELAIDE BRIGHTON LTD AND ITS CONTROLLED ENTITIES
FOR THE YEAR ENDED 31 DECEMBER 2016
NOTES TO AND FORMING PART OF
THE CONSOLIDATED FINANCIAL STATEMENTS
22 Financial risk management (continued)
(b) Credit risk (continued)
2016 2015
Gross Gross Carrying Expected Carrying Expected Amount Provision loss rate Amount Provision loss rate $m $m % $m $m %
Current 112.9 0.1 0.12 118.1 0.1 0.12 More than 30 days past due 72.5 0.2 0.24 67.5 0.2 0.24 More than 60 days past due 7.9 0.2 2.35 8.4 0.2 2.38 More than 90 days past due 2.2 0.7 31.86 3.7 1.3 34.92
Total 195.5 1.2 197.7 1.8
The gross carrying amount includes external receivables of $167.2 million (2015: $168.4 million) and joint venture receivables of $28.3 million (2015: $29.3 million).
(c) Liquidity risk
The ultimate responsibility for liquidity risk management rests with the Board which has established an appropriate risk management framework for the management of the Group’s short, medium and long term funding and liquidity management requirements. The Group’s Corporate Treasury Function manages liquidity risk by maintaining adequate reserves, banking facilities and reserve borrowing facilities by continuously monitoring forecast and actual cash flows and matching the maturity profiles of financial assets and liabilities. Included below is a statement of credit standby facilities that the Group has at its disposal to further reduce liquidity risk.
Financing arrangements Consolidated
($ Million) 2016 2015
Unrestricted access was available at balance date to the following lines of credit:
Credit standby arrangements Total facilities Bank overdrafts 4.0 4.0 Bank facilities 540.0 540.0
544.0 544.0
Used at balance date Bank overdrafts - - Bank facilities 310.0 330.0
310.0 330.0
Unused at balance date Bank overdrafts 4.0 4.0 Bank facilities 230.0 210.0
234.0 214.0
Maturity profile of bank facilities. Maturing on: 5 January 2018 330.0 330.0 4 January 2019 210.0 210.0
540.0 540.0
The table below analyses the Group’s financial liabilities that will be settled on a gross basis. The amounts disclosed are the contractual undiscounted cash flows. For bank facilities the cash flows have been estimated using interest rates applicable at the end of the reporting period.
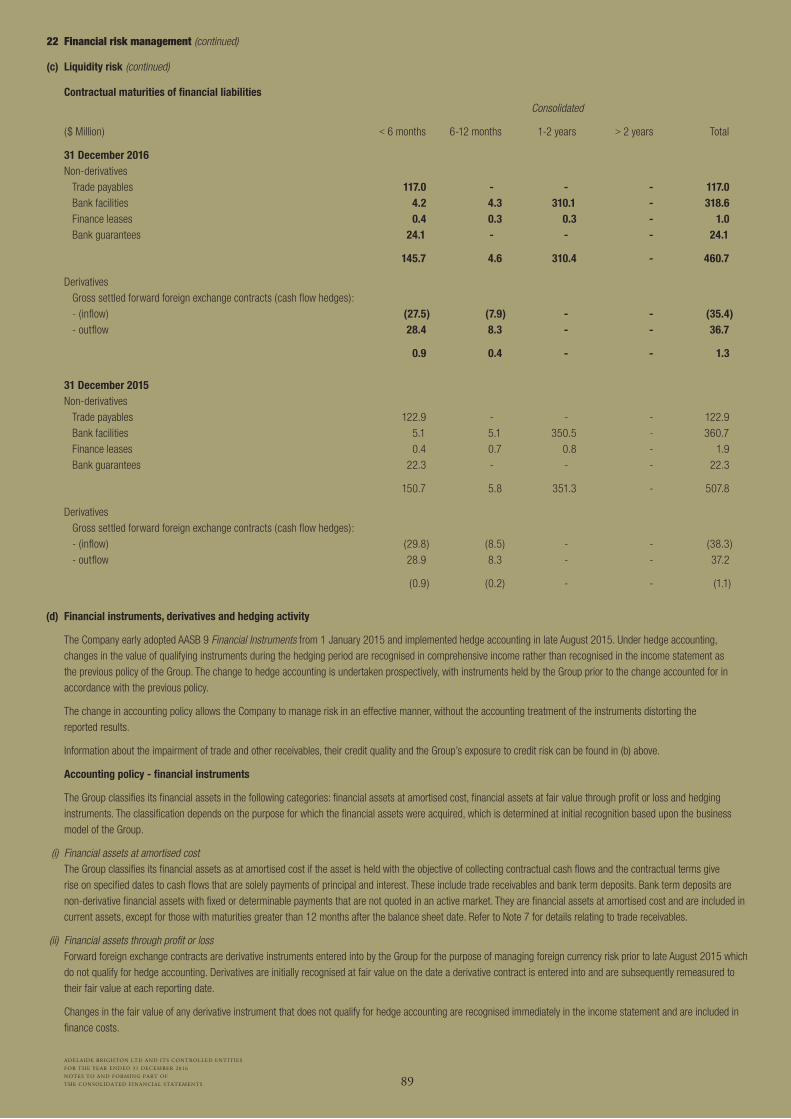
89
ADELAIDE BRIGHTON LTD AND ITS CONTROLLED ENTITIES
FOR THE YEAR ENDED 31 DECEMBER 2016
NOTES TO AND FORMING PART OF
THE CONSOLIDATED FINANCIAL STATEMENTS
22 Financial risk management (continued)
(c) Liquidity risk (continued)
Contractual maturities of financial liabilities Consolidated
($ Million) < 6 months 6-12 months 1-2 years > 2 years Total
31 December 2016 Non-derivatives Trade payables 117.0 - - - 117.0 Bank facilities 4.2 4.3 310.1 - 318.6 Finance leases 0.4 0.3 0.3 - 1.0 Bank guarantees 24.1 - - - 24.1
145.7 4.6 310.4 - 460.7
Derivatives Gross settled forward foreign exchange contracts (cash flow hedges): - (inflow) (27.5) (7.9) - - (35.4) - outflow 28.4 8.3 - - 36.7
0.9 0.4 - - 1.3 31 December 2015 Non-derivatives Trade payables 122.9 - - - 122.9 Bank facilities 5.1 5.1 350.5 - 360.7 Finance leases 0.4 0.7 0.8 - 1.9 Bank guarantees 22.3 - - - 22.3
150.7 5.8 351.3 - 507.8
Derivatives Gross settled forward foreign exchange contracts (cash flow hedges): - (inflow) (29.8) (8.5) - - (38.3) - outflow 28.9 8.3 - - 37.2
(0.9) (0.2) - - (1.1)
(d) Financial instruments, derivatives and hedging activity
The Company early adopted AASB 9 Financial Instruments from 1 January 2015 and implemented hedge accounting in late August 2015. Under hedge accounting, changes in the value of qualifying instruments during the hedging period are recognised in comprehensive income rather than recognised in the income statement as the previous policy of the Group. The change to hedge accounting is undertaken prospectively, with instruments held by the Group prior to the change accounted for in accordance with the previous policy.
The change in accounting policy allows the Company to manage risk in an effective manner, without the accounting treatment of the instruments distorting the reported results.
Information about the impairment of trade and other receivables, their credit quality and the Group’s exposure to credit risk can be found in (b) above.
Accounting policy - financial instruments
The Group classifies its financial assets in the following categories: financial assets at amortised cost, financial assets at fair value through profit or loss and hedging instruments. The classification depends on the purpose for which the financial assets were acquired, which is determined at initial recognition based upon the business model of the Group.
(i) Financial assets at amortised cost The Group classifies its financial assets as at amortised cost if the asset is held with the objective of collecting contractual cash flows and the contractual terms give
rise on specified dates to cash flows that are solely payments of principal and interest. These include trade receivables and bank term deposits. Bank term deposits are non-derivative financial assets with fixed or determinable payments that are not quoted in an active market. They are financial assets at amortised cost and are included in current assets, except for those with maturities greater than 12 months after the balance sheet date. Refer to Note 7 for details relating to trade receivables.
(ii) Financial assets through profit or loss Forward foreign exchange contracts are derivative instruments entered into by the Group for the purpose of managing foreign currency risk prior to late August 2015 which
do not qualify for hedge accounting. Derivatives are initially recognised at fair value on the date a derivative contract is entered into and are subsequently remeasured to their fair value at each reporting date.
Changes in the fair value of any derivative instrument that does not qualify for hedge accounting are recognised immediately in the income statement and are included in finance costs.
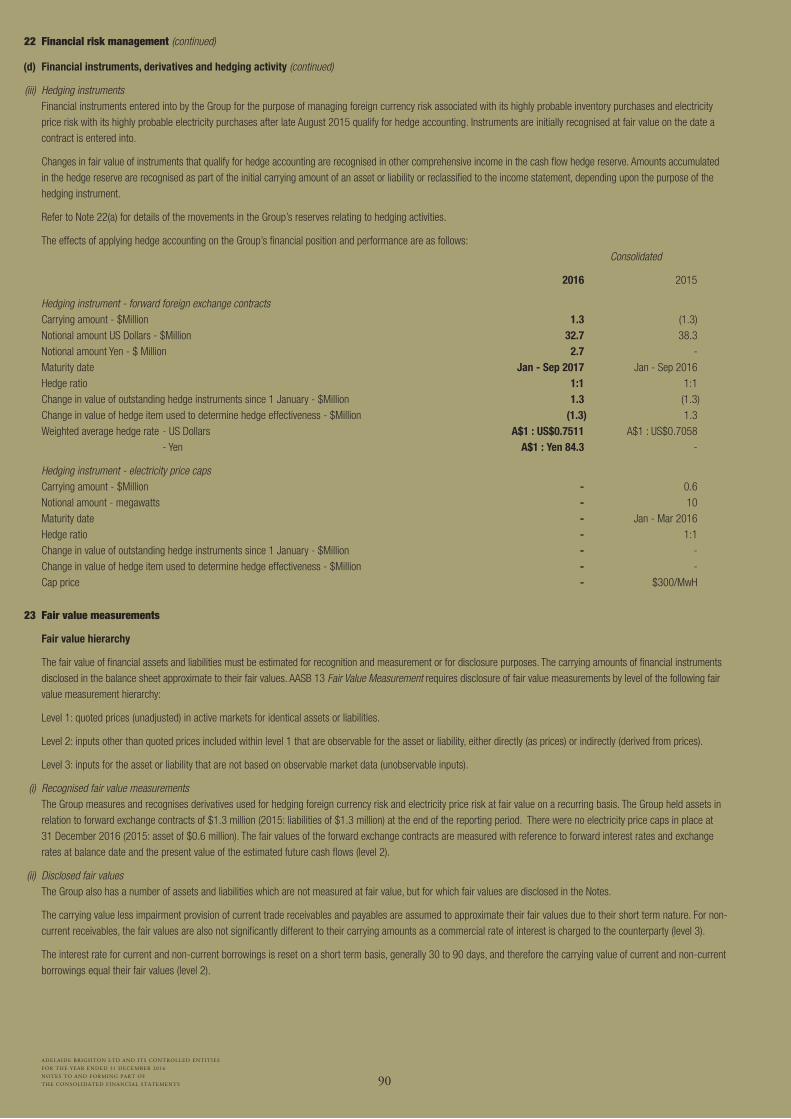
90
ADELAIDE BRIGHTON LTD AND ITS CONTROLLED ENTITIES
FOR THE YEAR ENDED 31 DECEMBER 2016
NOTES TO AND FORMING PART OF
THE CONSOLIDATED FINANCIAL STATEMENTS
22 Financial risk management (continued)
(d) Financial instruments, derivatives and hedging activity (continued)
(iii) Hedging instruments Financial instruments entered into by the Group for the purpose of managing foreign currency risk associated with its highly probable inventory purchases and electricity
price risk with its highly probable electricity purchases after late August 2015 qualify for hedge accounting. Instruments are initially recognised at fair value on the date a contract is entered into.
Changes in fair value of instruments that qualify for hedge accounting are recognised in other comprehensive income in the cash flow hedge reserve. Amounts accumulated in the hedge reserve are recognised as part of the initial carrying amount of an asset or liability or reclassified to the income statement, depending upon the purpose of the hedging instrument.
Refer to Note 22(a) for details of the movements in the Group’s reserves relating to hedging activities.
The effects of applying hedge accounting on the Group’s financial position and performance are as follows: Consolidated
2016 2015
Hedging instrument - forward foreign exchange contracts Carrying amount - $Million 1.3 (1.3) Notional amount US Dollars - $Million 32.7 38.3 Notional amount Yen - $ Million 2.7 - Maturity date Jan - Sep 2017 Jan - Sep 2016 Hedge ratio 1:1 1:1 Change in value of outstanding hedge instruments since 1 January - $Million 1.3 (1.3) Change in value of hedge item used to determine hedge effectiveness - $Million (1.3) 1.3 Weighted average hedge rate - US Dollars A$1 : US$0.7511 A$1 : US$0.7058 - Yen A$1 : Yen 84.3 -
Hedging instrument - electricity price caps Carrying amount - $Million - 0.6 Notional amount - megawatts - 10 Maturity date - Jan - Mar 2016 Hedge ratio - 1:1 Change in value of outstanding hedge instruments since 1 January - $Million - - Change in value of hedge item used to determine hedge effectiveness - $Million - - Cap price - $300/MwH
23 Fair value measurements
Fair value hierarchy
The fair value of financial assets and liabilities must be estimated for recognition and measurement or for disclosure purposes. The carrying amounts of financial instruments disclosed in the balance sheet approximate to their fair values. AASB 13 Fair Value Measurement requires disclosure of fair value measurements by level of the following fair value measurement hierarchy:
Level 1: quoted prices (unadjusted) in active markets for identical assets or liabilities.
Level 2: inputs other than quoted prices included within level 1 that are observable for the asset or liability, either directly (as prices) or indirectly (derived from prices).
Level 3: inputs for the asset or liability that are not based on observable market data (unobservable inputs).
(i) Recognised fair value measurements The Group measures and recognises derivatives used for hedging foreign currency risk and electricity price risk at fair value on a recurring basis. The Group held assets in
relation to forward exchange contracts of $1.3 million (2015: liabilities of $1.3 million) at the end of the reporting period. There were no electricity price caps in place at 31 December 2016 (2015: asset of $0.6 million). The fair values of the forward exchange contracts are measured with reference to forward interest rates and exchange rates at balance date and the present value of the estimated future cash flows (level 2).
(ii) Disclosed fair values The Group also has a number of assets and liabilities which are not measured at fair value, but for which fair values are disclosed in the Notes.
The carrying value less impairment provision of current trade receivables and payables are assumed to approximate their fair values due to their short term nature. For non-current receivables, the fair values are also not significantly different to their carrying amounts as a commercial rate of interest is charged to the counterparty (level 3).
The interest rate for current and non-current borrowings is reset on a short term basis, generally 30 to 90 days, and therefore the carrying value of current and non-current borrowings equal their fair values (level 2).

91
ADELAIDE BRIGHTON LTD AND ITS CONTROLLED ENTITIES
FOR THE YEAR ENDED 31 DECEMBER 2016
NOTES TO AND FORMING PART OF
THE CONSOLIDATED FINANCIAL STATEMENTS
24 Contingencies
Details and estimates of maximum amounts of contingent liabilities are as follows: Consolidated
($ Million) 2016 2015
(a) Guarantees
Bank guarantees 24.1 22.3
(b) Litigation
At the time of preparing this financial report some companies included in the Group are parties to pending legal proceedings, the outcome of which is not known. The entities are defending, or prosecuting, these proceedings. The Directors have assessed the impact on the Group from the individual actions.
No material losses are anticipated in respect of any of the above contingent liabilities.
25 Commitments for capital expenditure
Capital expenditure contracted for at the reporting date but not recognised as liabilities is as follows:
Within one year 12.6 29.6
26 Share-based payment plans
Accounting policy - share-based payments
Share-based compensation benefits are provided to executives via the Adelaide Brighton Limited Executive Performance Share Plan (“the Plan” or “EPSP”).
The fair value of Awards granted under the Plan is recognised as an employee benefit expense with a corresponding increase in equity. The fair value is measured at grant date and recognised over the period during which the employees become unconditionally entitled to the Awards.
The fair value at grant date is independently determined using a pricing model that takes into account the exercise price, the term of the Award, the vesting and performance criteria, the impact of dilution, the non-tradeable nature of the Award, the share price at grant date, the expected dividend yield and the risk-free interest rate for the term of the Award.
The fair value of the Awards granted excludes the impact of any non-market vesting conditions (e.g. earnings per share). Non-market vesting conditions are included in assumptions about the number of Awards that are expected to become exercisable. At each balance sheet date, the entity revises its estimate of the number of Awards that are expected to become exercisable. The employee benefit expense recognised each period takes into account the most recent estimate. The impact of the revision to original estimates, if any, is recognised in the income statement with a corresponding entry to equity.
The Plan is administered by the Adelaide Brighton employee share plan trust; see Note 1(b)(ii).
(a) Employee Share Plan
The establishment of the Adelaide Brighton Limited Employee Share Plan was approved by special resolution at the Annual General Meeting of the Company held on 19 November 1997. Subject to the Board approval of grants, all full time employees of the Company and its controlled entities who have been continuously employed by the Company or a controlled entity for a period of one year are eligible to participate in the Plan. Casual employees and contractors are not eligible to participate in the Plan.
No shares were issued under the Employee Share Plan during the year (2015 - nil). In subsequent years, the Board will decide whether, considering the profitability of the Company and the demands of the business, further invitations to take up grants of shares should be made.
(b) Executive Performance Share Plan
The Plan provides for grants of Awards to eligible executives. This plan was approved by shareholders at the Annual General Meeting held on 19 November 1997.
Under the Plan, eligible executives are granted Awards (each being an entitlement to a fully paid ordinary share of Adelaide Brighton Limited, subject to the satisfaction of performance conditions) on terms and conditions determined by the Board. On exercise of the Award following vesting, participants are issued shares of the Company. Detailed discussion of performance conditions is set out in the Remuneration Report on pages 42 to 60.
The exercise price for each Award is $nil. Consolidated
2016 2015
Movement in number of Awards outstanding Outstanding at beginning of the year 2,986,287 3,319,603 Granted 701,889 795,761 Forfeited - (510,997) Exercised (768,352) (618,080) Expired - -
Outstanding at the end of the year 2,919,824 2,986,287
Exercisable at the end of the year - -
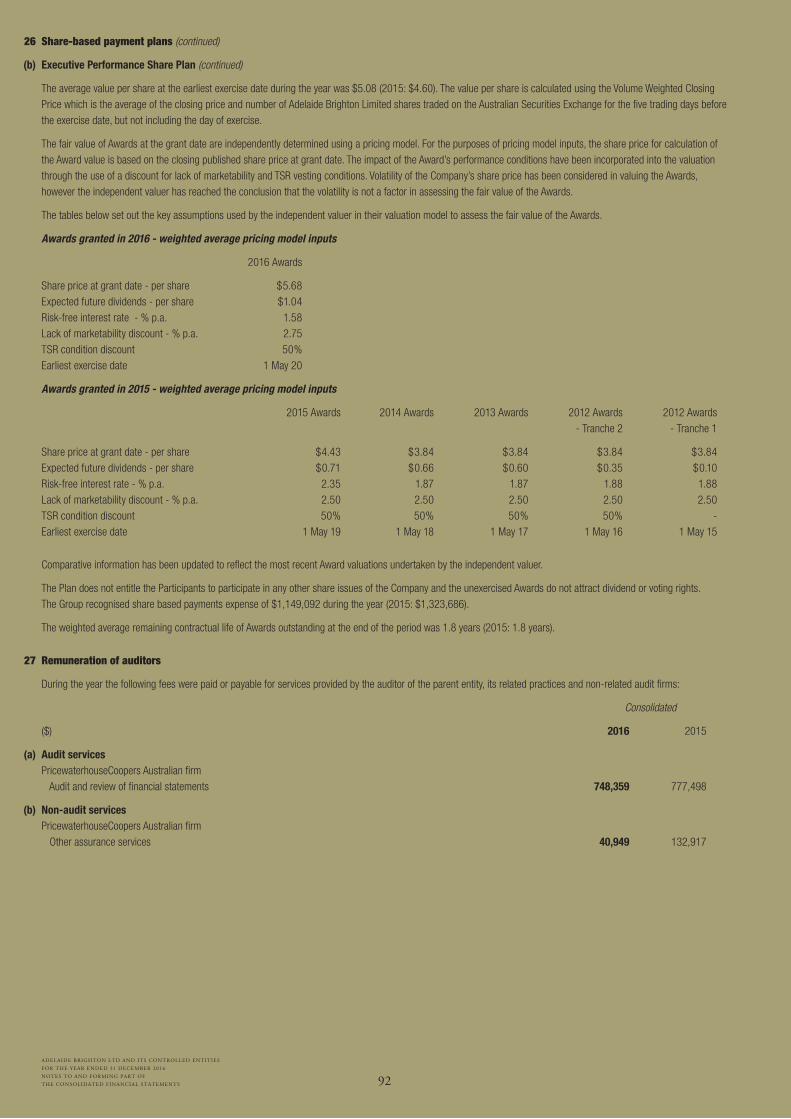
92
ADELAIDE BRIGHTON LTD AND ITS CONTROLLED ENTITIES
FOR THE YEAR ENDED 31 DECEMBER 2016
NOTES TO AND FORMING PART OF
THE CONSOLIDATED FINANCIAL STATEMENTS
26 Share-based payment plans (continued)
(b) Executive Performance Share Plan (continued)
The average value per share at the earliest exercise date during the year was $5.08 (2015: $4.60). The value per share is calculated using the Volume Weighted Closing Price which is the average of the closing price and number of Adelaide Brighton Limited shares traded on the Australian Securities Exchange for the five trading days before the exercise date, but not including the day of exercise.
The fair value of Awards at the grant date are independently determined using a pricing model. For the purposes of pricing model inputs, the share price for calculation of the Award value is based on the closing published share price at grant date. The impact of the Award’s performance conditions have been incorporated into the valuation through the use of a discount for lack of marketability and TSR vesting conditions. Volatility of the Company’s share price has been considered in valuing the Awards, however the independent valuer has reached the conclusion that the volatility is not a factor in assessing the fair value of the Awards.
The tables below set out the key assumptions used by the independent valuer in their valuation model to assess the fair value of the Awards.
Awards granted in 2016 - weighted average pricing model inputs
2016 Awards
Share price at grant date - per share $5.68 Expected future dividends - per share $1.04 Risk-free interest rate - % p.a. 1.58 Lack of marketability discount - % p.a. 2.75 TSR condition discount 50% Earliest exercise date 1 May 20
Awards granted in 2015 - weighted average pricing model inputs
2015 Awards 2014 Awards 2013 Awards 2012 Awards 2012 Awards - Tranche 2 - Tranche 1
Share price at grant date - per share $4.43 $3.84 $3.84 $3.84 $3.84 Expected future dividends - per share $0.71 $0.66 $0.60 $0.35 $0.10 Risk-free interest rate - % p.a. 2.35 1.87 1.87 1.88 1.88 Lack of marketability discount - % p.a. 2.50 2.50 2.50 2.50 2.50 TSR condition discount 50% 50% 50% 50% - Earliest exercise date 1 May 19 1 May 18 1 May 17 1 May 16 1 May 15
Comparative information has been updated to reflect the most recent Award valuations undertaken by the independent valuer.
The Plan does not entitle the Participants to participate in any other share issues of the Company and the unexercised Awards do not attract dividend or voting rights. The Group recognised share based payments expense of $1,149,092 during the year (2015: $1,323,686).
The weighted average remaining contractual life of Awards outstanding at the end of the period was 1.8 years (2015: 1.8 years).
27 Remuneration of auditors
During the year the following fees were paid or payable for services provided by the auditor of the parent entity, its related practices and non-related audit firms:
Consolidated
($) 2016 2015
(a) Audit services PricewaterhouseCoopers Australian firm Audit and review of financial statements 748,359 777,498
(b) Non-audit services PricewaterhouseCoopers Australian firm Other assurance services 40,949 132,917
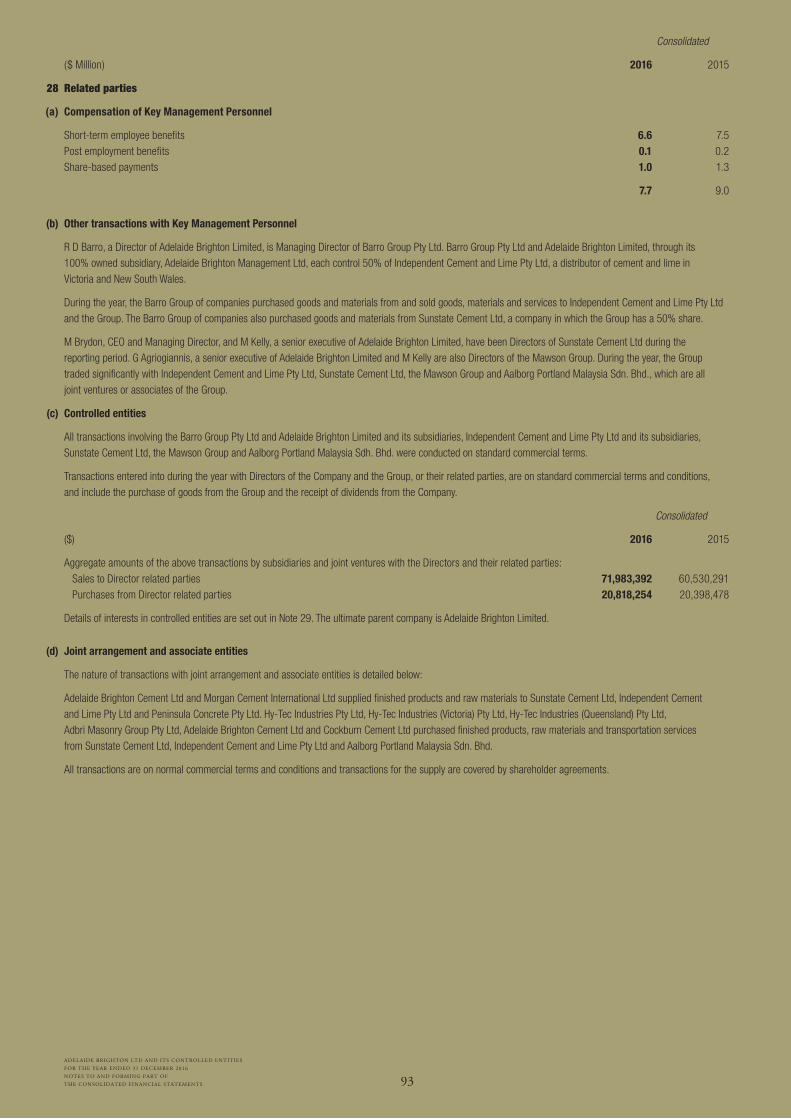
93
ADELAIDE BRIGHTON LTD AND ITS CONTROLLED ENTITIES
FOR THE YEAR ENDED 31 DECEMBER 2016
NOTES TO AND FORMING PART OF
THE CONSOLIDATED FINANCIAL STATEMENTS
Consolidated
($ Million) 2016 2015
28 Related parties
(a) Compensation of Key Management Personnel
Short-term employee benefits 6.6 7.5 Post employment benefits 0.1 0.2 Share-based payments 1.0 1.3
7.7 9.0
(b) Other transactions with Key Management Personnel
R D Barro, a Director of Adelaide Brighton Limited, is Managing Director of Barro Group Pty Ltd. Barro Group Pty Ltd and Adelaide Brighton Limited, through its 100% owned subsidiary, Adelaide Brighton Management Ltd, each control 50% of Independent Cement and Lime Pty Ltd, a distributor of cement and lime in Victoria and New South Wales.
During the year, the Barro Group of companies purchased goods and materials from and sold goods, materials and services to Independent Cement and Lime Pty Ltd and the Group. The Barro Group of companies also purchased goods and materials from Sunstate Cement Ltd, a company in which the Group has a 50% share.
M Brydon, CEO and Managing Director, and M Kelly, a senior executive of Adelaide Brighton Limited, have been Directors of Sunstate Cement Ltd during the reporting period. G Agriogiannis, a senior executive of Adelaide Brighton Limited and M Kelly are also Directors of the Mawson Group. During the year, the Group traded significantly with Independent Cement and Lime Pty Ltd, Sunstate Cement Ltd, the Mawson Group and Aalborg Portland Malaysia Sdn. Bhd., which are all joint ventures or associates of the Group.
(c) Controlled entities
All transactions involving the Barro Group Pty Ltd and Adelaide Brighton Limited and its subsidiaries, Independent Cement and Lime Pty Ltd and its subsidiaries, Sunstate Cement Ltd, the Mawson Group and Aalborg Portland Malaysia Sdh. Bhd. were conducted on standard commercial terms.
Transactions entered into during the year with Directors of the Company and the Group, or their related parties, are on standard commercial terms and conditions, and include the purchase of goods from the Group and the receipt of dividends from the Company.
Consolidated
($) 2016 2015
Aggregate amounts of the above transactions by subsidiaries and joint ventures with the Directors and their related parties: Sales to Director related parties 71,983,392 60,530,291 Purchases from Director related parties 20,818,254 20,398,478
Details of interests in controlled entities are set out in Note 29. The ultimate parent company is Adelaide Brighton Limited.
(d) Joint arrangement and associate entities
The nature of transactions with joint arrangement and associate entities is detailed below:
Adelaide Brighton Cement Ltd and Morgan Cement International Ltd supplied finished products and raw materials to Sunstate Cement Ltd, Independent Cement and Lime Pty Ltd and Peninsula Concrete Pty Ltd. Hy-Tec Industries Pty Ltd, Hy-Tec Industries (Victoria) Pty Ltd, Hy-Tec Industries (Queensland) Pty Ltd, Adbri Masonry Group Pty Ltd, Adelaide Brighton Cement Ltd and Cockburn Cement Ltd purchased finished products, raw materials and transportation services from Sunstate Cement Ltd, Independent Cement and Lime Pty Ltd and Aalborg Portland Malaysia Sdn. Bhd.
All transactions are on normal commercial terms and conditions and transactions for the supply are covered by shareholder agreements.

94
ADELAIDE BRIGHTON LTD AND ITS CONTROLLED ENTITIES
FOR THE YEAR ENDED 31 DECEMBER 2016
NOTES TO AND FORMING PART OF
THE CONSOLIDATED FINANCIAL STATEMENTS
28 Related parties (continued) Consolidated
($’000) 2016 2015
(e) Transactions with related parties
The following transactions occurred with related parties:
Sales of goods - Joint venture entities 242,702 223,705 Purchases of materials and goods - Joint venture entities 84,375 76,491 - Associate entities 8,142 11,803 Interest revenue - Joint venture entities 719 762 Dividend and distribution income - Joint venture entities 18,582 16,227 Superannuation contributions - Contributions to superannuation funds on behalf of employees 12,707 12,189 Loans advanced to/(from): Joint venture entities 2,046 940
(f) Outstanding balances arising from sales/purchases of goods and services
The following balances are outstanding at the reporting date in relation to transactions with related parties:
Current receivables - Joint venture entities (interest) 338 345 - Joint venture entities (trade) 28,041 28,962 Non-current receivables - Joint venture entities (loans) 31,917 30,212 Current payables - Joint venture entities (trade) 3,686 2,243
Outstanding balances are unsecured and repayable in cash. No provisions for doubtful receivables have been raised in relation to any outstanding balances.
(g) Loans to related parties
A loan to a joint venture entity, Independent Cement and Lime Pty Ltd, has interest charged at commercial rates on the outstanding balance. Interest revenue brought to account by the Group during the reporting year on this loan was $718,972 (2015: $762,637).
29 Subsidiaries and transactions with non-controlling interests
The Group’s material subsidiaries at 31 December are set out below. The subsidiaries have share capital consisting solely of ordinary shares, which are held directly by the Group, and the proportion of ownership interests held equals to the voting rights held by the Group. The country of incorporation or registration is also their principal place of business.
Ownership interest held by the Group
Place of Class of 2016 2015 Name of entity incorporation shares % %
Adbri Masonry Group Pty Ltd Australia Ord 100 100 Adbri Masonry Pty Ltd Australia Ord 100 100 Adelaide Brighton Cement Investments Pty Ltd Australia Ord 100 100 Adelaide Brighton Cement Ltd Australia Ord 100 100 Adelaide Brighton Management Ltd Australia Ord 100 100 Aus-10 Rhyolite Pty Ltd Australia Ord 100 100 Cockburn Cement Ltd Australia Ord 100 100 Exmouth Limestone Pty Ltd Australia Ord 51 51 Hurd Haulage Pty Ltd Australia Ord 100 100 Hy-Tec Industries Pty Ltd Australia Ord 100 100 Hy-Tec Industries (Queensland) Pty Ltd Australia Ord 100 100 Hy-Tec Industries (Victoria) Pty Ltd Australia Ord 100 100 Morgan Cement International Pty Ltd Australia Ord 100 100 Northern Cement Ltd Australia Ord 100 100 Premier Resources Ltd Australia Ord 100 100 Screenings Pty Ltd Australia Ord 100 100 Southern Quarries Pty Ltd Australia Ord 100 100
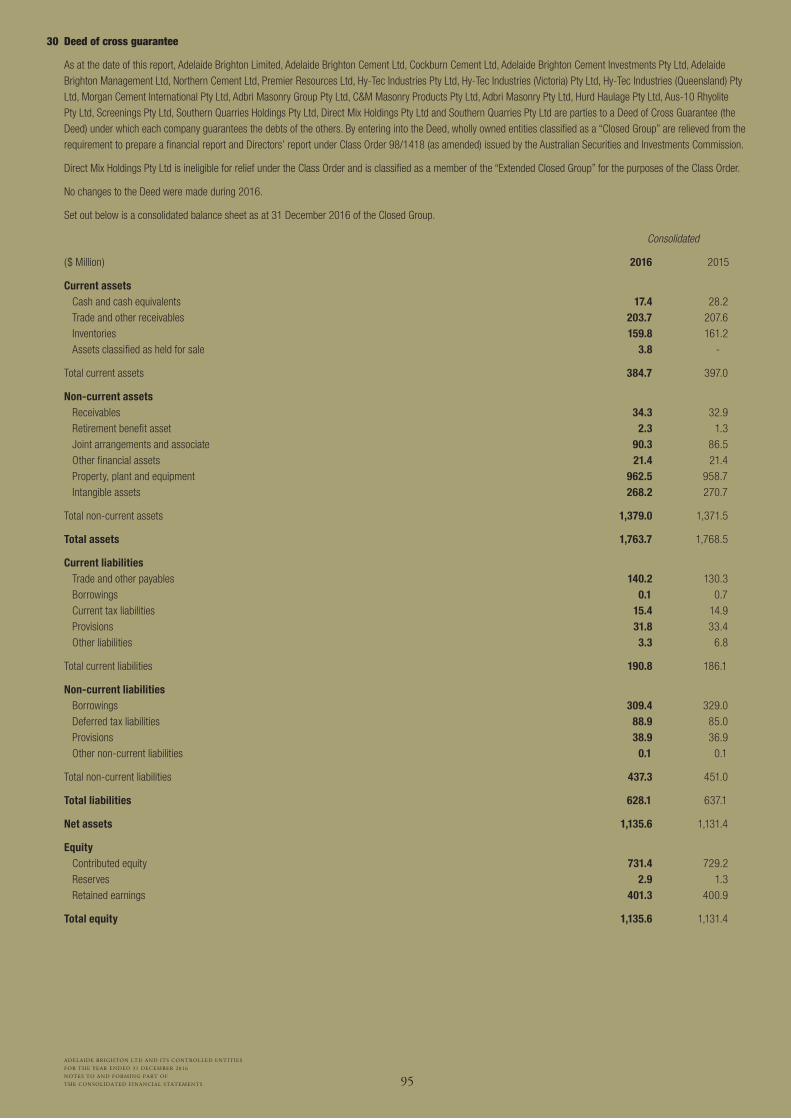
95
ADELAIDE BRIGHTON LTD AND ITS CONTROLLED ENTITIES
FOR THE YEAR ENDED 31 DECEMBER 2016
NOTES TO AND FORMING PART OF
THE CONSOLIDATED FINANCIAL STATEMENTS
30 Deed of cross guarantee
As at the date of this report, Adelaide Brighton Limited, Adelaide Brighton Cement Ltd, Cockburn Cement Ltd, Adelaide Brighton Cement Investments Pty Ltd, Adelaide Brighton Management Ltd, Northern Cement Ltd, Premier Resources Ltd, Hy-Tec Industries Pty Ltd, Hy-Tec Industries (Victoria) Pty Ltd, Hy-Tec Industries (Queensland) Pty Ltd, Morgan Cement International Pty Ltd, Adbri Masonry Group Pty Ltd, C&M Masonry Products Pty Ltd, Adbri Masonry Pty Ltd, Hurd Haulage Pty Ltd, Aus-10 Rhyolite Pty Ltd, Screenings Pty Ltd, Southern Quarries Holdings Pty Ltd, Direct Mix Holdings Pty Ltd and Southern Quarries Pty Ltd are parties to a Deed of Cross Guarantee (the Deed) under which each company guarantees the debts of the others. By entering into the Deed, wholly owned entities classified as a “Closed Group” are relieved from the requirement to prepare a financial report and Directors’ report under Class Order 98/1418 (as amended) issued by the Australian Securities and Investments Commission.
Direct Mix Holdings Pty Ltd is ineligible for relief under the Class Order and is classified as a member of the “Extended Closed Group” for the purposes of the Class Order.
No changes to the Deed were made during 2016.
Set out below is a consolidated balance sheet as at 31 December 2016 of the Closed Group.
Consolidated
($ Million) 2016 2015
Current assets Cash and cash equivalents 17.4 28.2 Trade and other receivables 203.7 207.6 Inventories 159.8 161.2 Assets classified as held for sale 3.8 -
Total current assets 384.7 397.0
Non-current assets Receivables 34.3 32.9 Retirement benefit asset 2.3 1.3 Joint arrangements and associate 90.3 86.5 Other financial assets 21.4 21.4 Property, plant and equipment 962.5 958.7 Intangible assets 268.2 270.7
Total non-current assets 1,379.0 1,371.5
Total assets 1,763.7 1,768.5
Current liabilities Trade and other payables 140.2 130.3 Borrowings 0.1 0.7 Current tax liabilities 15.4 14.9 Provisions 31.8 33.4 Other liabilities 3.3 6.8
Total current liabilities 190.8 186.1
Non-current liabilities Borrowings 309.4 329.0 Deferred tax liabilities 88.9 85.0 Provisions 38.9 36.9 Other non-current liabilities 0.1 0.1
Total non-current liabilities 437.3 451.0
Total liabilities 628.1 637.1
Net assets 1,135.6 1,131.4
Equity Contributed equity 731.4 729.2 Reserves 2.9 1.3 Retained earnings 401.3 400.9
Total equity 1,135.6 1,131.4
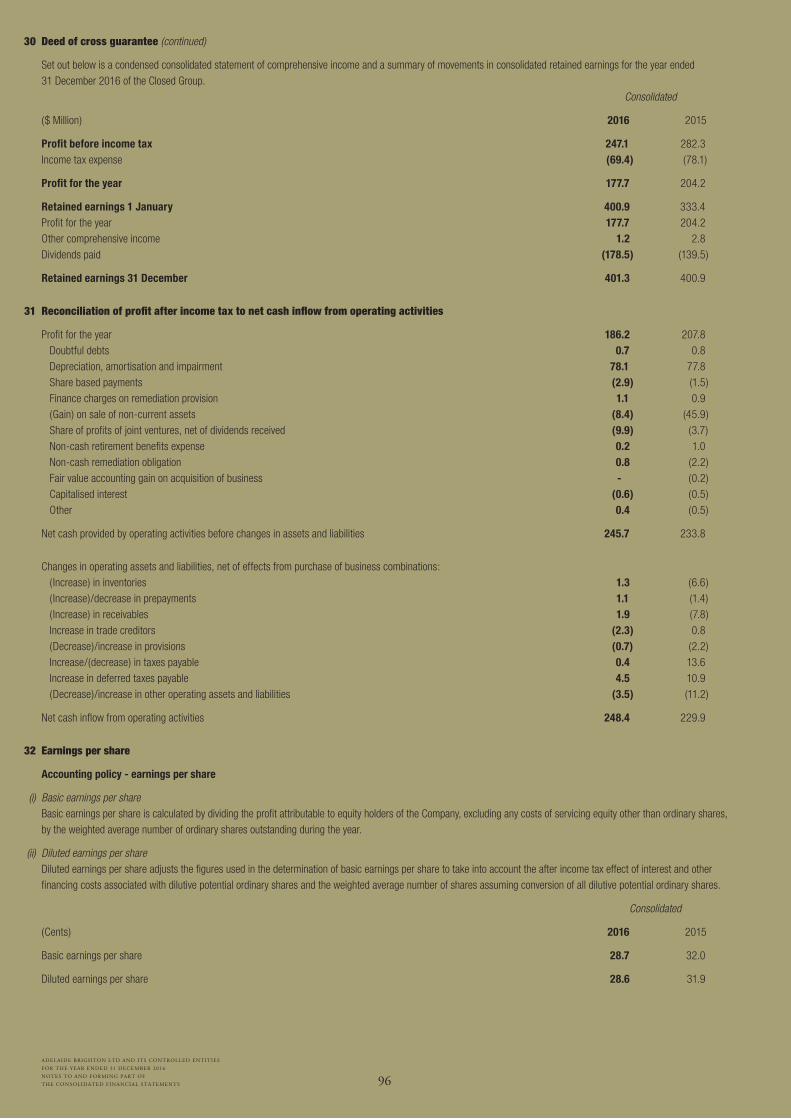
96
ADELAIDE BRIGHTON LTD AND ITS CONTROLLED ENTITIES
FOR THE YEAR ENDED 31 DECEMBER 2016
NOTES TO AND FORMING PART OF
THE CONSOLIDATED FINANCIAL STATEMENTS
30 Deed of cross guarantee (continued)
Set out below is a condensed consolidated statement of comprehensive income and a summary of movements in consolidated retained earnings for the year ended 31 December 2016 of the Closed Group.
Consolidated
($ Million) 2016 2015
Profit before income tax 247.1 282.3 Income tax expense (69.4) (78.1)
Profit for the year 177.7 204.2
Retained earnings 1 January 400.9 333.4 Profit for the year 177.7 204.2 Other comprehensive income 1.2 2.8 Dividends paid (178.5) (139.5)
Retained earnings 31 December 401.3 400.9
31 Reconciliation of profit after income tax to net cash inflow from operating activities
Profit for the year 186.2 207.8 Doubtful debts 0.7 0.8 Depreciation, amortisation and impairment 78.1 77.8 Share based payments (2.9) (1.5) Finance charges on remediation provision 1.1 0.9 (Gain) on sale of non-current assets (8.4) (45.9) Share of profits of joint ventures, net of dividends received (9.9) (3.7) Non-cash retirement benefits expense 0.2 1.0 Non-cash remediation obligation 0.8 (2.2) Fair value accounting gain on acquisition of business - (0.2) Capitalised interest (0.6) (0.5) Other 0.4 (0.5)
Net cash provided by operating activities before changes in assets and liabilities 245.7 233.8
Changes in operating assets and liabilities, net of effects from purchase of business combinations: ( Increase) in inventories 1.3 (6.6) ( Increase)/decrease in prepayments 1.1 (1.4) ( Increase) in receivables 1.9 (7.8) Increase in trade creditors (2.3) 0.8 (Decrease)/increase in provisions (0.7) (2.2) Increase/(decrease) in taxes payable 0.4 13.6 Increase in deferred taxes payable 4.5 10.9 (Decrease)/increase in other operating assets and liabilities (3.5) (11.2)
Net cash inflow from operating activities 248.4 229.9
32 Earnings per share
Accounting policy - earnings per share
(i) Basic earnings per share Basic earnings per share is calculated by dividing the profit attributable to equity holders of the Company, excluding any costs of servicing equity other than ordinary shares,
by the weighted average number of ordinary shares outstanding during the year.
(ii) Diluted earnings per share Diluted earnings per share adjusts the figures used in the determination of basic earnings per share to take into account the after income tax effect of interest and other
financing costs associated with dilutive potential ordinary shares and the weighted average number of shares assuming conversion of all dilutive potential ordinary shares.
Consolidated
(Cents) 2016 2015
Basic earnings per share 28.7 32.0
Diluted earnings per share 28.6 31.9

97
ADELAIDE BRIGHTON LTD AND ITS CONTROLLED ENTITIES
FOR THE YEAR ENDED 31 DECEMBER 2016
NOTES TO AND FORMING PART OF
THE CONSOLIDATED FINANCIAL STATEMENTS
32 Earnings per share (continued) Consolidated
(Number) 2016 2015
Weighted average number of shares used as the denominator Weighted average number of ordinary shares used as the denominator in calculating basic earnings per share 649,395,882 648,680,849 Adjustment for calculation of diluted earnings per share: Awards 2,919,824 2,986,287
Weighted average number of ordinary shares and potential ordinary shares used as the denominator in calculating diluted earnings per share 652,315,706 651,667,136
Consolidated
($ Million) 2016 2015
Reconciliation of earnings used in calculating earnings per share Basic and diluted earnings per share Profit after tax 186.2 207.8 Loss/(profit) attributable to non-controlling interests 0.1 0.1
Profit attributable to ordinary equity holders of the Company used in calculating basic and diluted earnings per share 186.3 207.9
33 Segment reporting
(a) Description of segments
Management has determined the operating segments based on the reports reviewed by the CEO and Managing Director. These reports include segmental information on the basis of product groups and are used to regularly evaluate how to allocate resources and in assessing performance.
The two reportable segments have been identified as follows: > Cement, Lime, Concrete and Aggregates > Concrete Products
The operating segments Cement, Lime, Concrete and Aggregates individually meet the quantitative thresholds required by AASB 8 as well as meeting the aggregation criteria allowing them to be reported as one segment. The Group considered aggregation of these segments appropriate due to the similarity of the markets that the products are sold, the consistent regulatory environment for the production, handling and use of the products, distribution method and underlying demand drivers. Concrete Products meets the quantitative threshold therefore is reported as a separate segment. Joint arrangements and associates related to the reportable segments form part of the above two reportable segments.
The major end-use markets of the Group’s products include residential and non-residential construction, engineering construction, alumina production and mining.
(b) Segment information provided to the CEO and Managing Director
The segment information provided to the CEO and Managing Director for the reportable segments is as follows:
31 December 2016
Cement, Lime, Concrete and Concrete
($ Million) Aggregates Products Unallocated Total
Total segment operating revenue 1,573.5 149.2 - 1,722.7 Inter-Company revenue (74.9) - - (74.9)
Revenue from external customers 1,498.6 149.2 - 1,647.8 Depreciation and amortisation (65.1) (8.4) (4.6) (78.1) EBIT 287.8 11.4 (33.1) 266.1 Share of net profits of joint venture and associate entities accounted for using the equity method 28.5 - - 28.5
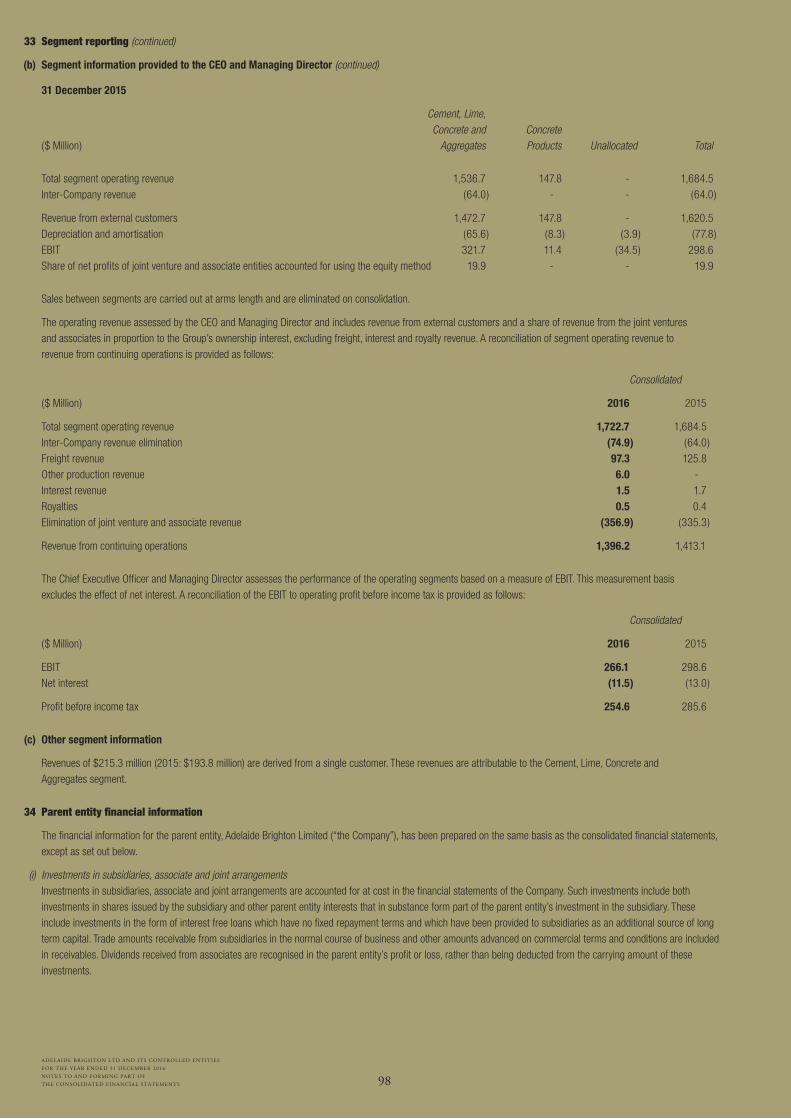
98
ADELAIDE BRIGHTON LTD AND ITS CONTROLLED ENTITIES
FOR THE YEAR ENDED 31 DECEMBER 2016
NOTES TO AND FORMING PART OF
THE CONSOLIDATED FINANCIAL STATEMENTS
33 Segment reporting (continued)
(b) Segment information provided to the CEO and Managing Director (continued)
31 December 2015
Cement, Lime, Concrete and Concrete
($ Million) Aggregates Products Unallocated Total
Total segment operating revenue 1,536.7 147.8 - 1,684.5 Inter-Company revenue (64.0) - - (64.0)
Revenue from external customers 1,472.7 147.8 - 1,620.5 Depreciation and amortisation (65.6) (8.3) (3.9) (77.8) EBIT 321.7 11.4 (34.5) 298.6 Share of net profits of joint venture and associate entities accounted for using the equity method 19.9 - - 19.9
Sales between segments are carried out at arms length and are eliminated on consolidation.
The operating revenue assessed by the CEO and Managing Director and includes revenue from external customers and a share of revenue from the joint ventures and associates in proportion to the Group’s ownership interest, excluding freight, interest and royalty revenue. A reconciliation of segment operating revenue to revenue from continuing operations is provided as follows:
Consolidated
($ Million) 2016 2015
Total segment operating revenue 1,722.7 1,684.5 Inter-Company revenue elimination (74.9) (64.0) Freight revenue 97.3 125.8 Other production revenue 6.0 - Interest revenue 1.5 1.7 Royalties 0.5 0.4 Elimination of joint venture and associate revenue (356.9) (335.3)
Revenue from continuing operations 1,396.2 1,413.1
The Chief Executive Officer and Managing Director assesses the performance of the operating segments based on a measure of EBIT. This measurement basis excludes the effect of net interest. A reconciliation of the EBIT to operating profit before income tax is provided as follows:
Consolidated
($ Million) 2016 2015
EBIT 266.1 298.6 Net interest (11.5) (13.0)
Profit before income tax 254.6 285.6
(c) Other segment information
Revenues of $215.3 million (2015: $193.8 million) are derived from a single customer. These revenues are attributable to the Cement, Lime, Concrete and Aggregates segment.
34 Parent entity financial information
The financial information for the parent entity, Adelaide Brighton Limited (“the Company”), has been prepared on the same basis as the consolidated financial statements, except as set out below.
(i) Investments in subsidiaries, associate and joint arrangements Investments in subsidiaries, associate and joint arrangements are accounted for at cost in the financial statements of the Company. Such investments include both
investments in shares issued by the subsidiary and other parent entity interests that in substance form part of the parent entity’s investment in the subsidiary. These include investments in the form of interest free loans which have no fixed repayment terms and which have been provided to subsidiaries as an additional source of long term capital. Trade amounts receivable from subsidiaries in the normal course of business and other amounts advanced on commercial terms and conditions are included in receivables. Dividends received from associates are recognised in the parent entity’s profit or loss, rather than being deducted from the carrying amount of these investments.
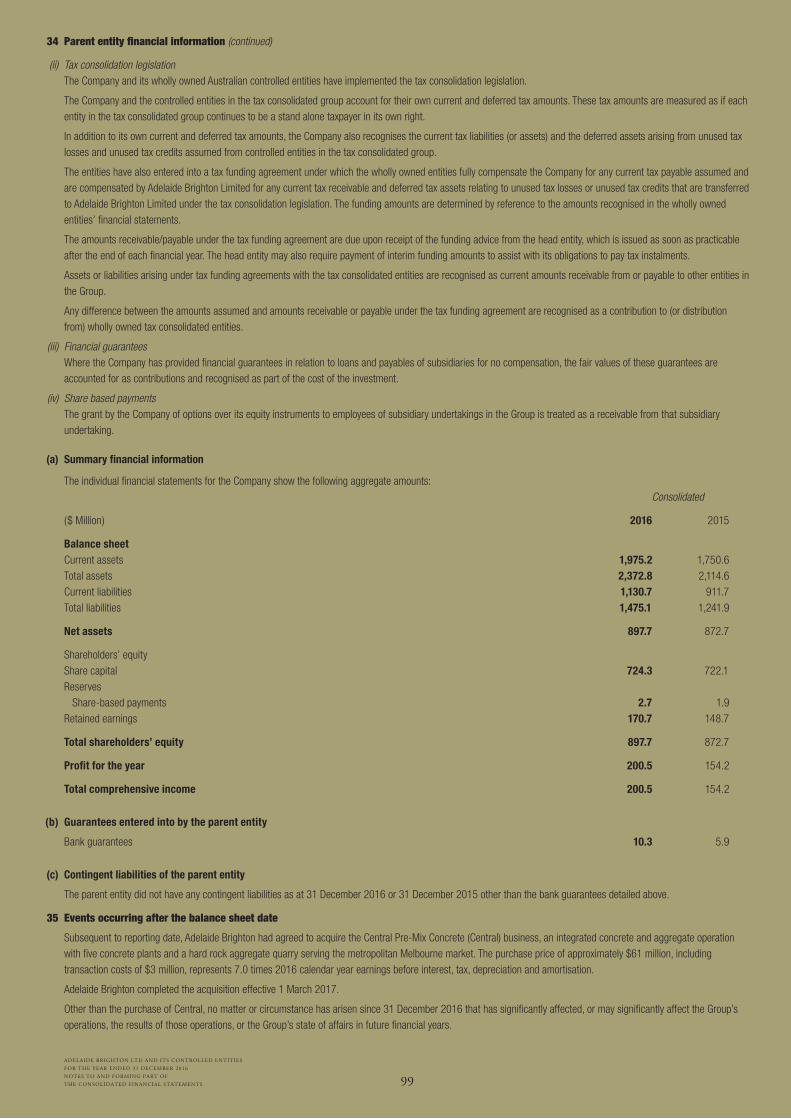
99
ADELAIDE BRIGHTON LTD AND ITS CONTROLLED ENTITIES
FOR THE YEAR ENDED 31 DECEMBER 2016
NOTES TO AND FORMING PART OF
THE CONSOLIDATED FINANCIAL STATEMENTS
34 Parent entity financial information (continued)
(ii) Tax consolidation legislation The Company and its wholly owned Australian controlled entities have implemented the tax consolidation legislation.
The Company and the controlled entities in the tax consolidated group account for their own current and deferred tax amounts. These tax amounts are measured as if each entity in the tax consolidated group continues to be a stand alone taxpayer in its own right.
In addition to its own current and deferred tax amounts, the Company also recognises the current tax liabilities (or assets) and the deferred assets arising from unused tax losses and unused tax credits assumed from controlled entities in the tax consolidated group.
The entities have also entered into a tax funding agreement under which the wholly owned entities fully compensate the Company for any current tax payable assumed and are compensated by Adelaide Brighton Limited for any current tax receivable and deferred tax assets relating to unused tax losses or unused tax credits that are transferred to Adelaide Brighton Limited under the tax consolidation legislation. The funding amounts are determined by reference to the amounts recognised in the wholly owned entities’ financial statements.
The amounts receivable/payable under the tax funding agreement are due upon receipt of the funding advice from the head entity, which is issued as soon as practicable after the end of each financial year. The head entity may also require payment of interim funding amounts to assist with its obligations to pay tax instalments.
Assets or liabilities arising under tax funding agreements with the tax consolidated entities are recognised as current amounts receivable from or payable to other entities in the Group.
Any difference between the amounts assumed and amounts receivable or payable under the tax funding agreement are recognised as a contribution to (or distribution from) wholly owned tax consolidated entities.
(iii) Financial guarantees Where the Company has provided financial guarantees in relation to loans and payables of subsidiaries for no compensation, the fair values of these guarantees are
accounted for as contributions and recognised as part of the cost of the investment.
(iv) Share based payments The grant by the Company of options over its equity instruments to employees of subsidiary undertakings in the Group is treated as a receivable from that subsidiary
undertaking.
(a) Summary financial information
The individual financial statements for the Company show the following aggregate amounts: Consolidated
($ Million) 2016 2015
Balance sheet Current assets 1,975.2 1,750.6 Total assets 2,372.8 2,114.6 Current liabilities 1,130.7 911.7 Total liabilities 1,475.1 1,241.9
Net assets 897.7 872.7
Shareholders’ equity Share capital 724.3 722.1 Reserves Share-based payments 2.7 1.9 Retained earnings 170.7 148.7
Total shareholders’ equity 897.7 872.7
Profit for the year 200.5 154.2
Total comprehensive income 200.5 154.2
(b) Guarantees entered into by the parent entity
Bank guarantees 10.3 5.9
(c) Contingent liabilities of the parent entity
The parent entity did not have any contingent liabilities as at 31 December 2016 or 31 December 2015 other than the bank guarantees detailed above.
35 Events occurring after the balance sheet date
Subsequent to reporting date, Adelaide Brighton had agreed to acquire the Central Pre-Mix Concrete (Central) business, an integrated concrete and aggregate operation with five concrete plants and a hard rock aggregate quarry serving the metropolitan Melbourne market. The purchase price of approximately $61 million, including transaction costs of $3 million, represents 7.0 times 2016 calendar year earnings before interest, tax, depreciation and amortisation.
Adelaide Brighton completed the acquisition effective 1 March 2017.
Other than the purchase of Central, no matter or circumstance has arisen since 31 December 2016 that has significantly affected, or may significantly affect the Group’s operations, the results of those operations, or the Group’s state of affairs in future financial years.
100ADELAIDE BRIGHTON LTD AND ITS CONTROLLED ENTITIES
FOR THE YEAR ENDED 31 DECEMBER 2016
In the Directors’ opinion:
(a) the financial statements and notes set out on pages 61 to 99 are in accordance with the Corporations Act 2001, including:
(i) complying with Accounting Standards, the Corporations Regulations 2001 and other mandatory professional reporting requirements; and
(ii) giving a true and fair view of the consolidated entity’s financial position as at 31 December 2016 and of its performance for the financial year ended on that date; and
(b) there are reasonable grounds to believe that the Company will be able to pay its debts as and when they become due and payable; and
(c) at the date of this declaration, there are reasonable grounds to believe that the members of the Extended Closed Group identified in Note 30 will be able to meet any obligations or liabilities to which they are, or may become, subject by virtue of the Deed of Cross Guarantee described in Note 30.
Note 1(a) confirms that the financial statements also comply with International Financial Reporting Standards as issued by the International Accounting Standards Board.
The Directors have been given the declarations by the Chief Executive Officer and Managing Director and Chief Financial Officer required by section 295A of the Corporations Act 2001.
This declaration is made in accordance with a resolution of the Directors.
M Brydon Director Dated 17 March 2017
Directors’ declaration Auditor’s independence declaration
Auditor’s independence declaration
As lead auditor for the audit of Adelaide Brighton Limited for the year ended 31 December 2016, I declare that to the best of my knowledge and belief, there have been:
(a) no contraventions of the auditor independence requirements of the Corporations Act 2001 in relation to the audit; and
(b) no contraventions of any applicable code of professional conduct in relation to the audit.
This declaration is in respect of Adelaide Brighton Limited and the entities it controlled during the period.
Kevin Reid, Partner PricewaterhouseCoopers
Adelaide 17 March 2017
Liability limited by a scheme approved under Professional Standards Legislation.
PricewaterhouseCoopers ABN 52 780 433 757 Level 11, 70 Franklin Street, Adelaide SA 5000 GPO Box 418, Adelaide SA 5001 Telephone +61 8 8218 7000 Facsimile +61 8 8218 7999 www.pwc.com.au
101ADELAIDE BRIGHTON LTD AND ITS CONTROLLED ENTITIES
FOR THE YEAR ENDED 31 DECEMBER 2016
Independent auditor’s report to the members of Adelaide Brighton Limited
Report on the audit of the financial report
Our opinion
In our opinion:
The accompanying financial report of Adelaide Brighton Limited (the Company) and its controlled entities (together, the Group) is in accordance with the Corporations Act 2001, including:
(a) giving a true and fair view of the Group’s financial position as at 31 December 2016 and of its financial performance for the year then ended
(b) complying with Australian Accounting Standards and the Corporations Regulations 2001.
What we have audited The Group’s financial report comprises: > the consolidated balance sheet as at
31 December 2016 > the consolidated income statement for the
year then ended > the consolidated statement of comprehensive
income for the year then ended > the consolidated statement of changes in equity
for the year then ended > the consolidated statement of cash flows for
the year then ended > the notes to the consolidated financial statements,
which include a summary of significant accounting policies
> the directors’ declaration.
Basis for opinion
We conducted our audit in accordance with Australian Auditing Standards. Our responsibilities under those standards are further described in the Auditor’s responsibilities for the audit of the financial report section of our report.
We believe that the audit evidence we have obtained is sufficient and appropriate to provide a basis for our opinion.
Independence We are independent of the Group in accordance
with the auditor independence requirements of the Corporations Act 2001 and the ethical requirements of the Accounting Professional and Ethical Standards Board’s APES 110 Code of Ethics for Professional Accountants (the Code) that are relevant to our audit of the financial report in Australia. We have also fulfilled our other ethical responsibilities in accordance with the Code.
Our audit approach
An audit is designed to provide reasonable assurance about whether the financial report is free from material misstatement. Misstatements may arise due to fraud or error. They are considered material if individually or in aggregate, they could reasonably be expected to influence the economic decisions of users taken on the basis of the financial report.
We tailored the scope of our audit to ensure that we performed enough work to be able to give an opinion on the financial report as a whole, taking into account the geographic and management structure of the Group, its accounting processes and controls and the industry in which it operates. As explained in the Directors’ Report, the Group has four distinct product groups, being Cement, Lime, Concrete and Aggregates and Concrete Products which operate across Australia. The Group also has interests in joint arrangements and associates.
Materiality
For the purpose of our audit we utilised an overall Group materiality of $12,700,000, representing approximately 5% of profit before tax of the Group, excluding the gain on sale of properties (property profits).
We applied this threshold, together with qualitative considerations, to determine the scope of our audit and the nature, timing and extent of our audit procedures and to evaluate the effect of misstatements on the financial report as a whole.
We chose profit before tax as the benchmark because, in our view, it is the metric against which the performance of the Group is most commonly measured and is a generally accepted benchmark. The gain on sale of properties (property profits) was removed from materiality calculations on the basis that these transactions are distinguishable from the continuing product trading activities of the Group.
We selected 5% based on our professional judgement noting that it is within the range of commonly acceptable profit related thresholds.
Audit scope
Our audit focused on where the directors made subjective judgements; for example, significant accounting estimates involving making assumptions and considering inherently uncertain future events.
We conducted an audit of the most significant components being Cement and Lime (primarily focusing on the South Australian and Western Australian businesses which comprise the bulk of these operations) and Concrete and Aggregates, which, in our view, were financially significant to the financial report.
Additionally, we performed specific risk focused audit procedures in relation to the Group’s Cement and Lime components in the Northern Territory and New South Wales, and Concrete Products. The procedures varied across these operations and included procedures directed at revenue, debtors, inventory, fixed assets and journals. Audit procedures were also performed over the gain on sale of properties (property profits).
Of the Group’s interest in joint arrangements and associates, Independent Cement and Lime Pty Ltd and Sunstate Cement Ltd were the largest contributors to the Group’s share of net profits from jointventures and associates. As stated in the Joint Arrangements and Associates Note 10 to the financial report, these joint ventures have a balance sheet date of 30 June. Other auditors audited the financial reports for Independent Cement and Lime Pty Ltd and Sunstate Cement Ltd for the year ended 30 June 2016. We determined the level of involvement we needed to have to be able to conclude whether sufficient appropriate audit evidence had been obtained for our opinion on the Group financial report as a whole, including reviewing the work of these other auditors. Due to the different balance dates utilised by these joint ventures, we performed audit procedures for the period 1 July 2016 to (and as at) 31 December 2016, including substantive analytical procedures over the financial results, to obtain sufficient evidence in respect of the results for the year ended and financial position as at 31 December 2016 for our opinion.
Outside the operations identified above, the Group includes components which individually and collectively do not contribute materially to the overall Group result. We have obtained an understanding of these operations and performed analytical procedures.

102ADELAIDE BRIGHTON LTD AND ITS CONTROLLED ENTITIES
FOR THE YEAR ENDED 31 DECEMBER 2016
Key audit matters
Amongst other relevant topics, we communicated the following key audit matters to the Audit and Risk Committee: > Recoverability of goodwill and tangible assets > Estimation of rehabilitation provisions > Measurement of inventory quantities
These are further described in the Key audit matters section of our report.
Key audit matters are those matters that, in our professional judgement, were of most significance in our audit of the financial report for the current period. The key audit matters were addressed in the context of our audit of the financial report as a whole, and in forming our opinion thereon, and we do not provide a separate opinion on these matters. Further, any commentary on the outcomes of a particular audit procedure is made in that context.
Key audit matter
Recoverability of goodwill and tangible assets
(Refer to notes 11 & 12)
The financial report for the Group includes property, plant and equipment of $978.4 million and goodwill of $248.7 million as at 31 December 2016.
In order to assess recoverability of these assets, the Group prepared financial models at 31 December 2016 to determine if the carrying values of goodwill and property, plant and equipment were supported by forecast future cash flows, discounted to present value (the models).
The appropriateness of the carrying amount of the goodwill and property, plant and equipment was a key audit matter due to:
> the significance of these asset balances to the financial position of the Group; and
> the Group’s assessment of the carrying amount involving judgements, such as budgeted cash flows, growth rates and discount rate.
How our audit addressed the key audit matter
We evaluated the Group’s cash flow forecasts and the process by which they were developed. We compared the 2017 forecast in the models to the Board approved budgets. We checked that prior year budgets have been materially consistent with actual performance to assess the Group’s ability to make reliable forecasts. We found that the Group’s previous forecasts had been materially accurate.
We compared growth rate assumptions with external forecasts for the industry and found the growth rate assumptions in the models to be consistent with these.
We performed a sensitivity analysis by recalculating the models using a range of reasonably possible alternative growth rates and discount rates assumptions. In particular, we applied the long term growth rate (or perpetual growth rate) from year 5 as opposed to year 20 (which was utilised by the Group). No impairment was identified from this analysis.
Management engaged an expert to assist them in determining the discount rates applied in the impairment models. We assessed them as management experts, and considered the experts’ method, competency and objectivity. Having done so, we were satisfied that we could rely on their work for the purpose of our audit.
We tested the components of the discount rates by comparison to independent sources.
Key audit matter
Estimation of rehabilitation provisions
(Refer to note 16)
The Group recognised rehabilitation provisions of $38.1 million in relation to the rehabilitation of presently operating quarries and concrete plants.
The rehabilitation provisions were a key audit matter because significant judgement is involved in assessing future costs and rehabilitation requirements for the estimation of the provision.
The rehabilitation provision for sites being actively remediated is material. The provision for rehabilitation costs for these sites reflected tendered cost estimates for future stages of rehabilitation.
For other quarries not currently being actively remediated, the provision is determined through annual cost estimates. The Group estimates future costs to rehabilitate each site (nominal cost), based on rehabilitation requirements, current costs and forecast cost inflation factors, and discounts these estimates to net present value. Cost inflation and discount rates are based on published government rates.
How our audit addressed the key audit matter
We obtained a listing of all quarries and concrete plants with a rehabilitation provision. We assessed whether a provision was included for all sites that required rehabilitation based on our knowledge of the operations, review of new lease contract agreements, review of meeting minutes and discussions with management. We did not identify any omissions.
We focussed our attention on sites where there had been a change to the nominal cost from previous periods, or where we would have expected there to be a change to the nominal cost based on our knowledge of the business. We identified that a number of sites had a change to the nominal cost to rehabilitate, however individually and in aggregate, these changes were not material. Focusing on those with a greater size and risk, we made inquiries as to why the change had occurred and corroborated this inquiry by obtaining supporting evidence, including contracts and quotes for decommissioning and rehabilitation costs, or evidence of costs incurred for similar sites.
Our procedures were more limited where there was no change in the underlying cost to rehabilitate, given (1) the movement in the provision year on year was due to the passing of time as opposed to a change in the future cost estimate and (2) we had tested the provision on initial recognition, or since the last significant change to nominal cost. We assessed whether the provisions had been updated to reflect any new knowledge gained from rehabilitation planned in other areas or changes in rehabilitation requirements.
For sites being actively remediated, we compared the movement in the provision recognised with external quotes for the next stage of work to be performed. We found the provision estimate was consistent with the external quotes. To assess the Group’s ability to estimate accurately, we also compared previous period’s estimates of costs to the actual costs and found no material differences.
103ADELAIDE BRIGHTON LTD AND ITS CONTROLLED ENTITIES
FOR THE YEAR ENDED 31 DECEMBER 2016
Key audit matter
Measurement of inventory quantities for finished goods, raw materials and work in progress
(Refer to note 8)
The Group had $160.2 million of inventory on hand at 31 December 2016, which included finished goods, raw materials and work in progress totalling $130.7 million. Raw materials and work in progress inventory is typically stockpiled prior to consumption or sale.
The measurement of inventory quantities for these inventory types was a key audit matter as the measurement process is relatively complex for parts of the Group. The Group relies on independent surveyors to perform volumetric surveys to estimate the quantities of certain stockpiled inventory utilising aerial and laser surveys. The Group converts the survey quantities, which are reported in cubic metres, to tonnages using density factors.
How our audit addressed the key audit matter
We assessed the independent surveyors as management experts, and for each expert considered the surveyor’s method, competency and objectivity. We were satisfied that we could rely on their work for the purpose of our audit.
We obtained and inspected the survey results for material stockpiled inventory locations. We reperformed the Group’s conversion of the quantities identified from the surveyors’ reports to tonnages using the Group’s internally assessed density factors.
We compared the density factors used to results of the Group’s internal laboratory testing that occurred during the year and (where available) to prior year density factors for the same raw material. Given the nature of the inventory, the density factors do not usually vary significantly year on year. We identified no significant changes in these factors in the current year or other factors which would require a change.
Other information
The directors are responsible for the other information. The other information included in the Group’s annual report for the year ended 31 December 2016 comprises the Director’s Report and Diversity Report (but does not include the financial report and our auditor’s report thereon), which we obtained prior to the date of this auditor’s report. The other information also includes the Performance Summary, Chairman’s Report, Managing Director and CEO Report, Finance Report, Map and Review of Operations, Sustainability Report, Financial History, Information for Shareholders and Corporate Governance Statement, which are expected to be made available to us after the date of this report.
Our opinion on the financial report does not cover the other information and accordingly we do and will not express any form of assurance conclusion thereon.
In connection with our audit of the financial report, our responsibility is to read the other information identified above and, in doing so, consider whether the other information is materially inconsistent with the financial report or our knowledge obtained in the audit, or otherwise appears to be materially misstated.
If, based on the work we have performed on the other information that we obtained prior to the date of this auditor’s report, we conclude that there is a material misstatement of this other information, we are required to report that fact. We have nothing to report in this regard.
When we read the other information not yet received as identified above, if we conclude that there is a material misstatement therein, we are required to communicate the matter to the directors and use our professional judgement to determine the appropriate action to take.
Responsibilities of the directors for the financial report
The directors of the Company are responsible for the preparation of the financial report that gives a true and fair view in accordance with Australian Accounting Standards and the Corporations Act 2001 and for such internal control as the directors determine is necessary to enable the preparation of the financial report that gives a true and fair view and is free from material misstatement, whether due to fraud or error.
In preparing the financial report, the directors are responsible for assessing the ability of the Group to continue as a going concern, disclosing, as applicable, matters related to going concern and using the going concern basis of accounting unless the directors either intend to liquidate the Group or to cease operations, or have no realistic alternative but to do so.
Auditor’s responsibilities for the audit of the financial report
Our objectives are to obtain reasonable assurance about whether the financial report as a whole is free from material misstatement, whether due to fraud or error, and to issue an auditor’s report that includes our opinion. Reasonable assurance is a high level of assurance, but is not a guarantee that an audit conducted in accordance with the Australian Auditing Standards will always detect a material misstatement when it exists. Misstatements can arise from fraud or error and are considered material if, individually or in the aggregate, they could reasonably be expected to influence the economic decisions of users taken on the basis of the financial report.
A further description of our responsibilities for the audit of the financial report is located at the Auditing and Assurance Standards Board website at: www.auasb.gov.au/auditors_files/ar2.pdf.
This description forms part of our auditor’s report.
Report on the remuneration report
Our opinion on the remuneration report We have audited the remuneration report included in
pages 42 to 60 of the directors’ report for the year ended 31 December 2016.
In our opinion, the remuneration report of Adelaide Brighton Limited for the year ended 31 December 2016 complies with section 300A of the Corporations Act 2001.
Responsibilities The directors of the Company are responsible for the
preparation and presentation of the remuneration report in accordance with section 300A of the Corporations Act 2001. Our responsibility is to express an opinion on the remuneration report, based on our audit conducted in accordance with Australian Auditing Standards.
PricewaterhouseCoopers
Kevin Reid, Partner Adelaide 17 March 2017
PricewaterhouseCoopers ABN 52 780 433 757 Level 11, 70 Franklin Street, Adelaide SA 5000 GPO Box 418, Adelaide SA 5001 Telephone +61 8 8218 7000 Facsimile +61 8 8218 7999 www.pwc.com.au
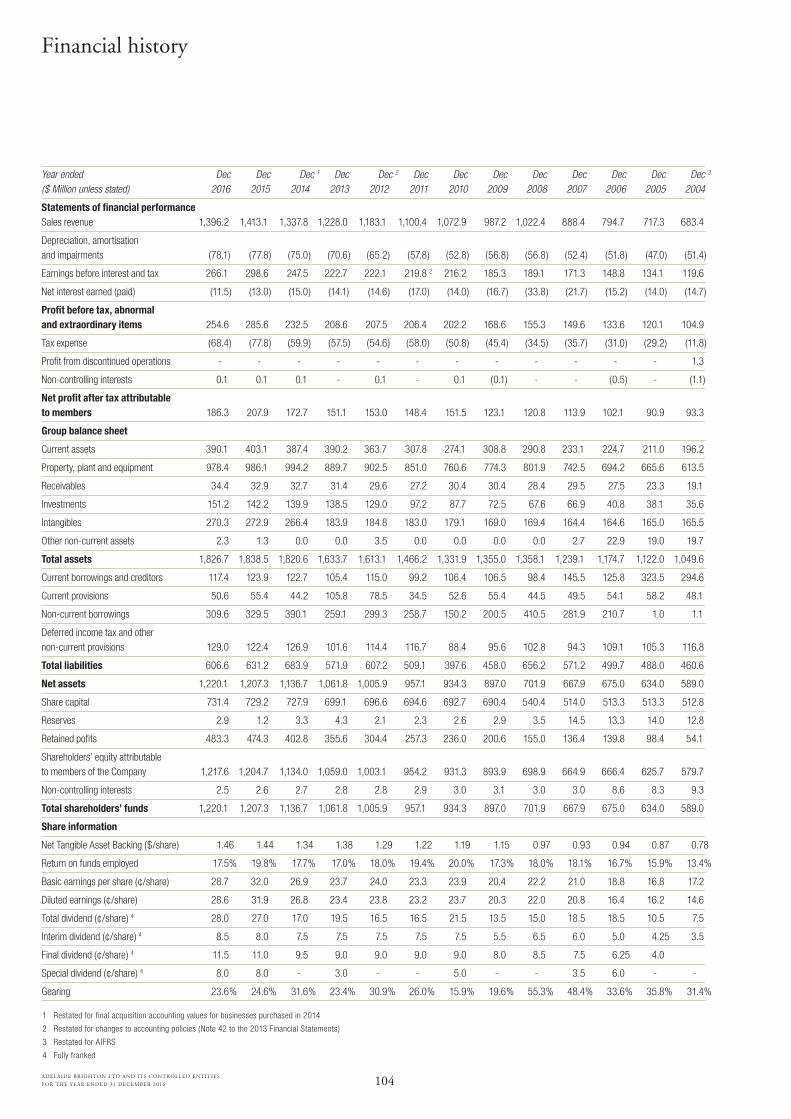
104ADELAIDE BRIGHTON LTD AND ITS CONTROLLED ENTITIES
FOR THE YEAR ENDED 31 DECEMBER 2016
Financial history
Year ended Dec Dec Dec 1 Dec Dec 2 Dec Dec Dec Dec Dec Dec Dec Dec 3
($ Million unless stated) 2016 2015 2014 2013 2012 2011 2010 2009 2008 2007 2006 2005 2004
Statements of financial performance Sales revenue 1,396.2 1,413.1 1,337.8 1,228.0 1,183.1 1,100.4 1,072.9 987.2 1,022.4 888.4 794.7 717.3 683.4
Depreciation, amortisation and impairments (78.1) (77.8) (75.0) (70.6) (65.2) (57.8) (52.8) (56.8) (56.8) (52.4) (51.8) (47.0) (51.4)
Earnings before interest and tax 266.1 298.6 247.5 222.7 222.1 219.8 2 216.2 185.3 189.1 171.3 148.8 134.1 119.6
Net interest earned (paid) (11.5) (13.0) (15.0) (14.1) (14.6) (17.0) (14.0) (16.7) (33.8) (21.7) (15.2) (14.0) (14.7)
Profit before tax, abnormal and extraordinary items 254.6 285.6 232.5 208.6 207.5 206.4 202.2 168.6 155.3 149.6 133.6 120.1 104.9
Tax expense (68.4) (77.8) (59.9) (57.5) (54.6) (58.0) (50.8) (45.4) (34.5) (35.7) (31.0) (29.2) (11.8)
Profit from discontinued operations - - - - - - - - - - - - 1.3
Non-controlling interests 0.1 0.1 0.1 - 0.1 - 0.1 (0.1) - - (0.5) - (1.1)
Net profit after tax attributable to members 186.3 207.9 172.7 151.1 153.0 148.4 151.5 123.1 120.8 113.9 102.1 90.9 93.3
Group balance sheet
Current assets 390.1 403.1 387.4 390.2 363.7 307.8 274.1 308.8 290.8 233.1 224.7 211.0 196.2
Property, plant and equipment 978.4 986.1 994.2 889.7 902.5 851.0 760.6 774.3 801.9 742.5 694.2 665.6 613.5
Receivables 34.4 32.9 32.7 31.4 29.6 27.2 30.4 30.4 28.4 29.5 27.5 23.3 19.1
Investments 151.2 142.2 139.9 138.5 129.0 97.2 87.7 72.5 67.6 66.9 40.8 38.1 35.6
Intangibles 270.3 272.9 266.4 183.9 184.8 183.0 179.1 169.0 169.4 164.4 164.6 165.0 165.5
Other non-current assets 2.3 1.3 0.0 0.0 3.5 0.0 0.0 0.0 0.0 2.7 22.9 19.0 19.7
Total assets 1,826.7 1,838.5 1,820.6 1,633.7 1,613.1 1,466.2 1,331.9 1,355.0 1,358.1 1,239.1 1,174.7 1,122.0 1,049.6
Current borrowings and creditors 117.4 123.9 122.7 105.4 115.0 99.2 106.4 106.5 98.4 145.5 125.8 323.5 294.6
Current provisions 50.6 55.4 44.2 105.8 78.5 34.5 52.6 55.4 44.5 49.5 54.1 58.2 48.1
Non-current borrowings 309.6 329.5 390.1 259.1 299.3 258.7 150.2 200.5 410.5 281.9 210.7 1.0 1.1
Deferred income tax and other non-current provisions 129.0 122.4 126.9 101.6 114.4 116.7 88.4 95.6 102.8 94.3 109.1 105.3 116.8
Total liabilities 606.6 631.2 683.9 571.9 607.2 509.1 397.6 458.0 656.2 571.2 499.7 488.0 460.6
Net assets 1,220.1 1,207.3 1,136.7 1,061.8 1,005.9 957.1 934.3 897.0 701.9 667.9 675.0 634.0 589.0
Share capital 731.4 729.2 727.9 699.1 696.6 694.6 692.7 690.4 540.4 514.0 513.3 513.3 512.8
Reserves 2.9 1.2 3.3 4.3 2.1 2.3 2.6 2.9 3.5 14.5 13.3 14.0 12.8
Retained pofits 483.3 474.3 402.8 355.6 304.4 257.3 236.0 200.6 155.0 136.4 139.8 98.4 54.1
Shareholders’ equity attributable to members of the Company 1,217.6 1,204.7 1,134.0 1,059.0 1,003.1 954.2 931.3 893.9 698.9 664.9 666.4 625.7 579.7
Non-controlling interests 2.5 2.6 2.7 2.8 2.8 2.9 3.0 3.1 3.0 3.0 8.6 8.3 9.3
Total shareholders’ funds 1,220.1 1,207.3 1,136.7 1,061.8 1,005.9 957.1 934.3 897.0 701.9 667.9 675.0 634.0 589.0
Share information
Net Tangible Asset Backing ($/share) 1.46 1.44 1.34 1.38 1.29 1.22 1.19 1.15 0.97 0.93 0.94 0.87 0.78
Return on funds employed 17.5% 19.8% 17.7% 17.0% 18.0% 19.4% 20.0% 17.3% 18.0% 18.1% 16.7% 15.9% 13.4%
Basic earnings per share (¢/share) 28.7 32.0 26.9 23.7 24.0 23.3 23.9 20.4 22.2 21.0 18.8 16.8 17.2
Diluted earnings (¢/share) 28.6 31.9 26.8 23.4 23.8 23.2 23.7 20.3 22.0 20.8 16.4 16.2 14.6
Total dividend (¢/share) 4 28.0 27.0 17.0 19.5 16.5 16.5 21.5 13.5 15.0 18.5 18.5 10.5 7.5
Interim dividend (¢/share) 4 8.5 8.0 7.5 7.5 7.5 7.5 7.5 5.5 6.5 6.0 5.0 4.25 3.5
Final dividend (¢/share) 4 11.5 11.0 9.5 9.0 9.0 9.0 9.0 8.0 8.5 7.5 6.25 4.0
Special dividend (¢/share) 4 8.0 8.0 - 3.0 - - 5.0 - - 3.5 6.0 - -
Gearing 23.6% 24.6% 31.6% 23.4% 30.9% 26.0% 15.9% 19.6% 55.3% 48.4% 33.6% 35.8% 31.4%
1 Restated for final acquisition accounting values for businesses purchased in 2014
2 Restated for changes to accounting policies (Note 42 to the 2013 Financial Statements)
3 Restated for AIFRS
4 Fully franked


![Consolidated Financial Statements Australian ... · ed 238 3 contents contents preface [draft] accounting standard aasb 2013-x consolidated financial statements – australian implementation](https://img.pdfslide.us/doc/110x75/5c76b92b09d3f28c0f8c0aec/consolidated-financial-statements-australian-ed-238-3-contents-contents.jpg)