Embed Size (px)
Citation preview
Online appendix for:
Financial Statements as Monitoring Mechanisms: Evidence from Small Commercial Loans
Section Page
Section A. Setting and dataset description 1
Section B. Additional descriptive statistics and tests 5
Section C. Description of Composite Barrier recovery score 14
1
Section A. Setting and Dataset Description
A1. Setting
Small commercial firms in the United States rely heavily on banks for financing, and prior literature describes a lending framework for this setting that has three dimensions: loan types, borrowing purposes, and lending mechanisms. The loan types and borrowing purposes are very similar to those for public firms. Two primary types of loans exist: commercial and industrial (C&I) and commercial real estate (CRE). C&I loans include lines of credit to address seasonality and working capital financing and term loans for equipment and general business financing. The former generally have maturities of less than one year, whereas the latter have maturities greater than one year. CRE loans are typically long-term mortgages to purchase buildings and land. Lending mechanisms are the technologies used to mitigate adverse selection and moral hazard problems associated with making and monitoring loans. The common lending mechanisms, including financial statements, collateral, and relationships, are also similar for public firms, but with less emphasis on financial reporting.
Multiple banking literature surveys (e.g., Gup and Kolari [2005], Berger and Udell [2006], Freixas and Rochet [2008], and Degryse, Kim, and Ongena [2009]) as well as regulator documents (e.g., OCC [2001]) portray broad heterogeneity in the combinations of loan types, borrowing purposes, and lending mechanisms in this setting. In other words, no one loan mechanism is used exclusively for any one loan type. For example, lines of credit are generally assumed to be collateralized by working capital assets, but this is not necessarily the reality; by definition, CRE loans are collateralized by real estate assets, but other assets can cross-collateralize these loans; term loans can be used to purchase equipment, but can also be financed based on the firm’s cash flows (i.e., uncollateralized). Similar to collateral, relationship and financial reporting mechanisms can be used across all loan types. A key conclusion of Berger and Udell [2006] is that banks and borrowers consider a combination of all these mechanisms across loan types.
A2. Dataset description
Sageworks, Inc. graciously provided us proprietary data from the Sageworks Loan Administration (SLA) package for the purposes of examining the monitoring of small commercial firms.1 SLA is an online cloud based tool that allows banks to record and track details about each loan. From the bank’s perspective, SLA automates the collection of borrower information and facilitates the loan review process. In addition to providing these organizing features, SLA is a compliance tool facilitating a bank’s regulatory review process. Regulators require banks to maintain risk assessment and monitoring practices. For example, the Office of the Comptroller of the Currency states that risk management practices should “form the foundation for credit risk measurement, monitoring, and reporting, and it should support management’s and the board’s decision making” [OCC 2001]. The SLA system provides data to guide the bank’s credit measurement and monitoring activities across the portfolio of loans, and provides documentation necessary for banks to prove compliance with stated practices to regulators.
1 This product was formerly called “Sageworks Monitor.” See http://web.sageworks.com/loan-administration/ for additional information about the product.
2
From the econometrician’s perspective, SLA contains the set of ongoing financial and non-financial reporting requirements that the bank and borrower agree to in the form of a collection schedule. Because SLA is an ex ante scheduling program, we observe a static “snapshot” of the information each bank requests from each borrower, and this information does not vary over the life of the loan. Thus, although we have historical data in the sense of when the loans were originated, we do not have a dynamic panel of loans or information requests. We also do not observe loan outcomes such as delinquencies and defaults, preventing us from investigating how monitoring activities are associated with loan performance. We received the dataset in two separate files: a loan file (with anonymized bank, borrower, and loan identifiers and terms of the loan) and a correspondence file (with anonymized bank and borrower identifiers and all information request activity).
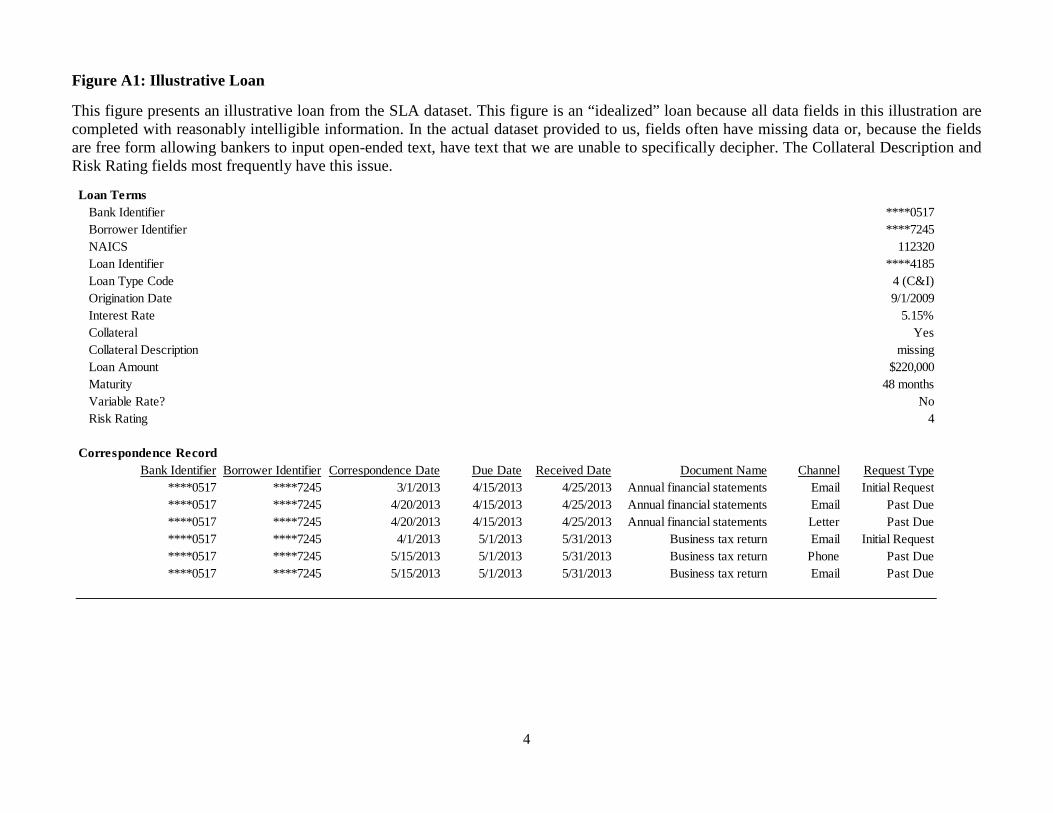
To demonstrate the nature of the data, we present an illustrative loan in Figure A1 below. Most variables require little explanation beyond the definitions provided in Appendix A of the paper; however the “document name,” “collateral description,” and “risk rating” fields require additional discussion. These fields are free-form text, meaning SLA users are allowed discretion over what (if any) information to input into the dataset. This discretion results in frequently missing observations or textual inputs that are likely informative to the banker, but difficult for us to decipher (e.g., the use of acronyms or identification numbers). The “document name” field (which is the primary focus of our paper and the main reason for the initial creation of SLA) has the fewest issues. Most document requests are sufficiently descriptive (and often standardized, such as “business financial statements” or “business tax returns”) that our manual coding process is more effective. Table B1 below reports the various documents that we identified and placed into broad categories.
The “collateral description” field is more frequently missing (44% of the collateralized loans have no description) and has much more varied inputs compared to the document requests field. We identify 1,725 different descriptions of collateral, many of which are indecipherable or contain multiple asset types. As a result, we do not use the collateral description field to conduct cross sectional tests across collateral types, though we believe this area is a fruitful one for future research with more complete data.2
Finally, the dataset includes a free form risk rating field. As part of the credit allocation and risk management process, regulators expect banks to assign risk ratings to loan applicants. One might suggest this variable would be a useful proxy for a borrower’s credit reputation instead of the credit spread variable we use in the paper; however, this variable has a number of theoretical and empirical issues. Discussions with bankers suggest this variable does not fully capture credit reputation as well as credit spread. Typically, the risk rating is assigned based on a loan’s
2 In Table B2 we conduct a robustness test in which we explicitly control for collateral in the form of guarantees. For example, we find SBA guarantees in 5.7% of sample loans, which is similar to the overall rate of 5.2% of US loans (Dilger [2013]). A potential concern one might have surrounding loans with SBA guarantees is that the program distorts lenders’ incentives to monitor. Several factors mitigate the importance of this concern to our study, however. First, as indicated by the 5.2% statistic, loans originated under SBA programs comprise a very small fraction of overall C&I loans outstanding. Second, even in the presence of an SBA guarantee, lenders have incentives to monitor borrowers because not doing so threatens future participation in the program. Moreover, lenders incur the first losses on SBA loans, and the government only reimburses them for losses up to a maximum percentage per the SBA guarantee. Because the collateral description field is noisy, the guarantor indicator variable used in Table B2 is also noisy, and we suggest future research investigate the different types of collateral.
3
perceived risk based on generic features such as loan type and borrower industry. The credit spread takes this rating into account, but then the bank adjusts the spread based on the borrower’s specific credit reputation and ability to attract financing from other banks based on that reputation. Therefore, the spread identifies this additional component of credit reputation missing in the risk rating. Moreover, risk rating does not mitigate endogeneity concerns. Like the credit spread, the risk rating is assigned after consideration of other loan contract terms (such as collateral, financial statement provision, etc.). Thus, from a theoretical construct perspective, the risk rating misses an element of borrower reputation and does not resolve endogeneity issues.
The variable also suffers from empirical issues. First, it is missing for 31% of loans in the dataset. Second, no consistent ratings systems exist across (or, even in some cases, within) banks. Therefore, empirically inferring the direction and magnitude of the rating is difficult. Finally, bankers suggested to us that little usable variation might exist in this variable. Bankers first discern whether a borrower is “lendable” and then assign a middle-of-the-road rating to the borrower and do not expend much effort in finely partitioning the variable. This bears out in the data—despite having inconsistent rating systems across banks, more than half of the loans for which there is a risk rating have a rating of “3” in the dataset. On a 10 point rating scale that we gained access to from one bank, this number indicates a rather generic imperfect lendable loan.
4
Figure A1: Illustrative Loan
This figure presents an illustrative loan from the SLA dataset. This figure is an “idealized” loan because all data fields in this illustration are completed with reasonably intelligible information. In the actual dataset provided to us, fields often have missing data or, because the fields are free form allowing bankers to input open-ended text, have text that we are unable to specifically decipher. The Collateral Description and Risk Rating fields most frequently have this issue.
Loan TermsBank Identifier ****0517Borrower Identifier ****7245NAICS 112320Loan Identifier ****4185Loan Type Code 4 (C&I)Origination Date 9/1/2009Interest Rate 5.15%Collateral YesCollateral Description missingLoan Amount $220,000Maturity 48 monthsVariable Rate? NoRisk Rating 4
Correspondence RecordBank Identifier Borrower Identifier Correspondence Date Due Date Received Date Document Name Channel Request Type
****0517 ****7245 3/1/2013 4/15/2013 4/25/2013 Annual financial statements Email Initial Request****0517 ****7245 4/20/2013 4/15/2013 4/25/2013 Annual financial statements Email Past Due****0517 ****7245 4/20/2013 4/15/2013 4/25/2013 Annual financial statements Letter Past Due****0517 ****7245 4/1/2013 5/1/2013 5/31/2013 Business tax return Email Initial Request****0517 ****7245 5/15/2013 5/1/2013 5/31/2013 Business tax return Phone Past Due****0517 ****7245 5/15/2013 5/1/2013 5/31/2013 Business tax return Email Past Due
5
Section B. Descriptive statistics and robustness tests
Table B1: Correspondence Summary
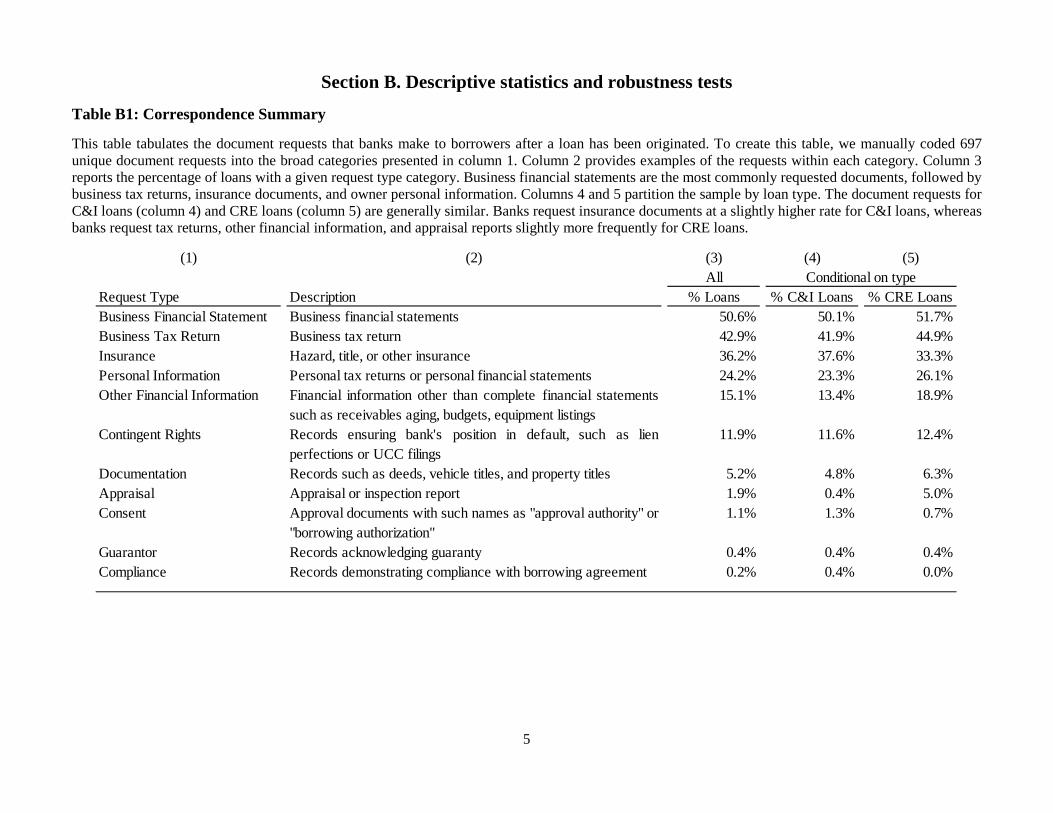
This table tabulates the document requests that banks make to borrowers after a loan has been originated. To create this table, we manually coded 697 unique document requests into the broad categories presented in column 1. Column 2 provides examples of the requests within each category. Column 3 reports the percentage of loans with a given request type category. Business financial statements are the most commonly requested documents, followed by business tax returns, insurance documents, and owner personal information. Columns 4 and 5 partition the sample by loan type. The document requests for C&I loans (column 4) and CRE loans (column 5) are generally similar. Banks request insurance documents at a slightly higher rate for C&I loans, whereas banks request tax returns, other financial information, and appraisal reports slightly more frequently for CRE loans.
(1) (2) (3) (4) (5)All
Request Type Description % Loans % C&I Loans % CRE LoansBusiness Financial Statement Business financial statements 50.6% 50.1% 51.7%Business Tax Return Business tax return 42.9% 41.9% 44.9%Insurance Hazard, title, or other insurance 36.2% 37.6% 33.3%Personal Information Personal tax returns or personal financial statements 24.2% 23.3% 26.1%Other Financial Information Financial information other than complete financial statements
such as receivables aging, budgets, equipment listings15.1% 13.4% 18.9%
Contingent Rights Records ensuring bank's position in default, such as lienperfections or UCC filings
11.9% 11.6% 12.4%
Documentation Records such as deeds, vehicle titles, and property titles 5.2% 4.8% 6.3%Appraisal Appraisal or inspection report 1.9% 0.4% 5.0%Consent Approval documents with such names as "approval authority" or
"borrowing authorization" 1.1% 1.3% 0.7%
Guarantor Records acknowledging guaranty 0.4% 0.4% 0.4%Compliance Records demonstrating compliance with borrowing agreement 0.2% 0.4% 0.0%
Conditional on type
6
Table B2: Determinants of Financial Statement Requests: Specification Robustness
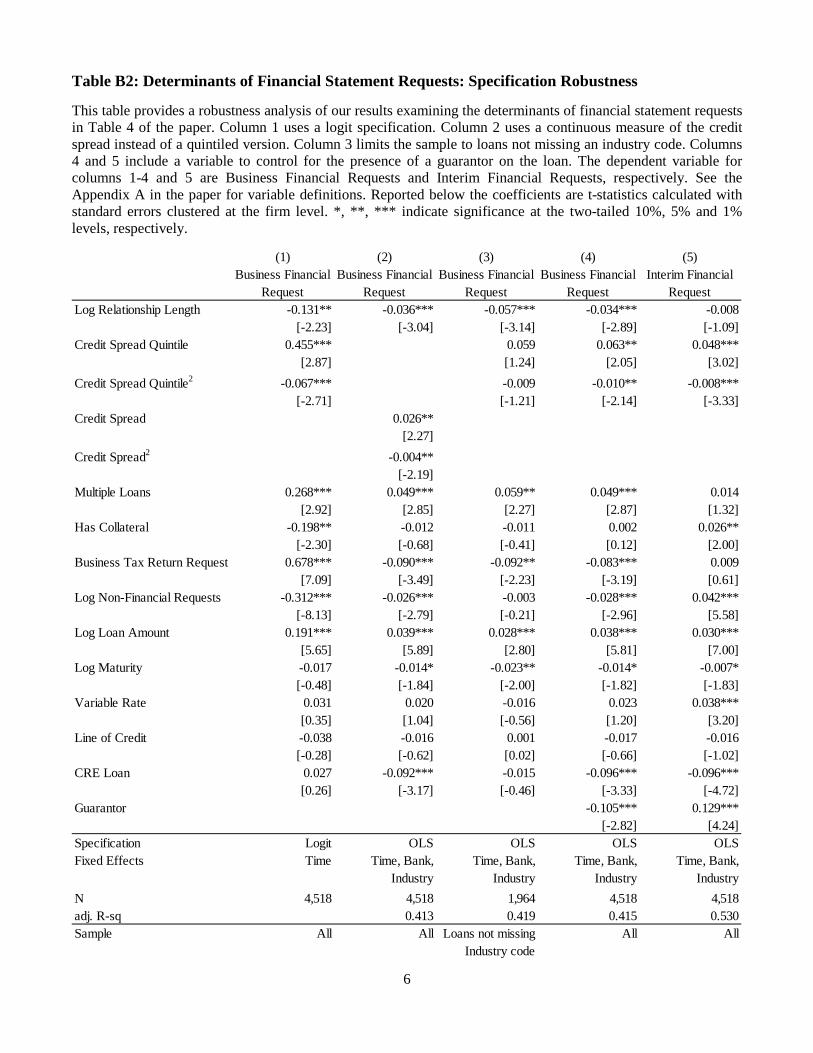
This table provides a robustness analysis of our results examining the determinants of financial statement requests in Table 4 of the paper. Column 1 uses a logit specification. Column 2 uses a continuous measure of the credit spread instead of a quintiled version. Column 3 limits the sample to loans not missing an industry code. Columns 4 and 5 include a variable to control for the presence of a guarantor on the loan. The dependent variable for columns 1-4 and 5 are Business Financial Requests and Interim Financial Requests, respectively. See the Appendix A in the paper for variable definitions. Reported below the coefficients are t-statistics calculated with standard errors clustered at the firm level. *, **, *** indicate significance at the two-tailed 10%, 5% and 1% levels, respectively.
(1) (2) (3) (4) (5)
Log Relationship Length -0.131** -0.036*** -0.057*** -0.034*** -0.008[-2.23] [-3.04] [-3.14] [-2.89] [-1.09]
Credit Spread Quintile 0.455*** 0.059 0.063** 0.048***[2.87] [1.24] [2.05] [3.02]
Credit Spread Quintile2 -0.067*** -0.009 -0.010** -0.008***[-2.71] [-1.21] [-2.14] [-3.33]
Credit Spread 0.026**[2.27]
Credit Spread2 -0.004**[-2.19]
Multiple Loans 0.268*** 0.049*** 0.059** 0.049*** 0.014[2.92] [2.85] [2.27] [2.87] [1.32]
Has Collateral -0.198** -0.012 -0.011 0.002 0.026**[-2.30] [-0.68] [-0.41] [0.12] [2.00]
Business Tax Return Request 0.678*** -0.090*** -0.092** -0.083*** 0.009[7.09] [-3.49] [-2.23] [-3.19] [0.61]
Log Non-Financial Requests -0.312*** -0.026*** -0.003 -0.028*** 0.042***[-8.13] [-2.79] [-0.21] [-2.96] [5.58]
Log Loan Amount 0.191*** 0.039*** 0.028*** 0.038*** 0.030***[5.65] [5.89] [2.80] [5.81] [7.00]
Log Maturity -0.017 -0.014* -0.023** -0.014* -0.007*[-0.48] [-1.84] [-2.00] [-1.82] [-1.83]
Variable Rate 0.031 0.020 -0.016 0.023 0.038***[0.35] [1.04] [-0.56] [1.20] [3.20]
Line of Credit -0.038 -0.016 0.001 -0.017 -0.016[-0.28] [-0.62] [0.02] [-0.66] [-1.02]
CRE Loan 0.027 -0.092*** -0.015 -0.096*** -0.096***[0.26] [-3.17] [-0.46] [-3.33] [-4.72]
Guarantor -0.105*** 0.129***[-2.82] [4.24]
Specification Logit OLS OLS OLS OLSFixed Effects Time Time, Bank,
IndustryTime, Bank,
IndustryTime, Bank,
IndustryTime, Bank,
IndustryN 4,518 4,518 1,964 4,518 4,518adj. R-sq 0.413 0.419 0.415 0.530Sample All All Loans not missing All All
Industry code
Interim Financial Request
Business Financial Request
Business Financial Request
Business Financial Request
Business Financial Request
7
Table B3: Determinants of Financial Statement Requests: Sample Robustness
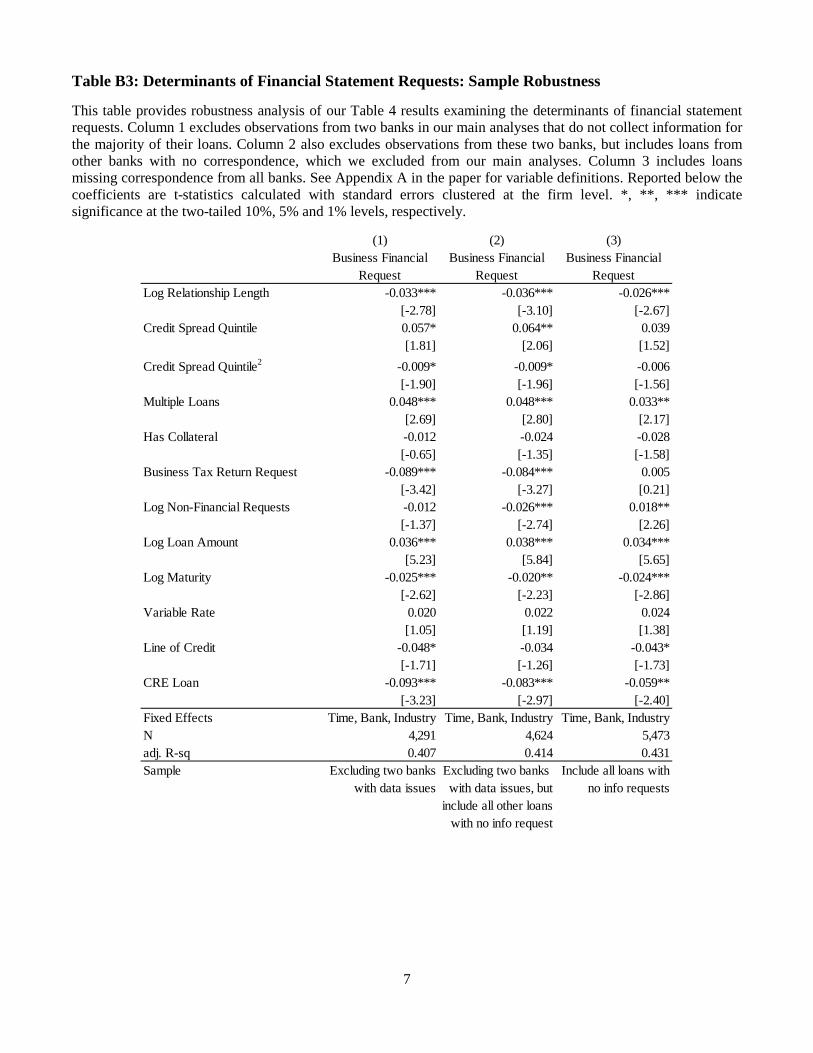
This table provides robustness analysis of our Table 4 results examining the determinants of financial statement requests. Column 1 excludes observations from two banks in our main analyses that do not collect information for the majority of their loans. Column 2 also excludes observations from these two banks, but includes loans from other banks with no correspondence, which we excluded from our main analyses. Column 3 includes loans missing correspondence from all banks. See Appendix A in the paper for variable definitions. Reported below the coefficients are t-statistics calculated with standard errors clustered at the firm level. *, **, *** indicate significance at the two-tailed 10%, 5% and 1% levels, respectively.
(1) (2) (3)
Log Relationship Length -0.033*** -0.036*** -0.026***[-2.78] [-3.10] [-2.67]
Credit Spread Quintile 0.057* 0.064** 0.039[1.81] [2.06] [1.52]
Credit Spread Quintile2 -0.009* -0.009* -0.006[-1.90] [-1.96] [-1.56]
Multiple Loans 0.048*** 0.048*** 0.033**[2.69] [2.80] [2.17]
Has Collateral -0.012 -0.024 -0.028[-0.65] [-1.35] [-1.58]
Business Tax Return Request -0.089*** -0.084*** 0.005[-3.42] [-3.27] [0.21]
Log Non-Financial Requests -0.012 -0.026*** 0.018**[-1.37] [-2.74] [2.26]
Log Loan Amount 0.036*** 0.038*** 0.034***[5.23] [5.84] [5.65]
Log Maturity -0.025*** -0.020** -0.024***[-2.62] [-2.23] [-2.86]
Variable Rate 0.020 0.022 0.024[1.05] [1.19] [1.38]
Line of Credit -0.048* -0.034 -0.043*[-1.71] [-1.26] [-1.73]
CRE Loan -0.093*** -0.083*** -0.059**[-3.23] [-2.97] [-2.40]
Fixed Effects Time, Bank, Industry Time, Bank, Industry Time, Bank, IndustryN 4,291 4,624 5,473adj. R-sq 0.407 0.414 0.431Sample Excluding two banks Excluding two banks Include all loans with
with data issues with data issues, but no info requestsinclude all other loans
with no info request
Business Financial Request
Business Financial Request
Business Financial Request
8
Table B4: Univariate Correlations
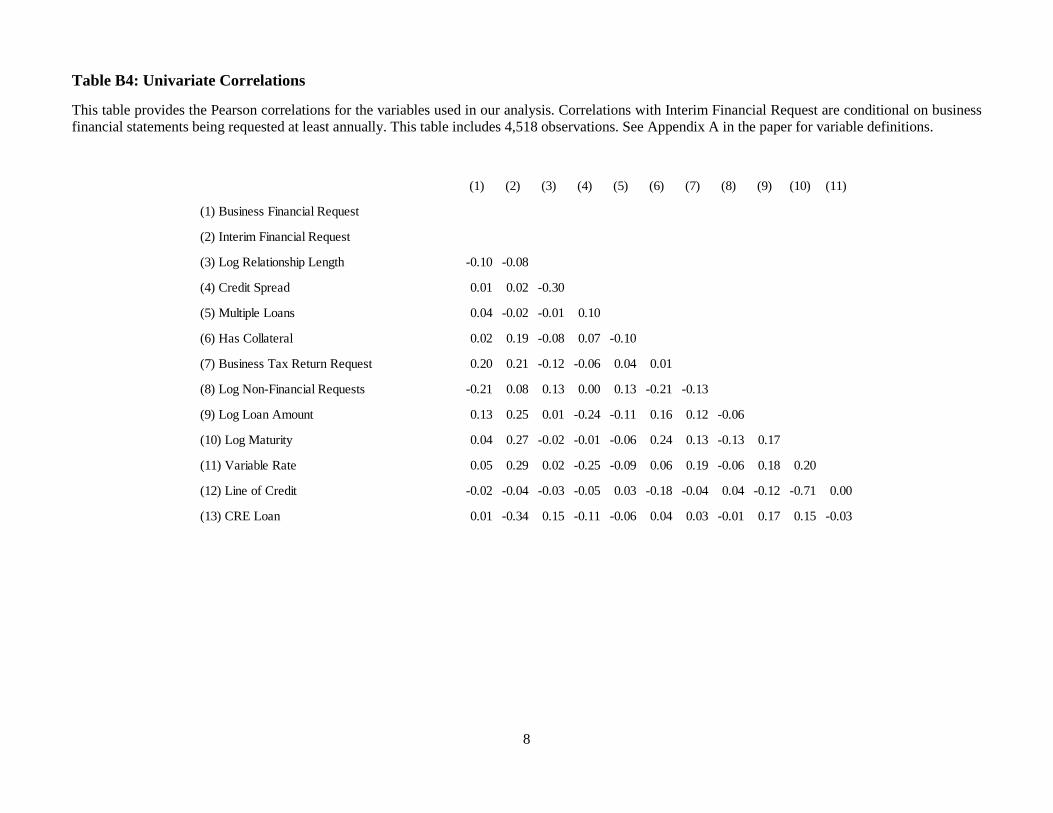
This table provides the Pearson correlations for the variables used in our analysis. Correlations with Interim Financial Request are conditional on business financial statements being requested at least annually. This table includes 4,518 observations. See Appendix A in the paper for variable definitions.
(1) (2) (3) (4) (5) (6) (7) (8) (9) (10) (11)
(1) Business Financial Request
(2) Interim Financial Request
(3) Log Relationship Length -0.10 -0.08
(4) Credit Spread 0.01 0.02 -0.30
(5) Multiple Loans 0.04 -0.02 -0.01 0.10
(6) Has Collateral 0.02 0.19 -0.08 0.07 -0.10
(7) Business Tax Return Request 0.20 0.21 -0.12 -0.06 0.04 0.01
(8) Log Non-Financial Requests -0.21 0.08 0.13 0.00 0.13 -0.21 -0.13
(9) Log Loan Amount 0.13 0.25 0.01 -0.24 -0.11 0.16 0.12 -0.06
(10) Log Maturity 0.04 0.27 -0.02 -0.01 -0.06 0.24 0.13 -0.13 0.17
(11) Variable Rate 0.05 0.29 0.02 -0.25 -0.09 0.06 0.19 -0.06 0.18 0.20
(12) Line of Credit -0.02 -0.04 -0.03 -0.05 0.03 -0.18 -0.04 0.04 -0.12 -0.71 0.00
(13) CRE Loan 0.01 -0.34 0.15 -0.11 -0.06 0.04 0.03 -0.01 0.17 0.15 -0.03
9
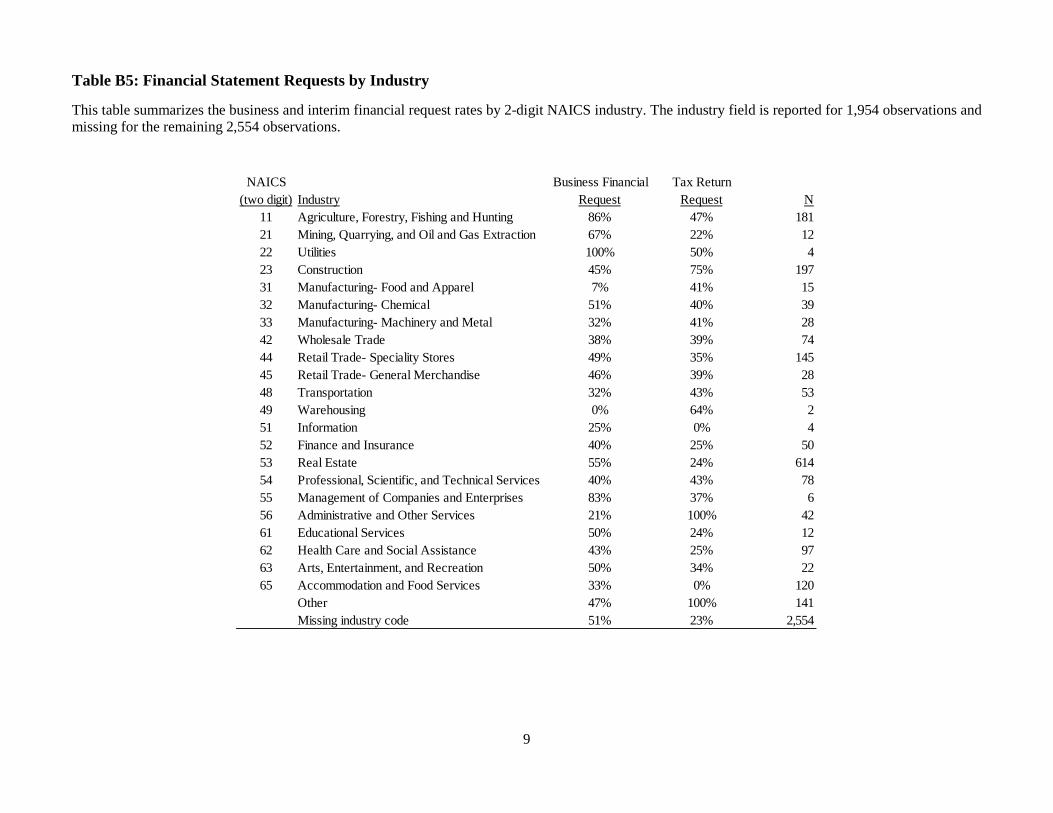
Table B5: Financial Statement Requests by Industry
This table summarizes the business and interim financial request rates by 2-digit NAICS industry. The industry field is reported for 1,954 observations and missing for the remaining 2,554 observations.
NAICS Business Financial Tax Return(two digit) Industry Request Request N
11 Agriculture, Forestry, Fishing and Hunting 86% 47% 18121 Mining, Quarrying, and Oil and Gas Extraction 67% 22% 1222 Utilities 100% 50% 423 Construction 45% 75% 19731 Manufacturing- Food and Apparel 7% 41% 1532 Manufacturing- Chemical 51% 40% 3933 Manufacturing- Machinery and Metal 32% 41% 2842 Wholesale Trade 38% 39% 7444 Retail Trade- Speciality Stores 49% 35% 14545 Retail Trade- General Merchandise 46% 39% 2848 Transportation 32% 43% 5349 Warehousing 0% 64% 251 Information 25% 0% 452 Finance and Insurance 40% 25% 5053 Real Estate 55% 24% 61454 Professional, Scientific, and Technical Services 40% 43% 7855 Management of Companies and Enterprises 83% 37% 656 Administrative and Other Services 21% 100% 4261 Educational Services 50% 24% 1262 Health Care and Social Assistance 43% 25% 9763 Arts, Entertainment, and Recreation 50% 34% 2265 Accommodation and Food Services 33% 0% 120
Other 47% 100% 141Missing industry code 51% 23% 2,554
10
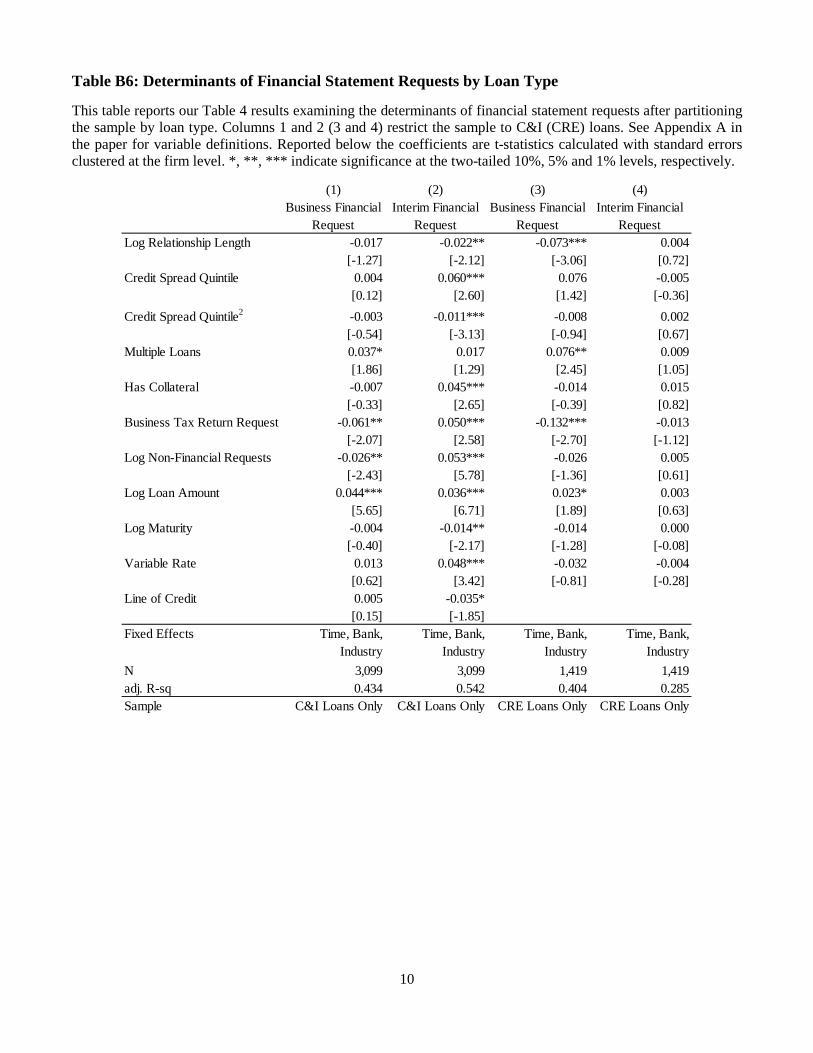
Table B6: Determinants of Financial Statement Requests by Loan Type
This table reports our Table 4 results examining the determinants of financial statement requests after partitioning the sample by loan type. Columns 1 and 2 (3 and 4) restrict the sample to C&I (CRE) loans. See Appendix A in the paper for variable definitions. Reported below the coefficients are t-statistics calculated with standard errors clustered at the firm level. *, **, *** indicate significance at the two-tailed 10%, 5% and 1% levels, respectively.
(1) (2) (3) (4)
Log Relationship Length -0.017 -0.022** -0.073*** 0.004[-1.27] [-2.12] [-3.06] [0.72]
Credit Spread Quintile 0.004 0.060*** 0.076 -0.005[0.12] [2.60] [1.42] [-0.36]
Credit Spread Quintile2 -0.003 -0.011*** -0.008 0.002[-0.54] [-3.13] [-0.94] [0.67]
Multiple Loans 0.037* 0.017 0.076** 0.009[1.86] [1.29] [2.45] [1.05]
Has Collateral -0.007 0.045*** -0.014 0.015[-0.33] [2.65] [-0.39] [0.82]
Business Tax Return Request -0.061** 0.050*** -0.132*** -0.013[-2.07] [2.58] [-2.70] [-1.12]
Log Non-Financial Requests -0.026** 0.053*** -0.026 0.005[-2.43] [5.78] [-1.36] [0.61]
Log Loan Amount 0.044*** 0.036*** 0.023* 0.003[5.65] [6.71] [1.89] [0.63]
Log Maturity -0.004 -0.014** -0.014 0.000[-0.40] [-2.17] [-1.28] [-0.08]
Variable Rate 0.013 0.048*** -0.032 -0.004[0.62] [3.42] [-0.81] [-0.28]
Line of Credit 0.005 -0.035*[0.15] [-1.85]
Fixed Effects Time, Bank, Industry
Time, Bank, Industry
Time, Bank, Industry
Time, Bank, Industry
N 3,099 3,099 1,419 1,419adj. R-sq 0.434 0.542 0.404 0.285Sample C&I Loans Only C&I Loans Only CRE Loans Only CRE Loans Only
Business Financial Request
Interim Financial Request
Business Financial Request
Interim Financial Request
11
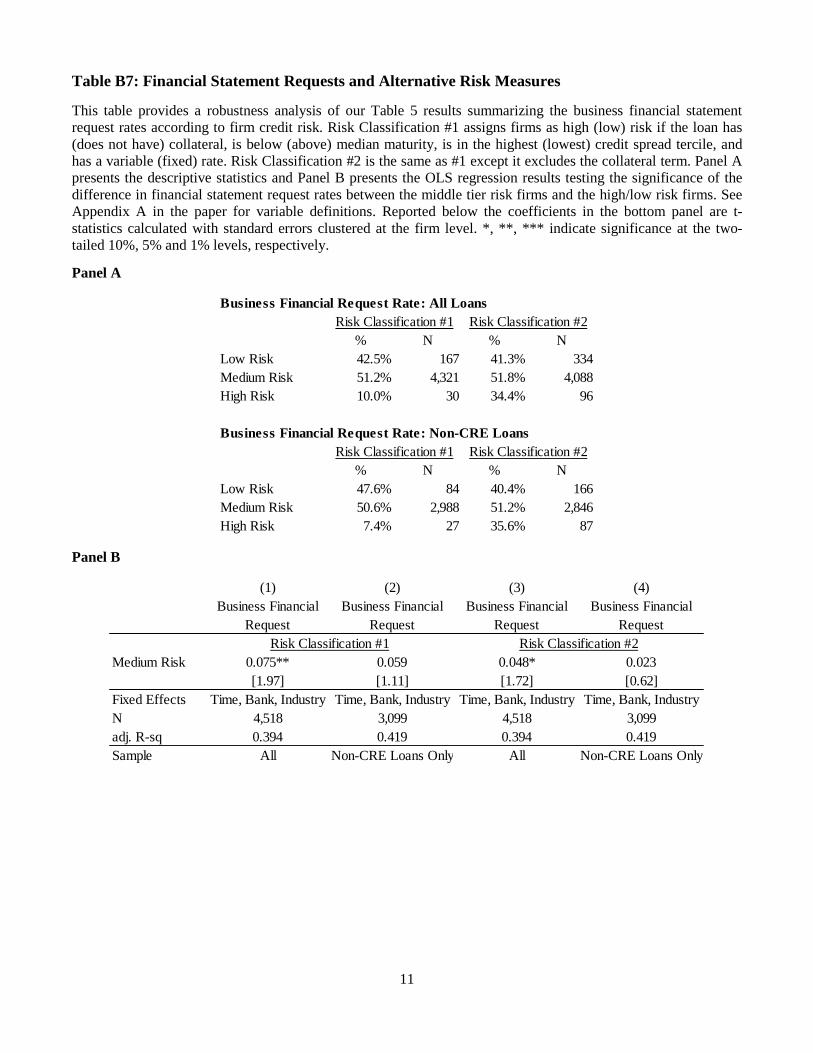
Table B7: Financial Statement Requests and Alternative Risk Measures
This table provides a robustness analysis of our Table 5 results summarizing the business financial statement request rates according to firm credit risk. Risk Classification #1 assigns firms as high (low) risk if the loan has (does not have) collateral, is below (above) median maturity, is in the highest (lowest) credit spread tercile, and has a variable (fixed) rate. Risk Classification #2 is the same as #1 except it excludes the collateral term. Panel A presents the descriptive statistics and Panel B presents the OLS regression results testing the significance of the difference in financial statement request rates between the middle tier risk firms and the high/low risk firms. See Appendix A in the paper for variable definitions. Reported below the coefficients in the bottom panel are t-statistics calculated with standard errors clustered at the firm level. *, **, *** indicate significance at the two-tailed 10%, 5% and 1% levels, respectively.
Panel A
Panel B
Business Financial Request Rate: All Loans
% N % NLow Risk 42.5% 167 41.3% 334Medium Risk 51.2% 4,321 51.8% 4,088High Risk 10.0% 30 34.4% 96
Business Financial Request Rate: Non-CRE Loans
% N % NLow Risk 47.6% 84 40.4% 166Medium Risk 50.6% 2,988 51.2% 2,846High Risk 7.4% 27 35.6% 87
Risk Classification #1 Risk Classification #2
Risk Classification #1 Risk Classification #2
(1) (2) (3) (4)
Medium Risk 0.075** 0.059 0.048* 0.023[1.97] [1.11] [1.72] [0.62]
Fixed Effects Time, Bank, Industry Time, Bank, Industry Time, Bank, Industry Time, Bank, IndustryN 4,518 3,099 4,518 3,099adj. R-sq 0.394 0.419 0.394 0.419Sample All Non-CRE Loans Only All Non-CRE Loans Only
Risk Classification #1 Risk Classification #2
Business Financial Request
Business Financial Request
Business Financial Request
Business Financial Request
12
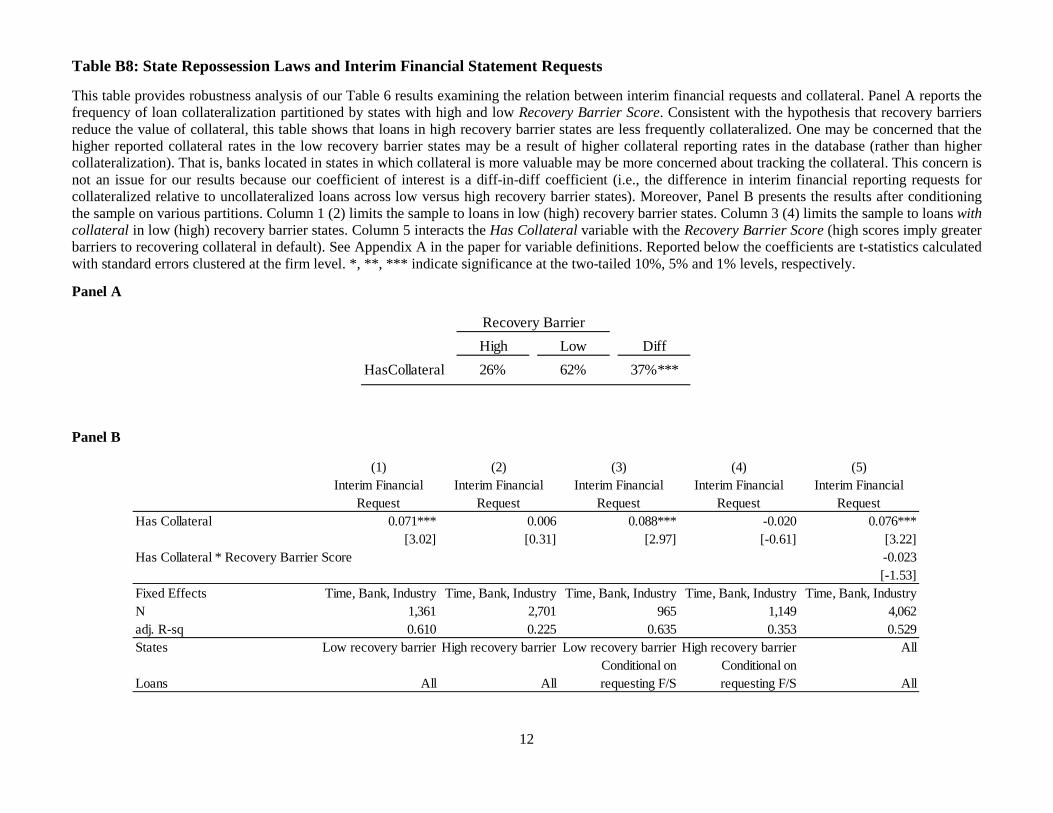
Table B8: State Repossession Laws and Interim Financial Statement Requests
This table provides robustness analysis of our Table 6 results examining the relation between interim financial requests and collateral. Panel A reports the frequency of loan collateralization partitioned by states with high and low Recovery Barrier Score. Consistent with the hypothesis that recovery barriers reduce the value of collateral, this table shows that loans in high recovery barrier states are less frequently collateralized. One may be concerned that the higher reported collateral rates in the low recovery barrier states may be a result of higher collateral reporting rates in the database (rather than higher collateralization). That is, banks located in states in which collateral is more valuable may be more concerned about tracking the collateral. This concern is not an issue for our results because our coefficient of interest is a diff-in-diff coefficient (i.e., the difference in interim financial reporting requests for collateralized relative to uncollateralized loans across low versus high recovery barrier states). Moreover, Panel B presents the results after conditioning the sample on various partitions. Column 1 (2) limits the sample to loans in low (high) recovery barrier states. Column 3 (4) limits the sample to loans with collateral in low (high) recovery barrier states. Column 5 interacts the Has Collateral variable with the Recovery Barrier Score (high scores imply greater barriers to recovering collateral in default). See Appendix A in the paper for variable definitions. Reported below the coefficients are t-statistics calculated with standard errors clustered at the firm level. *, **, *** indicate significance at the two-tailed 10%, 5% and 1% levels, respectively.
Panel A
Panel B
High Low DiffHasCollateral 26% 62% 37%***
Recovery Barrier
(1) (2) (3) (4) (5)
Has Collateral 0.071*** 0.006 0.088*** -0.020 0.076***[3.02] [0.31] [2.97] [-0.61] [3.22]
Has Collateral * Recovery Barrier Score -0.023[-1.53]
Fixed Effects Time, Bank, Industry Time, Bank, Industry Time, Bank, Industry Time, Bank, Industry Time, Bank, IndustryN 1,361 2,701 965 1,149 4,062adj. R-sq 0.610 0.225 0.635 0.353 0.529States Low recovery barrier High recovery barrier Low recovery barrier High recovery barrier All
Loans All AllConditional on requesting F/S
Conditional on requesting F/S All
Interim Financial Request
Interim Financial Request
Interim Financial Request
Interim Financial Request
Interim Financial Request
13
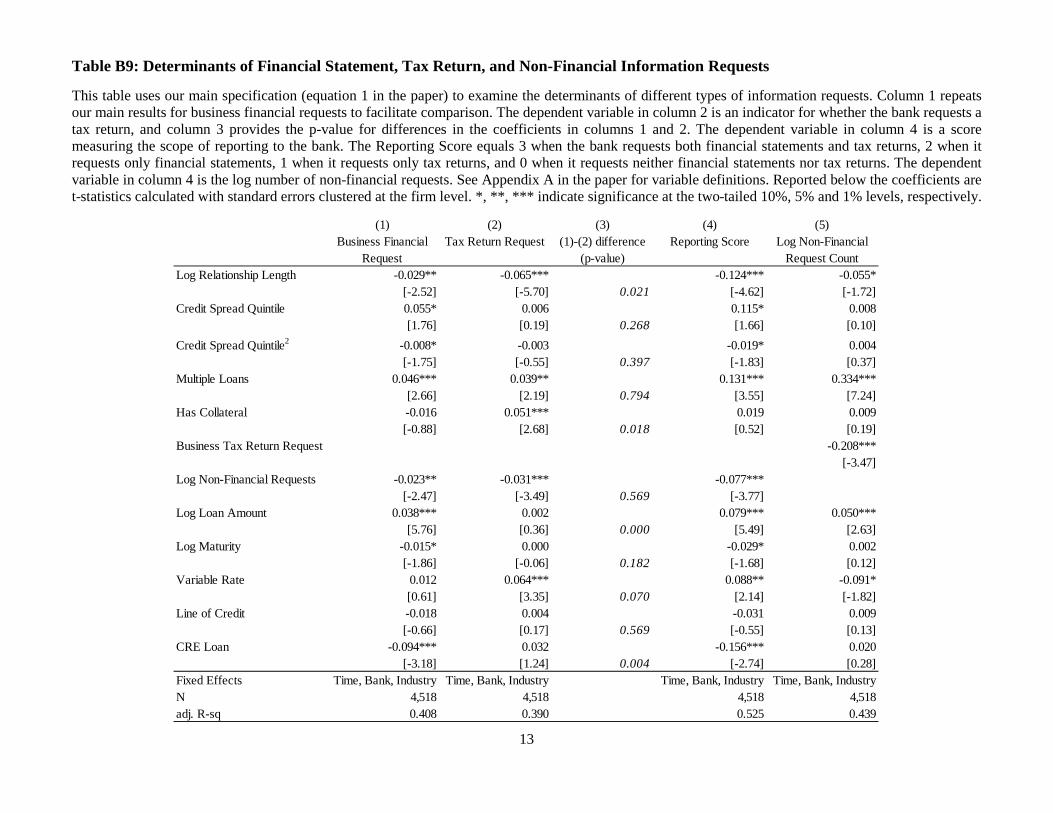
Table B9: Determinants of Financial Statement, Tax Return, and Non-Financial Information Requests
This table uses our main specification (equation 1 in the paper) to examine the determinants of different types of information requests. Column 1 repeats our main results for business financial requests to facilitate comparison. The dependent variable in column 2 is an indicator for whether the bank requests a tax return, and column 3 provides the p-value for differences in the coefficients in columns 1 and 2. The dependent variable in column 4 is a score measuring the scope of reporting to the bank. The Reporting Score equals 3 when the bank requests both financial statements and tax returns, 2 when it requests only financial statements, 1 when it requests only tax returns, and 0 when it requests neither financial statements nor tax returns. The dependent variable in column 4 is the log number of non-financial requests. See Appendix A in the paper for variable definitions. Reported below the coefficients are t-statistics calculated with standard errors clustered at the firm level. *, **, *** indicate significance at the two-tailed 10%, 5% and 1% levels, respectively.
(1) (2) (3) (4) (5)(1)-(2) difference
(p-value)Log Relationship Length -0.029** -0.065*** -0.124*** -0.055*
[-2.52] [-5.70] 0.021 [-4.62] [-1.72]Credit Spread Quintile 0.055* 0.006 0.115* 0.008
[1.76] [0.19] 0.268 [1.66] [0.10]Credit Spread Quintile2 -0.008* -0.003 -0.019* 0.004
[-1.75] [-0.55] 0.397 [-1.83] [0.37]Multiple Loans 0.046*** 0.039** 0.131*** 0.334***
[2.66] [2.19] 0.794 [3.55] [7.24]Has Collateral -0.016 0.051*** 0.019 0.009
[-0.88] [2.68] 0.018 [0.52] [0.19]Business Tax Return Request -0.208***
[-3.47]Log Non-Financial Requests -0.023** -0.031*** -0.077***
[-2.47] [-3.49] 0.569 [-3.77] Log Loan Amount 0.038*** 0.002 0.079*** 0.050***
[5.76] [0.36] 0.000 [5.49] [2.63]Log Maturity -0.015* 0.000 -0.029* 0.002
[-1.86] [-0.06] 0.182 [-1.68] [0.12]Variable Rate 0.012 0.064*** 0.088** -0.091*
[0.61] [3.35] 0.070 [2.14] [-1.82]Line of Credit -0.018 0.004 -0.031 0.009
[-0.66] [0.17] 0.569 [-0.55] [0.13]CRE Loan -0.094*** 0.032 -0.156*** 0.020
[-3.18] [1.24] 0.004 [-2.74] [0.28]Fixed Effects Time, Bank, Industry Time, Bank, Industry Time, Bank, Industry Time, Bank, IndustryN 4,518 4,518 4,518 4,518adj. R-sq 0.408 0.390 0.525 0.439
Business Financial Request
Tax Return Request Reporting Score Log Non-Financial Request Count
14
Section C: Description of Recovery Barrier composite score This section details the calculation of the Recovery Barrier composite score used in our cross sectional tests. It contains four figures:
Table C1: Variable descriptions
Table C2: Variables by state
Table C3: Correlations between state variables
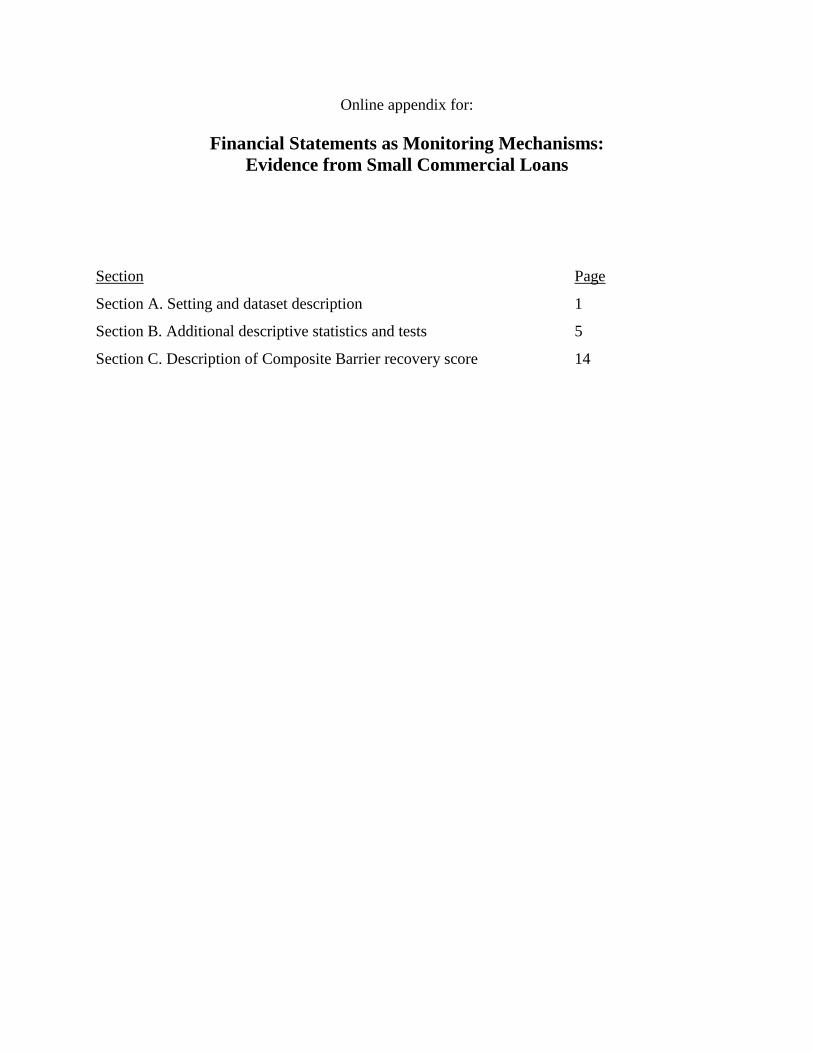
Figure C1: Map of states and composite scores
15
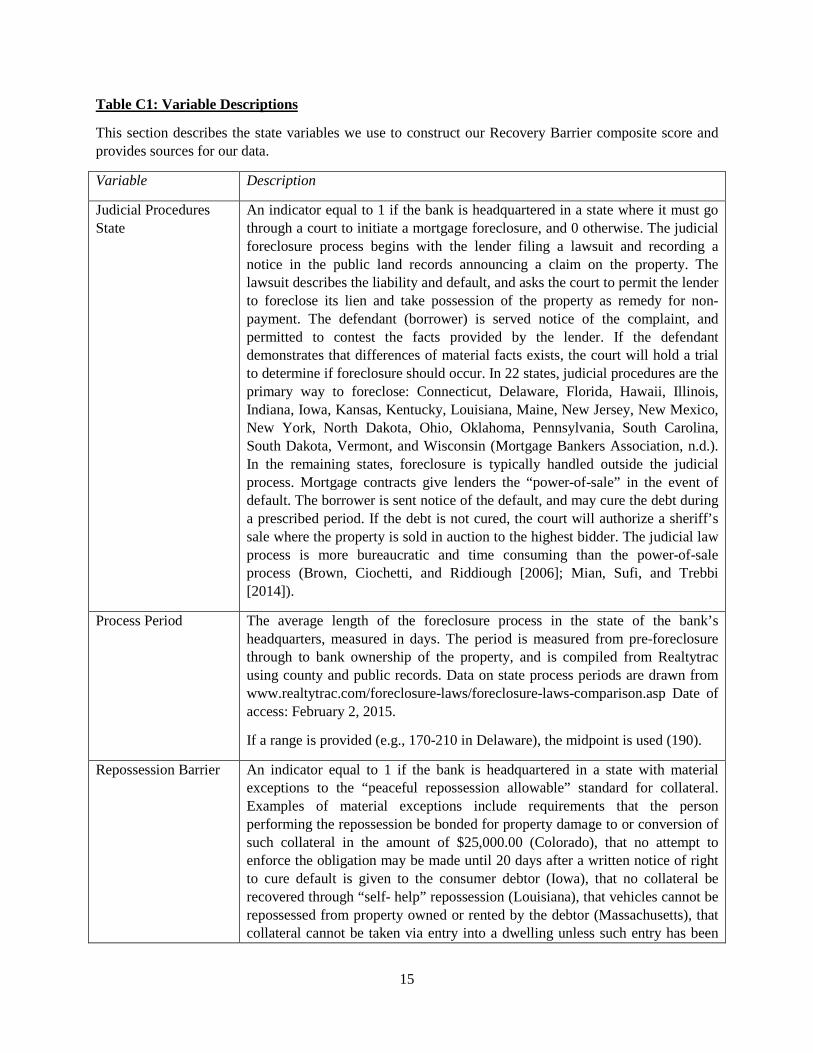
Table C1: Variable Descriptions
This section describes the state variables we use to construct our Recovery Barrier composite score and provides sources for our data.
Variable Description
Judicial Procedures State
An indicator equal to 1 if the bank is headquartered in a state where it must go through a court to initiate a mortgage foreclosure, and 0 otherwise. The judicial foreclosure process begins with the lender filing a lawsuit and recording a notice in the public land records announcing a claim on the property. The lawsuit describes the liability and default, and asks the court to permit the lender to foreclose its lien and take possession of the property as remedy for non-payment. The defendant (borrower) is served notice of the complaint, and permitted to contest the facts provided by the lender. If the defendant demonstrates that differences of material facts exists, the court will hold a trial to determine if foreclosure should occur. In 22 states, judicial procedures are the primary way to foreclose: Connecticut, Delaware, Florida, Hawaii, Illinois, Indiana, Iowa, Kansas, Kentucky, Louisiana, Maine, New Jersey, New Mexico, New York, North Dakota, Ohio, Oklahoma, Pennsylvania, South Carolina, South Dakota, Vermont, and Wisconsin (Mortgage Bankers Association, n.d.). In the remaining states, foreclosure is typically handled outside the judicial process. Mortgage contracts give lenders the “power-of-sale” in the event of default. The borrower is sent notice of the default, and may cure the debt during a prescribed period. If the debt is not cured, the court will authorize a sheriff’s sale where the property is sold in auction to the highest bidder. The judicial law process is more bureaucratic and time consuming than the power-of-sale process (Brown, Ciochetti, and Riddiough [2006]; Mian, Sufi, and Trebbi [2014]).
Process Period The average length of the foreclosure process in the state of the bank’s headquarters, measured in days. The period is measured from pre-foreclosure through to bank ownership of the property, and is compiled from Realtytrac using county and public records. Data on state process periods are drawn from www.realtytrac.com/foreclosure-laws/foreclosure-laws-comparison.asp Date of access: February 2, 2015.
If a range is provided (e.g., 170-210 in Delaware), the midpoint is used (190).
Repossession Barrier An indicator equal to 1 if the bank is headquartered in a state with material exceptions to the “peaceful repossession allowable” standard for collateral. Examples of material exceptions include requirements that the person performing the repossession be bonded for property damage to or conversion of such collateral in the amount of $25,000.00 (Colorado), that no attempt to enforce the obligation may be made until 20 days after a written notice of right to cure default is given to the consumer debtor (Iowa), that no collateral be recovered through “self- help” repossession (Louisiana), that vehicles cannot be repossessed from property owned or rented by the debtor (Massachusetts), that collateral cannot be taken via entry into a dwelling unless such entry has been
16
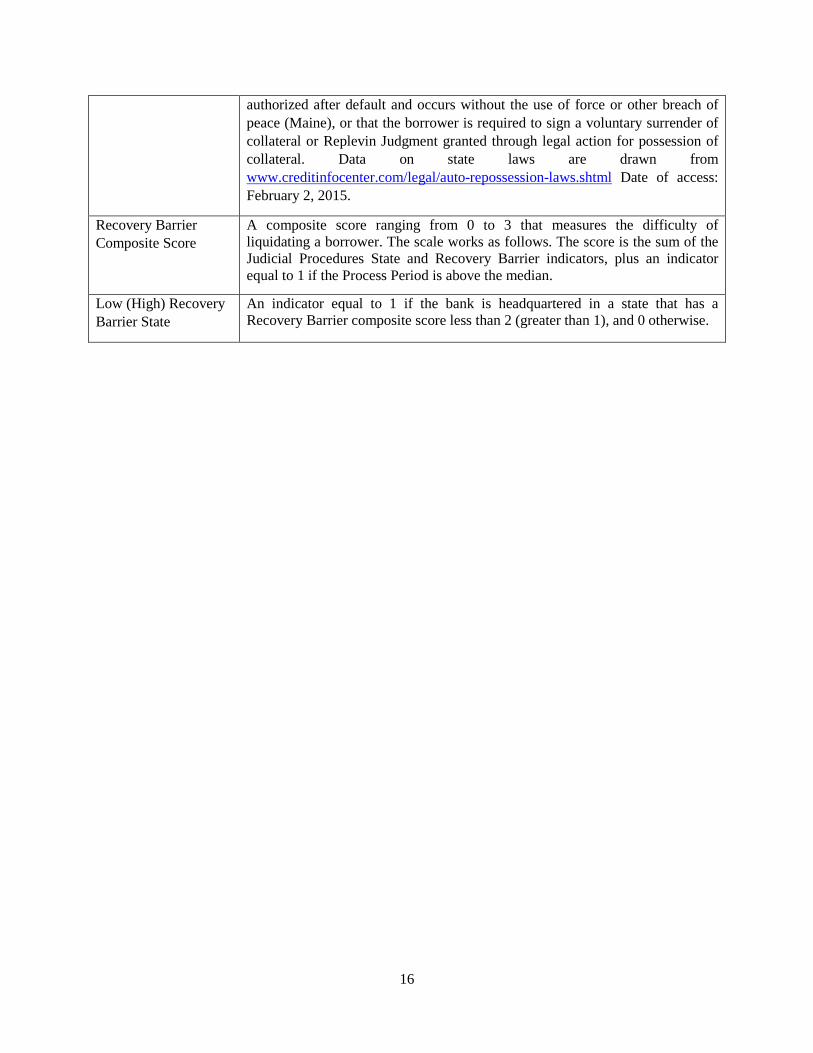
authorized after default and occurs without the use of force or other breach of peace (Maine), or that the borrower is required to sign a voluntary surrender of collateral or Replevin Judgment granted through legal action for possession of collateral. Data on state laws are drawn from www.creditinfocenter.com/legal/auto-repossession-laws.shtml Date of access: February 2, 2015.
Recovery Barrier Composite Score
A composite score ranging from 0 to 3 that measures the difficulty of liquidating a borrower. The scale works as follows. The score is the sum of the Judicial Procedures State and Recovery Barrier indicators, plus an indicator equal to 1 if the Process Period is above the median.
Low (High) Recovery Barrier State
An indicator equal to 1 if the bank is headquartered in a state that has a Recovery Barrier composite score less than 2 (greater than 1), and 0 otherwise.
17
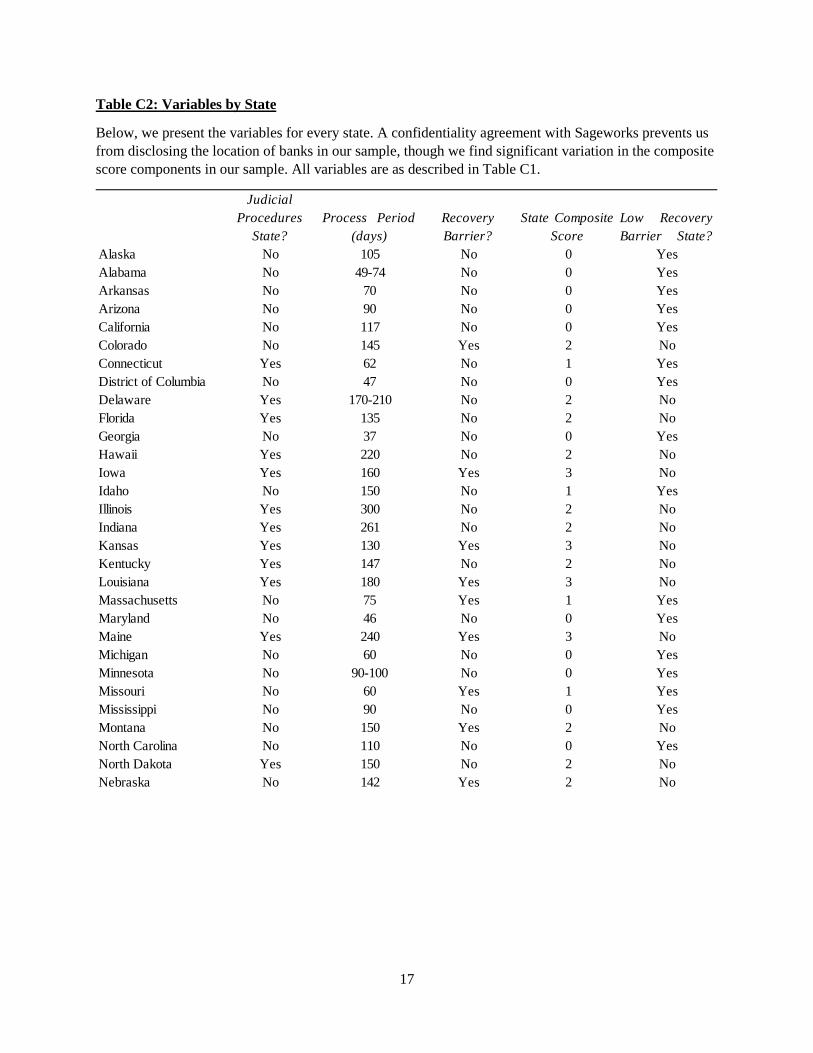
Table C2: Variables by State
Below, we present the variables for every state. A confidentiality agreement with Sageworks prevents us from disclosing the location of banks in our sample, though we find significant variation in the composite score components in our sample. All variables are as described in Table C1.
Judicial Procedures
State?Process Period
(days)Recovery Barrier?
State CompositeScore
Low RecoveryBarrier State?
Alaska No 105 No 0 YesAlabama No 49-74 No 0 YesArkansas No 70 No 0 YesArizona No 90 No 0 YesCalifornia No 117 No 0 YesColorado No 145 Yes 2 NoConnecticut Yes 62 No 1 YesDistrict of Columbia No 47 No 0 YesDelaware Yes 170-210 No 2 NoFlorida Yes 135 No 2 NoGeorgia No 37 No 0 YesHawaii Yes 220 No 2 NoIowa Yes 160 Yes 3 NoIdaho No 150 No 1 YesIllinois Yes 300 No 2 NoIndiana Yes 261 No 2 NoKansas Yes 130 Yes 3 NoKentucky Yes 147 No 2 NoLouisiana Yes 180 Yes 3 NoMassachusetts No 75 Yes 1 YesMaryland No 46 No 0 YesMaine Yes 240 Yes 3 NoMichigan No 60 No 0 YesMinnesota No 90-100 No 0 YesMissouri No 60 Yes 1 YesMississippi No 90 No 0 YesMontana No 150 Yes 2 NoNorth Carolina No 110 No 0 YesNorth Dakota Yes 150 No 2 NoNebraska No 142 Yes 2 No
18
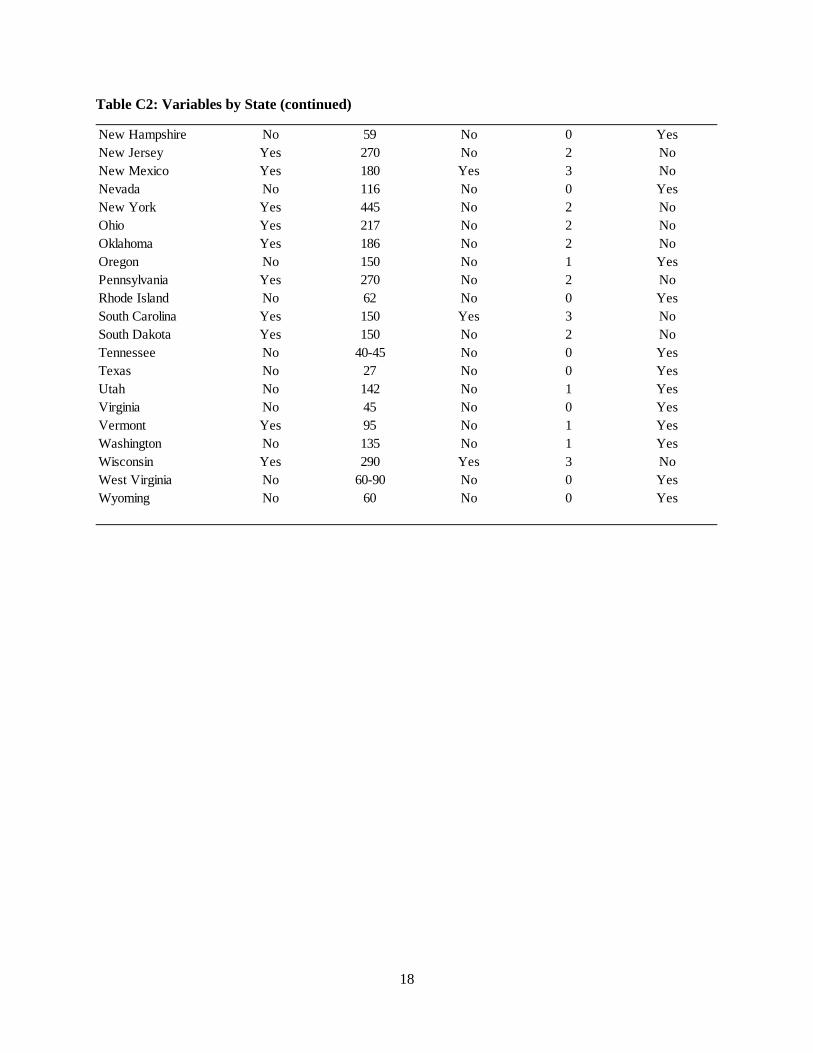
Table C2: Variables by State (continued)
New Hampshire No 59 No 0 YesNew Jersey Yes 270 No 2 NoNew Mexico Yes 180 Yes 3 NoNevada No 116 No 0 YesNew York Yes 445 No 2 NoOhio Yes 217 No 2 NoOklahoma Yes 186 No 2 NoOregon No 150 No 1 YesPennsylvania Yes 270 No 2 NoRhode Island No 62 No 0 YesSouth Carolina Yes 150 Yes 3 NoSouth Dakota Yes 150 No 2 NoTennessee No 40-45 No 0 YesTexas No 27 No 0 YesUtah No 142 No 1 YesVirginia No 45 No 0 YesVermont Yes 95 No 1 YesWashington No 135 No 1 YesWisconsin Yes 290 Yes 3 NoWest Virginia No 60-90 No 0 YesWyoming No 60 No 0 Yes
19
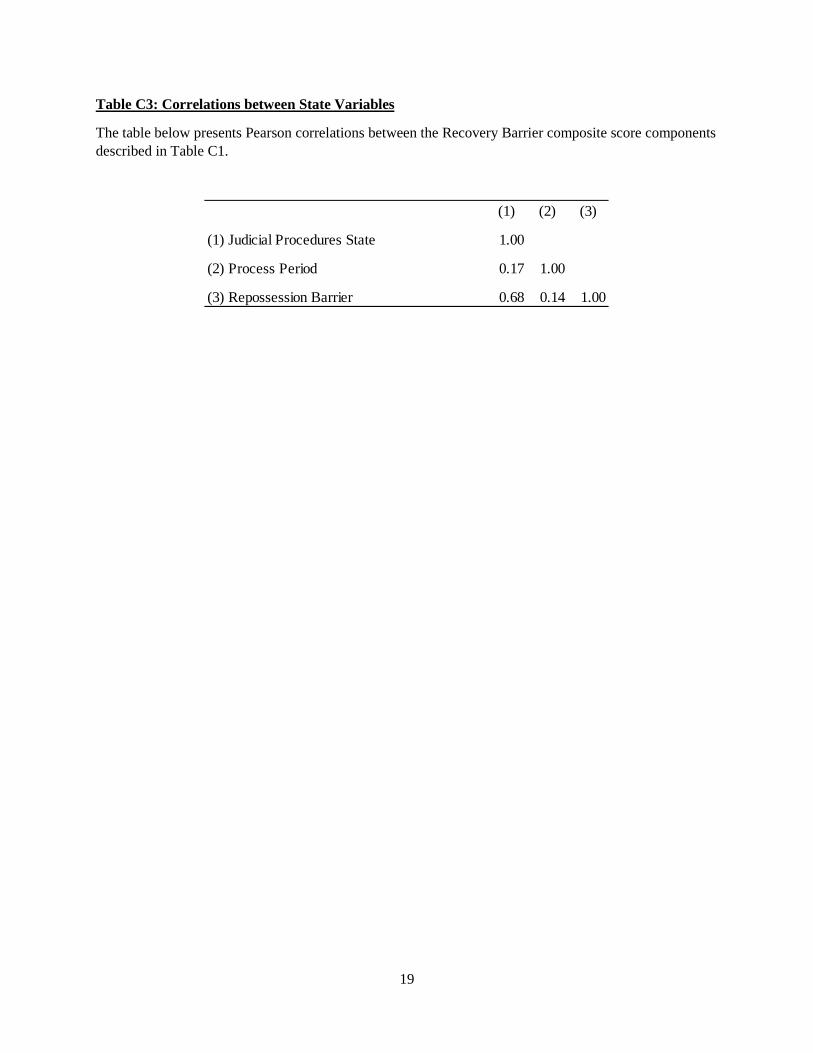
Table C3: Correlations between State Variables
The table below presents Pearson correlations between the Recovery Barrier composite score components described in Table C1.
(1) (2) (3)
(1) Judicial Procedures State 1.00
(2) Process Period 0.17 1.00
(3) Repossession Barrier 0.68 0.14 1.00
20
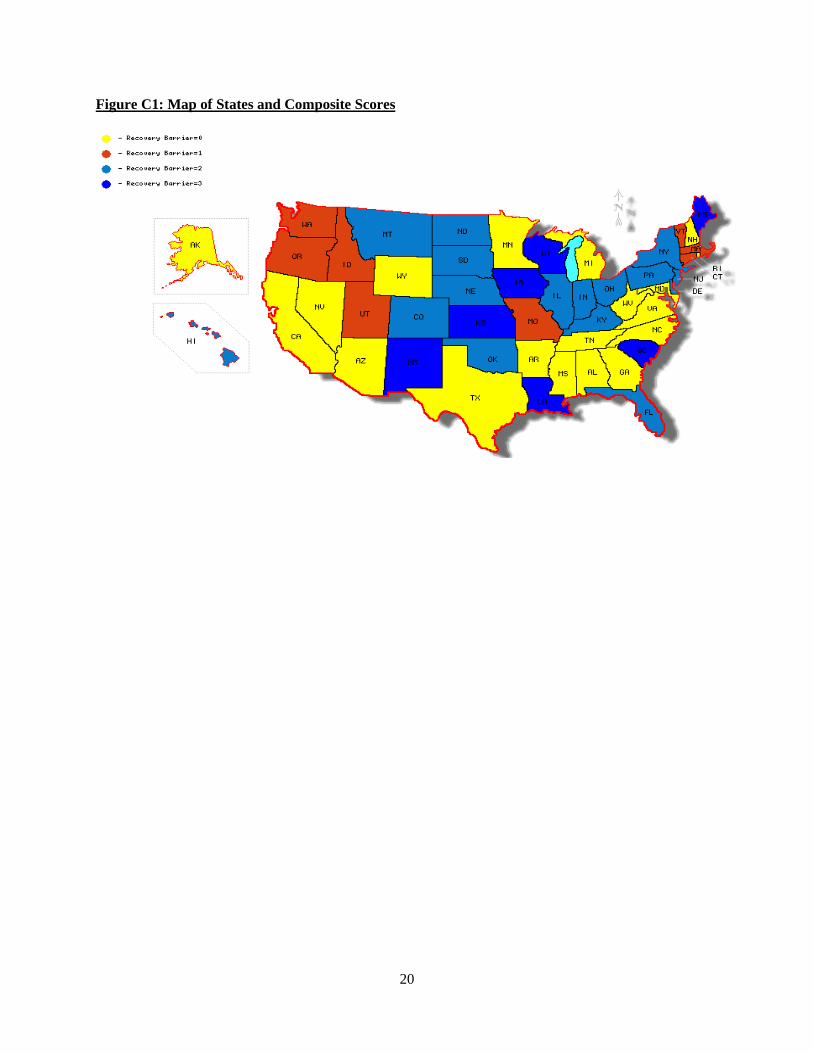
Figure C1: Map of States and Composite Scores
21
References
BERGER, A., and G. UDELL. “A More Complete Conceptual Framework for SME Finance.” Journal of Banking and Finance 30 (2006): 2945-2966.
BROWN, D., B. CIOCHETTI, and T. RIDDIOUGH. “Theory and Evidence on the Resolution of Financial Distress.” Review of Financial Studies 19 (2006): 1357-1397.
CREDIT INFOCENTER. “Automobile Repossession Laws by State.” (n.d.). Retrieved September 16, 2013, from http://www.creditinfocenter.com/legal/auto-repossession-laws.shtml.
DEGRYSE, H., M. KIM, and S. ONGENA. Microeconometrics of Banking: Methods, Applications, and Results. Oxford University Press, USA, 2009.
DILGER, R. “Small Business Administration 7(a) Loan Guaranty Program.” Congressional Research Service, R41146. 2013.
FREIXAS, X. and J.C. ROCHET. Microeconomics of Banking. Vol. 2. Cambridge, MA: MIT press, 1997.
GUP, B. and J. KOLARI. Commercial Banking. 3rd ed. John Wiley & Sons. 2005.
MIAN, A., A. SUFI, and F. TREBBI. “Foreclosures, House Prices, and the Real Economy.” Journal of Finance (forthcoming).
MORTGAGE BANKERS ASSOCIATION. “Judicial versus Non-Judicial Foreclosure.” (n.d.) Retrieved September 16, 2013, from http://www.mbaa.org/files/ResourceCenter/ForeclosusreProcess/JudicialVersusNon-JudicialForeclosure.pdf
OFFICE OF THE COMPTROLLER OF THE CURRENCY. “Rating Credit Risk: Comptroller’s Handbook.” April 2001.
REALTYTRAC. “Foreclosure Laws and Procedures by State”. (n.d.) Retrieved September 16,
2013, from http://www.realtytrac.com/foreclosure-laws/foreclosure-laws-comparison.asp