Embed Size (px)
Citation preview
Board of Water Supply City and County of Honolulu
FINANCIAL STATEMENTS AND SUPPLEMENTARY INFORMATION
WITH INDEPENDENT AUDITOR’S REPORT
Fiscal Years Ended June 30, 2017 and 2016
2
BOARD OF WATER SUPPLY CITY AND COUNTY OF HONOLULU
TABLE OF CONTENTS Page INTRODUCTION 3 - 6 INDEPENDENT AUDITOR’S REPORT 7 - 9 MANAGEMENT’S DISCUSSION AND ANALYSIS 10 - 15 FINANCIAL STATEMENTS Statements of Net Position 16 - 17 Statements of Revenues, Expenses, and Changes in Net Position 18 Statements of Cash Flows 19 - 20 Notes to Financial Statements 21 - 50 REQUIRED SUPPLEMENTARY INFORMATION Schedule of Proportionate Share of the Net Pension Liability 52 Schedule of Contributions 53
Notes to Required Supplementary Information Required by GASB Statement No. 68 54
Schedule of Funding Progress 55
SUPPLEMENTARY INFORMATION Schedule of Bonds Payable 57 - 58 Schedules of Net Revenue Requirement 59
Board of Water Supply City and County of Honolulu
INTRODUCTION Fiscal Year Ended June 30, 2017
3
The Board of Water Supply of the City and County of Honolulu (BWS) is pleased to present its Annual Financial Report for Fiscal Year 2017. This introduction provides a brief overview of the mission, organization, and operations of the BWS. The following management’s discussion and analysis is intended to provide the reader with an easily understandable analysis of the BWS’s financial performance and all aspects of its financial position. Financial statements presenting the financial position and results of operations and cash flows of the BWS in conformity with accounting principles generally accepted in the United States of America, accompanied by the independent auditor’s report, follows the management’s discussion and analysis. HISTORY OF THE BOARD OF WATER SUPPLY
The BWS was created in 1929 by the Territorial Legislature in response to public outcry for a truly effective water management system that was above politics. The 1929 Legislature passed Act 96 to create and define the powers and duties of the Honolulu Board of Water Supply. Although it remained as a department of the City and County of Honolulu (City), the BWS was designed to be a semi-autonomous and self-supporting agency with the authority to charge for water usage to support its capital improvement and operating expenses and set long-term plans for Oahu’s water future.
POWERS, DUTIES, AND FUNCTIONS The BWS manages Oahu’s municipal water resources and distribution system, providing residents with a safe, dependable, and affordable drinking water supply. The BWS is the largest municipal water utility in the state of Hawaii. In Fiscal Year 2017, the BWS delivered potable and non-potable water to approximately one million customers on Oahu. The BWS carefully and proactively manages and invests in its intricate system, consisting of 94 active potable water sources, 171 reservoirs, and over 2,100 miles of pipeline. The BWS is a financially self-sufficient, semi-autonomous agency of the City and County of Honolulu. Its operations and projects are financed with revenues generated by water transmission and distribution fees. It receives no tax money from the City. The BWS also pursues federal and state grants to help subsidize BWS projects. The BWS is governed by a Board of Directors (Board), consisting of seven members. Five members are appointed by the Mayor and are confirmed by the Honolulu City Council. The remaining two serve in their capacities as the Director of the State Department of Transportation, and the Director and Chief Engineer of the City’s Department of Facility Maintenance. The Board appoints the BWS Manager and Chief Engineer to administer the BWS. The BWS consists of the following 10 divisions: Capital Projects Division, Customer Care Division, Field Operations Division, Finance Division, Information Technology Division, Land Division, Office of the Manager and Chief Engineer, Water Quality Division, Water Resources Division, and Water System Operations Division.
Board of Water Supply City and County of Honolulu
INTRODUCTION Fiscal Year Ended June 30, 2017
4
MISSION The BWS mission is to provide a safe, dependable, and affordable water supply now and into the future, focusing in three strategic areas: resource, operational, and financial sustainability.
Resource sustainability. Protect and manage our groundwater supplies and watersheds through adaptive and integrated strategies.
Operational sustainability. Foster a resilient and collaborative organization utilizing effective and proactive operational practices consistent with current industry standards.
Financial sustainability. Implement sound fiscal strategies to finance our operating and capital needs to provide dependable and affordable water service.
ACCOMPLISHMENTS
BWS employees work diligently to provide safe, dependable, and affordable water service to customers by concentrating their efforts to achieve the BWS’s strategic goals:
Resource Sustainability (Safe)
• The BWS conducted 59,862 chemical tests, 10,843 microbiological tests, and 15,114 chlorine residual and other quality tests on samples collected from its sources, distribution systems, and treatment facilities to ensure all water served is safe to drink. Chemical tests performed this fiscal year include monitoring BWS wells near the Navy Red Hill Bulk Fuel Facility in response to a fuel leak reported by the Navy in January 2014. BWS is conducting its own studies to assess the impact the leak may have on the groundwater aquifer.
• In June 2017, BWS completed its annual production and delivery of the Consumer Confidence Report (CCR), also known as the Water Quality Report, to all BWS customers. The report provides information on the quality of the water delivered from the BWS system and was mailed to all customers on record and is also available at www.boardofwatersupply.com. The BWS also placed ads in Honolulu newspapers, including various ethnic language publications, to inform community members of the distribution.
• Potable water demand continues its downward trend of approximately 10% from 1990 to 2017 due to advanced water conservation efforts, economic incentives from sewer and water rate increases, recycled water, public education, and leak detection and repair programs in the BWS water system.
• The North Shore Watershed Management Plan (WMP) was adopted in FY 2017. The WMPs for the Ewa and Central Oahu districts are on-going. Work on the Primary Urban Core WMPs has started with the first community meeting in May 2017. These are long-range water resource protection and water use and development plans for the City that are concurrent with and support the City’s Development and Sustainable Communities Plans for Oahu. The WMPs guide the BWS’s long-range capital improvement program, ensuring that adequate natural and alternative water supplies are available to meet Oahu’s future water growth.
Board of Water Supply City and County of Honolulu
INTRODUCTION Fiscal Year Ended June 30, 2017
5
• Recycled water is an important conservation strategy to reduce potable water consumption to extend our high-quality water supplies. Recycled water use from the Honouliuli Water Recycling Facility provides an alternative water supply in Ewa for irrigation and industrial purposes. Recycled water production from the BWS Honouliuli Water Recycling Facility averaged approximately eight million gallons per day. BWS is seeking State of Hawaii land to construct an elevated recycled water reservoir, which will increase recycled water use in Ewa.
• BWS staff held 41 outdoor water conservation classes at the Halawa Xeriscape Garden. 525 community members attended these classes focused on reducing water use through efficient landscaping.
• The BWS sponsored its 39th annual Water Conservation Week Poster Contest and the 9th annual Water Conservation Week Poetry Contest, receiving more than 870 posters and 300 poems from more than 50 Oahu schools, focused on the theme "Water Matters -- Conserve It." All winning entries will be featured in the 2018 Water Conservation Calendar scheduled for distribution in December 2017.
• The BWS started efforts to implement a pilot Water Conservation program, to begin in FY17, leveraging mobile app and web technologies to encourage water savings through targeted, direct customer engagements and the use of data analytics.
Operational Sustainability (Dependable)
• The Water Master Plan (WMP), which is a comprehensive evaluation of our water supplies, needs, and infrastructure over a 30-year period was adopted in October 2016. The 30-year CIP will follow as well as the financial plan and water rate study thereafter. In May of 2017, we celebrated the two-year anniversary of the formation of the BWS Stakeholder Advisory Group (SAG). The group comprises nearly 30 highly respected local residents, civic organization leaders, and environmental and business professionals with a sustained interest in water issues, with representation covering all City Council districts. The SAG effort demonstrates BWS’s commitment to increase our responsiveness and transparency of our communications and public engagement.
• In January of FY 2017, BWS launched a complete redesign of their intranet. It now matches the updated website and allows for easier access of documents and other important information for BWS employees. Also part of this is a section that provides regular updates on information and news of importance to BWS employees. All departments work with Communications to issue these News to Use bulletins.
• The development of a new Customer Self-Service web portal, and an Interactive Voice Response (IVR) capability integrated with our Customer Care and Billing system was initiated in FY 2017 and is on-going. This will provide our customers the ability to initiate actions and interactions with the BWS, at their convenience, without having to call in and speak with a Customer Service Representative.
• BWS staff responded to 346 main breaks, or about 16 breaks per 100 miles of pipeline.
• BWS staff helped protect Oahu's water resources and prevent damage to BWS infrastructure by handling 9,327 One Call locate requests and providing in-field support for 838 water line leaks and breaks. The BWS staff proactively investigated 26,903 meters to ensure accurate and timely billing and assisted 4,139 customers with concerns about bills reflecting high water consumption.
Board of Water Supply City and County of Honolulu
INTRODUCTION Fiscal Year Ended June 30, 2017
6
• BWS staff assisted 167,072 customers: 150,993 (90.3%) by phone; 4,559 (2.7%) in-person; 11,316 (6.8%) via online forms; 264 (0.2%) through email, by mail and fax.
Financial Sustainability (Affordable)
• A total of over $52.3 million in construction contracts and over $14.2 million in professional services contracts were awarded as of June 30, 2017. The major programs include the following:
o Water Main Replacement Program: Aging and corroded water mains are
systematically identified and replaced throughout the municipal water system to improve system reliability, reduce main breaks, and to ensure sufficient system pressure during periods of peak demand. In conjunction with main replacement projects, existing fire hydrants are replaced and new hydrants are installed to improve fire protection and ensure that current standards are met. Over $14.7 million in design contracts were awarded by the BWS for water main replacements in Aiea, Manoa, Wilhemina Rise, Hawaii Kai, Wahiawa, and Kaneohe.
o Water Facility Improvement Program: Identification and improvements of
deficiencies to the appearance and integrity of aging BWS water facilities continues. These facilities include water reservoirs, wells and booster stations, and administrative offices belonging to the BWS. New construction contracts were awarded to repair, renovate, repaint and/or reroof the Wahiawa 1361 Reservoirs No. 1 and No. 2, Makakilo 920 and Waipahu 228 Reservoirs, Kalihi Corporation Yard Lighting, Beretania Engineering Building, Beretania Public Service Building, and security fencing at various locations.
o Mechanical and Electrical Renovation Projects: Renovation projects ensure the
dependable service and operational efficiency of the BWS's pump and booster stations. Construction contracts were awarded for the renovation of the mechanical and/or electrical systems at Mililani Wells I, Honouliuli Wells Unit 2, Kamaile Wells, Waialae Iki Well, and the Diamond Head Line Booster.
• BWS executed and began its 20-year, $33 million Energy Savings Performance Contract
(ESPC) with NORESCO LLC. The partnership allows BWS to implement comprehensive energy efficiency, renewable energy, and operational improvements which guarantees enough energy savings over the next 20 years to pay for the contract. The project is financed by a loan from the Drinking Water State Revolving Fund, managed by the State of Hawaii Department of Health.
• BWS staff received mail-in payments via lockbox, which continued to be the most popular
method of payment for BWS customers, with 36% using the service, down 3% from last fiscal year. Automatic bill payments account for 31% of the BWS’ total bill collections. Credit card payments account for 16% of payments, a 16% increase over last fiscal year. Online payments account for 9%, walk-in customers for 4%, payments made at satellite city hall locations for 3%, and other accounts for 1% of payments received.
7
N&K CPAs, Inc. ACCOUNTANTS | CONSULTANTS
AMERICAN SAVINGS BANK TOWER 1001 BISHOP STREET, SUITE 1700 HONOLULU, HAWAII 96813-3696
T (808) 524-2255 F (808) 523-2090
INDEPENDENT AUDITOR’S REPORT To the Board of Directors Board of Water Supply City and County of Honolulu Report on the Financial Statements We have audited the accompanying financial statements of the Board of Water Supply (the “BWS”), a component unit of the City and County of Honolulu (the “City”), as of and for the fiscal years ended June 30, 2017 and 2016, and the related notes to the financial statements, which collectively comprise the BWS’s basic financial statements as listed in the table of contents. Management’s Responsibility for the Financial Statements Management is responsible for the preparation and fair presentation of these financial statements in accordance with accounting principles generally accepted in the United States of America; this includes the design, implementation, and maintenance of internal control relevant to the preparation and fair presentation of financial statements that are free from material misstatement, whether due to fraud or error. Auditor’s Responsibility Our responsibility is to express an opinion on these financial statements based on our audits. We conducted our audits in accordance with auditing standards generally accepted in the United States of America and the standards applicable to financial audits contained in Government Auditing Standards, issued by the Comptroller General of the United States. Those standards require that we plan and perform the audit to obtain reasonable assurance about whether the financial statements are free from material misstatement. An audit involves performing procedures to obtain audit evidence about the amounts and disclosures in the financial statements. The procedures selected depend on the auditor’s judgment, including the assessment of the risks of material misstatement of the financial statements, whether due to fraud or error. In making those risk assessments, the auditor considers internal control relevant to the entity’s preparation and fair presentation of the financial statements in order to design audit procedures that are appropriate in the circumstances, but not for the purpose of expressing an opinion
8
N&K CPAs, Inc. ACCOUNTANTS | CONSULTANTS
on the effectiveness of the entity’s internal control. Accordingly, we express no such opinion. An audit also includes evaluating the appropriateness of accounting policies used and the reasonableness of significant accounting estimates made by management, as well as evaluating the overall presentation of the financial statements.
We believe that the audit evidence we have obtained is sufficient and appropriate to provide a basis for our audit opinion.
Opinion
In our opinion, the financial statements referred to above present fairly, in all material respects, the financial position of the BWS as of June 30, 2017 and 2016, and the changes in its financial position and its cash flows for the fiscal years then ended in accordance with accounting principles generally accepted in the United States of America.
Emphasis of Matter
As discussed in Note B, the financial statements of the BWS are intended to present the financial position, the changes in financial position, and cash flows of only that portion of the governmental activities, the business-type activities, each major fund, and the aggregate remaining fund information of the City that is attributable to the transactions of the BWS. They do not purport to, and do not, present fairly the financial position of the City as of June 30, 2017 and 2016, the changes in its financial position, or its cash flows for the fiscal years then ended in accordance with accounting principles generally accepted in the United States of America. Our opinion is not modified with respect to this matter.
Adoption of New Accounting Principle
As discussed in Note P to the basic financial statements, the BWS adopted new accounting guidance that clarifies standards for accounting and financial reporting for pensions that are provided to the employees of state and local governmental employers. Our opinion is not modified with respect to this matter.
Other Matters
Required Supplementary Information
Accounting principles generally accepted in the United States of America require that management’s discussion and analysis on pages 10 through 15 and the schedules of proportionate share of the net pension liability, contributions, and funding progress on pages 52 to 55 be presented to supplement the basic financial statements. Such information, although not a part of the basic financial statements, is required by the Governmental Accounting Standards Board who considers it to be an essential part of financial reporting for placing the basic financial statements in an appropriate operational, economic, or historical context. We have applied certain limited procedures to the required supplementary information in accordance with auditing standards generally accepted in the United States of America, which consisted of inquiries of
9
N&K CPAs, Inc. ACCOUNTANTS | CONSULTANTS
management about the methods of preparing the information and comparing the information for consistency with management’s responses to our inquiries, the basic financial statements, and other knowledge we obtained during our audit of the basic financial statements. We do not express an opinion or provide any assurance on the information because the limited procedures do not provide us with sufficient evidence to express an opinion or provide any assurance.
Other Information
Our audit was conducted for the purpose of forming an opinion on the financial statements that collectively comprise the BWS’s basic financial statements. The introductory section and schedules of bonds payable and net revenue requirement are presented for purposes of additional analysis and are not a required part of the basic financial statements.
The schedules of bonds payable and net revenue requirement are the responsibility of management and were derived from and relate directly to the underlying accounting and other records used to prepare the basic financial statements. Such information has been subjected to the auditing procedures applied in the audit of the basic financial statements and certain additional procedures, including comparing and reconciling such information directly to the underlying accounting and other records used to prepare the basic financial statements or to the basic financial statements themselves, and other additional procedures in accordance with auditing standards generally accepted in the United States of America. In our opinion, the schedules of bonds payable and net revenue requirement are fairly stated, in all material respects, in relation to the basic financial statements as a whole.
The introductory section has not been subjected to the auditing procedures applied in the audit of the basic financial statements and, accordingly, we do not express an opinion or provide any assurance on it.
Other Reporting Required by Government Auditing Standards
In accordance with Government Auditing Standards, we have also issued our report dated December 11, 2017 on our consideration of the BWS’s internal control over financial reporting and on our tests of its compliance with certain provisions of laws, regulations, contracts, and grant agreements and other matters. The purpose of that report is solely to describe the scope of our testing of internal control over financial reporting and compliance and the results of that testing, and not to provide an opinion on the effectiveness of the BWS’s internal control over financial reporting or on compliance. That report is an integral part of an audit performed in accordance with Government Auditing Standards in considering the BWS’s internal control over financial reporting and compliance.
Honolulu, Hawaii December 11, 2017
Board of Water Supply City and County of Honolulu
MANAGEMENT’S DISCUSSION AND ANALYSIS Fiscal Years Ended June 30, 2017 and 2016
10
This section presents management’s discussion and analysis of the BWSʼs financial condition and activities for the fiscal year ended June 30, 2017. This information should be read in conjunction with the financial statements.
Financial Highlights
The BWS still maintains a relatively strong financial performance with a manageable capital program. Meanwhile, management continues to carefully evaluate the BWSʼs finances to ensure optimum performance. In addition to meeting all debt covenants, outstanding debt and cash reserves were kept at levels appropriate for maintaining favorable bond ratings. Key financial highlights are listed below:
Net position increased $60.4 million in fiscal year 2017 compared to the $72.8 million increase in fiscal year 2016.
Total assets were $1.6 billion and $1.5 billion at June 30, 2017 and 2016, respectively, which exceeded liabilities by $1.1 billion at June 30, 2017 and 2016.
The BWSʼs current assets at June 30, 2017 were 3.7 times its related current liabilities compared to 2.6 times at June 30, 2016.
The BWSʼs debt to equity ratio was 26.7% and 28.3% at June 30, 2017 and 2016, respectively, indicating the continuance of capacity to issue additional debt.
Overview of Financial Report
The BWS is a semi-autonomous agency of the City. The financial statements are presented using the economic resources measurement focus and the accrual basis of accounting, whereby revenues and expenses are recognized in the period earned or incurred.
Managementʼs discussion and analysis (“MD&A”) represents managementʼs analysis and comments on the BWSʼs financial condition and performance. Summary financial data, key financial and operational indicators used in the BWSʼs annual report, budget, bond resolutions, and other management tools were used for this analysis.
The basic financial statements include statements of net position, statements of revenues, expenses and changes in net position, statements of cash flows, and notes to the financial statements. The statements of net position present the resources and obligations of the BWS at June 30, 2017 and 2016. The statements of revenues, expenses and changes in net position presents the changes in net position for the fiscal years then ended, and the resultant ending net position balances.
Board of Water Supply City and County of Honolulu
MANAGEMENT’S DISCUSSION AND ANALYSIS Fiscal Years Ended June 30, 2017 and 2016
11
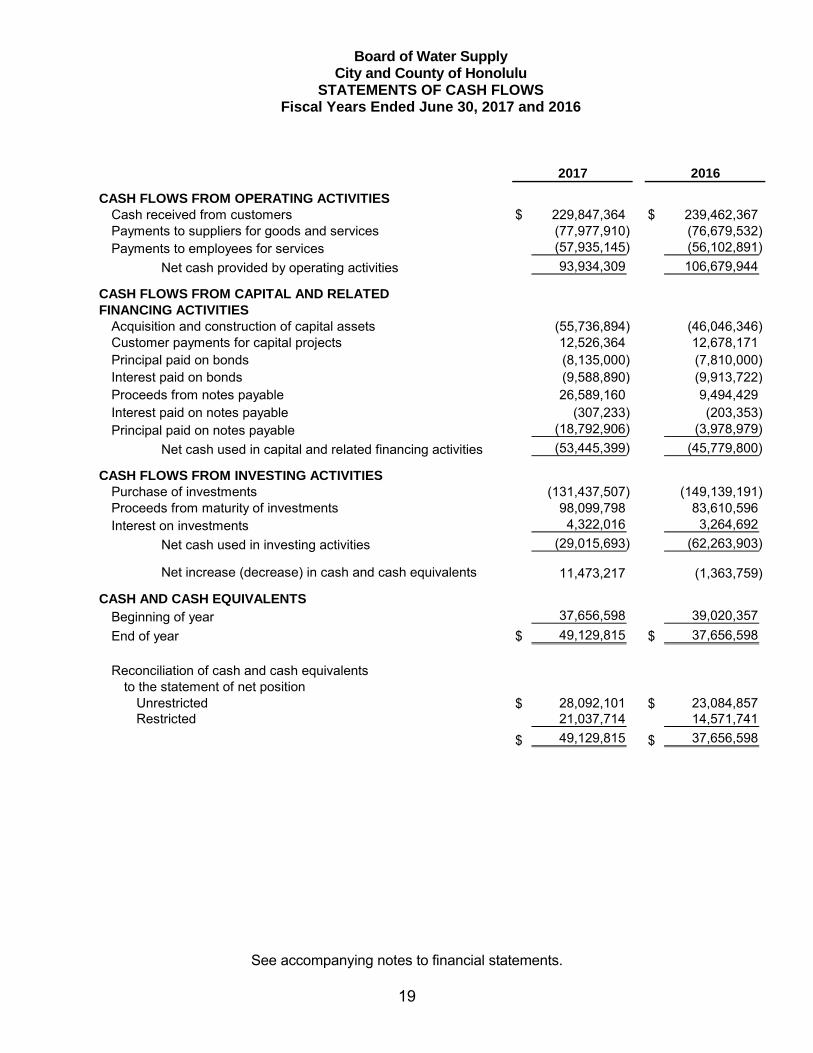
The statements of cash flows present changes in cash and cash equivalents (short-term investments with original maturities of three months or less from the date of acquisition), resulting from operating, investing, capital and related financing activities, and non-capital financing activities.
Results of Operations
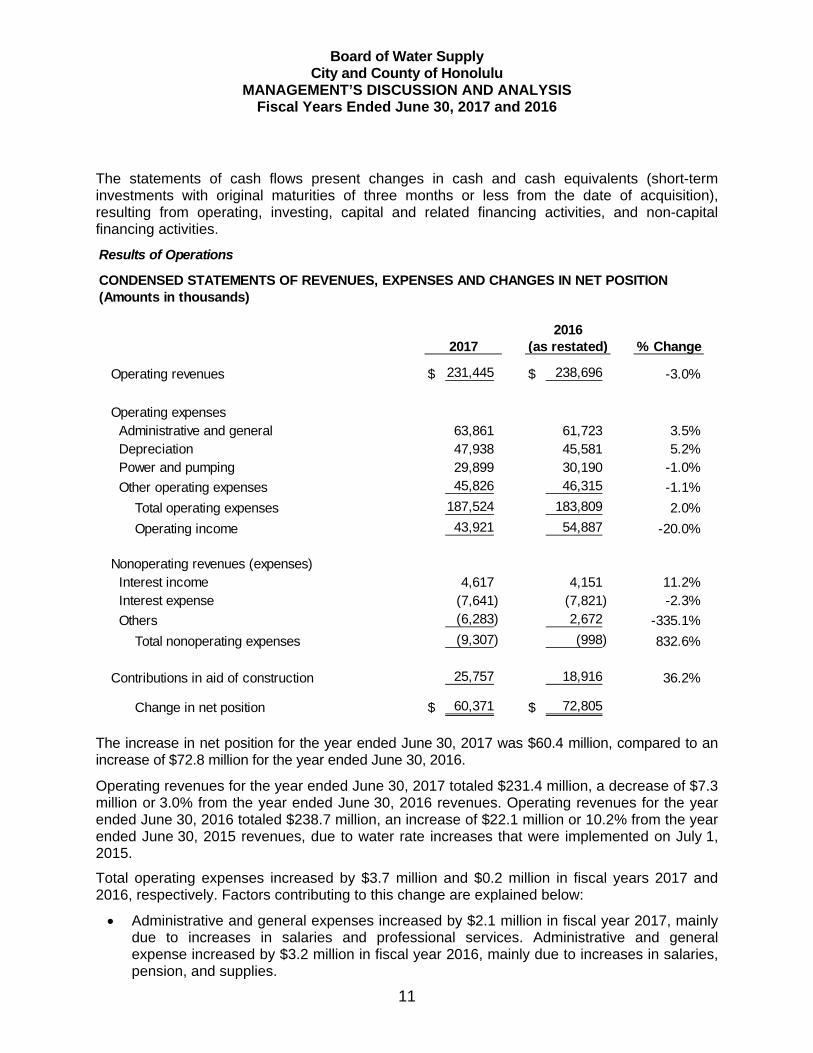
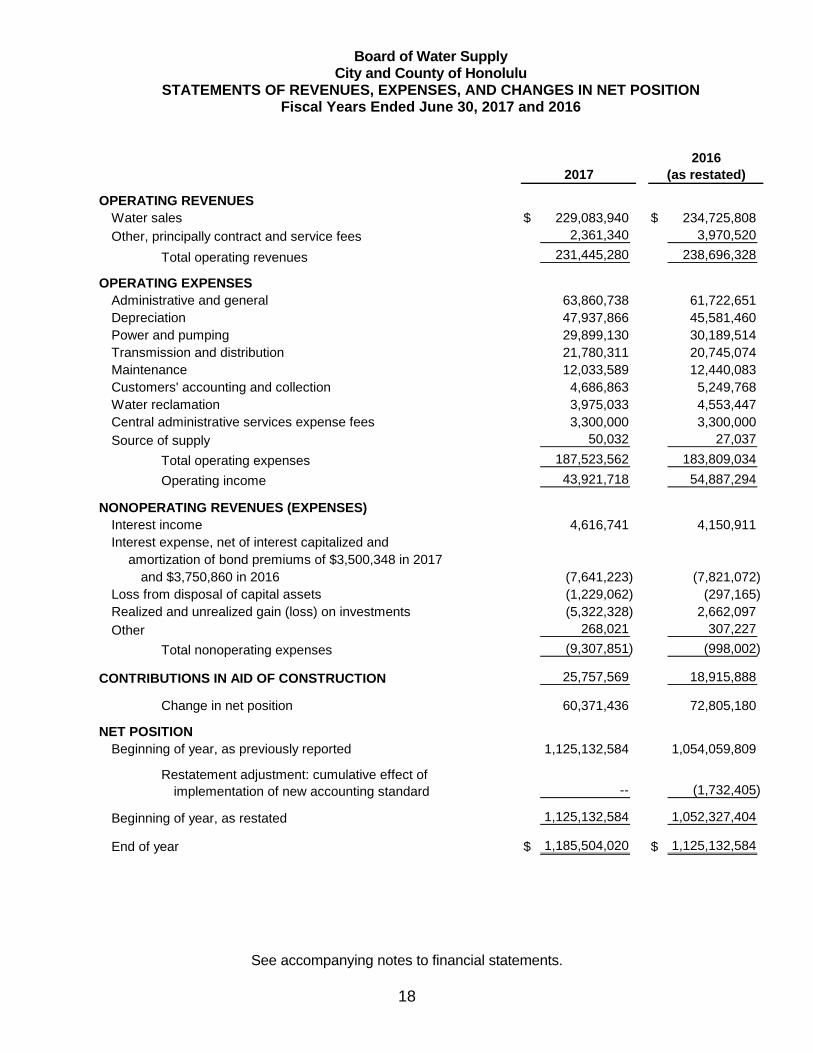
CONDENSED STATEMENTS OF REVENUES, EXPENSES AND CHANGES IN NET POSITION(Amounts in thousands)
% Change
Operating revenues $ 231,445 $ 238,696 -3.0%
Operating expenses Administrative and general 63,861 61,723 3.5% Depreciation 47,938 45,581 5.2% Power and pumping 29,899 30,190 -1.0%
Other operating expenses 45,826 46,315 -1.1%
Total operating expenses 187,524 183,809 2.0%
Operating income 43,921 54,887 -20.0%
Nonoperating revenues (expenses) Interest income 4,617 4,151 11.2% Interest expense (7,641) (7,821) -2.3%
Others (6,283) 2,672 -335.1%
Total nonoperating expenses (9,307) (998) 832.6%
Contributions in aid of construction 25,757 18,916 36.2%
Change in net position $ 60,371 $ 72,805
2017 (as restated)2016
The increase in net position for the year ended June 30, 2017 was $60.4 million, compared to an increase of $72.8 million for the year ended June 30, 2016.
Operating revenues for the year ended June 30, 2017 totaled $231.4 million, a decrease of $7.3 million or 3.0% from the year ended June 30, 2016 revenues. Operating revenues for the year ended June 30, 2016 totaled $238.7 million, an increase of $22.1 million or 10.2% from the year ended June 30, 2015 revenues, due to water rate increases that were implemented on July 1, 2015.
Total operating expenses increased by $3.7 million and $0.2 million in fiscal years 2017 and 2016, respectively. Factors contributing to this change are explained below:
Administrative and general expenses increased by $2.1 million in fiscal year 2017, mainly due to increases in salaries and professional services. Administrative and general expense increased by $3.2 million in fiscal year 2016, mainly due to increases in salaries, pension, and supplies.
Board of Water Supply City and County of Honolulu
MANAGEMENT’S DISCUSSION AND ANALYSIS Fiscal Years Ended June 30, 2017 and 2016
12
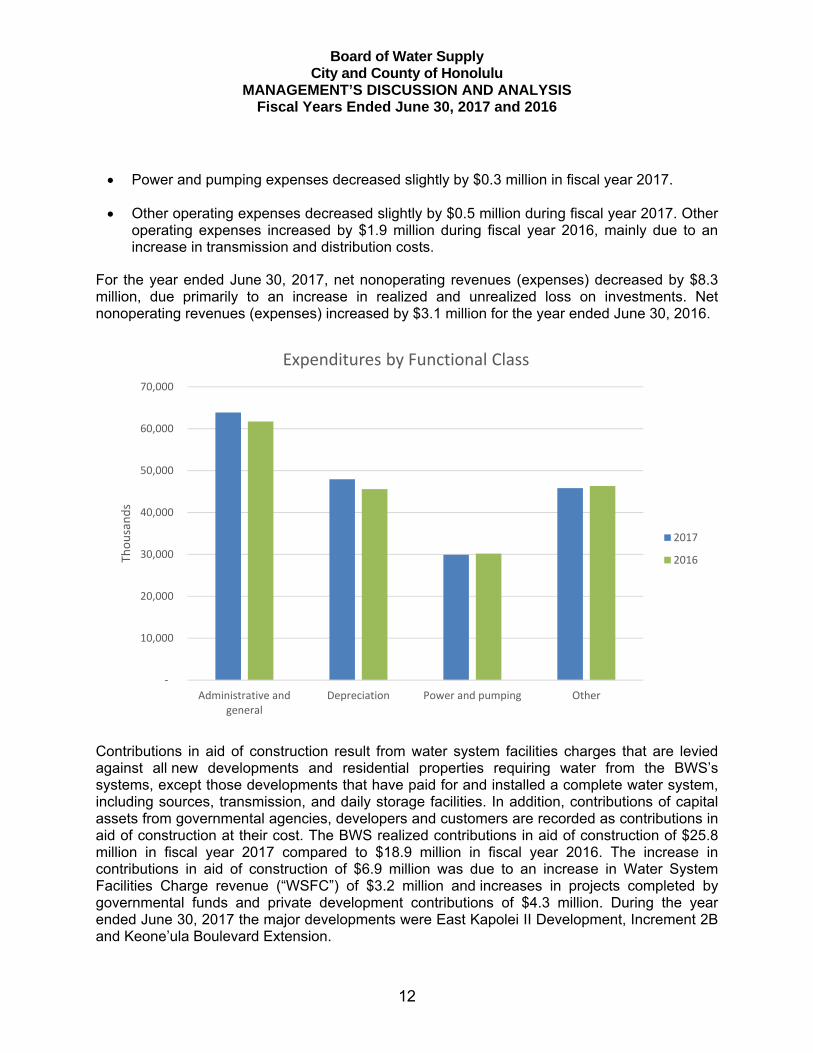
Power and pumping expenses decreased slightly by $0.3 million in fiscal year 2017.
Other operating expenses decreased slightly by $0.5 million during fiscal year 2017. Other operating expenses increased by $1.9 million during fiscal year 2016, mainly due to an increase in transmission and distribution costs.
For the year ended June 30, 2017, net nonoperating revenues (expenses) decreased by $8.3 million, due primarily to an increase in realized and unrealized loss on investments. Net nonoperating revenues (expenses) increased by $3.1 million for the year ended June 30, 2016.
Contributions in aid of construction result from water system facilities charges that are levied against all new developments and residential properties requiring water from the BWSʼs systems, except those developments that have paid for and installed a complete water system, including sources, transmission, and daily storage facilities. In addition, contributions of capital assets from governmental agencies, developers and customers are recorded as contributions in aid of construction at their cost. The BWS realized contributions in aid of construction of $25.8 million in fiscal year 2017 compared to $18.9 million in fiscal year 2016. The increase in contributions in aid of construction of $6.9 million was due to an increase in Water System Facilities Charge revenue (“WSFC”) of $3.2 million and increases in projects completed by governmental funds and private development contributions of $4.3 million. During the year ended June 30, 2017 the major developments were East Kapolei II Development, Increment 2B and Keone’ula Boulevard Extension.
‐
10,000
20,000
30,000
40,000
50,000
60,000
70,000
Administrative andgeneral
Depreciation Power and pumping Other
Thousands
Expenditures by Functional Class
2017
2016
Board of Water Supply City and County of Honolulu
MANAGEMENT’S DISCUSSION AND ANALYSIS Fiscal Years Ended June 30, 2017 and 2016
13
Financial Condition
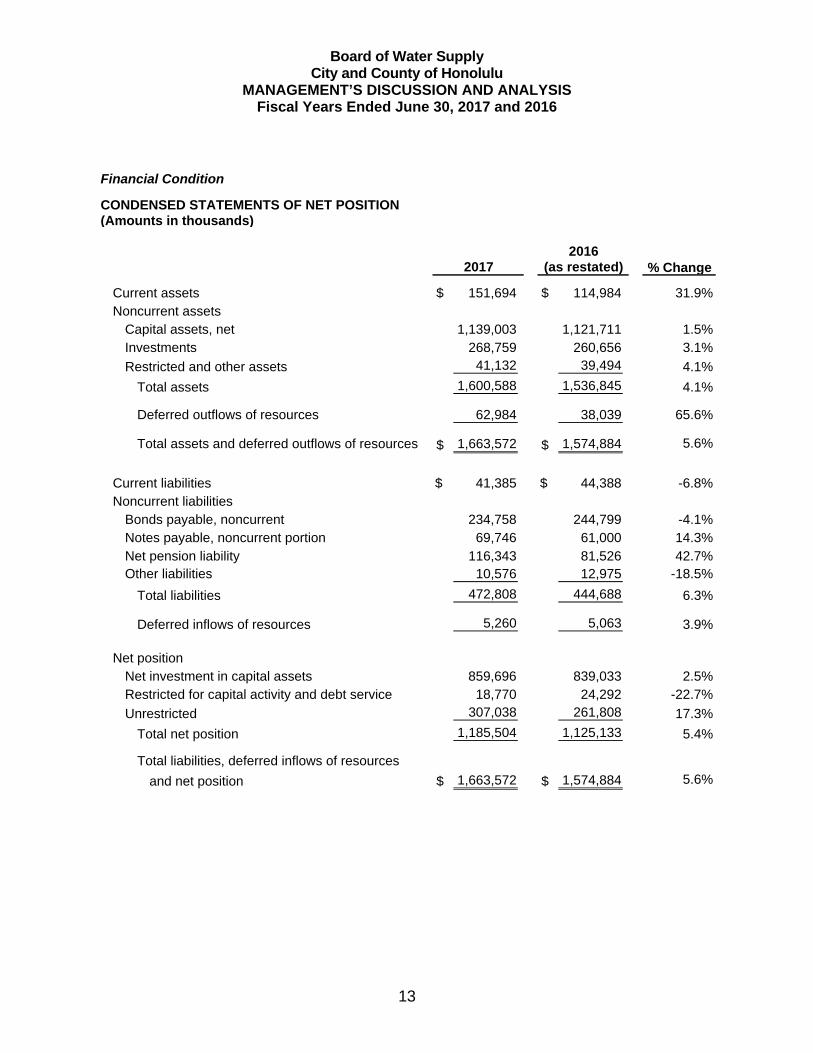
CONDENSED STATEMENTS OF NET POSITION(Amounts in thousands)
% Change
Current assets $ 151,694 $ 114,984 31.9%Noncurrent assets
Capital assets, net 1,139,003 1,121,711 1.5%Investments 268,759 260,656 3.1%
Restricted and other assets 41,132 39,494 4.1%
Total assets 1,600,588 1,536,845 4.1%
Deferred outflows of resources 62,984 38,039 65.6%
Total assets and deferred outflows of resources $ 1,663,572 $ 1,574,884 5.6%
Current liabilities $ 41,385 $ 44,388 -6.8%Noncurrent liabilities
Bonds payable, noncurrent 234,758 244,799 -4.1%Notes payable, noncurrent portion 69,746 61,000 14.3%Net pension liability 116,343 81,526 42.7%Other liabilities 10,576 12,975 -18.5%
Total liabilities 472,808 444,688 6.3%
Deferred inflows of resources 5,260 5,063 3.9%
Net positionNet investment in capital assets 859,696 839,033 2.5%Restricted for capital activity and debt service 18,770 24,292 -22.7%
Unrestricted 307,038 261,808 17.3%
Total net position 1,185,504 1,125,133 5.4%
Total liabilities, deferred inflows of resources
and net position $ 1,663,572 $ 1,574,884 5.6%
20172016
(as restated)
Board of Water Supply City and County of Honolulu
MANAGEMENT’S DISCUSSION AND ANALYSIS Fiscal Years Ended June 30, 2017 and 2016
14
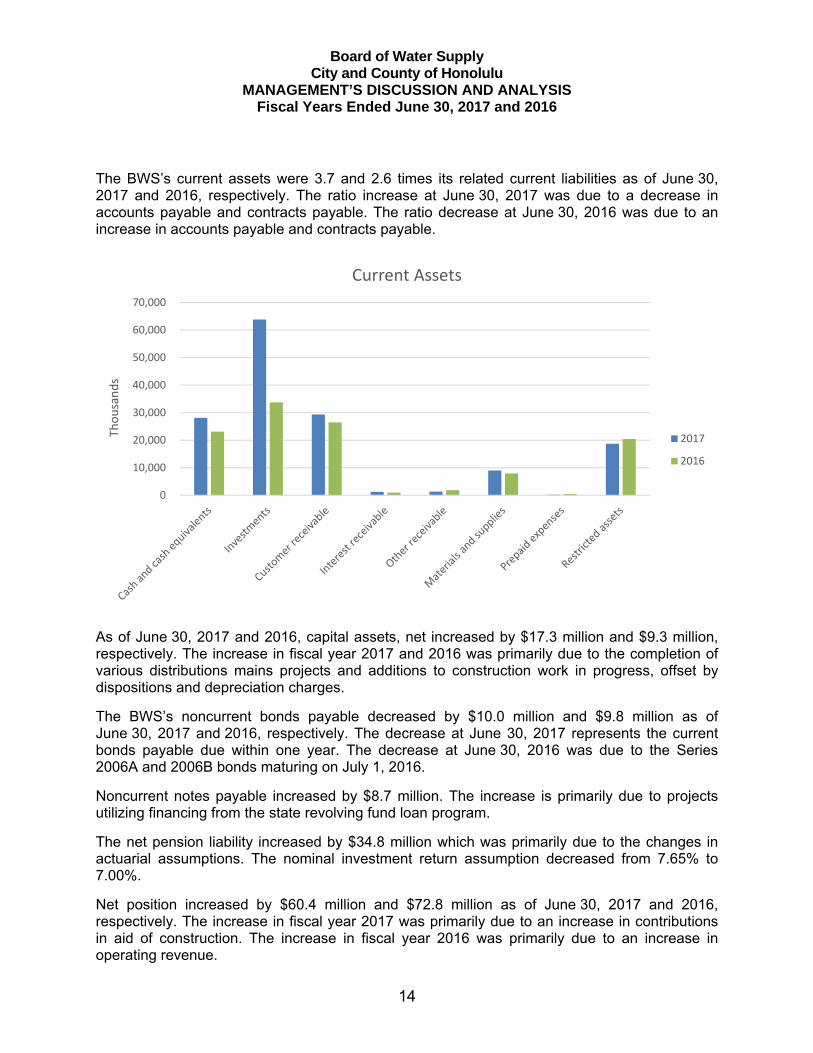
The BWS’s current assets were 3.7 and 2.6 times its related current liabilities as of June 30, 2017 and 2016, respectively. The ratio increase at June 30, 2017 was due to a decrease in accounts payable and contracts payable. The ratio decrease at June 30, 2016 was due to an increase in accounts payable and contracts payable.
As of June 30, 2017 and 2016, capital assets, net increased by $17.3 million and $9.3 million, respectively. The increase in fiscal year 2017 and 2016 was primarily due to the completion of various distributions mains projects and additions to construction work in progress, offset by dispositions and depreciation charges.
The BWSʼs noncurrent bonds payable decreased by $10.0 million and $9.8 million as of June 30, 2017 and 2016, respectively. The decrease at June 30, 2017 represents the current bonds payable due within one year. The decrease at June 30, 2016 was due to the Series 2006A and 2006B bonds maturing on July 1, 2016.
Noncurrent notes payable increased by $8.7 million. The increase is primarily due to projects utilizing financing from the state revolving fund loan program.
The net pension liability increased by $34.8 million which was primarily due to the changes in actuarial assumptions. The nominal investment return assumption decreased from 7.65% to 7.00%.
Net position increased by $60.4 million and $72.8 million as of June 30, 2017 and 2016, respectively. The increase in fiscal year 2017 was primarily due to an increase in contributions in aid of construction. The increase in fiscal year 2016 was primarily due to an increase in operating revenue.
0
10,000
20,000
30,000
40,000
50,000
60,000
70,000
Thousands
Current Assets
2017
2016
Board of Water Supply City and County of Honolulu
MANAGEMENT’S DISCUSSION AND ANALYSIS Fiscal Years Ended June 30, 2017 and 2016
15
Capital Assets and Long-Term Debt
During fiscal years 2017 and 2016, the BWS capitalized $56.3 million and $32.6 million, respectively, to its utility plant in service. Major assets added in fiscal year 2017 were Kapiolani Boulevard 12” Main, $5.2 million; Kunia Wells II Renovation, $4.3 million; Water Main Replacements at Various Streets, $4.1 million, Pensacola Street Water System Improvements, $3.2 million; Liliha Water System Improvements; Phase A, $2.8 million; and Slope Stabilization at Waialae Iki 1080, Kamehame 500, Hahaione 500, and Kalama 170 Reservoirs, $2.7 million.
The BWS issues long-term bonds to finance part of its capital improvement program. The BWSʼs debt to equity ratio has remained fairly constant at 26.7%, 28.3% and 30.6% for fiscal years 2017, 2016 and 2015, respectively.
All outstanding bonds have been assigned underlying ratings of Aa2 from Moodyʼs Investors Service and AA+ from Fitch Ratings.
Rate Covenant
The BWS is required under its bond indenture, among other things, to fix, charge and collect such rates and other charges in each fiscal year to meet the net revenue requirement for such fiscal year. The net revenue requirement is the greater of 1) the sum of the aggregate debt service and all deposits required by bond resolution to be made, or 2) 1.20 times the aggregate debt service. The BWS met the net revenue requirements for the fiscal years ended June 30, 2017 and 2016.
Request for Information
This financial report is designed to provide a general overview of the BWSʼs finances. Questions concerning any of the information provided in this report or requests for additional financial information should be addressed to the Board of Water Supply, City and County of Honolulu, 630 S. Beretania Street, Honolulu, Hawaii 96813.
Board of Water Supply City and County of Honolulu
STATEMENTS OF NET POSITION June 30, 2017 and 2016
See accompanying notes to financial statements.
16
ASSETSCurrent assets
Cash and cash equivalents $ 28,092,101 $ 23,084,857 Investments 63,806,798 33,721,976 Interest receivable 1,263,738 969,013 Customer receivables
Billed, less allowances for uncollectible accounts of $2,529,056 in 2017 and $2,615,737 in 2016 17,238,263 14,188,771
Unbilled 12,070,707 12,299,162 Other receivables, less allowances for uncollectible
accounts of $510,868 in 2017 and 2016 1,335,080 1,891,233 Materials and supplies 8,989,621 7,900,769 Prepaid expenses 204,367 461,200 Restricted assets
Cash and cash equivalents 18,693,705 14,571,741 Investments -- 5,895,469
Total current assets 151,694,380 114,984,191
Noncurrent assetsCapital assets
Infrastructure 1,504,279,618 1,469,794,915 Building and improvements 169,870,257 164,492,090 Equipment and machinery 317,240,982 305,454,875
1,991,390,857 1,939,741,880Less accumulated depreciation (983,717,510) (937,722,307)
1,007,673,347 1,002,019,573 Land 32,373,064 32,373,064 Construction work in progress 98,956,663 87,318,572
Net capital assets 1,139,003,074 1,121,711,209
Investments 268,759,415 260,655,703
Restricted assetsCash and cash equivalents 2,344,009 -- Investments 23,022,759 27,300,443
Other postemployment benefits asset 15,734,883 12,162,155Other assets 29,525 31,370
Total noncurrent assets 1,448,893,665 1,421,860,880
Total assets 1,600,588,045 1,536,845,071
DEFERRED OUTFLOWS OF RESOURCESDeferred loss on refunding of debt 18,599,198 20,112,402 Deferred outflows of resources related to pensions 44,384,811 17,926,992
Total deferred outflows of resources 62,984,009 38,039,394
Total assets and deferred outflows of resources $ 1,663,572,054 $ 1,574,884,465
2017 (as restated)2016
Board of Water Supply City and County of Honolulu
STATEMENTS OF NET POSITION (Continued) June 30, 2017 and 2016
See accompanying notes to financial statements.
17
LIABILITIESCurrent liabilities
Payable from current assetsAccounts payable $ 9,798,139 $ 11,465,798Contracts payable, including retainages 5,989,963 6,389,575Accrued vacation, current portion 3,029,874 2,492,417Accrued workers' compensation, current portion 741,279 916,000
Other 3,131,876 2,657,135
Total payable from current assets 22,691,131 23,920,925
Payable from restricted assetsContracts payable, including retainages 2,222,787 3,007,142Accrued interest payable 4,844,139 5,113,740Bonds payable, current portion 8,365,000 8,135,000
Notes payable, current portion 3,261,779 4,211,328
Total payable from restricted assets 18,693,705 20,467,210
Total current liabilities 41,384,836 44,388,135
Noncurrent liabilitiesBonds payable, noncurrent 234,757,539 244,798,748Notes payable, noncurrent portion 69,746,122 61,000,319Net pension liability 116,342,916 81,526,553 Accrued vacation, noncurrent portion 3,946,625 4,302,997Accrued workers' compensation 1,525,876 1,880,735Customer advances 1,529,622 3,335,490
Other 3,574,344 3,455,480
Total noncurrent liabilities 431,423,044 400,300,322
Total liabilities 472,807,880 444,688,457
DEFERRED INFLOWS OF RESOURCESDeferred inflows of resources related to pensions 5,260,154 5,063,424
Total deferred inflows of resources 5,260,154 5,063,424
NET POSITIONNet investment in capital assets 859,695,807 839,032,962 Restricted for capital activity and debt service 18,769,572 24,292,025
Unrestricted 307,038,641 261,807,597
Total net position 1,185,504,020 1,125,132,584
Total liabilities, deferred inflows of resources
and net position $ 1,663,572,054 $ 1,574,884,465
2017 (as restated)2016
Board of Water Supply City and County of Honolulu
STATEMENTS OF REVENUES, EXPENSES, AND CHANGES IN NET POSITION Fiscal Years Ended June 30, 2017 and 2016
See accompanying notes to financial statements.
18
OPERATING REVENUESWater sales $ 229,083,940 $ 234,725,808
Other, principally contract and service fees 2,361,340 3,970,520
Total operating revenues 231,445,280 238,696,328
OPERATING EXPENSESAdministrative and general 63,860,738 61,722,651 Depreciation 47,937,866 45,581,460Power and pumping 29,899,130 30,189,514 Transmission and distribution 21,780,311 20,745,074 Maintenance 12,033,589 12,440,083 Customers' accounting and collection 4,686,863 5,249,768 Water reclamation 3,975,033 4,553,447 Central administrative services expense fees 3,300,000 3,300,000 Source of supply 50,032 27,037
Total operating expenses 187,523,562 183,809,034
Operating income 43,921,718 54,887,294
NONOPERATING REVENUES (EXPENSES)Interest income 4,616,741 4,150,911Interest expense, net of interest capitalized and
amortization of bond premiums of $3,500,348 in 2017and $3,750,860 in 2016 (7,641,223) (7,821,072)
Loss from disposal of capital assets (1,229,062) (297,165) Realized and unrealized gain (loss) on investments (5,322,328) 2,662,097
Other 268,021 307,227
Total nonoperating expenses (9,307,851) (998,002)
CONTRIBUTIONS IN AID OF CONSTRUCTION 25,757,569 18,915,888
Change in net position 60,371,436 72,805,180
NET POSITIONBeginning of year, as previously reported 1,125,132,584 1,054,059,809
Restatement adjustment: cumulative effect ofimplementation of new accounting standard -- (1,732,405)
Beginning of year, as restated 1,125,132,584 1,052,327,404
End of year $ 1,185,504,020 $ 1,125,132,584
2017 (as restated)2016
Board of Water Supply City and County of Honolulu
STATEMENTS OF CASH FLOWS Fiscal Years Ended June 30, 2017 and 2016
See accompanying notes to financial statements.
19
CASH FLOWS FROM OPERATING ACTIVITIESCash received from customers $ 229,847,364 $ 239,462,367 Payments to suppliers for goods and services (77,977,910) (76,679,532) Payments to employees for services (57,935,145) (56,102,891)
Net cash provided by operating activities 93,934,309 106,679,944
CASH FLOWS FROM CAPITAL AND RELATEDFINANCING ACTIVITIES
Acquisition and construction of capital assets (55,736,894) (46,046,346) Customer payments for capital projects 12,526,364 12,678,171 Principal paid on bonds (8,135,000) (7,810,000) Interest paid on bonds (9,588,890) (9,913,722) Proceeds from notes payable 26,589,160 9,494,429 Interest paid on notes payable (307,233) (203,353) Principal paid on notes payable (18,792,906) (3,978,979)
Net cash used in capital and related financing activities (53,445,399) (45,779,800)
CASH FLOWS FROM INVESTING ACTIVITIESPurchase of investments (131,437,507) (149,139,191) Proceeds from maturity of investments 98,099,798 83,610,596 Interest on investments 4,322,016 3,264,692
Net cash used in investing activities (29,015,693) (62,263,903)
Net increase (decrease) in cash and cash equivalents 11,473,217 (1,363,759)
CASH AND CASH EQUIVALENTS Beginning of year 37,656,598 39,020,357
End of year $ 49,129,815 $ 37,656,598
Reconciliation of cash and cash equivalentsto the statement of net position
Unrestricted $ 28,092,101 $ 23,084,857 Restricted 21,037,714 14,571,741
$ 49,129,815 $ 37,656,598
2017 2016
Board of Water Supply City and County of Honolulu
STATEMENTS OF CASH FLOWS (Continued) Fiscal Years Ended June 30, 2017 and 2016
See accompanying notes to financial statements.
20
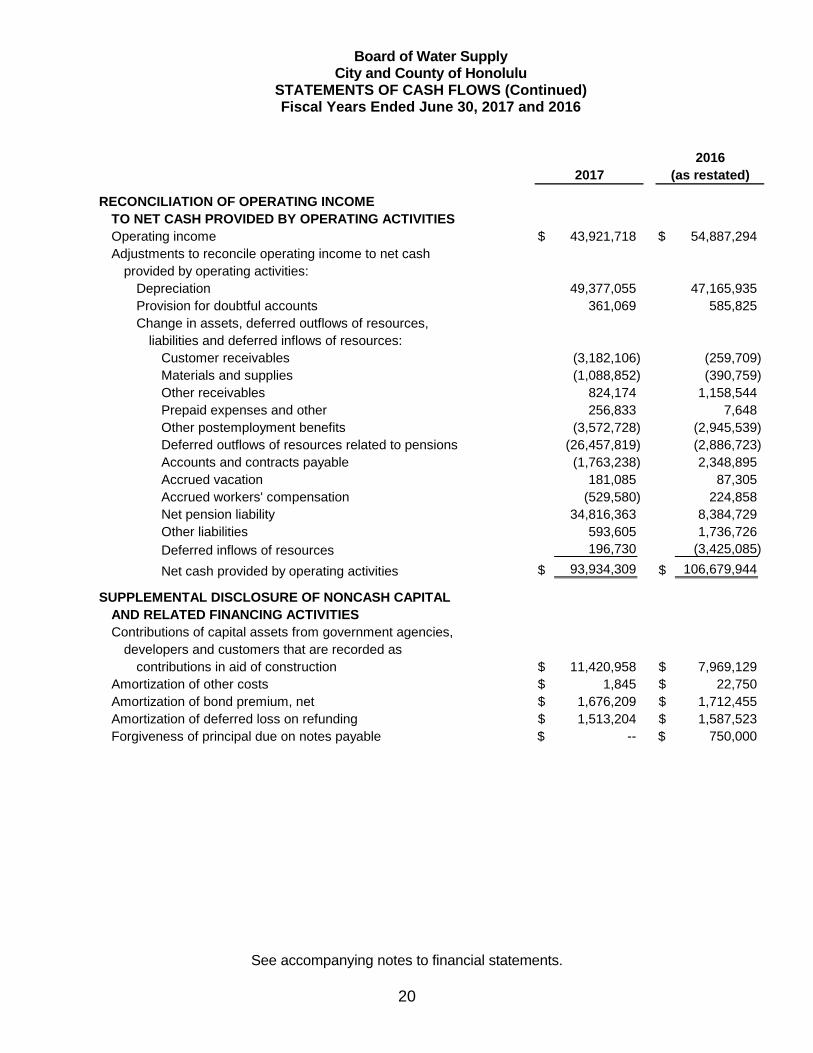
RECONCILIATION OF OPERATING INCOMETO NET CASH PROVIDED BY OPERATING ACTIVITIESOperating income $ 43,921,718 $ 54,887,294 Adjustments to reconcile operating income to net cash
provided by operating activities:Depreciation 49,377,055 47,165,935 Provision for doubtful accounts 361,069 585,825 Change in assets, deferred outflows of resources,
liabilities and deferred inflows of resources:Customer receivables (3,182,106) (259,709) Materials and supplies (1,088,852) (390,759) Other receivables 824,174 1,158,544 Prepaid expenses and other 256,833 7,648 Other postemployment benefits (3,572,728) (2,945,539) Deferred outflows of resources related to pensions (26,457,819) (2,886,723) Accounts and contracts payable (1,763,238) 2,348,895 Accrued vacation 181,085 87,305 Accrued workers' compensation (529,580) 224,858 Net pension liability 34,816,363 8,384,729 Other liabilities 593,605 1,736,726
Deferred inflows of resources 196,730 (3,425,085)
Net cash provided by operating activities $ 93,934,309 $ 106,679,944
SUPPLEMENTAL DISCLOSURE OF NONCASH CAPITALAND RELATED FINANCING ACTIVITIESContributions of capital assets from government agencies,
developers and customers that are recorded ascontributions in aid of construction $ 11,420,958 $ 7,969,129
Amortization of other costs $ 1,845 $ 22,750 Amortization of bond premium, net $ 1,676,209 $ 1,712,455 Amortization of deferred loss on refunding $ 1,513,204 $ 1,587,523 Forgiveness of principal due on notes payable $ -- $ 750,000
2017 (as restated)2016
Board of Water Supply City and County of Honolulu
NOTES TO FINANCIAL STATEMENTS June 30, 2017 and 2016
21
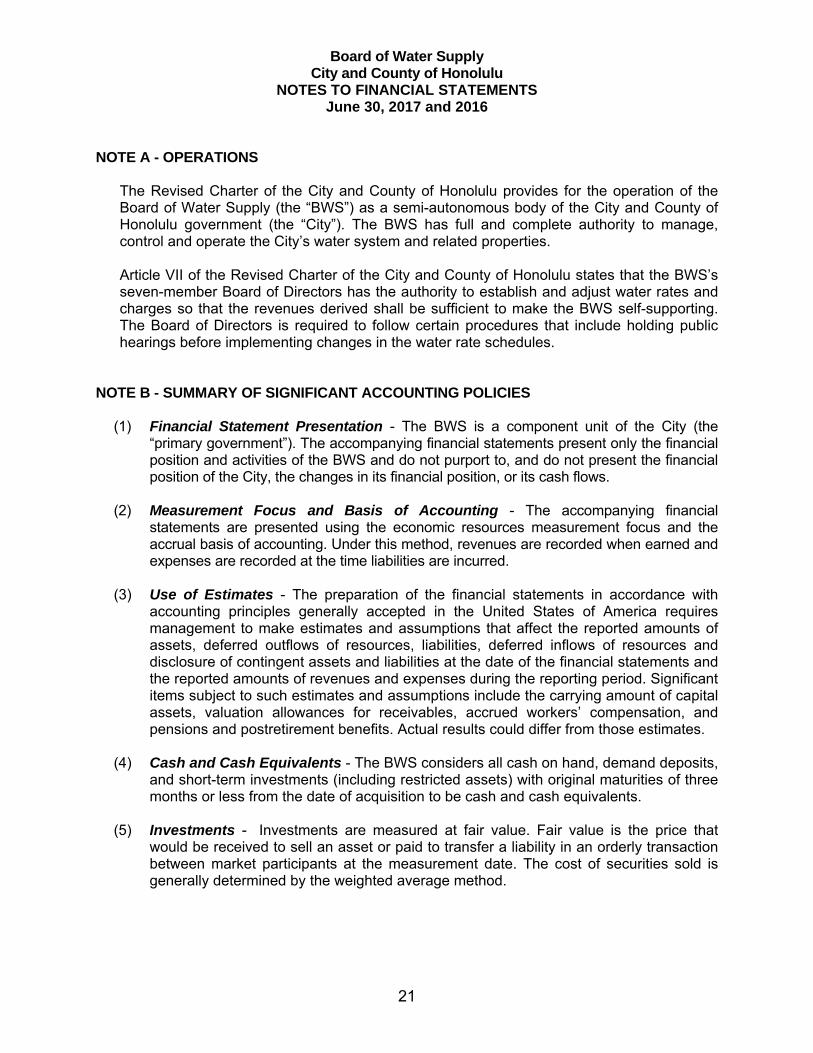
NOTE A - OPERATIONS The Revised Charter of the City and County of Honolulu provides for the operation of the
Board of Water Supply (the “BWS”) as a semi-autonomous body of the City and County of Honolulu government (the “City”). The BWS has full and complete authority to manage, control and operate the City’s water system and related properties.
Article VII of the Revised Charter of the City and County of Honolulu states that the BWSʼs seven-member Board of Directors has the authority to establish and adjust water rates and charges so that the revenues derived shall be sufficient to make the BWS self-supporting. The Board of Directors is required to follow certain procedures that include holding public hearings before implementing changes in the water rate schedules.
NOTE B - SUMMARY OF SIGNIFICANT ACCOUNTING POLICIES
(1) Financial Statement Presentation - The BWS is a component unit of the City (the “primary government”). The accompanying financial statements present only the financial position and activities of the BWS and do not purport to, and do not present the financial position of the City, the changes in its financial position, or its cash flows.
(2) Measurement Focus and Basis of Accounting - The accompanying financial
statements are presented using the economic resources measurement focus and the accrual basis of accounting. Under this method, revenues are recorded when earned and expenses are recorded at the time liabilities are incurred.
(3) Use of Estimates - The preparation of the financial statements in accordance with
accounting principles generally accepted in the United States of America requires management to make estimates and assumptions that affect the reported amounts of assets, deferred outflows of resources, liabilities, deferred inflows of resources and disclosure of contingent assets and liabilities at the date of the financial statements and the reported amounts of revenues and expenses during the reporting period. Significant items subject to such estimates and assumptions include the carrying amount of capital assets, valuation allowances for receivables, accrued workers’ compensation, and pensions and postretirement benefits. Actual results could differ from those estimates.
(4) Cash and Cash Equivalents - The BWS considers all cash on hand, demand deposits,
and short-term investments (including restricted assets) with original maturities of three months or less from the date of acquisition to be cash and cash equivalents.
(5) Investments - Investments are measured at fair value. Fair value is the price that
would be received to sell an asset or paid to transfer a liability in an orderly transaction between market participants at the measurement date. The cost of securities sold is generally determined by the weighted average method.
Board of Water Supply City and County of Honolulu
NOTES TO FINANCIAL STATEMENTS June 30, 2017 and 2016
22
NOTE B - SUMMARY OF SIGNIFICANT ACCOUNTING POLICIES (Continued)
(6) Receivables - Receivables are recorded at the invoiced amount and do not bear interest. The allowance for doubtful accounts is the BWSʼs best estimate of the amount of probable credit losses in the BWSʼs existing receivables. The BWS determines the allowance based on past collection experience and the length of time individual receivables are past due. Account balances are charged off against the allowance after all means of collection have been exhausted and the potential for recovery is considered remote.
(7) Materials and Supplies - Materials and supplies are stated at weighted average cost
(which approximates the first-in, first-out method). The cost of materials and supplies are recorded as expenses when consumed rather than when purchased.
(8) Restricted Assets - Restricted assets are comprised of cash and cash equivalents and
investments maintained in accordance with bond resolutions and other agreements for the purpose of funding certain debt service payments, construction, improvements, and renewal and replacements of the water system. When both restricted and unrestricted assets are available for use, it is the BWS’s policy to use restricted assets first, then unrestricted assets as they are needed. Restricted assets comprise the following:
The debt service account accumulates transfers from the operating account
throughout the fiscal year to make principal and interest payments on the outstanding water system revenue bonds and other notes payable.
The renewal and replacement account and the reserve release fund provides
funding for improvements, reconstruction, emergency or extraordinary repairs, and renewals or replacements of the water system.
The improvement account holds the proceeds of the series bond issuance
pursuant to the series resolution or series certificates. These proceeds are only applied to costs specified in the applicable series resolution or series certificates.
The extramural account holds reimbursements received from any governmental
agency or private entity, pursuant to negotiated agreements, contracts and/or grants.
(9) Capital Assets - Capital assets include those assets in excess of $5,000 for buildings,
infrastructure, and equipment and machinery with a useful life of more than one year. Capital assets are stated at cost and include contributions by governmental agencies, private subdividers and customers at their cost or estimated cost of new construction.
Major replacements, renewals and betterments are capitalized. Interest costs are capitalized during the construction period of major capital projects. Interest costs incurred in the fiscal years ended June 30, 2017 and 2016 totaled approximately $11,142,000 and $11,572,000, respectively.
Board of Water Supply City and County of Honolulu
NOTES TO FINANCIAL STATEMENTS June 30, 2017 and 2016
23
NOTE B - SUMMARY OF SIGNIFICANT ACCOUNTING POLICIES (Continued) Capitalized interest costs approximated $1,824,139 and $2,038,000 for the fiscal years ended June 30, 2017 and 2016, respectively. The BWS also capitalizes certain indirect costs to construction work based upon actual construction direct labor. Maintenance, repairs and replacements that do not improve or extend the lives of the assets are charged to expense. Assets are depreciated over the individual assets’ estimated useful lives using the straight-line method. Depreciation on both purchased and contributed assets is charged against operations.
The estimated useful lives of capital assets are as follows:
Source of supply plant 20 to 100 years
Pumping plant 20 to 50 years Water treatment plant 20 to 30 years Transmission and distribution plant 13-1/3 to 50 years General plant 5 to 50 years
Gains or losses resulting from the sale, retirement or disposal of capital assets in service are charged or credited to operations.
(10) Bond Issue Prepaid Insurance Costs, Original Issue Discount or Premium and Deferred Loss on Refunding of Debt - Bond issue costs are expensed when incurred, except for prepaid insurance, which are amortized over the life of the respective issue on a straight-line basis. Bond issue prepaid insurance costs are presented as other assets in the statements of net position. Original issue discounts or premiums are amortized using the straight-line method over the terms of the respective issues. Original issue discounts or premiums are offset against or added to bonds payable in the statements of net position. Deferred loss on refunding of debt is amortized using the straight-line method over the remaining life of the refunded debt or the life of the new debt, whichever is shorter. The deferred loss on refunding of debt is presented as deferred outflows of resources in the statements of net position.
(11) Accrued Vacation and Compensatory Pay - Vacation is earned at the rate of one and three-quarters working days for each month of service. Vacation days may be accumulated to a maximum of ninety days as of the end of the calendar year and are convertible to pay upon termination. The BWS accrues a liability for compensated absences and additional amounts for certain salary-related payments including payroll taxes and fringe benefits.
Board of Water Supply City and County of Honolulu
NOTES TO FINANCIAL STATEMENTS June 30, 2017 and 2016
24
NOTE B - SUMMARY OF SIGNIFICANT ACCOUNTING POLICIES (Continued) As of June 30, 2017 and 2016, accumulated sick leave aggregated approximately $19,203,000 and $19,163,000, respectively. Sick leave accumulates at the rate of one and three-quarters working days for each month of service without limit, but can be taken only in the event of illness and is not convertible to pay upon termination of employment. However, an employee who retires or leaves government service in good standing with 60 or more unused sick days is entitled to additional service credit in the State of Hawaii’s Employees’ Retirement System.
(12) Net Position - Net position represents the difference between assets and deferred outflows of resources less liabilities and deferred inflows of resources. Net position is classified in the following three components: net investment in capital assets, restricted for capital activity and debt service, and unrestricted net position. Net investment in capital assets consists of capital assets, net of accumulated depreciation and reduced by outstanding debt that is attributable to the acquisition, construction or improvement of those assets. Debt related to unspent proceeds or other restricted cash and investments at year-end is not included in the calculation of net investment in capital assets. Restricted for capital activity and debt service consists of net position for which constraints are placed thereon by external parties, such as lenders, grantors, contributors, laws, regulations or enabling legislation. Unrestricted consists of the remaining balance not included in the above categories.
(13) Operating Revenues and Expenses - The BWS distinguishes operating revenues and expenses from nonoperating items. Operating revenues and expenses generally result from providing services in connection with the BWSʼs principal ongoing water operations. The principal operating revenues are derived from charges for water usage, while operating expenses include cost of services, administrative expenses, and depreciation on capital assets. All revenues and expenses not meeting this definition are reported as nonoperating revenues and expenses.
(14) Revenue Recognition - Charges for water sales are based on usage. The BWSʼs policy is to bill customers on a cyclical monthly basis. The accrual for unbilled water revenues and related receivables reflected in the accompanying financial statements is based on estimated usage from the latest meter reading date to the end of the fiscal year.
(15) Contributions in Aid of Construction - Contributions in aid of construction represent
cash or capital assets received by the BWS to aid in the construction of infrastructure assets. Contributions in aid of construction are recognized when they are accepted by the BWS and when all applicable eligibility requirements have been met.
(16) Water System Facilities Charge - A water system facilities charge is levied against all
new developments and residential properties requiring water from the BWSʼs systems, except those developments that have paid for and installed a complete water system, including source, transmission and daily storage facilities. The amounts collected are initially recorded as customer advances and are recognized as contributions in aid of construction when water service is made available to the customer. The use of these funds is designated for the construction of water facilities.
Board of Water Supply City and County of Honolulu
NOTES TO FINANCIAL STATEMENTS June 30, 2017 and 2016
25
NOTE B - SUMMARY OF SIGNIFICANT ACCOUNTING POLICIES (Continued)
(17) Pensions - For purposes of measuring the net pension liability, deferred outflows of resources and deferred inflows of resources related to pensions and pension expense, information about the fiduciary net position of the Employees’ Retirement System of the State of Hawaii (the “ERS”) and additions to/deductions from the ERS’s fiduciary net position have been determined using the accrual basis of accounting, which is the same basis as they are reported by the ERS. For this purpose, employer and member contributions are recognized in the period in which the contributions are legally due and benefit payments (including refunds of employee contributions) are recognized when due and payable in accordance with benefit terms. Investments are reported at fair value.
(18) Deferred Compensation Plan - All full-time employees are eligible to participate in the City and County of Honolulu’s Public Employees’ Deferred Compensation Plan (the “Plan”), adopted pursuant to Internal Revenue Code Section 457. The Plan permits eligible employees to defer a portion of their salary until future years. The deferred compensation amounts are not available to employees until termination, retirement, death or unforeseeable emergency. A trust fund was established to protect plan assets from claims of general creditors and from diversion to any uses other than paying benefits to participants and beneficiaries. Accordingly, the BWS has excluded the Plan’s assets and liabilities from the financial statements because the BWS and the City do not have significant administrative involvement in the Plan or perform the investment function for the Plan.
(19) Risk Management - The BWS is exposed to various risks of loss from: (1) torts, (2) theft of, damage to, and destruction of assets, (3) employee injuries and illnesses, (4) natural disasters, and (5) employee health, dental, and accident benefits. Commercial insurance coverage is purchased for claims arising from such matters. The ranges of insurance limits and deductibles are as follows: Policy Limits (Millions) Deductibles Property $ 60 $ 50,000 Public entity liability $ 15 $ 750,000 Excess workers’ compensation $ 25 $ 600,000 Employment practices $ 5 $ 75,000 Storage tank liability $ 2 $ 10,000 Pollution legal liability $ 5 $ 250,000 Crime $ 5 $ 25,000 Cyber liability $ 3 $ 50,000 There have been no significant reductions in insurance coverage’s from the prior fiscal year.
Board of Water Supply City and County of Honolulu
NOTES TO FINANCIAL STATEMENTS June 30, 2017 and 2016
26
NOTE B - SUMMARY OF SIGNIFICANT ACCOUNTING POLICIES (Continued)
(20) Reclassification - Certain balances in the prior year financial statements have been reclassified for comparative purposes to conform with the current year presentation. Such reclassifications had no effect on the previously reported change in net position.
(21) New Accounting Pronouncements - The Government Accounting Standards Board (the “GASB”) issued Statement No. 75, Accounting and Financial Reporting for Postemployment Benefits Other Than Pensions. The Statement replaces GASB Statement No. 45, Accounting and Financial Reporting by Employers for Postemployment Benefits Other Than Pensions, and No. 57, OPEB Measurements by Agent Employers and Agent Multiple-Employer Plans. The Statement will require the liability of employers for defined benefit OPEB to be measured as the portion of the present value of projected benefit payments to be provided to current active and inactive employees that is attributed to those employees' past periods of service, less the amount of the OPEB plan's fiduciary net position. The requirements of this Statement are effective for fiscal years beginning after June 15, 2017. Management has not yet determined the effect this Statement will have on the BWSʼs financial statements, but anticipate that it will materially impact the BWS’s financial statements.
The GASB issued Statement No. 82, Pension Issues an amendment of GASB Statements No. 67, No. 68, and No. 73. This Statement addresses issues regarding (1) the presentation of payroll-related measures in required supplementary information, (2) the selection of assumptions and the treatment of deviations from the guidance in an Actuarial Standard of Practice for financial reporting purposes, and (3) the classification of payments made by employers to satisfy employee (plan member) contribution requirements. The requirements of this Statement are effective for reporting periods beginning after June 15, 2016, except for the requirements of this Statement for the selection of assumptions in a circumstance in which an employer's pension liability is measured as of a date other than the employer's most recent fiscal year-end. In that circumstance, the requirements for the selection of assumptions are effective for that employer in the first reporting period in which the measurement date of the pension liability is on or after June 15, 2017. Management has adopted the applicable requirements of the new standards as presented in the BWSʼs financial statements.
The GASB issued Statement No. 83, Certain Asset Retirement Obligations. This Statement addresses accounting and financial reporting for certain asset retirement obligations (“AROs”). An ARO is a legally enforceable liability associated with the retirement of a tangible capital asset. A government that has legal obligations to perform future asset retirement activities related to its tangible capital assets should recognize a liability based on the guidance in this Statement. The requirements of this Statement are effective for reporting periods beginning after June 15, 2018. Management has not yet determined the effect this Statement will have on the BWSʼs financial statements.
The GASB issued Statement No. 85, Omnibus 2017. This Statement addresses a variety of topics including issues related to blending component units, goodwill, fair value measurement and application, and postemployment benefits (pensions and other postemployment benefits [OPEB]). The requirements of this Statement are effective for reporting periods beginning after June 15, 2017. Management has not yet determined the effect this Statement will have on the BWSʼs financial statements.
Board of Water Supply City and County of Honolulu
NOTES TO FINANCIAL STATEMENTS June 30, 2017 and 2016
27
NOTE B - SUMMARY OF SIGNIFICANT ACCOUNTING POLICIES (Continued) The GASB issued Statement No. 87, Leases. This Statement requires the recognition of certain lease assets and liabilities for leases that previously were classified as operating leases and recognized as inflows of resources or outflows of resources based on the payment provisions of the contract. It establishes a single model for lease accounting based on the foundational principle that leases are financings of the right to use an underlying asset. Under this Statement, a lessee is required to recognize a lease liability and an intangible right-to-use lease asset, and a lessor is required to recognize a lease receivable and a deferred inflow of resources. The requirements of this Statement are effective for reporting periods beginning after December 15, 2019. Management has not yet determined the effect this Statement will have on the BWSʼs financial statements.
NOTE C - CASH AND INVESTMENTS Cash deposited with the City is maintained by the Department of Budget and Fiscal Services
of the City. The City maintains a cash and investment pool that is used by all of the City’s Funds and the BWS. The Hawaii Revised Statutes (“HRS”) provide for the City’s Director of Finance to deposit the cash with any national or state bank or federally insured financial institution authorized to do business in the State of Hawaii, provided that all deposits are fully insured or collateralized. The City’s demand deposits are fully insured or collateralized with securities held by the City or its agents in the City’s name.
The HRS authorizes the BWS to invest, with certain restrictions, in obligations of the State of Hawaii or the United States of America, in federally insured savings accounts, time certificates of deposit, and bank repurchase agreements with federally insured financial institutions authorized to do business in the State of Hawaii. The BWSʼs portfolio is managed by various investment managers. These investments consist of U.S. government and U.S. government agencies securities.
Interest Rate Risk - Interest rate risk is the risk that changes in interest rates will adversely
affect the fair value of an investment. Generally, the longer the term of an investment, the greater the sensitivity of its fair value to changes in market interest rates. As a means of limiting its exposure to fair value losses, the BWS invests operating funds primarily in shorter-term securities, money market mutual funds, or similar investment pools.
Custodial Credit Risk - The custodial credit risk for deposits is the risk that, in the event of
the failure of a depository financial institution, a government will not be able to recover deposits or will not be able to recover collateral securities that are in the possession of an outside party. The custodial credit risk for investments is the risk that, in the event of the failure of the counterparty to a transaction, a government will not be able to recover the value of investment or collateral securities that are in the possession of an outside party. Excluding cash deposited with the City, all cash, money market mutual funds and investment securities as of June 30, 2017 and 2016 were held in trust by two financial institutions in the State of Hawaii.
Board of Water Supply City and County of Honolulu
NOTES TO FINANCIAL STATEMENTS June 30, 2017 and 2016
28
NOTE C - CASH AND INVESTMENTS (Continued) All investment securities are registered in the name of the BWS and are not exposed to
custodial credit risk. Money market mutual funds are not considered investment securities for purposes of custodial credit risk classification and are not exposed to custodial credit risk. Cash held in trust with these financial institutions are uncollateralized, however, amounts in excess of depository insurance are covered by commercial insurance obtained by each financial institution designed to insure against losses resulting from errors and omissions or fraud.
Credit Risk and Concentration of Credit Risk - Credit risk is the risk that an issuer or
other counterparty to an investment will not fulfill its obligation to the holder of the investment. Concentration of credit risk is the risk of a loss attributed to the magnitude of a government’s investment in a single issuer. As of June 30, 2017, all investment securities and money market mutual funds were rated Aaa and Aaa-mf, respectively, by Moody’s Investors Services. The BWSʼs concentration of credit risk related to investments in debt securities has been mitigated by limiting such investments to only debt obligations of the U.S. government and U.S. government agencies.
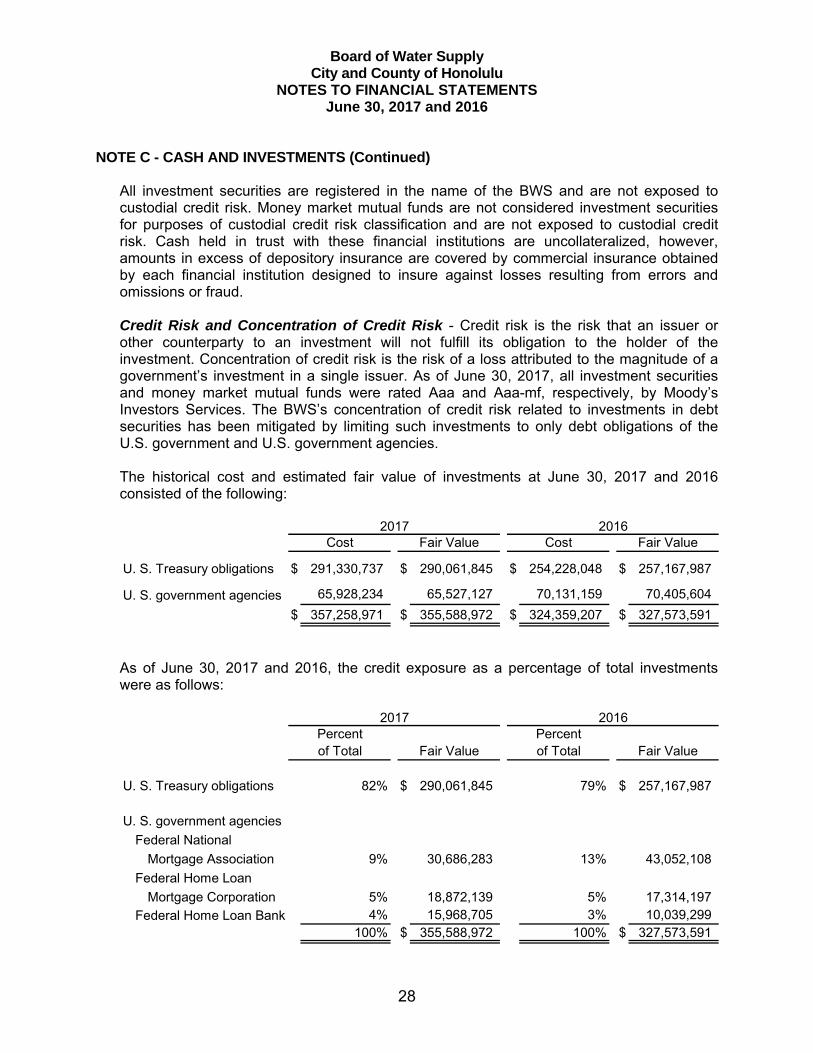
The historical cost and estimated fair value of investments at June 30, 2017 and 2016
consisted of the following:
U. S. Treasury obligations $ 291,330,737 $ 290,061,845 $ 254,228,048 $ 257,167,987
U. S. government agencies 65,928,234 65,527,127 70,131,159 70,405,604
$ 357,258,971 $ 355,588,972 $ 324,359,207 $ 327,573,591
2017 2016Cost Fair Value Cost Fair Value
As of June 30, 2017 and 2016, the credit exposure as a percentage of total investments
were as follows:
U. S. Treasury obligations 82% $ 290,061,845 79% $ 257,167,987
U. S. government agencies
Federal National
Mortgage Association 9% 30,686,283 13% 43,052,108
Federal Home Loan
Mortgage Corporation 5% 18,872,139 5% 17,314,197
Federal Home Loan Bank 4% 15,968,705 3% 10,039,299 100% $ 355,588,972 100% $ 327,573,591
2017 2016Percentof Total Fair Value of Total
PercentFair Value
Board of Water Supply City and County of Honolulu
NOTES TO FINANCIAL STATEMENTS June 30, 2017 and 2016
29
NOTE C - CASH AND INVESTMENTS (Continued)
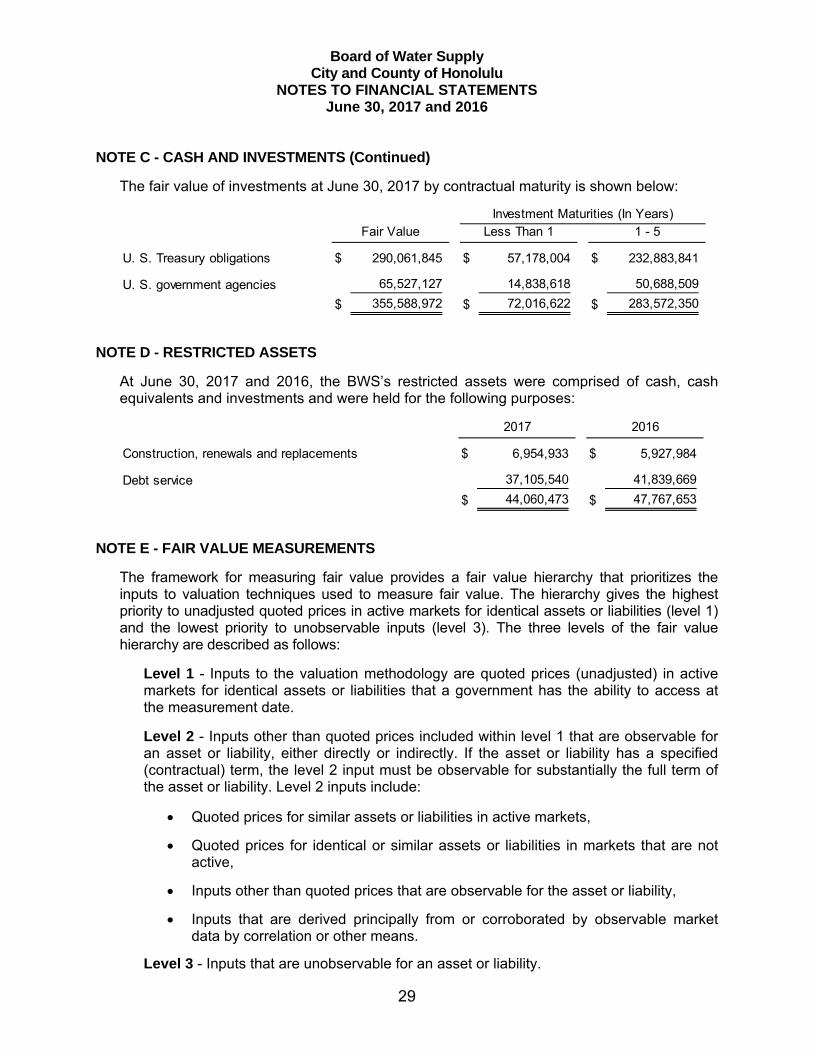
The fair value of investments at June 30, 2017 by contractual maturity is shown below:
U. S. Treasury obligations $ 290,061,845 $ 57,178,004 $ 232,883,841
U. S. government agencies 65,527,127 14,838,618 50,688,509
$ 355,588,972 $ 72,016,622 $ 283,572,350
Investment Maturities (In Years)Fair Value Less Than 1 1 - 5
NOTE D - RESTRICTED ASSETS
At June 30, 2017 and 2016, the BWS’s restricted assets were comprised of cash, cash equivalents and investments and were held for the following purposes:
Construction, renewals and replacements $ 6,954,933 $ 5,927,984
Debt service 37,105,540 41,839,669
$ 44,060,473 $ 47,767,653
2017 2016
NOTE E - FAIR VALUE MEASUREMENTS
The framework for measuring fair value provides a fair value hierarchy that prioritizes the inputs to valuation techniques used to measure fair value. The hierarchy gives the highest priority to unadjusted quoted prices in active markets for identical assets or liabilities (level 1) and the lowest priority to unobservable inputs (level 3). The three levels of the fair value hierarchy are described as follows:
Level 1 - Inputs to the valuation methodology are quoted prices (unadjusted) in active markets for identical assets or liabilities that a government has the ability to access at the measurement date.
Level 2 - Inputs other than quoted prices included within level 1 that are observable for an asset or liability, either directly or indirectly. If the asset or liability has a specified (contractual) term, the level 2 input must be observable for substantially the full term of the asset or liability. Level 2 inputs include:
Quoted prices for similar assets or liabilities in active markets,
Quoted prices for identical or similar assets or liabilities in markets that are not active,
Inputs other than quoted prices that are observable for the asset or liability,
Inputs that are derived principally from or corroborated by observable market data by correlation or other means.
Level 3 - Inputs that are unobservable for an asset or liability.
Board of Water Supply City and County of Honolulu
NOTES TO FINANCIAL STATEMENTS June 30, 2017 and 2016
30
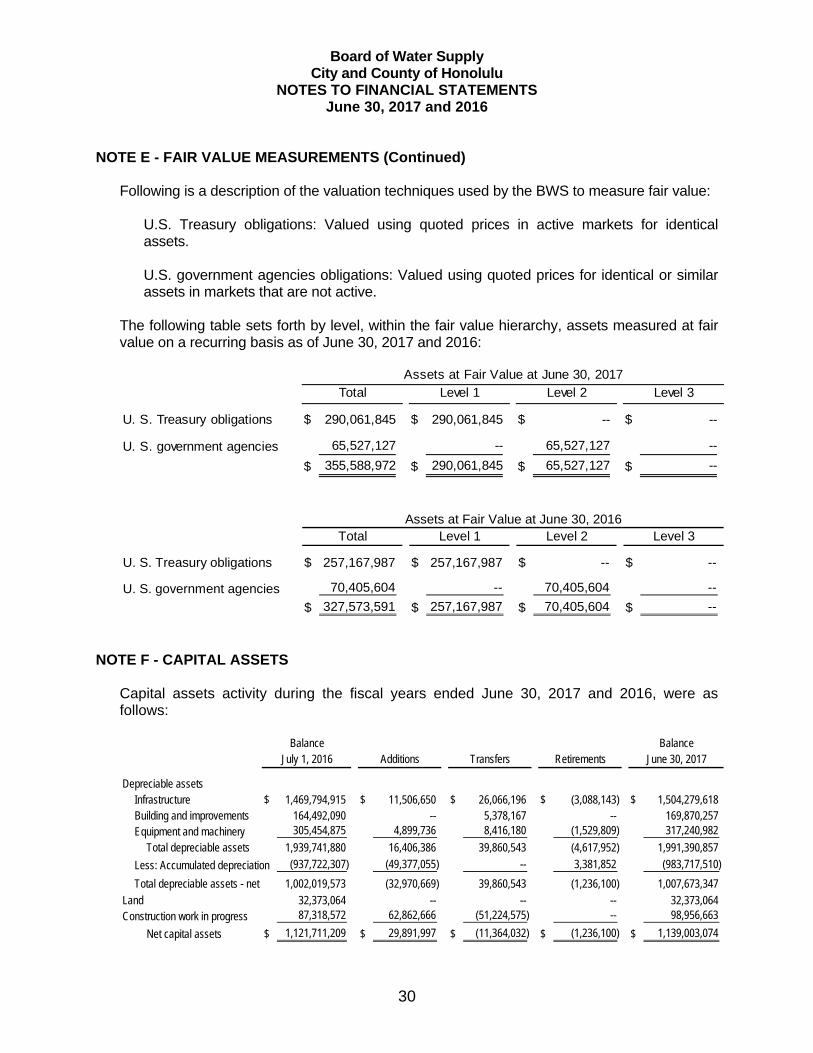
NOTE E - FAIR VALUE MEASUREMENTS (Continued) Following is a description of the valuation techniques used by the BWS to measure fair value:
U.S. Treasury obligations: Valued using quoted prices in active markets for identical assets. U.S. government agencies obligations: Valued using quoted prices for identical or similar assets in markets that are not active.
The following table sets forth by level, within the fair value hierarchy, assets measured at fair
value on a recurring basis as of June 30, 2017 and 2016:
U. S. Treasury obligations $ 290,061,845 $ 290,061,845 $ -- $ --
U. S. government agencies 65,527,127 -- 65,527,127 --
$ 355,588,972 $ 290,061,845 $ 65,527,127 $ --
Level 3Assets at Fair Value at June 30, 2017
Total Level 1 Level 2
U. S. Treasury obligations $ 257,167,987 $ 257,167,987 $ -- $ --
U. S. government agencies 70,405,604 -- 70,405,604 --
$ 327,573,591 $ 257,167,987 $ 70,405,604 $ --
Assets at Fair Value at June 30, 2016Total Level 1 Level 2 Level 3
NOTE F - CAPITAL ASSETS Capital assets activity during the fiscal years ended June 30, 2017 and 2016, were as
follows:
Depreciable assetsInfrastructure $ 1,469,794,915 $ 11,506,650 $ 26,066,196 $ (3,088,143) $ 1,504,279,618 Building and improvements 164,492,090 -- 5,378,167 -- 169,870,257 Equipment and machinery 305,454,875 4,899,736 8,416,180 (1,529,809) 317,240,982
Total depreciable assets 1,939,741,880 16,406,386 39,860,543 (4,617,952) 1,991,390,857
Less: Accumulated depreciation (937,722,307) (49,377,055) -- 3,381,852 (983,717,510)
Total depreciable assets - net 1,002,019,573 (32,970,669) 39,860,543 (1,236,100) 1,007,673,347 Land 32,373,064 -- -- -- 32,373,064 Construction work in progress 87,318,572 62,862,666 (51,224,575) -- 98,956,663
Net capital assets $ 1,121,711,209 $ 29,891,997 $ (11,364,032) $ (1,236,100) $ 1,139,003,074
BalanceBalanceJune 30, 2017Additions Transfers RetirementsJuly 1, 2016
Board of Water Supply City and County of Honolulu
NOTES TO FINANCIAL STATEMENTS June 30, 2017 and 2016
31
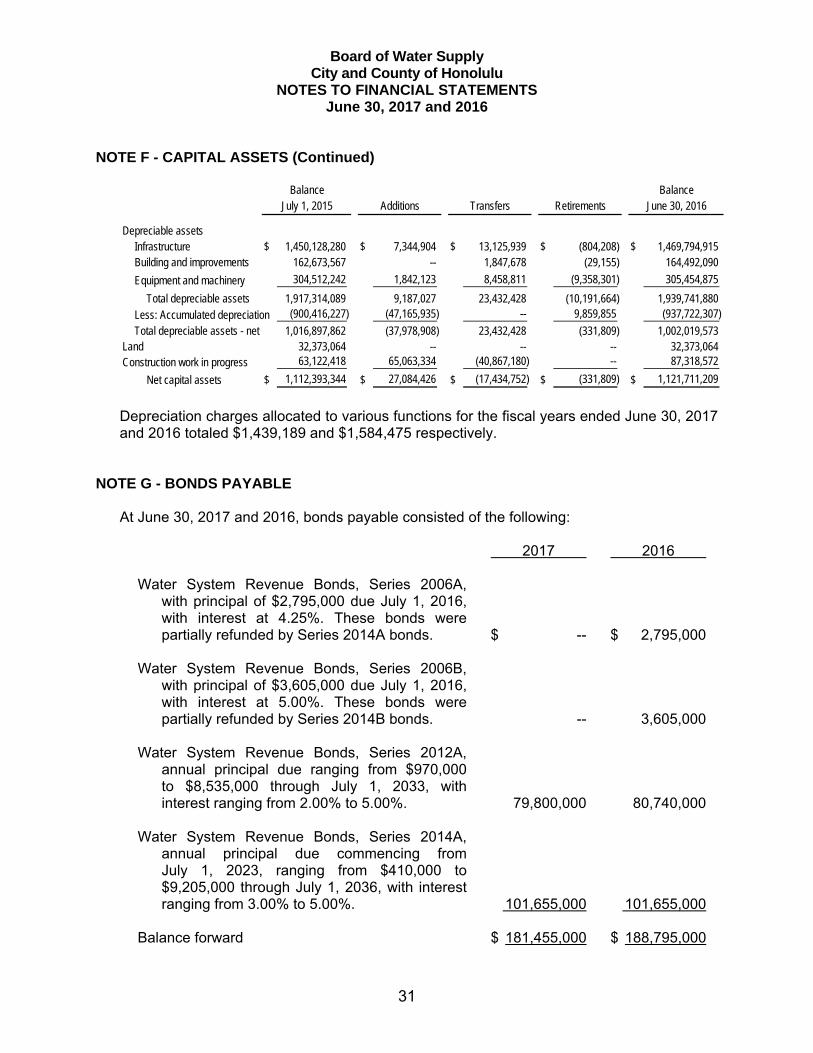
NOTE F - CAPITAL ASSETS (Continued)
Depreciable assetsInfrastructure $ 1,450,128,280 $ 7,344,904 $ 13,125,939 $ (804,208) $ 1,469,794,915 Building and improvements 162,673,567 -- 1,847,678 (29,155) 164,492,090
Equipment and machinery 304,512,242 1,842,123 8,458,811 (9,358,301) 305,454,875
Total depreciable assets 1,917,314,089 9,187,027 23,432,428 (10,191,664) 1,939,741,880 Less: Accumulated depreciation (900,416,227) (47,165,935) -- 9,859,855 (937,722,307)
Total depreciable assets - net 1,016,897,862 (37,978,908) 23,432,428 (331,809) 1,002,019,573 Land 32,373,064 -- -- -- 32,373,064 Construction work in progress 63,122,418 65,063,334 (40,867,180) -- 87,318,572
Net capital assets $ 1,112,393,344 $ 27,084,426 $ (17,434,752) $ (331,809) $ 1,121,711,209
July 1, 2015 June 30, 2016Additions Transfers RetirementsBalanceBalance
Depreciation charges allocated to various functions for the fiscal years ended June 30, 2017
and 2016 totaled $1,439,189 and $1,584,475 respectively. NOTE G - BONDS PAYABLE At June 30, 2017 and 2016, bonds payable consisted of the following: 2017 2016 Water System Revenue Bonds, Series 2006A, with principal of $2,795,000 due July 1, 2016, with interest at 4.25%. These bonds were partially refunded by Series 2014A bonds. $ -- $ 2,795,000 Water System Revenue Bonds, Series 2006B, with principal of $3,605,000 due July 1, 2016, with interest at 5.00%. These bonds were partially refunded by Series 2014B bonds. -- 3,605,000 Water System Revenue Bonds, Series 2012A, annual principal due ranging from $970,000 to $8,535,000 through July 1, 2033, with interest ranging from 2.00% to 5.00%. 79,800,000 80,740,000 Water System Revenue Bonds, Series 2014A, annual principal due commencing from July 1, 2023, ranging from $410,000 to $9,205,000 through July 1, 2036, with interest ranging from 3.00% to 5.00%. 101,655,000 101,655,000 Balance forward $ 181,455,000 $ 188,795,000
Board of Water Supply City and County of Honolulu
NOTES TO FINANCIAL STATEMENTS June 30, 2017 and 2016
32
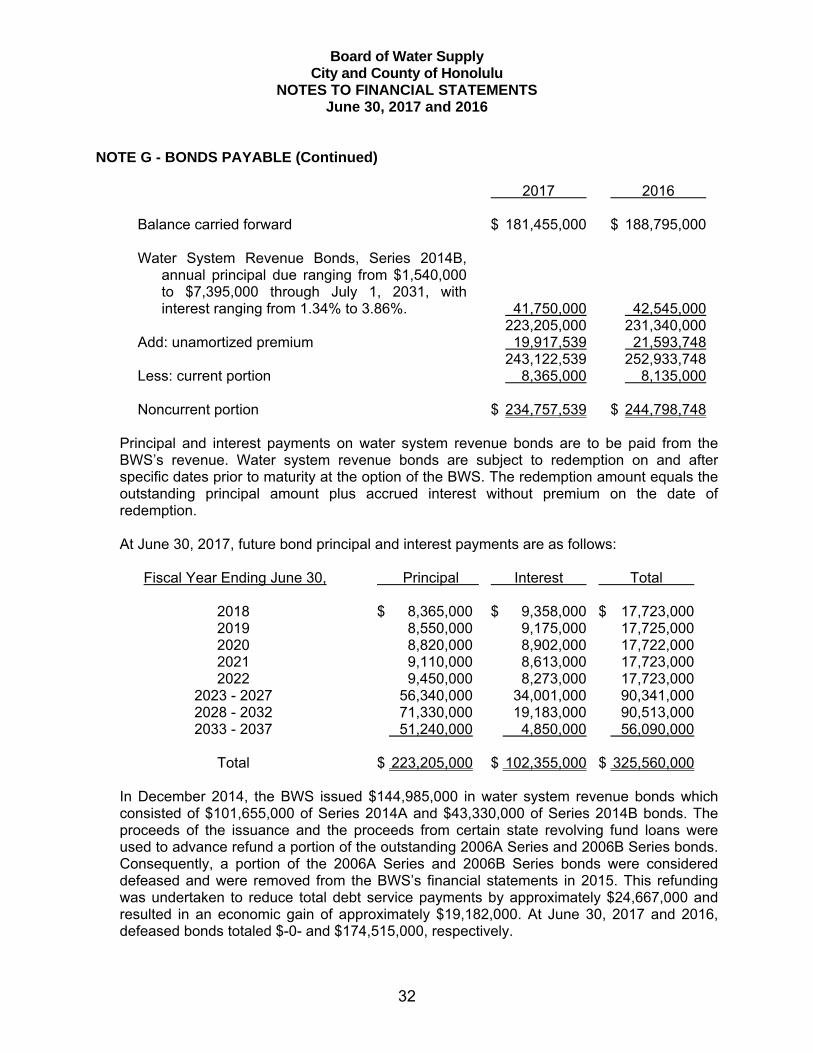
NOTE G - BONDS PAYABLE (Continued) 2017 2016 Balance carried forward $ 181,455,000 $ 188,795,000
Water System Revenue Bonds, Series 2014B, annual principal due ranging from $1,540,000 to $7,395,000 through July 1, 2031, with interest ranging from 1.34% to 3.86%. 41,750,000 42,545,000
223,205,000 231,340,000 Add: unamortized premium 19,917,539 21,593,748 243,122,539 252,933,748 Less: current portion 8,365,000 8,135,000 Noncurrent portion $ 234,757,539 $ 244,798,748 Principal and interest payments on water system revenue bonds are to be paid from the
BWS’s revenue. Water system revenue bonds are subject to redemption on and after specific dates prior to maturity at the option of the BWS. The redemption amount equals the outstanding principal amount plus accrued interest without premium on the date of redemption.
At June 30, 2017, future bond principal and interest payments are as follows: Fiscal Year Ending June 30, Principal Interest Total 2018 $ 8,365,000 $ 9,358,000 $ 17,723,000 2019 8,550,000 9,175,000 17,725,000 2020 8,820,000 8,902,000 17,722,000 2021 9,110,000 8,613,000 17,723,000 2022 9,450,000 8,273,000 17,723,000 2023 - 2027 56,340,000 34,001,000 90,341,000 2028 - 2032 71,330,000 19,183,000 90,513,000 2033 - 2037 51,240,000 4,850,000 56,090,000 Total $ 223,205,000 $ 102,355,000 $ 325,560,000
In December 2014, the BWS issued $144,985,000 in water system revenue bonds which consisted of $101,655,000 of Series 2014A and $43,330,000 of Series 2014B bonds. The proceeds of the issuance and the proceeds from certain state revolving fund loans were used to advance refund a portion of the outstanding 2006A Series and 2006B Series bonds. Consequently, a portion of the 2006A Series and 2006B Series bonds were considered defeased and were removed from the BWSʼs financial statements in 2015. This refunding was undertaken to reduce total debt service payments by approximately $24,667,000 and resulted in an economic gain of approximately $19,182,000. At June 30, 2017 and 2016, defeased bonds totaled $-0- and $174,515,000, respectively.
Board of Water Supply City and County of Honolulu
NOTES TO FINANCIAL STATEMENTS June 30, 2017 and 2016
33
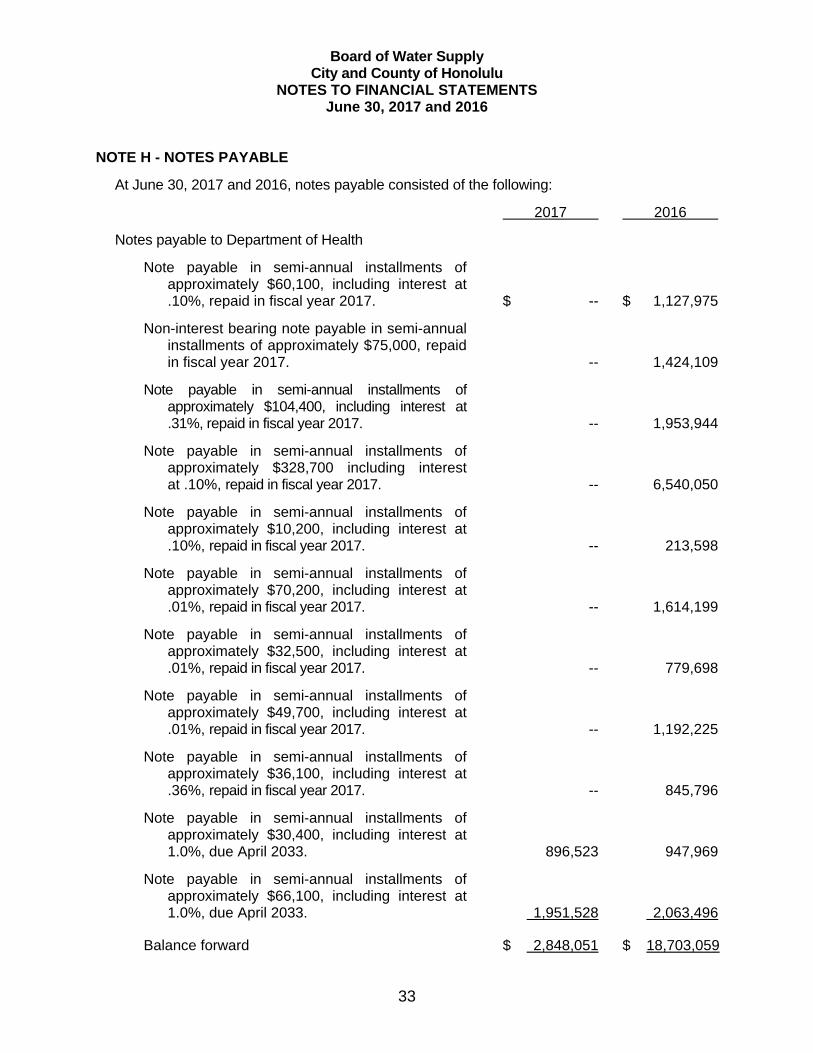
NOTE H - NOTES PAYABLE
At June 30, 2017 and 2016, notes payable consisted of the following:
2017 2016
Notes payable to Department of Health
Note payable in semi-annual installments of approximately $60,100, including interest at .10%, repaid in fiscal year 2017. $ -- $ 1,127,975
Non-interest bearing note payable in semi-annual installments of approximately $75,000, repaid in fiscal year 2017. -- 1,424,109
Note payable in semi-annual installments of approximately $104,400, including interest at .31%, repaid in fiscal year 2017. -- 1,953,944
Note payable in semi-annual installments of approximately $328,700 including interest at .10%, repaid in fiscal year 2017. -- 6,540,050
Note payable in semi-annual installments of approximately $10,200, including interest at .10%, repaid in fiscal year 2017. -- 213,598
Note payable in semi-annual installments of approximately $70,200, including interest at .01%, repaid in fiscal year 2017. -- 1,614,199
Note payable in semi-annual installments of approximately $32,500, including interest at .01%, repaid in fiscal year 2017. -- 779,698
Note payable in semi-annual installments of approximately $49,700, including interest at .01%, repaid in fiscal year 2017. -- 1,192,225
Note payable in semi-annual installments of approximately $36,100, including interest at .36%, repaid in fiscal year 2017. -- 845,796
Note payable in semi-annual installments of approximately $30,400, including interest at 1.0%, due April 2033. 896,523 947,969
Note payable in semi-annual installments of approximately $66,100, including interest at 1.0%, due April 2033. 1,951,528 2,063,496
Balance forward $ 2,848,051 $ 18,703,059
Board of Water Supply City and County of Honolulu
NOTES TO FINANCIAL STATEMENTS June 30, 2017 and 2016
34
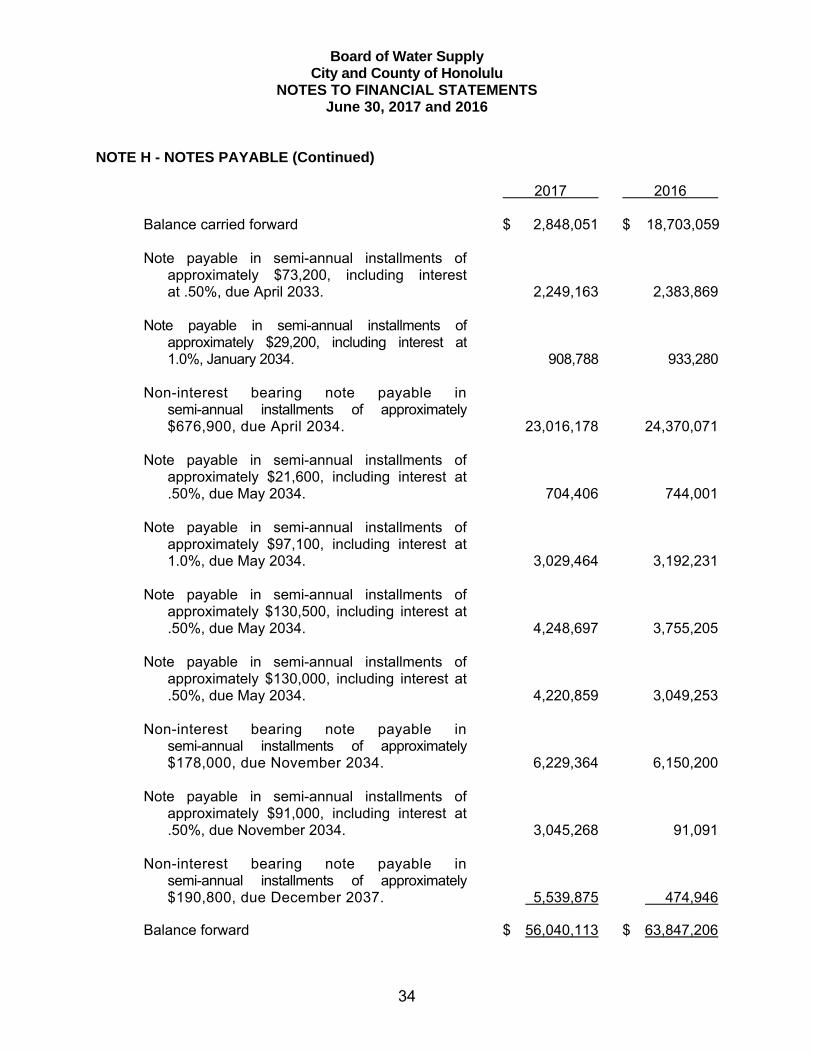
NOTE H - NOTES PAYABLE (Continued) 2017 2016
Balance carried forward $ 2,848,051 $ 18,703,059
Note payable in semi-annual installments of approximately $73,200, including interest at .50%, due April 2033. 2,249,163 2,383,869 Note payable in semi-annual installments of approximately $29,200, including interest at 1.0%, January 2034. 908,788 933,280 Non-interest bearing note payable in semi-annual installments of approximately $676,900, due April 2034. 23,016,178 24,370,071 Note payable in semi-annual installments of approximately $21,600, including interest at .50%, due May 2034. 704,406 744,001 Note payable in semi-annual installments of approximately $97,100, including interest at 1.0%, due May 2034. 3,029,464 3,192,231 Note payable in semi-annual installments of approximately $130,500, including interest at .50%, due May 2034. 4,248,697 3,755,205 Note payable in semi-annual installments of approximately $130,000, including interest at .50%, due May 2034. 4,220,859 3,049,253 Non-interest bearing note payable in semi-annual installments of approximately $178,000, due November 2034. 6,229,364 6,150,200 Note payable in semi-annual installments of approximately $91,000, including interest at .50%, due November 2034. 3,045,268 91,091 Non-interest bearing note payable in semi-annual installments of approximately $190,800, due December 2037. 5,539,875 474,946
Balance forward $ 56,040,113 $ 63,847,206
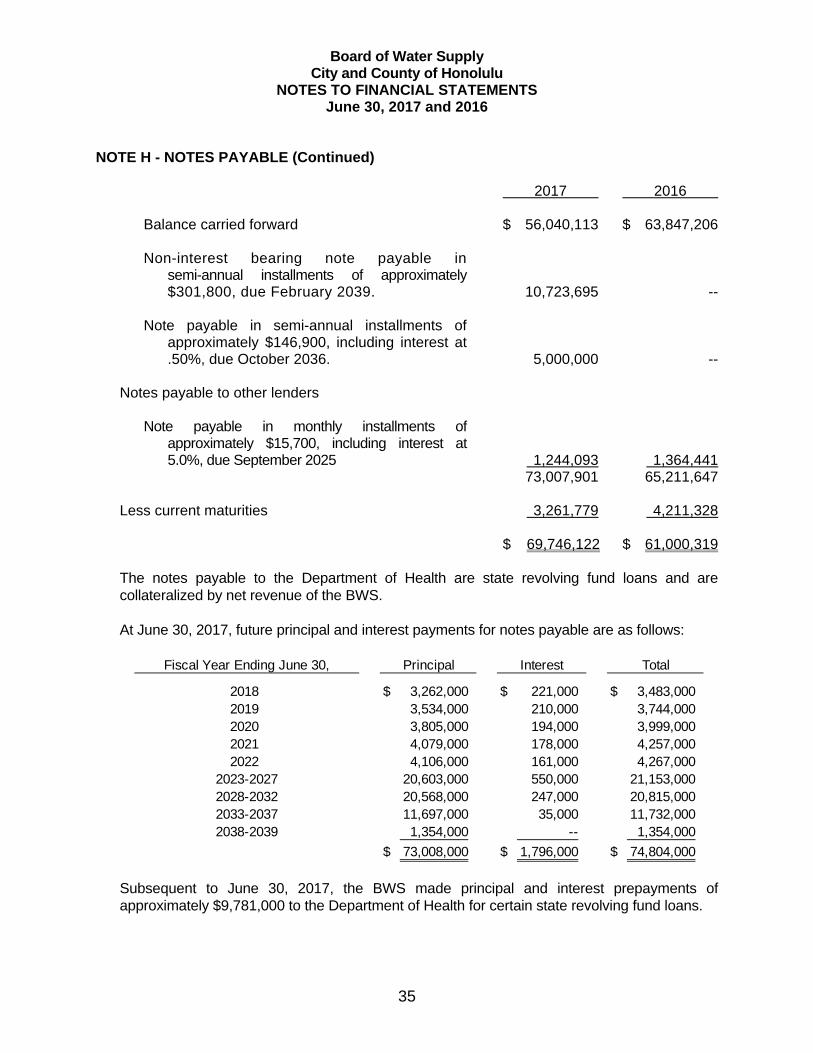
Board of Water Supply City and County of Honolulu
NOTES TO FINANCIAL STATEMENTS June 30, 2017 and 2016
35
NOTE H - NOTES PAYABLE (Continued) 2017 2016
Balance carried forward $ 56,040,113 $ 63,847,206 Non-interest bearing note payable in semi-annual installments of approximately $301,800, due February 2039. 10,723,695 -- Note payable in semi-annual installments of approximately $146,900, including interest at .50%, due October 2036. 5,000,000 -- Notes payable to other lenders
Note payable in monthly installments of approximately $15,700, including interest at 5.0%, due September 2025 1,244,093 1,364,441 73,007,901 65,211,647 Less current maturities 3,261,779 4,211,328 $ 69,746,122 $ 61,000,319
The notes payable to the Department of Health are state revolving fund loans and are collateralized by net revenue of the BWS.
At June 30, 2017, future principal and interest payments for notes payable are as follows:
Fiscal Year Ending June 30,
2018 $ 3,262,000 $ 221,000 $ 3,483,000 2019 3,534,000 210,000 3,744,000 2020 3,805,000 194,000 3,999,000 2021 4,079,000 178,000 4,257,000 2022 4,106,000 161,000 4,267,000
2023-2027 20,603,000 550,000 21,153,000 2028-2032 20,568,000 247,000 20,815,000 2033-2037 11,697,000 35,000 11,732,000 2038-2039 1,354,000 -- 1,354,000
$ 73,008,000 $ 1,796,000 $ 74,804,000
Principal Interest Total
Subsequent to June 30, 2017, the BWS made principal and interest prepayments of approximately $9,781,000 to the Department of Health for certain state revolving fund loans.
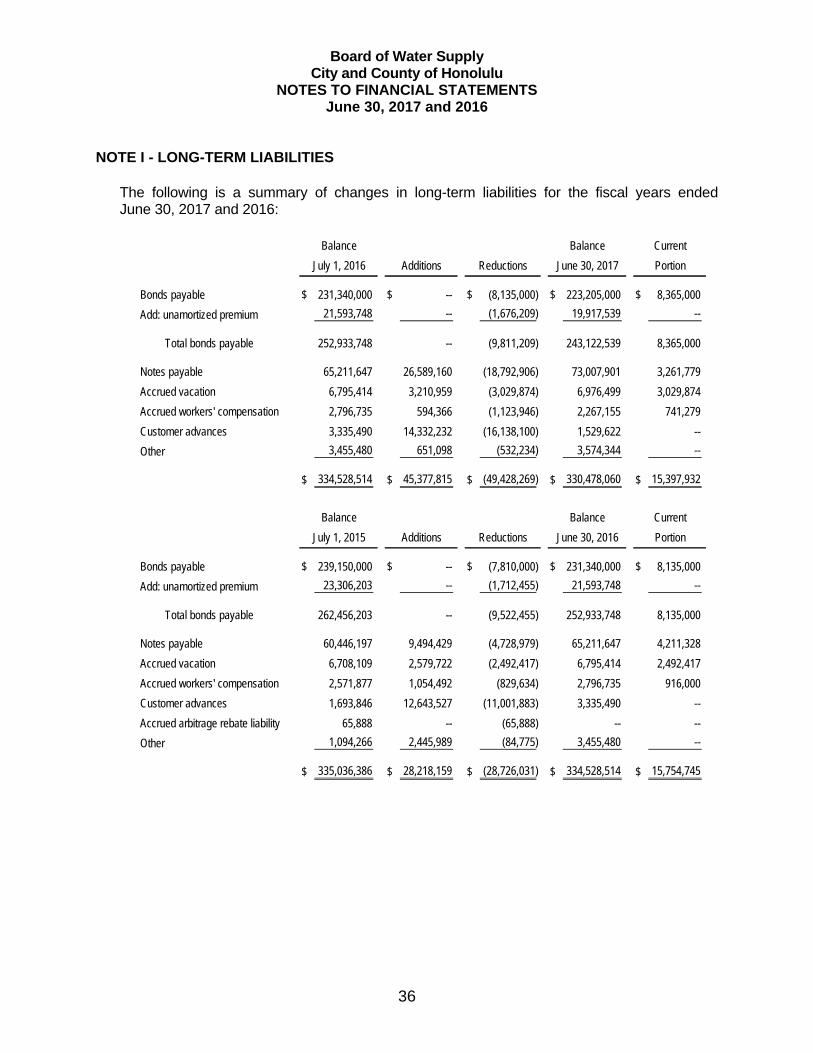
Board of Water Supply City and County of Honolulu
NOTES TO FINANCIAL STATEMENTS June 30, 2017 and 2016
36
NOTE I - LONG-TERM LIABILITIES
The following is a summary of changes in long-term liabilities for the fiscal years ended June 30, 2017 and 2016:
Bonds payable $ 231,340,000 $ -- $ (8,135,000) $ 223,205,000 $ 8,365,000
Add: unamortized premium 21,593,748 -- (1,676,209) 19,917,539 --
Total bonds payable 252,933,748 -- (9,811,209) 243,122,539 8,365,000
Notes payable 65,211,647 26,589,160 (18,792,906) 73,007,901 3,261,779
Accrued vacation 6,795,414 3,210,959 (3,029,874) 6,976,499 3,029,874
Accrued workers' compensation 2,796,735 594,366 (1,123,946) 2,267,155 741,279
Customer advances 3,335,490 14,332,232 (16,138,100) 1,529,622 --
Other 3,455,480 651,098 (532,234) 3,574,344 --
$ 334,528,514 $ 45,377,815 $ (49,428,269) $ 330,478,060 $ 15,397,932
Current
Portion
BalanceBalance
June 30, 2017Additions ReductionsJuly 1, 2016
Bonds payable $ 239,150,000 $ -- $ (7,810,000) $ 231,340,000 $ 8,135,000
Add: unamortized premium 23,306,203 -- (1,712,455) 21,593,748 --
Total bonds payable 262,456,203 -- (9,522,455) 252,933,748 8,135,000
Notes payable 60,446,197 9,494,429 (4,728,979) 65,211,647 4,211,328
Accrued vacation 6,708,109 2,579,722 (2,492,417) 6,795,414 2,492,417
Accrued workers' compensation 2,571,877 1,054,492 (829,634) 2,796,735 916,000
Customer advances 1,693,846 12,643,527 (11,001,883) 3,335,490 --
Accrued arbitrage rebate liability 65,888 -- (65,888) -- --
Other 1,094,266 2,445,989 (84,775) 3,455,480 --
$ 335,036,386 $ 28,218,159 $ (28,726,031) $ 334,528,514 $ 15,754,745
Current
PortionJuly 1, 2015 June 30, 2016Additions Reductions
BalanceBalance
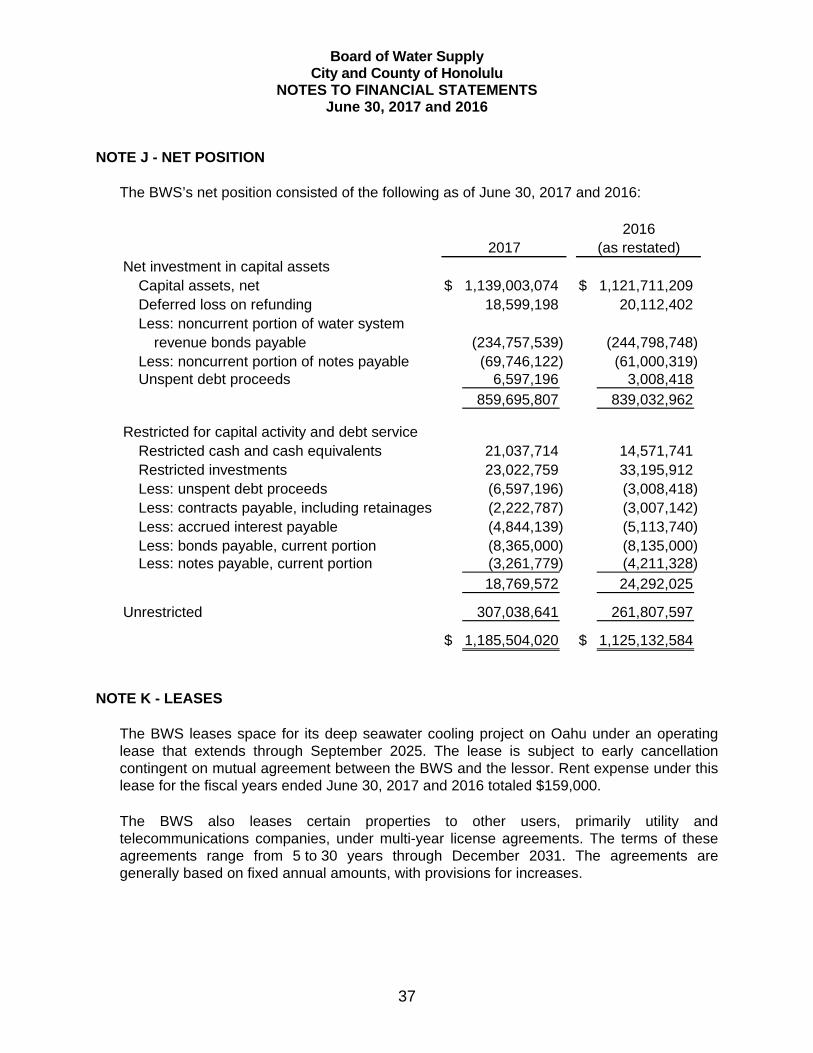
Board of Water Supply City and County of Honolulu
NOTES TO FINANCIAL STATEMENTS June 30, 2017 and 2016
37
NOTE J - NET POSITION
The BWS’s net position consisted of the following as of June 30, 2017 and 2016:
Net investment in capital assetsCapital assets, net $ 1,139,003,074 $ 1,121,711,209 Deferred loss on refunding 18,599,198 20,112,402 Less: noncurrent portion of water system
revenue bonds payable (234,757,539) (244,798,748) Less: noncurrent portion of notes payable (69,746,122) (61,000,319) Unspent debt proceeds 6,597,196 3,008,418
859,695,807 839,032,962
Restricted for capital activity and debt serviceRestricted cash and cash equivalents 21,037,714 14,571,741 Restricted investments 23,022,759 33,195,912 Less: unspent debt proceeds (6,597,196) (3,008,418) Less: contracts payable, including retainages (2,222,787) (3,007,142) Less: accrued interest payable (4,844,139) (5,113,740) Less: bonds payable, current portion (8,365,000) (8,135,000) Less: notes payable, current portion (3,261,779) (4,211,328)
18,769,572 24,292,025
Unrestricted 307,038,641 261,807,597
$ 1,185,504,020 $ 1,125,132,584
2017 (as restated)2016
NOTE K - LEASES
The BWS leases space for its deep seawater cooling project on Oahu under an operating lease that extends through September 2025. The lease is subject to early cancellation contingent on mutual agreement between the BWS and the lessor. Rent expense under this lease for the fiscal years ended June 30, 2017 and 2016 totaled $159,000.
The BWS also leases certain properties to other users, primarily utility and telecommunications companies, under multi-year license agreements. The terms of these agreements range from 5 to 30 years through December 2031. The agreements are generally based on fixed annual amounts, with provisions for increases.
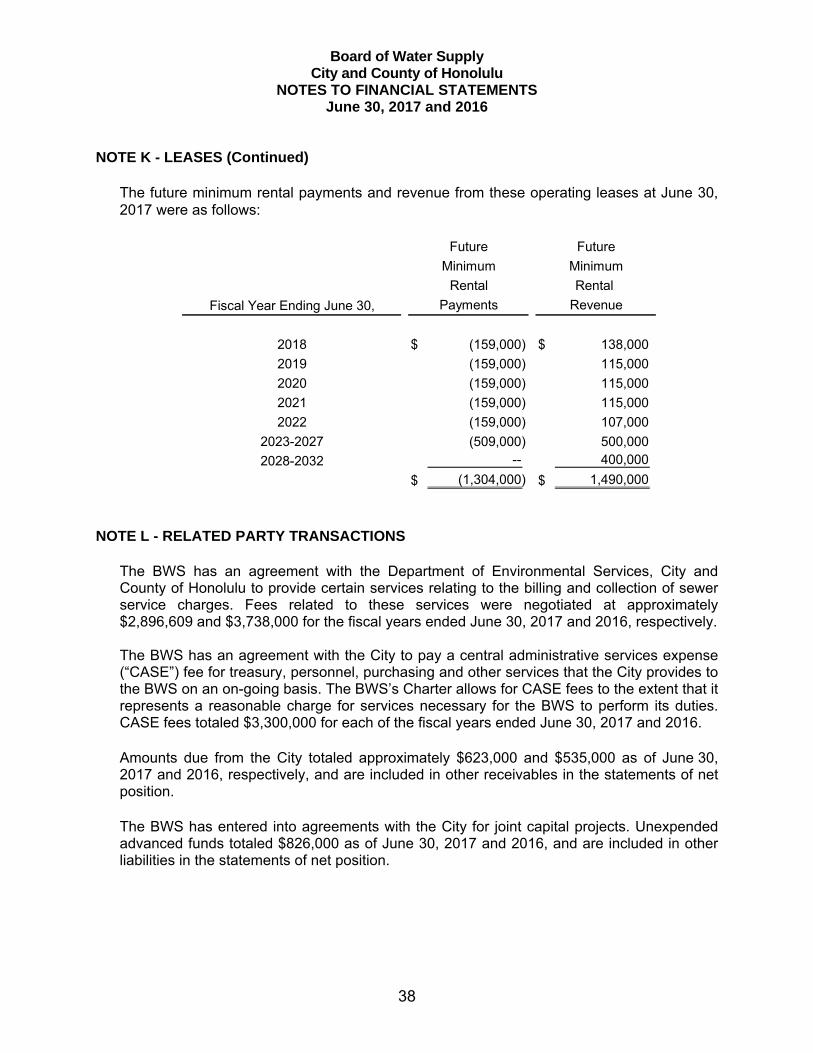
Board of Water Supply City and County of Honolulu
NOTES TO FINANCIAL STATEMENTS June 30, 2017 and 2016
38
NOTE K - LEASES (Continued) The future minimum rental payments and revenue from these operating leases at June 30,
2017 were as follows:
Fiscal Year Ending June 30,
2018 $ (159,000) $ 138,000
2019 (159,000) 115,000
2020 (159,000) 115,000
2021 (159,000) 115,000
2022 (159,000) 107,000
2023-2027 (509,000) 500,000
2028-2032 -- 400,000
$ (1,304,000) $ 1,490,000
Rental
Payments Revenue
Rental
Future Future
MinimumMinimum
NOTE L - RELATED PARTY TRANSACTIONS
The BWS has an agreement with the Department of Environmental Services, City and County of Honolulu to provide certain services relating to the billing and collection of sewer service charges. Fees related to these services were negotiated at approximately $2,896,609 and $3,738,000 for the fiscal years ended June 30, 2017 and 2016, respectively.
The BWS has an agreement with the City to pay a central administrative services expense (“CASE”) fee for treasury, personnel, purchasing and other services that the City provides to the BWS on an on-going basis. The BWSʼs Charter allows for CASE fees to the extent that it represents a reasonable charge for services necessary for the BWS to perform its duties. CASE fees totaled $3,300,000 for each of the fiscal years ended June 30, 2017 and 2016.
Amounts due from the City totaled approximately $623,000 and $535,000 as of June 30, 2017 and 2016, respectively, and are included in other receivables in the statements of net position.
The BWS has entered into agreements with the City for joint capital projects. Unexpended advanced funds totaled $826,000 as of June 30, 2017 and 2016, and are included in other liabilities in the statements of net position.
Board of Water Supply City and County of Honolulu
NOTES TO FINANCIAL STATEMENTS June 30, 2017 and 2016
39
NOTE M - EMPLOYEE BENEFIT PLANS
Defined Benefit Pension Plan The ERS is a cost-sharing, multiple-employer public employee retirement system established as a defined benefit pension plan to administer a pension benefits program for all eligible employees of the State and counties of Hawaii. Benefit terms, eligibility, and contribution requirements are established by Chapter 88 of the Hawaii Revised Statutes and can be amended through legislation. The ERS provides retirement, disability and death benefits that are covered by the provisions of the noncontributory, contributory and hybrid retirement membership classes. The three classes provide a monthly retirement allowance equal to the benefit multiplier (generally 1.25% or 2%) multiplied by the average final compensation multiplied by years of credited service. Average final compensation is an average of the highest salaries during any three years of credited service, excluding any salary paid in lieu of vacation for employees hired January 1, 1971 or later and the average of the highest salaries during any five years of credited service including any salary paid in lieu of vacation for employees hired prior to January 1, 1971. For members hired before July 1, 2012, the original retirement allowance is increased by 2.5% each July 1 following the calendar year of retirement. This cumulative benefit is not compounded and increases each year by 2.5% of the original retirement allowance without a ceiling (2.5% of the original retirement allowance the first year, 5.0% the second year, 7.5% the third year, etc.). For members hired after June 30, 2012, the post-retirement annuity increase was decreased to 1.5% per year.
Noncontributory Class
o Retirement Benefits - General employees’ retirement benefits are determined as 1.25% of average final compensation multiplied by the years of credited service. Employees with 10 years of credited service are eligible to retire at age 62. Employees with 30 years of credited service are eligible to retire at age 55.
o Disability Benefits - Members are eligible for service-related disability benefits regardless of length of service and receive a lifetime pension of 35% of their average final compensation. Ten years of credited service is required for ordinary disability. Ordinary disability benefits are determined in the same manner as retirement benefits but are payable immediately, without an actuarial reduction, and at a minimum of 12.5% of average final compensation.
o Death Benefits - For service-connected deaths, the surviving spouse/reciprocal beneficiary receives a monthly benefit of 30% of the average final compensation until remarriage or re-entry into a new reciprocal beneficiary relationship. Additional benefits are payable to surviving dependent children up to age 18. If there is no spouse/reciprocal beneficiary or dependent children, no benefit is payable.
Board of Water Supply City and County of Honolulu
NOTES TO FINANCIAL STATEMENTS June 30, 2017 and 2016
40
NOTE M - EMPLOYEE BENEFIT PLANS (Continued)
Ten years of credited service is required for ordinary death benefits. For ordinary death benefits, the surviving spouse/reciprocal beneficiary (until remarriage/re-entry into a new reciprocal beneficiary relationship) and dependent children (up to age 18) receive a benefit equal to a percentage of member’s accrued maximum allowance unreduced for age or, if the member was eligible for retirement at the time of death, the surviving spouse/reciprocal beneficiary receives 100% joint and survivor lifetime pension.
Contributory Class for Employees Hired Prior to July 1, 2012
o Retirement Benefits - General employees’ retirement benefits are determined as 2% of average final compensation multiplied by the years of credited service. General employees with five years of credited service are eligible to retire at age 55.
o Disability Benefits - Members are eligible for service-related disability benefits regardless
of length of service and receive a one-time payment of the member’s contributions and accrued interest plus a lifetime pension of 50% of their average final compensation. Ten years of credited service is required for ordinary disability. Ordinary disability benefits are determined as 1.75% of average final compensation multiplied by the years of credited service but are payable immediately, without an actuarial reduction, and at a minimum of 30% of average final compensation.
o Death Benefits - For service-connected deaths, the surviving spouse/reciprocal
beneficiary receives a lump sum payment of the member’s contributions and accrued interest plus a monthly benefit of 50% of the average final compensation until remarriage or re-entry into a new reciprocal beneficiary relationship. If there is no surviving spouse/reciprocal beneficiary, surviving children (up to age 18) or dependent parents are eligible for the monthly benefit. If there is no spouse/reciprocal beneficiary or dependent children/parents, the death benefit is payable to the designated beneficiary.
Ordinary death benefits are available to employees who were active at time of death with at least one year of service. Ordinary death benefits consist of a lump sum payment of the member’s contributions and accrued interest plus a percentage of the salary earned in the 12 months preceding death, or 50% Joint and Survivor lifetime pension if the member was not eligible for retirement at the time of death but was credited with at least 10 years of service and designated one beneficiary, or 100% Joint and Survivor lifetime pension if the member was eligible for retirement at the time of death and designated one beneficiary.
Board of Water Supply City and County of Honolulu
NOTES TO FINANCIAL STATEMENTS June 30, 2017 and 2016
41
NOTE M - EMPLOYEE BENEFIT PLANS (Continued) Contributory Class for Employees Hired After June 30, 2012 o Retirement Benefits - General employees’ retirement benefits are determined as 1.75%
of average final compensation multiplied by the years of credited service. General employees with 10 years of credited service are eligible to retire at age 60.
o Disability and Death Benefits - Disability and benefits for contributory class members
hired after June 30, 2012 are generally the same as those for contributory class members hired June 30, 2012 and prior.
Hybrid Class for Employees Hired Prior to July 1, 2012
o Retirement Benefits - General employees’ retirement benefits are determined as 2% of
average final compensation multiplied by the years of credited service. General employees with five years of credited service are eligible to retire at age 62. General employees with 30 years of credited service are eligible to retire at age 55.
o Disability Benefits - Members are eligible for service-related disability benefits regardless
of length of service and receive a lifetime pension of 35% of their average final compensation plus refund of their contributions and accrued interest. Ten years of credited service is required for ordinary disability. Ordinary disability benefits are determined in the same manner as retirement benefits but are payable immediately, without an actuarial reduction, and at a minimum of 25% of average final compensation.
o Death Benefits - For service-connected deaths, the designated surviving
spouse/reciprocal beneficiary receives a lump sum payment of the member’s contributions and accrued interest plus a monthly benefit of 50% of the average final compensation until remarriage or re-entry into a new reciprocal beneficiary relationship. If there is no surviving spouse/reciprocal beneficiary, surviving children (up to age 18) or dependent parents are eligible for the monthly benefit. If there is no spouse/reciprocal beneficiary or dependent children/parents, the death benefit is payable to the designated beneficiary.
Ordinary death benefits are available to employees who were active at time of death with at least five years of service. Ordinary death benefits consist of a lump sum payment of the member’s contributions and accrued interest plus a percentage multiplied by 150%, or 50% Joint and Survivor lifetime pension if the member was not eligible for retirement at the time of death but was credited with at least 10 years of service and designated one beneficiary, or 100% Joint and Survivor lifetime pension if the member was eligible for retirement at the time of death and designated one beneficiary.
Board of Water Supply City and County of Honolulu
NOTES TO FINANCIAL STATEMENTS June 30, 2017 and 2016
42
NOTE M - EMPLOYEE BENEFIT PLANS (Continued)
Hybrid Class for Employees Hired After June 30, 2012
o Retirement Benefits - General employees’ retirement benefits are determined as 1.75% of average final compensation multiplied by the years of credited service. General employees with 10 years of credited service are eligible to retire at age 65. Employees with 30 years of credited service are eligible to retire at age 60.
o Disability and Death Benefits - Provisions for disability and death benefits generally remain the same except for ordinary death benefits. Ordinary death benefits are available to employees who were active at time of death with at least 10 years of service. Ordinary death benefits consist of a lump sum payment of the member’s contributions and accrued interest, or 50% Joint and Survivor lifetime pension if the member was not eligible for retirement at the time of death and designated one beneficiary, or 100% Joint and Survivor lifetime pension if the member was eligible for retirement at the time of death and designated one beneficiary.
Contributions - The employer contribution rate is a fixed percentage of compensation. The employer contribution rate was 17% for each of the fiscal years ended June 30, 2017 and 2016. For the fiscal years ended June 30, 2017 and 2016, contributions to the pension plan from the BWS totaled $6,879,511 and $5,871,134, respectively.
The employer is required to make all contributions for noncontributory members. For contributory class employees hired prior to July 1, 2012, general employees are required to contribute 7.8% of their salary. For contributing class employees hired after June 30, 2012, general employees are required to contribute 9.8% of their salary. Hybrid class members hired prior to July 1, 2012 are required to contribute 6.0% of their salary. Hybrid class members hired after June 30, 2012 are required to contribute 8.0% of their salary.
Pension Liabilities, Pension Expense, Deferred Outflows of Resources, and Deferred Inflows of Resources Related to Pensions - At June 30, 2017 and 2016, the BWS reported a liability of $116,342,916 and $81,526,553, respectively, for its proportionate share of the net pension liability. The net pension liability was measured as of June 30, 2016 and 2015, respectively, and the total pension liability used to calculate the net pension liability was determined by an actuarial valuation as of those dates. The BWS’s proportion of the net pension liability was based on the actual employer contributions to the pension plan relative to the contributions of all participating employers. At June 30, 2016 and 2015, the BWS’s proportion was 0.87% and 0.93%, respectively, which was a change of -0.06% and 0.02% from its proportion measured as of June 30, 2015 and 2014, respectively.
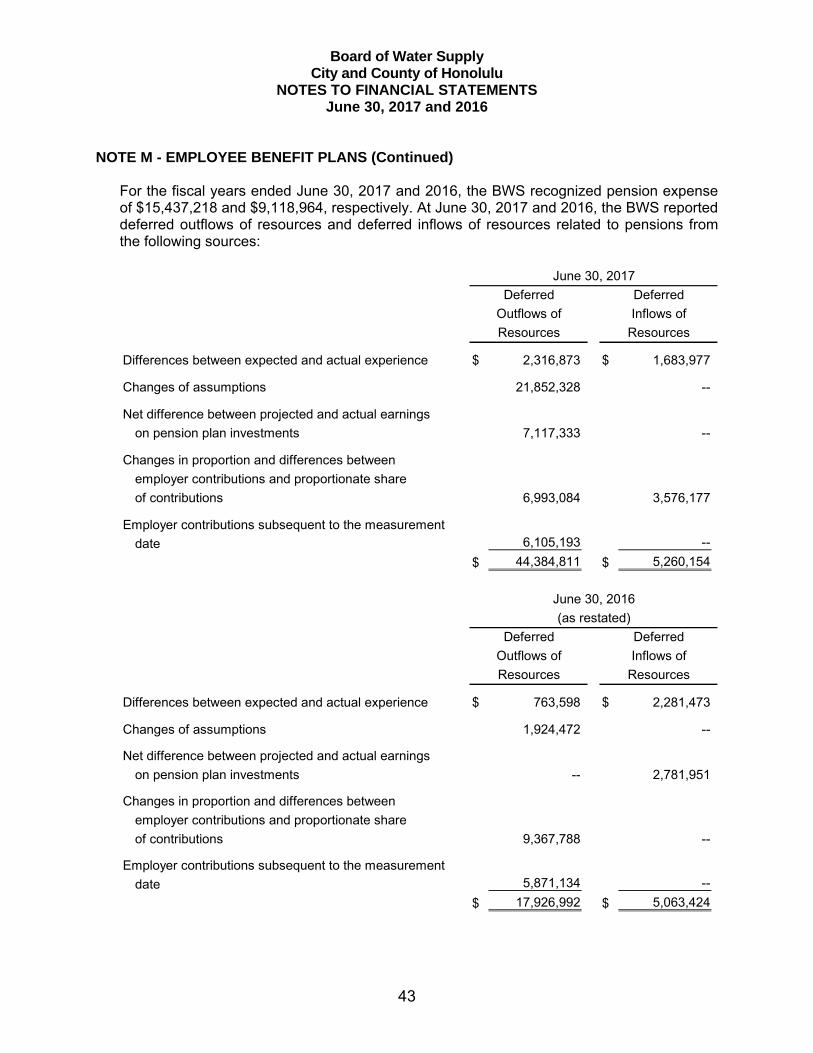
Board of Water Supply City and County of Honolulu
NOTES TO FINANCIAL STATEMENTS June 30, 2017 and 2016
43
NOTE M - EMPLOYEE BENEFIT PLANS (Continued) For the fiscal years ended June 30, 2017 and 2016, the BWS recognized pension expense of $15,437,218 and $9,118,964, respectively. At June 30, 2017 and 2016, the BWS reported deferred outflows of resources and deferred inflows of resources related to pensions from the following sources:
Differences between expected and actual experience $ 2,316,873 $ 1,683,977
Changes of assumptions 21,852,328 --
Net difference between projected and actual earnings
on pension plan investments 7,117,333 --
Changes in proportion and differences between
employer contributions and proportionate share
of contributions 6,993,084 3,576,177
Employer contributions subsequent to the measurement
date 6,105,193 --
$ 44,384,811 $ 5,260,154
June 30, 2017
Resources Resources
Outflows of
Deferred Deferred
Inflows of
Differences between expected and actual experience $ 763,598 $ 2,281,473
Changes of assumptions 1,924,472 --
Net difference between projected and actual earnings
on pension plan investments -- 2,781,951
Changes in proportion and differences between
employer contributions and proportionate share
of contributions 9,367,788 --
Employer contributions subsequent to the measurement
date 5,871,134 --
$ 17,926,992 $ 5,063,424
Resources Resources
June 30, 2016
Deferred Deferred
Outflows of Inflows of
(as restated)
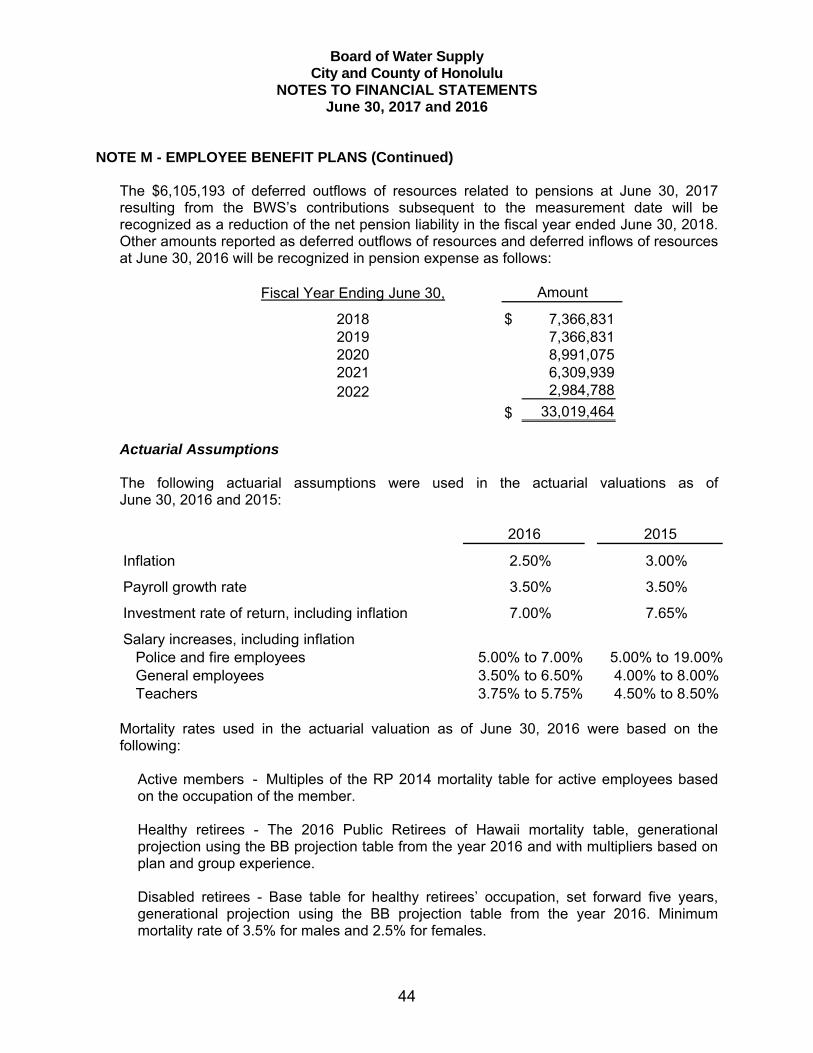
Board of Water Supply City and County of Honolulu
NOTES TO FINANCIAL STATEMENTS June 30, 2017 and 2016
44
NOTE M - EMPLOYEE BENEFIT PLANS (Continued)
The $6,105,193 of deferred outflows of resources related to pensions at June 30, 2017 resulting from the BWS’s contributions subsequent to the measurement date will be recognized as a reduction of the net pension liability in the fiscal year ended June 30, 2018. Other amounts reported as deferred outflows of resources and deferred inflows of resources at June 30, 2016 will be recognized in pension expense as follows:
Fiscal Year Ending June 30,
2018 $ 7,366,831 2019 7,366,831 2020 8,991,075 2021 6,309,939 2022 2,984,788
$ 33,019,464
Amount
Actuarial Assumptions
The following actuarial assumptions were used in the actuarial valuations as of June 30, 2016 and 2015:
Inflation 2.50% 3.00%
Payroll growth rate 3.50% 3.50%
Investment rate of return, including inflation 7.00% 7.65%
Salary increases, including inflationPolice and fire employees 5.00% to 7.00% 5.00% to 19.00%General employees 3.50% to 6.50% 4.00% to 8.00%Teachers 3.75% to 5.75% 4.50% to 8.50%
2016 2015
Mortality rates used in the actuarial valuation as of June 30, 2016 were based on the following:
Active members - Multiples of the RP 2014 mortality table for active employees based on the occupation of the member.
Healthy retirees - The 2016 Public Retirees of Hawaii mortality table, generational projection using the BB projection table from the year 2016 and with multipliers based on plan and group experience.
Disabled retirees - Base table for healthy retirees’ occupation, set forward five years, generational projection using the BB projection table from the year 2016. Minimum mortality rate of 3.5% for males and 2.5% for females.
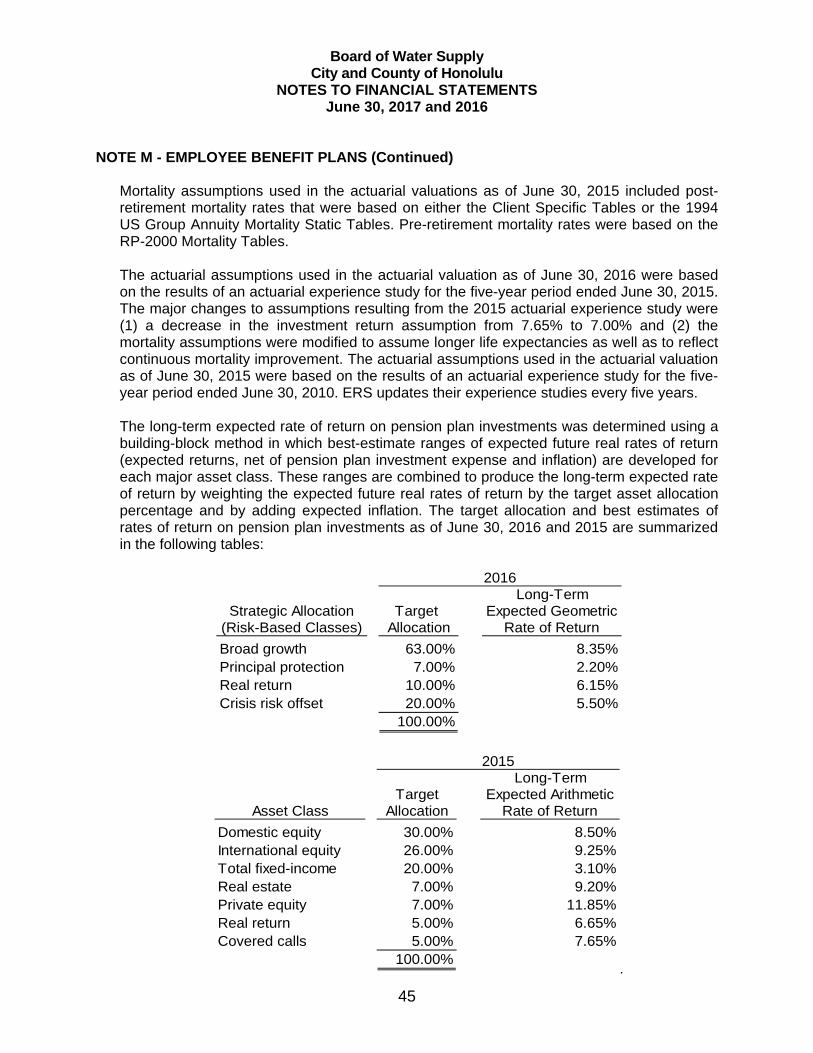
Board of Water Supply City and County of Honolulu
NOTES TO FINANCIAL STATEMENTS June 30, 2017 and 2016
45
NOTE M - EMPLOYEE BENEFIT PLANS (Continued) Mortality assumptions used in the actuarial valuations as of June 30, 2015 included post-retirement mortality rates that were based on either the Client Specific Tables or the 1994 US Group Annuity Mortality Static Tables. Pre-retirement mortality rates were based on the RP-2000 Mortality Tables. The actuarial assumptions used in the actuarial valuation as of June 30, 2016 were based on the results of an actuarial experience study for the five-year period ended June 30, 2015. The major changes to assumptions resulting from the 2015 actuarial experience study were (1) a decrease in the investment return assumption from 7.65% to 7.00% and (2) the mortality assumptions were modified to assume longer life expectancies as well as to reflect continuous mortality improvement. The actuarial assumptions used in the actuarial valuation as of June 30, 2015 were based on the results of an actuarial experience study for the five-year period ended June 30, 2010. ERS updates their experience studies every five years. The long-term expected rate of return on pension plan investments was determined using a building-block method in which best-estimate ranges of expected future real rates of return (expected returns, net of pension plan investment expense and inflation) are developed for each major asset class. These ranges are combined to produce the long-term expected rate of return by weighting the expected future real rates of return by the target asset allocation percentage and by adding expected inflation. The target allocation and best estimates of rates of return on pension plan investments as of June 30, 2016 and 2015 are summarized in the following tables:
Long-TermStrategic Allocation Target Expected Geometric
(Risk-Based Classes) Allocation Rate of Return
Broad growth 63.00% 8.35%Principal protection 7.00% 2.20%Real return 10.00% 6.15%Crisis risk offset 20.00% 5.50%
100.00%
2016
Long-TermTarget Expected Arithmetic
Asset Class Allocation Rate of Return
Domestic equity 30.00% 8.50%International equity 26.00% 9.25%Total fixed-income 20.00% 3.10%Real estate 7.00% 9.20%Private equity 7.00% 11.85%Real return 5.00% 6.65%Covered calls 5.00% 7.65%
100.00%
2015
.
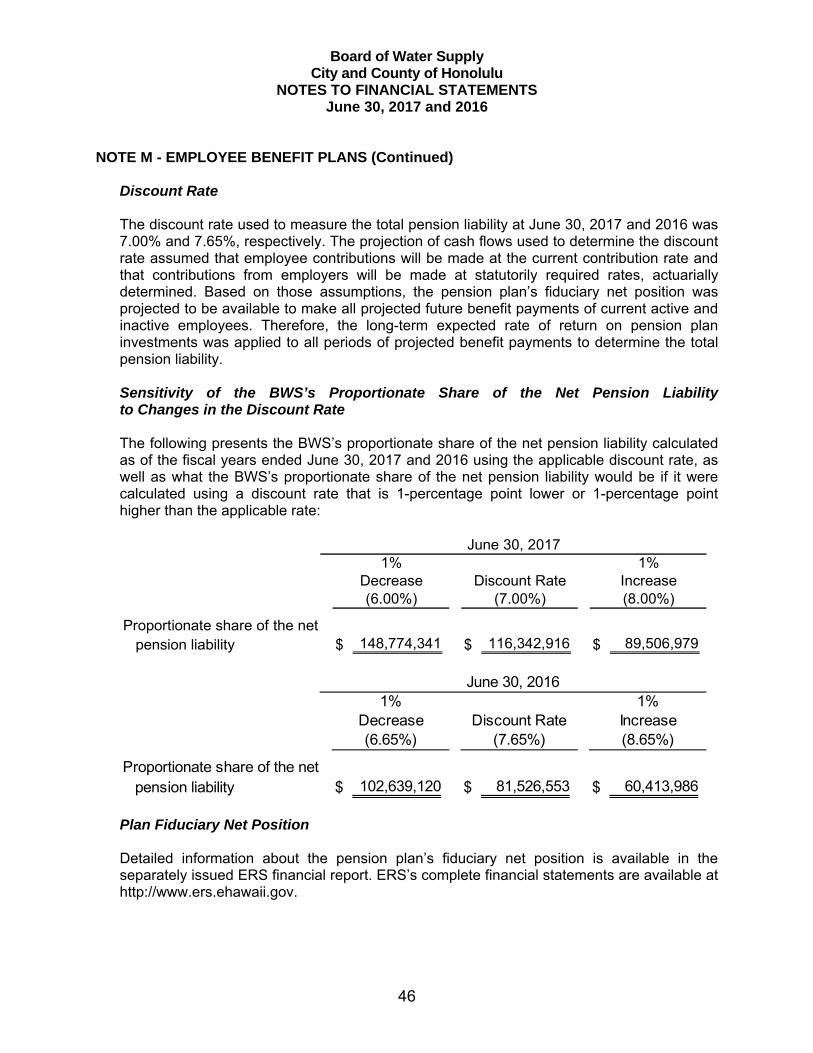
Board of Water Supply City and County of Honolulu
NOTES TO FINANCIAL STATEMENTS June 30, 2017 and 2016
46
NOTE M - EMPLOYEE BENEFIT PLANS (Continued) Discount Rate The discount rate used to measure the total pension liability at June 30, 2017 and 2016 was 7.00% and 7.65%, respectively. The projection of cash flows used to determine the discount rate assumed that employee contributions will be made at the current contribution rate and that contributions from employers will be made at statutorily required rates, actuarially determined. Based on those assumptions, the pension plan’s fiduciary net position was projected to be available to make all projected future benefit payments of current active and inactive employees. Therefore, the long-term expected rate of return on pension plan investments was applied to all periods of projected benefit payments to determine the total pension liability. Sensitivity of the BWS’s Proportionate Share of the Net Pension Liability to Changes in the Discount Rate The following presents the BWS’s proportionate share of the net pension liability calculated as of the fiscal years ended June 30, 2017 and 2016 using the applicable discount rate, as well as what the BWS’s proportionate share of the net pension liability would be if it were calculated using a discount rate that is 1-percentage point lower or 1-percentage point higher than the applicable rate:
Proportionate share of the netpension liability $ 148,774,341 $ 116,342,916 $ 89,506,979
June 30, 20171%
Increase(8.00%)
1%Decrease(6.00%)
Discount Rate(7.00%)
Proportionate share of the netpension liability $ 102,639,120 $ 81,526,553 $ 60,413,986
June 30, 20161% 1%
Decrease Discount Rate Increase(6.65%) (7.65%) (8.65%)
Plan Fiduciary Net Position Detailed information about the pension plan’s fiduciary net position is available in the separately issued ERS financial report. ERS’s complete financial statements are available at http://www.ers.ehawaii.gov.
Board of Water Supply City and County of Honolulu
NOTES TO FINANCIAL STATEMENTS June 30, 2017 and 2016
47
NOTE M - EMPLOYEE BENEFIT PLANS (Continued) Payable to the Pension Plan At June 30, 2017 and 2016, the amount payable to the ERS totaled $503,150 and $487,947, respectively. The amount payable at June 30, 2017 and 2016 consists of statutorily required employer contributions for the month of June 2017 and 2016, respectively. Post-Retirement Health Care and Life Insurance Benefits In addition to providing pension benefits, the State of Hawaii Employer-Union Health Benefits Trust Fund (“EUTF”), an agent multiple-employer plan provides certain health care (medical, prescription, vision and dental) and life insurance benefits for retired BWS employees. Act 88 established the EUTF during the 2001 State legislative session and is codified in HRS 87A. Contributions are based on negotiated collective bargaining agreements and are limited by State statute to the actual cost of benefit coverage. For employees hired on or before July 1, 1996, the BWS pays 100% of the monthly health care premium for employees retiring with 10 or more years of credited service, and 50% of the monthly premium for employees retiring with fewer than 10 years of credited service. For employees hired after June 30, 1996 but before July 1, 2001, and retiring with 25 years or more of service, the BWS pays the entire health care premium. For employees retiring with at least 15 years but fewer than 25 years of service, the BWS pays 75% of the monthly Medicare or non-Medicare premium. For those retiring with at least 10 years but fewer than 15 years of service, the BWS pays 50% of the retired employees’ monthly Medicare or non-Medicare premium. For those retiring with fewer than 10 years of service, the BWS makes no contributions. For employees hired on or after June 30, 2001 and retiring with over 25 years of service, the BWS pays 100% of the monthly premium based on the self plan. For those who retire with at least 15 years but fewer than 25 years of service, the BWS pays 75% of the retired employees’ monthly Medicare or non-Medicare premium based on the self plan. For those retiring with at least 10 years but fewer than 15 years of service, the BWS pays 50% of the retired employeesʼ monthly Medicare or non-Medicare premium based on the self plan. For those retiring with fewer than 10 years of service, the BWS makes no contributions. The BWS also reimburses 100% of Medicare premium costs for retirees and qualified dependents (through the State of Hawaii), who are at least 65 years of age and have at least 10 years of service. The BWS is required to contribute the annual required contribution (“ARC”) of the employer, an amount actuarially determined for the other postemployment benefits (“OPEB”). The ARC represents a level of funding that, if paid on an on-going basis, is projected to cover normal cost each year and amortize any unfunded actuarial liabilities or funding excess over a period not to exceed 30 years.
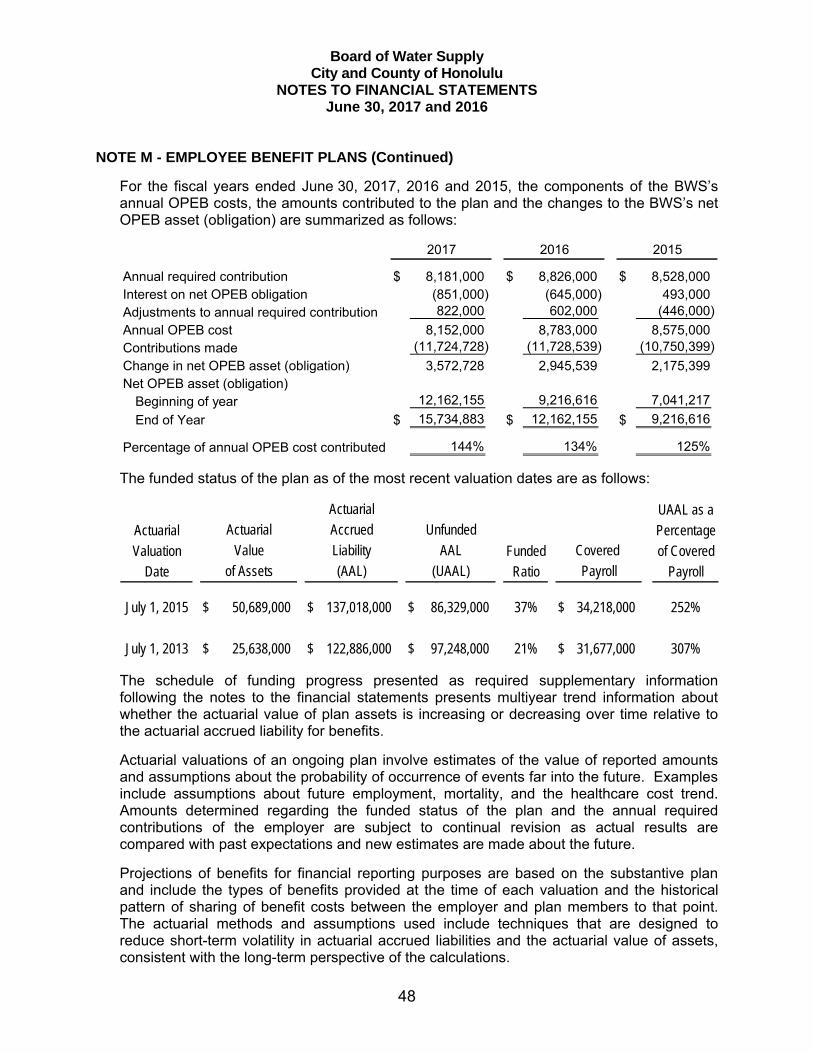
Board of Water Supply City and County of Honolulu
NOTES TO FINANCIAL STATEMENTS June 30, 2017 and 2016
48
NOTE M - EMPLOYEE BENEFIT PLANS (Continued)
For the fiscal years ended June 30, 2017, 2016 and 2015, the components of the BWSʼs annual OPEB costs, the amounts contributed to the plan and the changes to the BWSʼs net OPEB asset (obligation) are summarized as follows:
Annual required contribution $ 8,181,000 $ 8,826,000 $ 8,528,000 Interest on net OPEB obligation (851,000) (645,000) 493,000 Adjustments to annual required contribution 822,000 602,000 (446,000)
Annual OPEB cost 8,152,000 8,783,000 8,575,000 Contributions made (11,724,728) (11,728,539) (10,750,399)
Change in net OPEB asset (obligation) 3,572,728 2,945,539 2,175,399 Net OPEB asset (obligation)
Beginning of year 12,162,155 9,216,616 7,041,217
End of Year $ 15,734,883 $ 12,162,155 $ 9,216,616
Percentage of annual OPEB cost contributed 144% 134% 125%
2017 2016 2015
The funded status of the plan as of the most recent valuation dates are as follows:
UAAL as a
Actuarial Percentage
Valuation Funded of CoveredDate Ratio Payroll
July 1, 2015 $ 50,689,000 $ 137,018,000 $ 86,329,000 37% $ 34,218,000 252%
July 1, 2013 $ 25,638,000 $ 122,886,000 $ 97,248,000 21% $ 31,677,000 307%
Actuarial
Value
of Assets
Unfunded
AAL
(UAAL)
ActuarialAccrued
Liability
(AAL)
Covered
Payroll
The schedule of funding progress presented as required supplementary information following the notes to the financial statements presents multiyear trend information about whether the actuarial value of plan assets is increasing or decreasing over time relative to the actuarial accrued liability for benefits.
Actuarial valuations of an ongoing plan involve estimates of the value of reported amounts and assumptions about the probability of occurrence of events far into the future. Examples include assumptions about future employment, mortality, and the healthcare cost trend. Amounts determined regarding the funded status of the plan and the annual required contributions of the employer are subject to continual revision as actual results are compared with past expectations and new estimates are made about the future.
Projections of benefits for financial reporting purposes are based on the substantive plan and include the types of benefits provided at the time of each valuation and the historical pattern of sharing of benefit costs between the employer and plan members to that point. The actuarial methods and assumptions used include techniques that are designed to reduce short-term volatility in actuarial accrued liabilities and the actuarial value of assets, consistent with the long-term perspective of the calculations.
Board of Water Supply City and County of Honolulu
NOTES TO FINANCIAL STATEMENTS June 30, 2017 and 2016
49
NOTE M - EMPLOYEE BENEFIT PLANS (Continued) In the July 1, 2015 actuarial valuation, the entry age normal actuarial cost method was used. The actuarial assumptions included a discount rate of 7.0%, projected payroll growth of 3.5%, and an annual health cost trend rates of 9.0% and 7.5% for PPO and HMO, respectively, reduced by decrements to an ultimate rate of 5.0% after 8 years. The initial unfunded actuarial accrued liability is amortized as a level percentage of projected payroll over a thirty-year closed period ending June 30, 2037. The EUTF issues a stand-alone financial report that includes financial statements and required supplementary information, which may be obtained at the following address: State of Hawaii Employer-Union Health Benefits Trust Fund, P.O. Box 2121, Honolulu, Hawaii 96805.
NOTE N - COMMITMENTS Commitments, primarily for capital improvements, approximated $196,224,000 and $217,450,000 as of June 30, 2017 and 2016, respectively. Such amounts are to be funded by operating revenues, contributed capital, cash and investments on hand.
NOTE O - CONTINGENCIES
Workers’ Compensation Self-Insurance Liability The BWS is self-insured for workers’ compensation and disability claims up to $600,000 and in excess of $25,000,000. The BWS has obtained excess insurance coverage for claims that are not self-insured. The BWS provides reserves for claims not covered by insurance that in the opinion of management will result in probable judgment against the BWS. The liability for losses and loss adjustment expenses is comprised of case reserves and incurred but not reported loss reserves (“IBNR”). Case or outstanding loss reserves represent estimates of ultimate costs to settle reported claims.
Determination of a reserve account for workers’ compensation is a significant estimate. It is reasonably possible that one or more future events could result in a material change in the estimated claims loss in the near term. Safe Drinking Water The BWS is subject to the requirements of the Safe Drinking Water Act (the “Act”), which is administered by the State Department of Health on behalf of the U.S. Environmental Protection Agency. Management believes that the BWS is in full compliance with the requirements of the Act and is not aware of any matters under the Act that may materially affect the BWSʼs customer service area.
Board of Water Supply City and County of Honolulu
NOTES TO FINANCIAL STATEMENTS June 30, 2017 and 2016
50
NOTE O - CONTINGENCIES (Continued) Other Legal Matters The BWS is party to various legal proceedings arising in the normal course of business. The outcome of individual matters is not predictable. However, management believes that the ultimate resolution of all such matters, after considering insurance coverage, will not have material adverse effect on the BWSʼs financial position, results of operations, or liquidity.
NOTE P - ADOPTION OF NEW ACCOUNTING PRINCIPLE
BWS has adopted certain requirements of GASB Statement No. 82, Pension Issues an amendment of GASB Statements No. 67, No. 68, and No. 73 (GASBS 82), which are effective for reporting periods beginning after June 15, 2016. The adoption of GASBS 82 resulted in the reclassification of payments made by BWS to satisfy employee (plan member) contribution requirements that were previously deferred in the period for which the contributions were assessed and recorded as expenses in the subsequent fiscal year. These changes have been applied retroactively by restating the financial statements of the BWS as of June 30, 2016. For the fiscal year ended June 30, 2016, the effect of the change reduced beginning net position by $1,732,405 and decreased the change in net position for the fiscal year ended June 30, 2016 by $96,523. As of June 30, 2016, deferred outflows of resources related to pensions and net position both decreased by $1,828,928. For the fiscal year ended June 30, 2017, the effect of the change decreased the change in net position by $126,880.
51
REQUIRED SUPPLEMENTARY INFORMATION
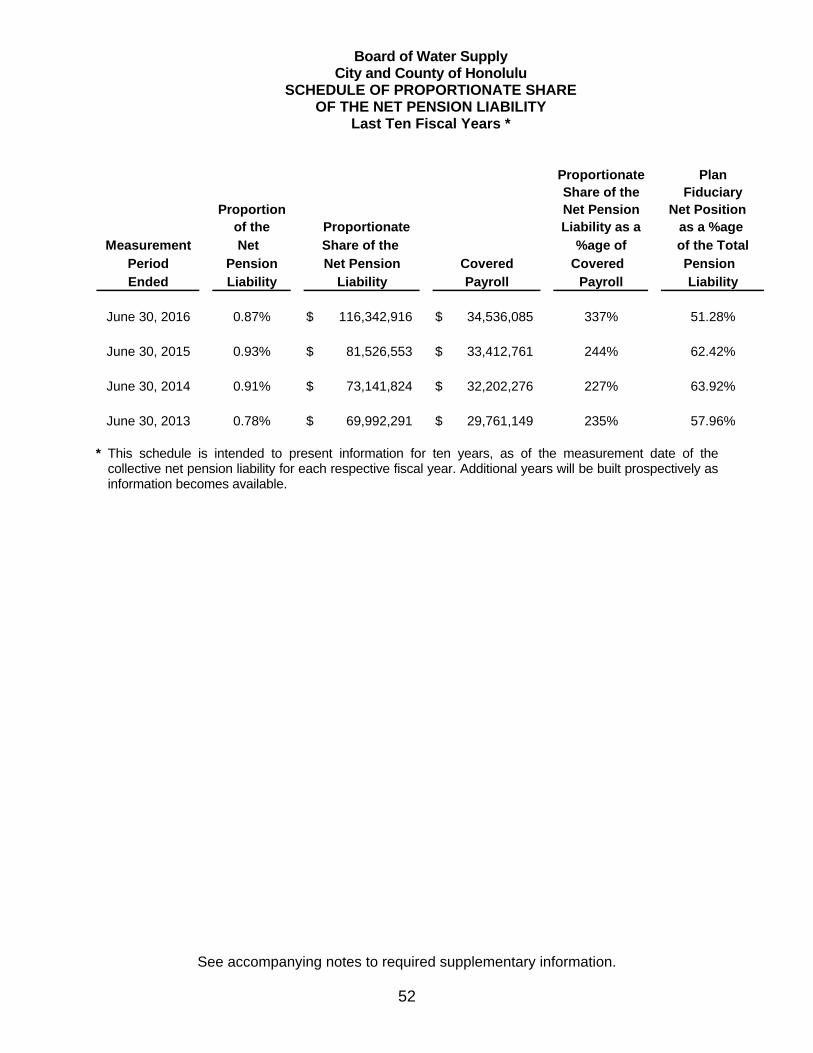
Board of Water Supply City and County of Honolulu
SCHEDULE OF PROPORTIONATE SHARE OF THE NET PENSION LIABILITY
Last Ten Fiscal Years *
See accompanying notes to required supplementary information.
52
Proportionate PlanShare of the Fiduciary
Proportion Net Pension Net Position of the Proportionate Liability as a as a %age
Measurement Net %age of of the TotalPeriod Pension Covered Pension Ended Liability Payroll Liability
June 30, 2016 0.87% $ 116,342,916 $ 34,536,085 337% 51.28%
June 30, 2015 0.93% $ 81,526,553 $ 33,412,761 244% 62.42%
June 30, 2014 0.91% $ 73,141,824 $ 32,202,276 227% 63.92%
June 30, 2013 0.78% $ 69,992,291 $ 29,761,149 235% 57.96%
Share of the Net Pension
LiabilityCoveredPayroll
* This schedule is intended to present information for ten years, as of the measurement date of the
collective net pension liability for each respective fiscal year. Additional years will be built prospectively as information becomes available.
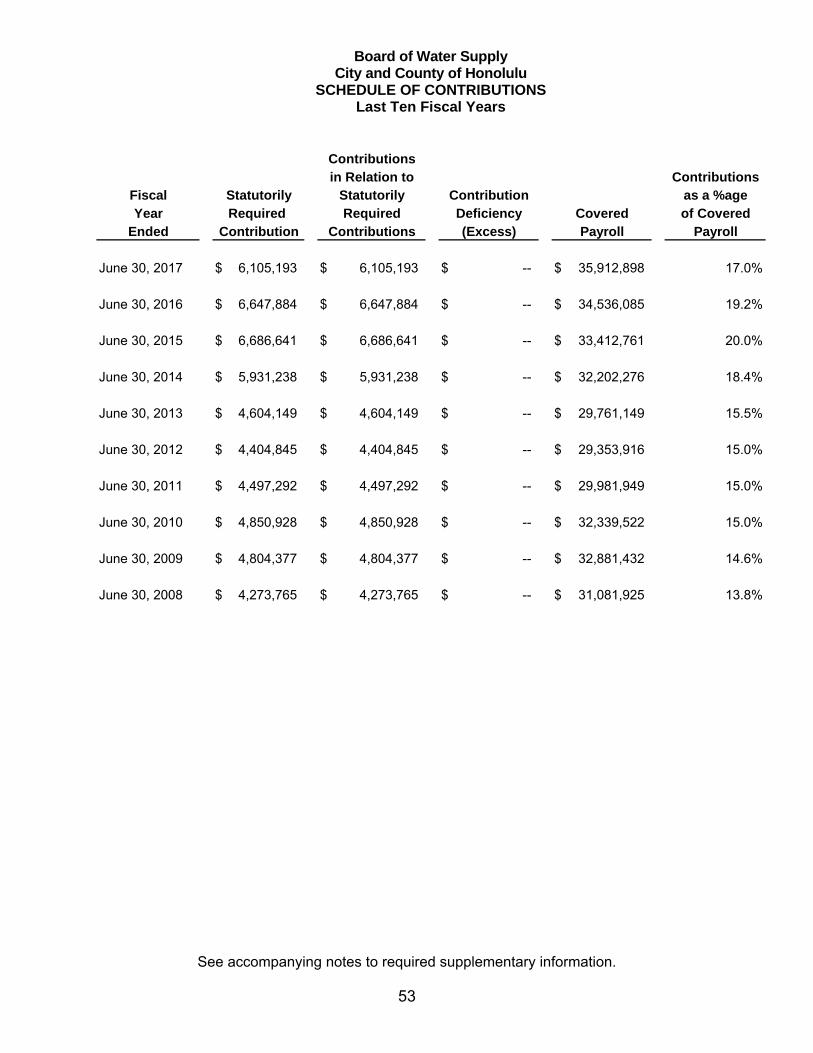
Board of Water Supply City and County of Honolulu
SCHEDULE OF CONTRIBUTIONS Last Ten Fiscal Years
See accompanying notes to required supplementary information.
53
ContributionsFiscal as a %ageYear of Covered
Ended Payroll
June 30, 2017 $ 6,105,193 $ 6,105,193 $ -- $ 35,912,898 17.0%
June 30, 2016 $ 6,647,884 $ 6,647,884 $ -- $ 34,536,085 19.2%
June 30, 2015 $ 6,686,641 $ 6,686,641 $ -- $ 33,412,761 20.0%
June 30, 2014 $ 5,931,238 $ 5,931,238 $ -- $ 32,202,276 18.4%
June 30, 2013 $ 4,604,149 $ 4,604,149 $ -- $ 29,761,149 15.5%
June 30, 2012 $ 4,404,845 $ 4,404,845 $ -- $ 29,353,916 15.0%
June 30, 2011 $ 4,497,292 $ 4,497,292 $ -- $ 29,981,949 15.0%
June 30, 2010 $ 4,850,928 $ 4,850,928 $ -- $ 32,339,522 15.0%
June 30, 2009 $ 4,804,377 $ 4,804,377 $ -- $ 32,881,432 14.6%
June 30, 2008 $ 4,273,765 $ 4,273,765 $ -- $ 31,081,925 13.8%
(Excess)Deficiency
Contribution
PayrollCovered
Contribution
StatutorilyRequired
Contributions
Contributionsin Relation to
StatutorilyRequired
Board of Water Supply City and County of Honolulu
NOTES TO REQUIRED SUPPLEMENTARY INFORMATION REQUIRED BY GASB STATEMENT NO. 68
Fiscal Year Ended June 30, 2017
54
NOTE A - CHANGES OF ASSUMPTIONS Amounts reported in the schedule of the proportionate share of the net pension liability as of
the measurement period ended June 30, 2016 (fiscal year ended June 30, 2017) were significantly impacted by the following changes of actuarial assumptions:
o The investment return assumption decreased from 7.65% to 7.00%
o Mortality assumptions were modified to assume longer life expectancies as well as
to reflect continuous mortality improvement Prior to the measurement period ended June 30, 2016 (fiscal year ended June 30, 2017),
there were no other factors, including the use of different assumptions that significantly affect trends reported in these schedules.
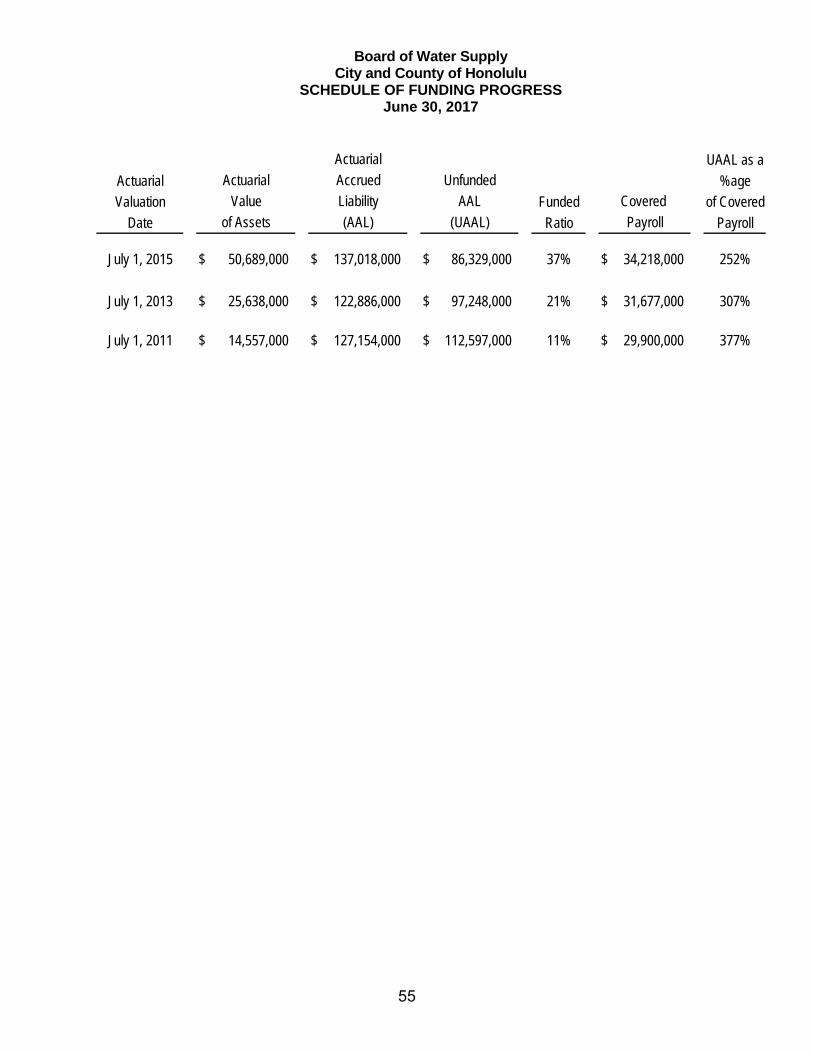
Board of Water Supply City and County of Honolulu
SCHEDULE OF FUNDING PROGRESS June 30, 2017
55
UAAL as a
Actuarial %ageValuation Funded of Covered
Date Ratio Payroll
July 1, 2015 $ 50,689,000 $ 137,018,000 $ 86,329,000 37% $ 34,218,000 252%
July 1, 2013 $ 25,638,000 $ 122,886,000 $ 97,248,000 21% $ 31,677,000 307%
July 1, 2011 $ 14,557,000 $ 127,154,000 $ 112,597,000 11% $ 29,900,000 377%
of Assets (AAL) (UAAL) Payroll
Actuarial
Actuarial Accrued UnfundedValue Liability AAL Covered
56
SUPPLEMENTARY INFORMATION
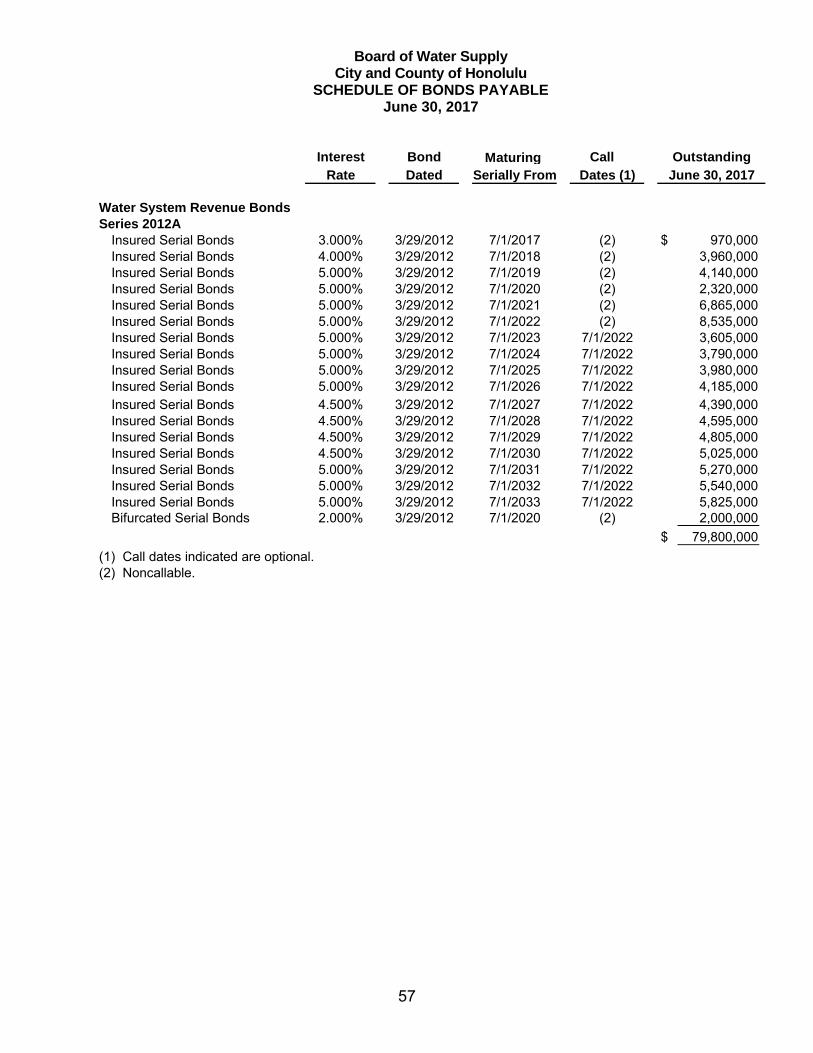
Board of Water Supply City and County of Honolulu
SCHEDULE OF BONDS PAYABLE June 30, 2017
57
Interest Bond Maturing Call Rate Dated Serially From Dates (1)
Water System Revenue BondsSeries 2012A
Insured Serial Bonds 3.000% 3/29/2012 7/1/2017 (2) $ 970,000Insured Serial Bonds 4.000% 3/29/2012 7/1/2018 (2) 3,960,000Insured Serial Bonds 5.000% 3/29/2012 7/1/2019 (2) 4,140,000Insured Serial Bonds 5.000% 3/29/2012 7/1/2020 (2) 2,320,000Insured Serial Bonds 5.000% 3/29/2012 7/1/2021 (2) 6,865,000Insured Serial Bonds 5.000% 3/29/2012 7/1/2022 (2) 8,535,000Insured Serial Bonds 5.000% 3/29/2012 7/1/2023 7/1/2022 3,605,000Insured Serial Bonds 5.000% 3/29/2012 7/1/2024 7/1/2022 3,790,000Insured Serial Bonds 5.000% 3/29/2012 7/1/2025 7/1/2022 3,980,000Insured Serial Bonds 5.000% 3/29/2012 7/1/2026 7/1/2022 4,185,000Insured Serial Bonds 4.500% 3/29/2012 7/1/2027 7/1/2022 4,390,000Insured Serial Bonds 4.500% 3/29/2012 7/1/2028 7/1/2022 4,595,000Insured Serial Bonds 4.500% 3/29/2012 7/1/2029 7/1/2022 4,805,000Insured Serial Bonds 4.500% 3/29/2012 7/1/2030 7/1/2022 5,025,000Insured Serial Bonds 5.000% 3/29/2012 7/1/2031 7/1/2022 5,270,000Insured Serial Bonds 5.000% 3/29/2012 7/1/2032 7/1/2022 5,540,000Insured Serial Bonds 5.000% 3/29/2012 7/1/2033 7/1/2022 5,825,000Bifurcated Serial Bonds 2.000% 3/29/2012 7/1/2020 (2) 2,000,000
$ 79,800,000
(1) Call dates indicated are optional.(2) Noncallable.
OutstandingJune 30, 2017
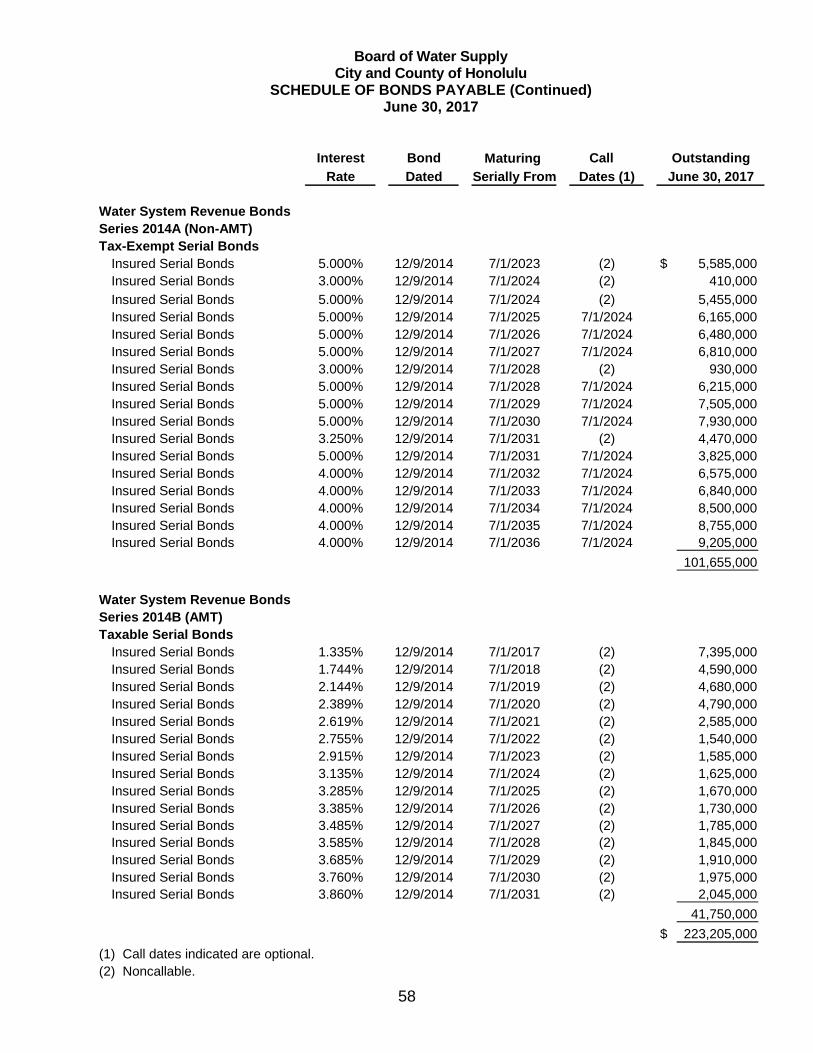
Board of Water Supply City and County of Honolulu
SCHEDULE OF BONDS PAYABLE (Continued) June 30, 2017
58
Interest Bond Maturing Call
Rate Dated Serially From Dates (1)
Water System Revenue BondsSeries 2014A (Non-AMT)Tax-Exempt Serial Bonds
Insured Serial Bonds 5.000% 12/9/2014 7/1/2023 (2) $ 5,585,000Insured Serial Bonds 3.000% 12/9/2014 7/1/2024 (2) 410,000
Insured Serial Bonds 5.000% 12/9/2014 7/1/2024 (2) 5,455,000Insured Serial Bonds 5.000% 12/9/2014 7/1/2025 7/1/2024 6,165,000Insured Serial Bonds 5.000% 12/9/2014 7/1/2026 7/1/2024 6,480,000Insured Serial Bonds 5.000% 12/9/2014 7/1/2027 7/1/2024 6,810,000Insured Serial Bonds 3.000% 12/9/2014 7/1/2028 (2) 930,000Insured Serial Bonds 5.000% 12/9/2014 7/1/2028 7/1/2024 6,215,000Insured Serial Bonds 5.000% 12/9/2014 7/1/2029 7/1/2024 7,505,000Insured Serial Bonds 5.000% 12/9/2014 7/1/2030 7/1/2024 7,930,000Insured Serial Bonds 3.250% 12/9/2014 7/1/2031 (2) 4,470,000Insured Serial Bonds 5.000% 12/9/2014 7/1/2031 7/1/2024 3,825,000Insured Serial Bonds 4.000% 12/9/2014 7/1/2032 7/1/2024 6,575,000Insured Serial Bonds 4.000% 12/9/2014 7/1/2033 7/1/2024 6,840,000Insured Serial Bonds 4.000% 12/9/2014 7/1/2034 7/1/2024 8,500,000Insured Serial Bonds 4.000% 12/9/2014 7/1/2035 7/1/2024 8,755,000Insured Serial Bonds 4.000% 12/9/2014 7/1/2036 7/1/2024 9,205,000
101,655,000
Water System Revenue BondsSeries 2014B (AMT)Taxable Serial Bonds
Insured Serial Bonds 1.335% 12/9/2014 7/1/2017 (2) 7,395,000Insured Serial Bonds 1.744% 12/9/2014 7/1/2018 (2) 4,590,000Insured Serial Bonds 2.144% 12/9/2014 7/1/2019 (2) 4,680,000Insured Serial Bonds 2.389% 12/9/2014 7/1/2020 (2) 4,790,000Insured Serial Bonds 2.619% 12/9/2014 7/1/2021 (2) 2,585,000Insured Serial Bonds 2.755% 12/9/2014 7/1/2022 (2) 1,540,000Insured Serial Bonds 2.915% 12/9/2014 7/1/2023 (2) 1,585,000Insured Serial Bonds 3.135% 12/9/2014 7/1/2024 (2) 1,625,000Insured Serial Bonds 3.285% 12/9/2014 7/1/2025 (2) 1,670,000Insured Serial Bonds 3.385% 12/9/2014 7/1/2026 (2) 1,730,000Insured Serial Bonds 3.485% 12/9/2014 7/1/2027 (2) 1,785,000Insured Serial Bonds 3.585% 12/9/2014 7/1/2028 (2) 1,845,000Insured Serial Bonds 3.685% 12/9/2014 7/1/2029 (2) 1,910,000Insured Serial Bonds 3.760% 12/9/2014 7/1/2030 (2) 1,975,000 Insured Serial Bonds 3.860% 12/9/2014 7/1/2031 (2) 2,045,000
41,750,000
$ 223,205,000
(1) Call dates indicated are optional.(2) Noncallable.
June 30, 2017
Outstanding
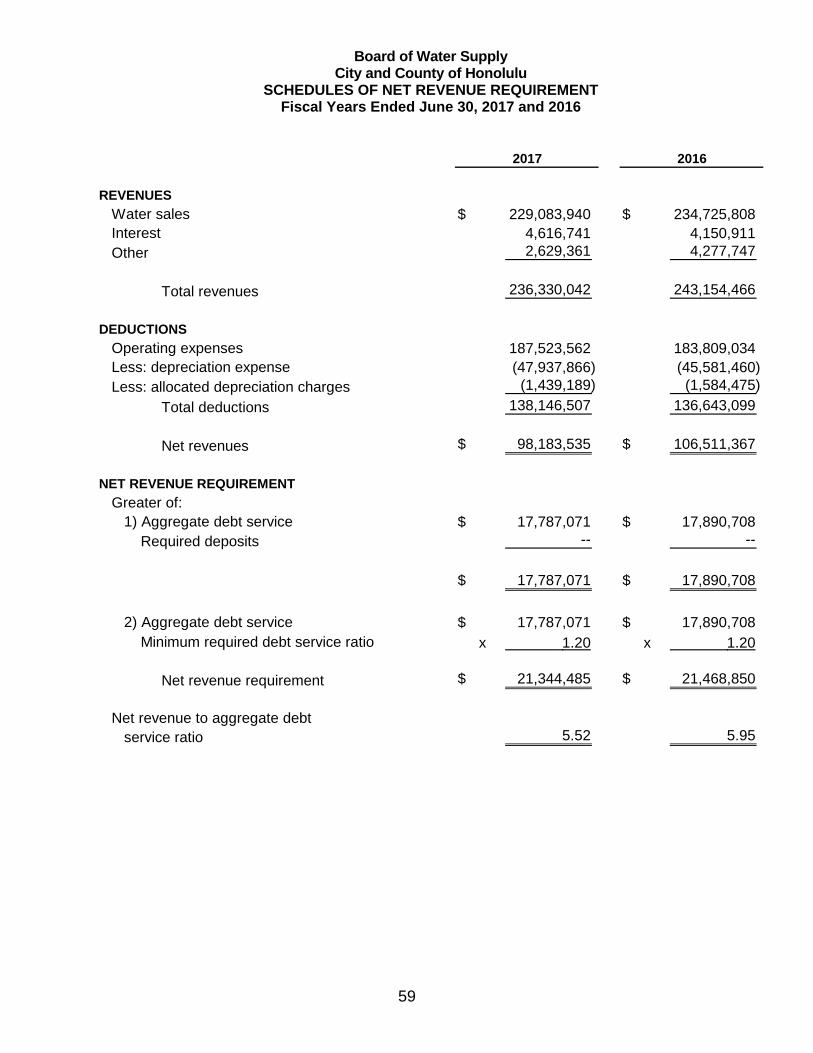
Board of Water Supply City and County of Honolulu
SCHEDULES OF NET REVENUE REQUIREMENT Fiscal Years Ended June 30, 2017 and 2016
59
REVENUES
Water sales $ 229,083,940 $ 234,725,808Interest 4,616,741 4,150,911Other 2,629,361 4,277,747
Total revenues 236,330,042 243,154,466
DEDUCTIONS
Operating expenses 187,523,562 183,809,034 Less: depreciation expense (47,937,866) (45,581,460) Less: allocated depreciation charges (1,439,189) (1,584,475)
Total deductions 138,146,507 136,643,099
Net revenues $ 98,183,535 $ 106,511,367
NET REVENUE REQUIREMENT
Greater of:1) Aggregate debt service $ 17,787,071 $ 17,890,708
Required deposits -- --
$ 17,787,071 $ 17,890,708
2) Aggregate debt service $ 17,787,071 $ 17,890,708 Minimum required debt service ratio x 1.20 x 1.20
Net revenue requirement $ 21,344,485 $ 21,468,850
Net revenue to aggregate debtservice ratio 5.52 5.95
2017 2016