Embed Size (px)
Citation preview
CALIFORNIA HEALTH BENEFIT EXCHANGE (COVERED CALIFORNIA)
Financial Statements and Reports Required by OMB Circular A-133, Audits of States, Local Governments, and Non-Profit Organizations
Year ended June 30, 2015
(With Independent Auditors’ Report Thereon)
CALIFORNIA HEALTH BENEFIT EXCHANGE
(COVERED CALIFORNIA)
Table of Contents
Page
Independent Auditors’ Report 1
Management’s Discussion and Analysis (Unaudited) 4
Basic Financial Statements:
Statement of Net Position 13
Statement of Revenues, Expenses, and Changes in Net Position 14
Statement of Cash Flows 15
Notes to Financial Statements 16
Reports Required by OMB Circular A-133
Independent Auditors’ Report on Internal Control over Financial Reporting and on Compliance
and Other Matters Based on an Audit of Financial Statements Performed in Accordance
with Government Auditing Standards 28
Independent Auditors’ Report on Compliance for Each Major Federal Program; Report on
Internal Control Over Compliance Required by OMB Circular A-133, Audits of States,
Local Governments, and Non-Profit Organizations 30
Schedule of Expenditures of Federal Awards 32
Notes to Schedule of Expenditures of Federal Awards 33
Schedule of Findings and Questioned Costs 34
Independent Auditors’ Report
Board of Directors
California Health Benefit Exchange
Report on the Financial Statements
We have audited the accompanying financial statements of the California Health Benefit Exchange (Covered
California) as of and for the year ended June 30, 2015 and the related notes to the financial statements, which
collectively comprise Covered California’s basic financial statements as listed in the table of contents.
Management’s Responsibility for the Financial Statements
Management is responsible for the preparation and fair presentation of these financial statements in
accordance with U.S. generally accepted accounting principles; this includes the design, implementation, and
maintenance of internal control relevant to the preparation and fair presentation of financial statements that
are free from material misstatement, whether due to fraud or error.
Auditors’ Responsibility
Our responsibility is to express an opinion on these financial statements based on our audit. We conducted
our audit in accordance with auditing standards generally accepted in the United States of America and the
standards applicable to financial audits contained in Government Auditing Standards, issued by the
Comptroller General of the United States. Those standards require that we plan and perform the audit to
obtain reasonable assurance about whether the financial statements are free from material misstatement.
An audit involves performing procedures to obtain audit evidence about the amounts and disclosures in the
financial statements. The procedures selected depend on the auditors’ judgment, including the assessment of
the risks of material misstatement of the financial statements, whether due to fraud or error. In making those
risk assessments, the auditor considers internal control relevant to the entity’s preparation and fair
presentation of the financial statements in order to design audit procedures that are appropriate in the
circumstances, but not for the purpose of expressing an opinion on the effectiveness of the entity’s internal
control. Accordingly, we express no such opinion. An audit also includes evaluating the appropriateness of
accounting policies used and the reasonableness of significant accounting estimates made by management,
as well as evaluating the overall presentation of the financial statements.
We believe that the audit evidence we have obtained is sufficient and appropriate to provide a basis for our
audit opinion.
Opinion
In our opinion, the financial statements referred to above present fairly, in all material respects, the financial
position of Covered California as of June 30, 2015, and the changes in financial position and its cash flows
thereof for the year then ended in accordance with U.S. generally accepted accounting principles.
KPMG LLP is a Delaware limited liability partnership and the U.S. member firm of the KPMG network of independent member firms affiliated with KPMG International Cooperative (“KPMG International”), a Swiss entity.
KPMG LLP500 Capitol Mall, Ste 2100Sacramento, CA 95814-4754
2
Emphasis of Matter
As discussed in note 1 to the financial statements, in 2015, Covered California adopted Governmental
Accounting Standards Board (GASB) Statement No. 68, Accounting and Financial Reporting for Pensions and
Statement No. 71, Pension Transition for Contributions Made Subsequent to the Measurement Date. The
July 1, 2014 beginning net position has been restated for the retrospective application of this new accounting
guidance. Our opinion is not modified with respect to this matter.
Other Matters
Required Supplementary Information
U.S. generally accepted accounting principles require that the management’s discussion and analysis on
pages 4-12 be presented to supplement the basic financial statements. Such information, although not a part
of the basic financial statements, is required by the Governmental Accounting Standards Board who considers
it to be an essential part of financial reporting for placing the basic financial statements in an appropriate
operational, economic, or historical context. We have applied certain limited procedures to the required
supplementary information in accordance with auditing standards generally accepted in the United States of
America, which consisted of inquiries of management about the methods of preparing the information and
comparing the information for consistency with management’s responses to our inquiries, the basic financial
statements, and other knowledge we obtained during our audit of the basic financial statements. We do not
express an opinion or provide any assurance on the information because the limited procedures do not
provide us with sufficient evidence to express an opinion or provide any assurance.
Management has omitted the required supplementary information for GASB Statement No. 68 Accounting and
Financial Reporting for Pensions that accounting principles generally accepted in the United States of
America require to be presented to supplement the basic financial statements. Such missing information,
although not a part of the basic financial statements, is required by the Governmental Accounting Standards
Board who considers it to be an essential part of the financial reporting for placing the basic financial
statements in an appropriate operational, economic, or historical context. Our opinion on the basic financial
statements is not affected by this missing information.
Supplementary and Other Information
Our audit was conducted for the purpose of forming an opinion on the financial statements that collectively
comprise Covered California’s basic financial statements. The accompanying schedule of expenditures of
federal awards, as required by the U.S. Office of Management and Budget Circular A-133, Audits of States,
Local Governments, and Non-Profit Organizations, is presented for purposes of additional analysis and is not
a required part of the basic financial statements. The accompanying schedule of expenditures of federal
awards is the responsibility of management and was derived from and relates directly to the underlying
accounting and other records used to prepare the basic financial statements. Such information has been
subjected to the auditing procedures applied in the audit of the basic financial statements and certain
additional procedures, including comparing and reconciling such information directly to the underlying
accounting and other records used to prepare the basic financial statements or to the basic financial
statements themselves, and other additional procedures in accordance with auditing standards generally
accepted in the United States of America. In our opinion, the schedule of expenditures of federal awards is
fairly stated in all material respects in relation to the basic financial statements as a whole.
3
Other Reporting Required by Government Auditing Standards
In accordance with Government Auditing Standards, we have also issued our report dated March 20, 2017 on
our consideration of Covered California’s internal control over financial reporting and on our tests of its
compliance with certain provisions of laws, regulations, contracts, and grant agreements and other matters.
The purpose of that report is to describe the scope of our testing of internal control over financial reporting and
compliance and the results of that testing, and not to provide an opinion on internal control over financial
reporting or on compliance. That report is an integral part of an audit performed in accordance with
Government Auditing Standards in considering Covered California’s internal control over financial reporting
and compliance.
Sacramento, California
March 20, 2017
CALIFORNIA HEALTH BENEFIT EXCHANGE
(COVERED CALIFORNIA)
Management’s Discussion and Analysis (Unaudited)
June 30, 2015
4 (Continued)
The following discussion and analysis of the California Health Benefit Exchange’s (Covered California)
financial performance provides an overview of financial activities for the fiscal year ended June 30, 2015.
Please read it in conjunction with Covered California’s financial statements that follow this section.
Financial Statements
These required statements offer short-term and long-term financial information about Covered California. The
statement of net position provides information about the nature and amounts of investments in resources
(assets) and obligations (liabilities) at the close of the fiscal year. All of the current year’s revenues and
expenses are accounted for in the statement of revenues, expenses, and changes in net position. This
statement measures the success of Covered California’s operations over the past year. The final required
financial statement is the statement of cash flows. The primary purpose of this statement is to provide
information about Covered California’s cash receipts and cash payments during the reporting period. The
statement reports cash receipts, cash payments, and net changes in cash resulting from operations, investing,
and financing activities, and provides answers to such questions as where did cash come from and what was
cash used for. The financial statements are prepared on the accrual basis in accordance with U.S. generally
accepted accounting principles.
Accounting Changes
During fiscal year 2014-15 Covered California implemented GASB Statement No. 68, Accounting and
Financial Reporting for Pensions. The primary objective of this Statement is to improve accounting and
financial reporting by state and local governments for pensions. This Statement establishes standards for
measuring and recognizing liabilities, deferred outflows of resources, deferred inflows of resources, and
expenses, and requires recognition of a liability equal to the net pension liability, which is measured as the
total pension liability, less the amount of the pension’s fiduciary net position. The implementation of GASB 68
resulted in Covered California recognizing a net pension liability of $53.5 million as of June 30, 2015. During
fiscal year 2014-15 Covered California recognized pension expense of $4.0 million, deferred outflows of
$11.1 million, and deferred inflows of $10.6 million. More information on Covered California’s pension liability
can be found in note 5.
Notes to Financial Statements
The notes provide additional information that is essential to the full understanding of the data provided in the
financial statements. The notes to financial statements can be found on pages 16 through 27 of this report.
CALIFORNIA HEALTH BENEFIT EXCHANGE
(COVERED CALIFORNIA)
Management’s Discussion and Analysis (Unaudited)
June 30, 2015
5 (Continued)
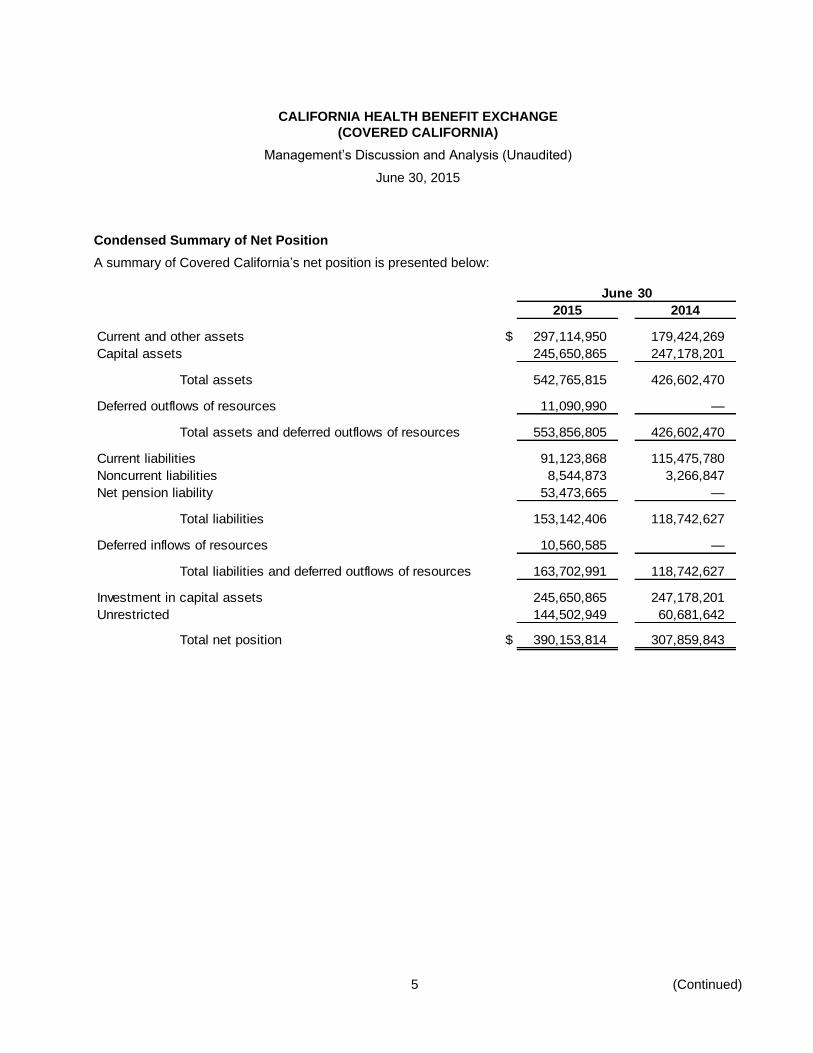
Condensed Summary of Net Position
A summary of Covered California’s net position is presented below:
June 30
2015 2014
Current and other assets $ 297,114,950 179,424,269
Capital assets 245,650,865 247,178,201
Total assets 542,765,815 426,602,470
Deferred outflows of resources 11,090,990 —
Total assets and deferred outflows of resources 553,856,805 426,602,470
Current liabilities 91,123,868 115,475,780
Noncurrent liabilities 8,544,873 3,266,847
Net pension liability 53,473,665 —
Total liabilities 153,142,406 118,742,627
Deferred inflows of resources 10,560,585 —
Total liabilities and deferred outflows of resources 163,702,991 118,742,627
Investment in capital assets 245,650,865 247,178,201
Unrestricted 144,502,949 60,681,642
Total net position $ 390,153,814 307,859,843
CALIFORNIA HEALTH BENEFIT EXCHANGE
(COVERED CALIFORNIA)
Management’s Discussion and Analysis (Unaudited)
June 30, 2015
6 (Continued)
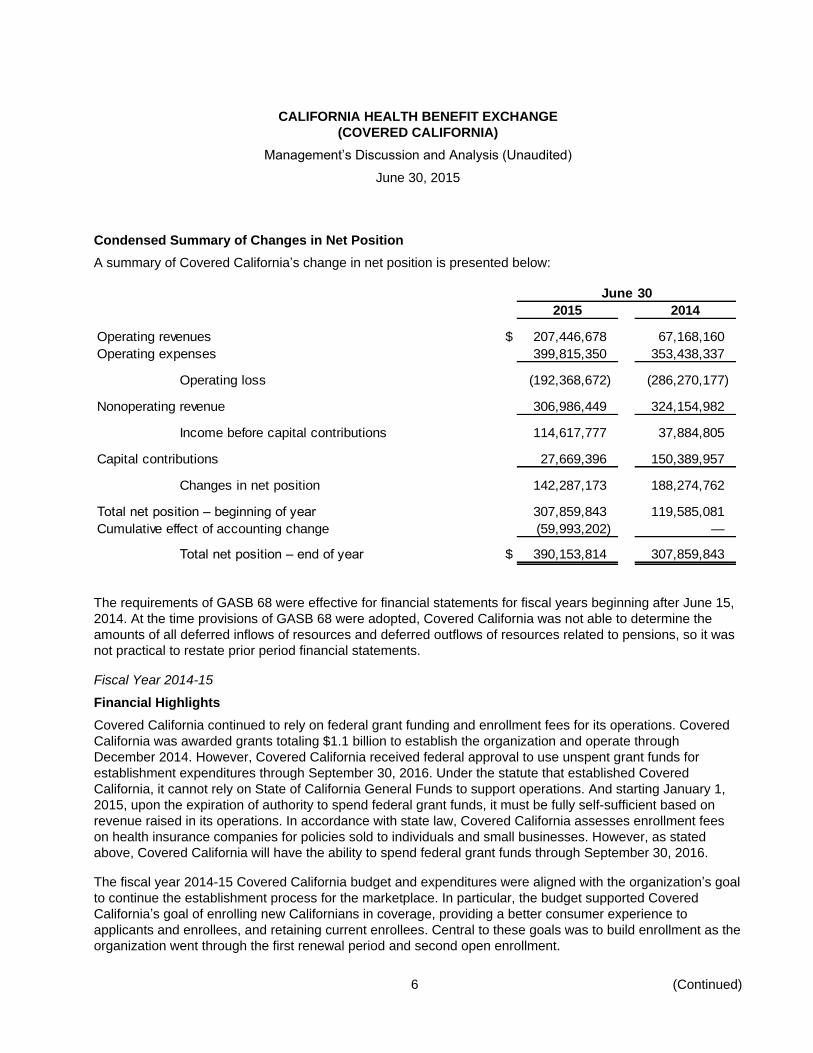
Condensed Summary of Changes in Net Position
A summary of Covered California’s change in net position is presented below:
June 30
2015 2014
Operating revenues $ 207,446,678 67,168,160
Operating expenses 399,815,350 353,438,337
Operating loss (192,368,672) (286,270,177)
Nonoperating revenue 306,986,449 324,154,982
Income before capital contributions 114,617,777 37,884,805
Capital contributions 27,669,396 150,389,957
Changes in net position 142,287,173 188,274,762
Total net position – beginning of year 307,859,843 119,585,081
Cumulative effect of accounting change (59,993,202) —
Total net position – end of year $ 390,153,814 307,859,843
The requirements of GASB 68 were effective for financial statements for fiscal years beginning after June 15,
2014. At the time provisions of GASB 68 were adopted, Covered California was not able to determine the
amounts of all deferred inflows of resources and deferred outflows of resources related to pensions, so it was
not practical to restate prior period financial statements.
Fiscal Year 2014-15
Financial Highlights
Covered California continued to rely on federal grant funding and enrollment fees for its operations. Covered
California was awarded grants totaling $1.1 billion to establish the organization and operate through
December 2014. However, Covered California received federal approval to use unspent grant funds for
establishment expenditures through September 30, 2016. Under the statute that established Covered
California, it cannot rely on State of California General Funds to support operations. And starting January 1,
2015, upon the expiration of authority to spend federal grant funds, it must be fully self-sufficient based on
revenue raised in its operations. In accordance with state law, Covered California assesses enrollment fees
on health insurance companies for policies sold to individuals and small businesses. However, as stated
above, Covered California will have the ability to spend federal grant funds through September 30, 2016.
The fiscal year 2014-15 Covered California budget and expenditures were aligned with the organization’s goal
to continue the establishment process for the marketplace. In particular, the budget supported Covered
California’s goal of enrolling new Californians in coverage, providing a better consumer experience to
applicants and enrollees, and retaining current enrollees. Central to these goals was to build enrollment as the
organization went through the first renewal period and second open enrollment.
CALIFORNIA HEALTH BENEFIT EXCHANGE
(COVERED CALIFORNIA)
Management’s Discussion and Analysis (Unaudited)
June 30, 2015
7 (Continued)
Funding for the fiscal year ended June 30, 2015 included federal grant funds and monthly fees assessed on
qualified health plans. The budget was constructed in anticipation of Covered California transitioning from
being exclusively funded by federal grants to being funded with assessment revenue. The approval of the
extension of the federal grant gave Covered California more time to establish the organization as it worked
toward its goal of identifying the most efficient and cost-effective structure possible.
The first renewal period and the new enrollment numbers for the second open-enrollment period were
encouraging. In May 2014 Covered California released an enrollment forecast for the 2015 open-enrollment
period and beyond. The forecast identified a range of potential enrollments based on the best estimates at the
time. The overall enrollment number of approximately 1.4 million at the end of open enrollment was above the
“low estimate” (1.3 million), but not as high as the “medium estimate” used for budgeting (1.7 million). One of
the main reasons for the difference was that during the special-enrollment period, while the actual retention
rate was better than projected, the transition of consumers out of Medi-Cal and into Covered California was
more modest than anticipated. As a result, by December 2014, the base of consumers with an option to renew
was lower than the medium forecast. Covered California has been able to use that experience to further
sharpen its forecasts.
The expenditures for FY 2014-15 were lower than the adopted budget of $411.7 million. This was primarily the
result of lower-than-budgeted expenditures in Outreach and Sales, Marketing; CalHEERS; unspent
reserve/initiative funding; and salary savings. Similar to fiscal year 2013-14, during fiscal year 2014-15 the
timing of significant expenditures occurred later than originally anticipated, which resulted in a delay of some
expenditures to FY 2015-16.
Expenditure Summary by Major Areas
Service Center – expenditures were lower than budgeted as additional costs associated with third-party
Service Center support for peak enrollment periods were offset by lower-than-expected operating and
contractual expenditures. Service Center representatives handled much higher volumes during the
open-enrollment period and at improved service levels.
CalHEERS – Covered California’s projected expenditures were lower than budgeted, after cost sharing. The
revised cost-allocation plan for CalHEERS expenses was approved and effective October 1, 2014.
Outreach and Sales, Marketing – expenditures for these programs in FY 2014-15 were lower than
budgeted, largely because expenditure payments to Certified Enrollment Entities and Certified Insurance
Agents on behalf of the Department of Health Care Services (DHCS) were lower than budgeted.
Plan Management and Evaluation – Fiscal year 2014-15 expenditures were lower than budgeted, primarily
because of lower-than-expected expenditures on the data aggregation and analytics effort due to timing and
lower expenditures on contractors and other operations costs.
Administration – expenditures were lower than the FY 2014-15 budget because costs associated with the
building and maintenance were offset by lower overall operating expenditures.
Enterprise Shared Costs – expenditures were lower than originally budgeted because of
lower-than-estimated mandatory Statewide Cost Allocation Plan and Statewide distributed administrative
costs, as well as unexpended reserve funding.
CALIFORNIA HEALTH BENEFIT EXCHANGE
(COVERED CALIFORNIA)
Management’s Discussion and Analysis (Unaudited)
June 30, 2015
8 (Continued)
Covered California’s total net position increased by $82.3 million in FY 2014-15. The increase in FY 2014-15
over the prior fiscal year was due to an increase in operating revenues from enrollment fees from health
insurance carriers.
Covered California’s total net investment in capital assets was $245.7 million and $247.2 million at June 30,
2015 and 2014, respectively. The decrease in FY 2014-15 of 0.6% over the FY2013-14 was due to the
revised cost allocation methodology for the share of the cost consistent with longstanding federal policy and
practice and as set forth in Office of Management and Budget (OMB) Circular A-87, in those cases where
Covered California shares functionalities with Medicaid and the Children’s Health Insurance Program (CHIP).
Those programs are required to pay their share to develop and implement the California Healthcare Eligibility,
Enrollment and Retention System (CalHEERS). Previously the cost allocation was 82% Covered California
and 18% DHCS. The new cost allocation was changed to 17.9% Covered California and 82.1% DHCS
effective October 1, 2014. Covered California’s total accumulated depreciation was $35.4 million and
$25.4 million at June 30, 2015 and 2014, respectively. Additional costs will be capitalized and depreciated as
Covered California moves towards final system completion.
Covered California’s assets exceeded liabilities by $390.2 million and $307.9 million at the close of the fiscal
years ended June 30, 2015 and 2014, respectively. In FY 2014-15, total current assets included cash and
cash equivalents of $239.7 million, enrollment fees receivables of $41.8 million due from health insurance
carriers and small businesses, and receivables from other state agencies of $14.3 million for reimbursements
due from the Department of Health Care Services. Capital assets included the capitalized cost required for the
continued implementation of CalHEERS as well as office furniture and equipment and leasehold
improvements. Current liabilities included accounts payable for unpaid goods and services of $59.3 million
and federal grant funds drawn prior to receiving federal guidance regarding establishment and implementation
activities of $22.2 million. Noncurrent liabilities included net pension liability of $53.5 million. In FY 2013-14,
current and other assets included grants receivable of $65.6 million due from the Federal government,
enrollment fees receivables of $65.4 million from health insurance carriers and small businesses, and
receivables from other state agencies of $27.0 million for reimbursements due from the Department of Health
Care Services. Capital assets included the capitalized cost required for the development and implementation
of CalHEERS as well as office furniture and equipment and leasehold improvements. Current liabilities
included accounts payable for unpaid goods and services of $110.4 million.
Economic Outlook
Covered California spent its remaining federal establishment funds by the end of FY 2015-16 and began FY
2016-17, its first fiscal year relying on plan assessment revenues, with a prudent operating reserve.
Consistent with its guiding financial principles, the reserve amount is based on maintaining a level that is
sufficient to assure an adequate balance to address uncertainties and to allow for timing lags needed to adjust
revenue and expenditures. The current Covered California enrollment forecast extends through 2020, and is
based on two years of special enrollment activity, and three rounds of open enrollment, including two annual
renewals. Continued enrollment growth is expected based on the projected growth of the number of
Californians eligible for financial assistance through Covered California driven by underlying demographic
trends and additionally, by the impact of the recently enacted increase to California’s minimum wage that will
increase in stages to $15 per hour in 2020. Thus, the forecast projects modest enrollment and revenue growth
from 2016 through 2018 followed by more robust growth through 2020.
CALIFORNIA HEALTH BENEFIT EXCHANGE
(COVERED CALIFORNIA)
Management’s Discussion and Analysis (Unaudited)
June 30, 2015
9 (Continued)
Various indicators point to the likelihood that Covered California’s initial phase of rapid expansion will give way
to a more stable phase, which leads to a more modest outlook than the previous forecast. Open enrollment for
the 2016 benefit year resulted in enrollment within the range of previous forecasts. Based on the latest
enrollment results reported by all Affordable Care Act marketplaces, the Kaiser Family Foundation estimates
that among the best-performing states, which includes California, 90% of people eligible for subsidies have
selected plans, which leaves little room for potential growth going forward.
Covered California is an important participant in a large and dynamic health insurance marketplace whose
customer base is constantly changing in size, economic situation, as well as in health insurance needs. In
addition to the 1.4 million Californians who have health policies purchased through Covered California,
approximately 18 million receive health coverage through employers, 700,000 purchase individual coverage
outside of Covered California, and more than 12 million are covered by Medi-Cal. Approximately 3 million
remain uninsured, of which less than 1.4 million are eligible for subsidies. Of the latter, from 500,000 to
800,000 may be covered by COBRA, covered indirectly by an employer, or may be in transition between
employer-based coverage, Covered California and Medi-Cal.
According to the analysis performed by PriceWaterhouseCoopers (PwC), the most significant impact to the
exchange eligible population will be the recently enacted minimum wage increase. Boosting income for those
near the subsidy eligibility range will lead to shifts from Medi-Cal to Covered California. Among the various
external drivers considered by the PwC analysis, the impact of a rising minimum wage is expected to be the
most significant driver of additional enrollment through 2020.
The forecast also incorporates a change in the assessment from a flat per-member, per-month (PMPM) rate
to a percentage of gross premiums paid beginning in 2017. A 4% of premium assessment fee will be
assessed on the 1.4 million currently enrolled in Covered California plans. In addition to Covered California
enrollees, there are also approximately 700,000 people in the individual market who benefit from the rates
negotiated by Covered California, even though they are not directly enrolled through Covered California. The
total number of members in the individual market is approximately 2.1 million. The Affordable Care Act
requires the rates for these products (both on and off exchange) to be the same. Since the health plans
offered by Covered California represent approximately 66% of the total enrollment in individual coverage, the
Affordable Care Act assessment essentially requires the health plans to spread the assessment fee across
the entire individual market. To the extent that carriers have members that do not purchase through Covered
California, but who pay the same rate, results in the actual assessment being spread across the entire
individual market for those health plans offered by Covered California. Covered California estimates that the
actual average effective assessment rate for 2017 will be approximately 2.6% across the entire market.
In addition to the enrollment and eligibility insights, PwC also concluded that Covered California incurs
significant costs related to acquisition activities, similar to other organizations with high membership churn
rates. These acquisition expenditures in turn help reduce acquisition costs incurred by participating insurance
carriers.
CALIFORNIA HEALTH BENEFIT EXCHANGE
(COVERED CALIFORNIA)
Management’s Discussion and Analysis (Unaudited)
June 30, 2015
10 (Continued)
Forecasting Potential Enrollment
The 2015 enrollment forecast benefited from the experience and lessons learned in 2014. In contrast, the
2016 forecast reflects the experience of two years of enrollment history as well as insights from
comprehensive market analysis completed by PwC in concert with demographic modeling experts at the
University of California. The forecast combines the two perspectives into a balanced outlook.
The 2015 benefit year and 2016 open enrollment experience indicate that Covered California will likely see
more stable enrollment trends going forward. Open enrollment activity for the 2016 benefit year was more
modest than for 2015 primarily due to a more compressed schedule and a smaller uninsured population likely
to enroll in Covered California. Special enrollment activities provided additional opportunities for individuals to
enroll in 2015 and was stronger than 2014. This was due to a longer special enrollment period and the
temporary additional qualifying event given to individuals who were unaware of the tax implications of
remaining uninsured.
These developments are reflected in the 2016 forecast by shorter open enrollment periods, as currently
anticipated, lower special enrollment gains and slightly higher disenrollment. Thus, the 2016 enrollment
forecast is anchored in the 2014 and 2015 experiences with some modest projections for growth, largely due
to income impacts caused by minimum wage increases. It is critical to note that while “net” enrollment reflects
only moderate growth, this is based on Covered California continuing to do extensive marketing, sales and
retention activities required to newly enroll from 700,000 to 900,000 each year as many enrollees leave
Covered California’s coverage to get employer-sponsored coverage, Medi-Cal, Medicare or other coverage.
At the end of the third open enrollment, Covered California reached enrollment of 1.4 million individuals.
Individual Market Forecast
This projection begins after the third open-enrollment period and takes into account the following:
The pace that new enrollees acquired coverage through Covered California during 2015 special
enrollment.
The rate at which enrolled individuals leave Covered California through termination or by failing to renew
coverage.
The likelihood that an individual who selects a plan will pay their premium.
The seasonal distribution of enrollment activity throughout the benefit year.
The size of the California population eligible for subsidies.
The impact of rising minimum wage on the subsidy eligible population.
Potential medical cost trends reflected in premiums.
For the next several years, open enrollment activities will continue to outpace special enrollment activities and
be the primary driver of enrollment growth. Enrollment growth is projected through 2020.
CALIFORNIA HEALTH BENEFIT EXCHANGE
(COVERED CALIFORNIA)
Management’s Discussion and Analysis (Unaudited)
June 30, 2015
11 (Continued)
Revenue and Change in Health Insurance Premiums
The revenue forecast reflects a shift to a percent of premium assessment in 2017, with a rate of 4%. All
models reflect the same trend assumptions for gross health insurance premiums, which was projected to
increase by 8% in 2017 and 5% each year through 2020. The projected increase in 2017 is driven by the
assumed impact of the sunset of the Transitional Reinsurance Program and the Risk Corridors Program –
temporary federally sponsored high claimant risk mitigation programs. The termination of these programs will
put a one-time upward pressure on health insurance gross premiums. After 2017, premiums are forecast to
increase at 5% each year, driven by annual cost increases (weighted average basis) in Hospital Services
(1%), Professional Medi-Cal Services (2%), and Pharmaceuticals (2%).
Annual individual plan assessments are projected to decrease as a percentage of premiums, as total
premiums increase, in upcoming years. On a budgetary basis, Covered California projects $245.4 million in
individual market revenues will be generated in FY 2015-16; $249 million in 2016-17; $300.9 million in
2017-18; $319 million in 2018-19; and $325.5 million in 2019-20.
Covered California for Small Business Forecast
The enrollment outlook of Covered California for Small Business (CCSB) (previously identified as the Small
Business Health Options Program, or SHOP), builds on the operational improvements and the continuing
migration of the small business market to products that meet requirements of the Affordable Care Act.
Operational improvements include enrollment system functionality now performing at market standard and
improved agent support. Both of which have received positive market response. Additionally, as of January,
2016, the definition of the small business market expanded from one to 50 eligible employees to a new ceiling
of 100. This change requires groups in the 51-100 segment to ensure coverage offered effective
January 2016 or after is ACA compliant. As the beginning of 2016 approached, the 51-100 market saw early
renewal activity in which groups who were due to renew coverage in January 2016 choose instead to renew in
late 2015 to maintain their current plans. This was similar to the migration pattern seen in 2013 as the
January, 2014 compliance for the under 50 segment approached.
While start up challenges in 2014 hampered initial sales and retention, service improvements are beginning to
be reflected in expanded enrollment in CCSB. Broker engagement, which is the channel responsible for the
vast majority of small business enrollment across the market, is growing.
Overall, CCSB enrollment is expected to rise through 2020 due to the positive impact of the following factors:
The market is recognizing the value of exchange products. This includes parity in market pricing,
employers offering employees an array of choice, employer ability to budget premium contributions, and
single billing administration. This is leading to exchanges being more attractive to the market than seen in
years past.
Expected improvements to the CCSB offering portfolio both in terms of carriers and plans offered.
CCSB offers tax credits for up to 50% of eligible employer’s contribution to health coverage for two
consecutive taxable years.
The continuing migration of employers in the 51-100 market to Affordable Care Act compliant plans.
CALIFORNIA HEALTH BENEFIT EXCHANGE
(COVERED CALIFORNIA)
Management’s Discussion and Analysis (Unaudited)
June 30, 2015
12
Covered California having addressed a majority of the initial launch challenges and developing additional
operational capabilities to further improve both the employer and agent experience.
Starting in 2017, the CCSB assessment is calculated as a percent of gross medical premium. The rate for
2017 is 5.2% of premiums which is equivalent to the $18.60 per member per month fee currently assessed.
This assessment does not include the additional amount which is collected and paid to agents for their
commission-based enrollment activities.
Covered California Revenue Summary
Revenues which include both the individual and Covered California for Small Business markets, are
calculated on a cash basis that more accurately reflect the actual timing of the collection of revenue.
The forecast for the individual market includes plan assessments budgeted at a level of 4% of premium for
2017 and 2018, and budgeted at 3.75% in 2019 and 3.5% in 2020. Covered California for Small Business
plan assessments are budgeted at a level of 5.2% of premium for the duration of the forecast. The forecast
does include revenue from family dental coverage, which is assessed at the same rates as the medical
coverage offered on the individual and CCSB markets. To the extent enrollment varies from the medium
forecast, Covered California would be able to adjust its revenue by increasing or decreasing the plan
assessment, or by adjusting its budgeted expenditures. Adjustments in the plan assessment are estimated to
take approximately nine to 18 months to have an impact on plan assessment revenue.
Based upon the multi-year forecast, Covered California does not expect the fiscal year end reserve level to be
less than seven months at any time throughout the outlook. The reserve level is based on the revenue
forecast rather than the total net position as the net position includes noncurrent liabilities such as pension
liabilities for State employees, which are an obligation of the State rather than Covered California. It is
important to note that each year a new multi-year forecast will be completed based on the most current
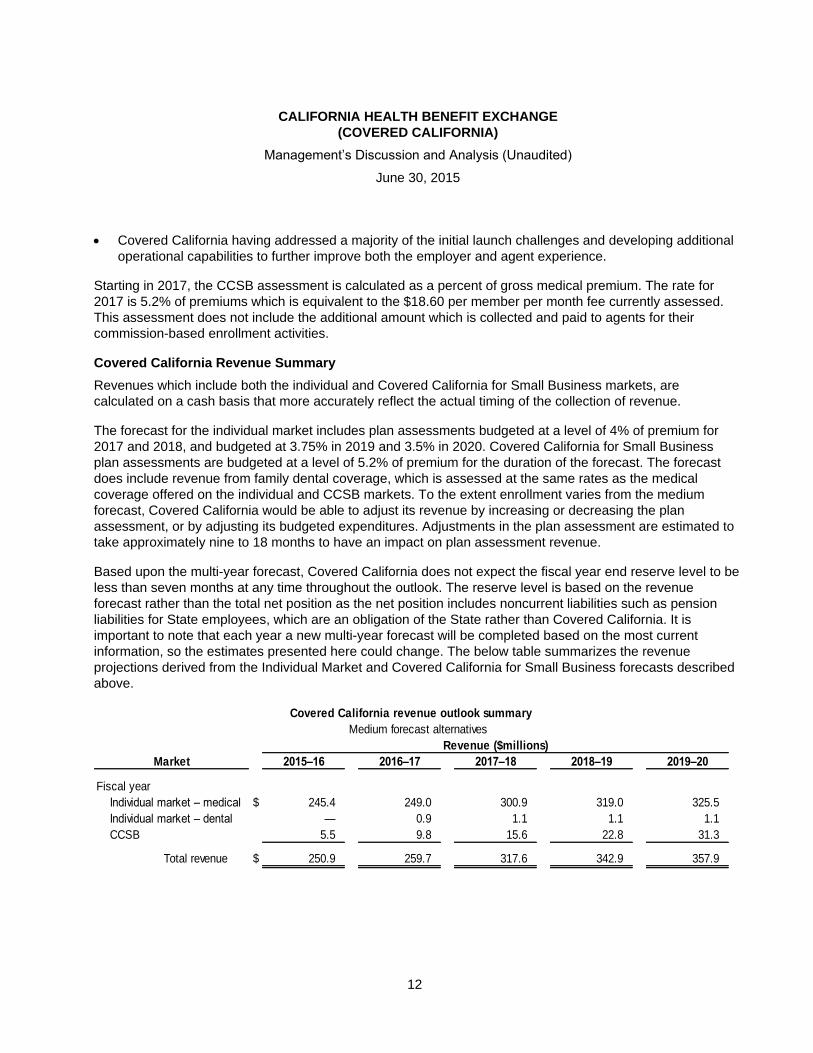
information, so the estimates presented here could change. The below table summarizes the revenue
projections derived from the Individual Market and Covered California for Small Business forecasts described
above.
Covered California revenue outlook summary
Medium forecast alternatives
Revenue ($millions)
Market 2015–16 2016–17 2017–18 2018–19 2019–20
Fiscal year
Individual market – medical $ 245.4 249.0 300.9 319.0 325.5
Individual market – dental — 0.9 1.1 1.1 1.1
CCSB 5.5 9.8 15.6 22.8 31.3
Total revenue $ 250.9 259.7 317.6 342.9 357.9
CALIFORNIA HEALTH BENEFIT EXCHANGE(COVERED CALIFORNIA)
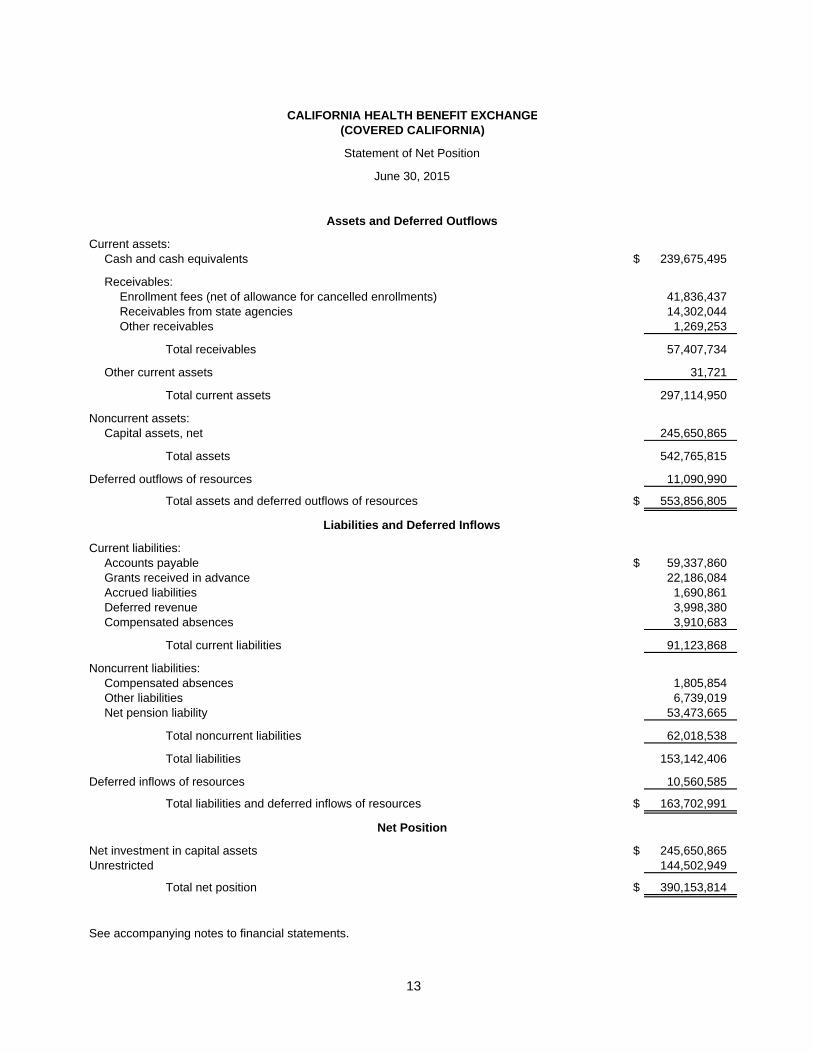
Statement of Net Position
June 30, 2015
Assets and Deferred Outflows
Current assets:Cash and cash equivalents $ 239,675,495
Receivables:Enrollment fees (net of allowance for cancelled enrollments) 41,836,437 Receivables from state agencies 14,302,044 Other receivables 1,269,253
Total receivables 57,407,734
Other current assets 31,721
Total current assets 297,114,950
Noncurrent assets:Capital assets, net 245,650,865
Total assets 542,765,815
Deferred outflows of resources 11,090,990
Total assets and deferred outflows of resources $ 553,856,805
Liabilities and Deferred Inflows
Current liabilities:Accounts payable $ 59,337,860 Grants received in advance 22,186,084 Accrued liabilities 1,690,861 Deferred revenue 3,998,380 Compensated absences 3,910,683
Total current liabilities 91,123,868
Noncurrent liabilities:Compensated absences 1,805,854 Other liabilities 6,739,019 Net pension liability 53,473,665
Total noncurrent liabilities 62,018,538
Total liabilities 153,142,406
Deferred inflows of resources 10,560,585
Total liabilities and deferred inflows of resources $ 163,702,991
Net Position
Net investment in capital assets $ 245,650,865 Unrestricted 144,502,949
Total net position $ 390,153,814
See accompanying notes to financial statements.
13
CALIFORNIA HEALTH BENEFIT EXCHANGE(COVERED CALIFORNIA)
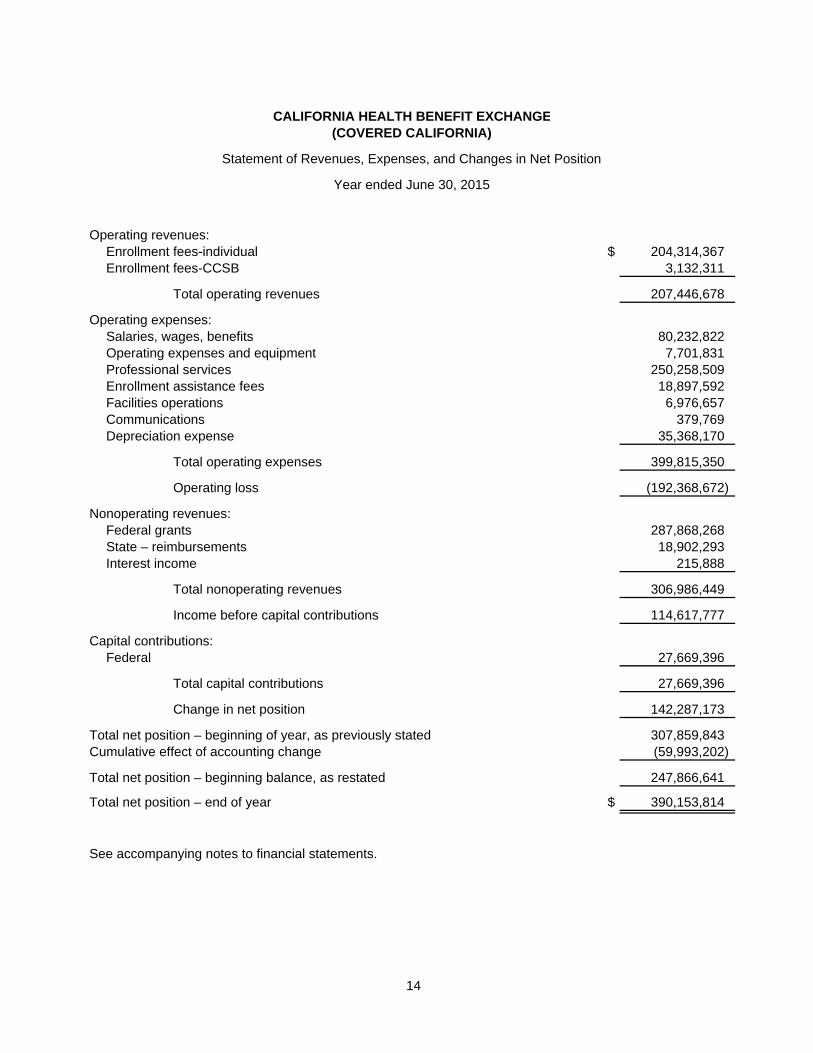
Statement of Revenues, Expenses, and Changes in Net Position
Year ended June 30, 2015
Operating revenues:Enrollment fees-individual $ 204,314,367 Enrollment fees-CCSB 3,132,311
Total operating revenues 207,446,678
Operating expenses:Salaries, wages, benefits 80,232,822 Operating expenses and equipment 7,701,831 Professional services 250,258,509 Enrollment assistance fees 18,897,592 Facilities operations 6,976,657 Communications 379,769 Depreciation expense 35,368,170
Total operating expenses 399,815,350
Operating loss (192,368,672)
Nonoperating revenues:Federal grants 287,868,268 State – reimbursements 18,902,293 Interest income 215,888
Total nonoperating revenues 306,986,449
Income before capital contributions 114,617,777
Capital contributions:Federal 27,669,396
Total capital contributions 27,669,396
Change in net position 142,287,173
Total net position – beginning of year, as previously stated 307,859,843 Cumulative effect of accounting change (59,993,202)
Total net position – beginning balance, as restated 247,866,641
Total net position – end of year $ 390,153,814
See accompanying notes to financial statements.
14
CALIFORNIA HEALTH BENEFIT EXCHANGE(COVERED CALIFORNIA)
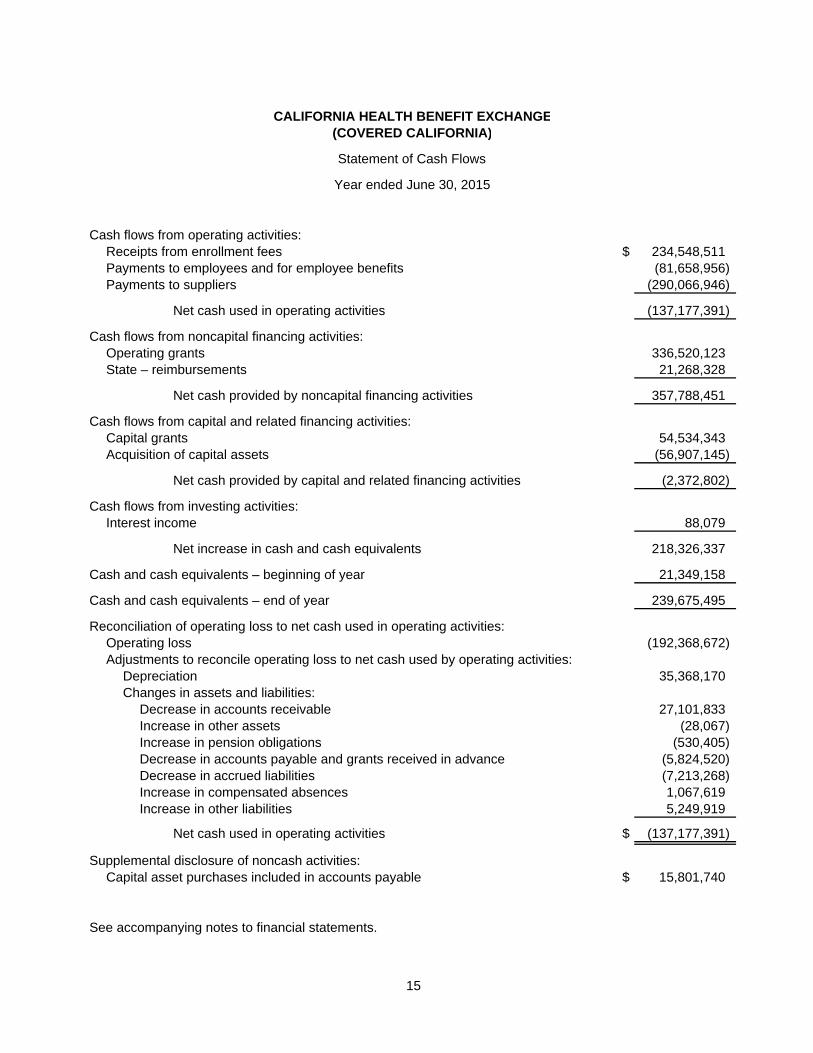
Statement of Cash Flows
Year ended June 30, 2015
Cash flows from operating activities:Receipts from enrollment fees $ 234,548,511 Payments to employees and for employee benefits (81,658,956) Payments to suppliers (290,066,946)
Net cash used in operating activities (137,177,391)
Cash flows from noncapital financing activities:Operating grants 336,520,123 State – reimbursements 21,268,328
Net cash provided by noncapital financing activities 357,788,451
Cash flows from capital and related financing activities:Capital grants 54,534,343 Acquisition of capital assets (56,907,145)
Net cash provided by capital and related financing activities (2,372,802)
Cash flows from investing activities:Interest income 88,079
Net increase in cash and cash equivalents 218,326,337
Cash and cash equivalents – beginning of year 21,349,158
Cash and cash equivalents – end of year 239,675,495
Reconciliation of operating loss to net cash used in operating activities:Operating loss (192,368,672) Adjustments to reconcile operating loss to net cash used by operating activities:
Depreciation 35,368,170 Changes in assets and liabilities:
Decrease in accounts receivable 27,101,833 Increase in other assets (28,067) Increase in pension obligations (530,405) Decrease in accounts payable and grants received in advance (5,824,520) Decrease in accrued liabilities (7,213,268) Increase in compensated absences 1,067,619 Increase in other liabilities 5,249,919
Net cash used in operating activities $ (137,177,391)
Supplemental disclosure of noncash activities:Capital asset purchases included in accounts payable $ 15,801,740
See accompanying notes to financial statements.
15
CALIFORNIA HEALTH BENEFIT EXCHANGE
(COVERED CALIFORNIA)
Notes to Financial Statements
June 30, 2015
16 (Continued)
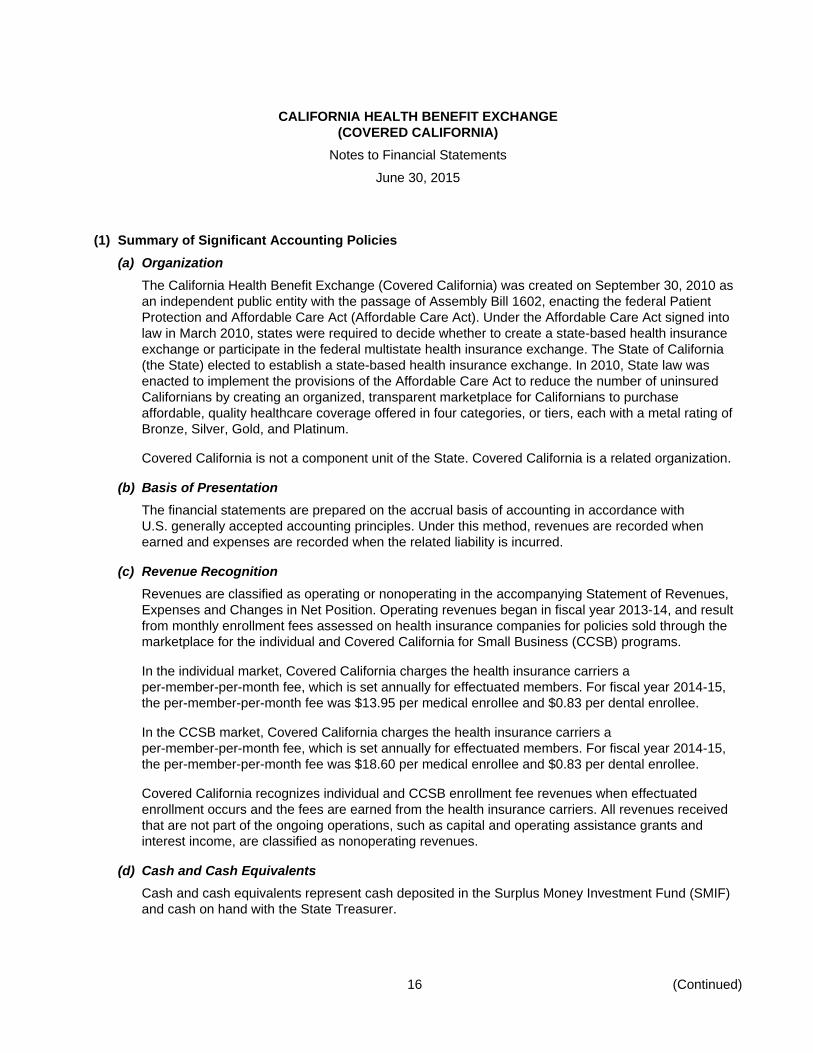
(1) Summary of Significant Accounting Policies
(a) Organization
The California Health Benefit Exchange (Covered California) was created on September 30, 2010 as
an independent public entity with the passage of Assembly Bill 1602, enacting the federal Patient
Protection and Affordable Care Act (Affordable Care Act). Under the Affordable Care Act signed into
law in March 2010, states were required to decide whether to create a state-based health insurance
exchange or participate in the federal multistate health insurance exchange. The State of California
(the State) elected to establish a state-based health insurance exchange. In 2010, State law was
enacted to implement the provisions of the Affordable Care Act to reduce the number of uninsured
Californians by creating an organized, transparent marketplace for Californians to purchase
affordable, quality healthcare coverage offered in four categories, or tiers, each with a metal rating of
Bronze, Silver, Gold, and Platinum.
Covered California is not a component unit of the State. Covered California is a related organization.
(b) Basis of Presentation
The financial statements are prepared on the accrual basis of accounting in accordance with
U.S. generally accepted accounting principles. Under this method, revenues are recorded when
earned and expenses are recorded when the related liability is incurred.
(c) Revenue Recognition
Revenues are classified as operating or nonoperating in the accompanying Statement of Revenues,
Expenses and Changes in Net Position. Operating revenues began in fiscal year 2013-14, and result
from monthly enrollment fees assessed on health insurance companies for policies sold through the
marketplace for the individual and Covered California for Small Business (CCSB) programs.
In the individual market, Covered California charges the health insurance carriers a
per-member-per-month fee, which is set annually for effectuated members. For fiscal year 2014-15,
the per-member-per-month fee was $13.95 per medical enrollee and $0.83 per dental enrollee.
In the CCSB market, Covered California charges the health insurance carriers a
per-member-per-month fee, which is set annually for effectuated members. For fiscal year 2014-15,
the per-member-per-month fee was $18.60 per medical enrollee and $0.83 per dental enrollee.
Covered California recognizes individual and CCSB enrollment fee revenues when effectuated
enrollment occurs and the fees are earned from the health insurance carriers. All revenues received
that are not part of the ongoing operations, such as capital and operating assistance grants and
interest income, are classified as nonoperating revenues.
(d) Cash and Cash Equivalents
Cash and cash equivalents represent cash deposited in the Surplus Money Investment Fund (SMIF)
and cash on hand with the State Treasurer.
CALIFORNIA HEALTH BENEFIT EXCHANGE
(COVERED CALIFORNIA)
Notes to Financial Statements
June 30, 2015
17 (Continued)
(e) Receivables
Receivables represent amounts owed by the California Department of Health Care Services (DHCS)
for its share of the costs related to California Healthcare Eligibility, Enrollment, and Retention System
(CalHEERs) of $14.3 million as of June 30, 2015. Receivables also include amounts due from health
insurance carriers and small businesses for enrollment fees in the amount of $41.8 million, which is
net of cancelled enrollments of approximately $2.8 million, amounts due from employees of $194,756,
and amounts due from the Surplus Money Investment Fund (SMIF) of $132,724.
(f) Capital Assets
Capital assets are defined as assets which have a unit cost of $5,000 or greater and a useful life of
more than one year. Capital assets are stated at cost. Depreciation on equipment is calculated using
the straight-line method over the estimated useful life ranging from 2 to 20 years. Depreciation on
internally generated software and purchased software is calculated using the straight-line method
over the estimated useful life of 10 and 5 years, respectively. When assets are retired or otherwise
disposed of, the costs and related accumulated depreciation are removed from the accounts, and any
resulting gain or loss is recognized in the period of disposal. Amortization of leasehold improvements
is computed using the straight-line method over the shorter of the lease term or the useful life.
In accordance with Governmental Accounting Standards Board (GASB) Statement No. 51,
Accounting and Reporting for Intangible Assets, Covered California has recorded internally generated
computer software that is in the development stage; however, the system went live on October 1,
2013. Intangible assets are considered internally generated if they are created or produced by the
department or an entity contracted by the department, or if they are acquired from a third party but
require more than minimal incremental effort on the part of the department to begin to achieve their
expected level of service capacity. The preliminary project stage was completed in June 2012.
Application development costs incurred from July 2014 through June 30, 2015 were $30 million.
Depreciation of the assets began on October 1, 2013, and totaled $35.4 million for fiscal year
2014-15.
(g) Accounts Payable and Grants Received in Advance
Accounts payable represents amounts owed by Covered California to third parties. Grants received in
advance is reported net of grants receivable and includes federal grant funds drawn prior to receiving
Frequently Asked Questions guidance issued by the Centers for Medicare & Medicaid Services
(CMS) in June 2015 and other advance payments received.
(h) Compensated Absences Payable
Vacation balances are accrued as a liability as earned.
(i) Enrollment Assistance Fees
Covered California entered into a contract with DHCS whereby DHCS compensates certified
enrollment entities and agents for successful consumer enrollment and effectuation in Medi-Cal. The
compensation is either $58 or $29 depending on enrollment factors. Covered California pays these
fees on behalf of DHCS. The funds to pay these fees are collected in advance from DHCS.
CALIFORNIA HEALTH BENEFIT EXCHANGE
(COVERED CALIFORNIA)
Notes to Financial Statements
June 30, 2015
18 (Continued)
(j) Use of Estimates
The preparation of financial statements in conformity with U.S. generally accepted accounting
principles requires management to make estimates and assumptions that affect the reported amounts
of assets and liabilities and disclosure of contingent assets and liabilities at the date of the financial
statements and reported amounts of revenues and expenses during the reporting period. Actual
results could differ from those estimates.
(k) Pensions
During the year ended June 30, 2015, Covered California adopted GASB Statement No. 68,
Accounting and Financial Reporting for Pensions and GASB Statement No. 71, Pension Transition for
Contributions Made Subsequent to the Measurement Date. GASB Statement No. 68 revises existing
standards for measuring and reporting pension liabilities. This statement requires recognition of a
liability equal to the net pension liability, which is measured as the total pension liability, less the
amount of the pension plan’s fiduciary net position. The total pension liability is determined based
upon discounting projected benefit payments based on the benefit terms and legal agreements
existing at the pension plan’s fiscal year end. Projected benefit payments are required to be
discounted using a single rate that reflects the expected rate of return on investments, to the extent
that plan assets are available to pay benefits. This Statement requires that most changes in the net
pension liability be included in pension expense in the period of the change. Due to the adoption of
GASB 68, Covered California reduced its beginning net position, as shown on the statement of
revenues, expenses, and changes in net position, by $60.0 million.
For purpose of measuring the net pension liability, deferred outflows and inflows of resources related
to pensions, and pension expense, information contained within Covered California has been
determined on the same basis as they are reported by the California Public Employees’ Retirement
System (CalPERS) Financial Office.
(l) Deferred Outflows of Resources and Deferred Inflows of Resources
Changes in net pension liability not included in pension expense are reported as deferred outflows of
resources or deferred inflows of resources. Employer contributions subsequent to the measurement
date of the net pension liability are reported as deferred outflows of resources. The unamortized net
difference between projected and actual earnings on investments are recorded as deferred inflows of
resources.
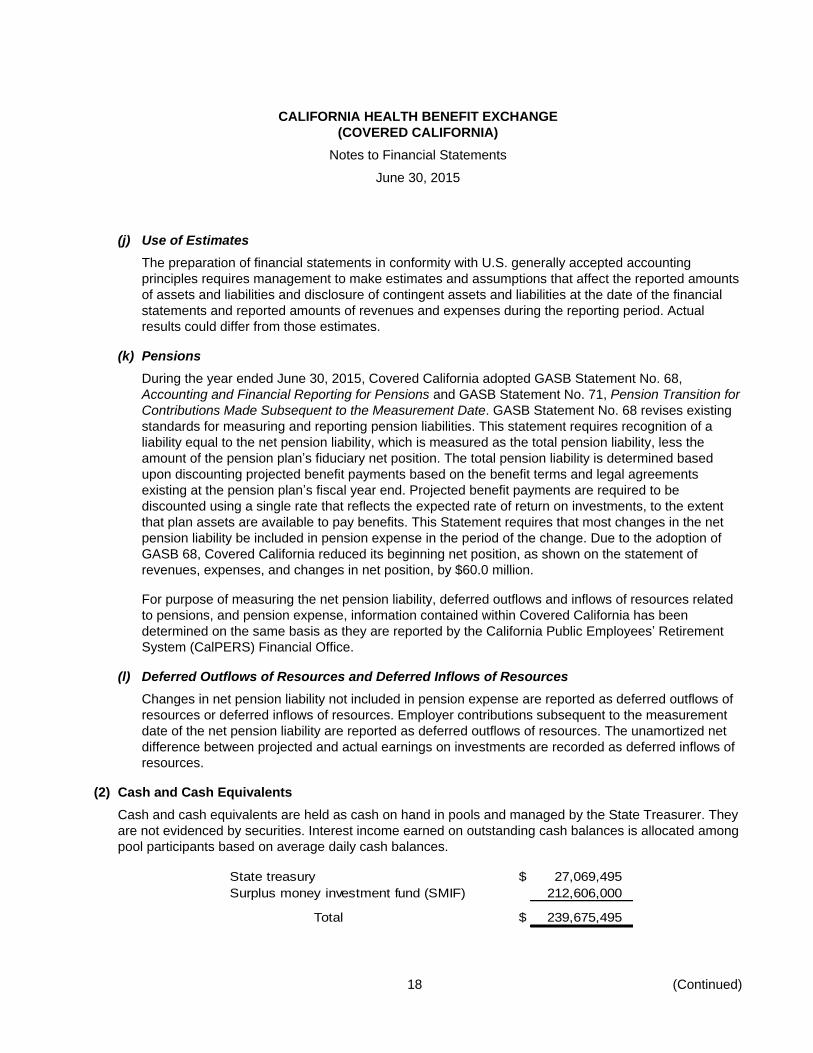
(2) Cash and Cash Equivalents
Cash and cash equivalents are held as cash on hand in pools and managed by the State Treasurer. They
are not evidenced by securities. Interest income earned on outstanding cash balances is allocated among
pool participants based on average daily cash balances.
State treasury $ 27,069,495
Surplus money investment fund (SMIF) 212,606,000
Total $ 239,675,495

CALIFORNIA HEALTH BENEFIT EXCHANGE
(COVERED CALIFORNIA)
Notes to Financial Statements
June 30, 2015
19 (Continued)
As of June 30, 2015, the carrying value of deposits in the SMIF represents the fair value. The SMIF
consists of the available cash of all special funds of the State which do not have investment authority of
their own. Cash balances in excess of needs in any of these participating funds are invested by the State
Treasurer. The Pooled Money Investment Board (PMIB) provides regulatory oversight over the State
Treasurer’s pooled investment program and is responsible for determining whether any cash balances of
the participating funds are in excess of current needs and available for investment, or whether it is
necessary to liquidate previous investments to meet current requirements. The PMIB is composed of the
State Treasurer, as chairman; the State Controller; and the Director of Finance for the State.
All of the resources of the SMIF are invested through the Pooled Money Investment Account (PMIA). By
law, PMIA monies can be invested only in the following categories: U.S. Government securities; securities
of federally sponsored agencies; domestic corporate bonds; interest-bearing time deposits in California
banks, savings and loan associations, and credit unions; prime-rated commercial paper; repurchase and
reverse repurchase agreements; security loans; banker’s acceptances; negotiable certificates of deposits;
and loans to various bond funds.
At June 30, 2015, the allocation of the deposits held by Covered California in the SMIF was estimated as
follows:
Covered
California’s
share of SMIF
U.S. Treasury securities $ 100,909,867
Federal agency debt 27,392,542
Supranational debentures 1,375,024
Bank notes 2,138,079
Certificates of deposit 44,746,993
Commercial paper 18,085,191
Time deposits 16,608,418
AB 55 and General Fund Loans 1,349,886
Total $ 212,606,000
The value of the deposits in the State Treasurer’s pooled investment program, including the SMIF, is
equal to the dollars deposited in the program. The fair value of the position in the program may be greater
or less than the value of the deposits, with the difference representing the unrealized gain or loss. As of
June 30, 2015, this difference was immaterial to the valuation of the deposits held by Covered California
in the SMIF.
Covered California’s share in the interest earnings of the PMIA is based on its ratio of dollar-day
contributions to the total dollar-day investments of the PMIA. The overall return on investment for the
PMIA was 0.27% for the year ended June 30, 2015.
CALIFORNIA HEALTH BENEFIT EXCHANGE
(COVERED CALIFORNIA)
Notes to Financial Statements
June 30, 2015
20 (Continued)
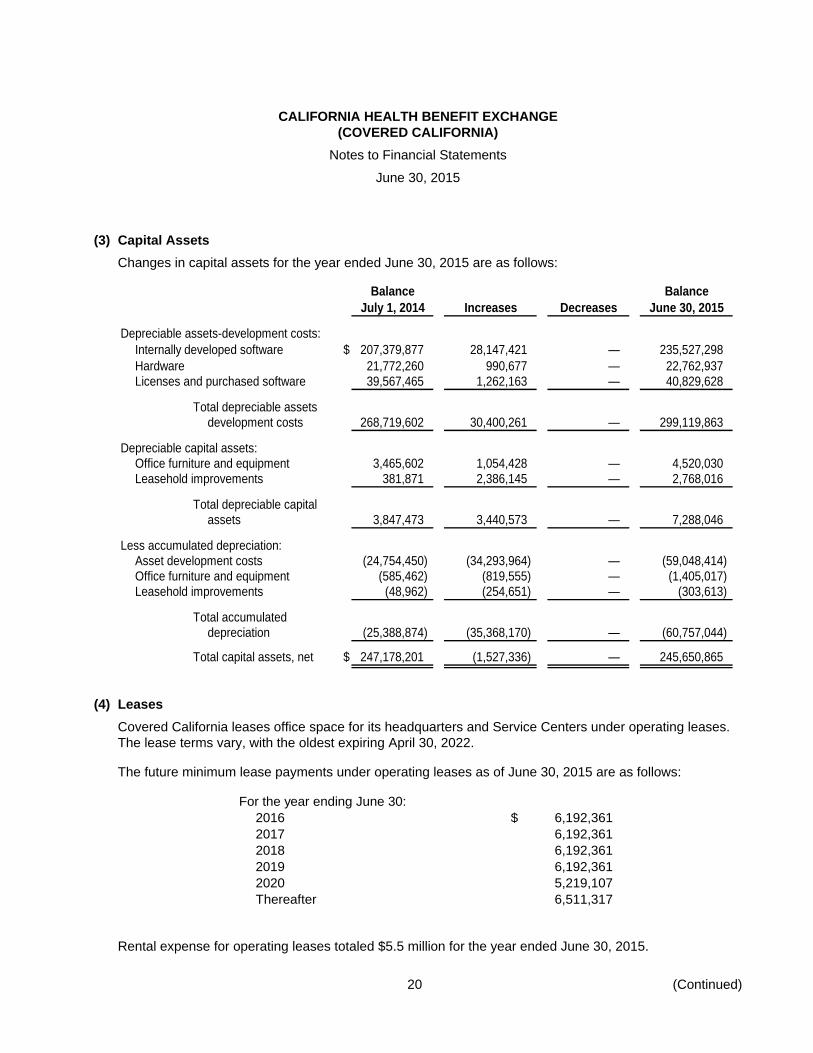
(3) Capital Assets
Changes in capital assets for the year ended June 30, 2015 are as follows:
Balance Balance
July 1, 2014 Increases Decreases June 30, 2015
Depreciable assets-development costs:
Internally developed software $ 207,379,877 28,147,421 — 235,527,298
Hardware 21,772,260 990,677 — 22,762,937 Licenses and purchased software 39,567,465 1,262,163 — 40,829,628
Total depreciable assetsdevelopment costs 268,719,602 30,400,261 — 299,119,863
Depreciable capital assets:Office furniture and equipment 3,465,602 1,054,428 — 4,520,030 Leasehold improvements 381,871 2,386,145 — 2,768,016
Total depreciable capitalassets 3,847,473 3,440,573 — 7,288,046
Less accumulated depreciation:Asset development costs (24,754,450) (34,293,964) — (59,048,414) Office furniture and equipment (585,462) (819,555) — (1,405,017) Leasehold improvements (48,962) (254,651) — (303,613)
Total accumulateddepreciation (25,388,874) (35,368,170) — (60,757,044)
Total capital assets, net $ 247,178,201 (1,527,336) — 245,650,865
(4) Leases
Covered California leases office space for its headquarters and Service Centers under operating leases.
The lease terms vary, with the oldest expiring April 30, 2022.
The future minimum lease payments under operating leases as of June 30, 2015 are as follows:
For the year ending June 30:
2016 $ 6,192,361
2017 6,192,361
2018 6,192,361
2019 6,192,361
2020 5,219,107
Thereafter 6,511,317
Rental expense for operating leases totaled $5.5 million for the year ended June 30, 2015.
CALIFORNIA HEALTH BENEFIT EXCHANGE
(COVERED CALIFORNIA)
Notes to Financial Statements
June 30, 2015
21 (Continued)
(5) Retirement Planning and Other Postemployment Benefits
Retirement Plan
As discussed in note (1), Covered California adopted GASB 68 during the 2014-15 fiscal year. GASB 68
requires that the reported results pertain to liability and asset information within certain defined
timeframes. For this report, the following timeframes are used:
Valuation date (VD) June 30, 2013
Measurement date (MD) June 30, 2014
Measurement period (MP) July 1, 2013 to June 30, 2014
At the time provisions of GASB 68 were adopted, Covered California was not able to determine the
amounts of all deferred outflows and inflows of resources related to pensions, so it was not practical to
restate the prior period financial statements.
Plan Description, Benefits Provided, and Employees Covered
Covered California contributes to the Public Employees’ Retirement Fund administered by the California
Public Employees’ Retirement System (CalPERS), an agent multiple-employer public employee defined
benefit pension plan. Covered California has employees who are enrolled in the State Miscellaneous Plan
(First Tier and Second Tier). CalPERS provides retirement benefits to plan members and beneficiaries.
CalPERS acts as a common investment and administrative agent for participating public entities within the
State and uses the accrual basis of accounting. Benefit provisions and all other requirements are
established by state statute.
CalPERS issues a separate comprehensive annual financial report that includes financial statements and
required supplementary information. CalPERS’ annual financial report may be obtained by writing to the
California Public Employees’ Retirement System, Fiscal Services Division, P.O. Box 942703, Sacramento,
California 94229 or by visiting the CalPERS Web site at www.CalPERS.ca.gov.
Generally, full-time employees are eligible to participate as members of CalPERS and are eligible to retire
at age 50 with at least five years of service or age 55 with at least ten years of service, depending on the
plan selected by the employee. However, the Public Employees’ Pension Reform Act, or PERA, was
passed in 2012 and went into effect on January 1, 2013. This new law changed the terms of the pension
plan for state workers first hired after January 1, 2013. Annual retirement benefits are determined based
on age at retirement, the length of membership service, and the amount of earnings based on the highest
or last 12 or 36 consecutive months’ average compensation. Healthcare and dental benefits may be
provided to members depending on the date hired and the years of credited service of a member. If
members are not fully vested, the healthcare and dental contributions will be prorated based on the years
of service.
Contributions
Section 20814 (c) of the California Public Employees’ Retirement Law (PERL) requires that the employer
contribution rates for all public employees are determined on an annual basis by the actuary and shall be
effective on the July 1 following notice of a change in the rate. The total plan contributions are determined
CALIFORNIA HEALTH BENEFIT EXCHANGE
(COVERED CALIFORNIA)
Notes to Financial Statements
June 30, 2015
22 (Continued)
through the CalPERS’ annual actuarial valuation process. The actuarially determined rate is the estimated
amount necessary to finance the costs of benefits earned by employees during the year, with an
additional amount to finance any unfunded accrued liability. The employer is required to contribute the
difference between the actuarially determined rate and the contribution rate of employees. For the
Miscellaneous Plan measurement period ended June 30, 2014, the average active employee contribution
rate is 6.525% of annual pay, and the employer’s contribution rate is 21.137% of annual payroll. These
rates reflect PERL Section 20683.2, which mandates that certain employees contribute more as of July 1,
2013. Furthermore, any reduction in employer contributions due to the increase in the employee
contributions must be paid by the employer towards the unfunded liability. It is the responsibility of the
employer to make necessary accounting adjustments to reflect the impact due to any employer-paid
member contributions or situations where members are paying a portion of the employer contribution.
Discount Rate
In preparation for implementing GASB 68, CalPERS prepared the GASB 68 Accounting Valuation Reports
(AVRs) for the State of California for the eight plans (including the State Miscellaneous Plan) in which the
State participates. CalPERS utilized a discount rate of 7.65%, which includes the plans’ administrative
expenses.
Pension Liabilities, Pension Expense, and Deferred Outflows and Deferred Inflows of Resources
Related to Pensions
The State Controller’s Office (SCO) used a calculated percentage based on Covered California’s share of
the pensionable compensation to the State’s total pensionable compensation amounts for the State
Miscellaneous Plan, to provide Covered California’s net pension liability and related GASB 68 accounting
elements. Covered California’s calculated percentage was 0.224583% for the State Miscellaneous Plan.
Using this percentage, Covered California’s net pension liability for the State Miscellaneous Plan was
$64.8 million at the beginning of the measurement period (MP) and $53.5 million at the end of the MP.
As of the start of the measurement period, July 1, 2013, the net pension liability was $64,836,493.
For the measurement period ending June 30, 2014 (the measurement date), Covered California Fund
incurred a pension expense of $4,041,048.
As of June 30, 2014, Covered California Fund had deferred outflows of resources of $11,090,990 and
deferred inflows of resources of $10,560,585.
CALIFORNIA HEALTH BENEFIT EXCHANGE
(COVERED CALIFORNIA)
Notes to Financial Statements
June 30, 2015
23 (Continued)
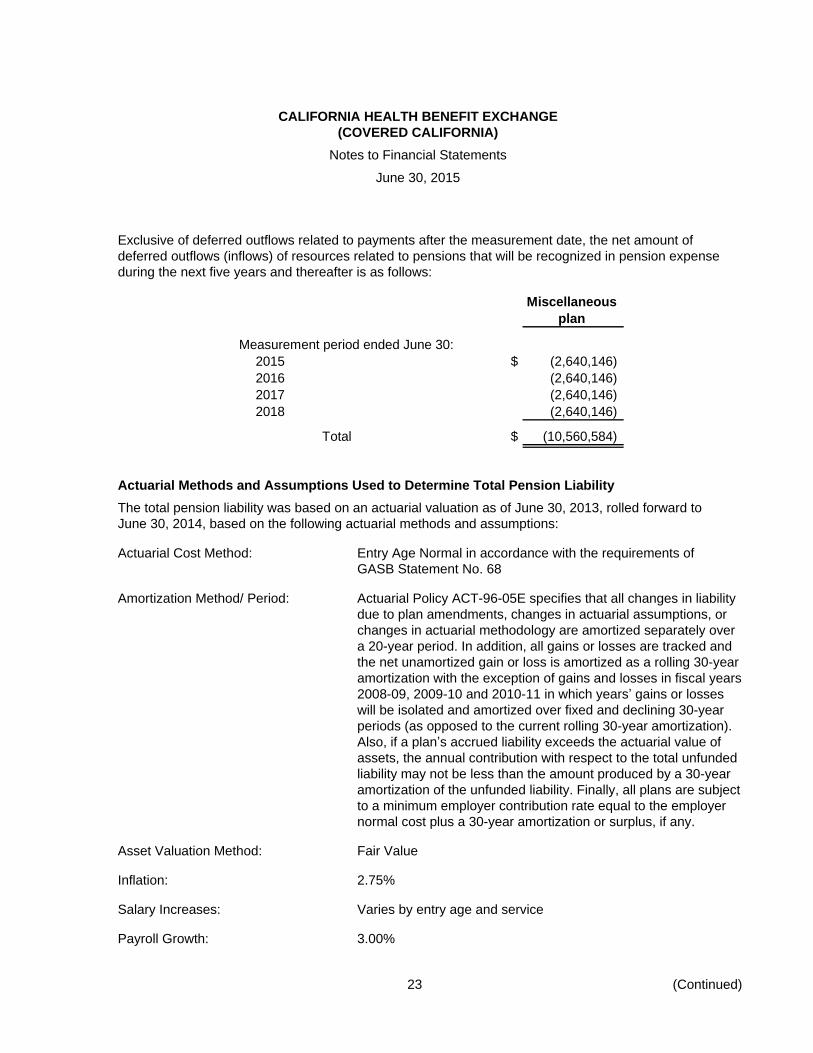
Exclusive of deferred outflows related to payments after the measurement date, the net amount of
deferred outflows (inflows) of resources related to pensions that will be recognized in pension expense
during the next five years and thereafter is as follows:
Miscellaneous
plan
Measurement period ended June 30:
2015 $ (2,640,146)
2016 (2,640,146)
2017 (2,640,146)
2018 (2,640,146)
Total $ (10,560,584)
Actuarial Methods and Assumptions Used to Determine Total Pension Liability
The total pension liability was based on an actuarial valuation as of June 30, 2013, rolled forward to
June 30, 2014, based on the following actuarial methods and assumptions:
Actuarial Cost Method: Entry Age Normal in accordance with the requirements of
GASB Statement No. 68
Amortization Method/ Period: Actuarial Policy ACT-96-05E specifies that all changes in liability
due to plan amendments, changes in actuarial assumptions, or
changes in actuarial methodology are amortized separately over
a 20-year period. In addition, all gains or losses are tracked and
the net unamortized gain or loss is amortized as a rolling 30-year
amortization with the exception of gains and losses in fiscal years
2008-09, 2009-10 and 2010-11 in which years’ gains or losses
will be isolated and amortized over fixed and declining 30-year
periods (as opposed to the current rolling 30-year amortization).
Also, if a plan’s accrued liability exceeds the actuarial value of
assets, the annual contribution with respect to the total unfunded
liability may not be less than the amount produced by a 30-year
amortization of the unfunded liability. Finally, all plans are subject
to a minimum employer contribution rate equal to the employer
normal cost plus a 30-year amortization or surplus, if any.
Asset Valuation Method: Fair Value
Inflation: 2.75%
Salary Increases: Varies by entry age and service
Payroll Growth: 3.00%
CALIFORNIA HEALTH BENEFIT EXCHANGE
(COVERED CALIFORNIA)
Notes to Financial Statements
June 30, 2015
24 (Continued)
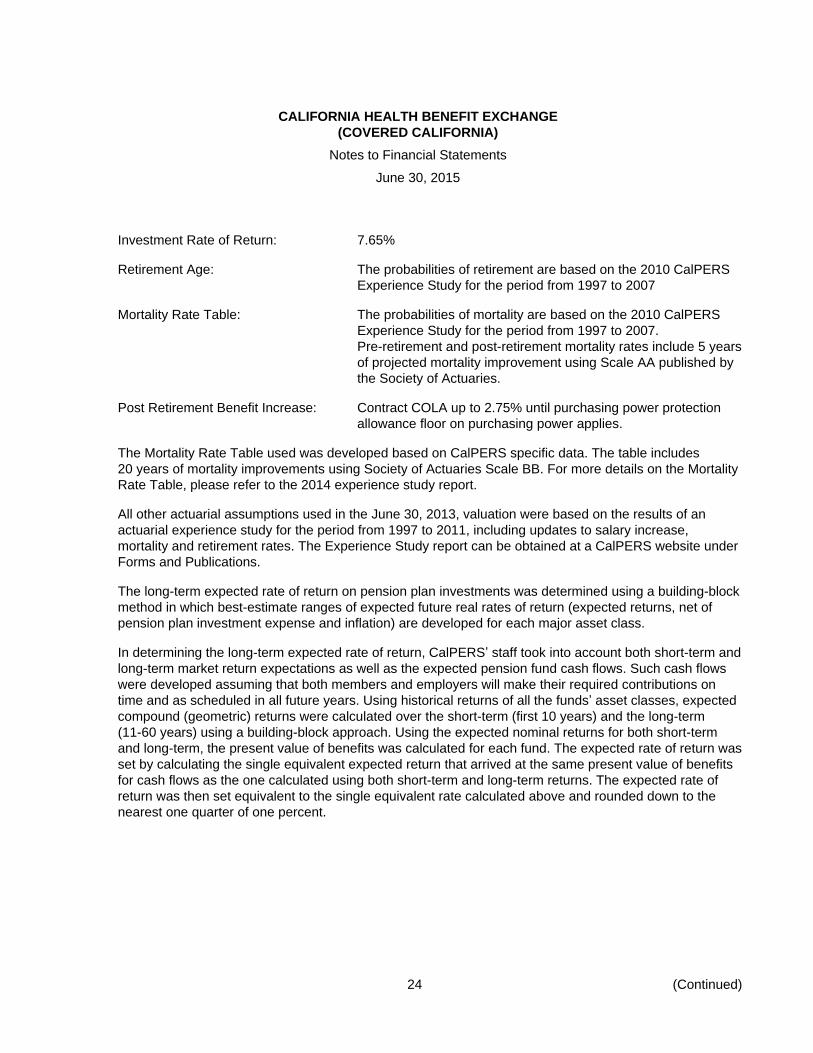
Investment Rate of Return: 7.65%
Retirement Age: The probabilities of retirement are based on the 2010 CalPERS
Experience Study for the period from 1997 to 2007
Mortality Rate Table: The probabilities of mortality are based on the 2010 CalPERS
Experience Study for the period from 1997 to 2007.
Pre-retirement and post-retirement mortality rates include 5 years
of projected mortality improvement using Scale AA published by
the Society of Actuaries.
Post Retirement Benefit Increase: Contract COLA up to 2.75% until purchasing power protection
allowance floor on purchasing power applies.
The Mortality Rate Table used was developed based on CalPERS specific data. The table includes
20 years of mortality improvements using Society of Actuaries Scale BB. For more details on the Mortality
Rate Table, please refer to the 2014 experience study report.
All other actuarial assumptions used in the June 30, 2013, valuation were based on the results of an
actuarial experience study for the period from 1997 to 2011, including updates to salary increase,
mortality and retirement rates. The Experience Study report can be obtained at a CalPERS website under
Forms and Publications.
The long-term expected rate of return on pension plan investments was determined using a building-block
method in which best-estimate ranges of expected future real rates of return (expected returns, net of
pension plan investment expense and inflation) are developed for each major asset class.
In determining the long-term expected rate of return, CalPERS’ staff took into account both short-term and
long-term market return expectations as well as the expected pension fund cash flows. Such cash flows
were developed assuming that both members and employers will make their required contributions on
time and as scheduled in all future years. Using historical returns of all the funds’ asset classes, expected
compound (geometric) returns were calculated over the short-term (first 10 years) and the long-term
(11-60 years) using a building-block approach. Using the expected nominal returns for both short-term
and long-term, the present value of benefits was calculated for each fund. The expected rate of return was
set by calculating the single equivalent expected return that arrived at the same present value of benefits
for cash flows as the one calculated using both short-term and long-term returns. The expected rate of
return was then set equivalent to the single equivalent rate calculated above and rounded down to the
nearest one quarter of one percent.
CALIFORNIA HEALTH BENEFIT EXCHANGE
(COVERED CALIFORNIA)
Notes to Financial Statements
June 30, 2015
25 (Continued)
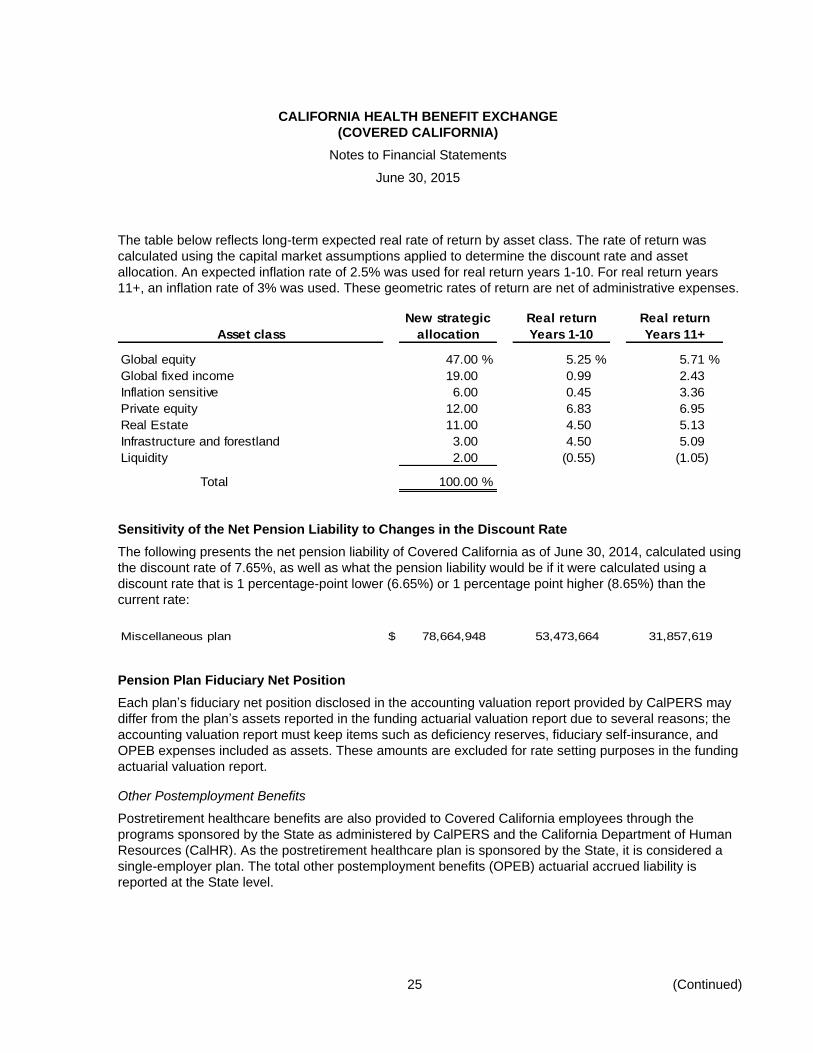
The table below reflects long-term expected real rate of return by asset class. The rate of return was
calculated using the capital market assumptions applied to determine the discount rate and asset
allocation. An expected inflation rate of 2.5% was used for real return years 1-10. For real return years
11+, an inflation rate of 3% was used. These geometric rates of return are net of administrative expenses.
New strategic Real return Real return
Asset class allocation Years 1-10 Years 11+
Global equity 47.00 % 5.25 % 5.71 %
Global fixed income 19.00 0.99 2.43
Inflation sensitive 6.00 0.45 3.36
Private equity 12.00 6.83 6.95
Real Estate 11.00 4.50 5.13
Infrastructure and forestland 3.00 4.50 5.09
Liquidity 2.00 (0.55) (1.05)
Total 100.00 %
Sensitivity of the Net Pension Liability to Changes in the Discount Rate
The following presents the net pension liability of Covered California as of June 30, 2014, calculated using
the discount rate of 7.65%, as well as what the pension liability would be if it were calculated using a
discount rate that is 1 percentage-point lower (6.65%) or 1 percentage point higher (8.65%) than the
current rate:
Miscellaneous plan $ 78,664,948 53,473,664 31,857,619
Pension Plan Fiduciary Net Position
Each plan’s fiduciary net position disclosed in the accounting valuation report provided by CalPERS may
differ from the plan’s assets reported in the funding actuarial valuation report due to several reasons; the
accounting valuation report must keep items such as deficiency reserves, fiduciary self-insurance, and
OPEB expenses included as assets. These amounts are excluded for rate setting purposes in the funding
actuarial valuation report.
Other Postemployment Benefits
Postretirement healthcare benefits are also provided to Covered California employees through the
programs sponsored by the State as administered by CalPERS and the California Department of Human
Resources (CalHR). As the postretirement healthcare plan is sponsored by the State, it is considered a
single-employer plan. The total other postemployment benefits (OPEB) actuarial accrued liability is
reported at the State level.
CALIFORNIA HEALTH BENEFIT EXCHANGE
(COVERED CALIFORNIA)
Notes to Financial Statements
June 30, 2015
26 (Continued)
Healthcare and dental benefits may be provided to members depending on the date hired and the
member’s years of credited service. Postretirement health benefits include medical, prescription drug, and
dental benefits and are currently funded on a pay-as-you-go basis. Employer contributions for health
premiums during fiscal year 2014-15 maintained the 100/90% contribution formula established by
Government Code. Under this formula, the State uses 100% of the weighted average premiums of the
four largest health benefit plans in order to calculate the maximum amount the State will contribute toward
the retiree’s health benefits. The State also contributes 90% of this average for the health benefits of each
of the retiree’s dependents. The retiree is responsible for paying all health benefit plan costs that exceed
the average of the four largest benefit plans. The monthly contribution maximums are $655 for a single
enrollee, $1,246 for an enrollee and one dependent, and $1,605 for an enrollee and two or more
dependents. Dental premiums vary by plan and number of dependents. The contribution formulas are
subject to approval and amendment by the legislature of the State. If members are not fully vested, the
healthcare and dental contributions will be prorated based on the years of service.
Covered California paid approximately $1.5 million for postretirement health and dental benefits for retired
members for the year ended June 30, 2015. Covered California has adopted GASB Statement No. 45.
Covered California’s annual OPEB cost (AOC) is calculated based on the annual required contribution
(ARC). The AOC recorded by Covered California is calculated by the State and represents an allocation
of the total ARC of the State, adjusted for interest and other adjustments. The allocation is based on
Covered California’s retiree health benefit costs in relation to the total State retiree health benefit costs.
The ARC represents normal cost plus an amortization of the difference between the actuarial accrued
liability and any asset available to pay benefits. For the year ended June 30, 2015, Covered California’s
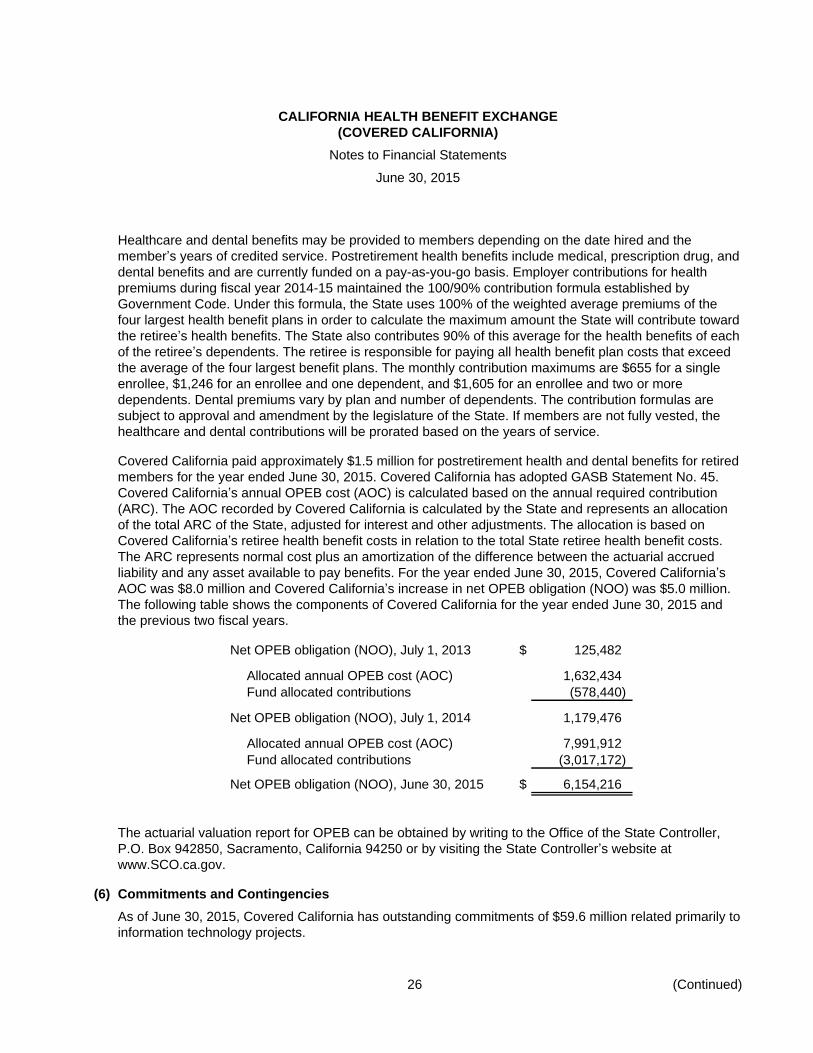
AOC was $8.0 million and Covered California’s increase in net OPEB obligation (NOO) was $5.0 million.
The following table shows the components of Covered California for the year ended June 30, 2015 and
the previous two fiscal years.
Net OPEB obligation (NOO), July 1, 2013 $ 125,482
Allocated annual OPEB cost (AOC) 1,632,434
Fund allocated contributions (578,440)
Net OPEB obligation (NOO), July 1, 2014 1,179,476
Allocated annual OPEB cost (AOC) 7,991,912
Fund allocated contributions (3,017,172)
Net OPEB obligation (NOO), June 30, 2015 $ 6,154,216
The actuarial valuation report for OPEB can be obtained by writing to the Office of the State Controller,
P.O. Box 942850, Sacramento, California 94250 or by visiting the State Controller’s website at
www.SCO.ca.gov.
(6) Commitments and Contingencies
As of June 30, 2015, Covered California has outstanding commitments of $59.6 million related primarily to
information technology projects.
CALIFORNIA HEALTH BENEFIT EXCHANGE
(COVERED CALIFORNIA)
Notes to Financial Statements
June 30, 2015
27
Covered California receives federal awards. Receipts from federal grants are subject to audit to determine
if the funds were expended in accordance with appropriate statutes, grant terms, and regulations. Any
disallowed expenditures resulting from such audits become a liability of Covered California. Management
does not believe such adjustments, if any, would materially affect the financial condition or operations of
Covered California.
(7) Risk Management
Covered California is self-insured through the State Department of General Services (DGS) Office of Risk
and Insurance Management (ORIM) for risks of employee errors and omissions, business interruption,
and comprehensive insurance. The ORIM provides risk management and insurance services to state and
other public entities on an ongoing or project-specific basis. There have been no significant reductions in
insurance coverage from the prior year. In addition, no insurance settlement in the last three years has
exceeded insurance coverage. All claims are on a “pay-as-you-go” basis.
Liabilities for workers’ compensation costs are accrued based on estimates derived from the State
Compensation Insurance Fund. This estimate is based on actuarial reviews of employee workers’
compensation program and includes indemnity payments compensation benefits and leave benefits. The
liability for workers’ compensation is not material to the financial statements as a whole.
Independent Auditors’ Report on Internal Control over Financial Reporting and on Compliance and
Other Matters Based on an Audit of Financial Statements Performed in Accordance with
Government Auditing Standards
Board of Directors
California Health Benefit Exchange
We have audited, in accordance with the auditing standards generally accepted in the United States of
America and the standards applicable to financial audits contained in Government Auditing Standards, issued
by the Comptroller General of the United States, the financial statements of the California Health Benefit
Exchange (Covered California), which comprise the statement of net position as of June 30, 2015, and the
related statements of revenues, expenses and changes in net position and cash flows for the year then
ended, and the related notes to the financial statements, and have issued our report thereon dated March 20,
2017. Our report includes an emphasis of matter paragraph related to Covered California’s adoption of
Governmental Accounting Standards Board (GASB) Statement No. 68, Accounting and Financial Reporting
for Pensions and Statement No. 71, Pension Transition for Contributions Made Subsequent to the
Measurement Date. The July 1, 2014 beginning net position has been restated for the retrospective
application of this new accounting guidance.
Internal Control over Financial Reporting
In planning and performing our audit of the financial statements, we considered Covered California’s internal
control over financial reporting (internal control) to determine the audit procedures that are appropriate in the
circumstances for the purpose of expressing our opinion on the financial statements, but not for the purpose
of expressing an opinion on the effectiveness of Covered California’s internal control. Accordingly, we do not
express an opinion on the effectiveness of Covered California’s internal control.
A deficiency in internal control exists when the design or operation of a control does not allow management or
employees, in the normal course of performing their assigned functions, to prevent, or detect and correct,
misstatements on a timely basis. A material weakness is a deficiency, or combination of deficiencies, in
internal control, such that there is a reasonable possibility that a material misstatement of the entity’s financial
statements will not be prevented, or detected and corrected on a timely basis. A significant deficiency is a
deficiency, or a combination of deficiencies, in internal control that is less severe than a material weakness,
yet important enough to merit attention by those charged with governance.
Our consideration of internal control was for the limited purpose described in the first paragraph of this section
and was not designed to identify all deficiencies in internal control that might be material weaknesses or
significant deficiencies and therefore, material weaknesses or significant deficiencies may exist that were not
identified. Given these limitations, during our audit we did not identify any deficiencies in internal control that
we consider to be material weaknesses. However, material weaknesses may exist that have not been
identified. We consider the deficiency described as 2015-001 in the accompanying schedule of findings and
questioned costs to be a significant deficiency.
KPMG LLP is a Delaware limited liability partnership and the U.S. member firm of the KPMG network of independent member firms affiliated with KPMG International Cooperative (“KPMG International”), a Swiss entity.
KPMG LLP500 Capitol Mall, Ste 2100Sacramento, CA 95814-4754
29
Compliance and Other Matters
As part of obtaining reasonable assurance about whether Covered California’s financial statements are free
from material misstatement, we performed tests of its compliance with certain provisions of laws, regulations,
contracts, and grant agreements, noncompliance with which could have a direct and material effect on the
determination of financial statement amounts. However, providing an opinion on compliance with those
provisions was not an objective of our audit, and accordingly, we do not express such an opinion. The results
of our tests disclosed no instances of noncompliance or other matters that are required to be reported under
Government Auditing Standards.
Covered California’s Response to the Finding
Covered California’s response to the findings identified in our audit is described in the accompanying
schedule of findings and questioned costs. Covered California’s response was not subjected to the auditing
procedures applied in the audit of the financial statements and, accordingly, we express no opinion on the
response.
Purpose of this Report
The purpose of this report is solely to describe the scope of our testing of internal control and compliance and
the results of that testing, and not to provide an opinion on the effectiveness of Covered California’s internal
control or on compliance. This report is an integral part of an audit performed in accordance with Government
Auditing Standards in considering Covered California’s internal control and compliance. Accordingly, this
communication is not suitable for any other purpose.
Sacramento, California
March 20, 2017
Independent Auditors’ Report on Compliance for Each Major Federal Program; Report on Internal
Control over Compliance Required by OMB Circular A-133, Audits of States, Local Governments, and
Non-Profit Organizations
Board of Directors
California Health Benefit Exchange
Report on Compliance for Each Major Federal Program
We have audited the California Health Benefit Exchange’s (Covered California) compliance with the types of
compliance requirements described in the OMB Circular A-133 Compliance Supplement that could have a
direct and material effect on Covered California’s major federal program for the year ended June 30, 2015.
Covered California’s major federal program is identified in the summary of auditors’ results section of the
accompanying schedule of findings and questioned costs.
Management’s Responsibility
Management is responsible for compliance with the requirements of laws, regulations, contracts, and grants
applicable to its federal programs.
Auditors’ Responsibility
Our responsibility is to express an opinion on compliance for Covered California’s major federal program
based on our audit of the types of compliance requirements referred to above. We conducted our audit of
compliance in accordance with auditing standards generally accepted in the United States of America; the
standards applicable to financial audits contained in Government Auditing Standards, issued by the
Comptroller General of the United States; and OMB Circular A-133, Audits of States, Local Governments, and
Non-Profit Organizations. Those standards and OMB Circular A-133 require that we plan and perform the
audit to obtain reasonable assurance about whether noncompliance with the types of compliance
requirements referred to above that could have a direct and material effect on a major federal program
occurred. An audit includes examining, on a test basis, evidence about Covered California’s compliance with
those requirements and performing such other procedures as we considered necessary in the circumstances.
We believe that our audit provides a reasonable basis for our opinion on compliance for the major federal
program. However, our audit does not provide a legal determination of Covered California’s compliance.
Opinion on Each Federal Program
In our opinion, Covered California complied, in all material respects, with the types of compliance
requirements referred to above that could have a direct and material effect on its major federal program for
the year ended June 30, 2015.
Other Matters
The results of our auditing procedures disclosed instances of noncompliance, which are required to be
reported in accordance with OMB Circular A-133 and which are described in the accompanying schedule of
findings and questioned costs as items 2015-002 and 2015-003. Our opinion on the major federal program is
not modified with respect to this matter.
KPMG LLP is a Delaware limited liability partnership and the U.S. member firm of the KPMG network of independent member firms affiliated with KPMG International Cooperative (“KPMG International”), a Swiss entity.
KPMG LLP500 Capitol Mall, Ste 2100Sacramento, CA 95814-4754
31
Covered California’s responses to the noncompliance findings identified in our audit are described in the
accompanying schedule of findings and questioned costs. Covered California’s responses were not subjected
to the auditing procedures applied in the audit of compliance and, accordingly, we express no opinion on the
responses.
Report on Internal Control over Compliance
Management of Covered California is responsible for establishing and maintaining effective internal control
over compliance with the types of compliance requirements referred to above. In planning and performing our
audit of compliance, we considered Covered California’s internal control over compliance with the types of
requirements that could have a direct and material effect on each major federal program to determine the
auditing procedures that are appropriate in the circumstances for the purpose of expressing an opinion on
compliance for each major federal program and to test and report on internal control over compliance in
accordance with OMB Circular A-133, but not for the purpose of expressing an opinion on the effectiveness of
internal control over compliance. Accordingly, we do not express an opinion on the effectiveness of Covered
California’s internal control over compliance.
A deficiency in internal control over compliance exists when the design or operation of a control over
compliance does not allow management or employees, in the normal course of performing their assigned
functions, to prevent, or detect and correct, noncompliance with a type of compliance requirement of a federal
program on a timely basis. A material weakness in internal control over compliance is a deficiency, or
combination of deficiencies, in internal control over compliance, such that there is a reasonable possibility that
material noncompliance with a type of compliance requirement of a federal program will not be prevented, or
detected and corrected, on a timely basis. A significant deficiency in internal control over compliance is a
deficiency, or a combination of deficiencies, in internal control over compliance with a type of compliance
requirement of a federal program that is less severe than a material weakness in internal control over
compliance, yet important enough to merit attention by those charged with governance.
Our consideration of internal control over compliance was for the limited purpose described in the first
preceding paragraph of this section and was not designed to identify all deficiencies in internal control over
compliance that might be material weaknesses or significant deficiencies and therefore, material weaknesses
or significant deficiencies may exist that were not identified. We did not identify any deficiencies in internal
control over compliance that we consider to be material weaknesses. However, we identified certain
deficiencies in internal control over compliance, as described in the accompanying schedule of findings and
questioned costs as items 2015-002 and 2015-003, that we consider to be significant deficiencies.
Covered California’s responses to the internal control over compliance findings identified in our audit are
described in the accompanying schedule of findings and questioned costs. Covered California’s responses
were not subjected to the auditing procedures applied in the audit of compliance and, accordingly, we express
no opinion on the responses.
The purpose of this report on internal control over compliance is solely to describe the scope of our testing of
internal control over compliance and the results of that testing based on the requirements of OMB Circular
A-133. Accordingly, this report is not suitable for any other purpose.
Sacramento, California
March 20, 2017
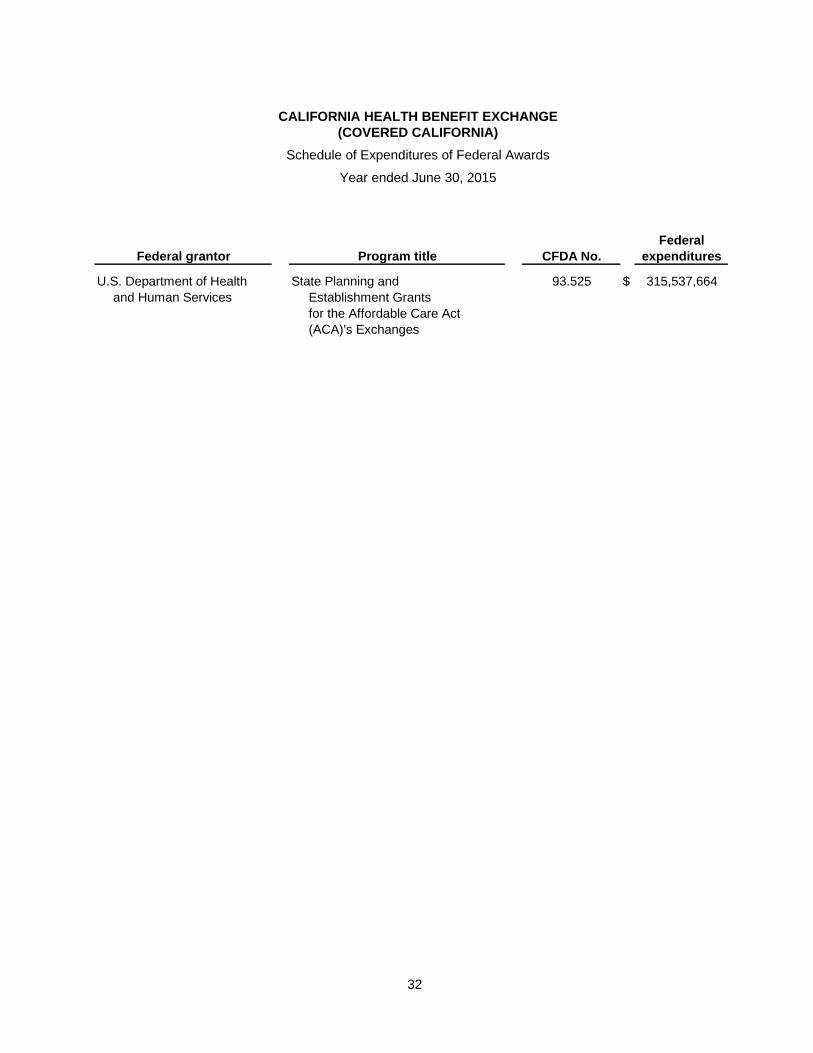
CALIFORNIA HEALTH BENEFIT EXCHANGE
(COVERED CALIFORNIA)
Schedule of Expenditures of Federal Awards
Year ended June 30, 2015
32
Federal
Federal grantor Program title CFDA No. expenditures
U.S. Department of Health State Planning and 93.525 $ 315,537,664
and Human Services Establishment Grants
for the Affordable Care Act
(ACA)'s Exchanges
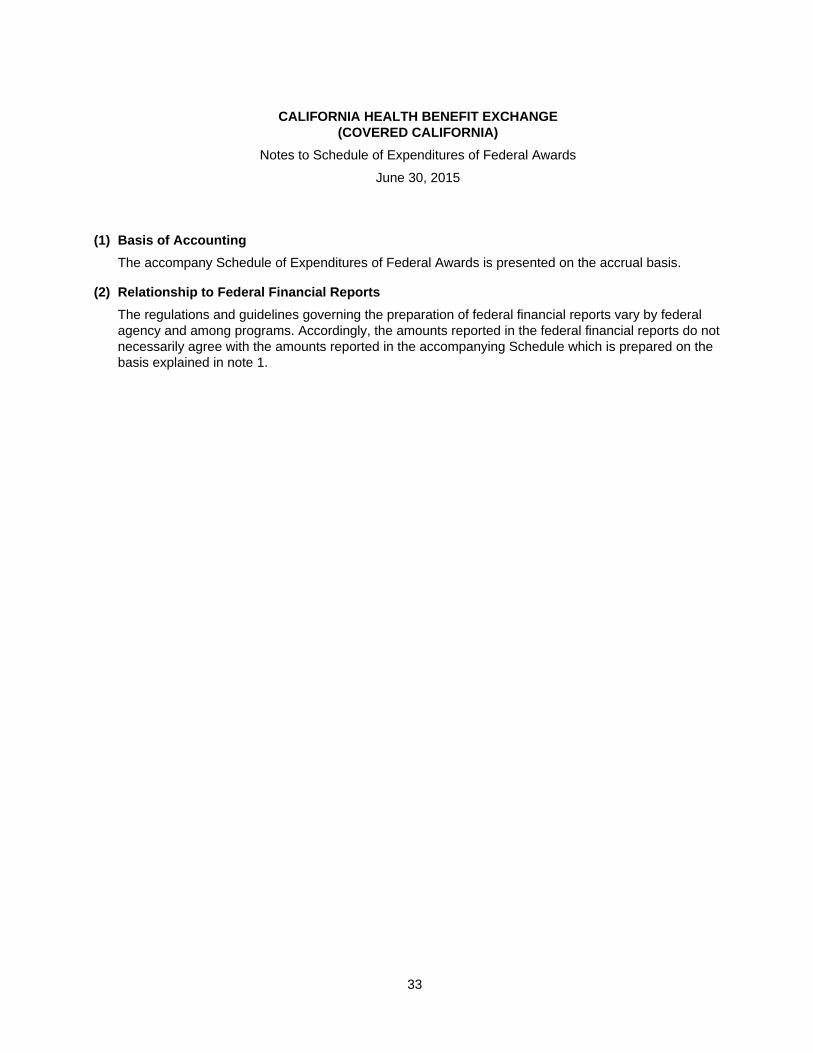
CALIFORNIA HEALTH BENEFIT EXCHANGE
(COVERED CALIFORNIA)
Notes to Schedule of Expenditures of Federal Awards
June 30, 2015
33
(1) Basis of Accounting
The accompany Schedule of Expenditures of Federal Awards is presented on the accrual basis.
(2) Relationship to Federal Financial Reports
The regulations and guidelines governing the preparation of federal financial reports vary by federal
agency and among programs. Accordingly, the amounts reported in the federal financial reports do not
necessarily agree with the amounts reported in the accompanying Schedule which is prepared on the
basis explained in note 1.
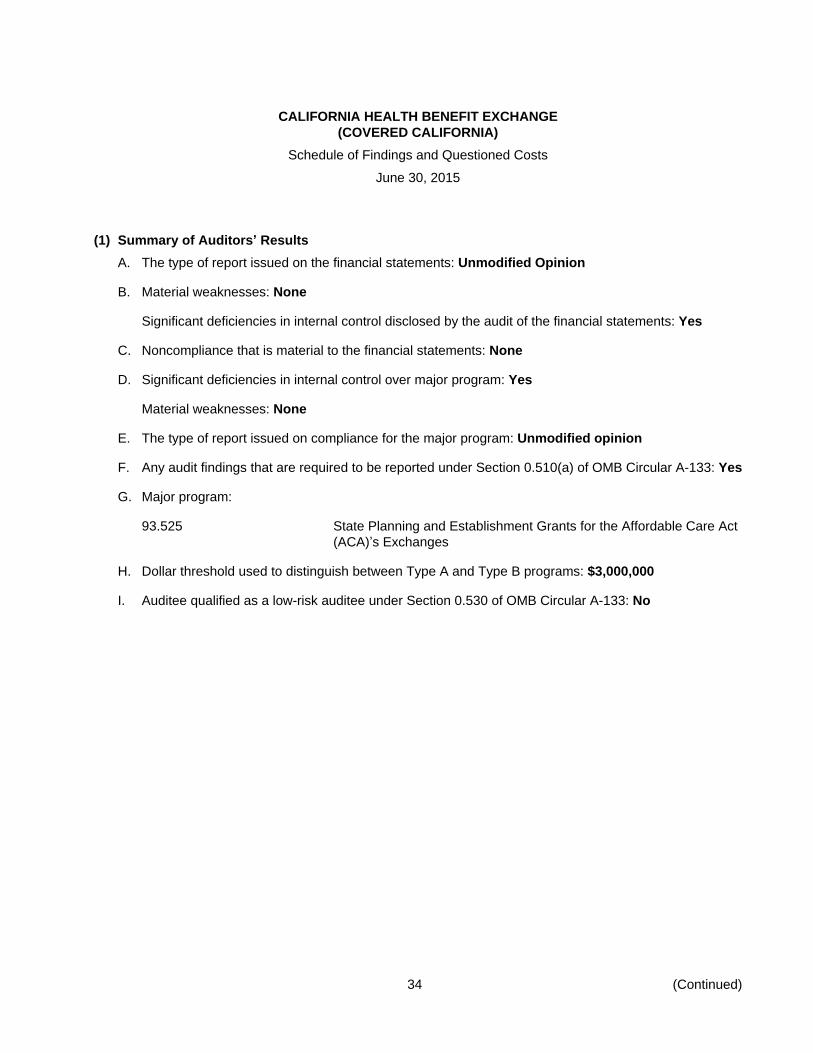
CALIFORNIA HEALTH BENEFIT EXCHANGE
(COVERED CALIFORNIA)
Schedule of Findings and Questioned Costs
June 30, 2015
34 (Continued)
(1) Summary of Auditors’ Results
A. The type of report issued on the financial statements: Unmodified Opinion
B. Material weaknesses: None
Significant deficiencies in internal control disclosed by the audit of the financial statements: Yes
C. Noncompliance that is material to the financial statements: None
D. Significant deficiencies in internal control over major program: Yes
Material weaknesses: None
E. The type of report issued on compliance for the major program: Unmodified opinion
F. Any audit findings that are required to be reported under Section 0.510(a) of OMB Circular A-133: Yes
G. Major program:
93.525 State Planning and Establishment Grants for the Affordable Care Act
(ACA)’s Exchanges
H. Dollar threshold used to distinguish between Type A and Type B programs: $3,000,000
I. Auditee qualified as a low-risk auditee under Section 0.530 of OMB Circular A-133: No
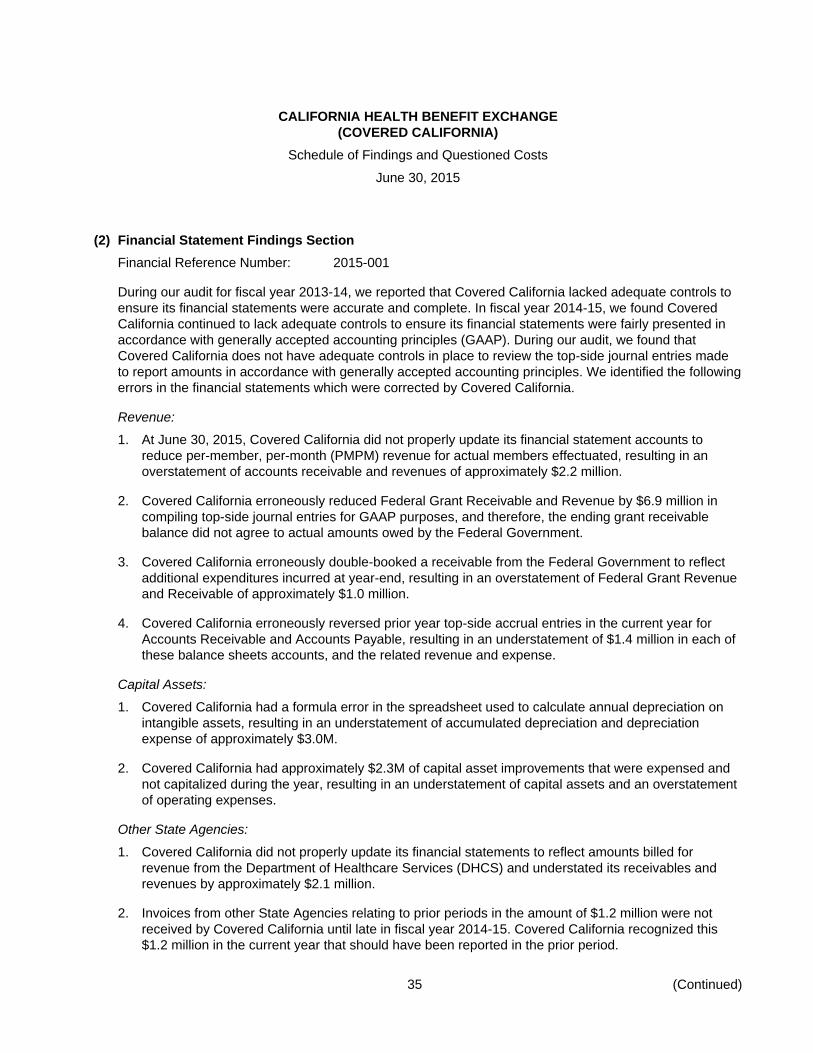
CALIFORNIA HEALTH BENEFIT EXCHANGE
(COVERED CALIFORNIA)
Schedule of Findings and Questioned Costs
June 30, 2015
35 (Continued)
(2) Financial Statement Findings Section
Financial Reference Number: 2015-001
During our audit for fiscal year 2013-14, we reported that Covered California lacked adequate controls to
ensure its financial statements were accurate and complete. In fiscal year 2014-15, we found Covered
California continued to lack adequate controls to ensure its financial statements were fairly presented in
accordance with generally accepted accounting principles (GAAP). During our audit, we found that
Covered California does not have adequate controls in place to review the top-side journal entries made
to report amounts in accordance with generally accepted accounting principles. We identified the following
errors in the financial statements which were corrected by Covered California.
Revenue:
1. At June 30, 2015, Covered California did not properly update its financial statement accounts to
reduce per-member, per-month (PMPM) revenue for actual members effectuated, resulting in an
overstatement of accounts receivable and revenues of approximately $2.2 million.
2. Covered California erroneously reduced Federal Grant Receivable and Revenue by $6.9 million in
compiling top-side journal entries for GAAP purposes, and therefore, the ending grant receivable
balance did not agree to actual amounts owed by the Federal Government.
3. Covered California erroneously double-booked a receivable from the Federal Government to reflect
additional expenditures incurred at year-end, resulting in an overstatement of Federal Grant Revenue
and Receivable of approximately $1.0 million.
4. Covered California erroneously reversed prior year top-side accrual entries in the current year for
Accounts Receivable and Accounts Payable, resulting in an understatement of $1.4 million in each of
these balance sheets accounts, and the related revenue and expense.
Capital Assets:
1. Covered California had a formula error in the spreadsheet used to calculate annual depreciation on
intangible assets, resulting in an understatement of accumulated depreciation and depreciation
expense of approximately $3.0M.
2. Covered California had approximately $2.3M of capital asset improvements that were expensed and
not capitalized during the year, resulting in an understatement of capital assets and an overstatement
of operating expenses.
Other State Agencies:
1. Covered California did not properly update its financial statements to reflect amounts billed for
revenue from the Department of Healthcare Services (DHCS) and understated its receivables and
revenues by approximately $2.1 million.
2. Invoices from other State Agencies relating to prior periods in the amount of $1.2 million were not
received by Covered California until late in fiscal year 2014-15. Covered California recognized this
$1.2 million in the current year that should have been reported in the prior period.
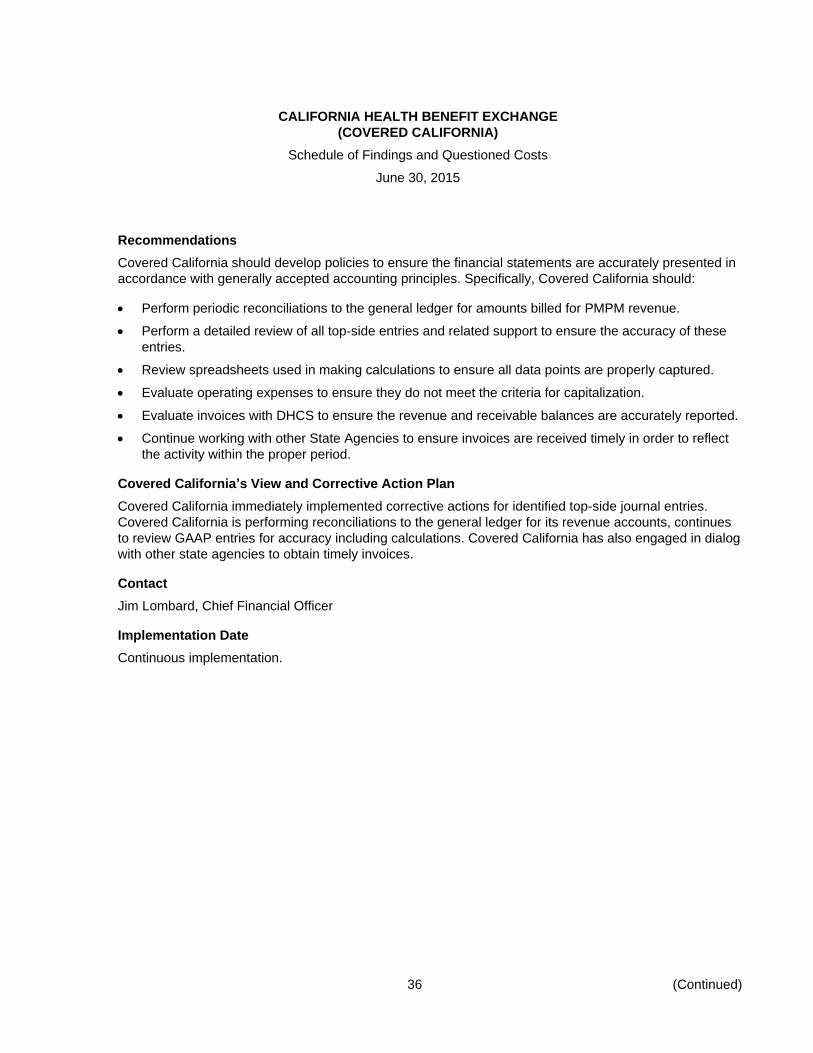
CALIFORNIA HEALTH BENEFIT EXCHANGE
(COVERED CALIFORNIA)
Schedule of Findings and Questioned Costs
June 30, 2015
36 (Continued)
Recommendations
Covered California should develop policies to ensure the financial statements are accurately presented in
accordance with generally accepted accounting principles. Specifically, Covered California should:
Perform periodic reconciliations to the general ledger for amounts billed for PMPM revenue.
Perform a detailed review of all top-side entries and related support to ensure the accuracy of these
entries.
Review spreadsheets used in making calculations to ensure all data points are properly captured.
Evaluate operating expenses to ensure they do not meet the criteria for capitalization.
Evaluate invoices with DHCS to ensure the revenue and receivable balances are accurately reported.
Continue working with other State Agencies to ensure invoices are received timely in order to reflect
the activity within the proper period.
Covered California’s View and Corrective Action Plan
Covered California immediately implemented corrective actions for identified top-side journal entries.
Covered California is performing reconciliations to the general ledger for its revenue accounts, continues
to review GAAP entries for accuracy including calculations. Covered California has also engaged in dialog
with other state agencies to obtain timely invoices.
Contact
Jim Lombard, Chief Financial Officer
Implementation Date
Continuous implementation.
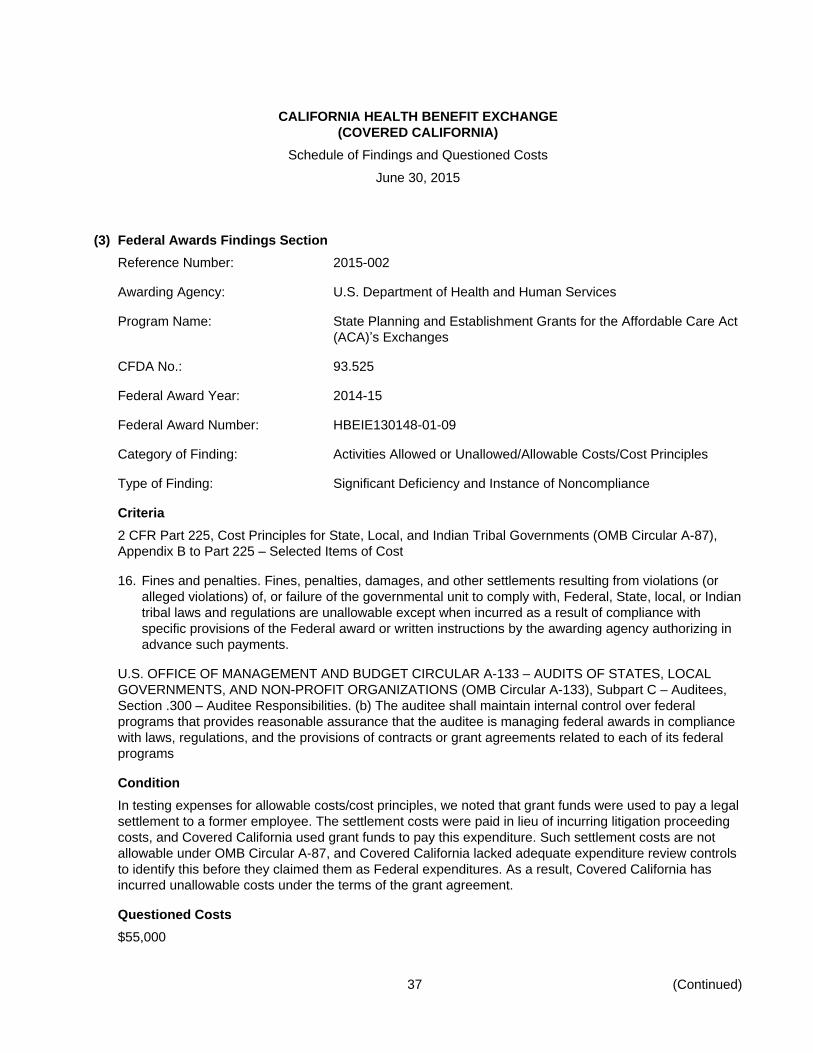
CALIFORNIA HEALTH BENEFIT EXCHANGE
(COVERED CALIFORNIA)
Schedule of Findings and Questioned Costs
June 30, 2015
37 (Continued)
(3) Federal Awards Findings Section
Reference Number: 2015-002
Awarding Agency: U.S. Department of Health and Human Services
Program Name: State Planning and Establishment Grants for the Affordable Care Act
(ACA)’s Exchanges
CFDA No.: 93.525
Federal Award Year: 2014-15
Federal Award Number: HBEIE130148-01-09
Category of Finding: Activities Allowed or Unallowed/Allowable Costs/Cost Principles
Type of Finding: Significant Deficiency and Instance of Noncompliance
Criteria
2 CFR Part 225, Cost Principles for State, Local, and Indian Tribal Governments (OMB Circular A-87),
Appendix B to Part 225 – Selected Items of Cost
16. Fines and penalties. Fines, penalties, damages, and other settlements resulting from violations (or
alleged violations) of, or failure of the governmental unit to comply with, Federal, State, local, or Indian
tribal laws and regulations are unallowable except when incurred as a result of compliance with
specific provisions of the Federal award or written instructions by the awarding agency authorizing in
advance such payments.
U.S. OFFICE OF MANAGEMENT AND BUDGET CIRCULAR A-133 – AUDITS OF STATES, LOCAL
GOVERNMENTS, AND NON-PROFIT ORGANIZATIONS (OMB Circular A-133), Subpart C – Auditees,
Section .300 – Auditee Responsibilities. (b) The auditee shall maintain internal control over federal
programs that provides reasonable assurance that the auditee is managing federal awards in compliance
with laws, regulations, and the provisions of contracts or grant agreements related to each of its federal
programs
Condition
In testing expenses for allowable costs/cost principles, we noted that grant funds were used to pay a legal
settlement to a former employee. The settlement costs were paid in lieu of incurring litigation proceeding
costs, and Covered California used grant funds to pay this expenditure. Such settlement costs are not
allowable under OMB Circular A-87, and Covered California lacked adequate expenditure review controls
to identify this before they claimed them as Federal expenditures. As a result, Covered California has
incurred unallowable costs under the terms of the grant agreement.
Questioned Costs
$55,000
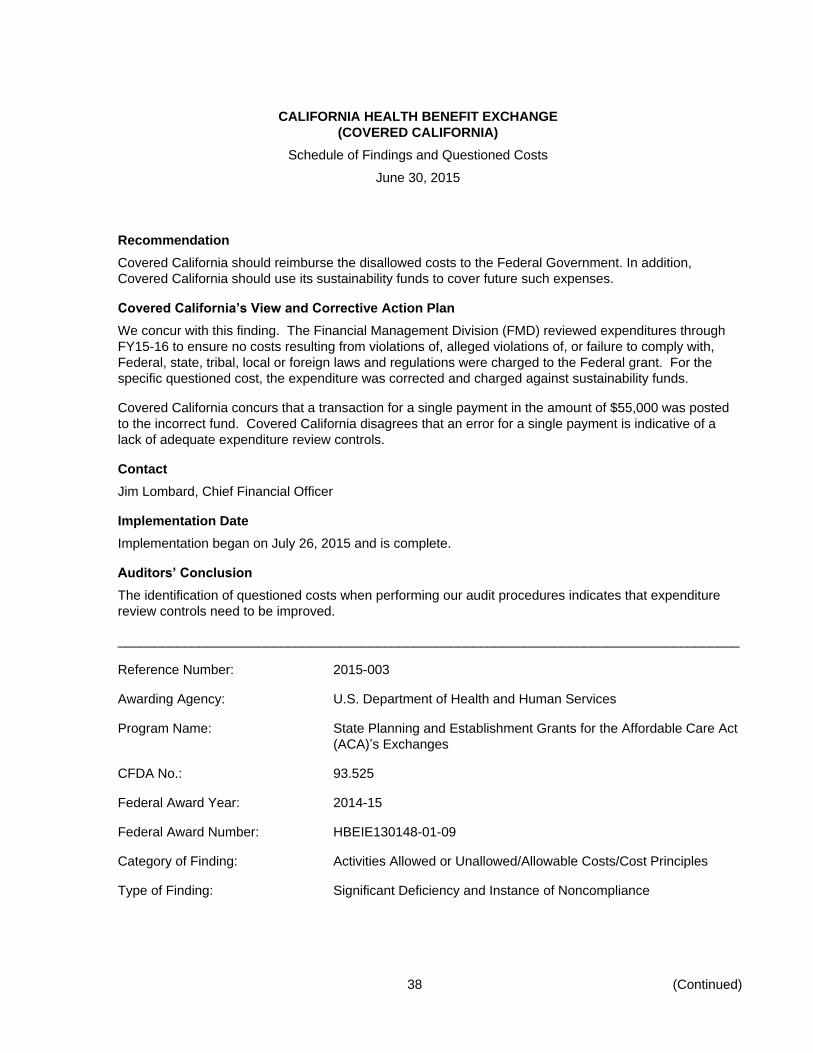
CALIFORNIA HEALTH BENEFIT EXCHANGE
(COVERED CALIFORNIA)
Schedule of Findings and Questioned Costs
June 30, 2015
38 (Continued)
Recommendation
Covered California should reimburse the disallowed costs to the Federal Government. In addition,
Covered California should use its sustainability funds to cover future such expenses.
Covered California’s View and Corrective Action Plan
We concur with this finding. The Financial Management Division (FMD) reviewed expenditures through
FY15-16 to ensure no costs resulting from violations of, alleged violations of, or failure to comply with,
Federal, state, tribal, local or foreign laws and regulations were charged to the Federal grant. For the
specific questioned cost, the expenditure was corrected and charged against sustainability funds.
Covered California concurs that a transaction for a single payment in the amount of $55,000 was posted
to the incorrect fund. Covered California disagrees that an error for a single payment is indicative of a
lack of adequate expenditure review controls.
Contact
Jim Lombard, Chief Financial Officer
Implementation Date
Implementation began on July 26, 2015 and is complete.
Auditors’ Conclusion
The identification of questioned costs when performing our audit procedures indicates that expenditure
review controls need to be improved.
____________________________________________________________________________________
Reference Number: 2015-003
Awarding Agency: U.S. Department of Health and Human Services
Program Name: State Planning and Establishment Grants for the Affordable Care Act
(ACA)’s Exchanges
CFDA No.: 93.525
Federal Award Year: 2014-15
Federal Award Number: HBEIE130148-01-09
Category of Finding: Activities Allowed or Unallowed/Allowable Costs/Cost Principles
Type of Finding: Significant Deficiency and Instance of Noncompliance
CALIFORNIA HEALTH BENEFIT EXCHANGE
(COVERED CALIFORNIA)
Schedule of Findings and Questioned Costs
June 30, 2015
39 (Continued)
Criteria
U.S. OFFICE OF MANAGEMENT AND BUDGET CIRCULAR A-133 – AUDITS OF STATES, LOCAL
GOVERNMENTS, AND NON-PROFIT ORGANIZATIONS (OMB Circular A-133), Subpart C – Auditees,
Section 300 – Auditee Responsibilities. (b) The auditee shall maintain internal control over federal
programs that provides reasonable assurance that the auditee is managing federal awards in compliance
with laws, regulations, and the provisions of contracts or grant agreements related to each of its federal
programs.
Section 1311. AFFORDABLE CHOICES OF HEALTH BENEFIT PLANS
(5) Funding Limitations
(A) NO FEDERAL FUNDS FOR CONTINUED OPERATIONS. − In establishing an Exchange under
this section, the State shall ensure that such Exchange is self-sustaining beginning on January 1,
2015, including allowing the Exchange to charge assessments or user fees to participating health
insurance issuers, or to otherwise generate funding, to support its operations.
OMB Circular A-87 Revised Cost Principles for State, Local, and Indian Tribal Governments, Section C.
Basic Guidelines:
1. Factors affecting allowability of costs. To be allowable under Federal awards, costs must meet the
following general criteria:
a. Be necessary and reasonable for proper and efficient performance and administration of Federal
awards.
b. Be allocable to Federal awards under the provisions of this Circular.
Condition
During fiscal year 2014-15, Covered California claimed certain expenditures that were not allowable under
the provisions of Section 1311 of the Affordable Care Act and OMB Circular A-87. Beginning January 1,
2015, Covered California was required to comply with Section 1311 (5)(A) of the Affordable Care Act
which provides for the use of sustainability funds to cover ongoing operating expenditures. Covered
California did not have adequate expenditure review controls in place to identify these expenditures prior
to claiming them with the Federal government. Based on discussions with Covered California
management and audit testing performed, Covered California identified approximately $9.7 million of grant
expenditures incurred subsequent to January 1, 2015 and claimed thereafter that were identified as
unallowable costs as they related to ongoing operations. Covered California management identified the
unallowable costs based on the Frequently Asked Questions guidance issued by the Centers for Medicare
& Medicaid Services (CMS) in June 2015, and has indicated that the Federal Government was
reimbursed for such costs through a reduction of draws submitted subsequent to its 2014-15 fiscal year
end. In addition, Covered California identified approximately $2.4 million of other expenditures that should
have been funded with sustainability funds instead of grant funds.
CALIFORNIA HEALTH BENEFIT EXCHANGE
(COVERED CALIFORNIA)
Schedule of Findings and Questioned Costs
June 30, 2015
40 (Continued)
Questioned Costs
$12,164,509
Recommendation
Covered California should strengthen its existing monitoring controls surrounding changes in allowability
requirements to ensure that all expenditures claimed under the grant meet the grant requirements.
Covered California’s View and Corrective Action Plan
Covered California disagrees with this finding. The Condition statement above does not provide sufficient
timing detail regarding the advice received on allowable costs from CMS on June 8, 2015 that was
retroactive to January 1, 2015; therefore, the suggested recommendation of strengthening monitoring
controls would not have avoided the adjustments noted above. At the time that the expenditures
occurred, the costs were allowable and Covered California was in compliance with Section 1311 (5)
(A). However, on June 8, 2015, three weeks before the end of the state fiscal year, and six months after
the beginning of the self-sustainability period cited in Section 1311 (5) (A), CMS released, “FAQs on the
Clarification of the Use of 1311 Funds for Establishment Activities”, which described allowable uses of
1311 funds after January 1, 2015 for establishment activities that were specifically described in the
grantee’s approved work plan. Based on this new information Covered California reviewed expenditures
and made timely adjustments. All expenditure adjustments were completed before the end of the 2014-15
state fiscal year and no corrective action is necessary.
Further, the CMS confirmed that the June 8, 2015 FAQs were issued as additional guidance to assist
States on continuing ACA activities. Due to the timing of the FAQs, CMS expected that State based
marketplaces would require some accounting adjustments consistent with the additional guidance.
Covered California’s expenditure adjustments and subsequent offsets to grant draws was a reasonable
and appropriate effort to mitigate the impact of the June 8, 2015 guidance.
Covered California was proactive and had appropriate expenditure reviews in place prior to claiming
Federal expenditures. Covered California could not have predicted that CMS would provide additional
guidance six months after the sustainability period began. At the time that the expenditures occurred, the
costs were allowable and Covered California was in compliance with Section 1311 (5) (A).
Contact
Jim Lombard, Chief Financial Officer
Implementation Date
Review of the FAQs began in June 2015 and expenditure corrections were completed. No further action is
necessary.
CALIFORNIA HEALTH BENEFIT EXCHANGE
(COVERED CALIFORNIA)
Schedule of Findings and Questioned Costs
June 30, 2015
41
Auditors’ Conclusion
The additional guidance provided by CMS in its publication of the Frequently Asked Questions further
clarified the types of expenditures that were no longer allowable under the grant as of January 1, 2015. As
the Affordable Care Act included a requirement to use sustainability funds to cover ongoing operating
expenditures, we concluded that the questioned costs above were not allowable during the reporting
period from January 1, 2015 to June 30, 2015.