Embed Size (px)
Citation preview

Standard Chartered
Annual Report 2017 190
FINANCIAL STATEMENTS
Standard Chartered
Annual Report 2017 190

191
Ris
k re
vie
w a
nd
cap
ital re
vie
wS
trate
gic
rep
ort
Su
pp
lem
en
tary
info
rmatio
nF
INA
NC
IAL
ST
AT
EM
EN
TS
Dire
cto
rs’ re
po
rt
Supporting SCB colleagues through fl exible working
FLEXIBLE WORKING
My family and my work
I’m an Australian-born mother of two: Mason (three) and Mia (one and a half).
My husband and I moved to Singapore over fi ve years ago as a newly married
couple looking for a new experience. I currently work as a business and change
manager, which involves ensuring that the bank complies with the customer
due diligence standards that apply in our markets.
I always knew that I wanted to return to work on a part-time basis after giving
birth so, after Mason came along, I used remaining maternity and annual leave
entitlements to work a shorter week.
Best of both worlds
Part-time work enables me to continue to advance in my career, while being
a full-time, hands-on mother. The best part is that I can take my kids on various
outings and play dates during what would be a ‘typical’ work day, while
helping to get important initiatives rolled out within the bank on the other days.
Attitudes are changing
Not all companies in Singapore would consider hiring someone on a fl exible
basis, and some people may assume I am less ambitious than everyone else
because I work part time, which is certainly not the case.
“I feel I have moved on to the next step in my career and that fl exible working has allowed me
to develop in a way that suited me.”
Katie Hasson | Business & Change Manager | Singapore 192 Independent auditor’s report
200 Consolidated income statement
201 Consolidated statement of comprehensive income
202 Consolidated balance sheet
203 Consolidated statement of changes in equity
204 Cash fl ow statement
205 Company balance sheet
206 Company statement of changes in equity
207 Notes to the fi nancial statements
Financial statements
Standard Chartered
Annual Report 2017 192
FINANCIAL STATEMENTS Independent auditor’s report
Independent auditor’s reportto the members of Standard Chartered PLC
1. Our opinion is unmodifi ed
We have audited the fi nancial statements of Standard Chartered PLC (“the Company”), and its subsidiaries (together “the Group”), for the year ended 31 December 2017 which comprise the consolidated balance sheet, the consolidated income statement, the consolidated statement of comprehensive income, the consolidated statement of changes in equity, the Group and Company cash fl ow statement, the Company balance sheet, the Company statement of changes in equity and the related notes, including the accounting policies in note 1.
In our opinion:
the fi nancial statements give a true and fair view of the state of the Group’s and of the parent Company’s affairs as at 31 December 2017 and of the Group’s profi t for the year then ended;
the Group fi nancial statements have been properly prepared in accordance with International Financial Reporting Standards as adopted by the European Union (IFRSs as adopted by the EU);
the parent Company fi nancial statements have been properly prepared in accordance with IFRSs as adopted by the EU and as applied in accordance with the provisions of the Companies Act 2006; and
the fi nancial statements have been prepared in accordance with the requirements of the Companies Act 2006 and, as regards the Group fi nancial statements, Article 4 of the IAS Regulation.
Basis for opinion
We conducted our audit in accordance with International Standards
on Auditing (UK) (“ISAs (UK)”) and applicable law. Our responsibilities
are described below. We believe that the audit evidence we have
obtained is a suffi cient and appropriate basis for our opinion. Our audit
opinion is consistent with our report to the Audit Committee.
We were appointed as auditor by the Group before 1973. The period of total uninterrupted engagement is for more than the 45 financial years ended 31 December 2017.
We have fulfi lled our ethical responsibilities under, and we remain independent of the Group in accordance with, UK ethical requirements including the FRC Ethical Standard as applied to listed public interest entities. No non-audit services prohibited by that standard were provided.
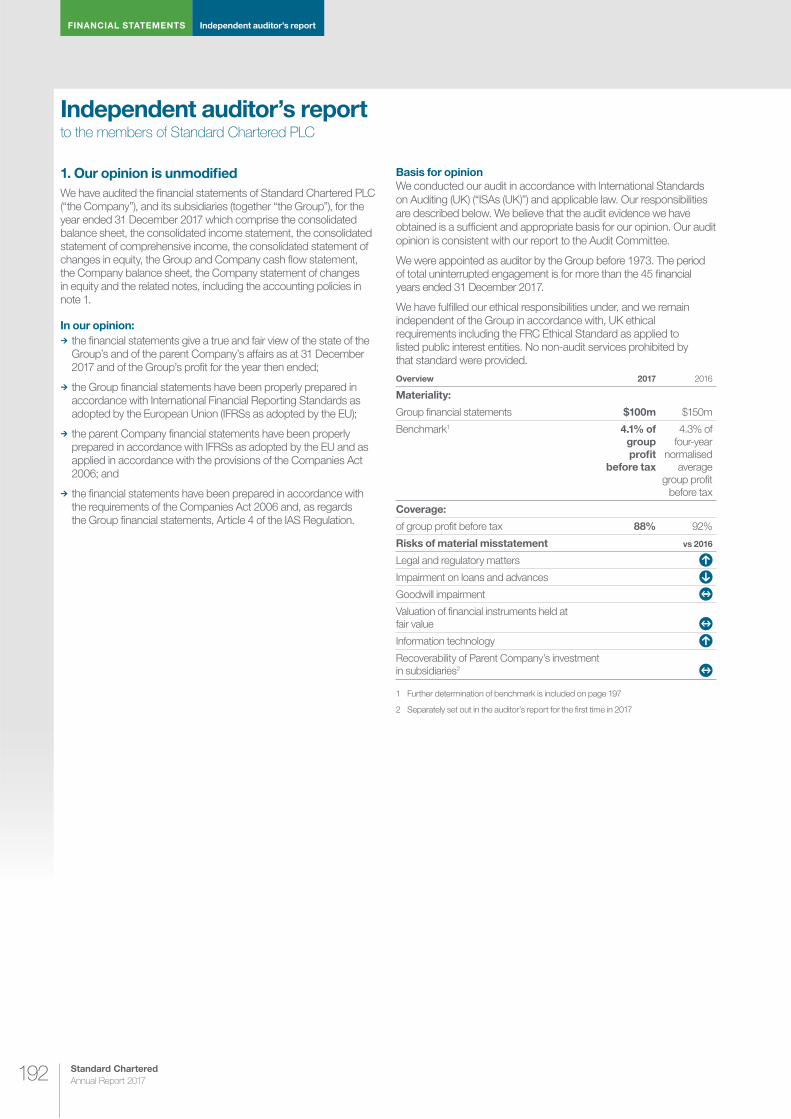
Overview 2017 2016
Materiality:
Group fi nancial statements $100m $150m
Benchmark1 4.1% of group profi t
before tax
4.3% of four-year
normalised average
group profi t before tax
Coverage:
of group profi t before tax 88% 92%
Risks of material misstatement vs 2016
Legal and regulatory matters
Impairment on loans and advances
Goodwill impairment
Valuation of fi nancial instruments held at fair value
Information technology
Recoverability of Parent Company’s investment in subsidiaries2
1 Further determination of benchmark is included on page 197
2 Separately set out in the auditor’s report for the fi rst time in 2017

193
Ris
k re
vie
w a
nd
cap
ital re
vie
wS
trate
gic
rep
ort
Su
pp
lem
en
tary
info
rmatio
nF
INA
NC
IAL
ST
AT
EM
EN
TS
Dire
cto
rs’ re
po
rt
2. Key audit matters: our assessment of risks of material misstatement
Key audit matters are those matters that, in our professional judgment, were of most signifi cance in the audit of the fi nancial statements and include the most signifi cant assessed risks of material misstatement (whether or not due to fraud) identifi ed by us, including those which had the greatest effect on: the overall audit strategy; the allocation of resources in the audit; and directing the efforts of the engagement team.
We summarise below the key audit matters in arriving at our audit opinion above, together with our key audit procedures to address those matters and, as required for public interest entities, our results from those procedures. These matters were addressed, and our results are based on procedures undertaken, in the context of, and solely for the purpose of, our audit of the fi nancial statements as a whole, and in forming our opinion thereon, and consequently are incidental to that opinion, and we do not provide a separate opinion on these matters.
Key audit matter The risk Our response
Legal and regulatory matters
Refer to page 64 (Audit Committee
Report), page 258 (note 24 Provisions
for liabilities and charges) and page 259
(note 26 Legal and regulatory matters)
including accounting policies
Dispute Outcome
There are a number of pending and ongoing legal disputes and regulatory investigations involving the Group. In certain litigation and regulatory matters signifi cant judgement is required by management to determine whether a present obligation exists and whether a provision should be recognised. If there is a present obligation there are signifi cant judgements in determining the measurement of provisions, which are subject to the future outcome of legal or regulatory processes.
We focused on the risk of material misstatement arising from ongoing investigations by regulators, specifi cally in the US relating to the possible violation of US sanction laws and regulations. Refer to note 26 (under ‘Other ongoing investigations and review’) in relation to the Group’s ongoing discussions with the relevant US authorities regarding the resolution of this investigation.
As discussed in note 26, it is acknowledged that the resolution of the investigation may involve a range of civil and criminal penalties for sanctions compliance violations including substantial monetary penalties.
As also discussed in note 26 there are ongoing discussions with the UK regulators in relation to fi nancial crime controls in the correspondent banking business.
Our procedures included:
Enquiry of lawyers: Meetings with the Group’s external counsel in the US and UK and the PRA (who are in regular contact with US and other regulatory bodies) to understand the nature and status of legal disputes and regulatory investigations to determine whether or not a provision should recognised.
Assessing provisions: We critically assessed and challenged the adequacy of provisions and contingent liability disclosures including management’s ability to reliably estimate any monetary penalties. Our procedures included comparing assumptions to historical data, approved settlement agreements and enquiry of lawyers.
Assessing transparency: Assessed whether the disclosures related to signifi cant litigation and regulatory matters adequately disclose the potential liabilities and the signifi cant uncertainties that exist.
Our results: We considered the provisions for legal and regulatory matters recognised, including the related disclosures and the contingent liability disclosure made in note 26, to be acceptable (2016: acceptable).

Standard Chartered
Annual Report 2017 194
FINANCIAL STATEMENTS Independent auditor’s report
Key audit matter The risk Our response
Impairment of loans and advances
Charge: $1,362 million (2016: $2,791 million)
Provision: $5,707 million (2016: $6,518 million)
Corporate & Institutional Banking (CIB) clients, Commercial Banking (CB) clients and Private Banking clients (collectively ‘larger clients’) represent 72 per cent ($264 billion) of the Group’s net loan exposure, whereas Retail clients represent 28 per cent ($103 billion).
Refer to page 64 (Audit Committee
Report), page 218 (note 8 Impairment
losses on loans and advances and
other credit risk provisions) and page
249 (note 16 Loans and and advances
to banks and customers) including
accounting policies
Subjective estimate
The carrying value of loans and advances to banks and customers held at amortised cost may be materially misstated if individual or collective impairments are not appropriately identifi ed and estimated. The identifi cation of impaired assets and the estimation of impairment including estimates of future cash fl ows and valuation of collateral involve signifi cant management judgement.
The collective impairment on CIB, CB and Retail loans and advances include overlays to the model calculated collective impairment. These overlays are calculated and assessed based on management’s judgement of the performance of the book.
The most signifi cant areas are:
Loan exposures in India due to high debt levels and weak balance sheets, regulatory reform and the poor performance of certain sectors such as telecoms and power
Oil and gas support service related exposures following sustained depression of oil prices in prior years
Our procedures included:
Control design, observation and operation: We tested the design and operation of manual and automated controls over the individual impairment provision including:
the accuracy of data input into the system used for credit grading and the approval of credit facilities
the ongoing monitoring and identifi cation of loans displaying indicators of impairment and whether they are migrating, on a timely basis, to early alert or to grades 12 to 14 including generation of days past due reports.
Assessing overlays: We assessed the adequacy of management overlays to the modelled collective provision for CIB, CB and Retail by recalculating the coverage provided by the collective impairment provision (including overlays) to loan book, taking into account recent loss history, performance and de-risking of the relevant portfolios. We assessed the areas identifi ed as most signifi cant opposite using external data and challenged whether the modelled collective impairment provision already appropriately refl ected them or if an overlay was required.
Assessing individual exposures: We selected a sample (based on quantitative thresholds) of larger clients where impairment indicators had been identifi ed by management. We obtained management’s assessment of the recoverability of these exposures (including individual provisions calculations) and challenged whether individual impairment provisions, or lack of, were appropriate. This included the following procedures:
challenging the recoverability of the forecast cash fl ows by comparing them to historical performance of the customer and the expected future performance where applicable; and
assessing external collateral valuer’s credentials and comparing external valuations to values used in management’s impairment assessments
For a risk based sample of CIB and CB loans credit grades 1 to 11 not identifi ed as displaying indicators of impairment by management, challenged this assessment by reviewing the historical performance of the customer and formed our own view whether any impairment indicators were present.
Our results: We considered the credit impairment charge and provision recognised and the related disclosures to be acceptable (2016: acceptable).

195
Ris
k re
vie
w a
nd
cap
ital re
vie
wS
trate
gic
rep
ort
Su
pp
lem
en
tary
info
rmatio
nF
INA
NC
IAL
ST
AT
EM
EN
TS
Dire
cto
rs’ re
po
rt
Key audit matter The risk Our response
Goodwill impairment
Impairment: $320 million (2016: $166 million)
Goodwill: $3,252 million (2016: $3,456 million)
Refer to page 64 (Audit Committee
Report) and page 251 (note 18
Goodwill and Intangible assets
including accounting policies)
Forecast-based valuation
Goodwill may be misstated if the carrying value of goodwill in the balance sheet is not supported by the estimated discounted future cash fl ows of the underlying businesses.
Subjective estimate
The identifi cation of indicators of impairment and the preparation of the estimate of recoverable amount involves subjective judgments and uncertainties.
Our work focused on the CGUs which have low headroom or signifi cantly reduced headroom following the re-segmentation (see note 18), including:
Taiwan
India
Our procedures included:
Methodology assessment: Assessed whether the resegmentation of the CGUs refl ects our understanding of the business and how it operates including assessment of the independence of the underlying cash fl ows.
Benchmarking assumptions: For a sample of CGUs including those identifi ed opposite, compared the growth rate assumptions to externally derived data for key inputs, including projected economic growth.
Our expertise: Our valuation specialists critically assessed the appropriateness of the discount rates for a sample of CGUs including those identifi ed opposite, independently calculating discount rate ranges using external data sources and peer bank data for local risk free rates, betas and market/country/entity risk premiums.
Sensitivity analysis: Performing breakeven analysis on the discount rate, the future cash fl ows and gross domestic product projections.
Historical comparison: Assessed management’s ability to accurately prepare forecasts compared to actual results.
Consistency comparison: Assessed the consistency of projected cash fl ows to the Board approved corporate plan.
Our results: We considered the goodwill impairment charge, carrying value of goodwill recognised and the related disclosures to be acceptable (2016: acceptable).
Valuation of fi nancial instruments held at fair value
Fair value of level 3 asset positions $1,938 million comprising 1.0 per cent of total fair value fi nancial instrument assets (2016: $2.3 billion, 1.2 per cent)
Fair value of level 3 liability positions $536 million comprising 0.8% of total fair value fi nancial instrument liabilities (2016: $0.8 billion, 1.0%)
Refer to page 64 (Audit Committee
Report), page 234 (accounting policy)
and page 227 (note 13 Financial
instruments)
Subjective estimate
The valuation of level 3 fi nancial instruments held at fair value through profi t or loss or as available-for-sale may be misstated due to the application of valuation techniques which often involve the exercise of judgement and the use of assumptions and estimates.
A subjective estimate exists for instruments where the valuation method uses signifi cantly unobservable inputs, which is principally the case for level 3 fi nancial instruments.
Our work focused on the following:
Valuation of level 3 positions, including unlisted investments in the Principal Finance business and derivatives with signifi cant unobservable pricing inputs
Modelling of, and key inputs into, the valuation of derivative and other instruments classifi ed as level 3
Disclosure of level 3 fi nancial assets and liabilities held at fair value, including the assessment of observability of pricing inputs
Our procedures included:
Controls operation: We tested the Group’s controls over the identifi cation and measurement of level 3 fi nancial instruments including independent price verifi cation controls and pricing inputs.
Methodology assessment: We assessed, for a selection of level 3 investments, the reasonableness of valuation methodology, model calculation, inputs and assumptions used, considering potential alternatives and sensitivities to key factors, for example EBITDA and PE multiples for Principal Finance investments.
Disclosures: We assessed the methodology applied for the fair value hierarchy. For a sample of level 2 and 3 fi nancial instruments we challenged the appropriateness of the levelling classifi cation. This included determining whether level 2 fi nancial instruments met the requisite criteria to be classifi ed as such. For level 3 positions, we assessed the transparency of the fi nancial statement disclosures, including sensitivity to key inputs refl ect the Group’s exposure to valuation risk.
Our results: We considered the valuation of level 3 fi nancial instruments held at fair value and the related disclosures to be acceptable (2016: acceptable).

Standard Chartered
Annual Report 2017 196
FINANCIAL STATEMENTS Independent auditor’s report
Key audit matter The risk Our response
Information technology
Refer to page 66
(Audit Committee Report)
Processing error
The Group’s key fi nancial accounting and reporting processes are highly dependent on the automated controls over the Group’s information systems, such that there exists a risk that gaps in the IT control environment could result in the fi nancial accounting and reporting records being materially misstated.
We have focused on user access management, segregation of duties and controls over system change over key fi nancial accounting and reporting systems.
Our procedures included:
General IT controls design, observation and operation: Tested a sample of key controls operating over the information technology in relation to fi nancial accounting and reporting systems, including system access and system change management, program development and computer operations.
User access controls operation: We obtained management’s evaluation of the access rights granted to applications relevant to fi nancial accounting and reporting systems and tested resolution of a sample of exceptions. We also assessed the operating effectiveness of controls over granting, removal and appropriateness of access rights.
Our results: We considered the user access management, segregation of duties and change management controls in relation to fi nancial accounting and reporting systems to be acceptable (2016: acceptable).
Company: recoverability of Parent Company’s investment in subsidiaries
Investment in subsidiaries $34,853 million (2016: $33,853 million)
Refer to page 64 (Audit Committee
Report), page 274 (note 32 Investment
in subsidiary undertakings, joint
ventures and associates including
accounting policies)
Low risk, high value
The carrying value of the Parent Company’s investment in subsidiaries represents 55 per cent of the company’s total assets. Recoverability of the investment is not considered a high risk of signifi cant misstatement or subject to signifi cant judgement. However, due to the materiality of the investment in the context of the parent company fi nancial statements, this is considered to be the area that had the greatest focus of our overall parent company audit.
Our procedures included:
Tests of detail: Comparing the carrying amount of a sample of the highest value investments, representing 99 per cent of the total investment balance with the relevant subsidiaries’ draft balance sheet to identify whether their net assets, being an approximation of their minimum recoverable amount, were in excess of their carrying amount and assessing whether those subsidiaries have historically been profi t-making.
Assessing subsidiary audits: We assessed the work performed by the subsidiary audit team on that sample of those subsidiaries and considered the results of that work, on those subsidiaries’ profi ts and net assets.
Our results: We considered the Company’s assessment of the recoverability of the investment in subsidiaries to be acceptable.

197
Ris
k re
vie
w a
nd
cap
ital re
vie
wS
trate
gic
rep
ort
Su
pp
lem
en
tary
info
rmatio
nF
INA
NC
IAL
ST
AT
EM
EN
TS
Dire
cto
rs’ re
po
rt
3. Our application of materiality and an overview of the scope of our audit
Materiality
Materiality for the fi nancial statements as a whole was set with reference to a benchmark of profi t before tax for the period (representing 4.1 per cent of the benchmark). The prior year materiality used 4.3 per cent of a four-year normalised average Group profi t before tax to mitigate volatility in determining our materiality. As results are less volatile, an average benchmark was no longer considered necessary.
Materiality for the Parent Company fi nancial statements as a whole was set at $100 million (2016: $150 million), determined with reference to a benchmark of net assets, of which it represents 0.4 per cent (2016: 0.5 per cent).
We agreed to report to the Audit Committee any corrected or uncorrected identifi ed misstatements affecting Group profi t and loss or Group shareholders’ funds exceeding $5 million (2016: $7.5 million) and affecting Group assets or liabilities exceeding $50 million (2016: $75 million), in addition to other identifi ed misstatements that warrant reporting on qualitative grounds.
The Group team instructed component and hub auditors as to the signifi cant areas to be covered, including the relevant risks and the information to be reported to the Group team. The Group team approved the component materiality levels, which ranged from $1 million to $40 million, having regard to the size and risk profi le of the components.
Group profit before tax
£100m
Whole financial statements materiality
(2016: $150m)
£40m
Range of materiality at 35 components
($1m to $40m) (2016: $1m to $40m)
£5m
Misstatements reported to the audit
committee (2016: $7.5m)
$2.4bn (2016: $3.5bn)
Group materiality
$100m (2016: $150m)
Scope – general
The scoping of our audit is focused on those components which are either individually signifi cant or contain signifi cant risks. Components subject to specifi ed audit procedures (as shown in the table below) were not individually fi nancially signifi cant to require an audit for Group reporting purposes, but were either scoped on the basis of the signifi cant volume of liquid assets and transactions processed in those components or contained signifi cant risks which were covered centrally. Additionally we continued to scope specifi ed audit procedures on one of the Group joint ventures, which had high levels of credit impairment in the previous year. All central processing hubs (shared service centres) where in-scope fi nancial reporting processes are performed were subject to specifi ed audit procedures, primarily over transaction processing and IT controls.
2017 2016
Total Group components1 172 178
– Subject to full scope audit 35 35
– Subject to specifi ed procedures 4 4
Hubs subject to specifi ed audit procedures 8 8
1 Component defi ned as a reporting component within the Group’s consolidation
system, typically these are a branch or subsidiary of the Group.
Group profit before tax1 %
88%(2016: 92%)
87
83
9
811
12
2017 2016
Full scope for group audit purposes
Specified risk-focused audit procedures
Residual components
Group total assets %
98%(2016: 95%)
88
82
135
102
1 Calculation used absolute profi t before tax. Specifi ed risk focused audit procedures
coverage was calculated using absolute income and expense.
Scope – disclosure of IFRS 9 effect
The Group is adopting IFRS 9 Financial Instruments from 1 January 2018 and have included an estimate of the fi nancial impact of the change in accounting standard in accordance with IAS 8 Changes in Accounting Estimates and Errors as set out in note 41. This disclosure notes that the Group continues to refi ne its expected credit loss model and embed its operational processes which may change the actual impact on adoption. While further testing of the fi nancial impact will be performed as part of our 2018 year end audit, we have performed suffi cient audit procedures for the purposes of assessing the disclosures made in accordance with IAS 8. Specifi cally we have:
Considered the appropriateness of key technical decisions, judgements, assumptions and elections made by management
Considered key Classifi cation and Measurement decisions, including Business Model Assessments and Solely Payment of Principal and Interest (SPPI) outcomes
Involved credit risk modelling and economic specialists in the consideration of credit risk modelling decisions and macroeconomic variables, including forward economic guidance and generation of multiple economic scenarios
Considered transitional controls and governance processes related to the approval of the estimated transitional impact
Team structure
As part of determining the scope and preparing the audit plan and strategy, the Group team led a global planning conference to discuss key audit risks and obtain input from component and hub teams.
Aside from the audit of the parent company, consolidation, valuation of fi nancial instruments, collective impairment provision methodology, goodwill impairment, material litigation and regulatory provisions, US deferred tax asset and IAS 8 disclosures in relation to IFRS 9, all audit work was performed by component or hub auditors.
Further, the Group team visited 8 (2016: 11) component and hub locations, including China, Hong Kong, India, Bangladesh, Singapore, South Korea, Malaysia and US. At these visits and meetings, the fi ndings reported to the Group team and any further work required by the Group team were discussed in more detail. Regular conference calls were also held with these component auditors and the majority of the other countries that were not physically visited.
The Group team inspected the component team’s key work papers related to the signifi cant risks and assessed the appropriateness of conclusions and the consistency between reported fi ndings and work performed.
Standard Chartered
Annual Report 2017 198
FINANCIAL STATEMENTS Independent auditor’s report
4. We have nothing to report on going concern
We are required to report to you if:
we have anything material to add or draw attention to in relation to the directors’ statement in note 1 to the fi nancial statements on the use of the going concern basis of accounting with no material uncertainties that may cast signifi cant doubt over the Group and Company’s use of that basis for a period of at least twelve months from the date of approval of the fi nancial statements; or
the related statement under the Listing Rules is materially inconsistent with our audit knowledge.
We have nothing to report in these respects.
5. We have nothing to report on the other information in the Annual Report
The directors are responsible for the other information presented in the Annual Report together with the fi nancial statements. Our opinion on the fi nancial statements does not cover the other information and, accordingly, we do not express an audit opinion or, except as explicitly stated below, any form of assurance conclusion thereon.
Our responsibility is to read the other information and, in doing so, consider whether, based on our fi nancial statements audit work, the information therein is materially misstated or inconsistent with the fi nancial statements or our audit knowledge. Based solely on that work we have not identifi ed material misstatements in the other information.
Strategic report and directors’ report
Based solely on our work on the other information:
we have not identifi ed material misstatements in the strategic report and the directors’ report;
in our opinion the information given in those reports for the fi nancial year is consistent with the fi nancial statements; and
in our opinion those reports have been prepared in accordance with the Companies Act 2006.
Directors’ remuneration report
In our opinion the part of the Directors’ Remuneration Report to be audited has been properly prepared in accordance with the Companies Act 2006.
Disclosures of principal risks and longer-term viability
Based on the knowledge we acquired during our fi nancial statements audit, we have nothing material to add or draw attention to in relation to:
the directors’ confi rmation within the Viability statement on page 43 that they have carried out a robust assessment of the principal risks facing the Group, including those that would threaten its business model, future performance, solvency and liquidity;
the Principal Risks disclosures describing these risks and explaining how they are being managed and mitigated; and
the directors’ explanation in the Viability statement of how they have assessed the prospects of the Group, over what period they have done so and why they considered that period to be appropriate, and their statement as to whether they have a reasonable expectation that the Group will be able to continue in operation and meet its liabilities as they fall due over the period of their assessment, including any related disclosures drawing attention to any necessary qualifi cations or assumptions.
Under the Listing Rules we are required to review the directors’ viability statement. We have nothing to report in this respect.
Corporate governance disclosures
We are required to report to you if:
we have identifi ed material inconsistencies between the knowledge we acquired during our fi nancial statements audit and the directors’ statement that they consider that the annual report and fi nancial statements taken as a whole is fair, balanced and understandable and provides the information necessary for shareholders to assess the Group’s position and performance, business model and strategy; or
the section of the annual report describing the work of the Audit Committee does not appropriately address matters communicated by us to the Audit Committee.
We are required to report to you if the Corporate Governance Statement does not properly disclose a departure from the eleven provisions of the UK Corporate Governance Code specifi ed by the Listing Rules for our review.
We have nothing to report in these respects.
6. We have nothing to report on the other matters on which we are required to report by exception
Under the Companies Act 2006, we are required to report to you if, in our opinion:
adequate accounting records have not been kept by the parent Company, or returns adequate for our audit have not been received from branches not visited by us; or
the parent Company fi nancial statements and the part of the Directors’ Remuneration Report to be audited are not in agreement with the accounting records and returns; or
certain disclosures of directors’ remuneration specifi ed by law are not made; or
we have not received all the information and explanations we require for our audit.
We have nothing to report in these respects.
7. Respective responsibilities
Directors’ responsibilities
As explained more fully in their statement set out on page 115, the directors are responsible for: the preparation of the fi nancial statements including being satisfi ed that they give a true and fair view; such internal control as they determine is necessary to enable the preparation of fi nancial statements that are free from material misstatement, whether due to fraud or error; assessing the Group and parent Company’s ability to continue as a going concern, disclosing, as applicable, matters related to going concern; and using the going concern basis of accounting unless they either intend to liquidate the Group or the parent Company or to cease operations, or have no realistic alternative but to do so.
Auditor’s responsibilities
Our objectives are to obtain reasonable assurance about whether the fi nancial statements as a whole are free from material misstatement, whether due to fraud or other irregularities (see below), or error, and to issue our opinion in an auditor’s report. Reasonable assurance is a high level of assurance, but does not guarantee that an audit conducted in accordance with ISAs (UK) will always detect a material misstatement when it exists. Misstatements can arise from fraud, other irregularities or error and are considered material if, individually or in aggregate, they could reasonably be expected to infl uence the economic decisions of users taken on the basis of the fi nancial statements.
A fuller description of our responsibilities is provided on the FRC’s website at
www.frc.org.uk/auditorsresponsibilities

199
Ris
k re
vie
w a
nd
cap
ital re
vie
wS
trate
gic
rep
ort
Su
pp
lem
en
tary
info
rmatio
nF
INA
NC
IAL
ST
AT
EM
EN
TS
Dire
cto
rs’ re
po
rt
Irregularities – ability to detect
We identifi ed relevant areas of laws and regulations from our sector experience, through discussion with the directors and other management (as required by auditing standards), and from inspection of the Group’s regulatory correspondence.
We had regard to laws and regulations in areas that directly affect the fi nancial statements including fi nancial reporting (including related company legislation) and taxation legislation. We considered the extent of compliance with those laws and regulations as part of our procedures on the related annual accounts items.
In addition we considered the impact of laws and regulations in the specifi c areas of regulatory capital and liquidity, conduct and fi nancial crime including money laundering, sanctions list and market abuse regulations recognising the fi nancial and regulated nature of the Groups activities. With the exception of any known or possible non-compliance, and as required by auditing standards, our work in respect of these was limited to enquiry of the directors and other management and inspection of regulatory correspondence. We considered the effect of any known or possible non-compliance in these areas as part of our procedures on the related annual accounts items. Further detail in respect of legal and regulatory matters is set out in the key audit matter disclosures in section 2 of this report.
We communicated identifi ed laws and regulations throughout our team and remained alert to any indications of non-compliance throughout the audit. This included communication from the group to component audit teams of relevant laws and regulations identifi ed at Group level, with a request to report on any indications of potential existence of irregularities in these areas, or other areas directly identifi ed by the component team.
As with any audit, there remained a higher risk of non-detection of irregularities, as these may involve collusion, forgery, intentional omissions, misrepresentations, or the override of internal controls.
8. The purpose of our audit work and to whom we owe our responsibilities
This report is made solely to the Company’s members, as a body, in accordance with Chapter 3 of Part 16 of the Companies Act 2006. Our audit work has been undertaken so that we might state to the Company’s members those matters we are required to state to them in an auditor’s report and for no other purpose. To the fullest extent permitted by law, we do not accept or assume responsibility to anyone other than the Company and the Company’s members, as a body, for our audit work, for this report, or for the opinions we have formed.
Michelle HinchliffeSenior Statutory Auditorfor and on behalf of KPMG LLP, Statutory Auditor Chartered Accountants15 Canada SquareLondon E14 5GL
27 February 2018

Standard Chartered
Annual Report 2017 200
FINANCIAL STATEMENTS Financial statements
Notes
2017
$million
2016
$million
Interest income 14,435 13,010
Interest expense (6,254) (5,216)
Net interest income 3 8,181 7,794
Fees and commission income 3,942 3,671
Fees and commission expense (430) (440)
Net fee and commission income 4 3,512 3,231
Net trading income 5 1,527 1,886
Other operating income 6 1,205 1,149
Operating income 14,425 14,060
Staff costs (6,758) (6,303)
Premises costs (823) (797)
General administrative expenses (2,007) (2,372)
Depreciation and amortisation (829) (739)
Operating expenses 7 (10,417) (10,211)
Operating profi t before impairment losses and taxation 4,008 3,849
Impairment losses on loans and advances and other credit risk provisions 8 (1,362) (2,791)
Other impairment
Goodwill 9 (320) (166)
Other 9 (179) (446)
Profi t/(loss) from associates and joint ventures 32 268 (37)
Profi t before taxation 2,415 409
Taxation 10 (1,147) (600)
Profi t/(loss) for the year 1,268 (191)
Profi t/(loss) attributable to:
Non-controlling interests 29 49 56
Parent company shareholders 1,219 (247)
Profi t/(loss) for the year 1,268 (191)
cents cents
Earnings per share:
Basic earnings/(loss) per ordinary share 12 23.5 (14.5)
Diluted earnings/(loss) per ordinary share 12 23.3 (14.5)
The notes on pages 208 to 307 form an integral part of these fi nancial statements.
Consolidated income statementFor the year ended 31 December 2017

201
Ris
k re
vie
w a
nd
cap
ital re
vie
wS
trate
gic
rep
ort
Su
pp
lem
en
tary
info
rmatio
nF
INA
NC
IAL
ST
AT
EM
EN
TS
Dire
cto
rs’ re
po
rt
Notes
2017
$million
2016
$million
Profi t/(loss) for the year 1,268 (191)
Other comprehensive income/(loss)
Items that will not be reclassifi ed to income statement: (238) (445)
Own credit losses on fi nancial liabilities designated at fair value through profi t or loss (249) (372)
Actuarial gains/(losses) on retirement benefi t obligations 30 32 (105)
Taxation relating to components of other comprehensive income 10 (21) 32
Items that may be reclassifi ed subsequently to income statement: 1,532 (968)
Exchange differences on translation of foreign operations:
Net gains/(losses) taken to equity 1,637 (817)
Net (losses)/gains on net investment hedges (288) 30
Share of other comprehensive loss from associates and joint ventures (1) (11)
Available-for-sale investments:
Net valuation gains taken to equity 369 48
Reclassifi ed to income statement (233) (188)
Cash fl ow hedges:
Net gains/(losses) taken to equity 35 (79)
Reclassifi ed to income statement 14 11 57
Taxation relating to components of other comprehensive income 10 2 (8)
Other comprehensive income/(loss) for the year, net of taxation 1,294 (1,413)
Total comprehensive income/(loss) for the year 2,562 (1,604)
Total comprehensive income/(loss) attributable to:
Non-controlling interests 29 50 45
Parent company shareholders 2,512 (1,649)
2,562 (1,604)
Consolidated statement of comprehensive incomeFor the year ended 31 December 2017

Standard Chartered
Annual Report 2017 202
FINANCIAL STATEMENTS Financial statements
Notes
2017
$million
2016
$million
Assets
Cash and balances at central banks 13,35 58,864 70,706
Financial assets held at fair value through profi t or loss 13 27,564 20,077
Derivative fi nancial instruments 13,14 47,031 65,509
Loans and advances to banks 13 57,494 54,538
Loans and advances to customers 13 248,707 226,693
Reverse repurchase agreements and other similar secured lending 13,17 54,275 44,097
Investment securities 13,15 117,025 108,972
Other assets 21 33,490 36,940
Current tax assets 10 491 474
Prepayments and accrued income 2,307 2,238
Interests in associates and joint ventures 32 2,307 1,929
Goodwill and intangible assets 18 5,013 4,719
Property, plant and equipment 19 7,211 7,252
Deferred tax assets 10 1,177 1,294
Assets classifi ed as held for sale 21 545 1,254
Total assets 663,501 646,692
Liabilities
Deposits by banks 13 30,945 32,872
Customer accounts 13 370,509 338,185
Repurchase agreements and other similar secured borrowing 13,17 39,783 37,692
Financial liabilities held at fair value through profi t or loss 13 16,633 16,598
Derivative fi nancial instruments 13,14 48,101 65,712
Debt securities in issue 13,22 46,379 46,700
Other liabilities 23 35,257 33,146
Current tax liabilities 10 376 327
Accruals and deferred income 5,493 5,223
Subordinated liabilities and other borrowed funds 13,27 17,176 19,523
Deferred tax liabilities 10 404 353
Provisions for liabilities and charges 24 183 213
Retirement benefi t obligations 30 455 525
Liabilities included in disposal groups held for sale 23 – 965
Total liabilities 611,694 598,034
Equity
Share capital and share premium account 28 7,097 7,091
Other reserves 12,767 11,524
Retained earnings 26,641 25,753
Total parent company shareholders’ equity 46,505 44,368
Other equity instruments 28 4,961 3,969
Total equity excluding non-controlling interests 51,466 48,337
Non-controlling interests 29 341 321
Total equity 51,807 48,658
Total equity and liabilities 663,501 646,692
The notes on pages 208 to 307 form an integral part of these fi nancial statements.
These fi nancial statements were approved by the Board of directors and authorised for issue on 27 February 2018 and signed on its behalf by:
José Viñals Bill Winters Andy HalfordGroup Chairman Group Chief Executive Group Chief Financial Offi cer
Consolidated balance sheetAs at 31 December 2017

203
Ris
k re
vie
w a
nd
cap
ital re
vie
wS
trate
gic
rep
ort
Su
pp
lem
en
tary
info
rmatio
nF
INA
NC
IAL
ST
AT
EM
EN
TS
Dire
cto
rs’ re
po
rt
Share
capital
and share
premium
account
$million
Capital and
merger
reserves1
$million
Own credit
adjustment
reserve
$million
Available-
for-sale
reserve
$million
Cash fl ow
hedge
reserve
$million
Translation
reserve
$million
Retained
earnings
$million
Parent
company
shareholders’
equity
$million
Other
equity
instruments
$million
Non-
controlling
interests
$million
Total
$million
At 1 January 2016 7,088 17,122 – 132 (46) (5,026) 26,934 46,204 1,987 321 48,512
Transfer of own credit adjustment, net of taxation2 – – 631 – – – (631) – – – –
(Loss)/profi t for the year – – – – – – (247) (247) – 56 (191)
Other comprehensive loss – – (342) (136) (39) (779) (106)3 (1,402) – (11) (1,413)
Distributions – – – – – – – – – (37) (37)
Shares issued, net of expenses 3 7 – – – – – 10 – – 10
Other equity instruments issued, net of expenses – – – – – – – – 1,982 – 1,982
Net own shares adjustment – – – – – – (46) (46) – – (46)
Share option expense, net of taxation – – – – – – 80 80 – – 80
Dividends4 – – – – – – (231) (231) – – (231)
Other movements5 – – – – – – – – – (8) (8)
As at 31 December 2016 7,091 17,129 289 (4) (85) (5,805) 25,753 44,368 3,969 321 48,658
Profi t for the year – – – – – – 1,219 1,219 – 49 1,268
Other comprehensive (loss)/income – – (235) 87 40 1,351 503 1,293 – 1 1,294
Distributions – – – – – – – – – (51) (51)
Shares issued, net of expenses 6 – – – – – – 6 – – 6
Other equity instruments issued, net of expenses – – – – – – – – 992 – 992
Net own shares adjustment – – – – – – 10 10 – – 10
Share option expense, net of taxation – – – – – – 125 125 – – 125
Dividends4 – – – – – – (445) (445) – – (445)
Other movements6 – – – – – – (71) (71) – 21 (50)
As at 31 December 2017 7,097 17,129 54 83 (45) (4,454) 26,641 46,505 4,961 341 51,807
1 Includes capital reserve of $5 million, capital redemption reserve of $13 million and merger reserve of $17,111 million
2 The Group early adopted IFRS 9 Financial Instruments to present own credit adjustments within Other comprehensive income (rather than Net trading income)
3 Comprises actuarial gain/(loss), net of taxation and share from associates and joint ventures $50 million (2016: $(106) million)
4 Comprises of dividends on preferences shares classifi ed as equity and Additional Tier 1 securities $445 million (2016: $231 million)
5 Mainly due to completion of sale of businesses with non-controlling interest in Pakistan and issuance of shares to non-controlling interest in Angola
6 Mainly due to additional share capital issued including the premium by Nepal to its non-controlling interests of $31 million, non-controlling interest with respect to an acquisition during
2017 of $9 million and offset by other equity adjustments of $90 million
Note 28 includes a description of each reserve.
The notes on pages 208 to 307 form an integral part of these fi nancial statements.
Consolidated statement of changes in equityFor the year ended 31 December 2017

Standard Chartered
Annual Report 2017 204
FINANCIAL STATEMENTS Financial statements
Notes
Group Company
2017
$million
2016
$million
2017
$million
2016
$million
Cash fl ows from operating activities:
Profi t before taxation 2,415 409 207 192
Adjustments for non-cash items and other adjustments included within income statement 34 3,241 4,615 615 703
Change in operating assets 34 (13,625) (8,286) 459 110
Change in operating liabilities 34 5,819 13,080 575 (619)
Contributions to defi ned benefi t schemes 30 (143) (98) – –
UK and overseas taxes paid 10 (915) (1,287) (14) (12)
Net cash (used in)/from operating activities (3,208) 8,433 1,842 374
Cash fl ows from investing activities:
Purchase of property, plant and equipment 19 (165) (195) – –
Disposal of property, plant and equipment 29 23 – –
Acquisition of investment in subsidiaries, associates, and joint ventures, net of cash acquired 32 (44) (238) (1,000) (5,500)
Dividends received from subsidiaries, associates and joint ventures 32 2 3 392 204
Disposal of subsidiaries – 636 – –
Purchase of investment securities 15 (265,186) (207,274) – (4,000)
Disposal and maturity of investment securities 261,316 210,857 2,850 1,300
Net cash (used in)/from investing activities (4,048) 3,812 2,242 (7,996)
Cash fl ows from fi nancing activities:
Issue of ordinary and preference share capital, net of expenses 28 6 10 6 10
Exercise of share options 10 5 10 5
Purchase of own shares – (51) – (51)
Issue of Additional Tier 1 capital, net of expenses 28 992 1,982 992 1,982
Gross proceeds from issue of subordinated liabilities 34 – 1,250 – 1,250
Interest paid on subordinated liabilities 34 (743) (920) (353) (604)
Repayment of subordinated liabilities 34 (2,984) (2,666) (1,249) (105)
Proceeds from issue of senior debts 34 2,292 5,453 1,501 4,385
Repayment of senior debts 34 (4,162) (6,470) (3,237) (3,941)
Interest paid on senior debts 34 (896) (454) (825) (365)
Investment from/(repayment to) non–controlling interests 21 (8) – –
Dividends paid to non-controlling interests and preference shareholders (496) (268) (445) (231)
Net cash (used in)/from fi nancing activities (5,960) (2,137) (3,600) 2,335
Net (decrease)/increase in cash and cash equivalents (13,216) 10,108 484 (5,287)
Cash and cash equivalents at beginning of the year 96,977 88,428 15,230 20,517
Effect of exchange rate movements on cash and cash equivalents 3,470 (1,559) – –
Cash and cash equivalents at end of the year 35 87,231 96,977 15,714 15,230
The notes on pages 208 to 307 form an integral part of these fi nancial statements.
Cash fl ow statementFor the year ended 31 December 2017

205
Ris
k re
vie
w a
nd
cap
ital re
vie
wS
trate
gic
rep
ort
Su
pp
lem
en
tary
info
rmatio
nF
INA
NC
IAL
ST
AT
EM
EN
TS
Dire
cto
rs’ re
po
rt
Notes
2017
$million
2016
$million
Non-current assets
Investments in subsidiary undertakings 32 34,853 33,853
Current assets
Derivative fi nancial instruments 36, 39 70 529
Investment securities 39 12,159 15,009
Amounts owed by subsidiary undertakings 39 15,714 15,230
Taxation 3 –
27,946 30,768
Current liabilities
Derivative fi nancial instruments 39 492 1,541
Other creditors 405 399
Taxation – 14
897 1,954
Net current assets 27,049 28,814
Total assets less current liabilities 61,902 62,667
Non–current liabilities
Debt securities in issue 39 16,169 17,132
Subordinated liabilities and other borrowed funds 27, 39 13,882 14,582
30,051 31,714
Total assets less liabilities 31,851 30,953
Equity
Share capital and share premium account 28 7,097 7,091
Other reserves 17,129 17,129
Retained earnings 2,664 2,764
Total shareholders’ equity 26,890 26,984
Other equity instruments 28 4,961 3,969
Total equity 31,851 30,953
The Company has taken advantage of the exemption in section 408 of the Companies Act 2006 not to present its individual statement of comprehensive income and related notes that form a part of these fi nancial statements. The Company profi t for the year after tax is $210 million (2016: $189 million).
The notes on pages 208 to 307 form an integral part of these fi nancial statements.
These fi nancial statements were approved by the Board of directors and authorised for issue on 27 February 2018 and signed on its behalf by:
José Viñals Bill Winters Andy HalfordGroup Chairman Group Chief Executive Group Chief Financial Offi cer
Company balance sheet As at 31 December 2017

Standard Chartered
Annual Report 2017 206
FINANCIAL STATEMENTS Financial statements
Share capital and
share premium
account
$million
Capital
and merger
reserve1
$million
Retained
earnings
$million
Other equity
instruments
$million
Total
$million
At 1 January 2016 7,088 17,122 2,772 1,987 28,969
Profi t for the year – – 189 – 189
Shares issued, net of expenses 3 7 – – 10
Other equity instruments issued, net of expenses – – – 1,982 1,982
Net own shares adjustment – – (46) – (46)
Share option expense – – 80 – 80
Dividends2 – – (231) – (231)
At 31 December 2016 7,091 17,129 2,764 3,969 30,953
Profi t for the year – – 210 – 210
Shares issued, net of expenses 6 – – – 6
Other equity instruments issued, net of expenses – – – 992 992
Net own shares adjustment – – 10 – 10
Share option expense – – 125 – 125
Dividends2 – – (445) – (445)
At 31 December 2017 7,097 17,129 2,664 4,961 31,851
1 Includes capital reserve of $5 million, capital redemption reserve of $13 million and merger reserve of $17,111 million
2 Comprises dividends on preference shares classifi ed as equity and Additional Tier 1 securities $445 million (2016: $231 million)
Note 28 includes a description of each reserve.
The notes on pages 208 to 307 form an integral part of these fi nancial statements.
Company statement of changes in equity For the year ended 31 December 2017

207
Ris
k re
vie
w a
nd
cap
ital re
vie
wS
trate
gic
rep
ort
Su
pp
lem
en
tary
info
rmatio
nF
INA
NC
IAL
ST
AT
EM
EN
TS
Dire
cto
rs’ re
po
rt
Contents – Notes to the fi nancial statements
Section Note Page
Basis of preparation 1 Accounting policies 208
Performance/return 2 Segmental information 210
3 Net interest income 215
4 Net fees and commission 216
5 Net trading income 216
6 Other operating income 217
7 Operating expenses 217
8 Impairment losses on loans and advances and other credit risk provisions 218
9 Other impairment 221
10 Taxation 222
11 Dividends 226
12 Earnings per ordinary share 227
Assets and liabilities held at fair value 13 Financial instruments 227
14 Derivatives fi nancial instruments 245
15 Investment securities 248
Financial instruments held at amortised cost 16 Loans and advances to banks and customers 249
17 Reverse repurchase and repurchase agreements including other similar secured lending and borrowing 250
Other assets and investments 18 Goodwill and intangible assets 251
19 Property, plant and equipment 254
20 Operating lease commitments 255
21 Other assets 256
Funding, accruals, provisions, contingent liabilities and legal and regulatory matters
22 Debt securities in issue 257
23 Other liabilities 257
24 Provisions for liabilities and charges 258
25 Contingent liabilities and commitments 258
26 Legal and regulatory matters 259
Capital instruments, equity and reserves 27 Subordinated liabilities and other borrowed funds 261
28 Share capital, other equity instruments and reserves 262
29 Non-controlling interests 264
Employee benefi ts 30 Retirement benefi t obligations 265
31 Share-based payments 270
Scope of consolidation 32 Investment in subsidiary undertakings, joint ventures and associates 274
33 Structured entities 278
Cash fl ow statement 34 Cash fl ow statement 280
35 Cash and cash equivalents 281
Other disclosure matters 36 Related party transactions 282
37 Post balance sheet events 283
38 Auditor’s remuneration 283
39 Standard Chartered PLC (Company) 284
40 Related undertakings of the Group 286
41 IFRS 9 Financial Instruments 304
Standard Chartered
Annual Report 2017 208
FINANCIAL STATEMENTSNotes to the fi nancial statements
1. Accounting policies
Statement of compliance
The Group fi nancial statements consolidate Standard Chartered PLC (the Company) and its subsidiaries (together referred to as the Group) and equity account the Group’s interest in associates and jointly controlled entities.
The parent company fi nancial statements present information about the Company as a separate entity.
Both the parent company fi nancial statements and the Group fi nancial statements have been prepared and approved by the directors in accordance with International Financial Reporting Standards (IFRS) and IFRS Interpretations Committee interpretations as endorsed by the European Union (EU). EU-endorsed IFRS may differ from IFRS published by the International Accounting Standards Board (IASB) if a standard has not been endorsed by the EU.
The Company has taken advantage of the exemption in section 408 of the Companies Act 2006 not to present its individual statement of comprehensive income and related notes that form a part of these fi nancial statements.
The following parts of the Risk review and Capital review form part of these fi nancial statements:
a) From the start of Risk profi le section (page 122) to the end of Top risks and emerging risks in the same section (page 159) excluding:
Asset backed securities (page 145)
Country risk (page 146)
Market risk changes – risks not in value at risk (page 148)
Market risk changes – backtesting (page 148)
Mapping of market risk items to the balance sheet (page 149)
Stressed coverage and liquidity coverage ratio (page 151)
Net stable funding ratio (page 152)
Liquidity pool (page 152)
Encumbrance (page 153 to 154)
Earnings sensitivity (page 157)
Operational risk (page 158)
b) From the start of Principal risks (page 165) to the end of Capital and Liquidity risk (page 172), excluding Country risk (page 168)
c) From the start of the CRD IV capital base section (page 185) to the end of Movement in total capital section (page 186)
Basis of preparation
The consolidated and Company fi nancial statements have been prepared on a going concern basis and under the historical cost convention, as modifi ed by the revaluation of cash-settled share-based payments, available-for-sale assets, and fi nancial assets and liabilities (including derivatives) at fair value through profi t or loss.
Signifi cant accounting estimates and judgements
In determining the carrying amounts of certain assets and liabilities, the Group makes assumptions of the effects of uncertain future events on those assets and liabilities at the balance sheet date. The Group’s estimates and assumptions are based on historical experience and expectation of future events and are reviewed periodically. Further information about key assumptions concerning the future, and other key sources of estimation uncertainty and judgement, are set out in the relevant disclosure notes for the following areas:
Impairment of loans and advances (note 8)
Taxation (note 10)
Valuation of fi nancial instruments held at fair value (note 13)
Goodwill impairment (note 18)
Provisions for liabilities and charges (note 24)
Retirement benefi t obligations (note 30)
Investments in associates and joint ventures (note 32)
Notes to the fi nancial statements

209
Ris
k re
vie
w a
nd
cap
ital re
vie
wS
trate
gic
rep
ort
Su
pp
lem
en
tary
info
rmatio
nF
INA
NC
IAL
ST
AT
EM
EN
TS
Dire
cto
rs’ re
po
rt
1. Accounting policies continued
IFRS and Hong Kong accounting requirements
As required by the Hong Kong Listing Rules, an explanation of the differences in accounting practices between EU-endorsed IFRS and Hong Kong Financial Reporting Standards is required to be disclosed. There would be no signifi cant differences had these accounts been prepared in accordance with Hong Kong Financial Reporting Standards.
Comparatives
Certain comparatives have been changed to comply with current year disclosures.
Reverse repurchase and repurchase agreements including other similar secured lending and borrowing have been separated from loans and advances to banks and customers and deposits by banks and customer accounts on the balance sheet.
Details of these changes are set out in the relevant notes below:
Liquidity and funding risk (pages 150 to 152)
Note 13 Financial instruments
Note 15 Investment securities
Note 18 Goodwill and intangible assets
Note 25 Contingent liabilities and commitments
Note 27 Subordinated liabilities and other borrowed funds
Note 33 Structured entities
These changes have not resulted in any amendments to the reported income statement or balance sheet of the Group.
New accounting standards adopted by the Group
There were no new standards applied during the year ended 31 December 2017.
The accounting policies used by the Group are detailed in the relevant note to the fi nancial statements, except those set out below. All have been applied consistently across the Group and to all years presented in these fi nancial statements.
Foreign currencies
Items included in the Group fi nancial statements for each of the Group’s entities are measured using the currency of the primary economic environment in which the entity operates (the functional currency of that entity). Both the Group and Company fi nancial statements are presented in millions of US dollars ($ million), which is the functional and presentation currency of the Company and the presentation currency of the Group.
Transactions and balances
Foreign currency transactions are translated into the functional currency using the exchange rates prevailing at the transaction date. Foreign exchange gains and losses resulting from the settlement of such transactions, and from the translation at year-end exchange rates of monetary assets and liabilities denominated in foreign currencies, are recognised in the income statement. Non-monetary assets and liabilities are translated at historical exchange rates if held at historical cost, or year-end exchange rates if held at fair value, and the resulting foreign exchange gains and losses are recognised in either the income statement or shareholders’ equity depending on the treatment of the gain or loss on the asset or liability.
Foreign currency translation
The results and fi nancial position of all the entities included in the Group fi nancial statements that have a functional currency different from the Group’s presentation currency are accounted for as follows:
Assets and liabilities for each balance sheet presented are translated at the closing rate at the balance sheet date
Income and expenses for each income statement are translated at average exchange rates or at rates on the date of the transaction where exchange rates fl uctuate signifi cantly
All resulting exchange differences arising since 1 January 2004 are recognised as a separate component of equity
On consolidation, exchange differences arising from the translation of the net investment in foreign entities, and of borrowings and other currency instruments designated as hedges of such investments, are taken to other comprehensive income. When a foreign operation is sold or capital repatriated they are recognised in the income statement as part of the gain or loss on disposal. Goodwill and fair value adjustments arising on the acquisition of a foreign entity are treated as assets and liabilities of the foreign entity and translated at the closing rate.
New accounting standards in issue but not yet effective
The following new standards are effective for periods beginning on or after 1 January 2018 and have not been applied in preparing these consolidated fi nancial statements:
IFRS 9 Financial Instruments
IFRS 9 was issued in July 2014 and has an effective date of 1 January 2018. It was endorsed by the EU in November 2016.
In October 2017, the IASB published an amendment to IFRS 9, Prepayment Features with Negative Compensation, which is effective from 1 January 2019, with earlier application permitted.

Standard Chartered
Annual Report 2017 210
FINANCIAL STATEMENTSNotes to the fi nancial statements
1. Accounting policies continued
This has not yet been endorsed by the EU. The amendment amends the existing requirements regarding termination rights in order to allow measurement at amortised cost (or fair value through OCI) even in the case of negative compensation payments. This is consistent with Management’s treatment of these clauses.
IFRS 9 replaces IAS 39 Financial Instruments: Recognition and Measurement, introducing new requirements for the classifi cation and measurement of fi nancial instruments, the recognition and measurement of credit impairment provisions, and providing for a simplifi ed approach to hedge accounting. The Group has elected to continue hedge accounting in line with the IAS 39 requirements and has not therefore applied the IFRS 9 hedging requirements. The Group will, however, adopt these revised disclosures set out in IFRS 7, which includes those relating to hedge accounting. The changes in measurement arising on initial application of IFRS 9 will be incorporated through an adjustment to the opening reserves and retained earnings position as at 1 January 2018.
Although IFRS 9 will be retrospectively applied, the Group is only permitted to restate comparatives if, and only if, it is possible without the use of hindsight.
The Group does not consider it possible to restate comparatives for impairment without the use of hindsight. For further details on the effect and implementation of IFRS 9 refer to note 41.
IFRS 15 Revenue from Contracts with Customers
The effective date of IFRS 15 is 1 January 2018 and the standard has been endorsed by the EU in September 2016. The standard
provides a more detailed principles-based approach for income recognition than the current standard IAS 18 Revenue, with revenue being recognised as or when promised services are transferred to customers. The standard applies to ‘fees and commission income’ but not to fi nancial instruments or lease contracts. IFRS 15 will not have a material impact on the Group’s consolidated fi nancial statements and there will not be an adjustment to retained earnings in respect of adoption.
IFRS 16 Leases
The effective date of IFRS 16 is 1 January 2019 and the standard was endorsed by the EU in November 2017. IFRS 16 introduces a single lessee accounting model and requires a lessee to recognise assets and liabilities for all leases with a term of more than 12 months, unless the underlying asset is of low value. A lessee is required to recognise a right-of-use asset representing its right to use the underlying leased asset and a lease liability representing its obligation to make lease payments. IFRS 16 substantially carries forward the lessor accounting requirements in IAS 17 Leases. Accordingly, a lessor continues to classify its leases as operating leases or fi nance leases, and to account for those two types of leases differently. The work to assess the impact of the standard is ongoing and it is not yet practicable to quantify the effect of IFRS 16 on these consolidated fi nancial statements. The Group will have a balance sheet increase in lease liabilities and right-of-use assets on adoption of IFRS 16.
2. Segmental information
The Group’s segmental reporting is in accordance with IFRS 8 Operating Segments and is reported consistently with the internal performance framework and as presented to the Group’s Management Team. The four client segments are Corporate & Institutional Banking, Retail Banking, Commercial Banking and Private Banking. The four geographic regions are Greater China & North Asia, ASEAN & South Asia, Africa & Middle East, and Europe & America. Activities not directly related to a client segment and/or geographic region are included in Central & other items. These mainly include Corporate Centre costs, Asset and Liability Management, treasury activities, certain strategic investments and the UK bank levy.
The following should also be noted:
Transactions and funding between the segments are carried out on an arm’s-length basis
Corporate Centre costs represent stewardship and central management services roles and activities that are not directly attributable to business or country operations
Asset and Liability Management, joint ventures and associate investments are managed in the regions and are included within the applicable region. However, they are not managed directly by a client segment and therefore included in the Central & other items segment
In addition to treasury activities, Corporate Centre costs and other Group related functions, Central & other items for regions includes globally run businesses or activities that are managed by the client segments but not directly by geographic management. These include Principal Finance and Portfolio Management
The Group allocated central costs (excluding Corporate Centre costs) relating to client segments and geographic regions using appropriate business drivers (such as in proportion to the direct cost base of each segment before allocation of indirect costs) and these are reported within operating expenses
An analysis of the Group’s performance by client segment and region is set out in the Strategic report (pages 18 to 26).

211
Ris
k re
vie
w a
nd
cap
ital re
vie
wS
trate
gic
rep
ort
Su
pp
lem
en
tary
info
rmatio
nF
INA
NC
IAL
ST
AT
EM
EN
TS
Dire
cto
rs’ re
po
rt
2. Segmental information continued
Basis of preparation
The analysis refl ects how the client segments and geographic regions are managed internally. This is described as the Management View and is principally the location from which a client relationship is managed, which may differ from where it is fi nancially booked and may be shared between businesses and/or regions. In certain instances this approach is not appropriate and a Financial View is disclosed, that is, the location in which the transaction or balance was booked. Typically the Financial View is used in areas such as the Market and Liquidity Risk reviews where actual booking location is more important for an assessment. Segmental information is therefore on a Management View unless otherwise stated.
Restructuring items excluded from underlying results
Income, costs and impairment relating to identifi able business units, products or portfolios from the date that have been approved for restructuring, disposal, wind down or redundancy as a consequence of the Strategy Review announced 3 November 2015 are presented as restructuring and excluded from the underlying results of the Group. This includes realised and unrealised gains and losses from management’s decisions to dispose of assets as well as residual income, direct costs and impairment of related legacy assets of those identifi able business units, products or portfolios.
A reconciliation between underlying and statutory results is set out in the table below:
2017
Underlying
$million
Restructuring
$million
Net gain on
businesses
disposed/
held for sale
$million
Goodwill
impairment
$million
Statutory
$million
Operating income 14,289 58 78 – 14,425
Operating expenses (10,120) (297) – – (10,417)
Operating profi t/(loss) before impairment losses and taxation 4,169 (239) 78 – 4,008
Impairment losses on loans and advances and other credit risk provisions (1,200) (162) – – (1,362)
Other impairment (169) (10) – (320) (499)
Profi t from associates and joint ventures 210 58 – – 268
Profi t/(loss) before taxation 3,010 (353) 78 (320) 2,415
2016
Underlying
$million
Restructuring
$million
Net gain on
businesses
disposed/
held for sale
$million
Goodwill
impairment
$million
Gains arising on
repurchase of
subordinated
liabilities
$million
Statutory
$million
Operating income 13,808 (85) 253 – 84 14,060
Operating expenses (9,975) (236) – – – (10,211)
Operating profi t/(loss) before impairment losses and taxation 3,833 (321) 253 – 84 3,849
Impairment losses on loans and advances and other credit risk provisions (2,382) (409) – – – (2,791)
Other impairment (383) (63) – (166) – (612)
Profi t from associates and joint ventures 25 (62) – – – (37)
Profi t/(loss) before taxation 1,093 (855) 253 (166) 84 409

Standard Chartered
Annual Report 2017 212
FINANCIAL STATEMENTSNotes to the fi nancial statements
2. Segmental information continued
Underlying performance by client segment2017
Corporate &
Institutional
Banking
$million
Retail
Banking
$million
Commercial
Banking
$million
Private
Banking
$million
Central &
other items
$million
Total
$million
Operating income 6,496 4,834 1,333 500 1,126 14,289
Operating expenses (4,409) (3,585) (881) (500) (745) (10,120)
Operating profi t before impairment losses and taxation 2,087 1,249 452 – 381 4,169
Impairment (losses)/release on loans and advances and other credit risk provisions (658) (375) (167) (1) 1 (1,200)
Other impairment (168) (1) (3) – 3 (169)
Profi t from associates and joint ventures – – – – 210 210
Underlying profi t/(loss) before taxation 1,261 873 282 (1) 595 3,010
Restructuring (275) (19) (13) (15) (31) (353)
Net gains on businesses disposed/held for sale – – – – 78 78
Goodwill impairment – – – – (320) (320)
Statutory profi t/(loss) before taxation 986 854 269 (16) 322 2,415
Total assets 293,334 105,178 31,650 13,469 219,870 663,501
Of which: loans and advances to customers 131,738 103,013 28,108 13,351 9,343 285,553
Total liabilities 353,582 132,819 36,385 22,203 66,705 611,694
Of which: customer accounts 222,714 129,536 33,880 22,222 3,372 411,724
2016
Corporate &
Institutional
Banking
$million
Retail
Banking
$million
Commercial
Banking
$million
Private
Banking
$million
Central &
other items
$million
Total
$million
Operating income 6,472 4,669 1,295 496 876 13,808
Operating expenses (4,268) (3,413) (929) (463) (902) (9,975)
Operating profi t/(loss) before impairment losses and taxation 2,204 1,256 366 33 (26) 3,833
Impairment losses on loans and advances and other credit risk provisions (1,401) (489) (491) (1) – (2,382)
Other impairment (368) (1) 5 – (19) (383)
Profi t from associates and joint ventures – – – – 25 25
Underlying profi t/(loss) before taxation 435 766 (120) 32 (20) 1,093
Restructuring (459) (47) (26) (73) (250) (855)
Net gains on businesses disposed/held for sale – – – – 253 253
Goodwill impairment – – – – (166) (166)
Gains arising on repurchase of subordinated liabilities – – – – 84 84
Statutory (loss)/profi t before taxation (24) 719 (146) (41) (99) 409
Total assets 289,183 96,834 27,151 11,974 221,550 646,692
Of which: loans and advances to customers 122,231 93,488 24,013 11,908 4,256 255,896
Total liabilities 347,865 121,015 35,576 21,840 71,738 598,034
Of which: customer accounts 204,279 117,355 32,570 21,767 2,331 378,302

213
Ris
k re
vie
w a
nd
cap
ital re
vie
wS
trate
gic
rep
ort
Su
pp
lem
en
tary
info
rmatio
nF
INA
NC
IAL
ST
AT
EM
EN
TS
Dire
cto
rs’ re
po
rt
2. Segmental information continued
Underlying performance by region2017
Greater China &
North Asia
$million
ASEAN &
South Asia
$million
Africa &
Middle East
$million
Europe &
Americas
$million
Central &
other items
$million
Total
$million
Operating income 5,616 3,833 2,764 1,601 475 14,289
Operating expenses (3,681) (2,654) (1,819) (1,407) (559) (10,120)
Operating profi t/(loss) before impairment losses and taxation 1,935 1,179 945 194 (84) 4,169
Impairment (losses)/release on loans and advances (141) (653) (300) (107) 1 (1,200)
Other impairment (81) (12) (3) (16) (57) (169)
Profi t/(loss) from associates and joint ventures 229 (22) – – 3 210
Underlying profi t/(loss) before taxation 1,942 492 642 71 (137) 3,010
Restructuring 35 (161) (33) (25) (169) (353)
Net gains on businesses disposed/held for sale – 19 – – 59 78
Goodwill impairment – – – – (320) (320)
Statutory profi t/(loss) before taxation 1,977 350 609 46 (567) 2,415
Net interest margin 1.4% 1.9% 3.3% 0.5% 1.6%
Total assets 257,692 148,467 59,166 185,345 12,831 663,501
Of which: loans and advances to customers 126,739 82,579 29,602 46,633 – 285,553
Total liabilities 228,093 128,165 39,413 177,525 38,498 611,694
Of which: customer accounts 186,517 95,310 31,797 98,100 – 411,724
2016
Greater China &
North Asia
$million
ASEAN &
South Asia
$million
Africa &
Middle East
$million
Europe &
Americas
$million
Central &
other items
$million
Total
$million
Operating income 5,190 4,052 2,742 1,664 160 13,808
Operating expenses (3,546) (2,518) (1,730) (1,302) (879) (9,975)
Operating profi t/(loss) before impairment losses and taxation 1,644 1,534 1,012 362 (719) 3,833
Impairment losses on loans and advances and other credit risk provisions (424) (762) (563) (511) (122) (2,382)
Other impairment (47) 3 (18) 1 (322) (383)
Profi t/(loss) from associates and joint ventures 167 (146) – – 4 25
Underlying profi t/(loss) before taxation 1,340 629 431 (148) (1,159) 1,093
Restructuring (137) (443) (82) (113) (80) (855)
Net gains on businesses disposed/held for sale 253 – – – – 253
Goodwill impairment – – – – (166) (166)
Gains arising on repurchase of subordinated liabilities – – – – 84 84
Statutory profi t/(loss) before taxation 1,456 186 349 (261) (1,321) 409
Net interest margins 1.3% 2.0% 3.2% 0.5% 1.5%
Total assets 239,740 143,704 56,980 195,937 10,331 646,692
Of which: loans and advances to customers 110,533 73,161 28,140 44,062 – 255,896
Total liabilities 210,795 126,701 38,020 181,639 40,879 598,034
Of which: customer accounts 169,957 88,141 29,931 90,273 – 378,302

Standard Chartered
Annual Report 2017 214
FINANCIAL STATEMENTSNotes to the fi nancial statements
2. Segmental information continued
Additional segmental information (statutory)2017
Corporate &
Institutional
Banking
$million
Retail
Banking
$million
Commercial
Banking
$million
Private
Banking
$million
Central &
other items
$million
Total
$million
Net interest income 3,225 3,006 802 286 862 8,181
Other income 3,298 1,897 527 214 308 6,244
Operating income 6,523 4,903 1,329 500 1,170 14,425
2016
Corporate &
Institutional
Banking
$million
Retail
Banking
$million
Commercial
Banking
$million
Private
Banking
$million
Central &
other items
$million
Total
$million
Net interest income 3,051 2,977 782 287 697 7,794
Other income 3,437 1,692 511 209 417 6,266
Operating income 6,488 4,669 1,293 496 1,114 14,060
2017
Greater China &
North Asia
$million
ASEAN &
South Asia
$million
Africa &
Middle East
$million
Europe &
Americas
$million
Central &
other items
$million
Total
$million
Net interest income 2,950 2,402 1,619 692 518 8,181
Other income 2,663 1,468 1,145 904 64 6,244
Operating income 5,613 3,870 2,764 1,596 582 14,425
2016
Greater China &
North Asia
$million
ASEAN &
South Asia
$million
Africa &
Middle East
$million
Europe &
Americas
$million
Central &
other items
$million
Total
$million
Net interest income 2,684 2,485 1,566 744 315 7,794
Other income 2,698 1,557 1,171 911 (71) 6,266
Operating income 5,382 4,042 2,737 1,655 244 14,060
2017
Hong Kong
$million
Korea
$million
China
$million
Singapore
$million
India
$million
UAE
$million
UK
$million
US
$million
Net interest income 1,564 625 540 965 577 394 428 158
Other income 1,823 340 163 470 406 339 314 517
Operating income 3,387 965 703 1,435 983 733 742 675
2016
Hong Kong
$million
Korea
$million
China
$million
Singapore
$million
India
$million
UAE
$million
UK
$million
US
$million
Net interest income 1,375 586 505 817 680 392 451 179
Other income 1,959 295 187 683 275 357 331 482
Operating income 3,334 881 692 1,500 955 749 782 661

215
Ris
k re
vie
w a
nd
cap
ital re
vie
wS
trate
gic
rep
ort
Su
pp
lem
en
tary
info
rmatio
nF
INA
NC
IAL
ST
AT
EM
EN
TS
Dire
cto
rs’ re
po
rt
3. Net interest income
Accounting policy
Interest income and expense on available-for-sale assets, held-to-maturity assets and fi nancial assets and liabilities held at amortised cost, is recognised using the effective interest method.
Interest income and expense on fi nancial instruments held at fair value through profi t or loss is recognised within net interest income.
The effective interest method is a method of calculating the amortised cost of a fi nancial asset or a fi nancial liability and of allocating the interest income or interest expense over the relevant period. The effective interest rate is the rate that discounts estimated future cash payments or receipts through the expected life of the fi nancial instrument or, when appropriate, a shorter period, to the net carrying amount of the fi nancial asset or fi nancial liability. When calculating the effective interest rate, the Group estimates cash fl ows considering all contractual terms of the fi nancial instrument (for example, prepayment options) but does not consider future credit losses. The calculation includes all fees paid or received between parties to the contract that are an integral part of the effective interest rate, transaction costs and all other premiums or discounts. Where the estimates of cash fl ows have been revised, the carrying amount of the fi nancial asset or liability is adjusted to refl ect the actual and revised cash fl ows, discounted at the instruments original effective interest rate. The adjustment is recognised as interest income or expense in the period in which the revision is made.
Once a fi nancial asset or a group of similar fi nancial assets has been written down as a result of an impairment loss, interest income is recognised using the rate of interest used to discount the future cash fl ows for the purpose of measuring the impairment loss.
2017
$million
2016
$million
Balances at central banks 287 213
Loans and advances to banks 1,955 1,282
Loans and advances to customers 8,845 8,461
Listed debt securities 928 604
Unlisted debt securities 1,501 1,569
Other eligible bills 836 593
Accrued on impaired assets (discount unwind) 83 288
Interest income 14,435 13,010
Deposits by banks 891 494
Customer accounts 3,859 3,187
Debt securities in issue 756 700
Subordinated liabilities and other borrowed funds 748 835
Interest expense 6,254 5,216
Net interest income 8,181 7,794
Of which from fi nancial instruments held at:
Amortised cost 10,861 10,040
Available-for-sale 2,657 2,291
Fair value through profi t or loss 847 663
Held-to-maturity 70 16
Interest income 14,435 13,010
Of which from fi nancial instruments held at:
Amortised cost 6,128 5,107
Fair value through profi t or loss 126 109
Interest expense 6,254 5,216
Net interest income 8,181 7,794

Standard Chartered
Annual Report 2017 216
FINANCIAL STATEMENTSNotes to the fi nancial statements
4. Net fees and commission
Accounting policy
Fees and commissions charged for services provided or received by the Group are recognised on an accrual basis when the service has been provided or signifi cant act performed.
Loan syndication fees are recognised as revenue when the syndication has been completed and the Group retained no part of the loan package for itself, or retained a part at the same effective interest rate as for the other participants.
The Group can act as trustee or in other fi duciary capacities that result in the holding or placing of assets on behalf of individuals, trusts, retirement benefi t plans and other institutions. The assets and income arising thereon are excluded from these fi nancial statements, as they are not assets and income of the Group.
2017
$million
2016
$million
Fees and commissions income 3,942 3,671
Fees and commissions expense (430) (440)
Net fees and commission 3,512 3,231
Transaction Banking 1,277 1,194
Financial Markets 193 (62)
Corporate Finance 226 521
Wealth Management 1,355 1,089
Retail Products 443 464
Lending and Portfolio Management 51 50
Principal Finance 17 3
Treasury1 (20) (30)
Others1 (30) 2
Net fees and commission 3,512 3,231
1 Treasury net fees and commission comprises items previously reported under Asset and Liability Management ($(22) million) and Treasury-related aspects of Other income ($(8)
million). This refl ects the reorganisation of the Group’s balance sheet, liquidity, and capital management activities such that they are now managed within one Treasury function.
2016 has been re-presented as a result
Total fee income arising from fi nancial instruments that are not fair valued through profi t or loss is $1,067 million (2016: $1,035 million) and arising from trust and other fi duciary activities of $130 million (2016: $115 million).
Total fee expense arising from fi nancial instruments that are not fair valued through profi t or loss is $74 million (2016: $56 million) and arising from trust and other fi duciary activities of $22 million (2016: $17 million).
5. Net trading income
Accounting policy
Gains and losses arising from changes in the fair value of fi nancial instruments held at fair value through profi t or loss are included in the income statement in the period in which they arise.
Income is recognised from the sale and purchase of trading positions, margins on market making and customer business and fair value changes.
2017
$million
2016
$million
Net trading income 1,527 1,886
Signifi cant items within net trading income include:
Gains on instruments held for trading 1,716 2,106
Gains/(losses) on fi nancial assets designated at fair value through profi t or loss 167 (73)
Losses on fi nancial liabilities designated at fair value through profi t or loss (202) (178)

217
Ris
k re
vie
w a
nd
cap
ital re
vie
wS
trate
gic
rep
ort
Su
pp
lem
en
tary
info
rmatio
nF
INA
NC
IAL
ST
AT
EM
EN
TS
Dire
cto
rs’ re
po
rt
6. Other operating income
Accounting policy
Operating lease income is recognised on a straight line basis over the period of the lease unless another systematic basis is more appropriate.
Dividends on equity instruments are recognised when the Group’s right to receive payment is established.
On disposal of available-for-sale fi nancial instruments, the cumulative gain or loss recognised in other comprehensive income is recycled to the profi t or loss in other operating income/expense.
When the Group loses control of the subsidiary or disposal group, the difference between the consideration received and the carrying amount of the subsidiary or disposal group is recognised as a gain or loss on sale of the business.
2017
$million
2016
$million
Other operating income includes:
Rental income from operating lease assets 670 561
Gains less losses on disposal of available-for-sale fi nancial instruments 235 192
Net gain on sale of businesses 28 284
Net gain on derecognition of Investment in associate 64 –
Dividend income 46 52
Other 162 60
1,205 1,149
7. Operating expenses
Accounting policy
Short-term employee benefi ts: salaries and social security expenses are recognised over the period in which the employees provide the service. Variable compensation is included within share-based payments costs and wages and salaries. Further details are disclosed in the Directors’ remuneration report (pages 83 to 106).
Pension costs: contributions to defi ned contribution pension schemes are recognised in profi t or loss when payable. For defi ned benefi t plans, net interest expense, service costs and expenses are recognised to the income statement. Further details are provided in note 30.
Share-based compensation: the group operates equity-settled and cash-settled share-based payment compensation plans. The fair value of the employee services received in exchange for the grant of the options is recognised as an expense. Further details are provided in note 31.
2017
$million
2016
$million
Staff costs:
Wages and salaries 5,047 4,713
Social security costs 159 145
Other pension costs (note 30) 357 316
Share-based payment costs (note 31) 152 100
Other staff costs 1,043 1,029
6,758 6,303
Other staff costs include redundancy and other restructuring expenses of $85 million (2016: $236 million). Further costs in this category include training, travel costs and other staff-related costs.
The following table summarises the number of employees within the Group:
2017 2016
Business Support services Total Business Support services Total
At 31 December 40,636 45,385 86,021 43,286 43,407 86,693
Average for the year 41,806 44,988 86,794 42,605 42,311 84,916
The Company employed nil staff at 31 December 2017 (2016: nil) and it incurred costs of $5 million (2016: $3 million).
Details of directors’ pay and benefi ts and interests in shares are disclosed in the Directors’ remuneration report (pages 83 to 106).
Transactions with directors, offi cers and other related parties are disclosed in note 36.

Standard Chartered
Annual Report 2017 218
FINANCIAL STATEMENTSNotes to the fi nancial statements
7. Operating expenses continued2017
$million
2016
$million
Premises and equipment expenses:
Rental of premises 379 400
Other premises and equipment costs 427 379
Rental of computers and equipment 17 18
823 797
General administrative expenses:
UK bank levy 220 383
Other general administrative expenses 1,787 1,989
2,007 2,372
Depreciation and amortisation:
Property, plant and equipment (note 19):
Premises 85 98
Equipment 85 84
Operating lease assets 328 271
498 453
Intangibles (note 18):
Software 320 272
Acquired on business combinations 11 14
829 739
The UK bank levy is applied on the chargeable equities and liabilities on the Group’s consolidated balance sheet. Key exclusions from chargeable equities and liabilities include Tier 1 capital, insured or guaranteed retail deposits, repos secured on certain sovereign debt and liabilities subject to netting. The 2017 charge was lower than expected after updating estimates made in previous years. The rate of the levy for 2017 is the blended rate of 0.17 per cent for chargeable short-term liabilities, with a lower rate of 0.085 per cent generally applied to chargeable equity and long-term liabilities (i.e. liabilities with a remaining maturity greater than one year). The rates will be gradually reduced over the next fi ve years, from 1 January 2021 they will be 0.10 per cent for short-term liabilities and 0.05 per cent for long-term liabilities. In addition, the scope of the bank levy will be restricted to the balance sheet of UK operations only from that date.
8. Impairment losses on loans and advances and other credit risk provisions
Accounting policy
Signifi cant accounting estimates and judgements The calculation of impairment involves key judgements to be made by the Group:
Loan loss provisions are management’s best estimate of incurred loss in the loan portfolio at the balance sheet date. Management has to exercise judgement in making assumptions and estimates of the loan portfolio on both individually and collectively assessed loan and advances
For individually signifi cant fi nancial assets, the Group will consider judgements that have an impact on the expected future cash fl ows of the asset. These include: the business prospects, industry and geopolitical climate of the customer, quality of realisable value of collateral, the Group’s legal position relative to other claimants and any renegotiation/forbearance options. Many of the key judgement factors have a degree of interdependency, therefore a higher level of judgement is required for loans to borrowers showing signs of fi nancial diffi culty/failure to pay in market sectors experiencing economic stress, particularly where the likelihood of repayment is affected by the ability of the client to refi nance or sell a specifi ed asset
The difference between the loan carrying amount and the discounted expected future cash fl ows will result in the impairment amount. The future cash fl ow calculation involves signifi cant judgements and estimates. As new information becomes available and further negotiations/forbearance measures are taken, the estimates of the future cash fl ows will be revised, and will have an impact on the future cash fl ow analysis
For fi nancial assets which are not individually signifi cant, such as the Retail Banking portfolio or small business loans, which comprise a large number of homogenous loans that share similar characteristics, statistical estimates and techniques are used, as well as credit scoring analysis. These techniques use models which analyse historical repayment and default rates over a time horizon. Where various models are used, management’s judgement is required to analyse the available information provided and to select the appropriate model or combination of models to use. Further judgement is required to determine whether the current economic climate, behavioural and credit conditions are such that the actual level of incurred losses, and losses inherent in the collective portfolio is likely to be greater or less than historical experience, and is not fully refl ective in the allowance estimated through the use of statistical models and historical data. Factors are applied in different geographical regions and countries to refl ect local economic conditions, geopolitical risk, laws and regulations (e.g. new industry debt relief programme), credit bureau data, analysis of credit grade migration and delinquency trends. Further judgement is required to determine overlays on the models (described below in Retail Banking)

219
Ris
k re
vie
w a
nd
cap
ital re
vie
wS
trate
gic
rep
ort
Su
pp
lem
en
tary
info
rmatio
nF
INA
NC
IAL
ST
AT
EM
EN
TS
Dire
cto
rs’ re
po
rt
8. Impairment losses on loans and advances and other credit risk provisions continued
Objective evidence of impairmentThe Group assesses at each balance sheet date whether there is objective evidence that a fi nancial asset or group of fi nancial assets is impaired. A fi nancial asset or a group of fi nancial assets is impaired and impairment losses are incurred if, and only if, there is objective evidence of impairment as a result of one or more events occurring after the initial recognition of the asset (a loss event), and that loss event (or events) has an impact on the estimated future cash fl ows of the fi nancial asset or group of fi nancial assets that can be reliably estimated.
The Group considers the following factors in assessing objective evidence of impairment:
Whether the counterparty is in default of principal or interest payments
– the disappearance of an active market for that fi nancial asset because of fi nancial diffi culties
– signifi cant fi nancial diffi culty of the issuer or obligor
When a counterparty fi les for bankruptcy protection (or the local equivalent) and this would avoid or delay discharge of its obligation
Where the Group fi les to have the counterparty declared bankrupt or fi les a similar order in respect of a credit obligation
Where the Group consents to a restructuring of the obligation, resulting in a diminished fi nancial obligation, demonstrated by a material forgiveness of debt or postponement of scheduled payments
Where the Group sells a credit obligation at a material credit-related economic loss; or where there is observable data indicating that there is a measurable decrease in the estimated future cash fl ows of a group of fi nancial assets, although the decrease cannot yet be identifi ed with specifi c individual fi nancial assets
Assets at amortised costCorporate & Institutional Banking and Commercial BankingThe assessment of the credit risk of corporate and commercial loans is done by the Credit Risk department, based upon counterparty information they receive from various sources including relationship managers and on external market information, or as soon as payment of interest or principal is 90 days overdue.
Once a loan starts to exhibit credit deterioration, it will move along the credit grading scale in the performing book and when it is classifi ed as Credit Grade (CG) 12 as defi ned in the Risk review and Capital review (page 125), the credit assessment and oversight of the loan will be performed by Group Special Asset Management (GSAM).
Where GSAM’s assessment indicates that a loan is impaired, GSAM will calculate an Individual Impairment Provision (IIP) based on estimated cash fl ows revised to refl ect anticipated recoveries. GSAM’s assessment and calculation of impairment involves a signifi cant level of judgement.
If there is objective evidence that an impairment loss on a loan and receivable or a held-to-maturity asset has occurred, the amount of the loss is measured as the difference between the asset’s carrying amount and the present value of estimated future cash fl ows (excluding future credit losses that have not been incurred), discounted at the asset’s original effective interest rate. The carrying amount of the asset is reduced through the use of an allowance account and the amount of the loss is recognised in the income statement. If a loan and receivable or held-to-maturity asset has a variable interest rate, the discount rate for measuring any impairment loss is the current effective interest rate determined under the contract. As a practical expedient, the Group may measure impairment on the basis of an instrument’s fair value using an observable market price.
The individual circumstances of each client are taken into account when GSAM estimates future cash fl ows. All available sources, such as cash fl ow arising from operations, selling assets or subsidiaries, realising collateral or payments under guarantees are considered. In any decision relating to the raising of provisions, the Group attempts to balance economic conditions, local knowledge and experience, and the results of independent asset reviews.
The calculation of the present value of the estimated future cash fl ows of a collateralised fi nancial asset refl ects the cash fl ows that may result from foreclosure, less costs for obtaining and selling the collateral, whether or not foreclosure is probable.
Further details on collateral held by the Group is discussed in the Risk review and Capital review (pages 138 to 141).
In cases where the impairment assessment indicates that there will be a loss of principal, the loan is graded CG 14 while other impaired loans will be graded CG 13. Loans graded CG 13–CG 14 are classifi ed as non-performing loans.
The performing loan portfolio is subject to a Portfolio Impairment Provision (PIP) to cover latent losses i.e. those that are not specifi cally identifi ed but are known, by experience, to be present in any performing portfolio. The PIP is based on models using risk sizing (including probability of default and loss given default), environmental parameters and exceptional adjustment overlays. The calculation of the PIP uses regulatory expected credit loss (ECL) models. ECL is subject to an emergence risk factor that is generally understood as the hypothetical amount of time between a loss event occurrence and the bank recognition of impairment. The emergence risk factor is the principal means of translating a risk position to an impairment estimate, and the main scaling factor to adjust the conservative regulatory Expected Loss to an effective PIP level, as the regulatory ECL models are more punitive than the incurred loss model under IAS 39. On a portfolio basis, the emergence risk factor ranges between 2 and 3 months based on structural economic drivers that might infl uence the accurate and timely discovery of credit issues in each country.

Standard Chartered
Annual Report 2017 220
FINANCIAL STATEMENTSNotes to the fi nancial statements
8. Impairment losses on loans and advances and other credit risk provisions continued
Retail BankingAn IIP is recognised for Retail Banking when an account meets a defi ned threshold condition in terms of overdue payments (‘contractual default’) or meets other objective conditions (such as bankruptcy, debt restructuring, fraud or death) as further described above in the assessment factors. The threshold conditions are set at the point where empirical evidence suggests that the client is unlikely to meet their contractual obligations or a loss of principal is expected.
A credit obligation in Retail Banking clients portfolio that is more than 150 Days Past Due (DPD) or, a credit obligation secured by Wealth Management products that is 90 DPD, is recognised as ‘impaired’ and IIP is provided for accordingly. There are, however, exceptions to this rule for portfolios where empirical evidence suggests that they should be set more conservatively. In addition, the credit account is recognised as ‘impaired’ immediately if the borrower fi les for bankruptcy or other equivalent forbearance programme, or the borrower is deceased, or the business is closed in the case of small business clients, or the borrower’s other credit accounts with the Group are impaired. The core components of the IIP calculation are the value of gross charge-off and recoveries. Gross charge-off and/or provisions are recognised when it is established that the account is unlikely to pay. Recovery of unsecured debt post-impairment is recognised based on actual cash collected, either directly from clients or through the sale of defaulted loans to third-party institutions. Provision release of secured loans post-impairment is recognised if the loan outstanding is paid in full (release of full provision), or the provision is higher than the loan outstanding (release of the excess provision), or the loan is paid to current and remains in current for more than 180 days (release of full provision).
Retail Banking PIP, covering the inherent losses in the portfolio that exist at the balance sheet date but have not been individually identifi ed, is computed on performing loans (no IIP), using EL rates, to determine latent losses in the portfolio. The EL utilises probability of default and loss given default inherent within the portfolio of impaired loans or receivables and the historical loss experience for assets with credit risk characteristics similar to those in the Group. For defaulted yet non-impaired accounts (greater than 90 days past due) full EL is used, while for non-defaulted accounts, a three month emergence period is applied. An adjustment is added to the PIP calculation to take into the account instances where the EL-based PIP is deemed imprecise due to under-prediction or over-prediction of EL by underlying models. An overlay in the form of Special Risk Adjustment (SRA) is added to the EL-based PIP calculation to take into account instances where EL-based PIP is deemed insuffi cient to incorporate the impact of a specifi c credit event. An overlay in the form of Business Cycle Adjustment (BCA) is taken to account for the impact of cyclical volatility in the operating environment, which is not adequately covered in the underlying models.
The assessment and calculation of the Retail Banking IIP and PIP involve a signifi cant level of judgement.
Write-off and reversal of impairmentTo the extent a loan is irrecoverable, it is written off against the related provision for loan impairment. Such loans are written off after all the necessary procedures have been completed, it is decided that there is no realistic probability of recovery and the amount of the loss has been determined. Subsequent recoveries of amounts previously written off decrease the amount of the provision for loan impairment in the income statement. If, in a subsequent period, the amount of the impairment loss decreases and the decrease can be related objectively to an event occurring after the impairment was recognised (such as an improvement in the debtor’s credit rating), the previously recognised impairment loss is reversed by adjusting the allowance account. The amount of the reversal is recognised in the income statement during the period.
Forborne loansA forborne loan arises when a concession has been made to the contractual terms of a loan in response to a customer’s fi nancial diffi culties.
In certain circumstances, the Group may renegotiate client loans. Loans that are renegotiated for commercial reasons, such as when a client had a credit rating upgrade, are not included as part of forborne loans because they are not indicative of any credit stress or event.
Forbearance strategies assist clients who are temporarily in fi nancial distress and are unable to meet their original contractual repayment terms. Forbearance can be initiated by the client, the Bank or a third party (including government-sponsored programmes or a conglomerate of credit institutions) and includes debt restructuring such as a new repayment schedule, payment deferrals, tenor extensions and interest-only payments.
Loans that are renegotiated on terms that are not consistent with those readily available in the market and/or where we have granted a concession compared with the original terms of the loans, are considered for impairment. If the terms of the renegotiation are such that, where the present value of the new cash fl ows is lower than the present value of the original cash fl ows, the loan would be considered to be impaired and, at a minimum, a discount provision would be raised and are disclosed as ‘Loans subject to forbearance – impaired’, which is a subset of impaired loans. All other loans that have been subject to a forbearance contract amendment, but which are not considered impaired (not classifi ed as CG 13 or 14) are classifi ed as ‘Forborne – not impaired’ (previously disclosed as ‘other renegotiated loans’).
If a loan enters the forbearance process and the terms are substantially modifi ed, the original loan will be derecognised, and a new loan will be recognised.
For Retail Banking clients, all forborne loans are managed within a separate portfolio. If such loans subsequently become past due, charge-off and IIP is accelerated to 90 days past due for unsecured loans and automobile fi nance or 120 days past due for secured loans. The accelerated loss rates applied to this portfolio are derived from experience with other forborne loans, rather than the Retail Banking clients portfolio as a whole, to recognise the greater degree of inherent risk.
For Corporate & Institutional Banking, Commercial Banking and Private Banking clients, forbearance is applied on a case-by-case basis and is not subject to business-wide programmes. In some cases, the asset is derecognised and a new loan is granted as part of the restructure. In others, the contractual terms and repayment of the existing loans are changed or extended (for example, interest only for a period). Loans classifi ed as subject to forbearance are managed by GSAM and are kept under close review to assess the client’s ability to adhere to the restructured repayment strategy and to identify any events that could result in a deterioration in the client’s ability to repay.

221
Ris
k re
vie
w a
nd
cap
ital re
vie
wS
trate
gic
rep
ort
Su
pp
lem
en
tary
info
rmatio
nF
INA
NC
IAL
ST
AT
EM
EN
TS
Dire
cto
rs’ re
po
rt
8. Impairment losses on loans and advances and other credit risk provisions continued
Curing of forborne loansDuring the year the Group changed its methodology, to allow curing of forborne loans. Comparatives have been re-presented.
A forborne loan can only be removed from the disclosure (cured) if the loan is performing and a further two year probation period is met.
In order for a forborne loan to become performing, the following criteria have to be satisfi ed:
At least a year has passed with no default based upon the forborne contract terms
The customer is likely to repay its obligations in full without realising security
The customer has no accumulated impairment against amount outstanding
Subsequent to the criteria above, a further two year probation period has to be fulfi lled, whereby regular payments are made by the customer and none of the exposures to the customer are more than 30 days past due.
Forborne loans are disclosed by client segments (pages 126 to 129).
Further details on the application of these policies are set out in the Risk review and Capital review (pages 128 to 129).
The following table reconciles the charge for impairment provisions on loans and advances to the total impairment charge and other credit risk provision:
2017
$million
2016
$million
Net charge against profi t on loans and advances:
Individual impairment charge 1,604 2,553
Portfolio impairment (release)/charge (239) 52
1,365 2,605
Impairment (release)/charges related to credit commitments (23) 45
Impairment charges relating to debt securities classifi ed as loans and receivables 20 97
Impairment charges relating to credit risk mitigation instruments – 44
Total impairment losses and other credit risk provisions on loans and advances 1,362 2,791
Impairment charges relating to credit risk mitigation instruments
The Group executed funded credit mitigation transactions related to the Liquidation Portfolio, which did not achieve derecognition and are recorded as liabilities on an amortised cost basis. The liability balances are adjusted for revisions to the impairment estimates for the loans referenced in the transactions. Both impairment losses on the referenced loans and the related impairment on these credit mitigation transactions are recorded in total impairment losses and other credit risk provisions on loans and advances.
An analysis of impairment provisions on loans and advances by geography and client segment is set out within the Risk review and Capital review (pages 130 to 137).
9. Other impairment
Accounting policy
Available-for-sale assetsWhere objective evidence of impairment exists for available-for-sale fi nancial assets, the cumulative loss (measured as the difference between the amortised cost and the current fair value, less any impairment loss on that fi nancial asset previously recognised in the income statement) is reclassifi ed from equity and recognised in the income statement.
Available-for-sale debt securities are assessed for impairment in the same way as assets carried at amortised cost (see note 8 – Objective evidence of impairment, for impairment ‘trigger’ events).
Further, the extent, observability and depth of market price decreases and collateral rights are considered when assessing objective evidence of listed impairment for available-for-sale instruments.
If, in a subsequent period, the fair value of a debt instrument classifi ed as available-for-sale increases and the increase can be objectively related to an event occurring after the impairment loss was recognised, the impairment loss is reversed through the income statement.
For equity securities, a signifi cant or prolonged decline in the fair value of an equity security below its cost is considered, among other factors, in assessing objective evidence of impairment. In assessing signifi cance, the decline in fair value is evaluated against the original fair value of the asset upon recognition.
In assessing prolonged, the decline is evaluated against the continuous period in which the fair value of the asset has been below its initial recognition amount. Impairment losses recognised in the income statement on equity instruments are not reversed through the income statement.
Refer to the below referenced notes for the relevant accounting policy.
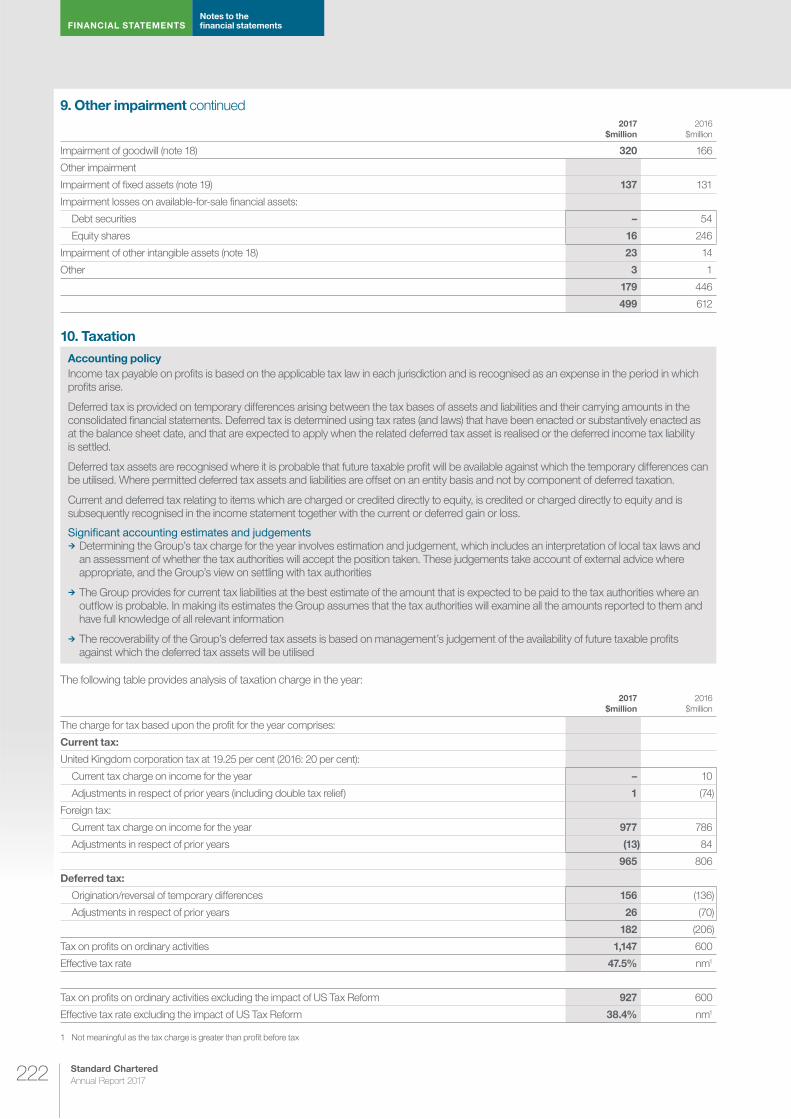
Standard Chartered
Annual Report 2017 222
FINANCIAL STATEMENTSNotes to the fi nancial statements
9. Other impairment continued2017
$million
2016
$million
Impairment of goodwill (note 18) 320 166
Other impairment
Impairment of fi xed assets (note 19) 137 131
Impairment losses on available-for-sale fi nancial assets:
Debt securities – 54
Equity shares 16 246
Impairment of other intangible assets (note 18) 23 14
Other 3 1
179 446
499 612
10. Taxation
Accounting policy
Income tax payable on profi ts is based on the applicable tax law in each jurisdiction and is recognised as an expense in the period in which profi ts arise.
Deferred tax is provided on temporary differences arising between the tax bases of assets and liabilities and their carrying amounts in the consolidated fi nancial statements. Deferred tax is determined using tax rates (and laws) that have been enacted or substantively enacted as at the balance sheet date, and that are expected to apply when the related deferred tax asset is realised or the deferred income tax liability is settled.
Deferred tax assets are recognised where it is probable that future taxable profi t will be available against which the temporary differences can be utilised. Where permitted deferred tax assets and liabilities are offset on an entity basis and not by component of deferred taxation.
Current and deferred tax relating to items which are charged or credited directly to equity, is credited or charged directly to equity and is subsequently recognised in the income statement together with the current or deferred gain or loss.
Signifi cant accounting estimates and judgements Determining the Group’s tax charge for the year involves estimation and judgement, which includes an interpretation of local tax laws and an assessment of whether the tax authorities will accept the position taken. These judgements take account of external advice where appropriate, and the Group’s view on settling with tax authorities
The Group provides for current tax liabilities at the best estimate of the amount that is expected to be paid to the tax authorities where an outfl ow is probable. In making its estimates the Group assumes that the tax authorities will examine all the amounts reported to them and have full knowledge of all relevant information
The recoverability of the Group’s deferred tax assets is based on management’s judgement of the availability of future taxable profi ts against which the deferred tax assets will be utilised
The following table provides analysis of taxation charge in the year:
2017
$million
2016
$million
The charge for tax based upon the profi t for the year comprises:
Current tax:
United Kingdom corporation tax at 19.25 per cent (2016: 20 per cent):
Current tax charge on income for the year – 10
Adjustments in respect of prior years (including double tax relief) 1 (74)
Foreign tax:
Current tax charge on income for the year 977 786
Adjustments in respect of prior years (13) 84
965 806
Deferred tax:
Origination/reversal of temporary differences 156 (136)
Adjustments in respect of prior years 26 (70)
182 (206)
Tax on profi ts on ordinary activities 1,147 600
Effective tax rate 47.5% nm1
Tax on profi ts on ordinary activities excluding the impact of US Tax Reform 927 600
Effective tax rate excluding the impact of US Tax Reform 38.4% nm1
1 Not meaningful as the tax charge is greater than profi t before tax

223
Ris
k re
vie
w a
nd
cap
ital re
vie
wS
trate
gic
rep
ort
Su
pp
lem
en
tary
info
rmatio
nF
INA
NC
IAL
ST
AT
EM
EN
TS
Dire
cto
rs’ re
po
rt
10. Taxation continued
The US Tax Cuts and Jobs Act of 2017, effective from 1 January 2018, reduces the US corporate tax rate from 35 per cent to 21 per cent and introduces a Base Erosion and Anti Abuse Tax. The combined impact of these changes in tax rates reduced the US deferred tax asset, increasing the deferred taxation charge for the year by $220 million.
Foreign tax includes current tax on Hong Kong profi ts of $167 million (31 December 2016: $109 million) on the profi ts assessable in Hong Kong.
Deferred tax includes origination or reversal of temporary differences in Hong Kong profi ts of $5 million (2016: $(4) million) provided at a rate of 16.5 per cent (2016: 16.5 per cent) on the profi ts assessable to Hong Kong.
The tax charge for the year of $1,147 million (2016: $600 million) on a profi t before tax of $2,415 million (2016: $409 million) refl ects the impact of US Tax Reform, non-deductible expenses and the impact of countries with tax rates higher or lower than the UK, the most signifi cant of which is India.
Tax rate: The tax charge for the year is higher than the charge at the rate of corporation tax in the UK, 19.25 per cent. The differences are explained below:
2017
$million
2016
$million
Profi t on ordinary activities before tax 2,415 409
Tax at 19.25 per cent (2016: 20.00 per cent) 465 82
Lower tax rates on overseas earnings (17) (5)
Higher tax rates on overseas earnings 351 269
Tax-free income (130) (117)
Share of associates and joint ventures (45) 13
Non-deductible expenses 217 201
Bank levy 42 77
Non-taxable losses on investments 9 120
Non-taxable gains on disposals of businesses (12) (41)
Goodwill impairment 63 33
US Tax Reform 220 –
Deferred tax not recognised 39 93
Adjustments to tax charge in respect of prior years 14 (60)
Other items (69) (65)
Tax on profi t on ordinary activities 1,147 600
Factors affecting the tax charge in future years: The Group’s tax charge, and effective tax rate in future years could be affected by several factors including acquisitions, disposals and restructuring of our businesses, the mix of profi ts across jurisdictions with different statutory tax rates, changes in tax legislation and tax rates and resolution of uncertain tax positions.
The evaluation of uncertain tax positions involves an interpretation of local tax laws which could be subject to challenge by a tax authority, and an assessment of whether the tax authorities will accept the position taken. The Group does not currently consider that the assumptions or judgements made in assessing tax liabilities have a signifi cant risk of resulting in a material adjustment within the next fi nancial year.
2017 2016
Current tax
$million
Deferred tax
$million
Total
$million
Current tax
$million
Deferred tax
$million
Total
$million
Tax recognised in other comprehensive income
Available-for-sale assets 1 7 8 10 (1) 9
Cash fl ow hedges – (6) (6) – (17) (17)
Own credit adjustment – 14 14 29 1 30
Retirement benefi t obligations – (35) (35) – 2 2
Total tax credit/(charge) recognised in equity 1 (20) (19) 39 (15) 24

Standard Chartered
Annual Report 2017 224
FINANCIAL STATEMENTSNotes to the fi nancial statements
10. Taxation continued2017
$million
2016
$million
Current tax assets 474 388
Current tax liabilities (327) (769)
Net current tax balance as at 1 January 147 (381)
Movements in income statement (965) (806)
Movements in other comprehensive income 1 39
Taxes paid 915 1,287
Other movements 17 8
Net current tax balance as at 31 December 115 147
Current tax assets 491 474
Current tax liabilities (376) (327)
Total 115 147
Deferred tax: The following are the major deferred tax liabilities and assets recognised by the Group and movements thereon during the year:
At 1 January 2017
$million
Exchange & other
adjustments
$million
(Charge)/credit
to profi t
$million
(Charge)/credit
to equity
$million
At 31 December
2017
$million
Deferred tax comprises:
Accelerated tax depreciation (399) (12) (2) – (413)
Impairment provisions on loans and advances 934 36 101 – 1,071
Tax losses carried forward 396 8 (114) – 290
Available-for-sale assets (27) (2) – 7 (22)
Cash fl ow hedges 5 (1) – (6) (2)
Own credit adjustment – (3) – 14 11
Retirement benefi t obligations 76 3 (6) (35) 38
Share-based payments 16 – – – 16
Other temporary differences (60) 5 (161) – (216)
Net deferred tax assets 941 34 (182) (20) 773
At 1 January 2016
$million
Exchange & other
adjustments
$million
(Charge)/credit
to profi t
$million
(Charge)/credit
to equity
$million
At 31 December
2016
$million
Deferred tax comprises:
Accelerated tax depreciation (319) 7 (87) – (399)
Impairment provisions on loans and advances 767 (22) 189 – 934
Tax losses carried forward 396 1 (1) – 396
Available-for-sale assets (29) 1 2 (1) (27)
Cash fl ow hedges 2 1 19 (17) 5
Retirement benefi t obligations 71 2 1 2 76
Share-based payments 26 – (10) – 16
Other temporary differences (148) (6) 93 1 (60)
Net deferred tax assets 766 (16) 206 (15) 941

225
Ris
k re
vie
w a
nd
cap
ital re
vie
wS
trate
gic
rep
ort
Su
pp
lem
en
tary
info
rmatio
nF
INA
NC
IAL
ST
AT
EM
EN
TS
Dire
cto
rs’ re
po
rt
10. Taxation continued
Deferred tax comprises assets and liabilities as follows:
2017 2016
Total
$million
Asset
$million
Liability
$million
Total
$million
Asset
$million
Liability
$million
Deferred tax comprises:
Accelerated tax depreciation (413) 17 (430) (399) 13 (412)
Impairment provisions on loans and advances 1,071 1,037 34 934 914 20
Tax losses carried forward 290 134 156 396 217 179
Available-for-sale assets (22) (8) (14) (27) (10) (17)
Cash fl ow hedges (2) (7) 5 5 – 5
Own credit adjustment 11 (2) 13 – – –
Retirement benefi t obligations 38 38 – 76 76 –
Share-based payments 16 16 – 16 16 –
Other temporary differences (216) (48) (168) (60) 68 (128)
773 1,177 (404) 941 1,294 (353)
At 31 December 2017, the Group has net deferred tax assets of $773 million (2016: $941 million). The recoverability of the Group’s deferred tax assets is based on management’s judgement of the availability of future taxable profi ts against which the deferred tax assets will be utilised.
Of the Group’s total deferred tax assets, $290 million relates to tax losses carried forward. These tax losses have arisen in individual legal entities and will be offset as future taxable profi ts arise in those entities.
$151 million of the deferred tax assets relating to losses has arisen in Ireland, where there is no expiry date for unused tax losses. These losses relate to aircraft leasing and are expected to be fully utilised over the useful economical life of the assets being up to 18 years
$33 million of the deferred tax assets relating to losses has arisen in Korea. These losses have no expiry date, and there is a defi ned profi t stream against which they are forecast to be utilised
$31 million of the deferred tax assets relating to losses has arisen in the US. Management forecasts show that the losses are expected to be fully utilised over a period of nine years. The tax losses have no expiry date
$26 million of the deferred tax assets relating to losses has arisen in Taiwan. Management forecasts show that the losses are expected to be fully utilised over a period of three years. The tax losses expire after 10 years
The remaining deferred tax assets of $49 million relating to losses has arisen in other jurisdictions and is expected to be recovered in less than 10 years
2017
$million
2016
$million
No account has been taken of the following potential deferred tax assets/(liabilities):
Withholding tax on unremitted earnings from overseas subsidiaries (343) (333)
Foreign exchange movements on investments in branches (339) (263)
Tax losses1 1,311 1,197
Held over gains on incorporation of overseas branches (399) (417)
Other temporary differences 47 53
1 Primarily in the UK

Standard Chartered
Annual Report 2017 226
FINANCIAL STATEMENTSNotes to the fi nancial statements
11. Dividends
Accounting policy
Dividends on ordinary shares and preference shares classifi ed as equity are recognised in equity in the year in which they are declared.
Dividends on ordinary equity shares are recorded in the year in which they are declared and, in respect of the fi nal dividend, have been approved by the shareholders.
The Board considers a number of factors which include the rate of recovery in the Group’s fi nancial performance, the macroeconomic environment, and opportunities to further invest in our business and grow profi tably in our markets.
There was no interim dividend declared in 2017 or during the comparative reporting periods.
Preference shares and Additional Tier 1 securities
Dividends on these preference shares and securities classifi ed as equity are recorded in the period in which they are declared.
2017
$million
2016
$million
Non-cumulative redeemable preference shares: 7.014 per cent preference shares of $5 each 53 53
6.409 per cent preference shares of $5 each 39 48
92 101
Additional Tier 1 securities: $5 billion fi xed rate resetting perpetual subordinated contingent convertible securities 353 130
445 231
Dividends on these preference shares are treated as interest expense and accrued accordingly.
Non-cumulative irredeemable preference shares: 7 3/8 per cent preference shares of £1 each 10 10
8 1/4 per cent preference shares of £1 each 11 11
21 21
The 2017 ordinary equity share dividend recommended by the Board is 11 cents per share. The fi nancial statements for the year ended 31 December 2017 do not refl ect this dividend as this will be accounted for in shareholders’ equity as an appropriation of retained profi ts in the year ending 31 December 2018.
The dividend will be paid in either pounds sterling, Hong Kong dollars or US dollars on 17 May 2018 to shareholders on the UK register of members at the close of business in the UK on 9 March 2018. The dividend will be paid in Indian rupees on 17 May 2018 to Indian Depository Receipt holders on the Indian register at the close of business in India on 9 March 2018.
It is intended that shareholders on the UK register and Hong Kong branch register will be able to receive shares credited as fully paid instead of all or part of the fi nal cash dividend. Details of the dividend arrangements will be sent to shareholders on or around 26 March 2018. Indian Depository Receipt holders will receive their dividend in Indian rupees only.

227
Ris
k re
vie
w a
nd
cap
ital re
vie
wS
trate
gic
rep
ort
Su
pp
lem
en
tary
info
rmatio
nF
INA
NC
IAL
ST
AT
EM
EN
TS
Dire
cto
rs’ re
po
rt
12. Earnings per ordinary share
Accounting policy
The Group measures earnings per share on an underlying basis. This differs from earnings defi ned in IAS 33 Earnings per share. Underlying earnings is profi t/(loss) attributable to ordinary shareholders adjusted for profi ts or losses of a capital nature; amounts consequent to investment transactions driven by strategic intent; and other infrequent and/or exceptional transactions that are signifi cant or material in the context of the Group’s normal business earnings for the period.
The table below provides the basis of underlying earnings.
2017
$million
2016
$million
Profi t/(loss) for the year attributable to equity holders 1,268 (191)
Non-controlling interest (49) (56)
Dividend payable on preference shares and AT1 classifi ed as equity (445) (231)
Profi t/(loss) for the year attributable to ordinary shareholders 774 (478)
Items normalised:
Restructuring 353 855
Gains arising on repurchase of subordinated liabilities – (84)
Goodwill impairment (note 9) 320 166
Net gain on business disposed and available-for-sale fi nancial instruments (included within note 6) (78) (253)
Impact of US Tax Reform (note 10) 220 –
Tax on normalised items1 (36) (95)
Underlying profi t 1,553 111
Basic – Weighted average number of shares (millions) 3,293 3,291
Diluted – Weighted average number of shares (millions) 3,325 3,305
Basic earnings/(loss) per ordinary share (cents) 23.5 (14.5)
Diluted earnings/(loss) per ordinary share (cents) 23.3 (14.5)2
Underlying basic earnings per ordinary share (cents) 47.2 3.4
Underlying diluted earnings per ordinary share (cents) 46.7 3.42
1 No tax is included in respect of the impairment of goodwill as no tax relief is available
2 The impact of any diluted options has been excluded from this amount as required by IAS 33 Earnings per share
13. Financial instruments
Classifi cation and measurement
Accounting policy
The Group classifi es its fi nancial assets into the following measurement categories: fi nancial assets held at fair value through profi t or loss; loans and receivables; held-to-maturity; or available-for-sale.
Financial liabilities are classifi ed as either held at fair value through profi t or loss or at amortised cost.
Management determines the classifi cation of its fi nancial assets and liabilities at initial recognition.
The following details the approach for the categories:
a) Financial assets and liabilities held at fair value through profi t or loss: This category has two sub-categories:
Financial assets and liabilities held for trading: A fi nancial asset or liability is classifi ed as held for trading if acquired principally for the purpose of selling in the short term, or forms part of a portfolio of fi nancial instruments which are managed together and for which there is evidence of short-term profi t-taking or is a derivative (excluding qualifying hedging relationships)
Designated at fair value through profi t or loss: Financial assets and liabilities may be designated at fair value through profi t or loss when:
– The designation eliminates or signifi cantly reduces a measurement or recognition inconsistency that would otherwise arise from measuring assets or liabilities on a different basis (for example, the Group may designate certain fi xed rate loans and receivables that are managed with derivative interest rate swaps)
– A group of fi nancial assets and/or liabilities is managed and its performance evaluated on a fair value basis (for example, the Group may designate issued debt to fund a portfolio of trading assets and liabilities that are all managed on a fair value basis)
– The assets or liabilities include embedded derivatives and such derivatives are required to be recognised separately
b) Loans and receivables are non-derivative fi nancial assets with fi xed or determinable payments that are not quoted in an active market and it is expected that apart from credit deterioration substantially all of the initial investment will be recovered.
Standard Chartered
Annual Report 2017 228
FINANCIAL STATEMENTSNotes to the fi nancial statements
13. Financial instruments continued
c) Held-to-maturity assets are non-derivative fi nancial assets with fi xed or determinable payments and fi xed maturities that the Group’s management has the intention and ability to hold to maturity.
d) Available-for-sale assets are those non-derivative fi nancial assets intended to be held for an indefi nite period of time, which may be sold in response to liquidity requirements or changes in interest rates, exchange rates, commodity prices or equity prices.
e) Financial liabilities held at amortised cost: Financial liabilities, which include borrowings not classifi ed as held at fair value through profi t or loss, are classifi ed as amortised cost instruments. Preference shares which carry a mandatory coupon that represents a market rate of interest at the issue date, or which are redeemable on a specifi c date or at the option of the shareholders, are classifi ed as fi nancial liabilities and are presented in other borrowed funds. The dividends on these preference shares are recognised in the income statement as interest expense on an amortised cost basis using the effective interest method.
A fi nancial guarantee issued is a special case of fi nancial liability. Under a fi nancial guarantee contract, the Group, in return for a fee, undertakes to meet a customer’s obligations under the terms of a debt instrument if the customer fails to do so. A fi nancial guarantee is recognised as a liability; initially at fair value and, if not designated as at fair value through profi t or loss, subsequently at the higher of its initial value less cumulative amortisation and any provision under the contract measured in accordance with IAS 37 Provisions, Contingent Liabilities and Contingent Assets. Amortisation is calculated so as to recognise fees receivable in profi t or loss over the period of the guarantee.
Initial recognition of fi nancial instrumentsAll fi nancial instruments are initially recognised at fair value, which is normally the transaction price plus, for those fi nancial assets and liabilities not carried at fair value through profi t or loss, directly attributable transaction costs.
In certain circumstances the initial fair value may be based on a valuation technique which may lead to the recognition of profi ts or losses at the time of initial recognition. However, these profi ts or losses can only be recognised when the valuation technique used is based primarily on observable market data. In those cases where the initially recognised fair value is based on a valuation model that uses inputs which are not observable in the market, the difference between the transaction price and the valuation model is not recognised immediately in the income statement. The difference is amortised to the income statement until the inputs become observable, or the transaction matures or is terminated.
Regular way purchases and sales of fi nancial assets and liabilities held at fair value through profi t or loss, and fi nancial assets classifi ed as held-to-maturity and available-for-sale, are initially recognised on the trade date (the date on which the Group commits to purchase or sell the asset). Regular way loans are recognised on settlement date when cash is advanced to the borrowers.
Subsequent measurementFinancial assets and liabilities held at fair value through profi t or loss are carried at fair value, with gains and losses arising from changes in fair value taken directly to the net trading income line in the income statement except for changes in fair value on fi nancial liabilities designated at fair value attributable to the Group’s own credit presented directly within other comprehensive income.
Available-for-sale fi nancial assets are carried at fair value, with gains and losses arising from changes in fair value taken to the available-for-sale reserve within equity until the asset is sold, or is impaired, when the cumulative gain or loss is transferred to the income statement.
Loans and receivables are carried at amortised cost using the effective interest method.
Held-to-maturity fi nancial assets are carried at amortised cost using the effective interest method.
Financial liabilities are stated at amortised cost, with any difference between proceeds net of directly attributable transaction costs and the redemption value recognised in the income statement over the period of the borrowings using the effective interest method.
In addition to these instruments, the carrying value of a fi nancial instrument carried at amortised cost that is the hedged item in a qualifying fair value hedge relationship is adjusted by the fair value gain or loss attributable to the hedged risk.
Derecognition
Financial assets are derecognised when the rights to receive cash fl ows from the fi nancial assets have expired or where the Group has transferred substantially all risks and rewards of ownership. If substantially all the risks and rewards have been neither retained nor transferred and the Group has retained control, the assets continue to be recognised to the extent of the Group’s continuing involvement.
Financial liabilities are derecognised when they are extinguished. A fi nancial liability is extinguished when the obligation is discharged, cancelled or expires.
If the Group purchases its own debt, it is removed from the balance sheet and the difference between the carrying amount of the liability and the consideration paid is included in other income.

229
Ris
k re
vie
w a
nd
cap
ital re
vie
wS
trate
gic
rep
ort
Su
pp
lem
en
tary
info
rmatio
nF
INA
NC
IAL
ST
AT
EM
EN
TS
Dire
cto
rs’ re
po
rt
13. Financial instruments continued
Reclassifi cation of fi nancial instruments:
Reclassifi cations of fi nancial assets or fi nancial liabilities between measurement categories are not permitted following initial recognition, other than:
Held for trading non-derivative fi nancial assets can only be transferred out of the held at fair value through profi t or loss category in the following circumstances: to the available-for-sale category, where, in rare circumstances, they are no longer held for the purpose of selling or repurchasing in the near term; or to the loan and receivables category, where they are no longer held for the purpose of selling or repurchasing in the near term and they would have met the defi nition of a loan and receivable at the date of reclassifi cation and the Group has the intent and ability to hold the assets for the foreseeable future or until maturity
Financial assets can only be transferred out of the available-for-sale category to the loan and receivables category where they would have met the defi nition of a loan and receivable at the date of reclassifi cation and the Group has the intent and ability to hold the assets for the foreseeable future or until maturity
Change in comparatives
Reverse repurchase agreements and other similar secured lending have been reported separately from loans and advances to banks and customers. Similarly, repurchase agreements and other similar secured borrowing have been reported separately from deposits by banks and customer accounts. Prior year comparatives have been re-presented to refl ect this change.
The Group’s classifi cation of its fi nancial assets and liabilities is summarised in the following tables.
Assets Notes
Assets at fair value Assets at amortised cost
Total
$million
Trading
$million
Derivatives
held for
hedging
$million
Designated
at fair value
through
profi t or loss
$million
Available-
for-sale
$million
Total
fi nancial
assets at
fair value
$million
Loans and
receivables
$million
Held-to-
maturity
$million
Cash and balances at central banks – – – – – 58,864 – 58,864
Financial assets held at fair value through profi t or loss
Loans and advances to banks1 320 – 2,252 – 2,572 – – 2,572
Loans and advances to customers1 1,689 – 1,229 – 2,918 – – 2,918
Reverse repurchase agreements and other similar secured lending 17 454 – 458 – 912 – – 912
Debt securities and other eligible bills 13 19,318 – 393 – 19,711 – – 19,711
Equity shares 13 718 – 733 – 1,451 – – 1,451
22,499 – 5,065 – 27,564 – – 27,564
Derivative fi nancial instruments 14 46,333 698 – – 47,031 – – 47,031
Loans and advances to banks1 16 – – – – – 57,494 – 57,494
Loans and advances to customers1 16 – – – – – 248,707 – 248,707
Reverse repurchase agreements and other similar secured lending 17 – – – – – 54,275 – 54,275
Investment securities
Debt securities and other eligible bills 15 – – – 109,161 109,161 2,630 4,340 116,131
Equity shares 15 – – – 894 894 – – 894
– – – 110,055 110,055 2,630 4,340 117,025
Other assets 21 – – – – – 29,922 – 29,922
Assets held for sale 21 – – 466 – 466 62 – 528
Total at 31 December 2017 68,832 698 5,531 110,055 185,116 451,954 4,340 641,410
1 Further analysed in Risk review and Capital review (pages 122 to 143)

Standard Chartered
Annual Report 2017 230
FINANCIAL STATEMENTSNotes to the fi nancial statements
13. Financial instruments continued
Assets Notes
Assets at fair value Assets at amortised cost
Total
$million
Trading
$million
Derivatives
held for
hedging
$million
Designated at
fair value
through profi t
or loss
$million
Available-
for-sale
$million
Total fi nancial
assets at
fair value
$million
Loans and
receivables
$million
Held-to-
maturity
$million
Cash and balances at central banks – – – – – 70,706 – 70,706
Financial assets held at fair value through profi t or loss
Loans and advances to banks1 267 – 1,296 – 1,563 – – 1,563
Loans and advances to customers1 614 – 2,241 – 2,855 – – 2,855
Reverse repurchase agreements and other similar secured lending 17 322 – 497 – 819 – – 819
Debt securities and other eligible bills 13 13,310 – 354 – 13,664 – – 13,664
Equity shares 13 425 – 751 – 1,176 – – 1,176
14,938 – 5,139 – 20,077 – – 20,077
Derivative fi nancial instruments 14 64,433 1,076 – – 65,509 – – 65,509
Loans and advances to banks1 16 – – – – – 54,538 – 54,538
Loans and advances to customers1 16 – – – – – 226,693 – 226,693
Reverse repurchase agreements and other similar secured lending 17 – – – – – 44,097 – 44,097
Investment securities
Debt securities and other eligible bills 15 – – – 104,308 104,308 3,106 170 107,584
Equity shares 15 – – – 1,388 1,388 – – 1,388
– – – 105,696 105,696 3,106 170 108,972
Other assets 21 – – – – – 33,942 – 33,942
Assets held for sale 21 – – – – – 1,102 – 1,102
Total at 31 December 2016 79,371 1,076 5,139 105,696 191,282 434,184 170 625,636
1 Further analysed in Risk review and Capital review (pages 122 to 143)
Liabilities Notes
Liabilities at fair value
Amortised
cost
$million
Total
$million
Trading
$million
Derivatives
held for
hedging
$million
Designated
at fair value
through
profi t or loss
$million
Total
fi nancial
liabilities at
fair value
$million
Financial liabilities held at fair value through profi t or loss
Deposits by banks – – 737 737 – 737
Customer accounts – – 5,236 5,236 – 5,236
Debt securities in issue 22 – – 7,023 7,023 – 7,023
Short positions 3,637 – – 3,637 – 3,637
3,637 – 12,996 16,633 – 16,633
Derivative fi nancial instruments 14 46,558 1,543 – 48,101 – 48,101
Deposits by banks – – – – 30,945 30,945
Customer accounts – – – – 370,509 370,509
Repurchase agreements and other similar secured borrowing 17 – – – – 39,783 39,783
Debt securities in issue 22 – – – – 46,379 46,379
Other liabilities 23 – – – – 34,982 34,982
Subordinated liabilities and other borrowed funds 27 – – – – 17,176 17,176
Liabilities included in disposal groups held for sale 23 – – – – – –
Total at 31 December 2017 50,195 1,543 12,996 64,734 539,774 604,508

231
Ris
k re
vie
w a
nd
cap
ital re
vie
wS
trate
gic
rep
ort
Su
pp
lem
en
tary
info
rmatio
nF
INA
NC
IAL
ST
AT
EM
EN
TS
Dire
cto
rs’ re
po
rt
13. Financial instruments continued
Liabilities Notes
Liabilities at fair value
Amortised
cost
$million
Total
$million
Trading
$million
Derivatives
held for
hedging
$million
Designated at
fair value
through profi t
or loss
$million
Total fi nancial
liabilities at
fair value
$million
Financial liabilities held at fair value through profi t or loss
Deposits by banks – – 718 718 – 718
Customer accounts – – 6,447 6,447 – 6,447
Debt securities in issue 22 – – 5,670 5,670 – 5,670
Short positions 3,763 – – 3,763 – 3,763
3,763 – 12,835 16,598 – 16,598
Derivative fi nancial instruments 14 62,917 2,795 – 65,712 – 65,712
Deposits by banks – – – – 32,872 32,872
Customer accounts – – – – 338,185 338,185
Repurchase agreements and other similar secured borrowing 17 – – – – 37,692 37,692
Debt securities in issue 22 – – – – 46,700 46,700
Other liabilities 23 – – – – 32,958 32,958
Subordinated liabilities and other borrowed funds 27 – – – – 19,523 19,523
Liabilities included in disposal groups held for sale 23 – – – – 958 958
Total at 31 December 2016 66,680 2,795 12,835 82,310 508,888 591,198
Debt securities, other eligible bills and equity shares held at fair value through profi t or loss2017
Debt securities
and other
eligible bills
$million
Equity shares
$million
Total
$million
Issued by public bodies:
Government securities 10,540
Other public sector securities 68
10,608
Issued by banks:
Certifi cates of deposit 512
Other debt securities 3,270
3,782
Issued by corporate entities and other issuers:
Other debt securities 5,321
Total debt securities and other eligible bills 19,711
Of which:
Listed on a recognised UK exchange 238 92 330
Listed elsewhere 13,430 575 14,005
Unlisted 6,043 784 6,827
19,711 1,451 21,162
Market value of listed securities 13,668 667 14,335

Standard Chartered
Annual Report 2017 232
FINANCIAL STATEMENTSNotes to the fi nancial statements
13. Financial instruments continued
Debt securities, other eligible bills and equity shares held at fair value through profi t or loss continued2016
Debt securities
and other
eligible bills
$million
Equity shares
$million
Total
$million
Issued by public bodies:
Government securities 8,628
Other public sector securities 77
8,705
Issued by banks:
Certifi cates of deposit 406
Other debt securities 1,546
1,952
Issued by corporate entities and other issuers:
Other debt securities 3,007
Total debt securities and other eligible bills 13,664
Of which:
Listed on a recognised UK exchange 164 – 164
Listed elsewhere 8,099 44 8,143
Unlisted 5,401 1,132 6,533
13,664 1,176 14,840
Market value of listed securities 8,263 44 8,307
Offsetting of fi nancial instruments
Financial assets and liabilities are offset and the net amount reported in the balance sheet when there is a legally enforceable right to offset the recognised amounts and there is an intention to settle on a net basis, or to realise the asset and settle the liability simultaneously.
In practice, for credit mitigation, the Group is able to offset assets and liabilities which do not meet the IAS 32 netting criteria set out above. Such arrangements include master netting arrangements for derivatives and global master repurchase agreements for repurchase and reverse repurchase transactions. These agreements generally allow that all outstanding transactions with a particular counterparty can be offset but only in the event of default or other predetermined events.
In addition the Group also receives and pledges readily realisable collateral for derivative transactions to cover net exposure in the event of a default. Under repurchase and reverse repurchase agreements the Group pledges (legally sells) and obtains (legally purchases) respectively, highly liquid assets which can be sold in the event of a default.
The following tables set out the impact of netting on the balance sheet. This comprises derivative transactions settled through an enforceable netting agreement where we have the intent and ability to settle net and which are offset on the balance sheet.
2017
Gross amounts
of recognised
fi nancial
instruments
$million
Impact of
offset in the
balance sheet
$million
Net amounts
of fi nancial
instruments
presented in the
balance sheet
$million
Related amount not offset
in the balance sheet
Net amount
$million
Financial
instruments
$million
Financial
collateral
$million
Assets
Derivative fi nancial instruments 54,619 (7,588) 47,031 (29,135) (9,825) 8,071
Reverse repurchase agreements and other similar secured lending 61,520 (6,333)1 55,187 – (55,187) –
At 31 December 2017 116,139 (13,921) 102,218 (29,135) (65,012) 8,071
Liabilities
Derivative fi nancial instruments 55,689 (7,588) 48,101 (29,135) (9,513) 9,453
Repurchase agreements and other similar secured borrowing 46,116 (6,333)1 39,783 – (39,783) –
At 31 December 2017 101,805 (13,921) 87,884 (29,135) (49,296) 9,453
1 Increase in offset has been achieved through confi rmation of single settlement from each bilateral counterparty. As a result the repurchase and reverse repurchase balances have
decreased at year end by $6.3 billion

233
Ris
k re
vie
w a
nd
cap
ital re
vie
wS
trate
gic
rep
ort
Su
pp
lem
en
tary
info
rmatio
nF
INA
NC
IAL
ST
AT
EM
EN
TS
Dire
cto
rs’ re
po
rt
13. Financial instruments continued
Offsetting of fi nancial instruments continued2016
Gross amounts
of recognised
fi nancial
instruments
$million
Impact of
offset in the
balance sheet
$million
Net amounts
of fi nancial
instruments
presented in the
balance sheet
$million
Related amount not offset
in the balance sheet
Net amount
$million
Financial
instruments
$million
Financial collateral
$million
Assets
Derivative fi nancial instruments 73,822 (8,313) 65,509 (40,391) (9,624) 15,494
Reverse repurchase agreements and other similar secured lending 44,916 – 44,916 – (44,916) –
At 31 December 2016 118,738 (8,313) 110,425 (40,391) (54,540) 15,494
Liabilities
Derivative fi nancial instruments 74,025 (8,313) 65,712 (40,391) (14,230) 11,091
Repurchase agreements and other similar secured borrowing 37,692 – 37,692 – (37,692) –
At 31 December 2016 111,717 (8,313) 103,404 (40,391) (51,922) 11,091
Related amounts not offset in the balance sheet comprises:
Financial instruments not offset in the balance sheet, but covered by an enforceable netting arrangement. This comprises master netting arrangements held against derivative fi nancial instruments and excludes the effect of over-collateralisation
Financial collateral – This comprises cash collateral pledged and received for derivative fi nancial instruments and collateral bought and sold for reverse repurchase and repurchase agreements respectively and excludes the effect of over-collateralisation
Loans and advances designated at fair value through profi t or loss
The maximum exposure to credit risk for loans and advances to banks and customers and reverse repurchase and other similar secured lending designated at fair value through profi t or loss was $3,939 million (2016: $4,034 million). The net fair value gain on loans and advances to banks and customers and reverse repurchase and other similar secured lending designated at fair value through profi t or loss was $23 million (2016: $17 million). Of this, $1 million (2016: $1 million) relates to changes in credit risk. The cumulative fair value loss attributable to changes in credit risk was $1 million (2016: $2 million). Further details of the Group’s valuation technique is described in this note (page 234).
Financial liabilities designated at fair value through profi t or loss2017
$million
2016
$million
Carrying balance aggregate fair value 12,996 12,835
Amount contractually obliged to repay at maturity 13,052 12,941
Difference between aggregate fair value and contractually obliged to repay at maturity (56) (106)
Cumulative change in fair value accredited to credit risk difference 82 331
The net fair value loss on fi nancial liabilities designated at fair value through profi t or loss was $202 million for the period (2016: net loss of $178 million). Further details of the Group’s own credit adjustment (OCA) valuation technique is described later in this note.

Standard Chartered
Annual Report 2017 234
FINANCIAL STATEMENTSNotes to the fi nancial statements
13. Financial instruments continued
Valuation of fi nancial instruments
Fair value is the price that would be received to sell an asset or paid to transfer a liability in an orderly transaction between market participants at the measurement date in the principal market or, in the absence of this, the most advantageous market to which the Group has access at that date. The fair value of a liability refl ects the Group’s non-performance risk. The fair value of fi nancial instruments is generally measured on the basis of the individual fi nancial instrument. However, when a group of fi nancial assets and fi nancial liabilities is managed on the basis of its net exposure to either market risks or credit risk, the fair value of the group of fi nancial instruments is measured on a net basis.
The fair values of quoted fi nancial assets and liabilities in active markets are based on current prices. A market is regarded as active if transactions for the asset or liability take place with suffi cient frequency and volume to provide pricing information on an ongoing basis. Wherever possible, fair values have been calculated using unadjusted quoted market prices in active markets for identical instruments held by the Group. Where quoted market prices are not available, or are unreliable because of poor liquidity, fair values have been determined using valuation techniques which, to the extent possible, use market observable inputs, but in some cases use non-market observable inputs. Valuation techniques used include discounted cash fl ow analysis and pricing models and, where appropriate, comparison with instruments that have characteristics similar to those of the instruments held by the Group.
The Valuation Control function is responsible for independent price verifi cation, oversight of fair value and prudent value adjustments and escalation of valuation issues. Independent price verifi cation is the process of determining that the valuations incorporated into the fi nancial statements are validated independent of the business area responsible for the product. The Valuation Control function has oversight of the fair value adjustments to ensure the fi nancial instruments are priced to exit. These are key controls in ensuring the material accuracy of the valuations incorporated in the fi nancial statements. The market data used for price verifi cation may include data sourced from recent trade data involving external counterparties or third parties such as Bloomberg, Reuters, brokers and consensus pricing providers. Valuation Control performs a semi-annual review of the suitability of the market data used for price testing. Price verifi cation uses independently sourced data that is deemed most representative of the market the instruments trade in. To determine the quality of the market data inputs, factors such as independence, relevance, reliability, availability of multiple data sources and methodology employed by the pricing provider are taken into consideration.
Formal committees for the business clusters, consisting of representatives from Group Market Risk, Product Control, Valuation Control and the business meet monthly to discuss and approve the valuations of the inventory. For Principal Finance, the Investment Committee meeting is held on a quarterly basis to review investments and valuations. The business cluster valuation committees fall under the Valuation Benchmarks Committee as part the of the valuation governance structure.
Signifi cant accounting estimates and judgementsThe Group evaluates the signifi cance of fi nancial instruments and material accuracy of the valuations incorporated in the fi nancial statements as they involve a high degree of judgement and estimation uncertainty in determining the carrying values of fi nancial assets and liabilities at the balance sheet date.
Fair value of fi nancial instruments are determined using valuation techniques (see below) which, to the extent possible, use market observable inputs, but in some cases use non-market observable inputs. Changes in the observability of signifi cant valuation inputs can materially affect the fair values of fi nancial instruments
When establishing the exit price of a fi nancial instrument using a valuation technique, the Group considers valuation adjustments in determining the fair value (page 236)
In determining the valuation of fi nancial instruments, the Group makes judgements on the amounts reserved to cater for model and valuation risks, which cover both Level 2 and Level 3 assets, and the signifi cant valuation judgements in respect of Level 3 instruments (page 237)
Where the measurement of fair value is more judgemental in respect of Level 3 assets, these are valued based on models that use a signifi cant degree of non-market-based unobservable inputs
Valuation techniques
Refer to the fair value hierarchy explanation – Level 1, 2 and 3 (page 237)
Financial instruments held at fair value
– Loans and advances: These include loans in the global syndications business which were not syndicated as of the balance sheet date and other fi nancing transactions within Financial Markets. These loans are generally bilateral in nature and, where available, their valuation is based on market observable credit spreads. If observable credit spreads are not available, proxy spreads based on comparable loans with similar credit grade, sector, and region, are used. Where observable credit spreads and market standard proxy methods are available, these loans are classifi ed as Level 2. Where there are no recent transactions or comparable loans, these loans are classifi ed as Level 3
– Debt securities – asset backed securities: Asset backed securities are priced based on external prices obtained from consensus pricing providers, broker quotes, recent trades, arrangers’ quotes, etc. Where an observable price is available for a given security, it is classifi ed as Level 2. In instances where third-party prices are not available or reliable, the security is classifi ed as Level 3. The fair value of Level 3 securities is estimated using market standard cash fl ow models with input parameter assumptions which include prepayment speeds, default rates, discount margins derived from comparable securities with similar vintage, collateral type, and credit ratings. Therefore, once external pricing has been verifi ed, an assessment is made whether each security is traded with signifi cant liquidity based on its credit rating and sector. If a security is of high credit rating and is traded in a liquid sector, it will be classifi ed as Level 2, otherwise it will be classifi ed as Level 3

235
Ris
k re
vie
w a
nd
cap
ital re
vie
wS
trate
gic
rep
ort
Su
pp
lem
en
tary
info
rmatio
nF
INA
NC
IAL
ST
AT
EM
EN
TS
Dire
cto
rs’ re
po
rt
13. Financial instruments continued
Valuation techniques continued
– Other debt securities: These debt securities include convertible bonds, corporate bonds, credit and structured notes. Where quoted prices are available through pricing vendors, brokers or observable trading activities from liquid markets, these are classifi ed as Level 2 and valued using such quotes. Where there are signifi cant valuation inputs which are unobservable in the market, due to illiquid trading or the complexity of the product, these are classifi ed as Level 3. The valuations of these debt securities are implied using input parameters such as bond spreads and credit spreads. These input parameters are determined with reference to the same issuer (if available) or proxied from comparable issuers or assets
– Equity shares – private equity: The majority of private equity unlisted investments are valued based on earning multiples – Price-to-Earnings (P/E) or enterprise value to earnings before income tax, depreciation and amortisation (EV/EBITDA) ratios – of comparable listed companies. The two primary inputs for the valuation of these investments are the actual or forecast earnings of the investee companies and earning multiples for the comparable listed companies. To ensure comparability between these unquoted investments and the comparable listed companies, appropriate adjustments are also applied (for example, liquidity and size) in the valuation. In circumstances where an investment does not have direct comparables or where the multiples for the comparable companies cannot be sourced from reliable external sources, alternate valuation techniques (for example, discounted cash fl ow models), which use predominantly unobservable inputs or Level 3 inputs, may be applied. Even though earning multiples for the comparable listed companies can be sourced from third-party sources (for example, Bloomberg), and those inputs can be deemed Level 2 inputs, all unlisted investments (excluding those where observable inputs are available, for example, over-the-counter (OTC) prices) are classifi ed as Level 3 on the basis that the valuation methods involve judgments ranging from determining comparable companies to discount rates where the discounted cash fl ow method is applied
– Derivatives: Derivative products are classifi ed as Level 2 if the valuation of the product is based upon input parameters which are observable from independent and reliable market data sources. Derivative products are classifi ed as Level 3 if there are signifi cant valuation input parameters which are unobservable in the market, such as products where the performance is linked to more than one underlying variable. Examples are foreign exchange basket options, equity options based on the performance of two or more underlying indices and interest rate products with quanto payouts. In most cases these unobservable correlation parameters cannot be implied from the market, and methods such as historical analysis and comparison with historical levels or other benchmark data must be employed
– Debt securities in issue: These debt securities relate to structured notes issued by the Group. Where independent market data is available through pricing vendors and broker sources these positions are classifi ed as Level 2. Where such liquid external prices are not available, valuation of these debt securities are implied using input parameters such as bond spreads and credit spreads, and are classifi ed as Level 3. These input parameters are determined with reference to the same issuer (if available) or proxies from comparable issuers or assets
Financial instruments held at amortised cost
The following sets out the Group’s basis of establishing fair values of amortised cost fi nancial instruments and their classifi cation between Levels 1, 2 and 3. As certain categories of fi nancial instruments are not actively traded, there is a signifi cant level of management judgement involved in calculating the fair values:
– Cash and balances at central banks: The fair value of cash and balances at central banks is their carrying amounts
– Loans and advances to banks and customers: For loans and advances to banks, the fair value of fl oating rate placements and overnight deposits is their carrying amounts. The estimated fair value of fi xed interest bearing deposits is based on discounted cash fl ows using the prevailing money market rates for debts with a similar credit risk and remaining maturity. The Group’s loans and advances to the customers’ portfolio is well diversifi ed by geography and industry. Approximately a quarter of the portfolio re-prices within one month, and approximately half re-prices within 12 months. Loans and advances are presented net of provisions for impairment. The fair value of loans and advances to customers with a residual maturity of less than one year generally approximates the carrying value. The estimated fair value of loans and advances with a residual maturity of more than one year represents the discounted amount of future cash fl ows expected to be received, including assumptions relating to prepayment rates and, credit risk/credit spreads. Expected cash fl ows are discounted at current market rates to determine fair value. The Group has a wide range of individual instruments within its loans and advances portfolio and as a result providing quantifi cation of the key assumptions used to value such instruments is impractical
– Investment securities: For investment securities that do not have directly observable market values, the Group utilises a number of valuation techniques to determine fair value. Where available, securities are valued using inputs proxies from the same or closely related underlying (for example, bond spreads from the same or closely related issuer) or inputs proxies from a different underlying (for example, a similar bond but using spreads for a particular sector and rating). Certain instruments cannot be proxies as set out above, and in such cases the positions are valued using non-market observable inputs. This includes those instruments held at amortised cost and predominantly relates to asset backed securities. The fair value for such instruments is usually proxies from internal assessments of the underlying cash fl ows
– Deposits and borrowings: The estimated fair value of deposits with no stated maturity is the amount repayable on demand. The estimated fair value of fi xed interest bearing deposits and other borrowings without quoted market prices is based on discounted cash fl ows using the prevailing market rates for debts with a similar credit risk and remaining maturity
– Debt securities in issue, subordinated liabilities and other borrowed funds: The aggregate fair values are calculated based on quoted market prices. For those notes where quoted market prices are not available, a discounted cash fl ow model is used based on a current market-related yield curve appropriate for the remaining term to maturity
– Other assets: Other assets comprise primarily of cash collateral and trades pending settlement. The carrying amount of these fi nancial instruments is considered to be a reasonable approximation of fair value as they are either short term in nature or re-price to current market rates frequently

Standard Chartered
Annual Report 2017 236
FINANCIAL STATEMENTSNotes to the fi nancial statements
13. Financial instruments continued
Fair value adjustments
When establishing the exit price of a fi nancial instrument using a valuation technique, the Group considers adjustments to the modelled price which market participants would make when pricing that instrument. The main valuation adjustments (described further below) in determining fair value for fi nancial assets and fi nancial liabilities are as follows:
2017
$million
2016
$million
Bid-offer valuation adjustment 82 106
CVA 229 466
DVA (66) (23)
Model valuation adjustment 6 6
FVA 79 248
Others (including day one) 148 132
Total 478 935
Bid-offer valuation adjustment: Where market parameters are marked on a mid-market basis in the revaluation systems, a bid offer valuation adjustment is required to quantify the expected cost of neutralising the business’ positions through dealing away in the market, thereby bringing long positions to bid and short positions to offer. The methodology to calculate the bid-offer adjustment for a derivative portfolio involves netting between long and short positions and the grouping of risk by strike and tenor based on the hedging strategy where long positions are marked to bid and short positions marked to offer in the systems
Credit valuation adjustment (CVA): The Group makes CVA adjustment against the fair value of derivative products. CVA is an adjustment to the fair value of the transactions to refl ect the possibility that our counterparties may default and we may not receive the full market value of the outstanding transactions. It represents an estimate of the adjustment a market participant would include when deriving a purchase price to acquire our exposures. CVA is calculated for each subsidiary, and within each entity for each counterparty to which the entity has exposure and takes account of any collateral we may hold. The Group calculates the CVA by applying the probability of default (PD) on the potential estimated future positive exposure of the counterparty using market-implied PD. Where market-implied data is not readily available, we use market-based proxies to estimate the PD. Wrong-way risk arises when the underlying value of the derivative prior to any CVA is positively correlated to the probability of default by the counterparty and the Group has implemented a model to capture this impact for certain key wrong way exposures. The Group continues to include ‘wrong-way risk’ in its Prudential Valuation Adjustments
Debit valuation adjustment (DVA): The Group calculates DVA adjustments on its derivative liabilities to refl ect changes in its own credit standing. The Group’s DVA adjustments will increase if its credit standing worsens and, conversely, decrease if its credit standing improves. The Group’s DVA adjustments will reverse over time as its derivatives mature. For derivative liabilities, a DVA adjustment is determined by applying the Group’s probability of default to the Group’s negative expected exposure against the counterparty. The Group’s probability of default and loss expected in the event of default is derived based on internally assessed credit ratings and market standard recovery levels. The expected exposure is modelled based on simulation methodology and is generated through simulation of underlying risk factors over the life of the deal booked against the particular counterparty. This simulation methodology incorporates the collateral posted by the Group and the effects of master netting agreements. In December 2017, the Group refi ned its methodology used to calculate DVA to better align with current industry practice. This change in calculation methodology is treated as a change in estimate and resulted in an increase in the DVA balance of $66 million
Model valuation adjustment: Valuation models may have pricing defi ciencies or limitations that require a valuation adjustment. These pricing defi ciencies or limitations arise due to the choice, implementation and calibration of the pricing model
Funding valuation adjustment (FVA): The Group makes FVA adjustments against derivative products. FVA refl ects an estimate of the adjustment to its fair value that a market participant would make to incorporate funding costs that could arise in relation to the exposure. FVA is calculated by determining the net expected exposure at a counterparty level and then applying a funding rate to those exposures that refl ect the market cost of funding. The FVA for collateralised derivatives is based on discounting the expected future cash fl ows at the relevant overnight indexed swap (OIS) rate after taking into consideration the terms of the underlying collateral agreement with the counterparty. The FVA for uncollateralised (including partially collateralised) derivatives incorporates the estimated present value of the market funding cost or benefi t associated with funding these transactions
Day one profi t and loss: In certain circumstances the initial fair value may be based on a valuation technique which may lead to the recognition of profi ts or losses at the time of initial recognition. However, these profi ts or losses can only be recognised when the valuation technique used is based primarily on observable market data. In those cases where the initially recognised fair value is based on a valuation model that uses inputs which are not observable in the market, the difference between the transaction price and the valuation model is not recognised immediately in the income statement. The difference is amortised to the income statement until the inputs become observable, or the transaction matures or is terminated
In addition, the Group calculates own credit adjustment (OCA) on its issued debt designated at fair value, including structured notes, in order to refl ect changes in its own credit standing. The Group’s OCA adjustments will increase if its credit standing worsens and, conversely, decrease if its credit standing improves. The Group’s OCA adjustments will reverse over time as its liabilities mature. For issued debt and structured notes designated at fair value, an OCA adjustment is determined by discounting the contractual cash fl ows using a yield curve adjusted for market observed secondary senior debt issuance spreads above average interbank rates. The OCA is $82 million (2016: $331 million).

237
Ris
k re
vie
w a
nd
cap
ital re
vie
wS
trate
gic
rep
ort
Su
pp
lem
en
tary
info
rmatio
nF
INA
NC
IAL
ST
AT
EM
EN
TS
Dire
cto
rs’ re
po
rt
13. Financial instruments continued
Fair value hierarchy – Financial instruments held at fair value
Assets and liabilities carried at fair value or for which fair values are disclosed have been classifi ed into three levels according to the observability of the signifi cant inputs used to determine the fair values. Changes in the observability of signifi cant valuation inputs during the reporting period may result in a transfer of assets and liabilities within the fair value hierarchy. The Group recognises transfers between levels of the fair value hierarchy when there is a signifi cant change in either its principal market or the level of observability of the inputs to the valuation techniques as at the end of the reporting period.
Level 1: Fair value measurements are those derived from unadjusted quoted prices in active markets for identical assets or liabilities
Level 2: Fair value measurements are those with quoted prices for similar instruments in active markets or quoted prices for identical or similar instruments in inactive markets and fi nancial instruments valued using models where all signifi cant inputs are observable
Level 3: Fair value measurements are those where at least one input which could have a signifi cant effect on the instrument’s valuation is not based on observable market data
The following tables show the classifi cation of fi nancial instruments held at fair value into the valuation hierarchy:
AssetsLevel 1
$million
Level 2
$million
Level 3
$million
Total
$million
Financial instruments held at fair value through profi t or loss
Loans and advances to banks – 2,501 71 2,572
Loans and advances to customers – 2,792 126 2,918
Reverse repurchase agreements and other similar secured lending – 912 – 912
Debt securities and other eligible bills 5,860 13,800 51 19,711
Of which:
Government bonds and treasury bills 4,988 5,531 – 10,519
Issued by corporates other than fi nancial institutions 171 4,017 48 4,236
Issued by fi nancial institutions 701 4,252 3 4,956
Equity shares 725 – 726 1,451
Derivative fi nancial instruments 402 46,589 40 47,031
Of which:
Foreign exchange 97 35,641 17 35,755
Interest rate 2 10,065 7 10,074
Commodity 303 609 2 914
Credit – 249 – 249
Equity and stock index – 25 14 39
Investment securities
Debt securities and other eligible bills 61,246 47,511 404 109,161
Of which:
Government bonds and treasury bills 51,257 21,364 318 72,939
Issued by corporates other than fi nancial institutions 5,648 7,590 86 13,324
Issued by fi nancial institutions 4,341 18,557 – 22,898
Equity shares 369 5 520 894
Total fi nancial instruments at 31 December 2017 68,602 114,110 1,938 184,650
Liabilities
Financial instruments held at fair value through profi t or loss
Deposits by banks – 668 69 737
Customer accounts – 5,236 – 5,236
Debt securities in issue – 6,581 442 7,023
Short positions 1,495 2,142 – 3,637
Derivative fi nancial instruments 470 47,606 25 48,101
Of which:
Foreign exchange 90 36,149 – 36,239
Interest rate 9 9,851 18 9,878
Commodity 371 590 – 961
Credit – 871 2 873
Equity and stock index – 145 5 150
Total fi nancial instruments at 31 December 2017 1,965 62,233 536 64,734
There have been no signifi cant changes to valuation or levelling approaches in 2017.
There are no signifi cant transfers of fi nancial assets and liabilities measured at fair value between Level 1 and Level 2 during the year.

Standard Chartered
Annual Report 2017 238
FINANCIAL STATEMENTSNotes to the fi nancial statements
13. Financial instruments continued
Fair value hierarchy – Financial instruments held at fair value continued
AssetsLevel 1
$million
Level 2
$million
Level 3
$million
Total
$million
Financial instruments held at fair value through profi t or loss
Loans and advances to banks – 1,563 – 1,563
Loans and advances to customers – 2,676 179 2,855
Reverse repurchase agreements and other similar secured lending – 819 – 819
Debt securities and other eligible bills 4,249 9,411 4 13,664
Of which:
Government bonds and treasury bills 4,044 4,242 – 8,286
Issued by corporates other than fi nancial institutions 77 2,467 3 2,547
Issued by fi nancial institutions 128 2,702 1 2,831
Equity shares 181 – 995 1,176
Derivative fi nancial instruments 513 64,636 360 65,509
Of which:
Foreign exchange 52 53,706 324 54,082
Interest rate 14 9,858 6 9,878
Commodity 447 879 – 1,326
Credit – 171 – 171
Equity and stock index – 22 30 52
Investment securities
Debt securities and other eligible bills 58,547 45,562 199 104,308
Of which:
Government bonds and treasury bills 47,002 14,491 173 61,666
Issued by corporates other than fi nancial institutions 6,928 7,741 24 14,693
Issued by fi nancial institutions 4,617 23,330 2 27,949
Equity shares 798 41 549 1,388
Total fi nancial instruments at 31 December 2016 64,288 124,708 2,286 191,282
Liabilities
Financial instruments held at fair value through profi t or loss
Deposits by banks – 718 – 718
Customer accounts – 6,447 – 6,447
Debt securities in issue – 5,140 530 5,670
Short positions 1,845 1,918 – 3,763
Derivative fi nancial instruments 547 64,849 316 65,712
Of which:
Foreign exchange 52 53,838 233 54,123
Interest rate 25 9,911 25 9,961
Commodity 470 628 – 1,098
Credit – 442 30 472
Equity and stock index – 30 28 58
Total fi nancial instruments at 31 December 2016 2,392 79,072 846 82,310
There are no signifi cant transfers of fi nancial assets and liabilities measured at fair value between Level 1 and Level 2 during 2016.

239
Ris
k re
vie
w a
nd
cap
ital re
vie
wS
trate
gic
rep
ort
Su
pp
lem
en
tary
info
rmatio
nF
INA
NC
IAL
ST
AT
EM
EN
TS
Dire
cto
rs’ re
po
rt
13. Financial instruments continued
Fair value hierarchy – fi nancial instruments measured at amortised cost
The following table shows the carrying amounts and incorporates the Group’s estimate of fair values of those fi nancial assets and liabilities not presented on the Group’s balance sheet at fair value. These fair values may be different from the actual amount that will be received or paid on the settlement or maturity of the fi nancial instrument. For certain instruments, the fair value may be determined using assumptions for which no observable prices are available.
Carrying value
$million
Fair value
Level 1
$million
Level 2
$million
Level 3
$million
Total
$million
Assets
Cash and balances at central banks1 58,864 – 58,864 – 58,864
Loans and advances to banks 57,494 – 57,388 4 57,392
Loans and advances to customers 248,707 – 14,644 234,812 249,456
Reverse repurchase agreements and other similar secured lending 54,275 – 23,068 31,218 54,286
Investment securities 6,970 – 6,955 36 6,991
Other assets1 29,922 – 29,922 – 29,922
Assets held for sale 62 – 62 – 62
At 31 December 2017 456,294 – 190,903 266,070 456,973
Liabilities
Deposits by banks 30,945 – 30,939 – 30,939
Customer accounts 370,509 – 370,489 – 370,489
Repurchase agreements and other similar secured borrowing 39,783 – 39,783 – 39,783
Debt securities in issue 46,379 15,264 30,158 – 45,422
Subordinated liabilities and other borrowed funds 17,176 17,456 161 – 17,617
Other liabilities1 34,982 – 34,982 – 34,982
At 31 December 2017 539,774 32,720 506,512 – 539,232
Carrying value
$million
Fair value
Level 1
$million
Level 2
$million
Level 3
$million
Total
$million
Assets
Cash and balances at central banks1 70,706 – 70,706 – 70,706
Loans and advances to banks 54,538 – 54,473 – 54,473
Loans and advances to customers 226,693 – 7,401 218,998 226,399
Reverse repurchase agreements and other similar secured lending 44,097 – 18,433 25,664 44,097
Investment securities 3,276 – 3,252 6 3,258
Other assets1 33,942 – 33,942 – 33,942
Assets held for sale 1,102 – – 1,102 1,102
At 31 December 2016 434,354 – 188,207 245,770 433,977
Liabilities
Deposits by banks 32,872 – 32,740 – 32,740
Customer accounts 338,185 – 338,153 – 338,153
Repurchase agreements and other similar secured borrowing 37,692 – 37,692 – 37,692
Debt securities in issue 46,700 17,132 29,568 – 46,700
Subordinated liabilities and other borrowed funds 19,523 18,655 177 – 18,832
Other liabilities1 32,958 – 32,958 – 32,958
Liabilities included in disposal groups held for sale 958 – 958 – 958
At 31 December 2016 508,888 35,787 472,246 – 508,033
1 The carrying amount of these fi nancial instruments is considered to be a reasonable approximation of fair value as they are short term in nature or reprice to current market rates
frequently

Standard Chartered
Annual Report 2017 240
FINANCIAL STATEMENTSNotes to the fi nancial statements
13. Financial instruments continued
Loans and advances to customers by client segment1
2017
Carrying value Fair value
Impaired
$million
Not impaired
$million
Total
$million
Impaired
$million
Not impaired
$million
Total
$million
Corporate & Institutional Banking 2,465 126,224 128,689 2,491 126,695 129,186
Retail Banking 420 102,593 103,013 422 102,828 103,250
Commercial Banking 596 27,296 27,892 646 27,269 27,915
Private Banking 140 13,211 13,351 140 13,202 13,342
Central & other items – 9,343 9,343 – 9,349 9,349
At 31 December 2017 3,621 278,667 282,288 3,699 279,343 283,042
2016
Carrying value Fair value
Impaired
$million
Not impaired
$million
Total
$million
Impaired
$million
Not impaired
$million
Total
$million
Corporate & Institutional Banking 2,500 116,601 119,101 2,481 116,501 118,982
Retail Banking 458 93,030 93,488 460 92,786 93,246
Commercial Banking 751 23,215 23,966 736 23,306 24,042
Private Banking 289 11,619 11,908 289 11,609 11,898
Central & other items – 4,256 4,256 – 4,256 4,256
At 31 December 2016 3,998 248,721 252,719 3,966 248,458 252,424
1 Loans and advances includes reverse repurchase agreements and other similar secured lending: carrying value $33,581 million and fair value $33,586 million (2016: $26,026 million
and $26,026 million respectively)
Level 3 Summary and signifi cant unobservable inputs
The following table presents the Group’s primary Level 3 fi nancial instruments which are held at fair value. The table also presents the valuation techniques used to measure the fair value of those fi nancial instruments, the signifi cant unobservable inputs, the range of values for those inputs and the weighted average of those inputs.
Instrument
Value at 31 December 2017
Principal valuation
technique
Signifi cant unobservable
inputs Range1
Weighted
average2
Assets
$million
Liabilities
$million
Loans and advances to banks 71 – Comparable pricing/yield Price/yield 2.3% 2.3%
Loans and advances to customers 126 – Comparable pricing/yield Price/yield 3.6% 3.6%
Comparable pricing/yield Recovery rates 27.8% to 48.3% 43.5%
Debt securities 98 – Comparable pricing/yield Price/yield 8% 8%
Asset backed securities 39 – Discounted cash fl ows Price/yield 1.6% to 5% 1.7%
Deposits by banks – 69 Discounted cash fl ows Credit spreads 1% 1%
Debt securities in issue – 442 Discounted cash fl ows Credit spreads 0.4% to 4% 1.7%
Government bonds and treasury bills 318 – Discounted cash fl ows Price/yield 2.4% to 11% 8.1%
Derivative fi nancial instruments of which:
Foreign exchange 17 – Option pricing modelForeign exchange option implied volatility 5.4% to 7.1% 5.9%
Discounted cash fl ows Foreign exchange curves 4.1% to 5.1% 4.6%
Interest rate 7 18 Discounted cash fl ows Interest rate curves 1.5% to 16.4% 7.2%
Credit – 2 Discounted cash fl ows Credit spreads 0.8% to 3% 1.3%
Commodities 2 – Internal pricing model Commodities correlation 81.4% to 99.4% 92.1%
Equity 14 5 Internal pricing model Equity correlation 5% to 85% N/A
Equity-FX correlation -85% to 85% N/A
Equity shares (includes private equity investments)3 1,246 – Comparable pricing/yield EV/EBITDA multiples 7.6x to 18.6x 10.8x
P/E multiples 8.6x to 17.7x 16.3x
P/B multiples 1.2x 1.2x
P/S multiples 2x 2x
Liquidity discount 10% to 20% 15.5%
Discounted cash fl ows Discount rates 8.6% to 14% 10.7%
Total 1,938 536
1 The ranges of values shown in the above table represent the highest and lowest levels used in the valuation of the Group’s Level 3 fi nancial instruments as at 31 December 2017. The
ranges of values used are refl ective of the underlying characteristics of these Level 3 fi nancial instruments based on the market conditions at the balance sheet date. However, these
ranges of values may not represent the uncertainty in fair value measurements of the Group’s Level 3 fi nancial instruments
2 Weighted average for non-derivative fi nancial instruments have been calculated by weighting inputs by the relative fair value. Weighted average for derivatives has been provided by
weighting inputs by the risk relevant to that variable. N/A has been entered for the cases where weighted average is not a meaningful indicator
3 The Group has an equity investment in the Series B preferred shares of Ripple Labs, Inc., which owns a digital currency (XRP) and is being carried at a fair value based on the shares’
initial offering price. The shares will continue to be valued at the initial offering price until such time as a reliable means of valuing the cash fl ows and underlying assets is possible or
additional sales are observable

241
Ris
k re
vie
w a
nd
cap
ital re
vie
wS
trate
gic
rep
ort
Su
pp
lem
en
tary
info
rmatio
nF
INA
NC
IAL
ST
AT
EM
EN
TS
Dire
cto
rs’ re
po
rt
13. Financial instruments continued
Level 3 summary and signifi cant unobservable inputs continued
The following section describes the signifi cant unobservable inputs identifi ed in the valuation technique table:
Commodities correlation: This refers to the correlation between two commodity underlyings over a specifi ed time
Comparable price/yield is a valuation methodology in which a price of a comparable instrument is used to estimate the fair value where there are no direct observable prices. Yield is the interest rate that is used to discount the future cash-fl ows in a discounted cash-fl ow model. Valuation using comparable instruments can be done by calculating an implied yield (or spread over a liquid benchmark) from the price of a comparable instrument, then adjusting that yield (or spread) to derive a value for the instrument. The adjustment should account for relevant differences in the fi nancial instruments such as maturity and/or credit quality. Alternatively, a price-to-price basis can be assumed between the comparable instrument and the instrument being valued in order to establish the value of the instrument (for example, deriving a fair value for a junior unsecured bond from the price of a senior secured bond). An increase in price, in isolation, would result in a favourable movement in the fair value of the asset. An increase in yield, in isolation, would result in an unfavourable movement in the fair value of the asset
Correlation is the measure of how movement in one variable infl uences the movement in another variable. An equity correlation is the correlation between two equity instruments while an interest rate correlation refers to the correlation between two swap rates
Credit spread represents the additional yield that a market participant would demand for taking exposure to the credit risk of an instrument
Discount rate refers to the rate of return used to convert expected cash fl ows into present value
EV/EBITDA ratio multiples: This is the ratio of Enterprise Value (EV) to Earnings Before Interest, Taxes, Depreciation and Amortisation (EBITDA). EV is the aggregate market capitalisation and debt minus the cash and cash equivalents. An increase in EV/EBITDA multiples in isolation, will result in a favourable movement in the fair value of the unlisted fi rm
Interest rate curves is the term structure of interest rates and measure of future interest rates at a particular point in time
Liquidity discounts in the valuation of unlisted investments: A liquidity discount is primarily applied to the valuation of unlisted fi rms’ investments to refl ect the fact that these stocks are not actively traded. An increase in liquidity discount will result in unfavourable movement in the fair value of the unlisted fi rm
Price-Book (P/B) multiple: This is the ratio of the market value of equity to the book value of equity. An increase in P/B multiple will result in a favourable movement in the fair value of the unlisted fi rm
Price-Earnings (P/E) multiples: This is the ratio of the Market Capitalisation to the Net Income after tax. The multiples are determined from multiples of listed comparables, which are observable. An increase in P/E multiple will result in a favourable movement in the fair value of the unlisted fi rm
Price-Sales (P/S) multiple: This is the ratio of the market value of equity to sales. An increase in P/S multiple will result in a favourable movement in the fair value of the unlisted fi rm
Recovery rates are the expectation of the rate of return resulting from the liquidation of a particular loan. As the probability of default increases for a given instrument, the valuation of that instrument will increasingly refl ect its expected recovery level assuming default. An increase in the recovery rate, in isolation, would result in a favourable movement in the fair value of the loan
Volatility represents an estimate of how much a particular instrument, parameter or index will change in value over time. Generally, the higher the volatility, the more expensive the option will be

Standard Chartered
Annual Report 2017 242
FINANCIAL STATEMENTSNotes to the fi nancial statements
13. Financial instruments continued
Level 3 movement tables – fi nancial assets
The table below analyses movements in level 3 fi nancial assets carried at fair value.
Assets
Held at fair value through profi t or loss
Derivative
fi nancial
instruments
$million
Investment securities
Total
$million
Loans and
advances to
banks
$million
Loans and
advances to
customers
$million
Debt
securities
and other
eligible bills
$million
Equity
shares
$million
Debt
securities
and other
eligible bills
$million
Equity
shares
$million
At 1 January 2017 – 179 4 995 360 199 549 2,286
Total (losses)/gains recognised in
income statement (1) (11) (2) 121 (4) (15) (9) 79
Net interest income – – – – – (15) – (15)
Net trading income (1) (11) (2) 121 (4) – (1) 102
Other operating income – – – – – – 9 9
Impairment charge – – – – – – (17) (17)
Total gains recognised in other comprehensive income – – – – – 7 54 61
Available-for-sale reserve – – – – – – 41 41
Exchange difference – – – – – 7 13 20
Purchases – – 94 1113 6 399 22 632
Sales – – (20) (254) (13) (1) (91) (379)
Settlements – – – – (250) (169) – (419)
Transfers out1 – (72) (25) (247)3 (61) (16) (5) (426)
Transfers in2 72 30 – – 2 – – 104
At 31 December 2017 71 126 51 726 40 404 520 1,938
Total unrealised losses recognised in the income statement, within net interest income, relating to change in fair value of assets held at 31 December 2017 – – – – – (15) – (15)
Total unrealised (losses)/gains recognised in the income statement, within net trading income, relating to change in fair value of assets held at 31 December 2017 (1) (5) (2) 65 (7) – (1) 49
Total unrealised losses recognised in the income statement, within impairment charges at 31 December 2017 – – – – – – (17) (17)
1 Transfers out include debt securities, equity shares and derivative fi nancial instruments where the valuation parameters became observable during the year, and were transferred to
Level 1 and Level 2. Transfers out further relate to equity shares and debt securities held at fair value through profi t or loss which are now presented under held for sale
2 Transfers in during the year primarily relate to loans and advances and derivative fi nancial instruments where the valuation parameters become unobservable during the year
3 When an entity is consolidated through a step up in ownership, the additional equity shares acquired are disclosed in the Purchases line. Subsequently these shares are eliminated
on consolidation and disclosed in the Transfer out line. Any underlying Level 3 fi nancial instruments which are recognised as a result of the consolidation are disclosed in the Transfers
in line

243
Ris
k re
vie
w a
nd
cap
ital re
vie
wS
trate
gic
rep
ort
Su
pp
lem
en
tary
info
rmatio
nF
INA
NC
IAL
ST
AT
EM
EN
TS
Dire
cto
rs’ re
po
rt
13. Financial instruments continued
Level 3 movement tables – fi nancial assets continued
Assets
Held at fair value through profi t or loss
Derivative
fi nancial
instruments
$million
Investment securities
Total
$million
Loans and
advances to
banks
$million
Loans and
advances to
customers
$million
Debt
securities and
other
eligible bills
$million
Equity
shares
$million
Debt
securities
and other
eligible bills
$million
Equity
shares
$million
At 1 January 2016 – 232 256 813 478 339 841 2,959
Total (losses)/gains recognised in income statement – (87) 4 (268) 44 (64) (198) (569)
Net trading income – (87) 4 (268) 44 – – (307)
Other operating income – – – – – – (7) (7)
Impairment charge – – – – – (64) (191) (255)
Total (losses)/gains recognised in other comprehensive income – – – – – (4) 1 (3)
Available-for-sale reserve – – – – – – 5 5
Exchange difference – – – – – (4) (4) (8)
Purchases – – 73 300 32 104 121 630
Sales – (6) (197) (60) (13) (50) (36) (362)
Settlements – (67) (10) – (54) (23) – (154)
Transfers out1 – (100) (122) – (127) (120) (180) (649)
Transfers in2 – 207 – 210 – 17 – 434
At 31 December 2016 – 179 4 995 360 199 549 2,286
Total unrealised (losses)/gains recognised in the income statement, within net trading income, relating to change in fair value of assets held at 31 December 2016 – (87) 5 (258) 24 – – (316)
Total unrealised losses recognised in the income statement, within impairment charges at 31 December 2016 – – – – – (64) (191) (255)
1 Transfers out during the year primarily relate to loans and advances, debt securities and other eligible bills, derivative fi nancial instruments and equity shares where the valuation
parameters became observable during the year and were transferred to Level 1 and Level 2 fi nancial assets
2 Transfers in during the year primarily relate to loans and advances, equity shares and debt securities and other eligible bills where the valuation parameters become unobservable
during the year
Level 3 movement tables – fi nancial liabilities2017
Deposits
by banks
$million
Customer
accounts
$million
Debt securities
in issue
$million
Derivative
fi nancial
instruments
$million
Total
$million
At 1 January 2017 – – 530 316 846
Total gains recognised in income statement – net trading income – – (9) (24) (33)
Issues 79 – 274 1 354
Settlements (10) – (353) (266) (629)
Transfers out1 – – – (2) (2)
At 31 December 2017 69 – 442 25 536
Total unrealised gains recognised in the income statement, within net trading income, relating to change in fair value of liabilities held at 31 December 2017 – – – (17) (17)
1 Transfers out during the year primarily relate to derivative fi nancial instruments where the valuation parameters became observable during the year and were transferred to Level 2
fi nancial liabilities

Standard Chartered
Annual Report 2017 244
FINANCIAL STATEMENTSNotes to the fi nancial statements
13. Financial instruments continued
Level 3 movement tables – fi nancial liabilities continued2016
Deposits
by banks
$million
Customer
accounts
$million
Debt securities
in issue
$million
Derivative
fi nancial
instruments
$million
Total
$million
At 1 January 2016 – 1 495 319 815
Total losses recognised in income statement – net trading income – – 1 31 32
Issues – – 268 78 346
Settlements – – (237) (74) (311)
Transfers out1 – (1) – (38) (39)
Transfers in2 – – 3 – 3
At 31 December 2016 – – 530 316 846
Total unrealised losses recognised in the income statement, within net trading income, relating to change in fair value of liabilities held at 31 December 2016 – – 5 39 44
1 Transfers out during the year primarily relate to customer accounts and derivative fi nancial instruments where the valuation parameters became observable during the year and were
transferred to Level 2 fi nancial liabilities
2 Transfers in during the year primarily relate to debt securities in issue for which parameters became unobservable during the year
Sensitivities in respect of the fair values of Level 3 assets and liabilities
Sensitivity analysis is performed on products with signifi cant unobservable inputs. The Group applies a 10 per cent increase or decrease on the values of these unobservable inputs, to generate a range of reasonably possible alternative valuations. The percentage shift is determined by statistical analyses performed on a set of reference prices based on the composition of our Level 3 assets. Favourable and unfavourable changes are determined on the basis of changes in the value of the instrument as a result of varying the levels of the unobservable parameters. This Level 3 sensitivity analysis assumes a one-way market move and does not consider offsets for hedges.
Held at fair value through profi t or loss Available-for-sale
Net exposure
$million
Favourable
changes
$million
Unfavourable
changes
$million
Net exposure
$million
Favourable
changes
$million
Unfavourable
changes
$million
Financial instruments held at fair value
Debt securities and other eligible bills 51 56 46 404 415 393
Equity shares 726 799 653 520 572 468
Loan and advances 197 201 194 – – –
Derivative fi nancial instruments 15 17 12 – – –
Deposits by banks (69) (68) (70) – – –
Debt securities in issue (442) (434) (450) – – –
At 31 December 2017 478 571 385 924 987 861
Financial instruments held at fair value
Debt securities and other eligible bills 4 4 4 199 200 198
Equity shares 995 1,095 896 549 604 494
Loan and advances 179 187 171 – – –
Derivative fi nancial instruments 44 158 25 – – –
Debt securities in issue (530) (521) (539) – – –
At 31 December 2016 692 923 557 748 804 692
The reasonably possible alternatives could have increased or decreased the fair values of fi nancial instruments held at fair value through profi t or loss and those classifi ed as available-for-sale by the amounts disclosed below.
Financial instruments Fair value changes
2017
$million
2016
$million
Held at fair value through profi t or loss Possible increase 93 231
Possible decrease (93) (135)
Available-for-sale Possible increase 63 56
Possible decrease (63) (56)

245
Ris
k re
vie
w a
nd
cap
ital re
vie
wS
trate
gic
rep
ort
Su
pp
lem
en
tary
info
rmatio
nF
INA
NC
IAL
ST
AT
EM
EN
TS
Dire
cto
rs’ re
po
rt
14. Derivative fi nancial instruments
Accounting policy
Accounting for derivatives: Derivatives are fi nancial instruments that derive their value in response to changes in interest rates, fi nancial instrument prices, commodity prices, foreign exchange rates, credit risk and indices. Derivatives are categorised as trading unless they are designated as hedging instruments.
Derivatives are initially recognised and subsequently measured at fair value, with revaluation gains recognised in profi t and loss (except where cash fl ow or net investment hedging has been achieved, in which case the effective portion of changes in fair value is recognised within other comprehensive income).
Fair values may be obtained from quoted market prices in active markets, recent market transactions, and valuation techniques, including discounted cash fl ow models and option pricing models, as appropriate. Where the initially recognised fair value of a derivative contract is based on a valuation model that uses inputs which are not observable in the market, it follows the same initial recognition accounting policy as for other fi nancial assets and liabilities. All derivatives are carried as assets when fair value is positive and as liabilities when fair value is negative.
Certain derivatives embedded in other fi nancial instruments, such as the conversion option in a convertible bond held, are valued as separate derivatives when their economic characteristics and risks are not closely related to those of the host contract and the host contract is not carried at fair value through profi t or loss. These embedded derivatives are measured at fair value with changes in fair value recognised in the income statement. Embedded derivatives continue to be presented with the host contract and are not separately disclosed or included within derivatives.
Hedge accounting: The method of recognising the resulting fair value gain or loss depends on whether the derivative is designated as a hedging instrument, and if so, the nature of the item being hedged. The Group designates certain derivatives as either:
a) Hedges of the fair value of recognised assets or liabilities or fi rm commitments (fair value hedge)
b) Hedges of highly probable future cash fl ows attributable to a recognised asset or liability, or a forecasted transaction (cash fl ow hedge)
c) Hedges of the net investment of a foreign operation (net investment hedges)
Hedge accounting is used for derivatives designated in this way, provided certain criteria are met.
The Group documents at the inception of the transaction, the relationship between hedging instruments and hedged items, as well as its risk management objective and strategy for undertaking various hedge transactions. The Group also documents its assessment, both at hedge inception and on an ongoing basis, of whether the derivatives that are used in hedging transactions are highly effective in offsetting changes in fair values or cash fl ows of hedged items.
The Group may enter into economic hedges that do not qualify for IAS 39 hedge accounting treatment. Where these economic hedges use derivatives to offset risk, the derivatives are fair valued, with fair value changes recognised through profi t or loss.
Fair value hedge: Changes in the fair value of derivatives that are designated and qualify as fair value hedging instruments are recorded in the income statement, together with any changes in the fair value of the hedged asset or liability that are attributable to the hedged risk. If the hedge no longer meets the criteria for hedge accounting, the adjustment to the carrying amount of a hedged item for which the effective interest method is used is amortised to the income statement over the period to maturity or derecognition.
Cash fl ow hedge: The effective portion of changes in the fair value of derivatives that are designated and qualify as cash flow hedging instruments is recognised in equity. The gain or loss relating to the ineffective portion is recognised immediately in the income statement. Amounts accumulated in equity are reclassifi ed to the income statement in the periods in which the hedged item affects profit or loss.
When a hedging instrument expires or is sold, or when a hedge no longer meets the criteria for hedge accounting, any cumulative gain or loss existing in equity at that time remains in equity and is recognised when the forecast transaction is ultimately recognised in the income statement. When a forecast transaction is no longer expected to occur, the cumulative gain or loss that was reported in equity is immediately transferred to the income statement.
Net investment hedge: Hedges of net investments in foreign operations are accounted for similarly to cash flow hedges. Any gain or loss on the hedging instrument relating to the effective portion of the hedge is recognised in the translation reserve; the gain or loss relating to the ineffective portion is recognised immediately in the income statement. Gains and losses accumulated in equity are reclassifi ed to the income statement when the foreign operation is disposed of.

Standard Chartered
Annual Report 2017 246
FINANCIAL STATEMENTSNotes to the fi nancial statements
14. Derivative fi nancial instruments continued
The tables below analyse the notional principal amounts and the positive and negative fair values of derivative fi nancial instruments. Notional principal amounts are the amount of principal underlying the contract at the reporting date.
Derivatives
2017 2016
Notional
principal
amounts
$million
Assets
$million
Liabilities
$million
Notional
principal
amounts
$million
Assets
$million
Liabilities
$million
Foreign exchange derivative contracts:
Forward foreign exchange contracts 1,825,488 18,905 19,702 1,896,056 24,872 24,475
Currency swaps and options 1,211,332 16,850 16,537 1,288,908 29,210 29,648
Exchange traded futures and options 100 – – 225 – –
3,036,920 35,755 36,239 3,185,189 54,082 54,123
Interest rate derivative contracts:
Swaps 2,831,025 8,603 8,414 2,191,851 8,425 8,409
Forward rate agreements and options 153,697 1,351 1,364 114,988 1,305 1,404
Exchange traded futures and options 637,883 120 100 789,901 148 148
3,622,605 10,074 9,878 3,096,740 9,878 9,961
Credit derivative contracts 34,772 249 873 25,101 171 472
Equity and stock index options 2,520 39 150 2,535 52 58
Commodity derivative contracts 74,133 914 961 80,921 1,326 1,098
Total derivatives 6,770,950 47,031 48,101 6,390,486 65,509 65,712
The Group limits exposure to credit losses in the event of default by entering into master netting agreements with certain market counterparties. As required by IAS 32, exposures are only presented net in these accounts where they are subject to legal right of offset and intended to be settled net in the ordinary course of business. Details of the amounts available for offset are set out in note 13 (pages 232 to 233).
The Derivatives and Hedging sections of the Risk review and Capital review (page 141) explain the Group’s risk management of derivative contracts and application of hedging.
Derivatives held for hedging
Included in the table above are derivatives held for hedging purposes as follows:
2017 2016
Notional
principal
amounts
$million
Assets
$million
Liabilities
$million
Notional
principal
amounts
$million
Assets
$million
Liabilities
$million
Derivatives designated as fair value hedges:
Interest rate swaps 45,420 456 272 48,565 972 303
Forward foreign exchange contracts – – – 419 12 15
Currency swaps 19,973 174 899 21,495 37 2,377
65,393 630 1,171 70,479 1,021 2,695
Derivatives designated as cash fl ow hedges:
Interest rate swaps 13,348 43 48 10,236 3 84
Forward foreign exchange contracts 356 2 29 883 – 13
Currency swaps 2,987 23 107 1,258 1 3
16,691 68 184 12,377 4 100
Derivatives designated as net investment hedges:
Forward foreign exchange contracts 3,470 – 188 1,313 51 –
Total derivatives held for hedging 85,554 698 1,543 84,169 1,076 2,795

247
Ris
k re
vie
w a
nd
cap
ital re
vie
wS
trate
gic
rep
ort
Su
pp
lem
en
tary
info
rmatio
nF
INA
NC
IAL
ST
AT
EM
EN
TS
Dire
cto
rs’ re
po
rt
14. Derivative fi nancial instruments continued
Fair value hedges
The Group uses interest rate swaps to exchange fi xed rates for fl oating rates on funding to match fl oating rates received on assets, or exchange fi xed rates on assets to match fl oating rates paid on funding.
For qualifying hedges, the fair value changes of the derivative are substantially matched by corresponding fair value changes of the hedged item, both of which are recognised in profi t or loss. All qualifying hedges were effective. Included in net losses and net gains below is an adjustment in respect of hedge ineffectiveness.
2017
$million
2016
$million
Net losses on hedging instruments (154) (77)
Net gains on hedged items1 81 57
1 Includes amortisation of fair value adjustments in respect of hedges no longer qualifying for hedge accounting
Cash fl ow hedges
The Group uses interest rate swaps to manage the variability in future cash fl ows on assets and liabilities that have fl oating rates of interest by exchanging the fl oating rates for fi xed rates. It also uses foreign exchange contracts and currency swaps to manage the variability in future exchange rates on its assets and liabilities and costs in foreign currencies.
Gains and losses arising on the effective portion of the hedges are deferred in equity until the variability on the cash fl ow affects profi t or loss, at which time the gains or losses are transferred to profi t or loss.
2017
$million
2016
$million
Losses reclassifi ed from reserves to income statement (11) (57)
Losses recognised in operating costs (4) (67)
Gains/(losses) recognised in other comprehensive income 35 10
The Group has hedged the following cash fl ows which are expected to impact the income statement in the following years:
2017
Less than
one year
$million
One to
two years
$million
Two to
three years
$million
Three to
four years
$million
Four to
fi ve years
$million
Over
fi ve years
$million
Total
$million
Forecast receivable cash fl ows 122 40 30 22 8 – 222
Forecast payable cash fl ows (97) (83) (51) (49) (48) (134) (462)
25 (43) (21) (27) (40) (134) (240)
2016
Less than
one year
$million
One to
two years
$million
Two to
three years
$million
Three to
four years
$million
Four to
fi ve years
$million
Over
fi ve years
$million
Total
$million
Forecast receivable cash fl ows 68 48 50 35 23 8 232
Forecast payable cash fl ows (20) (9) (28) (1) – – (58)
48 39 22 34 23 8 174
Net investment hedges
The Group uses a combination of foreign exchange contracts and non-derivative fi nancial assets to manage the variability in future exchange rates on its net investments in foreign currencies. Gains and losses arising on the effective portion of the hedges are deferred in equity until the net investment is disposed of.
2017
$million
2016
$million
(Losses)/gains recognised in other comprehensive income (288) 30

Standard Chartered
Annual Report 2017 248
FINANCIAL STATEMENTSNotes to the fi nancial statements
15. Investment securities
Accounting policy
Investment securities are debt securities, other eligible bills and equity shares intended to be held on a continuing basis. The securities are predominantly classifi ed as available for sale. Refer to note 13 Financial instruments for the accounting policy.
Change in comparatives
Treasury bills are now included within other debt securities, prior year comparatives have been updated to refl ect this change.
2017
Debt securities and other eligible bills
Equity
shares1
$million
Total
$million
Held-to-maturity
$million
Available-
for-sale
$million
Loans and
receivables
$million
Issued by public bodies:
Government securities 4,340 72,843 –
Other public sector securities – 2,720 274
4,340 75,563 274
Issued by banks:
Certifi cates of deposit – 4,236 –
Other debt securities – 18,734 63
– 22,970 63
Issued by corporate entities and other issuers:
Other debt securities – 10,628 2,293
Total debt securities and other eligible bills 4,340 109,161 2,630
Of which:
Listed on a recognised UK exchange – 6,849 232 4 6,876
Listed elsewhere 4,271 49,276 5492 383 54,479
Unlisted 69 53,036 2,058 507 55,670
4,340 109,161 2,630 894 117,025
Market value of listed securities 4,271 56,125 572 387 61,355
2016
Debt securities and other eligible bills
Equity
shares1
$million
Total
$million
Held-to-maturity
$million
Available-
for-sale
$million
Loans and
receivables
$million
Issued by public bodies:
Government securities 163 65,416 10
Other public sector securities – 1,705 222
163 67,121 232
Issued by banks:
Certifi cates of deposit – 5,764 –
Other debt securities – 21,748 79
– 27,512 79
Issued by corporate entities and other issuers:
Other debt securities 7 9,675 2,795
Total debt securities and other eligible bills 170 104,308 3,106
Of which:
Listed on a recognised UK exchange – 9,475 1082 3 9,586
Listed elsewhere 7 48,350 5962 741 49,694
Unlisted 163 46,483 2,402 644 49,692
170 104,308 3,106 1,388 108,972
Market value of listed securities 7 57,825 704 744 59,280
1 Equity shares largely comprise investments in corporates
2 These debt securities listed or registered on a recognised UK exchange or elsewhere are thinly traded or the markets for these securities are illiquid

249
Ris
k re
vie
w a
nd
cap
ital re
vie
wS
trate
gic
rep
ort
Su
pp
lem
en
tary
info
rmatio
nF
INA
NC
IAL
ST
AT
EM
EN
TS
Dire
cto
rs’ re
po
rt
15. Investment securities continued
The change in the carrying amount of investment securities comprised:
2017 2016
Debt securities
and other
eligible bills
$million
Equity
shares
$million
Total
$million
Debt securities
and other
eligible bills
$million
Equity
shares
$million
Total
$million
At 1 January 107,584 1,388 108,972 113,047 1,720 114,767
Exchange translation differences 3,463 17 3,480 (2,261) (30) (2,291)
Additions 265,126 60 265,186 207,081 193 207,274
Maturities and disposals (260,271) (814) (261,085) (210,540) (284) (210,824)
Transfers to assets held for sale (60) – (60) – – –
Impairment, net of recoveries on disposal (20) (16) (36) (151) (246) (397)
Changes in fair value (including the effect of fair value hedging) 17 259 276 143 35 178
Amortisation of discounts and premiums 292 – 292 265 – 265
At 31 December 116,131 894 117,025 107,584 1,388 108,972
The analysis of unamortised premiums and unamortised discounts on debt securities and income on equity shares held for investment purposes is provided below:
2017
$million
2016
$million
Debt securities:
Unamortised premiums 765 462
Unamortised discounts 104 139
Income from listed equity shares 36 38
Income from unlisted equity shares 10 14
The following table sets out the movement in the allowance of impairment provisions for investment securities classifi ed as loans and receivables:
2017
$million
2016
$million
At 1 January 144 57
Exchange translation differences (3) (3)
Amounts written off (47) (7)
Impairment charge 20 97
At 31 December 114 144
16. Loans and advances to banks and customers
Accounting policy
Refer to note 13 Financial instruments for the relevant accounting policy.
2017
$million
2016
$million
Loans and advances to banks 78,193 72,773
Individual impairment provision (4) (163)
Portfolio impairment provision (1) (1)
78,188 72,609
Loans and advances to customers 287,990 259,073
Individual impairment provision (5,237) (5,667)
Portfolio impairment provision (465) (687)
282,2881 252,719
Total loans and advances to banks and customers 360,476 325,328
1 Loans and advances to customers (net of provision) totalling $2 million (2016: $1,101 million) have been classifi ed and disclosed as held for sale in note 21
The Group has outstanding residential mortgage loans to Korea residents of $18.5 billion (2016: $15.3 billion) and Hong Kong residents of $28.3 billion (2016: $28.7 billion).
Analysis of loans and advances to customers by geographic region and client segments and related impairment provisions as set out within the Risk review and Capital review (pages 125 to 143).

Standard Chartered
Annual Report 2017 250
FINANCIAL STATEMENTSNotes to the fi nancial statements
17. Reverse repurchase and repurchase agreements including other similar secured lending and borrowing
Accounting policy
The Group purchases securities (a reverse repurchase agreement – ‘reverse repo’) typically with fi nancial institutions subject to a commitment to resell or return the securities at a predetermined price. These securities are not included in the balance sheet as the Group does not acquire the risks and rewards of ownership, however are recorded off balance sheet as collateral received. Consideration paid (or cash collateral provided) is accounted for as a loan asset at amortised cost, unless it is designated at fair value through profi t or loss.
The Group also sells securities (a repurchase agreement – ‘repo’) subject to a commitment to repurchase or redeem the securities at a predetermined price. The securities are retained on the balance sheet as the Group retains substantially all the risks and rewards of ownership and these securities are disclosed as pledged collateral. Consideration received (or cash collateral received) is accounted for as a fi nancial liability at amortised cost, unless it is designated at fair value through profi t or loss.
Repo and reverse repo transactions typically entitle the Group and its counterparties to have recourse to assets similar to those provided as collateral in the event of a default. Securities sold subject to repos, either by way of a Global Master Repurchase Agreement (GMRA), or through a securities sale and Total Return Swap (TRS) continue to be recognised on the balance sheet as the Group retains substantially the associated risks and rewards of the securities (the TRS is not recognised). The counterparty liability is included in deposits by banks or customer accounts, as appropriate. Assets sold under repurchase agreements are considered encumbered as the group cannot pledge these to obtain funding.
Reverse repurchase agreements and other similar secured lending1
2017
$million
2016
$million
Banks 21,259 18,569
Customers 33,928 26,347
55,187 44,916
Of which:
Fair value through profi t or loss 912 819
Banks 565 497
Customers 347 322
Held at amortised cost 54,275 44,097
Banks 20,694 18,071
Customers 33,581 26,026
1 Includes other similar secured lending
Under reverse repurchase and securities borrowing arrangements, the Group obtains securities on terms which permit it to repledge or resell the securities to others. Amounts on such terms are:
2017
$million
2016
$million
Securities and collateral received (at fair value) 75,088 55,394
Securities and collateral which can be repledged or sold (at fair value) 72,982 54,473
Amounts repledged/transferred to others for fi nancing activities, to satisfy liabilities under sale and repurchase agreements (at fair value) 34,018 33,053
Repurchase agreements and other similar secured borrowing held at amortised cost2017
$million
2016
$million
Banks 3,804 4,022
Customers 35,979 33,670
39,783 37,692
The tables below set out the fi nancial assets provided as collateral for repurchase and other secured borrowing transactions:
Collateral pledged against repurchase agreements
2017
Fair value
through
profi t or loss
$million
Available
for sale
$million
Loans and
receivables
$million
Total
$million
On balance sheet
Debt securities and other eligible bills 2,178 3,618 – 5,796
Off balance sheet
Repledged collateral received – – 34,018 34,018
At 31 December 2017 2,178 3,618 34,018 39,814

251
Ris
k re
vie
w a
nd
cap
ital re
vie
wS
trate
gic
rep
ort
Su
pp
lem
en
tary
info
rmatio
nF
INA
NC
IAL
ST
AT
EM
EN
TS
Dire
cto
rs’ re
po
rt
17. Reverse repurchase and repurchase agreements including other similar secured lending and borrowing continued
Repurchase agreements and other similar secured borrowing continued
Collateral pledged against repurchase agreements
2016
Fair value
through
profi t or loss
$million
Available
for sale
$million
Loans and
receivables
$million
Total
$million
On balance sheet
Debt securities and other eligible bills 1,094 3,686 – 4,780
Off balance sheet
Repledged collateral received – – 33,053 33,053
At 31 December 2016 1,094 3,686 33,053 37,833
18. Goodwill and intangible assets
Accounting policy
GoodwillGoodwill represents the excess of the cost of an acquisition over the fair value of the Group’s share of the identifi able net assets and contingent liabilities of the acquired subsidiary, associate or joint venture at the date of acquisition. Goodwill on acquisitions of subsidiaries is included in intangible assets. Goodwill on acquisitions of associates is included in investments in associates. Goodwill included in intangible assets is assessed at each balance sheet date for impairment and carried at cost less any accumulated impairment losses. Gains and losses on the disposal of an entity include the carrying amount of goodwill relating to the entity sold. Detailed calculations are performed based on discounting expected pre-tax cash fl ows of the relevant cash generating units (CGUs) and discounting these at an appropriate discount rate, the determination of which requires the exercise of judgement. Goodwill is allocated to CGUs for the purpose of impairment testing. CGUs represent the lowest level within the Group which generate separate cash infl ows and at which the goodwill is monitored for internal management purposes. These are equal to or smaller than the Group’s reportable segments (as set out in note 2) as the Group views its reportable segments on a global basis. The major CGUs to which goodwill has been allocated are set out in the CGU table (page 253).
Signifi cant accounting estimates and judgementsThe carrying amount of goodwill is based on the extent of judgements including the basis of assumptions and forecasts used for determining cash fl ows for CGUs, headroom availability, and sensitivities of the forecasts to reasonably possible changes in assumptions. The Group undertakes an annual assessment to evaluate whether the carrying value of goodwill on balance sheet is impaired. The estimation of future cash fl ows and the level to which they are discounted is inherently uncertain and requires signifi cant judgement and subject to potential change over time.
Acquired intangiblesAt the date of acquisition of a subsidiary or associate, intangible assets which are deemed separable and which arise from contractual or other legal rights are capitalised and included within the net identifi able assets acquired. These intangible assets are initially measured at fair value, which refl ects market expectations of the probability that the future economic benefi ts embodied in the asset will fl ow to the entity, and are amortised on the basis of their expected useful lives (4 to 16 years). At each balance sheet date, these assets are assessed for indicators of impairment. In the event that an asset’s carrying amount is determined to be greater than its recoverable amount, the asset is written down immediately.
Computer softwareAcquired computer software licences are capitalised on the basis of the costs incurred to acquire and bring to use the specifi c software. Direct costs of the development of separately identifi able internally generated software are capitalised where it is probable that future economic benefi ts attributable to the asset will fl ow from its use (internally generated software). These costs include salaries and wages, materials, service providers and contractors, and directly attributable overheads. Costs incurred in the ongoing maintenance of software are expensed immediately when incurred. Internally generated software is amortised over a three-year time period.

Standard Chartered
Annual Report 2017 252
FINANCIAL STATEMENTSNotes to the fi nancial statements
18. Goodwill and intangible assets continued2017 2016
Goodwill
$million
Acquired
intangibles
$million
Computer
software
$million
Total
$million
Goodwill
$million
Acquired
intangibles
$million
Computer
software
$million
Total
$million
Cost
At 1 January 3,456 505 1,881 5,842 3,616 494 1,551 5,661
Exchange translation differences 85 38 152 275 6 (1) (55) (50)
Additions 31 44 704 779 – 24 567 591
Disposals – – (2) (2) – – (1) (1)
Impairment (320) – – (320) (166) – – (166)
Amounts written off – (9) (206) (215) – (12) (181) (193)
At 31 December 3,252 578 2,529 6,359 3,456 505 1,881 5,842
Provision for amortisation
At 1 January – 431 692 1,123 – 430 589 1,019
Exchange translation differences – 35 42 77 – (1) (15) (16)
Amortisation – 11 320 331 – 14 272 286
Impairment charge – 2 21 23 – – 14 14
Disposals – – (2) (2) – – (1) (1)
Amounts written off – (9) (197) (206) – (12) (167) (179)
At 31 December – 470 876 1,346 – 431 692 1,123
Net book value 3,252 108 1,653 5,013 3,456 74 1,189 4,719
At 31 December 2017, accumulated goodwill impairment losses incurred from 1 January 2005 amounted to $2,801 million (2016: $2,481 million), of which $320 million was recognised in 2017 (2016: $166 million).
Goodwill
CGU structureIn 2017, the Group realigned its CGUs in line with its management structure and goodwill has been reallocated accordingly. When considering the generation of independent cash infl ows and appropriate level of management, Corporate Finance, Private Banking and Transaction Banking are managed on a global basis, while Retail Banking and Commercial Banking activities are managed on a country basis. Comparatives have been amended to refl ect the new structure of the CGUs.
Testing of goodwill for impairmentAn annual assessment is made as to whether the current carrying value of goodwill is impaired. For the purposes of impairment testing, goodwill is allocated at the date of acquisition to a CGU. Goodwill is considered to be impaired if the carrying amount of the relevant CGU exceeds its recoverable amount. Indicators of impairment include changes in the economic performance and outlook of the region including geopolitical changes, changes in market value of regional investments, large credit defaults and strategic decisions to exit certain regions. The recoverable amounts for all the CGUs were measured based on value-in-use (ViU). The calculation of ViU for each CGU is calculated using fi ve-year cash fl ow projections and an estimated terminal value based on a perpetuity value after year fi ve. The cash fl ow projections are based on forecasts approved by management up to 2022. The perpetuity terminal value amount is calculated using year fi ve cash fl ows using long-term GDP growth rates. All cash fl ows are discounted using pre-tax discount rates which refl ect market rates appropriate to the CGU.
At 31 December 2017, all CGUs had recoverable amounts that exceed the carrying amounts, with the exception of the Taiwan CGU, where, primarily as a result of a one per cent increase in the discount rate, the carrying amount exceeded the recoverable value and therefore an impairment charge of $320 million has been recognised. The goodwill allocated to each CGU and key assumptions used in determining the recoverable amounts are set out below and are solely estimates for the purposes of assessing impairment of acquired goodwill.

253
Ris
k re
vie
w a
nd
cap
ital re
vie
wS
trate
gic
rep
ort
Su
pp
lem
en
tary
info
rmatio
nF
INA
NC
IAL
ST
AT
EM
EN
TS
Dire
cto
rs’ re
po
rt
18. Goodwill and intangible assets continued
Goodwill continued
Cash Generating Unit
2017 20161
Goodwill
$million
Pre-tax
discount rate
per cent
Long-term
forecast GDP
growth rates
per cent
Goodwill
$million
Pre-tax
discount rate
per cent
Long-term
forecast GDP
growth rates
per cent
Regional CGUs
Greater China & North Asia 913 1,165
Hong Kong 357 14.9 3.0 357 12.1 2.8
Taiwan 556 13.9 2.1 808 12.8 2.2
Africa & Middle East 569 583
Pakistan 242 21.3 5.8 256 23.8 5.3
UAE 204 10.8 3.2 204 10.9 3.2
Others (5)2 123 11.5-19.6 2.0-6.1 123 11.7-20.5 1.9-5.9
ASEAN & South Asia 790 728
India 289 18.9 7.9 270 17.0 7.8
Singapore 343 11.8 2.6 327 10.1 2.6
Others (6)3 158 15.2-19.0 4.0-7.0 131 15.0-20.1 3.9-8.2
Global CGUs 980 980
Global Private Banking 84 10.2 3.7 84 13.5 2.9
Global Corporate Finance 219 10.3 3.7 219 13.4 2.9
Global Transaction Banking 677 10.3 3.7 677 13.4 2.9
3,252 3,456
1 CGUs reported in 2016 have been re-presented to align with the Group’s management structure
2 Bahrain, Ghana, Jordan, Oman and Qatar
3 Bangladesh, Brunei, Indonesia, Nepal, Sri Lanka and Vietnam
The Group has performed sensitivity analysis on the key assumptions for each CGU’s recoverable amount. The key CGUs at risk of future impairment as a result of potentially adverse movements are:
2017
Decrease in
cash fl ow
by 10%
$million
Increase
in discount
rate by 1%
$million
Decrease in
GDP growth
rate by 1%
$million
Taiwan 138 135 92
India 77 162 96
The headroom of $150 million relating to the India CGU would be eliminated if there was either a 6.5 per cent decrease in cash fl ows, a 0.5 per cent increase in the discount rate or a 0.6 per cent decrease in GDP.
Acquired intangibles
These primarily comprise those items recognised as part of the acquisitions of Union Bank (now amalgamated into Standard Chartered Bank (Pakistan) Limited), Hsinchu (now amalgamated into Standard Chartered Bank (Taiwan) Limited), Pembroke, American Express Bank and ABSA’s custody business in Africa. Maintenance intangible assets represent the value in the difference between the contractual right under acquired leases to receive aircraft in a specifi ed maintenance condition at the end of the lease and the actual physical condition of the aircraft at the date of acquisition.
The acquired intangibles are amortised over periods from four years to a maximum of 16 years. The constituents are as follows:
2017
$million
2016
$million
Acquired intangibles comprise:
Aircraft maintenance 24 24
Brand names 31 –
Core deposits 2 3
Customer relationships 32 39
Licences 19 8
Net book value 108 74
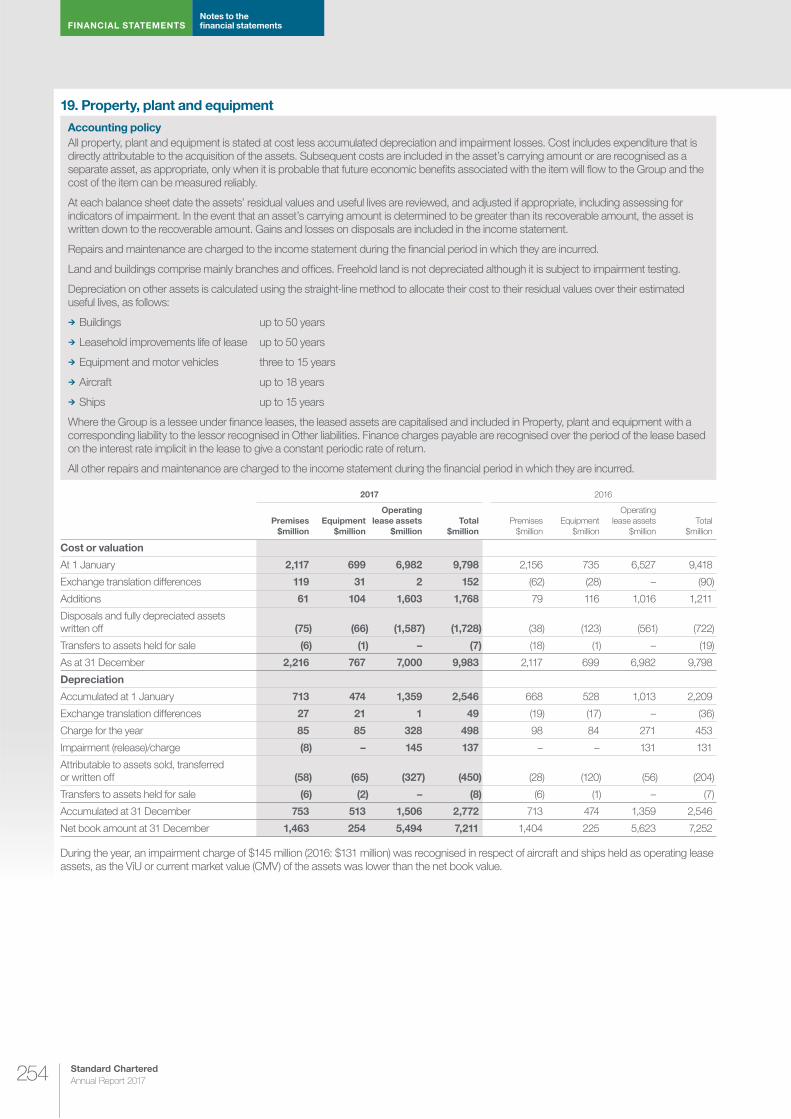
Standard Chartered
Annual Report 2017 254
FINANCIAL STATEMENTSNotes to the fi nancial statements
19. Property, plant and equipment
Accounting policy
All property, plant and equipment is stated at cost less accumulated depreciation and impairment losses. Cost includes expenditure that is directly attributable to the acquisition of the assets. Subsequent costs are included in the asset’s carrying amount or are recognised as a separate asset, as appropriate, only when it is probable that future economic benefi ts associated with the item will fl ow to the Group and the cost of the item can be measured reliably.
At each balance sheet date the assets’ residual values and useful lives are reviewed, and adjusted if appropriate, including assessing for indicators of impairment. In the event that an asset’s carrying amount is determined to be greater than its recoverable amount, the asset is written down to the recoverable amount. Gains and losses on disposals are included in the income statement.
Repairs and maintenance are charged to the income statement during the fi nancial period in which they are incurred.
Land and buildings comprise mainly branches and offi ces. Freehold land is not depreciated although it is subject to impairment testing.
Depreciation on other assets is calculated using the straight-line method to allocate their cost to their residual values over their estimated useful lives, as follows:
Buildings up to 50 years
Leasehold improvements life of lease up to 50 years
Equipment and motor vehicles three to 15 years
Aircraft up to 18 years
Ships up to 15 years
Where the Group is a lessee under fi nance leases, the leased assets are capitalised and included in Property, plant and equipment with a corresponding liability to the lessor recognised in Other liabilities. Finance charges payable are recognised over the period of the lease based on the interest rate implicit in the lease to give a constant periodic rate of return.
All other repairs and maintenance are charged to the income statement during the fi nancial period in which they are incurred.
2017 2016
Premises
$million
Equipment
$million
Operating
lease assets
$million
Total
$million
Premises
$million
Equipment
$million
Operating
lease assets
$million
Total
$million
Cost or valuation
At 1 January 2,117 699 6,982 9,798 2,156 735 6,527 9,418
Exchange translation differences 119 31 2 152 (62) (28) – (90)
Additions 61 104 1,603 1,768 79 116 1,016 1,211
Disposals and fully depreciated assets written off (75) (66) (1,587) (1,728) (38) (123) (561) (722)
Transfers to assets held for sale (6) (1) – (7) (18) (1) – (19)
As at 31 December 2,216 767 7,000 9,983 2,117 699 6,982 9,798
Depreciation
Accumulated at 1 January 713 474 1,359 2,546 668 528 1,013 2,209
Exchange translation differences 27 21 1 49 (19) (17) – (36)
Charge for the year 85 85 328 498 98 84 271 453
Impairment (release)/charge (8) – 145 137 – – 131 131
Attributable to assets sold, transferred or written off (58) (65) (327) (450) (28) (120) (56) (204)
Transfers to assets held for sale (6) (2) – (8) (6) (1) – (7)
Accumulated at 31 December 753 513 1,506 2,772 713 474 1,359 2,546
Net book amount at 31 December 1,463 254 5,494 7,211 1,404 225 5,623 7,252
During the year, an impairment charge of $145 million (2016: $131 million) was recognised in respect of aircraft and ships held as operating lease assets, as the ViU or current market value (CMV) of the assets was lower than the net book value.
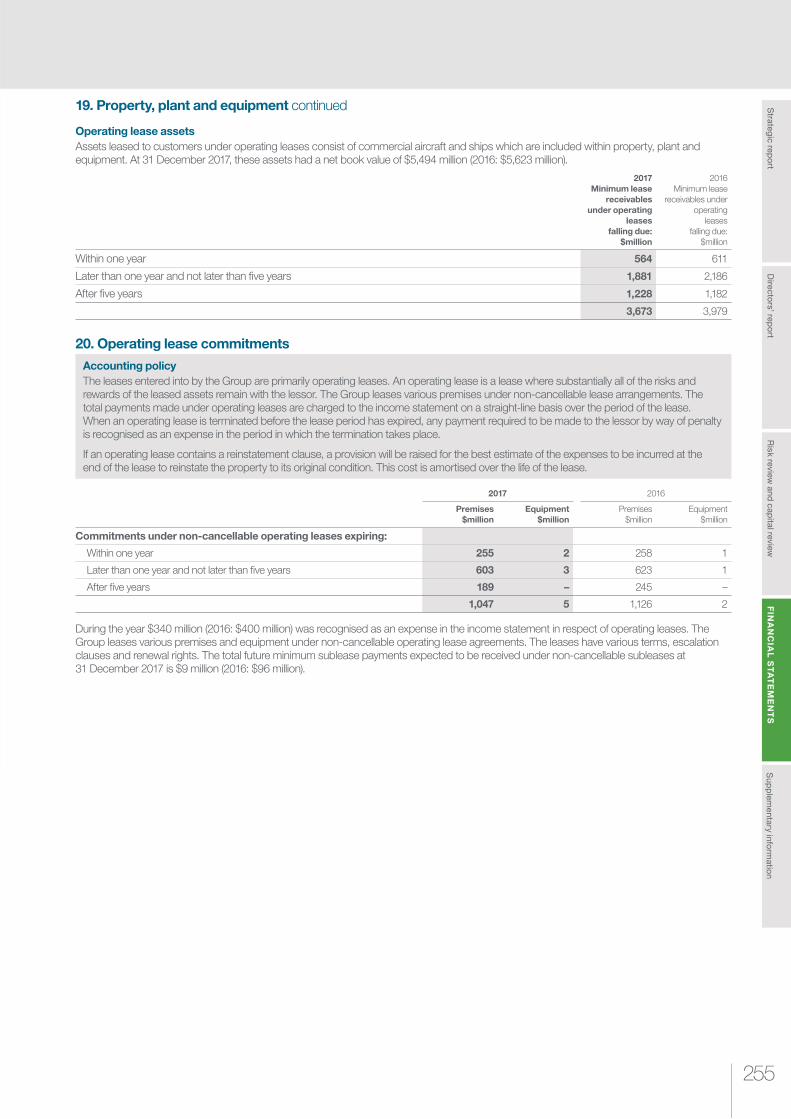
255
Ris
k re
vie
w a
nd
cap
ital re
vie
wS
trate
gic
rep
ort
Su
pp
lem
en
tary
info
rmatio
nF
INA
NC
IAL
ST
AT
EM
EN
TS
Dire
cto
rs’ re
po
rt
19. Property, plant and equipment continued
Operating lease assets
Assets leased to customers under operating leases consist of commercial aircraft and ships which are included within property, plant and equipment. At 31 December 2017, these assets had a net book value of $5,494 million (2016: $5,623 million).
2017
Minimum lease
receivables
under operating
leases
falling due:
$million
2016
Minimum lease
receivables under
operating
leases
falling due:
$million
Within one year 564 611
Later than one year and not later than fi ve years 1,881 2,186
After fi ve years 1,228 1,182
3,673 3,979
20. Operating lease commitments
Accounting policy
The leases entered into by the Group are primarily operating leases. An operating lease is a lease where substantially all of the risks and rewards of the leased assets remain with the lessor. The Group leases various premises under non-cancellable lease arrangements. The total payments made under operating leases are charged to the income statement on a straight-line basis over the period of the lease. When an operating lease is terminated before the lease period has expired, any payment required to be made to the lessor by way of penalty is recognised as an expense in the period in which the termination takes place.
If an operating lease contains a reinstatement clause, a provision will be raised for the best estimate of the expenses to be incurred at the end of the lease to reinstate the property to its original condition. This cost is amortised over the life of the lease.
2017 2016
Premises
$million
Equipment
$million
Premises
$million
Equipment
$million
Commitments under non-cancellable operating leases expiring:
Within one year 255 2 258 1
Later than one year and not later than fi ve years 603 3 623 1
After fi ve years 189 – 245 –
1,047 5 1,126 2
During the year $340 million (2016: $400 million) was recognised as an expense in the income statement in respect of operating leases. The Group leases various premises and equipment under non-cancellable operating lease agreements. The leases have various terms, escalation clauses and renewal rights. The total future minimum sublease payments expected to be received under non-cancellable subleases at 31 December 2017 is $9 million (2016: $96 million).

Standard Chartered
Annual Report 2017 256
FINANCIAL STATEMENTSNotes to the fi nancial statements
21. Other assets
Accounting policy
Financial instruments can be reclassifi ed as held for sale if they are non-current assets or if they are part of a disposal group; however, the measurement provisions for the fi nancial instruments remain governed by the requirements of IAS 39 Financial Instruments: Recognition and Measurement. Refer to note 13 Financial instruments for the relevant accounting policy.
Commodities represent physical holdings where the Group has title and exposure to the market risk associated with the holding. Commodities are fair valued with the fair value derived from observable spot or short-term futures prices from relevant exchanges.
2017
$million
2016
$million
Financial assets held at amortised cost (note 13):
Hong Kong SAR Government certifi cates of indebtedness (note 23)1 5,417 5,444
Cash collateral 9,513 14,230
Acceptances and endorsements 5,096 4,479
Unsettled trades and other fi nancial assets 9,896 9,789
29,922 33,942
Non-fi nancial assets:
Commodities2 3,263 2,719
Other assets 305 279
33,490 36,940
1 The Hong Kong SAR Government certifi cates of indebtedness are subordinated to the claims of other parties in respect of bank notes issued
2 Commodities are carried at fair value and classifi ed as Level 2
Assets held for sale
Non-current assets (such as property) and disposal groups (including both the assets and liabilities of the disposal groups) are classifi ed as held for sale and measured at the lower of their carrying amount and fair value less cost to sell when:
a) their carrying amounts will be recovered principally through sale
b) they are available-for-sale in their present condition
c) their sale is highly probable
Immediately before the initial classifi cation as held for sale, the carrying amounts of the assets (or assets and liabilities in the disposal group) are measured in accordance with the applicable accounting policies related to the asset or liability before reclassifi cation as held for sale.
The assets below have been presented as held for sale following the approval of Group management and the transactions are expected to complete in 2018.
Assets held for sale2017
$million
2016
$million
Non-current assets
Loans and advances to customers 2 –
Financial assets held at fair value through profi t or loss 466 –
Debt securities held at amortised cost 60 –
Interests in associates – 131
Others 17 12
545 143
Disposal group
Cash and balances at central banks – 1
Loans and advances to customers – 1,101
Prepayments and accrued income – 9
545 1,254
Assets held for sale include disposal groups and non-current assets as follows:
Principal Finance assets of $280 million, classifi ed in Financial assets held at fair value through profi t or loss ($216 million), Debt securities ($60 million) and Others ($4 million), expected to be completed in 2018
Asia Commercial Bank assets of $250 million classifi ed as Financial assets held at fair value through profi t or loss (sale completed in 2018, classifi ed as an interest in associate in 2016, and reclassifi ed after loss of signifi cant infl uence in 2017)
The disposal group disclosed in 2016 consisted of the Retail Banking Business of Standard Chartered Bank (Thai) Public Company Limited, the sale of which was completed in 2017
The assets reported above are in Level 3 except for Debt securities held at amortised cost and loans and advances to customers which are classifi ed as Level 2.

257
Ris
k re
vie
w a
nd
cap
ital re
vie
wS
trate
gic
rep
ort
Su
pp
lem
en
tary
info
rmatio
nF
INA
NC
IAL
ST
AT
EM
EN
TS
Dire
cto
rs’ re
po
rt
22. Debt securities in issue
Accounting policy
Refer to note 13 Financial instruments for the relevant accounting policy.
2017 2016
Certifi cates
of deposit of
$100,000 or more
$million
Other debt
securities
in issue
$million
Total
$million
Certifi cates
of deposit of
$100,000 or more
$million
Other debt
securities
in issue
$million
Total
$million
Debt securities in issue 20,460 25,919 46,379 15,020 31,680 46,700
Debt securities in issue included within:
Financial liabilities held at fair value through profi t or loss (note 13) 117 6,906 7,023 35 5,635 5,670
Total debt securities in issue 20,577 32,825 53,402 15,055 37,315 52,370
In 2017, the Company issued a total of $1.5 billion senior notes for general business purposes of the Group as shown below:
Securities $million
€750 million callable fi xed rate senior notes due 2023 901
€500 million callable fi xed rate senior notes due 2027 600
23. Other liabilities
Accounting policy
Refer to note 13 Financial instruments for the relevant accounting policy.
2017
$million
2016
$million
Financial liabilities held at amortised cost (note 13)
Notes in circulation1 5,417 5,444
Acceptances and endorsements 5,096 4,479
Cash collateral 9,825 9,624
Unsettled trades and other fi nancial liabilities 14,644 13,411
34,982 32,958
Non-fi nancial liabilities
Cash-settled share-based payments 39 26
Other liabilities 236 162
35,257 33,146
1 Hong Kong currency notes in circulation of $5,417 million (2016: $5,444 million) that are secured by the government of Hong Kong SAR certifi cates of indebtedness of the same
amount included in other assets (note 21)
Liabilities included in disposal group held for sale12017
$million
2016
$million
Customer accounts – 958
Other liabilities – 1
Accruals and deferred income – 6
– 965
1 Liabilities included in disposal group held for sale are classifi ed within Level 2 of the fair value hierarchy. The disposal group disclosed in 2016 consisted of the Retail Banking Business
of Standard Chartered Bank (Thai) Public Company Limited, the sale of which was completed in 2017

Standard Chartered
Annual Report 2017 258
FINANCIAL STATEMENTSNotes to the fi nancial statements
24. Provisions for liabilities and charges
Accounting policy
The Group recognises a provision for a present legal or constructive obligation resulting from a past event when it is more likely than not that it will be required to transfer economic benefi ts to settle the obligation and the amount of the obligation can be estimated reliably. Where a liability arises based on participation in a market at a specifi ed date, the obligation is recognised in the fi nancial statements on that date and is not accrued over the period.
Signifi cant accounting estimates and judgementsThe recognition and measurement of provisions for liabilities and charges requires signifi cant judgement and the use of estimates about uncertain future conditions or events. Determining the best estimate of the probability of outfl ow of economic resources, cost of settling a provision and timing of settlement, requires signifi cant judgement by management. These areas are inherently uncertain such as legal decisions, outcome of regulator reviews and anticipated cost of redress.
2017 2016
Provision
for credit
commitments
$million
Other
provisions
$million
Total
$million
Provision
for credit
commitments
$million
Other
provisions
$million
Total
$million
At 1 January 109 104 213 100 115 215
Exchange translation differences (2) 1 (1) (2) (2) (4)
(Release)/charge against profi t (23) 83 60 45 37 82
Provisions utilised (1) (88) (89) (34) (46) (80)
At 31 December 83 100 183 109 104 213
Provision for credit commitment comprises those undrawn contractually committed facilities where there is doubt as to the borrowers’ ability to meet their repayment obligations.
Other provisions consists mainly of provisions for regulatory settlements and legal claims, the nature of which are described in note 26.
25. Contingent liabilities and commitments
Accounting policy
Contingent liabilities are possible obligations arising from past events, whose existence will be confi rmed only by uncertain future events or present obligations arising from past events that are not recognised because either an outfl ow of economic benefi ts is not probable or the amount of the obligation cannot be reliably measured. Contingent liabilities are not recognised but information about them is disclosed unless the possibility of any outfl ow of economic benefi ts in settlement is remote.
Where the Group undertakes to make a payment on behalf of its customers for guarantees issued such as for performance bonds or as irrevocable letters of credit as part of the Group’s Transaction Banking business for which an obligation to make a payment has not arisen at the reporting date those are included in these fi nancial statements as contingent liabilities.
Other contingent liabilities primarily include revocable letters of credit and bonds issued on behalf of customers to customs offi cials, for bids or offers and as shipping guarantees.
Commitments are where the Group has confi rmed its intention to provide funds to a customer or on behalf of a customer in the form of loans, overdrafts, future guarantees whether cancellable or not or letters of credit and the Group has not made payments at the balance sheet date, those instruments are included in these fi nancial statement as commitments.
Capital commitments are contractual commitments the Group has entered into to purchase non-fi nancial assets.

259
Ris
k re
vie
w a
nd
cap
ital re
vie
wS
trate
gic
rep
ort
Su
pp
lem
en
tary
info
rmatio
nF
INA
NC
IAL
ST
AT
EM
EN
TS
Dire
cto
rs’ re
po
rt
25. Contingent liabilities and commitments continued
The table below shows the contract or underlying principal amounts and risk-weighted amounts of unmatured off-balance sheet transactions at the balance sheet date. The contract or underlying principal amounts indicate the volume of business outstanding and do not represent amounts at risk.
2017
$million
2016
$million
Contingent liabilities
Guarantees and irrevocable letters of credit 37,311 32,2861
Other contingent liabilities 6,210 6,0161
43,521 38,3021
Commitments
Documentary credits and short-term trade-related transactions 3,880 4,120
Forward asset purchases and forward deposits placed – 6
Undrawn formal standby facilities, credit lines and other commitments to lend
One year and over 43,730 38,108
Less than one year 20,160 17,547
Unconditionally cancellable 113,584 118,330
181,354 178,111
Capital commitments
Contracted capital expenditure approved by the directors but not provided for in these accounts 468 1,736
1 Total contingent liabilities of the Group have been restated from $37.4 billion to $38.3 billion (increase of $0.9 billion). Guarantees and irrevocable letters of credit have been restated
from $33.6 billion to $32.3 billion (reduction of $1.3 billion), and other contingent liabilities have been restated from $3.8 billion to $6.0 billion (offsetting increase of $2.2 billion)
The Group’s share of contingent liabilities and commitments relating to joint ventures is $0.2 billion (31 December 2016: $0.2 billion).
The Group has committed to purchase 10 aircraft for delivery in 2018. The total purchase commitment for these orders is $458 million. Pre-delivery payments of $88.5 million have been made to date in respect of these aircraft.
As set out in note 26, the Group has contingent liabilities in respect of certain legal and regulatory matters for which it is not practicable to estimate the fi nancial impact as there are many factors that may affect the range of possible outcomes.
26. Legal and regulatory matters
Accounting policy
Where appropriate, the Group recognises a provision for liabilities when it is probable that an outfl ow of economic resources embodying economic benefi ts will be required and for which a reliable estimate can be made of the obligation. The uncertainties inherent in legal and regulatory matters affect the amount and timing of any potential outfl ows with respect to which provisions have been established.
Claims and other proceedings
The Group receives legal claims against it in a number of jurisdictions and is a party to regulatory proceedings arising in the normal course of business.
Apart from the matters described below, the Group currently considers none of these claims or proceedings to be material.
2012 Settlements with certain US authoritiesIn 2012, the Group reached settlements with certain US authorities regarding US sanctions compliance in the period 2001 to 2007, involving a Consent Order by the New York Department of Financial Services (NYDFS), a Cease and Desist Order by the Board of Governors of the Federal Reserve System (Fed), Deferred Prosecution Agreements (DPAs) with each of the Department of Justice (DOJ) and the New York County District Attorney’s Offi ce (DANY) and a Settlement Agreement with the Offi ce of Foreign Assets Control (together, the ‘Settlements’ and together the foregoing authorities, the ‘US authorities’). In addition to the civil penalties totalling $667 million, the terms of these Settlements include a number of conditions and ongoing obligations with regard to improving sanctions, Anti-Money Laundering (AML) and Bank Secrecy Act (BSA) controls such as remediation programmes, reporting requirements, compliance reviews and programmes, banking transparency requirements, training measures, audit programmes, disclosure obligations and, in connection with the NYDFS Consent Order, the appointment of an independent monitor (Monitor). These obligations are managed under a programme of work referred to as the US Supervisory Remediation Program (SRP). The SRP comprises work streams designed to ensure compliance with the remediation requirements contained in all of the Settlements and the Group is engaged with all relevant authorities to implement these programmes and meet the Group’s obligations under the Settlements.
On 9 December 2014, the Group announced that the DOJ, DANY and the Group had agreed to a three-year extension of the DPAs until 10 December 2017, resulting in the subsequent retention of the Monitor to evaluate and make recommendations regarding the Group’s sanctions compliance programme. On 9 November 2017, the Group announced the further extension of the DPAs until 28 July 2018.
The November 2017 DPA extension agreement noted that the Group had taken a number of steps and made signifi cant progress to comply with the requirements of the DPA and enhance its sanctions compliance programme, but that the programme had not at the time reached the standard required by the DPA. The Group is committed to ongoing cooperation with the authorities and to continuing to implement a comprehensive programme of improvements to its fi nancial crime controls.
Standard Chartered
Annual Report 2017 260
FINANCIAL STATEMENTSNotes to the fi nancial statements
26. Legal and regulatory matters continued
Claims and other proceedings continued
2014 Settlement with NYDFSOn 19 August 2014, the Group announced that it had reached a fi nal settlement with the NYDFS regarding defi ciencies in the AML transaction surveillance system in its New York branch (the ‘Branch’). The system, which is separate from the sanctions screening process, is one part of the Group’s overall fi nancial crime controls and is designed to alert the Branch to unusual transaction patterns that require further investigation on a post-transaction basis.
The settlement provisions are summarised as follows:
(i) A civil monetary penalty of $300 million
(ii) Enhancements to the transaction surveillance system at the Branch
(iii) A two-year extension to the term of the Monitor (which, on 21 April 2017, was further extended to operate until 31 December 2018)
(iv) A set of temporary remediation measures, which will remain in place until the transaction surveillance system’s detection scenarios are operating to a standard approved by the Monitor. These temporary remediation measures include a restriction on opening, without prior approval of the NYDFS, a US dollar demand deposit account for any client that does not already have such an account with the Branch, a restriction on US dollar-clearing services for certain clients in Hong Kong and enhanced monitoring of certain high-risk clients in the UAE.
The remit of the SRP covers the management of these obligations.
Other ongoing investigations and reviewsThe Group continues to cooperate with an investigation by the US authorities relating to historical violations of US sanctions laws and regulations. In contrast to the 2012 settlements, which focused on the period before the Group’s 2007 decision to stop doing new business with known Iranian parties, the ongoing investigation is focused on examining the extent to which conduct and control failures permitted clients with Iranian interests to conduct transactions through Standard Chartered Bank after 2007 and the extent to which any such failures were shared with relevant US authorities in 2012.
The Group is engaged in ongoing discussions with the relevant US authorities regarding the resolution of this investigation, and such resolution may involve a range of civil and criminal penalties for sanctions compliance violations including substantial monetary penalties combined with other compliance measures such as remediation requirements and/or business restrictions.
Standard Chartered Bank is also engaged in ongoing discussions with the Financial Conduct Authority (FCA) regarding an investigation concerning its fi nancial crime controls. The investigation is looking at the effectiveness and governance of those controls within the correspondent banking business carried out by Standard Chartered Bank’s London branch, particularly in relation to the business carried on with respondent banks from outside the European Economic Area and the effectiveness and governance of those controls in one of Standard Chartered Bank’s overseas branches and the oversight exercised at Group level over those controls. Any resolution of the investigation could involve a substantial monetary penalty and other civil measures available to the FCA.
As part of their remit to oversee market conduct, regulators and other agencies in certain markets are conducting investigations or requesting reviews into a number of areas of regulatory compliance and market conduct, including sales and trading, involving a range of fi nancial products, and submissions made to set various market interest rates and other fi nancial benchmarks, such as foreign exchange. At relevant times, certain of the Group’s branches and/or subsidiaries were (and are) participants in some of those markets, in some cases submitting data to bodies that set such rates and other fi nancial benchmarks and responding to inquiries and investigations by relevant authorities, and the Group is facing regulatory investigations and proceedings in various jurisdictions related to foreign exchange trading. There may be penalties or other fi nancial consequences to the Group as a result. The Group is contributing to industry proposals to strengthen fi nancial benchmarks processes in certain markets and continues to review its practices and processes in the light of the investigations, reviews and the industry proposals.
It is not practicable to estimate the fi nancial impact of these matters as there are many factors that may affect the range of possible outcomes; however, the resulting fi nancial impact could be substantial.
The Securities and Futures Commission (SFC) in Hong Kong has been investigating Standard Chartered Securities (Hong Kong) Limited’s (SCSHK) role as a joint sponsor of an initial public offering of China Forestry Holdings Limited, which was listed on the Hong Kong Stock Exchange in 2009. The SFC is pursuing disciplinary action against SCSHK, and there may be fi nancial consequences for SCSHK in connection with this action.

261
Ris
k re
vie
w a
nd
cap
ital re
vie
wS
trate
gic
rep
ort
Su
pp
lem
en
tary
info
rmatio
nF
INA
NC
IAL
ST
AT
EM
EN
TS
Dire
cto
rs’ re
po
rt
27. Subordinated liabilities and other borrowed funds
Accounting policy
Subordinated liabilities and other borrowed funds are classifi ed as fi nancial instruments. Refer to note 13 Financial instruments for the accounting policy.
All subordinated liabilities are unsecured, unguaranteed and subordinated to the claims of other creditors including without limitation, customer deposits and deposits by banks. The Group has the right to settle these debt instruments in certain circumstances as set out in the contractual agreements.
2017
$million
2016
$million
Subordinated loan capital – issued by subsidiary undertakings
£700 million 7.75 per cent subordinated notes 2018 956 898
£675 million 5.375 per cent undated step up subordinated notes (callable 2020) 327 307
£200 million 7.75 per cent subordinated notes (callable 2022) 221 215
$750 million 5.875 per cent subordinated notes 2020 768 785
$700 million 8.0 per cent subordinated notes 2031 426 432
BWP 127.26 million 8.2 per cent subordinated notes 2022 (callable) 13 12
BWP 70 million fl oating rate subordinated notes 2021 (callable) 7 7
BWP 50 million fl oating rate notes 2022 (callable) 5 5
JPY 10 billion 3.35 per cent subordinated notes 2023 (callable 2018) 89 88
KRW 90 billion 6.05 per cent subordinated debt 2018 85 79
SGD 450 million 5.25 per cent subordinated notes 2023 (callable 2018) 339 318
€700 million 5.875 per cent subordinated notes 2017 – 766
€400 million 5.875 per cent subordinated notes 2017 – 431
$1 billion 6.4 per cent notes subordinated notes 2017 – 512
PKR 2.5 billion fl oating rate notes 2022 (callable) – 24
3,236 4,879
Subordinated loan capital – issued by the Company
Primary capital fl oating rate notes:
$400 million 16 16
$300 million (Series 2) 69 69
$400 million (Series 3) 50 50
$200 million (Series 4) 26 26
£150 million 16 15
£900 million 5.125 per cent subordinated debt 2034 1,498 1,307
$2 billion 5.7 per cent subordinated debt 2044 2,395 2,372
$2 billion 3.95 per cent subordinated debt 2023 1,959 1,971
$1 billion 5.7 per cent subordinated notes 2022 1,004 996
$1 billion 5.2 per cent subordinated debt 2024 1,014 1,027
$750 million 5.3 per cent subordinated debt 2043 787 788
$1.25 billion 4.3 per cent subordinated debt 2027 1,144 1,220
€1.25 billion 4 per cent subordinated debt 2025 (callable 2020) 1,565 1,387
€750 million 3.625 per cent subordinated notes 2022 958 852
€500 million 3.125 per cent subordinated debt 2024 613 543
SGD 700 million 4.4 per cent subordinated notes 2026 (callable 2021) 531 473
Other subordinated borrowings – issued by company1 295 283
$1.25 billion 4 per cent subordinated notes 2022 (callable) – 1,249
13,940 14,644
Total for Group 17,176 19,523
1 Other borrowings comprise irredeemable sterling preference shares (note 28). In the balance sheet of the Company the amount recognised is $58 million (2016: $221 million), with the
difference being the effect of hedge accounting achieved on a Group basis

Standard Chartered
Annual Report 2017 262
FINANCIAL STATEMENTSNotes to the fi nancial statements
27. Subordinated liabilities and other borrowed funds continued2017
USD
$million
GBP
$million
EUR
$million
Others
$million
Total
$million
Fixed rate subordinated debt 9,497 3,297 3,136 1,057 16,987
Floating rate subordinated debt 161 16 – 12 189
Total 9,658 3,313 3,136 1,069 17,176
2016
USD1
$million
GBP
$million
EUR
$million
Others
$million
Total
$million
Fixed rate subordinated debt 11,352 3,010 3,979 970 19,311
Floating rate subordinated debt 161 15 – 36 212
Total 11,513 3,025 3,979 1,006 19,523
1 2016 numbers have been restated moving $1.2 billion from fl oating rate to fi xed rate subordinated debt
Redemptions during the year
On 12 July 2017, Standard Chartered PLC exercised its right to redeem its $1.25 billion 4.0 per cent callable subordinated notes in full on the fi rst call date.
On 26 September 2017, Standard Chartered Bank redeemed:
The remaining $512 million of its $1 billion 6.4 per cent subordinated notes on the date of maturity
€700 million 5.875 per cent subordinated notes in full on its maturity
€400 million 5.875 per cent subordinated notes in full on its maturity
On 28 December 2017, Standard Chartered Bank Pakistan exercised its right to redeem PKR 2.5 billion fl oating rate notes 2022 in full on the fi rst call date.
Issuances during the year
There were no new issuances during the year ended 31 December 2017.
28. Share capital, other equity instruments and reserves
Accounting policy
Financial instruments issued are classifi ed as equity when there is no contractual obligation to transfer cash, other fi nancial assets or issue available number of own equity instruments. Incremental costs directly attributable to the issue of new shares or options are shown in equity as a deduction, net of tax, from the proceeds.
Securities which carry a discretionary coupon and have no fi xed maturity or redemption date are classifi ed as other equity instruments. Interest payments on these securities are recognised, net of tax, as distributions from equity in the period in which they are paid.
Where the Company or other members of the consolidated Group purchase the Company’s equity share capital, the consideration paid is deducted from the total shareholders’ equity of the Group and/or of the Company as treasury shares until they are cancelled. Where such shares are subsequently sold or reissued, any consideration received is included in shareholders’ equity of the Group and/or the Company.
Group and Company
Number of
ordinary shares
millions
Ordinary
share capital1
$million
Share
premium2
$million
Total share
capital & share
premium
$million
Other equity
instruments
$million
At 1 January 2016 3,278 1,639 5,449 7,088 1,987
Shares issued 6 3 – 3 –
Additional Tier 1 equity issuance – – – – 1,982
At 31 December 2016 3,284 1,642 5,449 7,091 3,969
Shares issued 12 6 – 6 –
Additional Tier 1 equity issuance – – – – 992
At 31 December 2017 3,296 1,648 5,449 7,097 4,961
1 Issued and fully paid ordinary shares of 50 cents each
2 Includes $1,494 million of share premium relating to preference capital
Ordinary share capital
In accordance with the Companies Act 2006 the Company does not have authorised share capital. The nominal value of each ordinary share is 50 cents.
During the year 12,272,991 shares were issued under employee share plans at prices between nil and 557.76 pence.

263
Ris
k re
vie
w a
nd
cap
ital re
vie
wS
trate
gic
rep
ort
Su
pp
lem
en
tary
info
rmatio
nF
INA
NC
IAL
ST
AT
EM
EN
TS
Dire
cto
rs’ re
po
rt
28. Share capital, other equity instruments and reserves continued
Preference share capital
At 31 December 2016 and 2017, the company has 15,000 $5 non-cumulative redeemable preference shares in issue, with a premium of $99,995 making a paid up amount per preference share of $100,000. The preference shares are redeemable at the option of the company and are classifi ed in equity.
The available profi ts of the company are distributed to the holders of the issued preference shares in priority to payments made to holders of the ordinary shares and in priority to, or pari passu with, any payments to the holders of any other class of shares in issue. On a winding up, the assets of the Company are applied to the holders of the preference shares in priority to any payment to the ordinary shareholders and in priority to, or pari passu with, the holders of any other shares in issue, for an amount equal to any dividends accrued and/or payable and the nominal value of the shares together with any premium as determined by the board. The redeemable preference shares are redeemable at the paid up amount (which includes premium) at the option of the Company in accordance with the terms of the shares. The holders of the preference shares are not entitled to attend or vote at any general meeting except where any relevant dividend due is not paid in full or where a resolution is proposed varying the rights of the preference shares.
Other equity instruments
On 2 April 2015 Standard Chartered PLC issued $2,000 million Fixed Rate Resetting Perpetual Subordinated Contingent Convertible Securities as Additional Tier 1 (AT1) securities, raising $1,987 million after issue costs. On 18 August 2016, Standard Chartered PLC issued a further $2,000 million Fixed Rate Resetting Perpetual Subordinated Contingent Convertible Securities as AT1 securities, raising $1,982 million after issue costs. On 18 January 2017, Standard Chartered PLC issued a further $1,000 million Fixed Rate Resetting Perpetual Subordinated Contingent Convertible Securities as AT1 securities, raising $992 million after issue costs. All the issuances were made for general business purposes and to increase the regulatory capital base of the Group.
The principal terms of the AT1 securities are described below:
The securities are perpetual and redeemable, at the option of Standard Chartered PLC in whole but not in part, on the fi rst interest reset date and each date falling fi ve years after the fi rst reset date
The securities are also redeemable for certain regulatory or tax reasons on any date at 100 per cent of their principal amount together with any accrued but unpaid interest upto (but excluding) the date fi xed for redemption. Any redemption is subject to Standard Chartered PLC giving notice to the relevant regulator and the regulator granting permission to redeem
The interest rate in respect of the securities issued on 2 April 2015 for the period from (and including) the issue date to (but excluding) 2 April 2020 is a fi xed rate of 6.50 per cent per annum. The fi rst reset date for the interest rate is 2 April 2020 and each date falling fi ve, or an integral multiple of fi ve years after the fi rst reset date
The interest rate in respect of the securities issued on 18 August 2016 for the period from (and including) the issue date to (but excluding) 2 April 2022 is a fi xed rate of 7.50 per cent per annum. The fi rst reset date for the interest rate is 2 April 2022 and each date falling fi ve years, or an integral multiple of fi ve years, after the fi rst reset date
The interest rate in respect of the securities issued on 18 January 2017 for the period from (and including) the issue date to (but excluding) 2 April 2023 is a fi xed rate of 7.75 per cent per annum. The fi rst reset date for the interest rate is 2 April 2023 and each date falling fi ve years, or an integral multiple of fi ve years, after the fi rst reset date
The interest on each of the securities will be payable semi-annually in arrears on 2 April and 2 October in each year, accounted for as a dividend
Interest on the securities is due and payable only at the sole and absolute discretion of Standard Chartered PLC, subject to certain additional restrictions set out in the terms and conditions. Accordingly, Standard Chartered PLC may at any time elect to cancel any interest payment (or part thereof) which would otherwise be payable on any interest payment date
The securities convert into ordinary shares of Standard Chartered PLC, at a pre-determined price, should the fully loaded Common Equity Tier 1 ratio of the Group fall below 7.0 per cent. Approximately 572 million ordinary shares would be required to satisfy the conversion of all the securities mentioned above
The securities rank behind the claims against Standard Chartered PLC of: (a) unsubordinated creditors; (b) which are expressed to be subordinated to the claims of unsubordinated creditors of Standard Chartered PLC but not further or otherwise; or (c) which are, or are expressed to be, junior to the claims of other creditors of Standard Chartered PLC, whether subordinated or unsubordinated, other than claims which rank, or are expressed to rank, pari passu with, or junior to, the claims of holders of the AT1 securities in a winding-up occurring prior to the conversion trigger.
Reserves
The constituents of the reserves are summarised as follows:
The capital reserve represents the exchange difference on redenomination of share capital and share premium from sterling to US dollars in 2001. The capital redemption reserve represents the nominal value of preference shares redeemed
Merger reserve represents the premium arising on shares issued using a cash box fi nancing structure, which required the Company to create a merger reserve under section 612 of the Companies Act 2006. Shares were issued using this structure in 2005 and 2006 to assist in the funding of certain acquisitions, in 2008, 2010 and 2015 for the shares issued by way of a rights issue, and for the shares issued in 2009 in the placing. The funding raised by the 2008 and 2010 rights issues and 2009 share issue was fully retained within the Company
Own credit adjustment reserve represents the cumulative gains and losses on fi nancial liabilities designated at fair value through profi t or loss relating to own credit. Following the Group’s decision to early apply this IFRS 9 requirement the cumulative OCA component of fi nancial liabilities designated at fair value through profi t or loss has been transferred from opening retained earnings to the OCA reserve. Gains and losses on fi nancial liabilities designated at fair value through profi t or loss relating to own credit in the year have been taken through other comprehensive income into this reserve. On derecognition of applicable instruments, the balance of any OCA will not be recycled to the income statement, but will be transferred within equity to retained earnings

Standard Chartered
Annual Report 2017 264
FINANCIAL STATEMENTSNotes to the fi nancial statements
28. Share capital, other equity instruments and reserves continued
Reserves continued
Available-for-sale reserve represents the unrealised fair value gains and losses in respect of fi nancial assets classifi ed as available-for-sale, net of taxation. Gains and losses are deferred in this reserve and are reclassifi ed to the income statement when the underlying asset is sold, matures or becomes impaired
Cash fl ow hedge reserve represents the effective portion of the gains and losses on derivatives that meet the criteria for these types of hedges. Gains and losses are deferred in this reserve and are reclassifi ed to the income statement when the underlying hedged item affects profi t and loss or when a forecast transaction is no longer expected to occur
Translation reserve represents the cumulative foreign exchange gains and losses on translation of the net investment of the Group in foreign operations. Since 1 January 2004, gains and losses are deferred to this reserve and are reclassifi ed to the income statement when the underlying foreign operation is disposed. Gains and losses arising from derivatives used as hedges of net investments are netted against the foreign exchange gains and losses on translation of the net investment of the foreign operations
Retained earnings represents profi ts and other comprehensive income earned by the Group and Company in the current and prior periods, together with the after tax increase relating to equity-settled share options, less dividend distributions and own shares held (treasury shares)
A substantial part of the Group’s reserves are held in overseas subsidiary undertakings and branches, principally to support local operations or to comply with local regulations. The maintenance of local regulatory capital ratios could potentially restrict the amount of reserves which can be remitted. In addition, if these overseas reserves were to be remitted, further unprovided taxation liabilities might arise
As at 31 December 2017, the distributable reserves of Standard Chartered PLC (the Company) were $15.1 billion (2016: $15.2 billion). These comprised retained earnings and $12.5 billion of the merger reserve account. Distribution of reserves is subject to maintaining minimum capital requirements.
Own shares
Computershare Trustees (Jersey) Limited is the trustee of the 2004 Employee Benefi t Trust (2004 Trust) and Ocorian Trustees (Jersey) Limited (formerly known as Bedell Trustees Limited) is the trustee of the 1995 Employees’ Share Ownership Plan Trust (1995 Trust). The 2004 Trust is used in conjunction with the Group’s employee share schemes and the 1995 Trust is used for the delivery of other employee share-based payments (such as upfront shares and fi xed pay allowances). Group companies fund these trusts from time to time to enable the trustees to acquire shares to satisfy these arrangements.
Except as disclosed, neither the Company nor any of its subsidiaries has bought, sold or redeemed any securities of the company listed on The Stock Exchange of Hong Kong Limited during the period. Details of the shares purchased and held by the trusts are set out below.
Number of shares
1995 Trust 2004 Trust Total
2017 2016 2017 2016 2017 2016
Shares purchased during the year – 6,160,185 – – – 6,160,185
Market price of shares purchased ($million) – 51 – – – 51
Shares held at the end of the year 3,769,011 6,104,154 18,004 78,313 3,787,015 6,182,467
Maximum number of shares held during the year 6,182,467 6,183,210
29. Non-controlling interests
Accounting policy
Non-controlling interests are measured either at fair value or at the non-controlling interest’s proportionate share of the acquiree’s identifi able net assets.
$million
At 1 January 2016 321
Loss in equity attributable to non-controlling interests (11)
Other profi ts attributable to non-controlling interests 56
Comprehensive income for the year 45
Distributions (37)
Other decreases1 (8)
At 31 December 2016 321
Income in equity attributable to non-controlling interests 1
Other profi ts attributable to non-controlling interests 49
Comprehensive income for the year 50
Distributions (51)
Other increases2 21
At 31 December 2017 341
1 Mainly due to completion of sale of businesses with non-controlling interest in Pakistan and issuance of shares to non-controlling interest in Angola
2 Mainly due to additional shares issued including the premium by Nepal $12 million and $9 million with respect to an acquisition during 2017

265
Ris
k re
vie
w a
nd
cap
ital re
vie
wS
trate
gic
rep
ort
Su
pp
lem
en
tary
info
rmatio
nF
INA
NC
IAL
ST
AT
EM
EN
TS
Dire
cto
rs’ re
po
rt
30. Retirement benefi t obligations
Accounting policy
The Group operates pension and other post-retirement benefi t plans around the world, which can be categorised into defi ned contribution plans and defi ned benefi t plans.
For defi ned contribution plans, the Group pays contributions to publicly or privately administered pension plans on a statutory or contractual basis, and such amounts are charged to operating expenses. The Group has no further payment obligations once the contributions have been paid. For funded defi ned benefi t plans, the liability recognised in the balance sheet is the present value of the defi ned benefi t obligation at the balance sheet date less the fair value of plan assets.
For unfunded defi ned benefi t plans the liability recognised at the balance sheet date is the present value of the defi ned benefi t obligation. The defi ned benefi t obligation is calculated annually by independent actuaries using the projected unit method. The present value of the defi ned benefi t obligation is determined by discounting the estimated future cash outfl ows using an interest rate equal to the yield on high-quality corporate bonds of the same currency and term as the benefi t payments.
Actuarial gains and losses that arise are recognised in shareholders’ equity and presented in the statement of other comprehensive income in the period they arise. The Group determines the net interest expense on the net defi ned benefi t liability for the year by applying the discount rate used to measure the defi ned benefi t obligation at the beginning of the annual period to the then net defi ned benefi t liability, taking into account any changes in the net defi ned benefi t liability during the year as a result of contributions and benefi t payments. Net interest expense, the cost of the accrual of new benefi ts, benefi t enhancements (or reductions) and administration expenses met directly from plan assets are recognised in the income statement.
Signifi cant accounting estimates and judgementsThere are many factors that affect the measurement of retirement benefi t obligations of the UK Fund and overseas plans. This measurement requires the use of assumptions, such as infl ation, salary increases, pension increases and discount rates which are inherently uncertain; the sensitivity of the liabilities to changes in these assumptions is shown in the note below.
Retirement benefi t obligations comprise:
2017
$million
2016
$million
Defi ned benefi t plans obligation 443 495
Defi ned contribution plans obligation 12 30
Net obligation 455 525
Retirement benefi t charge comprises:
2017
$million
2016
$million
Defi ned benefi t plans 98 85
Defi ned contribution plans 259 231
Charge against profi t (note 7) 357 316
The Group operates over 50 defi ned benefi t plans across its geographies, many of which are closed to new entrants who now join defi ned contribution arrangements. The aim of all these plans is to give employees the opportunity to save appropriately for retirement in a way that is consistent with local regulations, taxation requirements and market conditions. The defi ned benefi t plans expose the Group to currency risk, interest rate risk, investment risk and actuarial risks such as longevity risk.
The material holdings of government and corporate bonds shown in the asset table below partially hedge movements in the liabilities resulting from interest rate changes. Setting aside movements from other drivers such as currency fl uctuation, the falls in discount rates in most geographies over 2017 have led to higher liabilities. These have been somewhat offset by rises in the value of bonds held, higher stock markets generally and changes to demographic assumptions refl ecting an assumed lower future pace of mortality improvements in the UK. These movements are shown as actuarial losses versus gains respectively in the tables below. Higher contributions into a number of plans have also helped the net defi cit reduce over the year.
The disclosures required under IAS 19 have been calculated by independent qualifi ed actuaries based on the most recent full actuarial valuations updated, where necessary, to 31 December 2017.
UK Fund
The Standard Chartered Pension Fund (the ‘UK Fund’) is the Group’s largest pension plan, representing 60 per cent of total pension liabilities, and provides pensions based on 1/60th of fi nal salary per year of service, normally payable from age 60. The UK Fund is set up under a trust that is legally separate from the Bank (its formal sponsor) and, as required by UK legislation, at least one-third of the trustee directors are nominated by members; the remainder are appointed by the Bank. The trustee directors have a fi duciary duty to members and are responsible for governing the UK Fund in accordance with its Trust Deed and Rules.
The fi nancial position of the UK Fund is regularly assessed by an independent qualifi ed actuary. The funding valuation as at 31 December 2017 is currently underway with results expected to be fi nalised over the course of 2018, as permitted by UK pension regulations. The most recent completed funding valuation was performed as at 31 December 2014 by A Zegleman, Fellow of the Institute and Faculty of Actuaries, of Willis Towers Watson, using the projected unit method and assumptions different from those below. To repair the $97 million (£72 million) past service defi cit identifi ed as at 31 December 2014, four annual cash payments of $17.0 million (£12.6 million) were agreed, starting in January 2016. The agreement allows that if the funding position improves more quickly than expected, the three payments from January 2017 could be reduced or eliminated. The actuarial assessment that applied to the January 2017 and 2018 payments did not allow for a reduction in either case, so the full £12.6 million payments were paid into the Fund on 16 January 2017 and 11 January 2018. In addition, an escrow account of $149 million (£110 million) exists to provide security for future contributions. Following the 31 December 2014 valuation, regular contributions to the UK Fund were set at 32 per cent of pensionable salary for all members.

Standard Chartered
Annual Report 2017 266
FINANCIAL STATEMENTSNotes to the fi nancial statements
30. Retirement benefi t obligations continued
UK Fund continued
With effect from 1 July 1998, the UK Fund was closed to new entrants and new employees are offered membership of a defi ned contribution plan. Over 90 per cent of the Fund’s liabilities now relate to pensioners or ex-employees who have left the Group but have not yet retired. The discretionary pension increase awarded April 2017 was half what was assumed in the accounting liabilities, and this is refl ected in the gain in the pension cost table below. As at 31 December 2017, the weighted-average duration of the UK Fund was 15 years (2016: 16 years).
The Group is not required to recognise any additional liability under IFRIC 14 or the 2015 exposure draft of proposed amendments to it, as the Bank has control of any pension surplus under the Trust Deed and Rules.
Overseas plans
The principal overseas defi ned benefi t arrangements operated by the Group are in Germany, Hong Kong, India, Jersey, Korea, Taiwan and the United States of America (US).
Key assumptionsThe principal fi nancial assumptions used at 31 December 2017 were:
Funded plans
UK Fund1 Overseas Plans2
2017
%
2016
%
2017
%
2016
%
Price infl ation 2.1 2.1 1.0–5.0 1.0–5.0
Salary increases 2.1 2.1 2.1–7.0 2.1–6.5
Pension increases 2.1 2.1 1.6–3.2 1.5–3.2
Discount rate 2.5 2.7 1.0–7.2 1.3–6.9
1 The assumptions for life expectancy for the UK Fund are that a male member currently aged 60 will live for 28 years (2016: 28 years) and a female member for 29 years (2016: 29 years)
and a male member currently aged 40 will live for 30 years (2016: 30 years) and a female member for 30 years (2016: 31 years) after their 60th birthdays
2 The range of assumptions shown is for the main funded defi ned benefi t overseas plans in Germany, Hong Kong, India, Jersey, Korea, Taiwan and the US. These comprise over
85 per cent of the total liabilities of funded overseas plans
These assumptions are likely to change in the future and this will affect the value placed on the liabilities. For example, changes at the reporting date to one of the relevant actuarial assumptions, holding other assumptions constant, would have affected the defi ned benefi t obligation by the amounts shown below:
If the discount rate increased by 25 basis points the liability would reduce by approximately $65 million for the UK Fund and $30 million for the other plans
If the rate of infl ation and pension increases increased by 25 basis points the liability would increase by approximately $45 million for the UK Fund and $20 million for the other plans
If the rate salaries increase compared with infl ation increased by 25 basis points the liability would increase by $2 million for the UK Fund and approximately $15 million for the other plans
If longevity expectations increased by one year the liability would increase by approximately $55 million for the UK Fund and $15 million for the other plans
Although this analysis does not take account of the full distribution of cash fl ows expected under the UK Fund, it does provide an approximation of the sensitivity to the main assumptions. While changes in other assumptions would also have an impact, the effect would not be as signifi cant.
Unfunded plans
US post-retirement medical1 Other2
2017
%
2016
%
2017
%
2016
%
Price infl ation 2.5 2.5 1.9–5.0 2.0–5.0
Salary increases N/A 4 2.1–7.0 2.1–6.5
Pension increases N/A N/A 0.0–2.1 0.0–2.1
Discount rate 3.8 4.4 2.3–7.2 2.7–8.4
Post-retirement medical rate 8% in 2017 reducing by
1% per annum to 5% in 2020
9% in 2016 reducing by 1%
per annum to 5% in 2020
N/A N/A
1 The US post-retirement medical plan is closed to new entrants and eligibility for benefi ts tightened. This is refl ected in the pension cost table below
2 The range of assumptions shown is for the main unfunded plans in India, Korea, Thailand, UAE and the UK. They comprise around 85 per cent of the total liabilities of unfunded plans

267
Ris
k re
vie
w a
nd
cap
ital re
vie
wS
trate
gic
rep
ort
Su
pp
lem
en
tary
info
rmatio
nF
INA
NC
IAL
ST
AT
EM
EN
TS
Dire
cto
rs’ re
po
rt
30. Retirement benefi t obligations continued
Key assumptions continuedFund values:
The fair value of assets and present value of liabilities of the plans attributable to defi ned benefi t members were:
At 31 December
2017 2016
Funded plans Unfunded plans Funded plans Unfunded plans
UK Fund
$million
Overseas
plans
$million
Post-
retirement
medical
$million
Other
$million
UK Fund
$million
Overseas
plans
$million
Post-
retirement
medical
$million
Other
$million
Equities 180 354 N/A N/A 191 291 N/A N/A
Government bonds 752 191 N/A N/A 642 153 N/A N/A
Corporate bonds 140 87 N/A N/A 169 81 N/A N/A
Absolute Return Fund 177 – N/A N/A 148 – N/A N/A
Hedge funds1 190 2 N/A N/A 187 – N/A N/A
Insurance linked funds1 38 – N/A N/A 29 – N/A N/A
Opportunistic credit1 60 – N/A N/A 61 – N/A N/A
Property 64 13 N/A N/A 70 4 N/A N/A
Derivatives 5 4 N/A N/A (16) – N/A N/A
Cash and equivalents 91 195 N/A N/A 52 160 N/A N/A
Others1 10 39 N/A N/A 8 30 N/A N/A
Total fair value of assets2 1,707 885 N/A N/A 1,541 719 N/A N/A
Present value of liabilities (1,827) (996) (18) (194) (1,657) (878) (22) (198)
Net pension (liability)/asset (120) (111) (18) (194) (116) (159) (22) (198)
1 Unquoted assets
2 Self investment is monitored closely and is less than $2 million of Standard Chartered equities and bonds for 2017 (2016: $2 million). Self investment is only allowed where it is not
practical to exclude it – for example through investment in index-tracking funds where the Group is a constituent of the relevant index
The pension cost for defi ned benefi t plans was:
2017
Funded plans Unfunded plans
Total
$million
UK Fund
$million
Overseas
plans
$million
Post-
retirement
medical
$million
Other
$million
Current service cost 4 53 – 16 73
Past service cost and curtailments1 (6) 7 (4) – (3)
Settlement cost2 – (1) – 8 7
Interest income on pension plan assets (43) (23) – – (66)
Interest on pension plan liabilities 46 28 1 12 87
Total charge/(credit) to profi t before deduction of tax 1 64 (3) 36 98
Return on plan assets excluding interest income3 (30) (83) – – (113)
Losses/(gains) on liabilities 41 51 – (11) 81
Total losses/(gains) recognised directly in statement of comprehensive income before tax 11 (32) – (11) (32)
Deferred taxation 28 7 – – 35
Total losses/(gains) after tax 39 (25) – (11) 3
1 The gain in the UK Fund is due to the lower 2017 discretionary pension increased awarded. Costs arising in funded overseas schemes arise primarily in India from the expected
statutory increase in the gratuity payment ceiling, an early retirement severance plan and a discretionary increase to minimum pensions. The gain in the post-retirement medical plan
arises due to the reduction in eligibility criteria in the US plan
2 The costs arise primarily from the settlement of benefi ts in Thailand
3 The actual return on the UK fund assets was $73 million and on overseas plan assets was $106 million

Standard Chartered
Annual Report 2017 268
FINANCIAL STATEMENTSNotes to the fi nancial statements
30. Retirement benefi t obligations continued
Key assumptions continuedThe pension cost for defi ned benefi t plans was:
2016
Funded plans Unfunded plans
Total
$million
UK Fund
$million
Overseas
plans
$million
Post-
retirement
medical
$million
Other
$million
Current service cost 5 52 1 17 75
Past service cost and curtailments – (7) – 3 (4)
Gain on settlements1 – (1) – – (1)
Interest income on pension plan assets (56) (22) – – (78)
Interest on pension plan liabilities 57 27 1 8 93
Total charge to profi t before deduction of tax 6 49 2 28 85
Return on plan assets excluding interest income2 (139) (18) – – (157)
Losses/(gains) on liabilities 239 12 (4) 15 262
Total losses/(gains) recognised directly in statement of comprehensive income before tax 100 (6) (4) 15 105
Deferred taxation – (2) – – (2)
Total losses/(gains) after tax 100 (8) (4) 15 103
1 These movements refl ect a reduction in workforce in a number of geographies as result of the restructuring actions of the Group
2 The actual return on the UK Fund assets was $195 million and on overseas plan assets was $40 million
Movement in the defi ned benefi t pension plans and post-retirement medical defi cit during the year comprises:
Funded plans Unfunded plans
Total
$million
UK Fund
$million
Overseas
plans
$million
Post-
retirement
medical
$million
Other
$million
Defi cit at 1 January 2017 (116) (159) (22) (198) (495)
Contributions 19 92 1 31 143
Current service cost (4) (53) – (16) (73)
Past service cost and curtailments 6 (7) 4 – 3
Settlement costs and transfers impact – 1 – (8) (7)
Net interest on the net defi ned benefi t asset/liability (3) (5) (1) (12) (21)
Actuarial (losses)/gains (11) 32 – 11 32
Adjustment for Indonesia scheme1 – (4) – 4 –
Exchange rate adjustment (11) (8) – (6) (25)
Defi cit at 31 December 20172 (120) (111) (18) (194) (443)
1 During 2017 the Indonesian plan (with liabilities of $8 million) was partially funded with a Company contribution of $4 million. The scheme has moved from the unfunded to funded
category in the tables
2 The defi cit total of $443 million is made up of plans in defi cit of $483 million (2016: $513 million) net of plans in surplus with assets totalling $40 million (2016: $18 million)

269
Ris
k re
vie
w a
nd
cap
ital re
vie
wS
trate
gic
rep
ort
Su
pp
lem
en
tary
info
rmatio
nF
INA
NC
IAL
ST
AT
EM
EN
TS
Dire
cto
rs’ re
po
rt
30. Retirement benefi t obligations continued
Key assumptions continuedFunded plans Unfunded plans
Total
$million
UK Fund
$million
Overseas
plans
$million
Post-
retirement
medical
$million
Other
$million
Defi cit at 1 January 2016 (36) (175) (24) (187) (422)
Contributions 20 60 – 18 98
Current service cost (5) (52) (1) (17) (75)
Past service cost and curtailments – 7 – (3) 4
Settlement costs and transfers impact – 1 – – 1
Net interest on the net defi ned benefi t asset/liability (1) (5) (1) (8) (15)
Actuarial (losses)/gains (100) 6 4 (15) (105)
Exchange rate adjustment 6 (1) – 14 19
Defi cit at 31 December 2016 (116) (159) (22) (198) (495)
The Group’s expected contribution to its defi ned benefi t pension plans in 2018 is $91 million.
2017 2016
Assets
$million
Obligations
$million
Total
$million
Assets
$million
Obligations
$million
Total
$million
At 1 January 2,260 (2,755) (495) 2,409 (2,831) (422)
Contributions1 144 (1) 143 99 (1) 98
Current service cost2 – (73) (73) – (75) (75)
Past service cost and curtailments – 3 3 – 4 4
Settlement costs (14) 7 (7) (13) 14 1
Interest cost on pension plan liabilities – (87) (87) – (93) (93)
Interest income on pension plan assets 66 – 66 78 – 78
Benefi ts paid out2 (152) 152 – (175) 175 –
Actuarial (losses)/gains3 113 (81) 32 157 (262) (105)
Exchange rate adjustment 175 (200) (25) (295) 314 19
At 31 December 2,592 (3,035) (443) 2,260 (2,755) (495)
1 Includes employee contributions of $1 million (2016: $1 million)
2 Includes administrative expenses paid out of plan assets of $1 million (2016: $1 million)
3 Actuarial loss on obligation comprises $81 million loss (2016: $284 million loss) from fi nancial assumption changes, $30 million gain (2016: $8 million gain) from demographic
assumption changes and $30 million loss (2016: $14 million gain) from experience

FINANCIAL STATEMENTSNotes to the fi nancial statements
Standard Chartered
Annual Report 2017 270
31. Share-based payments
Accounting policy
The Group operates equity-settled and cash-settled share-based compensation plans. The fair value of the employee services received in exchange for the grant of the options is recognised as an expense. For deferred share awards granted as part of an annual performance award, the expense is recognised over the period from the start of the performance period to the vesting date. For example, the expense for awards granted in 2017 in respect of 2016 performance, which vest in 2018-2020, is recognised as an expense over the period from 1 January 2016 to the vesting dates in 2018-2020. For all other awards, the expense is recognised over the period from the date of grant to the vesting date.
For equity-settled awards, the total amount to be expensed over the vesting period is determined by reference to the fair value of the options at the date of grant, which excludes the impact of any non-market vesting conditions (for example, profi tability and growth targets). The fair value of equity instruments granted is based on market prices, if available, at the date of grant. In the absence of market prices, the fair value of the instruments is estimated using an appropriate valuation technique, such as a binomial option pricing model. Non-market vesting conditions are included in assumptions about the number of options that are expected to vest.
At each balance sheet date, the Group revises its estimates of the number of options that are expected to vest. It recognises the impact of the revision of original estimates, if any, in the income statement, and a corresponding adjustment to equity over the remaining vesting period. Forfeitures prior to vesting attributable to factors other than the failure to satisfy a non-market vesting condition are treated as a cancellation and the remaining unamortised charge is debited to the income statement at the time of cancellation. The proceeds received net of any directly attributable transaction costs are credited to share capital (nominal value) and share premium when the options are exercised.
Cash-settled awards are revalued at each balance sheet date and a liability recognised on the balance sheet for all unpaid amounts, with any changes in fair value charged or credited to staff costs in the income statement until the awards are exercised. Where forfeitures occur prior to vesting that are attributable to factors other than a failure to satisfy market-based performance conditions, the cumulative charge incurred up to the date of forfeiture is credited to the income statement. The Company records the value of the equity-settled awards as a deemed investment in subsidiaries. Any revaluation related to cash-settled awards is recorded as an amount due from subsidiary undertakings.
The Group operates a number of share-based arrangements for its executive directors and employees. Details of the share-based payment charge are set out below.
20171 20161
Cash
$million
Equity
$million
Total
$million
Cash
$million
Equity
$million
Total
$million
Deferred share awards 14 71 85 8 26 34
Other share awards 9 58 67 5 61 66
Total share-based payments 23 129 152 13 87 100
1 No forfeiture assumed
2011 Standard Chartered Share Plan (the ‘2011 Plan’)
The 2011 Plan was approved by shareholders in May 2011 and is the Group’s main share plan. Since approval, it has been used to deliver various types of share awards:
Long Term Incentive Plan (LTIP) awards: granted with vesting subject to performance measures. Performance measures attached to awards granted previously include: total shareholder return (TSR); return on equity (RoE) with a common equity tier 1 (CET1) underpin; strategic measures; earnings per share (EPS) growth; and return on risk-weighted assets (RoRWA). Each measure is assessed independently over a three-year period. Awards granted from 2016 have an individual conduct gateway that results in the award lapsing if not met
Deferred awards are used to deliver the deferred portion of variable remuneration, in line with both market practice and regulatory requirements. These awards vest in instalments on anniversaries of the award date specifi ed at the time of grant. Deferred awards are not subject to any plan limit. This enables the Group to meet regulatory requirements relating to deferral levels, and is in line with market practice
Restricted share awards, made outside of the annual performance process as replacement buy-out awards to new joiners who forfeit awards on leaving their previous employers, vest in instalments on the anniversaries of the award date specifi ed at the time of grant. This enables the Group to meet regulatory requirements relating to buy-outs, and is in line with market practice. In line with similar plans operated by our competitors, restricted share awards are not subject to an annual limit and do not have any performance measures
Underpin shares are subject to a combination of two performance measures: EPS growth and RoRWA. The weighting between the two elements is split equally, one-half of the award depending on each measure, assessed independently. These awards vest after three or fi ve years. Underpin shares formed part of the variable remuneration awarded to executive directors and senior management in respect of 2014 performance
Under the 2011 Plan, no grant price is payable to receive an award. The remaining life of the 2011 Plan during which new awards can be made is four years.

271
Ris
k re
vie
w a
nd
Cap
ital re
vie
wS
trate
gic
rep
ort
Su
pp
lem
en
tary
info
rmatio
nF
INA
NC
IAL
ST
AT
EM
EN
TS
Dire
cto
rs’ re
po
rt
31. Share-based payments continued
Valuation – LTIP awards
The vesting of awards granted in both 2016 and 2017 is subject to the satisfaction of RoE (subject to a capital underpin) and relative TSR performance measures and achievement of a strategic scorecard. The fair value of the TSR component is calculated using the probability of meeting the measures over a three-year performance period, using a Monte Carlo simulation model. The number of shares expected to vest is evaluated at each reporting date, based on the expected performance against the RoE and strategic measures in the scorecard, to determine the accounting charge.
Dividend equivalents accrue on these awards during the vesting period, so no discount is applied.
Grant date
2017 2016
13 March 15 June 4 May 11 March
Share price at grant date (£) 7.43 5.05 5.08 4.68
Vesting period (years) 3-7 3 3, 3-7 3
Expected dividend yield (%) N/A N/A N/A N/A
Fair value (RoE) (£) 2.48, 2.48 1.68 1.69, 1.69 1.56
Fair value (TSR) (£) 1.81, 1.38 1.24 1.25, 1.12 1.15
Fair value (Strategic) (£) 2.48, 2.48 1.68 1.69, 1.69 1.56
Valuation – deferred shares and restricted shares
The fair value for all employees is based on 100 per cent of the face value of the shares at the date of grant as the share price will refl ect expectations of all future dividends.
Deferred shares and underpin shares accrue dividend equivalent payments during the vesting period. The expected dividend yield assumption is based on a historical average over a period commensurate with this ‘average’ period until vesting, or over one year if the average period until vesting is less than one year.
Details of deferred, underpin and LTIP awards for executive directors can be found in the Directors’ remuneration report.
Deferred share awards
Grant date
2017 2016
3 October 15 June 13 March 30 November 4 October 15 June 4 May 11 March
Share price at grant date (£) 7.56 7.69 7.43 6.41 6.50 5.05 5.08 4.68
Vesting period Fair value (£) Fair value (£) Fair value (£) Fair value (£) Fair value (£) Fair value (£) Fair value (£) Fair value (£)
1-3 years 7.56 7.69 7.43 6.41 6.50 5.05 5.08 4.68
1-5 years – – 7.43 – – – – –
3-7 years – – 7.43 – – – – –

FINANCIAL STATEMENTSNotes to the fi nancial statements
Standard Chartered
Annual Report 2017 272
31. Share based payments continued
Other restricted share awards
Grant date
2017
29 November 3 October 15 June 13 March
Share price at grant date (£) 7.43 7.56 7.69 7.43
Vesting Period
Expected
dividend
yield
(%)
Fair value
(£)
Expected
dividend
yield
(%)
Fair value
(£)
Expected
dividend
yield
(%)
Fair value
(£)
Expected
dividend
yield
(%)
Fair value
(£)
6 months – – – – – – – 7.43
1 year – 7.43 – 7.56 – 7.69 – 7.43
2 year – 7.43 – 7.56 0.5 7.61 0.5 7.35
2-3 years – – – – – – 1.9 7.08
3 year 1.6 7.08 1.6 7.21 2.1 7.23 2.1 6.99
4 year 2.2 6.80 2.2 6.92 2.5 6.96 2.5 6.72
5 year 2.4 6.58 2.4 6.70 – – – –
6 year 2.6 6.36 2.6 6.47 – – – –
Grant date
2016
30 November 4 October 15 June 4 May 11 March
Share price at grant date (£) 6.41 6.50 5.05 5.08 4.68
Vesting Period
Expected
dividend
yield
(%)
Fair value
(£)
Expected
dividend
yield
(%)
Fair value
(£)
Expected
dividend
yield
(%)
Fair value
(£)
Expected
dividend
yield
(%)
Fair value
(£)
Expected
dividend
yield
(%)
Fair value
(£)
1 year – 6.41 – 6.50 – – – – – –
2 year 2.4 6.11 2.4 6.20 – – – – – –
2-3 years 2.5 6.03 2.5 6.11 3.6 4.62 3.6 4.65 3.5 4.30
3 year 3.0 5.87 3.0 5.95 – – 3.4 4.60 – –
2-4 years – – – – – – 3.8 4.65 – –
1-4 years – – – – – – – – 3.5 4.30
4 year – – 3.1 5.76 – – 3.4 4.44 – –
2001 Performance Share Plan (2001 PSP) – now closed to new grants: The Group’s previous plan for delivering performance shares was the 2001 PSP and there remain outstanding vested awards. Under the 2001 PSP half the award was dependent upon TSR performance and the balance was subject to a target of defi ned EPS growth. Both measures used the same three-year period and were assessed independently.
2006 Restricted Share Scheme (2006 RSS)/2007 Supplementary Restricted Share Scheme (2007 SRSS):The Group’s previous plans for delivering restricted shares were the 2006 RSS and 2007 SRSS, both now replaced by the 2011 Plan. There remain outstanding vested awards under these plans. Awards were generally in the form of nil cost options and did not have any performance measures. Generally deferred restricted share awards vested equally over three years and for non-deferred awards half-vested two years after the date of grant and the balance after three years. No further awards will be granted under the 2006 RSS and 2007 SRSS.
All Employee Sharesave Plans (comprised of the 2004 International Sharesave Plan, the 2004 UK Sharesave Plan and the 2013 Sharesave Plan): Under the All Employee Sharesave Plans, employees may open a savings contract. Within a period of six months after the third or fi fth anniversary, as appropriate, employees may purchase ordinary shares in the Company at a discount of up to 20 per cent on the share price at the date of invitation (this is known as the ‘option exercise price’). There are no performance measures attached to options granted under the All Employee Sharesave Plans and no grant price is payable to receive an option. In some countries in which the Group operates, it is not possible to operate Sharesave plans, typically due to securities law and regulatory restrictions. In these countries the Group offers an equivalent cash-based plan to its employees. The 2004 International Sharesave and the 2004 UK Sharesave plans are now closed and no further awards will be granted under these plans.
The 2013 Sharesave Plan was approved by Shareholders in May 2013 and all future Sharesave invitations are made under this plan. The remaining life of the 2013 Sharesave Plan is fi ve years.
Valuation – Sharesave: Options under the Sharesave plans are valued using a binomial option-pricing model. The same fair value is applied to all employees including executive directors. The fair value per option granted and the assumptions used in the calculation are as follows:

273
Ris
k re
vie
w a
nd
Cap
ital re
vie
wS
trate
gic
rep
ort
Su
pp
lem
en
tary
info
rmatio
nF
INA
NC
IAL
ST
AT
EM
EN
TS
Dire
cto
rs’ re
po
rt
31. Share-based payments continued
All Employee Sharesave Plan (Sharesave)
Grant date
2017 2016
3 October 4 October
Share price at grant date (£) 7.71 6.50
Exercise price (£) 6.20 5.30
Vesting period (years) 3 3
Expected volatility (%) 34.9 34.2
Expected option life (years) 3.33 3.33
Risk-free rate (%) 0.47 0.13
Expected dividend yield (%) 1.87 3.04
Fair value (£) 2.32 1.71
The expected volatility is based on historical volatility over the last three years, or three years prior to grant. The expected life is the average expected period to exercise. The risk-free rate of return is the yield on zero-coupon UK government bonds of a term consistent with the assumed option life. The expected dividend yield is based on historical dividend for three years prior to grant.
Reconciliation of option movements for the year to 31 December 2017
2011 Plan1
PSP1 RSS1 SRSS1 Sharesave
Weighted
average
exercise price
(£)
Performance
shares
Deferred/
restricted
shares
Outstanding as at 1 January 28,740,614 24,208,988 76,977 701,603 80,299 13,291,261 6.72
Granted2,3 2,347,184 12,066,323 – – – 3,097,250 6.20
Lapsed (5,550,569) (1,233,517) (14,821) (118,531) (18,741) (3,529,783) 8.67
Exercised (59,861) (11,730,573) (44,934) (397,129) (60,309) (40,494) 5.55
Outstanding as at 31 December 25,477,368 23,311,221 17,222 185,943 1,249 12,818,234 6.06
Exercisable as at 31 December 65,429 4,526,848 17,222 185,943 1,249 1,364,426 9.38
Range of exercise prices (£)2 – – – – – 5.30-9.38 –
Intrinsic value of vested but not exercised options ($ million) 0.1 3.6 0.0 0.2 0.0 0.0 –
Weighted average contractual remaining life (years) 8.29 8.09 1.13 0.19 0.19 2.05 –
Weighted average share price for options exercised during the period (£) 7.44 7.43 7.73 7.43 7.35 7.62 –
1 Employees do not contribute towards the cost of these awards
2 For Sharesave granted in 2017 the exercise price is £6.20 per share, which was the average of the closing prices over the fi ve days to the invitation date of 4 September. The closing
share price on 1 September 2017 was £7.7390
3 Performance shares comprise 2,347,184 (LTIP) granted on 13 March 2017. Deferred/restricted shares comprise 10,055,740 (RSA/DRSA) granted on 13 March 2017, 366,830
(RSA/DRSA) granted on 15 June 2017, 871,760 (RSA) granted on 03 October 2017 and 771,993 (RSA) granted on 29 November 2017
Reconciliation of option movements for the year to 31 December 2016
2011 Plan1
PSP1 RSS1 SRSS1 Sharesave
Weighted
average
exercise price
(£)
Performance
shares
Deferred/
restricted
shares
Outstanding as at 1 January 9,658,733 23,108,554 103,768 1,150,866 140,110 15,341,808 7.87
Granted2 25,319,8333 8,457,5594 – – – 3,801,733 5.30
Lapsed (6,074,460) (1,585,856) (14,007) (121,803) (348) (5,851,915) 8.83
Exercised (163,492) (5,771,269) (12,784) (327,460) (59,463) (365) 5.67
Outstanding as at 31 December 28,740,614 24,208,988 76,977 701,603 80,299 13,291,261 6.72
Exercisable as at 31 December 145,928 5,745,431 76,977 701,603 80,299 1,484,146 10.98
Range of exercise prices (£)2 – – – – – 5.30-11.21 –
Intrinsic value of vested but not exercised options ($ million) 0.1 3.6 0.1 0.4 0.1 0.0 –
Weighted average contractual remaining life (years) 8.88 8.15 2.02 0.90 0.45 2.31 –
Weighted average share price for options exercised during the period (£) 4.89 5.21 6.23 5.49 6.02 5.85 –
1 Employees do not contribute towards the cost of these awards
2 For Sharesave granted in 2016 the exercise price is £5.30 per share, which was the average of the closing prices over the fi ve days to the invitation date of 5 September. The closing
share price on 2 September 2016 was £6.614
3 23,437,968 granted on 11 March 2016, 922 (notional dividend) granted on 19 March 2016, 1,810,435 granted on 4 May 2016, 70,508 granted on 15 June 2016
4 7,134,374 granted on 11 March 2016, 34,643 (notional dividend) granted on 11 March 2016, 52,514 (notional dividend) granted on 13 March 2016, 94,242 (notional dividend) granted on
19 March 2016, 600,413 granted on 4 May 2016, 21,991 granted on 15 June 2016, 187 (notional dividend) granted on 17 June 2016, 35 (notional dividend) granted on 18 June 2016,
14 (notional dividend) granted on 19 June 2016, 434,555 granted on 4 October 2016, and 84,591 granted on 30 November 2016

FINANCIAL STATEMENTSNotes to the fi nancial statements
Standard Chartered
Annual Report 2017 274
32. Investments in subsidiary undertakings, joint ventures and associates
Accounting policy
SubsidiariesSubsidiaries are all entities, including structured entities, which the Group controls. The Group controls an entity when it is exposed to, or has rights to, variable returns from its involvement with the entity and has the ability to affect those returns through its power over the investee. The assessment of power is based on the Group’s practical ability to direct the relevant activities of the entity unilaterally for the Group’s own benefi t and is subject to reassessment if and when one or more of the elements of control change. Subsidiaries are fully consolidated from the date on which the Group effectively obtains control. They are deconsolidated from the date that control ceases, and where any interest in the subsidiary remains, this is remeasured to its fair value and the change in carrying amount is recognised in the income statement.
Associates and joint arrangementsJoint arrangements are where two or more parties either have rights to the assets, and obligations of the joint arrangement (joint operations), or have rights to the net assets of the joint arrangement (joint venture). The Group evaluates the contractual terms of joint arrangements to determine whether a joint arrangement is a joint operation or a joint venture. As at 31 December 2017, the Group did not have any contractual interest in joint operations.
An associate is an entity over which the Group has signifi cant infl uence.
Investments in associates and joint ventures are accounted for by the equity method of accounting and are initially recognised at cost. The Group’s investment in associates and joint ventures includes goodwill identifi ed on acquisition (net of any accumulated impairment loss).
The Group’s share of its associates’ and joint ventures’ post-acquisition profi ts or losses is recognised in the income statement, and its share of post-acquisition movements in other comprehensive income is recognised in reserves. The cumulative post-acquisition movements are adjusted against the carrying amount of the investment. When the Group’s share of losses in an associate or a joint venture equals or exceeds its interest in the associate, including any other unsecured receivables, the Group does not recognise further losses, unless it has incurred obligations or made payments on behalf of the associate or joint venture.
Unrealised gains and losses on transactions between the Group and its associates and joint ventures are eliminated to the extent of the Group’s interest in the associates and joint ventures. At each balance sheet date the Group assesses whether there is any objective evidence of impairment in the investment in associates and joint ventures. Such evidence includes a signifi cant or prolonged decline in the fair value of the Group’s investment in an associate or joint venture below its cost, among other factors.
Signifi cant accounting estimates and judgementsThe Group applies judgement in determining if it has control, joint control or signifi cant infl uence over subsidiaries, joint ventures and associates respectively. These judgements are based upon identifying the relevant activities of counterparties, being those activities that signifi cantly affect the entities’ returns, and further making a decision on whether the Group has control over those entities, joint control, or has signifi cant infl uence (being the power to participate in the fi nancial and operating policy decisions but not control them.).
These judgements are at times determined by equity holdings, and the voting rights associated with those holdings. However, further considerations, including but not limited to board seats, advisory committee members and specialist knowledge of some decision-makers are also taken into account.
Impairment testing of investments in associates and joint arrangements is based on judgements, including the basis of assumptions and forecasts used for estimating the expected cash fl ows from the investments and in the calculations of the present values of those cash fl ows. The estimation of future cash fl ows and the level to which they are discounted is inherently uncertain and requires signifi cant judgement.
Business combinationsThe acquisition method of accounting is used to account for the acquisition of subsidiaries by the Group. The cost of an acquisition is measured as the fair value of the assets given, equity instruments issued and liabilities incurred or assumed at the date of exchange, together with the fair value of any contingent consideration payable. The excess of the cost of acquisition over the fair value of the Group’s share of the identifi able net assets and contingent liabilities acquired is recorded as goodwill (see note 18 for details on goodwill recognised by the Group). If the cost of acquisition is less than the fair value of the net assets and contingent liabilities of the subsidiary acquired, the difference is recognised directly in the income statement.
Where the fair values of the identifi able net assets and contingent liabilities acquired have been determined provisionally, or where contingent or deferred consideration is payable, adjustments arising from their subsequent fi nalisation are not refl ected in the income statement if; (i) they arise within 12 months of the acquisition date (or relate to acquisitions completed before 1 January 2014); and (ii) the adjustments arise from better information about conditions existing at the acquisition date (measurement period adjustments). Such adjustments are applied as at the date of acquisition and, if applicable, prior year amounts are restated. All changes that are not measurement period adjustments are reported in income other than changes in contingent consideration not classifi ed as fi nancial instruments, which are accounted for in accordance with the appropriate accounting policy, and changes in contingent consideration classifi ed as equity, which is not remeasured.
Changes in ownership interest in a subsidiary, which do not result in a loss of control, are treated as transactions between equity holders and are reported in equity. Where a business combination is achieved in stages, the previously held equity interest is remeasured at the acquisition date fair value with the resulting gain or loss recognised in the income statement.
In the Company’s fi nancial statements, investment in subsidiaries, associates and joint ventures are held at cost less impairment and dividends from pre-acquisition profi ts received prior to 1 January 2009, if any. Inter-company transactions, balances and unrealised gains and losses on transactions between Group companies are eliminated in the Group accounts.
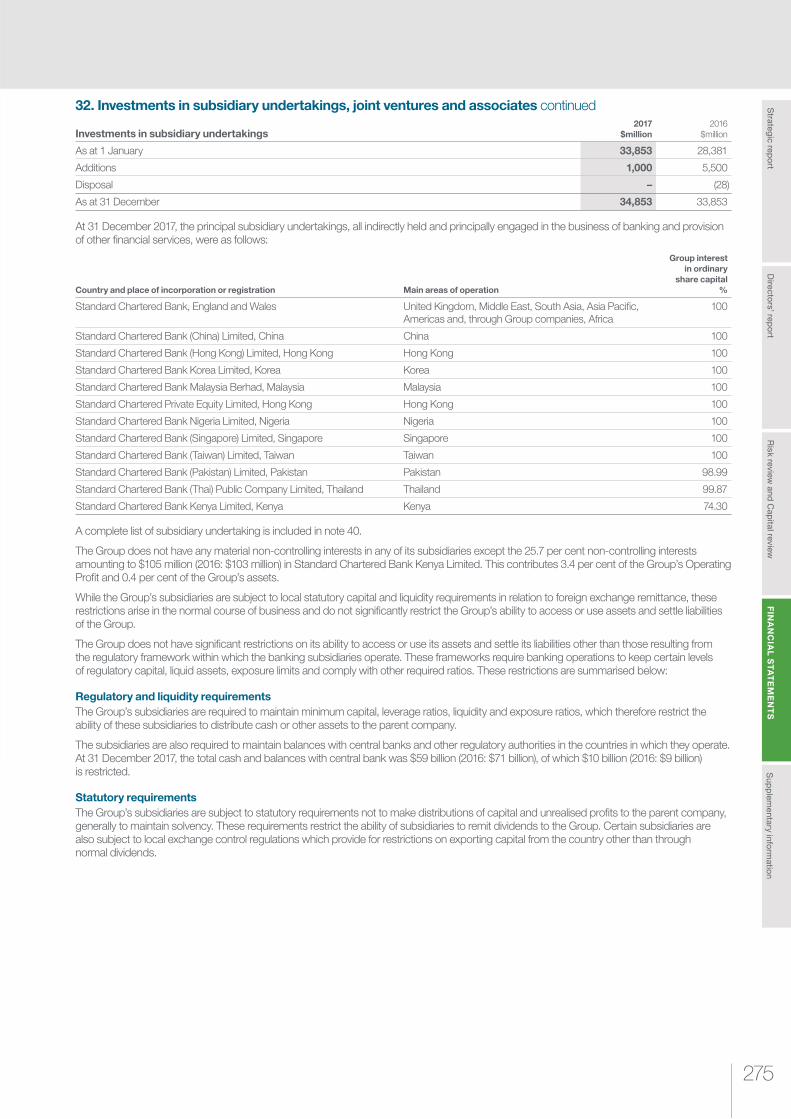
275
Ris
k re
vie
w a
nd
Cap
ital re
vie
wS
trate
gic
rep
ort
Su
pp
lem
en
tary
info
rmatio
nF
INA
NC
IAL
ST
AT
EM
EN
TS
Dire
cto
rs’ re
po
rt
32. Investments in subsidiary undertakings, joint ventures and associates continued
Investments in subsidiary undertakings2017
$million
2016
$million
As at 1 January 33,853 28,381
Additions 1,000 5,500
Disposal – (28)
As at 31 December 34,853 33,853
At 31 December 2017, the principal subsidiary undertakings, all indirectly held and principally engaged in the business of banking and provision of other fi nancial services, were as follows:
Country and place of incorporation or registration Main areas of operation
Group interest
in ordinary
share capital
%
Standard Chartered Bank, England and Wales United Kingdom, Middle East, South Asia, Asia Pacifi c, Americas and, through Group companies, Africa
100
Standard Chartered Bank (China) Limited, China China 100
Standard Chartered Bank (Hong Kong) Limited, Hong Kong Hong Kong 100
Standard Chartered Bank Korea Limited, Korea Korea 100
Standard Chartered Bank Malaysia Berhad, Malaysia Malaysia 100
Standard Chartered Private Equity Limited, Hong Kong Hong Kong 100
Standard Chartered Bank Nigeria Limited, Nigeria Nigeria 100
Standard Chartered Bank (Singapore) Limited, Singapore Singapore 100
Standard Chartered Bank (Taiwan) Limited, Taiwan Taiwan 100
Standard Chartered Bank (Pakistan) Limited, Pakistan Pakistan 98.99
Standard Chartered Bank (Thai) Public Company Limited, Thailand Thailand 99.87
Standard Chartered Bank Kenya Limited, Kenya Kenya 74.30
A complete list of subsidiary undertaking is included in note 40.
The Group does not have any material non-controlling interests in any of its subsidiaries except the 25.7 per cent non-controlling interests amounting to $105 million (2016: $103 million) in Standard Chartered Bank Kenya Limited. This contributes 3.4 per cent of the Group’s Operating Profi t and 0.4 per cent of the Group’s assets.
While the Group’s subsidiaries are subject to local statutory capital and liquidity requirements in relation to foreign exchange remittance, these restrictions arise in the normal course of business and do not signifi cantly restrict the Group’s ability to access or use assets and settle liabilities of the Group.
The Group does not have signifi cant restrictions on its ability to access or use its assets and settle its liabilities other than those resulting from the regulatory framework within which the banking subsidiaries operate. These frameworks require banking operations to keep certain levels of regulatory capital, liquid assets, exposure limits and comply with other required ratios. These restrictions are summarised below:
Regulatory and liquidity requirements
The Group’s subsidiaries are required to maintain minimum capital, leverage ratios, liquidity and exposure ratios, which therefore restrict the ability of these subsidiaries to distribute cash or other assets to the parent company.
The subsidiaries are also required to maintain balances with central banks and other regulatory authorities in the countries in which they operate. At 31 December 2017, the total cash and balances with central bank was $59 billion (2016: $71 billion), of which $10 billion (2016: $9 billion) is restricted.
Statutory requirements
The Group’s subsidiaries are subject to statutory requirements not to make distributions of capital and unrealised profi ts to the parent company, generally to maintain solvency. These requirements restrict the ability of subsidiaries to remit dividends to the Group. Certain subsidiaries are also subject to local exchange control regulations which provide for restrictions on exporting capital from the country other than through normal dividends.

FINANCIAL STATEMENTSNotes to the fi nancial statements
Standard Chartered
Annual Report 2017 276
32. Investments in subsidiary undertakings, joint ventures and associates continued
Contractual requirements
The encumbered assets in the balance sheet of the Group’s subsidiaries are not available for transfer around the Group. Encumbered assets are disclosed in Risk review and Capital review (page 153 to 154).
Share of profi t/(loss) from investment in associates and joint ventures comprises:
2017
$million
2016
$million
Profi t/(loss) from investment in joint ventures 29 (215)
Profi t from investment in associates 239 178
Total 268 (37)
Interests in joint venturesPT Bank Permata Tbk & others
2017
$million
2016
$million
As at 1 January 713 679
Exchange translation difference (1) 13
Additions 44 238
Share of profi t/(loss) 29 (215)
Share of available-for-sale and other reserves (2) (2)
As at 31 December 783 713
The Group’s principal joint venture is PT Bank Permata Tbk (Permata). The Group has a 44.56 per cent (2016: 44.56 per cent) equity investment in Permata. The Group has determined that it has joint control of Permata through its shareholding, which is held alongside a third party that holds the same percentage. The Group has made the judgement that through these equity holdings, and in making decisions pertaining to Permata that both parties require each other’s unanimous consent when making decisions over the relevant activities of Permata. Permata is based in Indonesia and provides fi nancial services to the consumer and commercial banking clients. The Group’s share of profi t/(loss) of Permata amounts to $29 million (2016: $(215) million) and the Group’s share of net assets was $775 million (2016: $705 million). On 16 February 2017, Permata announced plans for an IDR3 trillion (approximately $225 million) rights issue to drive growth. The Group invested an additional $44 million during 2017 as part of the rights issue. Permata is listed on the Indonesia Stock Exchange with a share price of IDR 625 as at 31 December 2017 resulting in a share capitalisation value of the Group’s investment of $576 million.
The following table sets out the summarised fi nancial statements of PT Bank Permata Tbk prior to the Group’s share of joint ventures being applied:
2017
$million
2016
$million
Current assets 5,626 6,484
Non-current assets 5,193 5,697
Current liabilities (8,415) (9,896)
Non-current liabilities (924) (963)
Net assets 1,480 1,322
Operating income 641 608
Of which:
Interest income 837 1,083
Interest expense (447) (641)
Expenses (334) (329)
Impairment (224) (923)
Operating profi t/(loss) 83 (644)
Taxation (18) 161
Profi t/(loss) after tax 65 (483)
The above amounts of assets and liabilities include the following:
Cash and cash equivalents 1,207 1,964
Other comprehensive loss for the year (5) (4)
Total comprehensive income/(loss) for the year 60 (487)

277
Ris
k re
vie
w a
nd
Cap
ital re
vie
wS
trate
gic
rep
ort
Su
pp
lem
en
tary
info
rmatio
nF
INA
NC
IAL
ST
AT
EM
EN
TS
Dire
cto
rs’ re
po
rt
32. Investments in subsidiary undertakings, joint ventures and associates continued
Interests in joint ventures continued
In December 2016, Permata established a portfolio of non-performing loans that were beyond its risk appetite which were to be liquidated. This resulted in an incremental impairment of $140 million, representing the difference between the carrying amount of the liquidation portfolio on a ‘hold to collect’ basis and the amount expected to be realised upon liquidation. This is consistent with the Group’s restructuring actions. Accordingly, in 2016 the Group has recorded its $62 million share of this incremental impairment as restructuring and this was normalised from the underlying results of the Group. In 2017, a gain of $59 million has been recognised in restructuring as a result of recoveries on these non-performing loans.
Current assets primarily represent cash and short-term receivable balances. Non-current assets are primarily loans to customers. Current liabilities are primarily customer deposits based on contractual maturities, while non-current liabilities are longer-term payables such as subordinated debt.
Reconciliation of the net assets above to the carrying amount of the investments in PT Bank Permata Tbk recognised in the consolidated fi nancial statements:
2017
$million
2016
$million
Net assets of PT Bank Permata Tbk 1,480 1,322
Proportion of the Group’s ownership interest in joint ventures 659 589
Notional goodwill 116 116
Carrying amount of the Group’s interest in PT Bank Permata Tbk 775 705
The Group’s interest in Permata was tested for impairment. The recoverable amount of the interest is measured based on its ViU, which is calculated using fi ve-year cash fl ow projections and an estimated terminal value based on a perpetuity value after year fi ve. The cash fl ow projections are based on forecasts approved by Permata’s management up to 2020. The perpetuity terminal value amount is calculated using year fi ve cash fl ows using long-term GDP growth rates. All cash fl ows are discounted using pre-tax discount rates which refl ect market rates appropriate to the interest. At 31 December 2017, the recoverable amount of the interest in Permata exceeded its carrying amount, and no impairment provision was required.
Interests in associates China Bohai Bank Other Total
2017
$million
2016
$million
2017
$million
2016
$million
2017
$million
2016
$million
As at 1 January 1,182 1,099 34 159 1,216 1,258
Exchange translation differences 96 (75) – (1) 96 (76)
Share of profi ts 229 167 10 11 239 178
Disposals – – 37 – 37 –
Dividends received – – (2) (3) (2) (3)
Share of AFS and Other reserves (18) (9) (39) – (57) (9)
Others – – (5) (132) (5) (132)
As at 31 December 1,489 1,182 35 34 1,524 1,216
A complete list of the Group’s interest in associates is included in note 40. The Group’s principal associate is:
Associate Nature of activities
Main areas of
operation
Group interest
in ordinary
share capital
%
China Bohai Bank Banking operations China 19.99
The Group’s investment in China Bohai Bank is less than 20 per cent but it is considered to be an associate because of the signifi cant infl uence the Group is able to exercise over the management and fi nancial and operating policies. The Group applies the equity method of accounting for investments in associates. The reported fi nancials up to November 2017 of this associate are within three months of the Group’s reporting date.

FINANCIAL STATEMENTSNotes to the fi nancial statements
Standard Chartered
Annual Report 2017 278
32. Investments in subsidiary undertakings, joint ventures and associates continued
Interests in associates continued
The following table sets out the summarised fi nancial statements of China Bohai Bank prior to the Group’s share of the associates being applied:
China Bohai Bank
30 Nov 2017
$million
30 Nov 2016
$million
Current assets 52,056 39,799
Non-current assets 104,479 86,568
Current liabilities (82,293) (71,453)
Non-current liabilities (66,794) (49,001)
Net assets 7,448 5,913
Operating income 3,854 3,221
Of which:
Interest income 6,014 5,763
Interest expense (3,452) (3,432)
Expenses (1,388) (1,208)
Impairment (1,056) (994)
Operating profi t 1,410 1,019
Taxation (263) (182)
Profi t after tax 1,147 837
The above amounts of assets and liabilities include the following:
Other comprehensive loss for the year (91) (43)
Total comprehensive income for the year 1,056 794
Non-current assets are primarily loans to customers and current liabilities are primarily customer deposits based on contractual maturities.
During the year, there were no indicators of impairment for the Group’s investment in China Bohai Bank.
33. Structured entities
Accounting policy
A structured entity is an entity that has been designed so that voting or similar rights are not the dominant factor in deciding who controls the entity. Contractual arrangements determine the rights and therefore relevant activities of the structured entity. Structured entities are generally created to achieve a narrow and well-defi ned objective with restrictions around their activities. Structured entities are consolidated when the substance of the relationship between the Group and the structured entity indicates the Group has power over the contractual relevant activities of the structured entity, is exposed to variable returns, and can use that power to affect the variable return exposure.
In determining whether to consolidate a structured entity to which assets have been transferred, the Group takes into account its ability to direct the relevant activities of the structured entity. These relevant activities are generally evidenced through a unilateral right to liquidate the structured entity, investment in a substantial proportion of the securities issued by the structured entity or where the Group holds specifi c subordinate securities that embody certain controlling rights. The Group may further consider relevant activities embedded within contractual arrangements such as call options which give the practical ability to direct entity, special relationships between the structured entity and investors, and if a single investor has a large exposure to variable returns of the structured entity.
Signifi cant accounting judgementSignifi cant judgement is required in determining control over structured entities. The purpose and design of the entity is considered, along with a determination of what the relevant activities are of the entity and who directs these. Further judgements are made around which investor is exposed to, and absorbs the variable returns of the structured entity. The Group will have to weigh up all of these facts to consider whether the Group, or another involved party, is acting as a principal in its own right or as an agent on behalf of others. Judgement is further required in the ongoing assessment of control over structured entities, specifi cally if market conditions have an effect on the variable return exposure of different investors.
The Group has involvement with both consolidated and unconsolidated structured entities, which may be established by the Group as a sponsor or by a third party.
Interests in consolidated structured entities: A structured entity is consolidated into the Group’s fi nancial statements where the Group controls the structured entity, as per the determination in the accounting policy above.

279
Ris
k re
vie
w a
nd
Cap
ital re
vie
wS
trate
gic
rep
ort
Su
pp
lem
en
tary
info
rmatio
nF
INA
NC
IAL
ST
AT
EM
EN
TS
Dire
cto
rs’ re
po
rt
33. Structured entities continued
The following table presents the Group’s interests in consolidated structured entities:
2017
$million
2016
$million
Aircraft and ship leasing 5,494 5,623
Structured and Principal fi nance 2,534 2,809
Total 8,028 8,4321
1 The Group’s disclosure of its interests in consolidated structured entities as at 31 December 2016 has increased by $1.3 billion (previously disclosed as $7.2 billion) following a review of
the population. These interests have historically been included within the Group’s results but not separately disclosed as relating to structured entities
Interests in unconsolidated structured entities: Unconsolidated structured entities are all structured entities that are not controlled by the Group. The Group enters into transactions with unconsolidated structured entities in the normal course of business to facilitate customer transactions and for specifi c investment opportunities. An interest in a structured entity is contractual or non-contractual involvement which creates variability of the returns of the Group arising from the performance of the structured entity.
The table below presents the carrying amount of the assets and liabilities recognised in the fi nancial statements relating to variable interests held in unconsolidated structured entities, the maximum exposure to loss relating to those interests and the total assets of the structured entities. Maximum exposure to loss is primarily limited to the carrying amount of the Group’s on-balance sheet exposure to the structured entity. For derivatives, the maximum exposure to loss represents the on-balance sheet valuation and not the notional amount. For commitments and guarantees, the maximum exposure to loss is the notional amount of potential future losses.
2017 2016
Principal
fi nance
funds
$million
Structured
fi nance
$million
Asset-
backed
securities
$million
Total
$million
Principal
fi nance
funds
$million
Structured
fi nance
$million
Asset-
backed
securities
$million
Total
$million
Group’s interest – assets
Financial assets held at fair value through profi t or loss 389 – 983 1,372 515 – 526 1,041
Loans and advances to customers – 1,527 – 1,527 – 1,202 – 1,202
Investment securities (available-for-sale) 56 – 4,105 4,161 54 – 4,906 4,960
Investment securities (loans and receivables) 439 – 1,437 1,876 624 – 1,489 2,113
Other assets 19 – – 19 12 – – 12
Total assets 903 1,527 6,525 8,955 1,205 1,202 6,921 9,328
Off balance sheet 262 501 86 849 422 327 107 856
Group’s maximum exposure to loss 1,165 2,028 6,611 9,804 1,627 1,529 7,028 10,1841
Total assets of structured entities 5,052 3,747 295,574 304,373 4,967 5,185 316,177 326,329
1 The Group’s disclosed interests in unconsolidated structured entities as at 31 December 2016 has increased by $2.1 billion (previously disclosed as $8.1 billion). These interests have
historically been included within the Group’s results, but not separately disclosed as relating to structured entities
The main types of activities for which the Group utilises unconsolidated structured entities cover synthetic credit default swaps for managed investment funds (including specialised Principal fi nance funds), portfolio management purposes, structured fi nance and asset backed securities. These are detailed as follows:
Principal fi nance fund: The Group’s exposure to Principal fi nance funds represents committed or invested capital in unleveraged investment funds, primarily investing in pan-Asian infrastructure, real estate and private equity
Structured fi nance: Structured fi nance comprises interests in transactions that the Group or, more usually, a customer has structured, using one or more structured entities, which provide benefi cial arrangements for customers. The Group’s exposure primarily represents the provision of funding to these structures as a fi nancial intermediary, for which it receives a lender’s return. The transactions largely relate to the provision of aircraft leasing and ship fi nance

FINANCIAL STATEMENTSNotes to the fi nancial statements
Standard Chartered
Annual Report 2017 280
33. Structured entities continued
Asset backed securities (ABS): The Group also has investments in asset backed securities issued by third-party structured entities as set out in Risk Review and Capital review (page 145). For the purpose of market marking and at the discretion of ABS trading desk, the Group may hold an immaterial amount of debt securities ($1 million at year end) from structured entities originated by credit portfolio management. This is disclosed in the ABS column above
– Portfolio management (Group-sponsored entities): For the purposes of portfolio management, the Group purchased credit protection via synthetic credit default swaps from note-issuing structured entities. The referenced assets remain on the Group’s balance sheet as they are not assigned to these structured entities. The Group continues to own or hold all of the risks and returns relating to these assets. The credit protection obtained from the regulatory-compliant securitisation only serves to protect the Group against losses upon the occurrence of eligible credit events and the underlying assets are not de-recognised from the Group balance sheet. The Group does not hold any equity interests in the structured entities, but may hold an insignifi cant amount of the issued notes for market marking purposes. This is disclosed in the ABS section above. The proceeds of the notes’ issuance are typically held as cash collateral in issuer’s account operated by a trustee or invested in AAA-rated government-backed securities to collateralise the structured entities swap obligations to the Group, and to repay the principal to investors at maturity. The structured entities reimburse the Group on actual losses incurred, through the use of the cash collateral or realisation of the collateral security. Correspondingly, the structured entities write down the notes issued by an equal amount of the losses incurred, in reverse order of seniority. All funding is committed for the life of these vehicles and the Group has no indirect exposure in respect of the vehicles’ liquidity position. The Group has reputational risk in respect of certain portfolio management vehicles and investment funds either because the Group is the arranger and lead manager or because the structured entities have Standard Chartered branding
During the year, the Group transferred assets of $24 million to a Group-sponsored structured entity.
34. Cash fl ow statement
Adjustment for non-cash items and other adjustments included within income statementGroup Company
2017
$million
2016
$million
2017
$million
2016
$million
Amortisation of discounts and premiums of investment securities (292) (265) – –
Interest expense on subordinated liabilities 748 835 563 604
Interest expense on senior debt securities in issue 465 367 381 238
Other non-cash items 541 9 63 65
Pension costs for defi ned benefi t schemes 98 85 – –
Share-based payment costs 152 100 – –
Impairment losses on loans and advances and other credit risk provisions 1,362 2,791 – –
Dividend income from subsidiaries – – (392) (204)
Other impairment 499 612 – –
Loss on business classifi ed as held for sale – 44 – –
Net gain on derecognition of investment in associate (64) – – –
(Profi t)/loss from associates and joint ventures (268) 37 – –
Total 3,241 4,615 615 703
Change in operating assetsGroup Company
2017
$million
2016
$million
2017
$million
2016
$million
Decrease/(increase) in derivative fi nancial instruments 19,246 (2,692) 459 110
(Increase)/decrease in debt securities, treasury bills and equity shares held at fair value through profi t or loss (5,373) 718 – –
Increase in loans and advances to banks and customers (26,085) (3,626) – –
Net increase in pre-payments and accrued income (19) (98) – –
Net increase in other assets (1,394) (2,588) – –
Total (13,625) (8,286) 459 110

281
Ris
k re
vie
w a
nd
Cap
ital re
vie
wS
trate
gic
rep
ort
Su
pp
lem
en
tary
info
rmatio
nF
INA
NC
IAL
ST
AT
EM
EN
TS
Dire
cto
rs’ re
po
rt
34. Cash fl ow statement continued
Change in operating liabilitiesGroup Company
2017
$million
2016
$million
2017
$million
2016
$million
(Decrease)/increase in derivative fi nancial instruments (18,405) 4,110 (1,049) 103
Net increase/(decrease) in deposits from banks, customer accounts, debt securities in issue, Hong Kong notes in circulation and short positions 23,877 9,219 1,599 (240)
Increase/(decrease) in accruals and deferred income 68 (139) (7) 18
Net increase/(decrease) in other liabilities 279 (110) 32 (500)
Total 5,819 13,080 575 (619)
DisclosuresGroup Company
2017
$million
2016
$million
2017
$million
2016
$million
Subordinated debt (including accrued interest):
Opening balance 19,913 22,295 14,821 13,951
Proceeds from the issue – 1,250 – 1,250
Interest paid (743) (920) (353) (604)
Repayment (2,984) (2,666) (1,249) (105)
Foreign exchange movements 701 (861) 536 (350)
Fair value changes 11 (42) 93 56
Other 652 857 261 623
Closing balance 17,550 19,913 14,109 14,821
Senior debt (including accrued interest):
Opening balance 19,800 21,445 17,265 17,432
Proceeds from the issue 2,292 5,453 1,501 4,385
Interest paid (896) (454) (825) (365)
Repayment (4,162) (6,470) (3,237) (3,941)
Foreign exchange movements 882 (614) 659 (543)
Fair value changes 26 (14) 21 (61)
Other 1,796 454 923 358
Closing balance 19,738 19,800 16,307 17,265
35. Cash and cash equivalents
Accounting policy
For the purposes of the cash fl ow statement, cash and cash equivalents comprise cash, on demand and overnight balances with central banks (unless restricted) and balances with less than three months’ maturity from the date of acquisition, including treasury bills and other eligible bills, loans and advances to banks, and short-term government securities.
The following balances with less than three months’ maturity from the date of acquisition have been identifi ed by the Group as being cash and cash equivalents.
Group Company
2017
$million
2016
$million
2017
$million
2016
$million
Cash and balances at central banks 58,864 70,706 – –
Less: restricted balances (9,761) (8,648) – –
Treasury bills and other eligible bills 9,384 9,163 – –
Loans and advances to banks 25,729 23,109 – –
Trading securities 3,015 2,647 – –
Amounts owed by and due to subsidiary undertakings – – 15,714 15,230
Total 87,231 96,977 15,714 15,230
Restricted balances comprise minimum balances required to be held at central banks.

FINANCIAL STATEMENTSNotes to the fi nancial statements
Standard Chartered
Annual Report 2017 282
36. Related party transactions
Directors and offi cers
Details of directors’ remuneration and interests in shares are disclosed in the Directors’ remuneration report.
IAS 24 Related party disclosures requires the following additional information for key management compensation. Key management comprises non-executive directors, executive directors of Standard Chartered PLC, the court directors of Standard Chartered Bank and the persons discharging managerial responsibilities (PDMR) of Standard Chartered PLC.
2017
$million
2016
$million
Salaries, allowances and benefi ts in kind 35 37
Share-based payments 29 34
Bonuses paid or receivable 11 5
75 76
Transactions with directors and others
At 31 December 2017, the total amounts to be disclosed under the Companies Act 2006 (the Act) and the Listing Rules of the Hong Kong Stock Exchange Limited (HK Listing Rules) about loans to directors were as follows:
2017 2016
Number $million Number $million
Directors 1 – 2 –
The loan transaction provided to the directors of Standard Chartered PLC was a connected transaction under Chapter 14A of the HK Listing Rules. It was fully exempt as fi nancial assistance under Rule 14A.87(1), as it was provided in our ordinary and usual course of business and on normal commercial terms.
As at 31 December 2017, Standard Chartered Bank had created a charge over $75 million (2016: $68 million) of cash assets in favour of the independent trustee of its employer-fi nanced retirement benefi t scheme.
Other than as disclosed in the Annual Report and Accounts, there were no other transactions, arrangements or agreements outstanding for any director, connected person or offi cer of the Company which have to be disclosed under the Act, the rules of the UK Listing Authority or the HK Listing Rules.
Company
The Company has received $848 million (2016: $751 million) of interest income from Standard Chartered Bank. The Company issues debt externally and lends proceeds to Group companies. At 31 December 2017, it had amounts due from Standard Chartered Bank of $12,580 million (2016: $11,625 million), derivative fi nancial assets of $70 million (2016: $529 million) and of $492 million derivative fi nancial liabilities (2016: $1,541 million) with Standard Chartered Bank, amounts due from Standard Chartered Holdings Limited of $80 million (2016: $80 million). At 31 December 2017, it had amounts due from Standard Chartered I H Limited of $298 million (2016: $1,054 million).
The Company has an agreement with Standard Chartered Bank that, in the event of Standard Chartered Bank defaulting on its debt coupon interest payments, where the terms of such debt requires it, the Company shall issue shares as settlement for non-payment of the coupon interest.
Associate and joint ventures2017 2016
China Bohai Bank
$million
Clifford Capital
$million
PT Bank Permata
$million
China Bohai Bank
$million
Clifford Capital
$million
PT Bank Permata
$million
Assets
Loans and advances – 50 95 – 40 90
Debt securities – 27 – – 27 –
Derivative assets 1 – – – – –
Total assets 1 77 95 – 67 90
Liabilities
Deposits 219 – 29 7 – 29
Debt securities issued 15 – – 14 – –
Total liabilities 234 – 29 21 – 29
Loan commitments and other guarantees – – – – 10 –
Total net income 5 – 6 2 – –

283
Ris
k re
vie
w a
nd
Cap
ital re
vie
wS
trate
gic
rep
ort
Su
pp
lem
en
tary
info
rmatio
nF
INA
NC
IAL
ST
AT
EM
EN
TS
Dire
cto
rs’ re
po
rt
37. Post balance sheet events
A fi nal dividend for 2017 of 11 cents per ordinary share was declared by the directors after 31 December 2017.
38. Auditor’s remuneration
Auditor’s remuneration is included within other general administration expenses. The amounts paid by the Group to their principal auditor, KPMG LLP and its associates (together KPMG), are set out below. All services are approved by the Group Audit Committee and are subject to controls to ensure the external auditor’s independence is unaffected by the provision of other services.
2017
$million
2016
$million
Audit fees for the Group statutory audit:
Fees relating to the current year 9.4 5.6
Fees payable to KPMG for other services provided to the Group:
Audit of Standard Chartered PLC subsidiaries, pursuant to legislation
Fees relating to the current year 7.7 8.5
Total audit and audit-related fees 17.1 14.1
Audit-related 5.4 5.4
Other services pursuant to legislation 0.2 0.2
Tax services 0.4 0.4
Services relating to corporate fi nance transactions 0.4 0.7
All other services 0.4 0.6
Total fees payable 23.9 21.4
The following is a description of the type of services included within the categories listed above:
Audit fees are in respect of fees payable to KPMG LLP for the statutory audit of the consolidated fi nancial statements of the Group and the separate fi nancial statements of Standard Chartered PLC. They exclude amounts payable for the audit of Standard Chartered PLC’s subsidiaries and amounts payable to KPMG LLP’s associates. These amounts have been included in fees payable to KPMG for other services provided to the Group
Audit-related fees consist of fees such as those for services required by law or regulation to be provided by the auditor, reviews of interim fi nancial information, reporting on regulatory returns, reporting to a regulator on client assets and extended work performed over fi nancial information and controls
Other services pursuant to legislation include services for assurance and other services that are in relation to statutory and regulatory fi lings
Tax services include services which are not prohibited by the European Directive on Statutory Audits of Annual and Consolidated Accounts and the Regulation on Statutory Audits of Public Interest Entities
Services related to corporate fi nance transactions include fees payable to KPMG for issuing comfort letters
All other services include other assurance and advisory services such as ad hoc accounting advice and extended work over controls
Expenses incurred during the provision of services and which have been reimbursed by the Group are included within auditor’s remuneration.

FINANCIAL STATEMENTSNotes to the fi nancial statements
Standard Chartered
Annual Report 2017 284
39. Standard Chartered PLC (Company)
Classifi cation and measurement of fi nancial instruments
Financial assets
2017 2016
Derivatives held
for hedging
$million
Amortised cost
$million
Total
$million
Derivatives held
for hedging
$million
Amortised cost
$million
Total
$million
Derivatives 70 – 70 529 – 529
Debt securities – 12,159 12,159 – 15,009 15,009
Amounts owed by subsidiary undertakings – 15,714 15,714 – 15,230 15,230
Total 70 27,873 27,943 529 30,239 30,768
Derivatives held for hedging are held at fair value and are classifi ed as Level 2 while the counterparty is Standard Chartered Bank.
Debt securities comprise corporate securities issued by Standard Chartered Bank and have a fair value equal to carrying value of $12,159 million (2016: $15,009 million).
In 2017 and 2016, amounts owed by subsidiary undertakings have a fair value equal to carrying value.
Financial liabilities
2017 2016
Derivatives held
for hedging
$million
Amortised cost
$million
Total
$million
Derivatives held
for hedging
$million
Amortised cost
$million
Total
$million
Derivatives 492 – 492 1,541 – 1,541
Debt securities in issue – 16,169 16,169 – 17,132 17,132
Subordinated liabilities and other borrowed funds – 13,882 13,882 – 14,582 14,582
Total 492 30,051 30,543 1,541 31,714 33,255
Derivatives held for hedging are held at fair value and are classifi ed as Level 2 while the counterparty is Standard Chartered Bank.
The fair value of debt securities in issue is $16,169 million (2016: $17,132 million) and they have fair value equal to carrying value.
The fair value of subordinated liabilities and other borrowed funds is $14,314 million (2016: $13,970 million).
Derivative fi nancial instruments
Derivatives
2017 2016
Notional
principal
amounts
$million
Assets
$million
Liabilities
$million
Notional
principal
amounts
$million
Assets
$million
Liabilities
$million
Foreign exchange derivative contracts:
Currency swaps 8,038 59 300 7,998 – 1,333
Interest rate derivative contracts:
Swaps 11,980 11 192 17,918 529 208
Total 20,018 70 492 25,916 529 1,541
Credit risk
Maximum exposure to credit risk2017
$million
2016
$million
Derivative fi nancial instruments 70 529
Debt securities 12,159 15,009
Amounts owed by subsidiary undertakings 15,714 15,230
Total 27,943 30,768
In 2017 and 2016, amounts owed by subsidiary undertakings were neither past due nor impaired; the Company had no individually impaired loans.
In 2017 and 2016, the Company had no impaired debt securities. The debt securities held by the Group are issued by Standard Chartered Bank, a wholly owned subsidiary undertaking with credit ratings of A+/A/A1.

285
Ris
k re
vie
w a
nd
Cap
ital re
vie
wS
trate
gic
rep
ort
Su
pp
lem
en
tary
info
rmatio
nF
INA
NC
IAL
ST
AT
EM
EN
TS
Dire
cto
rs’ re
po
rt
39. Standard Chartered PLC (Company) continued
Liquidity risk
The following table analyses the residual contractual maturity of the assets and liabilities of the Company on a discounted basis:
2017
One month
or less
$million
Between
one month
and three
months
$million
Between
three
months and
six months
$million
Between
six months
and nine
months
$million
Between
nine months
and one year
$million
Between
one year
and two
years
$million
Between
two years
and fi ve
years
$million
More than
fi ve years
and undated
$million
Total
$million
Assets
Derivative fi nancial instruments – – – – – 2 5 63 70
Investment securities – – – – – – 3,658 8,501 12,159
Amount owed by subsidiary undertakings 271 23 1,577 – 1,613 3,901 5,275 3,054 15,714
Investments in subsidiary undertakings – – – – – – – 34,853 34,853
Other assets – – – – – – – 3 3
Total assets 271 23 1,577 – 1,613 3,903 8,938 46,474 62,799
Liabilities
Derivative fi nancial instruments – – 2 – – 19 283 188 492
Senior debt – – 1,326 – 1,499 3,826 4,671 4,847 16,169
Other liabilities 194 72 76 – 24 – 36 3 405
Subordinated liabilities and other borrowed funds – – – – – – 3,094 10,788 13,882
Total liabilities 194 72 1,404 – 1,523 3,845 8,084 15,826 30,948
Net liquidity gap 77 (49) 173 – 90 58 854 30,648 31,851
2016
One month
or less
$million
Between
one month
and three
months
$million
Between
three
months and
six months
$million
Between
six months
and nine
months
$million
Between
nine months
and one year
$million
Between
one year
and two
years
$million
Between
two years
and fi ve
years
$million
More than
fi ve years
and undated
$million
Total
$million
Assets
Derivative fi nancial instruments – – – 16 – 1 17 495 529
Investment securities – – – 1,250 1,600 – 1,698 10,461 15,009
Amount owed by subsidiary undertakings 249 98 992 1,500 20 2,873 8,725 773 15,230
Investments in subsidiary undertakings – – – – – – – 33,853 33,853
Total assets 249 98 992 2,766 1,620 2,874 10,440 45,582 64,621
Liabilities
Derivative fi nancial instruments – – – – 240 1 323 977 1,541
Senior debt – – 842 1,500 795 2,899 7,858 3,238 17,132
Other liabilities 207 73 72 – 20 – 37 4 413
Subordinated liabilities and other borrowed funds – – – 1,250 – – 2,250 11,082 14,582
Total liabilities 207 73 914 2,750 1,055 2,900 10,468 15,301 33,668
Net liquidity gap 42 25 78 16 565 (26) (28) 30,281 30,953
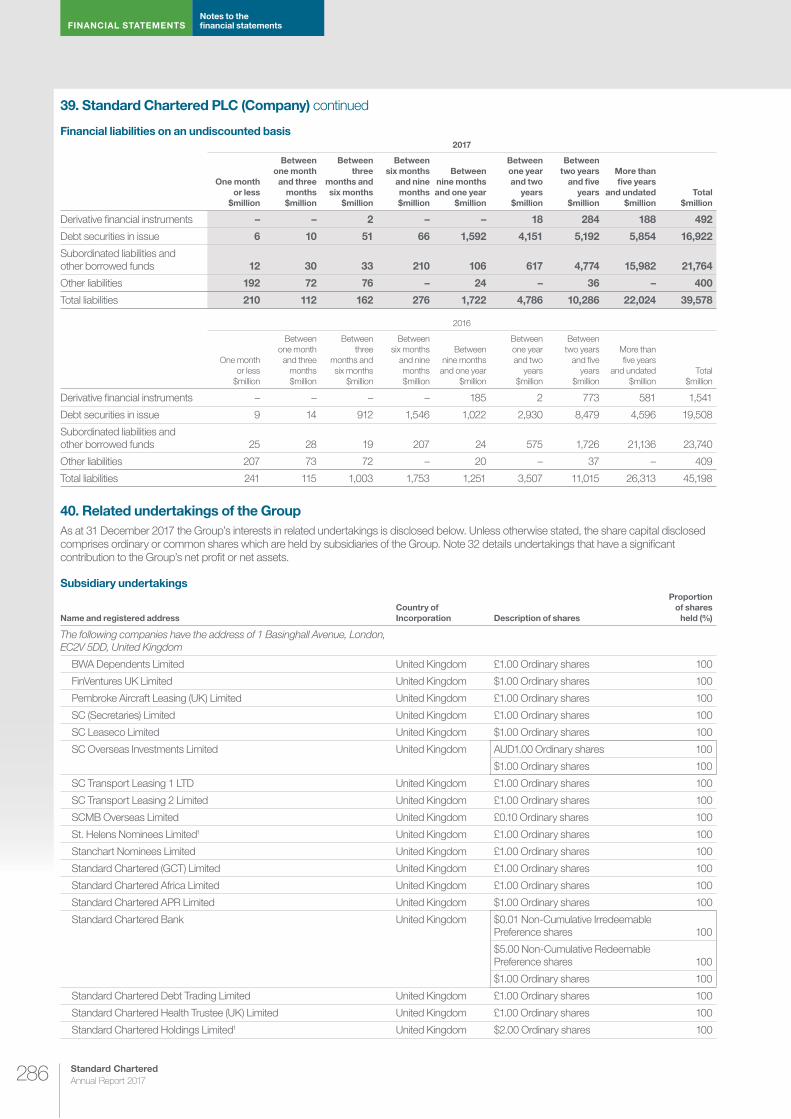
FINANCIAL STATEMENTSNotes to the fi nancial statements
Standard Chartered
Annual Report 2017 286
39. Standard Chartered PLC (Company) continued
Financial liabilities on an undiscounted basis2017
One month
or less
$million
Between
one month
and three
months
$million
Between
three
months and
six months
$million
Between
six months
and nine
months
$million
Between
nine months
and one year
$million
Between
one year
and two
years
$million
Between
two years
and fi ve
years
$million
More than
fi ve years
and undated
$million
Total
$million
Derivative fi nancial instruments – – 2 – – 18 284 188 492
Debt securities in issue 6 10 51 66 1,592 4,151 5,192 5,854 16,922
Subordinated liabilities and other borrowed funds 12 30 33 210 106 617 4,774 15,982 21,764
Other liabilities 192 72 76 – 24 – 36 – 400
Total liabilities 210 112 162 276 1,722 4,786 10,286 22,024 39,578
2016
One month
or less
$million
Between
one month
and three
months
$million
Between
three
months and
six months
$million
Between
six months
and nine
months
$million
Between
nine months
and one year
$million
Between
one year
and two
years
$million
Between
two years
and fi ve
years
$million
More than
fi ve years
and undated
$million
Total
$million
Derivative fi nancial instruments – – – – 185 2 773 581 1,541
Debt securities in issue 9 14 912 1,546 1,022 2,930 8,479 4,596 19,508
Subordinated liabilities and other borrowed funds 25 28 19 207 24 575 1,726 21,136 23,740
Other liabilities 207 73 72 – 20 – 37 – 409
Total liabilities 241 115 1,003 1,753 1,251 3,507 11,015 26,313 45,198
40. Related undertakings of the Group
As at 31 December 2017 the Group’s interests in related undertakings is disclosed below. Unless otherwise stated, the share capital disclosed comprises ordinary or common shares which are held by subsidiaries of the Group. Note 32 details undertakings that have a signifi cant contribution to the Group’s net profi t or net assets.
Subsidiary undertakings
Name and registered address
Country of
Incorporation Description of shares
Proportion
of shares
held (%)
The following companies have the address of 1 Basinghall Avenue, London, EC2V 5DD, United Kingdom
BWA Dependents Limited United Kingdom £1.00 Ordinary shares 100
FinVentures UK Limited United Kingdom $1.00 Ordinary shares 100
Pembroke Aircraft Leasing (UK) Limited United Kingdom £1.00 Ordinary shares 100
SC (Secretaries) Limited United Kingdom £1.00 Ordinary shares 100
SC Leaseco Limited United Kingdom $1.00 Ordinary shares 100
SC Overseas Investments Limited United Kingdom AUD1.00 Ordinary shares 100
$1.00 Ordinary shares 100
SC Transport Leasing 1 LTD United Kingdom £1.00 Ordinary shares 100
SC Transport Leasing 2 Limited United Kingdom £1.00 Ordinary shares 100
SCMB Overseas Limited United Kingdom £0.10 Ordinary shares 100
St. Helens Nominees Limited1 United Kingdom £1.00 Ordinary shares 100
Stanchart Nominees Limited United Kingdom £1.00 Ordinary shares 100
Standard Chartered (GCT) Limited United Kingdom £1.00 Ordinary shares 100
Standard Chartered Africa Limited United Kingdom £1.00 Ordinary shares 100
Standard Chartered APR Limited United Kingdom $1.00 Ordinary shares 100
Standard Chartered Bank United Kingdom $0.01 Non-Cumulative Irredeemable Preference shares 100
$5.00 Non-Cumulative Redeemable Preference shares 100
$1.00 Ordinary shares 100
Standard Chartered Debt Trading Limited United Kingdom £1.00 Ordinary shares 100
Standard Chartered Health Trustee (UK) Limited United Kingdom £1.00 Ordinary shares 100
Standard Chartered Holdings Limited1 United Kingdom $2.00 Ordinary shares 100
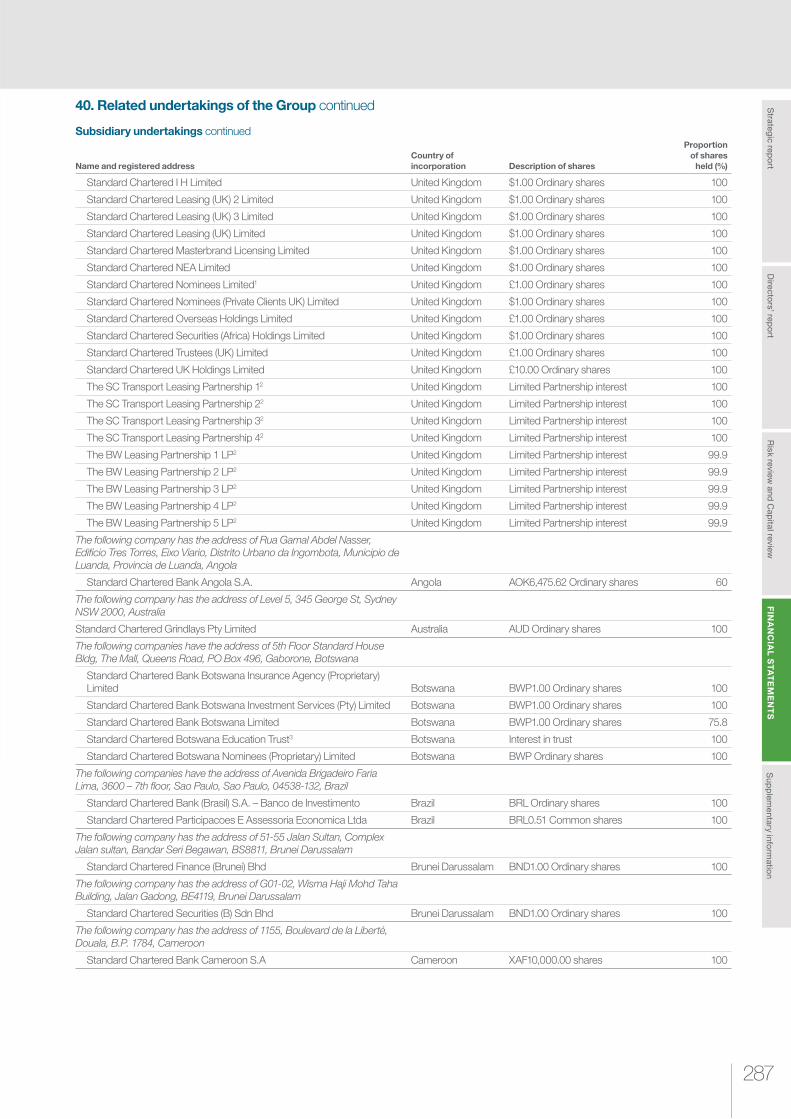
287
Ris
k re
vie
w a
nd
Cap
ital re
vie
wS
trate
gic
rep
ort
Su
pp
lem
en
tary
info
rmatio
nF
INA
NC
IAL
ST
AT
EM
EN
TS
Dire
cto
rs’ re
po
rt
40. Related undertakings of the Group continued
Subsidiary undertakings continued
Name and registered address
Country of
incorporation Description of shares
Proportion
of shares
held (%)
Standard Chartered I H Limited United Kingdom $1.00 Ordinary shares 100
Standard Chartered Leasing (UK) 2 Limited United Kingdom $1.00 Ordinary shares 100
Standard Chartered Leasing (UK) 3 Limited United Kingdom $1.00 Ordinary shares 100
Standard Chartered Leasing (UK) Limited United Kingdom $1.00 Ordinary shares 100
Standard Chartered Masterbrand Licensing Limited United Kingdom $1.00 Ordinary shares 100
Standard Chartered NEA Limited United Kingdom $1.00 Ordinary shares 100
Standard Chartered Nominees Limited1 United Kingdom £1.00 Ordinary shares 100
Standard Chartered Nominees (Private Clients UK) Limited United Kingdom $1.00 Ordinary shares 100
Standard Chartered Overseas Holdings Limited United Kingdom £1.00 Ordinary shares 100
Standard Chartered Securities (Africa) Holdings Limited United Kingdom $1.00 Ordinary shares 100
Standard Chartered Trustees (UK) Limited United Kingdom £1.00 Ordinary shares 100
Standard Chartered UK Holdings Limited United Kingdom £10.00 Ordinary shares 100
The SC Transport Leasing Partnership 12 United Kingdom Limited Partnership interest 100
The SC Transport Leasing Partnership 22 United Kingdom Limited Partnership interest 100
The SC Transport Leasing Partnership 32 United Kingdom Limited Partnership interest 100
The SC Transport Leasing Partnership 42 United Kingdom Limited Partnership interest 100
The BW Leasing Partnership 1 LP2 United Kingdom Limited Partnership interest 99.9
The BW Leasing Partnership 2 LP2 United Kingdom Limited Partnership interest 99.9
The BW Leasing Partnership 3 LP2 United Kingdom Limited Partnership interest 99.9
The BW Leasing Partnership 4 LP2 United Kingdom Limited Partnership interest 99.9
The BW Leasing Partnership 5 LP2 United Kingdom Limited Partnership interest 99.9
The following company has the address of Rua Gamal Abdel Nasser, Edifi cio Tres Torres, Eixo Viario, Distrito Urbano da Ingombota, Municipio de Luanda, Provincia de Luanda, Angola
Standard Chartered Bank Angola S.A. Angola AOK6,475.62 Ordinary shares 60
The following company has the address of Level 5, 345 George St, Sydney NSW 2000, Australia
Standard Chartered Grindlays Pty Limited Australia AUD Ordinary shares 100
The following companies have the address of 5th Floor Standard House Bldg, The Mall, Queens Road, PO Box 496, Gaborone, Botswana
Standard Chartered Bank Botswana Insurance Agency (Proprietary) Limited Botswana BWP1.00 Ordinary shares 100
Standard Chartered Bank Botswana Investment Services (Pty) Limited Botswana BWP1.00 Ordinary shares 100
Standard Chartered Bank Botswana Limited Botswana BWP1.00 Ordinary shares 75.8
Standard Chartered Botswana Education Trust3 Botswana Interest in trust 100
Standard Chartered Botswana Nominees (Proprietary) Limited Botswana BWP Ordinary shares 100
The following companies have the address of Avenida Brigadeiro Faria Lima, 3600 – 7th fl oor, Sao Paulo, Sao Paulo, 04538-132, Brazil
Standard Chartered Bank (Brasil) S.A. – Banco de Investimento Brazil BRL Ordinary shares 100
Standard Chartered Participacoes E Assessoria Economica Ltda Brazil BRL0.51 Common shares 100
The following company has the address of 51-55 Jalan Sultan, Complex Jalan sultan, Bandar Seri Begawan, BS8811, Brunei Darussalam
Standard Chartered Finance (Brunei) Bhd Brunei Darussalam BND1.00 Ordinary shares 100
The following company has the address of G01-02, Wisma Haji Mohd Taha Building, Jalan Gadong, BE4119, Brunei Darussalam
Standard Chartered Securities (B) Sdn Bhd Brunei Darussalam BND1.00 Ordinary shares 100
The following company has the address of 1155, Boulevard de la Liberté, Douala, B.P. 1784, Cameroon
Standard Chartered Bank Cameroon S.A Cameroon XAF10,000.00 shares 100

FINANCIAL STATEMENTSNotes to the fi nancial statements
Standard Chartered
Annual Report 2017 288
40. Related undertakings of the Group continued
Subsidiary undertakings continued
Name and registered address
Country of
incorporation Description of shares
Proportion
of shares
held (%)
The following company has the address of 20 Adelaide Street, Suite 1105 , Toronto ON M5C 2T6 Canada
Standard Chartered (Canada) Limited Canada CAD1.00 Ordinary shares 100
The following company has the address of Maples Finance Limited, PO Box 1093 GT, Queensgate House, Georgetown, Grand Cayman, Cayman Islands
SCB Investment Holding Company Limited Cayman Islands $1,000.00 A Ordinary shares 100
The following company has the address of Cayman Corporate Centre, 27 Hospital Road, George Town, Grand Cayman KY1-9008, Cayman Islands
Ocean Horizon Holdings South Ltd Cayman Islands $1.00 Ordinary shares 100
The following companies have the address of Walkers Corporate Limited, Cayman Corporate Centre, 27 Hospital Road George Town, Grand Cayman KY1-9008, Cayman Islands
Sirat Holdings Limited Cayman Islands $0.01 Ordinary shares 91
$0.01 Preference shares 66.7
Standard Chartered Corporate Private Equity (Cayman) Limited Cayman Islands $1.00 Ordinary shares 100
Standard Chartered International Partners Cayman Islands $1.00 Ordinary shares 100
Standard Chartered Principal Finance (Cayman) Limited Cayman Islands $1.00 Ordinary shares 100
Standard Chartered Private Equity (Cayman) Limited Cayman Islands $1.00 Ordinary shares 100
The following company has the address of Mourant Ozannes Corporate Services (Cayman) Limited, Harbour Centre, 42 North Church Street, PO Box 1348, Grand Cayman KY1-1108, Cayman Islands
Sunfl ower Cayman SPC2 Cayman Islands $1.00 Management shares 100
The following companies have the address of Maples Corporate Services Limited, PO Box 309, Ugland House, Grand Cayman KY1-1104, Cayman Islands
Cerulean Investments LP Cayman Islands Limited Partnership interest 100
Standard Chartered Saadiq Mudarib Company Limited Cayman Islands $1.00 Ordinary shares 100
The following companies have the address of Unit 2 – 101, Building 3, Haifeng Logistics Park, No. 600 Luoyang Road, Tianjin, Dongjiang Free Trade Port Zone, China
Pembroke Aircraft Leasing (Tianjin) Limited China $1.00 Ordinary shares 100
Pembroke Aircraft Leasing Tianjin 1 Limited China CNY1.00 Ordinary shares 100
Pembroke Aircraft Leasing Tianjin 2 Limited China CNY1.00 Ordinary shares 100
The following company has the address of Standard Chartered Tower, 201 Century Avenue, Pudong, Shanghai, 200120, China
Standard Chartered Bank (China) Limited China CNY Ordinary shares 100
The following company has the address of Unit 5, 12th Floor, Standard Chartered Tower, World Finance, No 1 East Third Ring Middle Road, Chaoyang District, Beijing, 100020, China
Standard Chartered Corporate Advisory Co. Ltd China $1.00 Ordinary shares 100
The following company has the address of No. 188 Yeshen Rd, 11F, A-1161 RM, Pudong New District, Shanghai, 31201308, China
Standard Chartered Trading (Shanghai) Limited China $15,000,000.00 Ordinary shares 100
The following company has the address of No. 35, Xinhuanbei Road, TEDA, Tianjin, 300457, China
Standard Chartered Global Business Services Co. Limited China $ Ordinary shares 100
The following company has the address of Standard Chartered Bank Cote d’Ivoire, 23 Boulevard de la République, Abidjan 17, 17 B.P. 1141, Cote d’Ivoire
Standard Chartered Bank Cote d’ Ivoire SA Cote d’Ivoire XOF100,000.00 Ordinary shares 100
The following company has the address of Standard Chartered Bank France, 32 Rue de Monceau,75008, Paris, France
Pembroke Lease France SAS France €1.00 Ordinary shares 100

289
Ris
k re
vie
w a
nd
Cap
ital re
vie
wS
trate
gic
rep
ort
Su
pp
lem
en
tary
info
rmatio
nF
INA
NC
IAL
ST
AT
EM
EN
TS
Dire
cto
rs’ re
po
rt
40. Related undertakings of the Group continued
Subsidiary undertakings continued
Name and registered address
Country of
incorporation Description of shares
Proportion
of shares
held (%)
The following company has the address of 8 Ecowas Avenue, PMB 259 Banjul, The Gambia
Standard Chartered Bank Gambia Limited Gambia GMD1.00 Ordinary shares 74.9
The following company has the address of Standard Chartered Bank Germany Branch, Franklinstraße 46-48, 60486, Frankfurt am Main, Germany
Standard Chartered AG Germany € Ordinary shares 100
The following companies have the address of Standard Chartered Bank Building, 6 John Evans Atta Mills High Street,P.O. Box 768, Accra,Ghana
Standard Chartered Bank Ghana Limited Ghana GHS Ordinary shares 69.4
GHS0.52 Preference shares 87.0
Standard Chartered Ghana Nominees Limited Ghana GHS Ordinary shares 100
The following companies have the address of Bordeaux Court Les Echelons, South Esplanade, St.Peter Port, Guernsey
Birdsong Limited Guernsey £1.00 Ordinary shares 100
Nominees One Limited Guernsey £1.00 Ordinary shares 100
Nominees Two Limited Guernsey £1.00 Ordinary shares 100
Songbird Limited Guernsey £1.00 Ordinary shares 100
Standard Chartered Secretaries (Guernsey) Limited Guernsey £1.00 Ordinary shares 100
Standard Chartered Trust (Guernsey) Limited Guernsey £1.00 Ordinary shares 100
The following companies have the address of 1401 Hutchison House, 10 Harcourt Road, Hong Kong
Double Wings Limited Hong Kong HKD1.00 Ordinary shares 100
Kozagi Limited Hong Kong HKD10.00 Ordinary shares 100
Majestic Legend Limited Hong Kong HKD1.00 Ordinary shares 100
Ori Private Limited Hong Kong $1.00 Ordinary shares 100
$1.00 A Ordinary shares 90.8
Rivendell Private Limited Hong Kong $1.00 A Ordinary shares 84.8
Standard Chartered PF Real Estate (Hong Kong) Limited Hong Kong HKD10.00 Ordinary shares 100
The following company has the address of 15th Floor, Standard Chartered Tower, 388 Kwun Tong Road, Kwun Tong, Hong Kong
Horsford Nominees Limited Hong Kong HKD Ordinary shares 100
The following companies have the address of 25/F, Standard Chartered Bank Building, 4-4A Des Voeux Road Central, Hong Kong
Marina Acacia Shipping Limited Hong Kong $ Ordinary shares 100
Marina Amaryllis Shipping Limited Hong Kong $ Ordinary shares 100
Marina Amethyst Shipping Limited Hong Kong $ Ordinary shares 100
Marina Ametrine Shipping Limited Hong Kong $ Ordinary shares 100
Marina Angelite Shipping Limited Hong Kong $ Ordinary shares 100
Marina Apollo Shipping Limited Hong Kong $ Ordinary shares 100
Marina Beryl Shipping Limited Hong Kong $ Ordinary shares 100
Marina Carnelian Shipping Limited Hong Kong $ Ordinary shares 100
Marina Emerald Shipping Limited Hong Kong $ Ordinary shares 100
Marina Flax Shipping Limited Hong Kong $ Ordinary shares 100
Marina Gloxinia Shipping Limited Hong Kong $ Ordinary shares 100
Marina Hazel Shipping Limited Hong Kong $ Ordinary shares 100
Marina Honor Shipping Limited Hong Kong HKD Ordinary shares 100
$ Ordinary shares 100
Marina Ilex Shipping Limited Hong Kong $ Ordinary shares 100
Marina Iridot Shipping Limited Hong Kong $ Ordinary shares 100
Marina Kunzite Shipping Limited Hong Kong $ Ordinary shares 100
Marina Leasing Limited Hong Kong $ Ordinary shares 100

FINANCIAL STATEMENTSNotes to the fi nancial statements
Standard Chartered
Annual Report 2017 290
40. Related undertakings of the Group continued
Subsidiary undertakings continued
Name and registered address
Country of
incorporation Description of shares
Proportion
of shares
held (%)
Marina Mimosa Shipping Limited Hong Kong $ Ordinary shares 100
Marina Moonstone Shipping Limited Hong Kong $ Ordinary shares 100
Marina Peridot Shipping Limited Hong Kong $ Ordinary shares 100
Marina Sapphire Shipping Limited Hong Kong $ Ordinary shares 100
Marina Splendor Shipping Limited Hong Kong HKD Ordinary shares 100
$ Ordinary shares 100
Marina Tourmaline Shipping Limited Hong Kong $ Ordinary shares 100
Standard Chartered Leasing Group Limited Hong Kong $ Ordinary shares 100
Standard Chartered Trade Support (HK) Limited Hong Kong HKD Ordinary shares 100
The following company has the address of 13/F, Standard Chartered Tower, 388 Kwun Tong Road, Kwun Tong, Kowloon, Hong Kong
S C Learning Limited Hong Kong HKD Ordinary shares 100
The following company has the address of 21/F, Standard Chartered Tower, 388 Kwun Tong Road, Kwun Tong, Kowloon, Hong Kong
Standard Chartered Asia Limited Hong Kong HKD Deferred shares 100
HKD Ordinary shares 100
The following companies have the address of 32nd Floor, 4-4A Des Voeux Road, Central, Hong Kong
Standard Chartered Sherwood (HK) Limited Hong Kong HKD Ordinary shares 100
Standard Chartered Bank (Hong Kong) Limited Hong Kong HKD A Ordinary shares 100
HKD B Ordinary shares 100
$ Preference shares 100
The following company has the address of L5 The Forum, Exchange Square, 8 Connaught Place, Central, Hong Kong
Standard Chartered Global Trading Investments Limited Hong Kong HKD Ordinary shares 100
The following companies have the address of 20/F, Standard Chartered Bank Building, 4-4A Des Voeux Road, Central, Hong Kong
Standard Chartered Private Equity Limited Hong Kong HKD1.00 Ordinary shares 100
Standard Chartered Private Equity Managers (Hong Kong) Limited Hong Kong HKD Ordinary shares 100
The following company has the address of 15/F, Two International Finance Centre, No. 8 Finance Street, Central, Hong Kong
Standard Chartered Securities (Hong Kong) Limited Hong Kong HKD Ordinary shares 100
The following company has the address of 17/F, Standard Chartered Bank Building, 4-4A Des Voeux Road, Central, Hong Kong
Standard Chartered Trust (Hong Kong) Limited Hong Kong HKD10.00 Ordinary shares 100
The following company has the address of Room 1305, 13/F, Shun Tak Center West Tower, 200 Connaught Road, Hong Kong
Union Town Limited Hong Kong HKD1.00 Ordinary shares 100
The following company has the address of 1st Floor, Europe Building, No.1, Haddows Road, Nungambakkam, Chennai, 600 006, India
Standard Chartered Global Business Services Private Limited India INR10.00 Equity shares 100
The following company has the address of 1st Floor, Crescenzo, Plot no. C-38 & 39, G-Block, Bandra (East), Mumbai, Maharashtra, 400 051, India
St Helen’s Nominees India Private Limited India INR10.00 Equity shares 100
The following company has the address of 90 M.G.Road, II Floor, FORT, Mumbai, MAHARASHTRA, 400 001, India
Standard Chartered Finance Private Limited India INR10.00 Ordinary shares 98.7
The following company has the address of 6th Floor, Crescenzo, Plot No 38-39, G-Block, Bandra Kurla Complex, Bandra East, Mumbai, Maharashtra, 400051, India
Standard Chartered Investments and Loans (India) Limited India INR10.00 Ordinary shares 100

291
Ris
k re
vie
w a
nd
Cap
ital re
vie
wS
trate
gic
rep
ort
Su
pp
lem
en
tary
info
rmatio
nF
INA
NC
IAL
ST
AT
EM
EN
TS
Dire
cto
rs’ re
po
rt
40. Related undertakings of the Group continued
Subsidiary undertakings continued
Name and registered address
Country of
incorporation Description of shares
Proportion
of shares
held (%)
The following company has the address of Floor no.7, Crescenzo Building, C-38-39, G”-Block, Bandra Kurla Complex, Bandra East, Mumbai, Maharashtra, 400051, India
Standard Chartered Private Equity Advisory (India) Private Limited India INR1,000.00 Ordinary shares 100
The following company has the address of 2nd Floor, 23-25 M.G. Road, Fort, Mumbai, 400 001, India
Standard Chartered Securities (India) Limited India INR10.00 Ordinary shares 100
The following company has the address of 6th Floor, Crescenzo, Plot No.C-38-39, G-Block, Bandra Kurla Complex, Bandra (East), , Mumbai, Maharashtra, 400051, India
Standard Chartered (India) Modeling and Analytics Centre Private Limited India INR10.00 Ordinary shares 100
The following company has the address of Menara Standard Chartered, 3rd Floor, Jl. Prof. Dr. Satrio no. 164, Setiabudi, Jarkarta, Selatan, Indonesia
PT Standard Chartered Sekuritas Indonesia Indonesia IDR100,000,000.00 Ordinary shares 99
The following company has the address of Menara Standard Chartered, 7th fl oor, Jl. Prof. Dr. Satrio no. 164, Jakarta, 12930, Indonesia
PT. Price Solutions Indonesia Indonesia $100.00 Ordinary shares 100
The following companies have the address of 33-41 Lower Mount Street, Dublin 2, Ireland
Inishbrophy Leasing Limited Ireland €1.00 Ordinary shares 100
Inishcannon Leasing Limited Ireland $1.00 Ordinary shares 100
Inishcorky Leasing Limited Ireland $1.00 Ordinary shares 100
Inishcrean Leasing Limited Ireland $1.00 Ordinary shares 100
Inishdawson Leasing Limited Ireland €1.00 Ordinary shares 100
Inisherkin Leasing Limited Ireland $1.00 Ordinary shares 100
Inishgort Leasing Limited Ireland $1.00 Ordinary shares 100
Inishlynch Leasing Limited Ireland €1.00 Ordinary shares 100
Inishoo Leasing Limited Ireland $1.00 Ordinary shares 100
Inishquirk Leasing Limited Ireland $1.00 Ordinary shares 100
Inishtubrid Leasing Limited Ireland $1.00 Ordinary shares 100
Nightjar Limited Ireland $1.00 Ordinary shares 100
Pembroke 7006 Leasing Limited Ireland €1.25 Ordinary shares 100
Pembroke Aircraft Leasing 1 Limited Ireland €1.00 Ordinary shares 100
Pembroke Aircraft Leasing 2 Limited Ireland €1.00 Ordinary shares 100
Pembroke Aircraft Leasing 3 Limited Ireland $1.00 Ordinary shares 100
Pembroke Aircraft Leasing 4 Limited Ireland $1.00 Ordinary shares 100
Pembroke Aircraft Leasing 5 Limited Ireland $1.00 Ordinary shares 100
Pembroke Aircraft Leasing 6 Limited Ireland $1.00 Ordinary shares 100
Pembroke Aircraft Leasing 7 Limited Ireland $1.00 Ordinary shares 100
Pembroke Aircraft Leasing 8 Limited Ireland $1.00 Ordinary shares 100
Pembroke Aircraft Leasing 9 Limited Ireland $1.00 Ordinary shares 100
Pembroke Aircraft Leasing 10 Limited Ireland $1.00 Ordinary shares 100
Pembroke Aircraft Leasing 11 Limited Ireland $1.00 Ordinary shares 100
Pembroke Aircraft Leasing 12 Limited Ireland $1.00 Ordinary shares 100
Pembroke Aircraft Leasing Holdings Limited Ireland $1.00 Ordinary shares 100
Pembroke Alpha Limited Ireland €1.00 Ordinary shares 100
Pembroke Capital Limited Ireland €1.25 Ordinary shares 100
$1.00 Ordinary shares 100
Pembroke Capital Shannon Limited Ireland €1.25 Ordinary shares 100
Skua Limited Ireland $1.00 Ordinary shares 100
The following company has the address of First Names House, Victoria Road, Douglas, IM2 4DF, Isle of Man
Pembroke Group Limited Isle of Man $0.01 Ordinary shares 100

FINANCIAL STATEMENTSNotes to the fi nancial statements
Standard Chartered
Annual Report 2017 292
40. Related undertakings of the Group continued
Subsidiary undertakings continued
Name and registered address
Country of
incorporation Description of shares
Proportion
of shares
held (%)
The following companies have the address of 1st Floor, Rose House, 51-59 Circular Road, Douglas, IM1 1RE, Isle of Man
Standard Chartered Assurance Limited Isle of Man $1.00 Ordinary shares 100
$1.00 Redeemable Preference shares 100
Standard Chartered Insurance Limited Isle of Man $1.00 Ordinary shares 100
The following company has the address of 21/F, Sanno Park Tower, 2-11-1 Nagatacho, Chiyoda-ku, Tokyo, 100-6155, Japan
Standard Chartered Securities (Japan) Limited Japan JPY50,000 Ordinary shares 100
The following company has the address of Lime Grove House, Green Street, St Helier, JE1 2ST, Jersey
Ocean Horizon Holdings East Limited Jersey $1.00 Ordinary shares 100
The following company has the address of 4/F St Pauls Gate, 22-24 New Street, St Helier,Channel Islands, JE1 4TR, Jersey
Ocean Horizon Holdings West Limited Jersey $1.00 Ordinary shares 100
The following company has the address of 15 Castle Street, St Helier, JE4 8PT, Jersey
SCB Nominees (CI) Limited Jersey $1.00 Ordinary shares 100
The following company has the address of 13 Castle Street, St Helier, JE4 5UT, Jersey
Standard Chartered Funding (Jersey) Limited1 Jersey £1.00 Ordinary shares 100
The following companies have the address of Standard Chartered Chiromo, Number 48, Westlands Road, P. O. Box 30003 – 00100, Nairobi, Kenya
Standard Chartered Investment Services Limited Kenya KES1.00 Ordinary shares 100
Standard Chartered Bank Kenya Limited Kenya KES5.00 Ordinary shares 74.3
KES5.00 Preference shares 100
Standard Chartered Securities (Kenya) Limited Kenya KES10.00 Ordinary shares 100
Standard Chartered Financial Services Limited Kenya KES20.00 Ordinary shares 100
Standard Chartered Insurance Agency Limited Kenya KES100.00 Ordinary shares 100
Standard Chartered Kenya Nominees Limited Kenya KES20.00 Ordinary shares 100
The following company has the address of M6-2701, West 27Fl, Suha-dong, 26, Eulji-ro 5-gil, Jung-gu, Seoul, Korea, Republic of
Resolution Alliance Korea Ltd Korea, Republic of KRW5,000.00 Ordinary shares 100
The following company has the address of 47 Jongno, Jongno-gu, Seoul, 110-702, Korea, Republic of
Standard Chartered Bank Korea Limited Korea, Republic of KRW5,000.00 Ordinary shares 100
The following companies have the address of 17th Floor, 100, Gongpyeong-dong, Jongno-gu, Seoul, Korea, Republic of
Standard Chartered Private Equity Korea II Korea, Republic of KRW1,000,000.00 Ordinary shares 100
Standard Chartered Private Equity Managers Korea Limited Korea, Republic of KRW5,000.00 Ordinary shares 100
The following company has the address of 2F, 47 Jongno, Jongno-gu, Seoul, 110-702, Korea, Republic of
Standard Chartered Securities Korea Limited Korea, Republic of KRW5,000.00 Ordinary shares 100
The following company has the address of Atrium Building, Maarad Street, 3rd Floor, P.O.Box: 11-4081 Riad El Solh, Beirut, Beirut Central District, Lebanon
Standard Chartered Metropolitan Holdings SAL Lebanon $10.00 Ordinary A shares 100
The following companies have the address of Level 16, Menara Standard Chartered, 30, Jalan Sultan Ismail, 50250, Kuala Lumpur, Malaysia
Amphissa Corporation Sdn Bhd Malaysia RM1.00 Ordinary shares 100
Cartaban (Malaya) Nominees Sdn Berhad Malaysia RM10.00 Ordinary shares 100
Cartaban Nominees (Asing) Sdn Bhd Malaysia RM1.00 Ordinary shares 100
Cartaban Nominees (Tempatan) Sdn Bhd Malaysia RM1.00 Ordinary shares 100
Golden Maestro Sdn Bhd Malaysia RM1.00 Ordinary shares 100
Popular Ambience Sdn Bhd Malaysia RM1.00 Ordinary shares 100
Price Solutions Sdn Bhd Malaysia RM1.00 Ordinary shares 100

293
Ris
k re
vie
w a
nd
Cap
ital re
vie
wS
trate
gic
rep
ort
Su
pp
lem
en
tary
info
rmatio
nF
INA
NC
IAL
ST
AT
EM
EN
TS
Dire
cto
rs’ re
po
rt
40. Related undertakings of the Group continued
Subsidiary undertakings continued
Name and registered address
Country of
incorporation Description of shares
Proportion
of shares
held (%)
SCBMB Trustee Berhad Malaysia RM10.00 Ordinary shares 100
Standard Chartered Bank Malaysia Berhad Malaysia RM0.10 Irredeemable Cumulative Preference shares 100
RM1.00 Ordinary shares 100
Standard Chartered Saadiq Berhad Malaysia RM1.00 Ordinary shares 100
The following companies have the address of Brumby Centre, Lot 42, Jalan Muhibbah, 87000, Labuan F.T., Malaysia
Marina Morganite Shipping Limited Malaysia $ Ordinary shares 100
Marina Moss Shipping Limited Malaysia $1.00 Ordinary shares 100
Marina Tanzanite Shipping Limited Malaysia $ Ordinary shares 100
Pembroke Leasing (Labuan) 2 Berhad Malaysia $1.00 Ordinary shares 100
Pembroke Leasing (Labuan) 3 Berhad Malaysia $1.00 Ordinary shares 100
Pembroke Leasing (Labuan) Pte Limited Malaysia $1.00 Ordinary shares 100
The following company has the address of 12th Floor, Menara KH, Jalan Sultan Ismail, 50250 Kuala Lumpur, Wilayah Persekutuan, Malaysia
Resolution Alliance Sdn Bhd2 Malaysia RM1.00 Ordinary shares 91
The following company has the address of Level 7, Wisma Standard Chartered, Jalan Teknologi 8, Taman Teknologi Malaysia, 57000, Bukit Jalil, Kuala Lumpur, Wilayah Persekutuan, Malaysia
Standard Chartered Global Business Services Sdn Bhd Malaysia RM1.00 Ordinary shares 100
The following companies have the address of Trust Company Complex, Ajeltake Road, Ajeltake Island, Majuro, MH96960, Marshall Islands
Marina Alysse Shipping Limited Marshall Islands $1.00 Ordinary shares 100
Marina Amandier Shipping Limited Marshall Islands $1.00 Ordinary shares 100
Marina Ambroisee Shipping Limited Marshall Islands $1.00 Ordinary shares 100
Marina Angelica Shipping Limited Marshall Islands $1.00 Ordinary shares 100
Marina Aquamarine Shipping Limited Marshall Islands $1.00 Ordinary shares 100
Marina Aventurine Shipping Limited Marshall Islands $1.00 Ordinary shares 100
Marina Buxus Shipping Limited Marshall Islands $1.00 Ordinary shares 100
Marina Celsie Shipping Limited Marshall Islands $1.00 Ordinary shares 100
Marina Citrine Shipping Limited Marshall Islands $1.00 Ordinary shares 100
Marina Dahlia Shipping Limited Marshall Islands $1.00 Ordinary shares 100
Marina Dittany Shipping Limited Marshall Islands $1.00 Ordinary shares 100
Marina Dorado Shipping Limited Marshall Islands $1.00 Ordinary shares 100
Marina Lilac Shipping Limited Marshall Islands $1.00 Ordinary shares 100
Marina Lolite Shipping Limited Marshall Islands $1.00 Ordinary shares 100
Marina Obsidian Shipping Limited Marshall Islands $1.00 Ordinary shares 100
Marina Pissenlet Shipping Limited Marshall Islands $1.00 Ordinary shares 100
Marina Poseidon Shipping Limited Marshall Islands $1.00 Ordinary shares 100
Marina Protea Shipping Limited Marshall Islands $1.00 Ordinary shares 100
Marina Quartz Shipping Limited Marshall Islands $1.00 Ordinary shares 100
Marina Remora Shipping Limited Marshall Islands $1.00 Ordinary shares 100
Marina Turquoise Shipping Limited Marshall Islands $1.00 Ordinary shares 100
Marina Zeus Shipping Limited Marshall Islands $1.00 Ordinary shares 100
Marina Zircon Shipping Limited Marshall Islands $1.00 Ordinary shares 100
The following company has the address of 6th Floor, Standard Chartered Tower, 19, Bank Street, Cybercity, Ebene, 72201, Mauritius
Standard Chartered Bank (Mauritius) Limited Mauritius $10.00 Ordinary shares 100

FINANCIAL STATEMENTSNotes to the fi nancial statements
Standard Chartered
Annual Report 2017 294
40. Related undertakings of the Group continued
Subsidiary undertakings continued
Name and registered address
Country of
incorporation Description of shares
Proportion
of shares
held (%)
The following companies have the address of c/o Abax Corporate Services Ltd, 6th Floor, Tower A, 1 CYBERCITY, Ebene, Mauritius
Standard Chartered Financial Holdings Mauritius $1.00 Ordinary shares 100
Standard Chartered Private Equity (Mauritius) II Limited Mauritius $1.00 Ordinary shares 100
Standard Chartered Private Equity (Mauritius) Limited Mauritius $1.00 Ordinary shares 100
$ Redeemable Preference shares 100
Standard Chartered Private Equity (Mauritius) lll Limited Mauritius $1.00 Ordinary shares 100
The following company has the address of 5th Floor, Ebene Esplanade, 24 Bank Street, Cybercity, Ebene, Mauritius
Subcontinental Equities Limited Mauritius $1.00 Ordinary shares 100
The following company has the address of Standard Chartered Bank Nepal Limited, Madan Bhandari Marg, Ward No.34, Kathmandu Metropolitan City, Kathmandu District, Bagmati Zone, Kathmandu, Nepal
Standard Chartered Bank Nepal Limited Nepal NPR100.00 Ordinary shares 70.2
The following companies have the address of Hoogoorddreef 15, 1101 BA, Amsterdam, Netherlands
Pembroke B717 Holdings B.V. Netherlands €1.00 Ordinary shares 100
Pembroke Holland B.V. Netherlands €450.00 Ordinary shares 100
The following companies have the address of 1 Basinghall Avenue, London, EC2V 5DD, United Kingdom
Smart Application Investment B.V. Netherlands €45.00 Ordinary shares 100
Standard Chartered Holdings (Africa) B.V. Netherlands €4.50 Ordinary shares 100
Standard Chartered Holdings (Asia Pacifi c) B.V. Netherlands €4.50 Ordinary shares 100
Standard Chartered Holdings (International) B.V. Netherlands €4.50 Ordinary A shares 100
€4.50 Ordinary B shares 100
€4.50 Ordinary C shares 100
€4.50 Ordinary D shares 100
€4.50 Ordinary E shares 100
€4.50 Ordinary F shares 100
€4.50 Ordinary G shares 100
Standard Chartered MB Holdings B.V. Netherlands €4.50 Ordinary shares 100
The following companies have the address of 142 Ahmadu Bello Way, Victoria Island, Lagos, Nigeria
Cherroots Nigeria Limited Nigeria NGN1.00 Ordinary shares 100
Standard Chartered Bank Nigeria Limited Nigeria NGN1.00 Irredeemable Non Cumulative Preference shares 100
NGN1.00 Ordinary shares 100
NGN1.00 Redeemable Preference shares 100
Standard Chartered Capital & Advisory Nigeria Limited Nigeria NGN1.00 Ordinary shares 100
Standard Chartered Nominees (Nigeria) Limited Nigeria NGN1.00 Ordinary shares 100
The following company has the address of 3rd Floor Main SCB Building, I.I Chundrigar Road, Karachi, Sindh, 74000, Pakistan
Price Solution Pakistan (Private) Limited1 Pakistan PKR10.00 Ordinary shares 100
The following company has the address of P.O. Box No. 5556I.I. Chundrigar Road, Karachi, 74000, Pakistan
Standard Chartered Bank (Pakistan) Limited Pakistan PKR10.00 Ordinary shares 99
The following company has the address of Offshore Chambers, PO Box 217, Apia, Western Samoa
Standard Chartered Nominees (Western Samoa) Limited Samoa $1.00 Ordinary shares 100
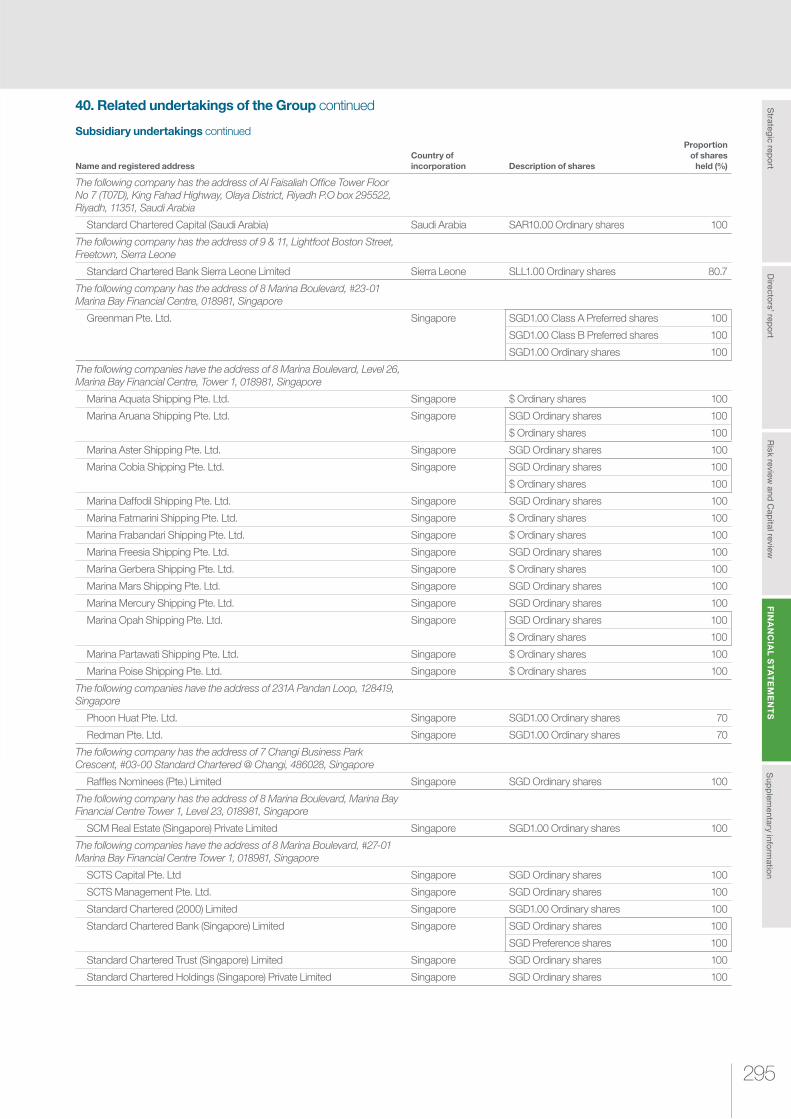
295
Ris
k re
vie
w a
nd
Cap
ital re
vie
wS
trate
gic
rep
ort
Su
pp
lem
en
tary
info
rmatio
nF
INA
NC
IAL
ST
AT
EM
EN
TS
Dire
cto
rs’ re
po
rt
40. Related undertakings of the Group continued
Subsidiary undertakings continued
Name and registered address
Country of
incorporation Description of shares
Proportion
of shares
held (%)
The following company has the address of Al Faisaliah Offi ce Tower Floor No 7 (T07D), King Fahad Highway, Olaya District, Riyadh P.O box 295522, Riyadh, 11351, Saudi Arabia
Standard Chartered Capital (Saudi Arabia) Saudi Arabia SAR10.00 Ordinary shares 100
The following company has the address of 9 & 11, Lightfoot Boston Street, Freetown, Sierra Leone
Standard Chartered Bank Sierra Leone Limited Sierra Leone SLL1.00 Ordinary shares 80.7
The following company has the address of 8 Marina Boulevard, #23-01 Marina Bay Financial Centre, 018981, Singapore
Greenman Pte. Ltd. Singapore SGD1.00 Class A Preferred shares 100
SGD1.00 Class B Preferred shares 100
SGD1.00 Ordinary shares 100
The following companies have the address of 8 Marina Boulevard, Level 26, Marina Bay Financial Centre, Tower 1, 018981, Singapore
Marina Aquata Shipping Pte. Ltd. Singapore $ Ordinary shares 100
Marina Aruana Shipping Pte. Ltd. Singapore SGD Ordinary shares 100
$ Ordinary shares 100
Marina Aster Shipping Pte. Ltd. Singapore SGD Ordinary shares 100
Marina Cobia Shipping Pte. Ltd. Singapore SGD Ordinary shares 100
$ Ordinary shares 100
Marina Daffodil Shipping Pte. Ltd. Singapore SGD Ordinary shares 100
Marina Fatmarini Shipping Pte. Ltd. Singapore $ Ordinary shares 100
Marina Frabandari Shipping Pte. Ltd. Singapore $ Ordinary shares 100
Marina Freesia Shipping Pte. Ltd. Singapore SGD Ordinary shares 100
Marina Gerbera Shipping Pte. Ltd. Singapore $ Ordinary shares 100
Marina Mars Shipping Pte. Ltd. Singapore SGD Ordinary shares 100
Marina Mercury Shipping Pte. Ltd. Singapore SGD Ordinary shares 100
Marina Opah Shipping Pte. Ltd. Singapore SGD Ordinary shares 100
$ Ordinary shares 100
Marina Partawati Shipping Pte. Ltd. Singapore $ Ordinary shares 100
Marina Poise Shipping Pte. Ltd. Singapore $ Ordinary shares 100
The following companies have the address of 231A Pandan Loop, 128419, Singapore
Phoon Huat Pte. Ltd. Singapore SGD1.00 Ordinary shares 70
Redman Pte. Ltd. Singapore SGD1.00 Ordinary shares 70
The following company has the address of 7 Changi Business Park Crescent, #03-00 Standard Chartered @ Changi, 486028, Singapore
Raffl es Nominees (Pte.) Limited Singapore SGD Ordinary shares 100
The following company has the address of 8 Marina Boulevard, Marina Bay Financial Centre Tower 1, Level 23, 018981, Singapore
SCM Real Estate (Singapore) Private Limited Singapore SGD1.00 Ordinary shares 100
The following companies have the address of 8 Marina Boulevard, #27-01 Marina Bay Financial Centre Tower 1, 018981, Singapore
SCTS Capital Pte. Ltd Singapore SGD Ordinary shares 100
SCTS Management Pte. Ltd. Singapore SGD Ordinary shares 100
Standard Chartered (2000) Limited Singapore SGD1.00 Ordinary shares 100
Standard Chartered Bank (Singapore) Limited Singapore SGD Ordinary shares 100
SGD Preference shares 100
Standard Chartered Trust (Singapore) Limited Singapore SGD Ordinary shares 100
Standard Chartered Holdings (Singapore) Private Limited Singapore SGD Ordinary shares 100

FINANCIAL STATEMENTSNotes to the fi nancial statements
Standard Chartered
Annual Report 2017 296
40. Related undertakings of the Group continued
Subsidiary undertakings continued
Name and registered address
Country of
incorporation Description of shares
Proportion
of shares
held (%)
The following company has the address of Abogado Pte Ltd, No. 8 Marina Boulevard, #05-02 MBFC Tower 1, 018981, Singapore
Standard Chartered IL&FS Management (Singapore) Pte. Limited Singapore $1.00 Ordinary shares 50
The following company has the address of 9 Battery Road, #15-01 Straits Trading Building, 049910, Singapore
Standard Chartered Nominees (Singapore) Pte Ltd Singapore SGD1.00 Ordinary shares 100
The following company has the address of Marina Bay Financial Centre (Tower 1), 8 Marina Boulevard, #05-02, 018981, Singapore
Standard Chartered PF Managers Pte. Limited Singapore $1.00 Ordinary shares 100
The following companies have the address of Marina Bay Financial Centre (Tower 1), 8 Marina Boulevard, Level 23, 018981, Singapore
Standard Chartered Private Equity (Singapore) Pte. Ltd Singapore $ Ordinary shares 100
$ Redeemable Preference shares 100
Standard Chartered Private Equity Managers (Singapore) Pte. Ltd Singapore $ Ordinary shares 100
Standard Chartered Real Estate Investment (Singapore) I Private Limited Singapore SGD1.00 Ordinary shares 100
Standard Chartered Real Estate Investment (Singapore) II Private Limited Singapore SGD1.00 Ordinary shares 100
Standard Chartered Real Estate Investment (Singapore) III Private Limited Singapore SGD1.00 Ordinary shares 100
Standard Chartered Real Estate Investment (Singapore) IV Private Limited Singapore SGD1.00 Ordinary shares 100
Standard Chartered Real Estate Investment (Singapore) V Private Limited Singapore SGD1.00 Ordinary shares 100
Standard Chartered Real Estate Investment (Singapore) VI Private Limited Singapore SGD1.00 Ordinary shares 100
Standard Chartered Real Estate Investment (Singapore) VII Private Limited Singapore SGD1.00 Ordinary shares 100
Standard Chartered Real Estate Investment (Singapore) VIII Private Limited Singapore SGD1.00 Ordinary shares 100
Standard Chartered Real Estate Investment Holdings (Singapore) Private Limited Singapore SGD1.00 Ordinary shares 100
The following companies have the address of 5th Floor, 4 Sandown Valley Crescent, Sandton, Gauteng, 2196, South Africa
CMB Nominees Proprietary Limited South Africa ZAR1.00 Ordinary shares 100
Standard Chartered Nominees South Africa Proprietary Limited (RF) South Africa ZAR Ordinary shares 100
The following company has the address of 1, 2, 4, 7, 9, 10F, No. 168/170 &, 8F, 12F, no.168, Tun Hwa N. Rd., Songshan Dist., Taipei, 105, Taiwan
Standard Chartered Bank (Taiwan) Limited Taiwan TWD10.00 Ordinary shares 100
The following companies have the address of 1st Floor, International House, Shaaban Robert Street / Garden Avenue, PO Box 9011, Dar Es Salaam, Tanzania, United Republic of
Standard Chartered Bank Tanzania Limited Tanzania, United Republic of
TZS1,000.00 Ordinary shares 100
TZS1,000.00 Preference shares 100
Standard Chartered Tanzania Nominees Limited Tanzania, United Republic of TZS1,000.00 Ordinary shares 100
The following company has the address of 90 North Sathorn Road, Silom, Bangrak Bangkok , 10500, Thailand
Standard Chartered Bank (Thai) Public Company Limited Thailand THB10.00 Ordinary shares 99.9
The following company has the address of Buyukdere Cad. Yapi Kredi Plaza C Blok, Kat 15, Levent, Istanbul, 34330, Turkey
Standard Chartered Yatirim Bankasi Turk Anonim Sirketi Turkey TRL0.10 Ordinary shares 100
The following company has the address of Standard Chartered Bank, Bldg5 Speke Road, PO Box 7111, Kampala, Uganda
Standard Chartered Bank Uganda Limited Uganda UGS1,000.00 Ordinary shares 100

297
Ris
k re
vie
w a
nd
Cap
ital re
vie
wS
trate
gic
rep
ort
Su
pp
lem
en
tary
info
rmatio
nF
INA
NC
IAL
ST
AT
EM
EN
TS
Dire
cto
rs’ re
po
rt
40. Related undertakings of the Group continued
Subsidiary undertakings continued
Name and registered address
Country of
incorporation Description of shares
Proportion
of shares
held (%)
The following company has the address of 625 2nd Street, #102, San Francisco CA 94107, United States
SC Studios, LLC United States Membership Interest 100
The following company has the address of Standard Chartered Bank, 37F, 1095 Avenue of the Americas, New York, 10036, United States
Standard Chartered Bank International (Americas) Limited United States $1.00 Ordinary shares 100
The following companies have the address of Corporation Trust Centre, 1209 Orange Street, Wilmington, DE 19801, United States
Standard Chartered Holdings Inc. United States $100.00 Common shares 100
StanChart Securities International LLC United States Membership Interest 100
Standard Chartered Capital Management (Jersey), LLC United States Membership Interest 100
Standard Chartered Securities (North America) LLC United States Membership Interest 100
Standard Chartered International (USA) LLC United States Membership Interest 100
The following company has the address of 50 Fremont Street, San Francisco CA 94105, United States
Standard Chartered Overseas Investment, Inc. United States $10.00 Ordinary shares 100
The following company has the address of 1013 Centre Road, Wilmington, Delaware, USA
Standard Chartered Trade Services Corporation United States $0.01 Common shares 100
The following company has the address of Room 1810-1815, Level 18, Building 72, Keangnam Hanoi Landmark Tower, Pham Hung Road, Cau Giay New Urban Area, Me Tri Ward, Nam Tu Liem District, Hanoi10000, Vietnam
Standard Chartered Bank (Vietnam) Limited Vietnam VND Charter Capital shares 100
The following companies have the address of P.O.Box 438, Palm Grove House, Road Town, Tortola, Virgin Islands, British
California Rose Limited Virgin Islands, British $1.00 Ordinary shares 90.5
Earnest Range Limited Virgin Islands, British $1.00 Ordinary shares 90.5
The following companies have the address of Vistra Corporate Services Centre, Wickhams Cay II, Road Town, Tortola, VG1110, Virgin Islands, British
Sky Favour Investments Limited Virgin Islands, British $1.00 Ordinary shares 100
Sky Harmony Holdings Limited Virgin Islands, British $1.00 Ordinary shares 100
The following companies have the address of Standard Chartered House, Cairo Road, Lusaka, PO BOX 32238, Zambia
Standard Chartered Bank Zambia Plc Zambia ZMW0.25 Ordinary shares 90
Standard Chartered Zambia Securities Services Nominees Limited Zambia ZMK1.00 Ordinary shares 100
The following companies have the address of Africa Unitry Square Building, 68 Nelson Mandela Avenue, Harare, Zimbabwe
Standard Chartered Asset Management Limited Zimbabwe $0.001 Ordinary shares 100
Standard Chartered Bank Zimbabwe Limited Zimbabwe $1.00 Ordinary shares 100
Standard Chartered Nominees Zimbabwe (Private) Limited Zimbabwe $2.00 Ordinary shares 100
1 Directly held by parent company of the Group
2 The Group has determined that these undertakings are excluded from being consolidated into the Group’s accounts, and do not meet the defi nition of a Subsidiary under IFRS.
See notes 32 and 33 for the consolidation policy and disclosure of the undertaking
3 No share capital by virtue of being a trust

FINANCIAL STATEMENTSNotes to the fi nancial statements
Standard Chartered
Annual Report 2017 298
40. Related undertakings of the Group continued
Associates
Name
Country of
incorporation Description of shares
Proportion
of shares
held (%)
The following company has the address of Bohai Bank Building, No.218 Hai He Dong Lu, Hedong District, Tianjin, China, 300012, China
China Bohai Bank Co. Ltd China CNY Ordinary shares 19.9
The following company has the address of C/o CIM Corporate Services Ltd, Les Cascades, Edith Cavell Street, Port Louis, Mauritius
FAI Limited Mauritius $1.00 Ordinary shares 25
The following company has the address of Victoria House, State House Avenue, Victoria, MAHE, Seychelles
Seychelles International Mercantile Banking Corporation Limited Seychelles SCR1,000.00 Ordinary shares 22
The following company has the address of Marina Bay Financial Centre, 17-03, MBFC Tower 3, 12 Marina Boulevard, 018981, Singapore
Clifford Capital Pte. Ltd Singapore $1.00 Ordinary shares 9.9
Joint ventures
Name
Country of
incorporation Description of shares
Proportion
of shares
held (%)
The following company has the address of WTC II Building, Jalan Jenderal Sudirman Kav29-31, Jakarta, 12920’ Indonesia
PT Bank Permata Tbk Indonesia IDR125.00 B shares 44.6
The following companies have the address of 33-41 Lower Mount Street, Dublin 2, Ireland
Canas Leasing Limited Ireland $1 Ordinary shares 50
Elviria Leasing Limited Ireland $1 Ordinary shares 33.3
The following company has the address of 100/36 Sathorn Nakorn Tower, Fl 21 North Sathorn Road, Silom Sub-District, Bangrak District, Bangkok, 10500, Thailand
Resolution Alliance Limited Thailand THB10.00 Ordinary shares 49
Signifi cant investment holdings and other related undertakings
Name
Country of
incorporation Description of shares
Proportion
of shares
held (%)
The following company has the address of 65A Basinghall Street, London, EC2V 5DZ, United Kingdom
Cyber Defence Alliance Limited United Kingdom Membership interest 25
The following company has the address of Walker House, 87 Mary Street, George Town, KY1-9005, Cayman Islands
Asia Trading Holdings Limited Cayman Islands $0.01 Ordinary shares 50
The following company has the address of Intertrust Corporate Services (Cayman) Limited, 190 Elgin Avenue, George Town, Grand Cayman, KY1-9005, Cayman Islands
ATSC Cayman Holdco Limited Cayman Islands $0.01 A Ordinary shares 5.3
$0.01 B Ordinary shares 100
The following companies have the address of Harbour Centre #42 North Church Street, PO Box 1348, Grand Cayman, KY1-1108 Cayman Islands
Standard Chartered IL&FS Asia Infrastructure (Cayman) Limited Cayman Islands $0.01 Ordinary shares 50
Standard Chartered IL&FS Asia Infrastructure Growth Fund Company Limited
Cayman Islands$1.00 Ordinary shares 50
Standard Chartered IL&FS Asia Infrastructure Growth Fund, L.P. Cayman Islands Partnership interest 38.6
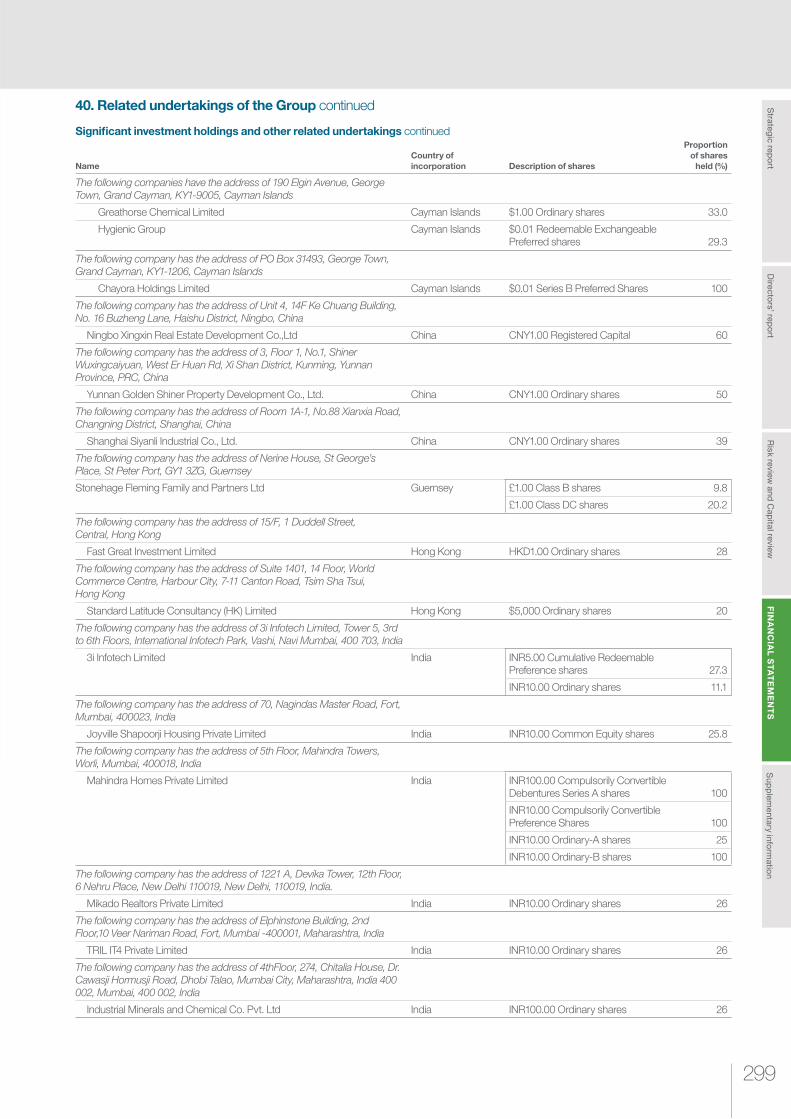
299
Ris
k re
vie
w a
nd
Cap
ital re
vie
wS
trate
gic
rep
ort
Su
pp
lem
en
tary
info
rmatio
nF
INA
NC
IAL
ST
AT
EM
EN
TS
Dire
cto
rs’ re
po
rt
40. Related undertakings of the Group continued
Signifi cant investment holdings and other related undertakings continued
Name
Country of
incorporation Description of shares
Proportion
of shares
held (%)
The following companies have the address of 190 Elgin Avenue, George Town, Grand Cayman, KY1-9005, Cayman Islands
Greathorse Chemical Limited Cayman Islands $1.00 Ordinary shares 33.0
Hygienic Group Cayman Islands $0.01 Redeemable Exchangeable Preferred shares 29.3
The following company has the address of PO Box 31493, George Town, Grand Cayman, KY1-1206, Cayman Islands
Chayora Holdings Limited Cayman Islands $0.01 Series B Preferred Shares 100
The following company has the address of Unit 4, 14F Ke Chuang Building, No. 16 Buzheng Lane, Haishu District, Ningbo, China
Ningbo Xingxin Real Estate Development Co.,Ltd China CNY1.00 Registered Capital 60
The following company has the address of 3, Floor 1, No.1, Shiner Wuxingcaiyuan, West Er Huan Rd, Xi Shan District, Kunming, Yunnan Province, PRC, China
Yunnan Golden Shiner Property Development Co., Ltd. China CNY1.00 Ordinary shares 50
The following company has the address of Room 1A-1, No.88 Xianxia Road, Changning District, Shanghai, China
Shanghai Siyanli Industrial Co., Ltd. China CNY1.00 Ordinary shares 39
The following company has the address of Nerine House, St George’s Place, St Peter Port, GY1 3ZG, Guernsey
Stonehage Fleming Family and Partners Ltd Guernsey £1.00 Class B shares 9.8
£1.00 Class DC shares 20.2
The following company has the address of 15/F, 1 Duddell Street, Central, Hong Kong
Fast Great Investment Limited Hong Kong HKD1.00 Ordinary shares 28
The following company has the address of Suite 1401, 14 Floor, World Commerce Centre, Harbour City, 7-11 Canton Road, Tsim Sha Tsui, Hong Kong
Standard Latitude Consultancy (HK) Limited Hong Kong $5,000 Ordinary shares 20
The following company has the address of 3i Infotech Limited, Tower 5, 3rd to 6th Floors, International Infotech Park, Vashi, Navi Mumbai, 400 703, India
3i Infotech Limited India INR5.00 Cumulative Redeemable Preference shares 27.3
INR10.00 Ordinary shares 11.1
The following company has the address of 70, Nagindas Master Road, Fort, Mumbai, 400023, India
Joyville Shapoorji Housing Private Limited India INR10.00 Common Equity shares 25.8
The following company has the address of 5th Floor, Mahindra Towers, Worli, Mumbai, 400018, India
Mahindra Homes Private Limited India INR100.00 Compulsorily Convertible Debentures Series A shares 100
INR10.00 Compulsorily Convertible Preference Shares 100
INR10.00 Ordinary-A shares 25
INR10.00 Ordinary-B shares 100
The following company has the address of 1221 A, Devika Tower, 12th Floor, 6 Nehru Place, New Delhi 110019, New Delhi, 110019, India.
Mikado Realtors Private Limited India INR10.00 Ordinary shares 26
The following company has the address of Elphinstone Building, 2nd Floor,10 Veer Nariman Road, Fort, Mumbai -400001, Maharashtra, India
TRIL IT4 Private Limited India INR10.00 Ordinary shares 26
The following company has the address of 4thFloor, 274, Chitalia House, Dr. Cawasji Hormusji Road, Dhobi Talao, Mumbai City, Maharashtra, India 400 002, Mumbai, 400 002, India
Industrial Minerals and Chemical Co. Pvt. Ltd India INR100.00 Ordinary shares 26

FINANCIAL STATEMENTSNotes to the fi nancial statements
Standard Chartered
Annual Report 2017 300
40. Related undertakings of the Group continued
Signifi cant investment holdings and other related undertakings continued
Name
Country of
incorporation Description of shares
Proportion
of shares
held (%)
The following company has the address of No. 1, Kanagam Village, 10th Floor IITM Research Park, , Taramani, Chennai – 600113, Tamil Nadu, India
IFMR Capital Finance Private Limited (IFMRC) India INR20.00 Compulsorily Convertible Preference shares 40.7
INR10.00 Equity shares 4.6
The following company has the address of Graha Paramita, 3rd Floor, Jalan Denpasar, Raya Block D-2, Kav. 8, Kuningan, Jakarta, 12940, Indonesia
PT Travira Air Indonesia IDR1,000,000.00 Ordinary shares 30
The following company has the address of Trio Building, 8th Floor, Jl, Kebon Sirih Raya Kav, 63, Jakarta 10340, Indonesia
PT Trikomsel Oke Tbk Indonesia IDR50.00 Series B shares 29.2
The following companies have the address of 4th Floor, St Pauls Gate, 22-24 New Street, St Helier, Jersey JE1 4TR, Jersey
Standard Jazeera Limited Jersey $100.00 Ordinary shares 20
Standard Topaz Limited Jersey $1,000.00 Ordinary shares 20.1
The following company has the address of 146-8 Chusa-ro Sinam-myeon, Yesan-gun Chungnam, Korea, Republic of
Daiyang Metal Company Ltd Korea, Republic of KRW 500 Common shares 23.1
KRW 500 Convertible Preference shares 100
The following company has the address of 6th Floor D Tower, 17, Jong-no 3 Gil, Jongno-Gu, Seoul, Korea, Republic of
Fountain Valley PFV Limited Korea, Republic of KRW5,000.00 Ordinary shares 47.3
The following company has the address of 17th Floor, 100, Gongpyeong-dong, Jongno-gu, Seoul, Korea, Republic of
SCPEK IV Korea, Republic of Limited Partnership Interest 41.4
The following company has the address of 17F (Gongpyung-dong), 47, Jongno, Jongno-gu, Seoul, Korea, Republic of
Standard Chartered Private Equity Korea III Korea, Republic of KRW1,000,000.00 Ordinary shares 31
The following company has the address of 14th Fl Sewoo Bldg, 115 Yeouigongwon-ro, Yeongdeungpo-gu, Seoul 07241, 07241, Korea, Republic of
Lotus PFV Co. Ltd Korea, Republic of KRW5,000.00 Ordinary shares 50
The following company has the address of Lot 6.05, Level 6, KPMG Tower, 8 First Avenue, Bandar Utama, 47800 Petaling Jaya, Selangor, Malaysia
House Network SDN BHD Malaysia RM1.00 Ordinary shares 25
The following company has the address of Area 5, Iperin Gate, Optic Industrial Estate, Agbara, Ogun State, Nigeria
GZ Industries Limited Nigeria NGN1.00 Ordinary shares 11.2
$1.00 Redeemable Preference shares 75.1
The following company has the address of 168 Robinson Road, #33-01 Capital Tower, 068912, Singapore
Standard Chartered IL&FS Asia Infrastructure Growth Fund Company Pte. Limited
Singapore $1.00 Ordinary shares 100
$0.01 Redeemable Preference shares 83.6
The following company has the address of 1 Venture Avenue, #07-07 Big Box, 608521, Singapore
Omni Centre Pte. Ltd. Singapore $ Redeemable Convertible Preference shares 100
The following company has the address of 180B Bencoolen Street, #11-00 The Bencoolen, 189648, Singapore
Crystal Jade Group Holdings Pte Ltd Singapore $1.00 Ordinary shares 42.6
The following company has the address of Blk 10, Kaki Bukit Avenue 1, #07-05 Kaki Bukitr Industrial Estate, 417492, Singapore
MMI Technoventures Pte Ltd Singapore SGD Ordinary shares 50
SGD 0.01 Redeemable Preference shares 50

301
Ris
k re
vie
w a
nd
Cap
ital re
vie
wS
trate
gic
rep
ort
Su
pp
lem
en
tary
info
rmatio
nF
INA
NC
IAL
ST
AT
EM
EN
TS
Dire
cto
rs’ re
po
rt
40. Related undertakings of the Group continued
Signifi cant investment holdings and other related undertakings continued
Name
Country of
incorporation Description of shares
Proportion
of shares
held (%)
The following company has the address of 80 Raffl es Place, #32-01, UOB Plaza 1, 048624, Singapore
THSC Investments Pte. Ltd. Singapore SGD0.50 Ordinary Shares 33.3
The following company has the address of 80 Robinson Road, #02-00, 068898, Singapore
Maxpower Group Pte Ltd Singapore Redeemable Preference shares 100
The following company has the address of 81 Ubi Avenue 4, #03-11 UB One, 408830, Singapore
Polaris Limited Singapore SGD Ordinary shares 25.8
The following company has the address of EADB Building, Plot 4 Nile Avenue, PO Box 7128, Kampala, Uganda
East African Development Bank Uganda $13,500.00 Class B shares 24.5
The following company has the address of 251 Little Falls Drive, Wilmington, New Castle DE 19808, United States
Paxata, Inc. United States $0.0001 Series C2 Preferred Stock 40.7
The following company has the address of Floor 7, Samco Building, No. 326 Vo Van Kiet, Co Giang Ward, District 1, Ho Chi Minh City, Vietnam
New Lifestyle Service Corporation Vietnam VND Dividend Preference shares 100
VND Redeemable Preference shares 100
The following company has the address of Floor M, Petroland Building, 12 Tan Trao, Tan Phu Ward, District 7, Ho Chi Minh City
Online Mobile Services Joint Stock Company Vietnam Class A1 Redeemable Preference shares 100
Class A1 Dividend Preference shares 100
The following company has the address of PO Box 957, Offshore Incorporations Centre, Road Town, Tortola, BVI, Virgin Islands, British
Ecoplast Technologies Inc Virgin Islands, British $0.0001 Class C Preferred shares 100
In liquidation
Subsidiary undertakings
Name
Country of
incorporation Description of shares
Proportion
of shares
held (%)
The following companies have the address of Deloitte LLP, Hill House, 1 Little New Street, London, EC4A 3TR, United Kingdom
Chartered Financial Holdings Limited United Kingdom £5.00 Ordinary shares 100
£1.00 Preference shares 100
Standard Chartered Capital Markets Limited United Kingdom £1.00 Ordinary shares 100
$1.00 Ordinary shares 100
Standard Chartered (CT) Limited United Kingdom £1.00 Ordinary shares 100
Standard Chartered Corporate Finance (Canada) Limited United Kingdom £1.00 Ordinary shares 100
Standard Chartered Corporate Finance (Eurasia) Limited United Kingdom £1.00 Ordinary shares 100
Standard Chartered Equitor Limited United Kingdom £1.00 Ordinary shares 100
Standard Chartered Financial Investments Limited United Kingdom £1.00 Ordinary A Shares 100
Standard Chartered Portfolio Trading (UK) Limited United Kingdom £1.00 Ordinary shares 100
Standard Chartered Receivables (UK) Limited United Kingdom $1.00 Ordinary shares 100
Compass Estates Limited United Kingdom £1.00 Ordinary shares 100
The following company has the address of 648-07 room, Building 2, Shanghai Zhangjiang High-tech Park, 351 Guo shoujing road, Shanghai, 201203, China
SCL Consulting (Shanghai) Co. Ltd China $ Ordinary shares 100
The following company has the address of Cra 7 Nro 71-52 TA if 702, Bogata, Colombia
Sociedad Fiduciaria Extebandes S.A. Colombia COP1.00 Ordinary shares 100

FINANCIAL STATEMENTSNotes to the fi nancial statements
Standard Chartered
Annual Report 2017 302
40. Related undertakings of the Group continued
In liquidation continued
Subsidiary undertakings continued
Name
Country of
incorporation Description of shares
Proportion
of shares
held (%)
The following companies have the address of Schottegatweg Oost, 44, Curacao, Netherlands Antilles
American Express International Finance Corp.N.V. Curaçao $1,000.00 Ordinary shares 100
Ricanex Participations N.V. Curaçao $1,000.00 Ordinary shares 100
The following company has the address of 8/F Eurotrade Centre, 21-23 Des Voeux Road Central, Hong Kong
GE Capital (Hong Kong) Limited Hong Kong HKD10.00 Ordinary shares 100
The following company has the address of 8th Floor, Gloucester Tower, The Landmark, 15 Queen’s Road Central, Hong Kong
Leopard Hong Kong Limited Hong Kong $ Ordinary shares 100
The following company has the address of Standard Chartered@Chiromo, Number 48, Westlands Road, P. O. Box 30003 – 00100, Nairobi, Kenya
Standard Chartered Management Services Limited Kenya KES20.00 Ordinary shares 100
The following company has the address of 26 Boulevard royal, 2449, Luxembourg
Standard Chartered Financial Services (Luxembourg) S.A. Luxembourg €25.00 Ordinary shares 100
The following company has the address of A Martins & Associados Advogados - Sociedade Unipessoal Lda, Av. Vladimir Lenine, 174, 4º andar, Edifício Millennium Park, Caixa Postal 796, Maputo, Mozambique
Standard Chartered Bank Mozambique, S.A. Mozambique $1.00 Ordinary shares 100
The following company has the address of 380 Canaval y Moreyra, Lima 27, Peru
Banco Standard Chartered en Liquidacion Peru $75.133 Ordinary shares 100
The following companies have the address of 8 Marina Boulevard, #27-01 Marina Bay Financial Centre Tower 1, 018981, Singapore
Standard Chartered Investments (Singapore) Private Limited Singapore $ Ordinary shares 100
Prime Financial Holdings Limited Singapore SGD Ordinary shares 100
$ Ordinary shares 100
The following company has the address of 10 Collyer Quay, #10-01, Ocean Financial Centre, 049315, Singapore
Standard Chartered Securities (Singapore) Pte. Limited Singapore SGD Ordinary shares 100
The following company has the address of Quai du General Guisan 38, 8022, Zurich, Switzerland
Standard Chartered Bank (Switzerland) S.A. Switzerland CHF1,000.00 Ordinary shares 100
CHF100.00 Participation Capital shares 100
The following company has the address of 6th Floor, Hewlett Packard Building, 337 Fu Hsing North Road, Taipei, Taiwan
Kwang Hua Mocatta Ltd. (Taiwan) Taiwan TWD1,000.00 Ordinary shares 100
The following company has the address of 100/3, Sathorn Nakorn Tower, 3rd Floor, North Sathorn Road, Silom, Bangrak, Bangkok, 10500, Thailand
Thai Exclusive Leasing Company Limited Thailand THB10.00 Ordinary shares 100
Standard Chartered (Thailand) Company Limited Thailand THB10.00 Ordinary shares 100
The following company has the address of Luis Alberto de Herrera 1248, Torre II, Piso 11, Esc. 1111, Uruguay
Standard Chartered Uruguay Representacion S.A. Uruguay UYU1.00 Ordinary shares 100

303
Ris
k re
vie
w a
nd
Cap
ital re
vie
wS
trate
gic
rep
ort
Su
pp
lem
en
tary
info
rmatio
nF
INA
NC
IAL
ST
AT
EM
EN
TS
Dire
cto
rs’ re
po
rt
40. Related undertakings of the Group continued
Associates
Name
Country of
incorporation Description of shares
Proportion
of shares
held (%)
The following company has the address of Quadrant House, 4 Thomas More Square, London, E1W 1YW, United Kingdom
MCashback Limited United Kingdom £0.01 Ordinary shares 31.7
Liquidated/dissolved/sold
Subsidiary undertakings
Name
Country of
incorporation Description of shares
Proportion
of shares
held (%)
Marina Jessamine Shipping Limited Marshall Islands $1.00 Ordinary shares 100
Inishmullen Leasing Limited Ireland $1.00 Ordinary shares 100
Inishroe Leasing Limited Ireland $1.00 Ordinary shares 100
Pembroke Funding BV Netherlands €100.00 Ordinary shares 100
Pembroke Thai Aircraft ll B.V. Netherlands €100.00 Ordinary shares 100
SC2 Investments (Singapore) Private Limited Singapore SGD Ordinary shares 100
Standard Chartered (1996) Limited Singapore SGD Ordinary shares 100
Price Solutions Singapore Pte. Ltd. Singapore SGD Ordinary shares 100
New Group Investments Limited Virgin Islands, British $1.00 Ordinary shares 100
Signifi cant investment holdings and other related undertakings
Name
Country of
incorporation Description of shares
Proportion
of shares
held (%)
Kamoso Distribution (Proprietary) Limited (previously named Spark Capital (Proprietary) Limited) Botswana BWP Ordinary shares 49.9
Abacus Eight Limited Cayman Islands A Shares 24.5
Abacus Nine Limited Cayman Islands A Shares 24.5
Abacus Seven Limited Cayman Islands A Shares 24.5
Abacus Ten Limited Cayman Islands A Shares 31.2
Etonkids Educational Group Limited Cayman Islands $0.001 Series A Preferred Shares 100
$0.001 Series A-1 Preferred Shares 100
BCC Launchpad, L.P. Cayman Islands Partnership Interest 49
Shui Li Realty (Shanghai) Limited China Registered Capital 45
Inox India Limited India Compulsorily Convertible Preference Shares 100
Equity Shares 4.6
Guangdong Aiyingdao Children Departmental Store Co. Ltd China CNY1.00 Common shares 20.2
Jin Li Realty (Shanghai) Co., Ltd. China Registered Capital 48.6
Smoothie King Holdings, Inc. Korea, Republic of KRW5,000.00 Ordinary shares 20.3
KRW5,000.00 Redeemable Convertible Preference shares 58

FINANCIAL STATEMENTSNotes to the fi nancial statements
Standard Chartered
Annual Report 2017 304
41. IFRS 9 Financial Instruments
We estimate that the changes in measurement arising on the initial adoption of IFRS 9 results in a decrease in shareholders’ equity of approximately $1.1 billion, net of tax, at 1 January 2018 (Company: approximately $7 million). This will result in an increase in the Group’s loan impairment provisions from $5.7 billion under IAS 39 to approximately $6.7 billion ($0.2 billion of which is held in other liabilities against undrawn commitments and fi nancial guarantees) and an estimated gain of $35 million from changes in the classifi cation and measurement of assets and liabilities under IFRS 9. The impact on regulatory capital is set out in the Risk review and Capital review (page 184).
The Group continues to refi ne its expected credit loss models and embed its operational processes which may change the actual impact on adoption.
The estimated impact of the remeasurement and reclassifi cations and the impact of the changes to the recognition and measurement of credit impairment loss allowances, net of the related tax impacts, is set out by category of reserve in the table below.
Share
capital
and
share
premium
account
$million
Capital
and
merger
reserves
$million
Own credit
adjustment
reserve
$million
Available-
for-sale
reserve
$million
Fair value
through
OCI
reserve
$million
Cash fl ow
hedge
reserve
$million
Translation
reserve
$million
Retained
earnings
$million
Parent
company
shareholders’
equity
$million
Other
equity
instruments
$million
Non-
controlling
interests
$million
Total
$million
As at 31 December 2017 7,097 17,129 54 83 – (45) (4,454) 26,641 46,505 4,961 341 51,807
Net impact of: – – – (83) (82) – – 200 35 – – 35
IFRS 9 reclassifi cations – – – (83) (86) – – 169 – – – –
IFRS 9 re-measurements – – – – 4 – – 31 35 – – 35
Expected credit loss, net – – – – 65 – – (1,296) (1,231) – (8) (1,239)
Tax impact – – – – (6) – – 182 176 – – 176
Impact of IFRS 9 on share of joint ventures and associates, net of tax – – – – (1) – – (51) (52) – – (52)
Estimated IFRS 9 transition adjustments – – – (83) (24) – – (965) (1,072) – (8) (1,080)
As at 1 January 2018 7,097 17,129 54 – (24) (45) (4,454) 25,676 45,433 4,961 333 50,727
The Group will publish an IFRS 9 transition report prior to the issuance of the fi rst quarter 2018 Interim Management Statement. This transition report will be unaudited and provide more extensive disclosures to explain the opening IFRS 9 adjustments and to provide a bridge from IAS 39 to IFRS 9. In particular it will include further details in respect of:
Quantitative information to reconcile impairment provisions, key risk metrics and the classifi cation and measurement of fi nancial instruments under IAS 39 to those under IFRS 9
The effect of IFRS 9 on signifi cant accounting policies, credit risk policies and practices and related governance processes
Explanation of the inputs, assumptions and estimation techniques used in determining expected credit losses and the key judgements made in applying IFRS 9
Qualitative information regarding volatility and areas of measurement uncertainty
Supplementary quantitative information on credit risk and classifi cation and measurement of fi nancial instruments in IFRS 9 terms, including stage distribution and an analysis of credit quality and expected credit loss allowances coverage by stage and segment for the loan portfolio
Classifi cation and measurement of fi nancial instruments
IAS 39There are four asset classifi cations under IAS 39: fair value through profi t or loss (FVTPL), incorporating trading and instruments designated at FVTPL; loans and receivables; held to maturity; and available-for-sale. The classifi cation of assets into these categories was determined based on a mix of management intent and product characteristics. Only the available-for-sale category has no restrictions on classifi cation.
In respect of hybrid fi nancial assets, the embedded derivative component may be separated and measured at fair value, unless closely related to the host contract. If this is not possible, the entire instrument must be designated at FVTPL.
Other instruments may be designated at FVTPL if they are managed on a fair value basis, or where the designation would eliminate or signifi cantly reduce an accounting mismatch.
305
Ris
k re
vie
w a
nd
Cap
ital re
vie
wS
trate
gic
rep
ort
Su
pp
lem
en
tary
info
rmatio
nF
INA
NC
IAL
ST
AT
EM
EN
TS
Dire
cto
rs’ re
po
rt
41. IFRS 9 Financial Instruments continued
Classifi cation and measurement of fi nancial instruments continued
IFRS 9There are three measurement classifi cations under IFRS 9: amortised cost, fair value through profi t or loss (FVTPL) and, for fi nancial assets, fair value through other comprehensive income (FVOCI). The existing IAS 39 fi nancial asset categories are removed.
Financial assets are classifi ed into these categories based on the business model within which they are held, and their contractual cash fl ow characteristics.
The business model refl ects how groups of fi nancial assets are managed to achieve a particular business objective. Financial assets can only be held at amortised cost if the instruments are held in order to collect the contractual cash fl ows (‘hold to collect’), and where those contractual cash fl ows are solely payments of principal and interest (SPPI). Principal represents the fair value of the instrument at the time of initial recognition.
Interest in this context represents compensation for the time value of money and associated credit risks together with compensation for other risks and costs consistent with a basic lending arrangement and a profi t margin. This requires an assessment at initial recognition of the contractual terms to determine whether it contains a term that could change the timing or amount of cash fl ows in a way that is inconsistent with the SPPI criteria.
Assets may be sold out of ‘hold to collect’ portfolios where there is an increase in credit risk. Disposals for other reasons are permitted but such sales should be insignifi cant in value or infrequent in nature.
Financial asset debt instruments where the business model objectives are achieved by collecting the contractual cash fl ows and by selling the assets (‘hold to collect and sell’) and that have SPPI cash fl ows are held at FVOCI, with unrealised gains or losses deferred in reserves until the asset is derecognised. In certain circumstances, non-trading equity instruments can be irrevocably designated as FVOCI but both unrealised and realised gains or losses are recognised in reserves and no amounts other than dividends received are recognised in the income statement.
All other fi nancial assets will mandatorily be held at FVTPL.
Financial assets may be designated at FVTPL only if doing so eliminates or reduces an accounting mismatch.
There has been no change to the requirements in respect of the classifi cation and measurement of fi nancial liabilities. The Group adopted the changes related to the presentation of fair value changes on own credit in its 2016 fi nancial statements.
The derecognition requirements have also been carried forward unchanged from IAS 39.
Where the contractual terms of fi nancial assets are modifi ed, and that modifi cation does not result in derecognition, a modifi cation gain or loss is recognised in the income statement and the gross carrying amount of the asset adjusted accordingly.
Transition impact
The Group has assessed the business models that it operates across the Group. In its assessment, the Group considered the objectives of the business model, how performance is measured and how staff are remunerated amongst other factors.
Where the objective of a business is to manage fi nancial assets on a fair value basis, the instruments within that business model are measured at FVTPL. This includes the Group’s trading portfolios.
Most of the Group’s loans to banks and customers are held within a ‘hold to collect’ business model.
Investment debt securities held with Treasury Markets are held within a ‘hold to collect and sell’ portfolio. The majority of the remaining investment debt securities are held within a ‘hold to collect’ business model.
For ‘hold to collect’ portfolios, the level of sales and the reason for those sales is also monitored to ensure they are consistent with the characteristics of a ‘hold to collect’ business model.
Instruments that do not meet the SPPI criteria are measured at FVTPL regardless of the business model in which they are held. Other than hybrid fi nancial assets, this primarily arises from prepayment clauses. While prepayment clauses are common across the Group’s loan portfolio, prepayment penalties are not considered to meet the SPPI criteria if the prepayment penalty received by the bank is not considered to be reasonable compensation from an IFRS 9 perspective for early termination of the contract. This has impacted a small number of products in Retail Banking and a small number of contracts within the Corporate Finance/Corporate Lending portfolios.
Non-trading equity investments are measured at FVTPL except for a small portfolio of strategic equity investments which are irrevocably designated at FVOCI.
Assets designated at FVTPL under IAS 39 that are not as a result of an accounting mismatch have been de-designated and mandatorily classifi ed as FVTPL either because they are managed on a fair value basis or cash fl ows are maximised through sale or part of a broader trading business or are hybrid fi nancial assets. There is no impact on the measurement of these instruments. The Group has also elected on initial implementation of IFRS 9 to designate certain fi nancial assets and fi nancial liabilities at FVTPL in order to reduce or eliminate accounting mismatches:
Loans and advances to customers, to reduce the impact of associated credit derivatives; and
Sales and repurchase liabilities, where the related fi nancial assets are now required to be accounted for at FVTPL

FINANCIAL STATEMENTSNotes to the fi nancial statements
Standard Chartered
Annual Report 2017 306
41. IFRS 9 Financial Instruments continued
Transition impact continued
ImpactThe estimated impact on retained earnings and reserves as a result of reclassifi cation and re-measurement of fi nancial assets and liabilities is approximately $35 million.
The amounts previously reported as part of the available-for-sale reserve have been reclassifi ed either to the fair value through OCI reserve or to retained earnings.
Impairment of fi nancial assets not held at FVTPL
IAS 39For debt instruments held at amortised cost or available-for-sale, specifi c loss allowances are only recognised where there is objective evidence of impairment as a result of one or more loss events occurring after the initial recognition of the instrument. This includes losses arising from credit related modifi cations to the contractual terms (such as forbearance).
For debt instruments held at amortised cost, where losses are known, by experience, to have been incurred but have not been separately identifi ed, a portfolio impairment provision (PIP) is recognised. The calculation of PIP is based on regulatory expected loss models, after adjustments made to align the calculation with IFRS, together with adjustments to take into account factors not adequately covered in the underlying models.
A PIP is not, however, recognised for available-for-sale instruments. Impairment loss allowances are also not recognised for loan commitments and fi nancial guarantees.
Where there is objective evidence of impairment for available-for-sale debt instruments, the entire unrealised loss held in reserves is transferred to the income statement and recognised as impairment.
For equity shares classifi ed as available-for-sale, a signifi cant or prolonged decline in the fair value below its cost is considered, among other factors, in assessing objective evidence of impairment. On impairment, the entire unrealised loss held in reserves is transferred to the income statement and recognised as impairment.
See note 8 for further details on the IAS 39 accounting policy.
IFRS 9A summary of the Group’s approach to determining ECL is set out within note 40 to the 2016 Annual Report and Accounts. The Group primarily uses sophisticated models that utilise the probability of default (PD), loss given default (LGD) and exposure at default (EAD) metrics, discounted using the effective interest rate. For lower value, less complex portfolios in Retail Banking, the Group uses roll rate or loss rate models.
Expected credit losses are recognised for all fi nancial debt instruments, loan commitments and fi nancial guarantees that are classifi ed as ‘hold to collect’/‘hold to collect and sell’ and have cash fl ows that are solely payments of principal and interest. Expected credit losses are not recognised for equity instruments designated at FVOCI.
An ECL allowance is recognised at the time of initial recognition for all fi nancial instruments that are in the scope of ECL in respect of default events that may occur over the next 12 months (so-called ‘stage 1 assets’ with allowances equivalent to 12-months expected credit losses). ECL continues to be determined on this basis until there is either a signifi cant increase in credit risk (SICR) or the asset becomes credit impaired.
If a fi nancial asset (or portfolio of fi nancial assets) experiences an SICR since initial recognition, an ECL allowance is recognised for default events that may occur over the lifetime of the asset (so-called ‘stage 2 assets’ with loss allowances equivalent to lifetime expected credit losses). SICR is assessed in the context of an increase in the risk of a default occurring over the remaining life of the fi nancial instrument when compared with that expected at the time of initial recognition for the same period. It is not assessed in the context of an increase in the expected credit loss.
The Group uses a number of qualitative and quantitative measures in assessing SICR. Quantitative measures relate to the relative and absolute changes in the lifetime PD compared with those expected at initial recognition. Qualitative factors include placement of loans on non-purely precautionary early alert, classifi cation as higher risk (CG 12) or where principal and/or interest payments are 30 days or more past due.
An asset is only considered credit impaired, and lifetime expected credit losses recognised, if there is observed objective evidence of impairment. These factors are similar to the indicators of objective evidence of impairment under IAS 39. This includes, amongst other factors, assets in default, experiencing signifi cant fi nancial diffi culty or subject to forbearance actions credit-impaired (so-called ‘stage 3 assets’).
The defi nition of default is aligned to the regulatory defi nition within CRR Article 178 and considered to occur when an asset is 90 days or more past due on contractual payments of principal and/or interest or is considered unlikely to pay without realisation of any collateral held.
To the extent that assets are credit-impaired at the point of initial recognition, they are classifi ed as purchased or originated credit-impaired. An expected credit loss allowance is not recognised at initial recognition. Any changes in lifetime expected losses after initial recognition are charged or credited to the income statement through ‘Impairment’.
The measurement of expected credit losses across all stages is required to refl ect an unbiased and probability weighted amount that is determined by evaluating a range of reasonably possible outcomes using reasonable and supportable information about past events, current conditions and forecasts of future economic conditions.
To account for the potential non-linearity in credit losses, multiple forward-looking scenarios are incorporated into the range of reasonably possible outcomes for all material portfolios. The Group uses a Monte Carlo approach to simulate a set of 50 scenarios around the Group’s central forecast to incorporate the potential non-linearity.
The period considered when measuring expected credit loss is the shorter of the expected life and the contractual term of the fi nancial asset.

307
Ris
k re
vie
w a
nd
Cap
ital re
vie
wS
trate
gic
rep
ort
Su
pp
lem
en
tary
info
rmatio
nF
INA
NC
IAL
ST
AT
EM
EN
TS
Dire
cto
rs’ re
po
rt
41. IFRS 9 Financial Instruments continued
Impairment of fi nancial assets not held at FVTPL continued
The expected life may be impacted by prepayments and the maximum contractual term by extension options. For certain revolving portfolios, including credit cards, the expected life is assessed over the period that the Group is exposed to credit risk (which is based on the length of time it takes for credit facilities to be withdrawn) rather than the contractual term.
For stage 3 fi nancial assets, the determination of lifetime expected credit losses will be similar to the IAS 39 approach; for example, loan loss allowances within Corporate & Institutional Banking will be based on the present value of estimated future cash fl ows for individual clients. The estimated cash fl ows will, however, be based on a probability range of scenarios. Where the cash fl ows include realisable collateral, the values used will incorporate forward-looking information.
Where the contractual terms of a fi nancial asset have been modifi ed due to fi nancial diffi culties (forbearance, for example) and the asset has not been derecognised, a modifi cation loss is recognised as part of ‘Impairment’ in the income statement. The loss represents the difference between the present value of the cash fl ows before and after the modifi cation, discounted at the original effective interest rate. Unlike IAS 39, however, no loss allowance is recorded in the balance sheet, as the modifi cation loss is offset against the gross carrying amount of the asset. Modifi cations for other reasons are accounted for in a similar way, except the modifi cation gain or loss will be reported as part of income.
For assets measured at amortised cost, the balance sheet amount refl ects the gross asset less the allowance for ECL.
For debt instruments held at FVOCI, the balance sheet amount refl ects the instrument’s fair value, with the expected credit loss allowance held as a separate reserve within other comprehensive income.
ECL allowances on off-balance sheet instruments are held as liability provisions to the extent that the drawn and undrawn components of loan exposures can be separately identifi ed. Otherwise they will be reported against the drawn component.
ImpactThe estimated initial adoption of the ECL approach would reduce retained earnings and reserves by approximately $1.2 billion.
Approximately $1 billion of this estimate related to loans and advances to banks and customers and approximately $0.2 billion to undrawn commitments and fi nancial guarantees (which have been recognised in other liabilities) and $65 million has been recognised in respect of debt securities, which has been offset through a credit to the FVOCI reserve.
The portfolios and products most impacted by the increase in loan loss allowances are Corporate Finance and Lending portfolios, due to the relatively longer maturity profi le, and unsecured products in Retail Banking.
Tax
Tax of $176 million has been credited to reserves as a result of transition to IFRS 9. Of this, deferred tax of $142 million has been credited to retained earnings, and is provided on additional deductible temporary differences that have arisen from loss provisions due to initial adoption of the ECL approach.