Embed Size (px)
Citation preview

Financial Statements and Federal Single Audit
Report
King County
For the period January 1, 2019 through December 31, 2019
Published December 21, 2020
Report No. 1027490

Insurance Building, P.O. Box 40021 Olympia, Washington 98504-0021 (564) 999-0950 [email protected]
Office of the Washington State Auditor
Pat McCarthy
December 21, 2020
Council and Executive
King County
Seattle, Washington
Report on Financial Statements and Federal Single Audit
Please find attached our report on King County’s financial statements and compliance with federal
laws and regulations.
We are issuing this report in order to provide information on the County’s financial condition.
Sincerely,
Pat McCarthy
State Auditor
Olympia, WA
Americans with Disabilities
In accordance with the Americans with Disabilities Act, we will make this document available in
alternative formats. For more information, please contact our Office at (564) 999-0950, TDD
Relay at (800) 833-6388, or email our webmaster at [email protected].

Office of the Washington State Auditor
TABLE OF CONTENTS
Schedule of Findings and Questioned Costs ................................................................................... 4
Schedule of Audit Findings and Responses .................................................................................... 7
Schedule of Federal Award Findings and Questioned Costs ........................................................ 10
Summary Schedule of Prior Audit Findings .................................................................................. 15
Independent Auditor's Report on Internal Control Over Financial Reporting and on Compliance
and Other Matters Based on an Audit of Financial Statements Performed in Accordance with
Government Auditing Standards................................................................................................... 18
Independent Auditor's Report on Compliance for Each Major Federal Program and Report on
Internal Control Over Compliance in Accordance With the Uniform Guidance ......................... 21
Independent Auditor's Report on Financial Statements ................................................................ 25
Financial Section ........................................................................................................................... 29
Corrective Action Plan for Findings Reported Under Uniform Guidance ................................... 31
About the State Auditor's Office ................................................................................................... 33
Page 3

Office of the Washington State Auditor
SCHEDULE OF FINDINGS AND QUESTIONED COSTS
King County
January 1, 2019 through December 31, 2019
SECTION I – SUMMARY OF AUDITOR’S RESULTS
The results of our audit of King County are summarized below in accordance with
Title 2 U.S. Code of Federal Regulations (CFR) Part 200, Uniform Administrative
Requirements, Cost Principles, and Audit Requirements for Federal Awards
(Uniform Guidance).
Financial Statements
We issued an unmodified opinion on the fair presentation of the financial
statements of the governmental activities, the business-type activities, each major
fund, the aggregate remaining fund information and the aggregate discretely
presented component units in accordance with accounting principles generally
accepted in the United States of America (GAAP).
Internal Control over Financial Reporting:
Significant Deficiencies: We identified deficiencies in the design or operation
of internal control over financial reporting that we consider to be significant
deficiencies.
Material Weaknesses: We identified no deficiencies that we consider to be
material weaknesses.
We noted no instances of noncompliance that were material to the financial
statements of the County.
Federal Awards
Internal Control over Major Programs:
Significant Deficiencies: We identified deficiencies in the design or operation
of internal control over major federal programs that we consider to be
significant deficiencies.
Page 4

Office of the Washington State Auditor
Material Weaknesses: We identified no deficiencies that we consider to be
material weaknesses.
We issued an unmodified opinion on the County’s compliance with requirements
applicable to each of its major federal programs.
We reported a finding that is required to be disclosed in accordance with 2 CFR
200.516(a).
Identification of Major Federal Programs
The following programs were selected as major programs in our audit of
compliance in accordance with the Uniform Guidance.
CFDA No. Program or Cluster Title
14.239 Home Investment Partnerships Program
14.267 Continuum of Care Program
20.500 Federal Transit Cluster – Federal Transit Capital Investment
Grants
20.507 Federal Transit Cluster – Federal Transit Formula Grants
20.525 Federal Transit Cluster – State of Good Repair Grants Program
20.526 Federal Transit Cluster – Buses and Bus Facilities Formula,
Competitive, and Low or No Emissions Programs
66.123 Puget Sound Action Agenda: Technical Investigations and
Implementation Assistance Program
93.778 Medicaid Cluster – Medical Assistance Program
93.914 HIV Emergency Relief Project Grants
97.067 Homeland Security Grant Program
97.075 Rail and Transit Security Grant Program
The dollar threshold used to distinguish between Type A and Type B programs,
as prescribed by the Uniform Guidance, was $3,000,000.
The County did not qualify as a low-risk auditee under the Uniform Guidance.
SECTION II – FINANCIAL STATEMENT FINDINGS
See Finding 2019-001.
Page 5

Office of the Washington State Auditor
SECTION III – FEDERAL AWARD FINDINGS AND
QUESTIONED COSTS
See Finding 2019-002.
Page 6

Office of the Washington State Auditor
SCHEDULE OF AUDIT FINDINGS AND RESPONSES
King County
January 1, 2019 through December 31, 2019
2019-001 The County did not report the External Investment Pool as
a separate column on the Fiduciary Statements in
accordance with governmental accounting standards.
Background
County councilmembers, state and federal agencies, and the public rely on
the information included in the financial statements and report to make
decisions. County management is responsible for designing and following
internal controls that provide reasonable assurance regarding the reliability
of financial reporting. Our audit identified a significant deficiency in
internal controls over financial reporting that affected the County’s ability
to produce accurate financial statements.
The County is the ex-officio treasurer for special-purpose districts in King
County and invests funds of special-purpose districts in the County’s
Investment Pool Fund. Custodial Funds are used to report cash received
and disbursed in the County’s capacity as ex-officio treasurer or collection
agent for special districts and other governments and investment activity
conducted by King County on behalf of legally separate entities. The
County uses Investment Funds to report investment activity engaged in on
behalf of legally separate entities.
Description of Condition
The County implemented Governmental Accounting Standards Board
(GASB) Statement No. 84, Fiduciary Activities during fiscal year 2019.
GASB 84 requires the external portion of investment pools that are not held
in a trust to be reported in a separate external investment pool fund column,
under the custodial funds classification. The County reported the external
investment pool under the custodial fund column and not as a separate
column.
The County receipted cash received in the County’s capacity as ex-officio
treasurer in a Custodial Fund and then transferred the cash to the
Investment Pool. The County reported this as an addition in the Investment
Pool but did not show the corresponding deduction in the Custodial Fund.
Similarly, the County transferred cash from the investment pool to the
Page 7

Office of the Washington State Auditor
Custodial Fund when a special-purpose District requested a disbursement.
The County reported this as a deduction in the Investment Pool but did not
show the corresponding addition to the Custodial Fund.
Cause of Condition
Although the County dedicated time and resources to research and
implement the new GASB statement, it misinterpreted the accounting
standard and applicable accounting treatment for these items.
Effect of Condition
The County did not report Investment Pool assets of $3.9 billion, additions
of $9.6 billion, and deductions of $9.8 billion as a separate column on the
Fiduciary Funds statements. Additionally, the County reported pool
participant contributions and deductions of $9.5 billion and $9.8 billion in
the Investment Pool Custodial Fund but did not report the corresponding
additions and deductions in the Custodial Funds. The County corrected
this on the final version of the financial statements.
Recommendation
We recommend the County strengthen internal controls to ensure it has
considered all relevant information regarding implementation of complex
new GASB standards.
County’s Response
The County thanks the Washington State Auditor’s Office for its review of
the County’s 2019 financial statements, and for the exceptional skill the
audit team brought to this issue. The state of Washington has a unique
regulation that mandates counties serve as the ex-officio treasurer of all
special purpose districts located within the government’s political
boundaries. For effective cash management, the County pools resources
from these governments for investment purposes. The presentation issue
identified by the Auditor impacted only the reporting of these funds held by
the County on behalf of other governments, and did not impact the total
balances reported or how the County managed those resources.
The County concurs with the Auditor that it misinterpreted the
Governmental Accounting Standard Board’s (GASB) intent to display
external investment pools in the basic financial statements. This
misunderstanding about where in the CAFR package to present the
external investment pool led to the Auditor’s secondary presentation
Page 8

Office of the Washington State Auditor
concern regarding the display of transfers between participant
governments and the external pool. The County contacted GASB after
learning of the Auditor’s concern and changed the presentation to match
guidance from GASB staff.
The County spent over 350 hours on its GASB 84 implementation activities,
including attendance at numerous training sessions offered by
governmental accounting professional organizations, none of which
addressed the presentation issue raised by the Auditor. Similarly, the
GASB did not provide any examples in GASB 84 which showed external
investment pools legally structured like the County’s.
Auditor’s Remarks
We appreciate the County’s commitment to resolve this finding and thank
the County for its cooperation and assistance during the audit. We will
review the corrective action taken during our next audit.
Applicable Laws and Regulations
Government Auditing Standards, December 2011 Revision, paragraph
4.23 establishes reporting requirements related to significant deficiencies
or material weaknesses in internal control, instances of fraud or abuse, and
noncompliance with provisions of law, regulations, contracts, or grant
agreements.
The American Institute of Certified Public Accountants defines significant
deficiencies and material weaknesses in its Codification of Statements on
Auditing Standards, section 265, Communicating Internal Control Related
Matters Identified in an Audit, paragraph 7.
Governmental Accounting Standards Board Statement No. 84, Fiduciary
Activities
The Budgeting, Accounting and Reporting System (BARS) manual, 4.3.5,
Fiduciary Funds Financial Statements
Page 9

Office of the Washington State Auditor
SCHEDULE OF FEDERAL AWARD FINDINGS AND
QUESTIONED COSTS
King County
January 1, 2019 through December 31, 2019
2019-002 The County improperly charged the program for
expenditures incurred outside the period of performance. In
addition, the County did not have adequate internal controls
to ensure compliance with federal suspension and
debarment requirements.
CFDA Number and Title: 14.267 Continuum of Care
Program
Federal Grantor Name: Department of Housing and
Urban Development
Federal Award/Contract
Number:
Too numerous to list
Pass-through Entity Name: N/A
Pass-through
Award/Contract Number:
N/A
Questioned Cost Amount: $27,416
Background
During the fiscal year 2019, the County spent $18.8 million in Continuum
of Care Program (Program) funds.
The Program is designed to: (1) promote community-wide commitment to
the goal of ending homelessness; (2) provide funding for efforts by non-
profit providers, states and local governments to quickly re-house
homeless individuals and families while minimizing the trauma and
dislocation caused to homeless individuals, families and communities by
homelessness; (3) promote access to and effective use of mainstream
programs by homeless individuals and families; and (4) optimize self-
sufficiency among individuals and families experiencing homelessness.
Federal regulations require recipients to establish and maintain internal
controls to ensure compliance with program requirements. These controls
include understanding program requirements and monitoring the
effectiveness of established controls.
Page 10

Office of the Washington State Auditor
Performance period
During 2019, the Department of Housing and Urban Development
awarded 32 contracts to the County. Each award specifies a performance
period during which program costs may be obligated or liquidated. Federal
requirements prohibit grant recipients from charging costs incurred outside
of the award period without prior approval from the grantor.
Suspension and debarment
Federal requirements prohibit grant recipients from contracting with
parties suspended or debarred from doing business with the federal
government. Whenever the County contracts for goods and services that it
expects to equal or exceed $25,000, paid all or in part with federal funds,
or makes a subaward regardless of award amount, it must verify the
contractor or subrecipient is not suspended or debarred or otherwise
excluded. The County can obtain a written certification from the contractor
or subrecipient or insert a clause into the contract where the contractor or
subrecipient states it is not suspended or debarred. Alternatively, the
County may review the federal Excluded Parties List (EPLS) issued by the
U.S. General Services Administration. This verification must be performed
before entering a contract or making a subaward.
Description of Condition
Performance period
The County had adequate internal controls to ensure it materially complied
with the period of performance requirement. However, we found it charged
the program $27,416 for subrecipients’ payroll costs and other expenses
incurred before the award period without prior approval.
This issue was not reported as a finding in the prior audit.
Suspension and debarment
The County has established procedures to include a suspension and
debarment clause in its contract templates for contractors and
subrecipients. However, for one of 11 contractors and subrecipients tested,
it did not follow its established procedures. The County did not obtain a
written certification, insert a clause into a contract or review EPLS to verify
one subrecipient, a local government, was not suspended or debarred from
participating in federal programs.
Page 11

Office of the Washington State Auditor
We consider this deficiency in internal controls to be a significant
deficiency.
This issue was not reported as a finding in the prior audit.
Cause of Condition
Performance period
The County staff did not perform an adequate review of expenditures to
ensure all costs charged to the program were incurred within the
performance period. Additionally, the County did not require any detailed
supporting documentation from one subrecipient for some costs because it
considered the subrecipient low risk.
Suspension and debarment
The County is aware of the suspension and debarment requirements.
However, the County did not consider the local government to be a
subrecipient or a contractor because they were joint applicants for the
program. The County was not aware the grantor considered the local
government to be a subrecipient of the County’s program and did not verify
the subrecipient’s status.
Effect of Condition and Questioned Costs
Performance period
We tested $1,158,862 out of $1,176,882 in expenditures charged to the
program that the County incurred close to the start date of the award period.
We are questioning costs of $27,416 charged to the program before the
start of the performance period.
Federal regulations require us to report known questioned costs that are
greater than $25,000 for each type of compliance requirement. We question
costs when we find the County has not complied with grant regulations
and/or when it does not have adequate documentation to support
expenditures.
Suspension and debarment
Without adequate internal controls over suspension and debarment
requirements, the County cannot guarantee it pays federal funds only to
eligible subrecipients. Any payments made to an ineligible party would be
subject to recovery by the grantor.
Page 12

Office of the Washington State Auditor
We verified that the subrecipient was not suspended or debarred.
Therefore, we are not questioning the related costs.
Recommendations
We recommend the County:
Monitor costs charged to the program to ensure they are obligated
during the performance period
Follow its established internal controls to comply with suspension
and debarment requirements and verify the suspension and
debarment status for all subrecipients before it makes subawards
County’s Response
The County would like to thank the Washington State Auditor’s Office for
its conclusions, communications and collaboration during the audit. We
agree with the finding and recommendations and have taken the following
actions:
Period of Performance
Effective October 1, 2020, the County required all Continuum of Care
subrecipients to clearly provide the pay periods included in their request
for payment. Additionally, the County will be amending subrecipient
contracts to clearly state that all charges, including payroll, must fall
within the grant period of performance. Lastly, the County staff who
manage and administer this grant, will review all invoice service and/or
purchase dates against the grant start and end dates. This will ensure that
charges from another grant period are not included. The process was
implemented in the fourth quarter of 2020.
Suspension and debarment
The County would like to emphasize that there was only one contract in the
audit selection that did not include a suspension and debarment clause and
did not follow established procedures. This was an isolated incident. In
this particular case, the local government acting as a subrecipient was the
City of Seattle. The verification process to confirm that the City of Seattle
was not suspended or debarred was completed in the fourth quarter of
2020. The County has trained all divisional grants administrators to follow
federal requirements for suspension and debarment.
Page 13

Office of the Washington State Auditor
Auditor’s Remarks
We appreciate the County’s commitment to resolve this finding and
thank the County for its cooperation and assistance during the audit.
We will review the corrective action taken during our next regular audit.
Applicable Laws and Regulations
Title 2 U.S. Code of Federal Regulations (CFR) Part 200, Uniform
Administrative Requirements, Cost Principles, and Audit Requirements for
Federal Awards (Uniform Guidance), section 516, Audit findings,
establishes reporting requirements for audit findings.
The American Institute of Certified Public Accountants defines significant
deficiencies and material weaknesses in its Codification of Statements on
Auditing Standards, section 935, Compliance Audits, paragraph 11.
Title 2 CFR Part 200, Uniform Guidance, section 303 Internal controls,
establishes requirements for management of Federal awards to non-Federal
entities.
Period of performance
Title 2 CFR Part 200, Uniform Guidance, section 309 Period of
Performance, establishes requirements for period of performance.
Suspension and debarment
Title 2 CFR Part 200, Uniform Guidance, section 213 – Suspension and
Debarment, establishes suspension and debarment requirements
Title 2 CFR Part 180, OMB Guidelines to Agencies on Government wide
Department and Suspension (Nonprocurement) establishes non-
procurement debarment and suspension regulations implementing
Executive Orders 12549 and 12689.
Page 14

Office of the Washington State Auditor
Finance & Business Operations Division Department of Executive Services
Chinook Building, CNK-ES-0300 401 Fifth Avenue
Seattle, WA 98104
(206) 263-9258
(206) 263-7670 Fax
www.kingcounty.gov
SUMMARY SCHEDULE OF PRIOR AUDIT FINDINGS
King County
January 1, 2019 through December 31, 2019
This schedule presents the status of federal findings reported in prior audit periods.
Audit Period:
January 1, 2018 through
December 31, 2018
Report Ref. No.:
1024651
Finding Ref. No.:
2018-001
CFDA Number(s):
93.898
Federal Program Name and Granting
Agency:
Cancer Prevention and Control Programs for
State, Territorial and Tribal Organizations
Department of Health and Human Services
Pass-Through Agency Name:
Washington State Department of
Health
Finding Caption:
The County did not have adequate internal controls to ensure compliance with federal
procurement requirements.
Background:
In 2018, the County paid over $576,000 for 37 service contracts to provide breast and cervical
health screening and other related services, which were subject to federal procurement
requirements. Of the 37 contracts, we reviewed 12 contracts totaling $432,000 and found:
For all 12 contracts, the County could not provide documentation to demonstrate it
competitively procured the contracts.
For five contracts exceeding $50,000, the County did not have documentation to
demonstrate that it performed a cost or price analysis, as required.
In addition, the County had established general procurement policies that included applicable
federal, state and local regulations; however, the policies did not include all of the federal
procurement requirements specifically outlined in the Uniform Guidance.
We considered this deficiency in internal controls to be a material weakness.
Page 15

Office of the Washington State Auditor
Status of Corrective Action: (check one)
☒ Fully
Corrected
☐ Partially
Corrected ☐ Not Corrected
☐ Finding is considered no
longer valid
Corrective Action Taken:
Public Health-Seattle & King County:
Developed workarounds in the current version of the contract management system to
ensure waiver options adhere to the requirements outlined in the Uniform Guidance.
Maintains a contract repository system to retain proper documentation, in order to
demonstrate compliance with federal procurement requirements.
Continues to train staff and monitor compliance with the Uniform Guidance federal
procurement requirements, including Request for Proposal (RFP), cost/price analysis,
waivers and micro-purchase thresholds.
The Finance and Business Operations Division (FBOD) revised the County's central
procurement policy as of April 2020. FBOD also developed a Federal Procurement
Requirements central portal providing agencies with guidance when procuring with federal
funds. In addition, all of FBOD’s procurement procedures covering the RFP process,
cost/price analysis, procurement waivers, micro-purchase thresholds and Disadvantaged
Business Enterprises (DBE) contract language were updated in the spring and summer of
2020.
Audit Period:
January 1, 2018 through
December 31, 2018
Report Reference
No.:
1024651
Finding Ref.
No.:
2018-002
CFDA
Number(s):
93.914
Federal Program Name and Granting Agency:
HIV Emergency Relief Project Grant
Department of Health and Human Services
Pass-Through Agency Name:
N/A
Finding Caption:
The County did not have adequate internal controls to ensure compliance with federal
procurement requirements.
Background:
In 2018, County paid over $1.34 million for 44 service contracts to provide dental services,
which were subject to federal procurement requirements. Of the 44 contracts, we reviewed 13
contracts totaling $990,650 and found:
For all 13 contracts, the County could not provide documentation to demonstrate it
competitively procured the contracts.
Page 16
Office of the Washington State Auditor
For six contracts exceeding $50,000, the County did not have documentation to
demonstrate that it performed a cost or price analysis, as required.
In addition, the County paid about $3,800 throughout the year to one vendor for box lunches.
The County did not obtain quotes for this service as required by policy.
Further, the County had established general procurement policies that included applicable
federal, state and local regulations; however, the policies did not include all of the federal
procurement requirements specifically outlined in the Uniform Guidance.
We considered this deficiency of internal controls to be a material weakness.
Status of Corrective Action: (check one)
☒ Fully
Corrected
☐ Partially
Corrected ☐ Not Corrected
☐ Finding is considered no
longer valid
Corrective Action Taken:
Public Health-Seattle & King County:
Developed workarounds in the current version of the contract management system to
ensure waiver options adhere to the requirements outlined in the Uniform Guidance.
Maintains a contract repository system to retain proper documentation, in order to
demonstrate compliance with federal procurement requirements.
Continues to train staff and monitor compliance with the Uniform Guidance federal
procurement requirements, including RFP, cost/price analysis, waivers and micro
purchase thresholds.
The Finance and Business Operations Division (FBOD) revised the County's central
procurement policy as of April 2020. FBOD also developed a Federal Procurement
Requirements central portal providing agencies with guidance when procuring with federal
funds. In addition, all of FBOD’s procurement procedures covering the RFP process,
cost/price analysis, procurement waivers, micro-purchase thresholds and Disadvantaged
Business Enterprises (DBE) contract language were updated in the spring and summer of
2020.
Page 17
Office of the Washington State Auditor
INDEPENDENT AUDITOR’S REPORT ON INTERNAL CONTROL
OVER FINANCIAL REPORTING AND ON COMPLIANCE AND
OTHER MATTERS BASED ON AN AUDIT OF FINANCIAL
STATEMENTS PERFORMED IN ACCORDANCE WITH
GOVERNMENT AUDITING STANDARDS
King County
January 1, 2019 through December 31, 2019
Council and Executive
King County
Seattle, Washington
We have audited, in accordance with auditing standards generally accepted in the United States of
America and the standards applicable to financial audits contained in Government Auditing
Standards, issued by the Comptroller General of the United States, the financial statements of the
governmental activities, the business-type activities, the aggregate discretely presented component
units, each major fund, and the aggregate remaining fund information of King County, as of and
for the year ended December 31, 2019, and the related notes to the financial statements, which
collectively comprise the County’s basic financial statements, and have issued our report thereon
dated July 27, 2020.
Our report includes a reference to other auditors who audited the financial statements of the Public
Transportation, Water Quality Enterprise, and Solid Waste funds, as described in our report on the
County’s financial statements. This report includes our consideration of the results of the other
auditors’ testing of internal control over financial reporting and compliance and other matters that
are reported on separately by those other auditors. However, this report, insofar as it relates to the
results of the other auditors, is based solely on the reports of the other auditors.
As discussed in Note 1 to the financial statements, during the year ended December 31, 2019, the
County implemented Governmental Accounting Standards Board Statement No. 83, Certain Asset
Retirement Obligations and Statement No. 84, Fiduciary Activities.
As discussed in Note 20 to the financial statements, in February 2020, a state of emergency was
declared that could have a negative financial effect on the County. Management’s plans in response
to this matter are also described in Note 20.
Page 18

Office of the Washington State Auditor
INTERNAL CONTROL OVER FINANCIAL REPORTING
In planning and performing our audit of the financial statements, we considered the County’s
internal control over financial reporting (internal control) to determine the audit procedures that
are appropriate in the circumstances for the purpose of expressing our opinions on the financial
statements, but not for the purpose of expressing an opinion on the effectiveness of the County’s
internal control. Accordingly, we do not express an opinion on the effectiveness of the County’s
internal control.
A deficiency in internal control exists when the design or operation of a control does not allow
management or employees, in the normal course of performing their assigned functions, to prevent,
or detect and correct, misstatements on a timely basis. A material weakness is a deficiency, or a
combination of deficiencies, in internal control such that there is a reasonable possibility that a
material misstatement of County’s financial statements will not be prevented, or detected and
corrected on a timely basis. A significant deficiency is a deficiency, or a combination of
deficiencies, in internal control that is less severe than a material weakness, yet important enough
to merit attention by those charged with governance.
Our consideration of internal control was for the limited purpose described in the first paragraph
of this section and was not designed to identify all deficiencies in internal control that might be
material weaknesses or significant deficiencies and therefore, material weaknesses or significant
deficiencies may exist that were not identified. Given these limitations, during our audit we and
the other auditors did not identify any deficiencies in internal control that we consider to be
material weaknesses. We did identify certain deficiencies in internal control, described in the
accompanying Schedule of Audit Findings and Responses as Finding 2019-001 that we consider
to be significant deficiencies.
COMPLIANCE AND OTHER MATTERS
As part of obtaining reasonable assurance about whether the County’s financial statements are free
from material misstatement, we performed tests of the County’s compliance with certain
provisions of laws, regulations, contracts and grant agreements, noncompliance with which could
have a direct and material effect on the determination of financial statement amounts. However,
providing an opinion on compliance with those provisions was not an objective of our audit, and
accordingly, we do not express such an opinion.
The results of our tests and the reports of the other auditors disclosed no instances of
noncompliance or other matters that are required to be reported under Government Auditing
Standards.
Page 19

Office of the Washington State Auditor
COUNTY’S RESPONSE TO FINDINGS
The County’s response to the findings identified in our audit is described in the accompanying
Schedule of Audit Findings and Responses. The County’s response was not subjected to the
auditing procedures applied in the audit of the financial statements and, accordingly, we express
no opinion on the response.
PURPOSE OF THIS REPORT
The purpose of this report is solely to describe the scope of our testing of internal control and
compliance and the results of that testing, and not to provide an opinion on the effectiveness of the
County’s internal control or on compliance. This report is an integral part of an audit performed in
accordance with Government Auditing Standards in considering the County’s internal control and
compliance. Accordingly, this communication is not suitable for any other purpose. However, this
report is a matter of public record and its distribution is not limited. It also serves to disseminate
information to the public as a reporting tool to help citizens assess government operations.
Pat McCarthy
State Auditor
Olympia, WA
July 27, 2020
Page 20

Office of the Washington State Auditor
INDEPENDENT AUDITOR’S REPORT ON COMPLIANCE FOR
EACH MAJOR FEDERAL PROGRAM AND REPORT ON
INTERNAL CONTROL OVER COMPLIANCE IN ACCORDANCE
WITH THE UNIFORM GUIDANCE
King County
January 1, 2019 through December 31, 2019
Council and Executive
King County
Seattle, Washington
REPORT ON COMPLIANCE FOR EACH MAJOR FEDERAL
PROGRAM
We have audited the compliance of King County, with the types of compliance requirements
described in the U.S. Office of Management and Budget (OMB) Compliance Supplement that could
have a direct and material effect on each of the County’s major federal programs for the year ended
December 31, 2019. The County’s major federal programs are identified in the accompanying
Schedule of Findings and Questioned Costs.
The County’s basic financial statements include the operations of the Harborview Medical Center,
which expended $6,590,792 in federal awards, which is not included in the Schedule of
Expenditures of Federal Awards for the year ended December 31, 2019. Our audit, described
below, did not include the operations of the Harborview Medical Center because it has arranged
for a separate audit of its federal awards in accordance with the Uniform Guidance.
Management’s Responsibility
Management is responsible for compliance with federal statutes, regulations, and the terms and
conditions of its federal awards applicable to its federal programs.
Auditor’s Responsibility
Our responsibility is to express an opinion on compliance for each of the County’s major federal
programs based on our audit of the types of compliance requirements referred to above. We
conducted our audit of compliance in accordance with auditing standards generally accepted in the
Page 21

Office of the Washington State Auditor
United States of America; the standards applicable to financial audits contained in Government
Auditing Standards, issued by the Comptroller General of the United States; and the audit
requirements of Title 2 U.S. Code of Federal Regulations Part 200, Uniform Administrative
Requirements, Cost Principles, and Audit Requirements for Federal Awards (Uniform Guidance).
Those standards and the Uniform Guidance require that we plan and perform the audit to obtain
reasonable assurance about whether noncompliance with the types of compliance requirements
referred to above that could have a direct and material effect on a major federal program occurred.
An audit includes examining, on a test basis, evidence about the County’s compliance with those
requirements and performing such other procedures as we considered necessary in the
circumstances.
We believe that our audit provides a reasonable basis for our opinion on compliance for each major
federal program. Our audit does not provide a legal determination on the County’s compliance.
Opinion on Each Major Federal Program
In our opinion, the County complied, in all material respects, with the types of compliance
requirements referred to above that could have a direct and material effect on each of its major
federal programs for the year ended December 31, 2019.
Other Matters
The results of our auditing procedures disclosed an instance of noncompliance with those
requirements, which is required to be reported in accordance with the Uniform Guidance and
which is described in the accompanying Schedule of Federal Award Findings and Questioned
Costs as Finding 2019-002. Our opinion on each major federal program is not modified with
respect to these matters.
County’s Response to Findings
The County’s response to the noncompliance findings identified in our audit is described in the
accompanying Schedule of Federal Award Findings and Questioned Costs. The County’s response
was not subjected to the auditing procedures applied in the audit of compliance and, accordingly,
we express no opinion on the response.
Page 22

Office of the Washington State Auditor
REPORT ON INTERNAL CONTROL OVER COMPLIANCE
Management of the County is responsible for establishing and maintaining effective internal
control over compliance with the types of compliance requirements referred to above. In planning
and performing our audit of compliance, we considered the County’s internal control over
compliance with the types of requirements that could have a direct and material effect on each
major federal program in order to determine the auditing procedures that are appropriate in the
circumstances for the purpose of expressing an opinion on compliance for each major federal
program and to test and report on internal control over compliance in accordance with the Uniform
Guidance, but not for the purpose of expressing an opinion on the effectiveness of internal control
over compliance. Accordingly, we do not express an opinion on the effectiveness of the County’s
internal control over compliance.
A deficiency in internal control over compliance exists when the design or operation of a control
over compliance does not allow management or employees, in the normal course of performing
their assigned functions, to prevent, or detect and correct, noncompliance with a type of
compliance requirement of a federal program on a timely basis. A material weakness in internal
control over compliance is a deficiency, or combination of deficiencies, in internal control over
compliance, such that there is a reasonable possibility that material noncompliance with a type of
compliance requirement of a federal program will not be prevented, or detected and corrected, on
a timely basis. A significant deficiency in internal control over compliance is a deficiency, or a
combination of deficiencies, in internal control over compliance with a type of compliance
requirement of a federal program that is less severe than a material weakness in internal control
over compliance, yet important enough to merit attention by those charged with governance.
Our consideration of internal control over compliance was for the limited purpose described in the
first paragraph of this section and was not designed to identify all deficiencies in internal control
over compliance that might be material weaknesses or significant deficiencies and therefore,
material weaknesses or significant deficiencies may exist that were not identified. We did not
identify any deficiencies in internal control over compliance that we consider to be material
weaknesses. However, we identified certain deficiencies in internal control over compliance, as
described in the accompanying Schedule of Federal Award Findings and Questioned Costs as
Finding 2019-002, that we consider to be significant deficiencies.
County’s Response to Findings
The County’s response to the internal control over compliance findings identified in our audit is
described in the accompanying Schedule of Federal Award Findings and Questioned Costs. The
County’s response was not subjected to the auditing procedures applied in the audit of compliance
and, accordingly, we express no opinion on the response.
Page 23

Office of the Washington State Auditor
Purpose of this Report
The purpose of this report on internal control over compliance is solely to describe the scope of
our testing of internal control over compliance and the results of that testing based on the
requirements of the Uniform Guidance. Accordingly, this report is not suitable for any other
purpose. However, this report is a matter of public record and its distribution is not limited. It also
serves to disseminate information to the public as a reporting tool to help citizens assess
government operations.
Pat McCarthy
State Auditor
Olympia, WA
December 10, 2020
Page 24

Office of the Washington State Auditor
INDEPENDENT AUDITOR’S REPORT ON
FINANCIAL STATEMENTS
King County
January 1, 2019 through December 31, 2019
Council and Executive
King County
Seattle, Washington
REPORT ON THE FINANCIAL STATEMENTS
We have audited the accompanying financial statements of the governmental activities, the
business-type activities, the aggregate discretely presented component units, each major fund, and
the aggregate remaining fund information of King County, as of and for the year ended
December 31, 2019, and the related notes to the financial statements, which collectively comprise
the County’s basic financial statements as listed on page 29.
Management’s Responsibility for the Financial Statements
Management is responsible for the preparation and fair presentation of these financial statements
in accordance with accounting principles generally accepted in the United States of America; this
includes the design, implementation, and maintenance of internal control relevant to the
preparation and fair presentation of financial statements that are free from material misstatement,
whether due to fraud or error.
Auditor’s Responsibility
Our responsibility is to express opinions on these financial statements based on our audit. We did
not audit the financial statements of the Public Transportation, Water Quality, or Solid Waste
funds, which in aggregate represent 97 percent, 94 percent, and 96 percent, respectively, of the
assets, net position, and revenues of the business-type activities. Those statements were audited
by other auditors, whose reports have been furnished to us, and our opinion, insofar as it relates to
the amounts included for the Public Transportation, Water Quality, and Solid Waste funds, is based
solely on the reports of the other auditors.
Page 25
Office of the Washington State Auditor
We conducted our audit in accordance with auditing standards generally accepted in the United
States of America and the standards applicable to financial audits contained in Government
Auditing Standards, issued by the Comptroller General of the United States. Those standards
require that we plan and perform the audit to obtain reasonable assurance about whether the
financial statements are free from material misstatement.
An audit involves performing procedures to obtain audit evidence about the amounts and
disclosures in the financial statements. The procedures selected depend on the auditor’s judgment,
including the assessment of the risks of material misstatement of the financial statements, whether
due to fraud or error. In making those risk assessments, the auditor considers internal control
relevant to the County’s preparation and fair presentation of the financial statements in order to
design audit procedures that are appropriate in the circumstances, but not for the purpose of
expressing an opinion on the effectiveness of the County’s internal control. Accordingly, we
express no such opinion. An audit also includes evaluating the appropriateness of accounting
policies used and the reasonableness of significant accounting estimates made by management, as
well as evaluating the overall presentation of the financial statements.
We believe that the audit evidence we have obtained is sufficient and appropriate to provide a basis
for our audit opinions.
Opinions
In our opinion, based on our audit and the reports of the other auditors, the financial statements
referred to above present fairly, in all material respects, the respective financial position of the
governmental activities, the business-type activities, the aggregate discretely presented component
units, each major fund and the aggregate remaining fund information of King County, as of
December 31, 2019, and the respective changes in financial position and, where applicable, cash
flows thereof for the year then ended in accordance with accounting principles generally accepted
in the United States of America.
Matters of Emphasis
As discussed in Note 1 to the financial statements, in 2019, the County adopted new accounting
guidance, Governmental Accounting Standards Board Statement No. 83, Certain Asset Retirement
Obligations and Statement No. 84, Fiduciary Activities. Our opinion is not modified with respect
to this matter.
As discussed in Note 20 to the financial statements, in February 2020, a state of emergency was
declared that could have a negative financial effect on the County. Management’s plans in response
to this matter are also described in Note 20. Our opinion is not modified with respect to this matter.
Page 26

Office of the Washington State Auditor
Other Matters
Required Supplementary Information
Accounting principles generally accepted in the United States of America require that the
management’s discussion and analysis and required supplementary information listed on page 29
be presented to supplement the basic financial statements. Such information, although not a part
of the basic financial statements, is required by the Governmental Accounting Standards Board
who considers it to be an essential part of financial reporting for placing the basic financial
statements in an appropriate operational, economic or historical context. We have applied certain
limited procedures to the required supplementary information in accordance with auditing
standards generally accepted in the United States of America, which consisted of inquiries of
management about the methods of preparing the information and comparing the information for
consistency with management’s responses to our inquiries, the basic financial statements, and
other knowledge we obtained during our audit of the basic financial statements. We do not express
an opinion or provide any assurance on the information because the limited procedures do not
provide us with sufficient evidence to express an opinion or provide any assurance.
Supplementary and Other Information
Our audit was conducted for the purpose of forming opinions on the financial statements that
collectively comprise the County’s basic financial statements as a whole. The accompanying
Schedule of Expenditures of Federal Awards is presented for purposes of additional analysis as
required by Title 2 U.S. Code of Federal Regulations (CFR) Part 200, Uniform Administrative
Requirements, Cost Principles, and Audit Requirements for Federal Awards (Uniform Guidance).
This schedule is not a required part of the basic financial statements. Such information is the
responsibility of management and was derived from and relates directly to the underlying
accounting and other records used to prepare the basic financial statements. The information has
been subjected to the auditing procedures applied in the audit of the basic financial statements and
certain additional procedures, including comparing and reconciling such information directly to
the underlying accounting and other records used to prepare the basic financial statements or to
the basic financial statements themselves, and other additional procedures in accordance with
auditing standards generally accepted in the United States of America. In our opinion, the
information is fairly stated, in all material respects, in relation to the basic financial statements
taken as a whole.
Page 27

Office of the Washington State Auditor
OTHER REPORTING REQUIRED BY GOVERNMENT AUDITING
STANDARDS
In accordance with Government Auditing Standards, we have also issued our report dated July 27,
2020 on our consideration of the County’s internal control over financial reporting and on our tests
of its compliance with certain provisions of laws, regulations, contracts and grant agreements and
other matters. The purpose of that report is to describe the scope of our testing of internal control
over financial reporting and compliance and the results of that testing, and not to provide an
opinion on internal control over financial reporting or on compliance. That report is an integral
part of an audit performed in accordance with Government Auditing Standards in considering the
County’s internal control over financial reporting and compliance.
Pat McCarthy
State Auditor
Olympia, WA
July 27, 2020
Page 28

Office of the Washington State Auditor
FINANCIAL SECTION
King County
January 1, 2019 through December 31, 2019
REQUIRED SUPPLEMENTARY INFORMATION
Management’s Discussion and Analysis – 2019
BASIC FINANCIAL STATEMENTS
Statement of Net Position – 2019
Statement of Activities – 2019
Balance Sheet - Governmental Funds– 2019
Statement of Revenues, Expenditures and Changes in Fund Balance – Governmental
Funds – 2019
Reconciliation of Statement of Revenues, Expenditures and Changes in Fund Balance of
Governmental Funds to the Statement of Activities – 2019
Statement of Net Position – Proprietary Funds – 2019
Statement of Revenues, Expenses and Changes in Fund Net Position – Proprietary Funds
– 2019
Statement of Cash Flows – Proprietary Funds – 2019
Statement of Fiduciary Net Position – Fiduciary Funds – 2019
Statement of Changes in Fiduciary Net Position – Fiduciary Funds – 2019
Statement of Net Position –Component Units – 2019
Statement of Activities –Component Units - 2019
Notes to Financial Statements – 2019
REQUIRED SUPPLEMENTARY INFORMATION
Schedule of Revenues, Expenditures, and Changes in Fund Balance – Budget and Actual
– General Fund – 2019
Schedule of Revenues, Expenditures, and Changes in Fund Balance – Budget and Actual
– Behavioral Health Fund – 2019
Schedules of the County’s Proportionate Share of the Net Pension Liability – PERS
Plan 1, PERS Plan 2/3, PSERS Plan 2, LEOFF Plan 1, LEOFF Plan 2, SCERS – 2019
Schedules of Contributions – PERS Plan 1, PERS Plan 2/3, PSERS Plan 2, LEOFF
Plan 2, SCERS – 2019
Page 29

Office of the Washington State Auditor
Schedule of Changes in Total OPEB Liability and Related Ratios – King County Retiree
Health Plan – 2019
Condition Assessments and Preservation of Infrastructure Eligible for Modified
Approach – 2019
SUPPLEMENTARY AND OTHER INFORMATION
Schedule of Expenditures of Federal Awards – 2019
Notes to the Schedule of Expenditures of Federal Awards – 2019
Page 30

King County, Washington
MANAGEMENT’S DISCUSSION AND ANALYSIS (MD&A)
This section of King County’s Comprehensive Annual Financial Report (CAFR) presents a narrative overview and analysis of the financial activities of the County for the year ended December 31, 2019. We encourage readers to consider this information in conjunction with that furnished in the letter of transmittal and with the County’s financial statements and accompanying notes to the financial statements.
FINANCIAL HIGHLIGHTS - PRIMARY GOVERNMENT
• At December 31, 2019, the assets and deferred outflows of resources of the County exceeded its liabilities and deferred inflows of resources by $7.24 billion (referred to as net position of the primary government). Of this amount, $982 million represents unrestricted net position, which may be used to meet the County’s short-term obligations to its vendors, creditors, employees and customers.
• The County’s total net position increased 6 percent or $434 million over last year mainly because of capital asset acquisitions and construction that did not utilize borrowing. The Puget Sound Emergency Radio Network levy collections have been sufficient to support its capital construction activities, avoiding previously anticipated borrowing. The county also decided to fund the Patricia H. Clark Child and Family Justice Center construction through current revenues.
• The governmental activities component of net position grew by 8 percent or $258 million over last year while the business-type activities component gained 5 percent or $176 million.
• The County’s governmental funds reported combined fund balances of $1,045 million, an increase of $62 million over the prior year. Approximately 9 percent or $93 million of this amount is unassigned fund balance which is available for spending at the government’s discretion.
• Unrestricted fund balance (the total of the committed, assigned and unassigned components of fund balance) for the General Fund was $182 million, or approximately 22 percent of total annual General Fund expenditures. Total fund balance for the General Fund increased 12 percent or $20 million from the prior year.
• Total liabilities of the County increased by 3 percent or $174 million in 2019. However, the largest component of liabilities is debt, which decreased 2 percent or $117 million. Governmental activities issued new general obligation bonds of $62 million and refunding issues of $56 million. Business-type activities issued $101 million in new general obligation debt, $148 million in general obligation refunding debt, and no revenue-backed debt.
OVERVIEW OF THE FINANCIAL STATEMENTS
This discussion and analysis is intended to serve as an introduction to the County’s basic financial statements which include three components: government-wide financial statements, fund financial statements and notes to the financial statements. This report also includes supplementary information intended to furnish additional detail to support the basic financial statements themselves.
Government-wide Financial Statements
The government-wide financial statements are designed to provide readers with an overview of the County’s finances, in a manner similar to a private sector business. The statements provide near-term and long-term information about the County’s financial position, which assists in assessing the County’s financial condition at the end of the fiscal year.
The statement of net position presents all of the County’s assets, deferred outflows of resources, liabilities and deferred inflows of resources, with the difference reported as net position. Over time, increases or decreases in the County’s net position may serve as a useful indicator of whether the financial position of the County is improving or deteriorating.
The statement of activities presents information showing how the County’s net position changed during the most recent fiscal year. All changes in net position are reported as soon as the underlying event giving rise to the change occurs, regardless of the timing of related cash flows. Thus, revenues and expenses are reported for some items that
Page 31

King County, Washington
will not result in cash flows until future fiscal periods, such as revenues pertaining to uncollected taxes and expenses pertaining to earned but unused vacation leave.
Both government-wide financial statements have separate sections for three different types of County programs or activities:
Governmental activities
The activities in this section are principally supported by taxes and revenues from other governments (called "intergovernmental revenues" in the statements). The county classifies governmental activities into general government; law, safety and justice; physical environment; transportation; economic environment; health and human services; culture and recreation; debt service and capital outlay. Further discussion of these activities may be found in Note 1 to the Basic Financial Statements. Also included within governmental activities are the operations of the King County Flood Control District which, although legally separate, is reported as a blended component unit and shown as a special revenue fund to comply with governmental accounting standards.
Business-type activities
These functions are intended to recover all or a significant portion of their costs through user fees and charges to external users. The county's business-type activities include public transportation, wastewater treatment, solid waste disposal and recycling, airport property leasing, ferry, radio communications, and public internet services.
Discretely presented component units
The County’s government-wide financial statements include the financial data of other legally separate entities that are reported as discrete component units: Harborview Medical Center, Cultural Development Authority of King County and NJB Properties. While governmental accounting standards call for these entities to be reported as part of the overall financial reporting entity, they are not included within the primary government. Individual financial statements for these discrete component units can be found in the Basic Financial Statements section, immediately following the fiduciary funds financial statements.
Fund Financial Statements
The fund financial statements are designed to report financial information about the County’s funds. A fund is a grouping of related accounts used to maintain control over resources that have been segregated for specific activities or objectives.
The County, like most state and local governments, uses fund accounting to ensure and demonstrate compliance with finance-related legal requirements. All of the funds of the County can be divided into three categories: governmental funds, proprietary funds and fiduciary funds.
Governmental funds
Most of the services provided by the County are accounted for in governmental funds. Governmental funds are used to account for essentially the same functions that are reported as governmental activities in the government-wide financial statements.
Unlike government-wide financial statements, however, governmental funds financial statements focus on near-term inflows and outflows of spendable resources, as well as on balances of spendable resources available at the end of the fiscal year. Such information may be useful in assessing near-term financing requirements.
Because the focus of governmental funds is narrower than that of the government-wide financial statements, it is useful to compare the information presented for governmental funds with similar information presented for governmental activities in the government-wide financial statements. By doing so, readers may better understand the long-term impact of the government’s near-term financing decisions. Both the governmental funds balance sheet and the governmental funds statement of revenues, expenditures, and changes in fund balance provide a reconciliation to facilitate this comparison between governmental funds and governmental activities.
Page 32

King County, Washington
King County maintains a general fund and several other individual governmental funds organized according to their type (special revenue, debt service, and capital projects). The government reports two governmental major funds, the General Fund and the Behavioral Health Fund. Each major fund is presented in a separate column in the governmental funds balance sheet and the governmental funds statement of revenues, expenditures, and changes in fund balances. Data from the other governmental funds are combined into a single aggregated presentation as "nonmajor governmental funds." Individual fund data for each of these nonmajor funds is provided as supplementary information in the form of combining statements in the Governmental Funds section.
The County adopts biennial budgets for the General Fund and Behavioral Health Fund, appropriated at the department or division level. Budgetary comparison schedules are provided for each of the major governmental funds and may be found in the Required Supplementary Information section.
Proprietary funds
Proprietary funds are used to account for services for which the County charges customers a fee to recover all or a portion of the cost of providing the services. Proprietary funds provide the same type of information as shown in the government-wide financial statements but at a more detailed level, including the addition of cash flow statements. Like the government-wide financial statements, proprietary funds financial statements use the accrual basis of accounting. The basic proprietary funds financial statements can be found immediately following the governmental funds financial statements.
The County has two types of proprietary funds:
Enterprise funds are used to report the same functions presented as business-type activities in the government-wide financial statements. The proprietary funds financial statements provide separate information for the Water Quality Enterprise, the Public Transportation Enterprise, and the Solid Waste Enterprise, all of which are considered to be major funds of the County for financial reporting purposes. All other enterprise funds are aggregated into a single "nonmajor enterprise funds" column within the proprietary funds financial statements. Individual fund data for each of these nonmajor funds is provided as supplementary information in the form of combining statements in the Proprietary Funds section.
Internal service funds are used to report activities that provide centralized services to the County’s other programs and activities on a cost reimbursement basis. The County uses this type of fund to account for services such as the motor pool, information and technology, employee benefits, facilities management, risk management, financial, and various other administrative services. Most of these funds support or benefit governmental rather than business-type functions and those funds have therefore been appropriately consolidated within governmental activities in the government-wide financial statements. One of the internal service funds, however, provides equipment and fleet maintenance services almost exclusively to the Water Quality Enterprise and is therefore consolidated within the business-type activities in the government-wide financial statements. At the fund level, because of their business-type nature, all the internal service funds are aggregated for reporting purposes under the proprietary fund group in the basic financial statements with individual fund statements provided as other supplementary information in the Internal Service Funds combining section. Fiduciary funds
Fiduciary funds such as trust and agency funds are used to account for resources held for the benefit of parties outside the government. This fund group also includes the investment trust funds that are used to report investment pool activity on behalf of special districts and public authorities. Since the resources of these funds are not available to support the County’s own programs, they are not reflected in the government-wide financial statements. The accounting for fiduciary funds is much like that used for proprietary funds. The basic fiduciary funds financial statements can be found immediately following the proprietary funds financial statements.
Notes to the Financial Statements
The notes provide additional information essential to a full understanding of the data provided in the government-wide and fund financial statements. The notes to the financial statements can be found immediately following the individual component unit financial statements in the Basic Financial Statements section.
Page 33

King County, Washington
Other Information
Required supplementary information In addition to the basic financial statements and accompanying notes, this report also presents required supplementary information on budget to actual comparisons for major governmental funds, the current funding progress for pensions, the current funding progress for defined benefit postemployment benefits other than pensions, and infrastructure assets reported using the modified approach. The required supplementary information immediately follows the notes to the financial statements.
Combining statements
The combining statements are presented in separate sections immediately after the required supplementary information.
GOVERNMENT-WIDE FINANCIAL ANALYSIS
Net position over time may serve as a useful indicator of a government’s financial position. In the case of King County, assets and deferred outflows of resources exceeded liabilities and deferred inflows of resources by $7.24 billion at the close of the most recent fiscal year.
King County's Net Position(in thousands)
Governmental Business-typeActivities Activities Total
2019 2018 2019 2018 2019 2018Assets
Current and other assets $ 1,842,952 $ 1,566,797 $ 2,498,873 $ 2,304,834 $ 4,341,825 $ 3,871,631
Capital assets(a) 3,447,644 3,344,379 6,304,284 6,245,746 9,751,928 9,590,125
Total Assets 5,290,596 4,911,176 8,803,157 8,550,580 14,093,753 13,461,756
Deferred Outflows of Resources 98,980 87,221 243,458 254,842 342,438 342,063
LiabilitiesLong-term liabilities 1,329,345 1,407,329 4,847,469 4,841,219 6,176,814 6,248,548
Other liabilities 409,469 212,303 288,706 240,190 698,175 452,493
Total Liabilities 1,738,814 1,619,632 5,136,175 5,081,409 6,874,989 6,701,041
Deferred Inflows of Resources 166,227 152,063 154,635 143,918 320,862 295,981
Net PositionNet investment in capital assets(a) 2,820,829 2,651,748 2,392,806 2,267,809 5,213,635 4,919,557
Restricted 776,016 780,131 269,056 286,406 1,045,072 1,066,537
Unrestricted (112,310) (205,177) 1,093,943 1,025,880 981,633 820,703
Total Net Position $ 3,484,535 $ 3,226,702 $ 3,755,805 $ 3,580,095 $ 7,240,340 $ 6,806,797
(a) Prior year balances restated. See Note 18 - Components of Fund Balance, Restrictions and Restatements.
The largest portion of King County’s net position, 72 percent or $5.21 billion, reflects its net investment in capital assets. The County employs these long-lived assets in providing a variety of services to its citizens. Accordingly, the net position associated with the capital assets does not represent amounts available for future spending. The County’s investment in capital assets is reported net of related debt. The resources used to repay the capital-related borrowing must be provided from other more current, or liquid, assets.
An additional portion of County’s net position, 14 percent or $1.05 billion, represents resources that are subject to external restrictions on how they may be used. The remaining balance of $982 million is unrestricted. A negative unrestricted net position, which is shown for some nonmajor governmental funds in the governmental funds section, represents more liabilities and deferred inflows of resources than assets and deferred outflows of resources.
King County’s overall net position increased 6 percent or $434 million from the prior fiscal year. The reasons for this overall increase are discussed in the following sections for governmental activities and business-type activities.
Page 34

King County, Washington
Governmental Activities During the current fiscal year, net position for governmental activities increased 8 percent or $258 million from the prior fiscal year for an ending balance of $3.48 billion. Net position invested in capital assets comprised 81 percent of total net position, or $2.82 billion, an increase from the prior year of $169 million. The increase was caused by the combined net additions to capital assets and net reductions in outstanding capital related debt during the year. Net position restricted for specific purposes amounted to $776 million including $263 million dedicated to health and human services; $130 million for economic environment services; $128 million for future capital project spending; $108 million for law, safety and justice services; and, $74 million for transportation services. Other restrictions constituted the remaining $73 million.
Governmental activities accounted for 59 percent of the total improvement in net position of the County. The total revenues for governmental activities were $2.34 billion, an increase of 2 percent or $53 million from the prior year. Increases in property taxes accounted for the largest portion, $26 million, followed by interest earnings with $25 million. The increase in property taxes was the result of strong growth in newly constructed properties, totaling $11.56 billion of assessed value in 2019, from which the county receives a full allocation of property tax in the first year. The increase in interest earnings was due to favorable interest rate conditions at the beginning of the year. The net rate of return for 2019 was 2.25 percent, up from 1.73 percent in 2018. After signaling a “pause” on rate changes early in 2019, the Federal Reserve Bank went on to cut rates by 0.25 percentage points three times in August, September, and October; lowering the lower bound of the effect rate from 2.25 percent to 1.50 percent. As a result, County earnings from interest are expected to recede in the coming year.
Expenses for governmental activities during the year increased by a net of 6 percent or $116 million. Expenditure increases were focused on health and human services; and law, safety, and justice. In health and human services, which overall increased 6 percent or $44 million, the increase was driven by a greater need for services and full engagement of the Best Starts for Kids (BSK) levy which entered its third year of implementation. For example, expenditures in the Public Health nonmajor fund increased 9 percent or $17 million with the largest driver the provision of increased services to BSK clients; reflecting this increased participation BSK transferred $53 million to Public Health in 2019, an increase from $18 million in the prior year. Similarly, expenditures increased in the Developmental Disabilities nonmajor fund 12 percent or $5 million with increased demand for services from BSK clients increasing the transfer from BSK by 56 percent or $3 million to $8 million in 2019. Best Starts for Kids expenditures in its own fund increased 48 percent or $6 million to $17 million this year. In the Veterans, Seniors, and Human Services levy, which entered its second year of implementation following the expansion of scope to include seniors in 2018, expenditures increased 69% to $16 million from $9 million as new programs to serve seniors began. In law, safety, and justice, where expenditures increased 4 percent or $29 million, the increase was primarily related to the increased personnel cost (salary plus benefits) of providing these services to the residents from the General Fund which increased 5 percent or $23 million from last year despite the number of personnel assigned to the function increasing only 3 percent or 114 full-time equivalents from last year. Please refer to the Full Time Equivalent County Government Employees by Function table in the Statistical section for more information about the number of full time equivalent employees employed by the County in each governmental function and how that statistic has changed over the last ten years.
Page 35

King County, Washington
Changes in Net Position(in thousands)
Governmental Business-typeActivities Activities Total
2019 2018 2019 2018 2019 2018Revenues
Program revenuesCharges for services $ 848,391 $ 840,576 $ 1,109,879 $ 1,080,500 $ 1,958,270 $ 1,921,076Operating grants and contributions 211,658 220,680 26,168 41,488 237,826 262,168Capital grants and contributions 20,556 30,461 64,081 138,057 84,637 168,518
General revenuesProperty taxes 924,076 897,969 35,378 29,536 959,454 927,505Retail sales and use taxes 257,476 244,157 686,120 652,299 943,596 896,456Other taxes 21,799 22,241 — — 21,799 22,241Unrestricted interest earnings 58,297 32,819 45,318 28,032 103,615 60,851
Total revenues 2,342,253 2,288,903 1,966,944 1,969,912 4,309,197 4,258,815Expenses(a)
General government(b) 193,291 173,000 — — 193,291 173,000Law, safety and justice 726,568 697,250 — — 726,568 697,250Physical environment 22,788 25,468 — — 22,788 25,468Transportation 102,793 93,723 — — 102,793 93,723Economic environment 198,326 192,707 — — 198,326 192,707Health and human services 746,148 702,015 — — 746,148 702,015Culture and recreation(b) 77,434 64,763 — — 77,434 64,763Interest and other debt service costs 23,606 25,629 — — 23,606 25,629Airport — — 25,475 22,869 25,475 22,869Public transportation — — 1,032,062 824,623 1,032,062 824,623Solid waste — — 234,164 155,026 234,164 155,026Water quality — — 474,952 486,545 474,952 486,545Other enterprise activities — — 18,047 15,431 18,047 15,431
Total expenses 2,090,954 1,974,555 1,784,700 1,504,494 3,875,654 3,479,049Increase in net position before transfers 251,299 314,348 182,244 465,418 433,543 779,766Transfers 6,534 5,453 (6,534) (5,453) — —Increase in net position 257,833 319,801 175,710 459,965 433,543 779,766Net position, beginning of year(c) 3,226,702 2,906,901 3,580,095 3,120,130 6,806,797 6,027,031Net position, end of year $ 3,484,535 $ 3,226,702 $ 3,755,805 $ 3,580,095 $ 7,240,340 $ 6,806,797
(a) Expenses for all functions include the allocation of indirect expenses from general government. The amount of indirect general government expenses allocated to each function is shown in a separate column on the government-wide Statement of Activities next to the column of direct operating expenses incurred by each function. In the above statement, the $193.3 million in general government expense consists of $243.4 million in direct program expenses reduced by indirect charges of $50.1 million that was charged to the other benefiting functions.
(b) 2018 expenses in these functions were adjusted for the corresponding effects of the restatements of beginning net position.
(c) Net position, beginning of year has been restated. See Note 18 - Components of Fund Balance, Restrictions and Restatements.
Business-type Activities King County’s business-type activities reported a net position of $3.76 billion, increasing by 5 percent or $176 million from the prior year. Of the total net position for business-type activities, 64 percent or $2.39 billion was invested in capital assets net of the related debt used to finance the acquisition or construction of these capital assets. Another 7 percent or $269 million of the total net position of business-type activities is restricted for spending on capital projects, debt service, regulatory assets and environmental liabilities. The remaining 29 percent or $1.10 billion is unrestricted net position which is available to meet ongoing obligations to customers, vendors, other creditors and employees.
Business-type activities’ net position of $3.76 billion comprised 52 percent of the total County net position at the end of 2019. Business type activities accounted for 39 percent of the total increase in the County's aggregate net position during the year. This growth in net position was due primarily to acquisitions of capital assets not funded through long-term debt, for example when the Public Transportation Enterprise purchases new busses with cash or grants.
Total revenues of business-type activities remained flat at $2.00 billion this year. Retail sales and use tax revenues increased the most, at 5 percent or $34 million, representing a continued strong local economy in 2019. Similar to the
Page 36
King County, Washington
governmental activities, and for the same reasons, interest earnings improved in the business-type activities by 62 percent or $17 million from last year.
Business-type activity expenses increased 19 percent or $280 million over the prior year for all business-type activities taken together. The Public Transportation Enterprise (PTE) saw the largest increase of expenses, at 25 percent or $207 million. $125 million of this apparent increase was actually a large gain on the sale of real property in 2018; adjusting for that one-time event PTE expenses only increased 9 percent or $82 million. The Solid Waste Enterprise had the largest percentage increase in expenses, totaling 51 percent or $79 million corresponding to an upward revision in the system-wide estimated post-closure care liability for municipal solid waste landfills it either operates, has operated, or has been named custodian over. The Water Quality Enterprise expenses decreased 2 percent or $12 million due to decreases in non-operating expenses related to lower short-term interest rates and fewer capital retirements.
FINANCIAL ANALYSIS OF THE COUNTY’S FUNDS
The County uses fund accounting to ensure and demonstrate compliance with finance-related legal requirements.
Governmental Funds The focus of the County’s governmental funds is to provide information on near-term inflows, outflows, and balances of spendable resources. Such information is useful in assessing the County’s financing requirements. In particular, unassigned fund balance may serve as a useful measure of a government’s net resources available for discretionary use. It represents the portion of fund balance which has not yet been limited to use for a particular purpose by either an external party, the County itself or a group or individual that has been delegated authority to assign resources for use for particular purposes by the Council.
At December 31, 2019, the County’s governmental funds reported a combined fund balance of $1.04 billion, an increase of 6 percent or $62 million in comparison with the prior year. Approximately 9 percent or $93 million constitutes unassigned fund balance. The remainder of fund balance is either nonspendable, restricted, committed or assigned to indicate, respectively, that it is 1) not in spendable form or legally required to be maintained intact, $36 million, 2) restricted for particular purposes, $834 million, 3) committed for particular purposes, $27 million, or assigned for particular purposes, $55 million.
The General Fund is the chief operating fund of the County. At the end of the 2019 fiscal year, total fund balance for the General Fund was $184 million. Unassigned fund balance totaled $142 million, an increase of 31 percent or $34 million over the prior year. As a measure of the General Fund’s liquidity, it may be useful to compare both unassigned fund balance and total fund balance to total fund expenditures of $828 million. The unassigned fund balance of $142 million represents 17 percent of total General Fund expenditures, an increase of 3 percent from 2018 while the total fund balance of $184 million represents 22 percent of total expenditures in 2019, compared to 21 percent in 2018.
Fund balance of the General Fund increased by 12 percent or $20 million during 2019. The increase in fund balance was attributed to taking in more resources than spending. The notable revenue streams contributing to the increase of fund balance are property taxes, 40 percent of total revenues, charges for services, 31 percent of total revenues and retail sales and use taxes, 17 percent of total revenues. Property taxes are budgeted on a biennial basis at the level needed and retail sales and use taxes remain a reliable resource with the continued strength of the economy. Charges for services are mostly comprised of contracts with other jurisdictions to provide legal, law enforcement and rehabilitation and detention services. Total expenditures increased by $58 million, but were easily eclipsed by revenues. The main expenditures are for law, safety and justice, 75 percent of total expenditures, related to contract costs with other jurisdictions, and general government, 19 percent of total expenditures, related to general operation costs such as elections, records and licensing, finance and budgeting and legislative expenditures.
The Behavioral Health Fund provides oversight and management of crisis services, mental health treatment, substance use disorder treatment and diversion and reentry services to low income clients, with an emphasis on prevention, intervention, treatment and recovery. At the end of 2019, it had a total fund balance of $297 thousand, a decrease of 99 percent or $34 million over the prior year.
The decrease in fund balance in the current year was caused by earning fewer revenues, $250 million, than incurring costs on programs, $271 million, due primarily to the change in administering Medicaid-related programs. Medicaid reimbursements were no longer paid directly to King County and went directly to managed care organizations that take an administrative portion before passing the remainder to the County. Last year, the County earned $213 million
Page 37

King County, Washington
in Medicaid-eligible revenues versus $192 million from five managed care organizations, representing a $21 million decrease.
Proprietary Funds The County’s proprietary funds provide the same type of information found in the government-wide financial statements for business-type activities, but in more detail.
At December 31, 2019, the County’s proprietary funds reported a combined net position of $3.76 billion, an increase of 5 percent or $176 million compared to the prior year. The Public Transportation Enterprise net position increased 6 percent or $152 million; the Water Quality Enterprise net position improved by 11 percent or $81 million; and the Solid Waste Enterprise net position decreased 98 percent or $95 million.
The Public Transportation Enterprise accounts for the operations, maintenance and capital improvements of the County’s public transportation system. At the end of 2019, the Public Transportation Enterprise had total net position of $2.59 billion, of which 65 percent or $1.68 billion was invested in capital assets net of associated debt; 2 percent or $38 million was restricted for capital projects and debt service; while 34 percent or $873 million was unrestricted. Unrestricted net position increased from the prior year by 14 percent or $105 million. The large increase is due to continually keeping expenses under revenues. The key revenues that help continue to increase the Enterprise’s net position are sales taxes at $686 million, or 60 percent of total revenues; passenger fares at $179 million, or 16 percent of total revenue; and service contracts at $184 million or 16 percent of total revenues. Total operating expenses increased by $89 million from the prior year, with personal services experiencing the largest increase at $34 million, followed by internal services and purchased transportation increasing by $20 million and $18 million, respectively.
The Water Quality Enterprise accounts for the operations, maintenance, capital improvements and expansion of the County’s water pollution control facilities. At the end of 2019, the Water Quality Enterprise reported total net position of $827 million of which 51 percent or $423 million was invested in capital assets net of the related debt; 28 percent or $231 million was restricted for debt service and regulatory assets and environmental liabilities; and the remaining 21 percent or $173 million was unrestricted. Total net position improved by $81 million due to continually posting positive results from operations. The Enterprise reported $415 million in sewage disposal fees, an increase of $12 million or 3 percent from the prior year, attributed to a rate increase. Other operating revenues of $121 million increased by $15 million or 14 percent, mostly due to increases in water treatment capacity charges and capacity charge early payoffs. The Enterprise incurred $323 million in total operating expenses, mainly comprised of $180 million in depreciation and amortization expenses, personal services of $51 million and internal services of $39 million.
The Solid Waste Enterprise accounts for the operations, maintenance, capital improvements and expansion of the County’s solid waste collection and disposal system. At the end of 2019, the Solid Waste Enterprise reported total net position of $2 million of which $144 million was invested in capital assets net of the related debt and -$142 million was unrestricted. A negative unrestricted net position represents more liabilities and deferred inflows of resources than assets and deferred outflows of resources. Total net position deteriorated by $95 million due to a one-time change in estimates for postclosure care needs of the last remaining active landfill, the Cedar Hills Regional Landfill, and several closed landfills under the division's care. The Enterprise reported $132 million in solid waste disposal charges, an increase of $3 million or 2 percent from the prior year, attributed to a rate increase. The Enterprise incurred $219 million in total operating expenses, mainly comprised of $107 million in landfill closure and postclosure care expenses, previously reported as nonoperating expenses, and personal services of $46 million.
General Fund Budgetary Highlights
King County budgets on a biennial basis with each budget period beginning in an odd-numbered year. This is the first year of the 2019-2020 biennium for County operating funds. The biennial budget is a true 24-month budget, not two separate budgets enacted at the same time.
Original Budget Compared to Final Budget The General Fund’s final budget differs from the original budget in that it reflects an increase of $107 million in expenditures due to supplemental budget appropriations. The largest increases to estimated revenues occurred in intergovernmental revenues as a result of entering into additional contracts with other governments. Budget increases were made during the budget period to general government by $6 million; law, safety, and justice by $30 million; health and human services by $2 million; capital outlay by $1 million; and transfers out by $67 million. The majority of the significant increases to law, safety, and justice were a result of increases in full-time equivalents for the Sheriff, Public Defense and Superior Court, and increases due to the collective bargaining agreement between the King County Police Officers’ Guild and King County Sheriff’s Office to include cost of living
Page 38

King County, Washington
adjustments and contract ratification bonuses. Large increases in transfers out are attributable to transfers to the major maintenance reserve, Building 4Equity Advance, and CIP transfers to the Department of Executive Services.
Final Budget Compared to Actual Results Property taxes are by far the largest source to the General Fund, accounting for 39 percent of the budgeted revenues. Charges for services and retail sales and use taxes are the other significant sources of revenue for the General Fund, representing 30 percent and 16 percent of total budgeted revenues, respectively. The amount received for charges for services is dependent on corresponding services provided and fluctuate with the applicable programs and services offered. Retail sales and use taxes are dependent on increased spending in the economy, which is influenced by various factors.
The actual budgetary basis expenditures were $1.04 billion less than the final appropriation. Law, safety and justice and general government comprise the largest amounts of actual expenditures at 68 percent and 17 percent, respectively.
CAPITAL ASSETS, INFRASTRUCTURE AND DEBT ADMINISTRATION
Capital Assets
The King County primary government’s capital assets for its governmental and business-type activities as of December 31, 2019, amounted to $3.45 billion for governmental activities and $6.30 billion for business-type activities totaling $9.75 billion, net of depreciation.
Capital assets include land, rights-of-way, easements and development rights, buildings, improvements other than buildings, infrastructure, vehicles, machinery, computers, software and other equipment and construction in progress. The total increase in capital assets over the previous year was $162 million, net of depreciation.
Major capital asset events during 2019 included the following:
• The Patricia H. Clark Child and Family Justice Center which replaces the existing Youth Services Center, was completed in 2019 totaling $185 million. The parking garage is scheduled to be completed by the spring of 2021.
• Public Transportation purchased and placed into service 186 new buses during the year at a cost of $179 million.
• Water Quality brought new infrastructure into service during the year at a total cost of $55 million, $33 million for Kent Auburn Phase B-Pipeline and $22 million for Magnolia Pipeline.
• Solid Waste had completed development and construction of a new refuse area, Area 8, at the Cedar Hills Regional Landfill. Area 8 was completed during 2019 with a total cost of $46 million. Area 8 has a 32-acre footprint and will provide 8 million cubic yards of refuse capacity. It includes a bottom liner system, landfill gas collection system, and leachate collection and conveyance system.
• Puget Sound Emergency Radio Network (PSERN) is engaged in replacing the existing radio system that is over 20 years old. The new system as a whole will provide improved coverage, capacity, capability and connectivity in PSERN's regional service area. The total estimated project cost is $261 million; $90 million has been spent through 12/31/2019. The radio network is anticipated to be operational in 2023.
Page 39

King County, Washington
A summary of the 2019 capital assets activity is shown below. More detailed information on the County’s capital assets can be found in Note 7 - Capital Assets.
Capital Assets(in millions)
Governmental Business-typeActivities Activities Total
2019 2018 2019 2018 2019 2018Land and land rights (b) $ 1,101.9 $ 1,080.0 *
*$ 473.9 $ 469.9 $ 1,575.8 $ 1,549.9
Buildings(a)(b) 696.3 521.8 1,744.5 1,788.3 2,440.8 2,310.1Leasehold Improvements(a) 29.1 11.5 2.8 3.1 31.9 14.6Improvements other than buildings(a)(b) 107.6 69.3 *
*314.8 233.4 422.4 302.7
Infrastructure - roads and bridges 1,128.3 1,121.7 — — 1,128.3 1,121.7Infrastructure - other(a)(b) 75.9 32.8 *
*1,751.3 1,749.1 1,827.2 1,781.9
Equipment, software and art collection(a)(b) 133.5 123.0 1,399.2 1,345.0 1,532.7 1,468.0Construction in progress 175.0 384.3 617.8 656.9 792.8 1,041.2
Total $ 3,447.6 $ 3,344.4 $ 6,304.3 $ 6,245.7 $ 9,751.9 $ 9,590.1
(a) Net of Depreciation(b) 2018 Governmental Activities Balance Restated. See Note 18 - Components of Fund Balance, Restatements and Restrictions.
Infrastructure
The County has elected to use the modified approach in reporting roads and bridges. Under the modified approach, capital assets are not depreciated because they will be preserved indefinitely. The condition of the assets is disclosed to provide evidence that established condition levels are being met. The rating scales for pavements (roads) and bridges and the results of the most recent condition assessments are further explained in the required supplementary information which follows the notes to the basic financial statements.
Condition assessments for roads are undertaken every three years using a pavement condition index (PCI). This is a 100-point scale numerical index that represents the pavement’s functional condition based on the quantity, severity and type of visual distress. It is the policy of the King County Road Services Division to maintain at least 50 percent of the road system at a PCI of 40 or better. In the most recent condition assessment, more than two-thirds of the arterial and local access roads met the established condition level.
The County currently maintains 178 bridges. Physical inspections to uncover deficiencies are carried out at least every two years. A prioritization scale is maintained to determine which bridges are due for replacement or rehabilitation. The most significant criterion is the sufficiency rating which utilizes a 100-point priority scale based on various factors of bridge condition. The policy of the King County Road Services Division is to maintain bridges in such a manner that no more than 6.5 percent will have a sufficiency rating of 20 or less. The most current complete assessment showed only nine bridges at or below this threshold.
The amount budgeted for 2019 roads preservation and maintenance was $75 million, but the actual amount expended was $58 million. For maintenance and preservation of bridges, the amount budgeted for 2019 was $12 million, but the actual expended amount was $6 million. The variance between budget and spending is due to supplemental budget and remaining work under contract to be completed in 2020.
Page 40

King County, Washington
Debt Administration
At the end of 2019, King County had a total of $4.93 billion in debt outstanding. Of this amount, $1.89 billion comprises debt backed by the full faith and credit of the County. The other $3.04 billion represents bonds secured by revenues generated by the debt-financed capital assets and state revolving loans. Below is a summary of the County’s debt by type and activity.
Outstanding Debt(in millions)
Governmental Business-typeActivities Activities Total
2019 2018 2019 2018 2019 2018General obligation bonds $ 721.0 $ 729.8 $ 1,157.4 $ 1,002.9 $ 1,878.4 $ 1,732.7GO capital leases (a) 8.2 8.3 — — 8.2 8.3Revenue bonds — — 2,811.5 3,072.5 2,811.5 3,072.5State revolving loans — — 227.5 229.5 227.5 229.5
Total $ 729.2 $ 738.1 $ 4,196.4 $ 4,304.9 $ 4,925.6 $ 5,043.0
(a) Project lease agreements - NJB properties. Under the lease agreements, the County’s obligation to pay rent to NJB Properties is a limited tax general obligation.
Total debt decreased over the previous year by 2 percent or $117 million (a 1 percent or $9 million decrease for governmental activities and a 3 percent or $108 million decrease for business-type activities). Governmental activities’ outstanding debt decreased primarily due to $72 million debt service payments and defeasance of $65 million of bonds offset by the issuance of $118 million in both new limited tax general obligation bonds and refunding general obligation bonds, with related premium of $21 million.
Business-type activities’ outstanding debt decreased primarily due to $107 million in debt service payments and the defeasance of $235 million in bonds offset by the issuance of $249 million in both new limited tax general obligation bonds and refunding general obligation bonds payable from sewer revenues, with related premiums of $28 million. State revolving loans decreased by $2 million.
The County maintained a rating of “Aaa” from Moody’s, a rating of “AAA” from Standard & Poor’s, and a rating of “AAA” from Fitch for its limited tax general obligation debt. For its unlimited tax general obligation debt the County has a rating of “Aaa” from Moody’s, a rating of “AAA” from Standard & Poor’s, and a rating of “AAA” from Fitch. The ratings for Water Quality Enterprise’s revenue debt are “Aa1” from Moody’s and “AA+” from Standard & Poor’s.
State statutes limit the amount of general obligation debt that the County may issue to 2.5 percent of its total assessed valuation for general county purposes and 2.5 percent for metropolitan functions (Water Quality and Public Transportation funds). The current debt limitation of total general obligations for general county purposes is $16.06 billion, significantly higher than the County’s outstanding net general obligation long-term liabilities of $661 million. For metropolitan functions the debt limitation is also $16.06 billion and the County’s outstanding net general obligation debt for metropolitan functions is $1.00 billion.
Additional information on King County’s long-term debt can be found in Note 15 of the Basic Financial Statements.
ECONOMIC OUTLOOK AND NEXT YEAR'S BUDGET
The last 10 years have been a period of stability and growth with most economic indicators reaching all-time highs in 2019.
Items of note within King County:
• King County’s unemployment rate was only 2.5 percent as of December 2019, lower than state and national unemployment rates, which were 4.0 percent and 3.5 percent, respectively. Diversification of the County's employment base was an important buffer during the Great Recession economic downturn, and all sectors but one (Government) grew in 2019. Two of the region’s prominent local employers, Amazon and Microsoft, retain strong demand for their products and services. Boeing, the state’s largest employer, bucked recent trends by adding 2,000 jobs in Washington in 2019. However, the ongoing safety issues of the 737-MAX and financial health of the world’s largest aircraft manufacturer is a cause for concern in both the short-term and
Page 41

King County, Washington
longer-term. Also, as the COVID-19 pandemic continues to unfold in early 2020, the forced closure of restaurants, bars, schools, recreational facilities, and hundreds of other businesses across the state has led to substantial job losses and a dramatic increase to the unemployment rate in the near-term.
• Taxable retail sales growth has been robust the last few years thanks to growing incomes, enhanced consumer confidence, strong employment, and a booming construction sector. Local retail sales tax collections grew 8 percent in 2016, 5 percent in 2017, 11 percent in 2018, and 4 percent in 2019.
• Inflation remained steady in 2019. The Seattle Consumer Price Index for Urban Wage Earners and Clerical Workers (CPI-W-STB) increased by 2.1 percent, down from 3.3 percent in 2018. The national CPI for All Urban Consumers (CPI-U-US) increased 1.8 percent during the same period.
Other than the global pandemic which continues to unfold, King County will continue to face numerous challenges, including volatile energy prices, rising employee and programmatic health care costs, the need to raise sufficient revenues to support utilities, the transit system, and general government operations. Over the last three years the County has maintained its commitment to build reserves in times of economic prosperity and has increased its minimum undesignated reserve for the General Fund from 6 percent to 8 percent, which is the maximum amount under county policy. The county also is willing to make difficult decisions in order to reduce expenditures to match revenue levels while retaining prudent reserves. At the state level, the County also continues to pursue statutory enhancements to local government revenues to more flexibly balance revenues with long-term cost pressures.
REQUESTS FOR INFORMATION
This financial report is designed to provide an overview of the County’s financial activities for all those with an interest in the government’s finances. Questions concerning any of the information provided in this report, or requests for additional financial information, should be addressed as below.
King County Chief Accountant500 Fourth Avenue, Room 650Seattle, WA 98104
Page 42

King County, Washington
STATEMENT OF NET POSITIONDECEMBER 31, 2019
(IN THOUSANDS)
Primary GovernmentGovernmental Business-type Component
Activities Activities Total UnitsASSETS
Cash and cash equivalents $ 1,456,142 $ 1,701,303 $ 3,157,445 $ 360,531Investments 1,944 15,727 17,671 11,453Receivables, net 233,958 367,058 601,016 191,601Internal balances (110,093) 110,093 — —Inventories 3,186 33,489 36,675 9,032Prepayments and other assets 25,719 5,190 30,909 12,720Net pension asset 73,838 — 73,838 —Capital assets: Nondepreciable assets 2,415,700 1,090,080 3,505,780 26,010 Depreciable assets, net 1,031,944 5,214,204 6,246,148 258,971Net investment in capital lease — — — 8,156Deposits with other governments — — — 7,007Regulatory assets - environmental remediation — 118,258 118,258 —Other assets 158,258 147,755 306,013 16,426
TOTAL ASSETS 5,290,596 8,803,157 14,093,753 901,907
DEFERRED OUTFLOWS OF RESOURCESDeferred outflows on refunding 14,530 185,120 199,650 —Deferred outflows on pensions 82,046 53,172 135,218 275Deferred outflows on other post employment benefits 2,269 355 2,624 —Deferred outflows on asset retirement obligations 135 4,811 4,946 —
TOTAL DEFERRED OUTFLOWS OF RESOURCES 98,980 243,458 342,438 275
LIABILITIESAccounts payable and other current liabilities 178,814 164,893 343,707 87,712Accrued liabilities 60,077 107,597 167,674 53,420Unearned revenues 170,578 16,216 186,794 11,745Noncurrent liabilities: Due within one year 134,620 163,452 298,072 2,314 Due in more than one year 1,194,725 4,684,017 5,878,742 26,244
TOTAL LIABILITIES 1,738,814 5,136,175 6,874,989 181,435
DEFERRED INFLOWS OF RESOURCESDeferred inflows on pensions 159,658 107,357 267,015 430Rate stabilization — 46,250 46,250 —Deferred inflows on other post employment benefits 6,569 1,028 7,597 —
TOTAL DEFERRED INFLOWS OF RESOURCES 166,227 154,635 320,862 430
NET POSITIONNet investment in capital assets 2,820,829 2,392,806 5,213,635 284,981Restricted for:
Capital projects 128,187 36,132 164,319 —Debt service 2,494 156,161 158,655 —General government 7,581 — 7,581 —Law, safety and justice 108,001 — 108,001 —Physical environment 32,401 — 32,401 —Transportation 73,627 — 73,627 —Economic environment 130,042 — 130,042 —Health and human services 262,559 — 262,559 —Culture and recreation 31,124 — 31,124 —Regulatory assets and environmental liabilities — 76,763 76,763 —
Expendable — — — 23,528Nonexpendable — — — 2,870Unrestricted (112,310) 1,093,943 981,633 408,938
TOTAL NET POSITION $ 3,484,535 $ 3,755,805 $ 7,240,340 $ 720,317The notes to the financial statements are an integral part of this statement.
Page 43

Kin
g C
ount
y, W
ashi
ngto
n
STAT
EMEN
T O
F A
CTI
VITI
ESFO
R T
HE
YEA
R E
ND
ED D
ECEM
BER
31,
201
9(IN
TH
OU
SA
ND
S)
Prog
ram
Rev
enue
sN
et (E
xpen
se) R
even
ue a
nd C
hang
es in
Net
Pos
ition
Com
pone
ntPr
imar
y G
over
nmen
tU
nits
Tot
alIn
dire
ctO
pera
ting
Cap
ital
Expe
nses
Cha
rges
for
Gra
nts
and
Gra
nts
and
Gov
ernm
enta
lB
usin
ess-
type
Func
tions
/Pro
gram
sEx
pens
esA
lloca
tion
Serv
ices
Con
trib
utio
nsC
ontr
ibut
ions
Act
iviti
esA
ctiv
ities
Tota
l
Prim
ary
gove
rnm
ent:
Gov
ernm
enta
l act
iviti
es:
Gen
eral
gov
ernm
ent
$24
3,41
0$
(50,
119 )
$14
7,17
6$
12,4
32$
566
$(3
3,11
7)$
—$
(33,
117)
$—
Law
, saf
ety
and
just
ice
724,
776
1,79
217
9,79
735
,492
10(5
11,2
69)
—(5
11,2
69)
—P
hysi
cal e
nviro
nmen
t21
,823
965
49,1
512,
265
670
29,2
98—
29,2
98—
Tran
spor
tatio
n10
0,12
62,
667
11,9
9715
,682
14,2
29(6
0,88
5)—
(60,
885)
—E
cono
mic
env
ironm
ent
194,
821
3,50
581
,900
55,6
301,
391
(59,
405)
—(5
9,40
5)—
Hea
lth a
nd h
uman
ser
vice
s73
7,39
58,
753
368,
535
87,7
81—
(289
,832
)—
(289
,832
)—
Cul
ture
and
recr
eatio
n75
,998
1,43
69,
835
2,37
63,
690
(61,
533)
—(6
1,53
3)—
Inte
rest
and
oth
er d
ebt s
ervi
ce c
osts
23,6
06—
——
—(2
3,60
6)—
(23,
606)
—
T
otal
gov
ernm
enta
l act
iviti
es2,
121,
955
(31,
001 )
848,
391
211,
658
20,5
56(1
,010
,349
)—
(1,0
10,3
49)
—
Bus
ines
s-ty
pe a
ctiv
ities
:
Airp
ort
25,0
1246
327
,805
146
6—
2,79
72,
797
—
Pub
lic T
rans
porta
tion
1,00
9,19
422
,868
386,
582
24,9
2749
,285
—(5
71,2
68)
(571
,268
)—
S
olid
Was
te23
1,29
72,
867
137,
158
285
——
(96,
721)
(96,
721)
—
Wat
er Q
ualit
y47
0,45
44,
498
544,
083
——
—69
,131
69,1
31—
In
stitu
tiona
l Net
wor
k2,
716
513,
082
——
—31
531
5—
M
arin
e9,
797
223
3,71
595
514
,330
—8,
980
8,98
0—
R
adio
Com
mun
icat
ions
Ser
vice
s5,
229
317,
454
——
—2,
194
2,19
4—
Tot
al b
usin
ess-
type
act
iviti
es1,
753,
699
31,0
011,
109,
879
26,1
6864
,081
—(5
84,5
72)
(584
,572
)—
Tota
l prim
ary
gove
rnm
ent
$3,
875,
654
$—
$1,
958,
270
$23
7,82
6$
84,6
37$
(1,0
10,3
49)
$(5
84,5
72)
$(1,
594,
921)
$—
Com
pone
nt U
nits
$1,
061,
979
$1,
063,
228
$11
,456
$3,
609
$16
,314
Gen
eral
reve
nues
:P
rope
rty ta
xes
$92
4,07
6$
35,3
78$
959,
454
$—
Ret
ail s
ales
and
use
taxe
s25
7,47
668
6,12
094
3,59
6—
Bus
ines
s an
d ot
her t
axes
21,7
99—
21,7
99—
Inte
rest
ear
ning
s58
,297
45,3
1810
3,61
51,
508
Tran
sfer
s6,
534
(6,5
34)
——
Tota
l gen
eral
reve
nues
and
tran
sfer
s1,
268,
182
760,
282
2,02
8,46
41,
508
Cha
nge
in n
et p
ositi
on25
7,83
317
5,71
043
3,54
317
,822
Net
pos
ition
- Ja
nuar
y 1,
201
9 (R
esta
ted)
3,22
6,70
23,
580,
095
6,80
6,79
770
2,49
5N
et p
ositi
on -
Dec
embe
r 31,
201
9$
3,48
4,53
5$
3,75
5,80
5$
7,24
0,34
0$
720,
317
The
note
s to
the
finan
cial
sta
tem
ents
are
an
inte
gral
par
t of t
his
stat
emen
t.
Page 44

King County, Washington
BALANCE SHEET GOVERNMENTAL FUNDS
DECEMBER 31, 2019 (IN THOUSANDS)
BEHAVIORAL NONMAJOR TOTALGENERAL HEALTH GOVERNMENTAL GOVERNMENTAL
FUND FUND FUNDS FUNDSASSETS
Cash and cash equivalents $ 142,666 $ 9,973 $ 948,311 $ 1,100,950Investments — — 1,944 1,944Taxes receivable-delinquent 8,760 52 8,827 17,639Accounts receivable, net 8,998 1,344 8,474 18,816Interest receivable 19,857 — 455 20,312Due from other funds 278 1,078 35,359 36,715Due from other governments, net 82,987 14,081 79,485 176,553Inventory — — 1,089 1,089Prepayments 6 — 19,977 19,983Advances to other funds 3,000 — 15,500 18,500Notes receivable — — 158,258 158,258
TOTAL ASSETS $ 266,552 $ 26,528 $ 1,277,679 $ 1,570,759
LIABILITIESAccounts payable $ 5,588 $ 18,517 $ 88,567 $ 112,672Due to other funds 12,180 904 36,940 50,024Interfund short-term loans payable — — 20,250 20,250Due to other governments 1,312 4,613 33,598 39,523Wages payable 31,882 849 17,041 49,772Taxes payable 125 — 71 196Unearned revenues 3 1,309 168,853 170,165Custodial accounts 7,340 — 3,621 10,961Advances from other funds 11,500 — 38,529 50,029
TOTAL LIABILITIES 69,930 26,192 407,470 503,592
DEFERRED INFLOWS OF RESOURCESUnavailable revenue-property taxes 7,402 39 6,712 14,153Unavailable revenue-other receivables 5,399 — 3,041 8,440
TOTAL DEFERRED INFLOWS OF RESOURCES 12,801 39 9,753 22,593
FUND BALANCESNonspendable 6 — 35,506 35,512Restricted 1,807 297 831,713 833,817Committed 27,038 — 170 27,208Assigned 13,435 — 41,918 55,353Unassigned 141,535 — (48,851) 92,684
TOTAL FUND BALANCES 183,821 297 860,456 1,044,574
TOTAL LIABILIITIES, DEFERRED INFLOWSOF RESOURCES AND FUND BALANCES $ 266,552 $ 26,528 $ 1,277,679 $ 1,570,759
Amounts reported for governmental activities in the statement of net position are different because:Total fund balances - governmental funds $ 1,044,574Capital assets used in governmental activities are not financial resources and are not reported in the funds. 3,390,734Other long-term assets are not available to pay for current-period expenditures and are deferred in the funds. 161,753Governmental activities internal service funds assets and liabilities are included in the governmental activities in the
statement of net position. 122,361Long-term liabilities, including bonds payable, are not due and payable in the current period and therefore are not
reported in the funds. (1,234,887)Net position of governmental activities $ 3,484,535See Note 2 for more detailed explanations of these adjustments.
The notes to the financial statements are an integral part of this statement.
Page 45

King County, Washington
STATEMENT OF REVENUES, EXPENDITURES AND CHANGES IN FUND BALANCESGOVERNMENTAL FUNDS
FOR THE YEAR ENDED DECEMBER 31, 2019(IN THOUSANDS)
BEHAVIORAL NONMAJOR TOTALGENERAL HEALTH GOVERNMENTAL GOVERNMENTAL
FUND FUND FUNDS FUNDSREVENUES
Taxes:Property taxes $ 366,911 $ 3,465 $ 553,725 $ 924,101Retail sales and use taxes 153,118 — 104,359 257,477Business and other taxes 4,128 17 17,653 21,798
Licenses and permits 7,582 — 21,417 28,999Intergovernmental revenues 27,350 13,303 167,972 208,625Charges for services 287,376 229,636 275,978 792,990Fines and forfeits 26,774 — 1,020 27,794Interest earnings 23,640 778 29,119 53,537Miscellaneous revenues 19,113 2,430 31,079 52,622
TOTAL REVENUES 915,992 249,629 1,202,322 2,367,943
EXPENDITURESCurrent:
General government 156,562 — 42,313 198,875Law, safety and justice 620,476 — 143,366 763,842Physical environment — — 24,920 24,920Transportation — — 107,478 107,478Economic environment 73 — 203,988 204,061Health and human services 49,199 279,170 435,983 764,352Culture and recreation — — 75,422 75,422
Debt service:Principal — — 67,990 67,990Interest and other debt service costs 58 — 31,457 31,515
Capital outlay 2,032 — 169,661 171,693TOTAL EXPENDITURES 828,400 279,170 1,302,578 2,410,148
Excess (deficiency) of revenues over (under)expenditures 87,592 (29,541) (100,256) (42,205)
OTHER FINANCING SOURCES (USES)Transfers in 18,481 8,291 402,244 429,016Transfers out (87,277) (12,579) (304,561) (404,417)General government debt issued — — 62,340 62,340Refunding bonds issued — — 55,877 55,877Premium on general government bonds issued — — 13,125 13,125Premium on refunding bonds issued — — 8,248 8,248Payment to refunded bonds escrow agent — — (63,652) (63,652)Sale of capital assets 944 — 2,522 3,466
TOTAL OTHER FINANCING SOURCES (USES) (67,852) (4,288) 176,143 104,003
Net change in fund balances 19,740 (33,829) 75,887 61,798
Fund balances - beginning 164,081 34,126 784,569 982,776Fund balances - ending $ 183,821 $ 297 $ 860,456 $ 1,044,574
The notes to the financial statements are an integral part of this statement.
Page 46

King County, Washington
RECONCILIATION OF THE STATEMENT OF REVENUES, EXPENDITURESAND CHANGES IN FUND BALANCES OF GOVERNMENTAL FUNDS
TO THE STATEMENT OF ACTIVITIESFOR THE YEAR ENDED DECEMBER 31, 2019
(IN THOUSANDS)
Amounts reported for governmental activities in the statement of activities are different because:
Net change in fund balances - total governmental funds $ 61,798
Governmental funds report capital outlays as expenditures. However, in the statement of activities the cost of those assets is allocated over their estimated useful lives and reported as depreciation expense. This is the amount by which capital outlays exceeded depreciation in the current period. 128,962
The net effect of various miscellaneous transactions involving capital assets (e.g., sales, trade-ins, and donations) is to increase net position. (23,646)
Revenues in the statement of activities that do not provide current financial resources are not reported as revenues in the governmental funds. 1,706
The issuance of long-term debt provides current financial resources to governmental funds, while the repayment of the principal of long-term debt consumes the current financial resources of governmental funds. Neither transaction has any effect on net position. Also, governmental funds report the effect of issuance costs, premiums, and similar items when debt is first issued, whereas these amounts are deferred and amortized in the statement of activities. This amount is the net effect of these differences in the treatment of long-term debt and related items. (7,947)
Some expenses reported in the statement of activities do not require the use of current financial resources and therefore are not reported as expenditures in governmental funds. 68,537
The net revenues and expenses of certain activities of internal service funds are reported with governmental activities. 28,423
Change in net position of governmental activities $ 257,833
The notes to the financial statements are an integral part of this statement.
Page 47

King County, Washington
STATEMENT OF NET POSITIONPROPRIETARY FUNDSDECEMBER 31, 2019
(IN THOUSANDS)(PAGE 1 OF 4)
BUSINESS-TYPE ACTIVITIES
PUBLIC WATER SOLIDTRANSPORTATION QUALITY WASTE
ASSETSCurrent assets
Cash and cash equivalents $ 830,503 $ 323,751 $ 110,055Restricted cash and cash equivalents 386 4,531 4,520Accounts receivable, net 49,610 40,145 13,411Due from other funds 6,728 3,006 2,910Interfund short-term loans receivable — — —Property tax receivable-delinquent 419 — —Due from other governments 256,347 — 397Inventory of supplies 21,954 9,625 1,370Prepayments and other assets 254 11 331
Total current assets 1,166,201 381,069 132,994
Noncurrent assetsRestricted assets:
Cash and cash equivalents 38,415 273,412 13,366Investments — 15,727 —Due from other governments 28 — —
Total restricted assets 38,443 289,139 13,366
Capital assets:Nondepreciable assets 321,151 702,495 48,954Depreciable assets, net 1,414,291 3,410,278 255,228 Total capital assets 1,735,442 4,112,773 304,182
Other noncurrent assets:Prepayments 4,444 — —Notes receivable 141,169 3,573 —Advances to other funds — — —Regulatory assets, net of amortization — 118,258 —Other assets — 3,013 —
Total other noncurrent assets 145,613 124,844 —Total noncurrent assets 1,919,498 4,526,756 317,548
TOTAL ASSETS 3,085,699 4,907,825 450,542
DEFERRED OUTFLOWS OF RESOURCESDeferred outflows on refunding 1,921 182,410 782Deferred outflows on pensions 44,417 5,170 2,902Deferred outflows on other post employment benefits 290 36 23Deferred outflows on asset retirement obligations 2,997 1,250 404
TOTAL DEFERRED OUTFLOWS OF RESOURCES 49,625 188,866 4,111
The notes to the financial statements are an integral part of this statement.
Page 48

King County, Washington
STATEMENT OF NET POSITIONPROPRIETARY FUNDSDECEMBER 31, 2019
(IN THOUSANDS)(PAGE 2 OF 4)
BUSINESS-TYPE ACTIVITIESNONMAJOR INTERNAL
ENTERPRISE SERVICEFUNDS TOTAL FUNDS
ASSETSCurrent assets
Cash and cash equivalents $ 83,248 $ 1,347,557 $ 373,157Restricted cash and cash equivalents 182 9,619 245Accounts receivable, net 800 103,966 584Due from other funds 344 12,988 669Interfund short-term loans receivable — — 20,250Property tax receivable-delinquent 89 508 —Due from other governments 5,812 262,556 55Inventory of supplies 535 33,484 2,102Prepayments and other assets 150 746 5,736
Total current assets 91,160 1,771,424 402,798
Noncurrent assetsRestricted assets:
Cash and cash equivalents 724 325,917 —Investments — 15,727 —Due from other governments — 28 —
Total restricted assets 724 341,672 —
Capital assets:Nondepreciable assets 17,480 1,090,080 —Depreciable assets, net 126,536 5,206,333 64,781 Total capital assets 144,016 6,296,413 64,781
Other noncurrent assets:Prepayments — 4,444 —Notes receivable — 144,742 —Advances to other funds — — 31,529Regulatory assets, net of amortization — 118,258 —Other assets — 3,013 —
Total other noncurrent assets — 270,457 31,529Total noncurrent assets 144,740 6,908,542 96,310
TOTAL ASSETS 235,900 8,679,966 499,108
DEFERRED OUTFLOWS OF RESOURCESDeferred outflows on refunding 7 185,120 —Deferred outflows on pensions 683 53,172 11,003Deferred outflows on other post employment benefits 6 355 62Deferred outflows on asset retirement obligations 160 4,811 —
TOTAL DEFERRED OUTFLOWS OF RESOURCES 856 243,458 11,065
The notes to the financial statements are an integral part of this statement.
Page 49

King County, Washington
STATEMENT OF NET POSITIONPROPRIETARY FUNDSDECEMBER 31, 2019
(IN THOUSANDS)(PAGE 3 OF 4)
BUSINESS-TYPE ACTIVITIES
PUBLIC WATER SOLIDTRANSPORTATION QUALITY WASTE
LIABILITIESCurrent liabilities
Accounts payable $ 120,400 $ 26,773 $ 6,973Retainage payable 386 4,531 50Estimated claim settlements — — —Due to other funds — 24 —Due to other governments — — —Interest payable 180 68,569 574Wages payable 30,378 4,678 2,580Compensated absences payable 10,371 851 228Taxes payable 32 15 164Unearned revenues 5,999 2,966 33Pollution remediation — 4,561 —
General obligation bonds payable 5,880 22,900 6,710 Revenue bonds payable — 62,675 —
Capital leases payable 147 — —State revolving loan payable — 17,348 70Landfill closure and post-closure care — — 30,441Other liabilities — 297 —
Total current liabilities 173,773 216,188 47,823
Noncurrent liabilitiesCompensated absences payable 43,124 10,266 4,260Other postemployment benefits 12,309 1,526 996Net pension liability 173,111 5,962 4,878General obligation bonds payable 46,919 900,270 166,643Revenue bonds payable — 2,748,909 —Capital leases payable 2,094 — —State revolving loans payable — 208,873 1,252Landfill closure and post-closure care — — 217,875Estimated claim settlements — — —Pollution remediation 659 39,947 1,210Asset retirement obligation 3,480 1,500 500Other liabilities — 77,010 —
Total noncurrent liabilities 281,696 3,994,263 397,614TOTAL LIABILITIES 455,469 4,210,451 445,437
DEFERRED INFLOWS OF RESOURCESDeferred inflows on rate stabilization — 46,250 —Deferred inflows on pensions 85,405 13,168 7,042Deferred inflows on other post employment benefits 840 104 68
TOTAL DEFERRED INFLOWS OF RESOURCES 86,245 59,522 7,110
NET POSITIONNet investment in capital assets 1,682,322 422,889 143,655Restricted for:
Capital projects 36,132 — —Debt service 2,311 153,850 —Regulatory assets and environmental liabilities — 76,763 —
Unrestricted 872,845 173,216 (141,549)TOTAL NET POSITION $ 2,593,610 $ 826,718 $ 2,106
The notes to the financial statements are an integral part of this statement.
Page 50

King County, Washington
STATEMENT OF NET POSITIONPROPRIETARY FUNDSDECEMBER 31, 2019
(IN THOUSANDS)(PAGE 4 OF 4)
BUSINESS-TYPE ACTIVITIESNONMAJOR INTERNAL
ENTERPRISE SERVICEFUNDS TOTAL FUNDS
LIABILITIESCurrent liabilities
Accounts payable $ 2,159 $ 156,305 $ 13,279Retainage payable 6 4,973 245Estimated claim settlements — — 58,462Due to other funds 223 247 101Due to other governments 3,132 3,132 —Interest payable 26 69,349 4Wages payable 603 38,239 7,125Compensated absences payable 47 11,497 872Taxes payable 245 456 6Unearned revenues 7,218 16,216 413Pollution remediation — 4,561 —General obligation bonds payable 755 36,245 —Revenue bonds payable — 62,675 1,050Capital leases payable — 147 —State revolving loan payable — 17,418 —Landfill closure and post-closure care — 30,441 —Other liabilities 176 473 2,156
Total current liabilities 14,590 452,374 83,713
Noncurrent liabilitiesCompensated absences payable 1,074 58,724 16,519Other postemployment benefits 230 15,061 2,611Net pension liability 772 184,723 38,326General obligation bonds payable 7,199 1,121,031 —Revenue bonds payable — 2,748,909 —Capital leases payable — 2,094 —State revolving loans payable — 210,125 —Landfill closure and post-closure care — 217,875 —Estimated claim settlements — — 101,269Pollution remediation 245 42,061 —Asset retirement obligation 200 5,680 —Other liabilities 724 77,734 —
Total noncurrent liabilities 10,444 4,684,017 158,725TOTAL LIABILITIES 25,034 5,136,391 242,438
DEFERRED INFLOWS OF RESOURCESDeferred inflows on rate stabilization — 46,250 —Deferred inflows on pensions 1,742 107,357 21,789Deferred inflows on other post employment benefits 16 1,028 178
TOTAL DEFERRED INFLOWS OF RESOURCES 1,758 154,635 21,967
NET POSITIONNet investment in capital assets 136,069 2,384,935 63,731Restricted for:
Capital projects — 36,132 —Debt service — 156,161 —Regulatory assets and environmental liabilities — 76,763 —
Unrestricted 73,895 978,407 182,037TOTAL NET POSITION $ 209,964 $ 3,632,398 $ 245,768
Adjustment to reflect the consolidation of internal service fund activities related to enterprise funds 123,407Net position of business-type activities $ 3,755,805
The notes to the financial statements are an integral part of this statement.
Page 51
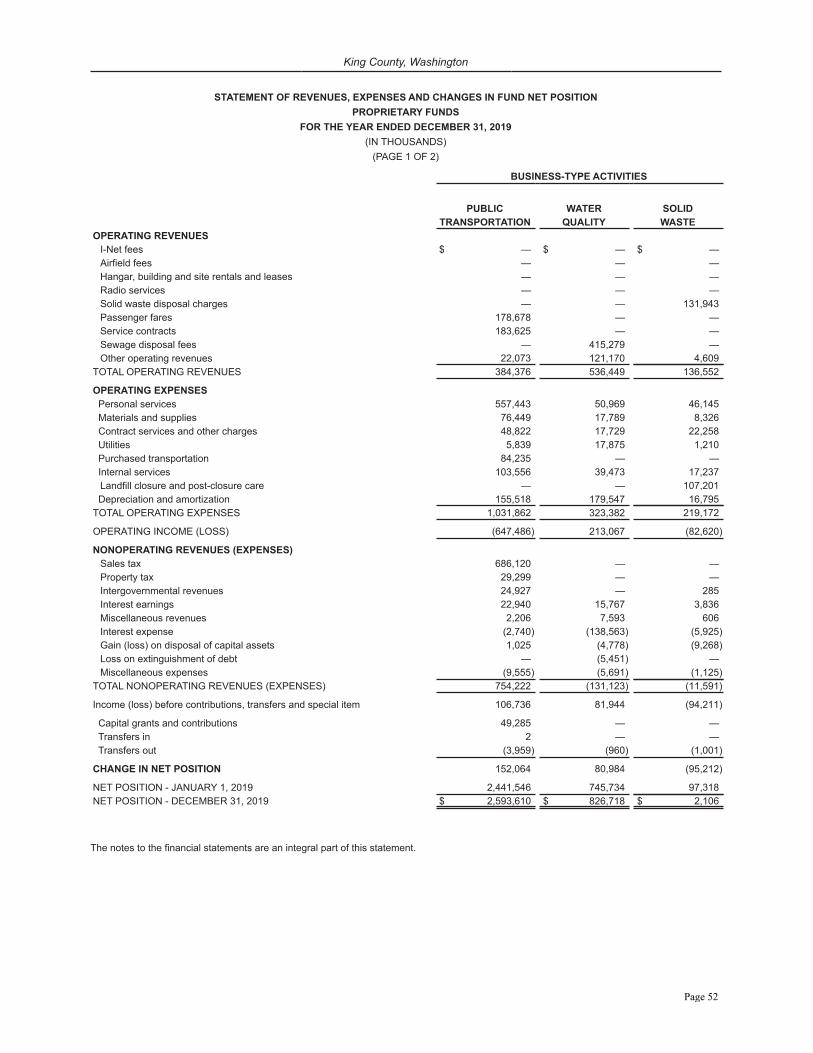
King County, Washington
STATEMENT OF REVENUES, EXPENSES AND CHANGES IN FUND NET POSITIONPROPRIETARY FUNDS
FOR THE YEAR ENDED DECEMBER 31, 2019(IN THOUSANDS)
(PAGE 1 OF 2)
BUSINESS-TYPE ACTIVITIES
PUBLIC WATER SOLIDTRANSPORTATION QUALITY WASTE
OPERATING REVENUESI-Net fees $ — $ — $ —Airfield fees — — —Hangar, building and site rentals and leases — — —Radio services — — —Solid waste disposal charges — — 131,943Passenger fares 178,678 — —Service contracts 183,625 — —Sewage disposal fees — 415,279 —Other operating revenues 22,073 121,170 4,609
TOTAL OPERATING REVENUES 384,376 536,449 136,552
OPERATING EXPENSES Personal services 557,443 50,969 46,145 Materials and supplies 76,449 17,789 8,326 Contract services and other charges 48,822 17,729 22,258 Utilities 5,839 17,875 1,210 Purchased transportation 84,235 — — Internal services 103,556 39,473 17,237
Landfill closure and post-closure care — — 107,201 Depreciation and amortization 155,518 179,547 16,795TOTAL OPERATING EXPENSES 1,031,862 323,382 219,172
OPERATING INCOME (LOSS) (647,486) 213,067 (82,620)
NONOPERATING REVENUES (EXPENSES)Sales tax 686,120 — —Property tax 29,299 — —Intergovernmental revenues 24,927 — 285Interest earnings 22,940 15,767 3,836Miscellaneous revenues 2,206 7,593 606Interest expense (2,740) (138,563) (5,925)Gain (loss) on disposal of capital assets 1,025 (4,778) (9,268)Loss on extinguishment of debt — (5,451) —Miscellaneous expenses (9,555) (5,691) (1,125)
TOTAL NONOPERATING REVENUES (EXPENSES) 754,222 (131,123) (11,591)
Income (loss) before contributions, transfers and special item 106,736 81,944 (94,211)
Capital grants and contributions 49,285 — — Transfers in 2 — — Transfers out (3,959) (960) (1,001)
CHANGE IN NET POSITION 152,064 80,984 (95,212)
NET POSITION - JANUARY 1, 2019 2,441,546 745,734 97,318NET POSITION - DECEMBER 31, 2019 $ 2,593,610 $ 826,718 $ 2,106
The notes to the financial statements are an integral part of this statement.
Page 52

King County, Washington
STATEMENT OF REVENUES, EXPENSES AND CHANGES IN FUND NET POSITIONPROPRIETARY FUNDS
FOR THE YEAR ENDED DECEMBER 31, 2019(IN THOUSANDS)
(PAGE 2 OF 2)
BUSINESS-TYPE ACTIVITIES
NONMAJOR INTERNALENTERPRISE SERVICE
FUNDS TOTAL FUNDSOPERATING REVENUES
I-Net fees $ 3,082 $ 3,082 $ —Airfield fees 3,597 3,597 —Hangar, building and site rentals and leases 24,195 24,195 —Radio services 7,139 7,139 —Solid waste disposal charges — 131,943 —Passenger fares 3,382 182,060 —Service contracts — 183,625 —Sewage disposal fees — 415,279 —Other operating revenues 314 148,166 619,910
TOTAL OPERATING REVENUES 41,709 1,099,086 619,910
OPERATING EXPENSESPersonal services 12,403 666,960 141,056Materials and supplies 2,316 104,880 10,205Contract services and other charges 5,917 94,726 369,193Utilities 2,812 27,736 —Purchased transportation — 84,235 —Internal services 11,998 172,264 29,788Landfill closure and post-closure care — 107,201 —Depreciation and amortization 8,375 360,235 16,023
TOTAL OPERATING EXPENSES 43,821 1,618,237 566,265
OPERATING INCOME (LOSS) (2,112) (519,151) 53,645
NONOPERATING REVENUES (EXPENSES)Sales tax — 686,120 —Property tax 6,079 35,378 —Intergovernmental revenues 956 26,168 —Interest earnings 2,272 44,815 5,271Miscellaneous revenues 347 10,752 —Interest expense (276) (147,504) (279)Gain (loss) on disposal of capital assets 2 (13,019) 953Loss on extinguishment of debt — (5,451) —Miscellaneous expenses — (16,371) (207)
TOTAL NONOPERATING REVENUES (EXPENSES) 9,380 620,888 5,738
Income (loss) before contributions, transfers and special item 7,268 101,737 59,383
Capital grants and contributions 14,796 64,081 3,531Transfers in — 2 2,539Transfers out (524) (6,444) (20,696)
CHANGE IN NET POSITION 21,540 159,376 44,757
NET POSITION - JANUARY 1, 2019 188,424 201,011NET POSITION - DECEMBER 31, 2019 $ 209,964 $ 245,768
Adjustment to reflect the consolidation of internal service fund activities related to enterprise funds 16,334Change in net position of business-type activities $ 175,710
The notes to the financial statements are an integral part of this statement.
Page 53

King County, Washington
STATEMENT OF CASH FLOWSPROPRIETARY FUNDS
FOR THE YEAR ENDED DECEMBER 31, 2019(IN THOUSANDS)
(PAGE 1 OF 4)
BUSINESS-TYPE ACTIVITIES
PUBLIC WATER SOLIDTRANSPORTATION QUALITY WASTE
CASH FLOWS FROM OPERATING ACTIVITIESCash received from customers $ 355,708 $ 541,372 $ 135,172Cash received from other funds - internal services 3,762 1,574 2,873Cash payments to suppliers for goods and services (187,622) (52,270) (40,559)Cash payments to other funds - internal services (103,835) (39,486) (17,237)Cash payments for employee services (591,764) (60,309) (52,978)Other receipts — 76,177 606Other payments — (18,730) (1,982)
NET CASH PROVIDED (USED) BY OPERATING ACTIVITIES (523,751) 448,328 25,895
CASH FLOWS FROM NONCAPITAL FINANCING ACTIVITIESOperating grants and subsidies received 740,025 — 116Interfund loan principal amounts loaned to other funds — — —Interfund loan principal repayments from other funds — — —Interfund advance principal loaned to other funds — — —Interfund advance principal repayments from other funds — — —Grants to others (3,237) — —Transfers in 2 — —Transfers out (3,959) (960) (1,001)
NET CASH PROVIDED (USED) BY NONCAPITAL FINANCING ACTIVITIES 732,831 (960) (885)
CASH FLOWS FROM CAPITAL AND RELATED FINANCING ACTIVITIESAcquisition of capital assets (204,566) (191,922) (14,913)Proceeds from capital debt — 142,215 1,256Principal paid on capital debt (12,930) (103,850) (6,420)Interest paid on capital debt (2,291) (150,008) (7,293)Cash payments for bond defeasance — (96,288) —Capital grants and contributions 98,946 — —Proceeds from disposal of capital assets 1,689 57 385
NET CASH USED BY CAPITAL AND RELATED FINANCING ACTIVITIES (119,152) (399,796) (26,985)
CASH FLOWS FROM INVESTING ACTIVITIESInvestment purchases — (689) —Interest on investments 22,629 15,581 3,806
NET CASH PROVIDED BY INVESTING ACTIVITIES 22,629 14,892 3,806
NET INCREASE IN CASH AND CASH EQUIVALENTS 112,557 62,464 1,831
CASH AND CASH EQUIVALENTS - JANUARY 1, 2019 756,747 539,230 126,110CASH AND CASH EQUIVALENTS - DECEMBER 31, 2019 $ 869,304 $ 601,694 $ 127,941
The notes to the financial statements are an integral part of this statement.
Page 54

King County, Washington
STATEMENT OF CASH FLOWSPROPRIETARY FUNDS
FOR THE YEAR ENDED DECEMBER 31, 2019(IN THOUSANDS)
(PAGE 2 OF 4)
BUSINESS-TYPE ACTIVITIESNONMAJOR INTERNAL
ENTERPRISE SERVICEFUNDS TOTAL FUNDS
CASH FLOWS FROM OPERATING ACTIVITIESCash received from customers $ 46,660 $ 1,078,912 $ 6,629Cash received from other funds - interfund services 1,974 10,183 617,175Cash payments to suppliers for goods and services (12,372) (292,823) (357,677)Cash payments to other funds - interfund services (12,103) (172,661) (59,294)Cash payments for employee services (13,822) (718,873) (151,557)Other receipts 375 77,158 6,115Other payments (90) (20,802) —
NET CASH PROVIDED (USED) BY OPERATING ACTIVITIES 10,622 (38,906) 61,391
CASH FLOWS FROM NONCAPITAL FINANCING ACTIVITIESOperating grants and subsidies received 6,084 746,225 —Interfund loan principal amounts loaned to other funds — — (20,250)Interfund loan principal repayments from other funds — — 15,800Interfund advance principal loaned to other funds — — (31,529)Interfund advance principal repayments from other funds — — 9,725Grants to others — (3,237) —Transfers in — 2 2,539Transfers out (524) (6,444) (20,696)
NET CASH PROVIDED (USED) BY NONCAPITAL FINANCING ACTIVITIES 5,560 736,546 (44,411)
CASH FLOWS FROM CAPITAL AND RELATED FINANCING ACTIVITIESAcquisition of capital assets (18,267) (429,668) (12,697)Proceeds from capital debt — 143,471 —Principal paid on capital debt (733) (123,933) (5,225)Interest paid on capital debt (353) (159,945) (298)Cash payments for bond defeasance — (96,288) —Capital grants and contributions 17,519 116,465 —Proceeds from disposal of capital assets 20 2,151 953
NET CASH USED BY CAPITAL AND RELATED FINANCING ACTIVITIES (1,814) (547,747) (17,267)
CASH FLOWS FROM INVESTING ACTIVITIESInvestment purchases — (689) —Interest on investments 2,238 44,254 5,270
NET CASH PROVIDED BY INVESTING ACTIVITIES 2,238 43,565 5,270
NET INCREASE IN CASH AND CASH EQUIVALENTS 16.606 193,458 4,983
CASH AND CASH EQUIVALENTS - JANUARY 1, 2019 67.548 1,489,635 368,419CASH AND CASH EQUIVALENTS - DECEMBER 31, 2019 $ 84,154 $ 1,683,093 $ 373,402
The notes to the financial statements are an integral part of this statement.
Page 55

King County, Washington
STATEMENT OF CASH FLOWSPROPRIETARY FUNDS
FOR THE YEAR ENDED DECEMBER 31, 2019(IN THOUSANDS)
(PAGE 3 OF 4)
BUSINESS-TYPE ACTIVITIES
PUBLIC WATER SOLIDTRANSPORTATION QUALITY WASTE
RECONCILIATION OF OPERATING INCOME (LOSS)TO NET CASH PROVIDED (USED) BY OPERATINGACTIVITIES:Operating income (loss) $ (647,486) $ 213,067 $ (82,620)
Adjustments to reconcile operating income (loss) to netcash provided (used) by operating activities:
Depreciation and amortization 155,035 167,777 16,699Nonoperating miscellaneous revenues (expenses) 2,206 2,658 (519)(Increases) decreases in assets:
Accounts receivable, net (22,788) (1,338) 2,911Due from other funds — (1) (2,300)Due from other governments, net (5,965) — 12Inventory (774) (80) (113)Prepayments 254 357 (91)Other assets 53 (476) —
(Increases) decreases in deferred outflows of resources:Deferred outflows on pensions, refunding, OPEB and ARO (6,199) (117) 149
Increases (decreases) in liabilities:Accounts payable 28,172 826 (3,667)Retainage payable 7 41 21Due to other funds (278) (14) —Wages payable 8,406 1,091 351Taxes payable (4) (21) 157Unearned revenues 1,587 491 13Claims and judgments payable — — —Compensated absences 248 40 (760)Other postemployment benefits 504 (7) (104)Net pension liability (46,409) (11,238) (6,102)Customer deposits and other liabilities 68 74,130 (45)Landfill closure and post-closure care — — 102,174
Increases (decreases) in deferred inflows of resources:Deferred inflows on pension and OPEB 9,612 1,142 (271)
Total adjustments 123,735 235,261 108,515
NET CASH PROVIDED (USED) BY OPERATING ACTIVITIES $ (523,751) $ 448,328 $ 25,895
NONCASH INVESTING, CAPITAL AND FINANCING ACTIVITIES:Public Transportation capital grants on account decreased by $49.7 million in 2019.Water Quality capital grants on account decreased by $258 thousand in 2019.
The notes to the financial statements are an integral part of this statement.
Page 56

King County, Washington
STATEMENT OF CASH FLOWSPROPRIETARY FUNDS
FOR THE YEAR ENDED DECEMBER 31, 2019(IN THOUSANDS)
(PAGE 4 OF 4)
BUSINESS-TYPE ACTIVITIESNONMAJOR INTERNAL
ENTERPRISE SERVICEFUNDS TOTAL FUNDS
RECONCILIATION OF OPERATING INCOME (LOSS)TO NET CASH PROVIDED (USED) BY OPERATINGACTIVITIES:Operating income (loss) $ (2,112) $ (519,151) $ 53,645
Adjustments to reconcile operating income (loss) to netcash provided (used) by operating activities:
Depreciation and amortization 8,335 347,846 16,023Nonoperating miscellaneous revenues (expenses) 356 4,701 —(Increases) decreases in assets:
Accounts receivable, net 747 (20,468) 717Due from other funds 207 (2,094) 27Due from other governments, net 139 (5,814) 11Inventory 125 (842) (554)Prepayments 20 540 (1,359)Other assets — (423) —
(Increases) decreases in deferred outflows of resources:Deferred outflows on pensions, refunding, OPEB and ARO (6) (6,173) (1,420)
Increases (decreases) in liabilities:Accounts payable (4,611) 20,720 748Retainage payable — 69 227Due to other funds (106) (398) (3)Wages payable 151 9,999 1,347Taxes payable 21 153 (11)Unearned revenues 7,135 9,226 —Claims and judgments payable — — 2,012Compensated absences 133 (339) 30Other postemployment benefits 14 407 (129)Net pension liability (1,907) (65,656) (12,066)Customer deposits and other liabilities 1,745 75,898 409Landfill closure and post-closure care — 102,174 —
Increases (decreases) in deferred inflows of resources:Deferred inflows on pension and OPEB 236 10,719 1,737
Total adjustments 12,734 480,245 7,746
NET CASH PROVIDED (USED) BY OPERATING ACTIVITIES $ 10,622 $ (38,906) $ 61,391
NONCASH INVESTING, CAPITAL AND FINANCING ACTIVITIES:Internal Service Funds received $3,531 thousand of capital assets from other funds and transferred $207 thousand of capital assets to other funds.
The notes to the financial statements are an integral part of this statement.
Page 57

King County, Washington
STATEMENT OF FIDUCIARY NET POSITIONFIDUCIARY FUNDS
DECEMBER 31, 2019(IN THOUSANDS)
CUSTODIAL FUNDSEXTERNAL OTHER
INVESTMENT CUSTODIALPOOL FUNDS FUNDS
ASSETSCash and cash equivalents $ — $ 132,202Investments at fair value:
Repurchase agreements 126,229 —Commercial paper 286,211 —U.S. agency discount notes 212,941 —Supranational discount notes 26,057 —Corporate notes 344,935 —Corporate notes floating rate 111,443 —U.S. Treasury notes 1,459,182 14,400U.S. agency notes 238,014 —U.S. agency collateralized mortgage obligations 1,796 —Supranational coupon notes 770,513 —
State Treasurer's investment pool 326,138 —Total investments 3,903,459 14,400
Taxes receivable for other governments — 74,862Accounts receivable — 24,872Interest receivable 7,507 —Assessments receivable for other governments — 2,175Notes and contracts receivable — 52
TOTAL ASSETS 3,910,966 248,563
LIABILITIESAccounts payable and other liabilities — 55,531Due to beneficiaries — 73,043Due to other governments — 62,172
TOTAL LIABILITIES — 190,746
NET POSITIONRestricted for:
Individuals, organizations and other governments 3,910,966 57,817TOTAL NET POSITION $ 3,910,966 $ 57,817
The notes to the financial statements are an integral part of this statement.
Page 58

King County, Washington
STATEMENT OF CHANGES IN FIDUCIARY NET POSITIONFIDUCIARY FUNDS
FOR THE YEAR ENDED DECEMBER 31, 2019(IN THOUSANDS)
CUSTODIAL FUNDSEXTERNAL OTHER
INVESTMENT CUSTODIALPOOL FUNDS FUNDS
ADDITIONSProperty taxes collected for other governments $ — $ 4,800,731State apportionment — 3,586,985Real estate excise taxes collected for other governments — 797,827Bond proceeds — 643,913Utility charges — 386,343Local support non-tax receipts — 368,637Member contributions — 243,206Drainage utility charges collected for other governments — 207,382Pool participant contributions 9,460,150 (9,460,150)Investment earnings:
Interest, dividends and other 87,547 29Net increase in fair value of investments 31,952 13
Total investment earnings 119,499 42Less investment costs:
Investment activity costs (1,713) —Net investment earnings 117,786 42
Charges for fire protection services — 32,815Receipts from other governments — 24,519Court fees collected for other governments — 16,678Lease contributions — 15,364Regulatory fees — 12,806Recording fees collected for other governments — 12,585Other taxes collected for other governments — 11,718Charges for emergency medical services — 7,710Impact fees collected for other governments — 3,794Food services receipts — 5,036Forest funds — 2,011Fines and forfeits collected for other governments — 378Licensing fees collected for other governments — 320Other fees collected for other governments — 188Permitting fees collected for other governments — 13Miscellaneous receipts — 202,901
Total additions 9,577,936 1,923,752
DEDUCTIONSPayments to vendors — 9,466,475Taxes distributed to other governments — 1,172,597Principal payments — 361,099Interest and other debt service costs — 268,111Other receipts distributed to other governments — 245,423Pool participant distributions 9,816,972 (9,816,972)Election costs — 5,714Payments to escrow — 4,950Treasurer collection fees — 2,606Cash management fees — 180Miscellaneous payments — 469,710
Total deductions 9,816,972 2,179,893
Net increase (decrease) in fiduciary net position (239,036) (256,141)
NET POSITION - BEGINNING (RESTATED) 4,150,002 313,958NET POSITION - ENDING $ 3,910,966 $ 57,817
The notes to the financial statements are an integral part of this statement.
Page 59

King County, Washington
STATEMENT OF NET POSITIONCOMPONENT UNITSDECEMBER 31, 2019
(IN THOUSANDS)
HARBORVIEW CULTURALMEDICAL DEVELOPMENT NJBCENTER AUTHORITY PROPERTIES TOTAL
ASSETS
Cash and cash equivalents $ 334,887 $ 25,644 $ — $ 360,531
Investments — 11,453 — 11,453
Receivables, net 191,598 — 3 191,601
Inventories 9,032 — — 9,032
Prepayments 12,440 273 7 12,720
Nondepreciable assets 26,010 — — 26,010
Depreciable assets, net of depreciation 258,971 — 258,971
Net investment in capital lease — — 8,156 8,156
Deposits with other governments 7,007 — — 7,007
Other assets 15,439 94 893 16,426
TOTAL ASSETS 855,384 37,464 9,059 901,907
DEFERRED OUTFLOWS OF RESOURCES
Deferred outflows on pensions — 275 — 275
TOTAL DEFERRED OUTFLOWS OF RESOURCES — 275 — 275
LIABILITIES
Accounts payable and other current liabilities 87,201 509 2 87,712
Accrued liabilities 53,382 — 38 53,420
Unearned revenues — 11,745 — 11,745
Noncurrent liabilities:
Due within one year 686 1,318 310 2,314
Due in more than one year 10,495 7,754 7,995 26,244
TOTAL LIABILITIES 151,764 21,326 8,345 181,435
DEFERRED INFLOWS OF RESOURCES
Deferred inflows on pensions — 430 — 430
TOTAL DEFERRED INFLOWS OF RESOURCES — 430 — 430
NET POSITION
Net investment in capital assets 284,981 — — 284,981
Restricted for:
Expendable 7,545 15,983 — 23,528
Nonexpendable 2,870 — — 2,870
Unrestricted 408,224 — 714 408,938
TOTAL NET POSITION $ 703,620 $ 15,983 $ 714 $ 720,317
The notes to the financial statements are an integral part of this statement.
Page 60

Kin
g C
ount
y, W
ashi
ngto
n
STAT
EMEN
T O
F A
CTI
VITI
ESC
OM
PON
ENT
UN
ITS
FOR
TH
E YE
AR
EN
DED
DEC
EMB
ER 3
1, 2
019
(IN T
HO
US
AN
DS
)
Net
(Exp
ense
) Rev
enue
Prog
ram
Rev
enue
s a
nd C
hang
es in
Net
Pos
ition
Ope
ratin
gC
apita
lH
AR
BO
RVI
EWC
ULT
UR
AL
Cha
rges
for
Gra
nts
and
Gra
nts
and
MED
ICA
LD
EVEL
OPM
ENT
NJB
Func
tions
/Pro
gram
sEx
pens
esSe
rvic
esC
ontr
ibut
ions
Con
trib
utio
nsC
ENTE
RA
UTH
OR
ITY
PRO
PER
TIES
Tota
l
Com
pone
nt U
nits
:H
arbo
rvie
w M
edic
al C
ente
r$
1,04
2,20
6$
1,06
2,96
3$
6,58
2$
3,60
9$
30,9
48$
—$
—$
30,9
48C
ultu
ral D
evel
opm
ent A
utho
rity
19,1
6016
24,
874
——
(14,
124)
—(1
4,12
4)N
JB P
rope
rties
613
103
——
——
(510
)(5
10)
Tota
l Com
pone
nt U
nits
$1,
061,
979
$1,
063,
228
$11
,456
$3,
609
$30
,948
$(1
4,12
4)$
(510
)$
16,3
14
Gen
eral
reve
nues
:In
tere
st e
arni
ngs
$—
$1,
089
$41
9$
1,50
8N
et g
ener
al re
venu
es—
1,08
941
91,
508
Cha
nge
in n
et p
ositi
on30
,948
(13,
035)
(91)
17,8
22N
et p
ositi
on -
Janu
ary
1, 2
019
(Res
tate
d)67
2,67
229
,018
805
702,
495
Net
pos
ition
- D
ecem
ber 3
1, 2
019
$70
3,62
0$
15,9
83$
714
$72
0,31
7
The
note
s to
the
finan
cial
sta
tem
ents
are
an
inte
gral
par
t of t
his
stat
emen
t.
Page 61

King County, Washington
Notes to the Financial StatementsFor the Year Ended December 31, 2019
Note 1 - Summary of Significant Accounting Policies
Note 2 - Reconciliation of Government-wide and Fund Financial Statements
Note 3 - Stewardship, Compliance and Accountability
Note 4 - Deposits and Investments
Note 5 - Receivables
Note 6 - Tax Revenues
Note 7 - Capital Assets
Note 8 - Restricted Assets
Note 9 - Pension Plans
Note 10 - Defined Benefit Other Postemployment Benefit (OPEB) Plan
Note 11 - Risk Management
Note 12 - Leases
Note 13 - Landfill Closure and Post-closure Care
Note 14 - Pollution Remediation
Note 15 - Long-term Liabilities
Note 16 - Interfund Balances and Transfers
Note 17 - Related Party Transactions
Note 18 - Components of Fund Balance, Restatements and Restrictions
Note 19 - Legal Matters, Financial Guarantees and Other Commitments
Note 20 - Subsequent Events
35
48
52
53
62
63
71
74
75
86
89
93
96
97
99
109
111
112
117
120
Page 62

King County, Washington
Note 1Summary of Significant Accounting Policies
Description of Government-wide Financial Statements
The government-wide financial statements (the Statement of Net Position and the Statement of Activities) report information on all of the non-fiduciary activities of the primary government and its component units. All fiduciary activities are reported only in the fund financial statements. Governmental activities, which normally are supported by taxes, intergovernmental revenues and other nonexchange transactions, are reported separately from business-type activities, which rely to a significant extent on fees and charges to external customers for support. Likewise, the primary government is reported separately from certain legally separate component units for which the primary government is financially accountable.
Reporting Entity
King County was founded in 1852 and operates under a Home Rule Charter that was adopted by a vote of County citizens in 1968 and which established an executive-council form of government. Citizens elect the County Executive to a four-year, full-time term and the nine-member council by district to staggered four-year terms. The accompanying financial statements present the government and its component units, entities for which the government is considered to be financially accountable. Blended component units are, in substance, part of the primary government’s operations, even though they are legally separate entities. Thus, blended component units are appropriately presented as funds of the primary government. Discretely presented component units are reported in a separate column in the government-wide financial statements to emphasize that they are legally separate from the government.
Blended Component Units
King County Flood Control District (FCD)
King County Flood Control District was created under the authority of chapter 86.15 RCW to manage, plan and construct flood control facilities within district boundaries. By statute, the King County Council serves as the Board of Supervisors for FCD.
FCD is a component unit of the County for the following reasons: (1) it is a legally separate entity established as a quasi-municipal corporation and independent taxing authority; (2) King County appoints the voting majority of FCD board because the County Council members are the ex officio supervisors of the district; and (3) the County can impose its will on FCD. FCD financial presentation is as a blended component unit because the two governing boards are substantively the same and there is a financial benefit relationship between the County and FCD. FCD contracts with King County Department of Natural Resources and Parks for flood control projects and programs. During 2019, FCD reimbursed the County $49.9 million for such projects and programs.
FCD issues its own financial statements, which are audited by the State Auditor's Office. Financial statements of FCD are included in Nonmajor Special Revenue Funds in the Governmental Funds section of this CAFR. Independently audited statements for the FCD can be obtained from Francis & Company, PLLC, 200 West Mercer St, Suite 208, Seattle, WA 98119.
Component Units – Discretely Presented
Harborview Medical Center (HMC)
Harborview Medical Center (HMC), a 413 licensed-bed hospital with extensive ambulatory services, is located in Seattle, Washington and is managed by the University of Washington (UW).
The HMC Board of Trustees is appointed by the County Executive. The County’s director of Finance and Business Operations Division is the Treasurer of HMC. The management contract between the HMC Board of Trustees and the UW Board of Regents recognizes the Trustees' desire to maintain HMC as a means of meeting King County’s obligation to provide the community with a resource for health services, and UW's desire that HMC be maintained as a continuing resource for medical education, training, and research. The general conditions of the management contract specify
Page 63

King County, Washington
that King County retains title to all real and personal property acquired for King County with HMC capital or operating funds.
The Trustees determine major institutional policies and retain control of programs and fiscal matters. The Trustees agree to secure UW's recommendations on any changes to the above. The Trustees are accountable to the public and King County for all financial aspects of HMC's operation and agree to maintain a fiscal policy that keeps the operating program and expenditures of HMC within the limits of operating income.
HMC is a component unit of the County for the following reasons: (1) it possesses de facto corporate powers evident from the UW management agreement; (2) the County Executive appoints HMC's Board of Trustees, who may be removed only for statutorily defined causes; and (3) HMC creates a financial burden on the County because the County is responsible for the issuance and repayment of all general obligation bonds for HMC capital improvements.
HMC is reported in the County’s CAFR using the discrete presentation method because the County and HMC's governing boards are not substantively the same and the hospital does not provide services solely to King County.
The primary classification of HMC is that of a component unit, however, the County is the issuer of HMC's general obligation bonds. Note 15 - "Long-term Liabilities" reports on all the general obligation bonds issued by the County as of December 31, 2019, including bonds reported by HMC as of June 30, 2019.
The County has not recorded an equity interest in HMC because it is not estimable. The management agreement under which HMC operates specifies that allocation of HMC's assets will be negotiated during a winding-up period following either the expiration of the agreement or its termination.
HMC hires independent auditors and prepares its own financial statements with a fiscal year ending June 30. These statements may be obtained from the Finance Section of the Harborview Medical Center, Box 359750, 325 Ninth Ave., Seattle, Washington, 98104.
Cultural Development Authority of King County (CDA), doing business as 4Culture
Cultural Development Authority of King County (CDA) is a public authority organized pursuant to Revised Code of Washington (RCW) 35.21.730 through 35.21.759 and King County Ordinance 14482. CDA commenced operations on January 1, 2003 and began doing business as 4Culture on April 4, 2004. CDA operates as a corporation for public purposes and was created to support, advocate for, and preserve the cultural resources of the region in a manner that fosters excellence, vitality, and diversity.
CDA is located in Seattle, Washington, and is governed by a 15-member board of directors and five ex officio members. The directors are appointed by the County Executive and confirmed by the County Council. CDA receives funds from King County through the Public Art Program where one percent of certain County construction project budgets are allocated to CDA to be used in providing artwork in County public spaces. For 2013-2020, the CDA is authorized to spend an endowment that was set-aside in prior years from a portion of the King County lodging tax receipts. In July of 2019, CDA launched Building for Equity, a two year joint initiative with the King County Council to support the existing needs of building projects within the cultural sector and to advance CDA’s funding practices aimed at improving equitable outcomes.
CDA is a component unit of the County for the following reasons: (1) it is a separate legal entity; (2) CDA’s board of directors is appointed by the County Executive (from a nonrestrictive pool of candidates) and confirmed by the County Council; and (3) the County is able to impose its will on CDA, for example, the County has the power to remove a director from the CDA board and the power to dissolve CDA. CDA’s financial presentation is as a discrete component unit because the County and CDA’s governing bodies are not substantively the same and CDA does not provide services solely to King County government.
CDA reports on a fiscal year-end consistent with the King County primary government. It issues its own financial statements, which are audited by the State Auditor’s Office. These statements may be obtained from CDA at 4Culture, 101 Prefontaine Place South, Seattle, Washington 98104.
Page 64

King County, Washington
NJB Properties
King County has a project lease agreement with NJB Properties, a Washington State nonprofit corporation, which provided for the design and construction of the Ninth and Jefferson Building (NJB) for use by Harborview Medical Center, a discrete component unit of the County. The agreement is in accordance with IRS Revenue Ruling 63-20 and Revenue Procedure 82-26. The building was financed through bonds issued by NJB Properties on behalf of the County. The building is being leased to the County by the nonprofit corporation under guaranteed monthly rent payments over the term of the lease or until the bonds are fully retired. Harborview Medical Center makes monthly transfers to King County to satisfy the County’s monthly rental payments to NJB Properties.
NJB Properties is recognized as a component unit of the County. Although it has an independently-appointed board, the nonprofit corporation is a single-purpose entity that is fiscally dependent on the County and who imposes a financial burden on the County because the monthly rent payments are considered limited general obligation debt. Because NJB Properties provides services almost exclusively to Harborview Medical Center and not to the County, it is reported using discrete presentation. Separately issued and audited financial statements for NJB Properties may be obtained from the National Development Council, 1218 Third Avenue, Suite 1403, Seattle, WA 98101.
Joint Venture
Seattle-King County Workforce Development Council (WDC) is a joint venture between King County and the City of Seattle. It was established as a nonprofit corporation in the State of Washington on July 1, 2000, as authorized under the Workforce Investment Act of 1998. It functions as the United States Department of Labor pass-through agency to receive the employment and training funds for the Seattle-King County area. The King County Executive and the Mayor of the City of Seattle, serving as the chief elected officials of the local area, have the joint power to appoint the members of the WDC board of directors and the joint responsibility for administrative oversight. An ongoing financial responsibility exists because of the potential for liability to grantors over disallowed costs. If expenditures of funds are disallowed by a grantor agency, WDC can recover the funds from (in order): (1) the agency creating the liability; (2) the insurance carrier; (3) future program years; and (4) as a final recourse, from King County and City of Seattle, each responsible for one-half of the disallowed amount. As of December 31, 2019, there are no outstanding program eligibility issues that might lead to a liability on the part of King County.
WDC contracts with King County to provide programs related to dislocated workers and workforce centers. For 2019, the WDC reimbursed King County approximately $1.5 million for the Employment and Education Resource Program in eligible program costs. King County has a $560 thousand equity interest in the WDC. Separately issued and independently audited financial statements may be obtained from the Workforce Development Council, 2003 Western Avenue, Suite 250, Seattle, Washington 98121.
Jointly Governed Organization
The Washington State Convention Center Public Facilities District (WSCC) was created in July 2010 to acquire, own and operate the convention and trade center transferred from a public nonprofit corporation that owned the original WSCC. The District’s board of directors consists of those nine directors who served at the time of the District’s creation. Following the expiration of the terms of the initial board, three members will be nominated by the County Executive subject to confirmation by the County Council, three members will be nominated by the City of Seattle, and three members will be appointed by the Washington state governor. Because there is equal representation in the governance of the District among the two local governments and the State, and the participant governments do not retain any ongoing financial interest nor any ongoing financial responsibility, the WSCC is a jointly governed organization.
Related Organizations
There are five separate entities for which the County is accountable, but is not financially accountable. These related organizations are King County Library System (KCLS), Library Capital Facility District (LCFD), King County Housing Authority (KCHA) and Washington State Major League Baseball Public Facilities District (PFD), and King County Regional Homelessness Authority (KCRHA). The County Council appoints a majority of the board of KCLS, KCHA and PFD; and, selected Councilmembers make up the three-member board of LCFD. The County Executive and two Councilmembers hold three of the twelve board positions of the KCRHA. There is no evidence that the County Council can influence the programs and activities of these five organizations or that they create a significant financial benefit or burden to the County.
Page 65

King County, Washington
The County serves as the treasurer for KCLS, LCFD, PFD and KCRHA providing services such as tax collection and warrant issuance. Due to this fiduciary relationship, these districts are reported as custodial funds to distinguish them from County funds.
Basis of Presentation - Government-wide Financial Statements
While separate government-wide and fund financial statements are presented, they are interrelated. The governmental activities column incorporates data from governmental funds and internal service funds that benefit the governmental activities, while business-type activities incorporate data from the government’s enterprise funds and internal service fund that benefit the business-type activities.
Separate financial statements are provided for governmental funds, proprietary funds, fiduciary funds (excluded from the government-wide financial statements), and component units. As discussed earlier, the government has three discretely presented component units, HMC, CDA and NJB. While none of the three is considered to be a major component unit, each is nevertheless shown in a separate column in the component unit financial statements.
As a general rule, the effect of interfund activity has been eliminated from the government-wide financial statements. Exceptions to this general rule include payments for services provided and other charges between the government’s water and transit functions and various other functions of the government. Elimination of these charges would misstate the direct costs of the purchasing function and the program revenues of the selling function.
HMC has a June 30 fiscal year end, differing from the County’s December 31 fiscal year end. The County reports HMC’s financial results as of June 30 in the financial statements. There is no material effect on the balances, transactions and interfund activity reported for the period, as a result of the disparity in reporting period.
Basis of Presentation – Fund Financial Statements
The fund financial statements provide information about the government’s funds, including its fiduciary funds and blended component units. Separate financial statements are provided for each fund category – governmental funds, proprietary funds and fiduciary funds. Governmental funds are reported by mission, which corresponds to the County’s strategic plan. Proprietary funds are reported by individual funds. The emphasis of fund financial statements is on major governmental and enterprise funds, each displayed in a separate column. All remaining governmental and enterprise funds are aggregated and reported as nonmajor funds. Major individual governmental and enterprise funds are reported as separate columns in the fund financial statements.
Major Governmental Funds
The County reports the following major governmental funds:
The General Fund is the government’s primary operating fund. It accounts for all financial resources of the general government except those required to be accounted for in another fund.
The Behavioral Health Fund encompasses the continuum of services for the King County Behavioral Health Administrative Services Organization (BH-ASO) and provides oversight and management of publicly funded mental health and substance use disorder services for eligible King County residents, with emphasis on prevention, intervention, treatment, and recovery. Its main sources of funding are Medicaid, federal and state grants, charges for services and property taxes.
Major Enterprise Funds
The County reports the following major enterprise funds:
The Public Transportation Enterprise accounts for the operations, maintenance, capital improvements and expansion of public transportation facilities in King County under the King County Metro Transit Division. Primary revenue sources include sales tax and passenger service fees. Construction and fleet replacement are funded through sales taxes, bonds and federal grants.
The Water Quality Enterprise accounts for the operations, capital improvements, and maintenance of the County’s water pollution control facilities. The enterprise has three large treatment plants, the recently constructed Brightwater
Page 66

King County, Washington
Treatment Plan that came online in 2011-12, the West Point Treatment Plant in Seattle, and the South Treatment Plant in Renton, as well as two smaller facilities, namely the Carnation and Vashon Island Treatment Plants.
The Solid Waste Enterprise accounts for the operation, maintenance, capital improvements, and expansion of the County’s solid waste disposal facilities under the Solid Waste Division of the Department of Natural Resources and Parks. The County operates eight solid waste transfer stations, two drop box stations, two household hazardous waste facilities, one regional landfill, and recycling services for residential customers. Operating revenues result primarily from tipping fees at the active solid waste disposal sites, while bond proceeds fund most new construction. Significant reserves are set aside to provide for post-closure care and remediation costs, and to replace capital equipment.
Nonmajor Governmental Funds
Special Revenue Funds are used to account for a variety of County programs including the arts, an automated fingerprint identification system, community development, road maintenance, emergency medical services, the enhanced 911 emergency telephone system, local hazardous waste management, parks, surface water management and other services.
Debt Service Funds are used by the County to account for the accumulation of resources for, and the payment of, principal and interest on the County’s general obligation bonds, and special assessment debt for certain special districts.
Capital Projects Funds are used to account for the acquisition, construction, and improvement of major capital assets and other capital-related activities such as infrastructure preservation, parks development and open space preservation, flood control, technology systems, and historic preservation.
Nonmajor Proprietary Funds
Enterprise Funds are used to account for the County’s business-type operations, including the King County International Airport, and other services.
Internal Service and Fiduciary Funds
Internal Service Funds are used to account for the provision of motor pool, information technology, risk management, construction and facilities management, financial, employee benefits program and other services provided by one department or agency to other departments or agencies of the County on a cost reimbursement basis. The Wastewater Equipment Rental Fund was established to exclusively serve the Water Quality Enterprise. It is consolidated for reporting purposes with business-type activities in the government-wide financial statements.
Custodial Funds are used to report cash received and disbursed in the County’s capacity as ex officio treasurer or collection agent for special districts and other governments and investment activity conducted by King County on behalf of legally separate entities.
During the course of operations, the government has activity between funds for various purposes. Any residual balances outstanding at year end are reported as due from/due to other funds and advances to/from other funds. While these balances are reported in fund financial statements, certain eliminations are made in the preparation of the government-wide financial statements. Balances between the funds included in governmental activities (i.e., the governmental and internal service funds that benefit the governmental activities) are eliminated so that only the net amount is included as internal balances in the governmental activities column. Similarly, balances between the funds included in business-type activities (i.e., the enterprise funds) are eliminated so that only the net amount is included as internal balances in the business-type activities column.
Further, certain activity occurs during the year involving transfers of resources between funds. In fund financial statements, these amounts are reported at gross amounts as transfers in/out. While reported in fund financial statements, certain eliminations are made in the preparation of the government-wide financial statements. Transfers between the funds included in governmental activities are eliminated so that only the net amount is included as transfers in the governmental activities column. Similarly, balances between the funds included in business-type activities are eliminated so that only the net amount is included as transfers in the business-type activities column.
Page 67

King County, Washington
Measurement Focus and Basis of Accounting
The accounting and financial reporting treatment is determined by the applicable measurement focus and basis of accounting. Measurement focus indicates the type of resources being measured such as current financial resources or economic resources. The basis of accounting indicates the timing of transactions or events for recognition in the financial statements.
The government-wide financial statements are reported using the economic resources measurement focus and the accrual basis of accounting. Revenues are recorded when earned and expenses are recorded when a liability is incurred, regardless of the timing of related cash flows. Property taxes are recognized in the year for which they are levied. Grants and similar items are recognized as revenue as soon as all eligibility requirements have been met.
The governmental fund financial statements are reported using the current financial resources measurement focusand the modified accrual basis of accounting. Revenues are recognized when susceptible to accrual (i.e., when they become both measurable and available). “Measurable” means the amount of the transaction can be reasonably estimated. “Available” means collectible within the current period or soon enough thereafter to be used to pay liabilities of the current period. For this purpose, the government considers revenues from property taxes to be available if they are collected within 60 days of the end of the current fiscal period. All other accrued revenue sources are determined to be available if collected within 12 months of the end of the current fiscal period. Expenditures generally are recorded when a liability is incurred, as under accrual accounting. However, debt service expenditures, as well as expenditures related to compensated absences and claims and judgments, are recorded only when payment is due. General capital asset acquisitions are reported as expenditures in governmental funds. Issuance of long-term debt and acquisitions under capital leases are reported as other financing sources.
Property taxes, sales and use taxes, business and occupation taxes, federal grants-in-aid, and charges for services are all considered to be susceptible to accrual and so have been recognized as revenues of the current fiscal period. Taxes imposed on exchange transactions are accrued when the underlying exchange transaction occurs if collected within one year. Revenues from licenses, permits, and fees are recognized when received in cash. Revenues related to expenditure-driven grant agreements are recognized when the qualifying expenditures are made, provided that the availability criteria are met. Expenditure-driven grant revenue is considered available if it can be collected at the same time cash is disbursed to cover the associated grant expenditure.
The proprietary and investment trust funds are reported using the economic resources measurement focus and the accrual basis of accounting. The agency funds have no measurement focus but utilize the accrual basis of accountingfor reporting assets and liabilities.
New Accounting Standards
GASB Statement No. 83, Certain Asset Retirement Obligations, is effective for fiscal years beginning after June 15, 2018. This Statement addresses accounting and financial reporting for certain asset retirement obligations. King County implemented the statement in 2019.
GASB Statement No. 84, Fiduciary Activities, is effective for fiscal years beginning after December 15, 2018. This Statement improves guidance regarding the identification of fiduciary activities for accounting and financial reporting. The statement was implemented by King County in 2019.
GASB Statement No. 88, Certain Disclosures Related to Debt, including Direct Borrowings and Direct Placements, is effective for fiscal years beginning after June 15, 2018. The primary objective of this Statement is to improve the information that is disclosed in notes to government financial statements related to debt, including direct borrowings and direct placements. It also clarifies which liabilities governments should include when disclosing information related to debt. The statement was adopted by King County in 2019.
GASB Statement No. 90, Majority Equity Interests-an amendment of GASB Statements No. 14 and No. 61, is effective for fiscal years beginning after December 15, 2018. This Statement improves financial reporting by providing users of financial statements with essential information related to presentation of majority equity interests in legally separate organizations that previously was reported inconsistently. In addition, requiring reporting of information about component units if the government acquires a 100 percent equity interest provides information about the cost of services to be provided by the component unit in relation to the consideration provided to acquire the component unit. This statement was adopted by King County in 2019.
Page 68

King County, Washington
Terminology
Expenditure Functions
Expenditures are presented on the non-major special revenue fund statements by county function. A short description of each function appears below.
General Government - Provided by the administrative branches of the government entity for the benefit of the public or governmental body as a whole. This function includes the County Council, County Executive, Performance Strategy and Budget, Information and Technology, Records and Licensing Services, Elections and Assessments.
Law, Safety and Justice - Essential to the safety of the public, including expenditures for law enforcement, detention and/or correction, judicial operations, protective inspections, emergency services and juvenile services. This function includes the Sheriff’s Office, Prosecuting Attorney, Superior Court, Public Defense, Judicial Administration, Adult and Juvenile Detention and Emergency Medical Services.
Physical Environment - Provided to achieve a satisfactory living environment for the community and the individual. This function includes Surface Water Management.
Transportation - Provided by the governmental entity for the safe and adequate flow of vehicles and pedestrians that includes expenditures for road and street construction, maintenance, transportation facilities and systems, and general administration. This function includes Road Services and Roads Capital Program.
Economic Environment - Provided for the development and improvement of the welfare of the community and individual. This function includes expenditures for employment opportunity and development, child care services, and services for the aging and disabled. This function includes Youth Employment Programs, Development and Environmental Services, Planning and Community Development, River Improvement, Animal Control, River and Flood Control Construction and Natural Resources.
Health and Human Services - Provided to promote healthy people and healthy communities by preventing and treating mental, physical, and environmentally induced illnesses. This function includes expenditures for community mental health, communicable diseases, environmental health, public health clinics and programs, alcoholism treatment, drug abuse prevention, programs for the mentally disabled and mentally ill, the medical examiner, hospitals and jail health services. This function also includes regional hazardous waste management.
Culture and Recreation - Provided to increase the individual’s understanding and enjoyment that includes expenditures for education, libraries, community events, parks and cultural facilities. This function includes Parks, Historical Preservation, Arts and Cultural Development and Law Library.
Debt Service - Accounts for the redemption of general long-term debt principal and interest and other debt service costs in the General, Special Revenue, Debt Service and Capital Projects Funds and payments to escrow agents other than refunding bond proceeds.
Capital Outlay - Accounts for expenditures related to capital projects and expenditures for capital assets acquired by outright purchase and by capital lease financing agreements.
Certain Accounts are Grouped on the Statement of Net Position:
• The asset account Receivables, net combines Taxes receivable - delinquent; Accounts receivable, net; Interest receivable; and Due from other governments, net.
• The liability account Accounts payable and other current liabilities combines Accounts payable, Retainage payable, Due to other governments, Custodial accounts and Other liabilities.
• The liability account Accrued liabilities combines Wages payable, Taxes payable and Interest payable.
• The liability account Noncurrent liabilities includes Claims and judgments payable, Estimated claim settlements, General obligation bonds, Revenue bonds payable, Capital leases, State revolving loans payable, Compensated absences, Pollution remediation, Other postemployment benefits, Net pension liability, Landfill closures and post-closure care, Asset retirement obligations, and Other liabilities.
Page 69

King County, Washington
Assets, Liabilities, Deferred Outflows/Inflows of Resources and Net Position/Fund Balance
Cash and Cash Equivalents
The government’s cash and cash equivalents are considered to be cash on hand, demand deposits and pooled equity invested in the King County Investment Pool.
All County funds and most component units and special districts participate in the King County Investment Pool (“Pool”) maintained by the King County Treasury Operations Section (See Note 4 - “Deposits and Investments”). The Pool consists of internal and external portions. For Pool participants, the Pool functions essentially as a demand deposit account where participants receive an allocation of their proportionate share of pooled earnings. Each fund’s equity share of the internal portion of the Pool’s net position is reported on the balance sheet as Cash and cash equivalents and reflects the change in fair value of the corresponding investment securities.
Included in the internal portion of the Pool is the investment of short-term cash surpluses not otherwise invested by individual funds. The interest earnings related to investment of short-term cash surpluses that are not pool participants are allocated to the General Fund in accordance with legal requirements and are used in financing general County operations.
Receivables (See Note 5 - “Receivables”)
Receivables include charges for services rendered by the County or intergovernmental grants that have not been received by the end of the fiscal year. All unbilled service receivables are recorded at year-end. The provisions for estimated uncollectible receivables are reviewed and updated at year-end. These provisions are estimated based on an analysis of an aging of the year-end Accounts receivable balance or the historical rate of collectability.
Taxes receivable - delinquent - This account includes receivables for property taxes levied for the current year and the allowance for uncollectible amounts. Revenue is recognized when payment is received within 60 days of the end of the fiscal period.
Accounts receivable, net - This account includes receivables for customer accounts, employee travel advances, abatement revenues from the DLS / Permitting Division, civil penalties, district court revenues, assessments on local improvement districts and abatement revenues and an allowance for uncollectible amounts from violations reported by the Code Enforcement Section on property within the County. Abatement costs may be certified to the property tax parcel; as a result, these costs might not be paid until the property is sold, which may take years.
Interfund Activity
Due to/from other funds - These accounts include any outstanding balances between funds on the governmental funds. Any residual balances outstanding between the governmental activities and business-type activities are reported in the government-wide financial statements as “Internal balances.”
Interfund short-term loan receivables/payables - These accounts include the short-term portion of lending or borrowing arrangements between funds that are outstanding at the end of the fiscal year.
Advances to/from other funds - Noncurrent portions of long-term interfund loans are reported as advances. In the governmental funds, Advances to other funds are included in nonspendable fund balance as they are long-term receivables and are not available for appropriation.
Interfund Reimbursements
Repayments from funds responsible for particular expenditures to the funds that initially paid for them are not recognized in the fund-level activity statements. Charge back transactions for shared services from certain departmental funds or cost centers to the fund of divisions under their administration are also treated as reimbursements.
Inventory
Inventories of governmental funds are recorded using the consumption method; expenditures are recognized when inventories are actually consumed. Proprietary funds expense inventories when used or sold. Facilities Management Department (FMD) and Public Health funds use the first-in, first-out (FIFO) valuation method. Radio Communications uses last-in, first-out (LIFO). The Motor Pool Equipment Rental, Public Works Equipment Rental, King County
Page 70

King County, Washington
International Airport, Marine, Solid Waste, Public Transportation and Water Quality Funds use the weighted average valuation method.
Prepayments
Payments made in advance to vendors for certain goods or services, such as building rent, that will benefit future periods are recorded as prepaid items in both the government-wide and fund financial statements. The expenditures are recognized in the period of consumption or occupancy.
Capital Assets (See Note 7 - “Capital Assets”)
Capital assets include: Land (fee simple land, rights-of-way and easements and farmland development rights); Infrastructure (roads and bridges network); Buildings; Improvements other than buildings; Furniture, machinery and equipment; Software and Artwork. Work-in-progress is reported for all unfinished construction and development for most capital assets except for roads and bridges infrastructure.
General capital assets, including those in internal service funds that support governmental funds, are reported in the governmental activities column of the government-wide Statement of Net Position.
Capital assets of enterprise funds, including those in internal service funds that exclusively support enterprise funds, are reported in the business-type column of the government-wide Statement of Net Position. Enterprise and internal service funds capital assets are also reported in the individual proprietary fund Statement of Net Position.
The capitalization threshold in the King County primary government is $5 thousand for machinery and equipment, $500 thousand for internally developed and purchased software, and $100 thousand for buildings, intangible assets and other improvements.
The County elects to use the modified approach for reporting infrastructure assets in lieu of the depreciation method because it is committed to maintaining the roads and bridges infrastructure indefinitely. The County is eligible to use the modified approach because it has an asset management system in place that allows for periodic monitoring of the infrastructure to ensure that assets are maintained and preserved at the predetermined condition level set by the Road Services Division. The asset management system tracks the mileage, condition and the actual and planned maintenance and preservation costs of individual infrastructure assets.
Certain equipment and facilities used in the Solid Waste Enterprise landfill closure and post-closure activities are not reported as capital assets. Instead, the liability for landfill post-closure care is reduced by these costs.
Capital assets are valued at historical cost or estimated historical cost where actual historical cost is not available. Donated capital assets are recorded at their acquisition value at the date of donation. Expenditures for normal maintenance and repairs which are essentially amounts spent in relation to capital assets that do not increase the capacity or efficiency of the item, or extend its useful life beyond the original estimate, are expensed as incurred. Expenditures for repairs and upgrades that materially add to the value or life of an asset are capitalized. Costs incurred to extend the life of governmental infrastructure assets are considered preservation costs and are therefore not capitalized.
Capital assets other than land, roads and bridges infrastructure, and artwork are depreciated or amortized over their estimated useful lives using a standard straight-line allocation method. Capital assets and their components useful lives are as follows:
DescriptionEstimated Life
(Years)
Buildings and other improvements 10-50Buses and trolleys 12-18Cars, vans, and trucks 3-10Downtown transit tunnel 50Equipment - other 3-25Software 3-10Sewer plant 20-50
Page 71

King County, Washington
Regulatory Accounting
King County Council has taken various regulatory actions resulting in differences between the recognition of revenues for rate-making purposes in the Water Quality Enterprise fund and their treatment under generally accepted accounting principles for nonregulated entities. Currently, the Water Quality Enterprise is authorized to apply the accounting treatment of costs under the GASB Statement No. 62 “Codification of Accounting and Financial Reporting Guidance Contained in Pre-November 30, 1989 FASB and AICPA Pronouncements” criteria because the rates for its services are regulated by the Metropolitan King County Council, and the regulated rates chargeable to its customers are designed to recover the enterprise’s allowable costs of operations.
Rate stabilization - The County Council established a Rate Stabilization Reserve in the Water Quality Enterprise fund. This allows for certain operating revenues to be treated as deferred inflows of resources and recognized as revenue in subsequent years through amortization in order to maintain stable sewer rates.
Regulatory assets - GASB Statement No. 62 is used by the Water Quality Enterprise to treat pollution remediation obligations, program payments to Rainwise participants, and strategic planning costs as regulatory assets to allow for cost recovery through future rate increases. The portion of regulatory asset costs that have been accrued is being amortized over a recovery period of 7 to 30 years.
Accrued Liabilities
Accrued liabilities refer to Accounts payable, Due to other governments, Interest payable, Wages payable and Taxes payable. Expenditures incurred during the year but paid in the subsequent year are recorded based on the following materiality thresholds according to when invoices were received:
February 3 - 13 $5,000February 14 - March 8 $50,000March 9 - 15 $100,000March 16 - April 10 $1,000,000
Individual assessments for specific funds are made for amounts not meeting the stated materiality thresholds. Grant-related items to be reported on the Schedule of Expenditures of Federal Awards or Schedule of State Financial Assistance are assessed without considering the materiality thresholds.
Unearned Revenues
Unearned revenues are obligations of the County to perform services or provide goods. This account offsets reported assets for revenues that have not met recognition requirements. Reported assets include grants received in advance, mitigation fees received in lieu of developers performing mitigation projects, prepayment for parks programs and rental facilities and rent prepaid by tenants in internal service funds.
Long-term Obligations (See Note 15 - “Long-term Liabilities”)
Long-term debt and other long-term obligations are reported in the applicable accrual basis statements of net position. Bond premiums and discounts, and refunding gains and losses, are deferred and amortized over the life of the associated bonds using the outstanding principal balance method. Bonds payable are reported net of the applicable premium or discount. Refunding losses are reported as deferred outflows of resources while refunding gains are reported as deferred inflows of resources.
In the fund financial statements, governmental fund types recognize bond premiums, discounts and bond issuance costs in the current period. The face amount of the debt issued is reported as other financing sources. Premiums on debt issuances are reported as other financing sources, while discounts on debt issuances are reported as other financing uses. Issuance costs, whether or not withheld from the actual debt proceeds received, are reported as debt service costs.
Rebatable Arbitrage
The County’s tax-exempt debt is subject to arbitrage restrictions as defined by the Internal Revenue Code. All of the County’s bonded debts are tax-exempt except certain taxable debts as identified in Note 15 - “Long-term Liabilities.” Arbitrage occurs when the funds borrowed at tax-exempt rates of interest are invested in higher yielding taxable
Page 72

King County, Washington
securities. The County had no arbitrage liability at December 31, 2019, in part because the yields on the County's Investment Pool remained at relatively low levels during 2019.
Net Pension Liability
For purposes of measuring the net pension liability, deferred outflows of resources and deferred inflows of resources related to pensions and pension expense, information about the fiduciary net position of all state sponsored pension plans and additions to/deductions from those plans, fiduciary net position have been determined on the same basis as they are reported by the Washington State Department of Retirement Systems. For this purpose, benefit payments (including refunds of employee contributions) are recognized when due and payable in accordance with the benefit terms. Investments are reported at fair value.
Deferred Outflows/Inflows of Resources
In addition to assets, the statement of financial position will sometimes report a separate section for deferred outflows of resources. This separate financial statement element, deferred outflows of resources, represents a consumption of net position that applies to a future period(s) and so will not be recognized as an outflow of resources (expense/expenditures) until then. The government only has four items that qualify for reporting in this category. They are the deferred charge on debt refunding, the deferred outflow of resources associated with pensions, postemployment benefits (OPEB), and the deferred retirement obligations associated with certain capital assets. A deferred charge on refunding results from the difference in the carrying value of refunded debt and its reacquisition price. This amount is deferred and amortized over the shorter of the life of the refunded or refunding debt. The deferred outflows of resources for pensions results from contributions subsequent to the measurement date, the difference between projected and actual investment earnings, the difference between expected and actual experience, and changes in actuarial assumptions and changes in proportions. The deferred outflows related to OPEB arise from changes in actuarial assumptions. The deferred outflow of resources related to the retirement of certain tangible capital assets arise from a legal obligation for the government to perform future asset retirement activities.
In addition to liabilities, the statement of financial position will sometimes report a separate section for deferred inflows of resources. This separate financial statement element, deferred inflows of resources, represents an acquisition of net position that applies to a future period(s) and so will not be recognized as an inflow of resources (revenue) until that time. The government has three types of items that qualify for reporting in this category. The deferred inflows of resources reported in the business-type activities and proprietary funds represent sewer revenues that are reserved annually to normalize future sewer rates (see Rate Stabilization, p. 45). The deferred inflows of resources on pensions and OPEB are reported in the government-wide Statement of Net Position.
The deferred inflows of resources on pensions and OPEB result from contributions subsequent to the measurement date, the difference between projected and actual investment earnings, the difference between expected and actual experience, and changes in actuarial assumptions and changes in proportions. The deferred inflows of resources-advanced grants is reported on the government-wide Statement of Net Position and the governmental funds Balance Sheet, representing grants received before meeting time requirements, but after all other eligibility requirements have been met. The deferred inflows of resources-unavailable revenue is reported only in the governmental funds balance sheet. The governmental funds report unavailable revenue from three sources: property taxes, district court receivables and abatement receivables. These amounts are deferred and recognized as an inflow of resources in the period that amounts become available.
Net Position Flow Assumption
Sometimes the government will fund outlays for a particular purpose from both restricted (e.g., restricted bond or grant proceeds) and unrestricted resources. In order to calculate the amounts to report as restricted - net position and unrestricted - net position in the government-wide and proprietary fund statements, a flow assumption must be made about the order in which the resources are considered to be applied. It is the County’s policy to consider restricted - net position to have been depleted before unrestricted - net position is applied.
Fund Balance Flow Assumptions
Sometimes the government will fund outlays for a particular purpose from both restricted and unrestricted resources (the total of committed, assigned and unassigned fund balance). In order to calculate the amounts to report as restricted, committed, assigned and unassigned fund balance in the governmental fund statements, a flow assumption must be made about the order in which the resources are considered to be applied. It is the County’s policy to consider restricted
Page 73

King County, Washington
fund balance to have been depleted before using any of the components of unrestricted fund balance. Further, when the components of unrestricted fund balance can be used for the same purpose, committed fund balance is depleted first, followed by assigned fund balance. Unassigned fund balance is applied last.
Fund Balance Policies
Fund balance of governmental funds is reported in various categories based on the nature of any limitations requiring the use of resources for specific purposes. The government itself can establish limitations on the use of resources through either a commitment (committed fund balance) or an assignment (assigned fund balance).
The committed fund balance classification includes amounts that can be used only for the specific purposes determined by a formal action of the government’s highest level of decision-making authority. The Metropolitan King County Council is the highest level of decision-making authority for the government that can, by adoption of an ordinance or motion prior to the end of the fiscal year, commit fund balance. Once adopted, the limitation imposed by the ordinance remains in place until a similar action is taken (the adoption of another ordinance) to remove or revise the limitation.
Amounts in the assigned fund balance classification are intended to be used by the government for specific purposes but do not meet the criteria to be classified as committed. The Council has by ordinance authorized the executive to assign fund balance. The Council may also assign fund balance as it does when appropriating fund balance to cover a gap between estimated revenue and appropriations in the subsequent year’s appropriated budget. Unlike commitments, assignments generally only exist temporarily. In other words, an additional action does not normally have to be taken for the removal of an assignment.
Compensated Absences
Compensated absences consist of vacation pay, sick pay, and compensatory time in lieu of overtime pay. Employees earn vacation based on their date of hire and years of service. Employees hired prior to January 1, 2018 have a maximum vacation accrual of 480 hours, while those hired January 1, 2018 or after have a maximum vacation accrual of 320 hours unless the employee’s collective bargaining unit agreement specifies a different maximum. Unused vacation at retirement or normal termination is considered vested and payable to the employee, up to the employee’s maximum accrual. Employees also earn up to 12 days of sick leave per year and may accumulate sick leave balances without limit. If the employee is leaving their employment due to death or retirement, they are paid for 35 percent of the value of unused sick leave with no maximum. For reporting purposes, a variety of factors are used to estimate the portion of the accumulated sick leave that is subject to accrual.
A liability is accrued for estimated excess compensation payable to the Washington State Department of Retirement Systems based on an employee’s accrued vacation and sick leave. An excess compensation liability is incurred when an employee whose retirement benefits are based in part on excess compensation receives a termination or severance payment defined by the State as excess compensation. This includes, but is not limited to, a cash-out of unused annual leave in excess of 240 hours and a cash-out of any other form of leave. Compensated absences are reported in governmental funds only if they have matured (i.e., unused reimbursable leave still outstanding following an employee's resignation or retirement). All vacation pay liability and a portion of sick leave liability are accrued in the government-wide and proprietary statements.
Revenues and Expenditures/Expenses
Program Revenues
Amounts reported as program revenues include 1) charges to customers or applicants who purchase, use, or directly benefit from goods, services or privileges provided by a given function or segment and 2) grants and contributions that are restricted to meeting the operational or capital requirements of a particular function or segment. All taxes, including those dedicated for specific purposes, and other internally dedicated resources are reported as general revenues rather than as program revenues.
Allocating Indirect Expense to Functions
The Statement of Activities demonstrates the degree to which the direct expenses of a given function or segment are offset by program revenues. Direct expenses are those that are clearly identifiable with a specific function or segment. Indirect expenses that have been allocated from general government to various functional activities are reported in a separate column.
Page 74

King County, Washington
Proprietary Funds Operating and Nonoperating Revenues and Expenses
Proprietary funds distinguish operating revenues and expenses from nonoperating items. Operating revenues and expenses generally result from providing services in connection with a proprietary fund’s principal ongoing operations. User fees (sewage fees, passenger fares, disposal charges, etc.) charged by the County’s enterprise funds for the use of its business-type facilities and charges for services of internal service funds are classified as operating revenues. Rental income is operating revenue to the Airport enterprise, whose principal operation is leasing real property. The corresponding costs of service provision and delivery, including direct administration costs, depreciation or amortization of capital assets, and other allocations of future costs to current year operations (e.g., landfill post-closure, other postemployment benefits), comprise operating expenses. All other revenues and expenses not meeting this definition are reported as nonoperating.
Page 75

King County, Washington
Note 2Reconciliation of Government-wide and Fund Financial Statements
Explanation of certain differences between the Governmental Funds Balance Sheet and the Government-wide Statement of Net Position (in thousands): The governmental funds balance sheet includes reconciliation between fund balance - total governmental funds and net position - governmental activities as reported in the government-wide statement of net position.
One element of that reconciliation explains, “Long-term liabilities, including bonds payable, are not due and payable in the current period and therefore are not reported in the funds.”
Long-term liabilities reported for governmental activities:Bonds payable $ (657,997)Plus: Unamortized premiums on bonds sold (61,988)Accrued interest payable (5,341)Capital leases payable (8,156)Compensated absences (93,208)Net pension liability (192,779)Deferred inflows on pensions (137,869)Earned but unavailable court fines and penalties 6,771Earned but unavailable taxes and assessments 15,821Asset retirement obligations (150)Other postemployment benefits (93,600)Deferred inflows on OPEB (6,391)
Total adjustments related to long-term liabilities and deferred inflows $ (1,234,887)
Another element of that reconciliation states, “Capital assets used in governmental activities are not financial resources and are not reported in the funds.”
Capital assets reported for governmental activities:Nondepreciable assets $ 2,415,700Depreciable assets 1,031,944
Less: Capital assets in governmental internal service funds (all internal service funds except Wastewater Equipment Replacement) (56,910)
Total adjustments related capital assets $ 3,390,734
Another element of the reconciliation states, “Other long-term assets are not available to pay for current-period expenditures and therefore are deferred in the funds.”
Other long-term assets reported for governmental activities:Net pension asset $ 73,838Deferred outflows on refunding (to be amortized as interest expense) 14,530Deferred outflows on pensions 71,043Deferred outflows on other post employment benefits 2,207Deferred outflows on asset retirement obligation 135
Total adjustments related to long-term assets and deferred outflows $ 161,753
Page 76

King County, Washington
Another element of that reconciliation states, "Governmental activities internal service funds assets and liabilities are included in the governmental activities in the statement of net position."
Internal service funds reported for governmental activities:Net position of the governmental activities internal service funds $ 219,679Internal payable representing charges in excess of cost to the enterprise funds by the governmental activities internal service funds - prior years (82,130)Internal payable representing the amount overcharged to the enterprise funds by the governmental activities internal service funds - current year (15,188)
Total adjustments related to internal service funds $ 122,361
Explanation of certain differences between the Governmental Funds Statement of Revenues, Expenditures and Changes in Fund Balances and the Government-wide Statement of Activities (in thousands): The governmental funds statement of revenues, expenditures, and changes in fund balances includes reconciliation between net changes in fund balances - total governmental funds and changes in net positions of governmental activities reported in the government-wide statement of activities.
One element of that reconciliation explains, “Governmental funds report capital outlays as expenditures. However, in the statement of activities the cost of those assets is allocated over their estimated useful lives and reported as depreciation expense.”
Capital outlay reported for governmental activities:Capital outlay $ 171,693Depreciation expense (42,731)
Total adjustments related to capital outlay $ 128,962
Another element of that reconciliation states, “The net effect of various miscellaneous transactions involving capital assets (e.g., sales, trade-ins and donations) increases net position.”
Miscellaneous capital asset transactions reported for governmental activities:The statement of activities report the gain on the sale of capital assets while gross proceeds increase financial resources in the governmental funds. The difference is the net book value of capital assets sold. $ (36,852)Donations of capital assets increase net position in the statement of activities, but do not appear in the governmental funds. 13,206
Total adjustments related to miscellaneous capital asset transactions $ (23,646)
Another element of that reconciliation states, “Revenues in the statement of activities that do not provide current financial resources are not reported as revenues in the governmental funds.”
Revenues reported for the governmental activities:Unavailable revenue-property taxes $ (23)Unavailable revenue-abatement fees (225)Unavailable revenue-noxious weeds 26Unavailable revenue-charges for services (575)Unavailable revenue-fines and forfeits (330)Unavailable revenue-grants (350)Unavailable revenue-pet licenses (83)LEOFF special funding 3,173Judgments 93
Total adjustments related to revenues $ 1,706
Page 77

King County, Washington
Another element of that reconciliation states, “The issuance of long-term debt provides current financial resources to governmental funds, while the repayment of the principal of long-term debt consumes the current financial resources of governmental funds. Neither transaction has any effect on net position. Also, governmental funds report the effect of premiums and similar items when debt is first issued, whereas these amounts are deferred and amortized in the statement of activities.”
Debt issuance or refundings reported for governmental activities:Issuance of general government debt $ (118,217)Premium on bonds sold (21,372)Principal repayments 67,990Payment to escrow agent 63,652
Total adjustments related to debt issuance or refundings $ (7,947)
Another element of that reconciliation states, “Some expenses reported in the statement of activities do not require the use of current financial resources and therefore are not reported as expenditures in governmental funds.”
Expenses reported for governmental activities:Compensated absences $ (3,996)Other postemployment benefits 998Interest on long-term debt 8,188Lease amortization (15)Pension expense 66,390Transfers out (3,163)
Lease payments 135Total adjustments related to expenses $ 68,537
Another element of that reconciliation states, “Net revenues and expenses of certain activities of internal service funds are reported with governmental activities.”
Internal service funds reported for governmental activities:Investment interest earnings $ 4,768Revenues related to services provided to outside parties 7,531Expenses related to services provided to outside parties (6,879)Gain on disposal of capital assets 580Interest on long-term debt (279)Capital contributions 3,334Transfers in 2,539Transfers out (20,640)Internal service fund gains allocated to governmental activities 37,469
Total adjustments related to internal service funds $ 28,423
Page 78

King County, Washington
Explanation of certain differences between the Proprietary Funds Statement of Net Position and the Government-wide Statement of Net Position (in thousands): The proprietary funds statement of net position includes reconciliation between net position - total enterprise funds and net position of business-type activities as reported in the government-wide statement of net position.
The description of the reconciliation is “Adjustment to reflect the consolidation of internal service fund activities related to enterprise funds.” The assets and liabilities of one internal service fund, Wastewater Equipment Rental Fund, are included in the business-type activities in the statement of net position because the fund was established to serve the Water Quality Enterprise.
Consolidation of internal service fund activities related to enterprise funds:Net position of the business-type activities internal service fund $ 26,089Internal receivable representing charges in excess of cost to the enterprise funds by the governmental activities internal service funds - prior years 82,130Internal receivable representing the amount overcharged to the enterprise funds by the governmental activities internal service funds - current year 15,188
Total adjustments related to internal service fund activities related to enterprise funds $ 123,407
Explanation of certain differences between the Proprietary Funds Statement of Revenues, Expenses and Changes in Fund Net Position and the Government-wide Statement of Activities (in thousands): The proprietary funds statement of revenues, expenses and changes in fund net position includes a reconciliation between change in net position - total enterprise funds and change in net position of business-type activities as reported in the government-wide statement of activities.
The description of the reconciliation is “Adjustment to reflect the consolidation of internal service fund activities related to enterprise funds.”
Consolidation of internal service fund activities related to enterprise funds:
Investment interest earnings $ 503
Revenues related to services provided to outside parties 41
Expenses related to services provided to outside parties (37)
Gain on disposal of capital assets 166
Capital contributions 197
Transfers out (56)
Internal service fund gains allocated to business-type activities 15,520
Total adjustments related to internal service fund activities related to enterprise funds $ 16,334
Page 79

King County, Washington
Note 3Stewardship, Compliance and Accountability
Budgetary Basis of Accounting
Biennial budgets are adopted on the modified accrual basis of accounting for the General Fund, Behavioral Health Fund, nonmajor special revenue funds and debt service funds. The capital projects funds are controlled by multi-year budgets. Some funds reported as nonmajor special revenue funds are controlled by multi-year budgets. They include Long-Term Leases, Major Maintenance, Regional Justice Center Projects, Surface Water Capital, Transfer of Development Credits and Urban Reforestation and Habitat Restoration. The budget for the Flood Control District, a blended component unit, is approved under the authority of its respective governing body. The Law Library Fund, Road Improvement Districts and Treasurer's Operating and Maintenance have the authority under state law to pay expenditures without appropriations.
Revenues are estimated on the basis of when they become susceptible to accrual. Budgeted appropriations include both expenditures and other financing uses; they are budgeted based on liabilities expected to be paid in the given budget period for the acquisition of goods and services.
The Metropolitan King County Council enacts appropriations by ordinance, generally at the appropriation unit level. The Grants Fund is appropriated at the fund level. These are the legal levels of budgetary control. Unless otherwise provided by the appropriation ordinances, all unexpended and unencumbered operating appropriations lapse at the end of the biennium. The budgetary comparison schedules (budgetary basis) include variances at the appropriation level of expenditure.
Deficit Fund Equity
Nonmajor Governmental Funds
The KC Flood Control Contract fund reports a total fund balance deficit of $171 thousand. The fund primarily provides services to the Flood Control District. Future contract billing receipts are anticipated to reduce the fund deficit.
The Long-Term Leases fund reports a total fund deficit of $908 thousand. The Facilities Management Division has developed a plan to address the fund deficit which was approved by the Executive Finance Committee during 2016 and 2017. The fund balance deficit will be resolved by the end of 2022 through streamlined rates.
The Permitting and Abatement fund reports a total fund balance deficit of $142 thousand. The deficit mostly results from an industry-driven cyclical downturn in permitting activity in unincorporated King County. The next cyclical upturn is expected to resolve the fund deficit by 2024.
The Risk Abatement fund reports a total fund balance deficit of over $6.3 million. In December 2016, a judgment directed King County to pay the Washington State Department of Retirement Systems (DRS) $10.5 million in interest payments. The Risk Abatement fund made the payment to DRS in 2016. The deficit will be paid down over five years by transfers from the General Fund.
The Building Repair and Replacement fund reports a total fund deficit of $15.8 million. The deficit is mostly caused by the Children and Family Justice Center project. Expenditures pool faster than tax revenues are collected. Currently, an interfund loan is approved until all revenues can be collected.
Internal Service Funds
The County implemented GASB Statement Nos. 68 and 71 in 2015, which requires reporting its share of net pension liabilities. As a result, the following funds have deficit net positions at December 31, 2019 (in thousands):
Fund:Total NetPosition
Construction and Facilities Management $ (14,514)Financial Management Services (8,458)King County Geographic Information Systems (228)
Page 80

King County, Washington
Note 4Deposits and Investments
Deposits
King County maintains deposit relationships with several local commercial banks in addition to its concentration bank. The deposits that are not covered by the Federal Deposit Insurance Corporation (FDIC) are collateralized by the Public Deposit Protection Commission of the State of Washington (PDPC) at no less than 50 percent. Effective June 7, 2018, resolution 2018-1 adopted by Commission on June 1, 2018, allowed that “all Well Capitalized public depositaries may collateralize uninsured public deposits at no less than fifty percent.” The PDPC is a statutory authority established under chapter 39.58 RCW that governs public depositaries and provides that “All public funds deposited in public depositories, including investment deposits and accrued interest thereon, shall be protected against loss, as provided in the chapter.” It constitutes a multiple financial institution collateral pool that can make pro rata assessments to all public depositories within the state for their public deposits. PDPC protection is of the nature of collateral, not of insurance.
Custodial credit risk - Deposits The custodial credit risk for deposits is the risk that, in the event of a bank failure, the County’s deposits may not be recovered. State statutes require that certificates of deposit be placed in qualified public depositaries in the State of Washington and total deposits cannot exceed the net worth of the financial institution. Those institutions not meeting 100 percent collateralization or the minimum credit rating requirements may receive deposits up to the FDIC or federally guaranteed amounts. The County’s diversification policy limits the maximum amount of investment in certificates of deposit to 25 percent of the total amount of the portfolio and five percent from a single issuer.
As of December 31, 2019, the County’s total deposits, including certificates of deposits and excluding the equity in the component units, were $45.3 million in carrying amount and $39.9 million in bank balance, of which $13.7 million was exposed to custodial credit risk as uninsured and uncollateralized.
Investments
King County Investment Pool - The King County Investment Pool (KCIP), the main pool, consists of monies invested on behalf of the County and other special purpose districts within the County including school, fire, sewer, library, water and other districts. The KCIP operates in accordance with the King County Investment Policy which has been prepared in accordance with state law. This policy is reviewed annually and any modifications shall be approved by the King County Executive Finance Committee (EFC). The policy applies to all financial assets invested in the KCIP as defined in King County Code (KCC) 4.10.090.
This policy also covers King County non-pooled investments. Non-pooled King County investments, which do not meet the criteria of this policy, require approval by the EFC.
The King County Investment Pool is not registered with the Securities and Exchange Commission (SEC) as an investment company. Oversight is provided by the EFC, which serves the role of the County Finance Committee as defined in RCW 36.48.070.
The Investment Pool Advisory Committee (IPAC) was created by Ordinance 16280 to provide input to the EFC on matters related to the King County Investment Pool. The IPAC has not been vested with decision-making authority for the KCIP; it makes recommendations to the EFC on agenda items related to the KCIP.
The King County Investment Policy is designed to help King County meet the objectives of the KCIP. The objectives of the County’s investment policy are to invest public funds in a manner which will preserve the safety and liquidity of all investments within the KCIP while obtaining a reasonable return within established investment guidelines. The portfolio should be managed in a manner that is responsive to the public trust and consistent with state law. The King County Investment Pool is guided by the following principles:
1. The primary objective of King County’s investment of public funds is to safeguard investment principal.
2. The secondary objective is to maintain sufficient liquidity to ensure that funds are available to meet daily cash flow requirements.
3. The third consideration is to achieve a reasonable yield consistent with these objectives.
Investment Instruments - Statutes authorize King County to invest in:
• Savings or time accounts in designated qualified public depositories; and certificates, notes or bonds of the United States.
Page 81

King County, Washington
• Other obligations of the United States, its agencies, or in any corporation wholly owned by the United States government and supranational institutions where the United States is its largest shareholders.
• Bankers’ acceptances purchased on the secondary market, Federal Home Loan bank notes and bonds, Federal Land Bank bonds, Federal National Mortgage Association notes, debentures and guaranteed certificates of participation.
• Obligations of any other government-sponsored corporation whose obligation is or may become eligible as collateral for advances to member banks as determined by the board of governors of the Federal Reserve System.
• Commercial paper and corporate notes (within the policies established by the State Investment Board).
• Debt instruments of local and state general obligations.
• General obligation bonds issued by any states and revenue bonds issued by Washington state governments that are rated at least “A” by a nationally recognized rating agency.
King County voluntarily invests in the Washington State Treasurer’s Local Government Investment Pool (LGIP). The LGIP values its investments at amortized cost, which approximates fair value. The LGIP portfolio will be managed to meet the portfolio maturity, quality, diversification and liquidity requirements set forth in GASB 79 for external investment pools who wish to measure, for financial reporting purposes, all of its investments at amortized cost. LGIP is overseen by the Office of the State Treasurer, the State Finance Committee, the Local Government Investment Pool Advisory Committee and the Washington State Auditor’s Office.
LGIP participants may withdraw funds from the LGIP on any business day and must notify the LGIP of any withdrawal over $1.0 million no later than 9 A.M. on the same day the withdrawal is made. The State Treasurer also may suspend redemptions if the New York Stock Exchange suspends trading or closes, if U.S. bond markets are closed, if the SEC declares an emergency or if it has determined irrevocably to liquidate the LGIP and suspend withdrawals and payments of withdrawal proceeds in order to facilitate the permanent termination of the LGIP in an orderly manner.
The County is authorized to enter into repurchase agreements to meet the investment needs of the King County Investment Pool. Such transactions are governed by a Master Repurchase Agreement. County investment policies require that securities’ tri-party underlying repurchase agreements must have a fair value equal to at least 102 percent of repurchase price, plus accrued interest. Repurchase agreements in excess of 60 days are not allowed. Currently, the County’s tri-party custodial bank monitors compliance with some of these provisions.
Although the County is authorized to enter into reverse repurchase agreements, the County chose not to enter into this type of transaction since 2008. Also, the County did not buy, sell, or hold any derivative or similar instrument except for certain U.S. agency collateralized mortgage obligation securities during the year.
External Investment Pool - The King County Investment Pool administered by the King County Treasury Operations Section is an external investment pool. For investment purposes, the County pools the cash balances of County funds and participating component units, and allows for participation by other legally separate entities such as special districts, for which the County is the ex officio treasurer, and public authorities. The external portion of the KCIP (the portion that belongs to special districts and public authorities other than component units) is reported in the Fiduciary Funds under Custodial Section. Except for County agencies that have been approved to invest in the Pool-Plus program, it is County policy to invest all County funds in the King County Investment Pool. All non-County participation in the KCIP is voluntary.
All securities are reported at fair value. Fair value reports are prepared monthly and are distributed to all Pool participants. Fair value pricing is provided by the County’s investment accounting system. If a security is not priced by the County’s accounting system vendor, prices are obtained from the County’s safekeeping bank or from Bloomberg L.P., a provider of fixed income analytics, market monitors, and security pricing. The County has not provided or obtained any legally binding guarantees to support the value of the King County Investment Pool’s shares.
The King County Investment Pool values participants’ shares using an amortized cost basis. Monthly income is distributed to participants based on their relative participation during the period. Income is calculated based on: (1) realized investment gains and losses; (2) interest income based on stated rates (both paid and accrued); and (3) the
Page 82

King County, Washington
amortization of discounts and premiums on a straight-line basis. Income is reduced by the contractually agreed upon fees. This method differs from the fair value method used to value investments in the financial statements because the amortized cost method is not designed to distribute to participants all unrealized gains and losses due to changes in the fair values. The net change in the fair values of the investments is reported as an increase or decrease in cash and cash equivalents in the statement of net position.
The King County Investment Pool’s total fair value of investment including purchased interest was $7.5 billion at year-end. At year-end, the change in the fair value of the total investments for the reporting entity, after considering purchases, sales and maturities, resulted in a net markup from cost of $32.2 million. The following schedule shows the types of investments, the average interest rate, and the effective duration limits of the various components of the King County Investment Pool as of December 31, 2019 (dollars in thousands):
KING COUNTY INVESTMENT POOLAverage Effective
Investment Type Fair Value Principal Interest RateDuration(Years)
Repurchase Agreements $ 242,000 $ 242,000 1.55% 0.005Commercial Paper 545,325 547,375 2.01 0.203U.S. Agency Discount Notes 408,240 410,300 1.54 0.318Supranational Discount Notes 49,956 50,000 1.86 0.063Corporate Notes 661,244 655,365 2.64 1.521Corporate Notes Floating Notes 213,653 213,400 2.18 0.148U.S. Treasury Notes 2,768,359 2,750,000 2.15 1.320U.S. Agency Notes 456,309 455,000 1.84 0.894U.S. Agency Collateralized Mortgage Obligations 3,444 3,218 4.33 3.485Supranational Coupon Notes 1,476,026 1,472,593 2.15 1.009State Treasurer's Investment Pool (LGIP) 625,256 625,256 1.78 0.003
Total investments in Pool $ 7,449,812 $ 7,424,507 2.08 0.919
Custodial credit risk - Investments - Custodial credit risk is the risk that, in the event of the failure of the counterparty, the County will not be able to recover the value of its investments or collateral securities that are in the possession of an outside party. County policy mandates that all security transactions, including repurchase agreements, are settled “delivery versus payment (DVP).” This means that payment is made simultaneously with the receipt of the security. These securities are delivered to the County’s safekeeping bank or its tri-party custodian banks. Exempt from the DVP policy are Certificates of Deposits (CDs) and funds placed with the Local Government Investment Pool (LGIP).
Concentration of credit risk - Investments - Concentration of credit risk is the risk of loss attributed to the magnitude of a government’s investment in a single issuer. At year-end, the King County Investment Pool had concentrations greater than 5 percent in the following issuer: International Bank Reconstruction and Development, 8.3 percent.
Interest rate risk - Investments - Interest rate risk is the risk that changes in interest rates will adversely affect the fair value of an investment. Through its investment policy, the County manages its exposure to fair value losses arising from increasing interest rates by setting maturity and effective duration limits for the King County Investment Pool. The policy limit for the KCIP’s maximum effective duration is 1.5 years or less, and 40 percent of the KCIP’s total value in securities must have a maturity of 12 months or less. Securities in the portfolio cannot have an average life greater than five years at purchase. As of December 31, 2019, the effective duration of the main Pool was .919 years.
Credit risk - Debt Securities - Credit risk is the risk that an issuer or other counterparty to an investment will not fulfill its obligations. At year-end, the King County Investment Pool was not rated by a Nationally Recognized Statistical Rating Organization (NRSRO). In compliance with state statutes, the King County Investment Pool's policy authorizes investments in U.S. Treasury securities, U.S. federal agency securities and mortgage-backed securities, municipal securities and corporate notes (rated at least “A” by two NRSROs), commercial paper (rated at least the equivalent of “A-1” by two NRSROs), certificates of deposit issued by qualified public depositories, repurchase agreements and the LGIP.
The credit quality distribution below is categorized to display the greatest degree of credit risk as rated by Standard and Poor’s and Moody’s. For example, a security rated “AAA” by one rating agency and “AA” by another would be listed as “AA.”
Page 83

King County, Washington
This table shows the credit quality for all securities in the King County Investment Pool not backed by the full faith and credit of the United States (in thousands):
Credit Quality Distribution
Investment Type AAA or A-1 AA A Not Rated TotalRepurchase Agreements $ 242,000 $ — $ — $ — $ 242,000Commercial Paper 545,325 — — — 545,325U.S. Agency Discount Notes 408,240 — — — 408,240Supranational Discount Notes 49,956 — — — 49,956Corporate Notes 98,559 235,255 327,430 — 661,244Corporate Notes Floating Notes — 57,658 155,995 — 213,653U.S. Agency Notes — 456,309 — — 456,309U.S. Agency Collateralized Mortgage Obligations — 3,444 — — 3,444Supranational Coupon Notes 1,476,026 — — — 1,476,026State Treasurer's Investment Pool — — — 625,256 625,256
Total investments $ 2,820,106 $ 752,666 $ 483,425 $ 625,256 $ 4,681,453
The King County Investment Pool’s policies limit the maximum amount that can be invested in various securities. The following table summarizes the King County Investment Pool’s diversification policy:
OVERVIEW OF THE KING COUNTY INVESTMENT POOL’S POLICIESTO LIMIT INTEREST RATE & CREDIT RISK
Maximum Security Single MinimumInvestment Type Maturity Type Limit Issuer Limit Credit Rating
U.S. Treasury 5 Years 100% None N/AU.S. Federal Agency(1) 5 Years 100% 35% N/AU.S. Federal Agency MBS(2) 5 Year WAL 25% 25% N/ACertificates of Deposit(3) 1 Year 25% 5% A-1 or P-1Municipal Securities(4) 5 Years 20% 5% ACorporate Securities 5 Years 25% 2% A(5)
Commercial Paper 270 Days 25% 3% A-1/P-1(6)
Repurchase Agreements(7) 60 Days 100% 25% A-1 or P-1Bankers’ Acceptances 180 Days 25% 5% A-1/P-1(8)
State LGIP(9) N/A 25% 25% N/A
N/A = Not applicable(1) Senior debt only and includes Supranational agencies where the U.S. is the largest shareholder.(2) MBS counts towards the total that can be invested in any one U.S. federal agency.(3) Must be a public depository; if not 100% collateralized, must be rated at least A-1 or P-1.(4) County policy limits purchases to general obligation bonds rated A or better by Standard & Poor's or Moody's.
(5) Must be rated A or better by both Standard and Poor's and Moody's for 2 percent issuer limit. But if rated AA or higher, 3 percent issuer limit applies.(6) Must be rated in top credit category by Standard & Poor's and Moody's. Maturities > 100 days must have a long-term rating of A or higher.(7) Tri-party repurchase agreements collateralized at 102 percent and for purposes of aggregating across sectors, overnight repos shall not be included. Ten percent of the portfolio can be in overnight repos rated A-2 or P-2.(8) Bankers' acceptances must be rated in top credit category by Standard & Poor's and Moody's.(9) The State LGIP is a money market-like fund managed by the State Treasurer’s Office.
At year-end the King County Investment Pool was in compliance. The KCIP’s actual composition consisted of Repurchase Agreements, 3.3 percent; Commercial Paper, 7.3 percent; U.S. Agency Discount Notes, 5.5 percent; Supranational Discount Notes, 0.7 percent; Corporate Notes, 8.9 percent; Corporate Notes Floating Rate, 2.9 percent; U.S. Treasury Notes, 37.1 percent; U.S. Agency Notes, 6.1 percent; Supranational Coupon Notes, 19.8 percent; and the LGIP, 8.4 percent.
Page 84

King County, Washington
Fair Value Hierarchy
The County categorizes its fair value measurements within the fair value hierarchy established by generally accepted accounting principles. The hierarchy is based on the valuation inputs used to measure fair value of the assets. Level 1 inputs are quoted prices in an active market for identical assets; Level 2 inputs are significant other observable inputs; and Level 3 inputs are significant unobservable inputs. The following is a summary of inputs in valuing the County’s investments as of December 31, 2019 (in thousands):
Fair Value Measurements Using
Investments by fair value levelFair Value 12/31/2019
Quoted Prices in Active
Markets for Identical Assets
(Level 1)
Significant Other
Observable Inputs
(Level 2)
Unobservable
Inputs (Level 3)
Commercial Paper $ 545,325 $ — $ 545,325 $ —U.S. Agency Discount Notes 408,240 — 408,240 —Corporate Notes 661,244 — 661,244 —Corporate Notes Floating Rate 213,653 — 213,653 —U.S. Treasury Notes 2,768,359 2,768,359 — —U.S. Agency Notes 456,309 — 456,309 —Supranational Discount Notes 49,956 — 49,956 —U.S. Agency Collateralized Mortgage Obligations 3,444 — 3,444 —Supranational Coupon Notes 1,476,026 — 1,476,026 —
Subtotals 6,582,556 $ 2,768,359 $ 3,814,197 $ —
Investments measured at amortized cost (not subject to fair value hierarchy)
Repurchase Agreements 242,000State Treasurer's Investment Pool 625,256
Subtotal investments measured at cost 867,256Total investments in Investment Pool $ 7,449,812
U.S. Treasury Notes are valued using quoted prices in active markets and classified in Level 1 of the fair value hierarchy.
Commercial Paper, U.S. Agency Discount Notes, Corporate Notes, Corporate Notes Floating Rate, U.S. Agency Notes, Supranational Discount Notes, U.S. Agency Collateralized Mortgage Obligations and Supranational Coupon Notes are valued using standard inputs including benchmark yields, reported trades, broker/dealer quotes, issuer spreads, two-sided markets, benchmark securities, bids, offers, and reference data including market research publications. Interactive Data also monitors market indicators, industry and economic events and corroborating market data and are classified in Level 2 of the fair value hierarchy.
Impaired Investment Pool
The King County Executive Finance Committee approved the bifurcation of the investment pool as of September 1, 2008. This separated the impaired investments into their own pool distinct from the main pool of performing investments. The reasons for bifurcating the pool were to: (1) ensure the yield on the performing assets is not negatively impacted by the impaired investments; (2) enhance transparency about the value of the performing pool and the impaired pool; (3) ease the implementation of the restructuring processes for the impaired investments.
For the bifurcation, the County placed four impaired commercial paper investments into an impaired investment pool (Impaired Pool). The Impaired Pool holds one commercial paper asset (Victoria), in which the County accepted an exchange offer in 2009 and is receiving the cash flows from the investment’s underlying securities. For the other three commercial paper investments (Cheyne, Mainsail and Rhinebridge), the County accepted a cash-out option in 2008, based on the results of three separate restructuring auctions conducted by the designated “receiver” of each commercial paper asset.
The fair value of the Impaired Pool at December 31, 2019, was $3.1 million and the book value was $4.5 million. The majority of the amount remaining in the impaired investment pool is associated with VFNC Trust (Victoria). VFNC Trust continues to make monthly cash distributions. During 2019, VFNC Trust distributed a total of $1.1 million to the County. Including all the receipts to date brings the cash recovery rate on the original VFNC Trust investment to 92 percent. Monthly distributions will continue for as long as the underlying securities in the trust continue to pay. This
Page 85

King County, Washington
monthly distribution is expected to continue for at least 5 to 10 more years or as long as the underlying securities continue to make cash payments. Also, because of extremely low interest rates, the County chose not to discount these future cash flows.
The impaired investments in commercial paper recorded at fair value total $3.1 million, are based on market price of the underlying securities that are held by VFNC Trust (Victoria) and the cash value retained by the receivers as of December 31, 2019, and are classified in Level 3 inputs of fair value hierarchy. These prices are provided by the collateral agent.
King County Investment Pool and Impaired Investment Pool Condensed Statements
The King County Investment Pool (main Pool) and the Impaired Investment Pool’s Condensed Statements of Net Position and Changes in Net Position as of December 31, 2019 (in thousands) are as follows:
Condensed Statement of Net Position
King County ImpairedTotal Investment Pool Pool
Net position held for pool participants $ 7,462,766 $ 7,459,715 $ 3,051
Equity of internal pool participants $ 3,566,460 $ 3,565,175 $ 1,285Equity of external pool participants 3,896,306 3,894,540 1,766Total equity $ 7,462,766 $ 7,459,715 $ 3,051
Condensed Statement of Changes in Net Position
Net position - January 1, 2019 $ 7,470,912 $ 7,466,891 $ 4,021Net change in investments by pool participants (8,146) (7,176) (970)Net position - December 31, 2019 $ 7,462,766 $ 7,459,715 $ 3,051
Pool Plus - Long-Term Investment Option
King County’s Executive Finance Committee (EFC) adopted the Pool-Plus program which allows approved County agencies and districts to invest funds beyond the maximum maturity limit established for the KCIP. This policy provides an investment option that allows a participant in the KCIP to request the County to combine a portfolio of individual long-term securities in the same fund that is invested in KCIP. The pooling of the long-term portfolio with the KCIP provides the ability to invest at durations longer than KCIP, while maintaining access to the liquidity of the KCIP. The Pool-Plus program allows qualifying funds to invest over longer durations recognizing there are: (1) potential risks such as increased price volatility and the possibility of selling securities before maturity to pay unexpected expenditures that could result in a loss of principal; (2) benefits from reducing reinvestment risk which improves the predictability of future budget revenue; (3) and potential rewards such as increased earnings.
The policy is intended to serve the following goals:
• Provide an investment option for funds with investment horizons far beyond the maximum maturity limit of the pool.
• Minimize credit risk exposure that long-term investments outside the KCIP will face. • Minimize the possibility of negative financial impacts on current pool participants. • Ensure that a fund requesting to invest in long-term investments outside the pool understands, and accepts,
the greater price volatility that is inherent in longer term investments. • Minimize any operational burden that would distract the investment team from its primary mission of managing
the investment pool.
The KCIP will be used for the liquidity portion of the portfolio, while the following investment types will be used for the longer term investments:
• U.S Treasuries or securities with full faith and credit of the U.S. government backing them.• Senior debt obligations issued by U.S. agencies, instrumentalities, or government-sponsored enterprises such
as Federal National Mortgage Association (FNMA), Federal Home Loan Bank (FHLB), Federal Farm Credit Bank (FFCB), and Federal Home Loan Mortgage Corporation (FHLMC). While these agencies have credit
Page 86

King County, Washington
ratings equivalent to the U.S. government, they are not explicitly guaranteed by the U.S. government. Financial market participants view them as having an “implied guarantee” because these agencies were chartered by Congress.
At yearend, the fair value of securities invested in the Pool Plus program was $15.6 million for County's agencies and $14.5 million for districts. The following schedule shows a summary of the characteristics of the assets in the Pool Plus program at December 31, 2019 (dollars in thousands):
KING COUNTY POOL-PLUS PROGRAM
Investment Type Fair Value Principal
Average Interest
Rate
Effective Duration (Years)
U.S Treasury Notes - County's agencies $ 15,628 $ 15,262 2.53% 4.200U.S. Treasury Notes - Districts funds 9,348 9,126 2.61% 3.900U.S. Treasury Notes - Districts funds 5,120 5,034 2.47% 3.770
Individual Investments Accounts
King County purchases individual investments for other legally separate entities, such as special districts and public authorities, which are not part of the financial reporting entity. Net positions in these individual investments accounts are reported in the Fiduciary Funds section under Custodial Funds.
Nonfinancial Assets
The County has some land that is being held for future sale. The investment is valued at $1.9 million which is determined based on comparable sales in the area or average per acre value of similar size and layout in the vicinity at the end of 2019.
Component Units
Harborview Medical Center (HMC)
Harborview Medical Center (HMC) participates in the County’s investment pool and follows the applicable criteria as described above for the King County Investment Pool deposits and investments.
Custodial credit risk - Deposits - The custodial credit risk for deposits is the risk that in the event of a bank failure, HMC’s deposits may not be recovered. As of June 30, 2019, the deposits not covered by the FDIC are uninsured and are partially collateralized by the PDPC collateral pool. HMC’s custodial credit risk for its deposits as shown in the following table (in thousands):
Harborview Medical CenterAs of June 30, 2019
Carrying Bank Uninsured andAmount Balance Uncollateralized
Cash in other banks $ 3,194 $ 220 $ 2,974Equity in Investment Pool 331,693 336,832 —
Total deposits $ 334,887 $ 337,052 $ 2,974
Cultural Development Authority of King County (CDA)
Deposits
The Cultural Development Authority of King County (CDA) maintains a deposit relationship with a local commercial bank. All deposits with this qualified public depositary that are not insured by the Federal Deposit Insurance Corporation (FDIC) are partially collateralized by the Public Deposit Protection Commission of the State of Washington (PDPC). The PDPC is a statutory authority established under charter 39.58 RCW and constitutes a multiple financial institution collateral pool that can make pro rata assessments to all public depositaries within the state for their public deposits. PDPC protection is of the nature of collateral, not of insurance.
Page 87

King County, Washington
Custodial credit risk - Deposits - The custodial credit risk for deposits is the risk that, in the event of a bank failure, the CDA's deposits may not be recovered. At yearend, the CDA’s total deposits, were $1.3 million in carrying amount, and $1.6 million in bank balance, of which $650 thousand was exposed to custodial credit risk as uninsured and uncollateralized.
Investments
The CDA has an investment policy to guide the management of its assets and help ensure that all investment activity is within the regulations established by State law and County codes. The primary objective is the preservation of principal.
State laws authorize CDA to invest in certificates, notes and bonds of the United States, and other obligations of the United States or its agencies, or any corporation wholly owned by the government of the United States. Statutes also authorize the CDA to invest in bankers’ acceptances purchased on the secondary market, Federal Home Loan bank notes and bonds, Federal Land Bank bonds, Federal National Mortgage Association notes and debentures and guaranteed certificates of participation.
CDA is also authorized to invest in the Washington State Local Government Investment Pool (LGIP). The LGIP values its investments at amortized cost, which approximates fair value. The LGIP funds are limited to high quality obligations with limited maximum and average maturities, which has the effect of minimizing both market and credit risk.
Fair Value Hierarchy
The CDA categorizes its fair value measurements within the fair value hierarchy established by generally accepted accounting principles. The hierarchy is based on the valuation inputs used to measure the fair value of the asset. Level 1 inputs are quoted prices in active markets for identical assets; Level 2 inputs are significant other observable inputs; Level 3 inputs are significant unobservable inputs.
The following is a summary of inputs in valuing CDA’s investments as of December 31, 2019 (in thousands):
Fair Value Measurements Using
Investments by fair value levelFair Value 12/31/2019
Quoted Prices in Active
Markets for Identical Assets
(Level 1)
Significant Other
Observable Inputs
(Level 2)
Unobservable
Inputs (Level 3)
U.S. Treasury Notes $ 762 $ 760 $ — $ —U.S Agency Notes 10,691 — 10,691 —
Subtotal investments at fair value 11,453 $ 760 $ 10,691 $ —
Investments measured at amortized cost (not subject to fair value hierarchy)
State Treasurer's Investment Pool (LGIP) 24,402Subtotal investments measured at cost 24,402Total CDA investments $ 35,855
U.S. Treasury Notes are valued using quoted prices in active markets and classified in Level 1 of the fair value hierarchy.
U.S. Agency notes are valued using significant other observable inputs other than quoted prices including issuer spreads scales by Interactive Data based on the new issue market, secondary trading, and dealer quotes and are classified in Level 2 of the fair value hierarchy.
Page 88
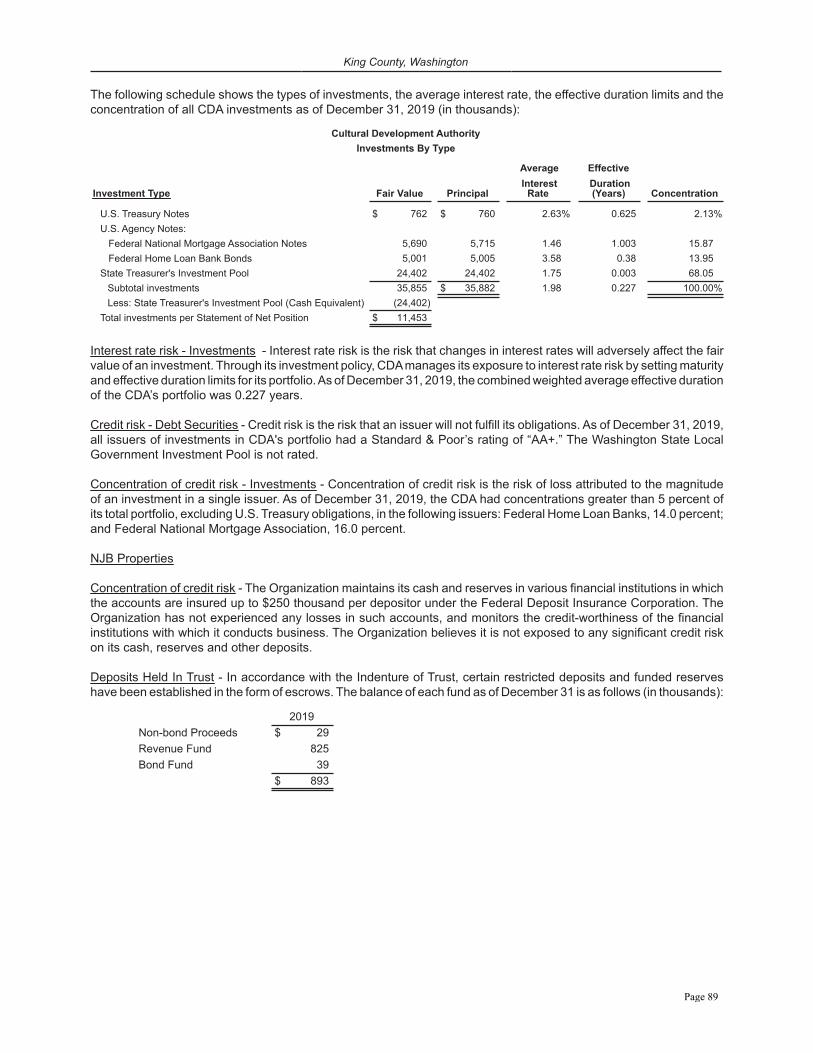
King County, Washington
The following schedule shows the types of investments, the average interest rate, the effective duration limits and the concentration of all CDA investments as of December 31, 2019 (in thousands):
Cultural Development AuthorityInvestments By Type
Average Effective
Investment Type Fair Value Principal Interest
Rate Duration(Years) Concentration
U.S. Treasury Notes $ 762 $ 760 2.63% 0.625 2.13%U.S. Agency Notes: Federal National Mortgage Association Notes 5,690 5,715 1.46 1.003 15.87 Federal Home Loan Bank Bonds 5,001 5,005 3.58 0.38 13.95State Treasurer's Investment Pool 24,402 24,402 1.75 0.003 68.05
Subtotal investments 35,855 $ 35,882 1.98 0.227 100.00%Less: State Treasurer's Investment Pool (Cash Equivalent) (24,402)
Total investments per Statement of Net Position $ 11,453
Interest rate risk - Investments - Interest rate risk is the risk that changes in interest rates will adversely affect the fair value of an investment. Through its investment policy, CDA manages its exposure to interest rate risk by setting maturity and effective duration limits for its portfolio. As of December 31, 2019, the combined weighted average effective duration of the CDA’s portfolio was 0.227 years.
Credit risk - Debt Securities - Credit risk is the risk that an issuer will not fulfill its obligations. As of December 31, 2019, all issuers of investments in CDA's portfolio had a Standard & Poor’s rating of “AA+.” The Washington State Local Government Investment Pool is not rated.
Concentration of credit risk - Investments - Concentration of credit risk is the risk of loss attributed to the magnitude of an investment in a single issuer. As of December 31, 2019, the CDA had concentrations greater than 5 percent of its total portfolio, excluding U.S. Treasury obligations, in the following issuers: Federal Home Loan Banks, 14.0 percent; and Federal National Mortgage Association, 16.0 percent.
NJB Properties
Concentration of credit risk - The Organization maintains its cash and reserves in various financial institutions in which the accounts are insured up to $250 thousand per depositor under the Federal Deposit Insurance Corporation. The Organization has not experienced any losses in such accounts, and monitors the credit-worthiness of the financial institutions with which it conducts business. The Organization believes it is not exposed to any significant credit risk on its cash, reserves and other deposits.
Deposits Held In Trust - In accordance with the Indenture of Trust, certain restricted deposits and funded reserves have been established in the form of escrows. The balance of each fund as of December 31 is as follows (in thousands):
2019Non-bond Proceeds $ 29Revenue Fund 825Bond Fund 39
$ 893
Page 89

King County, Washington
Note 5Receivables
Receivables are reported net of estimated uncollectible amounts in the basic financial statements: Balance Sheet for Governmental Funds and Statement of Net Position for Proprietary Funds. The schedule below shows receivables at gross with the related estimated uncollectible amounts (in thousands):
Nonmajor TotalBehavioral Governmental Governmental
Governmental General Fund Health Fund Funds FundsAccounts receivable:
Accounts receivable $ 40,782 $ 1,344 $ 18,020 $ 60,146Estimated uncollectible (31,784) — (9,546) (41,330)
Accounts receivable, net $ 8,998 $ 1,344 $ 8,474 $ 18,816
Due from other governments:Due from other governments $ 82,992 $ 14,081 $ 79,716 $ 176,789Estimated uncollectible (5) — (231) (236)
Due from other governments, net $ 82,987 $ 14,081 $ 79,485 $ 176,553
Nonmajor Total InternalPublic Water Solid Enterprise Enterprise Service
Proprietary Transportation Quality Waste Funds Funds FundsCurrent assets:
Accounts receivable:Accounts receivable $ 49,939 $ 40,158 $ 13,727 $ 808 $ 104,632 $ 632Estimated uncollectible (329) (13) (316) (8) (666) (48)
Accounts receivable, net $ 49,610 $ 40,145 $ 13,411 $ 800 $ 103,966 $ 584
Due from other governments:Due from other governments $ 256,347 $ — 397 $ 5,819 $ 262,563 $ 55Estimated uncollectible — — — (7) (7) —
Due from other governments, net $ 256,347 $ — $ 397 $ 5,812 $ 262,556 $ 55
Noncurrent assets:Due from other governments $ 28 — $ — — $ 28 —
Page 90

King County, Washington
Note 6Tax Revenues
Taxing Powers
King County is authorized to levy both “regular” property taxes and “excess” property taxes.
Regular property taxes are imposed for general municipal purposes, including the payment of debt service on limited tax general obligation bonds. Regular property tax levies are subject to rate limitations and amount limitations, as described below, and to the uniformity requirement of Article VII, Section 1, of the State Constitution, which specifies that a taxing district must levy the same rate on similarly classified property throughout the taxing district. Aggregate property taxes vary within the County because of its different overlapping taxing districts.
Maximum Rate Limitations. The County may levy regular property taxes for general municipal purposes and for road district purposes. Each purpose is subject to a rate limitation. The general municipal purposes levy is limited to $1.80 per $1,000 of assessed value, and the County levied $1.09639 per $1,000 of assessed value for the 2019 tax year. The road district levy, which is levied in unincorporated areas of the county for road construction and maintenance and other County services provided in the unincorporated areas, is limited to $2.25 per $1,000 of assessed value, for which the County currently is at $1.87677 per $1,000 of assessed value for the 2019 tax year. Additional statutory provisions limit the increase in the aggregate amount of taxes levied.
The County is authorized to increase its general purposes levy to a maximum of $2.475 per $1,000 of assessed value if the total combined levies for both general and road district purposes do not exceed $4.05 per $1,000 and if no other taxing district has its levy reduced as a result of the increased County levy (RCW 84.52.043).
The $1.80 per $1,000 limitation on the general purposes levy is exclusive of the following regular property taxes:
(1) A voted levy for emergency medical services, limited to $0.50 per $1,000 of assessed value (RCW 84.52.069),
(2) A voted levy to finance affordable housing for very low income households, limited to $0.50 per $1,000 of assessed value (RCW 84.52.105), although, the County has not sought approval from voters for this levy,
(3) A non-voted levy for conservation futures, limited to $0.0625 per $1,000 of assessed value (RCW 84.34.230), and
(4) A non-voted levy for transit-related purposes, limited to $0.075 per $1,000 of assessed value (RCW 84.52.140).
One Percent Aggregate Regular Property Tax Levy Limitation. Aggregate regular property tax levies by the State and all taxing districts except port districts and public utility districts are subject to a rate limitation of 1.0 percent of the true and fair value of property (or $10.00 per $1,000 assessed value) by Article VII, Section 2, of the State Constitution and RCW 84.52.050.
$5.90/$1,000 Aggregate Regular Property Tax Levy Limitation. Within the 1.0 percent limitation described above, aggregate regular property tax levies by all taxing districts except the State, port districts and public utility districts are subject to a rate limitation of $5.90 per $1,000 of assessed value by RCW 84.52.043(2). This limitation is exclusive of excess levies authorized by Article VII, Section 2, of the State Constitution; levies for acquiring conservation futures, for emergency medical services, affordable housing for very low income households, for ferry districts, for transit-related purposes, for regional transit authorities, for criminal justice purposes, a portion of certain levies by metropolitan park districts, fire protection districts and certain flood control zone districts.
If aggregate regular property tax levies exceed the 1.0 percent or $5.90 per $1,000 of assessed value limitations, then, in order to bring the aggregate levy into compliance, levies requested by “junior” taxing districts within the area affected are reduced or eliminated according to a detailed prioritized list (RCW 84.52.010). Junior taxing districts are defined by RCW 84.52.043 as all taxing districts other than the State, counties, cities, towns, road districts, port districts and public utility districts.
Regular Property Tax Increase Limitation. The regular property tax increase limitation (RCW 84.55) limits the total dollar amounts of regular property taxes levied by an individual taxing district to the amount of such taxes levied in the
Page 91

King County, Washington
highest of the three most recent years multiplied by a limit factor, plus an adjustment to account for taxes on new construction at the previous year’s rate. The limit factor is defined as the lesser of 101 percent or 100 percent plus inflation, but if the inflation rate is less than 1.0 percent, the limit factor can be increased to 101.0 percent, if approved by a majority plus one vote of the governing body of the taxing district, upon a finding of substantial need. In addition, the limit factor may be increased, regardless of inflation, if such increase is authorized by the governing body of the taxing district upon a finding of substantial need and is also approved by the voters at a general or special election within the taxing district. Such election must be held less than 12 months before the date on which the proposed levy will be made, and any tax increase cannot be greater than described under “Maximum Rate Limitations.” The approval of a majority of the voters would be required for the limit factor to be increased. The new limit factor will be effective for taxes collected in the following year only.
Since the regular property tax increase limitation applies to the total dollar amount levied, rather than to levy rates, increases in the assessed value of all property in the taxing district (excluding new construction) which exceed the growth in taxes allowed by the limit factor result in decreased regular tax levy rates, unless voters authorize a higher levy and vice versa for decreases in assessed value.
RCW 84.55.092 allows the property tax levy to be set at the amount that would be allowed if the tax levy for taxes due in each year since 1986 had been set at the full amount allowed under chapter 84.55 RCW. This is sometimes referred to as “banked” levy capacity. The County currently has no such banked levy capacity.
With a majority voter approval, a taxing district may levy, within the statutory rate limitations described above, more than what otherwise would be allowed by the tax increase limitations (RCW 84.55.050). This is known as a “levy lid lift,” which has the effect of increasing the taxing district’s levy “base” when calculating permitted levy increases in subsequent years. The new base can apply for a limited or unlimited period, except that if the levy lid lift was approved for the purpose of paying debt service on bonds, the new base can apply for no more than nine years. After the expiration of any limited purpose or limited duration specified in the levy lid lift, the levy is calculated as if the taxing district had levied only up to the limit factor in the interim period.
In 2018 the State Legislative approved SHB 2597 (Chapter 46, Wash. Laws of 2018), which permits cities and counties to provide senior citizens, individuals with disabilities, and veterans in the Senior Exemption Program with an exemption from any portion of their regular property tax attributable to a levy lid life, with voter approval.
Excess Property Taxes. The County also may impose “excess” property taxes, which are not subject to limitation, when authorized by a 60.0 percent supermajority voter approval, as provided in Article VII, Section 2 of the State Constitution and RCW 84.52.052. To be valid, such popular vote must have a minimum voter turnout of 40.0 percent of the number who voted at the last County general election, except that one-year excess tax levies also are valid if the number of voters approving the excess levy is at least 60% of a number equal to 40% of the number who voted at the last County general election. Excess levies also may be imposed without voter approval when necessary to prevent the impairment of the obligation of contracts.
Component Units with Taxing Authority. In 2019, the county-wide flood control zone district levy rate was $0.09660 per $1,000 of assessed value. The boundaries of the District's coterminous with the boundaries of the County and the members of the County Council serve initially as the legislative body for the District, but under state law, it is a separate taxing district with independent taxing authority.
A county-wide transportation benefit district known as the King County Transportation District (“KCTD”) was formed by the County Council in February 2014, as authorized by the State’s transportation benefit district law. Shortly, thereafter, the KCTD adopted a resolution to put a funding measure up for a public vote on April 22, 2014. The KCTD proposal was to enact a $60 annual vehicle fee and a one-tenth-of-a-cent increase in the sales tax; both would have expired after ten years. The measure failed by a margin of 46.0 percent to 54.0 percent, and at this time, the KCTD has no plans to propose any additional funding measures.
Allocation of Tax Levies
The table on the following page compares the allocation of the 2019 and 2018 Countywide, Conservation Futures, Unlimited Tax GO Bonds, Emergency Medical Services (EMS) and unincorporated County (Road District) levies. The original tax levy reflects the levy before any supplemental levies, tax cancellations or other adjustments. The 2019countywide assessed valuation was $606.6 billion, a $72 billion increase from 2018; the assessed valuation for the unincorporated area levy was $48.9 billion, an increase of $5.1 million from 2018.
Page 92

King County, Washington
ALLOCATION OF 2019 AND 2018 TAX LEVIES
2019 Original 2019 2018 Original 2018Taxes Levied Levy Rate Taxes Levied Levy Rate
(in thousands) (per thousand) (in thousands) (per thousand)
Countywide Levy
Assessed Value:
$606,623,698,132(a)
Items Within Operating Levy:(b)
General Fund $ 369,346 0.61087 $ 358,302 0.67262
Veterans' Relief 3,107 0.00514 3,010 0.00565
Human Services 6,977 0.01154 6,761 0.01269
Intercounty River Improvement 48 0.00008 49 0.00009
Automated Fingerprint Identification System 21,169 0.03501 22,123 0.04153
Parks Levy 78,152 0.12926 74,259 0.13940
Veterans and Human Services 56,287 0.09349 53,267 0.10000
Children and Family Justice Center 25,865 0.04278 25,054 0.04703
Best Starts for Kids 69,095 0.11428 65,656 0.12325
Radio Communications 32,614 0.05394 31,590 0.05930
Marine Operating 6,120 0.01012 5,930 0.01113
Total Operating Levy 668,780 1.10651 646,001 1.21269
Conservation Futures Levy
Conservation Futures Levy(c) 20,714 0.03426 11,071 0.02078
Farmland and Park Debt Service — — 8,999 0.01689
Total Conservation Futures Levy 20,714 0.03426 20,070 0.03767
Unlimited Tax GO Bonds (Voter-approved Excess Levy) 17,906 0.02974 17,298 0.03261
Transportation Levy(d) 29,353 0.04855 23,642 0.04438
Total Countywide Levy 736,753 1.21906 707,011 1.32735
Emergency Medical Services LevyAssessed Value:$606,502,929,644(a)
Emergency Medical Services Levy(e) 78,403 0.21762 76,412 0.23940
Unincorporated County Levy
Assessed Value:
$48,876,861,321(a)
County Road Fund(f) 91,211 1.87677 89,354 2.05402
Total County Tax Levies $ 906,367 $ 872,777
(a) Assessed value for taxes payable in 2019.
(b) The operating levy tax rate is statutorily limited to $1.80 per $1,000 of assessed value.
(c) The Conservation Futures Levy is limited statutorily to $0.0625 per $1,000 of assessed value.
(d) The Transportation Levy is limited statutorily to $0.075 per $1,000 of assessed value.
(e) The Emergency Medical Services Levy is limited statutorily to $0.335 over $1,000 of assessed value. The assessed value for the County's Emergency
Medical Services levy does not include the cities of Seattle or Milton.
(f) The County Road Fund Levy is levied only in the unincorporated areas of the County and is limited statutorily to $2.25 per $1,000 of assessed value.
The Automated Fingerprint Identification System (AFIS) levy, a regular property tax levy (RCW 84.55.050), was renewed in August 2018 for a six year term by a majority of voters in the County. The levy began in 2013 at a rate of no more than 0.0592 per $1,000 assessed value. In 2018 and 2019, the tax rate was 0.04153 and 0.03501 per $1,000 of assessed value, respectively.
Page 93

King County, Washington
In August 2013, the Park lid lift levy was renewed by voters for six years, for a rate of 0.1877 per $1,000 of assessed value. The 2018 and 2019 tax year rate for the Parks levy lid lift is 0.13940 and 0.12926 per $1,000 of assessed value, respectively.
In November 2017, voters approved a new temporary six-year lid lift for the Veterans, Seniors, and Human Services Levy at a rate of $0.10 per $1,000 of assessed value. This is a regular property tax levy and is to be increased by no more than 3.5% in each of the remaining five years. Due to the passage of SHB 2597 in the 2018 legislative session, this lid lift is now exempt for taxpayers in the Senior Exemption Program for the next five years of its existence. The 2018 and 2019 tax rate is 0.10000 and 0.09349 per $1,000 of assessed value, respectively.
The Children and Family Justice Center is a nine-year temporary levy lid lift approved by voters on August 7, 2012 at a rate of 0.070000 per $1,000 of assessed value for the first year (2013). The rate for 2018 and 2019 is 0.04703 and 0.04278 per $1,000 of assessed value.
A nine-year regular property tax levy for the Puget Sound Emergency Radio Network (PSERN) replacement was approved by voters in April 2015 at a rate of 0.07 per $1,000 of assessed value for the first year (2016). The rate for 2018 and 2019 is 0.05930 and 0.05394 per $1,000 assessed value.
The Best Starts for Kids levy was approved by voters at the November 3, 2015, general election that will be used to invest in prevention and early intervention strategies for children and families. This is a six-year levy beginning in 2016 at a rate of 0.13285 per $1,000 of assessed value. The rate for 2018 and 2019 is 0.12325 and 0.11428 per $1,000 of assessed value.
The County’s levy rate for transit-related purposes is 0.04855 per $1,000 of assessed value, and its levy rate for conservation futures is 0.03426 per $1,000 of assessed value in 2019.
The County’s EMS levy was approved at a special election on November 5, 2013, for an additional six years, at a rate of 0.335 or less per $1,000 of assessed value, with collections beginning in 2014. The rate for 2018 and 2019 is 0.23940 and 0.21762 per $1,000 of assessed value.
Assessed Valuation Determination
The County Assessor (the “Assessor”) determines the value of all real and personal property throughout the County that is subject to ad valorem taxation, with the exception of certain public service properties for which values are determined by the State Department of Revenue. The Assessor is an elected official whose duties and methods of determining value are prescribed and controlled by statute and by detailed regulations promulgated by the State Department of Revenue.
For tax purposes, the assessed value of property is 100.0 percent of its true and fair value. Since 1996, all property in the County has been subject to on-site appraisal and revaluation every six years, and is revalued each year based on annual market adjustments. Personal property is valued each year based on affidavits filed by the property owner. The property is listed by the Assessor on a roll at its current assessed value and the roll is filed in the Assessor’s office. The Assessor’s determinations are subject to revision by the County Board of Appeals and Equalization and, if appealed, subject to further revision by the State Board of Tax Appeals. At the end of the assessment year, in order to levy taxes payable the following year, the County Council receives the Assessor’s final certificate of assessed value of property within the County. Tax Collection Procedure
Property taxes are levied in specific amounts by the County Council and the rate for all taxes levied for all taxing districts in the County is determined, calculated and fixed by the Assessor based upon the assessed valuation of the property within the various taxing districts. The Assessor extends the tax levied within each taxing district upon a tax roll that contains the total amounts of taxes levied and to be collected and assigns a tax account number to each tax lot. The tax roll is delivered to the Treasury Operations Manager, who is responsible for the billing and collection of taxes due for each account. All taxes are due and payable on April 30 of each tax year, but if the amount due from a taxpayer exceeds $50, one-half may be paid then and the balance no later than October 31 of that year (except that the half to be paid on April 30 may be paid at any time prior to October 31 if accompanied by penalties and interest accrued until the date of payment).
Page 94

King County, Washington
The methods for giving notice of payment of taxes due, collecting taxes, accounting for the taxes collected, dividing the collected taxes among the various taxing districts, and giving notice of delinquency are covered by detailed statutes. Personal property taxes levied by the County Council are secured by a lien on the personal property assessed. A federal tax lien filed before the County Council levies the personal property taxes is senior to the County’s personal property tax lien. In addition, a federal civil judgment lien is senior to a lien on real property taxes once the federal lien has been recorded. In all other respects, and subject to the possible “homestead exemption” described below, the lien of property taxes is senior to all other liens or encumbrances of any kind on real or personal property subject to taxation. By law, the County may commence foreclosure on a tax lien on real property after three years have passed since the first delinquency. The State’s courts have not decided if the homestead law (chapter 6.13 RCW) gives the occupying homeowner a right to retain the first $125 thousand in proceeds of the forced sale of a family residency or other “homestead” property for delinquent general property taxes. The United States Bankruptcy Court for the Western District of Washington has held that the homestead exemption applies to the lien for property taxes, while the State Attorney General has taken the position that it does not.
Property Tax Calendar
January 1 Taxes are levied and become an enforceable lien against properties
February 14 Tax bills are mailed
April 30 First of two equal installment payments due
May 31 Assessed value of property established for next year’s levy at 100% of market value
October 31 Second installment due
Accounting for Property Taxes Receivable
In the governmental funds, property taxes levied for the current year are recorded on the balance sheet as taxes receivable and unavailable revenue - property taxes at the beginning of the year. Property taxes are recognized as revenue when collected in cash at which time the accounts taxes receivable and unavailable revenues - property taxes on the balance sheet are reduced by the amount of the collection. The amount of taxes receivable at year-end that would be collected soon enough to be used to pay liabilities of the current period is not material. At year-end, all uncollected property taxes are reported on the balance sheet as taxes receivable-delinquent and deferred inflow of resources. For the government-wide financial statements, the deferred inflow of resources related to the current period, net of the allowance for uncollectible property taxes, is reclassified as revenue.
Tax Abatements
As of December 31, 2019, the County provides tax abatements through three programs - the Current Use Program, Historic Preservation Program and the Single-family Dwelling Improvement Program. All of these programs are property tax abatements. The property tax system in the state of Washington is budget-based, which means the taxing authority determines a budget or dollar amount and adjusts the rates for the taxpayers based on the assessed valuation of their property. The tax abatements did not result in a reduction or loss of revenue to the County because, pursuant to state law, these taxes were effectively reallocated to other property taxpayers.
Current Use Programs
The Current Use Programs provide property tax abatements to landowners to voluntarily preserve open space, farmland or forestland via four programs on their property pursuant to RCW 84.33.130 and RCW 84.34.010.
Public Benefit Rating System (PBRS) enrollment and associated tax savings are based on a point system. Points are awarded for each PBRS resource category a property qualifies for such as protecting buffers to streams and wetlands, ground water protection, preserving significant wildlife habitat, conserving farmland and native forestland and preserving historic landmarks.
Timber Land enrollment requires a property to have between five and 20 acres of manageable forestland, and be zoned accordingly. Land participating in this program must be devoted primarily to the growth, harvest and management of forest crops for commercial purposes and must be managed according to an approved forest stewardship plan.
Farm and Agricultural Land enrollment requires land to be used for the production of livestock or agricultural commodities for commercial purposes.
Page 95
King County, Washington
Forestland enrollment requires a property to have more than 20 acres of eligible forestland primarily devoted to the growth and harvest of timber.
An owner of land desiring current use classification must submit an application to the County Assessor. Once enrolled, a participating property is assessed at a “current use” value, which is lower than the “highest and best use” assessment value that would otherwise apply to the property.
When land no longer meets the requirements for the respective classifications, abated taxes and applicable penalties and interest are collected.
Historic Preservation Program
The Historic Preservation Program provides property tax abatements through the legislature’s encouragement to maintain, improve and preserve privately owned historic landmarks pursuant to Chapter 84.26 RCW. The property must meet four criteria to qualify for special valuation to receive a reduction in property taxes. The property must: (1) be a historic property; (2) fall within a class of historic property determined eligible for special valuation by the local legislative authority; (3) be rehabilitated at a cost which meets the definition set forth in RCW 84.26.020(2) within 24 months prior to the application for special valuation; and (4) be protected by an agreement between the owner and the local review board as described in RCW 84.26.050(2). Abatement under this program remains valid for ten (10) consecutive assessment years from the date of application.
The County Assessor shall, for 10 consecutive assessment years following the calendar year in which application is made, place a special valuation on property classified as eligible historic property. The entitlement of property to the special valuation provisions of this section shall be determined as of January 1. If property becomes disqualified for the special valuation for any reason, the property shall receive the special valuation for that part of any year during which it remained qualified or the owner was acting in good faith belief that the property was qualified. At the conclusion of special valuation, the cost shall be considered new construction.
Whenever property classified and valued as eligible historic property under RCW 84.26.070 becomes disqualified for the valuation, there shall be added to the tax an additional tax equal to (a) the cost multiplied by the levy rate in each year the property was subject to special valuation; plus (b) interest on the amounts of the additional tax at the statutory rate charged on delinquent property taxes from the dates on which the additional tax could have been paid without penalty if the property had not been valued as historic property under this chapter; plus (c) a penalty equal to 12 percent of the amount determined in (a) and (b).
Single-family Dwelling Improvement Program
The Single-family Dwelling Improvement Program provides property tax abatements to encourage home improvements to single-family dwellings under RCW 84.36.400. Any physical improvement to single-family dwellings upon real property shall be exempt from taxation for the three (3) assessment years subsequent to the completion of the improvement. Abatements are obtained through application by the property owner, including proof that the improvements have been made and equal 100 percent of the additional property tax resulting from the increase in assessed value as a result of the improvements, not to exceed 30 percent of the pre-improvement value of the structure.
Multifamily Housing Property Tax Exemption
Chapter 5.73 of the Seattle Municipal Code provides an exemption from ad valorem property taxation for eligible housing construction and rehabilitation improvement projects for up to twelve years, depending on the circumstance of each project. The goal being to stimulate the construction of new multifamily housing and the rehabilitation of existing vacant and underutilized buildings for housing in Seattle. Among the eligibility requirements, the housing must be located in a residentially targeted area as designated by the city council. If the recipient of the tax abatement fails to comply with the statutory requirements of this Chapter the tax exemption shall be canceled and additional taxes, interest, and penalties will be imposed pursuant to state law.
Page 96

King County, Washington
Below summarizes the tax abatement programs and the total amount of taxes abated during the calendar year ended December 31, 2019 (in thousands):
Tax Abatement ProgramTotal Amount of
Taxes AbatedCurrent Use $2,459Single-family Dwelling Improvement $132Historic Preservation $584Multifamily Housing Property Tax Exemption $6
State of Washington Tax Abatements
The information provided by Washington State is based upon calendar 2018 as a proxy for fiscal year 2019. The State’s fiscal year end is June 30, 2019. The state of Washington provides tax abatements through seven programs subject to the requirements of GASB Statement No. 77, some of which are only available to businesses in the aerospace industry. Only tax abatement programs that are material and attributable to activities in King County are disclosed below.High Unemployment County Sales and Use Tax Deferral for Manufacturing Facilities
To encourage public and private investment in low-income areas with high rates of unemployment, sales and use tax arising from certain construction and equipment purchases for new and expanding manufacturers, persons conditioning vegetable seeds, research and development, and commercial testing for manufacturers in a Community Empowerment Zone (CEZ) may be permanently deferred if the project meets specific criteria per chapter 82.60 RCW.
Deferred taxes need not be repaid if the business fills at least one permanent full-time position for each $750 thousand investment with a resident of the CEZ by the end of the second calendar year following the year in which the project is certified as operationally complete. Failure to meet the employment requirement causes all deferred taxes to become immediately due.
High-Technology Sales and Use Tax Deferral
Chapter 82.63 RCW provides a deferral and ultimate waiver of sales and use tax to encourage the creation of high-wage, high-skilled jobs in Washington. The deferral applies to sales and use tax arising from the construction or expansion of a qualified research and development facility or a pilot scale manufacturing facility used in the fields of advanced computing, advanced materials, biotechnology, electronic device technology, or environmental technology.
If the investment project is used for any other purpose at any time during the calendar year in which the investment is certified as operationally complete, or during the next seven calendar years, a portion of the deferred taxes must be repaid immediately.
Multi-Unit Urban Housing Exemption
Chapter 84.14 RCW provides for an exemption from ad valorem property taxation for eligible housing construction, conversions, and rehabilitation improvement projects for a duration between eight and twelve years, depending on the circumstances of each project. The goal being to stimulate the construction of new multifamily housing and the rehabilitation of existing vacant and underutilized buildings for housing in urban centers. Among the eligibility requirements, the housing must be located in a residentially targeted area as designated by the city or county. If the recipient of the tax abatement fails to comply with the statutory requirements of this Chapter a lien will be placed on the property in the amount of the real property taxes that would normally be imposed, plus a penalty and interest.
Multipurpose Sports and Entertainment Facility Deferral
RCW 82.32.558 allows qualifying businesses to apply for a deferral of state and local sales and use taxes for multipurpose sports and entertainment facilities, associated parking structures, plazas and public spaces projects intended to attract professional ice hockey and basketball league franchises. Qualifying businesses receive a certificate for the taxes abated which expires upon project completion. Abated local sales and use taxes, and interest accrued from the date of project completion, may be repaid in annual installments beginning on January 1st of the year following the year of project completion. State sales and use taxes, along with aforementioned interest, must be paid back by
Page 97

King County, Washington
June 30, 2023. If the project is not complete within three calendar years from the date the certificate was issued, the amount of taxes outstanding for the project is immediately due and payable. The debt for taxes due is not extinguished by insolvency.
Aerospace Incentives
The state of Washington provides seven tax abatement and incentive programs to the aerospace industry to encourage the industry’s continued presence in the state of Washington.
RCWs 82.04.260(11), 82.04.290(3), and 82.04.250(3) allow for a reduced business and occupation (B&O) tax for manufacturers and processors for hire of commercial airplanes, component parts of commercial airplanes, or tooling designed for use in manufacturing commercial airplanes or components; non-manufacturers engaged in the business of aerospace product development; and certificated Federal Acquisition Regulation (FAR) repair stations making retail sales.
The purchase of goods and services, including labor, for the construction of new buildings used to manufacture commercial airplanes or fuselages or wings of commercial airplanes are exempt from sales and use tax per RCWs 82.08.980 and 82.12.980. The exemption also applies to new buildings or parts of new buildings used for storing raw materials or finished products used to manufacture commercial airplanes and certain commercial airplane parts. Port districts, political subdivisions, or municipal corporations may also use the sales and use tax exemption when constructing new facilities to lease to these manufacturers.
RCW 82.04.4461 allows a business and occupation tax credit equal to 1.5 percent of expenditures on aerospace product development performed within Washington.
Per RCW 82.04.4463, manufacturers and processors for hire of commercial airplanes or their component parts and aerospace tooling manufacturers are eligible for a business and occupation tax credit equal to the property and leasehold taxes paid on certain buildings, land, and the increased value from certain building renovations or expansions, as well as a portion of property taxes paid on certain machinery and equipment. Eligibility for the credit requires the building, land, and/or machinery and equipment be used exclusively in manufacturing commercial airplanes or their components or in manufacturing tooling specifically designed for use in manufacturing commercial airplanes or their components.
Non-manufacturers engaged in the business of aerospace product development and certificated FAR repair stations making retail sales are eligible for a business and occupation tax credit equal to property and leasehold taxes on certain buildings, land, and the increased value of renovated buildings, and qualifying computer equipment and peripherals under RCW 82.04.4463. Eligibility for the credit requires the building, land, and/or computer equipment and peripherals be used exclusively in aerospace product development or in providing aerospace services.
The purchase and use of computer hardware, software, or peripherals, including installation charges is exempt from sales and use tax per RCWs 82.08.975 and 82.12.975 if the buyer uses the purchased item primarily in developing, designing, and engineering aerospace products.
Leasehold interests in port district facilities used by a manufacturer of super-efficient airplanes are exempt from leasehold excise tax per RCW 82.29A.137. In addition, all buildings, machinery, equipment, and other personal property of a lessee of a port district used exclusively in manufacturing super-efficient airplanes is exempt from property taxation per RCW 84.36.655.
The following table shows the amount of taxes, attributable to activities in King County, abated by the state of Washington during the calendar year ended December 31, 2018 (in thousands):
Tax Abatement ProgramTotal Amount of
Taxes AbatedHigh Unemployment County Sales and Use Tax Deferral for Manufacturing Facilities D*High-Technology Sales and Use Tax Deferral $1,015Multi-Unit Urban Housing Exemption $11,851Multi-Purpose Sports and Entertainment Facility Deferral D*Aerospace incentives: Computer Hardware, Software and Peripherals sales and use tax exemption 54
*Washington State cannot disclose the amounts abated.
Page 98

King County, Washington
Note 7Capital Assets
Primary Government
A summary of changes in capital assets for the King County Primary Government (in thousands):
Balance Retirements / Transfers / Balance01/01/2019 Additions WIP Deductions Reclassifications 12/31/2019
Governmental Activities:Capital assets not being depreciated: *Land $ 605,837 $ 16,692 $ (48) $ 90 $ 622,571 *Rights-of-way and easements 474,122 6,360 (1,161) — 479,321 Infrastructure - road and bridges 1,121,670 12,859 (6,186) — 1,128,343 Art collections 10,495 — — — 10,495 Work in progress 384,290 125,973 (37,252) (298,041) 174,970 Total capital assets not being depreciated 2,596,414 161,884 (44,647) (297,951) 2,415,700Capital assets being depreciated: Buildings 1,027,150 8,464 — 188,594 1,224,208 Leasehold improvements 19,076 — — 19,272 38,348 *Improvements other than buildings 98,890 6,601 — 35,575 141,066 *Infrastructure – levees 36,175 — — 43,677 79,852 *Furniture, machinery and equipment 195,875 27,326 (6,825) 1,369 217,745 Software 129,519 — (204) 9,499 138,814 Total capital assets being depreciated 1,506,685 42,391 (7,029) 297,986 1,840,033Less accumulated depreciation for: *Buildings (505,353) (22,599) — — (527,952) Leasehold improvements (7,630) (1,599) — — (9,229) *Improvements other than buildings (29,540) (3,892) — — (33,432) *Infrastructure – levees (3,331) (583) — — (3,914) *Furniture, machinery and equipment (130,682) (16,001) 6,673 (35) (140,045) Software (82,184) (11,536) 203 — (93,517)
Total accumulated depreciation (758,720) (56,210) 6,876 (35) (808,089)Total capital assets being depreciated, net 747,965 (13,819) (153) 297,951 1,031,944Governmental activities capital assets, net $ 3,344,379 $ 148,065 $ (44,800) $ — $ 3,447,644
819,515 (46,802) (1,530) 5,239Business-type Activities: 2,971,710 50,415 (6,915) (2,138)Capital assets not being depreciated: Land $ 433,319 $ 218 $ — $ 3,946 $ 437,483 Rights-of-way and easements 30,570 — — — 30,570 Art collections 4,258 — — — 4,258 Work in progress 656,860 409,681 — (448,772) 617,769 Total capital assets not being depreciated 1,125,007 409,899 — (444,826) 1,090,080Capital assets being depreciated: Buildings 3,506,929 424 (4,357) 46,407 3,549,403 Leasehold improvements 7,307 — — — 7,307 Improvements other than buildings 425,519 4,487 (14,175) 99,448 515,279 Rights-of-way - temporary easement 7,635 — — — 7,635 Infrastructure – water quality 2,418,997 — (1,741) 54,264 2,471,520 Furniture, machinery and equipment 2,894,058 9,307 (57,323) 244,118 3,090,160 Software 149,318 — (287) 554 149,585 Total capital assets being depreciated 9,409,763 14,218 (77,883) 444,791 9,790,889Less accumulated depreciation for: Buildings (1,718,648) (88,970) 2,723 — (1,804,895) Leasehold improvements (4,161) (378) — — (4,539) Improvements other than buildings (192,138) (22,448) 14,175 (7) (200,418) Rights-of-way - temporary easement (1,581) (218) — — (1,799) Infrastructure – water quality (669,904) (50,788) 485 — (720,207) Furniture, machinery and equipment (1,588,329) (179,154) 45,024 42 (1,722,417) Software (114,263) (8,434) 287 — (122,410)
Total accumulated depreciation (4,289,024) (350,390) 62,694 35 (4,576,685)Total capital assets being depreciated, net 5,120,739 (336,172) (15,189) 444,826 5,214,204Business-type activities capital assets, net $ 6,245,746 $ 73,727 $ (15,189) $ — $ 6,304,284
Page 99
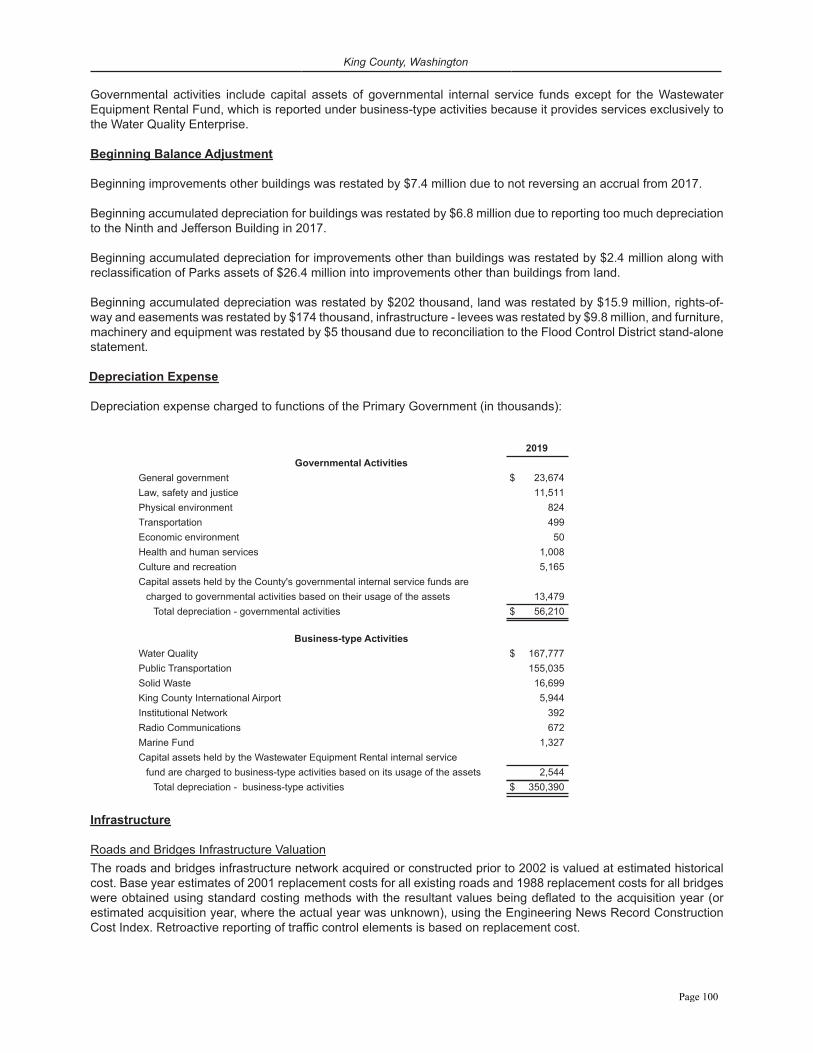
King County, Washington
Governmental activities include capital assets of governmental internal service funds except for the Wastewater Equipment Rental Fund, which is reported under business-type activities because it provides services exclusively to the Water Quality Enterprise.
Beginning Balance Adjustment
Beginning improvements other buildings was restated by $7.4 million due to not reversing an accrual from 2017.
Beginning accumulated depreciation for buildings was restated by $6.8 million due to reporting too much depreciation to the Ninth and Jefferson Building in 2017.
Beginning accumulated depreciation for improvements other than buildings was restated by $2.4 million along with reclassification of Parks assets of $26.4 million into improvements other than buildings from land.
Beginning accumulated depreciation was restated by $202 thousand, land was restated by $15.9 million, rights-of-way and easements was restated by $174 thousand, infrastructure - levees was restated by $9.8 million, and furniture, machinery and equipment was restated by $5 thousand due to reconciliation to the Flood Control District stand-alone statement.
Depreciation Expense
Depreciation expense charged to functions of the Primary Government (in thousands):
2019Governmental Activities
General government $ 23,674Law, safety and justice 11,511Physical environment 824Transportation 499Economic environment 50Health and human services 1,008Culture and recreation 5,165Capital assets held by the County's governmental internal service funds are
charged to governmental activities based on their usage of the assets 13,479Total depreciation - governmental activities $ 56,210
Business-type ActivitiesWater Quality $ 167,777Public Transportation 155,035Solid Waste 16,699King County International Airport 5,944Institutional Network 392Radio Communications 672Marine Fund 1,327Capital assets held by the Wastewater Equipment Rental internal service
fund are charged to business-type activities based on its usage of the assets 2,544Total depreciation - business-type activities $ 350,390
Infrastructure
Roads and Bridges Infrastructure ValuationThe roads and bridges infrastructure network acquired or constructed prior to 2002 is valued at estimated historical cost. Base year estimates of 2001 replacement costs for all existing roads and 1988 replacement costs for all bridges were obtained using standard costing methods with the resultant values being deflated to the acquisition year (or estimated acquisition year, where the actual year was unknown), using the Engineering News Record Construction Cost Index. Retroactive reporting of traffic control elements is based on replacement cost.
Page 100

King County, Washington
Rights-of-Way
Historical costs for infrastructure-related rights-of-way were obtained by estimating replacement costs at 2001 using land assessed valuation data and then deflating the resultant values to the acquisition year (or estimated acquisition year, where the actual year is unknown), using assessed land value indices from the King County Assessor’s Office.
Construction Commitments
Project commitments are defined as authorized and planned expenditures for the next fiscal year.
Enterprise Funds
Public Transportation Enterprise - $3.3 million is committed to the maintenance of existing infrastructure, service delivery and partnership efforts.
Water Quality Enterprise - $93.3 million is committed to ensuring the continued operation, reliability and compliance with regulatory standards of existing wastewater treatment facilities.
Solid Waste Enterprise - $4.0 million is committed to improving the County's solid waste regional landfill and maintenance of existing facilities. Other Enterprises - $793 thousand is committed for Airport facility improvements within the County and $4.5 million for the construction of Seattle Ferry Terminal and the replacement of infrastructure for Marine Enterprise.
Capital Projects Funds
$134.8 million is committed to various capital projects, including: (1) open space and conservation easement acquisitions; (2) development and improvement of trails, playgrounds and ballfields and other cultural facilities; (3) technology initiatives to improve business efficiency, emergency preparedness and network security; (4) flood control projects to protect the ecosystem and public property; (5) preservation of roads and construction of bridges; and (6) improvements and major repairs to office buildings and other facilities. Discretely Presented Component Units
Harborview Medical Center (HMC)
Capital assets activity for HMC during the fiscal year ended June 30, 2019 (in thousands):
Balance Balance7/1/2018 Additions Retirements Transfers 6/30/2019
Capital assets not being depreciated: Land $ 2,432 $ — $ — $ — $ 2,432 Work in progress 14,698 14,994 — (6,114) 23,578 Total capital assets not being depreciated 17,130 14,994 — (6,114) 26,010
Capital assets being depreciated: Buildings 405,692 — (300) 4,680 410,072 Improvements other than buildings 17,486 — (13) 790 18,263 Equipment 312,248 17,225 (20,589) 644 309,528 Total capital assets being depreciated 735,426 17,225 (20,902) 6,114 737,863
Less accumulated depreciation for: Buildings (200,996) (13,315) 233 — (214,078) Improvements other than buildings (9,299) (1,021) 10 — (10,310) Equipment (260,824) (13,738) 20,058 — (254,504) Total accumulated depreciation (471,119) (28,074) 20,301 — (478,892)HMC capital assets, net $ 281,437 $ 4,145 $ (601) $ — $ 284,981
Page 101

King County, Washington
Note 8Restricted Assets
Within the Statement of Net Position are amounts that are restricted as to their use. In some funds, these amounts appear under both current and noncurrent assets. The restricted assets for these funds are summarized below (in thousands):
Proprietary Funds
Public Transportation - restricted for future construction projects, debt service and obligations. $ 38,829
Water Quality - restricted for future construction projects, debt service, and reserves and obligations. 293,670
King County International Airport - restricted for construction projects and obligations. 900
Radio Communications Services - restricted for construction projects and obligations. 6
Solid Waste - restricted for construction projects, landfill closure and post-closure care costs. 17,886
Construction & Facilities Management - restricted for construction projects and obligations. 204Financial Management Services - restricted for construction projects. 41
Total Proprietary Funds restricted assets $ 351,536
Component Unit - Harborview Medical Center (HMC)
HMC Special Purpose Fund - restricted donations, gifts and bequests from various sources for specific uses. $ 11,583
Total HMC restricted assets $ 11,583
Component Unit - Cultural Development Authority of King County (CDA)
1% for Art Fund - restricted for the one percent for public art programs operated to benefit King County. $ 11,771
Building for Culture Program - restricted for a regional King County cultural capital investment partnership program. 35
Cultural Special Account and Other Funds - restricted for arts and heritage cultural programs. 25,658
Total CDA restricted assets $ 37,464
Component Unit - NJB Properties
Non-bond Proceeds Fund - restricted for costs of the NJB Project $ 29
Revenue Fund - restricted for transfers to the Bond Fund and authorized administrative fees 825
Bond Fund - restricted for interest and principal on the bonds 39
Total NJB Properties restricted assets $ 893
Page 102

King County, Washington
Note 9Pension Plans
The following table represents the aggregate pension amounts for all plans subject to the requirements of GASB Statement No. 68, Accounting and Financial Reporting for Pensions for the year 2019:
Aggregate Pension Amounts - All Plans (in thousands)
Pension liabilities $ 415,828Pension assets 73,838Deferred outflows of resources related to pensions 135,218Deferred inflows of resources related to pensions 267,015Pension expense/expenditures 22,885
Substantially all of the County’s full-time and qualifying part-time employees participate in one of the following retirement plans: Public Employees’ Retirement System (PERS) Plan 1, 2 and 3; Law Enforcement Officers’ and Fire Fighters’ Retirement System (LEOFF) Plan 1 and 2; Public Safety Employees’ Retirement System (PSERS) Plan 2; and Seattle City Employees’ Retirement System (SCERS).
PERS, LEOFF and PSERS are administered by the Washington State Department of Retirement Systems under cost-sharing, multiple-employer public employee defined benefit and defined contribution retirement plans. The state Legislature establishes and amends laws pertaining to the creation and administration of all statewide public retirement systems.
The Department of Retirement Systems (DRS), a department within the primary government of the State of Washington, issues a publicly available comprehensive annual financial report (CAFR) that includes financial statements and required supplementary information for each plan. The DRS CAFR may be obtained by writing to:
Department of Retirement Systems Communications Unit P.O. Box 48380 Olympia, WA 98504-8380
Or the DRS CAFR may be downloaded from the DRS website at www.drs.wa.gov.
SCERS is administered by the City of Seattle’s Employees’ Retirement System under cost-sharing, multiple-employer public employee defined benefit retirement plans. The seven-member Board of Administration establishes and amends laws pertaining to the administration of SCERS.
The Employees’ Retirement System issues an independent financial report. A copy of the report is available from the Seattle City Employees’ Retirement System at 720 Third Avenue, Suite 900, Seattle, WA 98104; by telephone at 206-386-1293; or by accessing the website http://www.seattle.gov/retirement.
Public Employees’ Retirement System (PERS)
PERS members include elected officials; state employees; employees of the Supreme, Appeals and Superior Courts; employees of the legislature; employees of district and municipal courts; employees of local governments; and higher education employees not participating in higher education retirement programs. PERS is comprised of three separate pension plans for membership purposes. PERS Plan 1 and Plan 2 are defined benefit plans, and PERS Plan 3 is a defined benefit plan with a defined contribution component.
PERS Plan 1Benefits Provided: PERS Plan 1 provides retirement, disability and death benefits. Retirement benefits are determined as two percent of the member’s average final compensation (AFC) times the member’s years of service. The AFC is the average of the member’s 24 highest consecutive service months. Members are eligible for retirement from active status at any age with at least 30 years of service, at age 55 with at least 25 years of service, or at age 60 with at least five years of service. Members retiring from active status prior to the age of 65 may receive actuarially reduced benefits.
Page 103

King County, Washington
Retirement benefits are actuarially reduced to reflect the choice of a survivor benefit. Other benefits include duty and non-duty disability payments, an optional cost-of-living adjustment (COLA), and a one-time duty-related death benefit, if found eligible by the Department of Labor and Industries. PERS 1 members were vested after the completion of five years of eligible service. The plan was closed to new entrants on September 30, 1977.
Contributions: The PERS Plan 1 member contribution rate is established by State statute at 6 percent. The employer contribution rate is developed by the Office of the State Actuary (OSA) and includes an administrative expense component that is currently set at 0.18 percent. Each biennium, the state Pension Funding Council adopts Plan 1 employer contribution rates. The PERS Plan 1 required contribution rates (expressed as a percentage of covered payroll) for 2019 were as follows:
PERS Plan 1Actual Contribution Rates: Employer EmployeeJanuary through June 2019 12.83% 6.00%July through December 2019 12.86% 6.00%
The County’s actual contributions to the plan were $62.3 million for the year ended December 31, 2019.
PERS Plans 2 and 3Benefits Provided: PERS Plan 2/3 provides retirement, disability and death benefits. Retirement benefits are determined as two percent of the member’s AFC times the member’s years of service for Plan 2 and 1 percent of AFC for Plan 3. The AFC is the average of the member’s 60 highest paid consecutive service months. There is no cap on years of service credit. Members are eligible for retirement with a full benefit at age 65 with at least five years of service credit. Retirement before age 65 is considered an early retirement. PERS Plan 2/3 members who have at least 20 years of service credit and are 55 years of age or older, are eligible for early retirement with a benefit that is reduced by a factor that varies according to age for each year before age 65. PERS Plan 2/3 members who have 30 or more years of service credit and are at least 55 years old can retire under one of two provisions:
• With a benefit that is reduced by three percent for each year before age 65; or• With a benefit that has a smaller (or no) reduction (depending on age) that imposes stricter return-to-
work rules.
PERS Plan 2/3 members hired on or after May 1, 2013 have the option to retire early by accepting a reduction of five percent for each year of retirement before age 65. This option is available only to those who are age 55 or older and have at least 30 years of service credit. PERS Plan 2/3 retirement benefits are also actuarially reduced to reflect the choice of a survivor benefit. Other PERS Plan 2/3 benefits include duty and non-duty disability payments, a cost-of-living allowance (based on the CPI), capped at three percent annually and a one-time duty related death benefit, if found eligible by the Department of Labor and Industries. PERS Plan 2 members are vested after completing five years of eligible service. PERS Plan 3 members are vested in the defined benefit portion of their plan after ten years of service; or after five years of service if 12 months of that service are earned after age 44.
PERS Plan 3 defined contribution benefits are totally dependent on employee contributions and investment earnings on those contributions. PERS Plan 3 members choose their contribution rate upon joining membership and have a chance to change rates upon changing employers. As established by statute, PERS Plan 3 required defined contribution rates are set at a minimum of 5 percent and escalate to 15 percent with a choice of six options. Employers do not contribute to the defined contribution benefits. PERS Plan 3 members are immediately vested in the defined contribution portion of their plan.
The Judicial Branch Multiplier (JBM) program began January 1, 2007. It gave eligible justices and judges an option to increase the benefit multiplier used, along with service credit years and average final compensation, to set the retirement benefit. The JBM program increases the multiplier for Plan 2 to 3.5 percent (from 2.0 percent for non-JBM participants) and for Plan 3 to 1.6 percent (from 1.0 percent for non-JBM participants).
Contributions: PERS Plan 2/3 employer and employee contribution rates are developed by the OSA to fully fund Plan 2 and the defined benefit portion of Plan 3. PERS Plan 2/3 employer rates include a component to address the PERS Plan 1 unfunded actuarial accrued liability and an administrative expense that is currently set at 0.18 percent. Each biennium, the state Pension Funding Council adopts Plan 2 employer and employee contribution rates and Plan 3 employer contribution rates.
Page 104

King County, Washington
The PERS Plan 2/3 required contribution rates (expressed as a percentage of covered payroll) for 2019 were as follows:
PERS Plan 2/3Actual Contribution Rates: Employer 2/3 Employee 2* Employee 3January through June 2019 12.83% 7.41% Varies (5-15%)July through December 2019 12.86% 7.90% Varies (5-15%)
* For employees participating in the JBM, the contribution rate was 18.53% for January - June 2019, and 19.75% for July - December 2019.
The County’s actual contributions to the plan were $93.9 million for the year ended December 31, 2019.
Public Safety Employees’ Retirement System (PSERS)
PSERS Plan 2 was created by the 2004 Legislature and became effective July 1, 2006. To be eligible for membership, an employee must work on a full time basis and:
• Have completed a certified criminal-justice training course with authority to arrest, conduct criminal investigations, enforce the criminal laws of Washington, and carry a firearm as part of the job; or
• Have primary responsibility to ensure the custody and security of incarcerated or probationary individuals; or
• Function as a limited authority Washington peace officer, as defined in RCW 10.93.020; or• Have primary responsibility to supervise eligible members who meet the above criteria.
PSERS membership includes:
• PERS 2 or 3 employees hired by a covered employer before July 1, 2006, who met at least one of the PSERS eligibility criteria and elected membership during the period of July 1, 2006 to September 30 2006; and
• Employees hired on or after July 1, 2006 by a covered employer, that meet at least one of the PSERS eligibility criteria.
PSERS covered employers include:
• Certain State of Washington agencies (Department of Corrections, Department of Natural Resources, Gambling Commission, Liquor and Cannabis Board, Parks and Recreation Commission, and Washington State Patrol),
• Washington State Counties,• Washington State Cities (except for Seattle, Spokane, and Tacoma),• Correctional entities formed by PSERS employers under the Interlocal Cooperation Act.
Benefits Provided: PSERS Plan 2 provides retirement, disability and death benefits. Retirement benefits are determined as two percent of the AFC for each year of service. The AFC is based on the member’s 60 consecutive highest creditable months of service. Benefits are actuarially reduced for each year that the member’s age is less than 60 (with ten or more service credit years in PSERS), or less than 65 (with fewer than ten service credit years). There is no cap on years of service credit. Members are eligible for retirement at the age of 65 with five years of service; or at the age of 60 with at least ten years of PSERS service credit; or at age 53 with 20 years of service. Retirement before age 60 is considered an early retirement. PSERS members who retire prior to the age of 60 receive reduced benefits. If retirement is at age 53 or older with at least 20 years of service, a three percent per year reduction for each year between the age at retirement and age 60 applies. PSERS Plan 2 retirement benefits are actuarially reduced to reflect the choice of a survivor benefit. Other benefits include duty and non-duty disability payments, an optional cost-of living adjustment, and a one-time duty-related death benefit, if found eligible by the Department of Labor and Industries. PSERS Plan 2 members are vested after completing five years of eligible service.
Contributions: PSERS Plan 2 employer and employee contribution rates are developed by the OSA to fully fund Plan 2. The Plan 2 employer rate includes components to address the PERS Plan 1 unfunded actuarial accrued liability and administrative expense currently set at 0.18 percent. Each biennium, the state Pension Funding Council adopts
Page 105

King County, Washington
Plan 2 employer and employee contribution rates. In addition to the regular change in contribution rates on July 1, 2017, PSERS contribution rates changed again on September 1, 2017 due to HB 1709, which allows PERS members meeting specific criteria to transfer service credit into PSERS as long as they and their employer pay the difference between the PERS and PSERS contribution rates.
The PSERS Plan 2 required contribution rates (expressed as a percentage of covered payroll) for 2019 were as follows:
PSERS Plan 2Actual Contribution Rates: Employer EmployeeJanuary through June 2019 12.38% 7.07%July through December 2019 12.14% 7.20%
The County’s actual contributions to the plan were $3.5 million for the year ended December 31, 2019.
Law Enforcement Officers’ and Fire Fighters’ Retirement System (LEOFF)
LEOFF membership includes all full-time, fully compensated, local law enforcement commissioned officers, firefighters, and as of July 24, 2005, emergency medical technicians. LEOFF is comprised of two separate defined benefit plans.
LEOFF Plan 1 Benefits Provided: LEOFF Plan 1 provides retirement, disability and death benefits. Retirement benefits are determined per year of service calculated as a percent of final average salary (FAS) as follows:
• 20+ years of service 2.0% of FAS• 10 - 19 years of service 1.5% of FAS• 5 - 9 years of service 1.0% of FAS
The FAS is the basic monthly salary received at the time of retirement, provided a member has held the same position or rank for 12 months preceding the date of retirement. Otherwise, it is the average of the highest consecutive 24 months’ salary within the last ten years of service. Members are eligible for retirement with five years of service at the age of 50. Other benefits include duty and non-duty disability payments, a cost-of-living adjustment, and a one-time duty-related death benefit, if found eligible by the Department of Labor and Industries. LEOFF Plan 1 members were vested after the completion of five years of eligible service. The plan was closed to new entrants on September 30, 1977.
Contributions: Starting on July 1, 2000, LEOFF Plan 1 employers and employees contribute zero percent, as long as the plan remains fully funded. The LEOFF Plan 1 had no required employer or employee contributions for fiscal year 2019. Employers paid only the administrative expense of 0.18 percent of covered payroll.
LEOFF Plan 2Benefits Provided: LEOFF Plan 2 provides retirement, disability and death benefits. Retirement benefits are determined as two percent of the FAS per year of service (the FAS is based on the highest consecutive 60 months). Members are eligible for retirement with a full benefit at 53 with at least five years of service credit. Members who retire prior to the age of 53 receive reduced benefits. If the member has at least 20 years of service and is age 50, the reduction is three percent for each year prior to age 53. Otherwise, the benefits are actuarially reduced for each year prior to age 53. LEOFF Plan 2 retirement benefits are also actuarially reduced to reflect the choice of a survivor benefit. Other benefits include duty and non-duty disability payments, a cost-of-living allowance (based on the CPI), capped at three percent annually and a one-time duty-related death benefit, if found eligible by the Department of Labor and Industries. LEOFF Plan 2 members are vested after the completion of five years of eligible service.
Contributions: LEOFF Plan 2 employer and employee contribution rates are developed by the OSA to fully fund Plan 2. The employer rate includes an administrative expense component set at 0.18 percent. Plan 2 employers and employees are required to pay at the level adopted by the LEOFF Plan 2 Retirement Board.
Page 106

King County, Washington
The LEOFF Plan 2 required contribution rates (expressed as a percentage of covered payroll) for 2019 were as follows:
LEOFF 2Actual Contribution Rates: Employer EmployeeJanuary through June 2019 5.43% 8.75%July through December 2019 5.33% 8.59%
The County’s actual contributions to the plan were $5.3 million for the year ended December 31, 2019.
During the 2019 Session, legislation (C366, L19) was passed which transferred $300 million from the LEOFF Plan 2 trust fund to the LEOFF Benefit Improvement Account on July 2019.
The Legislature, by means of a special funding arrangement, appropriates money from the state General Fund to supplement the current service liability and fund the prior service costs of Plan 2 in accordance with the recommendations of the Pension Funding Council and the LEOFF Plan 2 Retirement Board. This special funding situation is not mandated by the state constitution and could be changed by statute. For the state fiscal year ending June 30, 2019, the State contributed $73.0 million to LEOFF Plan 2. The amount recognized by the County as its proportionate share of this amount is $28.9 million.
Seattle City Employees’ Retirement System (SCERS)
SCERS is a cost-sharing, multiple-employer retirement plan administered in accordance with Chapter 4.36 of the Seattle Municipal Code. County employees of the Department of Public Health who have established membership in SCERS remain covered by the City Retirement System. Employees of Public Transportation who are former employees of Seattle Transit are also covered by the system.
Benefits Provided: SCERS provides retirement, disability and death benefits. Employees covered by this plan may retire after 30 years of service regardless of age; after age 52 with 20 years or more of service; after age 57 with 10 or more years of service; and after age 62 with five or more years of service. Disability retirement is available after 10 years of service. The unmodified monthly retirement allowance is based on a percentage of average salary for every year of service to a maximum of 60 percent. The average salary for this plan is defined as the highest consecutive 24-months’ average rate of pay. The percentage for each year of service used to compute the retirement benefit depends on the age at retirement and the years of service. It ranges from 1.2 percent at age 52 with 20 years of service to a maximum of 2 percent for each year of service. The maximum allowance a member can receive is the unmodified plan, which has no provision for a beneficiary and, at the member's death, stops all payments. Several optional retirement benefit formulas exist which provide for beneficiaries with reduced monthly allowances.
Contributions: The SCERS member contribution rate is 10.03 percent of compensation except for members qualifying for lower rates prior to June 1972. The County is required to contribute at an actuarially determined rate. The current rate is 15.23 percent of annual covered payroll. The contribution requirements of plan members and the County are established and may be amended by the Board of Administration. The SCERS Plan required contribution rates (expressed as a percentage of covered payroll) for 2019 were as follows:
SCERSActual Contribution Rates: Employer EmployeeJanuary through December 2019 15.23% 10.03%
The County’s actual contributions to the plan were $300 thousand for the year ended December 31, 2019.
Actuarial Assumptions
The total pension liability (TPL) for each of the DRS plans was determined using the most recent actuarial valuation completed in 2019 with a valuation date of June 30, 2018. The actuarial assumptions used in the valuation were based on the results of the Office of the State Actuary’s 2007-2012 Experience Study and the 2017 Economic Experience Study.
Additional assumptions for subsequent events and law changes are current as of the 2018 actuarial valuation report. The TPL was calculated as of the valuation date and rolled forward to the measurement date of June 30, 2019.
Page 107

King County, Washington
Plan liabilities were rolled forward from June 30, 2018, to June 30, 2019, reflecting each plan’s normal cost (using the entry-age cost method), assumed interest and actual benefit payments.
• Inflation: 2.75% total economic inflation• Salary increases: In addition to the base 3.50% salary inflation assumption, salaries are also expected to
grow by promotions and longevity.• Investment rate of return: 7.4%
Mortality rates for DRS pension plans were based on the RP-2000 report's Combined Healthy Table and Combined Disabled Table published by the Society of Actuaries. The OSA applied offsets to the base table and recognized future improvements in mortality by projecting the mortality rates using 100 percent Scale BB. Mortality rates are applied on a generational basis; meaning, each member is assumed to receive additional mortality improvements in each future year throughout his or her lifetime.
There were changes in methods and assumptions since the last valuation.
• Modeling was updated to reflect providing benefit payments to the date of initial retirement eligibility for terminated vested members who delay application for retirement benefits.
• Updated cost of living adjustment (COLA) programming to reflect legislation signed during the 2018 legislative session (C151 L18). This law provides PERS Plan 1 annuitants who are not receiving a basic minimum, alternate minimum, or temporary disability benefit with a one-time permanent 1.5 percent increase to their monthly retirement benefit, not to exceed a maximum of $62.50 per month.
The TPL for SCERS pension plan was determined by an actuarial valuation as of December 31, 2018. The actuarial assumptions used in the valuation were based on an actuarial experience study for the period January 1, 2014 through December 31, 2017. The following actuarial assumptions were applied to all periods including the measurement period.
• Inflation: 2.75% • Salary increases: In addition to the 3.5% salary increase assumption, salaries are also expected to grow
by promotions and longevity.• Investment rate of return: 7.25% compounded annually, net of expenses
Mortality rates for the SCERS plan were based on the RP-2000 report's Employee Table, Combined Healthy Table and Combined Disabled Table. All mortality tables are generational using Projection Scale AA to reflect expected future mortality improvement.
Discount Rate
The discount rate used to measure the total pension liability for all DRS plans was 7.4 percent. To determine the discount rate, an asset sufficiency test was completed to test whether the pension plan's fiduciary net position was sufficient to make all projected future benefit payments of current plan members. Consistent with current law, the completed asset sufficiency test included an assumed 7.5 percent long-term discount rate to determine funding liabilities for calculating future contribution rate requirements. (All plans use 7.5 percent except LEOFF Plan 2, which has assumed 7.4 percent.) Consistent with the long-term expected rate of return, a 7.4 percent future investment rate of return on invested assets was assumed for the test.
The discount rate used to measure the total pension liability for SCERS pension plan was 7.25 percent. The projection of cash flows used to determine the discount rate assumed that plan member contributions will be made at the current contribution rate and the participating governmental entity contributions will be made at rates equal to the difference between actuarially determined contribution rates and the member rate. Based on those assumptions, the pension plan’s fiduciary net position was projected to be available to make all projected future benefit payments of current plan members. Therefore, the long-term expected rate of return on pension plan investments was applied to all periods on projected benefit payment to determine the total pension liability.
Long-Term Expected Rate of Return
The long-term expected rate of return on the DRS pension plan investments of 7.4 percent was determined using a building-block-method. In selecting this assumption, the OSA reviewed the historical experience data, considered the historical conditions that produced past annual investment returns, and considered capital market assumptions and
Page 108

King County, Washington
simulated expected investment returns provided by the Washington State Investment Board (WSIB). The WSIB uses the capital market assumptions and their target asset allocation to simulate future investment returns over various time horizons.
The long-term expected rate of return on the SCERS pension plan investments of 7.25 percent was determined using a building block method in which best-estimate ranges of expected future real rates of return are developed for each major asset class. These ranges are combined to produce the long-term expected rate of return by weighing the expected future real rates of return by the target asset allocation percentage and by adding expected inflation.
Estimated Rates of Return by Asset Class
Best estimates of arithmetic real rates of return for each major asset class included in the DRS pension plan’s target asset allocation as of June 30, 2019, are summarized in the table below. The inflation component used to create the table is 2.2 percent and represents the WSIB’s most recent long-term estimate of broad economic inflation.
Asset ClassTarget
Allocation
% Long-term Expected Real Rate of Return Arithmetic
Fixed Income 20% 2.2%Tangible Assets 7% 5.1%Real Estate 18% 5.8%Global Equity 32% 6.3%Private Equity 23% 9.3%
100%
Best estimates of geometric real rates of return for each major asset class included in the SCERS pension plan’s target asset allocation as of December 31, 2018 are summarized in the chart that follows:
Asset Class
% Long-term Expected Real Rate of Return
GeometricEquity: Public 5.4%Equity: Private 8.4%Fixed Income: Core 1.6%Fixed Income: Credit 4.3%Real Assets: Real Estate 3.9%Real Assets: Infrastructure 4.3%Diversifying Strategies 4.0%
Sensitivity of Net Pension Liability (Asset)
The table below presents the County’s proportionate share of the net pension liability calculated using the discount rate of 7.4 percent (7.25 percent for SCERS), as well as what the County’s proportionate share of the net pension liability would be if it were calculated using a discount rate that is one percentage point lower (6.4 percent, 6.25 percent for SCERS) or one percentage point higher (8.4 percent, 8.25 percent for SCERS) than the current rate.
Sensitivity of Net Pension Liability (Asset)(in thousands)
Plans1% Decrease
(6.4%)Current Discount
Rate (7.4%)1% Increase
(8.4%)PERS 1 $ 397,402 $ 317,333 $ 247,863PERS 2/3 749,589 97,735 (437,154)PSERS 2 11,636 (1,127) (11,153)LEOFF 1 (9,674) (11,825) (13,683)LEOFF 2 (11,321) (60,886) (101,341)
Page 109

King County, Washington
Sensitivity of Net Pension Liability (Asset)(in thousands)
Plans1% Decrease
(6.25%)Current Discount
Rate (7.25%)1% Increase
(8.25%)SCERS $ 1,017 $ 760 $ 535
Pension Plan Fiduciary Net Position
Detailed information about the State’s pension plans’ and SCERS plan's fiduciary net position are available in the separately issued DRS and City of Seattle financial reports.
Pension Liabilities (Assets), Pension Expense and Deferred Outflows of Resources and Deferred Inflows of Resources Related to Pensions
At December 31, 2019, the County reported a total pension liability of $415.8 million and total pension asset of $73.8 million for its proportionate share of the net pension liabilities (assets) as follows:
Total Pension Liability (Asset)
(in thousands)PERS 1 $ 317,333PERS 2/3 97,735PSERS 2 (1,127)LEOFF 1 (11,825)LEOFF 2 (60,886)SCERS 760
The amount of the asset reported above for LEOFF Plan 2 reflects a reduction for State pension support provided to the County. The amount recognized by the County as its proportionate share of the net pension asset, the related State support and the total portion of the net pension asset that was associated with the County were as follows:
Net Pension Liability/(Asset) (in thousands)LEOFF 2 - County's proportionate share $ (60,886)LEOFF 2 - State's proportionate share of the net pension liability/(asset) associated with King County (39,872)
TOTAL $ (100,758)
The County proportionate share of the collective net pension liabilities was as follows:
Collective Net Pension LiabilitiesProportionate Share 6/30/18
Proportionate Share 6/30/19
Change in Proportion
PERS 1 8.56% 8.25% -0.31%PERS 2/3 10.29% 10.06% -0.23%PSERS 2 9.69% 8.67% -1.02%LEOFF 1 0.60% 0.60% 0.00%LEOFF 2 2.88% 2.63% -0.25%
Collective Net Pension LiabilitiesProportionate Share 12/31/17
Proportionate Share 12/31/18
Change in Proportion
SCERS 0.05% 0.05% 0%
Employer contribution transmittals received and processed by the DRS for the fiscal year ended June 30 are used as the basis for determining each employer’s proportionate share of the collective pension amounts reported by the DRS in the Schedules of Employer and Nonemployer Allocations for all plans except LEOFF 1.
Page 110

King County, Washington
LEOFF Plan 1 allocation percentages are based on the total historical employer contributions to LEOFF 1 from 1971 through 2000 and the retirement benefit payments in fiscal year 2019. Historical data was obtained from a 2011 study by the Office of the State Actuary. In fiscal year 2019, the state of Washington contributed 87.12 percent of LEOFF 1 employer contributions and all other employers contributed the remaining 12.88 percent of employer contributions. LEOFF 1 is fully funded and no further employer contributions have been required since June 2000. If the plan becomes underfunded, funding of the remaining liability will require new legislation. The allocation method the plan chose reflects the projected long-term contribution effort based on historical data.
In fiscal year 2019, the State of Washington contributed 39.57 percent of LEOFF 2 employer contributions pursuant to RCW 41.26.725 and all other employers contributed the remaining 60.43 percent of employer contributions.
The collective net pension liability (asset) for all DRS pension plans was measured as of June 30, 2019, and the actuarial valuation date on which the total pension liability (asset) is based was as of June 30, 2018, with update procedures used to roll forward the total pension liability to the measurement date.
The collective net pension liability for SCERS was measured as of December 31, 2018, and the actuarial valuation date on which the total pension liability was based was as of January 1, 2018, with update procedures used to roll forward the total pension liability to the measurement date taking into account any significant changes between the valuation date and the fiscal year end.
Pension Expense
For the year ended December 31, 2019, the County recognized pension expense as follows:
Pension Expense (in thousands)
PERS 1 $ 456PERS 2/3 19,385PSERS 2 1,851LEOFF 1 (591)LEOFF 2 1,462SCERS 322TOTAL $ 22,885
Deferred Outflows of Resources and Deferred Inflows of Resources
At December 31, 2019, the County reported deferred outflows of resources and deferred inflows of resources related to pensions from the following sources:
PERS 1
Deferred Outflows of Resources
(in thousands)
Deferred Inflows of Resources (in thousands)
Differences between expected and actual experience $ — $ —Net difference between projected and actual investment earnings on pension plan investments — (21,201)
Changes of assumptions — —Changes in proportion and differences between contributions and proportionate share of contributions — —
Contributions subsequent to the measurement date 33,237 —
TOTAL $ 33,237 $ (21,201)
Page 111

King County, Washington
PERS 2/3
Deferred Outflows of Resources
(in thousands)
Deferred Inflows of Resources (in thousands)
Differences between expected and actual experience $ 28,001 $ (21,013)Net difference between projected and actual investment earnings on pension plan investments — (142,262)
Changes of assumptions 2,503 (41,006)Changes in proportion and differences between contributions and proportionate share of contributions 4,810 (16,153)
Contributions subsequent to the measurement date 51,070 —
TOTAL $ 86,384 $ (220,434)
PSERS 2
Deferred Outflows of Resources
(in thousands)
Deferred Inflows of Resources (in thousands)
Differences between expected and actual experience $ 952 $ (100)Net difference between projected and actual investment earnings on pension plan investments — (1,957)
Changes of assumptions 9 (606)Changes in proportion and differences between contributions and proportionate share of contributions 60 (420)
Contributions subsequent to the measurement date 2,001 —
TOTAL $ 3,022 $ (3,083)
LEOFF 1
Deferred Outflows of Resources
(in thousands)
Deferred Inflows of Resources (in thousands)
Differences between expected and actual experience $ — $ —Net difference between projected and actual investment earnings on pension plan investments — (1,226)
Changes of assumptions — —Changes in proportion and differences between contributions and proportionate share of contributions — —
Contributions subsequent to the measurement date — —
TOTAL $ — $ (1,226)
LEOFF 2
Deferred Outflows of Resources
(in thousands)
Deferred Inflows of Resources (in thousands)
Differences between expected and actual experience $ 4,381 $ (1,095)Net difference between projected and actual investment earnings on pension plan investments — (12,482)
Changes of assumptions 100 (6,852)Changes in proportion and differences between contributions and proportionate share of contributions 4,296 (310)
Contributions subsequent to the measurement date 2,633 —
TOTAL $ 11,410 $ (20,739)
Page 112

King County, Washington
SCERS
Deferred Outflows of Resources
(in thousands)
Deferred Inflows of Resources (in thousands)
Differences between expected and actual experience $ — $ (16)Net difference between projected and actual investment earnings on pension plan investments 80 —
Changes of assumptions 41 —Changes in proportion and differences between contributions and proportionate share of contributions 768 (316)
Contributions subsequent to the measurement date 276 —
TOTAL $ 1,165 $ (332)
Deferred outflows of resources related to pensions resulting from the County contributions subsequent to the measurement date will be recognized as a reduction of the net pension liability in the year ended December 31, 2019. Other amounts reported as deferred outflows and deferred inflows of resources related to pensions will be recognized in pension expense as follows:
Year ended December 31:
PERS 1 (in thousands)
Year ended December 31:
PERS 2/3 (in thousands)
Year ended December 31:
PSERS 2 (in thousands)
2020 $ (4,680) 2020 $ (45,767) 2020 $ (348)2021 (11,086) 2021 (75,464) 2021 (655)2022 (3,956) 2022 (34,831) 2022 (417)2023 (1,479) 2023 (19,780) 2023 (250)2024 — 2024 (8,929) 2024 (69)
Thereafter — Thereafter (349) Thereafter (323)
Year ended December 31:
LEOFF 1 (in thousands)
Year ended December 31:
LEOFF 2 (in thousands)
Year ended December 31:
SCERS (in thousands)
2020 $ (285) 2020 $ (2,926) 2020 $ 2182021 (628) 2021 (5,958) 2021 1242022 (228) 2022 (2,377) 2022 902023 (85) 2023 (1,053) 2023 922024 — 2024 (53) 2024 33
Thereafter — Thereafter 405 Thereafter —
Component Unit - Harborview Medical Center (HMC)
HMC personnel are University of Washington (UW) employees. HMC faculty and professional staff participate in the University of Washington Retirement Plan (UWRP), an IRC Section 403(b) defined contribution retirement plan, authorized by the Board of Regents. HMC staff participate in a plan authorized by the State of Washington Department of Retirement Systems (DRS). Plan participation is defined by position, with the majority of HMC employees enrolled in one of the three Public Employees' Retirement Systems (PERS) plans.
All plans include contributions by both employee and employer. Employee contributions are tax-deferred. Employer contributions are paid semi-monthly by the UW in accordance with rates specified by the retirement systems.
Component Unit - Cultural Development Authority of King County (CDA)
All eligible CDA personnel participate in PERS, a statewide local government retirement system administered by the DRS under cost-sharing, multiple-employer defined benefit plans. CDA’s net pension liability, deferred outflows of resources and deferred inflows of resources related to pensions at December 31, 2019 were $804 thousand, $266 thousand and $430 thousand, respectively.
Page 113

King County, Washington
Note 10Defined Benefit Other Postemployment Benefit (OPEB) Plan
The County is required to accrue other postemployment benefits (OPEB) expense related to its postretirement health care plan based on a computed total OPEB liability. Instead of recording expense on a "pay-as-you-go" basis, the County has recorded a liability of $111.3 million for the difference between the actuarially calculated liability and the estimated contributions made.
The following table represents the aggregate OPEB amounts for all plans subject to the requirements of GASB Statement No. 75 for the year ended December 31, 2019 (in thousands):
OPEB liabilities $ 111,272OPEB assets —Deferred outflows of resources 2,624Deferred inflows of resources 7,597OPEB expense/expenditures 5,621
The County’s total OPEB liability was measured as of December 31, 2019 using an actuarial valuation as of December 31, 2018.
Plan Description The King County Health Plan (the Health Plan) is a single-employer defined-benefit health care plan administered by the County. The Health Plan provides medical, dental, prescription drug, and vision benefits to eligible retirees, their spouses, and children. Retiree premiums for dental and vision plans are assumed to cover the full cost of those benefits. The Health Plan does not issue a separate stand-alone financial report.
LEOFF 1 retirees, representing less than 2 percent of plan participants, are not required to contribute to the Health Plan. All other retirees are required to pay into the health plan by contributing 100 percent of the rate established by the County for coverage under the Consolidated Omnibus Budget Reconciliation Act of 1985 (“COBRA”). As a self-insurer, COBRA rates are set by the County each budget year. At December 31, 2018 (the census date) the following employees were covered by the Health Plan.
Inactive employees or beneficiaries currently receiving benefits 449
Inactive employees entitled to, but not yet receiving benefits —
Active employees 14,378
Total 14,827
For the fiscal year ended December 31, 2019, the County contributed an estimated $5.0 million to the Health Plan to pay for retiree benefits. The County's contribution was entirely to fund "pay-as-you-go" costs under the Health Plan and not to pre-fund benefits. Accordingly, there are no assets in a qualifying trust.
Actuarial Methods and Assumptions The basis of benefit projections for financial reporting purposes is the substantive plan (the Health Plan as understood by the County and members of the Health Plan) and includes the types of benefits provided at the time of each valuation and the historical pattern of sharing benefit costs between the County and Members of the Health Plan. The actuarial methods and assumptions used include techniques that are designed to reduce the effects of short-term volatility in actuarial accrued liabilities and the actuarial value of assets, consistent with the long-term perspective of the calculations.
The December 31, 2018 valuation used the entry age normal level percentage of salary actuarial cost method. The actuarial assumptions included an initial annual health care cost trend rate of 6.50 percent reduced by decrements to an ultimate rate of 3.84 percent after 56 years. The Medicare premium trend rate is 6.00 percent, for all years. All trend rates include a 2.50 percent inflation assumption and 3.00 percent salary increase assumption. County employees have multiple medical plans to select from during and after employment. Plan Members are assumed to retain the same medical plan after retirement as they selected while an employee pre-retirement, including an assumption that employees choosing not to enroll in a County medical plan before retirement will not select a County medical plan after retirement. Mortality rates were based on tables from the Society of Actuaries.
Page 114

King County, Washington
These assumptions reflect the County’s best estimates. The following presents the total OPEB liability of the County calculated using the current healthcare cost trend rate of 6.50 percent decreasing to 3.84 percent, as well as what the OPEB liability would be if it were calculated using a discount rate that is 1-percentage-point lower or 1-percentage-point higher than the current rate (in thousands).
1% Decrease
Current Trend Rate 1% Increase
(5.5%decreasingto 2.84%)
(6.5%decreasingto 3.84%)
(7.5%decreasingto 4.84%)
Total OPEB Liability $ 100,586 $ 111,272 $ 123,601
Discount Rate The discount rate used to measure the total OPEB liability is 3.75 percent. The County’s OPEB Plan is an unfunded plan, therefore the discount rate was set to the rate of tax-exempt, high-quality 20-year municipal bonds, as of the valuation date.
The following presents the total OPEB liability of the County calculated using the discount rate of 3.75 percent, as well as what the OPEB liability would be if it were calculated using a discount rate that is 1-percentage-point lower or 1-percentage-point higher than the current rate (in thousands).
1% Decrease
Current Discount
Rate 1% Increase2.75% 3.75% 4.75%
Total OPEB Liability $ 121,288 $ 111,272 $ 102,385
Changes in the Total OPEB Liability The County’s actuarial analysis used a measurement date of December 31, 2018. For the current reporting period, the following schedule includes changes in the total OPEB liability since last year (in thousands).
Total
OPEB
Liability
Balance at 1/1/2019 $ 111,412
Changes for the Year:Service cost 2,155
Interest 4,138
Changes of benefit terms —
Difference between expected and actual experience —
Changes of assumptions —
Benefit payments (4,954)
Other changes (1,479)
Net changes (140)
Balance at 12/31/2019 $ 111,272
The County recognized $5.6 million in OPEB expense for the year. There were no changes to the plan benefits in 2019. Changes in actuarial assumptions for the last valuation dated December 31, 2018 included changing the actuarial method from unit credit actuarial cost to entry age normal level percent per GASB 75, increasing the payroll growth rate to 3 percent from zero, updating the mortality tables to use the MP-280 improvement scale, updating the medical trend assumptions to use a single rate for medical and pharmacological services, and updating the claims and contributions for medical plans.
Page 115

King County, Washington
Deferred Inflows and Deferred Outflows At December 31, 2019 the County reported deferred outflows of resources and deferred inflows of resources related to OPEB as follows (in thousands):
Deferred Deferred
Outflows of Inflows of
Resources Resources
Differences between expected and actual experience $ 2,624 $ —
Changes of assumptions — (7,597)
Payments subsequent to the measurement dates — —
Total $ 2,624 $ (7,597)
The County did not make payments subsequent to the measurement date, which otherwise would have been reported as a deferred outflow of resources. Other amounts reported as deferred outflows and deferred inflows of resources related to OPEB will be recognized in OPEB expense as follows (in thousands):
Year ended December 31: Amount
2020 $ (672)
2021 (672)
2022 (672)
2023 (672)
2024 (672)
Thereafter (1,613)
Component Unit - Harborview Medical Center (HMC)
All University employees, including medical center employees, are eligible for participation in healthcare and life insurance programs administered by the WSHCA (Washington State Health Care Authority). HMC retirees may elect coverage through state health and life insurance plans, for which they pay less than the full cost of the benefits based on their age and other demographic factors.
The Office of the State Actuary determines total OPEB obligations at the State level using individual state employee data, including age, retirement eligibility, and length of service. Information to support actuarial calculation at the division, department, or component unit level is not available. The State is ultimately responsible for the obligation; therefore, the net OPEB liability is not recorded at the University or its departments, divisions, agencies or component units.
Page 116

King County, Washington
Note 11Risk Management
The County uses three internal service funds to account for and finance property/casualty, workers’ compensation and employee medical, pharmacy, dental, and vision benefits self-insurance programs. The County contracts with a plan administrator to process medical, pharmacy, vision and dental claims. County fund/claims managers, together with the Civil Division of the Prosecuting Attorney’s Office, are responsible for processing all tort and workers’ compensation claims.
Claims settlements and loss expenses are accrued in the three internal service funds for the estimated settlement value of both reported and unreported claims. These funds are responsible for collecting interfund premiums from insured funds and departments for paying claim settlements and for purchasing certain policies. Interfund premiums are assessed on the basis of claims experience and are reported as revenues and expenses or expenditures.
Insurance Fund
The Insurance Fund, an internal service fund, accounts for the County’s property/casualty program. The fund accounts for the County’s exposures to loss due to the tortious conduct of the County, including those exposures commonly covered by general liability, automobile liability, police professional, public officials, errors and omissions and professional malpractice insurance policies. With the assistance of an actuary, the Insurance Fund’s claims liability is estimated based upon historical claims experience and other actuarial techniques. The estimated liability for probable self-insurance losses (reported and unreported) recorded in the fund as of December 31, 2019, is $78.9 million.
Changes in the Insurance Fund’s estimated claims liability in 2018 and 2019 (in thousands):
Beginning Claims andof Year Changes in Claim End of YearLiability Estimates Payments Liability
2018 $ 74,921 $ 14,191 $ (18,645) $ 70,4672019 70,467 21,234 (12,797) 78,904
In 2019, there were no settlements that resulted in payment in excess of the County's $7.5 million self-insured retention (SIR). In 2018, there was one settlement that resulted in payment in excess of the SIR by $300 thousand, and in 2017, there were no losses paid in excess of the SIR.
In April 2019, the County procured an additional $20.0 million in excess liability coverage that currently provides $112.5 million in limits above a $7.5 million per occurrence SIR for Transit and $6.5 million SIR for all other County agencies. In lieu of purchasing the certified terrorism coverage offered through the federal government offered by the County's excess liability insurance carriers, a stand-alone liability terrorism insurance policy was placed on April 1, 2019 with limits of $40.0 million.
Effective July 1, 2019, the County renewed the property insurance policies. The program maintains a blanket limit of $750.0 million above a $250 thousand per occurrence deductible. The program provides an overall earthquake sublimit of $100.0 million and a Flood sublimit of $250 million. In lieu of purchasing the certified terrorism coverage offered by our property insurance carriers, a stand-alone property terrorism insurance policy was placed with limits of $500.0 million.
As of April 1, 2019, an additional $20.0 million in cyber liability limits was purchased for total limits of $50.0 million. The County’s cyber liability deductible was reduced from $1.0 million per occurrence to $750 thousand per occurrence.
Due to the reduced appetite for swimming pool liability risk in the insurance marketplace and pricing, the County saw a reduction in insurance limits for the April 1, 2019 policy term. The County’s swimming pool liability limits reduced from $6.5 million per occurrence and $7.5 million on the aggregate down to $1.0 million per occurrence and $2.0 million in the aggregate for its 2019 policy.
Page 117

King County, Washington
In addition to the policies already mentioned, the County has specific insurance policies to cover some of its other exposures. These are listed in the following table:
COVERAGE COVERAGE AMOUNT DEDUCTIBLE
Excess General Liability $112.5 million $6.5 million per occurrence / $7.5 millionTransit bus losses
Property & Mobile Equipment $750 million $250 thousand per occurrence
$100 million EQ(Earthquake)
EQ - 5% of location value / $500 thousandminimum
$250 million Flood Flood - $250 thousand / $500 thousand
Terrorism - Property $500 million $100 thousand per occurrence
Terrorism - General Liability $40 million $100 thousand per occurrence
Excess Workers' Compensation Statutory (unlimited) $2 million per occurrence
Multi-State Workers' Compensation Statutory None
Aircraft Liability & Physical Damage $50 million per occurrence /scheduled value
None
King County International Airport General Liability $300 million None
King County International Airport Property Damage $197 million $100 thousand per occurrence
Marine Liability & Property Damage $150 million / scheduledvalues
Varies based on vessel and coverage type
Foreign Liability in General and Automobile $1 million $1 thousand
Fiduciary Liability for Employees' Benefit $20 million None
Parks Swimming Pools General Liability $1 million $5 thousand
Crime and Fidelity $2.5 million $50 thousand
Flood Insurance scheduled value (property) $1 - 2.5 thousand
Cyber Liability $50 million $750 thousand
Cedar Hills Regional Landfill Pollution Liability $50 million $250 thousand
PSERN - Inland Marine $35 million $2.5 thousand per occurrence;EQ - $50 thousand per location;
Flood - $10 thousand per locationPSERN - Site Specific Pollution
(Scheduled locations only)$2.0 million per occurrence;
$4.0 million aggregate$25 thousand (3rd party);$50 thousand (clean-up)
Safety and Workers’ Compensation Fund
The Safety and Workers’ Compensation Fund, an internal service fund, accounts for the County’s self insurance for workers’ compensation as certified under Title 51 Revised Code of Washington (RCW), Industrial Insurance Act. Interfund charges are derived from actuarial projections of their future claims and administrative costs. The estimated liability for probable self-insurance losses (reported and unreported) recorded in the financial statements is not discounted due to the low rate of return on investment. As of December 31, 2019, the total claim liability is $61.3 million.
The County purchases an excess workers’ compensation policy that provides statutory limits coverage, and therefore has had no risk exposure over the statutory limits during the last three years. The amount of loss retained by King County (the self-insured retention) under this policy, effective April 1, 2018, was $2.0 million.
The Fund’s claims liability is estimated by an independent actuary. The claim liability represents the estimated ultimate amount to be paid for reported and incurred but not reported claims based on past experience and other actuarial techniques.
Page 118

King County, Washington
Changes in the Safety and Workers’ Compensation Fund’s claims liability in 2018 and 2019 (in thousands) are shown below:
Beginning Claims andof Year Changes in Claim End of YearLiability Estimates Payments Liability
2018 $ 65,667 $ 15,855 $ (15,665) $ 65,8572019 65,857 14,296 (18,827) 61,326
Employee Benefits Program Fund
The Employee Benefits Program Fund, an internal service fund, accounts for employee medical, dental, vision, life, accidental death and dismemberment (AD&D) and long-term disability (LTD) benefit programs. Two medical plans, and the pharmacy, dental and vision plans are self-insured. The life, AD&D, and LTD benefit programs are fully insured. Interfund premiums are determined on a per employee, per month basis.
The estimated liability for probable self-insurance losses (reported and unreported) recorded in the fund as of December 31, 2019, is $19.5 million.
The Fund’s claims liability is based on historical experience. Changes in the Employee Benefits Program Fund’s claims liability in 2018 and 2019 (in thousands) are shown below:
Beginning Claims andof Year Changes in Claim End of YearLiability Estimates Payments Liability
2018 $ 18,085 $ 239,668 $ (236,358) $ 21,3952019 21,395 248,742 (250,636) 19,501
Component Unit - Harborview Medical Center (HMC)
HMC is exposed to risk of loss related to professional and general liability, property loss, and injuries to employees. HMC participates in risk pools managed by the University of Washington to mitigate risk of loss related to these exposures.
Professional and General LiabilityThe University's professional liability program currently includes self-insured and commercial reinsurance coverage components. HMC's annual funding to the professional liability program is determined by the University administration using information from an annual actuary study. Various participants in the program contribute to the self-insurance fund and share in the expenses of the program. HMC's contribution to the professional liability program was $4.1 million in 2019 and $4.1 million in 2018, recorded in supplies and other expense on the Statements of Revenues, Expenses and Changes in Net Position.
Employee Benefits ProgramHMC personnel are employees of the University. Benefit costs are pooled centrally for all University employees. Annually the University reviews total employee benefit costs and prepares standard benefit load rates by employment classification. These benefit costs cover employee healthcare costs, workers' compensation, employment taxes and retirement plans.
Component Unit - Cultural Development Authority (CDA) of King County
Insurance FundCultural Development Authority of King County (CDA) carries comprehensive general liability and auto liability coverage with a limit of $20.0 million per occurrence and no aggregate limit. Commercial property losses are covered up to the replacement cost on file with Enduris Washington. CDA also carries 1) Public Official Errors and Omissions Liability coverage with a limit of $20.0 million per occurrence and an aggregate limit of $20.0 million; 2) Terrorism Liability coverage with a limit of $500 thousand per occurrence and an aggregate limit of $1.0 million; 3) Employment Practices Liability coverage with an aggregate limit of $20.0 million per member; 4) Crime Blanket Coverage with Faithful Performance of Duty with an aggregate limit of $250 thousand per member; 5) Cyber coverage with a limit of $2.0
Page 119

King County, Washington
million per occurrence and 6) Identity Fraud expense reimbursement with a limit of $25 thousand per occurrence and an aggregate limit of $25 thousand.
Employee Benefits ProgramThe CDA provides its eligible employees with a comprehensive health benefits package through the Public Employees Benefits Board (PEBB), which includes medical, dental, basic life and long-term disability coverage. In addition, the PEBB offers the following optional products: long-term care, auto and home insurance. CDA also offers insurance with American Family Life Assurance Company (AFLAC) and MetLife. With the AFLAC and MetLife coverage, CDA employees can pick from a selection of insurance policies at their own expense. CDA benefits-eligible employees can enroll in FSA through Wageworks, Inc.
Page 120

King County, Washington
Note 12Leases
Capital Leases
King County has entered into agreements to purchase buildings, machinery and equipment through capital lease and installment purchase agreements. Assets acquired and liabilities incurred through such agreements for governmental funds are accounted for under Governmental Activities. Such assets and liabilities related to proprietary funds are accounted for under Business-type Activities.
Capital assets and outstanding liabilities relating to capital lease agreement contracts as of December 31, 2019 (in thousands) is as follows:
Capital Assets Capital Leases PayableGovernmental Business-type Governmental Business-type
Activities Activities Activities ActivitiesBuildings $ 194,935 $ — $ 8,156 $ —Leasehold improvements — 4,881 — 2,241Less depreciation (42,896) (2,899) — —Totals $ 152,039 $ 1,982 $ 8,156 $ 2,241
Future minimum lease payments under capital lease agreements and the present value of the net minimum lease payments are shown below as of December 31, 2019 (in thousands):
Governmental Business-typeActivities Activities
2020 $ 768 $ 2552021 765 2552022 767 2552023 764 2552024 764 255
2025-2029 3,821 1,2752020-2034 3,821 4042035-2036 1,533 —
Total minimum lease payments 13,003 $ 2,954Less: Amount representing interest (4,847) (713)
Present value of net minimum lease payments $ 8,156 $ 2,241
Operating Leases
The County has numerous operating lease commitments for office space, equipment, radio towers and railroad tracks. The Information and Telecommunications Services Fund leases computer hardware; these leases include maintenance agreements. Expenditures for the year ended December 31, 2019 for long-term operating expenses for office space, equipment and other operating leases amount to $14.7 million. The patterns of future lease payment requirements are systematic and rational.
Page 121

King County, Washington
Future minimum lease payments for these leases are shown in the table below (in thousands):
OfficeYear Space Other Total
2020 $ 8,478 $ 5,484 $ 13,9622021 8,002 4,718 12,7202022 6,920 4,243 11,1632023 6,255 4,126 10,3812024 4,991 3,945 8,936
2025-2029 11,995 12,030 24,025 2030-2034 — 4,583 4,583 2035-2039 — 3,634 3,634 2040-2044 — 3,634 3,634 2045-2049 — 3,592 3,592
The County currently leases some of its property to various tenants under long-term, renewable and noncancelable contracts. Under business-type activities, the King County International Airport Enterprise leases out most of the buildings and grounds in the King County International Airport/Boeing Field complex to companies and government agencies in the aviation industry. The County’s investment in property under long term, noncancelable operating leases as of December 31, 2019 (in thousands):
Governmental Business-type ActivitiesActivities Airport Other
Land $ 65 $ 14,212 $ 407
Buildings 317 24,691 424
Less: Depreciation (317) (14,892) (146)Total cost of property under lease $ 65 $ 24,011 $ 685
Minimum future lease receipts on noncancelable operating leases based on contract amounts and terms as of December 31, 2019 (in thousands):
Governmental Business-type ActivitiesYear Activities Airport Other Total2020 $ 2,721 $ 19,193 $ 138 $ 22,0522021 1,296 18,890 107 20,2932022 810 18,866 58 19,7342023 625 18,845 37 19,5072024 578 18,650 17 19,245
2025-2029 2,677 92,556 62 95,295 2030-2034 593 36,287 24 36,9042035-2039 18 25,380 24 25,422 2040-2044 18 25,323 8 25,349 2045-2049 18 17,650 — 17,668
Page 122
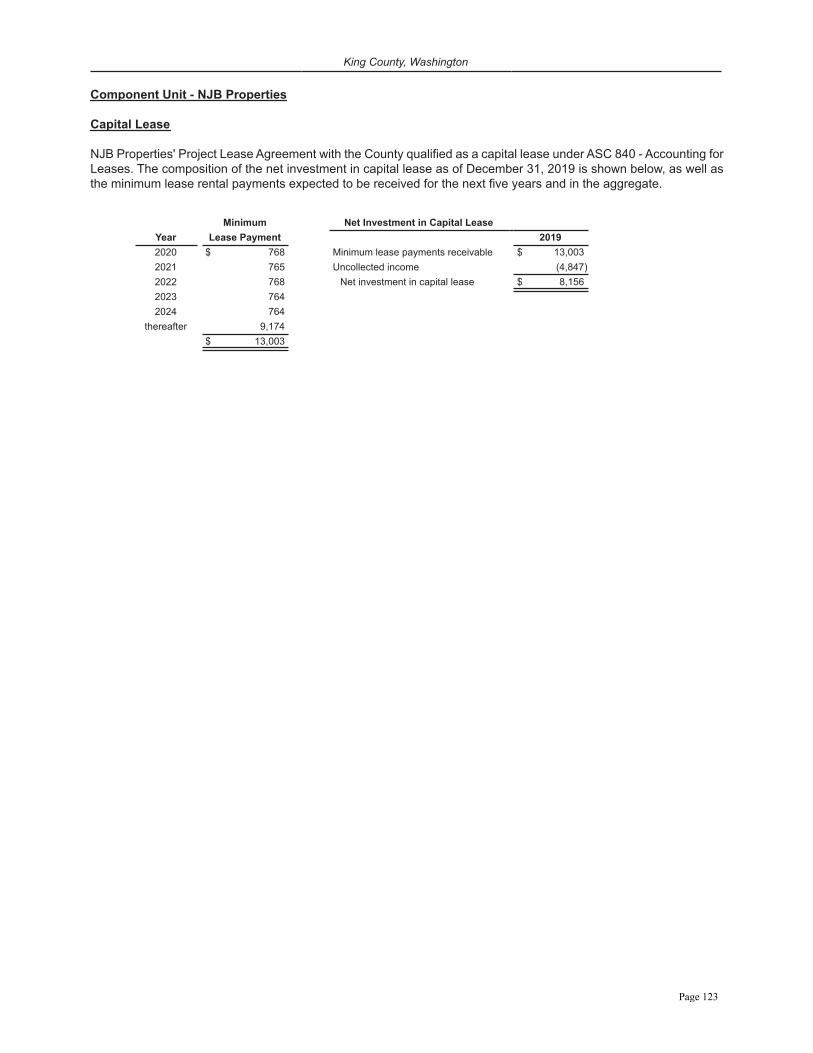
King County, Washington
Component Unit - NJB Properties
Capital Lease
NJB Properties' Project Lease Agreement with the County qualified as a capital lease under ASC 840 - Accounting for Leases. The composition of the net investment in capital lease as of December 31, 2019 is shown below, as well as the minimum lease rental payments expected to be received for the next five years and in the aggregate.
Minimum Net Investment in Capital LeaseYear Lease Payment 20192020 $ 768 Minimum lease payments receivable $ 13,0032021 765 Uncollected income (4,847)2022 768 Net investment in capital lease $ 8,1562023 7642024 764
thereafter 9,174$ 13,003
Page 123

King County, Washington
Note 13Landfill Closure and Post-Closure Care
King County is legally responsible for closure and post-closure care costs associated with the County’s solid waste landfills. Estimated costs of closure and post-closure care are recognized as the remaining estimated capacity is filled. These amounts are based on what it would cost to perform all closure and post-closure care in current dollars. Actual cost may be different due to inflation or deflation, changes in technology and changes in laws or regulations.
State and federal laws and regulations require King County to complete closure activities at its Cedar Hills Landfill site when the County stops accepting waste at this location. Certain maintenance and monitoring functions are also required at the sites for minimum of 30 years or until the closed landfill reaches functional stability under state law; the County estimates it will take 42 years following closure for the Cedar Hills Landfill to reach functional stability. Enumclaw, Hobart, Vashon and Cedar Falls landfills have been closed. Duvall, Puyallup, Houghton, Bow Lake and First Northeast are custodial landfills which were closed 30 or more years ago and are subject to less prescriptive laws and regulations.
Although closure and post-closure care costs will be paid only near or after the date that the landfills stop accepting waste, the County reports a portion of these costs as an operating expense in each period. The expense is based on landfill capacity used as of each year-end.
The $248.3 million reported as landfill closure and post-closure care liability as of December 31, 2019, represents the cumulative percentage reported based on the amount that each of the landfills has been filled to date as follows (dollars in thousands):
LandfillPercentFilled
EstimatedLiability
EstimatedRemaining
Liability
EstimatedYear ofClosure
Cedar Hills 83.44% $ 168,192 $ 67,310 2040Closed 100% 58,484 — ClosedCustodial 100% 21,640 — Closed
The County is required by state and federal laws and regulations to make annual contributions to a reserve fund to finance closure and post-closure care. The County is in compliance with these requirements. As of December 31, 2019, cash and cash equivalents of $4.5 million were held in the Landfill Post-closure Maintenance Fund. In addition, $41.7 million were held in the Landfill Reserve Fund designated for the management and development of the landfill.
The County expects that future cost increases resulting from inflation will be covered by the interest income earned on these annual contributions. However, if interest earnings are inadequate, or additional post-closure care requirements are determined due to changes in technology or regulations, the County may need to increase future user fees or tax revenues.
Page 124

King County, Washington
Note 14Pollution Remediation
Pollution remediation liabilities reported at the end of 2019 do not include potential costs of cleanup that may arise out of the legal issues described in Note 19 - “Legal Matters, Financial Guarantees and Other Commitments.” The likelihood of negative outcomes in these matters, the amount of liabilities that may arise and the resultant allocation among potentially responsible parties (PRP), cannot be reasonably estimated at this time.
The major sites where the County is conducting remediation activities are:
Elliott Bay and the Lower Duwamish Waterway - These ongoing projects include the sediment management of aquatic habitats along Elliott Bay and the cleanup of certain sites along the Lower Duwamish Waterway. The Sediment Management Project has been approved by the Metropolitan King County Council as a self-obligated pollution remediation program. The Lower Duwamish Waterway project became an obligation when King County entered into an Administrative Order on Consent (AOC) with the Washington State Department of Ecology (DOE) and the U.S. Environmental Protection Agency (EPA). This AOC also identified the Boeing Company, the City of Seattle and the Port of Seattle as parties to conduct the studies on which to base the cleanup decision. Each party has agreed in principle to pay one-fourth of the cleanup costs.
Both projects can result in additional cleanup efforts if future regulatory orders are declared. These potential cleanup liabilities, however, cannot be reasonably estimated at this time. Ongoing regulatory action may identify other PRPs for the Lower Duwamish Waterway cleanup.
There are no estimated recoveries at this time that will reduce the amount of these obligations. The total pollution remediation liability at December 31, 2019 stands at $44.5 million although the actual amount will vary due to changes resulting from price increases or reductions, changes in technology, or changes in applicable laws or regulations.
The method for estimating liabilities continues to be based on internal engineering analysis, program experience, and cost projections for the remediation activities scheduled in future years as programmed under Water Quality’s Regional Wastewater Services Plan. Certain costs were developed by consulting engineers. Costs were estimated using the expected cash flow method. For the Lower Duwamish Waterway Project a weighted-average method is used to calculate the liability. The Sediment Management Plan does not employ a weighted-average cost estimate because the remaining work is well-defined which negates the utility of multiple estimates. The cost estimates continue to be re-measured as succeeding benchmarks are reached or when cost assumptions are modified. All pollution remediation obligations under the Water Quality enterprise are being deferred as assets as permitted by regulatory accounting standards.
Lake Union Tank and Dearborn Groundwater Monitoring - The Public Transportation Enterprise reported a pollution remediation liability of $659 thousand at December 31, 2019. The pollution obligation is primarily related to monitoring soil and ground water contamination at the Lake Union Tank and Dearborn sites (under consent decrees from the DOE, dating back to the mid-1990’s) and groundwater monitoring at two bus operation bases on a voluntary basis. The liability was measured at the estimated amounts compiled by Public Transportation staff with knowledge of pollution issues at the sites, using the expected cash flow technique. Cost estimates are subject to changes when additional information becomes available regarding the level of contamination at specific sites, when existing agreements or remediation methods are modified, or when new applicable regulations emerge.
Gasworks Park - In 2005, the City of Seattle and Puget Sound Energy (PSE) entered an agreed order with the DOE for investigating and identifying cleanup options for Lake Union sediments surrounding Gasworks Park. The City and PSE named Metro Transit and Chevron Corporation as additional potentially liable parties (PLP) related to the Gasworks sediment site. Subsequently, the DOE notified Metro Transit and Chevron Corporation that they might be PLPs under the Model Toxics Control Act. The DOE has not issued a final decision regarding Metro Transit’s status as a PLP. No liability was recorded because outlays for the site cleanup were not reasonably estimable at December 31, 2019.
Maury Island Gravel Mine Site - King County acquired approximately 250 acres of property on Vashon Island in 2010. The property is within the footprint of the former ASARCO smelter plume, and contains elevated levels of lead and arsenic, a condition that was known at the time of acquisition. In February 2011, King County was named a “potentially liable party” for cleanup of the site by the DOE. An Agreed Order between DOE and King County was
Page 125

King County, Washington
finalized in January 2013 requiring the County to conduct a remediation investigation, a feasibility study and a cleanup action plan. Because the remediation was a prerequisite to the purchase agreement and is a necessary activity to prepare a portion of the land for its intended use, the County intends to capitalize the cost of pollution as part of the land. The remediation will be completed in phases over a period of about five to 10 years. As of December 31, 2016, the County completed the first phase of an Interim Action Cleanup Plan with approval from the DOE, costing approximately $600 thousand. The cleanup included removing invasive vegetation and surface soil on three acres immediately south of SW 260th St, adding a compost cap, and replanting the area with native trees and shrubs. The cleanup costs incurred in 2016 were capitalized. The remaining cleanup requirements were proposed in a Draft Cleanup Action Plan that DOE issued for Public Comment in April 2018. King County responded to public comment and DOE approved the Cleanup Action Plan in early 2019. Implementation of the first phase of the cleanup-trail- capping was completed in March 2020. The next phase-capping of the former skeet range and removal of three more acres of invasive vegetation to then be covered with temporary weed fabric will occur in late 2020. Planting of those three acres and removal of an additional three acres of invasive vegetation will occur every two to three years until 16 acres of contaminated area has been restored.
Washington Air National Guard Site Investigation - The Washington Air National Guard (WANG) site is located at 6736 Ellis Avenue South in Seattle, Washington. The WANG site occupies approximately 7.5 acres, adjacent to the northwest boundary of the North Boeing Field Georgetown Steam Plant (NBF/GTSP). The WANG site was developed during World War II by the War Department, and served as an aircraft factory school between 1943 and 1948. During environmental investigations at the site, a dissolved Trichloroethene (TCE) plume was identified in shallow groundwater in the southern portion of the site. In May 2016, the Washington State Department of Ecology (DOE) recommended that King County conduct an investigation to determine if the source of recent increases in TCE concentrations in groundwater monitoring wells at the NBF/GTSP site is from the WANG site. The site investigation work will be conducted in three phases: soil and groundwater data collection, soil and groundwater sampling, and quarterly groundwater monitoring. The Airport reported a pollution remediation liability of $245 thousand at December 31, 2019.
East Perched Zone - The East Perched Zone (EPZ) is a 20-acre area of shallow groundwater located on the east side of the Cedar Hills Regional Landfill (CHRLF) in Maple Valley, Washington. Based on an incomplete draft Remedial Investigation (RI), shallow groundwater in the EPZ is impacted by vinyl chloride, arsenic, manganese, and iron. The County believes these contaminants were deposited through exposure of the water and surrounding soils to landfill gas. Regulations did not require liners between refuse and native soils when refuse was placed in this part of the landfill, which dated back to the mid-1960s. The Washington State Department of Ecology, on behalf of Public Health - Seattle and King County, requested that King County Solid Waste Division engage in a voluntary cleanup of the EPZ under the Model Toxics Control Act (MTCA). The Solid Waste Division reported a pollution remediation liability of $1.21 million at December 31, 2019 to complete the RI work and a feasibility study.
Page 126

King County, Washington
Note 15Long-term Liabilities
Short-term Debt Instruments and Liquidity
At December 31, 2019, King County has no short-term debt outstanding.
Long-term Debt
King County has long-term debt reported for both governmental activities and business-type activities.
For governmental activities, long-term debt consists of general obligation bonds and general obligation capital leases. The County issues general obligation bonds to provide funds for the acquisition and construction of major capital facilities. These bonds consist of limited, unlimited general obligation bonds and capital leases. The general obligation bonds are direct obligations and pledge the full faith and credit of the County. These bonds generally are issued as serial bonds with principal maturing each year and maturities that range from five to 30 years. For business-type activities, long-term debt consists of limited tax general obligation bonds are accounted for in the King County International Airport, Marine Division, Solid Waste, Public Transportation and Water Quality Enterprise Funds. Capital leases are accounted for in the Public Transportation Enterprise Fund. Sewer Revenue Bonds are accounted for in the Water Quality Enterprise Fund. State of Washington revolving loans-Direct Borrowings are accounted for in the Water Quality Enterprise Fund and Solid Waste Fund. Limited tax general obligation bonds-Direct Placements are accounted for in the Water Quality Enterprise Fund.
Sewer revenue bonds are accounted for in the Water Quality Enterprise Fund. These bonds are secured by the pledge of and lien on revenues of the sewer system subject to the payment of all operating and maintenance expenses of the sewer system. Payments from revenues of Water Quality are required to be made to the sewer revenue bond fund in the annual amounts sufficient to retire serial or term bonds on or before maturity. The amount required in the cash reserved and surety policies is based on the highest year of debt services over the life of all outstanding revenue bonds. The sewer revenue bonds are special limited obligations of the County, and neither its full faith and credit nor any taxing power is pledged to the payment of the sewer revenue bonds. These sewer revenue bonds have maturities that range from 20 to 40 years.
Page 127

King County, Washington
The following tables summarize long-term debt issuances and amounts outstanding:
SCHEDULE OF LONG-TERM DEBT(IN THOUSANDS)
(PAGE 1 OF 3)
OriginalIssue Final Interest Issue OutstandingDate Maturity Rates Amount at 12/31/19
I. GOVERNMENTAL ACTIVITIES – LONG-TERM DEBTIA. Limited Tax General Obligation Bonds (LTGO)
2009C LTGO Refunding1993B Bonds 12/1/2009 1/1/2024 4.50% $ 17,150 $ 3,095
2010A LTGO Refunding 2001 and 2002 Bonds (Partial) 10/28/2010 6/1/2021 2.00-5.00% 21,445 1,745
2010B LTGO (BABs) (Taxable) Bonds 12/1/2010 12/1/2021 2.85-6.05% 17,355 3,930
2010C LTGO (RZEDBs) (Taxable) Bonds 12/1/2010 12/1/2030 4.58-6.05% 23,165 23,165
2010D LTGO (QECBs) (Taxable) Bonds 12/1/2010 12/1/2025 5.43% 2,825 2,825
2011 LTGO Refunding 2002, 2003A, and 2003B Bonds 8/1/2011 6/1/2023 2.00-5.00% 25,700 9,990
2011D LTGO (Maury Island/Open Space Acquisition) Bonds 12/21/2011 12/1/2031 2.00-3.50% 21,895 12,250
2012A LTGO (ABT Project) Bonds 3/29/2012 7/1/2022 3.00-5.00% 65,935 26,130
2012B LTGO (S. Park Bridge) Bonds 5/8/2012 9/1/2032 3.00-5.00% 28,065 20,900
2012C LTGO Refunding 2004B and 2005 Bonds 8/28/2012 1/1/2025 5.00% 54,260 30,475
2012D LTGO Refunding 2002BOP Lease (HMC) Bonds 11/29/2012 12/1/2031 2.00-5.00% 41,810 30,165
2012E LTGO SE District Court Relocation Bonds (Partial) 12/19/2012 12/1/2027 2.00-5.00% 3,000 1,785
2012F LTGO (QECBS) (Taxable) KCCF HVAC Project (Partial) 12/19/2012 12/1/2022 2.20% 3,010 3,010
2013B LTGO Refunding 2005 GHP Lease Bonds 12/19/2013 12/1/2026 3.00-5.00% 42,820 27,835
2014A LTGO Refunding 2005 GHP Lease Bonds 2/26/2014 12/1/2032 5.00% 34,815 34,420
2014B LTGO (Tall Chief Acquisition/SWM) Bonds 6/24/2014 6/1/2034 2.00-5.00% 15,395 13,440
2015B LTGO (FED TAX-EXEMPT) Bonds 10/13/2015 12/1/2030 2.50-5.00% 27,355 17,295
2015C LTGO Refunding 2007C and 2007D Bonds 10/13/2015 1/1/2028 3.00-5.00% 25,970 24,010
2015E LTGO Refunding 2006A NJB and 2007 KSC Lease Bonds 12/17/2015 12/1/2036 4.00-5.00% 172,320 151,560
2016A LTGO Bond 4Culture Building 3/10/2016 12/1/2030 1.50-5.00% 22,450 21,450
2017B LTGO Bond Various Purpose (Partial) 8/10/2017 6/1/2037 3.00-5.00% 33,325 27,240
2018A LTGO Bond Various Purpose (Partial) 8/8/2018 6/1/2038 5.00% 5,845 5,385
2019HUD LTGO Refg06HUD Section108 Bonds 3/28/2019 8/1/2024 2.55-2.67% 1,437 1,227
2019A LTGO Refunding 2009B and 2013MM Bonds 3/15/2019 6/1/2029 5.00% 41,420 39,485
2019B LTGO Bond Various Purpose 9/12/2019 7/1/2039 5.00% 62,340 62,340
2019C LTGO Refunding 2009C Bonds 12/19/2019 1/1/2024 5.00% 13,020 13,020
Total Payable From Limited Tax GO Redemption Fund 824,127 608,172
Payable From Internal Service Funds
2010B LTGO (BABs) (Taxable) Bonds 12/1/2010 12/1/2020 4.58-6.05% 7,125 1,050
Total Payable From Internal Service Funds 7,125 1,050
Total Limited Tax General Obligation Debt 831,252 609,222
IB. Limited Tax GO Capital Lease(a)
2006 Project lease agreement - NJB Properties 11/14/2006 12/1/2036 5.00-5.51% 189,720 8,156
Total Limited Tax GO Capital leases 189,720 8,156
IC. Unlimited Tax General Obligation Bonds (UTGO)
Payable From Unlimited Tax GO Redemption Fund
2012 UTGO Refunding 2004 (HMC) and 2004B (HMC) Bonds 8/14/2012 12/1/2023 2.00-5.00% 94,610 49,825
Total Payable From Unlimited Tax GO Bond Redemption Fund 94,610 49,825
TOTAL GOVERNMENTAL ACTIVITIES – LONG-TERM DEBT 1,115,582 667,203
(a) Project lease agreements - NJB properties. Under the lease agreements, the County’s obligation to pay rent to NJB Properties is a limited tax general obligation.
Page 128

King County, Washington
SCHEDULE OF LONG-TERM DEBT(IN THOUSANDS)
(PAGE 2 OF 3)Original
Issue Final Interest Issue OutstandingDate Maturity Rates Amount at 12/31/19
II. BUSINESS-TYPE ACTIVITIES – LONG-TERM DEBTIIA. Limited Tax General Obligation Bonds (LTGO) Payable from Enterprise Funds
2008 LTGO (WQ) Refunding 1998B Bonds 2/12/2008 1/1/2023 3.25-5.25% $ 236,950 $ 21,020
2010A LTGO Refunding 2001 (Airport) Bonds (Partial) 10/28/2010 6/1/2021 2.00-5.00% 5,110 1,135
2010B LTGO (BABs) (Transit) Taxable Bonds 12/1/2010 12/1/2030 2.85-6.05% 20,555 14,925
2010D LTGO (QECBs) (Transit) Taxable Bonds 12/1/2010 12/1/2020 4.33% 3,000 3,000
2012A LTGO (WQ) Refunding 2005A Bonds 4/18/2012 1/1/2025 2.00-5.00% 68,395 48,460
2012B LTGO (WQ) Refunding 2005A Bonds 8/2/2012 1/1/2029 5.00% 41,725 30,500
2012D LTGO (Transit) Refunding 2002 and 2004 Bonds 10/16/2012 6/1/2034 2.00-5.00% 71,670 33,115
2012F LTGO (WQ) (South Plant Pump) Bonds 12/19/2012 12/1/2022 2.20% 3,010 3,010
2013 LTGO (Solid Waste) Bonds 2/27/2013 12/1/2040 3.10-5.00% 77,100 64,250
2014C LTGO & Refunding 2007E (Solid Waste) Bonds 7/30/2014 12/1/2034 2.00-5.00% 25,515 22,305
2015A LTGO (WQ) Refunding 2009B2 Bonds 2/18/2015 7/1/2038 2.00-5.00% 247,825 247,395
2015B LTGO (FED Tax-Exempt) (Solid Waste) Bonds 10/13/2015 12/1/2025 5.00% 60 40
2015D LTGO & Refunding 2007E (Solid Waste) Bonds 11/5/2015 12/1/2040 3.00-5.00% 50,595 43,415
2017A LTGO (WQ) Refunding 2008 Bonds 10/25/2017 7/1/2033 4.00-5.00% 154,560 139,840
2017A LTGO (Solid Waste) Bonds 6/8/2017 6/1/2040 3.25-5.00% 31,230 29,690
2017B LTGO (Solid Waste) Bond Various Purpose 8/10/2017 6/1/2027 4.00-5.00% 135 125
2018A LTGO (Marine Construction) partial 8/8/2018 6/1/2038 4.00-5.00% 6,330 6,135
2019 LTGO (WQ) Capital Improvement Projects Bonds 10/24/2019 1/1/2038 5.00% 101,035 101,035
2019A Multi-Modal LTGO Refunding 2015AB Bonds 6/27/2019 1/1/2046 Variable (b) 100,000 100,000
2019B Multi-Modal LTGO Refunding 2017 Bonds 6/27/2019 1/1/2046 Variable (b) 48,095 48,095
Total Limited Tax GO Bonds Payable From Enterprise Funds 1,292,895 957,490
IIB. GO Bonds Payable - Direct Placements Payable from Enterprise Funds
2017A Multi-Modal LTGO (WQ) Refunding 2010A Bonds 10/26/2017 1/1/2040 Variable (c) 50,000 50,000
2017B Multi-Modal LTGO (WQ) Refunding 2010B Bonds 10/26/2017 1/1/2040 Variable (c) 50,000 50,000
Total GO Bonds Payable -Direct Placements Payable From Enterprise Funds 100,000 100,000
Total LTGO Bonds and GO Bonds-Direct Placements Payable from Enterprise Funds 1,392,895 1,057,490
IIC. Revenue Bonds Payable from Enterprise Funds
2001A WQ Revenue Junior Lien Variable Rate Demand Bonds 8/6/2001 1/1/2032 Variable(d) $ 50,000 $ 50,000
2001B WQ Revenue Junior Lien Variable Rate Demand Bonds 8/6/2001 1/1/2032 Variable(d) 50,000 50,000
2010 WQ Revenue & Refunding 2001 Bonds 7/19/2010 1/1/2036 2.00-5.00% 334,365 37,610
2011 WQ Revenue (Capital Improvement Projects) Bonds 1/25/2011 1/1/2021 5.00-5.125% 175,000 8,190
2011B WQ Revenue Refunding 2001, 2002A, 2002B, and 04A Bonds 10/5/2011 1/1/2026 1.00-5.00% 494,270 45,890
2011C WQ Revenue Refunding 2001, 2002A, and 2004A Bonds 11/1/2011 1/1/2022 3.00-5.00% 32,445 7,885
2011 WQ Revenue Junior Lien Variable Rate Demand Bonds 10/26/2011 1/1/2042 Variable(e) 100,000 100,000
2012 WQ Revenue and Refunding 2004A Bonds 4/18/2012 1/1/2052 5.00% 104,445 89,785
2012B WQ Revenue and Refunding 2004A Bonds 8/2/2012 1/1/2035 4.00-5.00% 64,260 64,260
2012C WQ Revenue and Refunding 2004A and 2006 Bonds 9/19/2012 1/1/2033 2.50-5.00% 65,415 37,520
2012 WQ Revenue Junior Lien Variable Rate Demand Bonds 12/27/2012 1/1/2043 Variable(f) 100,000 100,000
2013A WQ Revenue Refunding 2003, 2006, and 2005 WQ-LTGO Bonds 4/9/2013 1/1/2035 2.00-5.00% 122,895 103,515
2013B WQ Revenue and Refunding 2004B Bonds 10/29/2013 1/1/2044 2.00-5.00% 74,930 56,865
2014A WQ Revenue Refunding 2007 Bonds 7/8/2014 1/1/2047 5.00% 75,000 75,000
2014B WQ Revenue Refunding 2004B, 2006, 2006B, 2007 and 2008 Bonds 8/12/2014 7/1/2035 1.00-5.00% 192,460 181,490
2015A WQ Revenue Refunding 2007, 2008, and 2009 Bonds 2/18/2015 7/1/2047 3.00-5.00% 474,025 470,475
2015B WQ Revenue & Refunding 2006 Bonds 11/17/2015 1/1/2046 4.00-5.00% 93,345 75,985
2016A WQ Revenue & Refunding 2007, 2008, 2009, 2010 Bonds 2/17/2016 7/1/2041 4.00-5.00% 281,535 273,975
2016B WQ Revenue & Refunding 2006-2, 2010, 2011A, 2011B, 2011C Bonds 10/12/2016 7/1/2049 4.00-5.00% 499,655 492,005
2017A WQ Revenue Refunding 2009 LTGO, 2010, 2011A, 2011B, 2011C Bonds 12/19/2017 7/1/2049 5.00% 149,485 127,840
2018B WQ Revenue Refunding 2010, 2011B, 2012 Bonds 11/15/2018 7/1/2032 5.00% 124,455 124,455
Total Revenue Bonds Payable from Enterprise Funds $ 3,657,985 $ 2,572,745
Page 129

King County, Washington
SCHEDULE OF LONG-TERM DEBT(IN THOUSANDS)
(PAGE 3 OF 3)
OriginalIssue Final Interest Issue OutstandingDate Maturity Rates Amount at 12/31/19
IID. State Revolving Loans-Direct Borrowings Payable from Enterprise Funds
2000-2019 WQ State of Washington Revolving Loans Various Various 0.50-3.10% 255,705 226,221
2019 Solid Waste State of Washington Revolving Loans 6/26/2019 6/1/2038 1.66% 1,322 1,322
Total State Revolving Loans-Direct Borrowings Payable from Enterprise Funds 257,027 227,543
IIE. Capital Leases Payable from Enterprise Funds
2000 Public Transportation Park and Ride Capital Leases 3/30/2000 12/31/2031 5.00% 4,722 2,241
Total Capital Leases Payable From Enterprise Funds 4,722 2,241
TOTAL BUSINESS-TYPE ACTIVITIES – LONG-TERM DEBT 5,312,629 3,860,019
TOTAL LONG-TERM DEBT $ 6,428,211 $ 4,527,222
(b) The Multi-Modal 2019A Bonds initially will bear interest at Daily Interest Rate for Daily Interest Rate Periods and the Multi-Modal 2019B Bonds initially will bear interest at Weekly Interest Rates for Weekly Interest Rate Periods, subject to conversion to other Modes.
(c) The 2017AB Multi-Modal bonds initially issued in the Weekly Mode bear interest at Weekly Rates. The bonds in the Weekly Mode may be converted to Daily Mode, Flexible Mode, Term Rate Mode or Fixed Rate Mode.
(d) The 2001AB junior lien variable rate demand bonds initially issued in the Weekly Mode will bear interest at Weekly Rates. The Weekly Rate for each Interest Period is determined by the Remarketing Agents. The bonds in the Weekly Mode may be changed to or from the Weekly Mode to or from a Daily Mode, a Commercial Paper Mode, or a Long-term Mode, or to a Fixed Mode, upon satisfaction of the "Change in Modes" conditions.
(e) On December 3, 2018 the junior lien variable rate demand bonds sewer revenue bonds, series 2011 was remarketed. The 2011 initially issued in the LIBOR Index Mode was converted to a Term Rate Mode and extending to November 30, 2020 (2011 Term Rate Period), subject to prior optional redemption on or after the 2011 Bonds Par Call Date and will bear interest at the 2011 Term Rate.
(f) On December 3, 2018 the junior lien variable rate demand bonds sewer revenue bonds, series 2012 was remarketed. The 2012 initially issued in the Index Rate Mode was converted to a Term Rate Mode and extending to November 30, 2021 (the 2012 Term Rate Period), subject to prior optional redemption on or after the 2012 Bonds Par Call Date and will bear interest at the 2012 Term Rate.
Page 130
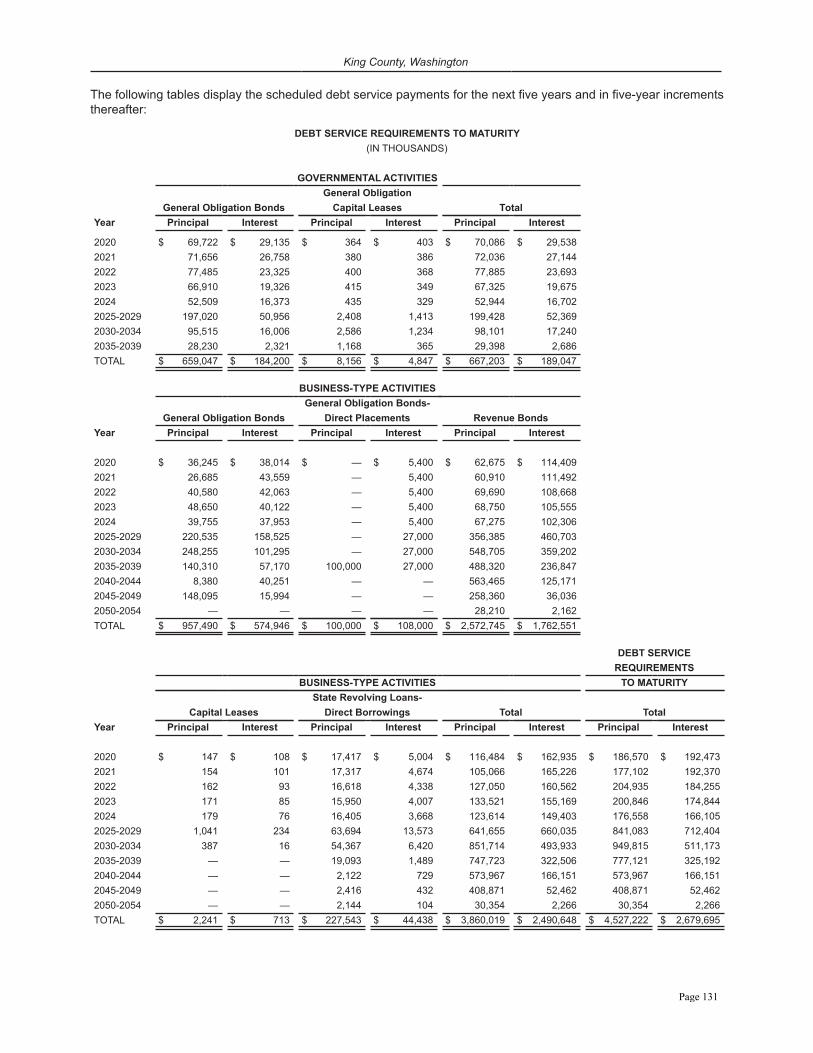
King County, Washington
The following tables display the scheduled debt service payments for the next five years and in five-year increments thereafter:
DEBT SERVICE REQUIREMENTS TO MATURITY(IN THOUSANDS)
GOVERNMENTAL ACTIVITIESGeneral Obligation
General Obligation Bonds Capital Leases TotalYear Principal Interest Principal Interest Principal Interest
2020 $ 69,722 $ 29,135 $ 364 $ 403 $ 70,086 $ 29,5382021 71,656 26,758 380 386 72,036 27,1442022 77,485 23,325 400 368 77,885 23,6932023 66,910 19,326 415 349 67,325 19,6752024 52,509 16,373 435 329 52,944 16,7022025-2029 197,020 50,956 2,408 1,413 199,428 52,3692030-2034 95,515 16,006 2,586 1,234 98,101 17,2402035-2039 28,230 2,321 1,168 365 29,398 2,686TOTAL $ 659,047 $ 184,200 $ 8,156 $ 4,847 $ 667,203 $ 189,047
BUSINESS-TYPE ACTIVITIESGeneral Obligation Bonds-
General Obligation Bonds Direct Placements Revenue BondsYear Principal Interest Principal Interest Principal Interest
2020 $ 36,245 $ 38,014 $ — $ 5,400 $ 62,675 $ 114,4092021 26,685 43,559 — 5,400 60,910 111,4922022 40,580 42,063 — 5,400 69,690 108,6682023 48,650 40,122 — 5,400 68,750 105,5552024 39,755 37,953 — 5,400 67,275 102,3062025-2029 220,535 158,525 — 27,000 356,385 460,7032030-2034 248,255 101,295 — 27,000 548,705 359,2022035-2039 140,310 57,170 100,000 27,000 488,320 236,8472040-2044 8,380 40,251 — — 563,465 125,1712045-2049 148,095 15,994 — — 258,360 36,0362050-2054 — — — — 28,210 2,162TOTAL $ 957,490 $ 574,946 $ 100,000 $ 108,000 $ 2,572,745 $ 1,762,551
DEBT SERVICEREQUIREMENTS
BUSINESS-TYPE ACTIVITIES TO MATURITYState Revolving Loans-
Capital Leases Direct Borrowings Total TotalYear Principal Interest Principal Interest Principal Interest Principal Interest
2020 $ 147 $ 108 $ 17,417 $ 5,004 $ 116,484 $ 162,935 $ 186,570 $ 192,4732021 154 101 17,317 4,674 105,066 165,226 177,102 192,3702022 162 93 16,618 4,338 127,050 160,562 204,935 184,2552023 171 85 15,950 4,007 133,521 155,169 200,846 174,8442024 179 76 16,405 3,668 123,614 149,403 176,558 166,1052025-2029 1,041 234 63,694 13,573 641,655 660,035 841,083 712,4042030-2034 387 16 54,367 6,420 851,714 493,933 949,815 511,1732035-2039 — — 19,093 1,489 747,723 322,506 777,121 325,1922040-2044 — — 2,122 729 573,967 166,151 573,967 166,1512045-2049 — — 2,416 432 408,871 52,462 408,871 52,4622050-2054 — — 2,144 104 30,354 2,266 30,354 2,266TOTAL $ 2,241 $ 713 $ 227,543 $ 44,438 $ 3,860,019 $ 2,490,648 $ 4,527,222 $ 2,679,695
Page 131

King County, Washington
Long-term liability activity is reported by King County within governmental activities and business-type activities. The summary of changes in long-term liabilities for the year ended December 31, 2019 is as follows (in thousands):
Balance Balance Due Within01/01/2019 Additions Reductions 12/31/2019 One Year
Governmental activities:General obligation bonds payable:
General obligation (GO) bonds $ 646,312 $ 118,217 $ (105,482) $ 659,047 $ 69,722GO bonds payable-Direct Borrowings 30,760 — (30,760) — —Unamortized bonds premium and discount 52,763 21,373 (12,148) 61,988 —
Total bonds payable 729,835 139,590 (148,390) 721,035 69,722
Other liabilities:General obligation capital leases 8,291 — (135) 8,156 364Compensated absences liability (a) 109,504 122,992 (119,539) 112,957 6,072Net pension liability 308,153 270,294 (347,342) 231,105 —Other postemployment benefits 96,758 5,017 (5,564) 96,211 —Asset retirement obligation (b) 150 — — 150 —Estimated claims settlements and other liabilities 157,719 284,272 (282,260) 159,731 58,462
Total other liabilities 680,575 682,575 (754,840) 608,310 64,898Total Governmental activities long-term liabilities $ 1,410,410 $ 822,165 $ (903,230) $ 1,329,345 $ 134,620
Business-type activities:Bonds payable:
General Obligation (GO) bonds $ 814,695 $ 249,130 $ (106,335) $ 957,490 $ 36,245GO bonds payable-Direct Placements 100,000 — — 100,000 —Revenue bonds 2,807,510 — (234,765) 2,572,745 62,675Unamortized bonds premium and discount 353,187 18,993 (33,555) 338,625 —
Total bonds payable 4,075,392 268,123 (374,655) 3,968,860 98,920
Other liabilities:Capital leases 2,381 — (140) 2,241 147State revolving loans-Direct Borrowings 229,474 15,319 (17,250) 227,543 17,418Compensated absences liability 70,559 88,988 (89,326) 70,221 11,497Net pension liability 250,378 215,945 (281,600) 184,723 —Other postemployment benefits 14,654 1,398 (991) 15,061 —Landfill closure and post-closure care liability 146,142 107,200 (5,026) 248,316 30,441Pollution remediation 48,646 2,456 (4,480) 46,622 4,561Asset retirement obligation (b) 5,680 — — 5,680 —Customer deposits and other liability 3,593 76,494 (1,885) 78,202 468
Total other liabilities 771,507 507,800 (400,698) 878,609 64,532Total Business-type activities long-term liabilities $ 4,846,899 $ 775,923 $ (775,353) $ 4,847,469 $ 163,452
Governmental activities estimated claims settlements of $159.7 million are liquidated by internal service funds. Governmental activities compensated absences, net pension liability and other postemployment benefits are liquidated by the governmental fund in which an employee receiving the payment is budgeted, including most notably, General Fund, Public Health Fund and County Road Fund.
(a) In 2019, the beginning balance of compensated absences liability was restated from $106.6 million to $109.5 million to include governmental fund comp time liabilities.
(b) The beginning balance of asset retirement obligation was restated resulting from the County's implementation of GASB 83 in 2019.
General Obligation Bonds-Direct PlacementsThe County’s outstanding notes from direct placements related to business-type activities in the combined amount of $100.0 million related to 2017A/B State Street Bank Multi-Modal LTGO Water Quality Refunding Bonds are secured by a subordinate lien on the net revenue of the Water Quality system as well as the full faith and credit of the County. This outstanding 2017A/B Multi-Modal LTGO from direct placements related to business-type activities of $100.0 million contain 1) provision that in the event of default under the continuing covenants agreements for the bonds that provide additional security includes non-payment of amounts due and ratings downgrades below certain thresholds and 2) a provision that if the County is unable to make payment, outstanding amounts are due immediately. The subjective acceleration clause that allows the lender to accelerate payment of the entire principal amount to become immediately due if the lender determines that a material adverse change occurs.
Page 132

King County, Washington
State of Washington Revolving Loans-Direct Borrowings
Water Quality - Water Quality has received loans from the Washington State Department of Ecology under the Water Pollution Control State Revolving Fund Loan Program and the Washington Public Works Trust Fund administered by the Washington State Department of Commerce. State loans are secured by a subordinate lien on the net revenues of the system. Events of default under the loan agreements with the Department of Ecology include nonpayment of amounts due, failure to commence the project for which the loan was granted and unjustified failure to perform loan agreement obligations. Remedies include suspending any undisbursed loan proceeds and acceleration of the outstanding balance, provided that the loan is not subject to acceleration if any sewer revenue bonds are outstanding. Any state funds owed to the County may also be withheld. Events of default under the loan agreements with the Public Works Trust Fund include nonpayment of amounts due and failure to use loan proceeds for permitted activities. Remedies include withholding of any undisbursed loan proceeds, assessment of additional interest and notification to creditors.
Solid Waste - Solid Waste has received loans from the Washington State Department of Commerce under the Washington Public Works Board. State loans are secured by a subordinate lien on the net revenues of the system. Events of default under the loan agreements with the Department of Commerce include nonpayment of amounts due, failure to commence the project for which the loan was granted and unjustified failure to perform loan agreement obligations. Remedies include suspending any undisbursed loan proceeds and acceleration of the outstanding balance. Any state funds owed to the County may also be withheld.
Terms specified in debt agreement related to Events of Default with finance-related consequences and subjective acceleration clauses:
The County’s outstanding bonds related to 2001A/B Water Quality Junior Lien Variable Rate Demand bonds related to business-type activities in the combined amount of $100 million are secured by a subordinate lien on the net revenue of the Water Quality system. This outstanding 2001A/B junior lien variable rate demand bonds contain 1) provision that in the event of default under the letter of credit agreements that provide additional security for the bonds includes non-payment of amounts due and rating downgrades below certain thresholds and 2) a provision that if the County is unable to make payment, outstanding amounts are due immediately.
The County’s outstanding 2019A/B Multi-Modal LTGO Water Quality Refunding bonds related to business-type activities in the combined amount of $148.1 million are secured by a subordinate lien on the net revenue of the Water Quality system as well as the full faith and credit of the County. This outstanding 2019A/B Multi-Modal LTGO WQ Refunding bonds contain 1) provision that in the event of default under the standby bond purchase agreements that provide the liquidity support for the bonds includes non-payment of amounts due and ratings downgrades below certain thresholds and 2) a provision that if the County is unable to make payment, outstanding amounts are due immediately.
Authorized But UnissuedAt yearend, the County had a total of $95 million in general obligation bonds authorized but unissued for the Solid Waste capital program. In addition, the County had authorized $140 million sewer revenue bonds that remained unissued.
Unused Lines of CreditThe County has no unused lines of credit at year-end.
Computation of Legal Debt Margin
Under Washington State law (RCW 39.36.020), a county may incur general obligation debt for general county purposes in an amount not to exceed 2.5 percent of the assessed value of all taxable property within the county. State law requires all property to be assessed at 100 percent of its true and fair value. Unlimited tax general obligation debt requires an approving vote of the people; any election to validate such general obligation debt must have a voter turnout of at least 40 percent of those who voted in the last state general election and, of those voting, 60 percent must be in the affirmative. The County Council may by resolution authorize the issuance of limited tax general obligation debt in an amount up to 1.5 percent of assessed value of property within the County for general county purposes and 0.75 percent for metropolitan functions (Wastewater Treatment and Public Transportation), but the total of limited tax general obligation debt for general county purposes and metropolitan functions should not exceed 1.5 percent of assessed value. No combination of limited and unlimited tax debt, for general county purposes, and no combination of limited and unlimited tax debt, for metropolitan functions, may exceed 2.5 percent of the valuation. The debt service
Page 133

King County, Washington
on unlimited tax debt is secured by excess property tax levies, whereas the debt service on limited tax debt is secured by property taxes collected within the $1.80 per $1,000 of assessed value operating levy.
The legal debt margin computation for the year ended December 31, 2019 (in thousands):
2019 ASSESSED VALUE (2020 TAX YEAR) $ 642,490,492
Debt limit of limited tax general obligations for metropolitan functions
0.75 % of assessed value $ 4,818,679
Less: Net limited tax general obligation indebtedness for metropolitan functions (1,003,673)LIMITED TAX GENERAL OBLIGATION DEBT MARGIN FOR METROPOLITAN FUNCTIONS $ 3,815,006
Debt limit of limited tax general obligations for general county purposes and metropolitan functions
1.5 % of assessed value $ 9,637,357Less: Net limited tax general obligation indebtedness for general county purposes $ (614,104)
Net limited tax general obligation indebtedness for metropolitan functions (1,003,673)Total net limited tax general obligation indebtedness for general county purposes and metropolitan functions (1,617,777)
LIMITED TAX GENERAL OBLIGATION DEBT MARGIN FOR GENERAL COUNTY PURPOSES AND METROPOLITAN FUNCTIONS $ 8,019,580
Debt limit of total general obligations for metropolitan functions2.5% of assessed value $ 16,062,262Less: Net total general obligation indebtedness for metropolitan functions (1,003,673)
TOTAL GENERAL OBLIGATION DEBT MARGIN FOR METROPOLITAN FUNCTIONS $ 15,058,589
Debt limit of total general obligations for general county purposes2.5 % of assessed value $ 16,062,262Less: Net unlimited tax general obligation indebtedness for general county purposes $ (47,345)
Net limited tax general obligation indebtedness for general county purposes (614,104)Total net general obligation indebtedness for general county purposes (661,449)
TOTAL GENERAL OBLIGATION DEBT MARGIN FOR GENERAL COUNTY PURPOSES $ 15,400,813
Refunding and Defeasing General Obligation Bond Issues - 2019
Limited Tax General Obligation Refunding Bonds, 2019 Series A - On March 15, 2019, the County issued $41.4 million in limited tax general obligation refunding bonds, 2019A with an effective interest cost of 1.95 percent to current refund $17.0 million of outstanding limited tax general obligation bonds 2009 Series B and $30.8 million of outstanding limited tax GO bonds 2013 Multi-Modal. As a result, the refunded bonds are considered defeased and the liability for those bonds has been removed from the governmental activities column of the statement of net position.
The reacquisition price exceeded the net carrying amount of the old debt by $331 thousand. This amount, reported in the statement of net position, is being charged to operations through fiscal year 2029, using the outstanding principal balance method. This current refunding was undertaken to reduce total debt service payments by $4.2 million over the life of the new bonds, resulting in an economic gain (difference between the present values of the old and new debt service payments) of $3.8 million.
Limited Tax General Obligation Refunding Bonds, 2019 Series C - On December 19, 2019, the County issued $13.0 million in limited tax general obligation refunding bonds, 2019C with an effective interest cost of 1.1 percent to advance refund $13.9 million of outstanding limited tax general obligation bonds 2009 Series C.
The net proceeds were used to purchase U.S. government securities that were deposited with an escrow agent to provide for all future debt service payments on the refunded bonds. As a result, the refunded bonds are considered
Page 134

King County, Washington
defeased and the liability for those bonds has been removed from the governmental activities column of the statement of net position.
The reacquisition price exceeded the net carrying amount of the old debt by $294 thousand. This amount, reported in the statement of net position, is being charged to operations through fiscal year 2023, using the outstanding principal balance method. This advance refunding was undertaken to reduce total debt service payments by $913 thousand over the life of the new bonds, resulting in an economic gain (difference between the present values of the old and new debt service payments) of $895 million.
Housing and Urban Development (HUD) Section 108 Loan, 2019A - On March 28, 2019, the County refinanced $1.4 million in outstanding 2006 Section 108 loan from the Department of Housing and Urban Development (HUD) for the Greenbridge affordable housing project in White Center. The refinancing of the loan was to take advantage of a lower interest rate and reduce total interest payments by $130 thousand over its remaining five year term. As a result, the 2006 Section 108 loan are considered defeased and the liability for those loans has been removed from the governmental activities column of the statement of net position.
Refunding and Cash Defeasance Sewer Revenue Bond Issues - 2019
Multi-Modal Limited Tax General Obligation (GO) Refunding Bonds (Payable from Sewer Revenues) Bonds, 2019A and Series 2019B. - On June 27, 2019, the County issued $148.1 million in multi-modal limited tax GO refunding bonds (Payable from Sewer Revenues) series, 2019A ($100 million) and Series 2019B ($48.1) with variable interest rates to refund the County’s outstanding Junior Lien Sewer Revenue Bonds Series, 2015 Series A and 2015 Series B and Junior Lien Sewer Revenue Bonds, Series 2017, with variable interest rates. As a result, the series 2015AB and Series 2017 bonds are considered defeased and the liability for those bonds has been removed from the business-type activities column of the statement of net position. Both series of 2019 bonds are variable rate obligations, with daily interest rate resets for 2019A and weekly resets for 2019B. This refunding was undertaken to reduce total debt service payments by $4.5 million over the 5-year life of the standby bond purchase agreement (SBPA).
2019 Cash Defeasance of LTGO Refunding Bonds (Payable from Sewer Revenues) 2012B, Sewer Revenue and Refunding Bonds, 2012C, and LTGO Refunding Bonds (Payable from Sewer Revenues), 2012C - On October 07, 2019, the County purchased Treasury securities at a cost of $24.9 million and placed them in an escrow to pay interest and redeem at their earliest redemption dates $22.5 million of outstanding Sewer Revenue and Refunding Bonds, Series 2012C. Funding for the escrow came from operations and excess in bond reserves. Water Quality undertook the defeasance in order to reduce future debt service payments by $34.7 million through 2032. As a result, the series 2012C bonds are considered defeased and the liability for those bonds has been removed from the business-type activities column of the statement of net position.
On October 7, 2019, the County purchased Treasury securities at a cost of $71.4 million and placed them in an escrow to pay interest and redeem at their earliest redemption dates $64.6 million of outstanding Limited Tax General Obligations Refunding Bonds, Series 2012B and Series 2012C. Funding for the escrow came from operations and excess in bond reserves. Water Quality undertook the defeasance in order to reduce future debt service payments by $103.4 million through 2034. Under the terms of the authorizing ordinances, these bonds have been defeased and are no longer secured by a pledge of the revenue of the sewer system. As a result, the bonds are considered defeased and the liability for those bonds has been removed from the business-type activities column of the statement of net position.
Prior Year Refunded and Defeasance of Debt
As of December 31, 2019, King County has eleven refunded and defeased bond issues outstanding, consisting of five limited tax general obligation bonds ($85 million) and six sewer revenue bonds ($746 million). In prior years, the County defeased these bonds by placing the proceeds of the new bonds in an irrevocable trust accounts to provide for all future debt service payments on the old bonds. Accordingly, the payments of principal and interest on these old bond issues are the responsibility of the escrow agent, U.S. Bank National Association, and the liability for the defeased bonds has been removed from the County’s financial statement.
Page 135

King County, Washington
Asset Retirement Obligations
In 2019, the County reported asset retirement obligations (ARO) in accordance with GASB Statement No. 83, Certain Asset Retirement Obligations. The liability is measured at its current value and based on professional judgment, experience, and historical cost data. The ARO at December 31, 2019 stands at $3.5 million for the Public Transportation Enterprise, $1.5 million for the Water Quality Enterprise, $500 thousand for the Solid Waste Enterprise, $200 thousand for the Radio Communication Services Fund, and $150 thousand for the County Road Operating Fund.
The County's ARO relates to the disposition of underground storage tanks (USTs) due to applicable regulations and requirements. The estimated remaining useful life of the USTs range from three to twenty-two years.
The liability could change over time as new information becomes available as a result of changes in technology, legal or regulatory requirements, and types of equipment, facilities or services that will be used to meet the obligation to dispose of the USTs.
Component Unit - NJB Properties
The following tables summarize the scheduled maturity dates of bond principal over the next five years and in the aggregate of the discretely presented component unit NJB Properties as reported in its separately issued financial statements:
(In Thousands)Original
Issue Final Interest Issue OutstandingDate Maturity Rates Amount at 12/31/19
Lease Revenue Bonds, 2006 Series A 12/5/2006 12/1/2036 5.00-6.00% $ 179,285 $ 5
Lease Revenue Bonds, 2006 Series B 12/5/2006 12/1/2036 5.00-6.00% 10,435 8,300
Total Bonds Payable $ 189,720 $ 8,305
Year Principal
2020 310
2021 325
2022 345
2023 360
2024 380
Thereafter 6,585
Total 8,305
Page 136

King County, Washington
Note 16Interfund Balances and Transfers
Interfund Balances
Due from/to other funds and interfund short-term loans receivable and payable (in thousands):
Fund types with account balances of less than $500 thousand are aggregated into “All Others.”
Receivable Fund Payable Fund AmountGeneral Fund All Others $ 278Behavioral Health Fund Nonmajor Governmental Funds 1,062
All Others 16Nonmajor Governmental Funds General Fund 8,657
Behavioral Health Fund 904Nonmajor Governmental Funds 25,735All Others 63
Public Transportation Enterprise General Fund 1,587Nonmajor Governmental Funds 5,141
Water Quality Enterprise General Fund 1,092Nonmajor Governmental Funds 1,914
Solid Waste Enterprise Nonmajor Governmental Funds 2,659All Others 251
Nonmajor Enterprise Funds All Others 344Internal Service Funds Nonmajor Governmental Funds 20,272
All Others 647
Total interfund balances $ 70,622
The interfund balances resulted from the time lag between the dates: (1) when interfund goods and services were provided or reimbursable expenditures incurred, and when interfund payments were made; and (2) when interfund short-term loans were made and when the loans were repaid.
Advances from/to other funds (in thousands)
Receivable Fund Payable Fund AmountGeneral Fund Nonmajor Governmental Funds $ 3,000Nonmajor Governmental Funds General Fund 11,500
Nonmajor Governmental Funds 4,000Internal Service Funds Nonmajor Governmental Funds 31,529
Total advances from/to other funds $ 50,029
All of these advances consisted of loans made for the purpose of cash flow. None of the advances are scheduled to be repaid in 2020.
Page 137

King County, Washington
Interfund Transfers (in thousands)
Fund types with account balances of less than $500 thousand are aggregated into “All Others.”
Transfers Out Transfers In AmountGeneral Fund Behavioral Health Fund $ 3,061
Nonmajor Governmental Funds 83,782All Others 434
Behavioral Health Fund General Fund 6,935Nonmajor Governmental Funds 5,622All Others 22
Nonmajor Governmental Funds General Fund 11,546Behavioral Health Fund 5,208Nonmajor Governmental Funds 285,711Internal Service Funds 2,096
Public Transportation Enterprise Nonmajor Governmental Funds 3,959Water Quality Enterprise Nonmajor Governmental Funds 960Solid Waste Enterprise Nonmajor Governmental Funds 990
All Others 11Nonmajor Enterprise Funds Nonmajor Governmental Funds 524Internal Service Funds Nonmajor Governmental Funds 20,696
Total interfund transfers $ 431,557
Transfers are used to move resources from a fund collecting them to the fund using them, as required by statute or budget, and to account for ongoing operating subsidies between funds in accordance with budget authorizations.
Page 138

King County, Washington
Note 17Related Party Transactions
Harborview Medical Center (HMC), a discretely presented component unit of King County, makes monthly occupancy fee and rental payments to the County for use of the Patricia Steel Memorial Building and the Ninth & Jefferson Building (NJB). The County became the legal owner of the Patricia Steel Memorial Building in December 2012 when it refinanced the original developer issued bonds. HMC will continue to use the building. Rent is also paid by HMC to the County for use of NJB, owned by a nonprofit corporation that is a discrete component unit of the County. The County is contractually obligated for the debt service on the lease revenue bonds issued by the nonprofit which funded construction of NJB. In both situations, HMC has agreed to include the annual rental payments in its operating budget for as long as it uses the buildings. In 2019, the primary government received $14.0 million in building lease and occupancy revenues from HMC. In addition, HMC made $5.0 million in payments to King County Department of Health for mission-related purposes.
The Cultural Development Authority (CDA), a discretely presented component unit of King County, annually receives funding from various County funds under the One Percent for Art program. Revenues are used to support activities related to the development and maintenance of County public art. In 2019, the King County primary government transferred $6.6 million to the CDA. The CDA spent net $985 thousand on art projects, for which the County recorded a corresponding decrease in receivables from the CDA and an increase in artwork. In addition, King County made a $3.0 million loan for the Building 4Equity program and $276 thousand in payments to the CDA for mission related purposes.
The Public Transportation Enterprise (Transit) entered into a ground lease agreement as lessor with King County Housing Authority (KCHA) for the development of affordable housing units and a parking garage in the City of Redmond. The land under the lease has a cost of $1.3 million. KCHA is a related organization of King County. The lease provides for a minimum set-aside of 150 parking stalls for park-and-ride commuters. The lease calls for an annual lease payment with a 3.0 percent increase each year, commencing with the year ended December 31, 2003. The lease payment is due within 90 days following the end of each calendar year. A portion of the annual lease payment is restricted for use on future Federal Transit Administration projects. The term of the lease is 50 years with one option to extend for 25 years. Transit reported lease revenue of $47 thousand in 2019.
Page 139

King County, Washington
Note 18Components of Fund Balance, Restatements and Restrictions
Net Position
The government-wide and proprietary fund financial statements utilize a net position presentation. Net position is classified into three components:
Net investment in capital assets - Consists of capital assets net of accumulated depreciation and reduced by outstanding balances of bonds, notes and other debt attributed to the acquisition, construction, or improvement of those assets.
Restricted net position - Results when constraints are placed on net position use either by external parties or by law through constitutional provision or enabling legislation.
Unrestricted net position - Consists of net position that does not meet the definition of the two preceding categories.
Components of Fund Balance
King County’s governmental fund balances are classified according to the relative constraints that control how amounts can be spent. Classifications include:
• Nonspendable. Balances that either are not in a spendable form or are legally or contractually required to remain intact.
• Restricted. Balances restricted for specific purposes by the constitution, enabling legislation or external resource providers such as creditors, grantors, or laws or regulations of other governments.
• Committed. Balances that can only be used for specific purposes pursuant to constraints imposed by formal action of the Metropolitan King County Council. A Council ordinance or motion is required to establish, modify or rescind a commitment of fund balance.
• Assigned. Balances that are constrained by management to be used for specific purposes, but are neither restricted nor committed. Assignments are authorized by chief officers of executive departments and administrative offices.
• Unassigned. Residual balances that are not contained in the other classifications. The General Fund is the only fund that reports a positive unassigned fund balance amount. In other governmental funds, it is not appropriate to report a positive unassigned fund balance amount. However, in governmental funds other than the General Fund, if expenditures incurred for specific purposes exceed the amounts that are restricted, committed or assigned to those purposes, it may be necessary to report a negative unassigned fund balance in that fund.
Rainy Day Reserve Ordinance 15961 created the Rainy Day Reserve for the purpose of accumulating revenues to be available for emergencies. The fund is fully invested for its own benefit. The ordinance states that the Rainy Day Reserve shall be used in the event of an emergency, as declared by a vote of the County Council, for the following purposes:
• Maintenance of essential county services in the event that current expense fund revenue collections in a given fiscal year are less than 97 percent of adopted estimates;
• Payment of current expense fund legal settlements or judgments in excess of the County's ability to pay from other sources;
• Catastrophic losses in excess of the County's other insurances against such losses; and
• Other emergencies as determined by the County Council.
The Rainy Day Reserve is reported as part of the General Fund. As of December 31, 2019, it had a committed fund balance of $26.1 million.
Page 140

King County, Washington
A summary of governmental fund balances at December 31, 2019, is as follows (in thousands):
Behavioral NonmajorGeneral Health Governmental
Fund Fund Funds Total
Nonspendable:Arts and Cultural Development $ — $ — $ 14,650 $ 14,650Emergency Medical Services — — 149 149Long-Term Leases — — 1,529 1,529Major Maintenance — — 11,500 11,500Parks Capital Projects — — 6,708 6,708Public Health 6 — 970 976
Total Nonspendable Fund Balance 6 — 35,506 35,512
Restricted for:Animal Services — — 2,291 2,291Arts and Cultural Development — — 143 143Automated Fingerprint Identification System — — 25,393 25,393Behavioral Health — 297 — 297Best Starts For Kids Levy — — 70,479 70,479Building Repair and Replacement — — 11,242 11,242Community Services Operating — — 128 128Conservation Futures — — 22,679 22,679County Roads Operating — — 28,349 28,349County Road Construction — — 43,444 43,444Crime Victim Compensation Program 696 — — 696Department of Community and Human Services — — 515 515Debt Service — — 2,270 2,270Department of Local Services — — 333 333Developmental Disabilities — — 7,476 7,476Dispute Resolution 22 — — 22Drug Enforcement 1,064 — — 1,064Emergency Medical Services — — 42,862 42,862Employment and Education Resources — — 330 330Enhanced 911 Emergency Telephone System — — 33,803 33,803Environmental Health — — 13,316 13,316Farmland and Open Space Acquisitions — — 1,746 1,746Flood Control District — — 94,710 94,710Grants Fund — — 3,353 3,353Historical Preservation — — 334 334Housing and Community Development — — 76,101 76,101Information and Telecommunication Capital — — 45,875 45,875Intercounty River Improvement — — 17 17Law Library — — 508 508Local Hazardous Waste — — 15,203 15,203Mental Illness and Drug Dependency — — 24,132 24,132Noxious Weed Control — — 1,821 1,821Open Space King County Bond Funded Subfund — — 388 388Parks Capital Projects — — 79,418 79,418Parks Operating Levy — — 18,032 18,032Permit and Environmental Review — — 1,210 1,210Public Health — — 29,642 29,642Puget Sound Emergency Radio Network — — 28,405 28,405Real Estate Excise Tax Capital — — 37,915 37,915Real Property Title Assurance 25 — — 25Recorder's Operations and Maintenance — — 2,112 2,112Road Improvement Districts — — 13 13Surface Water Capital — — 18,415 18,415Surface Water Management — — 15,024 15,024Treasurer's Operations and Maintenance — — 460 460Urban Reforestation and Habitat Restoration — — 350 350
Page 141
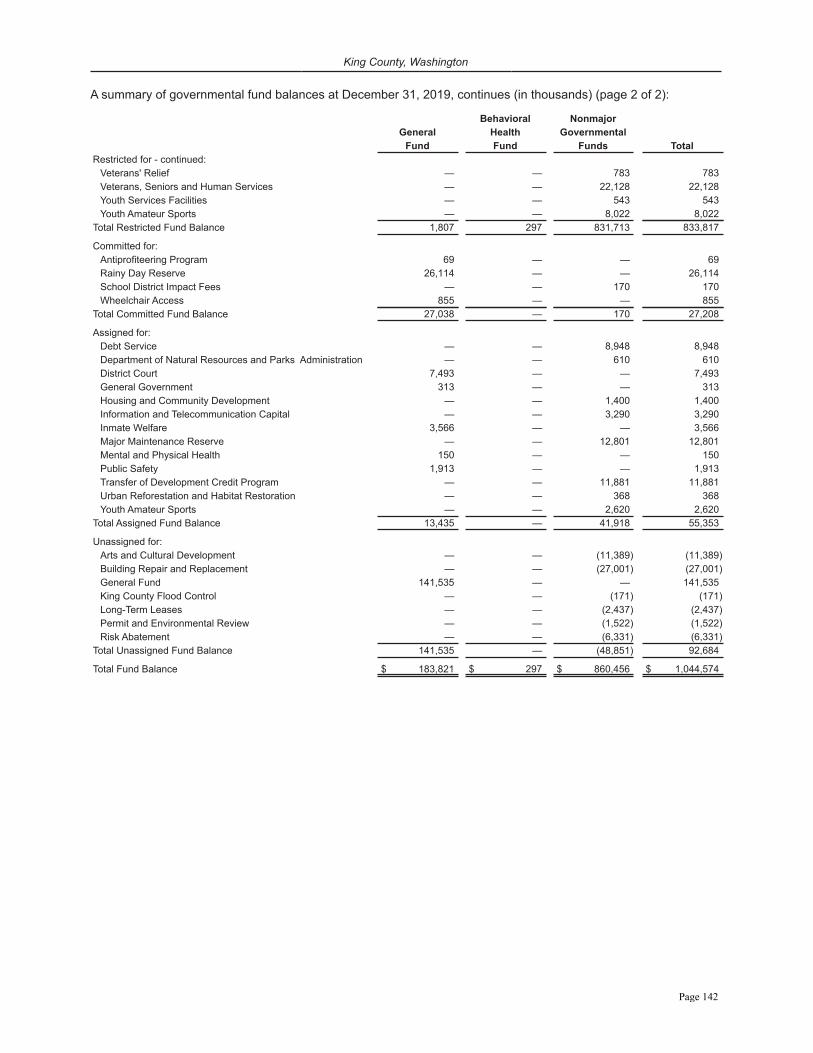
King County, Washington
A summary of governmental fund balances at December 31, 2019, continues (in thousands) (page 2 of 2):
Behavioral NonmajorGeneral Health Governmental
Fund Fund Funds TotalRestricted for - continued:
Veterans' Relief — — 783 783Veterans, Seniors and Human Services — — 22,128 22,128Youth Services Facilities — — 543 543Youth Amateur Sports — — 8,022 8,022
Total Restricted Fund Balance 1,807 297 831,713 833,817
Committed for:Antiprofiteering Program 69 — — 69Rainy Day Reserve 26,114 — — 26,114School District Impact Fees — — 170 170Wheelchair Access 855 — — 855
Total Committed Fund Balance 27,038 — 170 27,208
Assigned for:Debt Service — — 8,948 8,948Department of Natural Resources and Parks Administration — — 610 610District Court 7,493 — — 7,493General Government 313 — — 313Housing and Community Development — — 1,400 1,400Information and Telecommunication Capital — — 3,290 3,290Inmate Welfare 3,566 — — 3,566Major Maintenance Reserve — — 12,801 12,801Mental and Physical Health 150 — — 150Public Safety 1,913 — — 1,913Transfer of Development Credit Program — — 11,881 11,881Urban Reforestation and Habitat Restoration — — 368 368Youth Amateur Sports — — 2,620 2,620
Total Assigned Fund Balance 13,435 — 41,918 55,353
Unassigned for:Arts and Cultural Development — — (11,389) (11,389)Building Repair and Replacement — — (27,001) (27,001)General Fund 141,535 — — 141,535King County Flood Control — — (171) (171)Long-Term Leases — — (2,437) (2,437)Permit and Environmental Review — — (1,522) (1,522)Risk Abatement — — (6,331) (6,331)
Total Unassigned Fund Balance 141,535 — (48,851) 92,684
Total Fund Balance $ 183,821 $ 297 $ 860,456 $ 1,044,574
Page 142

King County, Washington
Restatements of Beginning Balances
Detailed information regarding restatements of beginning balances (in thousands):
GOVERNMENTAL ACTIVITIES
Total Nonmajor Internal
Governmental Governmental Governmental Service
Changes in Net Position or Fund Balance Activities Funds Funds Funds
Net position/fund balance - January 1, 2019 $ 3,223,443 $ 982,776 $ 784,569 $ 201,011
Expensed too much depreciation in prior year 6,828 — — —
Unreversed prior year capitalization accrual (7,403) — — —
Updated Flood Control District balances after publication 6,188 — — —
Reclassified nondepreciable assets to depreciable assets (2,354) — — —
Net position/fund balance - January 1, 2019 (Restated) $ 3,226,702 $ 982,776 $ 784,569 $ 201,011
BUSINESS-TYPE ACTIVITIES
Total Major Funds Nonmajor
Business-type Enterprise Public Solid Water Enterprise
Changes in Net Position Activities Funds Transportation Waste Quality Funds
Net position - January 1, 2019 $ 3,580,095 $ 3,473,022 $ 2,441,546 $ — $ 745,734 $ 285,742
Solid Waste Enterprise reclassified as major fund — — — 97,318 — (97,318)
Net position - January 1, 2019 (Restated) $ 3,580,095 $ 3,473,022 $ 2,441,546 $ 97,318 $ 745,734 $ 188,424
COMPONENT UNITS
Harborview Cultural
Component Medical Development NJB
Changes in Net Position Units Center Authority Properties
Net position - January 1, 2019 $ 703,735 $ 672,672 $ 30,258 $ 805
Implementation of GASB Statement No. 75 (1,240) — (1,240) —
Net position - January 1, 2019 (Restated) $ 702,495 $ 672,672 $ 29,018 $ 805
Governmental Activities
The County expensed too much depreciation in the prior year $6.8 million.
The County did not reverse $7.4 million in 2017 capital asset accruals in the following year.
The Flood Control District, a blended component unit of King County, published changes to 2018 balances after the County released its 2018 financial statements, resulting in a $6.2 million increase in net position.
The County reported depreciable assets as nondepreciable assets, resulting in missed depreciation totaling $2.4 million.
The Building Repair and Replacement fund prior year fund balance increased by $4 thousand due to a transfer of taxes receivable due to a closure of the Regional Justice Center Projects fund.
Business-type Activities
The Solid Waste Enterprise was reclassified from a nonmajor fund to a major fund for 2019 reporting.
Fiduciary Funds
The County adopted GASB Statement No. 84, Fiduciary Activities, resulting in the restatement of prior period net position totaling $314.0 million.
Page 143

King County, Washington
Component Units
In the prior year Cultural Development Authority adopted GASB Statement No. 75, Accounting and Financial Reporting for Postemployment Benefits Other Than Pension (OPEB) and implemented after the County released its 2018 financial statements resulting in a $1.2 million restatement of net position. Restricted Net Position
Component Unit - Harborview Medical Center (HMC)
Restricted expendable net position - $7.5 million of expendable net position is restricted for either capital purposes use or through donor restrictions. Restrictions are imposed by King County on the use of resources for designated capital projects. Other restrictions are placed by donors or external parties, such as creditors, through purpose or time restrictions on the use of the assets.
Restricted nonexpendable net position - The $2.9 million consists of permanent endowments provided by donors with restrictions requiring HMC to maintain the assets in perpetuity.
Component Unit - Cultural Development Authority of King County (CDA)
Restricted expendable net position - $16.0 million is restricted by RCW 67.28.180.3 and King County ordinance to be used for the arts and heritage cultural program awards fund and special account, for which the amount is derived according to a specified formula, and one percent for public arts program.
Page 144

King County, Washington
Note 19Legal Matters, Financial Guarantees and Other Commitments
Pending Litigation and Other Claims
King County and its agencies are parties to routine legal proceedings that normally occur in governmental operations. At any given point, there may be numerous lawsuits that could significantly impact expenditures and future budgets. The County’s threshold for disclosure of loss contingencies is $1.0 million.
The following litigation or potential litigation may involve claims for material damages that may be asserted against King County. However, the County can provide no opinion as to the ultimate outcome, or estimate the amount of damages that may be found, except as described below:
Denny Way CSO Model Toxic Control Act Cleanup - A potential requirement for additional cleanup in the area contaminated when the Denny Way combined sewer outflow was replaced in 2005. The King County Wastewater Treatment Division (WTD) has already performed interim cleanup costing $3.6 million to comply with an agreed order issued by the Washington State Department of Ecology (DOE). WTD had recent discussions with DOE and stakeholders regarding site conditions and next steps toward final cleanup. It is unclear what final remedy DOE may select. Therefore, we are unable to determine an amount, if any, for which WTD may be responsible.
East Waterway Operable Unit of the Harbor Island Superfund Site - The Port of Seattle has completed a significant removal action in the East Waterway. The City of Seattle, Port of Seattle and King County intend to negotiate the amount, if any, that the City and the County will contribute to defray the Port of Seattle's past cleanup costs at the site. This is an extremely complex negotiation and we are unable to determine an amount that WTD may be responsible for, if any.
Former King County Maple Valley Maintenance Shop Site Cleanup - The County owned and/or operated a road maintenance facility on the Maple Valley property from approximately the 1940s to the 1980s. The current property owner has investigated the nature and extent of the environmental contamination and plans to move forward with site remediation. Estimated costs for site investigation and cleanup range from $581 thousand to $1.4 million, and the property owner has indicated he will look to the County to share in the costs based on the County's status as a potentially liable party.
North Creek Interceptor Sewer Improvement Project - A claim submitted by a contractor against WTD over the project to repair and replace two miles of pipeline serving the rapidly developing area in the vicinity of Canyon Park and address untreated overflows into buildings and a wetland. Pursuant to an agreement with DOE, WTD had to install a bypass system because this capital project was not completed by the onset of the 2016 wet season. The contractor submitted a request for change order for approximately $1.5 million asserting that the contract dewatering and open-faced shield tunneling specifications are defective. The contractor also asserted that he was constructively suspended and stopped tunneling. King County found the contractor in default, terminated the contract and made demand upon the performance bond surety. King County Executive declared an emergency and WTD procured a $20.0 million completion contract pursuant to the waiver of statutory procurement requirements. The completion contract and work required to repair damage or defective work by the former contractor increased these costs to approximately $28.0 million. In December 2016, King County initiated suit in King County Superior Court against the contractor to recover the additional costs to complete the project. The contractor has counter claimed for approximately $10.0 million asserting its change order claims and wrongful termination. The trial date is set for March 2021.
Lower Duwamish Waterway - EPA issued an administrative order that required King County, City of Seattle, Boeing and Port of Seattle to conduct studies to determine the nature and extent of contamination in the Lower Duwamish Waterway. The County and the other three parties have agreed with EPA to amend the administrative order to conduct additional studies pursuant to the amendment. The Feasibility Study, which discusses the remediation alternatives, has been issued in final form by EPA. EPA issued a Record of Decision (ROD) in the latter part of 2014. The ROD contains EPA's final plan for cleanup of the Lower Duwamish Waterway. King County and a number of other parties are participating in an alternative dispute resolution process, called an allocation, to determine shares of liability for the costs of the cleanup. If parties that participate in the allocation accept their allotted shares, they expect to enter into a settlement agreement and to negotiate a consent decree with EPA to implement the cleanup. Due to the fact that the parties do not know their respective shares of cleanup costs and no consent decree has been negotiated, we
Page 145

King County, Washington
are unable to determine the schedule or cost of any required remediation. In addition, we are unable to determine the extent to which King County and WTD will be responsible for the cost of such remediation.
Lower Duwamish Waterway - Possible Natural Resource Damages - King County has participated in discussions with National Oceanic and Atmospheric Administration (NOAA) regarding alleged natural resource damages (NRD) in the Lower Duwamish Waterway and around Harbor Island. These discussions have included NOAA's determination that the County may be a potentially liable party that has contributed to the release of hazardous substances that have injured natural resources. NOAA notified the County in February 2016 that the Natural Resources Trustees will proceed with a NRD assessment and invited the County to participate in the development of the assessment. The County notified NOAA in March 2016 that the County desires to conduct settlement discussions regarding the NRD liability that NOAA attributes to the County. The County's intent in past discussions with NOAA has been to minimize the County's alleged liability relative to the other liable parties. The County will maintain that intent as discussions have restarted with NOAA in early 2020.
North Lake Union Site Model Toxics Control Act Cleanup - In the 1970s King County acquired a bulk fueling terminal on the north shore of Lake Union in the vicinity of Gasworks Park and used it as a maintenance base and fuel storagefacility. In the early 1990s the upland portion of the site was identified by the DOE as a potential source of environmental contamination under the Model Toxics Control Act. In 1999 the former owner and King County entered into an interim cost-sharing agreement, and also entered into a Consent Decree with DOE for final cleanup actions and over a period of years, performed shallow soil remediation and groundwater remediation required under the Consent Decree. in 2009 King County sold a portion of the site to a developer after the developer entered into a separate Prospective Purchaser Consent Decree (PPCD) for its portion of the site in 2007. During 2014 through 2015 the developer performed the deep soil excavation required under its PPCD and in 2016 DOE declared the developer's cleanup complete and closed out the PPCD. However, under the 1999 Consent Decree, the former owner and King County remain obligated to monitor groundwater on the site and DOE has reserved the right to require additional or different remedial actions at the site if new or different information comes to light. Therefore, we are presently unable to determine an amount, if any, for which King County and Metro Transit may be responsible.
South Park Landfill Model Toxics Control Act Cleanup - In the 1920s, King County acquired property in the South Park area through tax-lien foreclosure and subsequently leased it to the City of Seattle, which used it and other adjoining property as a landfill, until it was closed in the 1960s. In 2006, the County sold its portion of the closed landfill property to a developer. The terms of the transaction required the developer to insulate the County from most but not all cleanup costs associated with the landfill site. In 2007, the landfill site was identified by the DOE as a potential source of environmental contamination under the Model Toxics Control Act. Over a period of years, the developer and the City of Seattle had entered into multiple Agreed Orders with DOE for interim cleanup actions and subsequently performed those actions. The City, the developer, and King County are presently negotiating with DOE and other parties regarding a final cleanup action plan and Consent Decree that would establish the final cleanup and monitoring obligations related to the site. Negotiations are ongoing and DOE typically reserves the right to require additional or different remedial actions at the site if new or different information comes to light. Therefore, we are presently unable to determine an amount, if any, for which King County and the Facilities Management Division may be responsible.
Financial Guarantees
King County has extended nonexchange financial guarantees in the form of contingent loan agreements with the King County Housing Authority (KCHA), a related organization to the County, and other owners/developers of affordable housing. The County will provide credit support, such as assumption of monthly payments, for certain bonds and lines of credit issued by these agencies in the event of financial distress. Any guarantee payments made become liabilities of the guaranteed contract holders to be paid back after regaining financial stability. The County’s credit enhancement program, managed by the Department of Community and Human Services, allows up to $400.0 million in total commitment. At the end of 2019, there are 17 contingent loan agreements outstanding totaling $312.0 million. These agreements have maturity dates ranging from 10 to 30 years. All projects are currently self-supporting and the County has not made any payments pursuant to these agreements. It is unlikely that the County will make any payments in relation to these guarantees based on available information at the end of December 31, 2019 and the standards prescribed under GASB Statement No. 70 - Accounting and Financial Reporting for Nonexchange Financial Guarantees.
Fuel Farm - The existing fuel farm is located at the North end of the King County International Airport inside the security fence at 1495 S. Hardy Street. The site occupies approximately 1.98 acres and includes 11 underground tanks (eight operational tanks dispensing aviation fuel and three closed tanks). The fuel farm tenant and subtenant are responsible
Page 146

King County, Washington
for the cleanup of the fuel farm site. Under the Model Toxics Control Act (MTCA), the DOE can pursue all cleanup costs from a single owner or operator. In such a scenario, the County (as owner) would need to identify a responsible third party, such as a former tenant or tenants, who are responsible for all the existing contamination. But if the County is responsible for any of the contamination, the Department could order the County to clean the site. The County would then pursue other potentially liable parties for statutory contribution. At December 31, 2019, the tenant and subtenant had begun cleanup studies, and the County believes the scenario wherein it performs the clean-up activities itself to be unlikely.
Other Commitments
The Solid Waste Enterprise paid the County General Fund $3.1 million for rent on the Cedar Hills landfill site in 2019. The Enterprise is committed to paying rent to the General Fund as long as the Cedar Hills site continues to accept waste.
Component Unit - Harborview Medical Center
Harborview Medical Center (HMC) is involved in litigation arising in the course of business. It is HMC management’s opinion that these matters will be resolved without material adverse effect to HMC’s future financial position or results of operations.
The current regulatory environment in the healthcare industry is one of increasing governmental activity with respect to investigations and allegations concerning possible violations of regulations by healthcare providers that could result in the imposition of significant fines and penalties, including significant repayments of patient services previously billed. HMC believes that it complies with the fraud and abuse regulations, as well as other laws and regulations. Compliance with such laws and regulations can be subject to future governmental review and interpretation and regulatory actions unknown or unasserted at this time.
HMC is operated by the University of Washington under a management and operations contract with King County. In this contract, the University of Washington agrees to defend, indemnify, and save and hold harmless King County’s elected and appointed officials, employees, and agents, from and against any damage, cost, claim or liability arising out of the negligent acts or omissions of the University, its employees or agents, or arising out of the activities or operations of the medical center.
Page 147

King County, Washington
Note 20Subsequent Events
Debt Issuances in 2020
In July 2020, the County issued $200.6 million of Junior Lien Sewer Revenue Refunding Bonds. The proceeds from these bonds were used to refund $200 million of Junior Lien Sewer Revenue Bonds, in series 2001 and 2011.
Novel Coronavirus / State of Emergency
On February 29, 2020 the Governor of the state of Washington declared a state of emergency in response to the spread of a deadly new virus, SARS-CoV-2. In the weeks following the declaration, precautionary measures to slow the spread of the virus were ordered statewide including closing schools, colleges and universities, canceling public events, prohibiting public and private gatherings, and requiring people to stay home unless they were leaving for an essential function.
Like the State, the County took immediate and aggressive steps to protect residents including declaring a public health emergency on March 1, 2020 to slow the spread of the virus and its corresponding disease COVID-19. Impacts to the County are anticipated to include both revenues and expenses. The Metropolitan King County Council has appropriated over $202 million for pandemic response-related costs to protect residents including establishing temporary hospitals, purchasing and outfitting isolation and quarantine facilities for residents without a suitable way to self-isolate, and preparing businesses to reopen. They have also redirected $2.2 million of existing appropriation to provide childcare to first responders. Some of these costs will be borne by other governments through various programs including the CARES Act and Federal Emergency Management Agency (FEMA) grants, but the amount of Federal and State participation in these costs is not known. With respect to revenue impacts, the County estimates a year-over-year reduction in taxable sales of 30% or more from 2019 to 2020 as a result of the virus and efforts to control its spread. There may be stimulus funds or revenues from other sources to replace sales and use tax lost, but the amount and extent of such backfill revenues are also not known.
As a result of the uncertainties discussed above, the County cannot identify the full extent of the financial impact at this time. The length of time and specific nature of measures needed to slow the spread of the virus are also unknown at this time.
Page 148

King County, Washington
I. Budget to Actual - Major Fund
GENERAL FUNDSCHEDULE OF REVENUES, EXPENDITURES AND CHANGES IN FUND BALANCE – BUDGET AND ACTUAL
FOR THE YEAR ENDED DECEMBER 31, 2019(IN THOUSANDS)
2019-2020 BUDGETED AMOUNTS (BIENNIAL)
ORIGINAL FINAL ACTUAL VARIANCEREVENUES
Taxes:Property taxes $ 740,306 $ 742,944 $ 367,064 $ (375,880)Retail sales and use taxes 297,516 309,742 153,118 (156,624)Business and other taxes 8,900 28,900 4,128 (24,772)
Licenses and permits 15,055 15,055 7,582 (7,473)Intergovernmental revenues 45,393 70,528 27,495 (43,033)Charges for services 579,740 576,862 288,970 (287,892)Fines and forfeits 49,625 48,869 26,774 (22,095)Interest earnings 24,481 26,581 18,844 (7,737)Miscellaneous revenues 41,844 42,286 20,644 (21,642)Sale of capital assets — — 944 944Transfers in 25,994 47,892 32,481 (15,411)
TOTAL REVENUES 1,828,854 1,909,659 948,044 (961,615)
EXPENDITURESCurrent:
General government 329,375 335,783 156,734 179,049Law, safety and justice 1,263,285 1,293,102 623,955 669,147Economic environment 1,085 1,085 73 1,012Health and human services 93,475 95,301 49,223 46,078
Debt service:Principal 68 68 — 68Interest and other debt service costs 207 225 158 67
Capital outlay 3,777 5,092 2,081 3,011Transfers out 165,339 232,767 92,777 139,990
TOTAL EXPENDITURES 1,856,611 1,963,423 925,001 1,038,422Excess (deficiency) of revenues over (under) expenditures (budgetary basis) $ (27,757) $ (53,764) 23,043 $ 76,807
Adjustment from budgetary basis to GAAP basis(a) (3,303)Net change in fund balance 19,740
Fund balance - Beginning balance 164,081Fund balance - Ending balance $ 183,821
(a)Elements of adjustment from budgetary basis to GAAP basis:Adjustments to revenues:
Recognition of unrealized loss on investments $ 4,895Adjustments to expenditures 2,990Non-budgeted revenues (11,188)
Adjustment from budgetary basis to GAAP basis $ (3,303)
Page 149

King County, Washington
BEHAVIORAL HEALTH FUNDSCHEDULE OF REVENUES, EXPENDITURES AND CHANGES IN FUND BALANCE – BUDGET AND ACTUAL
FOR THE YEAR ENDED DECEMBER 31, 2019(IN THOUSANDS)
2019-2020 BUDGETED AMOUNTS (BIENNIAL)
ORIGINAL FINAL ACTUAL VARIANCE
REVENUESTaxes:
Property taxes $ 6,988 $ 6,988 $ 3,466 $ (3,522)Business and other taxes — — 17 17
Intergovernmental revenues 28,200 28,200 13,303 (14,897)Charges for services 601,950 601,950 229,636 (372,314)Interest earnings 469 469 559 90Miscellaneous revenues 3,369 3,369 2,430 (939)Transfers in 15,658 15,658 8,291 (7,367)
TOTAL REVENUES 656,634 656,634 257,702 (398,932)
EXPENDITURESCurrent:
Health and human services 683,898 687,528 279,170 408,358Transfers out — — 12,579 (12,579)
TOTAL EXPENDITURES 683,898 687,528 291,749 395,779
Excess (deficiency) of revenues over (under)expenditures (budgetary basis) $ (27,264) $ (30,894) (34,047) $ (3,153)
Adjustment from budgetary basis to GAAP basis(a) 218Net change in fund balance (33,829)
Fund balance - Beginning balance 34,126Fund balance - Ending balance $ 297
(a) Elements of adjustment from budgetary basis to GAAP basis:Adjustments to revenues:
Recognition of unrealized gains on investments $ 219Adjustments to expenditures:
Non-budgeted revenue (1)Adjustment from budgetary basis to GAAP basis $ 218
Page 150

King County, Washington
II. Pension Funding
Schedule of the County's Proportionate Share of the Net Pension Liability Public Employees' Retirement System (PERS) Plan 1
Measurement Date of June 30*(dollars in thousands)
2019 2018 2017 2016 2015
County's proportion of the net pension liability 8.25% 8.56% 8.45% 8.90% 8.76%
County's proportionate share of the net pension liability $ 317,333 $ 382,129 $ 400,803 $ 477,872 $ 458,477
County's covered payroll** $1,196,465 $1,124,434 $1,046,436 $1,007,624 $1,002,651 ***
County's proportionate share of the net pension liability as a percentage of covered payroll 26.52% 33.98% 38.30% 47.43% 45.73%
Plan fiduciary net position as a percentage of the total pension liability 67.12% 63.22% 61.24% 57.03% 59.10%
Schedule of the County's Proportionate Share of the Net Pension Liability Public Employees' Retirement System (PERS) Plan 2/3
Measurement Date of June 30*(dollars in thousands)
2019 2018 2017 2016 2015
County's proportion of the net pension liability 10.06% 10.29% 10.14% 10.52% 10.36%
County's proportionate share of the net pension liability $ 97,735 $ 175,728 $ 352,361 $ 529,855 $ 370,294
County's covered payroll** $1,144,724 $1,072,968 $ 995,800 $ 953,254 $ 949,860 ***
County's proportionate share of the net pension liability as a percentage of covered payroll 8.54% 16.38% 35.38% 55.58% 38.98%
Plan fiduciary net position as a percentage of the total pension liability 97.77% 95.77% 90.97% 85.82% 89.20%
*These schedules will be built prospectively until they contain ten years of data.**Covered payroll is the payroll on which contributions to a pension plan are based.***Restated
Page 151

King County, Washington
Schedule of the County's Proportionate Share of the Net Pension Liability Public Safety Employees' Retirement System (PSERS) Plan 2
Measurement Date of June 30*(dollars in thousands)
2019 2018 2017 2016 2015
County's proportion of the net pension liability 8.67 % 9.69% 9.92% 11.33% 9.88%
County's proportionate share of the net pension liability $ (1,127) $ 120 $ 1,944 $ 4,817 $ 1,803
County's covered payroll** $ 41,656 $ 38,120 $ 35,210 $ 35,577 $ 29,911 ***
County's proportionate share of the net pension liability as a percentage of covered payroll (2.71)% 0.31% 5.52% 13.54% 6.03%
Plan fiduciary net position as a percentage of the total pension liability 101.85 % 99.79% 96.26% 90.41% 95.08%
Schedule of the County's Proportionate Share of the Net Pension Liability Law Enforcement Officers' and Fire Fighters' Retirement System (LEOFF) Plan 1
Measurement Date of June 30*(dollars in thousands)
2019 2018 2017 2016 2015
County's proportion of the net pension (asset) 0.60% 0.60% 0.60% 0.60% 0.60%
County's proportionate share of the net pension (asset) $ (11,826) $ (10,894) $ (9,046) $ (6,180) $ (7,275)
County's covered payroll** $ 117 $ 161 $ 194 $ 213 $ 290 ***
County's proportionate share of the net pension (asset) as a percentage of covered payroll -10,107.69% -6,766.18% -4,662.96% -2,901.36% -2,508.65%
Plan fiduciary net position as a percentage of the total pension liability 148.78% 144.42% 135.96% 123.74% 127.36%
*These schedules will be built prospectively until they contain ten years of data.**Covered payroll is the payroll on which contributions to a pension plan are based.***Restated
Page 152

King County, Washington
Schedule of the County's Proportionate Share of the Net Pension Liability Law Enforcement Officers' and Fire Fighters' Retirement System (LEOFF) Plan 2
Measurement Date of June 30*(dollars in thousands)
2019 2018 2017 2016 2015
County's proportion of the net pension (asset) 2.63% 2.88% 2.91% 3.02% 2.90%
County's proportionate share of the net pension (asset) $ (60,885) $ (58,520) $ (40,429) $ (17,543) $ (29,819)State's proportionate share of the net pension (asset) associated with King County (39,872) (37,891) (26,225) (11,437) (19,716)
Total $ (100,757) $ (96,411) $ (66,654) $ (28,980) $ (49,535)
County's covered payroll** $ 97,381 $ 95,210 $ 91,137 $ 87,895 $ 84,358 ***
County's proportionate share of the net pension (asset) as a percentage of covered payroll -62.52% -61.46% -44.36% -19.96% -35.35%
Plan fiduciary net position as a percentage of the total pension liability 119.43% 118.50% 113.36% 106.04% 111.67%
Schedule of the County's Proportionate Share of the Net Pension Liability Seattle City Employees' Retirement System (SCERS)
Measurement Date of December 31*(dollars in thousands)
2019 2018 2017 2016 2015
County's proportion of the net pension liability 0.05% 0.05% 0.07% 0.09% 0.11%
County's proportionate share of the net pension liability $ 760 $ 554 $ 914 $ 1,169 $ 1,219
County's covered payroll** $ 1,807 $ 2,022 $ 2,429 $ 3,010 $ 3,305
County's proportionate share of the net pension liability as a percentage of covered payroll 42.04% 27.38% 37.61% 38.84% 36.88%
Plan fiduciary net position as a percentage of the total pension liability 64.14% 72.04% 65.60% 64.03% 67.70%
*These schedules will be built prospectively until they contain ten years of data.**Covered payroll is the payroll on which contributions to a pension plan are based.***Restated
Page 153

King County, Washington
Schedule of Contributions
Public Employees' Retirement System (PERS) Plan 1
Fiscal Year Ended December 31*(dollars in thousands)
2019 2018 2017 2016 2015Contractually required contribution $ 62,259 $ 59,366 $ 54,111 $ 50,154 $ 25,295Contributions in relation to the contractually required contribution 62,259 59,366 54,111 50,154 25,295Contribution deficiency (excess) $ — $ — $ — $ — $ —
Covered payroll** $1,245,598 $1,154,804 $1,082,715 $1,028,598 $ 507,206Contributions as a percentage of covered payroll 5.00% 5.14% 5.00% 4.88% 4.99%
Schedule of Contributions
Public Employees' Retirement System (PERS) Plan 2/3
Fiscal Year Ended December 31*(dollars in thousands)
2019 2018 2017 2016 2015Contractually required contribution $ 93,935 $ 84,792 $ 72,763 $ 62,650 $ 72,853Contributions in relation to the contractually required contribution 93,935 84,792 72,763 62,650 72,853Contribution deficiency (excess) $ — $ — $ — $ — $ —
Covered payroll** $1,188,641 $1,103,984 $1,031,418 $ 977,342 $ 933,304Contributions as a percentage of covered payroll 7.90% 7.68% 7.05% 6.41% 7.81%
Schedule of Contributions
Public Safety Employees' Retirement System (PSERS) Plan 2
Fiscal Year Ended December 31*(dollars in thousands)
2019 2018 2017 2016 2015
Contractually required contribution $ 3,518 $ 2,777 $ 2,514 $ 2,319 $ 2,781Contributions in relation to the contractually required contribution 3,518 2,777 2,514 2,319 2,781
Contribution deficiency (excess) $ — $ — $ — $ — $ —
Covered payroll** $ 48,039 $ 39,458 $ 36,728 $ 34,253 $ 33,102
Contributions as a percentage of covered payroll 7.32% 7.04% 6.84% 6.77% 8.40%
Page 154

King County, Washington
Schedule of Contributions
Law Enforcement Officers' and Fire Fighters' Retirement System (LEOFF) Plan 2
Fiscal Year Ended December 31*(dollars in thousands)
2019 2018 2017 2016 2015Contractually required contribution $ 5,329 $ 5,219 $ 4,956 $ 4,735 $ 4,505Contributions in relation to the contractually required contribution 5,329 5,219 4,956 4,735 4,505Contribution deficiency (excess) $ — $ — $ — $ — —
Covered payroll** $ 99,067 $ 96,106 $ 92,952 $ 90,526 $ 86,131Contributions as a percentage of covered payroll 5.38% 5.43% 5.33% 5.23% 5.23%
Schedule of Contributions Seattle City Employees' Retirement System (SCERS)
Fiscal Year Ended December 31*(dollars in thousands)
2019 2018 2017 2016 2015Contractually required contribution $ 275 $ 309 $ 371 $ 458 $ 520Contributions in relation to the contractually required contribution 275 309 371 458 520Contribution deficiency (excess) $ — $ — $ — $ — $ —
Covered payroll** $ 1,807 $ 2,022 $ 2,429 $ 3,010 $ 3,305Contributions as a percentage of covered payroll 15.23% 15.29% 15.27% 15.22% 15.73%
Notes:
*These schedules will be built prospectively until they contain ten years of data.**Covered payroll is the payroll on which contributions to a pension plan are based. Contributions are actual employer contributions to the plan. For PERS 1 this includes the portion of PERS 2/3 and PSERS 2 contributions that fund the PERS 1 UAAL. Contributions do not include employer-paid member contributions.
Law Enforcement Officers' and Fire Fighters' Retirement System (LEOFF) Plan 1 currently has one active member. Starting on July 1, 2000, employers and employees contribute zero percent as long as the Plan remains fully funded. The Plan had no required contributions for the fiscal years 2015, 2016, 2017, 2018, and 2019; thus, no schedule is required.
Adopted contribution rates could be different pending the actions of the governing bodies. For instance, for the period beginning July 1, 2017 and ending June 30, 2019, the contribution rates the Pension Funding Council adopted, which the Legislature did not change, reflect a phasing-in of the increase to contribution rates that resulted from a change to the mortality assumption. This is the third of three biennial over which this increase is expected to be phased in for PERS 1, PERS 2/3 and other pension plans.
Page 155

King County, Washington
III. Defined Benefit Other Postemployment Benefit (OPEB) Plan
King CountySchedule of Changes in Total OPEB Liability and Related Ratios
King County Retiree Health Plan
For the year ended December 31, 2019
Last 10 Fiscal Years*
(in thousands)
2018 2019
Total OPEB liability - beginning $ 118,120 $ 111,412
Service cost 2,092 2,155
Interest 4,146 4,138
Changes in benefit terms — —
Differences between expected and actual experience 3,332 —
Changes of assumptions (9,651) —
Benefit payments (5,244) (4,954)
Other changes (1,383) (1,479)
Total OPEB liability - ending $ 111,412 $ 111,272
Covered-employee payroll $ 1,217,867 $ 1,219,237
Total OPEB liability as a % of covered payroll 9.15% 9.13%
*Until a full 10-year trend is compiled, only information for those years available is presented.
No assets are accumulated in a trust that meets the criteria in paragraph 4 of GASB 75.
Page 156

King County, Washington
IV. Condition Assessments and Preservation of Infrastructure Eligible for Modified Approach
Roads
The County performs condition assessments on its network of roads through the King County Pavement Management System. This system generates a Pavement Condition Index (PCI) for each segment of arterial and local access road in the network. The PCI is a numerical index from zero to one hundred (0-100) that represents the pavement’s functional condition based on the quantity, severity, and type of visual distress, such as pavement cracking. Condition assessments are undertaken every three years for local streets and every two years for arterials.
The condition assessments of the County’s roads are shown below for the last three completed cycles.
2019-2017 2016-2014 2013-2011Condition ratings (miles) % (miles) % (miles) %
Arterial roadsExcellent to good 293.7 64.4 294.3 65.0 297.7 64.9Fair 44.1 9.7 61.4 13.5 32.0 7.0Poor to substandard 118.3 25.9 97.5 21.5 129.0 28.1
Total 456.1 100.0 453.2 100.0 458.7 100.0
Local access roadsExcellent to good 618.8 60.3 689.2 67.7 742.0 70.7Fair 148.8 14.5 134.7 13.2 91.4 8.7Poor to substandard 257.9 25.2 194.2 19.1 216.5 20.6
Total 1,025.5 100.0 1,018.1 100.0 1,049.9 100.0
The following table (derived from the table of condition ratings) shows the number and percentage of miles of roads that meet the 40 PCI level.
PCI score interval 2019-2017 2016-2014 2013-2011(miles) % (miles) % (miles) %
Arterial roads PCI 40 - 100 312.8 68.6 323.3 71.3 315.7 68.8 PCI 0 - 39 143.3 31.4 129.9 28.7 143.0 31.2 Total 456.1 100.0 453.2 100.0 458.7 100.0
Local access roads PCI 40 - 100 697.6 68.0 759.4 74.6 786.5 74.9 PCI 0 - 39 327.9 32.0 258.7 25.4 263.4 25.1 Total 1,025.5 100.0 1,018.1 100.0 1,049.9 100.0
In the most recent condition assessments, 68.6 percent of the arterial roads in the County and 68.0 percent of the local access roads in the County had a PCI rating of 40 and above.
The roads condition assessments have increased slightly over the last maintenance cycle. The accelerated condition deterioration observed in the 2016-2014 cycle and continuing in the 2019-2017 cycle, was primarily the result of weather and system age. Many of the arterial roadways are beyond their cost-effective life cycles, resulting in roadway deterioration. Because of the uncertainty in future funding for roads, the County formally lowered its established condition level to 50 percent of the roads at a PCI of 40 or better. The 2019 budgeted amounts on the next page already account for the change in the established condition level. Below is information on planned (budgeted) and actual expenditures incurred to maintain and preserve the road network from 2015 to 2019. The budgeted amount is equivalent to the anticipated amount needed to maintain roads at the 50/40 required condition level for the modified approach (in thousands).
2019 2018 2017 2016 2015
Budgeted $ 75,333 $ 80,615 $ 72,969 $ 70,969 $ 56,599
Expended 57,632 57,406 59,864 43,820 37,003
Page 157

King County, Washington
The amount budgeted in 2019 for road preservation and maintenance was $75.3 million. The amount actually expended was $57.6 million. The 2019 underspending was due to scheduling of contracted work and work to be performed in 2020. Adjusting for these items, the remaining gap is consistent with historical experience.
Bridges
King County currently maintains 182 bridges including co-owned and pedestrian bridges. Physical inspections to determine the condition of bridges and the degree of wear and deterioration are carried out at least every two years. Inspections reveal deficiencies in bridges such as steel corrosion, damaged guardrails, rotted timbers, deteriorated bridge decks, bank erosion and cracked concrete. These are documented in an inspection report along with recommended repairs. Four bridges that do not carry vehicular traffic are included in the list of bridges being maintained by the County. These are also subject to condition assessments, but are subject to different standards than the more heavily used 178 vehicular bridges.
Each year the County conducts a bridge prioritization process to determine potential candidates for replacement or rehabilitation. A weighted 10-point priority scale (sufficiency rating, seismic rating, geometrics, hydraulics, load limits, traffic safety, serviceability, importance, useful life, and structural concern) ranks the bridges in order; the results are considered in the planning and programming of major bridge studies and construction projects in the Roads Capital Improvement Program.
A key element in the priority score is the sufficiency rating, the measure considered by state and federal governments as the basis for establishing eligibility and priority for bridge replacement or rehabilitation funding. The sufficiency rating is a numerical rating of a bridge based on its structural adequacy and safety, essentially for public use, and its serviceability and functional obsolescence. The three most recent bridge sufficiency ratings are as follows:
Bridge Number of BridgesSufficiency Rating 2019 2018 2017
0 - 20 9 9 821 - 30 4 5 431 - 49 20 17 2250 - 100 145 147 144Totals 178 178 178
Amounts budgeted and spent to maintain and preserve bridges over the past five years are below (in thousands):
2019 2018 2017 2016 2015
Budgeted $ 12,203 $ 10,109 $ 6,605 $ 4,343 $ 5,607
Expended 6,082 7,906 6,221 3,448 3,184
The budgeted amount is equivalent to the anticipated amount needed to maintain and preserve the bridges up to the required condition level.
Notes:
* Pavement Condition Index (PCI) condition measurement and road condition rating scale:1. PCI < 30 is defined to be in “poor to substandard” with heavy pavement cracking and potholes2. PCI 30 50 is defined to be in “fair condition” with noticeable cracks and utility cuts3. PCI 50 100 is defined to be in “excellent condition” with relatively smooth roadway
* King County’s Road Services Division policy is to maintain at least 50 percent of the road system at a PCI level of 40 or better.
* Bridges adhere to the Federal Highway Administration condition measurement.* Bridges sufficiency rating scale:
1. 49 0 indicates replacement or rehabilitation funding, < 30 are selected for rehabilitation funding2. 50 100 indicates a good deal of service life remaining, a bridge capable of carrying traffic
* King County’s Road Services Division policy is to maintain bridges in such manner that no more than 12 will have a sufficiency rating of 20 or less. A rating of 20 or less is usually indicative of a bridge with structural deficiency. The most common remedy is full replacement, rehabilitation or closure of the bridge.
Page 158

Fede
ral G
rant
or A
genc
yPa
ss-th
roug
h Ag
ency
Nam
eFe
dera
l Pro
gram
Nam
eCF
DA
Num
ber
Fede
ral A
war
d Id
entif
icat
ion
Num
ber
Ag
ency
Exp
endi
ture
s
Subr
ecip
ient
Ex
pend
iture
s
Tota
l Exp
endi
ture
sN
otes
Depa
rtm
ent o
f Agr
icultu
re
Was
hing
ton
Offi
ce o
f Sup
erin
tend
ent o
f Pu
blic
Inst
ruct
ion
Scho
ol B
reak
fast
Pro
gram
10.5
53
197W
AWA3
N109
9$
27,8
10.0
2$
0.00
$27
,810
.02
Was
hing
ton
Offi
ce o
f Sup
erin
tend
ent o
f Pu
blic
Inst
ruct
ion
Scho
ol B
reak
fast
Pro
gram
10.5
53
207W
AWA3
N109
9$
9,08
8.48
$0.
00$
9,08
8.48
Indi
rect
To
tal
$36
,898
.50
$0.
00$
36,8
98.5
0
10.5
53 T
otal
$36
,898
.50
$0.
00$
36,8
98.5
0
Was
hing
ton
Offi
ce o
f Sup
erin
tend
ent o
f Pu
blic
Inst
ruct
ion
Natio
nal S
choo
l Lun
ch P
rogr
am10
.555
19
7WAW
A3N1
099
$52
,385
.15
$0.
00$
52,3
85.1
5
Was
hing
ton
Offi
ce o
f Sup
erin
tend
ent o
f Pu
blic
Inst
ruct
ion
Natio
nal S
choo
l Lun
ch P
rogr
am10
.555
20
7WAW
A3N1
099
$17
,631
.76
$0.
00$
17,6
31.7
6
Indi
rect
To
tal
$70
,016
.91
$0.
00$
70,0
16.9
1
10.5
55 T
otal
$70
,016
.91
$0.
00$
70,0
16.9
1
Tota
l Chi
ld N
utrit
ion
Clus
ter
$10
6,91
5.41
$0.
00$
106,
915.
41
Was
hing
ton
Stat
e De
part
men
t of
Heal
thW
IC S
pecia
l Sup
plem
enta
l Nut
ritio
n Pr
ogra
m fo
r W
omen
, Inf
ants
, and
Chi
ldre
n10
.557
18
7WAW
A7W
1003
$5,
158,
607.
43$
684,
139.
27$
5,84
2,74
6.70
Was
hing
ton
Stat
e De
part
men
t of
Heal
thW
IC S
pecia
l Sup
plem
enta
l Nut
ritio
n Pr
ogra
m fo
r W
omen
, Inf
ants
, and
Chi
ldre
n10
.557
7W
AWA1
W50
03$
269,
113.
36$
0.00
$26
9,11
3.36
Indi
rect
To
tal
$5,
427,
720.
79$
684,
139.
27$
6,11
1,86
0.06
10.5
57 T
otal
$5,
427,
720.
79$
684,
139.
27$
6,11
1,86
0.06
KING
CO
UNTY
, WAS
HING
TON
SCHE
DULE
OF
EXPE
NDIT
URES
OF
FEDE
RAL A
WAR
DS
JANU
ARY
1, 2
019
THRO
UGH
DECE
MBE
R 31
, 201
9
Child
Nut
ritio
n Cl
uste
r
The
note
s are
an
inte
gral
par
t of t
his
Sche
dule
Page 159

Fede
ral G
rant
or A
genc
yPa
ss-th
roug
h Ag
ency
Nam
eFe
dera
l Pro
gram
Nam
eCF
DA
Num
ber
Fede
ral A
war
d Id
entif
icat
ion
Num
ber
Ag
ency
Exp
endi
ture
s
Subr
ecip
ient
Ex
pend
iture
s
Tota
l Exp
endi
ture
sN
otes
KING
CO
UNTY
, WAS
HING
TON
SCHE
DULE
OF
EXPE
NDIT
URES
OF
FEDE
RAL A
WAR
DS
JANU
ARY
1, 2
019
THRO
UGH
DECE
MBE
R 31
, 201
9
SNAP
Clu
ster
Was
hing
ton
Stat
e De
part
men
t of
Heal
thSt
ate
Adm
inist
rativ
e M
atch
ing
Gran
ts fo
r the
Su
pple
men
tal N
utrit
ion
Assis
tanc
e Pr
ogra
m10
.561
20
7WW
AWA5
Q39
03$
81,7
27.6
3$
0.00
$81
,727
.63
Was
hing
ton
Stat
e De
part
men
t of
Heal
thSt
ate
Adm
inist
rativ
e M
atch
ing
Gran
ts fo
r the
Su
pple
men
tal N
utrit
ion
Assis
tanc
e Pr
ogra
m10
.561
19
7WAW
A5Q
3903
$28
3,55
3.81
$12
2,03
4.58
$40
5,58
8.39
Was
hing
ton
Stat
e De
part
men
t of S
ocia
l an
d He
alth
Ser
vice
sSt
ate
Adm
inist
rativ
e M
atch
ing
Gran
ts fo
r the
Su
pple
men
tal N
utrit
ion
Assis
tanc
e Pr
ogra
m10
.561
19
7WAW
A4S2
520
$28
3,46
2.35
$21
3,38
0.09
$49
6,84
2.44
Was
hing
ton
Stat
e De
part
men
t of S
ocia
l an
d He
alth
Ser
vice
sSt
ate
Adm
inist
rativ
e M
atch
ing
Gran
ts fo
r the
Su
pple
men
tal N
utrit
ion
Assis
tanc
e Pr
ogra
m10
.561
20
7WAW
A4S2
520
$10
6,10
6.71
$18
,251
.09
$12
4,35
7.80
With
in R
each
Stat
e Ad
min
istra
tive
Mat
chin
g Gr
ants
for t
he
Supp
lem
enta
l Nut
ritio
n As
sista
nce
Prog
ram
10.5
61 1
97W
AWA4
S251
4/20
7W
AWA4
S251
4$
216,
053.
50$
0.00
$21
6,05
3.50
Indi
rect
To
tal
$97
0,90
4.00
$35
3,66
5.76
$1,
324,
569.
76
Tota
l SNA
P Cl
uste
r10
.561
Tot
al$
970,
904.
00$
353,
665.
76$
1,32
4,56
9.76
Was
hing
ton
Stat
e De
part
men
t of
Heal
thW
IC F
arm
ers'
Mar
ket N
utrit
ion
Prog
ram
(FM
NP)
10.5
72
187W
AWA7
Y860
4$
9,68
1.00
$0.
00$
9,68
1.00
Indi
rect
To
tal
$9,
681.
00$
0.00
$9,
681.
00
10.5
72 T
otal
$9,
681.
00$
0.00
$9,
681.
00
Was
hing
ton
Stat
e De
part
men
t of
Heal
thW
IC G
rant
s To
Stat
es (W
GS)
10.5
78
1615
7WAW
A6W
522
$9,
818.
91$
0.00
$9,
818.
91
Indi
rect
To
tal
$9,
818.
91$
0.00
$9,
818.
91
10.5
78 T
otal
$9,
818.
91$
0.00
$9,
818.
91
The
note
s are
an
inte
gral
par
t of t
his
Sche
dule
Page 160

Fede
ral G
rant
or A
genc
yPa
ss-th
roug
h Ag
ency
Nam
eFe
dera
l Pro
gram
Nam
eCF
DA
Num
ber
Fede
ral A
war
d Id
entif
icat
ion
Num
ber
Ag
ency
Exp
endi
ture
s
Subr
ecip
ient
Ex
pend
iture
s
Tota
l Exp
endi
ture
sN
otes
KING
CO
UNTY
, WAS
HING
TON
SCHE
DULE
OF
EXPE
NDIT
URES
OF
FEDE
RAL A
WAR
DS
JANU
ARY
1, 2
019
THRO
UGH
DECE
MBE
R 31
, 201
9
Fore
st S
ervi
ce S
choo
ls an
d Ro
ads C
lust
erW
ashi
ngto
n O
ffice
of S
tate
Tre
asur
erSc
hool
s and
Roa
ds -
Gran
ts to
Sta
tes
10.6
65
14DP
1113
0000
053
$28
,000
.00
$0.
00$
28,0
00.0
0
Was
hing
ton
Stat
e De
part
men
t of
Natu
ral R
esou
rces
Scho
ols a
nd R
oads
- Gr
ants
to S
tate
s10
.665
14
DP11
1300
0005
3-1
$80
,019
.42
$0.
00$
80,0
19.4
2
Indi
rect
To
tal
$10
8,01
9.42
$0.
00$
108,
019.
42
Tot
al F
ores
t Ser
vice
Sch
ools
and
Road
s Clu
ster
10.6
65 T
otal
$10
8,01
9.42
$0.
00$
108,
019.
42
Depa
rtm
ent o
f Agr
icul
ture
$6,
633,
059.
53$
1,03
7,80
5.03
$7,
670,
864.
56
Depa
rtm
ent o
f Hou
sing
and
Urba
n De
velo
pmen
tCD
BG -
Entit
lem
ent G
rant
s Clu
ster
Com
mun
ity D
evel
opm
ent B
lock
Gra
nts/
Entit
lem
ent
Gran
ts14
.218
B-
16-U
C-53
-000
1$
12,9
92.6
0$
289,
286.
72$
302,
279.
32(3
), (9
)
Com
mun
ity D
evel
opm
ent B
lock
Gra
nts/
Entit
lem
ent
Gran
ts14
.218
B-
19-U
C-53
-000
1$
1,64
7,68
5.39
$67
6,54
4.99
$2,
324,
230.
38(3
), (9
)
Com
mun
ity D
evel
opm
ent B
lock
Gra
nts/
Entit
lem
ent
Gran
ts14
.218
B-
17-U
C-53
-000
1$
199,
146.
67$
866,
610.
53$
1,06
5,75
7.20
(3),
(9)
Com
mun
ity D
evel
opm
ent B
lock
Gra
nts/
Entit
lem
ent
Gran
ts14
.218
B-
14-U
C-53
-000
1$
0.00
$88
9.00
$88
9.00
(3),
(9)
Com
mun
ity D
evel
opm
ent B
lock
Gra
nts/
Entit
lem
ent
Gran
ts14
.218
B-
15-U
C-53
-000
1$
3,43
5.00
$12
,931
.72
$16
,366
.72
(3),
(9)
Com
mun
ity D
evel
opm
ent B
lock
Gra
nts/
Entit
lem
ent
Gran
ts14
.218
B-
18-U
C-53
-000
1$
745,
888.
78$
1,02
8,66
4.17
$1,
774,
552.
95(3
), (9
)
Dire
ct T
otal
$
2,60
9,14
8.44
$2,
874,
927.
13$
5,48
4,07
5.57
Tota
l CDB
G - E
ntitl
emen
t Gra
nts C
lust
er14
.218
Tot
al$
2,60
9,14
8.44
$2,
874,
927.
13$
5,48
4,07
5.57
The
note
s are
an
inte
gral
par
t of t
his
Sche
dule
Page 161

Fede
ral G
rant
or A
genc
yPa
ss-th
roug
h Ag
ency
Nam
eFe
dera
l Pro
gram
Nam
eCF
DA
Num
ber
Fede
ral A
war
d Id
entif
icat
ion
Num
ber
Ag
ency
Exp
endi
ture
s
Subr
ecip
ient
Ex
pend
iture
s
Tota
l Exp
endi
ture
sN
otes
KING
CO
UNTY
, WAS
HING
TON
SCHE
DULE
OF
EXPE
NDIT
URES
OF
FEDE
RAL A
WAR
DS
JANU
ARY
1, 2
019
THRO
UGH
DECE
MBE
R 31
, 201
9
Emer
genc
y So
lutio
ns G
rant
Pro
gram
14.2
31
E19U
C5-3
0001
$0.
00$
96,5
82.7
5$
96,5
82.7
5
Emer
genc
y So
lutio
ns G
rant
Pro
gram
14.2
31
E17U
C5-3
0001
$0.
00$
15,3
41.0
0$
15,3
41.0
0
Emer
genc
y So
lutio
ns G
rant
Pro
gram
14.2
31
E18U
C5-3
0001
$19
,895
.59
$12
3,71
9.00
$14
3,61
4.59
Dire
ct T
otal
$
19,8
95.5
9$
235,
642.
75$
255,
538.
34
Was
hing
ton
Stat
e De
part
men
t of
Com
mer
ceEm
erge
ncy
Solu
tions
Gra
nt P
rogr
am14
.231
17
-461
07-0
06$
97,7
94.8
1$
539,
480.
69$
637,
275.
50
Was
hing
ton
Stat
e De
part
men
t of
Com
mer
ceEm
erge
ncy
Solu
tions
Gra
nt P
rogr
am14
.231
19
-461
07-0
06$
27,3
22.8
3$
148,
901.
13$
176,
223.
96
Indi
rect
To
tal
$12
5,11
7.64
$68
8,38
1.82
$81
3,49
9.46
14.2
31 T
otal
$14
5,01
3.23
$92
4,02
4.57
$1,
069,
037.
80
Hom
e In
vest
men
t Par
tner
ship
s Pro
gram
14.2
39
M18
DC5-
3020
0$
2,23
2,57
6.12
$0.
00$
2,23
2,57
6.12
(3),
(9)
Hom
e In
vest
men
t Par
tner
ship
s Pro
gram
14.2
39
M19
DC5-
3020
0$
104,
273.
14$
0.00
$10
4,27
3.14
(3)
Hom
e In
vest
men
t Par
tner
ship
s Pro
gram
14.2
39
M14
DC5-
3020
0$
47.1
5$
0.00
$47
.15
(3)
Hom
e In
vest
men
t Par
tner
ship
s Pro
gram
14.2
39
M16
DC5-
3020
0$
488,
536.
00$
0.00
$48
8,53
6.00
(3),
(9)
Hom
e In
vest
men
t Par
tner
ship
s Pro
gram
14.2
39
M17
DC5-
3020
0$
426,
212.
81$
0.00
$42
6,21
2.81
(3),
(9)
Dire
ct T
otal
$
3,25
1,64
5.22
$0.
00$
3,25
1,64
5.22
14.2
39 T
otal
$3,
251,
645.
22$
0.00
$3,
251,
645.
22
Cont
inuu
m o
f Car
e Pr
ogra
m14
.267
W
A032
0L0T
0018
03$
2,76
1.38
$62
,742
.54
$65
,503
.92
Cont
inuu
m o
f Car
e Pr
ogra
m14
.267
W
A026
2L0T
0016
03$
0.00
$1,
122.
15$
1,12
2.15
Cont
inuu
m o
f Car
e Pr
ogra
m14
.267
W
A032
0L0T
0017
02$
1,86
0.12
$50
,343
.63
$52
,203
.75
Cont
inuu
m o
f Car
e Pr
ogra
m14
.267
W
A036
6L0T
0017
01$
2,76
2.26
$17
9,81
1.04
$18
2,57
3.30
Cont
inuu
m o
f Car
e Pr
ogra
m14
.267
W
A003
3L0T
0017
10$
13,4
71.2
9$
501,
145.
63$
514,
616.
92
Cont
inuu
m o
f Car
e Pr
ogra
m14
.267
W
A003
4L0T
0017
10$
81,2
45.2
7$
2,21
9,20
0.76
$2,
300,
446.
03
Cont
inuu
m o
f Car
e Pr
ogra
m14
.267
W
A004
1L0T
0017
10$
1,31
2.05
$57
,992
.32
$59
,304
.37
The
note
s are
an
inte
gral
par
t of t
his
Sche
dule
Page 162

Fede
ral G
rant
or A
genc
yPa
ss-th
roug
h Ag
ency
Nam
eFe
dera
l Pro
gram
Nam
eCF
DA
Num
ber
Fede
ral A
war
d Id
entif
icat
ion
Num
ber
Ag
ency
Exp
endi
ture
s
Subr
ecip
ient
Ex
pend
iture
s
Tota
l Exp
endi
ture
sN
otes
KING
CO
UNTY
, WAS
HING
TON
SCHE
DULE
OF
EXPE
NDIT
URES
OF
FEDE
RAL A
WAR
DS
JANU
ARY
1, 2
019
THRO
UGH
DECE
MBE
R 31
, 201
9
Cont
inuu
m o
f Car
e Pr
ogra
m14
.267
W
A039
2L0T
0017
00$
6,94
1.18
$11
0,32
3.70
$11
7,26
4.88
Cont
inuu
m o
f Car
e Pr
ogra
m14
.267
W
A036
5L0T
0017
01$
8,36
4.59
$36
9,93
2.91
$37
8,29
7.50
Cont
inuu
m o
f Car
e Pr
ogra
m14
.267
W
A005
4L0T
0017
10$
1,07
0.68
$69
,524
.99
$70
,595
.67
Cont
inuu
m o
f Car
e Pr
ogra
m14
.267
W
A003
3L0T
0018
11$
18,6
15.6
7$
561,
012.
29$
579,
627.
96
Cont
inuu
m o
f Car
e Pr
ogra
m14
.267
W
A041
3D0T
0018
00$
0.00
$47
,176
.83
$47
,176
.83
Cont
inuu
m o
f Car
e Pr
ogra
m14
.267
W
A039
2L0T
0018
01$
6,34
5.80
$18
2,84
6.08
$18
9,19
1.88
Cont
inuu
m o
f Car
e Pr
ogra
m14
.267
W
A005
4L0T
0018
11$
2,44
1.55
$44
,262
.68
$46
,704
.23
Cont
inuu
m o
f Car
e Pr
ogra
m14
.267
W
A000
1L0T
0018
09$
1,08
4.01
$54
,116
.29
$55
,200
.30
Cont
inuu
m o
f Car
e Pr
ogra
m14
.267
W
A003
4L0T
0018
11$
113,
431.
94$
4,80
5,14
4.89
$4,
918,
576.
83
Cont
inuu
m o
f Car
e Pr
ogra
m14
.267
W
A005
0L0T
0017
10$
5,73
0.14
$0.
00$
5,73
0.14
Cont
inuu
m o
f Car
e Pr
ogra
m14
.267
W
A036
6L0T
0018
02$
10,0
30.8
9$
350,
498.
27$
360,
529.
16
Cont
inuu
m o
f Car
e Pr
ogra
m14
.267
W
A029
7L0T
0017
03$
65,2
45.6
4$
1,88
7,66
5.61
$1,
952,
911.
25
Cont
inuu
m o
f Car
e Pr
ogra
m14
.267
W
A034
8L0T
0017
02$
7,88
1.14
$39
7,95
9.18
$40
5,84
0.32
Cont
inuu
m o
f Car
e Pr
ogra
m14
.267
W
A005
0L0T
0018
11$
393,
468.
07$
0.00
$39
3,46
8.07
Cont
inuu
m o
f Car
e Pr
ogra
m14
.267
W
A000
1L0T
0017
08$
1,61
9.76
$28
,645
.31
$30
,265
.07
Cont
inuu
m o
f Car
e Pr
ogra
m14
.267
W
A005
3L0T
0018
11$
0.00
$14
4,57
4.30
$14
4,57
4.30
Cont
inuu
m o
f Car
e Pr
ogra
m14
.267
W
A040
9L0T
0018
00$
98,5
49.6
5$
0.00
$98
,549
.65
Cont
inuu
m o
f Car
e Pr
ogra
m14
.267
W
A034
3L0T
0017
02$
455,
885.
72$
887,
250.
34$
1,34
3,13
6.06
Cont
inuu
m o
f Car
e Pr
ogra
m14
.267
W
A002
0L0T
0018
11$
1,18
8.13
$96
,519
.48
$97
,707
.61
Cont
inuu
m o
f Car
e Pr
ogra
m14
.267
W
A029
7L0T
0018
04$
1,00
5.51
$2,
569,
170.
94$
2,57
0,17
6.45
Cont
inuu
m o
f Car
e Pr
ogra
m14
.267
W
A026
2L0T
0017
04$
9,49
4.00
$45
8,83
5.33
$46
8,32
9.33
Cont
inuu
m o
f Car
e Pr
ogra
m14
.267
W
A041
2D0T
0018
00$
0.00
$90
,070
.49
$90
,070
.49
Cont
inuu
m o
f Car
e Pr
ogra
m14
.267
W
A004
1L0T
0018
11$
0.00
$10
,818
.85
$10
,818
.85
Cont
inuu
m o
f Car
e Pr
ogra
m14
.267
W
A038
9L0T
0017
00$
905,
806.
46$
0.00
$90
5,80
6.46
Cont
inuu
m o
f Car
e Pr
ogra
m14
.267
W
A034
3L0T
0018
03$
189,
936.
32$
183,
998.
28$
373,
934.
60
Dire
ct T
otal
$
2,40
7,54
9.22
$16
,422
,705
.11
$18
,830
,254
.33
14.2
67 T
otal
$2,
407,
549.
22$
16,4
22,7
05.1
1$
18,8
30,2
54.3
3
The
note
s are
an
inte
gral
par
t of t
his
Sche
dule
Page 163

Fede
ral G
rant
or A
genc
yPa
ss-th
roug
h Ag
ency
Nam
eFe
dera
l Pro
gram
Nam
eCF
DA
Num
ber
Fede
ral A
war
d Id
entif
icat
ion
Num
ber
Ag
ency
Exp
endi
ture
s
Subr
ecip
ient
Ex
pend
iture
s
Tota
l Exp
endi
ture
sN
otes
KING
CO
UNTY
, WAS
HING
TON
SCHE
DULE
OF
EXPE
NDIT
URES
OF
FEDE
RAL A
WAR
DS
JANU
ARY
1, 2
019
THRO
UGH
DECE
MBE
R 31
, 201
9
Yout
h Ho
mel
essn
ess D
emon
stra
tion
Prog
ram
14.2
76
WA0
386Y
0T00
1600
$0.
00$
1,63
6.00
$1,
636.
00
Yout
h Ho
mel
essn
ess D
emon
stra
tion
Prog
ram
14.2
76
WA0
406Y
0T00
1600
$12
,885
.88
$38
8,26
3.64
$40
1,14
9.52
Yout
h Ho
mel
essn
ess D
emon
stra
tion
Prog
ram
14.2
76
WA0
405Y
0T00
1600
$9,
839.
41$
781,
727.
26$
791,
566.
67
Yout
h Ho
mel
essn
ess D
emon
stra
tion
Prog
ram
14.2
76
WA0
404Y
0T00
1600
$28
,694
.03
$66
8,51
7.55
$69
7,21
1.58
Yout
h Ho
mel
essn
ess D
emon
stra
tion
Prog
ram
14.2
76
WA0
407Y
0T00
1600
$3,
196.
74$
69,0
54.1
3$
72,2
50.8
7
Dire
ct T
otal
$
54,6
16.0
6$
1,90
9,19
8.58
$1,
963,
814.
64
14.2
76 T
otal
$54
,616
.06
$1,
909,
198.
58$
1,96
3,81
4.64
Was
hing
ton
Stat
e De
part
men
t of
Com
mer
ceM
ovin
g to
Wor
k De
mon
stra
tion
Prog
ram
14.8
81
WA1
9M00
203
$62
5.36
$0.
00$
625.
36
Indi
rect
To
tal
$62
5.36
$0.
00$
625.
36
14.8
81 T
otal
$62
5.36
$0.
00$
625.
36
Depa
rtm
ent o
f Hou
sing
and
Urba
n De
velo
pmen
t$
8,46
8,59
7.53
$22
,130
,855
.39
$30
,599
,452
.92
Depa
rtm
ent o
f the
Inte
rior
Fish
and
Wild
life
Man
agem
ent A
ssist
ance
15.6
08
F13A
C003
19$
50,4
71.9
9$
0.00
$50
,471
.99
Dire
ct T
otal
$
50,4
71.9
9$
0.00
$50
,471
.99
15.6
08 T
otal
$50
,471
.99
$0.
00$
50,4
71.9
9
Was
hing
ton
Stat
e Re
crea
tion
and
Cons
erva
tion
Offi
ceO
utdo
or R
ecre
atio
n Ac
quisi
tion,
Dev
elop
men
t and
Pl
anni
ng15
.916
P1
8AP0
0001
$10
,748
.69
$0.
00$
10,7
48.6
9
Indi
rect
To
tal
$10
,748
.69
$0.
00$
10,7
48.6
9
15.9
16 T
otal
$10
,748
.69
$0.
00$
10,7
48.6
9
Depa
rtm
ent o
f the
Inte
rior
$61
,220
.68
$0.
00$
61,2
20.6
8
The
note
s are
an
inte
gral
par
t of t
his
Sche
dule
Page 164

Fede
ral G
rant
or A
genc
yPa
ss-th
roug
h Ag
ency
Nam
eFe
dera
l Pro
gram
Nam
eCF
DA
Num
ber
Fede
ral A
war
d Id
entif
icat
ion
Num
ber
Ag
ency
Exp
endi
ture
s
Subr
ecip
ient
Ex
pend
iture
s
Tota
l Exp
endi
ture
sN
otes
KING
CO
UNTY
, WAS
HING
TON
SCHE
DULE
OF
EXPE
NDIT
URES
OF
FEDE
RAL A
WAR
DS
JANU
ARY
1, 2
019
THRO
UGH
DECE
MBE
R 31
, 201
9
Depa
rtm
ent o
f Jus
tice
Was
hing
ton
Stat
e De
part
men
t of
Com
mer
ceNa
tiona
l Crim
inal
Hist
ory
Impr
ovem
ent P
rogr
am
(NCH
IP)
16.5
54
2018
-RU-
BX-K
029
$14
,809
.31
$0.
00$
14,8
09.3
1
Indi
rect
To
tal
$14
,809
.31
$0.
00$
14,8
09.3
1
16.5
54 T
otal
$14
,809
.31
$0.
00$
14,8
09.3
1
Natio
nal I
nstit
ute
of Ju
stice
Res
earc
h, E
valu
atio
n, a
nd
Deve
lopm
ent P
roje
ct G
rant
s16
.560
20
18-D
U-BX
-015
3$
53,9
46.1
4$
0.00
$53
,946
.14
Natio
nal I
nstit
ute
of Ju
stice
Res
earc
h, E
valu
atio
n, a
nd
Deve
lopm
ent P
roje
ct G
rant
s16
.560
20
17-V
A-CX
-003
4$
23,4
46.2
2$
98,2
55.1
3$
121,
701.
35
Dire
ct T
otal
$
77,3
92.3
6$
98,2
55.1
3$
175,
647.
49
16.5
60 T
otal
$77
,392
.36
$98
,255
.13
$17
5,64
7.49
Was
hing
ton
Stat
e De
part
men
t of
Com
mer
ceCr
ime
Vict
im A
ssist
ance
16.5
75
2016
-VA-
GX-0
044
$19
6,29
7.47
$0.
00$
196,
297.
47
Was
hing
ton
Stat
e De
part
men
t of
Com
mer
ceCr
ime
Vict
im A
ssist
ance
16.5
75
2015
-VA-
GX-0
031
$33
2,55
9.23
$0.
00$
332,
559.
23
Indi
rect
To
tal
$52
8,85
6.70
$0.
00$
528,
856.
70
16.5
75 T
otal
$52
8,85
6.70
$0.
00$
528,
856.
70
Was
hing
ton
Stat
e De
part
men
t of
Com
mer
ceVi
olen
ce A
gain
st W
omen
For
mul
a Gr
ants
16.5
88
2018
-WF-
AX-0
057
$11
4,80
9.90
$0.
00$
114,
809.
90
Was
hing
ton
Stat
e De
part
men
t of
Com
mer
ceVi
olen
ce A
gain
st W
omen
For
mul
a Gr
ants
16.5
88
2017
-WF-
AX-0
030
$71
,177
.22
$0.
00$
71,1
77.2
2
Was
hing
ton
Stat
e De
part
men
t of
Com
mer
ceVi
olen
ce A
gain
st W
omen
For
mul
a Gr
ants
16.5
88
2017
-WE-
AX-0
030
$74
,995
.00
$0.
00$
74,9
95.0
0
Indi
rect
To
tal
$26
0,98
2.12
$0.
00$
260,
982.
12
16.5
88 T
otal
$26
0,98
2.12
$0.
00$
260,
982.
12
The
note
s are
an
inte
gral
par
t of t
his
Sche
dule
Page 165

Fede
ral G
rant
or A
genc
yPa
ss-th
roug
h Ag
ency
Nam
eFe
dera
l Pro
gram
Nam
eCF
DA
Num
ber
Fede
ral A
war
d Id
entif
icat
ion
Num
ber
Ag
ency
Exp
endi
ture
s
Subr
ecip
ient
Ex
pend
iture
s
Tota
l Exp
endi
ture
sN
otes
KING
CO
UNTY
, WAS
HING
TON
SCHE
DULE
OF
EXPE
NDIT
URES
OF
FEDE
RAL A
WAR
DS
JANU
ARY
1, 2
019
THRO
UGH
DECE
MBE
R 31
, 201
9
Nort
hwes
t Im
mig
rant
Rig
hts P
roje
ctGr
ants
to E
ncou
rage
Arr
est P
olici
es a
nd E
nfor
cem
ent o
f Pr
otec
tion
Ord
ers P
rogr
am16
.590
20
16-W
E-AX
-000
9$
22,6
12.3
1$
0.00
$22
,612
.31
Indi
rect
To
tal
$22
,612
.31
$0.
00$
22,6
12.3
1
16.5
90 T
otal
$22
,612
.31
$0.
00$
22,6
12.3
1
Was
hing
ton
Stat
e Pa
trol
Paul
Cov
erde
ll Fo
rens
ic Sc
ienc
es Im
prov
emen
t Gra
nt
Prog
ram
16.7
42
2019
-CD-
BX-0
033
$19
0,20
7.61
$0.
00$
190,
207.
61
Indi
rect
To
tal
$19
0,20
7.61
$0.
00$
190,
207.
61
16.7
42 T
otal
$19
0,20
7.61
$0.
00$
190,
207.
61
Was
hing
ton
Stat
e De
part
men
t of
Com
mer
ceCo
urt A
ppoi
nted
Spe
cial A
dvoc
ates
16.7
56
2018
-CH-
BX-K
001
$44
,828
.10
$0.
00$
44,8
28.1
0
Indi
rect
To
tal
$44
,828
.10
$0.
00$
44,8
28.1
0
16.7
56 T
otal
$44
,828
.10
$0.
00$
44,8
28.1
0
Com
preh
ensiv
e O
pioi
d Ab
use
Site
-Bas
ed P
rogr
am
(CO
AP)
16.8
38
2019
-AR-
BX-K
010
$3,
122.
57$
0.00
$3,
122.
57
Dire
ct T
otal
$
3,12
2.57
$0.
00$
3,12
2.57
16.8
38 T
otal
$3,
122.
57$
0.00
$3,
122.
57
Depa
rtm
ent o
f Jus
tice
$1,
142,
811.
08$
98,2
55.1
3$
1,24
1,06
6.21
The
note
s are
an
inte
gral
par
t of t
his
Sche
dule
Page 166

Fede
ral G
rant
or A
genc
yPa
ss-th
roug
h Ag
ency
Nam
eFe
dera
l Pro
gram
Nam
eCF
DA
Num
ber
Fede
ral A
war
d Id
entif
icat
ion
Num
ber
Ag
ency
Exp
endi
ture
s
Subr
ecip
ient
Ex
pend
iture
s
Tota
l Exp
endi
ture
sN
otes
KING
CO
UNTY
, WAS
HING
TON
SCHE
DULE
OF
EXPE
NDIT
URES
OF
FEDE
RAL A
WAR
DS
JANU
ARY
1, 2
019
THRO
UGH
DECE
MBE
R 31
, 201
9
Depa
rtm
ent o
f Lab
or
WIO
A Cl
uste
rW
orkf
orce
Dev
elop
men
t Cou
ncil
WIO
A Yo
uth
Activ
ities
17.2
59
AA30
7721
755A
53$
916,
853.
99$
137,
560.
00$
1,05
4,41
3.99
Indi
rect
To
tal
$91
6,85
3.99
$13
7,56
0.00
$1,
054,
413.
99
17.2
59 T
otal
$91
6,85
3.99
$13
7,56
0.00
$1,
054,
413.
99
Wor
kfor
ce D
evel
opm
ent C
ounc
ilW
IOA
Dislo
cate
d W
orke
r For
mul
a Gr
ants
17.2
78
AA30
7721
755A
53$
257,
468.
34$
0.00
$25
7,46
8.34
Indi
rect
To
tal
$25
7,46
8.34
$0.
00$
257,
468.
34
17.2
78 T
otal
$25
7,46
8.34
$0.
00$
257,
468.
34
Tota
l WIO
A Cl
uste
r17
.278
Tot
al$
1,17
4,32
2.33
$13
7,56
0.00
$1,
311,
882.
33
Wor
kfor
ce D
evel
opm
ent C
ounc
ilYo
uthB
uild
17.2
74
AA30
7721
755A
53$
193,
815.
61$
0.00
$19
3,81
5.61
Indi
rect
To
tal
$19
3,81
5.61
$0.
00$
193,
815.
61
17.2
74 T
otal
$19
3,81
5.61
$0.
00$
193,
815.
61
Depa
rtm
ent o
f Lab
or$
1,36
8,13
7.94
$13
7,56
0.00
$1,
505,
697.
94
Depa
rtm
ent o
f Tra
nspo
rtat
ion
Airp
ort I
mpr
ovem
ent P
rogr
am20
.106
3
53 0
058
052
$56
,525
.14
$0.
00$
56,5
25.1
4
Airp
ort I
mpr
ovem
ent P
rogr
am20
.106
3
53 0
058
054
$43
,033
.00
$0.
00$
43,0
33.0
0
Dire
ct T
otal
$
99,5
58.1
4$
0.00
$99
,558
.14
20.1
06 T
otal
$99
,558
.14
$0.
00$
99,5
58.1
4
The
note
s are
an
inte
gral
par
t of t
his
Sche
dule
Page 167

Fede
ral G
rant
or A
genc
yPa
ss-th
roug
h Ag
ency
Nam
eFe
dera
l Pro
gram
Nam
eCF
DA
Num
ber
Fede
ral A
war
d Id
entif
icat
ion
Num
ber
Ag
ency
Exp
endi
ture
s
Subr
ecip
ient
Ex
pend
iture
s
Tota
l Exp
endi
ture
sN
otes
KING
CO
UNTY
, WAS
HING
TON
SCHE
DULE
OF
EXPE
NDIT
URES
OF
FEDE
RAL A
WAR
DS
JANU
ARY
1, 2
019
THRO
UGH
DECE
MBE
R 31
, 201
9
High
way
Pla
nnin
g an
d Co
nstr
uctio
n Cl
uste
rW
ashi
ngto
n St
ate
Depa
rtm
ent o
f Tr
ansp
orta
tion
High
way
Pla
nnin
g an
d Co
nstr
uctio
n20
.205
53
1403
0120
9VE3
0$
103,
663.
03$
0.00
$10
3,66
3.03
Was
hing
ton
Stat
e De
part
men
t of
Tran
spor
tatio
nHi
ghw
ay P
lann
ing
and
Cons
truc
tion
20.2
05
5300
0S48
7ZS3
0$
13,6
08.1
7$
0.00
$13
,608
.17
Was
hing
ton
Stat
e De
part
men
t of
Tran
spor
tatio
nHi
ghw
ay P
lann
ing
and
Cons
truc
tion
20.2
05
5320
1711
0Z40
0$
812,
708.
88$
0.00
$81
2,70
8.88
Was
hing
ton
Stat
e De
part
men
t of
Tran
spor
tatio
nHi
ghw
ay P
lann
ing
and
Cons
truc
tion
20.2
05
5399
1702
1L88
E10
$9,
932.
48$
0.00
$9,
932.
48
Was
hing
ton
Stat
e De
part
men
t of
Tran
spor
tatio
nHi
ghw
ay P
lann
ing
and
Cons
truc
tion
20.2
05
5320
1714
8M2E
3$
174,
196.
78$
0.00
$17
4,19
6.78
Was
hing
ton
Stat
e De
part
men
t of
Tran
spor
tatio
nHi
ghw
ay P
lann
ing
and
Cons
truc
tion
20.2
05
693J
J219
3000
0Z23
2WAC
1710
01$
128,
528.
75$
0.00
$12
8,52
8.75
Was
hing
ton
Stat
e De
part
men
t of
Tran
spor
tatio
nHi
ghw
ay P
lann
ing
and
Cons
truc
tion
20.2
05
693J
J219
3000
0Z24
0WAX
1730
01$
204,
320.
02$
0.00
$20
4,32
0.02
Was
hing
ton
Stat
e De
part
men
t of
Tran
spor
tatio
nHi
ghw
ay P
lann
ing
and
Cons
truc
tion
20.2
05
5300
0S46
1ZS3
0$
571,
598.
00$
0.00
$57
1,59
8.00
Was
hing
ton
Stat
e De
part
men
t of
Tran
spor
tatio
nHi
ghw
ay P
lann
ing
and
Cons
truc
tion
20.2
05
5316
0202
1M24
E10
$45
6,76
5.10
$0.
00$
456,
765.
10
Was
hing
ton
Stat
e De
part
men
t of
Tran
spor
tatio
nHi
ghw
ay P
lann
ing
and
Cons
truc
tion
20.2
05
5320
1733
M40
E30
$81
,021
.59
$0.
00$
81,0
21.5
9
Was
hing
ton
Stat
e De
part
men
t of
Tran
spor
tatio
nHi
ghw
ay P
lann
ing
and
Cons
truc
tion
20.2
05
5320
1714
4Z23
0$
53,7
24.0
0$
0.00
$53
,724
.00
Was
hing
ton
Stat
e De
part
men
t of
Tran
spor
tatio
nHi
ghw
ay P
lann
ing
and
Cons
truc
tion
20.2
05
53EN
1001
7L22
E10
$6,
478.
34$
0.00
$6,
478.
34
Was
hing
ton
Stat
e De
part
men
t of
Tran
spor
tatio
nHi
ghw
ay P
lann
ing
and
Cons
truc
tion
20.2
05
5324
5600
6Z00
1$
183,
006.
97$
0.00
$18
3,00
6.97
Was
hing
ton
Stat
e De
part
men
t of
Tran
spor
tatio
nHi
ghw
ay P
lann
ing
and
Cons
truc
tion
20.2
05
53F1
7100
4M24
0$
510,
125.
74$
0.00
$51
0,12
5.74
Indi
rect
To
tal
$3,
309,
677.
85$
0.00
$3,
309,
677.
85
Tota
l Hig
hway
Pla
nnin
g an
d Co
nstr
uctio
n Cl
uste
r20
.205
Tot
al$
3,30
9,67
7.85
$0.
00$
3,30
9,67
7.85
The
note
s are
an
inte
gral
par
t of t
his
Sche
dule
Page 168

Fede
ral G
rant
or A
genc
yPa
ss-th
roug
h Ag
ency
Nam
eFe
dera
l Pro
gram
Nam
eCF
DA
Num
ber
Fede
ral A
war
d Id
entif
icat
ion
Num
ber
Ag
ency
Exp
endi
ture
s
Subr
ecip
ient
Ex
pend
iture
s
Tota
l Exp
endi
ture
sN
otes
KING
CO
UNTY
, WAS
HING
TON
SCHE
DULE
OF
EXPE
NDIT
URES
OF
FEDE
RAL A
WAR
DS
JANU
ARY
1, 2
019
THRO
UGH
DECE
MBE
R 31
, 201
9
Fede
ral T
rans
it Cl
uste
rFe
dera
l Tra
nsit
Capi
tal I
nves
tmen
t Gra
nts
20.5
00
WA-
XXXX
-XXX
$98
9,03
3.00
$0.
00$
989,
033.
00(1
1)
Fede
ral T
rans
it Ca
pita
l Inv
estm
ent G
rant
s20
.500
W
A-05
-006
6$
22,3
05.7
0$
71,5
88.3
0$
93,8
94.0
0
Fede
ral T
rans
it Ca
pita
l Inv
estm
ent G
rant
s20
.500
W
A-04
-008
1$
30,6
24.0
0$
0.00
$30
,624
.00
Fede
ral T
rans
it Ca
pita
l Inv
estm
ent G
rant
s20
.500
W
A-03
-024
5$
112,
469.
02$
15,2
28.9
8$
127,
698.
00
Fede
ral T
rans
it Ca
pita
l Inv
estm
ent G
rant
s20
.500
W
A-04
-008
0$
43,7
12.0
0$
0.00
$43
,712
.00
Fede
ral T
rans
it Ca
pita
l Inv
estm
ent G
rant
s20
.500
W
A-04
-009
9$
36,6
04.0
0$
0.00
$36
,604
.00
Dire
ct T
otal
$
1,23
4,74
7.72
$86
,817
.28
$1,
321,
565.
00
20.5
00 T
otal
$1,
234,
747.
72$
86,8
17.2
8$
1,32
1,56
5.00
Fede
ral T
rans
it Fo
rmul
a Gr
ants
20.5
07
WA-
2019
-035
$24
7,77
8.00
$0.
00$
247,
778.
00(1
1)
Fede
ral T
rans
it Fo
rmul
a Gr
ants
20.5
07
WA-
2016
-035
$29
9,76
6.62
$36
6,68
1.38
$66
6,44
8.00
Fede
ral T
rans
it Fo
rmul
a Gr
ants
20.5
07
WA-
2020
-105
$34
4,37
7.00
$0.
00$
344,
377.
00
Fede
ral T
rans
it Fo
rmul
a Gr
ants
20.5
07
WA-
2020
-048
$0.
00$
453,
674.
00$
453,
674.
00(1
1)
Fede
ral T
rans
it Fo
rmul
a Gr
ants
20.5
07
WA-
2019
-093
$4,
713,
642.
00$
0.00
$4,
713,
642.
00(1
1)
Fede
ral T
rans
it Fo
rmul
a Gr
ants
20.5
07
WA-
90-X
583
$80
.00
$0.
00$
80.0
0
Fede
ral T
rans
it Fo
rmul
a Gr
ants
20.5
07
WA-
95-X
005
$10
6,16
8.50
$6,
519.
50$
112,
688.
00
Fede
ral T
rans
it Fo
rmul
a Gr
ants
20.5
07
WA-
90-X
513
$87
5,30
5.00
$0.
00$
875,
305.
00
Fede
ral T
rans
it Fo
rmul
a Gr
ants
20.5
07
WA-
95-X
069
$1,
005.
00$
0.00
$1,
005.
00
Fede
ral T
rans
it Fo
rmul
a Gr
ants
20.5
07
WA-
90-X
522
$53
2.00
$0.
00$
532.
00
Fede
ral T
rans
it Fo
rmul
a Gr
ants
20.5
07
WA-
2020
-087
$1,
838,
965.
57$
15,2
13.0
0$
1,85
4,17
8.57
(11)
Fede
ral T
rans
it Fo
rmul
a Gr
ants
20.5
07
WA-
2020
-104
$98
8,17
6.00
$0.
00$
988,
176.
00(1
1)
Fede
ral T
rans
it Fo
rmul
a Gr
ants
20.5
07
WA-
2016
-022
$17
2,50
3.00
$98
,558
.33
$27
1,06
1.33
Fede
ral T
rans
it Fo
rmul
a Gr
ants
20.5
07
WA-
XXXX
-XXX
$19
,100
,241
.00
$0.
00$
19,1
00,2
41.0
0(1
1)
Fede
ral T
rans
it Fo
rmul
a Gr
ants
20.5
07
WA-
2020
-041
$5,
304.
00$
0.00
$5,
304.
00(1
1)
Fede
ral T
rans
it Fo
rmul
a Gr
ants
20.5
07
WA-
2016
-060
$11
2,10
4.00
$73
9,91
2.00
$85
2,01
6.00
Fede
ral T
rans
it Fo
rmul
a Gr
ants
20.5
07
WA-
2019
-036
$0.
00$
409,
720.
00$
409,
720.
00
Dire
ct T
otal
$
28,8
05,9
47.6
9$
2,09
0,27
8.21
$30
,896
,225
.90
20.5
07 T
otal
$28
,805
,947
.69
$2,
090,
278.
21$
30,8
96,2
25.9
0
The
note
s are
an
inte
gral
par
t of t
his
Sche
dule
Page 169

Fede
ral G
rant
or A
genc
yPa
ss-th
roug
h Ag
ency
Nam
eFe
dera
l Pro
gram
Nam
eCF
DA
Num
ber
Fede
ral A
war
d Id
entif
icat
ion
Num
ber
Ag
ency
Exp
endi
ture
s
Subr
ecip
ient
Ex
pend
iture
s
Tota
l Exp
endi
ture
sN
otes
KING
CO
UNTY
, WAS
HING
TON
SCHE
DULE
OF
EXPE
NDIT
URES
OF
FEDE
RAL A
WAR
DS
JANU
ARY
1, 2
019
THRO
UGH
DECE
MBE
R 31
, 201
9
Stat
e of
Goo
d Re
pair
Gran
ts P
rogr
am20
.525
W
A-20
19-0
28$
1,20
4,23
8.36
$6,
848,
034.
24$
8,05
2,27
2.60
(11)
Stat
e of
Goo
d Re
pair
Gran
ts P
rogr
am20
.525
W
A-20
19-0
51$
2,75
8,61
3.00
$0.
00$
2,75
8,61
3.00
(11)
Stat
e of
Goo
d Re
pair
Gran
ts P
rogr
am20
.525
W
A-XX
XX-X
XX$
9,52
0,02
0.00
$0.
00$
9,52
0,02
0.00
(11)
Stat
e of
Goo
d Re
pair
Gran
ts P
rogr
am20
.525
W
A-54
-000
2$
351,
714.
00$
0.00
$35
1,71
4.00
Stat
e of
Goo
d Re
pair
Gran
ts P
rogr
am20
.525
W
A-20
19-0
53$
561,
621.
00$
0.00
$56
1,62
1.00
(6)
Dire
ct T
otal
$
14,3
96,2
06.3
6$
6,84
8,03
4.24
$21
,244
,240
.60
20.5
25 T
otal
$14
,396
,206
.36
$6,
848,
034.
24$
21,2
44,2
40.6
0
Buse
s and
Bus
Fac
ilitie
s For
mul
a, C
ompe
titiv
e, a
nd Lo
w
or N
o Em
issio
ns P
rogr
ams
20.5
26
WA-
2019
-063
$3,
682,
249.
00$
0.00
$3,
682,
249.
00(1
1)
Buse
s and
Bus
Fac
ilitie
s For
mul
a, C
ompe
titiv
e, a
nd Lo
w
or N
o Em
issio
ns P
rogr
ams
20.5
26
WA-
XXXX
-XXX
$3,
140,
114.
00$
0.00
$3,
140,
114.
00(1
1)
Dire
ct T
otal
$
6,82
2,36
3.00
$0.
00$
6,82
2,36
3.00
20.5
26 T
otal
$6,
822,
363.
00$
0.00
$6,
822,
363.
00
Tota
l Fed
eral
Tra
nsit
Clus
ter
$51
,259
,264
.77
$9,
025,
129.
73$
60,2
84,3
94.5
0
Tran
sit S
ervi
ces P
rogr
ams C
lust
er
Enha
nced
Mob
ility
of S
enio
rs a
nd In
divi
dual
s with
Di
sabi
litie
s20
.513
W
A-20
17-0
44$
81,9
23.0
0$
0.00
$81
,923
.00
Dire
ct T
otal
$
81,9
23.0
0$
0.00
$81
,923
.00
Was
hing
ton
Stat
e De
part
men
t of
Tran
spor
tatio
nEn
hanc
ed M
obili
ty o
f Sen
iors
and
Indi
vidu
als w
ith
Disa
bilit
ies
20.5
13
PTD0
038
$11
3,17
5.00
$0.
00$
113,
175.
00(1
1)
Indi
rect
To
tal
$11
3,17
5.00
$0.
00$
113,
175.
00
20.5
13 T
otal
$19
5,09
8.00
$0.
00$
195,
098.
00
The
note
s are
an
inte
gral
par
t of t
his
Sche
dule
Page 170

Fede
ral G
rant
or A
genc
yPa
ss-th
roug
h Ag
ency
Nam
eFe
dera
l Pro
gram
Nam
eCF
DA
Num
ber
Fede
ral A
war
d Id
entif
icat
ion
Num
ber
Ag
ency
Exp
endi
ture
s
Subr
ecip
ient
Ex
pend
iture
s
Tota
l Exp
endi
ture
sN
otes
KING
CO
UNTY
, WAS
HING
TON
SCHE
DULE
OF
EXPE
NDIT
URES
OF
FEDE
RAL A
WAR
DS
JANU
ARY
1, 2
019
THRO
UGH
DECE
MBE
R 31
, 201
9
Job
Acce
ss A
nd R
ever
se C
omm
ute
Prog
ram
20.5
16
WA-
37-X
045
$13
1,86
9.00
$0.
00$
131,
869.
00
Dire
ct T
otal
$
131,
869.
00$
0.00
$13
1,86
9.00
20.5
16 T
otal
$13
1,86
9.00
$0.
00$
131,
869.
00
Tota
l Tra
nsit
Serv
ices P
rogr
ams C
lust
er$
326,
967.
00$
0.00
$32
6,96
7.00
Publ
ic Tr
ansp
orta
tion
Rese
arch
, Tec
hnica
l Ass
istan
ce,
and
Trai
ning
20.5
14
WA-
2017
-069
$67
9,30
8.00
$0.
00$
679,
308.
00
Dire
ct T
otal
$
679,
308.
00$
0.00
$67
9,30
8.00
Los A
ngel
es C
ount
y M
etro
polit
an
Tran
spor
tatio
n Au
thor
ityPu
blic
Tran
spor
tatio
n Re
sear
ch, T
echn
ical A
ssist
ance
, an
d Tr
aini
ng20
.514
CA
-201
6-01
8$
345,
000.
00$
0.00
$34
5,00
0.00
(6)
Indi
rect
To
tal
$34
5,00
0.00
$0.
00$
345,
000.
00
20.5
14 T
otal
$1,
024,
308.
00$
0.00
$1,
024,
308.
00
Clea
n Fu
els
20.5
19
WA-
58-0
008
$20
6,82
4.00
$0.
00$
206,
824.
00
Dire
ct T
otal
$
206,
824.
00$
0.00
$20
6,82
4.00
20.5
19 T
otal
$20
6,82
4.00
$0.
00$
206,
824.
00
High
way
Saf
ety
Clus
ter
Was
hing
ton
Asso
ciatio
n of
She
riffs
&
Polic
e Ch
iefs
Stat
e an
d Co
mm
unity
Hig
hway
Saf
ety
20.6
00
69A3
7519
3000
0402
0W
A0$
9,00
0.00
$0.
00$
9,00
0.00
Tota
l Hig
hway
Saf
ety
Clus
ter
20.6
00 T
otal
$9,
000.
00$
0.00
$9,
000.
00
Depa
rtm
ent o
f Tra
nspo
rtat
ion
$56
,235
,599
.76
$9,
025,
129.
73$
65,2
60,7
29.4
9
The
note
s are
an
inte
gral
par
t of t
his
Sche
dule
Page 171

Fede
ral G
rant
or A
genc
yPa
ss-th
roug
h Ag
ency
Nam
eFe
dera
l Pro
gram
Nam
eCF
DA
Num
ber
Fede
ral A
war
d Id
entif
icat
ion
Num
ber
Ag
ency
Exp
endi
ture
s
Subr
ecip
ient
Ex
pend
iture
s
Tota
l Exp
endi
ture
sN
otes
KING
CO
UNTY
, WAS
HING
TON
SCHE
DULE
OF
EXPE
NDIT
URES
OF
FEDE
RAL A
WAR
DS
JANU
ARY
1, 2
019
THRO
UGH
DECE
MBE
R 31
, 201
9
Envi
ronm
enta
l Pro
tect
ion
Agen
cy
Was
hing
ton
Stat
e De
part
men
t of
Fish
an
d W
ildlif
ePu
get S
ound
Act
ion
Agen
da: T
echn
ical I
nves
tigat
ions
an
d Im
plem
enta
tion
Assis
tanc
e Pr
ogra
m66
.123
01
J223
01$
47,4
59.4
6$
0.00
$47
,459
.46
Was
hing
ton
Stat
e De
part
men
t of
Ecol
ogy
Puge
t Sou
nd A
ctio
n Ag
enda
: Tec
hnica
l Inv
estig
atio
ns
and
Impl
emen
tatio
n As
sista
nce
Prog
ram
66.1
23
01J1
8101
$33
8,22
8.90
$0.
00$
338,
228.
90
Was
hing
ton
Stat
e De
part
men
t of
Ecol
ogy
Puge
t Sou
nd A
ctio
n Ag
enda
: Tec
hnica
l Inv
estig
atio
ns
and
Impl
emen
tatio
n As
sista
nce
Prog
ram
66.1
23
00J8
9401
$79
0,00
0.00
$14
,606
.23
$80
4,60
6.23
Was
hing
ton
Stat
e De
part
men
t of
Heal
thPu
get S
ound
Act
ion
Agen
da: T
echn
ical I
nves
tigat
ions
an
d Im
plem
enta
tion
Assis
tanc
e Pr
ogra
m66
.123
01
J180
01$
256,
971.
52$
0.00
$25
6,97
1.52
Was
hing
ton
Stat
e De
part
men
t of
Heal
thPu
get S
ound
Act
ion
Agen
da: T
echn
ical I
nves
tigat
ions
an
d Im
plem
enta
tion
Assis
tanc
e Pr
ogra
m66
.123
00
J888
01$
114,
961.
60$
0.00
$11
4,96
1.60
Indi
rect
To
tal
$1,
547,
621.
48$
14,6
06.2
3$
1,56
2,22
7.71
66.1
23 T
otal
$1,
547,
621.
48$
14,6
06.2
3$
1,56
2,22
7.71
Puge
t Sou
nd P
artn
ersh
ipNa
tiona
l Est
uary
Pro
gram
66.4
56
01J6
5401
$14
,506
.21
$0.
00$
14,5
06.2
1
Puge
t Sou
nd P
artn
ersh
ipNa
tiona
l Est
uary
Pro
gram
66.4
56
01J3
1901
$32
,474
.27
$0.
00$
32,4
74.2
7
Indi
rect
To
tal
$46
,980
.48
$0.
00$
46,9
80.4
8
66.4
56 T
otal
$46
,980
.48
$0.
00$
46,9
80.4
8
Clea
n W
ater
Sta
te R
evol
ving
Fun
d Cl
uste
rW
ashi
ngto
n St
ate
Depa
rtm
ent o
f Ec
olog
yCa
pita
lizat
ion
Gran
ts fo
r Cle
an W
ater
Sta
te R
evol
ving
Fu
nds
66.4
58
5300
0119
$21
,629
,553
.71
$0.
00$
21,6
29,5
53.7
1(5
)
Indi
rect
To
tal
$21
,629
,553
.71
$0.
00$
21,6
29,5
53.7
1
Tota
l Cle
an W
ater
Sta
te R
evol
ving
Fun
d Cl
uste
r66
.458
Tot
al$
21,6
29,5
53.7
1$
0.00
$21
,629
,553
.71
Was
hing
ton
Stat
e De
part
men
t of
Heal
thBe
ach
Mon
itorin
g an
d No
tifica
tion
Prog
ram
Im
plem
enta
tion
Gran
ts66
.472
01
J497
01$
22,0
00.0
0$
0.00
$22
,000
.00
Indi
rect
To
tal
$22
,000
.00
$0.
00$
22,0
00.0
0
66.4
72 T
otal
$22
,000
.00
$0.
00$
22,0
00.0
0
The
note
s are
an
inte
gral
par
t of t
his
Sche
dule
Page 172

Fede
ral G
rant
or A
genc
yPa
ss-th
roug
h Ag
ency
Nam
eFe
dera
l Pro
gram
Nam
eCF
DA
Num
ber
Fede
ral A
war
d Id
entif
icat
ion
Num
ber
Ag
ency
Exp
endi
ture
s
Subr
ecip
ient
Ex
pend
iture
s
Tota
l Exp
endi
ture
sN
otes
KING
CO
UNTY
, WAS
HING
TON
SCHE
DULE
OF
EXPE
NDIT
URES
OF
FEDE
RAL A
WAR
DS
JANU
ARY
1, 2
019
THRO
UGH
DECE
MBE
R 31
, 201
9
Supe
rfun
d St
ate,
Pol
itica
l Sub
divi
sion,
and
Indi
an T
ribe
Site
-Spe
cific
Coop
erat
ive
Agre
emen
ts66
.802
01
J284
01$
415,
623.
38$
65,7
64.4
9$
481,
387.
87
Dire
ct T
otal
$
415,
623.
38$
65,7
64.4
9$
481,
387.
87
66.8
02 T
otal
$41
5,62
3.38
$65
,764
.49
$48
1,38
7.87
Wor
kfor
ce D
evel
opm
ent C
ounc
ilEn
viro
nmen
tal W
orkf
orce
Dev
elop
men
t and
Job
Trai
ning
Coo
pera
tive
Agre
emen
ts66
.815
01
J517
01$
9,36
8.42
$65
,010
.00
$74
,378
.42
Indi
rect
To
tal
$9,
368.
42$
65,0
10.0
0$
74,3
78.4
2
66.8
15 T
otal
$9,
368.
42$
65,0
10.0
0$
74,3
78.4
2
Wat
er In
fras
truc
ture
Fin
ance
and
Inno
vatio
n (W
IFIA
)66
.958
W
IFIA
N17
107W
A$
13,1
79,6
71.4
2$
0.00
$13
,179
,671
.42
(10)
Dire
ct T
otal
$
13,1
79,6
71.4
2$
0.00
$13
,179
,671
.42
66.9
58 T
otal
$13
,179
,671
.42
$0.
00$
13,1
79,6
71.4
2
Envi
ronm
enta
l Pro
tect
ion
Agen
cy$
36,8
50,8
18.8
9$
145,
380.
72$
36,9
96,1
99.6
1
Depa
rtm
ent o
f Hea
lth a
nd H
uman
Se
rvice
sW
ashi
ngto
n St
ate
Depa
rtm
ent o
f He
alth
Publ
ic He
alth
Em
erge
ncy
Prep
ared
ness
93.0
69
NU90
TP92
1889
/922
04 3$
1,91
1,02
9.56
$0.
00$
1,91
1,02
9.56
Indi
rect
To
tal
$1,
911,
029.
56$
0.00
$1,
911,
029.
56
93.0
69 T
otal
$1,
911,
029.
56$
0.00
$1,
911,
029.
56
The
note
s are
an
inte
gral
par
t of t
his
Sche
dule
Page 173

Fede
ral G
rant
or A
genc
yPa
ss-th
roug
h Ag
ency
Nam
eFe
dera
l Pro
gram
Nam
eCF
DA
Num
ber
Fede
ral A
war
d Id
entif
icat
ion
Num
ber
Ag
ency
Exp
endi
ture
s
Subr
ecip
ient
Ex
pend
iture
s
Tota
l Exp
endi
ture
sN
otes
KING
CO
UNTY
, WAS
HING
TON
SCHE
DULE
OF
EXPE
NDIT
URES
OF
FEDE
RAL A
WAR
DS
JANU
ARY
1, 2
019
THRO
UGH
DECE
MBE
R 31
, 201
9
Sodi
um R
educ
tion
in C
omm
uniti
es93
.082
NU
58DP
0000
18$
137,
963.
66$
154,
509.
21$
292,
472.
87
Dire
ct T
otal
$
137,
963.
66$
154,
509.
21$
292,
472.
87
93.0
82 T
otal
$13
7,96
3.66
$15
4,50
9.21
$29
2,47
2.87
Was
hing
ton
Stat
e De
part
men
t of
Heal
thPr
ojec
t Gra
nts a
nd C
oope
rativ
e Ag
reem
ents
for
Tube
rcul
osis
Cont
rol P
rogr
ams
93.1
16
NU52
PS91
0221
-01-
00$
379,
139.
91$
0.00
$37
9,13
9.91
Indi
rect
To
tal
$37
9,13
9.91
$0.
00$
379,
139.
91
93.1
16 T
otal
$37
9,13
9.91
$0.
00$
379,
139.
91
Was
hing
ton
Stat
e De
part
men
t of
Heal
thAc
quire
d Im
mun
odef
icien
cy S
yndr
ome
(AID
S) A
ctiv
ity93
.118
NU
65PS
9236
91$
35,6
70.3
4$
0.00
$35
,670
.34
Indi
rect
To
tal
$35
,670
.34
$0.
00$
35,6
70.3
4
93.1
18 T
otal
$35
,670
.34
$0.
00$
35,6
70.3
4
Was
hing
ton
Stat
e De
part
men
t of
Heal
thIn
jury
Pre
vent
ion
and
Cont
rol R
esea
rch
and
Stat
e an
d Co
mm
unity
Bas
ed P
rogr
ams
93.1
36
NU17
CE92
5007
$67
,543
.31
$0.
00$
67,5
43.3
1
Indi
rect
To
tal
$67
,543
.31
$0.
00$
67,5
43.3
1
93.1
36 T
otal
$67
,543
.31
$0.
00$
67,5
43.3
1
Was
hing
ton
Stat
e De
part
men
t of S
ocia
l an
d He
alth
Ser
vice
sPr
ojec
ts fo
r Ass
istan
ce in
Tra
nsiti
on fr
om H
omel
essn
ess
(PAT
H)93
.150
SM
0160
48$
0.00
$24
4,99
4.59
$24
4,99
4.59
Indi
rect
To
tal
$0.
00$
244,
994.
59$
244,
994.
59
93.1
50 T
otal
$0.
00$
244,
994.
59$
244,
994.
59
The
note
s are
an
inte
gral
par
t of t
his
Sche
dule
Page 174

Fede
ral G
rant
or A
genc
yPa
ss-th
roug
h Ag
ency
Nam
eFe
dera
l Pro
gram
Nam
eCF
DA
Num
ber
Fede
ral A
war
d Id
entif
icat
ion
Num
ber
Ag
ency
Exp
endi
ture
s
Subr
ecip
ient
Ex
pend
iture
s
Tota
l Exp
endi
ture
sN
otes
KING
CO
UNTY
, WAS
HING
TON
SCHE
DULE
OF
EXPE
NDIT
URES
OF
FEDE
RAL A
WAR
DS
JANU
ARY
1, 2
019
THRO
UGH
DECE
MBE
R 31
, 201
9
Child
hood
Lead
Poi
soni
ng P
reve
ntio
n Pr
ojec
ts, S
tate
an
d Lo
cal C
hild
hood
Lead
Poi
soni
ng P
reve
ntio
n an
d Su
rvei
llanc
e of
Blo
od Le
ad Le
vels
in C
hild
ren
93.1
97
NUE2
EH00
1365
$41
7,39
9.95
$14
1,73
8.96
$55
9,13
8.91
Dire
ct T
otal
$
417,
399.
95$
141,
738.
96$
559,
138.
91
93.1
97 T
otal
$41
7,39
9.95
$14
1,73
8.96
$55
9,13
8.91
Was
hing
ton
Stat
e De
part
men
t of
Heal
thFa
mily
Pla
nnin
g Se
rvice
s93
.217
FP
HPA0
0646
2$
395,
076.
58$
0.00
$39
5,07
6.58
(3)
Was
hing
ton
Stat
e De
part
men
t of
Heal
thFa
mily
Pla
nnin
g Se
rvice
s93
.217
FP
HPA0
0635
9$
314,
543.
32$
0.00
$31
4,54
3.32
(3)
Indi
rect
To
tal
$70
9,61
9.90
$0.
00$
709,
619.
90
93.2
17 T
otal
$70
9,61
9.90
$0.
00$
709,
619.
90
Heal
th C
ente
r Pro
gram
Clu
ster
Heal
th C
are
Prog
ram
(Com
mun
ity H
ealth
Cen
ters
, M
igra
nt H
ealth
Cen
ters
, Hea
lth C
are
for t
he H
omel
ess,
and
Publ
ic Ho
usin
g Pr
imar
y Ca
re)
93.2
24
H80C
S000
56$
12,6
82,9
91.7
1$
123,
940.
54$
12,8
06,9
32.2
5(3
)
Dire
ct T
otal
$
12,6
82,9
91.7
1$
123,
940.
54$
12,8
06,9
32.2
5
Tota
l Hea
lth C
ente
r Pro
gram
Clu
ster
93.2
24 T
otal
$12
,682
,991
.71
$12
3,94
0.54
$12
,806
,932
.25
The
note
s are
an
inte
gral
par
t of t
his
Sche
dule
Page 175

Fede
ral G
rant
or A
genc
yPa
ss-th
roug
h Ag
ency
Nam
eFe
dera
l Pro
gram
Nam
eCF
DA
Num
ber
Fede
ral A
war
d Id
entif
icat
ion
Num
ber
Ag
ency
Exp
endi
ture
s
Subr
ecip
ient
Ex
pend
iture
s
Tota
l Exp
endi
ture
sN
otes
KING
CO
UNTY
, WAS
HING
TON
SCHE
DULE
OF
EXPE
NDIT
URES
OF
FEDE
RAL A
WAR
DS
JANU
ARY
1, 2
019
THRO
UGH
DECE
MBE
R 31
, 201
9
Subs
tanc
e Ab
use
and
Men
tal H
ealth
Ser
vice
s Pro
ject
s of
Regi
onal
and
Nat
iona
l Sig
nific
ance
93.2
43
H79S
P080
958
$18
9,94
3.14
$21
,579
.56
$21
1,52
2.70
Subs
tanc
e Ab
use
and
Men
tal H
ealth
Ser
vice
s Pro
ject
s of
Regi
onal
and
Nat
iona
l Sig
nific
ance
93.2
43
TI08
1494
$19
3,80
9.07
$11
4,51
7.82
$30
8,32
6.89
Subs
tanc
e Ab
use
and
Men
tal H
ealth
Ser
vice
s Pro
ject
s of
Regi
onal
and
Nat
iona
l Sig
nific
ance
93.2
43
SM06
3319
$21
,899
.52
$64
8,19
1.90
$67
0,09
1.42
Subs
tanc
e Ab
use
and
Men
tal H
ealth
Ser
vice
s Pro
ject
s of
Regi
onal
and
Nat
iona
l Sig
nific
ance
93.2
43
H79S
M08
0623
$54
,892
.72
$10
5,21
7.50
$16
0,11
0.22
Dire
ct T
otal
$
460,
544.
45$
889,
506.
78$
1,35
0,05
1.23
Was
hing
ton
Stat
e De
part
men
t of S
ocia
l an
d He
alth
Ser
vice
sSu
bsta
nce
Abus
e an
d M
enta
l Hea
lth S
ervi
ces P
roje
cts o
f Re
gion
al a
nd N
atio
nal S
igni
fican
ce93
.243
TI
0259
95$
0.00
$84
,983
.70
$84
,983
.70
Was
hing
ton
Stat
e De
part
men
t of S
ocia
l an
d He
alth
Ser
vice
sSu
bsta
nce
Abus
e an
d M
enta
l Hea
lth S
ervi
ces P
roje
cts o
f Re
gion
al a
nd N
atio
nal S
igni
fican
ce93
.243
SP
0201
55$
0.00
$4,
400.
00$
4,40
0.00
Was
hing
ton
Stat
e He
alth
Car
e Au
thor
itySu
bsta
nce
Abus
e an
d M
enta
l Hea
lth S
ervi
ces P
roje
cts o
f Re
gion
al a
nd N
atio
nal S
igni
fican
ce93
.243
TI
0255
70$
0.00
$20
,800
.00
$20
,800
.00
Indi
rect
To
tal
$0.
00$
110,
183.
70$
110,
183.
70
93.2
43 T
otal
$46
0,54
4.45
$99
9,69
0.48
$1,
460,
234.
93
Was
hing
ton
Stat
e De
part
men
t of
Heal
thIm
mun
izatio
n Co
oper
ativ
e Ag
reem
ents
93.2
68
NH23
IP92
2619
$18
5,09
1.87
$0.
00$
185,
091.
87
Was
hing
ton
Stat
e De
part
men
t of
Heal
thIm
mun
izatio
n Co
oper
ativ
e Ag
reem
ents
93.2
68
NH23
IP00
0762
$27
8,04
1.92
$0.
00$
278,
041.
92
Indi
rect
To
tal
$46
3,13
3.79
$0.
00$
463,
133.
79
93.2
68 T
otal
$46
3,13
3.79
$0.
00$
463,
133.
79
The
note
s are
an
inte
gral
par
t of t
his
Sche
dule
Page 176

Fede
ral G
rant
or A
genc
yPa
ss-th
roug
h Ag
ency
Nam
eFe
dera
l Pro
gram
Nam
eCF
DA
Num
ber
Fede
ral A
war
d Id
entif
icat
ion
Num
ber
Ag
ency
Exp
endi
ture
s
Subr
ecip
ient
Ex
pend
iture
s
Tota
l Exp
endi
ture
sN
otes
KING
CO
UNTY
, WAS
HING
TON
SCHE
DULE
OF
EXPE
NDIT
URES
OF
FEDE
RAL A
WAR
DS
JANU
ARY
1, 2
019
THRO
UGH
DECE
MBE
R 31
, 201
9
Vira
l Hep
atiti
s Pre
vent
ion
and
Cont
rol
93.2
70
U51P
S004
601
$39
4,68
0.22
$26
7,52
7.86
$66
2,20
8.08
Dire
ct T
otal
$
394,
680.
22$
267,
527.
86$
662,
208.
08
Was
hing
ton
Stat
e De
part
men
t of
Heal
thVi
ral H
epat
itis P
reve
ntio
n an
d Co
ntro
l93
.270
5N
U51P
S005
133
$54
,621
.00
$0.
00$
54,6
21.0
0
Indi
rect
To
tal
$54
,621
.00
$0.
00$
54,6
21.0
0
93.2
70 T
otal
$44
9,30
1.22
$26
7,52
7.86
$71
6,82
9.08
Teen
age
Preg
nanc
y Pr
even
tion
Prog
ram
93.2
97
TP2A
H000
031
$47
3,91
0.97
$66
0,23
9.82
$1,
134,
150.
79
Dire
ct T
otal
$
473,
910.
97$
660,
239.
82$
1,13
4,15
0.79
93.2
97 T
otal
$47
3,91
0.97
$66
0,23
9.82
$1,
134,
150.
79
Was
hing
ton
Stat
e De
part
men
t of
Heal
thPP
HF 2
018:
Offi
ce o
f Sm
okin
g an
d He
alth
-Nat
iona
l Sta
te-
Base
d To
bacc
o Co
ntro
l Pro
gram
s-Fi
nanc
ed in
par
t by
2018
Pre
vent
ion
and
Publ
ic He
alth
93.3
05
U58D
P006
004
$79
,948
.82
$0.
00$
79,9
48.8
2
Indi
rect
To
tal
$79
,948
.82
$0.
00$
79,9
48.8
2
93.3
05 T
otal
$79
,948
.82
$0.
00$
79,9
48.8
2
Was
hing
ton
Stat
e De
part
men
t of
Heal
thEp
idem
iolo
gy a
nd La
bora
tory
Cap
acity
for I
nfec
tious
Di
seas
es (E
LC)
93.3
23
NU50
CK00
0515
$5,
990.
37$
0.00
$5,
990.
37
Was
hing
ton
Stat
e De
part
men
t of
Heal
thEp
idem
iolo
gy a
nd La
bora
tory
Cap
acity
for I
nfec
tious
Di
seas
es (E
LC)
93.3
23
NU50
CK00
0388
$88
1,78
8.21
$0.
00$
881,
788.
21
Was
hing
ton
Stat
e De
part
men
t of
Heal
thEp
idem
iolo
gy a
nd La
bora
tory
Cap
acity
for I
nfec
tious
Di
seas
es (E
LC)
93.3
23
NU50
CK00
0383
/515
$13
5,97
8.38
$0.
00$
135,
978.
38
Indi
rect
To
tal
$1,
023,
756.
96$
0.00
$1,
023,
756.
96
93.3
23 T
otal
$1,
023,
756.
96$
0.00
$1,
023,
756.
96
The
note
s are
an
inte
gral
par
t of t
his
Sche
dule
Page 177

Fede
ral G
rant
or A
genc
yPa
ss-th
roug
h Ag
ency
Nam
eFe
dera
l Pro
gram
Nam
eCF
DA
Num
ber
Fede
ral A
war
d Id
entif
icat
ion
Num
ber
Ag
ency
Exp
endi
ture
s
Subr
ecip
ient
Ex
pend
iture
s
Tota
l Exp
endi
ture
sN
otes
KING
CO
UNTY
, WAS
HING
TON
SCHE
DULE
OF
EXPE
NDIT
URES
OF
FEDE
RAL A
WAR
DS
JANU
ARY
1, 2
019
THRO
UGH
DECE
MBE
R 31
, 201
9
Was
hing
ton
Stat
e De
part
men
t of
Heal
thPu
blic
Heal
th E
mer
genc
y Re
spon
se: C
oope
rativ
e Ag
reem
ent f
or E
mer
genc
y Re
spon
se: P
ublic
Hea
lth
Crisi
s Res
pons
e
93.3
54
NU90
TP92
1990
$49
9,39
8.07
$0.
00$
499,
398.
07
Indi
rect
To
tal
$49
9,39
8.07
$0.
00$
499,
398.
07
93.3
54 T
otal
$49
9,39
8.07
$0.
00$
499,
398.
07
Nurs
e Ed
ucat
ion,
Pra
ctice
Qua
lity
and
Rete
ntio
n Gr
ants
(N
EPQ
R)93
.359
UK
1HP3
1698
$63
7,69
1.85
$0.
00$
637,
691.
85
Dire
ct T
otal
$
637,
691.
85$
0.00
$63
7,69
1.85
93.3
59 T
otal
$63
7,69
1.85
$0.
00$
637,
691.
85
Was
hing
ton
Stat
e De
part
men
t of S
ocia
l an
d He
alth
Ser
vice
sCh
ild S
uppo
rt E
nfor
cem
ent
93.5
63
1804
WAC
SES
$2,
981,
470.
00$
0.00
$2,
981,
470.
00
Was
hing
ton
Stat
e De
part
men
t of S
ocia
l an
d He
alth
Ser
vice
sCh
ild S
uppo
rt E
nfor
cem
ent
93.5
63
1604
WAC
SES
$18
4,05
3.00
$0.
00$
184,
053.
00
Was
hing
ton
Stat
e De
part
men
t of S
ocia
l an
d He
alth
Ser
vice
sCh
ild S
uppo
rt E
nfor
cem
ent
93.5
63
2001
WAC
SES
$1,
593,
197.
00$
0.00
$1,
593,
197.
00
Was
hing
ton
Stat
e De
part
men
t of S
ocia
l an
d He
alth
Ser
vice
sCh
ild S
uppo
rt E
nfor
cem
ent
93.5
63
1901
WAC
SES
$1,
118,
956.
00$
0.00
$1,
118,
956.
00
Was
hing
ton
Stat
e De
part
men
t of S
ocia
l an
d He
alth
Ser
vice
sCh
ild S
uppo
rt E
nfor
cem
ent
93.5
63
1901
WAC
SES/
2001
WA
CSES
$26
1,35
7.00
$0.
00$
261,
357.
00
Indi
rect
To
tal
$6,
139,
033.
00$
0.00
$6,
139,
033.
00
93.5
63 T
otal
$6,
139,
033.
00$
0.00
$6,
139,
033.
00
Child
Abu
se a
nd N
egle
ct D
iscre
tiona
ry A
ctiv
ities
93.6
70
90CA
1825
$19
4,12
1.59
$0.
00$
194,
121.
59
Dire
ct T
otal
$
194,
121.
59$
0.00
$19
4,12
1.59
93.6
70 T
otal
$19
4,12
1.59
$0.
00$
194,
121.
59
The
note
s are
an
inte
gral
par
t of t
his
Sche
dule
Page 178

Fede
ral G
rant
or A
genc
yPa
ss-th
roug
h Ag
ency
Nam
eFe
dera
l Pro
gram
Nam
eCF
DA
Num
ber
Fede
ral A
war
d Id
entif
icat
ion
Num
ber
Ag
ency
Exp
endi
ture
s
Subr
ecip
ient
Ex
pend
iture
s
Tota
l Exp
endi
ture
sN
otes
KING
CO
UNTY
, WAS
HING
TON
SCHE
DULE
OF
EXPE
NDIT
URES
OF
FEDE
RAL A
WAR
DS
JANU
ARY
1, 2
019
THRO
UGH
DECE
MBE
R 31
, 201
9
PPHF
: Rac
ial a
nd E
thni
c App
roac
hes t
o Co
mm
unity
He
alth
Pro
gram
fina
nced
sole
ly b
y Pu
blic
Prev
entio
n an
d He
alth
Fun
ds
93.7
38
58DP
0065
83$
387,
282.
43$
344,
579.
27$
731,
861.
70
Dire
ct T
otal
$
387,
282.
43$
344,
579.
27$
731,
861.
70
93.7
38 T
otal
$38
7,28
2.43
$34
4,57
9.27
$73
1,86
1.70
Was
hing
ton
Stat
e De
part
men
t of
Heal
thPr
even
tive
Heal
th a
nd H
ealth
Ser
vice
s Blo
ck G
rant
fu
nded
sole
ly w
ith P
reve
ntio
n an
d Pu
blic
Heal
th F
unds
(P
PHF)
93.7
58
NB01
OT0
0923
4$
37,0
20.2
8$
0.00
$37
,020
.28
Indi
rect
To
tal
$37
,020
.28
$0.
00$
37,0
20.2
8
93.7
58 T
otal
$37
,020
.28
$0.
00$
37,0
20.2
8
Med
icaid
Clu
ster
Was
hing
ton
Stat
e He
alth
Car
e Au
thor
ityM
edica
l Ass
istan
ce P
rogr
am93
.778
16
05W
A5AD
M$
10,4
80.0
8$
0.00
$10
,480
.08
Was
hing
ton
Stat
e He
alth
Car
e Au
thor
ityM
edica
l Ass
istan
ce P
rogr
am93
.778
19
05W
A5AD
M$
4,82
1,55
6.10
$0.
00$
4,82
1,55
6.10
(8)
Indi
rect
To
tal
$4,
832,
036.
18$
0.00
$4,
832,
036.
18
Tota
l Med
icaid
Clu
ster
93.7
78 T
otal
$4,
832,
036.
18$
0.00
$4,
832,
036.
18
Was
hing
ton
Stat
e De
part
men
t of S
ocia
l an
d He
alth
Ser
vice
sO
pioi
d ST
R93
.788
TI
0802
49$
0.00
$19
9,74
0.00
$19
9,74
0.00
Was
hing
ton
Stat
e He
alth
Car
e Au
thor
ityO
pioi
d ST
R93
.788
TI
0817
05$
3,68
2.50
$36
,825
.00
$40
,507
.50
Indi
rect
To
tal
$3,
682.
50$
236,
565.
00$
240,
247.
50
93.7
88 T
otal
$3,
682.
50$
236,
565.
00$
240,
247.
50
The
note
s are
an
inte
gral
par
t of t
his
Sche
dule
Page 179
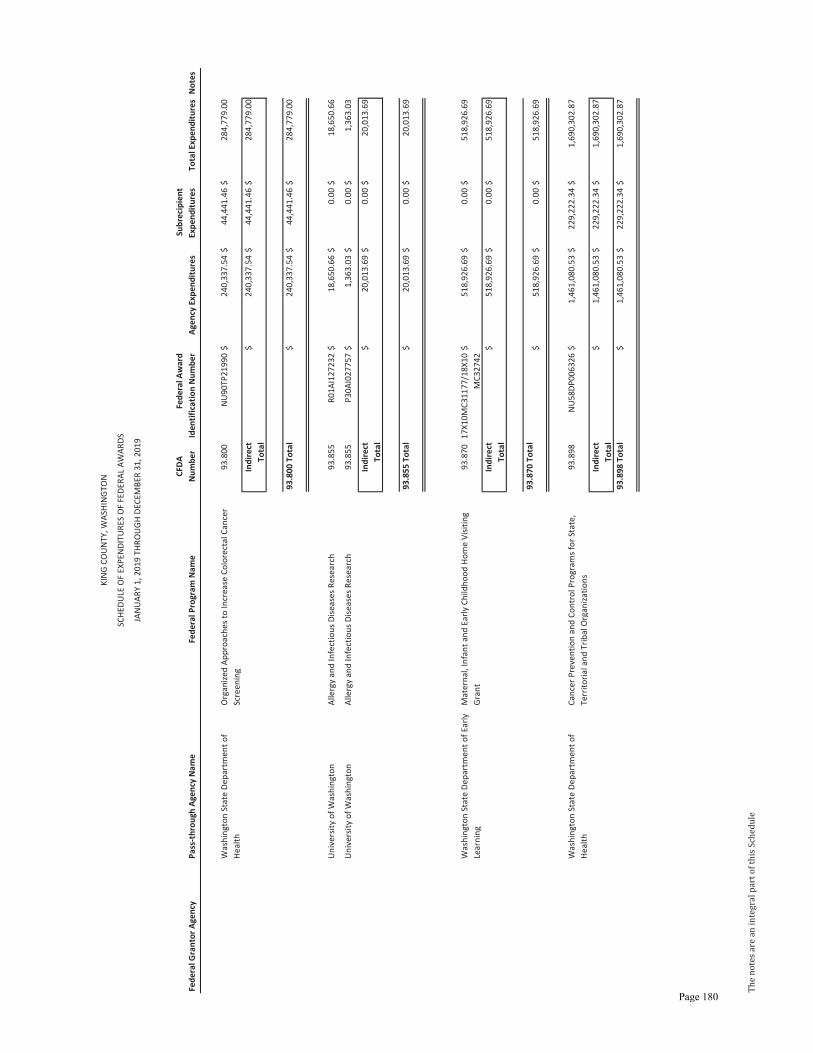
Fede
ral G
rant
or A
genc
yPa
ss-th
roug
h Ag
ency
Nam
eFe
dera
l Pro
gram
Nam
eCF
DA
Num
ber
Fede
ral A
war
d Id
entif
icat
ion
Num
ber
Ag
ency
Exp
endi
ture
s
Subr
ecip
ient
Ex
pend
iture
s
Tota
l Exp
endi
ture
sN
otes
KING
CO
UNTY
, WAS
HING
TON
SCHE
DULE
OF
EXPE
NDIT
URES
OF
FEDE
RAL A
WAR
DS
JANU
ARY
1, 2
019
THRO
UGH
DECE
MBE
R 31
, 201
9
Was
hing
ton
Stat
e De
part
men
t of
Heal
thO
rgan
ized
Appr
oach
es to
Incr
ease
Col
orec
tal C
ance
r Sc
reen
ing
93.8
00
NU90
TP21
990
$24
0,33
7.54
$44
,441
.46
$28
4,77
9.00
Indi
rect
To
tal
$24
0,33
7.54
$44
,441
.46
$28
4,77
9.00
93.8
00 T
otal
$24
0,33
7.54
$44
,441
.46
$28
4,77
9.00
Univ
ersit
y of
Was
hing
ton
Alle
rgy
and
Infe
ctio
us D
iseas
es R
esea
rch
93.8
55
R01A
I127
232
$18
,650
.66
$0.
00$
18,6
50.6
6
Univ
ersit
y of
Was
hing
ton
Alle
rgy
and
Infe
ctio
us D
iseas
es R
esea
rch
93.8
55
P30A
I027
757
$1,
363.
03$
0.00
$1,
363.
03
Indi
rect
To
tal
$20
,013
.69
$0.
00$
20,0
13.6
9
93.8
55 T
otal
$20
,013
.69
$0.
00$
20,0
13.6
9
Was
hing
ton
Stat
e De
part
men
t of E
arly
Le
arni
ngM
ater
nal,
Infa
nt a
nd E
arly
Chi
ldho
od H
ome
Visit
ing
Gran
t93
.870
17X
10M
C311
77/1
8X10
MC3
2742
$51
8,92
6.69
$0.
00$
518,
926.
69
Indi
rect
To
tal
$51
8,92
6.69
$0.
00$
518,
926.
69
93.8
70 T
otal
$51
8,92
6.69
$0.
00$
518,
926.
69
Was
hing
ton
Stat
e De
part
men
t of
Heal
thCa
ncer
Pre
vent
ion
and
Cont
rol P
rogr
ams f
or S
tate
, Te
rrito
rial a
nd T
ribal
Org
aniza
tions
93.8
98
NU58
DP00
6326
$1,
461,
080.
53$
229,
222.
34$
1,69
0,30
2.87
Indi
rect
To
tal
$1,
461,
080.
53$
229,
222.
34$
1,69
0,30
2.87
93.8
98 T
otal
$1,
461,
080.
53$
229,
222.
34$
1,69
0,30
2.87
The
note
s are
an
inte
gral
par
t of t
his
Sche
dule
Page 180

Fede
ral G
rant
or A
genc
yPa
ss-th
roug
h Ag
ency
Nam
eFe
dera
l Pro
gram
Nam
eCF
DA
Num
ber
Fede
ral A
war
d Id
entif
icat
ion
Num
ber
Ag
ency
Exp
endi
ture
s
Subr
ecip
ient
Ex
pend
iture
s
Tota
l Exp
endi
ture
sN
otes
KING
CO
UNTY
, WAS
HING
TON
SCHE
DULE
OF
EXPE
NDIT
URES
OF
FEDE
RAL A
WAR
DS
JANU
ARY
1, 2
019
THRO
UGH
DECE
MBE
R 31
, 201
9
HIV
Emer
genc
y Re
lief P
roje
ct G
rant
s93
.914
H8
9HA0
0022
$2,
191,
595.
72$
4,43
2,85
4.50
$6,
624,
450.
22
Dire
ct T
otal
$
2,19
1,59
5.72
$4,
432,
854.
50$
6,62
4,45
0.22
93.9
14 T
otal
$2,
191,
595.
72$
4,43
2,85
4.50
$6,
624,
450.
22
Univ
ersit
y of
Was
hing
ton
HIV
Prev
entio
n Ac
tiviti
es N
on-G
over
nmen
tal
Org
aniza
tion
Base
d93
.939
U6
5PS0
0438
7$
12,6
09.1
0$
0.00
$12
,609
.10
Indi
rect
To
tal
$12
,609
.10
$0.
00$
12,6
09.1
0
93.9
39 T
otal
$12
,609
.10
$0.
00$
12,6
09.1
0
Was
hing
ton
Stat
e De
part
men
t of
Heal
thHI
V Pr
even
tion
Activ
ities
Hea
lth D
epar
tmen
t Bas
ed93
.940
NU
62PS
9245
28$
1,74
6,65
6.50
$0.
00$
1,74
6,65
6.50
Indi
rect
To
tal
$1,
746,
656.
50$
0.00
$1,
746,
656.
50
93.9
40 T
otal
$1,
746,
656.
50$
0.00
$1,
746,
656.
50
Was
hing
ton
Stat
e De
part
men
t of
Heal
thHu
man
Imm
unod
efici
ency
Viru
s (HI
V)/A
cqui
red
Imm
unod
efici
ency
Viru
s Syn
drom
e (A
IDS)
Sur
veill
ance
93.9
44
NU62
PS00
4966
$40
7,47
8.46
$0.
00$
407,
478.
46
Was
hing
ton
Stat
e De
part
men
t of
Heal
thHu
man
Imm
unod
efici
ency
Viru
s (HI
V)/A
cqui
red
Imm
unod
efici
ency
Viru
s Syn
drom
e (A
IDS)
Sur
veill
ance
93.9
44
NU62
PS00
5094
$1,
382,
353.
39$
0.00
$1,
382,
353.
39
Indi
rect
To
tal
$1,
789,
831.
85$
0.00
$1,
789,
831.
85
93.9
44 T
otal
$1,
789,
831.
85$
0.00
$1,
789,
831.
85
The
note
s are
an
inte
gral
par
t of t
his
Sche
dule
Page 181

Fede
ral G
rant
or A
genc
yPa
ss-th
roug
h Ag
ency
Nam
eFe
dera
l Pro
gram
Nam
eCF
DA
Num
ber
Fede
ral A
war
d Id
entif
icat
ion
Num
ber
Ag
ency
Exp
endi
ture
s
Subr
ecip
ient
Ex
pend
iture
s
Tota
l Exp
endi
ture
sN
otes
KING
CO
UNTY
, WAS
HING
TON
SCHE
DULE
OF
EXPE
NDIT
URES
OF
FEDE
RAL A
WAR
DS
JANU
ARY
1, 2
019
THRO
UGH
DECE
MBE
R 31
, 201
9
Was
hing
ton
Stat
e De
part
men
t of S
ocia
l an
d He
alth
Ser
vice
sBl
ock
Gran
ts fo
r Com
mun
ity M
enta
l Hea
lth S
ervi
ces
93.9
58
SM01
0056
$28
7,41
2.45
$1,
529,
852.
65$
1,81
7,26
5.10
Was
hing
ton
Stat
e He
alth
Car
e Au
thor
ityBl
ock
Gran
ts fo
r Com
mun
ity M
enta
l Hea
lth S
ervi
ces
93.9
58
SM01
0056
-01
$0.
00$
455,
120.
00$
455,
120.
00
Indi
rect
To
tal
$28
7,41
2.45
$1,
984,
972.
65$
2,27
2,38
5.10
93.9
58 T
otal
$28
7,41
2.45
$1,
984,
972.
65$
2,27
2,38
5.10
Was
hing
ton
Stat
e De
part
men
t of S
ocia
l an
d He
alth
Ser
vice
sBl
ock
Gran
ts fo
r Pre
vent
ion
and
Trea
tmen
t of S
ubst
ance
Ab
use
93.9
59
Tl01
0056
$23
7,61
8.98
$85
3,83
6.75
$1,
091,
455.
73
Was
hing
ton
Stat
e De
part
men
t of S
ocia
l an
d He
alth
Ser
vice
sBl
ock
Gran
ts fo
r Pre
vent
ion
and
Trea
tmen
t of S
ubst
ance
Ab
use
93.9
59
SM01
0056
$0.
00$
3,16
0,95
6.24
$3,
160,
956.
24
Was
hing
ton
Stat
e He
alth
Car
e Au
thor
ityBl
ock
Gran
ts fo
r Pre
vent
ion
and
Trea
tmen
t of S
ubst
ance
Ab
use
93.9
59
TI01
0056
$0.
00$
374,
675.
00$
374,
675.
00
Indi
rect
To
tal
$23
7,61
8.98
$4,
389,
467.
99$
4,62
7,08
6.97
93.9
59 T
otal
$23
7,61
8.98
$4,
389,
467.
99$
4,62
7,08
6.97
Was
hing
ton
Stat
e De
part
men
t of
Heal
thSe
xual
ly T
rans
mitt
ed D
iseas
es (S
TD) P
reve
ntio
n an
d Co
ntro
l Gra
nts
93.9
77
NH25
PS00
5146
$51
8,80
8.41
$0.
00$
518,
808.
41
Was
hing
ton
Stat
e De
part
men
t of
Heal
thSe
xual
ly T
rans
mitt
ed D
iseas
es (S
TD) P
reve
ntio
n an
d Co
ntro
l Gra
nts
93.9
77
NH25
PS00
4271
/NH2
5PS
0051
85$
108,
988.
61$
0.00
$10
8,98
8.61
Indi
rect
To
tal
$62
7,79
7.02
$0.
00$
627,
797.
02
93.9
77 T
otal
$62
7,79
7.02
$0.
00$
627,
797.
02
Was
hing
ton
Stat
e De
part
men
t of
Heal
thM
ater
nal a
nd C
hild
Hea
lth S
ervi
ces B
lock
Gra
nt to
the
Stat
es93
.994
B0
4MC3
2578
$1,
082,
532.
84$
15,8
37.9
3$
1,09
8,37
0.77
Indi
rect
To
tal
$1,
082,
532.
84$
15,8
37.9
3$
1,09
8,37
0.77
93.9
94 T
otal
$1,
082,
532.
84$
15,8
37.9
3$
1,09
8,37
0.77
Depa
rtm
ent o
f Hea
lth a
nd H
uman
Ser
vice
s$
42,2
38,6
33.3
6$
14,2
70,5
82.6
0$
56,5
09,2
15.9
6
The
note
s are
an
inte
gral
par
t of t
his
Sche
dule
Page 182

Fede
ral G
rant
or A
genc
yPa
ss-th
roug
h Ag
ency
Nam
eFe
dera
l Pro
gram
Nam
eCF
DA
Num
ber
Fede
ral A
war
d Id
entif
icat
ion
Num
ber
Ag
ency
Exp
endi
ture
s
Subr
ecip
ient
Ex
pend
iture
s
Tota
l Exp
endi
ture
sN
otes
KING
CO
UNTY
, WAS
HING
TON
SCHE
DULE
OF
EXPE
NDIT
URES
OF
FEDE
RAL A
WAR
DS
JANU
ARY
1, 2
019
THRO
UGH
DECE
MBE
R 31
, 201
9
Depa
rtm
ent o
f Hom
elan
d Se
curit
y
Was
hing
ton
Stat
e De
part
men
t of P
arks
Boat
ing
Safe
ty F
inan
cial A
ssist
ance
97.0
12
3316
FAS1
6015
3$
24,5
91.0
0$
0.00
$24
,591
.00
Indi
rect
To
tal
$24
,591
.00
$0.
00$
24,5
91.0
0
97.0
12 T
otal
$24
,591
.00
$0.
00$
24,5
91.0
0
Was
hing
ton
Stat
e M
ilita
ry D
epar
tmen
tDi
sast
er G
rant
s - P
ublic
Ass
istan
ce (P
resid
entia
lly
Decla
red
Disa
ster
s)97
.036
FE
MA-
4309
-DR-
WA
$40
,865
.54
$0.
00$
40,8
65.5
4(7
)
Was
hing
ton
Stat
e M
ilita
ry D
epar
tmen
tDi
sast
er G
rant
s - P
ublic
Ass
istan
ce (P
resid
entia
lly
Decla
red
Disa
ster
s)97
.036
FE
MA-
1963
-DR-
WA
$79
,083
.22
$0.
00$
79,0
83.2
2(7
)
Indi
rect
To
tal
$11
9,94
8.76
$0.
00$
119,
948.
76
97.0
36 T
otal
$11
9,94
8.76
$0.
00$
119,
948.
76
Was
hing
ton
Stat
e M
ilita
ry D
epar
tmen
tHa
zard
Miti
gatio
n Gr
ant
97.0
39
FEM
A DR
-430
9-15
-P$
51,6
91.2
0$
0.00
$51
,691
.20
Indi
rect
To
tal
$51
,691
.20
$0.
00$
51,6
91.2
0
97.0
39 T
otal
$51
,691
.20
$0.
00$
51,6
91.2
0
Was
hing
ton
Stat
e M
ilita
ry D
epar
tmen
tEm
erge
ncy
Man
agem
ent P
erfo
rman
ce G
rant
s97
.042
EM
S-20
18-E
P-00
004
$22
9,18
0.66
$0.
00$
229,
180.
66(7
)
Was
hing
ton
Stat
e M
ilita
ry D
epar
tmen
tEm
erge
ncy
Man
agem
ent P
erfo
rman
ce G
rant
s97
.042
EM
S-20
19-E
P-00
003
$80
,476
.16
$0.
00$
80,4
76.1
6
Indi
rect
To
tal
$30
9,65
6.82
$0.
00$
309,
656.
82
97.0
42 T
otal
$30
9,65
6.82
$0.
00$
309,
656.
82
The
note
s are
an
inte
gral
par
t of t
his
Sche
dule
Page 183

Fede
ral G
rant
or A
genc
yPa
ss-th
roug
h Ag
ency
Nam
eFe
dera
l Pro
gram
Nam
eCF
DA
Num
ber
Fede
ral A
war
d Id
entif
icat
ion
Num
ber
Ag
ency
Exp
endi
ture
s
Subr
ecip
ient
Ex
pend
iture
s
Tota
l Exp
endi
ture
sN
otes
KING
CO
UNTY
, WAS
HING
TON
SCHE
DULE
OF
EXPE
NDIT
URES
OF
FEDE
RAL A
WAR
DS
JANU
ARY
1, 2
019
THRO
UGH
DECE
MBE
R 31
, 201
9
Was
hing
ton
Stat
e M
ilita
ry D
epar
tmen
tPr
e-Di
sast
er M
itiga
tion
97.0
47
EMS-
2017
-PC-
0003
$97
,145
.07
$0.
00$
97,1
45.0
7
Indi
rect
To
tal
$97
,145
.07
$0.
00$
97,1
45.0
7
97.0
47 T
otal
$97
,145
.07
$0.
00$
97,1
45.0
7
Port
Sec
urity
Gra
nt P
rogr
am97
.056
EM
W-2
018-
PU-0
0266
$17
4,07
3.99
$0.
00$
174,
073.
99
Dire
ct T
otal
$
174,
073.
99$
0.00
$17
4,07
3.99
97.0
56 T
otal
$17
4,07
3.99
$0.
00$
174,
073.
99
Was
hing
ton
Stat
e M
ilita
ry D
epar
tmen
tHo
mel
and
Secu
rity
Gran
t Pro
gram
97.0
67
EMW
-201
8-SS
-000
88$
487,
401.
03$
236,
479.
46$
723,
880.
49
Was
hing
ton
Stat
e M
ilita
ry D
epar
tmen
tHo
mel
and
Secu
rity
Gran
t Pro
gram
97.0
67
EMW
-201
6-SS
-000
05$
130,
970.
01$
13,8
40.6
8$
144,
810.
69
Was
hing
ton
Stat
e M
ilita
ry D
epar
tmen
tHo
mel
and
Secu
rity
Gran
t Pro
gram
97.0
67
EMW
-201
7-SS
-001
01$
729,
539.
99$
522,
064.
31$
1,25
1,60
4.30
Indi
rect
To
tal
$1,
347,
911.
03$
772,
384.
45$
2,12
0,29
5.48
97.0
67 T
otal
$1,
347,
911.
03$
772,
384.
45$
2,12
0,29
5.48
Rail
and
Tran
sit S
ecur
ity G
rant
Pro
gram
97.0
75
EMW
-201
8-RA
-000
35$
741,
703.
00$
0.00
$74
1,70
3.00
Rail
and
Tran
sit S
ecur
ity G
rant
Pro
gram
97.0
75
EMW
-201
7-RA
-000
30$
228,
726.
00$
0.00
$22
8,72
6.00
Dire
ct T
otal
$
970,
429.
00$
0.00
$97
0,42
9.00
97.0
75 T
otal
$97
0,42
9.00
$0.
00$
970,
429.
00
Prep
arin
g fo
r Em
ergi
ng T
hrea
ts a
nd H
azar
ds97
.133
EM
W-2
016-
GR-0
0145
$39
9,14
6.38
$38
2,75
1.19
$78
1,89
7.57
Dire
ct T
otal
$
399,
146.
38$
382,
751.
19$
781,
897.
57
97.1
33 T
otal
$39
9,14
6.38
$38
2,75
1.19
$78
1,89
7.57
Depa
rtm
ent o
f Hom
elan
d Se
curit
y$
3,49
4,59
3.25
$1,
155,
135.
64$
4,64
9,72
8.89
The
note
s are
an
inte
gral
par
t of t
his
Sche
dule
Page 184

Fede
ral G
rant
or A
genc
yPa
ss-th
roug
h Ag
ency
Nam
eFe
dera
l Pro
gram
Nam
eCF
DA
Num
ber
Fede
ral A
war
d Id
entif
icat
ion
Num
ber
Agen
cy E
xpen
ditu
res
Subr
ecip
ient
Ex
pend
iture
sTo
tal E
xpen
ditu
res
Not
es
KING
CO
UNTY
, WAS
HING
TON
SCHE
DULE
OF
EXPE
NDIT
URES
OF
FEDE
RAL A
WAR
DS
JANU
ARY
1, 2
019
THRO
UGH
DECE
MBE
R 31
, 201
9
Stat
e Ju
stice
Inst
itute
Cour
t Cle
rk W
orkl
oad
Asse
ssm
ent
99.U
01SJ
I-18-
T-01
0$
21,8
88.4
3$
0.00
$21
,888
.43
Dire
ct T
otal
$
21,8
88.4
3$
0.00
$21
,888
.43
99.U
01
Tota
l$
21,8
88.4
3$
0.00
$21
,888
.43
Stat
e Ju
stice
Inst
itute
$21
,888
.43
$0.
00$
21,8
88.4
3
Gran
d To
tal
$15
6,51
5,36
0.45
$48
,000
,704
.24
$20
4,51
6,06
4.69
The
note
s are
an
inte
gral
par
t of t
his
Sche
dule
Page 185

Fede
ral G
rant
or A
genc
yPa
ss-th
roug
h Ag
ency
Nam
eFe
dera
l Pro
gram
Nam
eCF
DA
Num
ber
Fede
ral A
war
d Id
entif
icat
ion
Num
ber
Agen
cy E
xpen
ditu
res
Subr
ecip
ient
Ex
pend
iture
sTo
tal E
xpen
ditu
res
Not
es
KING
CO
UNTY
, WAS
HING
TON
SCHE
DULE
OF
EXPE
NDIT
URES
OF
FEDE
RAL A
WAR
DS
JANU
ARY
1, 2
019
THRO
UGH
DECE
MBE
R 31
, 201
9
Note
s
(9)
The
Cou
nty’
s Dep
artm
ent o
f Com
mun
ity a
nd H
uman
Ser
vice
s mak
es lo
ans t
o de
velo
pers
and
non
-pro
fit o
rgan
izat
ions
for t
he p
urch
ase
and
reha
bilit
atio
n of
exi
stin
g bu
ildin
gs o
r new
con
stru
ctio
n of
affo
rdab
le h
ousi
ng u
nits
. Som
e of
the
fund
ing
for t
hese
loan
s com
e fr
om F
eder
al so
urce
s fro
m th
e H
OM
E In
vest
men
t Par
tner
ship
s Pr
ogra
m (H
OM
E), a
nd th
e Co
mm
unity
Dev
elop
men
t Blo
ck G
rant
(CD
BG).
The
Coun
ty’s
resp
onsi
bilit
y ov
er th
ese
loan
s is t
o en
sure
that
a
spec
ified
per
cent
age
of to
tal r
enta
l uni
ts a
re re
nted
to lo
w-in
com
e in
divi
dual
s. T
he b
alan
ce o
f the
loan
s out
stan
ding
as o
f Dec
embe
r 31,
201
9 co
nsis
ts o
f:H
OM
E67
,053
,234
.54
CDBG
11,0
88,1
23.4
378
,141
,357
.97
(10)
Fed
eral
Loa
ns.
No
proc
eeds
wer
e us
ed d
urin
g th
e ye
ar. T
he C
ount
y w
as a
ppro
ved
by th
e EP
A to
rece
ive
a lo
an to
talin
g $1
34,5
00,0
00 to
impr
ove
its w
aste
wat
er in
fras
truc
ture
. The
Wat
er In
fras
truc
ture
Fin
ance
and
Inno
vatio
nAc
t (W
IFIA
) pro
gram
acc
eler
ates
inve
stm
ent i
n ou
r nat
ion’
s w
ater
and
was
tew
ater
infr
astr
uctu
re b
y pr
ovid
ing
long
-ter
m, l
ow-c
ost,
supp
lem
enta
l cre
dit a
ssis
tanc
e un
der c
usto
miz
ed te
rms
to c
redi
twor
thy
wat
er a
nd w
aste
wat
er
proj
ects
of n
atio
nal a
nd re
gion
al si
gnifi
canc
e. F
or F
Y18,
the
Coun
ty re
port
ed $
59,6
96,8
38.5
3 co
sts
on th
eir F
Y18
SEFA
.
(11)
Pre
awar
d co
sts.
Alth
ough
the
gran
t has
not
bee
n aw
arde
d ye
t by
the
Fede
ral T
rans
it Ad
min
istr
atio
n, K
ing
Coun
ty M
etro
Tra
nsit
man
agem
ent c
onsi
ders
reim
burs
emen
thes
e ex
pend
iture
s to
be c
erta
in b
ased
on
hist
oric
al tr
ends
and
expe
rien
ce. T
here
fore
, the
pre
-aw
ard
cost
s ha
ve b
een
reco
rded
in th
e ye
ar in
curr
ed.
(3)
Pro
gram
Inco
me.
The
se p
rogr
ams
gene
rate
inco
me
used
to c
over
exp
ense
s. F
or o
nly
HOM
E an
d CD
BG p
rogr
ams,
Not
e 3
rela
tes t
o pr
ogra
m in
com
e on
def
erre
d pa
ymen
t loa
ns -
The
Cou
nty
has a
def
erre
d pa
ymen
t loa
n pr
ogra
m
for l
ow in
com
e ho
usin
g re
pair
s. Th
e am
ount
of l
oan
fund
s di
sbur
sed
to p
rogr
am p
artic
ipan
ts fo
r the
yea
r was
$95
1,11
2 an
d is
pre
sent
ed in
this
sch
edul
e. T
he a
mou
nt o
f pro
gram
inco
me
and
inte
rest
rece
ived
in lo
an re
paym
ents
for t
he
year
was
$78
1,93
2.
(4)
Indi
rect
cos
t rat
e pl
ans.
The
Coun
ty d
id n
ot e
lect
to u
se th
e 10
% d
emin
imus
rate
but
inst
ead
deve
lops
indi
rect
cos
t rat
e pl
ans
for i
ndiv
idua
l dep
artm
ents
and
div
isio
ns.
(5)
Fed
eral
Gra
nt. S
tate
Rev
olvi
ng L
oan
Fund
. The
out
stan
ding
bal
ance
s are
not
repo
rted
for t
hese
loan
s. T
he D
NRP
Was
te W
ater
Tre
atm
ent d
ivis
ion
rece
ived
a n
ew lo
an e
ffect
ive
7/1/
2019
for t
he G
eorg
etow
n pr
ojec
t. Th
e or
igin
allo
an a
gree
men
t has
bee
n am
ende
d to
refle
ct th
e ad
ditio
nal o
f new
loan
fund
s, fe
dera
l fun
ding
dis
trib
utio
n of
$27
,631
,000
and
stat
e fu
ndin
g di
stri
butio
n of
$9,
510,
994.
The
loan
agr
eem
ent h
as n
ot b
een
sign
ed y
et a
nd w
ill b
e go
ing
thro
ugh
the
coun
cil o
rdin
ance
pro
cess
to a
men
d or
dina
nce
for t
he o
rigi
nal l
oan.
Exp
endi
ture
s for
the
fede
ral p
ortio
n re
pres
ents
con
stru
ctio
n co
ntra
cts
desi
gnat
ed to
this
loan
for F
Y 20
19.
(6)
Prio
r yea
r's
expe
nditu
res a
re re
port
ed in
this
SEF
A. T
hey
wer
e no
t rep
orte
d on
pri
or y
ear'
s SEF
As.
(7)
Expe
nditu
res a
re re
port
ed o
n th
is y
ear'
s SEF
A du
e to
the
unce
rtai
nty
of fu
ndin
g st
atus
in th
e pr
ior y
ear.
They
wer
e no
t rep
orte
d on
pri
or y
ear'
s SEF
As.
(8)
Per
gui
danc
e re
ceiv
ed fr
om th
e St
ate
Audi
tor'
s O
ffice
and
from
the
gran
tor (
Hea
lth C
are
Auth
ority
), PH
SKC
is re
port
ing
the
reve
nues
reco
rded
in 2
019
for t
he M
edic
aid
Adm
inis
trat
ive
Clai
min
g (M
AC) p
rogr
am, r
athe
r tha
n th
e ex
pend
iture
s. Pe
r the
gui
danc
e re
ceiv
ed in
201
6, "r
egar
dles
s of
the
date
the
reim
burs
emen
t is
actu
ally
rece
ived
and
rega
rdle
ss o
f the
tim
e pe
riod
cov
ered
by
the
requ
est..
.all
reim
burs
emen
t req
uest
s su
bmitt
ed d
urin
g 20
16 w
ill b
e re
port
ed o
n th
e 20
16 S
EFA.
" Dur
ing
the
2019
fisc
al y
ear,
PHSK
C su
bmitt
ed re
imbu
rsem
ent r
eque
sts
tota
ling
$5,8
80,9
31.7
4 fo
r the
MAC
pro
gram
. How
ever
, of t
his,
$1,0
59,3
75.6
4 w
as b
illed
dur
ing
the
2020
cal
enda
r yea
r. As
suc
h, th
ese
will
nee
d to
get
exc
lude
d fr
om th
e 20
19 S
EFA,
and
will
be
repo
rtab
le o
n th
e 20
20 S
EFA.
Thi
s re
sults
in $
4,82
1,55
6.10
of r
even
ues
to re
port
on
the
2019
SEF
A. A
s su
ch, w
e ha
ve e
nter
ed th
e co
rres
pond
ing
SEFA
adj
ustm
ents
to re
flect
th
is.
(1)
Bas
is o
f Acc
ount
ing.
The
SEF
A is
pre
pare
d on
the
sam
e ba
sis
of a
ccou
ntin
g as
the
coun
ty's
fina
ncia
l sta
tem
ents
. The
cou
nty'
s fin
anci
al s
tate
men
ts a
re p
repa
red
on a
mod
ified
acc
rual
or f
ull a
ccru
al b
asis
, dep
endi
ng o
n th
e ty
pe o
ffu
nd.
(2)
Prog
ram
Cos
ts. T
he a
mou
nts
show
n as
cur
rent
yea
r exp
endi
ture
s rep
rese
nt o
nly
the
fede
ral p
ortio
n of
pro
gram
cost
s. Th
e fu
ll co
st m
ay in
clud
e st
ate
or lo
cal f
unds
in a
dditi
on to
the
amou
nts
show
n.
Page 186

Office of the Washington State Auditor
Finance & Business Operations Division Department of Executive Services
Chinook Building, CNK-ES-0300 401 Fifth Avenue
Seattle, WA 98104
(206) 263-9258
(206) 263-7670 Fax
www.kingcounty.gov
CORRECTIVE ACTION PLAN FOR FINDINGS REPORTED UNDER
UNIFORM GUIDANCE
King County
January 1, 2019 through December 31, 2019
This schedule presents the corrective action planned by the County for findings reported in this
report in accordance with Title 2 U.S. Code of Federal Regulations (CFR) Part 200, Uniform
Administrative Requirements, Cost Principles, and Audit Requirements for Federal Awards
(Uniform Guidance).
Finding ref number:
2019-001
Finding caption:
The County’s internal controls over accounting and financial statement
preparation were inadequate to ensure accurate and complete financial
reporting of fiduciary activities.
Name, address, and telephone of County’s contact person:
Cheryl Lee, Chief Accountant
Financial Management Section
Finance and Business Operations Division
500 Fourth Avenue, Room 650
Seattle, WA 98104
(206) 263-8595
Corrective action the auditee plans to take in response to the finding:
The County corrected the presentation concern in the Fiduciary Statements raised by the Auditor
in its 2019 Comprehensive Annual Financial Report (CAFR) prior to issuance. The County will
increase its internal controls over the implementation of new GASB standards, and will consider
using private sector accounting firms to assist with future large, complex pronouncements.
Anticipated date to complete the corrective action: 6/30/2021
Page 187

Office of the Washington State Auditor
Finding ref number:
2019-002
Finding caption:
The County improperly charged the program for expenditures
incurred outside the period of performance. In addition, the County
did not have adequate internal controls to ensure compliance with
federal suspension and debarment requirements.
Name, address, and telephone of County contact person:
Cheryl Lee, Chief Accountant
Financial Management Section
Finance and Business Operations Division
500 Fourth Avenue, Room 650
Seattle, WA 98104
(206) 263-8595
Corrective action the auditee plans to take in response to the finding:
We agree with the finding and recommendations and have taken the following actions:
Period of Performance
Effective October 1, 2020, the County required all Continuum of Care subrecipients to
clearly provide the pay periods included in their request for payment. Additionally, the
County will be amending subrecipient contracts to clearly state that all charges, including
payroll, must fall within the grant period of performance. Lastly, the County staff who
manage and administer this grant, will review all invoice service and/or purchase dates
against the grant start and end dates. This will ensure that charges from another grant
period are not included. The process was implemented in the fourth quarter of 2020.
Suspension and debarment
The County would like to emphasize that there was only one contract in the audit selection
that did not include a suspension and debarment clause and did not follow established
procedures. This was an isolated incident. In this particular case, the local government
acting as a subrecipient was the City of Seattle. The verification process to confirm that
the City of Seattle was not suspended or debarred was completed in the fourth quarter of
2020. The County has trained all divisional grants administrators to follow federal
requirements for suspension and debarment.
Anticipated date to complete the corrective action: December 2020
Page 188

Office of the Washington State Auditor
ABOUT THE STATE AUDITOR’S OFFICE
The State Auditor’s Office is established in the state’s Constitution and is part of the executive
branch of state government. The State Auditor is elected by the citizens of Washington and serves
four-year terms.
We work with our audit clients and citizens to achieve our vision of government that works for
citizens, by helping governments work better, cost less, deliver higher value, and earn greater
public trust.
In fulfilling our mission to hold state and local governments accountable for the use of public
resources, we also hold ourselves accountable by continually improving our audit quality and
operational efficiency and developing highly engaged and committed employees.
As an elected agency, the State Auditor’s Office has the independence necessary to objectively
perform audits and investigations. Our audits are designed to comply with professional standards
as well as to satisfy the requirements of federal, state, and local laws.
Our audits look at financial information and compliance with state, federal and local laws on the
part of all local governments, including schools, and all state agencies, including institutions of
higher education. In addition, we conduct performance audits of state agencies and local
governments as well as fraud, state whistleblower and citizen hotline investigations.
The results of our work are widely distributed through a variety of reports, which are available on
our website and through our free, electronic subscription service.
We take our role as partners in accountability seriously, and provide training and technical
assistance to governments, and have an extensive quality assurance program.
Contact information for the State Auditor’s Office
Public Records requests [email protected]
Main telephone (564) 999-0950
Toll-free Citizen Hotline (866) 902-3900
Website www.sao.wa.gov
Page 189