Embed Size (px)
Citation preview

FUGRO N.V. ANNUAL REPORT 2017 101
FINANCIAL STATEMENTS 2017
1 Consolidated statement of
comprehensive income 102
2 Consolidated statement of financial position 104
3 Consolidated statement of changes in equity 106
4 Consolidated statement of cash flows 108
5 Notes to the consolidated financial statements 110
6 Subsidiaries and investments accounted
for using the equity method of Fugro N.V. 175
7 Company balance sheet 177
8 Company income statement 178
9 Notes to the company financial statements 179
OTHER INFORMATION
Independent auditor’s report 183
Foundation Boards 190
Statutory provisions regarding the
appropriation of net result 190
Report of Stichting Administratiekantoor Fugro
(‘Foundation Trust Office’) 191
Historical review 194
Glossary 196
Key figures
Message from the CEO
Profile
Strategy
Divisional Performance
Group Performance
Governance
Report of the Supervisory Board
Financial Statements
Other Information

102 FUGRO N.V. ANNUAL REPORT 2017
(EUR x 1,000) 2017 2016
(5.26) Revenue 1,497,392 1,775,874
(5.29) Third party costs (621,936) (678,757)
Net revenue own services (revenue less third party costs) 875,456 1,097,117
(5.30) Other income 31,802 30,403
(5.31) Personnel expenses (629,572) (694,436)
(5.37) Depreciation (126,942) (172,366)
(5.38) Amortisation (6,060) (8,562)
(5.32) Impairments (164) (192,716)
(5.33) Other expenses (196,242) (278,118)
Results from operating activities (EBIT) (51,722) (218,678)
Finance income 5,408 8,880
Finance expenses (76,147) (79,810)
(5.34) Net finance income/(expenses) (70,739) (70,930)
(5.39) Share of profit/(loss) of equity-accounted investees (net of income tax) 4,712 (2,223)
Profit/(loss) before income tax (117,749) (291,831)
(5.35) Income tax gain/(expense) (47,595) (9,152)
Profit/(loss) for the period from continuing operations (165,344) (300,983)
(5.51) Profit/(loss) for the period from discontinued operations 5,070 -
Profit/(loss) for the period (160,274) (300,983)
Attributable to:
Owners of the company (net result) (159,901) (308,934)
(5.48) Non-controlling interests (373) 7,951
Profit/(loss) for the period (160,274) (300,983)
Earnings per share from continuing and discontinued operations
(attributable to owners of the company during the period)
(5.47) Basic and diluted earnings per share from continuing operations (2.04) (3.82)
(5.47) Basic and diluted earnings per share from discontinued operations 0.06 -
The notes on pages 110 to 182 are an integral part of these consolidated financial statements.
1 CONSOLIDATED STATEMENT OF COMPREHENSIVE INCOME
For the year ended 31 December
Key figures
Message from the CEO
Profile
Strategy
Divisional Performance
Group Performance
Governance
Report of the Supervisory Board
Financial Statements
Other Information

FUGRO N.V. ANNUAL REPORT 2017 103
1 CONSOLIDATED STATEMENT OF COMPREHENSIVE INCOME (CONTINUED)
For the year ended 31 December
(EUR x 1,000) 2017 2016
Profit/(loss) for the period (160,274) (300,983)
Other comprehensive incomeItems that will not be reclassified to profit or loss
(5.50) Defined benefit plan actuarial gains/(losses) 17,025 (14,145)
Total items that will not be reclassified to profit or loss 17,025 (14,145)
Items that may be reclassified subsequently to profit or loss
(5.34) Foreign currency translation differences of foreign operations (116,498) 26,935
(5.34) Foreign currency translation differences of equity-accounted investees (835) (1,425)
(5.34) Net change in fair value of hedge of net investment in foreign operations 16,117 5,079
(5.34) Net change in fair value of cash flow hedges transferred to profit or loss 103 288
(5.34) Net change in fair value of available-for-sale financial assets 218 34
Total items that may be reclassified subsequently to profit or loss (100,895) 30,911
Total other comprehensive income for the period (net of tax) (83,870) 16,766
Total comprehensive income/(loss) for the period (244,144) (284,217)
Attributable to:
Owners of the company (237,738) (295,447)
Non-controlling interests (6,406) 11,230
Total comprehensive income/(loss) for the period (244,144) (284,217)
Total comprehensive income attributable to owners of the company arises from:
Continuing operations (242,808) (295,447)
Discontinued operations 5,070 -
(237,738) (295,447)
The notes on pages 110 to 182 are an integral part of these consolidated financial statements.
Key figures
Message from the CEO
Profile
Strategy
Divisional Performance
Group Performance
Governance
Report of the Supervisory Board
Financial Statements
Other Information
Other Information

104 FUGRO N.V. ANNUAL REPORT 2017
(EUR x 1,000) 2017 2016
Assets(5.37) Property, plant and equipment 643,695 805,992
(5.38) Intangible assets 372,325 393,497
(5.39) Investments in equity-accounted investees 69,701 20,068
(5.40) Other investments 31,146 33,750
(5.41) Deferred tax assets 39,423 80,602
Total non-current assets 1,156,290 1,333,909
(5.42) Inventories 30,543 22,102
(5.43) Trade and other receivables 476,930 546,226
(5.36) Current tax assets 16,124 22,743
(5.44) Cash and cash equivalents 213,574 248,488
(5.45) Assets classified as held for sale 4,843 981
Total current assets 742,014 840,540
Total assets 1,898,304 2,174,449
The notes on pages 110 to 182 are an integral part of these consolidated financial statements.
2 CONSOLIDATED STATEMENT OF FINANCIAL POSITION
As at 31 December
Key figures
Message from the CEO
Profile
Strategy
Divisional Performance
Group Performance
Governance
Report of the Supervisory Board
Financial Statements
Other Information

FUGRO N.V. ANNUAL REPORT 2017 105
2 CONSOLIDATED STATEMENT OF FINANCIAL POSITION (CONTINUED)
As at 31 December
(EUR x 1,000) 2017 2016
EquityTotal equity attributable to owners of the company 712,054 934,859
(5.48) Non-controlling interests 41,610 55,250
(5.46) Total equity 753,664 990,109
Liabilities(5.49) Loans and borrowings 634,893 573,503
(5.50) Employee benefits 68,867 95,477
(5.51) Provisions for other liabilities and charges 17,068 26,845
(5.41) Deferred tax liabilities 1,247 1,650
Total non-current liabilities 722,075 697,475
(5.44) Bank overdraft 2,638 4,043
(5.49) Loans and borrowings 6,488 22,006
(5.52) Trade and other payables 342,594 375,377
(5.51) Provisions for other liabilities and charges 8,005 14,810
Other taxes and social security charges 35,406 36,710
(5.36) Current tax liabilities 27,434 33,919
Total current liabilities 422,565 486,865
Total liabilities 1,144,640 1,184,340
Total equity and liabilities 1,898,304 2,174,449
The notes on pages 110 to 182 are an integral part of these consolidated financial statements.
Key figures
Message from the CEO
Profile
Strategy
Divisional Performance
Group Performance
Governance
Report of the Supervisory Board
Financial Statements
Other Information
Other Information

106 FUGRO N.V. ANNUAL REPORT 2017
(EUR x 1,000) 2017
Share
capital
Share
premium
Translation
reserve
Hedging
reserve
Reserve
for own
shares
Equity com-
ponent of
convertible
bonds
Retained
earnings
Unappro-
priated
result Total
Non-
controlling
interest
Total
equity
Balance at 1 January 2017 4,228 431,227 (20,715) (103) (353,958) 25,716 1,157,398 (308,934) 934,859 55,250 990,109
Total comprehensive income
for the period:
Profit or (loss) (159,901) (159,901) (373) (160,274)
Other comprehensive income
(5.34) Foreign currency translation differences
of foreign operations (110,476) (110,476) (6,022) (116,498)
(5.34) Foreign currency translation differences
of equity-accounted investees (835) (835) (835)
(5.34) Net change in fair value of hedge of net
investment in foreign operations 16,117 16,117 16,117
(5. 50) Defined benefit plan actuarial gains/
(losses) 17,036 17,036 (11) 17,025
(5. 34) Net change in fair value of cash flow
hedges transferred to profit or loss 103 103 103
(5. 34) Net change in fair value of available-
for-sale financial assets 218 218 218
Total other comprehensive
income/(loss), net of tax (95,194) 103 17,254 (77,837) (6,033) (83,870)
Total comprehensive income/(loss)
for the period (95,194) 103 17,254 (159,901) (237,738) (6,406) (244,144)
Transactions with owners recognised
directly in equity
(5.31) Share-based payments 3,103 3,103 3,103
(5.46) Issuance of subordinated unsecured
convertible bonds, net of tax 11,830 11,830 11,830
Addition to/(reduction of) reserves (308,934) 308,934 - -
(5.48) Dividends to shareholders (7,234) (7,234)
Total contributions by and
distribution to owners 11,830 (305,831) 308,934 14,933 (7,234) 7,699
Balance at 31 December 2017 4,228 431,227 (115,909) - (353,958) 37,546 868,821 (159,901) 712,054 41,610 753,664
The notes on pages 110 to 182 are an integral part of these consolidated financial statements.
3 CONSOLIDATED STATEMENT OF CHANGES IN EQUITY
Key figures
Message from the CEO
Profile
Strategy
Divisional Performance
Group Performance
Governance
Report of the Supervisory Board
Financial Statements
Other Information
FUGRO N.V. ANNUAL REPORT 2017 107
3 CONSOLIDATED STATEMENT OF CHANGES IN EQUITY (CONTINUED)
(EUR x 1,000) 2016
Share
capital
Share
premium
Translation
reserve
Hedging
reserve
Reserve
for own
shares
Equity com-
ponent of
convertible
bonds
Retained
earnings
Unappro-
priated
result Total
Non-
controlling
interest
Total
equity
Balance at 1 January 2016 4,228 431,227 (48,023) (391) (353,958) - 1,537,094 (372,522) 1,197,655 36,702 1,234,357
Total comprehensive income
for the period:
Profit or (loss) (308,934) (308,934) 7,951 (300,983)
Other comprehensive income
(5.34) Foreign currency translation differences
of foreign operations 23,654 23,654 3,281 26,935
(5.34) Foreign currency translation differences
of equity-accounted investees (1,425) (1,425) (1,425)
(5.34) Net change in fair value of hedge of net
investment in foreign operations 5,079 5,079 5,079
(5.50) Defined benefit plan actuarial gains/
(losses) (14,143) (14,143) (2) (14,145)
(5.34) Net change in fair value of cash flow
hedges transferred to profit or loss 288 288 288
(5.34) Net change in fair value of available-
for-sale financial assets 34 34 34
Total other comprehensive
income/(loss), net of tax 27,308 288 (14,109) 13,487 3,279 16,766
Total comprehensive income/(loss)
for the period 27,308 288 (14,109) (295,447) 11,230 (284,217)
Transactions with owners recognised
directly in equity
(5.31) Share-based payments 6,935 6,935 6,935
(5.46) Issuance of subordinated unsecured
convertible bonds, net of tax 25,716 25,716 25,716
Addition to/(reduction of) reserves (372,522) 372,522 - -
Contributions by shareholders 17,290 17,290
(5.48) Dividends to shareholders (9,972) (9,972)
Total contributions by and
distribution to owners 25,716 (365,587) 372,522 32,651 7,318 39,969
Balance at 31 December 2016 4,228 431,227 (20,715) (103) (353,958) 25,716 1,157,398 (308,934) 934,859 55,250 990,109
The notes on pages 110 to 182 are an integral part of these consolidated financial statements.
Key figures
Message from the CEO
Profile
Strategy
Divisional Performance
Group Performance
Governance
Report of the Supervisory Board
Financial Statements
Other Information
Other Information
108 FUGRO N.V. ANNUAL REPORT 2017
(EUR x 1,000) 2017 2016
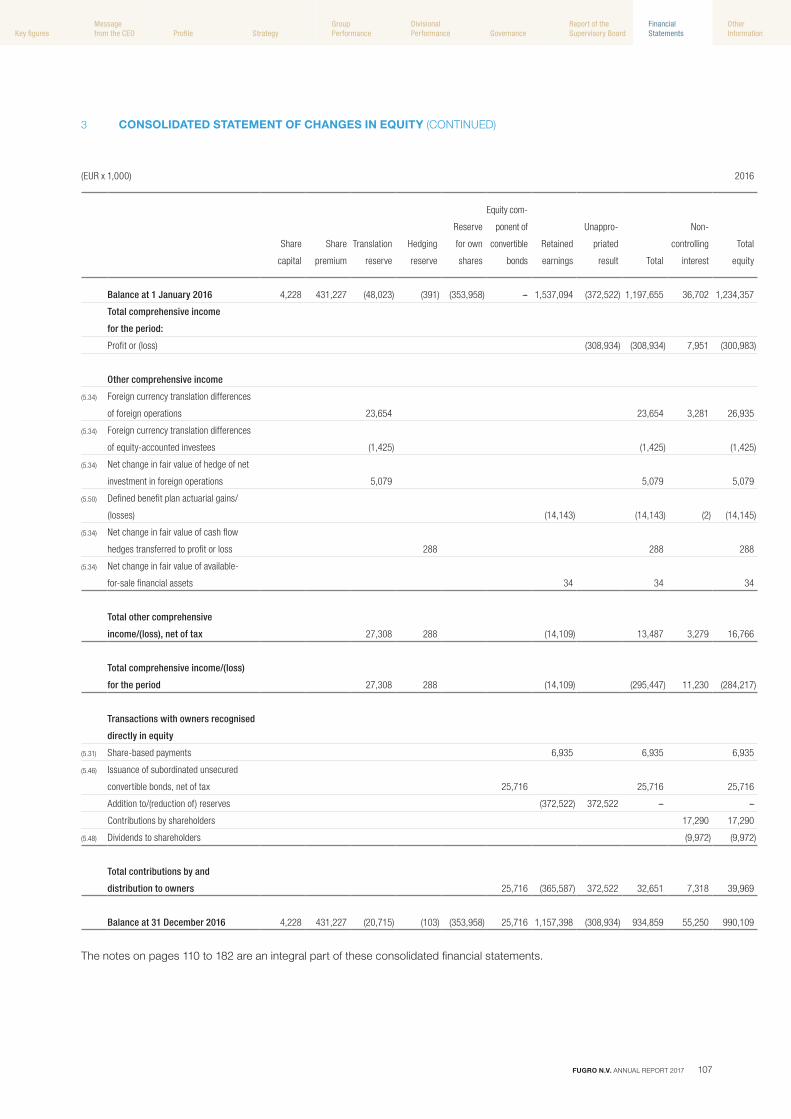
Cash flows from operating activitiesProfit/(loss) for the period (165,344) (300,983)
Adjustments for:
(5.37/5.38) Depreciation and amortisation 133,002 180,928
(5.32) Impairments 164 192,716
(5.40) Write-off long-term receivables 1,019 12,042
(5.39) Share of (profit)/loss of equity-accounted investees (net of income tax) (4,712) 2,223
(5.30/5.33) Net gain on sale of property, plant and equipment (13,870) (5,061)
(5.31) Equity-settled share-based payments 3,103 6,935
Change in provisions for other liabilities and charges and employee benefits (3,491) (35,497)
(5.35) Income tax expense/(gain) 47,595 9,152
Income tax paid (15,744) (30,646)
(5.34) Finance income and expense 70,739 70,930
Interest paid (24,750) (37,563)
Operating cash flows before changes in working capital 27,711 65,176
Change in inventories (9,740) 7,606
Change in trade and other receivables 63,255 195,121
Change in trade and other payables (56,878) (137,143)
Changes in working capital (3,363) 65,584
Net cash generated from operating activities 24,348 130,760
Cash flows from investing activitiesProceeds from sale of interests in business, net of cash disposed of - 62,510
Proceeds from sale & leaseback transaction of property, plant and equipment - 48,631
Proceeds from sale of property, plant and equipment 30,801 7,224
(5.38) Acquisition of intangible assets (5,923) (6,052)
(5.38) Other additions to intangible assets (3,249) (5,060)
(5.37) Capital expenditures on property, plant and equipment (107,974) (68,643)
(5.28) Acquisitions of investments in equity accounted investees (3,788) -
Interest received 5,408 11,126
(5.39/5.40) Dividends received 8,843 5,582
Repayment of long term loans 1,018 -
Net cash (used in) / from investing activities (74,864) 55,318
Cash flows from operating activities after investing activities (50,516) 186,078
4 CONSOLIDATED STATEMENT OF CASH FLOWS
For the year ended 31 December
The notes on pages 110 to 182 are an integral part of these consolidated financial statements.
Key figures
Message from the CEO
Profile
Strategy
Divisional Performance
Group Performance
Governance
Report of the Supervisory Board
Financial Statements
Other Information

FUGRO N.V. ANNUAL REPORT 2017 109
4 CONSOLIDATED STATEMENT OF CASH FLOWS (CONTINUED)
For the year ended 31 December
(EUR x 1,000) 2017 2016
Cash flows from financing activities(5.49) Proceeds from issue of long-term loans 152,918 59,986
(5.49) Proceeds from issue of subordinated unsecured convertible bonds 100,000 190,000
(5.46/5.49) Transaction costs relating to loans and borrowings (9,235) (21,490)
(5.49) Repayment of borrowings (177,048) (439,671)
(5.48) Dividends paid (7,234) (9,972)
Payments of finance lease liability (5,807) (6,802)
Net cash from / (used in) financing activities 53,594 (227,949)
Change in cash flows from operations 3,078 (41,871)
Net increase in cash and cash equivalents 3,078 (41,871)
Cash and cash equivalents at 1 January 244,445 283,085
Effect of exchange rate fluctuations on cash held (36,587) 3,231
Cash and cash equivalents at 31 December 210,936 244,445
Presentation in the statement of financial position(5.44) Cash and cash equivalents 213,574 248,488
(5.44) Bank overdraft (2,638) (4,043)
210,936 244,445
The notes on pages 110 to 182 are an integral part of these consolidated financial statements.
Key figures
Message from the CEO
Profile
Strategy
Divisional Performance
Group Performance
Governance
Report of the Supervisory Board
Financial Statements
Other Information
Other Information
110 FUGRO N.V. ANNUAL REPORT 2017
5.1 General
Fugro N.V., hereinafter to be referred to as ‘Fugro’ or ‘the
company’, has its corporate seat in The Netherlands.
The address of the company’s principal office is Veurse
Achterweg 10, 2264 SG, Leidschendam, the Netherlands.
The consolidated financial statements of Fugro as at and for
the year ended 31 December 2017 include Fugro and its
subsidiaries (together referred to as the ‘Group’) and the
Group’s interests in equity-accounted investees.
An overview of the main subsidiaries is included in
chapter 6.
5.2 Statement of compliance
The consolidated financial statements have been prepared
in accordance with International Financial Reporting
Standards (IFRS) as adopted by the European Union
(EU-IFRS) and with Part 9 of Book 2 of the Netherlands Civil
Code.
On 21 February 2018, the Board of Management and
Supervisory Board authorised the financial statements for
issue. Publication will take place on 2 March 2018.
The financial statements will be submitted for adoption to
the annual general meeting on 26 April 2018. The official
language for the financial statements is the English language
as approved by the annual general meeting on 10 May 2011.
5.3 Basis of preparation
5.3.1 Functional and presentation currency
The financial statements are presented in EUR x 1,000,
unless stated otherwise. The Euro is the functional and
presentation currency of the company.
5.3.2 Basis of measurement
The financial statements have been prepared on the basis of
historical cost, except for that the following assets and
liabilities are stated at their fair value: derivative financial
instruments, available-for-sale financial assets and plan
assets associated with defined benefit plans.
5.3.3 Change in accounting policies resulting from
changes in IFRS
The accounting policies set out below have been applied
consistently to all periods presented in these consolidated
financial statements. The company accounts for any change
in accounting principle retrospectively. The amendment to
IAS 7 has been applied by Fugro as at 31 December 2017.
The amendment enables users of financial statements to
evaluate changes in liabilities arising from financing activities,
including both changes arising from cash flows and
non-cash changes (such as effect of movements in foreign
exchange rates). It is not required to provide comparative
information for 2016. Refer to note 5.49.5. There are no new
standards, amendments and/or interpretations that are
required to be adopted as from 1 January 2017, which have
a material impact on the Group.
5.3.4 Use of estimates and judgements
The preparation of the consolidated financial statements
requires management to make judgements, estimates and
assumptions that affect the application of accounting
policies and the reported amounts of assets, liabilities,
income and expenses. Actual results may differ materially
from these estimates.
The estimates and associated assumptions are based on
historical experience and various other factors that are
believed to be reasonable under the circumstances,
the result of which forms the basis of making the
judgements about the carrying values of the assets and
liabilities that are not readily apparent from other sources.
The estimates and the underlying assumptions are reviewed
on an ongoing basis. Revisions to accounting estimates are
recognised in the period in which the estimates are revised,
if the revision affects only that period, or in the period of the
revision and future periods if the revision affects both current
and future periods.
Key sources of estimation uncertainty and references to the
notes which include information about assumptions and
estimation uncertainties that have a significant risk of
resulting in a material adjustment within the next financial
year are included in note 5.63.
5.3.5 New standards and interpretations
Certain new accounting standards and interpretations have
been published that are not mandatory for 31 December
2017 reporting periods and have not been early adopted by
the Group. The impact of these new standards and
interpretations are assessed in the table and paragraphs
below.
The Group has completed its transition projects with respect
to IFRS 9 Financial Instruments and IFRS 15 Revenue from
Contracts with Customers. IFRS 9 and IFRS 15 will not have
a material impact on the Group’s 2018 consolidated financial
statements. These conclusions have been shared with the
5 NOTES TO THE CONSOLIDATED FINANCIAL STATEMENTS
Key figures
Message from the CEO
Profile
Strategy
Divisional Performance
Group Performance
Governance
Report of the Supervisory Board
Financial Statements
Other Information

FUGRO N.V. ANNUAL REPORT 2017 111
Board of Management, the audit committee of the Supervisory Board and the external auditors. The Group has commenced its
transition project with respect to IFRS 16 Leases.
Nature of change Impact Mandatory application date
IFRS 9 Financial Instruments
IFRS 9 introduces (1) new classification and measurement
requirements for financial assets and liabilities, (2) a new
expected loss impairment model and (3) new hedge
accounting requirements.
Classification and measurement:
Fugro concluded that all material financial assets and
liabilities will continue to be measured on the same basis
as currently applied under IAS 39 (mainly amortised
cost).
Impairment:
IFRS 9 requires the Group to record expected credit
losses on long-term loans, deposits and other long-term
receivables either on a 12-month or lifetime basis. The
Group monitors whether a significant increase in credit
risk occurs. The Group will apply the simplified approach
to recognise lifetime expected credit losses on trade and
other receivables (including unbilled revenue from
contracts with customers).
Hedge accounting:
The Group does not engage in material hedging
transactions with derivatives. The Group hedges foreign
currency exposure for net investments in certain foreign
operations with certain financial liabilities as hedging
instruments. The Group will continue the aforementioned
hedging relationships upon application of IFRS 9.
Impact:
IFRS 9 will not have a material impact on the Group’s
2018 consolidated financial statements and the 2018
company financial statements.
Must be applied for
financial years commencing
on or after 1 January 2018
(endorsed by EU).
Key figures
Message from the CEO
Profile
Strategy
Divisional Performance
Group Performance
Governance
Report of the Supervisory Board
Financial Statements
Other Information
Other Information

112 FUGRO N.V. ANNUAL REPORT 2017
Nature of change Impact Mandatory application date
IFRS 15 Revenue from Contracts with Customers
The core principle of IFRS 15 is that an entity should
recognise revenue to depict the transfer of promised
goods or services to customers in an amount that reflects
the consideration to which the entity expects to be
entitled. The standard introduces a five-step approach to
revenue recognition. An entity recognises revenue when
(or as) a performance obligation is satisfied, i.e. when
‘control’ is transferred to the customer. Far more
prescriptive guidance has been added in IFRS 15 to deal
with specific scenarios. Furthermore, new disclosures are
required.
The Group is in the business of providing geo-intelligence
(site characterisation) and asset integrity solutions. These
services are typically sold in a bundled package of
services. Under IFRS 15, the Group will continue to
recognise revenue for those bundled packages of services
(i.e. one performance obligation) over time. The Group will
not apply the portfolio approach. The method to measure
progress towards complete satisfaction of the
performance obligation remains unchanged (generally the
cost-to-cost method). The recognition and measurement
of variable consideration (i.e. liquidated damages,
weather standby fees or discounts) remains unchanged.
Contracts with significant financing components are rare.
Insofar applicable, Fugro qualifies for the application of
the practical expedient in IFRS 15 and will not adjust the
transaction price. Generally, the Group does not incur
costs to obtain a contract.
Impact:
The Group will apply the modified retrospective transition
approach. As explained above, there are no material
recognition and measurement transition differences.
The Group has implemented system changes, policies
and procedures to collect and disclose the required
information.
Mandatory for financial
years commencing
on or after 1 January 2018
(endorsed by EU).
IFRS 16 Leasing
IFRS 16 sets out the principles for the recognition,
measurement, presentation and disclosure of leases. The
standard requires lessees to account for all leases under
a single on-balance sheet model similar to the accounting
for financial leases under IAS 17. IFRS 16 includes two
recognition exemptions for lessees – leases of ‘low-value’
assets and short-term leases. At commencement of a
lease, a lessee will recognise a liability to make lease
payments (i.e. the lease liability) and an asset
representing the right to use the underlying asset during
the lease term (i.e. the right-of-use asset). Lessees will
be required to separately recognise the interest expense
on the lease liability and the depreciation expense on the
right-of-use asset. Lessor accounting will remain
substantially unchanged from current standards. IFRS 16
requires more extensive disclosures.
The Group anticipates total assets, total liabilities, EBITDA
and operating cash flows to increase upon transition to
IFRS 16. The expense profile in profit and loss will be
front-loaded, due to higher interest expenses in early
years on the lease liability. The Group has set up a
Leasing Steering Committee with active involvement of
board of management, audit committee of the supervisory
board and the external auditors. The IFRS 16 transition
project commenced in the second quarter of 2017. It is
not practicable to provide a reasonable estimate of the
financial effect until the Group completes this project in
2018. The Group will apply the modified retrospective
transition approach.
Mandatory for financial
years commencing
on or after 1 January 2019
(endorsed by EU).
Key figures
Message from the CEO
Profile
Strategy
Divisional Performance
Group Performance
Governance
Report of the Supervisory Board
Financial Statements
Other Information

FUGRO N.V. ANNUAL REPORT 2017 113
entity when the group is exposed to, or has rights to,
variable returns from its involvement with the entity and has
the ability to affect those returns through its power over the
entity. Subsidiaries are fully consolidated from the date on
which control is transferred to the group. They are
deconsolidated from the date that control ceases.
Any surplus or deficit arising on the loss of control is
recognised in profit or loss. If the Group retains any interest
in the previous subsidiary, it is accounted for as an equity-
accounted investee or as an available-for-sale financial asset
depending on the level of influence retained.
5.4.3 Equity-accounted investees
The Group’s interests in equity-accounted investees
comprise interests in joint ventures and associates. A joint
venture is an arrangement in which the Group has joint
control, whereby the Group has rights to the net assets of
the arrangement, rather than rights to its assets and
obligations for its liabilities. Associates are all entities over
which the group has significant influence but not control or
joint control. This is generally the case where the group
holds between 20% and 50% of the voting rights. Refer to
note 5.10 or the accounting policy for equity-accounted
investees.
Nature of change Impact Mandatory application date
IFRS 17 Insurance Contracts
IFRS 17 establishes the requirements that a company
must apply in reporting information about insurance
contracts it issues and reinsurance contracts it holds.
IFRS 17 is not applicable to Fugro. Mandatory for financial
years commencing
on or after 1 January 2021
(subject to EU endorsement).
IFRIC 23 Uncertainty over Income Tax Treatments
The interpretation addresses the determination of taxable
profit (tax loss), tax bases, unused tax losses, unused tax
credits and tax rates, when there is uncertainty over
income tax treatments under IAS 12. It specifically
considers:
■ Whether tax treatments should be considered
collectively;
■ Assumptions for taxation authorities’ examinations;
■ The determination of taxable profit (tax loss), tax
bases, unused tax losses, unused tax credits and tax
rates;
■ The effect of changes in facts and circumstances.
The Group has commenced its impact assessment during
the third quarter of 2017. It is not practicable to provide a
reasonable estimate of the financial effect until the Group
completes this project in 2018.
Mandatory for financial
years commencing
on or after 1 January 2019
(subject to EU endorsement).
Certain other new standards, interpretations and
amendments issued by the IASB (i.e. Annual Improvements
Cycle 2014-2016, IAS 40, IFRS 2, IFRIC 22, IAS 28 and IFRS
4) are either not material for Fugro or not applicable to
Fugro.
Summary of significant accounting policies
The accounting policies set out below have been applied
consistently by all subsidiaries and equity-accounted
investees to all periods presented in these consolidated
financial statements.
5.4 Basis of consolidation
5.4.1 Accounting for business combinations
Business combinations are accounted for using the
acquisition method as at the acquisition date, which is the
date on which control is transferred to the Group.
In assessing control, the Group takes into consideration
potential voting rights that currently are exercisable.
Non-controlling interest in the acquiree are measured at the
proportionate share of the acquiree’s identifiable net assets.
5.4.2 Subsidiaries
Subsidiaries are all entities (including structured entities)
over which the group has control. The group controls an
Key figures
Message from the CEO
Profile
Strategy
Divisional Performance
Group Performance
Governance
Report of the Supervisory Board
Financial Statements
Other Information
Other Information

114 FUGRO N.V. ANNUAL REPORT 2017
Monetary assets and liabilities denominated in foreign
currencies at the reporting date are translated to the
respective functional currency at the foreign exchange rate
at that date. The foreign currency gain or loss on monetary
items is the difference between amortised cost in the
functional currency at the beginning of the year, adjusted for
effective interest and payments during the year, and the
amortised cost in foreign currency translated at the
exchange rate at the end of the year.
Non-monetary assets and liabilities that are measured in
terms of historical cost in a foreign currency are translated
using the exchange rate at the date of the transaction.
Non-monetary assets and liabilities denominated in foreign
currencies that are measured at fair value are translated to
the functional currency at foreign exchange rates effective at
the date the fair value was determined. Foreign currency
differences arising on retranslation are recognised in profit
or loss, except for differences arising on the retranslation of
available-for-sale financial assets and equity-accounted
investees, a financial liability designated as a hedge of the
net investment in a foreign operation that is effective,
or qualifying cash flow hedges, which are recognised in
other comprehensive income. A summary of the main
currency exchange rates applied in the year under review
and the preceding years reads as follows:
5.4.4 Other investments
Other investments are those entities in whose activities the
Group holds a non-controlling interest and has no control or
significant influence. Refer to note 5.11 for the accounting
policy for other investments.
5.4.5 Transactions eliminated on consolidation
Intra-group balances and transactions, and any unrealised
income and expenses arising from intra-group transactions,
are eliminated in preparing the consolidated financial
statements. Unrealised gains arising from transactions with
equity-accounted investees are eliminated against the
investment to the extent of the Group’s interest in the
investee. Unrealised losses are eliminated in the same way
as unrealised gains, but only to the extent that there is no
objective evidence of impairment conditions.
5.5 Foreign currency
5.5.1 Foreign currency transactions and translation
Transactions in foreign currencies are translated to the
respective functional currencies of Group entities at
exchange rates prevailing at the dates of the transactions.
USD at
year-end
USD
average
GBP at
year-end
GBP
average
NOK at
year-end
NOK
average
AUD at
year-end
AUD
average
2017 0.840 0.880 1.120 1.140 0.101 0.107 0.650 0.680
2016 0.950 0.910 1.160 1.220 0.110 0.108 0.690 0.670
5.5.2 Foreign operations
The assets and liabilities of foreign operations, including
goodwill and fair value adjustments arising on acquisition,
are translated to EUR at foreign exchange rates effective at
the reporting date. The income and expenses of foreign
operations are translated to EUR at exchange rates effective
at the dates of the transactions.
Foreign currency differences are recognised in other
comprehensive income, and presented in the foreign
currency translation reserve for foreign operations
(Translation reserve) in equity. However, if the operation is a
non-wholly-owned subsidiary, then the relevant
proportionate share of the translation difference is allocated
to the non-controlling interests. When a foreign operation is
disposed of, such that control, significant influence or joint
control is lost, the cumulative amount in the translation
reserve related to that foreign operation is reclassified to
profit or loss as part of the gain or loss on disposal.
When the Group disposes of only part of its interest in a
subsidiary that includes a foreign operation while retaining
control, the relevant proportion of the cumulative amount in
the translation reserve is reattributed to non-controlling
interests. If the Group disposes of only part of its investment
in an equity-accounted investee that includes a foreign
operation while retaining significant influence or joint control,
the relevant proportion of the cumulative amount in the
translation reserve is reclassified to profit or loss.
If the settlement of a monetary item, receivable from or
payable to a foreign operation, is neither planned nor likely in
the foreseeable future, foreign exchange gains and losses
Key figures
Message from the CEO
Profile
Strategy
Divisional Performance
Group Performance
Governance
Report of the Supervisory Board
Financial Statements
Other Information

FUGRO N.V. ANNUAL REPORT 2017 115
5.6.3 Forward exchange contracts and interest rate
swaps
The fair value of forward exchange contracts is based on
their quoted market price, if available.
5.6.4 Other non-derivative financial liabilities
Fair value, which is determined for disclosure purposes,
is calculated based on the present value of future principal
and interest cash flows, discounted at the market rate of
interest at the reporting date, taking into consideration the
Group’s own non-performance risk. For financial leases the
market rate of interest is either determined by reference to
similar lease agreements or based on the implicit discount
rate if determinable.
5.6.5 Share-based payment transactions
Fugro operates equity-settled share-based payment plans.
For members of the Board of Management and other
selected senior employees, a long-term incentive plan is
applicable since 2014. Under this plan, a combination of
performance options and performance shares has been
granted and awarded on an annual basis subject to
continued services. In addition, Fugro operates a share
option scheme with only service conditions for other eligible
and selected employees.
The fair value for shares awarded and options granted
(conditional options) subject to a market condition is
determined applying a Monte Carlo simulation model.
The fair value of the options granted is determined using the
Black and Scholes option pricing formula for the
performance options not being subject to market conditions
(conditional performance options with non-market service
conditions) or based on the binomial model (options with
only service conditions).
The grant date fair values of the employee share incentives
are measured, taking into account the terms and conditions
upon which the options and shares were granted and
awarded. Relevant measurement inputs include the share
price on the measurement date, the exercise price of the
instrument, expected volatility (based on the historical
volatility of Fugro’s (certificates of) shares, particularly over
the historical period that commensurate with the expected
term), expected term of the instruments (based on historical
experience and general option holder exercise behaviour),
expected dividends and the risk-free interest rate (based on
government bonds). Service and non-market performance
conditions attached to the share-based payment
arising from such monetary items are considered to form
part of a net investment in a foreign operation and are
recognised in other comprehensive income, and are
presented in the Translation reserve in equity.
5.5.3 Hedge of a net investment in foreign operations
The Group applies hedge accounting to foreign currency
differences arising between the functional currency of the
foreign operation and the functional currency of Fugro (EUR),
regardless of whether the net investment is held directly or
through an intermediate parent.
Foreign currency differences arising on the (re-)translation of
a financial liability designated as a hedge of a net investment
in a foreign operation are recognised in other
comprehensive income to the extent that the hedge is
effective, and are presented within equity in the Translation
reserve. To the extent that the hedge is ineffective,
such differences are recognised in profit or loss. When the
hedged net investment is disposed of, the relevant amount
in the Translation reserve is transferred to profit or loss as
part of the profit or loss upon disposal.
5.6 Determination of fair values
A number of the Group’s accounting policies and
disclosures requires the determination of fair value,
for both financial and non-financial assets and liabilities.
Fair values have been determined for measurement
and/or disclosure purposes based on the following
methods. When applicable, additional information on the
determination of fair values is disclosed in the notes of the
specific asset or liability.
5.6.1 Equity and debt securities
The fair value of equity and debt securities is determined by
reference to their quoted closing bid price at the reporting
date, or if unquoted, determined using a valuation
technique. Valuation techniques employed include market
multiples and discounted cash flow analysis using expected
future cash flows and a market-related discount rate.
5.6.2 Trade and other receivables
The fair value of trade and other receivables is estimated at
the present value of future cash flows, discounted at the
market rate of interest at the reporting date. This fair value is
determined for disclosure purposes.
Key figures
Message from the CEO
Profile
Strategy
Divisional Performance
Group Performance
Governance
Report of the Supervisory Board
Financial Statements
Other Information
Other Information

116 FUGRO N.V. ANNUAL REPORT 2017
and only when, the Group has a legal right to offset the
amounts and intends either to settle on a net basis or to
realise the asset and settle the liability simultaneously.
Other financial liabilities are initially recognised at fair value
net off any directly attributable transaction costs.
Subsequent to initial recognition, these financial liabilities are
measured at amortised cost using the effective interest
method.
The fair value of the liability portion of a convertible bond is
initially determined using a market interest rate for an
equivalent non-convertible bond at the issue date.
This amount is recorded as a liability on an amortised cost
basis until extinguished on conversion or maturity of the
bonds. The remainder of the proceeds is allocated to the
conversion option. This is recognised and included in
shareholders’ equity, net of income tax effects and is not
subsequently remeasured.
Other financial liabilities comprise loans and borrowings,
bank overdrafts, and trade and other payables. Reference is
made to note (5.44) Cash and cash equivalents and note
(5.52) Trade and other payables.
5.7.3 Derivative financial instruments, including hedge
accounting
5.7.3.1 Other derivative financial instruments
The Group holds derivative financial instruments to hedge its
exposure to foreign exchange risks arising from operational
and financing activities. In accordance with its treasury
policy, the Group does not hold or issue derivative financial
instruments for trading purposes.
Embedded derivatives are separated from the host contract
and accounted for separately if the economic characteristics
and risks of the host contract and the embedded derivative
are not closely related, a separate instrument with the same
terms as the embedded derivative would meet the definition
of a derivative, and the combined instrument is not
measured at fair value through profit or loss.
On initial designation as the hedging instrument, the Group
formally documents the relationship between the hedging
instrument and hedged item, including the risk management
objectives and strategy in undertaking the hedge transaction
and the hedged risk, together with the methods that will be
used to assess the effectiveness of the hedging relationship.
The Group makes an assessment, both at the inception of
transactions are not taken into account in determining the
grant date fair value.
5.7 Financial instruments
5.7.1 Non-derivative financial assets
The Group initially recognises loans and receivables and
deposits on the date that they are originated. All other
financial assets (including assets designated at fair value
through profit or loss) are recognised initially on the trade
date, which is the date that the Group becomes a party to
the contractual provisions of the instrument.
The Group derecognises a financial asset when the
contractual rights to the cash flows from the asset expire,
or it transfers the rights to receive the contractual cash flows
on the financial asset in a transaction in which substantially
all the risks and rewards of ownership of the financial asset
are transferred. Any interest in transferred financial assets
that is created or retained by the Group is recognised as a
separate asset or liability.
Financial assets and liabilities are offset and the net amount
presented in the statement of financial position when,
and only when, the Group has a legal right to offset the
amounts and intends either to settle on a net basis or to
realise the asset and settle the liability simultaneously.
The Group classifies non-derivative financial assets into the
following categories: financial assets at fair value through
profit or loss, held-to-maturity financial assets, loans and
receivables and available-for-sale financial assets. Reference
is made to accounting policy (5.11) and note (5.40).
Loans and receivables comprise cash and cash equivalents
and trade and other receivables. Cash and cash equivalents
comprise cash balances and call deposits with original
maturities of three months or less.
5.7.2 Non-derivative financial liabilities
The Group initially recognises debt securities issued and
subordinated liabilities on the date that they are originated.
All other financial liabilities are recognised initially on the
trade date, which is the date that the Group becomes a
party to the contractual provisions of the instrument.
The Group derecognises a financial liability when its
contractual obligations are discharged, cancelled or expire.
Financial liabilities and assets are offset and the net amount
presented in the statement of financial position when,
Key figures
Message from the CEO
Profile
Strategy
Divisional Performance
Group Performance
Governance
Report of the Supervisory Board
Financial Statements
Other Information

FUGRO N.V. ANNUAL REPORT 2017 117
attributable to bringing the assets to a working condition for
their intended use, the costs of dismantling and removing
the items and restoring the site on which they are located
and capitalised borrowing costs. Cost also may include
transfers from equity of any gain or loss on qualifying cash
flow hedges of foreign currency purchases of property, plant
and equipment. Purchased software that is integral to the
functionality of the related equipment is capitalised as part
of that equipment.
Property, plant and equipment that is being constructed or
developed for future use is classified as property, plant and
equipment under construction and stated at cost until
construction or development is complete, at which time it is
reclassified as land and buildings, plant and equipment,
vessels or other property, plant and equipment. When parts
of an item of property, plant and equipment have different
useful lives, they are accounted for as separate items (major
components) of property, plant and equipment. The gain or
loss on disposal of an item of property, plant and equipment
is determined by comparing the proceeds from disposal
with the carrying amount of the property, plant and
equipment, and is recognised net within ‘other income’ or
‘other expenses’ in profit or loss.
5.8.2 Leased assets
A lease is classified as a finance lease if it transfers
substantially all the risks and rewards incidental to
ownership. Upon initial recognition the leased asset is
measured at an amount equal to the lower of its fair value
and the present value of the minimum lease payments.
Subsequent to initial recognition, the asset is accounted for
in accordance with the accounting policy applicable to that
asset. A lease is classified as an operating lease if it does
not transfer substantially all the risks and rewards incidental
to ownership and are not recognised in the Group’s
statement of financial position. Lease payments are
accounted for as described in accounting policy 5.23.2.
If a sale and leaseback transaction results in an operating
lease, and it is clear that the transaction is established at fair
value, any profit or loss is recognised immediately.
5.8.3 Subsequent cost
Subsequent costs are included in the asset’s carrying
amount or recognised as a separate asset, as appropriate,
only when it is probable that future economic benefits
associated with the item will flow to the group and the cost
of the item can be measured reliably. The carrying amount
of any component accounted for as a separate asset is
the hedge relationship as well as on an ongoing basis,
of whether the hedging instruments are expected to be
‘highly effective’ in offsetting the changes in the fair value or
cash flows of the respective hedged items attributable to the
hedged risk, and whether the actual results of each hedge
are within a range of 80-125%.
Derivatives are recognised initially at fair value and directly
attributable transaction costs are recognised in profit or loss
as incurred. Subsequent to initial recognition, derivatives are
measured at fair value, and changes therein are accounted
for as described below.
5.7.3.2 Net investment hedges
Gains and losses resulting from the settlement of
transactions in a foreign currency, as well as from the
translation of monetary assets and liabilities denominated in
foreign currencies at year end are generally recognised in
profit or loss. They are deferred in equity if they relate to
qualifying net investment hedges to the extent the hedging
relationship is effective. Gains and losses accumulated in
equity are reclassified to profit or loss when the foreign
operation is partially disposed of or sold.
The Group documents at the inception of the hedging
transaction the relationship between hedging instruments
and hedged items, as well as its risk management objective
and strategy for undertaking various hedge transactions.
The Group also documents its assessment, both at hedge
inception and on an ongoing basis, of whether the
derivatives that are used in hedging transactions have been
and will continue to be highly effective in offsetting changes
in fair values or cash flows of hedged items.
5.7.3.3 Other non-trading derivatives
When a derivative financial instrument is not designated in a
hedge relationship that qualifies for hedge accounting,
all changes in its fair value are recognised immediately in
profit or loss.
5.8 Property, plant and equipment
5.8.1 Owned assets
Items of property, plant and equipment are measured at
cost less accumulated depreciation and accumulated
impairment losses (refer to accounting policy 5.16). The cost
of property, plant and equipment includes expenditure that
is directly attributable to the acquisition of the asset.
The cost of self-constructed assets includes the costs of
materials and direct labour, any other costs directly
Key figures
Message from the CEO
Profile
Strategy
Divisional Performance
Group Performance
Governance
Report of the Supervisory Board
Financial Statements
Other Information
Other Information

118 FUGRO N.V. ANNUAL REPORT 2017
5.9 Intangible assets
5.9.1 Goodwill
Goodwill that arises upon the acquisition of subsidiaries is
presented with intangible assets. For the measurement of
goodwill at initial recognition, goodwill is measured at cost
less accumulated impairment losses. Goodwill is allocated
to cash generating units and is not amortised but is tested
for impairment annually and when there is an indication for
impairment (refer to accounting policy 5.16). In respect of
equity-accounted investees, the carrying amount of goodwill
is included in the carrying amount of the investment,
and any impairment loss is allocated to the carrying amount
of the equity-accounted investee as a whole.
5.9.2 Finder
These intangible assets relate to the to a profit sharing
agreement with Finder Exploration Pty Ltd (Finder), relating
to Australian exploration projects. The Finder asset is
accounted for at cost and is not amortised but assessed for
impairment when facts and circumstances suggest that the
carrying amount of the asset may exceed its recoverable
amount.
5.9.3 Research and development
Expenditure on research activities, undertaken with the
prospect of gaining new scientific or technical knowledge
and understanding, is recognised in profit or loss as
incurred.
Development activities involve a plan or design for the
production of new or substantially improved products and
processes. Development expenditure is capitalised only if
development costs can be measured reliably, the product or
process is technically and commercially feasible, future
economic benefits are probable, and the Group intends to
and has sufficient resources to complete development and
to use or sell the asset. The capitalised expenditure includes
the cost of materials, direct labour, overhead costs that are
directly attributable to preparing the asset for its intended
use, and capitalised borrowing costs. Other development
expenditure is recognised in profit or loss as incurred.
Capitalised development expenditure is measured at cost
less accumulated amortisation and accumulated impairment
losses (refer to accounting policy 5.16).
5.9.4 Software and other intangible assets
Software and other intangible assets acquired or developed
by the Group and that have finite useful lives are measured
derecognised when replaced. All other repairs and
maintenance are charged to profit or loss during the
reporting period in which they are incurred.
5.8.4 Depreciation
Depreciation is based on the cost of an asset less its
residual value. Significant components of individual assets
are assessed and if a component has a useful life that is
different from the remainder of that asset, that component is
depreciated separately. Depreciation is recognised in profit
or loss on a straight-line basis over the estimated useful lives
of each component of an item of property, plant and
equipment. Leased assets are depreciated over the shorter
of the lease term and their useful lives unless it is reasonably
certain that the Group will obtain ownership by the end of
the lease term. Depreciation methods, useful lives and
residual values are reviewed at each reporting date and
adjusted if appropriate. The estimated useful lives for the
current and comparative period of significant items of
property, plant and equipment are as follows:
Category Years
Land and buildingsLand Infinite
Buildings 20 – 40
Fixtures and fittings 5 – 10
VesselsVessels and jack-ups 2 – 25
Plant and equipmentPlant and equipment 4 – 10
Survey equipment 3 – 5
Ocean bottom nodes 5 – 6
Aircraft 5 – 10
AUVs and ROVs 6 – 7
Computers and office equipment 3 – 4
Transport equipment 4
OtherDry-docking 3 – 5
Used plant and machinery 1 – 2
Key figures
Message from the CEO
Profile
Strategy
Divisional Performance
Group Performance
Governance
Report of the Supervisory Board
Financial Statements
Other Information

FUGRO N.V. ANNUAL REPORT 2017 119
receivables that form part of the entity’s net investment,
the group does not recognise further losses, unless it has
incurred obligations or made payments on behalf of the
other entity. The carrying amount of equity-accounted
investments is tested for impairment in accordance with the
policy described in 5.16.
5.11 Other investments
5.11.1 Other investments in equity instruments
Other investments in equity instruments are accounted for at
fair value with changes through profit and loss. Dividends
received are accounted for in profit or loss when these
become due.
5.11.2 Long-term loans and other long-term receivables
Long-term loans and other long-term receivables are
financial assets with fixed or determinable payments that are
not quoted in an active market. Such assets are initially
recognised at fair value plus any directly attributable
transaction costs. Subsequent to initial recognition, loans
and receivables are measured at amortised cost using the
effective interest method; less any impairment losses (refer
to accounting policy 5.16).
5.11.3 Available-for-sale financial assets
Available for sale financial assets are non-derivative financial
assets that are designated as available for sale or are not
classified in any of the above categories of financial assets.
Subsequent to initial recognition, they are measured at fair
value and changes therein, other than impairment losses
and foreign currency differences on available-for-sale debt
instruments (refer to accounting policy 5.16), are recognised
in other comprehensive income and presented in the other
reserves in equity. When an investment is derecognised,
the cumulative gain or loss accumulated in equity is
reclassified to profit or loss. Available-for-sale financial
assets comprise equity securities and debt securities.
5.12 Inventories
Inventories are measured at the lower of cost and net
realisable value. The cost of inventories is determined using
on the first-in first-out principle, and includes expenditure
incurred in acquiring the inventories, production or
conversion costs and other costs incurred in bringing them
to their existing location and condition. Net realisable value
of inventories is the estimated selling price in the ordinary
course of business, less the estimated costs of completion
and selling expenses.
at cost less accumulated amortisation and accumulated
impairment losses (refer to accounting policy 5.16).
5.9.5 Subsequent expenditure
Subsequent expenditure on capitalised intangible assets is
capitalised only when it increases the future economic
benefits embodied in the specific asset to which it relates.
All other expenditure, including expenditure on internally
generated goodwill and brands, is recognised in profit or
loss as incurred.
5.9.6 Amortisation
Amortisation is based on the cost of an asset less its
residual value. Amortisation is recognised in profit or loss on
a straight-line basis over the estimated useful lives of
intangible assets unless such lives are indefinite. Goodwill
and intangible assets with an indefinite life are annually
tested for impairment or when there is an indication for
impairment (refer to accounting policy 5.16). Other intangible
assets and software are amortised from the date they are
available for their intended use. The estimated useful life of
software and other capitalised development costs is,
in general, five years. Amortisation methods, useful lives and
residual values are reviewed at each reporting date and
adjusted if appropriate.
5.10 Investments in equity-accounted investees
The Group’s interests in equity-investees comprise interests
in joint ventures and associates. Investments in equity-
accounted investees are accounted for using the equity
method. Under the equity method of accounting,
the investments are initially recognised at cost and adjusted
thereafter to recognise the group’s share of the
post-acquisition profits or losses of the investee in profit or
loss, and the group’s share of movements in other
comprehensive income of the investee in other
comprehensive income. Dividends received or receivable
from associates and joint ventures are recognised as a
reduction in the carrying amount of the investment.
Unrealised gains on transactions between the Group and its
associates and joint ventures are eliminated to the extent of
the group’s interest in these entities. Unrealised losses are
also eliminated unless the transaction provides evidence of
an impairment of the asset transferred. Accounting policies
of equity accounted investees have been changed where
necessary to ensure consistency with the policies adopted
by the Group. When the Group’s share of losses in an
equity-accounted investment equals or exceeds its interest
in the entity, including any other unsecured long-term
Key figures
Message from the CEO
Profile
Strategy
Divisional Performance
Group Performance
Governance
Report of the Supervisory Board
Financial Statements
Other Information
Other Information

120 FUGRO N.V. ANNUAL REPORT 2017
The Group considers evidence of impairment for receivables
at both a specific asset and collective level. All individually
significant receivables are assessed for specific impairment.
All individually significant receivables found not to be
specifically impaired are then collectively assessed for any
impairment that has been incurred but not yet identified.
Receivables that are not individually significant are
collectively assessed for impairment by grouping together
receivables with similar risk characteristics. In assessing
collective impairment the Group uses historical trends of the
probability of default, the timing of recoveries and the
amount of loss incurred, adjusted for management’s
judgement as to whether current economic and credit
conditions are such that the actual losses are likely to be
greater or less than suggested by historical trends.
An impairment loss in respect of a financial asset measured
at amortised cost is calculated as the difference between its
carrying amount and the present value of the estimated
future cash flows discounted at the asset’s original effective
interest rate. Losses are recognised in profit or loss and
reflected in an allowance account against receivables.
Interest on the impaired asset continues to be recognised
through the unwinding of the discount. When a subsequent
event causes the amount of impairment loss to decrease,
the decrease in impairment loss is reversed through profit or
loss.
Impairment losses on available-for-sale financial assets are
recognised by reclassifying the losses accumulated in other
comprehensive income, and presented in equity, to profit or
loss. The cumulative loss that is reclassified from other
comprehensive income to profit or loss is the difference
between the acquisition cost, net of any principal repayment
and amortisation, and the current fair value, less any
impairment loss recognised previously in profit or loss.
Changes in impairment provisions attributable to application
of the effective interest method are reflected as a
component of interest income. If, in a subsequent period,
the fair value of an impaired available-for-sale debt security
increases and the increase can be related objectively to an
event occurring after the impairment loss was recognised in
profit or loss, then the impairment loss is reversed, with the
amount of the reversal recognised in profit or loss.
Any subsequent recovery in the fair value of an impaired
available-for-sale equity security is recognised in other
comprehensive income.
5.13 Trade and other receivables
Trade and other receivables are recognised initially at fair
value plus any directly attributable transaction costs.
Subsequent to initial recognition they are measured at
amortised cost using the effective interest method less,
any impairment losses (refer to accounting policy 5.16).
Unbilled revenue on (completed) projects represents the
gross amount expected to be collected from customers for
contract work performed to date. It is measured at costs
incurred plus profits recognised to date less progress
billings and recognised losses. Advances received from
customers are presented as advance instalments to work in
progress.
5.14 Cash and cash equivalents
In the consolidated statement of cash flows, cash and cash
equivalents include cash in hand and call deposits.
Bank overdrafts that are repayable on demand and which
form an integral part of the Group’s cash management are
included as a component of cash and cash equivalents for
the purpose of the consolidated statement of cash flows.
Bank overdrafts are shown within the current liabilities in the
consolidated statement of financial position.
5.15 Assets of disposal groups classified as held
for sale
Non-current assets that are expected to be recovered
primarily through sale rather than through continuing use are
classified as held for sale. Immediately before classification
as held for sale, these assets are remeasured in accordance
with the Group’s accounting policies. Thereafter generally
the assets are measured at the lower of their carrying
amount and fair values less costs to sell. Once classified as
held for sale, intangible assets and property, plant and
equipment are no longer amortised or depreciated and any
equity-accounted investees are no longer equity-accounted.
5.16 Impairment
5.16.1 Non-derivative financial assets
A financial asset not carried at fair value through profit or
loss is assessed at each reporting date to determine
whether there is objective evidence that it is impaired.
A financial asset is impaired if objective evidence indicates
that a loss event has occurred after the initial recognition of
the asset, and that the loss event had a negative effect on
the estimated future cash flows of that asset that can be
estimated reliably.
Key figures
Message from the CEO
Profile
Strategy
Divisional Performance
Group Performance
Governance
Report of the Supervisory Board
Financial Statements
Other Information

FUGRO N.V. ANNUAL REPORT 2017 121
An impairment loss in respect of goodwill is not reversed.
In respect of other assets, impairment losses recognised in
prior periods are reviewed at each reporting date for any
indications that the loss has decreased or no longer exists.
An impairment loss is reversed if there has been a change in
the estimates used to determine the recoverable amount.
An impairment loss is reversed only to the extent that the
asset’s carrying amount does not exceed the carrying
amount that would have been determined, net of
depreciation or amortisation, if no impairment loss had been
recognised.
5.17 Equity
5.17.1 Share capital
Share capital is classified as equity. The term ‘shares’ as
used in the financial statements should, with respect to
ordinary shares issued by Fugro, be construed to include
certificates of shares (‘share certificates’ or ‘depositary
receipts’ for shares) issued by ‘Stichting
Administratiekantoor Fugro’ (also referred to as ‘Fugro
Foundation Trust Office’ or ‘Foundation Trust Office’), unless
the context otherwise requires or unless it is clear from the
context that this is not the case. The surplus paid by
shareholders above the nominal value of shares is
recognised as share premium. Incremental costs directly
attributable to the issue of ordinary shares and share
options are recognised as a deduction from equity, net of
any tax effects.
5.17.2 Repurchase and sale of shares
When shares are repurchased or sold, the amount of the
consideration paid or received, including direct attributable
costs, net of any tax effects, is recognised as a change in
equity. Repurchased shares and related results are reported
as reserve for own shares and presented separately as a
component of total equity.
5.17.3 Dividends
Dividends are recognised as a liability in the period in which
they are declared.
5.18 Loans and borrowings
Loans and borrowings are recognised initially at fair value,
less directly attributable transaction costs. Subsequent to
initial recognition, borrowings are measured at amortised
cost using the effective interest rate method.
5.16.2 Non-financial assets
The carrying amounts of the Group’s non-financial assets
other than inventories, assets arising from employee benefits
and deferred tax assets (refer to accounting policy 5.24),
are reviewed at each reporting date to determine whether
there is any indication of impairment. If any such indication
exists, then the asset’s recoverable amount is estimated.
For goodwill, and intangible assets that have indefinite useful
lives or that are not yet available for use, the recoverable
amount is estimated each year at the same time.
An impairment loss is recognised if the carrying amount of
an asset or its related cash-generating unit exceeds its
estimated recoverable amount. Impairment losses are
recognised in profit or loss. Impairment losses recognised in
respect of cash-generating units are allocated first to reduce
the carrying amount of any goodwill allocated to the
cash-generating unit (or group of cash-generating units) and
then to reduce the carrying amount of the other assets in
the cash-generating unit (or group of cash-generating units)
on a pro rata basis.
The recoverable amount of an asset or cash-generating unit
(CGU) is the higher of its value in use and its fair value less
costs of disposal. In assessing value in use, the estimated
future cash flows are discounted to their present value using
a pre-tax discount rate that reflects current market
assessments of the time value of money and the risks
specific to the asset or cash-generating unit. For the
purpose of impairment testing, assets that cannot be tested
individually are grouped together into the smallest group of
assets that generates cash inflows from continuing use that
are largely independent of the cash inflows of other assets
or cash-generating unit. Subject to an operating segment
ceiling test, for the purposes of goodwill impairment testing,
CGUs to which goodwill has been allocated, are aggregated
so that the level at which impairment testing is performed
reflects the lowest level at which goodwill is monitored for
internal reporting purposes. Goodwill acquired in a business
combination is allocated to groups of cash generating units
that are expected to benefit from the synergies of the
combination.
The Group’s corporate assets do not generate separate
cash inflows and are utilised by more than one
cash-generating unit. Corporate assets are allocated to
cash-generating units on a reasonable and consistent basis
and tested for impairment as part of the testing of the cash
generating units to which the corporate asset is allocated.
Key figures
Message from the CEO
Profile
Strategy
Divisional Performance
Group Performance
Governance
Report of the Supervisory Board
Financial Statements
Other Information
Other Information

122 FUGRO N.V. ANNUAL REPORT 2017
the service costs in the period in which the related services
are rendered.
When the benefits of a plan are changed or when a plan is
curtailed, then resulting change in benefit that relates to past
service or the gain or loss on curtailment is recognised
immediately in profit or loss. The Group recognises gains
and losses on the settlement of a defined benefit plan when
the settlement occurs.
5.19.3 Other long-term employee benefits
The Group’s net obligation in respect of long-term employee
benefits, other than pension plans, is the amount of future
benefit that employees have earned in return for their service
in the current and prior periods; that benefit is discounted to
determine its present value, and the fair value of any assets
is deducted. At the reporting date, the discount rate is
determined by reference to the yield on AA credit-rated
corporate bonds that have maturity dates approximating the
terms of the Group’s obligations and that are denominated
in the same currency in which the benefits are expected to
be paid. The actuarial calculations are performed using the
projected unit credit method. Any actuarial gains or losses
are recognised in profit or loss in the period in which they
arise.
5.19.4 Share-based payments
The share incentive schemes allow Members of the Board of
Management and some assigned Group employees to
acquire shares in Fugro. The fair value of granted options
and shares (awards) is recognised as an employee expense,
with a corresponding increase in equity. The fair value is
determined on the date of grant and is spread over the
period during which the employees (share options) and the
members of the Board of Management and other selected
senior employees (performance shares and options) provide
services and become unconditionally entitled to the share
options or shares. The amount recognised as an expense is
adjusted to reflect the number of awards for which the
related non-market performance and service vesting
conditions are expected to be met, such that the amount
ultimately recognised as an expense is based on the
number of awards that meet these conditions at the vesting
date.
The expenses recognised for the conditionally awarded
share options and shares are adjusted annually to reflect the
actual number shares that are likely to vest based on the
related service and non-market performance conditions.
5.19 Employee benefits
5.19.1 Defined contribution plans
A defined contribution plan is a post-employment benefit
plan under which an entity pays fixed contributions into a
separate entity and will have no legal or constructive
obligation to pay further amounts. Obligations for
contributions to defined contribution pension plans are
recognised as an employee benefit expense in profit or loss
in the periods during which services are rendered by
employees. Prepaid contributions are recognised as an
asset to the extent that a cash refund or a reduction in future
payments is available. Contributions to a defined
contribution plan that are due more than twelve months
after the end of the period in which the employees render
the service are discounted to their present value.
5.19.2 Defined benefit plans
A defined benefit plan is a post-employment benefit plan
other than a defined contribution plan. The Group’s net
obligation in respect of defined benefit pension plans is
calculated separately for each plan by estimating the
amount of future benefit that employees have earned in the
current and prior periods, discounting that amount and
deducting the fair value of any plan assets. The discount
rate is the yield at the reporting date on AA credit-rated (high
quality) corporate bonds that have maturity dates
approximating the terms of the Group’s obligations and that
are denominated in the same currency in which the benefits
are expected to be paid. The calculation is performed by
qualified independent actuaries using the projected unit
credit method. When the calculation results in a potential
asset for the Group, the recognised asset is limited to the
present value of economic benefits available in the form of
any future refunds from the plan or reductions in future
contributions to the plan. In order to calculate the present
value of economic benefits, consideration is given to any
minimum funding requirements that apply to any plan in the
Group. An economic benefit is available to the Group if it is
realisable during the life of the plan, or on settlement of the
plan liabilities.
Actuarial gains and losses arising from experience
adjustments and changes in actuarial assumptions are
charged or credited to equity in other comprehensive
income in the period in which they arise. Past-service costs
are recognised immediately in profit or loss. Employee
contributions for which the amount is independent of the
number of years of service are recognised as a reduction of
Key figures
Message from the CEO
Profile
Strategy
Divisional Performance
Group Performance
Governance
Report of the Supervisory Board
Financial Statements
Other Information

FUGRO N.V. ANNUAL REPORT 2017 123
5.22 Revenue
Revenue comprises the fair value of the consideration
received or receivable for the sale of goods and services
rendered in the ordinary course of the Group’s activities.
Revenue is shown net of value-added tax, rebates and
discounts and after eliminating sales within the Group.
The Group recognises revenue when persuasive evidence
exists, usually in the form of an executed sales agreement,
the amount of revenue can be measured reliably, it is
probable that future economic benefits will flow to the entity
and when specific criteria have been met for each of the
Group’s activities as described below. The Group bases its
estimates on historical results, taking into consideration the
type of customer, the type of transaction and the specifics
of each arrangement.
Revenue from sales of goods of seismic data, software
licences and subscription income do not qualify as a
significant category of revenue as referred to in IAS 18.35
(b); however for completeness sake the relating revenue
recognition policies are set out in accounting policies 5.22.2
and 5.22.3.
5.22.1 Services rendered
Revenue from services rendered to third parties relate to
fixed price contracts and ‘cost plus’ contracts (mainly daily
rates or rates per (square) kilometre). This revenue is
recognised in profit or loss in proportion to the percentage
of completion of the transaction at the reporting date.
The percentage of completion is based on the input
measure and is generally determined as a percentage of the
contract costs incurred in relation to the total estimated
contract costs (as this method is most appropriate for the
majority of the services provided by the Group) and are only
recognised to the extent of costs incurred that are likely to
be recoverable. An expected loss on a contract is
recognised immediately in profit or loss.
5.22.2 Sales of goods
Revenue from the sale of goods is recognised when the
significant risks and rewards of ownership have been
transferred to the buyer, recovery of the consideration is
probable, the associated costs of goods can be estimated
reliably, and there is no continuing management involvement
with the goods.
No revenue is recognised if there are significant
uncertainties regarding recovery of the consideration due or
5.20 Provisions for other liabilities and charges
A provision is recognised if, as a result of a past event,
the Group has a present legal or constructive obligation that
can be estimated reliably, and it is probable that an outflow
of economic benefits will be required to settle the obligation.
Provisions for other liabilities and charges are determined by
discounting the expected future cash flows at a pre-tax rate
that reflects current market assessments of the time value of
money and, where appropriate, the risks specific to the
liability. The unwinding of the discount is recognised as
finance expenses.
5.20.1 Onerous contracts
A provision for onerous contracts is recognised when the
expected benefits to be derived by the Group from a
contract are lower than the unavoidable cost of meeting its
obligations under the contract. The provision is measured at
the present value of the lower of the expected cost of
terminating the contract and the expected net cost of
performing under the contract. The expected net cost of
performing under the contract is based on cash flow
calculations discounted using a rate that reflects current
market assessments of the time value of money. Before a
provision is established, the Group recognises any
impairment loss on the assets associated with and/or
dedicated to that contract.
5.20.2 Restructuring cost
A provision for restructuring cost is recognised when the
Group (i) has a detailed formal plan for the restructuring
identifying at least the business or part of a business
concerned, the principal locations affected, the location,
function, and approximate number of employees who
will be compensated for terminating their services,
the expenditures that will be undertaken, and when the plan
will be implemented; and (ii) has raised a valid expectation in
those affected that it will carry out the restructuring by
starting to implement that plan or announcing its main
features to those affected by it.
5.21 Trade and other payables
Trade and other payables represent liabilities for services
and goods provided to the group prior to the end of financial
year which are unpaid. Trade and other payables are
recognised initially at fair value net of any directly attributable
transaction costs. Subsequent to initial recognition they are
measured at amortised cost using the effective interest
method.
Key figures
Message from the CEO
Profile
Strategy
Divisional Performance
Group Performance
Governance
Report of the Supervisory Board
Financial Statements
Other Information
Other Information

124 FUGRO N.V. ANNUAL REPORT 2017
receivable and the present value of the receivable is
recognised as unearned finance income.
Payments made under operating leases are recognised in
profit or loss on a straight-line basis over the term of the
lease. Lease incentives received are recognised as an
integral part of the total lease expense, over the term of the
lease.
Minimum lease payments made under finance leases are
apportioned between the finance expense and the reduction
of the outstanding liability. The finance expense is allocated
to each period during the lease term so as to produce a
constant periodic rate of interest on the remaining balance
of the liability.
At inception of an arrangement, the Group determines
whether such an arrangement is or contains a lease.
A specific asset is the subject of a lease if fulfilment of the
arrangement is dependent on the use of that specified
asset. An arrangement conveys the right to use the asset if
the arrangement conveys to the Group the right to control
the use of the underlying asset. At inception or upon
reassessment of the arrangement, the Group separates
payments and other consideration required by such an
arrangement into those for the lease and those for other
elements on the basis of their relative fair values. If the
Group concludes for a finance lease that it is impracticable
to separate the payments reliably, then an asset and a
liability are recognised at an amount equal to the fair value of
the underlying asset. Subsequently the liability is reduced as
payments are made and an imputed finance charge on the
liability is recognised using the Group’s incremental
borrowing rate.
5.23.3 Net finance income and expenses
Net finance income and expenses consist of finance
expenses, finance income and foreign currency gains and
losses. Finance expenses comprise interest expense on
borrowings, unwinding of the discount on provisions, losses
on disposal of available-for-sale financial assets, fair value
losses on financial assets at fair value through profit or loss,
impairment losses recognised on financial assets (other than
trade receivables), and losses on hedging instruments that
are recognised in profit or loss.
Finance income comprises interest income on funds
invested (including available-for-sale financial assets),
dividend income, gains on the disposal of available-for-sale
associated costs. An expected loss on a contract is
recognised immediately in profit or loss.
5.22.3 Software licences and subscription income
Software licences and subscription income are recognised
in the period during which the underlying services have
been provided, using a straight line basis over the term of
the contract.
5.22.4 Net revenue own service (revenue less third
party costs)
Net revenue own service comprises all revenue minus costs
incurred with third parties related to the employment of
resources (in addition to the resources deployed by the
Group) and other third party cost such as charter-lease
costs and other cost required for the execution of various
projects.
5.22.5 Other income
Other income consists of income not related to the key
business activities of the Group, such as income from the
sale of non-monetary assets and/or liabilities, exceptional
and/or non-recurring income.
5.22.6 Government grants
Government grants are recognised initially as deferred
income at fair value when there is reasonable assurance that
they will be received and the Group will comply with the
conditions associated with the grant. Grants that
compensate the Group (partly) for expenses incurred are
recognised in profit or loss on a systematic basis in the
same periods in which the expenses are recognised. Grants
that (partly) compensate the Group for the cost of an asset
are recognised in profit or loss on a systematic basis over
the useful life of the asset.
5.23 Expenses
5.23.1 Third party costs
Third party costs are matched with related revenues on
contracts and accounted for on a historical cost basis.
5.23.2 Lease payments
A lease is an agreement whereby the lessor conveys to
the lessee in return for a payment, or series of payments,
the right to use an asset for an agreed period of time.
When assets are leased out under a finance lease,
the present value of the lease payments is recognised
as a lease receivable. The difference between the gross
Key figures
Message from the CEO
Profile
Strategy
Divisional Performance
Group Performance
Governance
Report of the Supervisory Board
Financial Statements
Other Information

FUGRO N.V. ANNUAL REPORT 2017 125
date. Deferred tax assets and liabilities are offset if there is a
legally enforceable right to offset current tax liabilities and
assets, and they relate to income taxes levied by the same
tax authority on the same taxable entity, or on different tax
entities, but they intend to settle current tax liabilities and
assets on a net basis or their tax assets and liabilities will be
realised simultaneously.
A deferred tax asset is recognised for unused tax losses,
tax credits and deductible temporary differences, to the
extent that it is probable that future taxable profits will be
available against which the asset can be utilised. Deferred
tax assets are reviewed at each reporting date and are
reduced to the extent that it is no longer probable that the
related tax benefit will be realised.
Additional income taxes that arise from the distribution of
dividends are recognised at the same time as the liability to
pay the related dividend.
In determining the amount of current and deferred tax the
Group takes into account the impact of uncertain tax
positions and whether additional taxes and interest may be
due. The Group believes that its accruals for tax liabilities
are adequate for all open tax years based on its assessment
of many factors, including interpretations of tax law and prior
experience. This assessment relies on estimates and
assumptions and may involve a series of judgements about
future events. New information may become available that
causes the Group to change its judgement regarding the
adequacy of existing tax liabilities; such changes to tax
liabilities will impact tax expense in the period that such a
determination is made.
5.25 Statement of cash flows
The consolidated statement of cash flows is prepared using
the indirect method. The cash flow statement distinguishes
between operating, investing and financing activities.
Cash flows in foreign currencies are converted at the
exchange rate at the dates of the transactions. Currency
exchange differences on cash held are separately shown.
Payments and receipts of corporate taxes are included as
cash flow from operating activities and interest paid is
shown as cash flow from operating activities. Cash flows as
a result from acquisition/divestment of financial interest in
subsidiaries and equity accounted investees are included as
cash flow from investing activities, taking into account the
available cash in these interests. Dividends paid are part of
the cash flow from financing activities.
financial assets, fair value gains on financial assets at fair
value through profit or loss, gains on the re-measurement
to fair value of any pre-existing interest in an acquiree,
and gains on hedging instruments that are recognised in
profit or loss. Interest income is recognised in profit or loss
as it accrues, using the effective interest method. Dividend
income is recognised in profit or loss on the date the
Group’s right to receive payment is established, which in the
case of quoted shares is normally the ex-dividend date.
Borrowing costs that are not directly attributable to the
acquisition, construction or production of a qualifying asset
are recognised in profit or loss using the effective interest
method.
Foreign currency gains and losses are reported on a net
basis as either finance income or finance cost depending on
whether foreign currency movements are in a net gain or net
loss position.
5.24 Income tax
Income tax expense comprises current and deferred tax.
Current tax and deferred tax is recognised in profit or loss
except to the extent that it relates to a business
combination, or items recognised directly in equity or in
other comprehensive income.
Current tax is the expected tax payable or receivable on the
taxable income or loss for the year, using tax rates enacted
or substantively enacted at the reporting date, and any
adjustment to tax payable in respect of previous years.
Current tax payable also includes any tax liability arising
from the declaration of dividends.
Deferred tax is recognised in respect of temporary
differences between the carrying amounts of assets and
liabilities for financial reporting purposes and the amounts
used for taxation purposes. Deferred tax is not recognised
for: taxable temporary differences arising on the initial
recognition of goodwill; temporary differences on the initial
recognition of assets or liabilities in a transaction that is not
a business combination and that affects neither accounting
nor taxable profit or loss; and temporary differences related
to investments in subsidiaries and jointly controlled entities
to the extent that it is probable that they will not reverse in
the foreseeable future. Deferred tax is measured at the tax
rates that are expected to be applied to temporary
differences when they reverse, based on the laws that have
been enacted or substantively enacted by the reporting
Key figures
Message from the CEO
Profile
Strategy
Divisional Performance
Group Performance
Governance
Report of the Supervisory Board
Financial Statements
Other Information
Other Information

126 FUGRO N.V. ANNUAL REPORT 2017
NOTES TO FINANCIAL STATEMENTS
5.26 Segment reporting
An operating segment is a component of the Group that
engages in business activities from which it may earn
revenues and incur expenses, including revenues and
expenses that relate to transactions with any of the Group’s
other components. All operating segments’ operating results
are reviewed regularly by the board of management to make
decisions about resources to be allocated to the segment
and to assess its performance, and for which discrete
financial information is available.
Inter-segment pricing is determined on an arm’s length
basis. Segment results, assets and liabilities include items
directly attributable to a segment as well as those that can
be allocated on a reasonable basis. Segment capital
expenditure is the total cost incurred during the year to
acquire property, plant and equipment, and intangible
assets other than goodwill.
5.26.1 Operating segments
As a consultant with operations throughout the world,
the Group delivers its services to clients located all over the
globe and collects and interprets data related to the Earth’s
surface and the soil and rock beneath. On the basis of this
data the Group provides geo-intelligence and asset integrity
solutions, generally for purposes related to the oil and gas,
building and infrastructure, renewables, power, nautical and
mining markets.
In 2016, Fugro decided to regroup the geotechnical, survey
and subsea services activities into Marine and Land
divisions, with the aim to better serve the increasing
demand from customers for integrated services.
The organisational structure, management structure and
internal reporting structure have changed accordingly as of
2017. The Geoscience division remains unchanged.
Based on Fugro’s evaluation on how the company allocates
resources and analyses performance in the new
organisational structure, the company has revised the
presentation of its operating segments by the identification
of three operating and reportable segments: Marine,
Land and Geoscience. The performance of the Marine,
Land and Geoscience divisions are separately reported to
and reviewed by the Board of Management (as the Chief
Operating Decision Maker: CODM). For each of the
divisions, the Board of Management reviews internal
management reports on a monthly basis. Previously, there
were four operating and reportable segments: Geotechnical,
Survey, Subsea Services and Geoscience. The comparative
figures of segment information have been restated
accordingly for comparison purposes.
The segments are managed on a worldwide basis,
and operate in five principal geographical areas: Europe,
Africa, Middle East/India, Asia Pacific and the Americas.
In presenting information on the basis of geographical areas,
segment revenue is based on the geographical location of
operating companies. The allocation of segment assets is
based on the geographical location of the operating
company using the assets. Information regarding the results
of each reportable segment is included below. Performance
is measured based on segment profit or loss before income
tax, as included in the internal management reports that are
reviewed by the board of management. Segment profit or
loss is used to measure performance as management
believes that such information is the most relevant in
evaluating the results of certain segments relative to other
entities that operate within these industries.
Fugro allocates all other corporate expenses and finance
income to the reportable segment profit (or loss) before
income tax of the respective operating segments pro-rate
based on net revenue. Assets that are used by more than
one operating segment and liabilities that relate to more
operating segments are pro-rate allocated based on net
revenues to the respective reporting segments as well.
The following summary describes the operations in each of
the Group’s reportable segments:
Marine
The Marine division encompasses the acquisition of soil
samples (geotechnical drilling) and related laboratory testing,
and the mapping of soil characteristics using non-invasive
techniques (geophysical surveys) including the related
interpretation and visualisation. Its services include
geoconsulting, general purpose navigation charts and
environmental, meteorological & oceanographic
measurement services. The division also offers positioning
signals and services, construction support, monitoring and
forecasting services, drill support, remote systems
technology, and inspection, repair and maintenance
services (IRM). The division also had construction and
installation related activities, which were ended per
December 2017.
Key figures
Message from the CEO
Profile
Strategy
Divisional Performance
Group Performance
Governance
Report of the Supervisory Board
Financial Statements
Other Information

FUGRO N.V. ANNUAL REPORT 2017 127
The division almost fully consists of Fugro’s 60% stake in
Seabed Geosolutions (100% consolidated). Seabed
Geosolutions supports the optimal development and
production of offshore oil and gas fields by providing high
quality seismic data collected directly on the seabed. These
data are used for detailed reservoir characterisation,
monitoring of the impact of production, and detection of
potential geohazards. The remaining shares of Seabed are
held by CGG. Clients of Seabed are oil and gas companies.
The Geoscience division also contains some indirect
interests in Australian exploration projects, via a profit
sharing agreement with Finder Exploration Pty.
Land
The Land division services encompass the determination of
soil characteristics via cone penetration testing and/or the
acquisition of soil samples (geotechnical drilling) and related
laboratory testing. These services are offered both onshore
and near shore. In addition, the division provides material
testing, and water and geo-consulting services. The division
also offers integrity solutions (monitoring, analysis,
modelling) for clients in the electrical power business,
railroads, roads and oil & gas infrastructure.
Geoscience
The Geoscience division provides services to acquire
geophysical data that are used for the appraisal,
development and production of offshore natural resources.
Operating segments(EUR x 1,000) Marine Land Geoscience Total
2017 2016 2017 2016 2017 2016 2017 2016
Segment revenue 1,029,466 1,177,390 493,845 531,321 74,078 172,983 1,597,389 1,881,694
Of which inter-segment revenue 82,205 81,294 17,792 24,526 - - 99,997 105,820
Revenue 947,261 1,096,096 476,053 506,795 74,078 172,983 1,497,392 1,775,874
Segment result 32,576 82,433 38,937 16,596 9,931 55,937 81,444 154,966
Depreciation (89,492) (113,746) (18,348) (20,204) (19,102) (38,416) (126,942) (172,366)
Amortisation (1,641) (3,083) (2,724) (2,466) (1,695) (3,013) (6,060) (8,562)
Impairments 2,075 (126,515) (2,200) (14,040) (39) (52,161) (164) (192,716)
Result from operating activities (EBIT) (56,482) (160,911) 15,665 (20,114) (10,905) (37,653) (51,722) (218,678)
EBIT in % of revenue (6.0) (14.7) 3.3 (4.0) (14.7) (21.8) (3.5) (12.3)
Finance income 8,890 12,540 2,130 2,758 7,068 3,826 18,088 19,124
Finance expense (60,941) (64,841) (16,219) (13,974) (11,667) (11,239) (88,827) (90,054)
Share of profit/(loss) of equity-accounted investees 2,462 (2,742) 2,250 519 - - 4,712 (2,223)
Reportable segment profit/(loss) before income tax (106,071) (215,954) 3,826 (30,811) (15,504) (45,066) (117,749) (291,831)
Income tax (27,947) (13,442) (19,390) (7,457) (258) 11,747 (47,595) (9,152)
Profit/(loss) for the period from discontinued operations - - - - 5,070 - 5,070 -
Profit/(loss) for the period (134,018) (229,396) (15,564) (38,268) (10,692) (33,319) (160,274) (300,983)
Capital employed 820,641 973,980 218,912 231,176 144,555 136,018 1,184,108 1,341,174
Reportable segment assets 1,249,648 1,450,642 431,408 451,918 217,248 271,889 1,898,304 2,174,449
Reportable segment liabilities 762,227 828,395 304,241 224,374 78,172 131,571 1,144,640 1,184,340
Capital expenditure, property, plant and equipment 76,376 49,870 11,913 10,227 19,685 32,396 107,974 92,493
Capital expenditure software and other intangible assets 1,028 1,743 128 102 4,767 4,207 5,923 6,052
Other additions to intangible assets - - - - 3,249 5,060 3,249 5,060
Movement in other investments (2,650) 15,388 877 5,189 (831) (78,253) (2,604) (57,676)
Key figures
Message from the CEO
Profile
Strategy
Divisional Performance
Group Performance
Governance
Report of the Supervisory Board
Financial Statements
Other Information
Other Information

128 FUGRO N.V. ANNUAL REPORT 2017
Other material items 2017 in respect of elements of profit or loss
(EUR x 1,000)
Reportable
segment totals
Adjustments
and other
unallocated
amounts
Consolidated
totals
Finance income 18,088 (12,680) 5,408
Finance expense (88,827) 12,680 (76,147)
Other material items 2016 in respect of elements of profit or loss
(EUR x 1,000)
Reportable
segment totals
Adjustments
and other
unallocated
amounts
Consolidated
totals
Finance income 19,124 (10,244) 8,880
Finance expense (90,054) 10,244 (79,810)
5.27 Government grants
The company has not been awarded any significant
government grants in 2017 and 2016.
5.28 Divestment of trenching and cable laying
assets
On 30 November 2017, Fugro finalised the divestment of its
trenching and cable laying assets in exchange for a 23.6%
interest in Global Marine Holdings LLC (Global), which
interest thereby became an associate of Fugro, and a
vendor loan of EUR 6.3 million. The divested assets were
part of the Marine division. At the date of the transaction,
Global became an associate of Fugro and is accounted for
as an equity-accounted investee. Global is located at
Delaware in the United States. The associate forms part of
Fugro’s Marine division. HC2 Holdings Inc., a listed company
on the New York Stock Exchange, is the majority owner of
Geographical areas(EUR x 1,000) Europe Africa Middle East/India Asia Pacific Americas Total
2017 2016 2017 2016 2017 2016 2017 2016 2017 2016 2017 2016
Revenue from external
customers 581,193 629,045 57,618 89,743 220,655 299,176 303,058 384,822 334,868 373,088 1,497,392 1,775,874
Non-current assets 617,824 656,464 10,013 34,802 84,457 74,105 202,420 258,909 241,576 309,629 1,156,290 1,333,909
Global. Global Marine is a supplier of subsea cable
installation and maintenance services in four market
segments: telecoms, offshore renewables, power and oil &
gas. The transaction is a major step forward in delivering on
Fugro’s Building on Strength strategic objective of ending its
active participation in the installation and construction part
of the subsea market. Furthermore, Fugro will become the
preferred provider of marine site characterisation and asset
integrity services to Global (on an arm’s length basis).
The trenching and cable laying assets that were divested
consist of a vessel, two trenchers and two remote operated
vehicles including the employees involved on those assets.
An amount of EUR 2.4 million has been paid to Global in
connection with the associated normalised working capital
for the vessel and trenchers (bunker fuel, lubes, spare parts).
The transaction costs involved for this divestment amounted
to EUR 1.4 million. Previously, the trenchers and vessel were
partially impaired. The divestment formed an indication that
these impairment losses no longer exist. Accordingly,
the recoverable amount of such assets was EUR 57.1
million, based on fair value less cost of disposal.
An impairment loss of EUR 11.7 million has been reversed.
Refer to note 5.32.
Fugro’s share in the profit or loss and other comprehensive
income, which latter mainly relate to currency translation
differences, of this associate amounts to EUR 0.4 million
(loss) and EUR 0.6 million (gain) respectively. (Refer to note
5.39 investments in equity-accounted investees.) No
dividends have been received from Global in 2017.
The carrying amount of this associate amounts to EUR 54.8
million as at 31 December 2017. Fugro has no significant
commitments to this associate.
Key figures
Message from the CEO
Profile
Strategy
Divisional Performance
Group Performance
Governance
Report of the Supervisory Board
Financial Statements
Other Information

FUGRO N.V. ANNUAL REPORT 2017 129
5.31 Personnel expenses
(EUR x 1,000) 2017 2016
Wages and salaries 546,259 597,493
Compulsory social security contributions 50,499 52,091
Equity-settled share-based payments 3,103 6,935
Contributions to defined contribution
plans 20,073 23,794
Expense related to defined benefit plans 10,042 13,809
Increase/(decrease) in liability for
long-service leave (404) 314
629,572 694,436
5.31.1 Share-based payments
Long-term incentive plan
The share-based payments plans of Fugro N.V. can be
divided into a long-term incentive plan (LTIP), which includes
the annual grant of conditional performance shares and
(until 2017) conditional performance options, and a share
option scheme, which includes the annual grant of
unconditional options.
At the annual general meeting (AGM) held in May 2017,
the LTIP was adjusted. One of the adjustments was a shift of
the grant date to the 5th trading day following the
publication of the annual results, instead of 31 December.
Furthermore, under the LTIP going forward, only conditional
performance shares will be granted, instead of a mix of
performance shares and performance options.
The performance period of three years remains the same.
Granting under the adjusted LTIP will for the first time take
place in early 2018, after the publication of the 2017 annual
results. Fugro also decided to shift the grant date under the
share option scheme to the same date in further alignment
with the LTIP. The share price as measurement input for the
fair value for the options will be determined based on the
average closing price of 5 days preceding the grant date
instead of the share price at year-end date of the year of
grant. Consequently, as of 2018, the costs of granted
performance shares and share options shall be recognised
in profit or loss over the total service period of three years.
Previously, this was four years. As a result, no new
performance awards and share options have been granted
as at 31 December 2017, and the costs recognised in profit
or loss 2017 only relate to performance awards and share
options previously granted.
5.29 Third party costs
(EUR x 1,000) 2017 2016
Cost of suppliers 458,311 477,403
Operational lease expense* 61,172 91,760
Other rentals 45,465 49,832
Onerous contracts 17,658 (6,087)
Other costs 39,330 65,849
621,936 678,757
* The operational lease expense includes an amount of EUR 12.5 million (2016: EUR 31.7 million) relating to maintenance and repair. Refer to note 5.49.6.
Cost of suppliers comprises costs of third party equipment
hire, fuel, demobilisation and mobilisation, consumables and
third party personnel. Costs of other rentals relate to any
lease or agreement with a term of less than one year or any
project-based lease or agreement with a term that begins at
the start of a specific project and ends upon completion of
such project. Other costs mainly relate to withholding taxes
on projects and subcontracted cost at request of the client
which can be recharged to the client directly.
For the provisions relating to the onerous contracts,
reference is made to note 5.51.
5.30 Other income
(EUR x 1,000) 2017 2016
Settlements claims 6,453 726
Government grants 2,482 2,971
Gain on sale of property, plant and
equipment 14,352 5,364
Reversal of the asset retirement
obligation - 14,056
Sundry income 8,515 7,286
31,802 30,403
Key figures
Message from the CEO
Profile
Strategy
Divisional Performance
Group Performance
Governance
Report of the Supervisory Board
Financial Statements
Other Information
Other Information

130 FUGRO N.V. ANNUAL REPORT 2017
which is evaluated on a yearly basis, consists of: Arcadis,
Boskalis Westminster, Core Laboratories, Fluor, John Wood
Group, Oceaneering International, Schlumberger, Subsea 7,
TechnipFMC, Transocean and WhorleyParsons. Vesting is
subject to the following performance incentive zone:
Total shareholder return ranking (weight: 37.5%)
Vesting
(% of conditional award)
1 175%
2 150%
3 125%
4 100%
5 75%
6 50%
7 25%
8-12 0%
The performance period is three years starting at the first of
January of the year following the grant date. The costs of the
previously granted performance awards (and share options)
are recognised in profit or loss over the total service period
of four years.
As at 31 December 2017, Fugro granted no performance
options (2016: 257,200) and awarded no performance
shares (2016: 128,600). The average remaining term of the
performance options outstanding is 4.3 years as at
31 December 2017 (31 December 2016: 5.2 years).
As at 31 December the following performance options were
outstanding:
Long-term incentive plan
The long-term incentive plan for members of the Board of
Management, and other selected senior employees,
effective as of 1 January 2014, consists of performance
shares and consisted of performance options. Vesting is
subject to continuous employment and performance
measurement after three years.
The performance targets and their relative weights for the
performance awards are as follows:
■ ROCE (weight 37.5%) is defined as net operating
profit after tax (NOPAT) as percentage of average
total equity plus net interest bearing debt, in the last
year of the three-year period, excluding multi-client
business.
■ TSR (weight 37.5%) is defined as share price
increase, including reinvested dividends. TSR is
measured over a three-year period based on a
three-month average period measured immediately
prior to the start and end date of the performance
period. The relative position within the peer group
determines the vesting level of the underlying
instruments.
■ Strategic target (weight 25%).
The Supervisory Board will set each year at granting the
performance criteria with respect to ROCE, taking into
account the ROCE target for the year of vesting.
TSR measurement is related to share price performance
versus a specific peer group of companies, which has been
set by the Supervisory Board under guidance from an
external consultant. The composition of the peer group,
Year of issue Duration
Number of
participants Granted
Outstanding at
01-01-2017
Additional
grant in 2017
Forfeited in
2017
Exercised in
2017
Outstanding at
31-12-2017
Exercisable at
31-12-2017
Exercise price
(EUR)
2014 6 years 22 158,500 152,889 - 4,410 - 148,479 - 17.26
2015 6 years 39 219,200 213,500 - 24,622 - 188,878 - 15.06
2016 6 years 44 261,200 257,200 4,000 33,013 - 228,187 - 14.55
638,900 623,589 4,000 62,045 - 565,544 -
Key figures
Message from the CEO
Profile
Strategy
Divisional Performance
Group Performance
Governance
Report of the Supervisory Board
Financial Statements
Other Information

FUGRO N.V. ANNUAL REPORT 2017 131
As at 31 December the following performance shares were outstanding:
Year of issue Duration
Number of
participants Granted
Outstanding at
01-01-2017
Additional
grant in 2017
Forfeited in
2017
Vested in
2017
Outstanding at
31-12-2017
2014 3 years 22 79,250 76,444 - 2,206 - 74,238
2015 3 years 39 109,600 106,750 - 12,312 - 94,438
2016 3 years 44 130,600 128,600 2,000 16,508 - 114,092
319,450 311,794 2,000 31,026 - 282,768
The expected volatility is based on the annualised historical
volatility prior to the date of grant, and the dividend yield is
estimated based on the historic dividend yield on Fugro
shares at the date of grant.
The total costs allocated to 2017 for the performance
awards granted in 2014, 2015 and 2016 amount to
EUR 950,034 (2016: EUR 1,198,312).
Share option scheme
Fugro’s share option scheme allows some assigned Group
employees, who do not participate in the new long-term
incentive plan, to acquire shares in Fugro. A share option
entitles the employee to purchase ordinary shares in Fugro.
The granting of options is dependent on the contribution of
the relevant employee to the long-term development of the
company. The vesting period for the previously granted
options was three years starting at the first of January of the
year following the grant date. The vesting period of the
options to be granted in 2018 is three years starting at the
grant date. The option period is six years. The options
granted are not subject to any further conditions of exercise,
except that the option holder is still employed by Fugro or
one of its subsidiaries. The usual terms and conditions are
applicable including exceptions in connection with
retirement, long-term disability, death and change of control.
The Board of Management and the Supervisory Board
decided annually on the granting of options. Options were
granted annually on 31 December and the option exercise
price was equal to the closing price of the share certificates
traded on Euronext Amsterdam on the last trading day of
the calendar year. The costs of the options are recognised in
profit or loss over the related period of employment (four
The grant date fair value of the 50% portion with a TSR
performance condition has been derived using a Monte
Carlo Simulation model. The fair value of the portion with a
ROCE performance condition (50%) has been determined
using the Black & Scholes option pricing formula.
No performance shares have been granted as per
31 December 2017. The weighted average grant date fair
value for 2016 amounted to EUR 14.33 for the performance
shares. The significant inputs into the valuation models are:
2017 2016
Performance
Shares/
Options
Performance
Shares/
Options
Share price (in €) - 14.55
Exercise price options - 14.55
Volatility (%) - 62.8%
TSR correlation - 41.5%
Dividend yield (%) - 0.0%
Vesting period (in years) - 3
Risk-free interest rate (%) - (0.74%)
Expected term shares/options (in years) - 3/6
Costs of granted performance shares
and performance options at the end of
2014 in EUR 225,862 236,047
Costs of granted performance shares
and performance options at the end of
2015 in EUR 301,325 443,342
Costs of granted performance shares
and performance options at the end of
2016 in EUR 422,847 518,923
Key figures
Message from the CEO
Profile
Strategy
Divisional Performance
Group Performance
Governance
Report of the Supervisory Board
Financial Statements
Other Information
Other Information

132 FUGRO N.V. ANNUAL REPORT 2017
years). As of 2018, granting will for the first time take place in early 2018 instead of 31 December, after the publication of the
2017 annual results. The costs of granted options shall be recognised in profit or loss over the total service period of three
years. In 2017, therefore, no new share options have been granted to employees. In 2017, no options have been exercised.
As at 31 December the following options were outstanding:
Year of issue Duration
Number of
participants Granted
Outstanding at
01-01-2017
Forfeited in
2017
Exercised in
2017
Outstanding at
31-12-2017
Exercisable at
31-12-2017
Exercise price
(EUR)
2011 6 years 684 1,161,100 845,150 845,150 - - - 44.895
2012 6 years 674 1,093,300 824,150 69,300 - 754,850 754,850 44.520
2013 6 years 621 956,925 839,430 88,225 - 751,205 751,205 43.315
2014 6 years 654 770,638 690,120 59,902 - 630,218 630,218 17.260
2015 6 years 654 534,470 510,970 43,390 - 467,580 - 15.060
2016 6 years 695 571,850 571,850 34,550 - 537,300 - 14.550
5,088,283 4,281,670 1,140,517 - 3,141,153 2,136,273
The outstanding options as at 31 December 2017 have an exercise price ranging from EUR 14.55 to EUR 44.52. The average
remaining term of the options is 2.8 years (2016: 3.2 years). The movement during the year of options and the average exercise
price is as follows:
2017 2016
Weighted
average
exercise
price (EUR)
Number of
options
Weighted
average
exercise
price (EUR)
Number of
options
Options outstanding at 1 January 32.45 4,281,670 39.95 4,834,902
Forfeited during the period 41.24 1,140,517 55.65 1,125,082
Options granted during the period - - 14.55 571,850
Options outstanding at 31 December 29.25 3,141,153 32.45 4,281,670
Exercisable at 31 December 2,136,273 2,508,730
The fair value of the share options with only service conditions is determined by using a binomial model. Concerning the
estimate for early departure (forfeitures), different percentages for different categories of staff are used: Board of Management
0% (only performance shares and performance options as from 2014) and other management/employees 3% per annum.
The expected behaviour for exercising the options is estimated until the end of the exercise period. Expected volatility is
estimated by considering historical share price volatility.
Key figures
Message from the CEO
Profile
Strategy
Divisional Performance
Group Performance
Governance
Report of the Supervisory Board
Financial Statements
Other Information

FUGRO N.V. ANNUAL REPORT 2017 133
note 5.28. The amount of EUR 11,656 thousand comprises
a reversal of an impairment loss of the vessel of EUR 2,512
thousand and a reversal of two trenchers for the amount of
EUR 9,144 thousand. The loss of EUR 11,820 thousand
mainly consist of an impairment loss of EUR 9,232 thousand
on certain vessels within property, plant and equipment
(PP&E) in the Marine operating segment, which is due to
poor market conditions. Also, certain equipment within
PP&E that form part of the Land operating segment has
been impaired for EUR 2,200 thousand. Other items within
PP&E, such as buildings and other equipment, have been
impaired for EUR 388 thousand of which EUR 349 thousand
and EUR 39 thousand is related to the Marine and
Geoscience operating segments respectively.
No share options have been granted as per 31 December 2017. The inputs used in the measurement of the fair values at grant
date of the share options are the following:
2017 2016
Average fair value of the granted options during the year in EUR - 6.60
Exercise price (and fair value of shares at grant date) in EUR - 14.55
Expected volatility - 50%
Option term - 6 years
Expected dividends - 0.00%
Risk-free interest rate (based on government bonds) - (0.31%)
Costs of granted options at the end of 2013 in EUR - 2,873,577
Costs of granted options at the end of 2014 in EUR 712,546 967,486
Costs of granted options at the end of 2015 in EUR 632,054 820,648
Costs of granted options at the end of 2016 in EUR 808,072 858,633
Total 2,152,672 5,520,344
5.31.2 Number of employees
2017 2016
Netherlands Foreign Total Netherlands Foreign Total
Technical staff 611 6,854 7,465 641 7,068 7,709
Management and administrative staff 252 1,858 2,110 202 2,018 2,220
Temporary and contract staff 128 341 469 93 508 601
Number of employees at 31 December 991 9,053 10,044 936 9,594 10,530
Average number of employees during the year 964 9,323 10,287 940 10,305 11,245
5.32 Impairments
Intangible assets that have an indefinite useful life or
intangible assets not ready for use are not subject to
amortisation and are tested annually for impairment. Other
non-financial assets that are subject to depreciation and
amortisation are reviewed for impairment whenever events
or changes in circumstances indicate that the carrying
amount may not be recoverable.
In 2017, a total impairment loss of EUR 164 thousand has
been recognised comprising an impairment loss of
EUR 11,820 thousand, and a reversal of an impairment loss
of EUR 11,656 thousand that relates to the trenching and
cable laying assets divested in November 2017. Refer to
Key figures
Message from the CEO
Profile
Strategy
Divisional Performance
Group Performance
Governance
Report of the Supervisory Board
Financial Statements
Other Information
Other Information

134 FUGRO N.V. ANNUAL REPORT 2017
5.34 Net finance (income)/expenses
(EUR x 1,000) 2017 2016
Interest income on loans and receivables (5,408) (8,878)
Dividend income on available-for-sale
financial assets and other investments in
equity instruments - (2)
Finance income (5,408) (8,880)
Interest expense on financial liabilities
measured at amortised cost 48,032 64,993
Net change in fair value of financial
assets at fair value through profit or loss (143) 317
Net foreign exchange variance 28,258 14,500
Finance expense 76,147 79,810
Net finance (income)/expenses
recognised in profit or loss 70,739 70,930
In 2016, the following impairments were identified:
(EUR x 1,000) 2016
Goodwill Seabed Geosolutions 20,505
Goodwill Subsea Services 17,650
Goodwill Onshore Geotechnical Europe/Africa 12,933
Subtotal 51,088
Property, plant and equipment (PP&E) 117,480
Finder 16,633
Other intangible assets (and other non-financial fixed
assets) 7,515
Total 192,716
* As from 2017, the Subsea Services and Survey divisions have been integrated in the Marine division and the onshore geotechnical activities form part of the Land division. Last year, an amount of EUR 100.1 million of PP&E impairments was related to offshore geotechnical activities, Subsea Services and Survey divisions. The impairment of other intangibles was fully related to the offshore geotechnical activities. As from 2017, the offshore geotechnical activities form part of the Marine division.
5.33 Other expenses
(EUR x 1,000) 2017 2016
Maintenance and operational supplies 14,683 44,818
Indirect operating expenses 38,958 56,618
Occupancy costs 19,041 22,330
Property lease expense 20,213 24,328
Communication and office equipment 32,272 31,469
Write-off receivables 1,897 27,744
Restructuring costs 12,196 22,035
Research costs 2,103 (260)
Loss on disposal of property, plant and
equipment 482 303
Marketing and advertising costs 3,908 5,115
Other 50,489 43,618
Total 196,242 278,118
Other expenses include amongst others professional
services, training costs, audit fees, miscellaneous charges
and sundry costs. Certain adviser and other costs
amounting to EUR 0.8 million (2016: EUR 6.0 million),
included in other, are considered as exceptional item under
the covenant requirement. Refer to note 5.49.6. Audit fees,
as charged by EY, are disclosed in note 9.16.
Key figures
Message from the CEO
Profile
Strategy
Divisional Performance
Group Performance
Governance
Report of the Supervisory Board
Financial Statements
Other Information

FUGRO N.V. ANNUAL REPORT 2017 135
The table set below summarises the net finance cost recognised in other comprehensive income and how they are categorised
in the statement of changes in equity.
(EUR x 1,000) 2017 2016
Recognised in other comprehensive income
Net change in fair value of hedge of net investment in foreign operations 16,117 5,079
Foreign currency translation differences of foreign operations (116,498) 26,935
Foreign currency translation differences of equity-accounted investees (835) (1,425)
(101,216) 30,589
Net change in fair value of cash flow hedges transferred to profit or loss 103 288
Net change in fair value of available-for-sale financial assets 218 34
Total (100,895) 30,911
Recognised in:
Hedging reserve 103 288
Translation reserve (95,194) 27,308
Retained earnings 218 34
Non-controlling interests (6,022) 3,281
Total (100,895) 30,911
5.35 Income tax expense/(gain)
Recognised in profit or loss(EUR x 1,000) 2017 2016
Current income tax expense/(gain)
Current year 18,931 25,552
Adjustments for prior years (5) (11,902)
18,926 13,650
Deferred income tax expense/(gain)
Origination and reversal of tax losses and temporary differences 8,538 (5,419)
Change in tax rate 10,550 2,240
Recognition of previously unrecognised tax losses and temporary differences (7,297) (22,738)
Write down of deferred tax asset 16,386 27,820
Liability for undistributed foreign earnings (deferred) (48) (1,190)
Adjustments for prior years 540 (5,211)
28,669 (4,498)
Total income tax expense/(gain) 47,595 9,152
Key figures
Message from the CEO
Profile
Strategy
Divisional Performance
Group Performance
Governance
Report of the Supervisory Board
Financial Statements
Other Information
Other Information

136 FUGRO N.V. ANNUAL REPORT 2017
Reconciliation of effective tax rate(EUR x 1,000) 2017 % 2017 2016 % 2016
Profit/(loss) for the period from continuing operations (165,344) (300,983)
Income tax expense/(gain) 47,595 9,152
Profit/(loss) before income tax (117,749) (291,831)
Income tax using the weighted domestic average tax rates 29.1 (34,285) 30.8 (89,962)
Change in tax rate (8.9) 10,550 (0.8) 2,240
Recognition of previously unrecognised tax losses and temporary differences 2.2 (2,523) 7.8 (22,738)
Current year tax losses and tax credits not recognised (43.5) 51,199 (25.6) 74,692
Write down of deferred tax asset (13.9) 16,386 (9.5) 27,820
Non-deductible expenses (13.5) 15,852 (12.7) 37,119
Tax exempt income 6.3 (7,371) 1.5 (4,356)
Liability for undistributed foreign earnings (deferred) 0.0 (48) 0.4 (1,190)
Adjustments for prior years (deferred) 3.6 (4,234) 1.8 (5,211)
Adjustments for prior years (current) 0.0 (5) 4.1 (11,902)
Dividend and other income taxes (1.8) 2,074 (0.9) 2,640
(40.4) 47,595 (3.1) 9,152
The weighted domestic average tax rate is computed by multiplying the result before tax of each tax group with the applicable
local corporate income tax rates that vary from 0% to 35%. The decreased weighted domestic average tax rate when
compared to prior year is caused by a significant different mix of results in the various tax groups.
Income tax recognised in other comprehensive income and in equity(EUR x 1,000) 2017 2016
Before tax
Tax (expense)/
benefit Net of tax Before tax
Tax (expense)/
benefit Net of tax
Defined benefit plan actuarial gains (losses) 19,916 (2,891) 17,025 (14,758) 613 (14,145)
Net change in fair value of cash flow hedges transferred to
profit or loss 103 - 103 288 - 288
Net change in fair value of hedge of net investment in
foreign operations 16,117 - 16,117 5,079 - 5,079
Share-based payment transactions 3,103 - 3,103 6,935 - 6,935
Net change in fair value of available-for-sale financial assets 218 - 218 34 - 34
Subordinated unsecured convertible bonds 15,773 (3,943) 11,830 34,538 (8,822) 25,716
Foreign currency translation differences of foreign
operations and equity-accounted investees (109,355) (7,978) (117,333) 26,010 (500) 25,510
(54,125) (14,812) (68,937) 58,126 (8,709) 49,417
Reference is also made to note 5.41
Key figures
Message from the CEO
Profile
Strategy
Divisional Performance
Group Performance
Governance
Report of the Supervisory Board
Financial Statements
Other Information

FUGRO N.V. ANNUAL REPORT 2017 137
5.36 Current tax assets and liabilities
The net current tax liability of EUR 11,310 thousand (2016: EUR 11,176 thousand liability) represents the balance of current tax
assets and liabilities in respect of current and prior periods less advance tax payments.
5.37 Property, plant and equipment
(EUR x 1,000) 2017
Land and
buildings
Plant and
equipment Vessels
Fixed assets
under
construction Other Total
Cost
Balance at 1 January 2017 211,982 1,258,294 954,004 40,857 221,191 2,686,328
Investments 1,318 43,090 41,240 15,995 6,331 107,974
Transfers from fixed assets under construction - 8,606 30,690 (39,907) 611 -
Disposals (18,359) (67,170) (135,576) - (6,603) (227,708)
Effects of movement in foreign exchange rates (12,410) (69,997) (96,010) (836) (21,488) (200,741)
Transfers to assets classified as held for sale (10,676) - - - - (10,676)
Balance at 31 December 2017 171,855 1,172,823 794,348 16,109 200,042 2,355,177
Depreciation and impairment losses
Balance at 1 January 2017 88,070 1,072,593 522,040 - 197,633 1,880,336
Depreciation 5,773 71,642 37,975 - 11,552 126,942
Impairment loss (note 5.32) 56 (6,665) 6,720 - 53 164
Disposals (5,820) (53,076) (89,255) - (6,255) (154,406)
Effects of movement in foreign exchange rates (5,547) (62,511) (49,824) - (17,839) (135,721)
Transfers to assets classified as held for sale (5,833) - - - - (5,833)
Balance at 31 December 2017 76,699 1,021,983 427,656 - 185,144 1,711,482
Carrying amount
At 1 January 2017 123,912 185,701 431,964 40,857 23,558 805,992
At 31 December 2017 95,156 150,840 366,692 16,109 14,898 643,695
Key figures
Message from the CEO
Profile
Strategy
Divisional Performance
Group Performance
Governance
Report of the Supervisory Board
Financial Statements
Other Information
Other Information

138 FUGRO N.V. ANNUAL REPORT 2017
(EUR x 1,000) 2016
Land and
buildings
Plant and
equipment Vessels
Fixed assets
under
construction Other Total
Cost
Balance at 1 January 2016 213,625 1,267,914 948,416 38,865 235,716 2,704,536
Investments 2,124 34,751 40,906 10,285 4,427 92,493
Transfers from fixed assets under construction 440 5,646 145 (7,777) 1,546 -
Disposals (2,615) (51,889) (70,860) - (21,426) (146,790)
Effects of movement in foreign exchange rates (1,592) 1,872 35,397 (516) 928 36,089
Balance at 31 December 2016 211,982 1,258,294 954,004 40,857 221,191 2,686,328
Depreciation and impairment losses
Balance at 1 January 2016 81,429 977,174 458,337 - 201,011 1,717,951
Depreciation 6,806 108,901 39,964 - 16,695 172,366
Impairment loss (note 5.32) 2,193 36,153 78,714 - 420 117,480
Disposals (2,305) (50,617) (70,854) - (20,855) (144,631)
Effects of movement in foreign exchange rates (53) 982 15,879 - 362 17,170
Balance at 31 December 2016 88,070 1,072,593 522,040 - 197,633 1,880,336
Carrying amount
At 1 January 2016 132,196 290,740 490,079 38,865 34,705 986,585
At 31 December 2016 123,912 185,701 431,964 40,857 23,558 805,992
5.37.1 Impairment loss and subsequent reversal
The Group has assessed whether any impairment triggers exist for its property, plant and equipment. Reference is made to
note 5.32 Impairments.
5.37.2 Fixed assets under construction
This mainly relates to vessels. At 31 December 2017, capitalised borrowing costs related to the construction of vessels amounts
to nil (2016: EUR 1.8 million and interest rate of 4.5%).
5.37.3 Leased fixed assets
In 2016, Fugro entered into a finance lease arrangement for a certain vessel (Hugin Explorer). The total carrying amount of this
vessel is EUR 18.8 million as at 31 December 2017 (31 December 2016: EUR 23.9 million). Refer to note 5.49.4.
Key figures
Message from the CEO
Profile
Strategy
Divisional Performance
Group Performance
Governance
Report of the Supervisory Board
Financial Statements
Other Information

FUGRO N.V. ANNUAL REPORT 2017 139
5.38 Intangible assets
(EUR x 1,000) 2017
Goodwill Finder Software Other Total
Cost
Balance at 1 January 2017 853,037 38,671 27,977 86,902 1,006,587
Purchase of intangible assets - - 1,118 4,805 5,923
Other additions - 3,249 - - 3,249
Disposals - - (895) (86) (981)
Effect of movements in foreign exchange rates (59,641) (2,406) (2,121) (7,701) (71,869)
Balance at 31 December 2017 793,396 39,514 26,079 83,920 942,909
Amortisation and impairment losses
Balance at 1 January 2017 509,116 18,124 23,612 62,238 613,090
Amortisation - - 1,808 4,252 6,060
Disposals - - (895) (86) (981)
Effect of movements in foreign exchange rates (39,267) (1,071) (1,857) (5,390) (47,585)
Balance at 31 December 2017 469,849 17,053 22,668 61,014 570,584
Carrying amount
At 1 January 2017 343,921 20,547 4,365 24,664 393,497
At 31 December 2017 323,547 22,461 3,411 22,906 372,325
Key figures
Message from the CEO
Profile
Strategy
Divisional Performance
Group Performance
Governance
Report of the Supervisory Board
Financial Statements
Other Information
Other Information

140 FUGRO N.V. ANNUAL REPORT 2017
(EUR x 1,000) 2016
Goodwill Finder Software Other Total
Cost
Balance at 1 January 2016 851,005 32,469 33,766 80,662 997,902
Purchase of intangible assets - - 1,910 4,142 6,052
Other additions - 5,060 - - 5,060
Disposals - - (8,099) (125) (8,224)
Effect of movements in foreign exchange rates 2,032 1,142 400 2,223 5,797
Balance at 31 December 2016 853,037 38,671 27,977 86,902 1,006,587
Amortisation and impairment losses
Balance at 1 January 2016 454,426 823 19,798 56,228 531,275
Amortisation - - 3,847 4,715 8,562
Impairment loss (note 5.32) 51,088 16,633 7,515 - 75,236
Disposals - - (8,091) (125) (8,216)
Effect of movements in foreign exchange rates 3,602 668 543 1,420 6,233
Balance at 31 December 2016 509,116 18,124 23,612 62,238 613,090
Carrying amount
At 1 January 2016 396,579 31,646 13,968 24,434 466,627
At 31 December 2016 343,921 20,547 4,365 24,664 393,497
5.38.1 Impairment loss and subsequent reversal
For the impairment loss in 2016 reference is made to note 5.32. The Group has not reversed any material impairment losses.
5.38.2 Impairment testing for cash-generating units containing goodwill
As disclosed in note 5.26 Segment reporting, the organisational structure, management structure and internal reporting
structure changed as of 2017. Fugro has therefore reassessed the (groups of) cash-generating units to which goodwill has been
allocated. As of 2017, for the purpose of goodwill impairment testing, Fugro allocates goodwill to the following cash-generating
units: Marine, Land and Seabed Geosolutions. For the purpose of impairment testing, these three cash-generating units
represent the lowest level within the Group at which goodwill is monitored for internal management purposes and are not larger
than the Group’s three operating segments. The revised goodwill CGU structure did not give rise to any goodwill impairments.
As of 2017, the Marine CGU with allocated goodwill comprises the former offshore Survey and offshore Geotechnical CGU’s.
Geospatial Services, onshore Geotechnical Middle East & India/Asia Pacific and onshore Geotechnical Americas CGU’s all with
goodwill form part of the Land CGU.
Key figures
Message from the CEO
Profile
Strategy
Divisional Performance
Group Performance
Governance
Report of the Supervisory Board
Financial Statements
Other Information
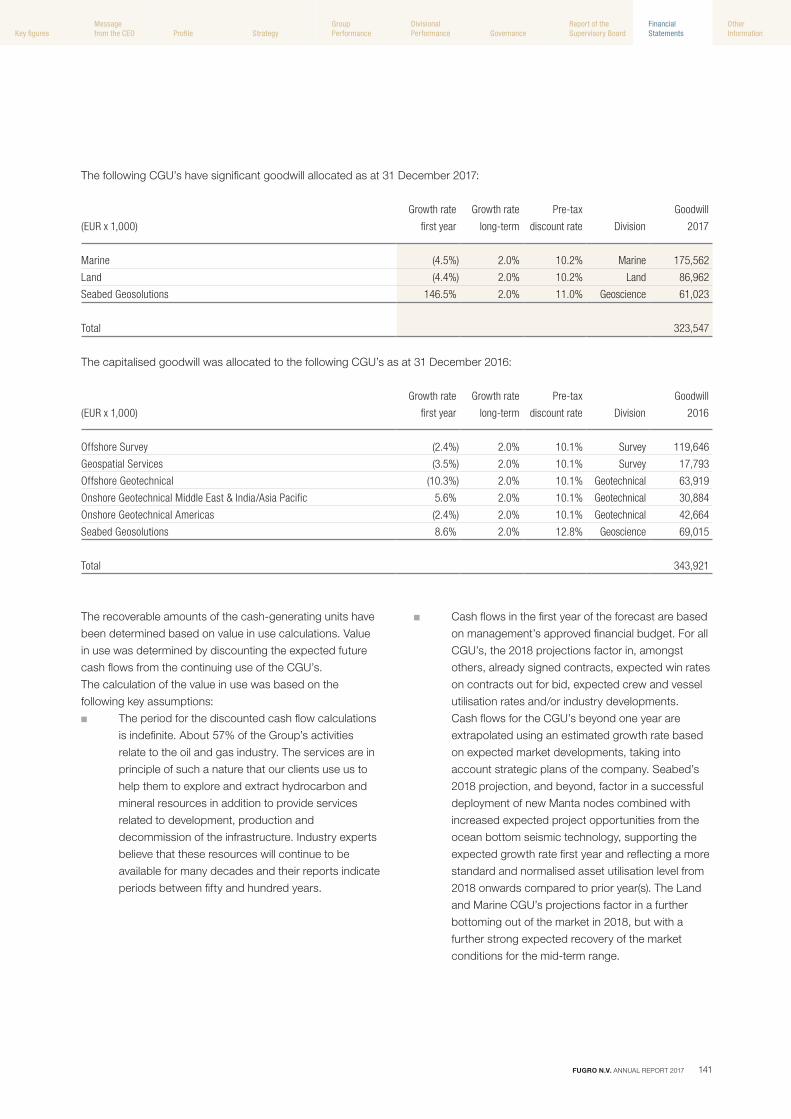
FUGRO N.V. ANNUAL REPORT 2017 141
The following CGU’s have significant goodwill allocated as at 31 December 2017:
(EUR x 1,000)
Growth rate
first year
Growth rate
long-term
Pre-tax
discount rate Division
Goodwill
2017
Marine (4.5%) 2.0% 10.2% Marine 175,562
Land (4.4%) 2.0% 10.2% Land 86,962
Seabed Geosolutions 146.5% 2.0% 11.0% Geoscience 61,023
Total 323,547
The capitalised goodwill was allocated to the following CGU’s as at 31 December 2016:
(EUR x 1,000)
Growth rate
first year
Growth rate
long-term
Pre-tax
discount rate Division
Goodwill
2016
Offshore Survey (2.4%) 2.0% 10.1% Survey 119,646
Geospatial Services (3.5%) 2.0% 10.1% Survey 17,793
Offshore Geotechnical (10.3%) 2.0% 10.1% Geotechnical 63,919
Onshore Geotechnical Middle East & India/Asia Pacific 5.6% 2.0% 10.1% Geotechnical 30,884
Onshore Geotechnical Americas (2.4%) 2.0% 10.1% Geotechnical 42,664
Seabed Geosolutions 8.6% 2.0% 12.8% Geoscience 69,015
Total 343,921
The recoverable amounts of the cash-generating units have
been determined based on value in use calculations. Value
in use was determined by discounting the expected future
cash flows from the continuing use of the CGU’s.
The calculation of the value in use was based on the
following key assumptions:
■ The period for the discounted cash flow calculations
is indefinite. About 57% of the Group’s activities
relate to the oil and gas industry. The services are in
principle of such a nature that our clients use us to
help them to explore and extract hydrocarbon and
mineral resources in addition to provide services
related to development, production and
decommission of the infrastructure. Industry experts
believe that these resources will continue to be
available for many decades and their reports indicate
periods between fifty and hundred years.
■ Cash flows in the first year of the forecast are based
on management’s approved financial budget. For all
CGU’s, the 2018 projections factor in, amongst
others, already signed contracts, expected win rates
on contracts out for bid, expected crew and vessel
utilisation rates and/or industry developments.
Cash flows for the CGU’s beyond one year are
extrapolated using an estimated growth rate based
on expected market developments, taking into
account strategic plans of the company. Seabed’s
2018 projection, and beyond, factor in a successful
deployment of new Manta nodes combined with
increased expected project opportunities from the
ocean bottom seismic technology, supporting the
expected growth rate first year and reflecting a more
standard and normalised asset utilisation level from
2018 onwards compared to prior year(s). The Land
and Marine CGU’s projections factor in a further
bottoming out of the market in 2018, but with a
further strong expected recovery of the market
conditions for the mid-term range.
Key figures
Message from the CEO
Profile
Strategy
Divisional Performance
Group Performance
Governance
Report of the Supervisory Board
Financial Statements
Other Information
Other Information

142 FUGRO N.V. ANNUAL REPORT 2017
5.40 Other investments
The Group holds the following other investments:
(EUR x 1,000) 2017 2016
Other investments 1,095 1,095
Long-term loans 8,070 9,180
Deposits 12,447 11,971
Advance lease payment 8,066 9,074
Available-for-sale financial assets 558 372
Other long-term receivables 910 2,058
31,146 33,750
The Group received no dividends from its other investments
in 2017 (2016: EUR 2 thousand).
5.40.1 Long-term loans
Long-term loans mainly comprise a loan due from
Wavewalker B.V. for the principal amount of EUR 7.5 million
(31 December 2016: EUR 8.3 million). An amount of EUR 0.8
million was repaid in 2017. The loan bears annual interest of
5%. The loan has to be fully repaid, including interest, before
30 April 2027.
5.40.2 Available-for-sale financial assets
The fair value of the available for sale financial assets is
based on quoted prices of these companies on the
Australian Securities Exchange (ASX).
5.40.3 Other long-term loans
In 2017, certain loans of approximately EUR 1.0 million have
been fully written-off as the collectability of such loans are
considered as unlikely. The costs are included in other
expenses as write-of receivables in the consolidated
statement of comprehensive income.
■ Cash flows for the CGU’s beyond five years are
extrapolated using an estimated long-term growth
rate of 2.0% (2016: 2.0%). For the CGU’s the growth
rates are based on an analysis of the long-term
market price trends in the oil and gas industry
adjusted for actual experience.
■ The pre-tax discount rate used to discount the
pre-tax cash flows for impairment testing purposes
is determined through an iterative calculation using
the projected post-tax cash flows, expected tax rate
for the respective cash generating units and a
post-tax discount rate for the group. The pre-tax
discount rate used to discount the pre-tax cash
flows for impairment testing purposes ranges for the
CGU’s from 10.2% to 11.0% (2016: 10.1%-12.8%).
The recoverable amounts for Marine, Land and Seabed
Geosolutions exceed the carrying amounts of the CGU’s
with significant headroom.
5.39 Investments in equity-accounted investees
The aggregate carrying amount of the equity-accounted
investees of EUR 69,701 thousand as at 31 December 2017,
consists of joint ventures for EUR 14,861 thousand
(31 December 2016: EUR 20,068 thousand) and associates
for EUR 54,840 thousand (31 December 2016: nil).
The Group’s share of profit from continuing operations from
its joint ventures amounted to EUR 5,121 thousand in 2017
(2016: EUR 2,223 thousand loss). No amounts were
reported as other comprehensive income from its joint
ventures in 2017 (2016: EUR nil). In 2017, the Group received
dividends of EUR 8,843 thousand (2016: EUR 5,580
thousand) from its joint ventures.
The Group’s share of profit (or loss) from continuing
operations and of other comprehensive income from
associates in 2017 amounts to a loss of EUR 409 thousand
(2016: nil) and a gain of EUR 649 thousand (2016: nil)
respectively. The other comprehensive income from Fugro’s
associates mainly relates to foreign currency exchange
differences. None of the group’s equity-accounted investees
are publicly listed entities and consequently they do not
have published price quotations. Refer to note 5.28 for the
acquired interest in Global Marine Holdings LLC in 2017.
The group has no significant commitments to its joint
ventures and associates.
Key figures
Message from the CEO
Profile
Strategy
Divisional Performance
Group Performance
Governance
Report of the Supervisory Board
Financial Statements
Other Information

FUGRO N.V. ANNUAL REPORT 2017 143
5.41 Deferred tax assets and liabilities
5.41.1 Recognised deferred tax assets and liabilities
Deferred tax assets and liabilities are attributable to the following items:
(EUR x 1,000) Assets Liabilities Net
2017 2016 2017 2016 2017 2016
Property, plant and equipment 10,197 26,107 (202) (136) 9,995 25,971
Intangible assets 765 2,951 (105) (1,272) 660 1,679
Loans and borrowings - - - (997) - (997)
Subordinated unsecured convertible bonds - - (10,593) (8,503) (10,593) (8,503)
Employee benefits 7,822 15,415 - - 7,822 15,415
Provisions for other liabilities and charges 2,879 3,752 (382) (139) 2,497 3,613
Tax loss carry-forwards 26,263 39,222 - - 26,263 39,222
Other items 4,251 7,744 (2,719) (5,192) 1,532 2,552
Deferred tax assets/(liabilities) 52,177 95,191 (14,001) (16,239) 38,176 78,952
Set off of tax components (12,754) (14,589) 12,754 14,589 - -
Net deferred tax asset/(liability) 39,423 80,602 (1,247) (1,650) 38,176 78,952
The recognised deferred tax assets are dependent on future taxable profits in excess of profits arising from the reversal of
existing taxable temporary differences. The recognised amounts relate to tax groups that are profitable or are expected to be
profitable in the foreseeable future.
Movement in temporary differences during the year
(EUR x 1,000)
Balance
01-01-2017
Recognised in
profit or loss
Recognised
in other
compre hensive
income
Recognised
directly in
equity
Balance
31-12-2017
Property, plant and equipment 25,971 (15,976) - - 9,995
Intangible assets 1,679 (1,019) - - 660
Loans and borrowings (997) 997 - - -
Subordinated unsecured convertible bonds (8,503) 1,853 - (3,943) (10,593)
Employee benefits 15,415 (4,702) (2,891) - 7,822
Provisions for other liabilities and charges 3,613 (1,116) - - 2,497
Tax loss carry-forward 39,222 (12,959) - - 26,263
Exchange differences - 5,273 (5,273) - -
Other items 2,552 (1,020) - - 1,532
Total 78,952 (28,669) (8,164) (3,943) 38,176
Key figures
Message from the CEO
Profile
Strategy
Divisional Performance
Group Performance
Governance
Report of the Supervisory Board
Financial Statements
Other Information
Other Information

144 FUGRO N.V. ANNUAL REPORT 2017
Unrecognised deferred tax assets(EUR x 1,000) 2017 2016
As of 1 January 207,003 136,290
Movements during the period:
Additional unrecognised losses and
temporary differences 67,585 102,512
Recognition of previously unrecognised
tax losses and temporary differences
(profit or loss) (7,297) (22,738)
Recognition of previously unrecognised
tax losses and temporary differences
(equity) (507) 465
Effect of change in tax rates (32,115) (316)
Exchange rate differences (19,699) 9,775
Change from reassessment 16,577 (18,985)
As of 31 December 231,547 207,003
Of the total recognised and unrecognised deferred tax
assets in respect of tax losses carried forward an amount of
EUR 14,109 thousand expires in periods varying from two to
five years. An amount of EUR 23,254 thousand expires
between five and ten years, an amount of EUR 51,031
thousand expires between ten and twenty years and an
amount of EUR 127,224 thousand can be offset indefinitely.
Based on forecasted results per tax jurisdiction,
management considered it probable that sufficient future
taxable profit will be generated to utilise recognised deferred
tax assets depending on taxable profits in excess of the
profits arising from the reversal of existing temporary
differences.
(EUR x 1,000)
Balance
01-01-2016
Recognised in
profit or loss
Recognised
in other
compre hensive
income
Recognised
directly in
equity
Balance
31-12-2016
Property, plant and equipment 6,789 19,182 - - 25,971
Intangible assets (9,905) 11,584 - - 1,679
Loans and borrowings (4,288) 1,832 1,459 - (997)
Subordinated unsecured convertible bonds - 319 - (8,822) (8,503)
Employee benefits 18,638 (3,836) 613 - 15,415
Provisions for other liabilities and charges 4,980 (1,367) - - 3,613
Tax loss carry-forward 60,876 (21,654) - - 39,222
Exchange differences - 1,431 (1,431) - -
Other items 5,545 (2,993) - - 2,552
Total 82,635 4,498 641 (8,822) 78,952
5.41.2 Unrecognised deferred tax assets and liabilities
Deferred tax has not been recognised in respect of the
following items:
Unrecognised deferred tax assets(EUR x 1,000) 2017 2016
Tax credits 1,079 2,170
Deductible temporary differences 41,113 28,823
Tax losses 189,355 176,010
Total 231,547 207,003
Unrecognised deferred tax assets relate to tax units
previously suffering losses for which it is currently not
probable that future taxable profit will be available to offset
these losses, taking into account fiscal restrictions on the
utilisation of loss compensation.
The deductible temporary differences and capital
allowances do not expire under current tax legislation.
Deferred tax assets have not been recognised in respect of
these items, because it is not probable that future taxable
profit will be available against which the Group can utilise
these benefits. Unrecognised tax assets changed over the
period as follows:
Key figures
Message from the CEO
Profile
Strategy
Divisional Performance
Group Performance
Governance
Report of the Supervisory Board
Financial Statements
Other Information

FUGRO N.V. ANNUAL REPORT 2017 145
financial position of the debtors, the days outstanding and
expected outcome of negotiations and legal proceedings
against debtors. Unbilled revenue on (completed) projects
does not include (material) impairment losses (2016: EUR
nil). Other receivables include VAT receivables, prepayments
for insurance and claims, deposits, current portion of long
term receivables and sundry receivables.
The vendor loan has been issued in connection with the
divestment of Fugro’s trenching and cable laying assets.
Refer to note 5.28. The loan bears annual interest of 4%.
After 11 January 2018 the loan bears interest of 10% per
annum. The loan has to be repaid before 11 October 2018.
5.44 Cash and cash equivalents
(EUR x 1,000) 2017 2016
Cash and cash equivalents 213,574 248,488
Bank overdraft (2,638) (4,043)
Cash and cash equivalents in the
consolidated statement of cash flows 210,936 244,445
The cash and cash equivalents disclosed above and in the
consolidated statement of cash flows include EUR 48 million
(31 December 2016: EUR 53 million) of Angolan kwanza’s in
Angola where exchange controls apply. These cash
balances are therefore not available for general use by the
other entities within the group. Refer to note 5.53.
5.45 Assets classified as held for sale
The assets held for sale relate to buildings which sale is
going to take place in 2018. As at 31 December 2016,
the assets classified as held for sale were related to a
building which sale took place in 2017.
5.46 Total equity
5.46.1 Share capital
(In thousands of shares) Ordinary shares
2017 2016
On issue and fully paid at 1 January 84,572 84,572
Number of (certificates of) own shares
held by Fugro N.V. (treasury shares) (3,613) (3,628)
On issue and fully paid at 31 December
– entitled to dividend 80,959 80,944
Unrecognised deferred tax liabilities
At 31 December 2017, no deferred tax liabilities relating to
investments in subsidiaries have been recognised (2016:
EUR nil), because Fugro controls whether the liability will be
incurred and it is satisfied that it will not be incurred in the
foreseeable future due to permanent reinvestments.
The aggregate amount of temporary differences for which
these deferred tax liabilities have not been recognised is
EUR nil (2016: EUR nil).
In some of the countries where the Group operates, local
tax laws provide that gains on disposal of certain assets are
tax exempt, provided that the gains are not distributed.
The company does not intend to distribute such gains;
therefore no tax liabilities are recognised in this respect.
5.42 Inventories
In 2017, EUR 23,404 thousand (2016: EUR 48,275 thousand)
of other inventories was recognised as an expense and no
inventory was written down (2016: EUR 96 thousand).
5.43 Trade and other receivables
(EUR x 1,000) 2017 2016
Unbilled revenue on (completed) projects 146,590 151,991
Trade receivables 240,655 308,810
Other receivables 83,385 85,425
Vendor loan 6,300 -
476,930 546,226
Unbilled revenue on (completed) projects represents the
gross amount expected to be collected from customers for
contract work performed to date. It is measured at costs
incurred plus profits recognised to date less progress
billings and recognised losses. The contracts in progress for
which this amount exceeds progress billings are presented
as unbilled revenue on (completed) projects.
The contracts in progress for which progress billing exceeds
costs incurred plus profits recognised to date less progress
billings and recognised losses are presented as advance
instalments to work in progress. At 31 December 2017,
trade receivables include retentions of EUR 17.3 million
(2016: EUR 13.5 million) relating to completed projects.
Trade receivables are shown net of impairment losses
amounting to EUR 17.9 million (2016: EUR 39.5 million)
arising from identified doubtful receivables from customers.
Trade receivables were impaired taking into account the
Key figures
Message from the CEO
Profile
Strategy
Divisional Performance
Group Performance
Governance
Report of the Supervisory Board
Financial Statements
Other Information
Other Information

146 FUGRO N.V. ANNUAL REPORT 2017
Fugro has purchased no certificates of own shares to cover
its option scheme in 2017 (2016: nil). In 2017, fifteen
thousand (15,000) shares were used (2016: nil). As per
31 December 2017, Fugro holds 3,613,347 own certificates
of shares (2016: 3,628,347) with respect to the option
scheme, subordinated unsecured convertible bonds and
performance awards. This was 4.3% of the issued capital
(2016: 4.3%).
5.46.6 Subordinated unsecured convertible bonds-
equity component
The equity component of the subordinated unsecured
convertible bonds EUR 100 million issued on 2 November
2017 as presented in the consolidated statement of changes
in equity can be summarised as follows:
(EUR x 1,000) 2017
Subordinated unsecured convertible bonds EUR 100
million- equity component 16,167
Initial direct cost attributable to equity component (394)
15,773
Tax on subordinated unsecured convertible bonds (3,943)
Equity component of subordinated unsecured
convertible bonds EUR 100 million, net of tax 11,830
Equity component of EUR 190 million issued in 2016,
net of tax, as at 31 December 25,716
Total equity component of subordinated unsecured
convertible bonds as at 31 December 37,546
Refer to note 5.49.3.
5.46.7 Unappropriated result
No dividend is proposed to be paid-out for 2017.
5.47 Basic and diluted earnings per share
The basic and diluted earnings per share for 2017 amount to
EUR 2.04 negative (2016: EUR 3.82 negative).
The calculation of basic earnings per share at 31 December
2017, is based on the loss from operations attributable to
owners of the company consisting of a loss of EUR 165,344
thousand (2016: EUR 300,983 thousand loss) that is
adjusted for the loss of the non-controlling interest of
EUR 373 thousand (2016: EUR 7,951 thousand gain),
and the weighted average number of shares outstanding at
31 December 2017 of 80,959 thousand (2016: 80,944
On 31 December 2017, the authorised share capital
amounts to EUR 16 million (2016: EUR 16 million) divided
into 140 million ordinary shares (2016: 96 million), each of
EUR 0.05 nominal value and 180 million (2016: 224 million)
various types of preference shares, each of EUR 0.05
nominal value. At the extraordinary general meeting in 2017,
it was approved to amend the articles of association and to
adjust the authorised share capital. The number of ordinary
shares within the authorised share capital has been
increased by decreasing the number of various types of
preference shares. The aggregate number of authorised
share capital remains the same.
On 31 December 2017, the issued share capital amounted
to EUR 4,228,626.25. As of this date, 60% of the ordinary
shares (84,572,525 shares) were issued. No preference
shares have been issued. In 2017, no certificates of shares
were issued by the Foundation Trust Office (2016: nil).
The holders of ordinary shares are entitled to dividends as
approved by the annual general meeting from time to time.
Furthermore, they are entitled to one vote per share in
Fugro’s shareholders meeting. The holders of certificates of
shares are entitled to the same dividend but they are not
entitled to voting rights. Under certain conditions the holder
of certificates can exchange his/her certificates into ordinary
shares and vice versa.
No dividend is (to be) paid for 2017 (2016: EUR nil).
5.46.2 Share premium
The share premium can be considered as paid in capital.
5.46.3 Translation reserve
The translation reserve comprises all foreign currency
differences arising from the translation of the financial
statements of foreign operations, as well as from the
translation of liabilities that hedge the company’s net
investment in a foreign subsidiary.
5.46.4 Hedging reserve
The hedging reserve comprises the effective portion of the
cumulative net change in the fair value of cash flow hedging
instruments related to hedged transactions that have not yet
occurred.
5.46.5 Reserve for own shares
Fugro purchases and sells own shares in relation to the
share option scheme. The cost of these shares held by the
Group is recorded as a reserve within shareholder’s equity.
Key figures
Message from the CEO
Profile
Strategy
Divisional Performance
Group Performance
Governance
Report of the Supervisory Board
Financial Statements
Other Information

FUGRO N.V. ANNUAL REPORT 2017 147
5.48.2 Summarised financial information on
subsidiaries with material non-controlling
interests
Set out below are the summarised financial information for
the subsidiaries Seabed Geosolutions B.V. (Seabed) and
Fugro-Suhaimi Ltd (Suhaimi) that have material
non-controlling interests to the Group. The non-controlling
interest in Seabed and Fugro-Suhaimi is 40% and 50%
respectively, which also represent 40% respectively 50% of
the companies’ voting rights in the general meeting of
shareholders.
Fugro controls the operations and management of Seabed
and Suhaimi as it directs the relevant revenue generating
activities of both companies. Fugro also determines the
strategy, policies and day-to-day business of these activities;
therefore both subsidiaries, with a significant non-controlling
interest, are fully incorporated into these consolidated
financial statements. The shareholders of these companies
have certain customary rights on certain key decisions,
such as decisions on the declaration and payment of
dividend and any significant change to the scope of the
business, which rights are considered as protective in nature
and normally go beyond the normal scope of business.
Such decisions must be taken by a majority of 75% of the
votes cast in both entities, but do not affect Fugro’s ability to
control the activities of both companies.
thousand). The share options on issue and the subordinated
unsecured convertible bonds could have an impact on the
weighted average number of (diluted) ordinary shares.
However, their conversion to (certificates of) ordinary shares
would not decrease earnings per share or increase loss per
share and as such they have not been treated as dilutive.
Basic earnings per share from discontinued operations for
2017 amounts to EUR 0.06 and is based on the profit from
discontinued operations of EUR 5,070 thousand (2016: nil)
and the weighted average number of shares outstanding of
80,959 thousand at 31 December 2017. The share options
and subordinated unsecured convertible bonds could have
an impact on the weighted average number of (diluted)
ordinary shares and could decrease the earnings per share
from discontinued operations. However, the diluted earnings
per share from discontinued operations equals the basic
earnings per share for 2017.
5.48 Non-controlling interest
5.48.1 Subsidiaries with non-controlling interest
The total non-controlling interest for the period is
EUR 41,610 thousand (surplus), of which EUR 30,065
thousand (surplus) is for Seabed Geosolutions B.V.
and EUR 10,359 thousand (surplus) is attributable to Fugro-
Suhaimi Ltd. The individual non-controlling interest of other
subsidiaries is considered as insignificant.
Summarised balance sheet (EUR x 1,000) Seabed Suhaimi
As at 31 December As at 31 December
2017 2016 2017 2016
Current
Assets 33,797 90,709 23,820 33,286
Liabilities (40,107) (70,479) (10,600) (17,322)
Total current net assets (6,310) 20,230 13,220 15,964
Non-current
Assets 86,034 94,123 12,665 15,380
Liabilities (4,561) (11,386) (5,166) (5,131)
Total non-current net assets 81,473 82,737 7,499 10,249
Net assets 75,163 102,967 20,719 26,213
NCI percentage 40% 40% 50% 50%
Carrying amount of NCI 30,065 41,187 10,359 13,107
Key figures
Message from the CEO
Profile
Strategy
Divisional Performance
Group Performance
Governance
Report of the Supervisory Board
Financial Statements
Other Information
Other Information

148 FUGRO N.V. ANNUAL REPORT 2017
Summarised income statement (EUR x 1,000) Seabed Suhaimi
For period ended
31 December
For period ended
31 December
2017 2016 2017 2016
Revenue 73,582 172,978 30,354 30,435
Profit/(loss) before income tax (15,060) 693 12,011 12,482
Income tax (expense)/income (1,354) 3,883 - -
Post-tax profit/(loss) from continuing operations (16,414) 4,576 12,011 12,482
Other comprehensive income (26) - - -
Total comprehensive income/(loss) (16,440) 4,576 12,011 12,482
Total comprehensive income/(loss) allocated to non-controlling interests (6,576) 1,830 6,005 6,241
Dividends paid to non-controlling interests - - 7,234 9,972
Summarised cash flows (EUR x 1,000) Seabed Suhaimi
For period ended
31 December
For period ended
31 December
2017 2016 2017 2016
Net cash generated from operating activities (11,740) 63,727 9,246 14,594
Net cash used in investing activities (24,307) (12,526) (856) (901)
Net cash used in financing activities (5,807) (48,937) (14,467) (18,061)
Net increase in cash and cash equivalents and bank overdrafts (41,854) 2,264 (6,077) (4,368)
Cash, cash equivalents and bank overdrafts at beginning of year 50,073 46,263 11,256 15,174
Exchange gains/(losses) on cash and cash equivalents (3,723) 1,546 (1,087) 450
Cash and cash equivalents and bank overdrafts at end of year 4,496 50,073 4,092 11,256
The information above are the amounts before intercompany eliminations.
Key figures
Message from the CEO
Profile
Strategy
Divisional Performance
Group Performance
Governance
Report of the Supervisory Board
Financial Statements
Other Information

FUGRO N.V. ANNUAL REPORT 2017 149
5.49 Loans and borrowings
This note provides information about the contractual terms of the Group’s interest-bearing loans and borrowings, which are
measured at amortised cost. For more information about the Group’s exposure to liquidity risk, currency risk and interest rate
risk and, refer to note 5.55, 5.56 and 5.57.
(EUR x 1,000) 2017 2016
Bank loans 386,699 243,537
Private placement loans 2011 in USD - 133,058
Private placement loans 2011 in EUR - 17,171
Private placement loans 2011 in GBP - 14,108
Private placement loans 2002 in USD - 14,862
Subordinated unsecured convertible bonds in EUR 190,000 160,399 153,900
Subordinated unsecured convertible bonds in EUR 100,000 82,827 -
Finance lease liabilities 10,973 18,336
Other loans and long-term borrowings 483 537
Subtotal 641,381 595,509
Less: current portion of loans and borrowings 6,488 22,006
634,893 573,503
The bank loans and private placement loans contain covenants. The Group is in compliance with these covenants as at
31 December 2017. Reference is made to 5.49.6.
As at 31 December 2017, Fugro has drawn a total amount of EUR 387 million under the committed multicurrency revolving
facilities (31 December 2016: EUR 245 million).
Key figures
Message from the CEO
Profile
Strategy
Divisional Performance
Group Performance
Governance
Report of the Supervisory Board
Financial Statements
Other Information
Other Information

150 FUGRO N.V. ANNUAL REPORT 2017
was in use (31 December 2016: EUR 245 million),
of which an equivalent of EUR 147 million was drawn
in USD (USD 175 million).
The total amortised transaction costs amounts to
EUR 1.4 million (31 December 2016: EUR 1.0 million) of
which EUR 0.6 million relate to the drawn part of the bank
loans. These are included in the carrying amount of the
bank loans for the drawn facility and recorded as other
current assets for the undrawn portion and are amortised
over the term. An amount of EUR 0.6 million of transaction
costs was paid in 2017 (2016: EUR 0.2 million).
5.49.2 Private placement loans
In 2017, the private placement loans have been fully repaid
from the net proceeds of the issuance of the unsecured
subordinated convertible bonds, from further usage of the
multicurrency revolving credit facility and cash-flows
generated from ordinary course of business. In 2017, total
Terms and debt repayment schedule
Terms and conditions of outstanding loans were as follows:
(EUR x 1,000) 2017 2016
Currency
Nominal
interest rate
Year of
maturity
Face
value
Carrying
value
Face
value
Carrying
value
Bank loans EUR/USD
EURIBOR/
LIBOR +
190 bps 2020 387,000 386,699 245,000 243,537
Private placement loans:
320 million USD bonds 2011 USD 5.05% 2018 - - 53,411 52,193
330 million USD bonds 2011 USD 5.78% 2021 - - 56,381 53,998
100 million USD bonds 2011 USD 5.88% 2023 - - 28,204 26,867
27.5 million GBP bonds 2011 GBP 5.06% 2018 - - 5,521 5,380
40 million GBP bonds 2011 GBP 5.82% 2021 - - 9,170 8,728
35 million EUR bonds 2011 EUR 5.81% 2021 - - 18,212 17,171
37 million USD bonds 2002 USD 8.10% 2017 - - 14,987 14,862
190 million EUR Subordinated unsecured
convertible bonds 2016 EUR 4.00% 2021 190,000 160,399 190,000 153,900
100 million EUR Subordinated unsecured
convertible bonds 2017 EUR 4.50% 2024 100,000 82,827 - -
Finance lease liabilities USD 5.15-5.55% 2019-2022 11,553 10,973 19,784 18,336
Mortgage and other loans and long-term
borrowings Variable 3.5-8.6% 2018-2024 483 483 537 537
689,036 641,381 641,207 595,509
5.49.1 Bank loans
The bank loan represents a 5-year multicurrency revolving
credit facility of initially EUR 500 million. Rabobank and ING
Bank N.V. provided EUR 127.5 million each, HSBC Bank Plc.
provided EUR 75 million, Barclays Bank plc and ABN AMRO
Bank N.V. provided EUR 50 million each, Credit Suisse
provided EUR 40 million and BNP Paribas S.A./N.V.
provided EUR 30 million. The interest is LIBOR, or in relation
to any loan in EUR, EURIBOR plus a margin based on the
consolidated net debt/adjusted EBITDA at each period of
twelve months ending on the last day of the company’s
financial quarters. In 2017, the multicurrency revolving credit
facility has been increased by EUR 75 million to EUR 575
million. Rabobank and ING Bank N.V. provided EUR 17.25
million each. ABN AMRO Bank N.V. provided EUR 30
million. Credit Suisse and BNP Paribas S.A./N.V.
have provided EUR 6 million and EUR 4.5 million
respectively. At 31 December 2017, a total amount of
EUR 387 million of the multicurrency revolving credit facility
Key figures
Message from the CEO
Profile
Strategy
Divisional Performance
Group Performance
Governance
Report of the Supervisory Board
Financial Statements
Other Information

FUGRO N.V. ANNUAL REPORT 2017 151
(EUR x 1,000) 2017
Face value of subordinated unsecured convertible bonds
EUR 100 million, issued on 2 November 2017 100,000
Subordinated unsecured convertible bonds EUR 100
million- equity component. Refer to note 5.46.6. 16,167
Liability component 83,833
Initial direct cost attributable to liability component (2,039)
Interest expense* 1,033
Interest paid -
Non-current liability 82,827
* Interest expense is calculated by applying the effective interest rate of 8.1 % to the liability component.
The initial fair value of the liability portion of the subordinated
unsecured convertible bonds was determined using a
market interest rate for an equivalent non-convertible bond
at the issue date. The liability is subsequently recognised on
an amortised cost basis until extinguished on conversion or
maturity of the bonds. The remainder of the proceeds is
allocated to the conversion option and recognised in
shareholders’ equity, net of income tax, and not
subsequently remeasured. The total transaction costs paid
attributable to the issuance of the subordinated unsecured
convertible bonds amounted to EUR 2,433 thousand of
which EUR 394 thousand has been allocated to the equity
component of the subordinated unsecured convertible
bonds.
As at 31 December 2017, the carrying amount of the
EUR 190 million subordinated unsecured convertible bonds
issued in 2016 amount to EUR 160,399 thousand
(31 December 2016: EUR 153,900 thousand) with an
interest expense (at 9.2%) of EUR 14.1 million in 2017.
EUR 7.6 million coupon of 4% has been paid in 2017. Unless
previously redeemed, converted or purchased and
cancelled, these bonds will be redeemed at their principal
amount on or around 26 October 2021. Upon exercise of
their conversion rights, these bonds will be convertible into
certificates (certificaten van aandelen) at a conversion rate of
5,144 for each bond held, representing ordinary shares in
the capital of Fugro. Fugro will have the option to convert all
but not some of these outstanding bonds into certificates at
the then prevailing conversion price at any time from
18 November 2019, if the value of the certificates underlying
a bond exceeds EUR 150 thousand for a specified period of
time.
amortised transaction costs amounts to EUR 16.4 million
(2016: EUR 24.3 million) and an amount of EUR 6.2 million of
transaction costs has been paid (2016: EUR 17.5 million).
5.49.3 Subordinated unsecured convertible bonds
On 2 November 2017, Fugro issued 1,000 subordinated
unsecured convertible bonds (the bonds) at a par value of
EUR 100 thousand each (i.e. EUR 100 million in total), which
are publicly traded on the Frankfurt Stock Exchange.
The bonds were issued at 100% par value. A coupon of
4.5% per annum will be paid semi-annually in arrear in equal
instalments on 2 May and 2 November in each year. Unless
previously redeemed, converted or purchased and
cancelled, the bonds will be redeemed at their principal
amount on or around 2 November 2024. At the option of the
holders, the bonds are convertible into certificates
(“certificaten van aandelen”), representing ordinary shares in
the capital of Fugro. The initial conversion rate is 6,693
certificates for each bond (an initial conversion price of
EUR 14.9412). The certificates underlying the bonds
correspond to approximately 7.9% of the company’s issued
share capital.
The conversion price of the bonds is subject to standard
anti-dilution adjustments in the event of share
consolidations, share splits, capital distributions, rights
issues and bonus issues and in the event of a change in
control, a merger, or other events. Fugro will have the option
to convert all but not some of the outstanding bonds into
certificates at the then prevailing conversion price at any
time from 23 November 2020, if the value of the certificates
underlying a bond exceeds EUR 150 thousand for a
specified period of time. Holders of the bonds have the
option to force redemption of the principal amount plus
interest (in cash) by Fugro on 30 October 2022 or in the
event of a change in control. Fugro has an early redemption
option (clean-up call) if 15% or less of the aggregate
principal amount of the bonds remains outstanding. Fugro
has an option to redeem all, but not some of the bonds in
the event of certain changes in tax law. Fugro considers the
bond as a compound financial compound financial
instrument containing a debt host (including closely related
embedded liability derivatives) and an embedded equity
derivative (conversion option).
The bonds are presented in the consolidated statement of
financial position and consolidated statement of
comprehensive income as follows:
Key figures
Message from the CEO
Profile
Strategy
Divisional Performance
Group Performance
Governance
Report of the Supervisory Board
Financial Statements
Other Information
Other Information

152 FUGRO N.V. ANNUAL REPORT 2017
5.49.4 Finance lease liabilities
Lease liabilities are effectively secured as the rights to the leased asset revert to the lessor in the event of default. On 1 July
2016, Fugro entered into a finance lease arrangement in connection with the purchase of a chartered vessel Hugin Explorer with
a lease term of three years for the amount of EUR 23,850 thousand. At expiry of the charter period, Fugro will acquire and
ownership will be transferred to Fugro by payment of the remaining purchase price.
Commitments in relation to finance leases and the present value of these liabilities, which are mainly related to the finance lease
arrangement in connection with the purchase of a chartered vessel, are as follows:
(EUR x 1,000) 2017 2016
Gross finance lease liabilities – minimum lease payments
No later than one year 6,342 7,108
Later than one year and no later than 5 years 5,211 12,676
11,553 19,784
Future finance charges on finance lease liabilities 580 1,448
Present value of finance lease liabilities 10,973 18,336
Of which:
Non-current* 4,631 11,228
Current 6,342 7,108
* Are due later than 1 years and no later than three years.
5.49.5 Changes in liabilities arising from financing activities
The table below sets out an analysis of the changes in liabilities arising from financing activities.
(EUR x 1,000) Bank loans
Private
placement
loans
Subordinate
unsecured
convertible
bonds
EUR 190,000
Subordinate
unsecured
convertible
bonds
EUR 100,000
Finance
lease
liabilities
Mortgage and
other loans
and long-term
borrowings Total
Balance at 1 January 2017 243,537 179,199 153,900 - 18,336 537 595,509
Cash flow from financing activities 152,011 (183,212) - 97,567 (5,499) (39) 60,828
Equity Component of convertible bond - - - (15,773) - - (15,773)
Effect of movement in foreign exchange rates (9,449) (9,029) - - (1,864) (15) (20,357)
Other changes* 600 13,042 6,499 1,033 - - 21,174
Balance at 31 December 2017 386,699 - 160,399 82,827 10,973 483 641,381
* Other changes include interest payments, accrued interest and amortisation.
Key figures
Message from the CEO
Profile
Strategy
Divisional Performance
Group Performance
Governance
Report of the Supervisory Board
Financial Statements
Other Information

FUGRO N.V. ANNUAL REPORT 2017 153
■ Declared dividend < 60% of the profit of the group
for such financial year (dividend payment in 2017
(over the year 2016) is conditional on covenant
compliance at original levels).
The covenant requirements are applicable at each period of
twelve months ending on the last day of the company’s
financial quarters.
The adjusted consolidated EBITDA for purpose of the
covenant calculations comprises the income (or loss) from
operations before interest expense, depreciation,
amortisation and taxes, but not including any exceptional
items as listed below, and are further adjusted by:
■ Including pre-acquisition income or (loss) from
businesses acquired.
■ Excluding the income or (loss) from businesses
disposed of, for the period for which they formed
part of the Group.
Exceptional items comprise:
■ Onerous contract charges (note 5.29).
■ Restructuring costs (note 5.33).
■ Write-off receivables (note 5.33).
■ Certain adviser and other fees (to the extent not
capitalised as transaction costs on loans and
borrowings (note 5.33).
■ Excluding the income or (loss) on disposal of
property, plant and equipment (note 5.30 and 5.33).
For purpose of the calculation of the net interest expense,
any amortised transaction costs directly attributable to
covenant amendments (advisor and other fees), other
amortised transaction costs of a non-recurring nature in
relation to the loans and interest expenses related to the
subordinated unsecured convertible bonds are not included.
For purpose of the calculation of the net financial
indebtedness, the amounts of the subordinated unsecured
convertible bonds are not included.
The operating lease expense comprises operational lease
expense under third party costs as well as the property
lease expense under other expenses. For covenant
requirements (a) part of the operational lease expense is
excluded for amounts that relate to maintenance, repairs,
taxes, insurance, assessments or other similar charges,
and additional rentals (in excess of fixed minimums) based
on gross receipts. Amounts required to be paid pursuant to
(i) any lease or agreement with a term of less than one year
The cash flow from financing activities of EUR 60,828
thousand in 2017 represents the total net cash from
financing activities in the consolidated statement of cash
flows of EUR 53,594 thousand excluding dividends paid of
EUR 7,234 thousand.
5.49.6 Covenant requirements
The multicurrency revolving credit facility as well as the US
private placement loans, contains certain covenant
requirements. In 2015, Fugro has reached agreement with
its lenders on the refinancing of the multicurrency revolving
credit facility, and has aligned the terms and conditions of
the private placement loans with new multicurrency
revolving credit facility. The private placement loans have
been fully repaid in 2017. Refer to note 5.49.2. Upon the
refinancing, the margin fixed charge coverage (fixed charge
cover) has been adjusted as shown in the table below:
Relevant period ended
or ending Net leverage Fixed charge cover
Covenant
Original
covenant
Adjusted
Covenant
March 2016 < 3.00x > 2.25x > 1.80x
June 2016 onwards < 3.00x > 2.50x > 1.80x
December 2017 < 3.00x > 2.50x > 1.80x
March, June, September
and December 2018 < 3.00x > 2.50x > 2.00x
March 2019 onwards < 3.00x > 2.50x > 2.50x
The covenant requirements consist of the following:
■ Equity > EUR 200 million (only applicable to private
placement loans 2002).
■ Net leverage (EBITDA coverage): Net financial
indebtedness (loans and borrowings less net cash)
plus outstanding guarantees in excess of EUR 250
million / Adjusted consolidated EBITDA.
■ Margin fixed charge cover(age): Adjusted
consolidated EBITDA plus operating lease expense /
net interest expense plus operating lease expense.
■ Solvency: Consolidated net worth / Balance sheet
total > 1.0: 3.0.
■ Consolidated financial indebtedness of the
subsidiaries < 10% for the private placement loans
of the consolidated balance sheet total.
■ Consolidated financial indebtedness of the
subsidiaries, excluding Seabed, < EUR 55 million for
the bank loans.
Key figures
Message from the CEO
Profile
Strategy
Divisional Performance
Group Performance
Governance
Report of the Supervisory Board
Financial Statements
Other Information
Other Information

154 FUGRO N.V. ANNUAL REPORT 2017
As from 31 December 2016 and onwards, an aggregate
maximum amount of EUR 35 million is applied in respect of
exceptional items excluded from adjusted consolidated
EBITDA, excluding any gains from exceptional items unless
such gains represent an adjustment or reversal relating to a
loss previously counted as an exceptional item. Some of the
covenant requirements such as the margin fixed charge
cover(age), solvency and net leverage (EBITDA coverage) are
incorporated in certain sale and lease back arrangements.
As can be concluded from the table below, Fugro complies
with all (adjusted) covenant requirements and also complied
with all covenant requirements for the multicurrency
revolving credit facility and US private placement loans
during 2017. In case Fugro would not comply with the
(adjusted) covenant requirements, the multicurrency
revolving credit facility will become immediately due.
or (ii) any project-based lease or agreement with a term that
begins at the start of a specific project and ends upon
completion of such project are reported as costs of other
rentals under third party costs, are not included for covenant
requirements to an amount equal or less than EUR 175
million as from 2015. Total operational lease expense relating
to (a) amounts to EUR 12,456 thousand (2016: EUR 31,672
thousand) and is therefore excluded from operating lease
expense. The property lease expense for the amount of
EUR 20,213 thousand (2016: EUR 24,328 thousand) is
therefore included in the operating lease expense as from
2016. Total operating lease expense for covenant
requirements therefore amounts to EUR 68,929 thousand in
2017 (2016: EUR 84,416 thousand).
(EUR x 1,000) 2017
Adjusted consolidated EBITDA 100,120
(5.29) Operating lease expense 68,929
(5.34) Net interest expense 9,659
Margin fixed charge coverage > 1.8 2.15
Net consolidated financial indebtedness
(loans and borrowings less net cash) 187,165
Bank guarantees exceeding cap of
EUR 250 million -
Total 187,165
EBITDA coverage < 3.0 1.87
Consolidated net worth 712,054
Balance sheet total 1,898,304
Solvency > 33.33% 37.5%
Financial indebtedness < EUR 55 million 14,042
Dividend < 60% of the profit -
The table below summarises the covenant requirements of
2016:
(EUR x 1,000) 2016
Adjusted consolidated EBITDA 184,605
(5.29) Operating lease expense 84,416
(5.34) Net interest expense 29,390
Margin fixed charge coverage > 1.8 2.36
Net consolidated financial indebtedness
(loans and borrowings less net cash) 198,386
Bank guarantees exceeding cap of
EUR 250 million -
Total 198,386
EBITDA coverage < 3.0 1.07
Consolidated net worth 934,859
Balance sheet total 2,174,449
Solvency > 33.33% 43.0%
Margin Indebtedness subsidiaries < 10% 2.4%
Financial indebtedness < EUR 55 million 23,361
Dividend < 60% of the profit -
Key figures
Message from the CEO
Profile
Strategy
Divisional Performance
Group Performance
Governance
Report of the Supervisory Board
Financial Statements
Other Information

FUGRO N.V. ANNUAL REPORT 2017 155
5.50 Employee benefits
(EUR x 1,000) 2017 2016
Present value of funded obligations 438,188 441,449
Fair value of plan assets (381,274) (359,565)
Recognised net liability for defined
benefit obligations 56,914 81,884
Liability for long-service leave 11,953 13,593
Total employee benefit liabilities 68,867 95,477
The Group makes contributions to a number of pension
plans, both defined benefit plans as well as defined
contribution plans, that provide pension benefits for
employees upon retirement in a number of countries.
The retirement age is in line with the provisions in the
different plans. The most important plans relate to plans in
the Netherlands, United Kingdom and the United States.
Details of these plans are as follows:
■ In the Netherlands the Group provides a pension
plan based on average salary. This plan qualifies as
a defined benefit scheme. The pension entitlements
from this plan are insured with an insurance
company that guarantees the accrued pension
entitlements. The group pays additional amounts to
fund (part of) the indexation for active participants.
For the deferred pensioners, the scheme includes a
(conditional) indexation of pension benefits as far as
the return on the separated investments exceeds the
unwinding of interest.
■ In the United Kingdom (UK) the Group operates two
defined benefit pension schemes. For Fugro
Holdings, the company operates a final salary
defined benefit pension scheme. The scheme is an
HMRC registered pension schemes and is subject to
standard UK pensions and tax law. The Robertson
Research International Group Pension Scheme is a
funded, defined benefit pension plan. The pension
schemes have been closed in previous years for new
participants, but include the on-going obligations to
their members (both former and present employees).
The pension schemes assets are held in separate
Trustee-administered funds. The schemes includes
indexation in line with RPI.
In October 2016, following the placement of the EUR 190
million subordinated unsecured convertible bonds,
two additional covenant requirements have been agreed
with the owner of two geotechnical vessels:
■ Total net debt (including the subordinated unsecured
convertible bonds issued in 2016) should not exceed
EUR 475 million;
■ Consolidated EBITDA for each relevant period
should be at least EUR 105 million.
As at 30 September 2017, Fugro has obtained a waiver for
the consolidated EBITDA requirement.
In December 2017, after the placement of the EUR 100
million convertible bonds, the covenants were adjusted as
follows:
■ Total net debt should not exceed EUR 400 million for
each relevant period. Net debt includes the liability
component of the EUR 190 million subordinated
unsecured convertible bonds 2016 and excludes the
liability component of the EUR 100 million
subordinated unsecured convertible bonds 2017;
■ The consolidated EBITDA should be at least EUR 90
million for each relevant period (or EUR 100 million
from the third quarter of 2018 onwards).
Fugro complies with these requirements as at 31 December
2017.
5.49.7 Mortgage and other loans and long-term
borrowings
The interest rate on mortgage loans and other loans and
long-term borrowings over one year amounts to 3.5% –
8.6% (2016: 1.0% – 11.5%).
5.49.8 Change of control provisions
A change of control of Fugro could result in early repayment
of the bank loans (note 5.49.1) and the unsecured
subordinated convertible bond (note 5.49.3). An amount of
EUR 387 million was drawn from the bank facilities as at
31 December 2017 (31 December 2016: EUR 245 million).
The sale and lease back arrangement for two vessels
contains certain change of control clauses.
Key figures
Message from the CEO
Profile
Strategy
Divisional Performance
Group Performance
Governance
Report of the Supervisory Board
Financial Statements
Other Information
Other Information

156 FUGRO N.V. ANNUAL REPORT 2017
Movement in the fair value of plan assets(EUR x 1,000) 2017 2016
Fair value of plan assets at 1 January 359,565 354,001
Interest income 8,045 9,870
Remeasurement:
Return on plan assets, excluding
amounts included in interest income 15,951 17,370
Exchange differences (5,912) (25,198)
Paid by the employer 13,239 14,004
Contributions paid by plan participants 1,819 1,865
Benefits paid by the plan (10,414) (11,665)
Administrative expenses (879) (682)
Settlements (140) -
Fair value of plan assets at 31 December 381,274 359,565
Expenses recognised in profit or loss(EUR x 1,000) 2017 2016
Current service costs 7,411 7,482
Past service costs (147) 3,468
Administrative expenses 879 682
Interest on obligation 9,944 12,047
18,087 23,679
Interest income (8,045) (9,870)
10,042 13,809
The expenses are recognised in the following line items in
the statement of comprehensive income:
(EUR x 1,000) 2017 2016
Personnel expenses 10,042 13,809
Actual return on plan assets(EUR x 1,000) 2017 2016
Actual return on plan assets 23,996 27,240
■ In the United States of America the Group operates
a 401K plan for its employees. The Group
contributes towards the deposits of its employees in
accordance with agreed rules and taking into
account the regulations of the IRS, the US tax
authority. This plan qualifies as a defined
contribution plan.
Plan assets consist of the following:
(EUR x 1,000) 2017 2016
Equity securities 81,346 72,405
Government bonds 8,270 4,628
Corporate bonds 41,953 39,785
Investment funds 19,825 20,553
Insurance policies 195,793 190,264
Real estate 21,291 19,959
Cash 12,796 11,971
381,274 359,565
Movements in the present value of the funded obligations(EUR x 1,000) 2017 2016
Present value of the funded obligation
at 1 January 441,449 431,190
Current service costs (see below) 7,411 7,482
Interest expenses 9,944 12,047
17,355 19,529
Remeasurements:
(Gain)/loss from change in demographic
assumptions - (1,726)
(Gain)/loss from change in financial
assumptions (5,694) 38,076
Experience (gains)/losses 1,729 (4,222)
(3,965) 32,128
Exchange differences (8,049) (35,072)
Paid by plan participants 1,819 1,871
Benefits paid by the plan (10,414) (11,665)
Plan amendments and curtailments (7) 3,468
Present value of the funded obligation at
31 December 438,188 441,449
Key figures
Message from the CEO
Profile
Strategy
Divisional Performance
Group Performance
Governance
Report of the Supervisory Board
Financial Statements
Other Information

FUGRO N.V. ANNUAL REPORT 2017 157
Remeasurements recognised directly in other comprehensive income(EUR x 1,000) 2017 2016
Cumulative amount at 1 January (67,865) (61,151)
Recognised during the year 19,916 (14,758)
Effect of movement in exchange rates 2,124 8,044
Cumulative amount at 31 December (45,825) (67,865)
Refer to note 5.35 with respect to the income tax impact on
the actuarial gains / (losses) of EUR 19,916 thousand gain
(2016: EUR 14,758 thousand loss).
Actuarial assumptions
Principal actuarial assumptions at the reporting date (expressed as a range of weighted averages):
2017 2016
UK Netherlands UK Netherlands
Discount rate at 31 December 2.5% 1.9% 2.7% 1.9%
Future salary increases 0.0% 1.4% 0.0% 1.5%
Future pension increases 2.6% 0.0% 2.7% 0.0%
The financial effects of differences between the actuarial assumptions and actuals for the pension liability and plan assets are
included in the remeasurements.
Netherlands: AG2016 Generation table for men and women with an age correction according to ES-P2.
United Kingdom: 90% of S2NxA with improvements in line with CMI 2014 and a long-term rate of improvements of 1.5% per
annum and SAPS2 CMI 2016 1.25% long term + 1 year adjustment.
The sensitivity of the defined benefit obligation to changes in the weighted principal assumptions is:
Impact on defined benefit obligation
Change in assumption Increase in assumption Decrease in assumption
Discount rate 0.50% Decrease by 10.2% Increase by 11.2%
Salary growth rate 0.50% Increase by 0.5% Decrease by 0.4%
Pension growth rate 0.50% Increase by 2.5% Decrease by 2.4%%
Increase by 1 year in assumption Decrease by 1 year in assumption
Life expectancy Increase by 3.3% Decrease by 3.1%
The sensitivity analyses are based on a change in one assumption while holding all other assumptions constant, so that
interdependencies between the assumptions are excluded.
Key figures
Message from the CEO
Profile
Strategy
Divisional Performance
Group Performance
Governance
Report of the Supervisory Board
Financial Statements
Other Information
Other Information

158 FUGRO N.V. ANNUAL REPORT 2017
Historical information (EUR x 1,000) 2017 2016 2015 2014 2013
Present value of the defined obligation 438,188 441,449 431,190 454,345 352,301
Fair value of plan assets 381,274 359,565 354,001 352,063 268,451
Deficit in the plan (56,914) (81,884) (77,189) (102,282) (83,850)
Experience adjustments arising on plan liabilities 1,729 (4,222) (545) 2,552 (4,403)
Experience adjustments arising on plan assets 15,951 17,370 (9,993) 52,814 (1,814)
Plan assets are comprised as follows:
(EUR x 1,000) 2017 2016
Quoted Unquoted Total % Quoted Unquoted Total %
Equity instruments 81,346 81,346 21% 72,405 72,405 20%
Debt instruments 70,048 70,048 18% 64,966 64,966 18%
Government 8,270 8,270 2% 4,628 4,628 1%
Corporate bonds (Investment
grade) 41,953 41,953 11% 39,785 39,785 11%
Corporate bonds
(Non-investment grade) 19,825 19,825 5% 20,553 20,553 6%
Insurance policies 195,793 195,793 52% 190,264 190,264 53%
Property 21,291 21,291 6% 19,959 19,959 6%
UK 21,291 21,291 6% 19,959 19,959 6%
Cash and cash equivalents 12,796 12,796 3% 11,971 11,971 3%
Total 185,481 195,793 381,274 100% 169,301 190,264 359,565 100%
* Previously stated as unquoted.
Through its defined benefit pension plans, the Group is exposed to a number of risks. Most of these risks come with the nature
of a defined benefit plan, and are therefore not country specific. The most significant risks are detailed below:
Key figures
Message from the CEO
Profile
Strategy
Divisional Performance
Group Performance
Governance
Report of the Supervisory Board
Financial Statements
Other Information

FUGRO N.V. ANNUAL REPORT 2017 159
and therefore changes in the value of the investment depot
will affect future pension increases as well.
In the UK, the Trustees set the Scheme’s investment
strategy, in consultation with the employer. The Robertson
and UK Holdings plan include return seeking assets and
bonds. The Robertson plan also includes matching assets
to cover the pensioner liabilities. The employer is ultimately
responsible for funding the accrued pensions and the
pension increases.
The expected 2018 contributions amount to EUR 16.2
million (2017: EUR 16.6 million).
The weighted average duration of the defined benefit
obligation is 21 years (2016: 22 years).
As at 31 December 2017 Netherlands
United
Kingdom
Total
weighted
Duration of plan 23 19 21
Asset volatility
The plan liabilities are calculated using a discount rate set
with reference to AA credit-rated corporate bond yields; if
plan assets underperform this yield, the deficits will increase.
The UK plans hold a significant proportion of equities, which
are expected to outperform corporate bonds in the
long-term while providing volatility and risk in the short-term.
Changes in bond yields
A decrease in corporate bond yields will increase plan
liabilities, although this will be partially offset by an increase
in the value of the plans’ bond holdings.
Inflation risk
Some of the group pension obligations are linked to inflation,
and higher inflation will lead to higher liabilities (although,
in most cases, caps on the level of inflationary increases are
in place to protect the plan against extreme inflation).
The majority of the plan’s assets are either unaffected by
(fixed interest bonds) or loosely correlated with (equities)
inflation, meaning that an increase in inflation will also
increase the deficit.
Life expectancy
The majority of the plans’ obligations are to provide benefits
for the life of the member, so increases in life expectancy will
result in an increase in the plans’ liabilities. This is
particularly significant in the UK plan, where inflationary
increases result in higher sensitivity to changes in life
expectancy. This risk is limited in the Netherlands where the
insurer guarantees the payment of the accrued benefits.
In addition, the Group is exposed to a number of local risks.
This is considered to be limited for the Netherlands as in the
Netherlands the company has taken out an insurance
contract to cover the pension plan. The insurance company
guarantees all accrued entitlements. The insurance contract
includes a separate account in which 80% of the
investments are used to match the liability on a funding
basis and 20% of the investments are used to invest in
equity. The insurance company ultimately decides on
investment policies and governance, as they run the
downside risk. Returns over the unwinding interest are used
to increase pensions. Fugro pays additional amounts to fund
the indexation for active participants, but otherwise is only
responsible for the annual cost of pension accrual.
The pension increases for deferred and pensioners are
depending on the means available in the investment depot
Key figures
Message from the CEO
Profile
Strategy
Divisional Performance
Group Performance
Governance
Report of the Supervisory Board
Financial Statements
Other Information
Other Information

160 FUGRO N.V. ANNUAL REPORT 2017
presented accordingly. The total provision amounts to
EUR 12.1 million as at 31 December 2017 (31 December
2016: EUR 17.9 million).
5.52 Trade and other payables
(EUR x 1,000) 2017 2016
Trade payables 98,797 109,232
Advance instalments to work in progress 42,300 47,010
Other payables 201,497 219,135
Balance at 31 December 342,594 375,377
Other payables include elements such as accrued expenses
of invoices to be received, employee related accruals and
considerations payable regarding acquisitions.
5.53 Financial risk management
5.53.1 Overview
The company’s risk management policy includes the
long-term sustainable management of its business activities
and where possible, the mitigation of the associated
business risks. Based on the nature and relative significance
5.51 Provisions for other liabilities and charges
(EUR x 1,000) 2017 2016
Onerous
contracts Procedures Restruc turing Total
Onerous
contracts
Asset
retirement
obligations Procedures Restruc turing Total
Balance at 1 January 13,017 21,173 7,465 41,655 37,454 13,900 22,642 2,734 76,730
Provisions made during the year 19,915 3,112 12,980 36,007 9,623 - 657 22,702 32,982
Provisions used during the year (14,013) (272) (14,721) (29,006) (18,848) - (1,397) (17,361) (37,606)
Provisions reversed during the
year (2,257) (5,853) (784) (8,894) (15,710) (14,056) (1,292) (667) (31,725)
Unwinding of discount - - - - - 308 - - 308
Effect of movements in foreign
exchange rates (1,049) (380) (352) (1,781) 498 (152) 563 57 966
Transfer to trade and other
payables (12,215) (693) - (12,908) - - - - -
Balance at 31 December 3,398 17,087 4,588 25,073 13,017 - 21,173 7,465 41,655
Non-current 342 16,726 - 17,068 5,682 - 21,163 - 26,845
Current 3,056 361 4,588 8,005 7,335 - 10 7,465 14,810
In 2017, the restructuring costs amounted to EUR 12.2
million (2016: EUR 22.0 million), including a reversal of
EUR 0.8 million, and EUR 14.7 million has been used (2016:
EUR 17.4 million). An amount of EUR 19.9 million in respect
of onerous contract provisions was made during 2017.
An amount of EUR 12.2 million of the onerous contract
provision has been transferred to trade and other payables
as certain onerous lease contracts have been ceased in
2017, and shall be actually further paid off in 2018. Fugro
has accounted for certain tax indemnities and warranties
under procedures in respect of the sale of the majority of the
Geoscience business to CGG for liabilities arising from tax
exposures. In 2017, an amount of EUR 5.8 million has been
released as these exposures will not further materialise.
Furthermore, an amount of EUR 0.7 million has been made
during the year in respect of these tax indemnities and
warranties for exposures additionally identified. This latter
amount shall be actually settled in 2018 and has therefore
been transferred to the trade and other payables.
The corresponding gain of EUR 5.1 million has been
classified as profit for the period from discontinued
operations in the consolidated statement of comprehensive
income as the cost for this provision was previously
Key figures
Message from the CEO
Profile
Strategy
Divisional Performance
Group Performance
Governance
Report of the Supervisory Board
Financial Statements
Other Information

FUGRO N.V. ANNUAL REPORT 2017 161
Trade and other receivables
The Group’s exposure to credit risk is influenced mainly by
the individual characteristics of each client. However,
management also considers the composition of the Group’s
client base, including the default risk of the industry and
country in which clients operate, as these factors may have
an influence on credit risk. As the Group operates to a large
extent in the oil and gas industry a significant portion of
trade and other receivables relates to clients from this
industry.
Some of the Group’s orders are awarded on the basis of
long-term preferred supplier agreements. In the course of a
year Fugro often carries out multiple projects for the same
client. Fugro typically has no single client that generates
more than 5% of its revenue in the year. On occasion one
client may generate more than 5%, which can happen in
case of exceptionally large contracts where most of the
revenue falls in the accounting year. Having a large number
of clients and short project time spans mitigates Fugro’s
credit risk as the individual amounts receivable with the
same client are limited.
New customers are analysed individually for
creditworthiness before payment and delivery terms and
conditions are offered. The Group’s review may include
external ratings, where available, and in some cases bank
references. Customers that fail to meet the Group’s
benchmark creditworthiness may transact with the Group
only on a prepayment basis or have to provide a bank
guarantee.
The majority of the Group’s clients has done business with
the Group for many years and significant losses have only
occurred incidentally in prior years. However, as a result of
the expected negative effects of the current crisis in the oil
and gas industry the credit risk has increased significantly.
Clients that are known to have negative credit
characteristics are individually monitored by the group
controllers. If clients fail to pay timely the Group re-assesses
the creditworthiness and stronger debt collection is started
if deemed necessary. The Group publishes an internal list of
clients that need extra attention before a contract is closed.
The Board of Management reviews frequently the
outstanding trade receivables. Local management is
requested to take additional precaution in working with
these clients. The Group establishes an allowance for
impairment that represents its estimate of incurred losses in
of the risks related to the Group’s wide diversity of markets,
clients and regions and its broad portfolio of activities the
risks have been quantified to the extent possible.
The Group has exposure to the following risks from its use
of financial instruments:
■ Credit risk
■ Liquidity risk
■ Market risk
This note presents information about the Group’s exposure
to each of the above risks, the Group’s objectives, policies
and processes for measuring and managing risk, and the
Group’s management of capital.
The Board of Management has overall responsibility for the
establishment and oversight of the Group’s risk
management framework.
The Group’s risk management policies are established to
identify and analyse the risks faced by the Group, to set
appropriate risk limits and controls, and to monitor risks and
adherence to limits. Risk management policies and systems
are reviewed regularly to reflect changes in market
conditions and the Group’s activities. The Group, through its
training and management standards and procedures,
aims to develop a disciplined and constructive control
environment in which all employees understand their role
and obligations.
The audit committee oversees how management monitors
compliance with the group’s risk management policies and
procedures and reviews the adequacy of the risk
management framework in relation to the risks faced by the
group. The audit committee is assisted in its oversight role
by internal audit. Both regular and ad hoc reviews of risk
management controls and procedures are performed,
the results of which are reported directly to the Board of
Management. A summary of important observations is
reported to the audit committee.
5.53.2 Credit risk
Credit risk is the risk of financial loss to the group if a
customer or counterparty to a financial instrument fails to
meet its contractual obligations, and arises principally from
the group’s receivables from customers.
Key figures
Message from the CEO
Profile
Strategy
Divisional Performance
Group Performance
Governance
Report of the Supervisory Board
Financial Statements
Other Information
Other Information

162 FUGRO N.V. ANNUAL REPORT 2017
exchange controls will become less when the oil and gas
market conditions are expected to improve and when
Angola will have increased inflow of USD in relation to their
oil business. In addition, several actions have been explored
to further lower this amount in the coming year and
thereafter.
The Group monitors cash flow on a regular basis and
operates with a global cash pool. Consolidated cash flow
information, including a projection for the year, is reported
on a monthly basis to the Board of Management, ensuring
that the Group has sufficient cash on demand (or available
lines of credit) to meet expected near term operational
expenditures, including the servicing of financial obligations
from lease commitments not included in the statement of
financial position. Cash flows exclude the potential impact of
extreme circumstances that cannot reasonably be
predicted, such as natural disasters. The Group maintains
the following lines of credit:
■ A total amount of multicurrency revolving credit
facility agreements with seven banks totalling
EUR 575 million. Rabobank and ING Bank N.V.
provided EUR 144.75 million each, HSBC Bank Plc.
provided EUR 75 million, Barclays Bank Plc.
provided EUR 50 million and ABN AMRO Bank N.V.
provided EUR 80 million, Credit Suisse provided
EUR 46 million and BNP Paribas S.A./N.V. provided
EUR 34.5 million. At 31 December 2017, an amount
of EUR 387 million has been drawn. These bank
facilities have been secured until December 2020.
■ A variety of unsecured overdraft facilities in various
currencies totalling around EUR 155 million of which
EUR 3 million has been drawn at 31 December 2017
(31 December 2016: around EUR 219 million with
EUR 4 million drawn).
5.53.4 Market risk
Market risk includes changes in market prices, such as
foreign exchange rates, interest rates and equity prices
which will affect the Group’s income or the value of its
holdings of financial instruments. The objective of market
risk management is to manage and control market risk
exposures within acceptable parameters, while optimising
the return. About 57% of the Group’s activities relate to the
oil and gas industry. The general downturn in the oil and gas
market has resulted in pressure on work volume and pricing
for oil services companies.
respect of trade and other receivables. The main
components of this allowance are a specific loss component
that relates to individually significant exposures, and a
collective loss component established for groups of similar
receivables in respect of losses that have been incurred but
not yet identified. The collective loss allowance is
determined based on historical data of payment statistics for
similar financial assets.
The Group held cash and cash equivalents of EUR 213.6
million at 31 December 2017 (2016: EUR 248.5 million),
which represents its maximum credit exposure on these
assets. The cash and cash equivalents are held with bank
and financial institution counterparties, which have
‘investment grade’ credit ratings.
Guarantees
In principle Fugro does not provide parent company
guarantees to its subsidiaries, unless commercial reasons
exist. Fugro has filed declarations of joint and several
liabilities for a number of subsidiaries at the Chambers of
Commerce. Fugro has filed a list with the Chamber of
Commerce which includes all financial interests of Fugro as
well as a reference to each subsidiary for which such a
declaration of liability has been deposited.
5.53.3 Liquidity risk
Liquidity risk is the risk that the Group will encounter
difficulty in meeting the obligations associated with its
financial liabilities that are settled by delivering cash or
another financial asset. The Group’s approach to managing
liquidity is to ensure, as far as possible, that it will always
have sufficient liquidity to meet its liabilities when due, under
both normal and stressed conditions, without incurring
unacceptable losses or risking damage to the Group’s
reputation. The global cash pool was introduced in 2015,
which made it possible for the company to use the cash
surplus within the group to reduce the overdrafts at its main
uncommitted facilities.
Although the result of the United Kingdom referendum to
leave the EU leads to uncertainties, its impact on Fugro’s
business will not be fully visible until negotiation between UK
and EU are completed.
As at 31 December 2017, Fugro holds cash balances in
Angolan Kwanza’s for the amount of EUR 48 million
(31 December 2016: EUR 53 million) in Angola where
exchange controls apply. The company expects that these
Key figures
Message from the CEO
Profile
Strategy
Divisional Performance
Group Performance
Governance
Report of the Supervisory Board
Financial Statements
Other Information

FUGRO N.V. ANNUAL REPORT 2017 163
The hedge on the investment on foreign operations is fully
effective. Consequently all exchange differences relating to
this hedge have been accounted for in other comprehensive
income. The Group is sensitive to translation differences
resulting from translation of its operations in non-Euro
currencies to Euros. In 2017, significant exchange
differences arose from the US dollar and British pound.
Interest rate risk
The Group’s liabilities bear both fixed and variable interests.
The Group’s objective is to limit the effect of interest rate
changes on the results by matching long term investment
with long term (fixed interest) financing as much as possible.
5.53.5 Capital management
The Board of Management’s policy is to maintain a strong
capital base in order to retain investor, creditor and market
confidence and to sustain future development of the
business. Capital consists of share capital, retained earnings
and non-controlling interests of the Group. The Board of
Management monitors the geographic spread of
shareholders, the return on capital as well as the level of
dividends to ordinary shareholders. The Board strives for a
dividend pay-out ratio of 35 to 55% of the net result.
No dividend is proposed to be paid-out for 2017.
The targeted solvency is set > 33.33%. The solvency at the
end of 2017 was 37.5% (2016: 43.0%). The Group’s objective
is to achieve a healthy return on shareholders’ equity.
However, as in previous year(s) the return is significantly
affected by the current market conditions and impairments
identified in the current and mainly in prior years. As a result
the return is 8.5% (negative) in 2017 (2016: 28.9% negative).
From time to time Fugro purchases its own certificates of
shares. These certificates are used to cover the options and
shares granted by Fugro. Purchase and sale decisions are
made on a specific transaction basis by the Board of
Management. Fugro does not have a defined share
buy-back plan.
There were no changes to the Group’s approach to capital
management during the year.
The Group is subject to the externally imposed capital
requirements related to covenant requirements as set out in
note 5.49.6. As per 31 December 2017 and 31 December
2016 the Group complied with all imposed external capital
requirements.
Currency risk
The global nature of the business of the Group exposes the
operations and reported financial results and cash flows to
the risks arising from fluctuations in exchange rates.
The Group’s business is exposed to currency risk whenever
it has revenues in a currency that is different from the
currency in which it incurs the costs of generating those
revenues. In the case that the revenues can be offset
against the costs incurred in the same currency, the balance
may be affected if the value of the currency in which the
revenues and costs are generated varies relative to the Euro.
Cash inflows and outflows of the operating segments are
offset if they are denominated in the same currency.
This means that revenue generated in a particular currency
balance out costs in the same currency, even if the revenues
arise from a different transaction than that in which the costs
are incurred. As a result, only the unmatched amounts are
subject to currency risk.
To mitigate the impact of currency exchange rate
fluctuations, the Group continually assesses the exposure to
currency risks and if deemed necessary a portion of those
risks is hedged by using derivative financial instruments.
The principal derivative financial instruments used to cover
foreign currency exposure are forward foreign currency
exchange contracts. An amount of EUR 48 million
(31 December 2016: EUR 53 million) is in Angolan Kwanza’s
which is subject to significant currency risk at year-end 2017.
The national bank of Angola has devaluated its currency in
2018, which resulted in a further fall of the Angolan Kwanza
against the Euro. The national bank might devaluate its
currency further in 2018, which might further affect the value
of the Angolan Kwanza against the euro.
Interest on borrowings is denominated in the currency of the
borrowing. Generally, borrowings are denominated in
currencies that match the cash flows generated by the
underlying operations of the Group, primarily Euro, US dollar
and British pound. This provides an economic hedge
without derivatives being entered into and therefore hedge
accounting is not applied in these circumstances.
The Group’s investment in its subsidiaries with US dollar as
functional currency is partly hedged by means of the US
dollar private placement loans and the use of the
multicurrency revolving credit facility in USD, which reduces
the currency risk arising from the subsidiary’s net assets.
In 2017, all private placement loans have been fully repaid.
The Group’s investments in other subsidiaries are not
hedged.
Key figures
Message from the CEO
Profile
Strategy
Divisional Performance
Group Performance
Governance
Report of the Supervisory Board
Financial Statements
Other Information
Other Information

164 FUGRO N.V. ANNUAL REPORT 2017
5.54 Credit risk
Exposure to credit risk(EUR x 1,000) Carrying amount
2017 2016
Other investments in equity instruments 1,095 1,095
Available-for-sale financial assets 558 372
Long-term loans 8,070 9,180
Deposits 12,447 11,971
Other long-term receivables 910 2,058
Unbilled revenue on (completed) projects 146,590 151,991
Trade receivables 240,655 308,810
Other receivables 83,385 85,425
Vendor loan 6,300 -
Cash and cash equivalents 213,574 248,488
713,584 819,390
The maximum exposure to credit risk at the reporting date is
the carrying amount of each class of financial assets
mentioned above. The group holds no collateral as security
on the long-term loans.
The maximum exposure for trade receivables and unbilled
revenue on (completed) projects at the reporting date by
geographic region was:
(EUR x 1,000) Carrying amount
2017 2016
Netherlands 32,328 73,965
Europe other 102,717 101,443
Africa 19,526 28,603
Middle East 79,931 87,297
Asia 37,102 58,093
Australia 26,920 11,508
Americas 88,721 99,892
387,245 460,801
Impairment losses
The ageing of trade receivables and unbilled revenue on
(completed) projects at the reporting date was:
■ As of 31 December 2017, trade receivables and
unbilled revenue on (completed) projects of
EUR 387,245 thousand (31 December 2016:
EUR 460,801 thousand) were fully performing.
■ As of 31 December 2017, trade receivables of
EUR 116,204 thousand (31 December 2016:
EUR 134,499 thousand), included in EUR 387,245
thousand (31 December 2016: EUR 460,801
thousand), were past due but not impaired. These
relate to a number of independent customers for
whom there is no recent history of default.
The average credit term for these trade receivables
is 30 days.
■ As of 31 December 2017, trade receivables and
unbilled revenue on (completed) projects of
EUR 17,892 thousand (31 December 2016:
EUR 39,482 thousand) were impaired and provided
for.
The individually impaired receivables mainly relate to
customers, which are in difficult economic situations. It was
assessed that a portion of the receivables is expected to be
recovered. The ageing of trade receivables and unbilled
revenue on (completed) projects is as follows:
Key figures
Message from the CEO
Profile
Strategy
Divisional Performance
Group Performance
Governance
Report of the Supervisory Board
Financial Statements
Other Information

FUGRO N.V. ANNUAL REPORT 2017 165
(EUR x 1,000) 2017 2016
Gross Impairment Gross Impairment
From 0 to 30 days 272,029 988 326,836 535
From 31 to 60 days 41,100 44 47,899 566
From 61 to 90 days 18,661 294 16,916 627
Over 90 days 56,059 13,834 91,763 37,754
Retentions and special items 17,288 2,732 16,869 -
405,137 17,892 500,283 39,482
The movement in the allowance for impairment in respect of
trade receivables and unbilled revenue on (completed)
projects during the year was as follows:
(EUR x 1,000) 2017 2016
Balance at 1 January 39,482 29,211
Impairment loss recognised 7,133 18,590
Impairment loss reversed (5,236) (2,887)
Trade receivables written off (21,860) (5,435)
Effect of movements in exchange rates (1,627) 3
Balance at 31 December 17,892 39,482
The allowance accounts in respect of trade receivables and
unbilled revenue on (completed) projects are used to record
impairment losses unless the Group is satisfied that no
recovery of the amount owing is possible; at that point the
amount considered irrecoverable is written off directly
against the allowance.
The impairment loss recognised is mainly attributable to a
limited number of clients for which receipt is doubtful or no
longer probable.
Besides the impairment loss on certain long-term loans
(refer to 5.40.3), no impairments related to other financial
assets than trade receivables and unbilled revenue on
(completed) projects are recognised. In general, the Group
considers credit risk on other receivables and cash and
cash equivalents to be limited. Cash and cash equivalents
are held with large well known banks with adequate credit
ratings only. Refer to 5.53.2.
Key figures
Message from the CEO
Profile
Strategy
Divisional Performance
Group Performance
Governance
Report of the Supervisory Board
Financial Statements
Other Information
Other Information

166 FUGRO N.V. ANNUAL REPORT 2017
5.55 Liquidity risk
The following are the contractual maturities of financial liabilities, including interest payments:
(EUR x 1,000) 2017
Carrying
amount
Contractual
cash flows
6 months
or less
6 – 12
months
1 – 2
years
2 – 5
years
More than
5 years
Bank loans 386,699 418,088 5,251 5,251 10,503 397,083 -
Subordinated unsecured convertible bonds
in EUR 190,000 160,399 220,421 3,790 3,810 7,600 205,221 -
Subordinated unsecured convertible bonds
in EUR 100,000 82,827 131,500 2,250 2,250 4,500 18,000 104,500
Finance lease liabilities 10,973 11,553 3,153 3,189 4,994 217 -
Other loans and long-term borrowings 483 539 183 44 72 150 90
Trade and other payables 342,594 342,594 342,594 - - - -
Bank overdraft 2,638 2,638 2,638 - - - -
986,613 1,127,333 359,859 14,544 27,669 620,671 104,590
(EUR x 1,000) 2016
Carrying
amount
Contractual
cash flows
6 months
or less
6 – 12
months
1 – 2
years
2 – 5
years
More than
5 years
Bank loans 243,537 254,489 1,245 1,191 4,728 247,325 -
Private placement loans:
320 million USD bonds 52,193 56,558 1,349 1,349 53,860 - -
330 million USD bonds 53,998 70,300 1,629 1,629 3,259 63,783 -
100 million USD bonds 26,867 38,625 829 829 1,658 6,634 28,675
27.5 million GBP bonds 5,380 6,354 128 140 6,086 - -
40 million GBP bonds 8,728 12,292 245 267 534 11,246 -
35 million EUR bonds 17,171 23,503 529 529 1,058 21,387 -
37 million USD bonds 14,862 14,937 14,937 - - - -
Subordinated unsecured convertible bonds
in EUR 153,900 228,021 3,790 3,810 7,600 212,821 -
Finance lease liabilities 18,336 19,784 3,525 3,584 7,108 5,567 -
Other loans and long-term borrowings 537 585 141 53 66 190 135
Trade and other payables 375,377 375,376 375,376 - - - -
Bank overdraft 4,043 4,043 4,043 - - - -
974,929 1,104,867 407,766 13,381 85,957 568,953 28,810
The interest included in the above table is based on the current amounts borrowed with current interest rates against the
current exchange rate (if applicable). No assumptions are included for possible future changes in borrowings or interest
payments. It is not expected that the cash flows included in the maturity analysis could occur significantly earlier, or at
significantly different amounts.
Key figures
Message from the CEO
Profile
Strategy
Divisional Performance
Group Performance
Governance
Report of the Supervisory Board
Financial Statements
Other Information

FUGRO N.V. ANNUAL REPORT 2017 167
5.56 Currency risk
Refer to 5.5.1 for the significant main currency exchange
rates applied in the year.
Sensitivity analysis
A 10 percent strengthening of the Euro against the above
currencies at 31 December would have increased
(decreased) equity and profit or loss by the amounts shown
below. This analysis is based on foreign currency exchange
rate variances that the Group considered to be reasonably
possible at the reporting date. This analysis assumes that all
other variables, in particular interest rates, remain constant
and ignores any impact of forecasted sales and purchases.
The analysis is performed on the same basis as for 2016.
Refer to note 5.53.4 Currency risk.
Effect in EUR x 1,000 Equity
Profit or loss
after tax
31 December 2017
USD (18,557) 9,621
GBP (16,710) 772
AUD (7,000) 1,636
NOK (4,994) (1,075)
31 December 2016
USD (47,265) 13,881
GBP (16,090) 2,506
NOK (8,749) (61)
AUD (8,518) 3,785
A 10 percent weakening of the euro against the above
currencies at 31 December would have had the equal but
opposite effect on the amounts shown above, on the basis
that all other variables remain constant. The effect for 2017
in the table above on profit or loss is mainly positive as the
losses reduce if the euro would increase against the other
currencies.
5.57 Interest rate risk
Profile
At the reporting date the interest rate profile of the Group’s
interest-bearing financial instruments was:
(EUR x 1,000) Carrying amount
2017 2016
Fixed rate instruments
Financial assets 14,370 9,180
Financial liabilities (254,682) (351,972)
Variable rate instruments
Financial assets 213,574 248,488
Financial liabilities (389,337) (247,580)
(416,075) (341,884)
Fair value sensitivity analysis for fixed rate instruments
The Group does not account for any fixed rate financial
assets and liabilities at fair value through profit or loss,
and the Group does not designate derivatives (interest rate
swaps) as hedging instruments under a fair value hedge
accounting model. Therefore a change in interest rates at
the reporting date would not affect profit or loss.
Cash flow sensitivity analysis for variable rate
instruments
A change of 100 basis points in interest rates at the
reporting date would have increased (decreased) equity and
profit or loss by the amounts shown below. This analysis
assumes that all other variables, in particular foreign
currency rates, remain constant. This analysis is performed
on the same basis as in 2016. At 31 December 2017, it is
estimated that a general increase (decrease) of 100 basis
points in interest rates would decrease (increase) the
Group’s profit before income tax by approximately:
Key figures
Message from the CEO
Profile
Strategy
Divisional Performance
Group Performance
Governance
Report of the Supervisory Board
Financial Statements
Other Information
Other Information

168 FUGRO N.V. ANNUAL REPORT 2017
(EUR x 1,000) Profit or loss Equity
100 bp
increase
100 bp
decrease
100 bp
increase
100 bp
decrease
31 December 2017
Variable rate instruments (1,758) 1,758 - -
Cash flow sensitivity (net) (1,758) 1,758 - -
31 December 2016
Variable rate instruments 9 (9) – –
Cash flow sensitivity (net) 9 (9) – –
5.58 Fair values
5.58.1 Financial assets and liabilities
The fair values of financial assets and liabilities, together with the carrying amounts shown in the statement of financial position,
are as follows:
(EUR x 1,000) 2017 2016
Carrying
amount Fair value
Carrying
amount Fair value
Loans and receivables
Trade receivables and other receivables* 476,930 476,930 546,226 546,226
Cash and cash equivalents 213,574 213,574 248,488 248,488
Deposits 12,447 12,447 11,971 11,971
Long-term loans 8,070 8,070 9,180 9,180
Other long-term receivables 910 910 2,058 2,058
Available-for-sale financial assets
Other investments 1,095 1,095 1,095 1,095
Available-for-sale financial assets 558 558 372 372
Financial liabilities measured at amortised cost
Bank loans (386,699) (386,699) (243,537) (243,537)
Mortgage and other loans and long-term borrowings (483) (483) (537) (537)
Private placement loans in USD - - (147,920) (170,664)
Private placement loans in GBP - - (14,108) (17,168)
Private placement loans in EUR - - (17,171) (23,212)
Subordinated unsecured convertible bonds EUR 190,000 (160,399) (168,929) (153,900) (157,102)
Subordinated unsecured convertible bonds EUR 100,000 (82,827) (84,835) - -
Finance lease liabilities (10,973) (10,973) (18,336) (18,336)
Bank overdraft (2,638) (2,638) (4,043) (4,043)
Trade and other payables (342,594) (342,594) (375,377) (375,377)
Total (273,029) (283,567) (155,539) (190,586)
Unrecognised gains/(losses) (10,538) (35,047)
* Due to the short-term nature of the trade receivables and other receivables, their carrying amount is considered to be the same as their fair value.
Key figures
Message from the CEO
Profile
Strategy
Divisional Performance
Group Performance
Governance
Report of the Supervisory Board
Financial Statements
Other Information

FUGRO N.V. ANNUAL REPORT 2017 169
The private placement loans carried for which fair value is
disclosed were categorised within level 2 of the fair value
hierarchy. The fair values of the subordinated unsecured
convertible bonds are based on discounted cash flows
using a current borrowing rate. They are classified as level 3
fair values in the fair value hierarchy due to the use of
unobservable inputs, including own credit risk.
The fair value for several Fugro vessels and other assets
were based on bids received, broker quotes and value-
in-use calculations. Management considers the value to be
within level 3 of the fair value hierarchy. Refer to note 5.32.
Interest rates used for determining fair value
The Group uses the government yield curve as per the
reporting date plus an adequate constant credit spread to
discount financial instruments. The interest rates used are
as follows:
(EUR x 1,000) 2017 2016
Loans and borrowings 1.9% – 8.6% 1.0% - 11.5%
Long term receivables 5.0% 5.0%
Fair value hierarchy
The different fair value hierarchy levels have been defined as
follows:
■ Level 1: quoted prices (unadjusted) in active markets
for identical assets or liabilities.
■ Level 2: inputs other than quoted prices included
within Level 1 that are observable for the asset or
liability, either directly (that is, as prices) or indirectly
(that is, derived from prices).
■ Level 3: inputs for the asset or liability that are not
based on observable market data (that is,
unobservable inputs).
Fugro has available-for-sale financial assets of EUR 558
thousand as at 31 December 2017 (31 December 2016:
EUR 372 thousand), which are categorised within level 1.
As in last year, there are no assets or liabilities categorised
within level 2 or 3.
5.58.2 Fugro’s valuation processes
The group’s finance department performs the valuations of
financial assets required for financial reporting purposes,
including Level 3 fair values. The valuations are directly
reported to the Chief Financial Officer.
Changes in Level 2 and Level 3 values are analysed at each
reporting date.
5.59 Commitments not included in the statement of
financial position
5.59.1 Operating leases as lessee
Non-cancellable operating lease rentals are payable as
follows:
(EUR x 1,000) 2017 2016
Less than one year 69,504 84,268
Between one and five years 162,845 192,963
More than five years 88,802 77,471
321,151 354,702
The Group leases a number of vessels, offices and
warehouse/laboratory facilities under operating leases.
The leases typically run for an initial period of between three
and ten years, with in most cases an option to renew the
lease after that date. Lease payments are adjusted annually
to reflect market rentals. None of the leases include
significant contingent rentals. During the year an amount of
EUR 127 million was recognised as an expense in profit or
loss in respect of operating leases and other rentals (2016:
EUR 166 million).
5.59.2 Bank guarantees
Per 31 December 2017, Fugro’s bank has issued bank
guarantees to clients for an amount of EUR 85 million (2016:
EUR 96 million).
5.59.3 Capital commitments
At 31 December 2017, the Group has no material
contractual obligations to purchase property, plant and
equipment (2016: EUR 6.8 million).
Key figures
Message from the CEO
Profile
Strategy
Divisional Performance
Group Performance
Governance
Report of the Supervisory Board
Financial Statements
Other Information
Other Information
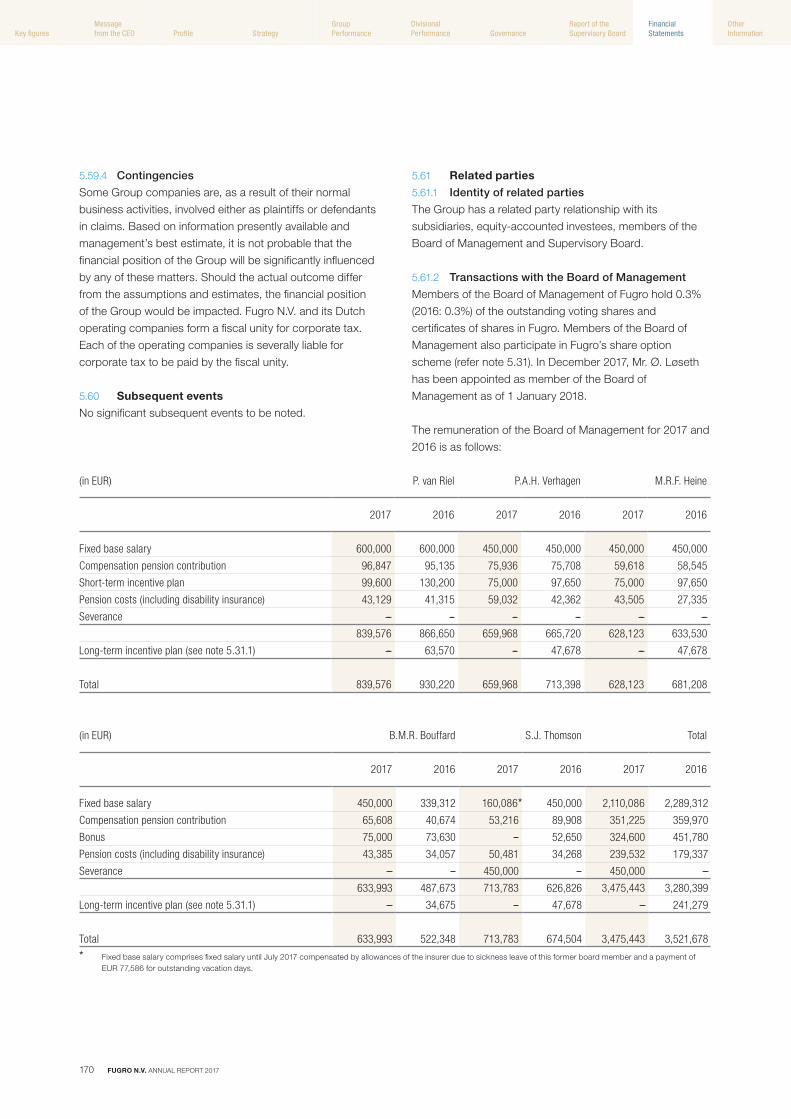
170 FUGRO N.V. ANNUAL REPORT 2017
5.61 Related parties
5.61.1 Identity of related parties
The Group has a related party relationship with its
subsidiaries, equity-accounted investees, members of the
Board of Management and Supervisory Board.
5.61.2 Transactions with the Board of Management
Members of the Board of Management of Fugro hold 0.3%
(2016: 0.3%) of the outstanding voting shares and
certificates of shares in Fugro. Members of the Board of
Management also participate in Fugro’s share option
scheme (refer note 5.31). In December 2017, Mr. Ø. Løseth
has been appointed as member of the Board of
Management as of 1 January 2018.
The remuneration of the Board of Management for 2017 and
2016 is as follows:
5.59.4 Contingencies
Some Group companies are, as a result of their normal
business activities, involved either as plaintiffs or defendants
in claims. Based on information presently available and
management’s best estimate, it is not probable that the
financial position of the Group will be significantly influenced
by any of these matters. Should the actual outcome differ
from the assumptions and estimates, the financial position
of the Group would be impacted. Fugro N.V. and its Dutch
operating companies form a fiscal unity for corporate tax.
Each of the operating companies is severally liable for
corporate tax to be paid by the fiscal unity.
5.60 Subsequent events
No significant subsequent events to be noted.
(in EUR) P. van Riel P.A.H. Verhagen M.R.F. Heine
2017 2016 2017 2016 2017 2016
Fixed base salary 600,000 600,000 450,000 450,000 450,000 450,000
Compensation pension contribution 96,847 95,135 75,936 75,708 59,618 58,545
Short-term incentive plan 99,600 130,200 75,000 97,650 75,000 97,650
Pension costs (including disability insurance) 43,129 41,315 59,032 42,362 43,505 27,335
Severance - - - - - -
839,576 866,650 659,968 665,720 628,123 633,530
Long-term incentive plan (see note 5.31.1) - 63,570 - 47,678 - 47,678
Total 839,576 930,220 659,968 713,398 628,123 681,208
(in EUR) B.M.R. Bouffard S.J. Thomson Total
2017 2016 2017 2016 2017 2016
Fixed base salary 450,000 339,312 160,086* 450,000 2,110,086 2,289,312
Compensation pension contribution 65,608 40,674 53,216 89,908 351,225 359,970
Bonus 75,000 73,630 - 52,650 324,600 451,780
Pension costs (including disability insurance) 43,385 34,057 50,481 34,268 239,532 179,337
Severance - - 450,000 - 450,000 -
633,993 487,673 713,783 626,826 3,475,443 3,280,399
Long-term incentive plan (see note 5.31.1) - 34,675 - 47,678 - 241,279
Total 633,993 522,348 713,783 674,504 3,475,443 3,521,678
* Fixed base salary comprises fixed salary until July 2017 compensated by allowances of the insurer due to sickness leave of this former board member and a payment of EUR 77,586 for outstanding vacation days.
Key figures
Message from the CEO
Profile
Strategy
Divisional Performance
Group Performance
Governance
Report of the Supervisory Board
Financial Statements
Other Information
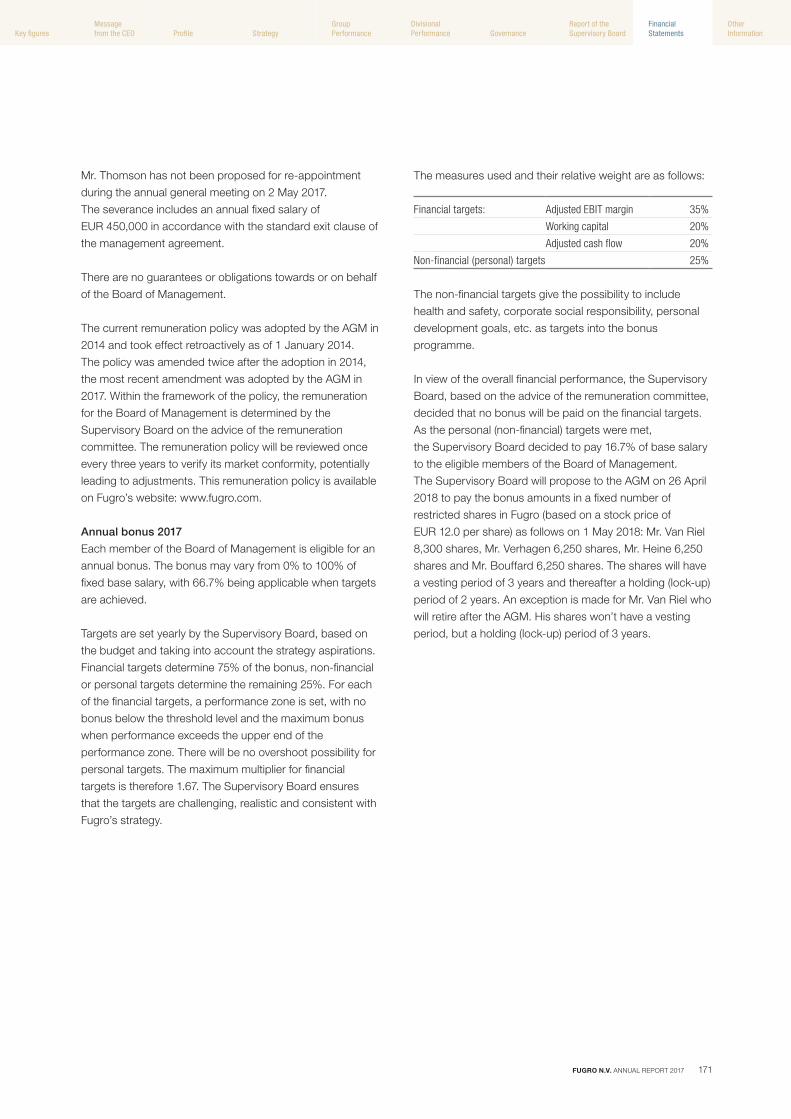
FUGRO N.V. ANNUAL REPORT 2017 171
Mr. Thomson has not been proposed for re-appointment
during the annual general meeting on 2 May 2017.
The severance includes an annual fixed salary of
EUR 450,000 in accordance with the standard exit clause of
the management agreement.
There are no guarantees or obligations towards or on behalf
of the Board of Management.
The current remuneration policy was adopted by the AGM in
2014 and took effect retroactively as of 1 January 2014.
The policy was amended twice after the adoption in 2014,
the most recent amendment was adopted by the AGM in
2017. Within the framework of the policy, the remuneration
for the Board of Management is determined by the
Supervisory Board on the advice of the remuneration
committee. The remuneration policy will be reviewed once
every three years to verify its market conformity, potentially
leading to adjustments. This remuneration policy is available
on Fugro’s website: www.fugro.com.
Annual bonus 2017
Each member of the Board of Management is eligible for an
annual bonus. The bonus may vary from 0% to 100% of
fixed base salary, with 66.7% being applicable when targets
are achieved.
Targets are set yearly by the Supervisory Board, based on
the budget and taking into account the strategy aspirations.
Financial targets determine 75% of the bonus, non-financial
or personal targets determine the remaining 25%. For each
of the financial targets, a performance zone is set, with no
bonus below the threshold level and the maximum bonus
when performance exceeds the upper end of the
performance zone. There will be no overshoot possibility for
personal targets. The maximum multiplier for financial
targets is therefore 1.67. The Supervisory Board ensures
that the targets are challenging, realistic and consistent with
Fugro’s strategy.
The measures used and their relative weight are as follows:
Financial targets: Adjusted EBIT margin 35%
Working capital 20%
Adjusted cash flow 20%
Non-financial (personal) targets 25%
The non-financial targets give the possibility to include
health and safety, corporate social responsibility, personal
development goals, etc. as targets into the bonus
programme.
In view of the overall financial performance, the Supervisory
Board, based on the advice of the remuneration committee,
decided that no bonus will be paid on the financial targets.
As the personal (non-financial) targets were met,
the Supervisory Board decided to pay 16.7% of base salary
to the eligible members of the Board of Management.
The Supervisory Board will propose to the AGM on 26 April
2018 to pay the bonus amounts in a fixed number of
restricted shares in Fugro (based on a stock price of
EUR 12.0 per share) as follows on 1 May 2018: Mr. Van Riel
8,300 shares, Mr. Verhagen 6,250 shares, Mr. Heine 6,250
shares and Mr. Bouffard 6,250 shares. The shares will have
a vesting period of 3 years and thereafter a holding (lock-up)
period of 2 years. An exception is made for Mr. Van Riel who
will retire after the AGM. His shares won’t have a vesting
period, but a holding (lock-up) period of 3 years.
Key figures
Message from the CEO
Profile
Strategy
Divisional Performance
Group Performance
Governance
Report of the Supervisory Board
Financial Statements
Other Information
Other Information

172 FUGRO N.V. ANNUAL REPORT 2017
As at 31 December the following performance options for
the Board of Management under the long-term incentive
plan were outstanding:
Year of issue Duration
Number of
participants Granted
Outstanding at
01-01-2017
Forfeited in
2017*Exercised in
2017
Outstanding at
31-12-2017
Exercisable at
31-12-2017
Exercise price
(EUR)
2014 6 years 4 97,500 97,500 3,125 - 94,375 - 17.26
2015 6 years 4 97,500 97,500 10,625 - 86,875 - 15.06
2016 6 years 5 120,000 120,000 18,125 - 101,875 - 14.55
315,000 315,000 31,875 - 283,125 -
* The performance options forfeited relates to Mr. Thomson, who has not been proposed for re-appointment. If and insofar as these performance options will vest, these will vest prorated based upon the number of full months that elapsed between the grant date and the date on which the management service agreement has ended. The prorated vesting has been reflected in the table.
The members of the Board of Management received no
performance options in 2017 (2016: 30,000 for the chairman
of the board and 22,500 for each of the other board
members). Refer to note 5.32.1.
As at 31 December the following performance shares for the
Board of Management under the long-term incentive plan
were outstanding:
Year of issue Duration
Number of
participants Granted
Outstanding at
01-01-2017
Forfeited in
2017*Vested in
2017
Outstanding at
31-12-2017
2014 3 years 4 48,750 48,750 1,563 - 47,187
2015 3 years 4 48,750 48,750 5,313 - 43,437
2016 3 years 5 60,000 60,000 9,063 - 50,937
157,500 157,500 15,939 - 141,561
* The performance shares forfeited relates to Mr. Thomson, who has not been proposed for re-appointment. If and insofar as these performance shares will vest, these will vest prorated based upon the number of full months that elapsed between the grant date and the date on which the management service agreement has ended. The prorated vesting has been reflected in the table.
The members of the Board of Management received no
performance shares in 2017 (2016: 15,000 of the chairman
of the board and 11,250 for each of the other board
members). Refer to note 5.31.1.
Key figures
Message from the CEO
Profile
Strategy
Divisional Performance
Group Performance
Governance
Report of the Supervisory Board
Financial Statements
Other Information
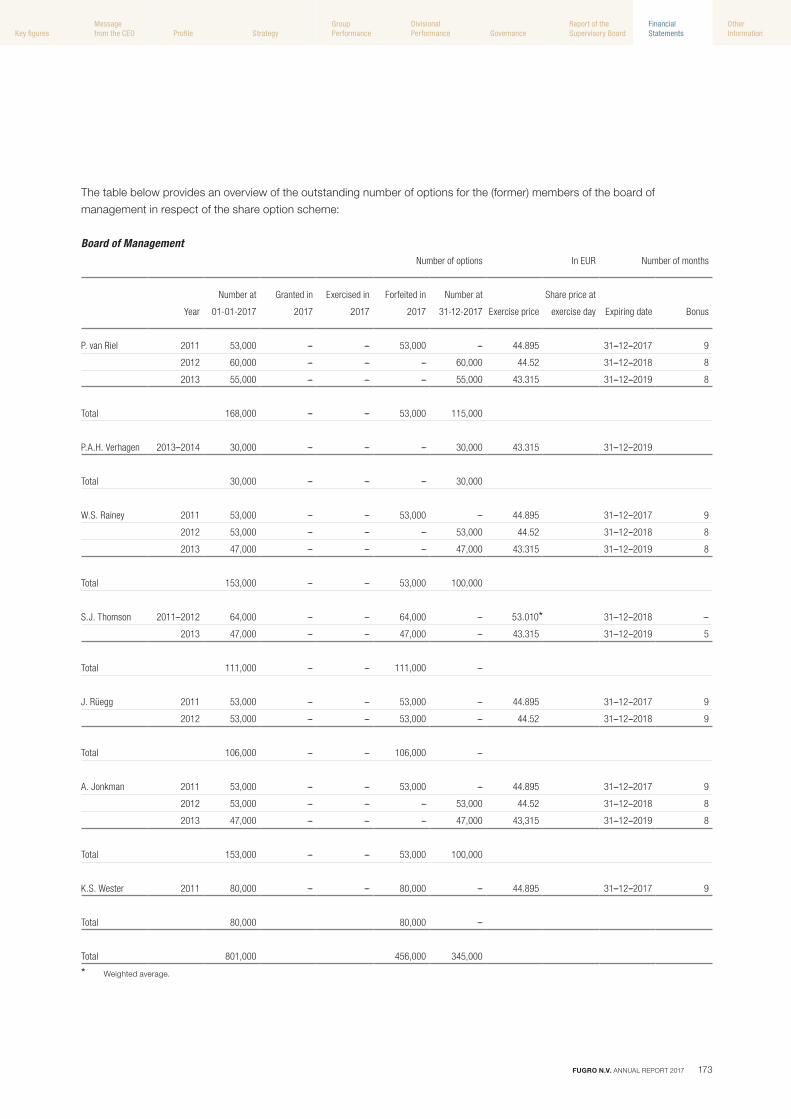
FUGRO N.V. ANNUAL REPORT 2017 173
The table below provides an overview of the outstanding number of options for the (former) members of the board of
management in respect of the share option scheme:
Board of ManagementNumber of options In EUR Number of months
Year
Number at
01-01-2017
Granted in
2017
Exercised in
2017
Forfeited in
2017
Number at
31-12-2017 Exercise price
Share price at
exercise day Expiring date Bonus
P. van Riel 2011 53,000 - - 53,000 - 44.895 31-12-2017 9
2012 60,000 - - - 60,000 44.52 31-12-2018 8
2013 55,000 - - - 55,000 43.315 31-12-2019 8
Total 168,000 - - 53,000 115,000
P.A.H. Verhagen 2013-2014 30,000 - - - 30,000 43.315 31-12-2019
Total 30,000 - - - 30,000
W.S. Rainey 2011 53,000 - - 53,000 - 44.895 31-12-2017 9
2012 53,000 - - - 53,000 44.52 31-12-2018 8
2013 47,000 - - - 47,000 43.315 31-12-2019 8
Total 153,000 - - 53,000 100,000
S.J. Thomson 2011-2012 64,000 - - 64,000 - 53.010* 31-12-2018 -
2013 47,000 - - 47,000 - 43.315 31-12-2019 5
Total 111,000 - - 111,000 -
J. Rüegg 2011 53,000 - - 53,000 - 44.895 31-12-2017 9
2012 53,000 - - 53,000 - 44.52 31-12-2018 9
Total 106,000 - - 106,000 -
A. Jonkman 2011 53,000 - - 53,000 - 44.895 31-12-2017 9
2012 53,000 - - - 53,000 44.52 31-12-2018 8
2013 47,000 - - - 47,000 43,315 31-12-2019 8
Total 153,000 - - 53,000 100,000
K.S. Wester 2011 80,000 - - 80,000 - 44.895 31-12-2017 9
Total 80,000 80,000 -
Total 801,000 456,000 345,000
* Weighted average.
Key figures
Message from the CEO
Profile
Strategy
Divisional Performance
Group Performance
Governance
Report of the Supervisory Board
Financial Statements
Other Information
Other Information

174 FUGRO N.V. ANNUAL REPORT 2017
recognised in the consolidated financial statements is
included in the following notes:
■ Impairments: Impairment analyses, amongst other
relating to vessels, are performed whenever a
triggering event has occurred to determine whether
the carrying amount exceeds the recoverable
amount. Goodwill is at least tested for impairment
annually. Impairment tests are based on estimates of
future cash flows. The accounting policies regarding
impairments are included in accounting policy 5.16.
Note 5.38.2 contains information about the key
assumptions used to determine the recoverable
amount of the various cash generating units.
Specific information on credit risk is disclosed in
notes 5.53.2 and 5.54. These notes contain
information about the assumptions used relating to
impairment of trade receivables, unbilled revenue on
(completed) projects and other receivables and
appropriate sensitivity analysis.
■ Deferred tax: The assumptions used in recognition
and measurement of deferred taxes are disclosed in
note 5.41.
■ Assets and liabilities from employee benefits:
Actuarial assumptions are established to anticipate
future events and are used in calculating pension
and other post-retirement benefit and liabilities.
These factors include assumptions with respect to
interest rates, expected investment returns on plan
assets, rates of future compensation increases,
turnover rates and life expectancy. Note 5.50
contains information about the (actuarial)
assumptions related to employee benefits. Actuarial
gains and losses related to defined benefit plans are
accounted for in other comprehensive income.
■ Other provisions, tax and other contingencies:
Information on the assumptions used in estimating
the effect of legal claims, asset retirement
obligations and onerous contract provisions are
included in accounting policy 5.20 and not 5.51.
The provisions in respect of onerous contracts are
based on the obligation that the Group has with
counterparties involved and represent the best
estimate of the obligation.
5.61.3 Supervisory Board
The remuneration of the Supervisory Board is as follows:
2017 2016
H.L.J. Noy, Chairman 80,000 80,000
J.C.M. Schönfeld, Vice-Chairman 65,000 65,000
A.J. Campo 88,000 88,000
P.H.M. Hofsté 58,000 58,000
A.H. Montijn 60,000 58,000
D.J. Wall 88,000 88,000
439,000 437,000
There are no loans outstanding to the members of the
Supervisory Board and no guarantees given on behalf of
members of the Supervisory Board.
5.61.4 Other related party transactions
5.61.4.1 Joint ventures and associates
The Group has not entered into any significant joint ventures
in 2017. Reference is further made to note 5.28 in respect of
Fugro’s interest in Global Marine Holdings LLC.
5.62 Subsidiaries
5.62.1 Significant subsidiaries
For an overview of (significant) subsidiaries we refer to
chapter 6.
5.63 Estimates and management judgements
Management discussed with the audit committee the
development in and choice of critical accounting principles
and estimates and the application of such principles and
estimates.
Key sources of estimation uncertainty
The preparation of financial statements in conformity with
EU-IFRS requires management to make judgements,
estimates and assumptions that affect the application of
accounting policies and the reported amounts of assets,
liabilities, income and expenses. Actual results may differ
from these estimates. Estimates and underlying
assumptions are reviewed on an ongoing basis. Revisions to
accounting estimates are recognised in the period in which
the estimates are revised if the revision affects only that
period, or in the period of the revision and future periods if
the revision affects both current and future periods.
Information about critical judgements in applying accounting
policies that have the most significant effect on the amounts
Key figures
Message from the CEO
Profile
Strategy
Divisional Performance
Group Performance
Governance
Report of the Supervisory Board
Financial Statements
Other Information

FUGRO N.V. ANNUAL REPORT 2017 175
Unless stated otherwise, the direct or indirect interest of
Fugro in the subsidiaries listed below is 100%. Insignificant,
but consolidated, subsidiaries in terms of third party
recompense for goods and services supplied and balance
sheet totals have not been included. For entities where the
direct or indirect interest of Fugro is less than 50%,
the Group consolidates financial information of such entities
based on the definition of control.
The subsidiaries listed below have been fully incorporated
into the consolidated financial statements of Fugro, unless
indicated otherwise.
The information as required by sections 2:379 and 2:414 of
the Dutch Civil Code has been filed at the trade registry of
the Chamber of Commerce in The Hague.
Company % Office, Country
Fugro Albania sh.p.k. Tirana, Albania
Fugro Angola Limitada 49% Luanda, Angola
Fugro ROAMES Pty Ltd Brisbane, Australia
Fugro TSM Finance Pty Ltd Perth, Australia
Fugro Exploration Pty Ltd Perth, Australia
Fugro Survey Pty. Ltd. Balcatta, Australia
Fugro LADS Corporation Pty Ltd Kidman Park, Australia
Fugro Holdings (Australia) Pty Ltd Perth, Australia
Fugro Spatial Solutions Pty Ltd Perth, Australia
Fugro TSM Pty Ltd Perth, Australia
Fugro Satellite Positioning Pty Ltd Perth, Australia
Fugro AG Pty Ltd Perth, Australia
Fugro Austria GmbH Bruck an der Mur, Austria
SOCAR-Fugro LLC 49%* Baku, Azerbaijan
Fugro Belgique/België S.A./N.V. Brussels, Belgium
Fugro In Situ Geotecnia Ltda. Pinhais, Brazil
Fugro Brasil Levantamentos Ltda. Rio de Janeiro, Brazil
Sudeste Serviços Ltda. Rio de Janeiro, Brazil
Fugro Sendirian Berhad Bandar Seri Begawan,
Brunei Darussalam
Fugro Survey (B) Sdn Bhd 70% Kuala Belait, Brunei Darussalam
Geofor Cameroun SA Douala, Cameroun
GIE GEOFOR Afrique Douala, Cameroun
Fugro Canada, Corp. St. John’s, Canada
Fugro Chile S.A. Santiago, Chile
Fugro Technical Services (Beijing) Ltd. Beijing, China
Fugro Technical Services (Guangzhou)
Ltd.
Guangzhou, China
Fugro Pacifica Qinhuangdao Co., Ltd. Qinhuangdao, China
Company % Office, Country
China Offshore Fugro GeoSolutions
(Shenzhen) Co. Ltd.
50%* Shekou, Shenzhen, China
Fugro Curaçao N.V. Willemstad, Curaçao
Fugro Consultants International N.V. Willemstad, Curaçao
Fugro Financial International N.V. Willemstad, Curaçao
Fugro S.A.E. Cairo, Egypt
Fugro Geoid S.A.S. Jacou, France
Fugro GeoConsulting S.A.S. Nanterre, France
Fugro Holding France S.A.S. Nanterre, France
Fugro Topnav S.A.S. Palaiseau, France
GEOTER S.A.S. Clapiers, France
Geofor Gabon SA Libreville, Gabon
Fugro Gabon SARL Port Gentil, Gabon
Fugro Germany Land GmbH Berlin, Germany
Fugro Germany Marine GmbH Bremen, Germany
Fugro Certification Services Ltd. Kwai Fong, Hong Kong
Fugro Technical Services Ltd. Tuen Mun, Hong Kong
Fugro Geotechnical Services Ltd. Fo Tan, Hong Kong
Fugro (Hong Kong) Ltd. Wanchai, Hong Kong
Fugro Geosciences International Ltd. Wanchai, Hong Kong
Fugro Holdings (Hong Kong) Ltd. Wanchai, Hong Kong
Fugro Hydrographic Surveys Ltd. Wanchai, Hong Kong
Fugro Geospatial Services
(Hong Kong) Ltd.
Wanchai, Hong Kong
Fugro Geotechnics Vietnam
(Hong Kong) Ltd.
Wanchai, Hong Kong
Fugro Marine Survey International Ltd. Wanchai, Hong Kong
Fugro SEA Ltd. Wanchai, Hong Kong
Fugro Subsea Services Ltd. Wanchai, Hong Kong
Fugro Survey Ltd. Wanchai, Hong Kong
MateriaLab Consultants Ltd. Kwai Fong, Hong Kong
Fugro Consult Kft Budapest, Hungary
Fugro Geotech (India) Private Limited Navi Mumbai, India
Fugro Survey (India) Private Limited 90% Navi Mumbai, India
PT Fugro Indonesia Jakarta Selatan, Indonesia
Fugro-ETW LLC 50%* Basra, Iraq
FAZ Technology Ltd. 96.5% Dublin, Ireland
FAZ Research Ltd. 96.5% Dublin, Ireland
Fugro Italy S.p.A. Rome, Italy
Fugro Japan Co., Ltd. Tokyo, Japan
Fugro-KGNT LLP 50%* Almaty, Kazakhstan Republic
MAPS SARL Beirut, Lebanon
Fugro Eco Consult S.a.r.l. Munsbach, Luxembourg
Fugro Technical Services (Macau) Ltd. Macau, Macau
Fugro Geodetic (Malaysia) Sdn Bhd 30% Kuala Lumpur, Malaysia
Fugro Geosciences (Malaysia) Sdn Bhd 30% Kuala Lumpur, Malaysia
Fugro Malaysia Land Sdn Bhd Puchong, Malaysia
6 SUBSIDIARIES AND INVESTMENTS ACCOUNTED FOR USING THE EQUITY METHOD OF FUGRO N.V.
(including statutory seat and percentage of interest)
Key figures
Message from the CEO
Profile
Strategy
Divisional Performance
Group Performance
Governance
Report of the Supervisory Board
Financial Statements
Other Information
Other Information

176 FUGRO N.V. ANNUAL REPORT 2017
Company % Office, Country
Fugro Maps South Africa (Pty) Ltd. Cape Town, South Africa
Fugro Earth Resources (Pty) Ltd. Johannesburg, South Africa
Fugro Finance AG Zug, Switzerland
Fugro Geodetic AG Zug, Switzerland
Fugro International Holding AG Zug, Switzerland
Fugro South America GmbH Zug, Switzerland
Fugro Survey GmbH Zug, Switzerland
Middle East Investment GmbH Zug, Switzerland
Fugro Sial Ltd. Ankara, Turkey
Fugro Subsea LLC 49% Abu Dhabi, United Arab Emirates
Fugro GB Marine North Limited Aberdeen, United Kingdom
Fugro-ImpROV Limited Aberdeen, United Kingdom
Fugro Subsea Services Limited Aberdeen, United Kingdom
Fugro-BKS Limited Coleraine, United Kingdom
Fugro GeoServices Limited Falmouth, United Kingdom
Fugro Alluvial Offshore Limited Great Yarmouth, United Kingdom
Fugro GB Marine Limited Wallingford, United Kingdom
Fugro Holdings Limited Wallingford, United Kingdom
Global Marine Holdings LLC 23.6%* Delaware, United States
Fugro Holding (USA), Inc. Houston, United States
Fugro Enterprise, Inc. Houston, United States
Fugro Synergy, Inc. Houston, United States
Fugro Roadware, Inc. Richmond, United States
Fugro USA Land, Inc. Houston, United States
Fugro USA Marine, Inc. Lafayette, United States
Fugro Geotechnics Vietnam LLC Ho Chi Minh City, Vietnam
* Joint arrangements classified as joint ventures or associates that are equity-accounted.
Company % Office, Country
Fugro TSM Labuan Pty Ltd Federal Territory of Labuan,
Malaysia
Fugro Holding Malta Ltd. Luqa, Malta
Fugro Malta Ltd. Luqa, Malta
Geofor International SA Quatre Bornes, Mauritius
Fugro Mauritius Ltd. Quatre Bornes, Mauritius
Fugro Mexico S.A. de C.V. Ciudad Del Carmen,
Campeche, Mexico
Geomundo S.A. de C.V. Ciudad Del Carmen,
Campeche, Mexico
Fugro Mozambique Ltda. Maputo, Mozambique
Fugro CIS B.V. Leidschendam, The Netherlands
Fugro-Elbocon B.V. Leidschendam, The Netherlands
Fugro Engineers B.V. Nootdorp, The Netherlands
Fugro Financial Resources B.V. Leidschendam, The Netherlands
Fugro NL Land B.V. Leidschendam, The Netherlands
Fugro Intersite B.V. Leidschendam, The Netherlands
Fugro Marine Services B.V. Leidschendam, The Netherlands
Fugro Nederland B.V. Leidschendam, The Netherlands
Fugro South America B.V. Leidschendam, The Netherlands
Fugro Survey B.V. Leidschendam, The Netherlands
Fugro Vastgoed B.V. Leidschendam, The Netherlands
FNV IP B.V. Leidschendam, The Netherlands
Fugro Satellite Positioning B.V. Leidschendam, The Netherlands
Seabed Geosolutions B.V. 60% Leidschendam, The Netherlands
Fugro BTW Ltd. New Plymouth, New Zealand
Fugro Survey (Nigeria) Ltd. Port Harcourt, Nigeria
Fugro Nigeria Ltd. Port Harcourt, Nigeria
Fugro Norway AS Oslo, Norway
Fugro Middle East & Partners LLC 70% Muscat, Oman
Fugro Symphony Inc. Panama City, Panama
Fugro Peru S.A. Lima, Peru
Fugro Peninsular Services 49% Doha, Qatar
GEOINGSERVICE LLP Moscow, Russia
Geofor Sao Tome Ltda. Sao Tome City, Sao Tome
Fugro-Suhaimi Ltd. 50% Dammam, Saudi Arabia
Decca Survey Saudi Arabia Ltd. 40% Dammam, Saudi Arabia
Fugro Saudi Arabia Ltd. Dammam, Saudi Arabia
Fugro Satellite Positioning Pte Ltd Singapore, Singapore
Fugro Singapore Pte Ltd Singapore, Singapore
Fugro Survey Pte Ltd Singapore, Singapore
Fugro TSM Pte Ltd Singapore, Singapore
Fugro Subsea Technologies Pte Ltd Singapore, Singapore
Fugro Global Environmental and Ocean
Sciences Pte Ltd
Singapore, Singapore
Setouchi Services Pte Ltd Singapore, Singapore
Fugro Survey Africa (Pty) Ltd. Cape Town, South Africa
Other Information
Key figures
Message from the CEO
Profile
Strategy
Divisional Performance
Group Performance
Governance
Report of the Supervisory Board
Financial Statements
Other Information

FUGRO N.V. ANNUAL REPORT 2017 177
(EUR x 1,000) 2017 2016
AssetsIntangible assets 160 804
Tangible fixed assets - 3
(9.1) Financial fixed assets 1,203,907 1,634,156
Deferred tax assets 186 -
Total non-current assets 1,204,253 1,634,963
(9.2) Trade and other receivables 8,113 12,365
Current tax assets 137 6,735
Cash and cash equivalents 384 127
Total current assets 8,634 19,227
Total assets 1,212,887 1,654,190
EquityShare capital 4,228 4,228
Share premium 431,227 431,227
Translation reserve (115,909) (20,715)
Hedging reserve - (103)
Other reserves (316,412) (328,242)
Retained earnings 868,821 1,157,398
Unappropriated result (159,901) (308,934)
(9.3) Total equity 712,054 934,859
Provisions
(9.4) Provisions for other liabilities and charges 13,172 18,694
Deferred tax liabilities - 682
Liabilities
(9.5) Loans and borrowings 243,226 318,237
Total non-current liabilities 256,398 337,613
Bank overdraft - 60
(9.5) Loans and borrowings - 14,862
(9.6) Trade and other payables 238,075 365,230
Current tax liabilities 6,006 -
Other taxes and social security charges 354 1,566
Total current liabilities 244,435 381,718
Total liabilities 500,833 719,331
Total equity and liabilities 1,212,887 1,654,190
7 COMPANY BALANCE SHEET
As at 31 December, before result appropriation
Key figures
Message from the CEO
Profile
Strategy
Divisional Performance
Group Performance
Governance
Report of the Supervisory Board
Financial Statements
Other Information
Other Information
Other Information

178 FUGRO N.V. ANNUAL REPORT 2017
8 COMPANY INCOME STATEMENT
For the year ended 31 December
(EUR x 1,000) 2017 2016
(9.7) Revenue 37,263 39,994
Other income 970 67
(9.8) Personnel expenses (20,699) (20,928)
Depreciation (3) (31)
Amortisation (644) (647)
(9.9) Other expenses (23,022) (51,713)
Results from operating activities (EBIT) (6,135) (33,258)
Finance income 11,530 30,711
Finance expenses (37,964) (64,457)
(9.10) Net finance income/(expenses) (26,434) (33,746)
Profit/(loss) before income tax (32,569) (67,004)
Income tax gain/(expense) (1,001) 21,006
Share in results from participating interests, after taxation (126,331) (262,936)
Profit/(loss) for the period (159,901) (308,934)
Other Information
Key figures
Message from the CEO
Profile
Strategy
Divisional Performance
Group Performance
Governance
Report of the Supervisory Board
Financial Statements
Other Information

FUGRO N.V. ANNUAL REPORT 2017 179
General
The company financial statements form part of the 2017
consolidated financial statements of Fugro.
Accounting policies
For setting the principles for the recognition and
measurement of assets and liabilities and determination of
the result for its company financial statements, Fugro makes
use of the option provided in Clause 8 Section 2:362 of the
Netherlands Civil Code. This means that the principles for
the recognition and measurement of assets and liabilities
and determination of the result (hereinafter referred to as
principles for recognition and measurement) of the company
financial statements of Fugro N.V. are the same as those
applied for the consolidated EU-IFRS financial statements.
Investments in subsidiaries are accounted for at net asset
value which comprises the cost, excluding goodwill,
of Fugro’s share in the net assets of the subsidiaries.
Participating interests, over which significant influence is
exercised, are stated on the basis of the equity method.
These consolidated financial statements have been
prepared in accordance with International Financial
Reporting Standards (IFRS) as adopted by the European
Union (EU-IFRS) and with Part 9 of Book 2 of the
Netherlands Civil Code. Reference is made to accounting
policies 5.3 to 5.25 for a description of these principles.
The share in the result of participating interests consists of
the share of Fugro in the result of these participating
interests. Results on transactions, where the transfer of
assets and liabilities between Fugro and its participating
interests, and mutually between participating interests
themselves, are not incorporated as far as they can be
deemed to be unrealised.
9.1 Financial fixed assets
(EUR x 1,000) 2017 2016
Subsidiaries 1,203,907 1,235,774
Long-term loans to group companies - 398,382
1,203,907 1,634,156
9.1.1 Subsidiaries
(EUR x 1,000) 2017 2016
Balance at 1 January 1,235,774 1,172,025
Share in result of participating interests (126,331) (262,936)
Capital increase 181,342 321,650
Dividends (7,242) (9,972)
Currency exchange differences (98,262) 28,654
Other 18,626 (13,647)
Balance 31 December 1,203,907 1,235,774
9.1.2 Long-term loans to group companies
(EUR x 1,000) 2017 2016
Balance at 1 January 398,382 926,151
Loans issued - 235,761
Write-off receivable - (12,042)
Redemptions (388,744) (742,379)
Currency exchange differences (9,638) (9,109)
Balance 31 December - 398,382
The long-term loans due from subsidiaries have been
redeemed in 2017.
9.2 Trade and other receivables
(EUR x 1,000) 2017 2016
Receivables from group companies 7,334 11,022
Other receivables 779 1,343
Balance 31 December 8,113 12,365
9.3 Equity
The equity movement schedule is included in chapter 3 of
the consolidated financial statements. For the notes to the
equity reference is made to note 5.46 of the consolidated
financial statements. The translation reserve and hedging
reserve qualify as legal reserves (Dutch: ‘wettelijke reserve’)
in accordance with Part 9 of Book 2 of the Netherlands Civil
Code.
9 NOTES TO THE COMPANY FINANCIAL STATEMENTS
Key figures
Message from the CEO
Profile
Strategy
Divisional Performance
Group Performance
Governance
Report of the Supervisory Board
Financial Statements
Other Information
Other Information
Other Information

180 FUGRO N.V. ANNUAL REPORT 2017
9.4 Provisions for other liabilities and charges
For the notes on provisions reference is made to note 5.51
of the consolidated financial statements. Fugro has
accounted for certain tax indemnities and warranties under
procedures in respect of the sale of the majority of the
Geoscience business to CGG for liabilities arising from tax
exposures amounting to EUR 12.1 million as at 31 December
2017 (31 December 2016: EUR 17.9 million). An amount of
EUR 0.6 million (31 December 2016: EUR 0.5 million) and
EUR 0.5 million (31 December 2016: EUR 0.3 million) relate
to a restructuring provision respectively employee benefit
obligations. An amount of EUR 0.6 million is expected to be
settled within one year. Refer to note 9.9.
9.5 Loans and borrowings
(EUR x 1,000) 2017 2016
Private placement loans, non-current
portion - 164,337
Subordinated unsecured convertible
bonds EUR 190,000 160,399 153,900
Subordinated unsecured convertible
bonds EUR 100,000 82,827 -
Private placement loans, current portion - 14,862
Balance 31 December 243,226 333,099
For the notes on private placement loans reference is made
to note 5.49 of the consolidated financial statements.
The average interest on loans and borrowings amounts to
4.2% per annum (2016: 4.9%).
9.6 Trade and other payables
(EUR x 1,000) 2017 2016
Trade payables 1,267 3,934
Payables to group companies 230,547 355,108
Other payables 6,261 6,188
Balance 31 December 238,075 365,230
The payables to group companies mainly relate to the
cash-pool overdraft of Fugro N.V. The interest is calculated
on the total balance of the cash pool. Reference is made to
note 5.53 of the consolidated financial statements.
9.7 Revenue
Revenue relates to the services provided by Fugro N.V.
to subsidiaries in respect of their management activities and
responsibilities.
9.8 Personnel expenses
(EUR x 1,000) 2017 2016
Wages and salaries 18,230 16,673
Compulsory social security contributions 824 523
Equity-settled share-based payments 759 2,195
Contributions to defined contribution
plans 8 612
Expense related to defined benefit plans 878 925
20,699 20,928
Refer to note 5.61 of the consolidated financial statements
for remuneration of the Board of Management.
The average number of employees within Fugro N.V. during
the year was 45 (2016: 43).
9.9 Other expenses
(EUR x 1,000) 2017 2016
Indirect operating expenses 1,709 2,750
Occupancy costs 62 91
Communication and office equipment 1,163 2,084
Write-off receivables - 12,041
Restructuring costs 1,923 589
Marketing and advertising costs 1,980 2,302
Release provision tax indemnities (5,070) -
Other 21,255 31,856
Total 23,022 51,713
Other expenses include amongst others professional
services, training costs, audit fees, miscellaneous charges
and sundry costs. Refer to note 5.33 of the consolidated
financial statements. Audit fees, as charged by EY are
disclosed in note 9.16. In 2017 Fugro released an amount of
EUR 5.8 million related to certain tax indemnities and
warranties under procedures in respect of the sale of the
majority of the Geoscience business to CGG for liabilities
arising from tax exposures. Furthermore, an amount of
EUR 0.7 million has been made during the year in respect of
these tax indemnities and warranties for exposures
additionally identified. In the consolidated financial
statements the corresponding gain of EUR 5.1 million has
Key figures
Message from the CEO
Profile
Strategy
Divisional Performance
Group Performance
Governance
Report of the Supervisory Board
Financial Statements
Other Information

FUGRO N.V. ANNUAL REPORT 2017 181
9.13 Guarantees
Fugro has filed declarations of joint and several liabilities for
a number of subsidiaries at the Chambers of Commerce.
Fugro has filed a list with the Chamber of Commerce, which
includes all financial interests of the Group in subsidiaries as
well as a reference to each subsidiary for which such a
declaration of liability has been deposited. Fugro N.V.
is borrower and guarantor under this multicurrency revolving
credit facility agreement.
9.14 Contingencies
For the notes to contingencies reference is made to note
5.59.4 of the consolidated financial statements.
9.15 Related parties
For the notes to related parties, reference is made to note
5.61 of the consolidated financial statements.
In note 5.61.2 of the consolidated financial statements the
remuneration of the Board of Management and Supervisory
Board is disclosed.
been classified as profit for the period from discontinued
operations. Refer to note 5.51 of the consolidated financial
statements.
9.10 Net finance (income)/expenses
(EUR x 1,000) 2017 2016
Interest income on loans and receivables
from group companies (9,659) (29,136)
Interest income on loans and receivables (71) (1,575)
Net foreign exchange variance (1,800) -
Finance income (11,530) (30,711)
Interest expense on financial liabilities
measured at amortised cost 37,964 54,989
Net change in fair value of financial
assets at fair value through profit or loss
(refer to note 5.40.3) - -
Net foreign exchange variance - 9,468
Finance expense 37,964 64,457
Net finance (income)/expenses
recognised in profit or loss 26,434 33,746
9.11 Commitments not included in the
balance sheet
Fiscal unity
Fugro N.V. and the Dutch operating companies form a fiscal
unit for corporate tax. Each of the operating companies is
severally liable for corporate tax to be paid by the fiscal
unity.
9.12 Bank guarantees
Per 31 December 2017, Fugro’s bank has issued bank
guarantees to clients for an amount of EUR 66 million
(2016: EUR 67 million).
Key figures
Message from the CEO
Profile
Strategy
Divisional Performance
Group Performance
Governance
Report of the Supervisory Board
Financial Statements
Other Information
Other Information

182 FUGRO N.V. ANNUAL REPORT 2017
Tax advisory services primarily consist of tax compliance
work. Other audit services relate to a non-recurring audit of
general purpose financial statements and other assurance
related services relate to certain agreed-upon procedures.
Audit and (non-)audit related fees for the respective years
are charged to the income statement on an accrual basis.
The fees paid for the above mentioned services, which are
included in profit or loss of the consolidated financial
statements in the line other expenses, are evaluated on a
regular basis and in line with the market.
The members of the Supervisory Board have signed the
financial statements pursuant to their statutory obligations
under Section 2:101 sub 2 Netherlands Civil Code.
The members of the Board of Management have signed the
financial statements pursuant to their statutory obligations
under Section 2:101 sub 2 Netherlands Civil Code and
Section 5:25c sub 2 (c) Financial Markets Supervision Act.
9.16 Audit fees
With reference to Section 2:382a of the Netherlands Civil Code, the following fees for the financial year have been charged by
EY to the company and its subsidiaries:
(EUR x 1,000) 2017 2016
Ernst & Young
Accountants
LLP
Other EY
network
Total
EY
Ernst & Young
Accountants
LLP
Other EY
network
Total
EY
Statutory audit of financial statements 1,242 2,269 3,511 1,470 2,215 3,685
Other audit services 260 - 260 - - -
Other assurance related services 2 - 2 - 86 86
Tax advisory services - 201 201 - 902 902
Other non-audit services - - - - 72 72
Total 1,504 2,470 3,974 1,470 3,275 4,745
Fugro will not propose to the annual general meeting on
26 April 2018 to declare a dividend for 2017 to shareholders.
Leidschendam, 21 February 2018
Board of Management
P. van Riel, Chairman Board of Management, Chief Executive Officer
P.A.H. Verhagen, Chief Financial Officer
M.R.F. Heine, Director Marine division
B.M.R. Bouffard, Director Land division
Ø. Løseth, member Board of Management
Supervisory Board
H.L.J. Noy, Chairman
J.C.M. Schönfeld, Vice-chairman
A.J. Campo
P.H.M. Hofsté
A.H. Montijn
D.J. Wall
Other Information
Key figures
Message from the CEO
Profile
Strategy
Divisional Performance
Group Performance
Governance
Report of the Supervisory Board
Financial Statements
Other Information