Embed Size (px)
Citation preview

Financial Statement Pension Note Disclosure Templates
for Rhode Island local governments with employees participating in the State administered:
Employees’ Retirement System (ERS) (Teachers)
Municipal Employees’ Retirement System (MERS)
Rhode Island Defined Contribution Plan (effective July 1, 2012)
Office of the Auditor General – State of Rhode Island
(last updated November 26, 2013)

86 Weybosset Street Providence, RI 02903-2800 tel: 401.222.2435 fax: 401.222.2111
Office of the Auditor General State of Rhode Island and Providence Plantations - General Assembly Dennis E. Hoyle, CPA - Auditor General
oag.ri.gov
November 26, 2013 Dear Finance Officer:
The purpose of these templates is to assist Rhode Island local governments in preparing financial statement note disclosures and required supplementary information related to pension plans administered by the Employees’ Retirement System of Rhode Island (the System).
These recommended pension disclosures are required by accounting principles generally accepted in the
United States of America and as promulgated by the Governmental Accounting Standards Board. The notes on pages 2 and 3 provide guidance regarding use of these templates and include links to
actuarial and other information necessary to complete your note disclosures and required supplementary information. Feel free to contact Rina DiBenedetto or Lori Gelfuso should you have any questions regarding the
templates.
Sincerely, Dennis E. Hoyle, CPA Auditor General

Financial Statement Note Disclosure Templates – Pensions Applicable for June 30, 2013 financial statements (updated November 26, 2013)
Page | 2
Notes regarding use: • These templates are appropriate for all local government entities (cities, towns, regional school districts) that
participate in the State administered pension plans and prepare financial statements in accordance with generally accepted accounting principles as prescribed by the Governmental Accounting Standards Board (GASB).
• These templates have been developed based on current accounting and financial reporting standards in effect
for the fiscal year ended June 30, 2013. References to the applicable GASB standards (GASB codification) for note disclosures and required supplementary information (RSI) are summarized below based on the type of plan:
Type of plan: GASB codification section GASB codification par. # Illustration
Cost-sharing plans P20 .117 #3 Multiple employer agent plans P20 .117, .118 and .119 #4 Defined contribution plans P20 .124
• We have included or referenced key data – principally (1) the actuarial valuations that developed the employer
contribution rates for Fiscal 2013 and (2) the actuarial valuations of ERS and MERS as of June 30, 2012 which is the most recent available, and (3) the actuarial valuation of MERS for June 30, 2011 which is needed for certain disclosures and required supplementary information.
Link to the 2012 actuarial valuations for ERS and MERS https://www.ersri.org/public/actuarialValuations/ERS_VAL2012_final.pdf https://www.ersri.org/public/actuarialValuations/MERS2012_final.pdf
Link to the 2011 actuarial valuations for MERS: https://www.ersri.org/public/actuarialValuations/MERS_VAL11.pdf
The fiscal 2013 employer contribution rates for both ERS and MERS were developed based on an actuarial valuation performed as of June 30, 2010. Due to the enactment of the Rhode Island Retirement Security Act (RIRSA) in November 2011, key valuation data, including contribution rates and funded status information was amended in a letter from Gabriel Roder Smith, (the System’s actuary) dated November 14, 2011 (pdf enclosed). This is the appropriate source of actuarial information for fiscal 2013 contribution rates.
Link to November 14, 2011 letter:
http://www.treasury.state.ri.us/secure-path-ri/rirsa/legis/RetirementSecurityAnalysisAmendNov11Final.pdf
• The templates have been prepared following the guidance that, in certain instances, disclosures may be
reduced when separately issued plan financial statements are available. The financial statements of the Employees’ Retirement System of Rhode Island (the System) are audited annually by the Office of the Auditor General – those audit reports are available on the following websites:
http://www.oag.ri.gov/reports.html http://www.ersri.org

Financial Statement Note Disclosure Templates – Pensions Applicable for June 30, 2013 financial statements (updated November 26, 2013)
Page | 3
Link to the fiscal 2012 audit report for the System: http://www.oag.ri.gov/reports/retire2012.pdf
The System’s fiscal 2013 audited financial statements should be available in early December 2013 and will include the newly created defined contribution plan.
• The note disclosure templates include the new Defined Contribution plan pursuant to RIRSA which became
effective on July 1, 2012. • Recommended disclosure templates are not included herein for pension plans administered by local
governments. The form and content of those disclosures are detailed in sec Pe5 and P20 of the GASB codification.
• The sections local governments need to customize are highlighted XXXXXXXXX.
• The sections where local governments need to choose the disclosures based on their specific circumstances
or the employee groups covered are highlighted XXXXXXXXX.
• These templates have been developed considering the requirements and common variations encountered by most municipalities. There may be specific situations that would require modification of these recommended disclosures. Municipalities should discuss those situations with their auditors and the Employees’ Retirement System when necessary.
• Legal challenges to legislatively enacted pension reforms are proceeding through the courts and as of this
date (November 26, 2013) are in court-ordered mediation. For financial reporting purposes, municipalities should assess the status of these legal proceedings and assess whether any disclosures regarding contingencies or subsequent events are warranted.

Financial Statement Note Disclosure Templates – Pensions Applicable for June 30, 2013 financial statements (updated November 26, 2013)
Page | 4
Effective July 1, 2012, the State administered retirement system which covers local teachers and certain municipal employees was modified to include both defined benefit and defined contribution plan components. Employees’ Retirement System (ERS) – Defined Benefit Plan
a. Plan Description All full-time teachers, principals, school nurses and certain other school officials (including the superintendent) in the city/town’s school system must participate in ERS, a cost-sharing multiple employer defined benefit plan administered by the Employees’ Retirement System of Rhode Island (the System). The plan provides retirement, death and disability benefits (as well as annual cost of living allowances if certain conditions have been met) as outlined in Chapters 36-10 and 16-16 of the Rhode Island General Laws (RIGL). The benefits may be amended by the Rhode Island General Assembly.
b. Funding Policy The funding policy is outlined in RIGL sections 16-16-22 and 36-10-2 (which can be amended by the Rhode Island General Assembly). Active plan members must contribute 3.75% of his/her compensation. The city/town and the State are collectively required to contribute at an actuarially determined rate expressed as a percentage of total compensation paid to the active membership. The employer contribution is split and paid 40% by the State and 60% by the school district with the exception of teachers who work in federally funded programs where 100% is paid by the school district and reimbursed by the federal government. For fiscal 2013, the total employer rate 19.29% (7.88% State share and 11.41% local share). The State share of the employer contribution rate includes the total cost of prior contribution deferrals which was .28% for fiscal 2013.
For communities that did not participate in the 1990 early retirement incentive – substitute these rates
Total – 17.87%
State - 7.15%
Local - 10.72%
The city/town contributed $XXX, $XXX and $XXX during the fiscal years 2013, 2012 and 2011, respectively, equal to 100% of the actuarially required contributions for those respective years. For financial reporting purposes, the State’s share of contributions are reflected as on behalf-payments and are included as both revenue and expenditures in the accompanying financial statements.
The System issues an annual financial report that includes financial statements and required supplementary information for all of the plans it administers. The reports can be obtained at www.ersri.org.
State administered - Defined benefit plan covering teachers – a cost sharing pension plan

Financial Statement Note Disclosure Templates – Pensions Applicable for June 30, 2013 financial statements (updated November 26, 2013)
Page | 5
For communities that participate in the Teachers Survivor Benefit Program – (teachers not covered by Social Security)
Teachers Survivor Benefits - the plan provides a survivor benefit to public school teachers in lieu of Social Security as outlined in sections 16-16-25 through 16-16-38 of the Rhode Island General Laws (RIGL). Spouse, parents, family or children’s benefits are payable upon death of a member. In lieu of a survivor benefit, members may opt to receive a lump sum return of their contributions plus interest upon retirement. The benefits may be amended by the Rhode Island General Assembly. The cost of the benefits provided by the plan are two percent (2%) of the member’s annual salary up to but not exceeding an annual salary of $9,600; one-half (1/2) of the cost is contributed by the member by deductions from his or her salary, and the other half (1/2) is contributed and paid by the school district. These contributions are in addition to the contributions required for regular pension benefits. The city/town contributed $XXX, $XXX and $XXX during the fiscal years 2013, 2012 and 2011, respectively, equal to 100% of the required contributions for those respective years.
Financial Statement Note Disclosure Templates – Pensions Applicable for June 30, 2013 financial statements (updated November 26, 2013)
Page | 6
Effective July 1, 2012, the State administered retirement system was modified to include both defined benefit and defined contribution plan components. General employees participate in a hybrid plan that combines both a defined benefit plan and a defined contribution plan. Police and fire employees participate only in the defined benefit plan unless they do not participate in Social Security in which case they also participate in the defined contribution plan. Municipal Employees’ Retirement System (MERS) – Defined Benefit Plan
a. Plan Description
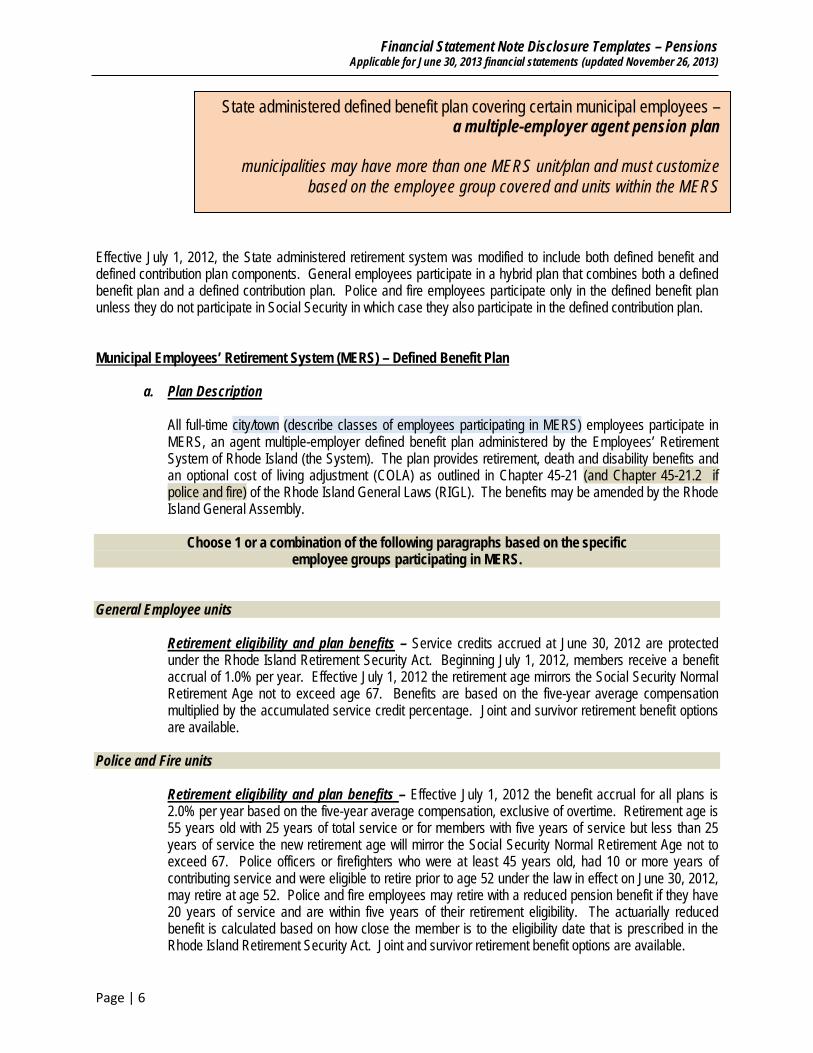
All full-time city/town (describe classes of employees participating in MERS) employees participate in MERS, an agent multiple-employer defined benefit plan administered by the Employees’ Retirement System of Rhode Island (the System). The plan provides retirement, death and disability benefits and an optional cost of living adjustment (COLA) as outlined in Chapter 45-21 (and Chapter 45-21.2 if police and fire) of the Rhode Island General Laws (RIGL). The benefits may be amended by the Rhode Island General Assembly.
Choose 1 or a combination of the following paragraphs based on the specific employee groups participating in MERS.
General Employee units Retirement eligibility and plan benefits – Service credits accrued at June 30, 2012 are protected under the Rhode Island Retirement Security Act. Beginning July 1, 2012, members receive a benefit accrual of 1.0% per year. Effective July 1, 2012 the retirement age mirrors the Social Security Normal Retirement Age not to exceed age 67. Benefits are based on the five-year average compensation multiplied by the accumulated service credit percentage. Joint and survivor retirement benefit options are available.
Police and Fire units Retirement eligibility and plan benefits – Effective July 1, 2012 the benefit accrual for all plans is 2.0% per year based on the five-year average compensation, exclusive of overtime. Retirement age is 55 years old with 25 years of total service or for members with five years of service but less than 25 years of service the new retirement age will mirror the Social Security Normal Retirement Age not to exceed 67. Police officers or firefighters who were at least 45 years old, had 10 or more years of contributing service and were eligible to retire prior to age 52 under the law in effect on June 30, 2012, may retire at age 52. Police and fire employees may retire with a reduced pension benefit if they have 20 years of service and are within five years of their retirement eligibility. The actuarially reduced benefit is calculated based on how close the member is to the eligibility date that is prescribed in the Rhode Island Retirement Security Act. Joint and survivor retirement benefit options are available.
State administered defined benefit plan covering certain municipal employees – a multiple-employer agent pension plan
municipalities may have more than one MERS unit/plan and must customize
based on the employee group covered and units within the MERS

Financial Statement Note Disclosure Templates – Pensions Applicable for June 30, 2013 financial statements (updated November 26, 2013)
Page | 7
For MERS units electing the Cost of Living Adjustment option
Cost of Living Adjustments – Pursuant to the Rhode Island Retirement Security Act, the Cost of Living Adjustment (COLA) has been suspended for any unit whose funding level is less than 80%. The COLA provision can be reviewed in a five-year interval. When the funding level of a plan exceeds 80%, eligible retirees may receive a COLA annually effective on their date of retirement plus one month. The COLA will be calculated as the five (5) year smoothed investment rate of return less 5.50%, with a 0.00% floor and a 4.00% cap. COLA will be delayed until the later of age 55 or three years after retirement. The COLA will be applied to the first $25,000 of benefits indexed annually.
For all MERS units Disability retirement provisions - The plan also provides nonservice-connected disability benefits after 5 years of service; service-connected disability pensions with no minimum service requirement.
b. Plan Funding Policy The funding policy is outlined in RIGL sections 45-21-41, 45-21-42, and 45-21-52 (which can be amended by the Rhode Island General Assembly).
General Employee units Active non police and fire members must contribute 1% if no COLA or 2% with COLA of his/her compensation. (modify for option chosen)
Police and Fire units (add this statutory reference above 45-21.2-14) Active police and fire members must contribute 7% if no COLA or 8% with COLA of his/her compensation. (modify for option chosen) The city/town is required to contribute at an actuarially determined rate expressed as a percentage of total compensation paid to the active membership. The rate for fiscal year 2013 was XX% (see enclosure for MERS unit specific rate for fiscal 2013).
c. Annual Pension Cost The city/town’s annual pension cost of $XXXXXX for MERS was equal to the city/town’s required and actual contributions.
Separate tables are required for each MERS unit
Three Year Trend Information for MERS (amounts in thousands) Fiscal Year Ending
Annual Pension Cost (APC)
Percentage of APC Contributed
Net Pension Obligation
6/30/2013 $XXXXXX XX% $XXXXXX 6/30/2012 XXXXXX XX% XXXXXX 6/30/2011 XXXXXX XX% XXXXXX

Financial Statement Note Disclosure Templates – Pensions Applicable for June 30, 2013 financial statements (updated November 26, 2013)
Page | 8
The required contribution for fiscal 2013 was determined as part of the actuarial valuation performed as of June 30, 2010. The most recent valuation of the plans within the system was performed as of June 30, 2012. The actuarial methods and assumptions used in those valuations are summarized in the following table.
Summary of Actuarial Assumptions Used in the MERS
June 30, 2010 and June 30, 2012 Valuations
Actuarial Cost Method Entry Age Normal - the Individual Entry Age Actuarial Cost methodology is used.
Amortization Method
Level Percent of Payroll – Closed
Equivalent Single Remaining Amortization Period
25 years as of June 30, 2010 23 years as of June 30, 2012
Asset Valuation Method 5 Year Smoothed Market
Actuarial Assumptions:
Investment Rate of Return 7.50% Projected Salary Increases
General Employees
4.00% to 8.00%
Police & Fire Employees 4.25% to 14.25%
Inflation
2.75%
Cost of Living Adjustments are equal to the average five-year fund asset performance (percent) greater than 5.5% up to a maximum of 4% - the COLA is to be applied to the first $25,000 of benefits, indexed over time. COLA is delayed until the later of Social Security eligibility age or 3 years after retirement. For MERS Police and Fire, COLA is delayed until the later of age 55 or 3 years after retirement. A 2% COLA is assumed after July 1, 2012.
d. Funded Status and Funding Progress The schedule of funding progress, presented as required supplementary information following the notes to the financial statements, presents multi-year trend information about whether the actuarial value of plan assets is increasing or decreasing over time relative to the actuarial accrued liability for benefits.
Separate tables are required for each MERS unit
Actuarial Valuation Date
Actuarial Value of Assets
(a)
Actuarial Accrued Liability (AAL) –
Entry Age (b)
Unfunded AAL
(UAAL) (b-a)
Funded Ratio (a/b)
Covered Payroll
(c)
UAAL as a Percentage of Covered
Payroll ((b-a)/c)
June 30, 2012 $XXXX $XXXX $XXXX X% $XXXX XX %

Financial Statement Note Disclosure Templates – Pensions Applicable for June 30, 2013 financial statements (updated November 26, 2013)
Page | 9
The System issues an annual financial report that includes financial statements and required supplementary information for all of the plans it administers. The reports can be obtained at www.ersri.org.
REQUIRED SUPPLEMENTARY INFORMATION Separate tables are required for each MERS unit
Schedule of Funding Progress for MERS
Actuarial Valuation Date
Actuarial Value of Assets
(a)
Actuarial Accrued Liability (AAL) –
Entry Age (b)
Unfunded AAL
(UAAL) (b-a)
Funded Ratio (a/b)
Covered Payroll
(c)
UAAL as a Percentage of Covered
Payroll ((b-a)/c)
June 30, 2012 $XXXX $XXXX $XXXX X% $XXXX XX % June 30, 2011 XXXX XXXX XXXX X XXXX XX June 30, 2010 XXXX XXXX XXXX X XXXX XX
Notes to the Schedule of Funding Progress
Changes affecting the June 30, 2012 actuarial valuation:
The assumptions for the Municipal Employees’ Retirement System are consistent with the 2011 valuation, with the exception of certain assumption changes that resulted from the enactment of the Rhode Island Retirement Security Act of 2011. The marriage assumption was modified to reflect the expected percentage of members that will be eligible for survivor benefits upon their death, the incidence of disability was lowered to incorporate a continued trend of significantly fewer incidents of disability than anticipated by the current assumption, and the missing data assumption was updated to incorporate an assumption for missing beneficiary data.
The method used to determine the actuarial value of assets is the five-year smoothed market method. A small adjustment was made to the method used to smooth investment gains and losses to allow gains and losses to offset each other immediately. This modification will reduce future volatility in the actuarial value of assets while ensuring that the actuarial value always trends directly towards the market value of assets.
Changes affecting the June 30, 2011 actuarial valuation:
The retirement rates were modified to be consistent with the retirement eligibility changes instituted by the Rhode Island Retirement Security Act of 2011. Members that were assumed to retire prior to the Act, but before the earliest allowable age under the Act, are assumed to retire once eligible.

Financial Statement Note Disclosure Templates – Pensions Applicable for June 30, 2013 financial statements (updated November 26, 2013)
Page | 10
Defined Contribution Plan
a. Plan Description: Employees participating in the defined benefit plan(s), as described above, also participate in a defined contribution plan of the Employees’ Retirement System as authorized by General Law Chapter 36-10.3. The defined contribution plan is established under IRS section 401(a) and is administered by TIAA-CREF and the Employees’ Retirement System of Rhode Island (the System). Employees may choose among various investment options available to plan participants. Employee contributions are immediately vested while employer contributions are vested after three years of contributory service. Contributions required under the plan by both the employee and employer are established by the General Laws, which are subject to amendment by the General Assembly. Amounts in the defined contribution plan are available to participants in accordance with Internal Revenue Service guidelines for such plans.
Choose 1 or a combination of the following paragraphs based on the specific employee groups contributing to the defined contribution plan.
Municipalities with teachers that contribute to Social Security: b. Plan Funding Policy The funding policy is outlined in RIGL chapter 36-10.3 (which can be amended by the Rhode Island General Assembly). Active plan members must contribute 5% of his/her compensation and the city/town is required to contribute 1%. The plan members and city/town contributed $XXX and $XXX, respectively, during the fiscal year ended June 30, 2013.
Municipalities with teachers that do not contribute to Social Security: b. Plan Funding Policy The funding policy is outlined in RIGL chapter 36-10.3 (which can be amended by the Rhode Island General Assembly). Active plan members must contribute 7% of his/her compensation and the city/town is required to contribute 3% {modify this sentence if city/town received approval for different rates pursuant to 36-10.3-6 (b)}. The plan members and city/town contributed $XXX and $XXX, respectively, during the fiscal year ended June 30, 2013
State and TIAA-CREF administered defined contribution benefit plan covering teachers in ERS and certain municipal employees participating in MERS –
a defined contribution pension plan
new for fiscal 2013

Financial Statement Note Disclosure Templates – Pensions Applicable for June 30, 2013 financial statements (updated November 26, 2013)
Page | 11
Municipalities with general employees (not police and fire units) in MERS that contribute to Social Security:
b. Plan Funding Policy
The funding policy is outlined in RIGL chapter 36-10.3 (which can be amended by the Rhode Island General Assembly). Active non-police and fire members must contribute 5% of his/her compensation and the city/town is required to contribute 1%. The plan members and city/town contributed $XXX and $XXX, respectively, during the fiscal year ended June 30, 2013.
Municipalities with employees ( both general employee units and police and fire units) in MERS that do not contribute to Social Security:
b. Plan Funding Policy The funding policy is outlined in RIGL chapter 36-10.3 (which can be amended by the Rhode Island General Assembly). General Employee units Active non police and fire plan members must contribute 7% of his/her compensation and the city/town is required to contribute 3% {modify this sentence if city/town received approval for different rates pursuant to 36-10.3-6 (b)}. The plan members and city/town contributed $XXX and $XXX, respectively, during the fiscal year ended June 30, 2013. Police and Fire units Police and fire employees must contribute 3% of his or her compensation/covered salary; the city/town must also contribute 3%. The plan members and city/town contributed $XXX and $XXX, respectively, during the fiscal year ended June 30, 2013.
For all employers with employees that contribute to the State administered Defined Contribution Plan:
The System issues an annual financial report that includes financial statements and required supplementary information for all of the plans it administers. The reports can be obtained at www.ersri.org.
November 14, 2011
Honorable Chairman Helio Melo
82 Smith Street
Room 306
Providence RI, 02903
Honorable Chairman Daniel DaPonte
82 Smith Street
Room 211
Providence RI, 02903
Re: Actuarial Analysis of the Rhode Island Retirement Security Act of 2011, as
described in S1111A and H6319A
Dear Chairmen:
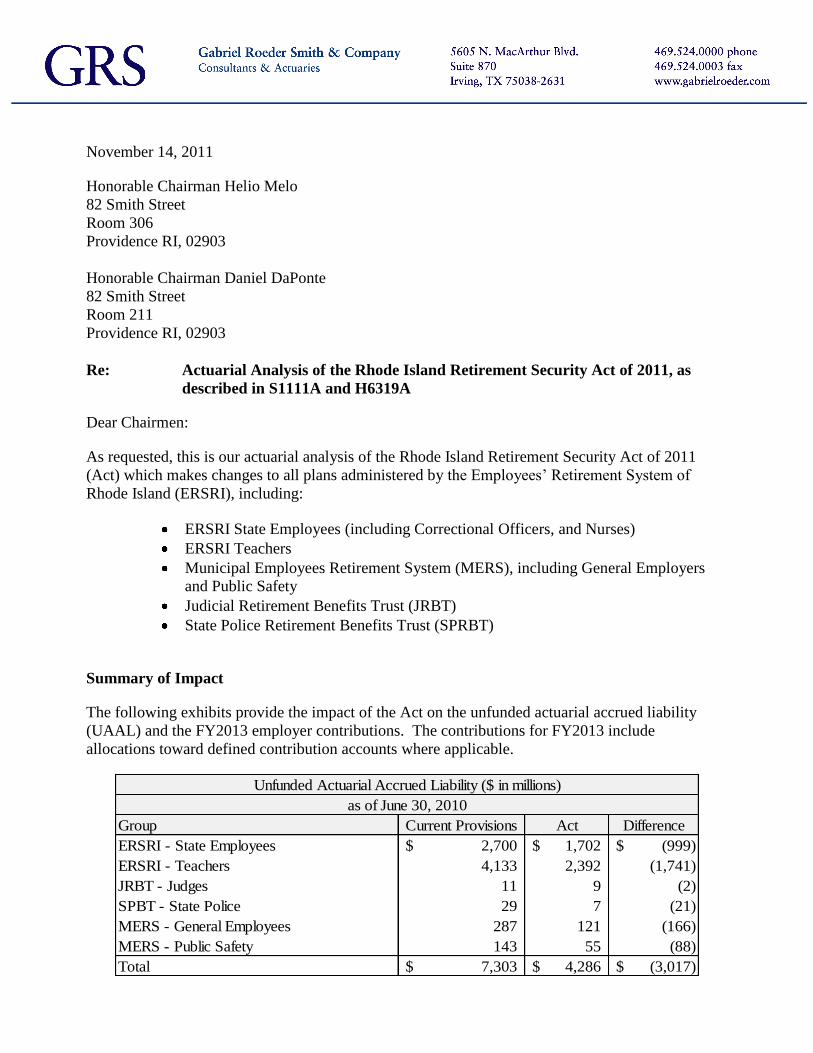
As requested, this is our actuarial analysis of the Rhode Island Retirement Security Act of 2011
(Act) which makes changes to all plans administered by the Employees’ Retirement System of
Rhode Island (ERSRI), including:
ERSRI State Employees (including Correctional Officers, and Nurses)
ERSRI Teachers
Municipal Employees Retirement System (MERS), including General Employers
and Public Safety
Judicial Retirement Benefits Trust (JRBT)
State Police Retirement Benefits Trust (SPRBT)
Summary of Impact
The following exhibits provide the impact of the Act on the unfunded actuarial accrued liability
(UAAL) and the FY2013 employer contributions. The contributions for FY2013 include
allocations toward defined contribution accounts where applicable.
Group Current Provisions Act Difference
ERSRI - State Employees 2,700$ 1,702$ (999)$
ERSRI - Teachers 4,133 2,392 (1,741)
JRBT - Judges 11 9 (2)
SPBT - State Police 29 7 (21)
MERS - General Employees 287 121 (166)
MERS - Public Safety 143 55 (88)
Total 7,303$ 4,286$ (3,017)$
Unfunded Actuarial Accrued Liability ($ in millions)
as of June 30, 2010

Honorable Chairman Helio Melo & Honorable Chairman Daniel DaPonte
November 14, 2011
Page 2
Group DB DC Savings DC Allocation
ERSRI - State Employees 243$ 142$ 7$ 95$ 1% on all payroll
ERSRI - Teachers/State Contributions 151 83 4 63 0.4% on all payroll
ERSRI - Teachers/Local Contributions 221 121 16 84 0.6% on all payroll + 2% for non SS
JRBT - Judges 2.4 1.7 - 0.7
SPBT - State Police 6 2 - 4
MERS - General Employees 41 25 2 13 1% on all payroll
MERS - Public Safety 25 10 1 14 3% for non SS
Total 689$ 384$ 30$ 274$
Current Provisions
Estimated FY2013 Employer Contributions ($ in millions)
Includes Defined Contribution Allocations Where Applicable
Act Contributions
Contribution estimates based on payrolls projected from FY2010 at the 3.75% assumed payroll growth rate
The savings shown in this analysis are the result of both the modification of the benefit provisions
and the change to a 25-year amortization period.
Proposed Changes
The Act makes broad changes to all of the plans effective July 1, 2012. The most significant
differences include:
For General State and Municipal Employees and Teachers: changing the structure of the
retirement program from a traditional defined benefit plan to a hybrid plan designed with a
smaller defined benefit plan with a supplemental defined contribution plan.
For all Public Safety except State Police: extending the retirement ages and lowering the benefit
multiplier.
Changing the automatic COLA from a CPI related formula to a formula contingent on the actual
investment performance over time.
Suspension/reduction of the COLA during times when the funded ratio is lower than targeted
80% levels. State Employees, Teachers, Judges (including pay as you go), and State Police
(including pay as you go) will be aggregated to determine if the 80% requirement has been
reached.
Re-amortization of the significantly reduced Unfunded Actuarial Accrued Liability (UAAL) to
25 years from the current 19 year schedule.
Teachers and Public Safety personnel not covered by Social Security (except State Police) will
participate in additional defined contribution allocations equal to 2% member plus 2% employer
for Teachers and 3% member plus 3% employer for public safety.
The attached Exhibit I provides a summary of the new benefit provisions for each group of
employees. In addition, the attached Exhibit II provides a summary of rules for transitioning from
the current benefit structure to the new benefit structure for current employees. Most notably:

Honorable Chairman Helio Melo & Honorable Chairman Daniel DaPonte
November 14, 2011
Page 3
The accumulated benefit multiplier as of June 30, 2012 will be preserved and any changes to
accruals will only be made prospectively.
The final average compensation as calculated on June 30, 2012 will be preserved and any
changes to the definition of salary or to the averaging period will not impact the final
average compensation used to determine the retirement benefit until after the new
calculation is greater than the preserved calculation.
The calculated accrued benefit as of June 30, 2012 using the accumulated benefit multiplier
as of that date and the final average compensation on that date can be commenced on the
date the member will reach retirement eligibility under the current provisions if the member
retires on the retirement date.
Any past post-retirement benefit adjustments that have been given will be preserved. Only
future adjustments will be modified and/or suspended.
All members currently eligible to retire will retain the ability to retire in accordance with
their current provisions.
Current State Employees, Teachers, and General MERS employees who have five years of
service as of June 30, 2012 will have a new retirement age delayed in proportion to the
amount of service they have earned as of June 30, 2012 and to their current expected
retirement age, but in no event before reaching age 59. In no circumstance will the
retirement age of the member reduce from the retirement age under current provisions.
Current Public Safety personnel who are age 45 with ten years of service as of June 30, 2012
and currently have a retirement age based on continued service prior to age 52 will have an
unreduced retirement eligibility at age 52.
A plan that has had four consecutive benefit adjustments suspended due to the 80% funding
criteria will be eligible to receive an adjustment in the fifth year regardless of the funding
level, and subsequently at five (5) year intervals until 80% funding is achieved.
Specific Examples
Benefit Accruals: The bill modifies the future accrual schedule for current employees. After June
30, 2012, each member will be entitled to receive a benefit equal to his/her Final Average
Compensation multiplied by an accrual factor. The accrual factor will be the sum of (a) the
member’s percentage accrual based on the current provisions through June 30, 2012, plus (b) 1%
for general employees and 2% for public safety for service after July 1, 2012. For example, a
Teacher with 23 years of service at June 30, 2012 has an accrual of 42% at that date. If she retires at
June 30, 2019, with 30 years of service, her benefit accrual would be 49% (42% + 7% for the next
seven years). If applicable, the member would also have a defined contribution balance based on
seven years of contributions.
Final average compensation: For many current members, especially municipal members, retirement
benefits are currently based on the highest average of the compensation over three consecutive

Honorable Chairman Helio Melo & Honorable Chairman Daniel DaPonte
November 14, 2011
Page 4
years during a member’s service. The bill changes this to a five-year average for all members.
However, if applicable, the three year average as of June 30, 2012 will be preserved and used as a
minimum for benefit determination purposes. For example, a member has a three year average
compensation of $40,000 as of June 30, 2012 and the member’s five year average on that date is
$38,000, if the member terminates or retires before the five year average surpasses $40,000, the
retirement benefit will be based on $40,000.
Retirement eligibility: Members whose retirement age is being delayed will retain the ability to
retire and commence their accrued benefit as of June 30, 2012 on their current retirement date. For
example, a current member with a $40,000 final average compensation and a 41% benefit accrual as
of June 30, 2012 will reach retirement eligibility under current rules at age 58, two years from now.
Under the proposed changes, the member could retire and commence the accrued benefit of $40,000
times 41% = $16,400 at age 58. To receive additional accruals or utilize any future salary increases
in her retirement benefit, the member would need to work to the new delayed retirement age, either
62 or social security normal retirement age depending on whether the member is grandfathered.
COLA: For all groups of employees, future post-retirement benefit adjustments will be contingent
upon the actual investment performance of the Trust. The amount of adjustment made in a given
year will be based on the actual average net return of the Trust over the prior 5 year period less
5.5%, not less than 0% or more than 4.0%. Therefore, with a 7.50% investment return assumption,
the expectation is for the benefit adjustments to average 2.0% per year. The adjustment will only
apply to the first $25,000 of benefit, indexed to increase over time.
Service Purchase: The bill requires that all future service purchases, except for those in which
military service is purchased, be made by paying the full actuarial cost of the additional service.
Full actuarial cost is defined as the mortality tables as approved by the Board and a discount rate
equal to the investment return assumption used in the actuarial valuation less 1%. This does not
apply to re-deposits of previously withdrawn contributions
Analysis (Defined Benefit Plan)
The results of our analysis are shown on the attached Exhibits S (ERSRI State Employees), T
(ERSRI Teachers), J (JRBT), SP (SPBT), and M (MERS). The revised provisions in the Act are
reflected in the UAAL, funded ratio, normal cost, and contribution rates into the defined benefit
plan for FY 2013. Readers should keep in mind that any savings shown for Teachers is shared
between the State (40%) and the municipal employers (60%).
It is important to distinguish between the impact on the UAAL and the cost savings over the short to
intermediate term which are generated from the change and suspension of the COLA and deferral of
the retirement age; from the change in the structure of the plan from a traditional defined benefit
plan to a hybrid plan which address future risk sharing between employer and employee. There is
not much difference in the expected cost for a new member in the current Schedule B structure
compared to the new combined defined benefit and defined contribution hybrid plan as long as all
assumptions are met. As such, there is not much savings generated from this change. However, if
over time assumptions are not met, the impact on the employer contribution rates will be
substantially less in the new hybrid plan.

Honorable Chairman Helio Melo & Honorable Chairman Daniel DaPonte
November 14, 2011
Page 5
We have also included an estimate of the longer term normal cost of each plan. The normal cost is
the cost of new benefit accruals. The current active population will have benefits partially based on
the current provisions and partially based on the new provisions and so their normal cost will be a
blend of the two benefit packages. As members who have more of the current provisions retire or
terminate employment and are replaced by new members only in the new plan, the normal cost of
the plan as a whole will decrease over time until ultimately only members in the new provisions are
left. The long-term normal cost provided in the exhibits provides a best estimate of this long term
cost in the defined benefit plan.
Exhibits S2 and T2 provide 30 year projections of the State and Teacher plans. These projections
reflect the approximate 20% return on the market value of assets in FY2011 and then assume all
assumptions are exactly met from FY2012 forward.
In the defined benefit exhibits, the payrolls shown for all groups reflect our estimate of future
covered payrolls based on projecting the actual FY2010 payrolls. In every case, the actual dollar
contributions should be based on actual payrolls and the contribution rates shown.
Under Rhode Island General Laws (RIGL) §36-10-2(g), if the State’s actuarially determined
contribution rate for state employees or for teachers for a fiscal year will be less than in the
preceding fiscal year, the Governor is required to include an appropriation to ERSRI in the fiscal
year budget equal to 20% of the reduction.
Budgetary Impact for each Employer
Individual employers could have employees across several benefit structures, most commonly
Teachers, General MERS, and MERS Public Safety. In addition, the defined contribution
component of the Act will impact the budget as an additional cost.
In Exhibit B, we have provided a listing of each local employer along with the impact the Act will
have on their estimated FY2013 budget. These amounts are based on the payroll used in the June
30, 2010 valuation projected forward at the 3.75% payroll growth rate.
Data and Assumptions
We prepared our analysis as though the bill would be enacted during the special legislative session
in October 2011. Because the bill would be effective by the beginning of the fiscal year beginning
July 1, 2012, we have revised the June 30, 2010 actuarial valuation to reflect the legislation. (The
June 30, 2010 actuarial valuation sets the contribution rate for that fiscal year.)
To prepare these analyses, we used member and financial data supplied by ERSRI as of June 30,
2010.
We based the analyses on the actuarial assumptions and methods previously adopted by the
Retirement Board. However, in connection with the retirement eligibility analyses, we modified the
retirement rates consistent with the proposals. Anyone we would have assumed would retire under
the current provisions before the earliest allowable age under the proposal was assumed to retire
once eligible.

Honorable Chairman Helio Melo & Honorable Chairman Daniel DaPonte
November 14, 2011
Page 6
For future benefit adjustments, we assumed 2% adjustments would be provided without suspension
for all MERS units because most of these plans will be 80% funded after the legislation passes. For
State Employees, Teachers, State Police, and Judges based on projections and the 25-year re-
amortization, we project the benefit adjustments will be suspended for approximately 19 years,
except for the intermittent adjustment every fifth year. For members not eligible to retire, we have
assumed adjustments would occur every year once they retire so that funding is currently being
made toward future adjustments.
In addition, as described in §36-10-2.1, the specific application of the entry age normal cost method
defined in the GASB 27 exposure drafts is slightly different than the current method utilized in the
prior actuarial valuations of ERSRI. To be consistent with the bill and with the new GASB
Standards, we have changed the funding method to the Individual Entry Age Cost Method.
Other General Comments
This letter is intended to describe the financial and actuarial effect of the proposed plan changes on
ERSRI. Changes in retirement eligibility, for example, could impact the cost of post-retirement
medical benefits, but we have not analyzed this effect.
The contribution rates shown herein only partially reflect the market losses that occurred during
FY2009, and readers should bear in mind that the contribution rates for FY 2014 and later will most
likely have to be increased because of these market losses. An example of these increases is
provided in Exhibits S2 and T2. Contribution rates for the other Plans will increase in a similar
manner.
Our calculations are based upon assumptions regarding future events, which may or may not
materialize. Please bear in mind that actual results could deviate significantly from our projections,
depending on actual plan experience.
We are not attorneys, and nothing in this letter should be construed as providing legal or tax advice.
No statement in this letter is intended to be interpreted as a recommendation in favor of the changes
or in opposition to them.

Honorable Chairman Helio Melo & Honorable Chairman Daniel DaPonte
November 14, 2011
Page 7
We certify that the undersigned are members of the American Academy of Actuaries and that we
meet the Qualification Standards of the American Academy of Actuaries to render the actuarial
opinion contained herein. If you have any questions, or require any additional clarifying
information, please do not hesitate to contact either one of the undersigned.
Respectfully submitted,
Joseph P. Newton, FSA, MAAA, EA Mark R. Randall, MAAA, EA
Senior Consultant Executive Vice President
J. Christian Conradi, ASA, MAAA, EA
Senior Consultant
Enclosures
cc: Mr. Frank Karpinski
Mr. Mark Dingley
J:\3014\2011/Leg/RetirementSecurity.docx
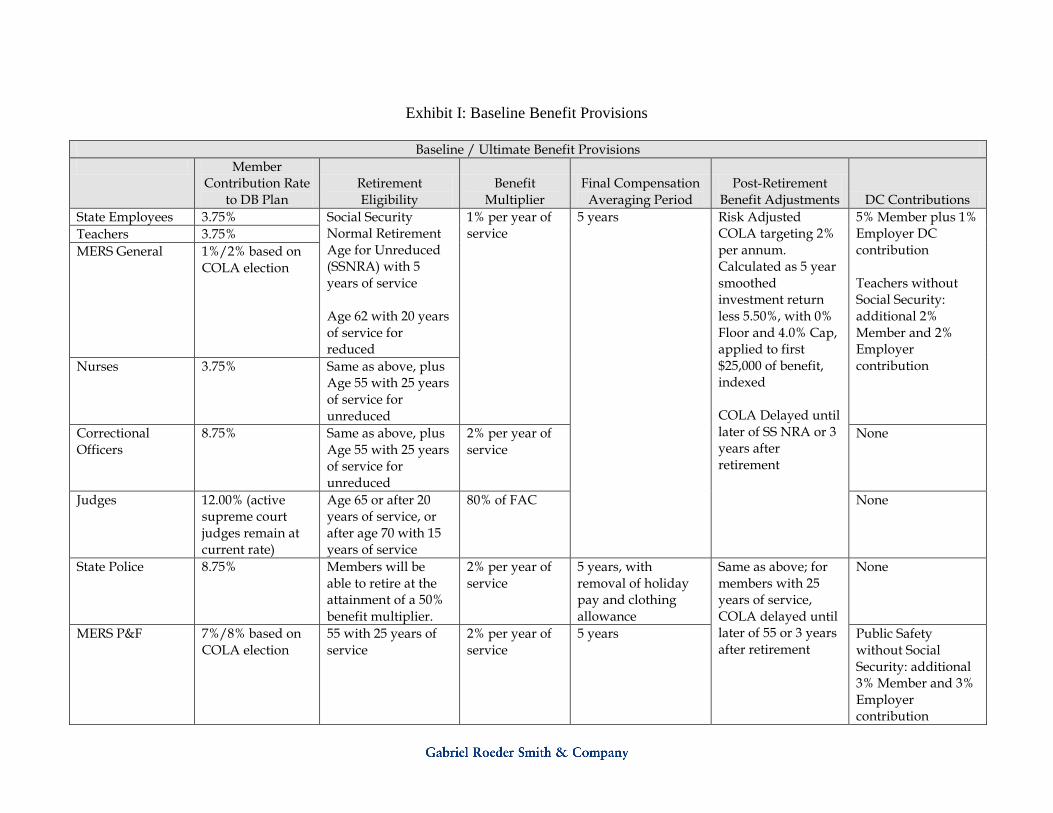
Exhibit I: Baseline Benefit Provisions
Baseline / Ultimate Benefit Provisions
Member Contribution Rate
to DB Plan Retirement Eligibility
Benefit Multiplier
Final Compensation Averaging Period
Post-Retirement Benefit Adjustments DC Contributions
State Employees 3.75% Social Security Normal Retirement Age for Unreduced (SSNRA) with 5 years of service Age 62 with 20 years of service for reduced
1% per year of service
5 years Risk Adjusted COLA targeting 2% per annum. Calculated as 5 year smoothed investment return less 5.50%, with 0% Floor and 4.0% Cap, applied to first $25,000 of benefit, indexed COLA Delayed until later of SS NRA or 3 years after retirement
5% Member plus 1% Employer DC contribution Teachers without Social Security: additional 2% Member and 2% Employer contribution
Teachers 3.75%
MERS General 1%/2% based on COLA election
Nurses 3.75% Same as above, plus Age 55 with 25 years of service for unreduced
Correctional Officers
8.75% Same as above, plus Age 55 with 25 years of service for unreduced
2% per year of service
None
Judges 12.00% (active supreme court judges remain at current rate)
Age 65 or after 20 years of service, or after age 70 with 15 years of service
80% of FAC None
State Police 8.75% Members will be able to retire at the attainment of a 50% benefit multiplier.
2% per year of service
5 years, with removal of holiday pay and clothing allowance
Same as above; for members with 25 years of service, COLA delayed until later of 55 or 3 years after retirement
None
MERS P&F 7%/8% based on COLA election
55 with 25 years of service
2% per year of service
5 years Public Safety without Social Security: additional 3% Member and 3% Employer contribution

Exhibit II: Transition Benefit Provisions
Transition Provisions
Member Contribution
Rate to DB Plan Retirement Eligibility Benefit Multiplier Final Compensation
Averaging Period Post-Retirement Benefit
Adjustments
All Groups Any member may retire with their accrued benefits of 6/30/2012 at their current retirement date determined using service and average compensation as of 6/30/2012
Old Accrual Rates times years of service as of 6/30/2012 frozen, new multiplier going forward
FAC at 6/30/2012 protected until new 5 year FAC is larger
Plan s that have not received an adjustment for four consecutive years will be eligible for an adjustment regardless of the funding level; subsequently at 5 year intervals
State Employees For employees with 5 years of service, delay in the current retirement age based on current service earned to date and distance between the current retirement age and SSNRA
Teachers
MERS General
Nurses
Correctional Officers
Members age 45 with 10 years of service as of 6/30/2012 who have a retirement date before age 52 will have a new unreduced retirement age of 52
For members with 25 years of service as of 6/30/2012, the current increased accrual rates will be preserved
Judges
State Police Members can retire once a 50% benefit accrual has been achieved
For members with 20 years of service as of 6/30/2012, the current increased accrual rates will be preserved
For members with 20 years of service as of 6/30/2012, 5-year FAC will include holiday pay
MERS P&F Members age 45 with 10 years of service as of 6/30/2012 who have a retirement date before age 52 will have a new unreduced retirement age of 52

Current Provisions
Current Amortization
Period
25 Year Re-
amortization
1.a. Unfunded actuarial accrued liability 2,700.4$ 1,701.9$ 1,701.9$
1.b. Change (998.5) (998.5)
2.a. Funded ratio 48.4% 59.8% 59.8%
2.b. Change 11.40% 11.40%
3.a. Normal cost percentage, current 11.39% 9.36% 9.36%
3.b. Change -2.03% -2.03%
4.a. Normal cost percentage, longer term 11.39% 6.18% 6.18%
4.b. Change -5.21% -5.21%
5.a. Contribution rate for FY 2013 36.34% 25.36% 21.18%
5.b. Change -10.98% -15.16%
6.a. Projected FY 2013 payroll 668.6$ 668.6$ 668.6$
6.b. Projected contribution 243.0 169.6 141.6
6.c. Change (73.4) (101.4)
$ in millions
Act
FY2013 Contribution Information
Exhibit S: State Employees
Employees' Retirement System of Rhode Island - State Employees
Based on the June 30, 2010 Actuarial Valuation
Defined Benefit Contributions Only

Current Provisions
Current Amortization
Period
25 Year Re-
amortization
1.a. Unfunded actuarial accrued liability 4,133.2$ 2,392.2$ 2,392.2$
1.b. Change (1,741.0) (1,741.0)
2.a. Funded ratio 48.4% 61.8% 61.8%
2.b. Change 13.4% 13.4%
3.a. Normal cost percentage, current 11.82% 8.96% 8.96%
3.b. Change -2.86% -2.86%
4.a. Normal cost percentage, longer term 11.82% 6.25% 6.25%
4.b. Change -5.57% -5.57%
5.a. Contribution rate for FY 2013 35.25% 22.55% 19.29%
5.b. Change -12.70% -15.96%
6.a. Projected FY 2013 payroll 1,054.8$ 1,054.8$ 1,054.8$
6.b. Projected contribution 371.8 237.8 203.5
6.c. Change (134.0) (168.3)
7.a. State share 14.27% 9.19% 7.88%
7.b. Change -5.08% -6.39%
8.a. Local share 20.98% 13.36% 11.41%
8.b. Change -7.62% -9.57%
Exhibit T: Teachers
Employees' Retirement System of Rhode Island - Teachers
Based on the June 30, 2010 Actuarial Valuation
Act
FY2013 Contribution Information

Valuation as of
June 30,
Fiscal Year
Ending June
30,
Market Return for
Fiscal Year
Employer
Contribution Rate
for Fiscal Year
Compensation for
Fiscal Year (in
Millions)
Employer
Contributions for
Fiscal Year (in
Millions)
Actuarial Accrued
Liability at
Valuation Date
(AAL, in Millions)
Actuarial Value of
Assets at
Valuation Date
(AVA, in Millions)
Unfunded
Actuarial Accrued
Liability at
Valuation Date
(UAAL, in
Millions)
Funded Ratio at
Valuation Date
Employer
Contribution Rate
Calculated in
Actuarial
Valuation
Market Value of
Assets at
Valuation Date
(MVA, in
Millions)
Funded Ratio
Using MVA at
Valuation Date
(1) (2) (3) (4) (5) (6) (7) (8) (9) (10) (11) (12) (13)
2010 2011 20.00% 20.78% 630.2$ 131.0$ 4,234.0$ 2,532.1$ 1,701.9$ 59.8% 21.18% 2,083.6$ 49.2%
2011 2012 7.50% 22.98% 648.1 148.9 4,277.3 2,447.1 1,830.2 57.2% 22.54% 2,351.4 55.0%
2012 2013 7.50% 21.18% 668.6 141.6 4,310.9 2,341.6 1,969.3 54.3% 24.11% 2,393.8 55.5%
2013 2014 7.50% 22.54% 690.1 155.5 4,340.4 2,272.7 2,067.7 52.4% 24.72% 2,395.2 55.2%
2014 2015 7.50% 24.11% 713.6 172.1 4,371.2 2,360.1 2,011.1 54.0% 23.66% 2,410.5 55.1%
2015 2016 7.50% 24.72% 738.1 182.5 4,404.3 2,444.4 1,959.9 55.5% 22.89% 2,444.4 55.5%
2016 2017 7.50% 23.66% 763.4 180.6 4,439.8 2,491.9 1,947.9 56.1% 22.74% 2,491.9 56.1%
2017 2018 7.50% 22.89% 790.0 180.8 4,476.0 2,539.2 1,936.8 56.7% 22.59% 2,539.2 56.7%
2018 2019 7.50% 22.74% 818.0 186.0 4,513.4 2,589.0 1,924.4 57.4% 22.43% 2,589.0 57.4%
2019 2020 7.50% 22.59% 847.0 191.3 4,553.7 2,648.1 1,905.6 58.2% 22.30% 2,648.1 58.2%
2020 2021 7.50% 22.43% 877.3 196.8 4,596.5 2,716.9 1,879.6 59.1% 22.15% 2,716.9 59.1%
2021 2022 7.50% 22.30% 908.1 202.5 4,640.8 2,794.8 1,846.0 60.2% 22.02% 2,794.8 60.2%
2022 2023 7.50% 22.15% 939.9 208.2 4,683.6 2,880.1 1,803.5 61.5% 21.90% 2,880.1 61.5%
2023 2024 7.50% 22.02% 973.1 214.3 4,724.4 2,972.4 1,752.0 62.9% 21.78% 2,972.4 62.9%
2024 2025 7.50% 21.90% 1,007.7 220.7 4,763.3 3,073.2 1,690.1 64.5% 21.64% 3,073.2 64.5%
2025 2026 7.50% 21.78% 1,044.2 227.4 4,799.6 3,182.9 1,616.7 66.3% 21.51% 3,182.9 66.3%
2026 2027 7.50% 21.64% 1,083.3 234.4 4,833.9 3,303.0 1,530.9 68.3% 21.36% 3,303.0 68.3%
2027 2028 7.50% 21.51% 1,124.9 242.0 4,866.0 3,434.4 1,431.6 70.6% 21.20% 3,434.4 70.6%
2028 2029 7.50% 21.36% 1,168.2 249.5 4,895.1 3,577.9 1,317.2 73.1% 21.02% 3,577.9 73.1%
2029 2030 7.50% 21.20% 1,214.5 257.5 4,922.2 3,735.4 1,186.8 75.9% 20.82% 3,735.4 75.9%
2030 2031 7.50% 21.02% 1,263.2 265.5 4,948.6 3,909.9 1,038.7 79.0% 20.61% 3,909.9 79.0%
2031 2032 7.50% 20.82% 1,315.0 273.8 4,984.7 4,112.9 871.8 82.5% 20.30% 4,112.9 82.5%
2032 2033 7.50% 20.61% 1,369.3 282.2 5,024.0 4,339.6 684.4 86.4% 19.80% 4,339.6 86.4%
2033 2034 7.50% 20.30% 1,424.9 289.3 5,067.0 4,592.1 474.9 90.6% 1.96% 4,592.1 90.6%
2034 2035 7.50% 19.80% 1,483.2 293.7 5,114.5 4,871.4 243.1 95.2% 1.97% 4,871.4 95.2%
2035 2036 7.50% 1.96% 1,544.6 30.3 5,167.5 5,177.4 (9.9) 100.2% 2.01% 5,177.4 100.2%
2036 2037 7.50% 1.97% 1,608.0 31.7 5,226.9 5,234.6 (7.7) 100.1% 2.03% 5,234.6 100.1%
2037 2038 7.50% 2.01% 1,673.3 33.6 5,292.9 5,298.9 (6.0) 100.1% 2.01% 5,298.9 100.1%
2038 2039 7.50% 2.03% 1,742.2 35.4 5,366.2 5,371.5 (5.3) 100.1% 2.01% 5,371.5 100.1%
2039 2040 7.50% 2.01% 1,815.1 36.5 5,448.5 5,453.5 (5.0) 100.1% 1.99% 5,453.5 100.1%
2040 2041 7.50% 2.01% 1,892.0 38.0 5,541.5 5,546.2 (4.7) 100.1% 2.01% 5,546.2 100.1%
2041 2042 7.50% 1.99% 1,971.3 39.2 5,646.1 5,650.9 (4.8) 100.1% 1.96% 5,650.9 100.1%
Exhibit S2: State Employees 30 Year Projection, Defined Benefit Only
Projection Results Based on the June 30, 2010 Actuarial Valuation
25 Year Amortization
Investment Return: 20.00% return for FY2011, 7.50% each year thereafter

Valuation as of
June 30,
Fiscal Year
Ending June
30,
Market Return for
Fiscal Year
Employer
Contribution Rate
for Fiscal Year
Compensation for
Fiscal Year (in
Millions)
Employer
Contributions for
Fiscal Year (in
Millions)
Actuarial Accrued
Liability at
Valuation Date
(AAL, in Millions)
Actuarial Value of
Assets at
Valuation Date
(AVA, in Millions)
Unfunded
Actuarial Accrued
Liability at
Valuation Date
(UAAL, in
Millions)
Funded Ratio at
Valuation Date
Employer
Contribution Rate
Calculated in
Actuarial
Valuation
Market Value of
Assets at
Valuation Date
(MVA, in
Millions)
Funded Ratio
Using MVA at
Valuation Date
(1) (2) (3) (4) (5) (6) (7) (8) (9) (10) (11) (12) (13)
2010 2011 20.00% 19.01% 989.2$ 188.1$ 6,265.3$ 3,873.1$ 2,392.2$ 61.8% 19.29% 3,196.5$ 51.0%
2011 2012 7.50% 22.32% 1,020.4 227.8 6,344.1 3,776.1 2,568.0 59.5% 20.53% 3,638.5 57.4%
2012 2013 7.50% 19.29% 1,054.8 203.5 6,415.5 3,670.9 2,744.6 57.2% 21.96% 3,754.6 58.5%
2013 2014 7.50% 20.53% 1,089.9 223.7 6,484.6 3,597.4 2,887.2 55.5% 22.50% 3,786.0 58.4%
2014 2015 7.50% 21.96% 1,127.4 247.6 6,559.0 3,763.4 2,795.6 57.4% 21.46% 3,841.2 58.6%
2015 2016 7.50% 22.50% 1,167.4 262.7 6,639.7 3,925.9 2,713.8 59.1% 20.70% 3,925.9 59.1%
2016 2017 7.50% 21.46% 1,208.5 259.4 6,726.9 4,033.2 2,693.7 60.0% 20.53% 4,033.2 60.0%
2017 2018 7.50% 20.70% 1,250.2 258.8 6,817.7 4,142.5 2,675.2 60.8% 20.38% 4,142.5 60.8%
2018 2019 7.50% 20.53% 1,294.2 265.7 6,912.6 4,256.7 2,655.9 61.6% 20.22% 4,256.7 61.6%
2019 2020 7.50% 20.38% 1,338.9 272.9 7,012.7 4,385.2 2,627.5 62.5% 20.08% 4,385.2 62.5%
2020 2021 7.50% 20.22% 1,385.3 280.1 7,117.9 4,528.5 2,589.4 63.6% 19.93% 4,528.5 63.6%
2021 2022 7.50% 20.08% 1,433.3 287.8 7,227.6 4,687.1 2,540.5 64.8% 19.78% 4,687.1 64.8%
2022 2023 7.50% 19.93% 1,481.6 295.3 7,338.7 4,859.1 2,479.6 66.2% 19.65% 4,859.1 66.2%
2023 2024 7.50% 19.78% 1,531.2 302.9 7,450.7 5,044.9 2,405.8 67.7% 19.53% 5,044.9 67.7%
2024 2025 7.50% 19.65% 1,582.7 311.0 7,565.2 5,246.9 2,318.3 69.4% 19.43% 5,246.9 69.4%
2025 2026 7.50% 19.53% 1,637.3 319.8 7,682.7 5,467.1 2,215.6 71.2% 19.30% 5,467.1 71.2%
2026 2027 7.50% 19.43% 1,694.3 329.2 7,803.3 5,707.2 2,096.1 73.1% 19.18% 5,707.2 73.1%
2027 2028 7.50% 19.30% 1,755.1 338.7 7,926.2 5,968.4 1,957.8 75.3% 19.04% 5,968.4 75.3%
2028 2029 7.50% 19.18% 1,817.7 348.6 8,049.8 6,250.4 1,799.4 77.6% 18.88% 6,250.4 77.6%
2029 2030 7.50% 19.04% 1,882.1 358.3 8,173.5 6,554.8 1,618.7 80.2% 18.75% 6,554.8 80.2%
2030 2031 7.50% 18.88% 1,952.1 368.6 8,301.2 6,886.3 1,414.9 83.0% 18.55% 6,886.3 83.0%
2031 2032 7.50% 18.75% 2,024.6 379.6 8,441.5 7,255.9 1,185.6 86.0% 18.28% 7,255.9 86.0%
2032 2033 7.50% 18.55% 2,097.6 389.1 8,585.2 7,657.4 927.8 89.2% 17.85% 7,657.4 89.2%
2033 2034 7.50% 18.28% 2,175.0 397.6 8,734.5 8,093.3 641.2 92.7% 2.29% 8,093.3 92.7%
2034 2035 7.50% 17.85% 2,249.8 401.6 8,884.5 8,560.4 324.1 96.4% 2.23% 8,560.4 96.4%
2035 2036 7.50% 2.29% 2,326.5 53.3 9,034.0 9,055.0 (21.0) 100.2% 2.17% 9,055.0 100.2%
2036 2037 7.50% 2.23% 2,408.8 53.7 9,185.8 9,216.2 (30.4) 100.3% 2.12% 9,216.2 100.3%
2037 2038 7.50% 2.17% 2,495.3 54.1 9,341.1 9,381.5 (40.4) 100.4% 2.07% 9,381.5 100.4%
2038 2039 7.50% 2.12% 2,585.4 54.8 9,499.5 9,550.4 (50.9) 100.5% 2.03% 9,550.4 100.5%
2039 2040 7.50% 2.07% 2,681.1 55.5 9,662.0 9,724.1 (62.1) 100.6% 2.00% 9,724.1 100.6%
2040 2041 7.50% 2.03% 2,781.3 56.5 9,829.4 9,903.2 (73.8) 100.8% 5.72% 9,903.2 100.8%
2041 2042 7.50% 2.00% 2,888.3 57.8 10,003.5 10,089.5 (86.0) 100.9% 5.69% 10,089.5 100.9%
Exhibit T2: Teachers 30 Year Projection, Defined Benefit Only
Projection Results Based on the June 30, 2010 Actuarial Valuation
25 Year Amortization
Investment Return: 20.00% return for FY2011, 7.50% each year thereafter

Current Provisions
Current Amortization
Period
25 Year Re-
amortization
1.a. Unfunded actuarial accrued liability 10.9$ 8.6$ 8.6$
1.b. Change (2.3) (2.3)
2.a. Funded ratio 77.8% 81.6% 81.6%
2.b. Change 3.8% 3.8%
3.a. Normal cost percentage, current 25.29% 24.79% 24.79%
3.b. Change -0.50% -0.50%
4.a. Normal cost percentage, longer term 25.29% 24.79% 24.79%
4.b. Change -0.50% -0.50%
5.a. Contribution rate for FY 2013 28.17% 21.33% 19.69%
5.b. Change -6.84% -8.48%
6.a. Projected FY 2013 payroll 8.4$ 8.4$ 8.4$
6.b. Projected contribution 2.4 1.8 1.7
6.c. Change (0.6) (0.7)
$ in millions
Exhibit J: Judges
Judicial Retirement Benefits Trust
Based on the June 30, 2010 Actuarial Valuation
Act
FY2013 Contribution Information

Current Provisions
Current Amortization
Period
25 Year Re-
amortization
1.a. Unfunded actuarial accrued liability 28.5$ 7.3$ 7.3$
1.b. Change (21.3) (21.3)
2.a. Funded ratio 69.7% 90.0% 90.0%
2.b. Change 20.3% 20.3%
3.a. Normal cost percentage, current 29.86% 19.87% 19.87%
3.b. Change -9.99% -9.99%
4.a. Normal cost percentage, longer term 29.86% 19.25% 19.25%
4.b. Change -10.61% -10.61%
5.a. Contribution rate for FY 2013 36.12% 11.85% 11.07%
5.b. Change -24.27% -25.05%
6.a. Projected FY 2013 payroll 16.6$ 16.6$ 16.6$
6.b. Projected contribution 6.0 2.0 1.8
6.c. Change (4.0) (4.2)
$ in millions
Exhibit P: State Police
State Police Benefit Trust
Based on the June 30, 2010 Actuarial Valuation
Act
FY2013 Contribution Information

Unit Act
Current
Provisions Difference Act Current Provisions Difference Act
Current
Provisions Difference
(1) (2) (3) (4) (5) (6) (7) (8) (9) (10)
FY2013 Contribution Rate Funded Ratio as of June 30, 2010UAAL as of June 30, 2010
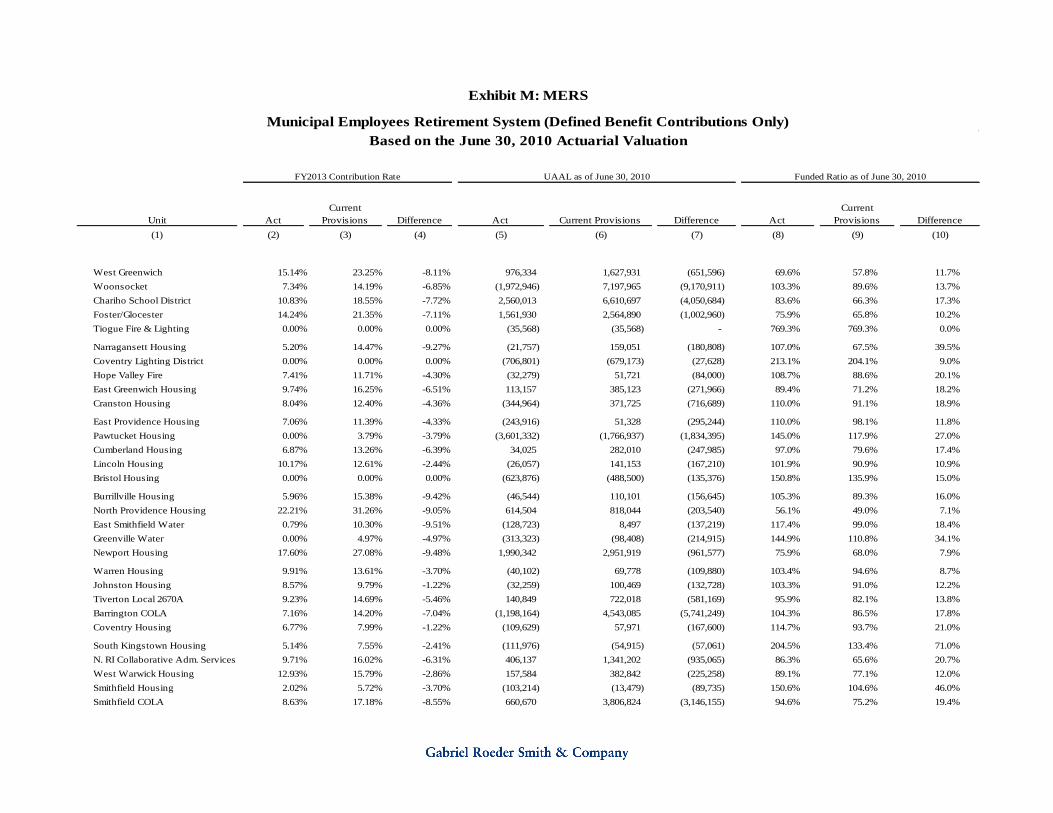
Exhibit M: MERS
Municipal Employees Retirement System (Defined Benefit Contributions Only)
Based on the June 30, 2010 Actuarial Valuation
Bristol 14.44% 23.66% -9.22% 5,297,792 8,925,942 (3,628,151) 73.8% 62.5% 11.2%
Burrillville 7.33% 13.22% -5.89% (1,060,757) 2,639,838 (3,700,595) 104.8% 89.8% 14.9%
Central Falls 11.78% 14.38% -2.60% 1,730,875 2,531,043 (800,168) 74.9% 67.2% 7.8%
Charlestown 10.49% 18.37% -7.88% 913,278 2,380,032 (1,466,754) 83.4% 65.8% 17.6%
Cranston 9.24% 15.56% -6.32% 1,269,617 20,021,819 (18,752,202) 99.0% 86.2% 12.8%
Cumberland 13.07% 15.17% -2.10% 6,233,202 9,362,056 (3,128,854) 75.6% 67.4% 8.2%
East Greenwich 5.74% 12.50% -6.76% (1,217,949) (102,923) (1,115,026) 120.2% 101.4% 18.8%
East Providence 18.92% 29.66% -10.74% 34,496,104 49,885,763 (15,389,659) 63.9% 55.1% 8.9%
West Greenwich 12.58% 20.51% -7.93% 1,661,277 3,342,249 (1,680,972) 81.0% 67.9% 13.1%
Foster 10.84% 12.74% -1.90% 535,207 973,590 (438,383) 84.5% 75.0% 9.5%
Glocester 9.56% 16.26% -6.70% 867,008 2,465,824 (1,598,816) 88.2% 72.4% 15.8%
Hopkinton 6.01% 10.82% -4.81% (639,574) 158,242 (797,816) 118.2% 96.3% 21.9%
Jamestown 11.46% 18.57% -7.11% 2,126,493 4,505,917 (2,379,424) 81.1% 67.0% 14.1%
Johnston 12.96% 21.18% -8.22% 6,679,413 12,605,851 (5,926,438) 81.8% 70.5% 11.4%
Lincoln 10.04% 12.99% -2.95% 313,811 655,861 (342,050) 80.2% 65.9% 14.3%
Middletown 11.11% 19.89% -8.78% 3,318,170 7,602,445 (4,284,275) 79.8% 63.4% 16.5%
Newport 17.84% 27.54% -9.70% 20,218,990 29,828,659 (9,609,669) 69.1% 60.3% 8.8%
New Shoreham 8.38% 14.02% -5.64% 220,117 1,472,348 (1,252,231) 95.6% 76.3% 19.2%
North Kingstown 14.64% 23.06% -8.42% 12,143,349 21,076,292 (8,932,943) 76.9% 65.8% 11.2%
North Providence 6.47% 7.55% -1.08% (2,614,149) 310,055 (2,924,204) 111.1% 98.8% 12.2%
North Smithfield 6.12% 11.00% -4.88% (1,165,907) 404,219 (1,570,127) 110.0% 97.0% 13.0%
Pawtucket 13.24% 22.25% -9.01% 18,823,516 36,590,078 (17,766,562) 82.6% 71.0% 11.6%
Union Fire District 8.56% 9.41% -0.85% 17,855 104,984 (87,129) 95.7% 79.2% 16.5%
Richmond 11.36% 11.52% -0.16% 289,186 484,217 (195,031) 84.1% 75.9% 8.1%
Scituate 13.73% 20.75% -7.02% 2,464,762 4,324,208 (1,859,446) 79.1% 68.4% 10.8%
Smithfield 8.60% 14.59% -5.99% (324,140) 1,646,433 (1,970,573) 103.0% 87.2% 15.7%
South Kingstown 10.41% 17.83% -7.42% 3,881,654 13,417,232 (9,535,578) 91.8% 76.4% 15.4%
Tiverton 4.27% 8.47% -4.20% (2,007,501) (348,427) (1,659,074) 121.9% 103.2% 18.7%
Warren 13.78% 22.98% -9.20% 2,240,086 3,589,346 (1,349,260) 66.1% 54.9% 11.2%
Westerly 69.82% 82.25% -12.43% 661,255 675,127 (13,872) 33.9% 33.5% 0.5%
Unit Act
Current
Provisions Difference Act Current Provisions Difference Act
Current
Provisions Difference
(1) (2) (3) (4) (5) (6) (7) (8) (9) (10)
FY2013 Contribution Rate Funded Ratio as of June 30, 2010UAAL as of June 30, 2010
Exhibit M: MERS
Municipal Employees Retirement System (Defined Benefit Contributions Only)
Based on the June 30, 2010 Actuarial Valuation
West Greenwich 15.14% 23.25% -8.11% 976,334 1,627,931 (651,596) 69.6% 57.8% 11.7%
Woonsocket 7.34% 14.19% -6.85% (1,972,946) 7,197,965 (9,170,911) 103.3% 89.6% 13.7%
Chariho School District 10.83% 18.55% -7.72% 2,560,013 6,610,697 (4,050,684) 83.6% 66.3% 17.3%
Foster/Glocester 14.24% 21.35% -7.11% 1,561,930 2,564,890 (1,002,960) 75.9% 65.8% 10.2%
Tiogue Fire & Lighting 0.00% 0.00% 0.00% (35,568) (35,568) - 769.3% 769.3% 0.0%
Narragansett Housing 5.20% 14.47% -9.27% (21,757) 159,051 (180,808) 107.0% 67.5% 39.5%
Coventry Lighting District 0.00% 0.00% 0.00% (706,801) (679,173) (27,628) 213.1% 204.1% 9.0%
Hope Valley Fire 7.41% 11.71% -4.30% (32,279) 51,721 (84,000) 108.7% 88.6% 20.1%
East Greenwich Housing 9.74% 16.25% -6.51% 113,157 385,123 (271,966) 89.4% 71.2% 18.2%
Cranston Housing 8.04% 12.40% -4.36% (344,964) 371,725 (716,689) 110.0% 91.1% 18.9%
East Providence Housing 7.06% 11.39% -4.33% (243,916) 51,328 (295,244) 110.0% 98.1% 11.8%
Pawtucket Housing 0.00% 3.79% -3.79% (3,601,332) (1,766,937) (1,834,395) 145.0% 117.9% 27.0%
Cumberland Housing 6.87% 13.26% -6.39% 34,025 282,010 (247,985) 97.0% 79.6% 17.4%
Lincoln Housing 10.17% 12.61% -2.44% (26,057) 141,153 (167,210) 101.9% 90.9% 10.9%
Bristol Housing 0.00% 0.00% 0.00% (623,876) (488,500) (135,376) 150.8% 135.9% 15.0%
Burrillville Housing 5.96% 15.38% -9.42% (46,544) 110,101 (156,645) 105.3% 89.3% 16.0%
North Providence Housing 22.21% 31.26% -9.05% 614,504 818,044 (203,540) 56.1% 49.0% 7.1%
East Smithfield Water 0.79% 10.30% -9.51% (128,723) 8,497 (137,219) 117.4% 99.0% 18.4%
Greenville Water 0.00% 4.97% -4.97% (313,323) (98,408) (214,915) 144.9% 110.8% 34.1%
Newport Housing 17.60% 27.08% -9.48% 1,990,342 2,951,919 (961,577) 75.9% 68.0% 7.9%
Warren Housing 9.91% 13.61% -3.70% (40,102) 69,778 (109,880) 103.4% 94.6% 8.7%
Johnston Housing 8.57% 9.79% -1.22% (32,259) 100,469 (132,728) 103.3% 91.0% 12.2%
Tiverton Local 2670A 9.23% 14.69% -5.46% 140,849 722,018 (581,169) 95.9% 82.1% 13.8%
Barrington COLA 7.16% 14.20% -7.04% (1,198,164) 4,543,085 (5,741,249) 104.3% 86.5% 17.8%
Coventry Housing 6.77% 7.99% -1.22% (109,629) 57,971 (167,600) 114.7% 93.7% 21.0%
South Kingstown Housing 5.14% 7.55% -2.41% (111,976) (54,915) (57,061) 204.5% 133.4% 71.0%
N. RI Collaborative Adm. Services 9.71% 16.02% -6.31% 406,137 1,341,202 (935,065) 86.3% 65.6% 20.7%
West Warwick Housing 12.93% 15.79% -2.86% 157,584 382,842 (225,258) 89.1% 77.1% 12.0%
Smithfield Housing 2.02% 5.72% -3.70% (103,214) (13,479) (89,735) 150.6% 104.6% 46.0%
Smithfield COLA 8.63% 17.18% -8.55% 660,670 3,806,824 (3,146,155) 94.6% 75.2% 19.4%

Unit Act
Current
Provisions Difference Act Current Provisions Difference Act
Current
Provisions Difference
(1) (2) (3) (4) (5) (6) (7) (8) (9) (10)
FY2013 Contribution Rate Funded Ratio as of June 30, 2010UAAL as of June 30, 2010
Exhibit M: MERS
Municipal Employees Retirement System (Defined Benefit Contributions Only)
Based on the June 30, 2010 Actuarial Valuation
Central Falls Housing 8.20% 14.95% -6.75% 322,478 771,748 (449,269) 83.8% 68.4% 15.4%
Lime Rock Administrative Services 10.29% 11.71% -1.42% 24,496 72,957 (48,461) 89.6% 74.3% 15.3%
Central Falls Schools 8.89% 15.16% -6.27% 951,485 3,993,447 (3,041,962) 92.6% 75.0% 17.6%
Bristol/Warren Schools 13.41% 19.77% -6.36% 3,568,672 6,217,882 (2,649,210) 80.2% 70.0% 10.3%
Town of E. Greenwich-COLA-NCE 5.74% 12.50% -6.76% (1,102,182) 2,541,670 (3,643,852) 106.8% 87.2% 19.6%
Harrisville Fire District (ADMIN) 7.24% 17.56% -10.32% (4,155) 238,336 (242,491) 101.1% 61.9% 39.2%
Albion Fire District (ADMIN) 0.00% 0.00% 0.00% 11,831 11,831 - 83.8% 83.8% 0.0%
General Employee Units Average 11.28% 18.35% -7.07% 120,667,781 286,595,556 (165,927,775) 87.6% 74.8% 12.8%
Johnston Fire 7.35% 14.20% -6.85% 142,003 713,186 (571,183) 94.6% 77.8% 16.8%
Richmond Police 8.20% 15.27% -7.07% 165,008 320,784 (155,776) 82.4% 70.7% 11.7%
Smithfield Police 5.49% 23.16% -17.67% (510,896) 2,445,115 (2,956,010) 106.8% 76.7% 30.1%
Valley Falls Fire 11.78% 18.93% -7.15% 465,462 654,443 (188,981) 86.5% 82.0% 4.5%
North Smithfield Voluntary Fire 14.64% 30.90% -16.26% 1,032,259 1,950,902 (918,643) 83.1% 72.3% 10.9%
East Greenwich Fire 19.00% 39.94% -20.94% 4,178,836 6,490,564 (2,311,727) 70.9% 61.0% 9.8%
East Greenwich Police 17.44% 40.35% -22.91% 2,737,735 5,599,829 (2,862,095) 82.0% 69.0% 13.0%
North Kingstown Fire 19.43% 40.33% -20.90% 6,338,499 11,133,548 (4,795,050) 80.5% 70.2% 10.3%
North Kingstown Police 18.78% 41.16% -22.38% 5,238,897 8,924,862 (3,685,965) 76.2% 65.3% 10.9%
North Providence Fire 17.02% 24.33% -7.31% 6,673,096 8,265,415 (1,592,319) 80.5% 77.0% 3.6%
Barrington Fire (25) 9.87% 19.49% -9.62% 324,220 644,350 (320,131) 77.1% 62.8% 14.2%
Barrington Police 24.45% 50.56% -26.11% 3,839,311 5,688,968 (1,849,658) 64.4% 55.0% 9.4%
Barrington Fire (20) 25.76% 50.36% -24.60% 987,375 1,965,419 (978,045) 89.2% 80.6% 8.6%
Warren Police & Fire 23.11% 46.17% -23.06% 3,489,524 5,385,530 (1,896,006) 68.9% 59.0% 10.0%
South Kingstown Police 14.79% 36.07% -21.28% 2,864,185 6,491,955 (3,627,770) 87.8% 76.0% 11.8%
Scituate Police 0.00% 0.00% 0.00% (146,092) (146,092) - 690.8% 690.8% 0.0%
North Smithfield Police 11.56% 30.12% -18.56% 546,889 1,917,057 (1,370,168) 93.5% 80.4% 13.1%
Tiverton Fire 7.25% 24.56% -17.31% (234,698) 1,433,159 (1,667,858) 102.8% 85.7% 17.1%
Foster Police 16.62% 36.72% -20.10% 614,129 1,040,929 (426,799) 77.8% 67.3% 10.4%
Woonsocket Police 16.76% 38.88% -22.12% 7,285,283 14,074,388 (6,789,105) 80.3% 67.9% 12.5%

Unit Act
Current
Provisions Difference Act Current Provisions Difference Act
Current
Provisions Difference
(1) (2) (3) (4) (5) (6) (7) (8) (9) (10)
FY2013 Contribution Rate Funded Ratio as of June 30, 2010UAAL as of June 30, 2010
Exhibit M: MERS
Municipal Employees Retirement System (Defined Benefit Contributions Only)
Based on the June 30, 2010 Actuarial Valuation
Charlestown Police 19.25% 41.46% -22.21% 2,349,340 4,004,864 (1,655,524) 71.6% 59.7% 11.9%
Hopkinton Police 14.17% 43.94% -29.77% 935,711 2,452,631 (1,516,920) 81.7% 63.0% 18.7%
Glocester Police 13.46% 33.61% -20.15% 930,409 1,982,172 (1,051,762) 82.9% 69.5% 13.4%
West Greenwich Police/Rescue 14.13% 31.95% -17.82% 696,023 1,352,997 (656,974) 79.4% 66.5% 12.9%
Burrillville Police 12.03% 28.52% -16.49% 189,230 1,659,797 (1,470,567) 97.6% 82.2% 15.4%
Cumberland Rescue 5.59% 20.76% -15.17% (522,127) 307,543 (829,670) 114.6% 93.0% 21.6%
Woonsocket Fire 8.26% 25.54% -17.28% (1,164,092) 7,024,220 (8,188,311) 104.2% 80.5% 23.6%
Bristol Fire 7.18% 6.57% 0.61% (42,762) (39,447) (3,315) 120.6% 118.7% 1.9%
Cumberland Hill Fire 16.19% 39.33% -23.14% 972,625 1,847,771 (875,146) 79.2% 66.8% 12.5%
Bristol Police 1.61% 15.93% -14.32% (1,323,846) (238,686) (1,085,160) 165.5% 107.7% 57.8%
Coventry Fire 17.15% 26.41% -9.26% 1,134,694 1,370,704 (236,010) 68.5% 64.3% 4.2%
South Kingstown EMT 2.74% 16.18% -13.44% (766,870) (209,365) (557,505) 145.4% 109.3% 36.1%
North Cumberland 16.19% 33.03% -16.84% 819,252 1,581,735 (762,483) 79.3% 66.5% 12.8%
Central Coventry Fire 16.34% 33.44% -17.10% 2,576,413 4,601,383 (2,024,971) 71.1% 58.0% 13.2%
Hopkins Hill Fire 10.72% 23.36% -12.64% 175,786 498,205 (322,419) 86.8% 69.9% 16.9%
Cranston Police 7.74% 34.60% -26.86% (509,028) 9,931,999 (10,441,027) 102.8% 65.4% 37.4%
Cranston Fire 10.11% 36.63% -26.52% 361,574 15,794,534 (15,432,960) 98.8% 66.2% 32.7%
Cumberland Fire 17.63% 35.48% -17.85% 1,054,338 1,696,074 (641,736) 73.3% 63.0% 10.3%
Lincoln Rescue 16.50% 27.64% -11.14% 1,110,446 1,501,948 (391,502) 66.3% 59.2% 7.0%
New Shoreham Police 17.90% 35.79% -17.89% 479,928 646,724 (166,795) 64.4% 57.3% 7.1%
Middletown Police & Fire 4.03% 17.00% -12.97% (637,166) 33,320 (670,486) 153.6% 98.2% 55.4%
Harrisville Fire District 9.42% 24.42% -15.00% 18,062 249,909 (231,847) 97.5% 73.7% 23.8%
Albion Fire District 18.56% 27.02% -8.46% 573,975 343,945 230,030 42.3% 55.0% -12.7%
Police & Fire Units Average 12.81% 31.91% -19.10% 55,442,939 143,389,286 (87,946,348) 86.2% 70.7% 15.5%
All MERS Units Average 11.67% 21.75% -10.08% 176,110,720 429,984,842 (253,874,123) 87.2% 73.6% 13.6%

Exhibit B: Combined Estimated Budgetary Impact on Local Employers
$ in 000s
Payroll Rate Contribution Payroll
Baseline
Rate
Baseline
Contribution Act DB Rate Act DC Rate Act DB Contribution
Act DC
Contribution
Total Act
Contribution Savings Savings
Municipal FY 12 FY 12 FY 12 FY 13 FY 13 FY 13 FY 13 FY 13 FY 13 FY 13 FY 13 Act v. Baseline Act v. FY 12
Barrington 7,967$ 5.06% 403$ 8,266$ 14.20% 1,174$ 7.16% 1.00% 592$ 83$ 675$ 499$ (271)$
Bris tol 4,750$ 14.42% 685$ 4,928$ 23.66% 1,166$ 14.44% 1.00% 712$ 49$ 761$ 405$ (76)$
Burri l lvi l le 6,049$ 4.98% 301$ 6,276$ 13.22% 830$ 7.33% 1.00% 460$ 63$ 523$ 307$ (222)$
Centra l Fa l l s 2,579$ 9.03% 233$ 2,676$ 14.38% 385$ 11.78% 1.00% 315$ 27$ 342$ 43$ (109)$
Charlestown 1,940$ 12.48% 242$ 2,013$ 18.37% 370$ 10.49% 1.00% 211$ 20$ 231$ 138$ 11$
Cranston 27,194$ 5.90% 1,604$ 28,214$ 15.56% 4,390$ 9.24% 1.00% 2,607$ 282$ 2,889$ 1,501$ (1,285)$
Cumberland 8,990$ 9.68% 870$ 9,327$ 15.17% 1,415$ 13.07% 1.00% 1,219$ 93$ 1,312$ 103$ (442)$
East Greenwich 6,636$ 3.71% 246$ 6,885$ 12.50% 861$ 5.74% 1.00% 395$ 69$ 464$ 396$ (218)$
East Providence 19,475$ 18.08% 3,521$ 20,205$ 29.66% 5,993$ 18.92% 1.00% 3,823$ 202$ 4,025$ 1,968$ (504)$
Foster 1,375$ 8.07% 111$ 1,427$ 12.74% 182$ 10.84% 1.00% 155$ 14$ 169$ 13$ (58)$
Glocester 2,662$ 10.33% 275$ 2,762$ 16.26% 449$ 9.56% 1.00% 264$ 28$ 292$ 157$ (17)$
Hopkinton 1,616$ 4.80% 78$ 1,677$ 10.82% 181$ 6.01% 1.00% 101$ 17$ 118$ 64$ (40)$
Jamestown 3,694$ 11.43% 422$ 3,833$ 18.57% 712$ 11.46% 1.00% 439$ 38$ 478$ 234$ (55)$
Johnston 8,675$ 12.83% 1,113$ 9,000$ 21.18% 1,906$ 12.96% 1.00% 1,166$ 90$ 1,256$ 650$ (143)$
Lincoln 920$ 6.43% 59$ 955$ 12.99% 124$ 10.04% 1.00% 96$ 10$ 105$ 19$ (46)$
Middletown 5,448$ 11.22% 611$ 5,652$ 19.89% 1,124$ 11.11% 1.00% 628$ 57$ 684$ 440$ (73)$
Newport 12,806$ 17.08% 2,187$ 13,286$ 27.54% 3,659$ 17.84% 1.00% 2,370$ 133$ 2,503$ 1,156$ (316)$
New Shoreham 2,230$ 8.39% 187$ 2,314$ 14.02% 324$ 8.38% 1.00% 194$ 23$ 217$ 107$ (30)$
North Kingstown 12,220$ 13.44% 1,642$ 12,678$ 23.06% 2,924$ 14.64% 1.00% 1,856$ 127$ 1,983$ 941$ (341)$
North Providence 7,890$ 0.97% 77$ 8,186$ 7.55% 618$ 6.47% 1.00% 530$ 82$ 611$ 7$ (535)$
North Smithfield 3,421$ 1.77% 61$ 3,549$ 11.00% 390$ 6.12% 1.00% 217$ 35$ 253$ 138$ (192)$
Pawtucket 22,407$ 11.81% 2,646$ 23,247$ 22.25% 5,172$ 13.24% 1.00% 3,078$ 232$ 3,310$ 1,862$ (664)$
Richmond 877$ 7.74% 68$ 910$ 11.52% 105$ 11.36% 1.00% 103$ 9$ 112$ (8)$ (45)$
Sci tuate 3,018$ 13.65% 412$ 3,131$ 20.75% 650$ 13.73% 1.00% 430$ 31$ 461$ 188$ (49)$
Smithfield* 3,360$ 6.42% 216$ 3,486$ 14.59% 509$ 8.60% 1.00% 300$ 35$ 335$ 174$ (119)$
South Kingstown 12,824$ 8.59% 1,102$ 13,305$ 17.83% 2,372$ 10.41% 1.00% 1,385$ 133$ 1,518$ 854$ (417)$
Tiverton* 3,195$ 2.67% 85$ 3,315$ 8.47% 281$ 4.27% 1.00% 142$ 33$ 175$ 106$ (89)$
Warren 1,921$ 14.78% 284$ 1,993$ 22.98% 458$ 13.78% 1.00% 275$ 20$ 295$ 163$ (11)$
Westerly 69$ 60.04% 42$ 72$ 82.25% 59$ 69.82% 1.00% 50$ 1$ 51$ 8$ (9)$
West Greenwich 925$ 14.46% 134$ 960$ 23.25% 223$ 15.14% 1.00% 145$ 10$ 155$ 68$ (21)$
Woonsocket 13,073$ 3.44% 450$ 13,563$ 14.19% 1,925$ 7.34% 1.00% 996$ 136$ 1,131$ 793$ (681)$
Total Municipal 210,208$ 20,367$ 218,091$ 40,930$ 25,253$ 2,181$ 27,434$ 13,496$ (7,067)$
MERS MUNICIPAL EMPLOYERS
Estimated Increases in Employer Retirement Contributions
FY'12 v. FY'13

Exhibit B: Combined Estimated Budgetary Impact on Local Employers
$ in 000s
Payroll Rate Contribution Payroll
Baseline
Rate
Baseline
Contribution Act DB Rate Act DC Rate Act DB Contribution
Act DC
Contribution
Total Act
Contribution Savings Savings
Municipal FY 12 FY 12 FY 12 FY 13 FY 13 FY 13 FY 13 FY 13 FY 13 FY 13 FY 13 Act v. Baseline Act v. FY 12
Johnston F 2,722$ 9.19% 250$ 2,824$ 14.20% 401$ 7.35% 0.00% 208$ -$ 208$ 193$ 43$
Richmond P 643$ 10.22% 66$ 667$ 15.27% 102$ 8.20% 0.00% 55$ -$ 55$ 47$ 11$
Smithfield P 2,742$ 20.38% 559$ 2,845$ 23.16% 659$ 5.49% 0.00% 156$ -$ 156$ 503$ 403$
East Greenwich Pol ice 2,107$ 16.57% 349$ 2,186$ 40.35% 882$ 17.44% 0.00% 381$ -$ 381$ 501$ (32)$
East Greenwich Fi re 2,396$ 19.74% 473$ 2,486$ 39.94% 993$ 19.00% 0.00% 472$ -$ 472$ 521$ 1$
North Kingstown F 4,079$ 17.66% 720$ 4,232$ 40.33% 1,707$ 19.43% 0.00% 822$ -$ 822$ 884$ (102)$
North Kingstown P 3,095$ 21.94% 679$ 3,211$ 41.16% 1,322$ 18.78% 0.00% 603$ -$ 603$ 719$ 76$
North Providence F 5,698$ 11.86% 676$ 5,912$ 24.33% 1,438$ 17.02% 0.00% 1,006$ -$ 1,006$ 432$ (330)$
Barrington Fi re (25) 898$ 13.68% 123$ 932$ 19.49% 182$ 9.87% 0.00% 92$ -$ 92$ 90$ 31$
Barrington P 1,381$ 30.41% 420$ 1,433$ 50.56% 725$ 24.45% 0.00% 350$ -$ 350$ 374$ 70$
Barrington Fi re (20) 528$ 11.60% 61$ 548$ 50.36% 276$ 25.76% 0.00% 141$ -$ 141$ 135$ (80)$
Warren 1,514$ 25.83% 391$ 1,571$ 46.17% 725$ 23.11% 0.00% 363$ -$ 363$ 362$ 28$
South Kingstown EMT 814$ 4.67% 38$ 845$ 16.18% 137$ 2.74% 0.00% 23$ -$ 23$ 114$ 15$
South Kingstown Pol ice 2,994$ 16.03% 480$ 3,106$ 36.07% 1,120$ 14.79% 0.00% 459$ -$ 459$ 661$ 21$
North Smithfield P 1,251$ 17.08% 214$ 1,298$ 30.12% 391$ 11.56% 0.00% 150$ -$ 150$ 241$ 64$
Tiverton F 1,809$ 9.14% 165$ 1,877$ 24.56% 461$ 7.25% 0.00% 136$ -$ 136$ 325$ 29$
Foster P 426$ 21.49% 92$ 442$ 36.72% 162$ 16.62% 0.00% 73$ -$ 73$ 89$ 18$
Woonsocket P 5,412$ 19.22% 1,040$ 5,615$ 38.88% 2,183$ 16.76% 3.00% 941$ 168$ 1,110$ 1,074$ (69)$
Charlestown P 1,324$ 25.64% 340$ 1,374$ 41.46% 570$ 19.25% 0.00% 264$ -$ 264$ 305$ 75$
Hopkinton P 870$ 24.01% 209$ 903$ 43.94% 397$ 14.17% 0.00% 128$ -$ 128$ 269$ 81$
Glocester P 988$ 17.01% 168$ 1,025$ 33.61% 345$ 13.46% 0.00% 138$ -$ 138$ 207$ 30$
West Greenwich PR 773$ 20.09% 155$ 802$ 31.95% 256$ 14.13% 0.00% 113$ -$ 113$ 143$ 42$
Burri l lvi l le P 1,373$ 10.79% 148$ 1,425$ 28.52% 406$ 12.03% 0.00% 171$ -$ 171$ 235$ (23)$
Cumberland R 1,023$ 7.66% 78$ 1,061$ 20.76% 220$ 5.59% 0.00% 59$ -$ 59$ 161$ 19$
Woonsocket F 7,219$ 12.05% 870$ 7,490$ 25.54% 1,913$ 8.26% 3.00% 619$ 225$ 843$ 1,070$ 27$
Bris tol F 50$ 0.00% -$ 52$ 6.57% 3$ 7.18% 0.00% 4$ -$ 4$ (0)$ (4)$
Bris tol P 1,792$ 10.45% 187$ 1,859$ 15.93% 296$ 1.61% 3.00% 30$ 56$ 86$ 210$ 102$
Cranston P 7,152$ 21.43% 1,533$ 7,420$ 34.60% 2,567$ 7.74% 3.00% 574$ 223$ 797$ 1,770$ 736$
Cranston F 9,321$ 21.33% 1,988$ 9,671$ 36.63% 3,542$ 10.11% 3.00% 978$ 290$ 1,268$ 2,275$ 720$
New Shoreham P 278$ 24.74% 69$ 288$ 35.79% 103$ 17.90% 0.00% 52$ -$ 52$ 52$ 17$
Middletown P & F 1,829$ 12.44% 228$ 1,898$ 17.00% 323$ 4.03% 1.50% 76$ 28$ 105$ 218$ 123$
Total - Police and Fire 74,504$ 12,769$ 77,298$ 24,807$ 9,640$ 990$ 10,630$ 14,177$ 2,138$
Total - MERS 284,712$ 33,136$ 295,389$ 65,737$ 34,894$ 3,171$ 38,065$ 27,673$ (4,929)$
MERS POLICE AND FIRE EMPLOYERS
Estimated Increases in Employer Retirement Contributions
FY'12 v. FY'13

Exhibit B: Combined Estimated Budgetary Impact on Local Employers
$ in 000s
Payroll Rate Contribution Payroll
Baseline
Rate
Baseline
Contribution Act DB Rate Act DC Rate Act DB Contribution
Act DC
Contribution
Total Act
Contribution Savings Savings
Municipal FY 12 FY 12 FY 12 FY 13 FY 13 FY 13 FY 13 FY 13 FY 13 FY 13 FY 13 Act v. Baseline Act v. FY 12
BARRINGTON 24,508$ 13.23% 3,242$ 25,427$ 20.98% 5,335$ 11.48% 2.60% 2,919$ 661$ 3,580$ 1,754$ (338)$
BRISTOL-WARREN 26,203$ 13.23% 3,467$ 27,186$ 20.98% 5,704$ 11.48% 2.60% 3,121$ 707$ 3,828$ 1,876$ (361)$
BURRILLVILLE 16,456$ 12.55% 2,065$ 17,073$ 20.29% 3,464$ 10.79% 2.60% 1,842$ 444$ 2,286$ 1,178$ (221)$
CENTRAL FALLS 27,317$ 13.23% 3,614$ 28,342$ 20.98% 5,946$ 11.48% 0.60% 3,254$ 170$ 3,424$ 2,522$ 190$
CHARIHO 27,331$ 13.23% 3,616$ 28,356$ 20.98% 5,949$ 11.48% 0.60% 3,255$ 170$ 3,425$ 2,524$ 190$
COVENTRY 44,107$ 13.23% 5,835$ 45,761$ 20.98% 9,601$ 11.48% 2.60% 5,253$ 1,190$ 6,443$ 3,158$ (608)$
CRANSTON 76,960$ 13.23% 10,182$ 79,846$ 20.98% 16,752$ 11.48% 2.60% 9,166$ 2,076$ 11,242$ 5,509$ (1,061)$
CUMBERLAND 27,722$ 13.23% 3,668$ 28,762$ 20.98% 6,034$ 11.48% 2.60% 3,302$ 748$ 4,050$ 1,985$ (382)$
EAST GREENWICH 15,696$ 12.55% 1,970$ 16,285$ 20.29% 3,304$ 10.79% 2.60% 1,757$ 423$ 2,181$ 1,124$ (211)$
EAST PROVIDENCE 35,289$ 13.23% 4,669$ 36,612$ 20.98% 7,681$ 11.48% 2.60% 4,203$ 952$ 5,155$ 2,526$ (486)$
EXETER-WEST GREEN 15,195$ 13.23% 2,010$ 15,765$ 20.98% 3,307$ 11.48% 0.60% 1,810$ 95$ 1,904$ 1,403$ 106$
FOSTER-GLOCESTER 9,218$ 13.23% 1,219$ 9,563$ 20.98% 2,006$ 11.48% 2.60% 1,098$ 249$ 1,347$ 660$ (127)$
FOSTER 2,346$ 13.23% 310$ 2,434$ 20.98% 511$ 11.48% 2.60% 279$ 63$ 343$ 168$ (32)$
GLOCESTER 4,050$ 13.23% 536$ 4,202$ 20.98% 882$ 11.48% 2.60% 482$ 109$ 592$ 290$ (56)$
JAMESTOWN 4,593$ 13.23% 608$ 4,766$ 20.98% 1,000$ 11.48% 0.60% 547$ 29$ 576$ 424$ 32$
JOHNSTON 23,111$ 13.23% 3,058$ 23,977$ 20.98% 5,030$ 11.48% 2.60% 2,753$ 623$ 3,376$ 1,654$ (318)$
LINCOLN 26,982$ 13.23% 3,570$ 27,994$ 20.98% 5,873$ 11.48% 2.60% 3,214$ 728$ 3,942$ 1,932$ (372)$
LITTLE COMPTON 2,556$ 12.55% 321$ 2,652$ 20.29% 538$ 10.79% 2.60% 286$ 69$ 355$ 183$ (34)$
MIDDLETOWN 19,747$ 13.23% 2,613$ 20,488$ 20.98% 4,298$ 11.48% 2.60% 2,352$ 533$ 2,885$ 1,414$ (272)$
NARRAGANSETT 13,248$ 13.23% 1,753$ 13,745$ 20.98% 2,884$ 11.48% 2.60% 1,578$ 357$ 1,935$ 948$ (183)$
NEWPORT 17,153$ 13.23% 2,269$ 17,796$ 20.98% 3,734$ 11.48% 2.60% 2,043$ 463$ 2,506$ 1,228$ (236)$
NEW SHOREHAM 2,131$ 12.55% 267$ 2,211$ 20.29% 449$ 10.79% 0.60% 239$ 13$ 252$ 197$ 16$
NORTH KINGSTOWN 30,100$ 13.23% 3,982$ 31,229$ 20.98% 6,552$ 11.48% 0.60% 3,585$ 187$ 3,772$ 2,779$ 210$
NORTH PROVIDENCE 26,779$ 13.23% 3,543$ 27,783$ 20.98% 5,829$ 11.48% 0.60% 3,189$ 167$ 3,356$ 2,473$ 187$
NORTH SMITHFIELD 12,298$ 12.55% 1,543$ 12,760$ 20.29% 2,589$ 10.79% 0.60% 1,377$ 77$ 1,453$ 1,136$ 90$
PAWTUCKET 53,539$ 13.23% 7,083$ 55,547$ 20.98% 11,654$ 11.48% 0.60% 6,377$ 333$ 6,710$ 4,944$ 373$
PORTSMOUTH 18,487$ 13.23% 2,446$ 19,180$ 20.98% 4,024$ 11.48% 2.60% 2,202$ 499$ 2,701$ 1,323$ (255)$
PROVIDENCE 145,082$ 13.23% 19,194$ 150,522$ 20.98% 31,580$ 11.48% 0.60% 17,280$ 903$ 18,183$ 13,396$ 1,011$
SCITUATE 11,460$ 13.23% 1,516$ 11,890$ 20.98% 2,494$ 11.48% 2.60% 1,365$ 309$ 1,674$ 820$ (158)$
SMITHFIELD 18,300$ 13.23% 2,421$ 18,986$ 20.98% 3,983$ 11.48% 2.60% 2,180$ 494$ 2,673$ 1,310$ (252)$
SOUTH KINGSTOWN 33,166$ 13.23% 4,388$ 34,410$ 20.98% 7,219$ 11.48% 0.60% 3,950$ 206$ 4,157$ 3,062$ 231$
TIVERTON 14,044$ 13.23% 1,858$ 14,571$ 20.98% 3,057$ 11.48% 2.60% 1,673$ 379$ 2,052$ 1,005$ (194)$
WARWICK 96,268$ 13.23% 12,736$ 99,878$ 20.98% 20,954$ 11.48% 0.60% 11,466$ 599$ 12,065$ 8,889$ 671$
WESTERLY 26,640$ 13.23% 3,524$ 27,639$ 20.98% 5,799$ 11.48% 2.60% 3,173$ 719$ 3,892$ 1,907$ (367)$
WEST WARWICK 25,402$ 13.23% 3,361$ 26,355$ 20.98% 5,529$ 11.48% 0.60% 3,026$ 158$ 3,184$ 2,346$ 177$
WOONSOCKET 34,567$ 13.23% 4,573$ 35,864$ 20.98% 7,524$ 11.48% 0.60% 4,117$ 215$ 4,332$ 3,192$ 241$
OTHER 8,644$ 13.23% 1,144$ 8,968$ 20.98% 1,882$ 11.48% 0.60% 1,030$ 54$ 1,083$ 798$ 60$
Total Teachers 1,016,697$ 134,175$ 1,054,823$ 220,950$ 120,742$ 16,170$ 136,912$ 84,038$ (2,737)$
TEACHERS RETIREMENT SYSTEM
Estimated Increases in Employer Retirement Contributions
FY'12 v. FY'13

Exhibit B: Combined Estimated Budgetary Impact on Local Employers
$ in 000s
Payroll Rate Contribution Payroll
Baseline
Rate
Baseline
Contribution Act DB Rate Act DC Rate Act DB Contribution
Act DC
Contribution
Total Act
Contribution Savings Savings
Municipal FY 12 FY 12 FY 12 FY 13 FY 13 FY 13 FY 13 FY 13 FY 13 FY 13 FY 13 Act v. Baseline Act v. FY 12
BARRINGTON 4,250$ 7,690$ 4,094$ 744$ 4,838$ 2,852$ (588)$
BRISTOL* 872$ 1,466$ 745$ 105$ 850$ 615$ 22$
BURRILLVILLE 2,515$ 4,700$ 2,474$ 507$ 2,980$ 1,720$ (466)$
CENTRAL FALLS** 233$ 385$ 315$ 27$ 342$ 43$ (109)$
CHARLESTOWN* 582$ 939$ 476$ 20$ 496$ 444$ 86$
COVENTRY 5,835$ 9,601$ 5,253$ 1,190$ 6,443$ 3,158$ (608)$
CRANSTON 15,307$ 27,252$ 13,325$ 2,871$ 16,196$ 11,055$ (889)$
CUMBERLAND 4,616$ 7,669$ 4,580$ 841$ 5,421$ 2,248$ (805)$
EAST GREENWICH 3,038$ 6,040$ 3,006$ 492$ 3,498$ 2,541$ (460)$
EAST PROVIDENCE 8,190$ 13,674$ 8,026$ 1,154$ 9,180$ 4,494$ (990)$
FOSTER* 513$ 855$ 508$ 78$ 585$ 270$ (72)$
GLOCESTER* 979$ 1,675$ 884$ 137$ 1,021$ 654$ (42)$
HOPKINTON* 287$ 578$ 229$ 17$ 246$ 333$ 41$
JAMESTOWN 1,030$ 1,712$ 986$ 67$ 1,053$ 658$ (23)$
JOHNSTON 4,421$ 7,338$ 4,127$ 713$ 4,840$ 2,498$ (419)$
LINCOLN 3,629$ 5,997$ 3,310$ 737$ 4,047$ 1,950$ (418)$
LITTLE COMPTON 321$ 538$ 286$ 69$ 355$ 183$ (34)$
MIDDLETOWN 3,451$ 5,745$ 3,056$ 618$ 3,674$ 2,071$ (223)$
NARRAGANSETT 1,753$ 2,884$ 1,578$ 357$ 1,935$ 948$ (183)$
NEWPORT 4,457$ 7,393$ 4,413$ 596$ 5,009$ 2,384$ (552)$
NEW SHOREHAM 523$ 876$ 484$ 36$ 520$ 356$ 3$
NORTH KINGSTOWN 7,024$ 12,504$ 6,866$ 314$ 7,181$ 5,323$ (157)$
NORTH PROVIDENCE 4,295$ 7,885$ 4,725$ 249$ 4,974$ 2,911$ (679)$
NORTH SMITHFIELD 1,818$ 3,370$ 1,744$ 112$ 1,856$ 1,514$ (38)$
PAWTUCKET 9,729$ 16,826$ 9,455$ 566$ 10,020$ 6,806$ (291)$
PORTSMOUTH 2,446$ 4,024$ 2,202$ 499$ 2,701$ 1,323$ (255)$
PROVIDENCE 19,194$ 31,580$ 17,280$ 903$ 18,183$ 13,396$ 1,011$
RICHMOND* 134$ 207$ 158$ 9$ 167$ 40$ (34)$
SCITUATE 1,928$ 3,144$ 1,795$ 340$ 2,135$ 1,009$ (207)$
SMITHFIELD 3,196$ 5,151$ 2,636$ 529$ 3,164$ 1,987$ 32$
SOUTH KINGSTOWN 6,007$ 10,848$ 5,818$ 340$ 6,157$ 4,691$ (150)$
TIVERTON 2,109$ 3,799$ 1,950$ 412$ 2,362$ 1,436$ (254)$
WARREN* 675$ 1,183$ 638$ 20$ 658$ 526$ 17$
WARWICK 12,736$ 20,954$ 11,466$ 599$ 12,065$ 8,889$ 671$
WESTERLY 3,566$ 5,858$ 3,223$ 719$ 3,943$ 1,915$ (376)$
WEST GREENWICH* 289$ 479$ 259$ 10$ 268$ 211$ 21$
WEST WARWICK 3,361$ 5,529$ 3,026$ 158$ 3,184$ 2,346$ 177$
WOONSOCKET 6,933$ 13,545$ 6,672$ 744$ 7,416$ 6,128$ (483)$
Total - All 152,241$ 261,893$ 142,069$ 17,897$ 159,966$ 101,927$ (7,725)$
* Excludes regional school dis trict increase. ** Excludes CF Schools
MERS EMPLOYER and TEACHER CONTRIBUTION TOTALS *
Estimated Increases in Employer Retirement Contributions
FY'12 v. FY'13