Embed Size (px)
Citation preview

I would like to thank Louis Morel and Stephen Murchison for their help in preparing this speech.
Not for publication before November 23, 2021 13:00 Eastern Time
Remarks by Paul Beaudry Deputy Governor OSC Dialogue Ontario Securities Commission
November 23, 2021 Toronto, Ontario (via webcast)
Financial stability through the pandemic and beyond
Introduction
Thank you for inviting me to connect virtually with you today.
The Bank of Canada has had a great working relationship with the Ontario Securities Commission (OSC) for many years.1 We appreciate your contributions to ensuring a safe, stable financial system that is always there for Canadians.
My remarks today are part of the Bank’s commitment to update Canadians twice a year about key vulnerabilities and risks to the financial system, through our Financial System Review (FSR) each spring and a speech every autumn.2
Financial vulnerabilities don’t have to lead to serious problems. Some work themselves out before anything bad happens. But the lesson from history is
that—if left unchecked—they can sometimes lead or contribute to harmful outcomes. That can be because they amplify negative shocks, making bad situations worse, or because they become sources of instability on their own.
As you are well aware, the Canadian financial system went into the COVID-19 crisis in a solid position and has proved to be resilient throughout. This resilience reflects Canada’s strong regulatory and supervisory framework . It also highlights
1 For instance, we both participate in the Heads of Regulatory Agencies, an important federal-
provincial forum for cooperation on financial sector issues. Chaired by the Governor of the Bank, it brings together the Department of Finance Canada and the Office of the Superintendent of Financial Institutions (OSFI) as well as Quebec’s Autorité des marchés financiers, the OSC, the British Columbia Securities Commission and the Alberta Securities Commission.
2 Bank staff also conduct research throughout the year to keep Governing Council informed of issues that may be relevant to our federal or provincial partners and to Canadians. All of this material is on our Financial System Hub.

- 2 -
that Canada’s major banks were well capitalized when the pandemic struck and remain so. Unprecedented policy support from governments and the Bank played a crucial role as well.
As a result, the economy came through the crisis quite well. Household insolvencies are at multi-year lows. Most businesses aren’t showing signs of major financial stress, with corporate bankruptcies below their historical average.
That being said, much of the government policy support that helped bring about these outcomes is being phased out. So the longer-term impact of the pandemic
continues to develop. And the main financial vulnerabilities that Canada faced before the pandemic—namely imbalances in the housing market and high household indebtedness—remain significant. Also, climate change and the transition to a low-carbon economy bring new financial risks that will be
increasingly important going forward. The scale of the challenge facing British Columbia right now is a brutal reminder that extreme weather events are already becoming more common. Assessing climate-related risks requires new tools, and the Bank is working hard to develop them in collaboration with others.
Because the Canadian banking system has been made more resilient over the years, risk to its overall stability currently appears to be limited. It would take
quite an extreme event to put our banking system in serious distress.3 But, as I’ll explain, the risks that we see could spur significant financial stress or losses for many households and businesses. As such, they could challenge the economic recovery from the pandemic or create problems for the economy down the road.
So there is reason to remain vigilant even as there is reason to be optimistic.
Housing market imbalances and high indebtedness
As I said a minute ago, housing market imbalances and high levels of household debt are hardly new vulnerabilities. But, in some respects, they have intensified because of the unusual circumstances created by the pandemic.
In our May FSR, we highlighted the unusually high demand for single-family homes, particularly in suburbs and outlying areas of major Canadian cities. This was due to three main pandemic-related factors.
First, with many Canadians working or caring for children at home, people wanted more living space.
Second, many households boosted their savings—allowing them to afford larger down payments. That’s because there was so little to spend on during lockdowns
and because most people who could work remotely kept their jobs.
Third, low borrowing costs supported demand and gave some people an
incentive to buy a home earlier than planned.
The surge in demand for housing wasn’t met with a similar increase in supply,
though. And that pushed prices up sharply in several markets.
3 To be clear, financial system vulnerabilities pose the risk that individual financial institutions could incur capital losses and tighten lending conditions in response. However, they do not pose a signif icant threat to the solvency of the banking system.
- 3 -
A particularly worrisome development is that price expectations in some areas may have become extrapolative. This happens when people think house prices will be even higher in the future, and it can lead them to rush into the market to buy. I’ll come back to this point.
As for indebtedness, conflicting forces are at play. By May 2021, many households had paid down some consumer debt. But others had taken on new
mortgage debt—including a rising number with high loan-to-income ratios.
The housing and debt dynamics induced by the pandemic continue to evolve,
and they are interacting with each other. So some important financial concerns exist that could affect the economic recovery. Let me elaborate.
Vulnerabilities linked to housing market imbalances
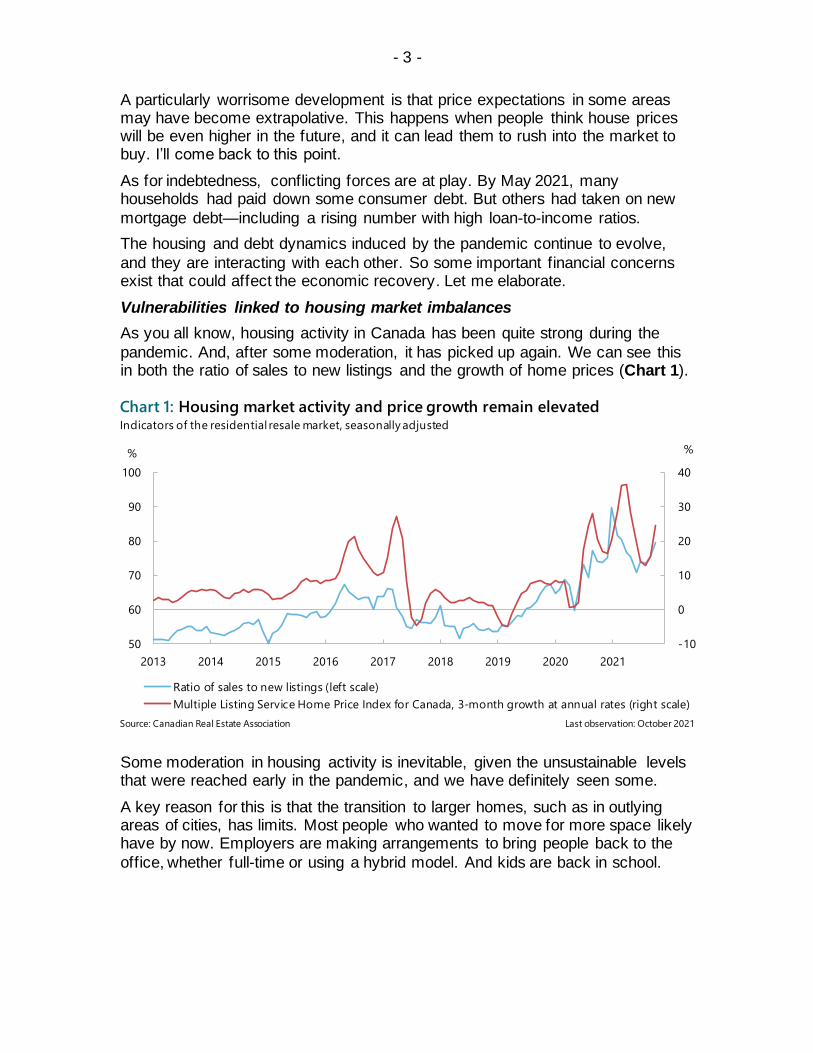
As you all know, housing activity in Canada has been quite strong during the
pandemic. And, after some moderation, it has picked up again. We can see this in both the ratio of sales to new listings and the growth of home prices (Chart 1).
Some moderation in housing activity is inevitable, given the unsustainable levels that were reached early in the pandemic, and we have definitely seen some.
A key reason for this is that the transition to larger homes, such as in outlying areas of cities, has limits. Most people who wanted to move for more space likely have by now. Employers are making arrangements to bring people back to the
office, whether full-time or using a hybrid model. And kids are back in school.
-10
0
10
20
30
40
50
60
70
80
90
100
2013 2014 2015 2016 2017 2018 2019 2020 2021
%%
Ratio of sales to new listings (left scale)
Multiple Listing Service Home Price Index for Canada, 3-month growth at annual rates (right scale)
Chart 1: Housing market activity and price growth remain elevatedIndicators of the residential resale market, seasonally adjusted
Last observation: October 2021Source: Canadian Real Estate Association
- 4 -
Also, the latest tightening of mortgage qualification requirements in mid-2021 may have encouraged some buyers to wait until they have a larger down payment and others to buy a less expensive house.4
Still, the moderation was from historically high levels and, as I noted, it has partially reversed.5
Keep in mind that higher demand against a much smaller increase in supply is a key factor boosting housing prices. Generally, it’s difficult for housing supply to catch up quickly to a sudden increase in demand. That partly reflects things such
as land use planning and building regulations as well as the simple reality that building a new home takes time. It also reflects the availability of lumber, other building materials and labour—all of which have been scarce at different times during the pandemic.
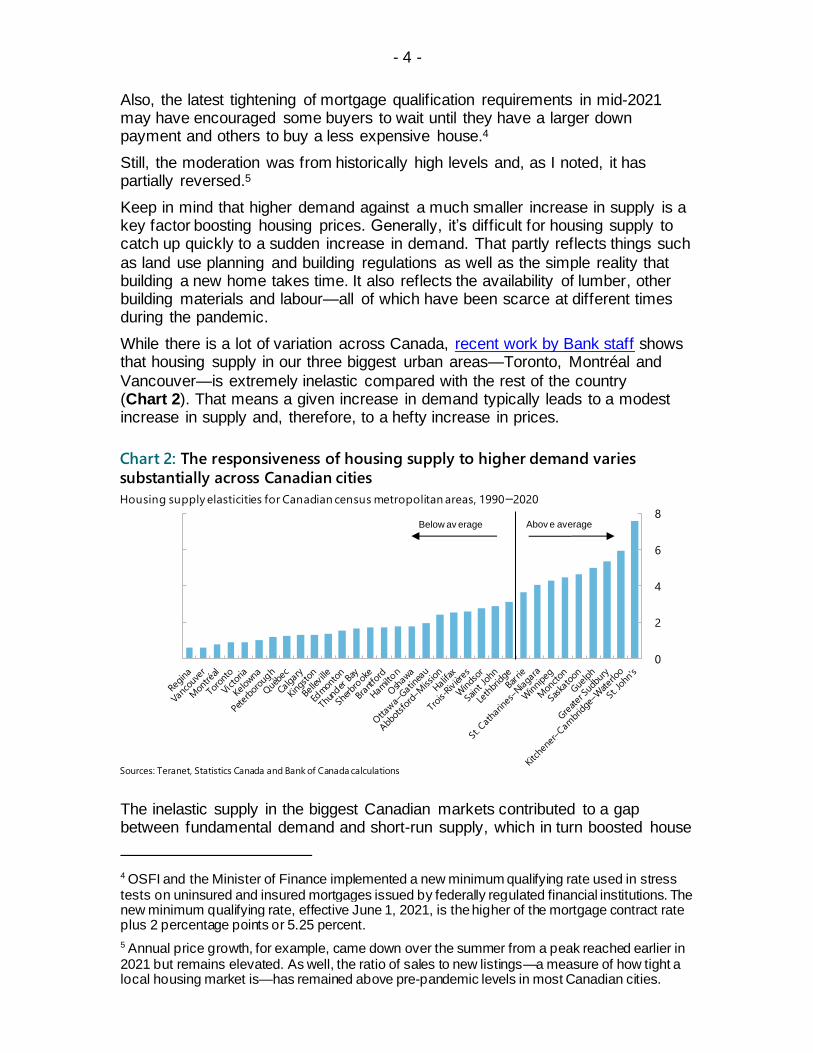
While there is a lot of variation across Canada, recent work by Bank staff shows that housing supply in our three biggest urban areas—Toronto, Montréal and
Vancouver—is extremely inelastic compared with the rest of the country (Chart 2). That means a given increase in demand typically leads to a modest increase in supply and, therefore, to a hefty increase in prices.
The inelastic supply in the biggest Canadian markets contributed to a gap between fundamental demand and short-run supply, which in turn boosted house
4 OSFI and the Minister of Finance implemented a new minimum qualifying rate used in stress tests on uninsured and insured mortgages issued by federally regulated financial institutions. The new minimum qualifying rate, effective June 1, 2021, is the higher of the mortgage contract rate plus 2 percentage points or 5.25 percent.
5 Annual price growth, for example, came down over the summer from a peak reached earlier in 2021 but remains elevated. As well, the ratio of sales to new listings—a measure of how tight a local housing market is—has remained above pre-pandemic levels in most Canadian cities.
0
2
4
6
8
Chart 2: The responsiveness of housing supply to higher demand varies
substantially across Canadian cities
Housing supply elasticities for Canadian census metropolitan areas, 1990–2020
Sources: Teranet, Statistics Canada and Bank of Canada calculations
Abov e average Below av erage

- 5 -
prices. It may also have indirectly contributed to price expectations becoming extrapolative in some markets, as we noted in May. Such dynamics can occur when people fear missing out or expect to make a future capital gain from reselling, or both. Either way, extrapolative expectations risk creating a
disconnect between actual home prices and their more fundamental levels.
The good news is that the somewhat slower house price growth that we saw over
the summer should lower the chances of undesirable extrapolative price dynamics. But some markets still show signs of such expectations (Chart 3).
At the same time, our analysis finds that many Canadians are buying homes as investment properties—that is, in addition to their principal residence—and the
importance of this phenomenon has grown (Chart 4).6 Expectations of a capital gain can make homes a very attractive asset for investors.
6 To protect the privacy of Canadians, TransUnion did not provide any personal information to the Bank. The TransUnion dataset was anonymized, meaning it does not include information that identifies individual Canadians, such as names, social insurance numbers or addresses.
Chart 3: Some housing markets continue to show signs of exuberance
Note: HPEI is the House Price Exuberance Indicator.
Source: Bank of Canada calculations Last observation: 2021Q3

- 6 -
A sudden influx of investors in the housing market likely contributed to the rapid price increases we saw earlier this year. In such a case, expectations of future price increases can become self-fulfilling, at least for a while. That can expose the market to a higher chance of a correction.7 And, if one occurs, the damage can spread far beyond the investors. That’s because, for many households, their
wealth and access to low-cost credit are tied to the value of their home.
We will continue to monitor this dynamic, and we are doing a lot of work to
assess how the presence of investors is affecting housing-related vulnerabilities.8
Let me sum up our current assessment of the housing market. House prices
have increased significantly over the pandemic. The moderation that we saw until recently pointed in the right direction, but housing remains very expensive. And the risk of a correction in some markets is a concern that we need to watch.
Let’s also not forget that the spike in demand for housing came while immigration was essentially on hold. As immigration resumes, the demand-supply gap could widen and last longer, which could put further upward pressure on house prices.
7 A. Haughwout, D. Lee, J. Tracy and W. van der Klaauw, “Real Estate Investors, the Leverage Cycle, and the Housing Market Crisis,” Federal Reserve Bank of New York Staff Report no. 514 (September 2011).
8 A forthcoming staff analytical note will aim to provide further details about the types of investors buying homes during the pandemic, including where they purchased homes and under what circumstances. Questions that represent important avenues for ongoing and future research work by the Bank include whether investors are more sensitive to price changes than other homebuyers, and what impact the increase in investor-buyers might have on the home resale and rental markets.
-40
-20
0
20
40
60
80
100
2015 2016 2017 2018 2019 2020 2021
%
First-time homebuyers Repeat homebuyers Investors
Chart 4: Home purchases by investors increased more during the pandemic
than those by other homebuyersYear-over-year growth in the number of new mortgages, by type of homebuyer (percent)
Last observation: 2021Q2Sources: TransUnion, regulatory filings of Canadian banks and Bank of Canada calculations

- 7 -
None of that is to say a calamity is on the horizon. The financial system as a whole is in good health and is generally quite resilient.9 Nevertheless, a drop in housing prices could significantly affect household spending, with repercussions for employment—even if it didn’t put the financial system at risk.
Vulnerabilities linked to high indebtedness
Turning to high indebtedness, a key concern here is that financially stretched households have little breathing room to absorb any disruption to their income. A job loss could force many to drastically cut their spending to keep servicing
their debt. A drop in housing prices could also reduce household consumption because many people use their home as collateral to secure a home equity line of credit or refinance their mortgage. And an increase in unemployment or drop in house prices would have worse effects on the economy today because both
debt levels and the share of wealth concentrated in housing have risen over time.
In addition, the fact that many households have used a long period of historically
low interest rates to accumulate a lot of debt means that the economy is likely also more sensitive now to any increase in borrowing costs.
To assess these vulnerabilities, it’s helpful to first look at what’s happened with indebtedness during the pandemic and then at some longer-term forces.
Pandemic-related trends
Since the May FSR, Statistics Canada has released new microdata that help us
better understand households’ financial position heading into the pandemic.10
These data show that from 2016 to 2019, household balance sheets evolved in a
largely constructive way. Net wealth improved for households in four out of five income quintiles and age groups. And the upward trend that we saw for two decades in the share of households considered highly indebted—that is, with a debt load that exceeds three and a half times their income—came to a halt.11
Still, in 2019, close to one in six households with any debt were in that category.
So, when the pandemic struck, high household indebtedness was still a concern.
And then, importantly, the pandemic affected the financial situation of households to varying degrees and in highly different ways.
As we discussed in May, many Canadians were able to accumulate more savings during the pandemic. On top of having limited opportunities to spend during lockdowns, some households exercised greater financial prudence, and
9 See Chart 2 in the Bank’s autumn 2021 Financial System Survey highlights, which shows that 97 percent of respondents to the survey are at least fairly confident that the Canadian financial system could withstand a large shock and remain resilient.
10 In August 2021, Statistics Canada released the sets of microdata behind its Survey of Financial Security, for which the aggregate statistics were released in December 2020.
11 This likely reflected two factors that complemented each other. First, from 2016 to 2019, federal and provincial regulators implemented several measures to tighten macroprudential policy in Canada—for example, stricter requirements both to qualify for a mortgage and for foreign ownership. And second, the Bank raised its policy interest rate five times over 2017 and 2018, which made borrowing more expensive.

- 8 -
some benefitted from extraordinary income support from governments. On average, Canadians have saved an extra $8,300 since early 2020 (Chart 5).
This allowed many households to pay back consumer debt such as credit cards and lines of credit (Chart 6). More households have made accelerated mortgage payments, too. And the shares of households falling behind on debt payments or
filing personal bankruptcies have declined to historical lows.
0
2,000
4,000
6,000
8,000
10,000
2020Q1 2020Q2 2020Q3 2020Q4 2021Q1 2021Q2
Can$
Spending shortfalls Gains in disposable income
Chart 5: Canadians had accumulated on average $8,300 in extra savings
as of mid-2021Extra savings per capita, seasonally adjusted
Last observation: 2021Q2
Note: Spending shortfalls and gains in disposable income are deviations from linear trends calculated from 2016 to 2019.
The chart shows the accumulation of extra savings for each quarter since the fourth quarter 2019.
Sources: Statistics Canada and Bank of Canada calculations
1.8
2.0
2.2
2.4
2.6
90
100
110
120
130
2015 2016 2017 2018 2019 2020 2021
%Index
Total credit card balances (left scale)
Share of borrowers behind on any payment by at least 60 days (right scale)
Chart 6: Canadians are relying less on credit card debt and experiencing
financial stress less frequentlyIndicators of household financial health; index: January 2015 = 100 for total credit card balances
Last observation: September 2021Source: TransUnion and Bank of Canada calculations

- 9 -
That’s all been welcome, but it’s not the full story. As savings rose and consumer credit fell, new mortgage debt climbed and continues to rise. This reflects a record number of mortgages issued to households and an increase in the average size of mortgages. We’re also seeing a growing share of new mortgages
taken out by borrowers with extremely high loan-to-income ratios (Chart 7).
So what’s the net effect of these trends on household vulnerabilities?
To find the answer, staff used an updated version of our Household Risk Assessment Model, or HRAM, to estimate how household balance sheets have
likely evolved since 2019, the last year for which these data were available.12
From our analysis, we found that the overall prevalence of highly indebted
households likely improved during the first year of the pandemic. That’s because households that managed to pay down debt and achieve a lower debt-to-income ratio outnumbered those taking on large, new mortgages.
12 HRAM models household consumption, savings and mortgage repayment decisions and, using a variety of data, can estimate levels of household assets, debt and income in subsequent years. See B. Peterson and T. Roberts, “Household Risk Assessment Model,” Bank of Canada Technical Report No. 106 (September 2016) and J. Allen, T. Grieder, B. Peterson and T. Roberts, “The Impact of Macroprudential Housing Finance Tools in Canada,” Journal of Financial Intermediation (September 1, 2017).
0
5
10
15
20
25
30
2014 2015 2016 2017 2018 2019 2020 2021
%
Insured mortgages Uninsured mortgages Total mortgages
Start of the
global pandemic
Chart 7: The share of new mortgages with a high loan-to-income ratio has
increased considerably during the pandemicShare of new mortgages with a loan-to-income ratio greater than 450 percent
Last observation: 2021Q2
Note: Data include purchases and refinancing originated by federally regulated financial institutions. Insured mortgages have a loan-
to-value ratio greater than 80 percent. Uninsured mortgages have a loan-to-value ratio of 80 percent or less. A small portion of
mortgages issued with a loan-to-value ratio below 80 percent are insured; however, these do not have a significant impact on the
plotted series.
Sources: Department of Finance Canada, regulatory filings of Canadian banks and Bank of Canada calculations

- 10 -
But we also found that the deteriorating quality of new mortgage borrowing during recent quarters is now likely the bigger driver of household indebtedness. By the end of 2021, the share of highly indebted households will likely have more than reversed its initial improvement and topped its 2019 peak (Chart 8).
The takeaway is that, overall, vulnerabilities linked to elevated household debt appear to be rising again after a slight pause.
Longer-term forces
Another important part of our assessment of vulnerabilities and the impact that they could have on the economy is thinking about how they reflect and could interact with longer-term forces.
Globally, one of the most important financial trends of the past two decades has been the gradual decline in market interest rates. This is true for most of the
major advanced economies, such as Canada. It’s also common among certain emerging-market economies. It has to do with big structural forces such as increased savings related to population aging in advanced economies and rising incomes in emerging-market economies, as well as weaker investment stemming
from slowing productivity growth in many countries. The global decline in interest rates is highly important for an open economy such as ours because it affects the broad financial conditions that we face at home. The Bank influences interest rates, of course, but is also constrained by such global trends.
In general, even extremely high debt loads can be manageable when borrowing costs are low. But, on average, the long-run decline in interest rates over the past
two decades hasn’t lowered the debt servicing costs of Canadian households.
0
4
8
12
16
20
1999 2005 2012 2016 2019 2020Q2–
2021Q1
2021H2
%
Chart 8: After a modest improvement in 2020, the share of highly indebted
households in 2021 is on track to surpass pre-pandemic highsShare of households with a debt-to-income ratio greater than 350 percent
Sources: Statistics Canada and Bank of Canada calculations
From Statistics Canada’s
Survey of Financial Security From simulations of
household indebtedness
performed by the
Bank of Canada

- 11 -
For instance, mortgage debt service ratios (DSRs)—that is, the portion of disposable income used for servicing mortgage payments—have been mostly constant, actually rising by a small margin (Chart 9).13 This is because the amount a household can borrow is largely dictated by the DSR that it can afford:
when interest rates fall, many households simply adjust by borrowing more. Lower interest rates and higher borrowing have tended to offset each other.
As well, with fairly inelastic housing supply, the extra borrowing induced by lower rates has partly translated into higher house prices. So we now find ourselves in a situation with high debt and high house prices but rather constant DSRs.
Partly as a result, the share of the population that owns a home hasn’t changed much either.14 Home ownership rates in Canada have been relatively stable for
20 years across a range of age groups (Chart 10).
13 Mortgage DSRs are calculated by dividing the residential mortgage debt payments that Canadians make on a quarterly basis—including both capital and interest payments—by their total disposable income (before interest payments) in the same quarter.
14 Fully understanding these dynamics is another important focus of ongoing and future research work for Bank staff.
0
1
2
3
4
5
6
7
8
9
35
40
45
50
55
60
65
70
75
80
2000 2002 2004 2006 2008 2010 2012 2014 2016 2018 2020
%%
Ratio of outstanding mortgage debt to nominal GDP (left scale)
Five-year fixed mortgage rate on new insured mortgages (right scale)
Total mortgage debt-service ratio of households (right scale)
Chart 9: The decline in mortgage rates over two decades has not reduced
servicing costs and has led to higher mortgage indebtednessIndicators of mortgage indebtedness and servicing costs
Last observation: 2021Q2Sources: Statistics Canada, Lender Spotlight and Bank of Canada calculations

- 12 -
In any case, despite the rather constant DSRs, it’s important to stress that the averages mask the large number of households that are stretched financially. They might be just fine as long as nothing affects their job or income. But if a big shock were to hit either, they could face serious difficulty servicing their debt.
Similarly, the debt that households accumulated at unusually low interest rates will stay with them well into the future. In the meantime, interest rates can be expected to rise as the effects of the pandemic dissipate and excess capacity in
the economy is fully absorbed. As well—and perhaps a more worrisome risk because it may be underappreciated—the longer-term structural forces pushing global interest rates down could partially reverse in the coming years. Either of these possibilities could cause problems for highly indebted households.
It’s also important to remember that the federal mortgage stress test, while very helpful for lenders to gauge whether a household could handle higher mortgage
rates, doesn’t provide a certificate of perfect financial health. Whether a household could withstand higher rates without slashing other spending depends on how well it manages its finances overall before rates rise.
Simply put, safeguards are in place to limit stress on the financial system from vulnerabilities—but there are some important risks. High debt levels mean the economy could react particularly badly to certain types of shocks, especially ones
that affect income and house prices or cause interest rates to rise substantially.
Let me turn to another reason for vigilance: climate change, which has been in
the news quite a bit lately because of the COP26 conference in Glasgow and, more recently, the disaster unfolding in British Columbia.
30
40
50
60
70
80
Under 35 35–44 45–54 55–64 65 and over All
%
Age group
1999 2012 2016 2019
Chart 10: Despite lower mortgage rates, home ownership has remained
relatively stable over the past two decadesRates of home ownership (principal residence only) by age group and year
Source: Statistics Canada Last observation: 2019

- 13 -
Climate-related risks and the Bank’s commitments
Climate change and its effects have clearly accelerated. Heatwaves and wildfires
demonstrated this dramatically last summer, and the heavy rainfall, flooding and mudslides this month suggest it too. Just as climate change is increasingly on the minds of Canadians, it is increasingly top of mind for us.
Given the potential importance of climate change for financial stability, the Bank has been working diligently to try to sort out all the ways that climate-related risks could affect the financial system and economy over time.
Climate-related risks include physical risks such as damage to homes, businesses and other assets from more frequent severe weather events. They
also include transition risks from undertaking measures that help the shift to a low-carbon economy.
In our May FSR, we warned that the potential impact of climate-related risks could be underappreciated and, as a result, they may not be well priced in financial markets. Mispricing risks means that the transition to a low-carbon economy could leave some investors and financial institutions that hold carbon-
intensive assets exposed to sudden and large future losses. It can also delay investments in the low-carbon infrastructure needed to achieve climate targets. As you all know, the more information financial system participants have, the better they can assess and price risks and thereby support the needed transition.
And, to do our job as a central bank concerned about financial stability, we need good information too. That’s why we’re working to learn all we can, and it’s why
we’re collaborating with our domestic and international partners on these issues.
For instance, the Bank is a global leader in using scenario analysis to assess
risks from climate change and from the move to a low-carbon economy—such as risks around measures to support international agreements aimed at capping the rise in temperatures.15 Such analysis involves looking at how the economy would adjust to different paths for controlling greenhouse gas emissions (Chart 11).
15 E. Ens and C. Johnston, “Scenario Analysis and the Economic and Financial Risks from Climate Change,” Bank of Canada Staff Discussion Paper No. 2020-3 (May 2020).

- 14 -
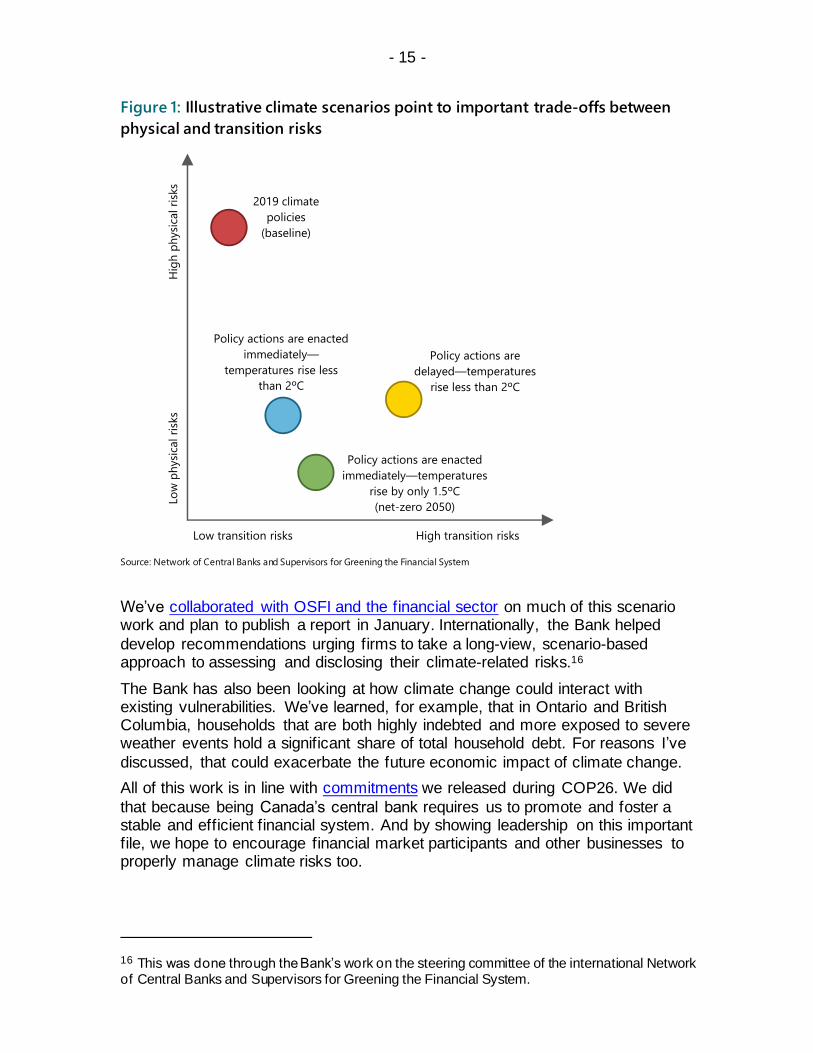
Scenario analysis by the Bank and others has found that while failing to act limits transition risks at first, it eventually carries a significant economic cost in the form
of greater damage to homes, businesses and infrastructure (Figure 1).
Acting in a timely way, meanwhile, would mean a smoother transition and would
also encourage new green technologies to emerge, lowering overall transition costs. Action that comes with a delay would need to be more abrupt than otherwise to achieve the same goal. That would mean a more difficult transition. It also could make a sudden repricing of carbon-intensive assets more likely.
Our analysis therefore confirms that if we act now to battle climate change, our financial system should be in a good position to facilitate the transition to a low-
carbon economy.
0
10
20
30
40
50
60
70
80
2015 2020 2025 2030 2035 2040 2045 2050
Gigatonnes/year
2019 climate policies (baseline)
Policy actions are enacted immediately—temperatures rise less than 2°C
Policy actions are delayed—temperatures rise less than 2°C
Policy actions are enacted immediately—temperatures rise by only 1.5°C (net-zero 2050)
Chart 11: The extent of climate-related physical and transition risks depends
crucially on the future path of greenhouse gas emissionsGigatonnes per year of carbon dioxide equivalent under various illustrative scenarios for global
greenhouse gas emissions
Source: Bank of Canada
- 15 -
We’ve collaborated with OSFI and the financial sector on much of this scenario work and plan to publish a report in January. Internationally, the Bank helped
develop recommendations urging firms to take a long-view, scenario-based approach to assessing and disclosing their climate-related risks.16
The Bank has also been looking at how climate change could interact with existing vulnerabilities. We’ve learned, for example, that in Ontario and British Columbia, households that are both highly indebted and more exposed to severe weather events hold a significant share of total household debt. For reasons I’ve
discussed, that could exacerbate the future economic impact of climate change.
All of this work is in line with commitments we released during COP26. We did
that because being Canada’s central bank requires us to promote and foster a stable and efficient financial system. And by showing leadership on this important file, we hope to encourage financial market participants and other businesses to properly manage climate risks too.
16 This was done through the Bank’s work on the steering committee of the international Network of Central Banks and Supervisors for Greening the Financial System.
Figure 1: Illustrative climate scenarios point to important trade-offs between
physical and transition risks
Source: Network of Central Banks and Supervisors for Greening the Financial System
Low transition risks High transition risks
Lo
wp
hysi
cal ri
sks
H
igh
ph
ysi
cal ri
sks
2019 climate
policies
(baseline)
Policy actions are
delayed—temperatures
rise less than 2ºC
Policy actions are enacted
immediately—temperatures
rise by only 1.5ºC
(net-zero 2050)
Policy actions are enacted
immediately—
temperatures rise less
than 2ºC

- 16 -
Conclusion
It’s time for me to conclude. I have thrown a lot of facts and analysis at you, so let
me sum up the messages that I’d like to leave you with.
First and foremost, the resilience of Canadians and our financial system helped
make the economic impact of the pandemic less damaging than it could have been. This resilience has helped households, businesses and financial institutions come through the pandemic in reasonably good financial health.
However, the main financial vulnerabilities that Canada faced before the pandemic—and that we’ve flagged for many years—remain significant.
The gap between demand and supply that pushed housing prices higher during the pandemic remains. Indeed, after a few months of moderation, housing activity and house price growth have picked up again. And vulnerabilities linked
to high indebtedness, overall, seem to be rising once more after a brief pause. While Canadian banks are resilient, these vulnerabilities could exacerbate the economic impact of any substantial rise in interest rates or adverse shock.
As pandemic restrictions continue to be gradually lifted, the economic recovery is projected to persist—which should help minimize financial stress from the phasing out of government support programs. But the Bank will keep a close eye
on the financial health of households, businesses and financial institutions as all of this evolves.
We will also continue to pay close attention to other financial system–wide issues that could affect the Canadian economy, most notably climate-related risks.
Rest assured that the Bank will continue to do its part to support a strong, healthy financial system and a complete economic recovery. Thank you.