Embed Size (px)
Citation preview
December 2, 2020
Financial Stability Report - Second Semester 2020

Introduction• The Mexican economy and financial system are facing an unprecedented shock as a result of the
pandemic.
• The shock has significantly affected economic activity, inflation and financial conditions inMexico, although at different time horizons.
• Given the severity and duration of the shock, it becomes even more relevant to have a stableand efficient financial system that fosters credit into the economy and allows for an adequatetransmission of monetary and financial policies to the rest of the economy.
• This edition of the Financial Stability Report describes:
✓ The current state of the financial system.
✓ The evolution of the most important risks and vulnerabilities faced by financialinstitutions and the system as a whole.
✓ The measures that have been implemented to promote the sound development of thefinancial system and to preserve its stability under this complex economic environment.
Financial Stability Report- December 2020 1
2 New challenges and measures implemented
3 Financial system risks
Contents
1 Macrofinancial conditions
4 Stress tests
5 Final remarks
Financial Stability Report- December 2020 2

❶ Global economic growth
World GDP growth forecastsPercent
GDP growth forecastsIndex 2019=100
Data as of October 2020.Source: IMF WEO October 2020.
Financial Stability Report- December 2020 3
Data as of October 2020.Source: IMF WEO October 2020.
Global economic activity has improved since May, although at a more moderate pace as of July and heterogeneously amongcountries. A sharp contraction of GDP in 2020 and a gradual recovery in 2021 are still anticipated, although with a high degreeof uncertainty.
92
100
108
116
124
132
140
148
2019 2020 2021 2022 2023 2024
World
Advanced economies
Emerging economies exc. China
China
October, 2019
October, 2020
-5.2-4.4
5.4 5.2
-8.1
-5.8
4.83.9
-3.1 -3.3
5.8 6.0
-5.1-5.8
4.6 4.9
-10
-8
-6
-4
-2
0
2
4
6
8
-10
-4
2
8
June October June October
2020 2021
Wolrd
Advanced economies
Emerging economies
Emerging economies exc. China

Global risk appetite index 1/
IndexS&Ps 500 volatility index
Annualized percentStock market and FX indices performance
Index Jan 2018 = 100
Financial Stability Report- December 2020 4
❷ Financial markets: advanced economies
Data as of December 1, 2020.Source: Prepared by Banco de México with Bloomberg data..1/ The emerging markets FX indices includes the following countries: Peru, thePhilippines, Poland, Hungary, South Africa, Russia, Brazil, Colombia, Chile,Malaysia, India and Mexico.
Data as of December 1, 2020.Source: Prepared by Banco de México with data from Bloomberg.1/ Emerging economies FX index includes: Peru, Philippines, Poland, Hungary, SouthAfrica, Russia, Brazil, Colombia, Chile, Malaysia, India and Mexico.
0
10
20
30
40
50
60
70
80
90
2018 2019 2020
60
70
80
90
100
110
120
130
140
E M M J O D F M J S D F A J S N
S&P 500MSCI emerging economiesDXY IndexEmerging economies FX index
2018 2019 2020
J
-6
-4
-2
0
2
4
6
2017 2018 2019 2020
Global risk apetite
Panic
Euphoria
Data as of November 30,2020.Source: Credit Suisse.1/ The risk appetite index compares various financial assets, taking into account that in periodsof high appetite for higher risk assets, such as equity from advanced and emerging economies,these tend to have higher yields, while safe assets, such as US, euro area and Japanesegovernment bonds, tend to have negative yields. Meanwhile, in periods of low risk appetite, theopposite occurs. In this context, the value of the index refers to the coefficient of a regression ofthe daily yield of 64 assets based on their volatility.
Overall, financial markets have exhibited a positive behavior during the second semester and have experienced moremoderate losses than those observed between March and May. Risk appetite has escalated, volatility has partially decreased,and stock and exchange rate indexes have improved, although an environment of uncertainty persists and future episodes ofvolatility cannot be ruled out.
❸ Financial markets: emerging market economies
Nominal Exchange Rate against USDIndex 01-Jan-2019=100
Cumulative flow of funds to emerging market economies after selected events
(fixed income and equity)USD billion
Cumulative flow of funds to emerging market economies excluding China in 2020 1/
USD billion
Data as of December 1, 2020.Source: Prepared by Banco de Mexico with data from EPFR.
Data as of December 1, 2020.Source: Prepared by Banco de Mexico with data from EPFR.1/ Includes funds used for the purchase and sale of stocks and bonds of emergingcountries excluding China, registered in advanced countries. Flows exclude portfolioperformance and changes in the exchange rate.
Data as of December 1, 2020.Source: Bloomberg.
Financial Stability Report- December 2020 5
-180
-140
-100
-60
-20
20
60
100
0 10 20 30 40
Mill
ares
Covid-19 (since Jan-21-20)Financial Crisis (2008)Greek Crisis (2011)Taper Tantrum (2013)US Presidential Election (2016)
Weeks since the beginning of the event
90
100
110
120
130
140
150
160
J A J O J A J O
Brazil
Chile
Colombia
South Africa
Mexico
Peru
2019 2020
-35
-30
-25
-20
-15
-10
-5
0
5
10
15
E F M A M J J S O N
Equity
Fixed income
Total
2020J
Depreciation
During the second half of 2020, inflows by foreign investors to emerging market economies have been observed. However, asof today, net cumulative outflows were still registered, mainly influenced by the more accommodative monetary policystances adopted. Domestic currencies in these countries have had mixed adjustments.
❹ Mexican financial markets
Financial Stability Report- December 2020 6
Data as of November 28, 2020. Source: Banco de México.1/The index was estimated using a principal component analysis on 36 standardized variables of Mexican financial markets grouped into 6 categories (debt market, securities market, FX market, derivatives market, credit institutions, and sovereign risk). The total sum of thecomponents yields an IEMF scaled to range [0,1]. A higher level of the index represents higher financial stress. Debt market: Peso/udi long term sovereign yield spread; long term / short term sovereign yield spread; Volatility of the long term sovereign yield; MX-US shortterm sovereign yield spread; Investment grade corporate short term yield spread; High yield corporate short term yield spread; Long term sovereign yield; Short term sovereign yield; MX-US long term sovereign yield. Equity market: Annual percentage change in the mainMexican Stock Exchange Index (IPC); Volatility of IPC´s daily changes; IPC’s price to earnings ratio; IPC’s price to book ratio; Implied volatility in IPC options; Naftrac´s (main stock ETF) bid ask spread. Foreign exchange market: Annual percentage change in peso/dollar spot;Volatility of spot peso/dollar’s daily changes; Max-min spread in interbank spot peso/dollar; Bid ask spread in interbank spot peso/dollar. Derivatives market: Non-commercial net long term position in the CME peso futures; Peso/dollar forward spread; OIS spread;Peso/dollar basis swap spread; IRS swap sovereign yield spread; Credit Institutions: Financial sector beta; Yield volatility in short term bank market funding; CDS of foreign banks that own the largest banks in Mexico; Financial sector equity index / IPC; Government-bankingfunding (repo) rate; Max-min spread in bank funding rate. Sovereign Risk: Mexico’s sovereign CDS; JP Morgan Corporate EMBI Mexico; JP Morgan Sovereign EMBI Mexico; Mexico’ oil price; Foreign holdings of local sovereign debt.
Mexican Financial Market Stress Index 1/
Stress level scaled to range [0,1]
The Mexican Financial Market Stress Index shows a partial reversal since the increase observed during March and April.However, it remains at levels higher than those observed prior to the beginning of the pandemic.
0.0
0.1
0.2
0.3
0.4
0.5
0.6
0.7
0.8
0.9
1.0
2005 2007 2009 2011 2013 2015 2017 2019
Debt
Equity
Foreign Exchange
Derivatives
Credit Institutions
Sovereign Risk
0.0
0.1
0.2
0.3
0.4
0.5
0.6
0.7
0.8
0.9
1.0
J F M A M J J A S O N D J F M A M J J A S O N2019 2020

Data as of December 1, 2020.Source: Bloomberg.1/ Red lines indicate the exchange rate at closing time whereas bluelines indicate the trading range.
Financial Stability Report- December 2020 7
❹ Mexican financial markets
Mexican peso trading range 1/
MXN/ USD
Data as of December 1, 2020.Source: Prepared by Banco de México with PIP data.1/ The gray area refers to the range of daily yield curves sinceDecember 4, 2019.
-270
-240
-210
-180
-150
-120
-90
-60
-30
0
30
4.0
4.5
5.0
5.5
6.0
6.5
7.0
7.5
8.0
8.5
9.0
1 m
on
th3
mo
nth
6 m
on
th1
2 m
on
th
3 y
ear
5 y
ear
10
yea
r
20
yea
r
30
yea
r
Mar-02-20
Jul-01-20
Dec-1-20
Change (Jul-01-20 to Dec-1-20)
18
19
20
21
22
23
24
25
26
27
D J F M A M J J A S O N
2019 2020
5
6
6
7
7
8
8
9
9
10
0
50
100
150
200
250
300
350
J M M J O D F M J S D F A J S N
Mexico CDS
10 year M Bond yield
2018 2019 2020Data as of December 1, 2020.Source: Bloomberg.
Overall, during S2-2020 domestic financial markets have exhibited a positive behavior associated with the improvement ininternational financial conditions, despite certain volatility episodes. Since the last Report, the Mexican peso has appreciatedwhile interest rates have decreased relative to the levels registered in March.
Government bond nominal yield curve 1/
Percent and basis pointsMexico CDS and 10-year M bond yield
Basis points and percent

Financial conditions IndexStandard deviations and index
Financial Stability Report- December 2020 8
❹ Mexican financial markets
Mexican financial conditions index: contributions Standard deviations
-2
-1
0
1
2
3
4
2006 2008 2010 2012 2014 2016 2018 2020
Condiciones mercado cambiario
Condiciones mercado accionario
Condiciones mercado de deuda
Riesgo país
Variables macroeconómicas
Otros
Condiciones financieras externas
ICF México
Tigh
ter
Loo
ser
-2
-1
0
1
2
3
4
2006 2008 2010 2012 2014 2016 2018 2020
Mexico 1/ United States 2/
Tigh
ter
Loo
ser
Conditions in FX marketConditions in stock marketConditions in debt marketCountry RiskMacroeconomic variablesOther<External financial conditionsMexico FC 1/
Preliminary data as of October 2020. Source: Banco de México.1/ The ICF for Mexico was estimated with a DVT-FAVAR based on 16 financial and 2 macroeconomic variables: interbank spread, overnight bank funding rate, 10-year bond interest rate, slope of the yield curve, interest rate spreads of 3-month and 10-year US-Mexico bonds, spread between short-term corporate paper with high credit quality (AAA -AA) and 28-day TIIIE, EMBI+, CPI variation, CPI 90-day volatility, financial system beta, exchange rate variation, implied volatility in 3-month MXN/USD exchange rateoptions, financing gap, Mexican oil mix price, US financial conditions, IGAE and CPI annual variations. An IGAE forecast was used for the April and May estimate. Inflation figures for May correspond to the first half of that month. Standard deviations 2/ Refers tothe mean deviation of the adjusted NCFI published by the Federal Reserve of Chicago. 3/ Does not include China.
Financial conditions have loosened after tightening in March, albeit they remain at higher levels than at the beginningof the pandemic. Both global and domestic financial conditions will continue to depend on the evolution of thepandemic.

❺ Balance of macrofinancial risks
• The Mexican financial system, particularly commercial banks, were at a stronger position at thebeginning of the pandemic as compared to previous episodes of financial stress. This was partlydue to the policies and regulations implemented in previous decades.
• Given the prevailing uncertainty about the evolution of the pandemic and its impact on theeconomy, certain risks could intensify and affect the well-functioning of the financial system.
• This report considers the following financial stability risks:
✓ A less vigorous recovery of the global economy than anticipated, mainly of the UnitedStates.
✓ Greater volatility in international financial markets and a rebalancing of flows towardslower risk assets.
✓ A slower recovery of the Mexican economy.
✓ A downgrading of sovereign and Pemex’s credit ratings.
9Financial Stability Report- December 2020
2 New challenges and measures implemented
3 Financial system risks
1 Macrofinancial risks
4 Stress tests
5 Final remarks
Financial Stability Report- December 2020 10
Contents

New risks and measures implemented
• Although domestic economic activity has slightly improved, the recovery has beenmoderate and heterogeneous across sectors.
• In view of the possible lengthy duration of the pandemic, additional impacts oneconomic activity of some sectors could be expected, and thus the sources of income andthe credit risk of the agents linked to those sectors would continue to be affected.
• Given the uncertainty, the Mexican financial system continues to face significantchallenges related to:
✓ Markets’ orderly operation.
✓ Keep the flow of financing to the economy.
✓ The containment of liquidity needs.
✓ Adequate risk management and business continuity.
✓ Mitigate the likely impact of economic activity and employment effects on thedelinquency rates of credit portfolios.
Financial Stability Report- December 2020 11
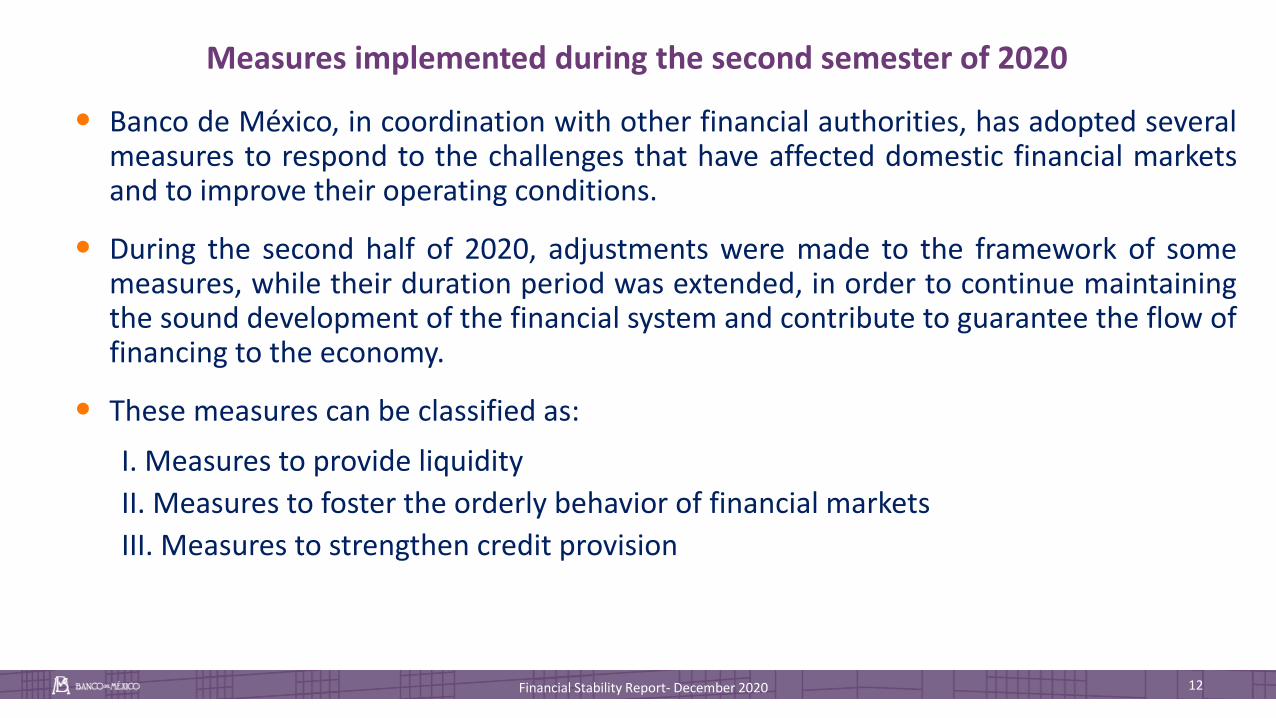
• Banco de México, in coordination with other financial authorities, has adopted severalmeasures to respond to the challenges that have affected domestic financial marketsand to improve their operating conditions.
• During the second half of 2020, adjustments were made to the framework of somemeasures, while their duration period was extended, in order to continue maintainingthe sound development of the financial system and contribute to guarantee the flow offinancing to the economy.
• These measures can be classified as:
I. Measures to provide liquidity
II. Measures to foster the orderly behavior of financial markets
III. Measures to strengthen credit provision
Measures implemented during the second semester of 2020
Financial Stability Report- December 2020 12

Use of measures to foster an orderly behavior of financial markets, strengthen credit provision, and supply liquidity for the well-functioning of the financial system
Financial Stability Report- December 2020 13
(Billion
MXN)
(Billion
USD)
(Billion
MXN)
(Billion
USD)
(Billion
MXN)
(Billion
USD)
Reduction of Monetary Regulation Deposits (DRMs, for its acronym in Spanish) 04/11/2020 d.n.a. 50 50 d.n.a. 50
Ordinary Additional Liquidity Facility (FLAO, for its acronym in Spanish) 04/11/2020 30 d.n.a. 0 d.n.a. 5/ 0
Increasing liquidity during trading hours 1/ d.n.a. d.n.a. d.n.a. d.n.a. d.n.a.
Government securities term repurchase window 28/09/2020 37 150 100 10 200
Temporary securities swap window 28/09/2020 5 50 18.99 6 18.99
Corporate securities repurchase facility (FRTC, for its acronym in Spanish) 28/09/2020 29 100 10.97 21 20.95
Swaps of government securities 03/11/2015 d.n.a. 100 14.98 2 14.98
Foreign exchange hedge program (billion USD) 2/ 30/03/2017 25 30 7.49 2 7.49
Financing in USD via credit swap line with the US Federal Reserve (billion USD) 19/06/2020 21 60 1.82 6 13.32
Financing to micro, small- and medium-size enterprises and individuals, via
liberating DRM or tem repos 3/ 28/09/2020 3 4/ 250 9.53 15 9.53
Collateralized financing facility for commercial banks with corporate loans, to
finance micro, small- and medium-size enterprises28/09/2020 0 100 0 0 0
Total measures implemented in MXN (billion MXN) 800 204.47 - - 314.45
Total measures implemented in USD (billion USD) 90 9.31 - - 20.81
I. Measures to provide liquidity
II. Measures to foster an orderly behavior of financial markets
III. Measures to strengthen credit provision
Date of rules' emission
or modification
Number of
contracts
signed with
banks
Size of programs
Usage Memo:
Amount
outstanding Calls
Total amount
allocated 6/
Figures as of November 30, 2020.Source: Banco de México. d.n.a.: Does not apply. 1/ Excess intraday liquidity that is sterilized at the close of the interbank market through open market operations. The average from April 21 to November 30 is 119.47 Billion MXN. 2/ The additional amount used since announcing the increase in the program from 20 to 30 Billion USD on March 9, 2020 is 1,991 Billion USD. 3/ The contract corresponding to this facility must be re-signed to be in line with the modifications published in Circular 30/2020 of August 19, 2020. Prior to this modification, 13 contracts had been signed. 4/ The contract corresponding to this facility must be signed again to comply with the modifications published in Circular 35/2020 of September 28, 2020. Prior to this amendment, 14 contracts had been signed. 5/ The frequency of the calls is not reported, since the facility is activated at the request of the bank. 6/ Includes maturities and refinancing.

2 New challenges and measures implemented
3 Financial system risks
1 Macrofinancial conditions
4 Stress results
5 Final remarks
Financial Stability Report- December 2020 14
Contents

❶Heat map of Mexican financial system risks
Financial Stability Report- December 2020 15
The heat map of risks of the financial system slightly improved as compared to that of the previous Report. Heat map of Mexican financial system risks 1/
Data as of September 2020.Source: Banco de México.1/ For a description of the methodology, see Box 3: Heat maps of Mexican financial system risks, Financial System Report 2018. The category Risk of Market Exposure corresponds to thecategory Risk Appetite of the Financial System Report 2018.
Aggregate index
Exposure to markets
Financial sector leverage
Non-financial sector leverage
Macroeconomic risk

Financial Stability Report- December 2020 16
❷ Total financing to the non-financial private sector
As a result of the financial shock originated by the COVID-19 pandemic, financing to the non-financial private sector,particularly to firms, increased; however, it slowed down during the second and third quarters.
Credit gap by sourcePercent
Credit gap by sector 1/
Percent
Data as of September 2020. Source: Banco de México.1/ The credit gap is calculated as the difference between the credit-to-GDP ratio and itslong-term trend. The long-term trend is estimated with a one-sided Hodrick-Prescott filterwith a smoothing parameter of 400,000 using data from the fourth quarter of 1980.2/ Data on external credit prior to 1995 was estimated as the difference between totalcredit and bank credit.
-15
-10
-5
0
5
10
15
20
19
81
19
84
19
87
19
90
19
94
19
97
20
00
20
03
20
07
20
10
20
13
20
16
20
20
Total credit gap 1/
Domestic credit gap
External credit gap 2/
-15
-10
-5
0
5
10
15
20
19
81
19
84
19
87
19
90
19
94
19
97
20
00
20
03
20
07
20
10
20
13
20
16
20
20
Total credit gap
Corporate credit gap
Consumer credit gap
Housing credit gap
Total credit gap and its counterfactual 1/
Percent
Data as of September 2020. Source: Banco de México.1/ The credit gap is calculated as the difference between the credit-to-GDP ratio and itslong-term trend. The long-term trend is estimated with a one-sided Hodrick-Prescottfilter with a smoothing parameter of 400,000 using data from the fourth quarter of 1980.The counterfactual of the credit gap is estimated holding the level of GDP equal to thatof December 2019.
Data as of September 2020. Source: Banco de México.1/ Data on corporate credit prior to 1995 was estimated as the difference betweentotal credit and bank credit.
0
2
4
6
8
10
M2019
J S D M2020
J S
Total Financing GAP
Contrafactual
Financial Stability Report- December 2020 17
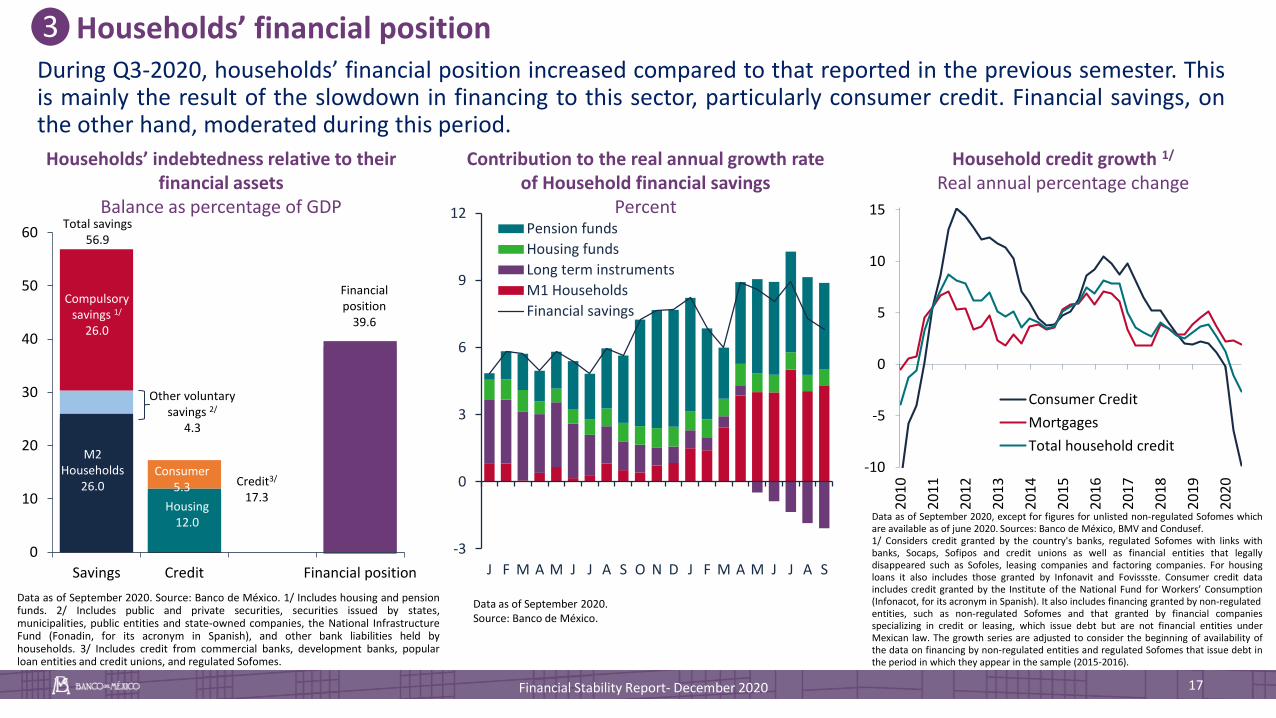
❸ Households’ financial positionDuring Q3-2020, households’ financial position increased compared to that reported in the previous semester. Thisis mainly the result of the slowdown in financing to this sector, particularly consumer credit. Financial savings, onthe other hand, moderated during this period.
Households’ indebtedness relative to their financial assets
Balance as percentage of GDP
Contribution to the real annual growth rate of Household financial savings
Percent
Household credit growth 1/
Real annual percentage change
Data as of September 2020. Source: Banco de México. 1/ Includes housing and pensionfunds. 2/ Includes public and private securities, securities issued by states,municipalities, public entities and state-owned companies, the National InfrastructureFund (Fonadin, for its acronym in Spanish), and other bank liabilities held byhouseholds. 3/ Includes credit from commercial banks, development banks, popularloan entities and credit unions, and regulated Sofomes.
Data as of September 2020.Source: Banco de México.
Data as of September 2020, except for figures for unlisted non-regulated Sofomes whichare available as of june 2020. Sources: Banco de México, BMV and Condusef.1/ Considers credit granted by the country's banks, regulated Sofomes with links withbanks, Socaps, Sofipos and credit unions as well as financial entities that legallydisappeared such as Sofoles, leasing companies and factoring companies. For housingloans it also includes those granted by Infonavit and Fovissste. Consumer credit dataincludes credit granted by the Institute of the National Fund for Workers’ Consumption(Infonacot, for its acronym in Spanish). It also includes financing granted by non-regulatedentities, such as non-regulated Sofomes and that granted by financial companiesspecializing in credit or leasing, which issue debt but are not financial entities underMexican law. The growth series are adjusted to consider the beginning of availability ofthe data on financing by non-regulated entities and regulated Sofomes that issue debt inthe period in which they appear in the sample (2015-2016).
0
10
20
30
40
50
60
Savings Credit Financial position
Total savings56.9
M2 Households
26.0
Compulsorysavings 1/
26.0
Credit3/
17.3
Other voluntary savings 2/
4.3
Housing12.0
Consumer 5.3
Financial position
39.6
-3
0
3
6
9
12
J F M A M J J A S O N D J F M A M J J A S
Pension funds
Housing funds
Long term instruments
M1 Households
Financial savings
-10
-5
0
5
10
15
20
10
20
11
20
12
20
13
20
14
20
15
20
16
20
17
20
18
20
19
20
20
Consumer Credit
Mortgages
Total household credit

❸ Households’ financial position
Financial Stability Report- December 2020 18
Consumer credit granted by banks and their subsidiaries decreased for all types of credit. In general, the balances of differentportfolios decreased, although, in some of them the reductions in the amounts of a relatively low percentage of loans had agreater impact.
Consumer credit by sourcePercent
Commercial banks’ consumer loan portfolioAnnual real percentage change
Changes in consumer loans, excluding credit cards from February to August 2020
Billion MXN
Data as of September 2020, except for unlisted non-regulated Sofomes where data is available as ofJune 2019. Sources: Banco de México, National Banking and Securities Commission (CNBV, for itsacronym in Spanish) and Condusef.1/ Includes credit portfolio of regulated Sofomes with links with banks.2/ Includes portfolio of Infonacot in the segment of personal loans and others, which accounts for1.3% of total consumer portfolio as of September 2020.3/ Includes portfolio of non-regulated Sofomes, credit cards issued by department stores that reportto the Mexican Stock Exchange (BMV for its acronym in Spanish) as well as financial companies thatgrant credit predominantly as part of their business line, such as financial leasing or some financialareas of automotive companies.
Data as of September 2020.Source: CNBV.
Data as of August 2020.Source: Banco de México.1/ Includes microcredits, loans to purchase durable goods, and otherconsumer credits.
-20
-15
-10
-5
0
5
10
15
20
25
30
35
2013 2014 2015 2016 2017 2018 2019 2020
Consumer loans
Credit card loans
Personal loans
Payroll loans
Auto loans
38
17
26
15
4
33
92 89
5764
17
1
3514
50
7 11 821
0
10
20
30
40
50
60
70
80
90
100
Auto loans Payroll loans Credit cardloans
Personalloans and
others
Total
Commercial banks 1/ Regulated non-banks 2/
Non-regulated non-banks 3/
764
206
-82
-153
736
79
- 25
- 63
57
- 21
- 43
41
- 27
- 22
29 -8
- 24
600
700
800
900
1,000
Feb-20 Aug-20
Personal loans
Payroll loans
Auto loans
New loans
Paid loans
Amortization
Financial Stability Report- December 2020 19
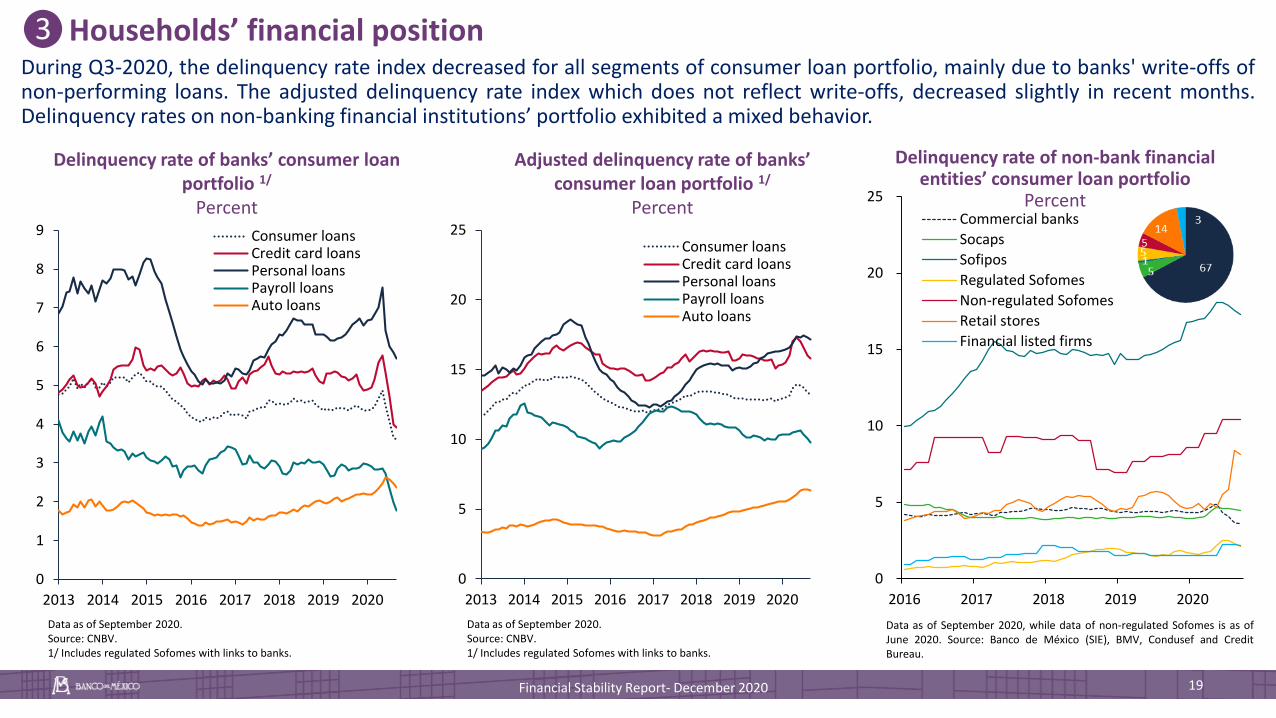
❸ Households’ financial positionDuring Q3-2020, the delinquency rate index decreased for all segments of consumer loan portfolio, mainly due to banks' write-offs ofnon-performing loans. The adjusted delinquency rate index which does not reflect write-offs, decreased slightly in recent months.Delinquency rates on non-banking financial institutions’ portfolio exhibited a mixed behavior.
Delinquency rate of banks’ consumer loan portfolio 1/
Percent
Adjusted delinquency rate of banks’ consumer loan portfolio 1/
Percent
Delinquency rate of non-bank financialentities’ consumer loan portfolio
Percent
Data as of September 2020.Source: CNBV.1/ Includes regulated Sofomes with links to banks.
Data as of September 2020.Source: CNBV.1/ Includes regulated Sofomes with links to banks.
Data as of September 2020, while data of non-regulated Sofomes is as ofJune 2020. Source: Banco de México (SIE), BMV, Condusef and CreditBureau.
0
1
2
3
4
5
6
7
8
9
2013 2014 2015 2016 2017 2018 2019 2020
Consumer loansCredit card loansPersonal loansPayroll loansAuto loans
0
5
10
15
20
25
2013 2014 2015 2016 2017 2018 2019 2020
Consumer loansCredit card loansPersonal loansPayroll loansAuto loans
0
5
10
15
20
25
2016 2017 2018 2019 2020
Commercial banks
Socaps
Sofipos
Regulated Sofomes
Non-regulated Sofomes
Retail stores
Financial listed firms
Reporte de Estabilidad Financiera - Diciembre 2020 20
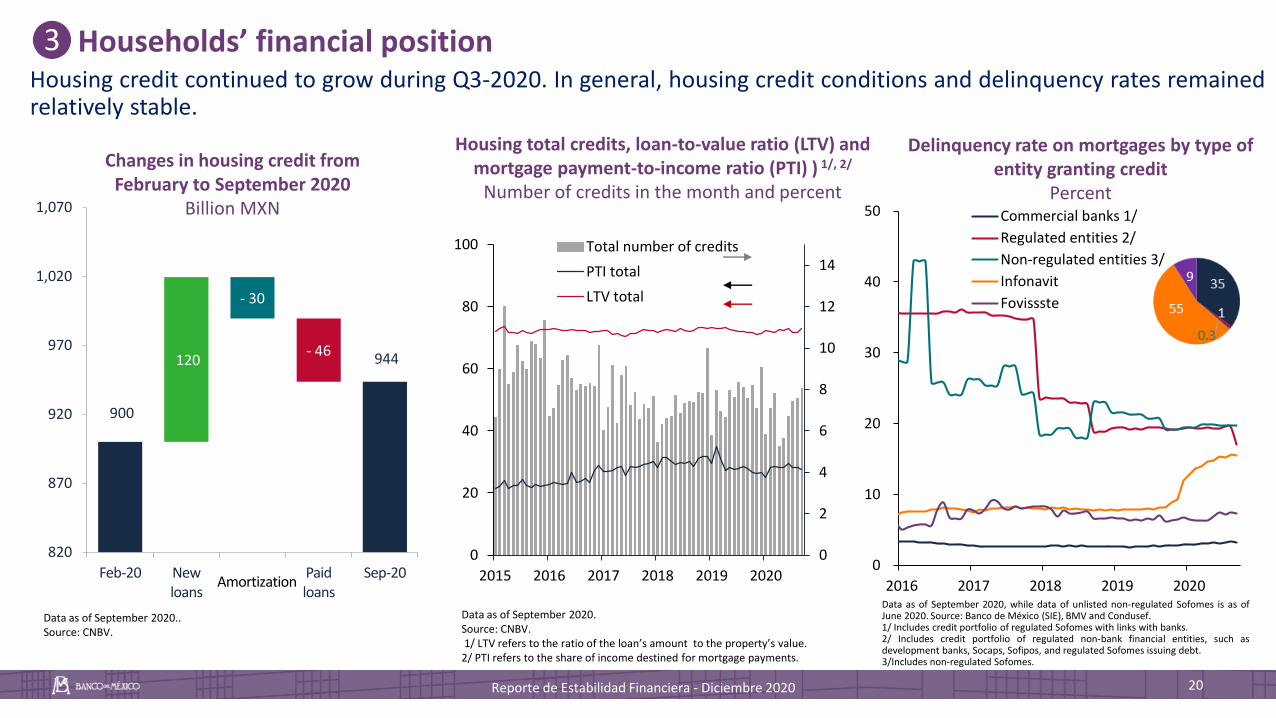
❸Households’ financial positionHousing credit continued to grow during Q3-2020. In general, housing credit conditions and delinquency rates remainedrelatively stable.
Changes in housing credit from February to September 2020
Billion MXN
Housing total credits, loan-to-value ratio (LTV) and mortgage payment-to-income ratio (PTI) ) 1/, 2/
Number of credits in the month and percent
Delinquency rate on mortgages by type ofentity granting credit
Percent
Data as of September 2020..Source: CNBV.
Data as of September 2020.Source: CNBV.1/ LTV refers to the ratio of the loan’s amount to the property’s value.
2/ PTI refers to the share of income destined for mortgage payments.
Data as of September 2020, while data of unlisted non-regulated Sofomes is as ofJune 2020. Source: Banco de México (SIE), BMV and Condusef.1/ Includes credit portfolio of regulated Sofomes with links with banks.2/ Includes credit portfolio of regulated non-bank financial entities, such asdevelopment banks, Socaps, Sofipos, and regulated Sofomes issuing debt.3/Includes non-regulated Sofomes.
900
944 120
- 30
- 46
820
870
920
970
1,020
1,070
Feb-20 New loans
Paid loans
Sep-20Amortization
0
10
20
30
40
50
2016 2017 2018 2019 2020
Commercial banks 1/
Regulated entities 2/
Non-regulated entities 3/
Infonavit
Fovissste
0
2
4
6
8
10
12
14
0
20
40
60
80
100
2015 2016 2017 2018 2019 2020
Total number of credits
PTI total
LTV total

Financial Stability Report- December 2020 21
❹Private non-financial firms’ financial positionTotal financing to Mexican private domestic non-financial firms has decelerated during Q2-2020 and Q3-2020. In particular,financing from domestic sources exhibited lower dynamism, while external financing increased, reflecting the improvement inexternal conditions.
Total financing tonon-financial private firms 1/
Real annual percentage change
Total financing tonon-financial private firms by firm size
Real annual percentage change
Changes in credit to private firms 1/
Billion MXN
Data as of September 2020.Source: CNBV1/ Does not include credit by regulated Sofomes linked with banks, theirsubsidiaries and non subsidiaries.
8
92
Data as of September 2020.Source: CNVB.
Data as of September 2020, except for unlisted non-regulated Sofomes which are as ofJune 2020. Source: Banco de México, BMV and SHCP.1/Includes financing from suppliers, both domestic and external, to firms listed in Mexico’sstock exchange. It also includes financing granted to firms by non-regulated entities, suchas non-regulated Sofomes and financing granted by financial firms specialized in credit orleasing, which issue debt but are not financial entities under Mexican law. The growthseries is adjusted to the beginning of available data of financing for non-regulated entitiesand regulated Sofomes for issuing debt in the period in which they appear in the sample(2015-2016). External financing data are adjusted due to the exchange rate effect.
-10
-5
0
5
10
15
2010 2012 2014 2016 2018 2020
Domestic
External
Total
764-205 -501
1,815
613
- 147
- 398
1,882
477
152 - 58
- 103
467
1,000
1,300
1,600
1,900
2,200
2,500
2,800
3,100
Feb-20 New loans
Paid loans
Sep-20
SME's
Large firms
Amortization
-15
-10
-5
0
5
10
15
20
2015 2016 2017 2018 2019 2020
SMEs
Large firms
Financial Stability Report- December 2020 22
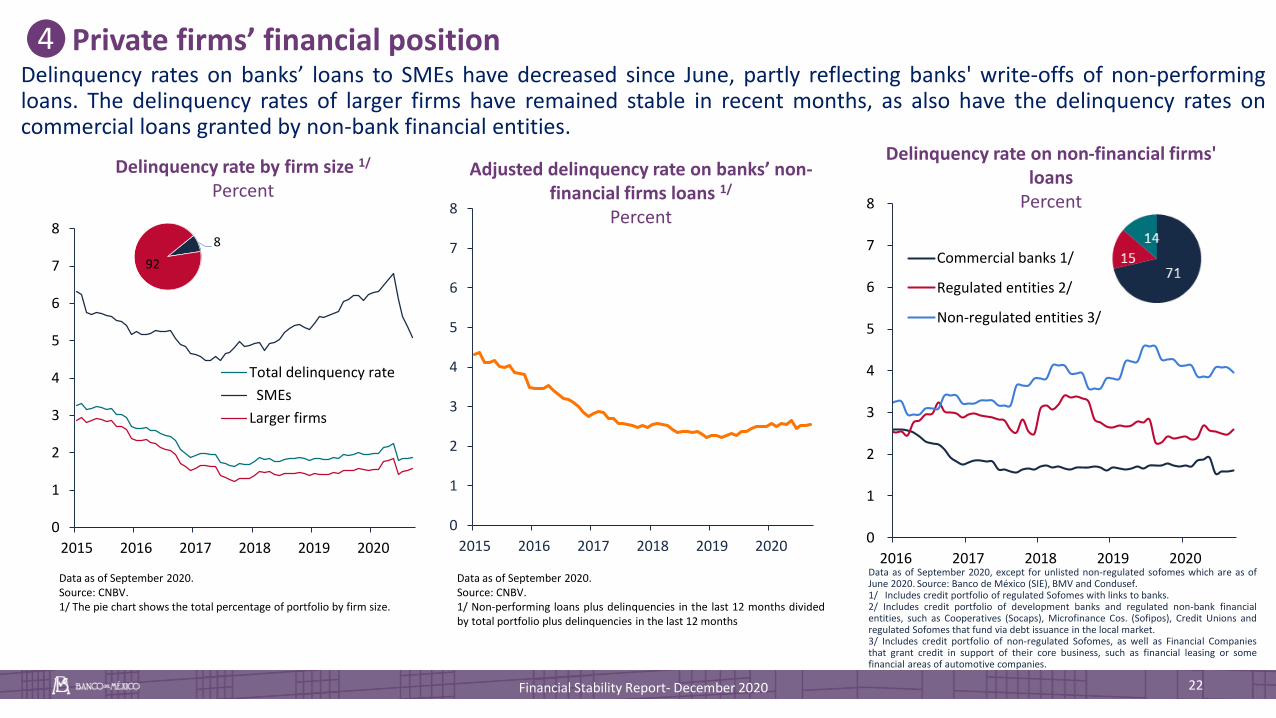
❹Private firms’ financial positionDelinquency rates on banks’ loans to SMEs have decreased since June, partly reflecting banks' write-offs of non-performingloans. The delinquency rates of larger firms have remained stable in recent months, as also have the delinquency rates oncommercial loans granted by non-bank financial entities.
Delinquency rate by firm size 1/
Percent
Delinquency rate on non-financial firms' loans
Percent
Data as of September 2020.Source: CNBV.1/ The pie chart shows the total percentage of portfolio by firm size.
Data as of September 2020, except for unlisted non-regulated sofomes which are as ofJune 2020. Source: Banco de México (SIE), BMV and Condusef.1/ Includes credit portfolio of regulated Sofomes with links to banks.2/ Includes credit portfolio of development banks and regulated non-bank financialentities, such as Cooperatives (Socaps), Microfinance Cos. (Sofipos), Credit Unions andregulated Sofomes that fund via debt issuance in the local market.3/ Includes credit portfolio of non-regulated Sofomes, as well as Financial Companiesthat grant credit in support of their core business, such as financial leasing or somefinancial areas of automotive companies.
0
1
2
3
4
5
6
7
8
2016 2017 2018 2019 2020
Commercial banks 1/
Regulated entities 2/
Non-regulated entities 3/
0
1
2
3
4
5
6
7
8
2015 2016 2017 2018 2019 2020
Total delinquency rate
SMEs
Larger firms
8
92
Adjusted delinquency rate on banks’ non-financial firms loans 1/
Percent
Data as of September 2020.Source: CNBV.1/ Non-performing loans plus delinquencies in the last 12 months dividedby total portfolio plus delinquencies in the last 12 months
0
1
2
3
4
5
6
7
8
2015 2016 2017 2018 2019 2020

❺ Institutions: commercial banks
Financial Stability Report- December 2020 23
Between March and September 2020, commercial banks’ capitalization levels rose, which is a key factor to address theenvironment of economic weakness and to sustain financing to firms and households.
Structure of banks’ Capital Adequacy Ratio (CAR) 1/
PercentCAR net of risk 1/
Percent
Data as of September 2020.Source: Banco de México.1/ The capital adequacy ratio (CAR) is estimated by dividing the net capital by the risk-weighted assets. Thenet capital is the regulatory capital that includes the Tier 1, Additional Tier 1, and Tier 2 capital.
Data as of September 2020.Source: Banco de México, CNBV and Credit Bureau.1/ Estimated as the capitalization ratio that results from reducing the CVaR at 99.9% of both net capital andrisk-weighted assets. This indicator assumes that credit portfolio has losses for an amount equal to the CVaRat 99.9%, which the bank assumes as directly reflecting capital loss without affecting its reserves and that suchportfolio is weighted in order to determine capital requirements at 100%.
6
8
10
12
14
16
18
M2016
J S D M2017
J S D M2018
J S D M2019
J S D M2020
J S
Tier 1 Additional Tier 1 Tier 2
0
2
4
6
8
10
12
14
16
18
20
2012 2013 2014 2015 2016 2017 2018 2019 2020
CAR
CAR net of risk
Minimun
Minimum + capital reserves

❺ Institutions: commercial banks
Financial Stability Report- December 2020 24
Market risk for banks decreased significantly since March 2020, due to an increase in their portfolio exposure to short-termgovernment bonds. Even though at the beginning of pandemic some institutions observed higher liquidity risk, starting fromQ2-2020 the system’s overall liquidity buffers increased, particularly for larger banks.
Conditional Value at Risk (CVaR) at 99.9% for market risk
Percent of net capital
Liquidity Coverage Ratio (LCR) Percent
Distribution of Net Stable Funding Ratio (NSFR)Percent
Data as of September 2020.Source: Banco de México.
Data as of October 31, 2020.Source: Banco de México.
Data as of October 2020.Source: Banco de México.
0
1
2
3
4
5
6
7
20
15
20
16
20
17
20
18
20
19
20
20
50
100
150
200
250
300
J F M A M J J A S O
System 7 largest banks
Rest of the banks Requirement
2020
50
100
150
200
250
300
350
J A J O J A J O J A J O J A J O
2017 2018 2019 2020
Percentile 90Percentile 75Percentile 25Percentile 10Average
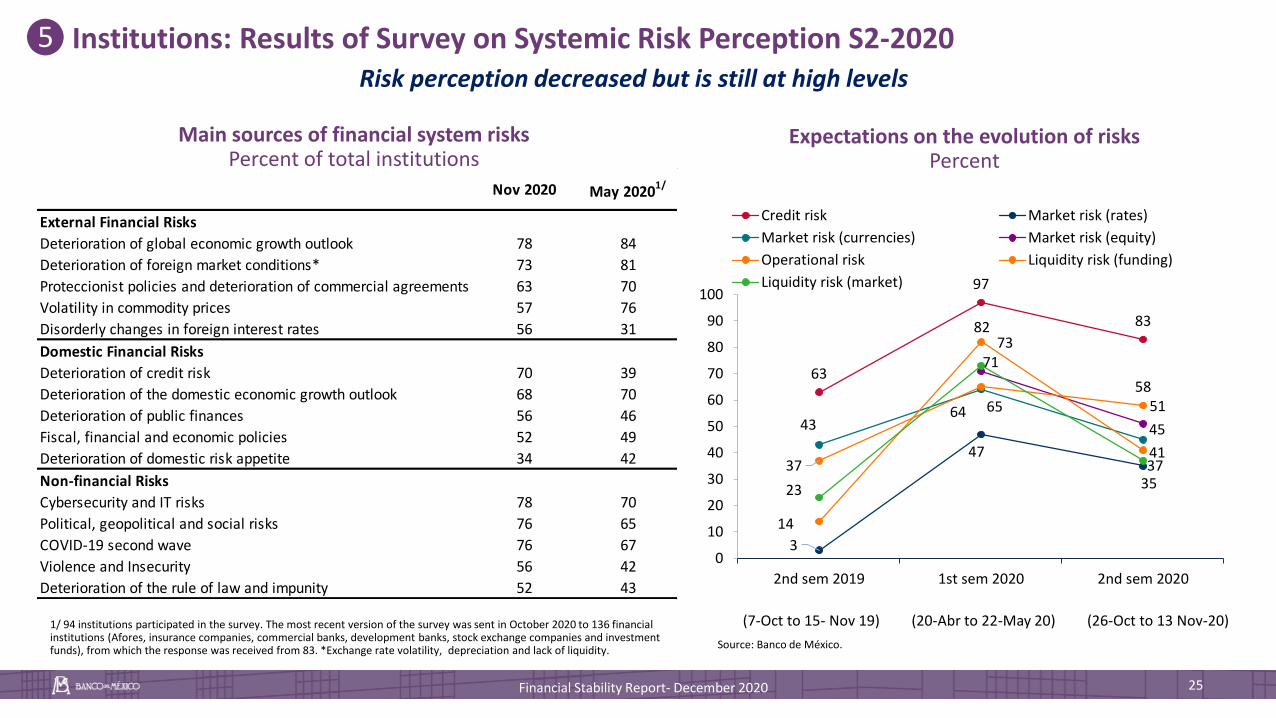
❺ Institutions: Results of Survey on Systemic Risk Perception S2-2020
Financial Stability Report- December 2020 25
Main sources of financial system risks Percent of total institutions
Risk perception decreased but is still at high levels
Expectations on the evolution of risksPercent
Source: Banco de México.
1/ 94 institutions participated in the survey. The most recent version of the survey was sent in October 2020 to 136 financial institutions (Afores, insurance companies, commercial banks, development banks, stock exchange companies and investment funds), from which the response was received from 83. *Exchange rate volatility, depreciation and lack of liquidity.
External Financial Risks
Deterioration of global economic growth outlook 78 84
Deterioration of foreign market conditions* 73 81
Proteccionist policies and deterioration of commercial agreements 63 70
Volatility in commodity prices 57 76
Disorderly changes in foreign interest rates 56 31
Domestic Financial Risks
Deterioration of credit risk 70 39
Deterioration of the domestic economic growth outlook 68 70
Deterioration of public finances 56 46
Fiscal, financial and economic policies 52 49
Deterioration of domestic risk appetite 34 42
Non-financial Risks
Cybersecurity and IT risks 78 70
Political, geopolitical and social risks 76 65
COVID-19 second wave 76 67
Violence and Insecurity 56 42
Deterioration of the rule of law and impunity 52 43
May 20201/Nov 2020
(7-Oct to 15- Nov 19) (20-Abr to 22-May 20) (26-Oct to 13 Nov-20)
63
97
83
3
47
35
4364
45
71
51
37
6558
14
82
41
23
73
37
0
10
20
30
40
50
60
70
80
90
100
2nd sem 2019 1st sem 2020 2nd sem 2020
Credit risk Market risk (rates)
Market risk (currencies) Market risk (equity)
Operational risk Liquidity risk (funding)
Liquidity risk (market)

• Since the release of the last Report, some cyber incidents have taken place in the financialsystem. However, these incidents did not affect clients economically, neither did they affectsignificantly processes or resources of the institutions.
• Hence, cybersecurity measures had to be reinforced and monitored in more detail.
• Banco de México continues implementing its operational continuity strategies in order to operatethe infrastructures it is in charge of.
Financial Stability Report- December 2020 26
❻ Other risks: cyber risks and operational continuity risks
AprilRansomware in a commercial bank
servers.Internet banking No impact
AugustRansomware in IT equipment of a
bank's branch office. Counter services No impact
NovemberRansomware in servers of a brokerage
firm.Funds dispersion No impact
NovemberRansomware in
servers of a financial group.
Internet banking, FX operations,
funds dispersion No impact
Month Description Affected Services Clients affected
• In recent years, financial entities and authorities, including central banks, have accelerated theprocesses of incorporating climate and environmental risks in their risk managementsystems.
• This Report takes the first step in quantifying the exposure of the country’s financialinstitutions to commercial credits that could be affected by physical and transition risks.
• In addition, despite the volatility observed in financial markets, the issuance of green bondshas increased compared to that registered last year.
• In its June meeting, the Financial System Stability Council analyzed and approved theoperating rules of the Green Finance Committee.
• In the first meeting of the Green Finance Committee, the establishment of four working groupswas approved:
1. Sustainable taxonomy.
2. Better use coming from capital mobilization opportunities.
3. ESG1/ risks measurement.
4. Information dissemination and implementation of ESG standards.
❻ Other risks: environmental risks and investments sustainability
Financial Stability Report- December 2020 27
1/ ESG: Environmental, Social and Governance risks
2 New challenges and measures implemented
3 Financial system risks
1 Macrofinancial conditions
4 Stress tests
5 Final remarks
Financial Stability Report- December 2020 28
Contents

• The goal of these tests is to assess the banking system’s resilience to specificmacroeconomic and financial shocks.
• The scenarios considered should not be taken as a forecast of the expectedperformance of the economy, nor should they be associated with a probability ofoccurrence.
• These exercises are a counterfactual and partial equilibrium simulation, with the goalof evaluating and identifying the vulnerabilities of the banking system overall.
• The scenarios considered were intended to assess the resilience of the system during aslow economic recovery, starting from September and over 36 months,
• The emphasis of the stress lies on the speed of GDP recovery, rather than in the severenature of the initial shocks, and uses as a starting point the most recent level ofeconomic activity and available information as of September 2020.
Financial Stability Report- December 2020 29
Credit stress tests to commercial banks

Less vigorous-than-anticipated recovery of
global economy
Portfolio recomposition and adjustments to sovereign debt and
Pemex’s credit ratings
• Environment of uncertainty and high volatility.• Higher risk premia and upward pressures on interest rates.• Significant exchange rate depreciation.• Decline in investment and credit demand.
• Shocks to Mexican economic activity generated by weakeraggregate demand.
• Delay in economic recovery.• Lower level of investment and consumption.• Impact on GDP growth and on unemployment rates.
Slower recovery and higher volatility, with
rebalancing asset holdings towards lower
risk assets
Scenarios Assumptions on macrofinancial variables
A
B
C
DThe variables modeled in the scenarios are constructed considering the initial shocks previously described, and stem from a set of simultaneous shocks previously described. In particular, in a set of scenarios A, shocks fluctuate between -2.96 and 2.68standard deviations with respect to historic values, highlighting a 2.12 s.d. shock in unemployment, a 2.68 s.d. shock in the exchange rate, and a -2.91 s.d. shock in the annual growth of IGAE. In the set of scenario B, shocks fluctuate for all variablesbetween -3.55 and 4.87 s.d., highlighting a shock of 2.98 s.d. in unemployment, a shock of 4.87 s.d. in the exchange rate and a shock of -3.55 in the annual growth of IGAE. Finally, in the set of scenarios C shocks fluctuate between – 2.98 and 4.45 s.d. forall variables, highlighting a shock of 2.24 s.d. in unemployment, a shock of 4.45 s.d. in the exchange rate and a shock of -2.98 in the annual growth of IGAE.
Historic scenarios
• The dynamics of the main variables observed during: ➢ The 1995 crisis (H1). ➢ The 2008 global financial crisis (H2).➢ The volatility episodes of May 2013 (H3).
Financial Stability Report- December 2020 30
❶The exercise is common to all institutions and does not consider idiosyncratic problems related to credit origination.
❷ It does not consider possible mitigation measures that could be implemented by the institutions in the exercise (counterfactual exercise of partial equilibrium and not general equilibrium).
❸Simulated stress scenarios are not associated with a probability of occurrence.
Additional assumptions
• Contraction in the aggregate demand and supply.• Fall in GDP and increase in unemployment.• Exchange rate depreciation due to the climate of uncertainty.
• Rebalancing asset holdings towards lower risk assets.• Upward pressure on interest rates.
Credit stress tests to commercial banks

• Stress test results indicate the following:
• The banking system as a whole has capital levels that allow it to face different simulatedscenarios for the domestic economy.
• At an individual level, certain banking institutions, representing a low percentage of totalassets of the system, could have difficulties to maintain the minimum capitalization levelsrequired for regulation in view of certain adverse scenarios.
• As for leverage ratio levels, the system’s levels would remain above the regulatory minimumof 3%.
Financial Stability Report- December 2020 31
Credit stress tests to commercial banks

Financial system Capital Adequacy Ratio (CAR) 1/2/3/
Percent
Data as of September 2020 and 3-year simulations starting from such date.Source: Banco de México.1 / The horizontal line corresponds to minimum CAR plus capital buffers.2/ These results should in no way be interpreted as a forecast for the 3 years analyzed.3/ Yellow lines represent the mean CAR of the system. The gray areas define the range of capitalization indexes observed in all simulations.
Scenario A Scenario B Scenario C
Financial Stability Report- December 2020 32
Stress test results suggest that average capitalization levels of the system remain above the minimum, pluscapital buffers, even in the most adverse scenarios.
8
9
10
11
12
13
14
15
16
17
18
19
2019 2020 2021 2022 2023
8
9
10
11
12
13
14
15
16
17
18
19
2019 2020 2021 2022 2023
8
9
10
11
12
13
14
15
16
17
18
19
2019 2020 2021 2022 2023
Range Mean Range Mean Range Mean
Observed Simulated Observed Simulated Observed Simulated
Credit stress tests to commercial banks

Financial Stability Report- December 2020 33
In the analyzed set of historic scenarios, the banking system would remain resilient, ending the stress horizonat levels above the regulatory minimum.
8
9
10
11
12
13
14
15
16
17
18
19
2019 2020 2021 2022 2023
8
9
10
11
12
13
14
15
16
17
18
19
2019 2020 2021 2022 2023
8
9
10
11
12
13
14
15
16
17
18
19
2019 2020 2021 2022 2023
Range Mean Range Mean Range Mean
Observed Simulated Observed Simulated Observed Simulated
Data as of September 2020 and 3-year simulations starting from such date.Source: Banco de México.1 / The horizontal line corresponds to minimum CAR plus capital buffers.2/ These results should in no way be interpreted as a forecast for the 3 years analyzed.3/ Yellow lines represent the mean CAR of the system. The gray areas define the range of capitalization indexes observed in all simulations
Historic scenario 1(1995)
Historic scenario 2(2008)
Historic scenario 3(2013)
Financial system Capital Adequacy Ratio (CAR) 1/2/3/
Percent
Credit stress tests to commercial banks

Financial system's probabilities of default weighted by performing loans portfolio 1/
Weighted by the current portfolio of each bank, percent
Mean CAR of the system considering a concentration impact of 99% of losses 1/
Percent
Data as of September 2020 and 3-year simulations starting from such date.Source: Banco de México.1/ This impact is estimated from models developed to analyze differentiated sector impactsand from information on the exposure of banks to companies in these sectors.
Data as of September 2020 and 3-year simulations starting from such date.Source: Banco de México.1/ Horizontal line represents minimum CAR plus capital supplements.
Financial Stability Report- December 2020 34
The analysis suggests that banks whose capitalization levels were affected most significantly, were those thathad the highest increases in their probabilities of default and that were more exposed to the most affectedsectors.
3
4
5
6
7
8
9
10
11
12
2019 2020 2021 2022 2023
A B C H1 H2 H3
Observed Simulated Observed Simulated
8
10
12
14
16
18 Scenarios A
Scenarios B
Scenarios C
Credit stress tests to commercial banks
Financial Stability Report- December 2020 35
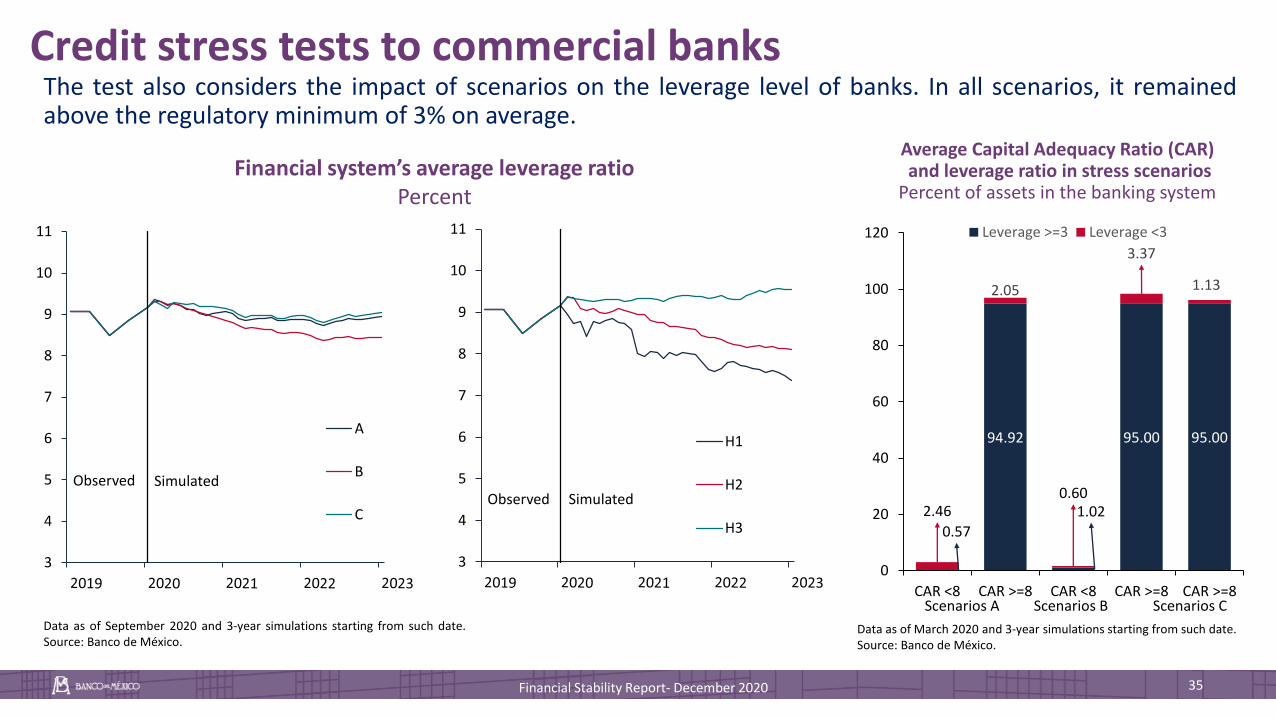
The test also considers the impact of scenarios on the leverage level of banks. In all scenarios, it remainedabove the regulatory minimum of 3% on average.
0.57
1.022.460.60
94.92 95.00 95.00
2.05
3.37
1.13
0
20
40
60
80
100
120
CAR <8 CAR >=8 CAR <8 CAR >=8 CAR >=8
Leverage >=3 Leverage <3
3
4
5
6
7
8
9
10
11
A
B
C
3
4
5
6
7
8
9
10
11
H1
H2
H3
Observed SimulatedObserved Simulated
Scenarios A Scenarios B Scenarios C
Financial system’s average leverage ratioPercent
Data as of September 2020 and 3-year simulations starting from such date.Source: Banco de México.
Average Capital Adequacy Ratio (CAR)and leverage ratio in stress scenarios
Percent of assets in the banking system
Data as of March 2020 and 3-year simulations starting from such date.Source: Banco de México.
Credit stress tests to commercial banks

Banks’ assets by LCR estimated with the expected loss of deposits1/ 2/ 3/
Financial Stability Report- December 2020 36
Data as of October 31, 2020.Source: Banco de Mexico.1/The most relevant assumptions made are the following: i) banks’ debt issuance and financing from financial institutions aren´t renew and ii) that a percentage of demand and term deposits within the 30-day horizon areevenly distributed over a 30-day period.2/ For each bank and type of deposit, an expected outflow is estimated using a 95% conditional VaR of the observed distribution of the monthly changes in the seasonally adjusted deposits amounts.
Percentage of banks that could cover its liabilities under a severe stress scenario for different time horizons
Percentage of banks classified by buckets of number of days
Figures as of October 30, 2020.1/ The data on total assets for commercial banks corresponds to those published by theCNBV at the end of October 2020.2/ The impact on the value of liquid assets of the different stress scenarios proposed byBanco de México is incorporated.3/ The exercise presented herein is performed on each bank based on an idiosyncraticshock, and does not evaluate the result in the face of a common macro-financial shock. Thisallows institutions to be stressed under those scenarios that would most affect themindividually.
Around 80% of banks would be able to cover their wholesale obligations1/ over a period of 30 days or longer,exclusively using available liquid assets without considering their inflows. Most institutions also have sufficient liquidresources to face unusually high deposit outflows (based on historical information),2/ for at least 30 days.
0
10
20
30
40
50
60
70
80
90
100
E2019
M M J S N E2020
M M J S
0-20 21-30 31-59 60+
J J
Group CriteriaPercentage of
banks' assets
1 LCR ≤ 65 2.9%
2 65 < LCR ≤ 100 1.7%
3 LCR > 100 95.4%
Liquidity stress tests to commercial banks
2 New challenges and measures implemented
3 Financial system risks
1 Macrofinancial conditions
4 Stress tests
5 Final remarks
Financial Stability Report- December 2020 37
Contents

❶The economy and Mexican financial system are still facing a complex environment caused by pandemic-related shocks.
❷At the beginning of the pandemic, the financial system was in a solid position, with high capital levels,ample liquidity and low delinquency rates. After the impact of the pandemic on the economy, certainvulnerabilities and risks have increased:
▪ Uncertainty over the effects of the pandemic on the credit portfolios of the most affected sectors prevails.
▪ It is also necessary to closely monitor the sectors or segments that have been most affected in their income, andthe risks of concentration in the financing sources for some institutions.
❸Although the financial system has shown resilience to the challenges faced, certain risks could intensifyover the next months.
❹Banco de México will continue to closely monitor the evolution of Mexican financial markets and willcontinuously assess its operational conditions.
❺Looking ahead, the challenge will be to maintain the strength of the financial system so that it continuesto perform its intermediation function and therefore contributes to a faster and more vigorous recovery.
Final remarks
Financial Stability Report- December 2020 38

❶ US monetary policy and global financial stability
❷ TIIE funding rate and new reference rates
❸ Evolution of financial system in view of adverse economic events
❹ Macroeconomic and financial determinants of delinquency rates
❺ Ratio between sovereign CDS and financing costs in the Mexican banking sector
❻ Actions of development banks and other entities implemented during episodes of economic contraction
❼ Popular credit and savings intermediaries
❽ Impact of extreme temperatures on delinquency in agricultural businesses
Boxes
Annexes
❶ Disaggregated heat map of the Mexican financial system
Financial Stability Report- December 2020 39
40Reporte de Estabilidad Financiera - Diciembre 2020


![Semester III (Second year]](https://img.pdfslide.us/doc/110x75/61a4c78110217e304f429c4f/semester-iii-second-year.jpg)