Embed Size (px)
Citation preview

Quarterly Compendium: Banking Statistics
Quarterly Compendium: Statistics of the Banking System
[March 2019]
Financial Stability Department
State Bank of Pakistan

Quarterly Compendium: Banking Statistics
CONTENTS
Data Conventions ................................................................................................................................................................................1
1. Banking System ...............................................................................................................................................................................2
Table 1.1: Financial Soundness Indicators ...................................................................................................................... 3
Statistics of the Banking System: ...................................................................................................................................................6
Table 1.2: Key variables of Balance Sheet and Profit & Loss Statement ........................................................................ 7
Table 1.3: Growth Rates of Key Variables and Key Financial Soundness Indicators ....................................................... 7
Table 1.4: Group wise Balance Sheet and Income Statement of Banks ......................................................................... 7
Table 1.5: Banks’ Group-wise Key Variables ................................................................................................................... 8
Table 1.6: Concentration in the Banking System .......................................................................................................... 10
Deposits: .............................................................................................................................................................................................. 11
Table 1.7a: Total Deposits by Category & Currency ..................................................................................................... 11
Table 1.7b: Domestic Deposits by Category & Currency .............................................................................................. 11
Asset Quality: ..................................................................................................................................................................................... 12
Table 1.8: Asset Quality of the Banking System ............................................................................................................ 12
Table 1.9: Segment-wise Advances and Non- Performing Loans (NPLs) ...................................................................... 13
Table 1.10: Sector-wise Advances and Non- Performing Loans (NPLs) ........................................................................ 13
Table 1.11: Investments As Per Remaining Maturity .................................................................................................... 14
Soundness & Resilience: ................................................................................................................................................................ 14
Table 1.12a: Break-up of Mark-up/Return/Interest Earned ......................................................................................... 15
Table 1.12b: Break-up of Mark-up/Return/Interest Expensed ..................................................................................... 15
Table 1.13: Distribution of Banks by Capital Adequacy Ratio (CAR) ............................................................................. 15
Table 1.14: Capital Structure and Capital Adequacy of All Banks and DFIs .................................................................. 16
Table 1.12: Capital Structure and Capital Adequacy of All Banks and DFIs (Continued) .............................................. 16
Table 1.15: Stress Testing Results of the Banking System ............................................................................................ 17
Table 1.16: List of Banks ................................................................................................................................................ 18
2. Islamic Banking ............................................................................................................................................................. 20
Table 2.1: Financial Soundness Indicators of Islamic Banking ...................................................................................... 21
Table 2.2: Group-wise Balance Sheet and Income Statement of Islamic Banks/Branches .......................................... 22
Table 2.3: List of Islamic Banking Institutions ............................................................................................................... 23

Quarterly Compendium: Banking Statistics
3. Development Finance Institutions ............................................................................................................................ 24
Table 3.1: Financial Soundness Indicators of DFIs ........................................................................................................ 25
Table 3.2: Balance Sheet and Income Statement of DFIs ............................................................................................. 26
Table 3.3: List of Development Finance Institutions ..................................................................................................... 27
4. Microfinance Banks (MFBs) ........................................................................................................................................ 28
Table 4.1: Financial Soundness Indicators of MFBs ............................................................................................................. 29
Table 4.2: Key variables of Balance Sheet and Profit & Loss Statement of MFBs ........................................................ 30
Table 4.3: Growth Rates of Key Variables of MFBs ....................................................................................................... 30
Table 4.4: Loan Portfolio Breakdown - MFBs ................................................................................................................ 31
Table 4.5: Asset Quality of the MFBs ............................................................................................................................ 32
Table 4.6: Sector-wise Advances and Non-Performing Loans (NPLs) ........................................................................... 32
Table 4.7a: MFBs: Break-up of Mark-up / Return / Interest Earned ............................................................................ 33
Table 4.7b: MFBs: Break-up of Mark-up / Return / Interest Expensed ........................................................................ 33
Table 4.8: Composition of Microfinance Banks ............................................................................................................ 33
Table 5: Key Variables and FSIs for Other Sectors ............................................................................................................... 34
Annexure A: Compilation Methodology of FSIs for Banks, Islamic Banks and DFIs ................................................ 35
Annexure B: Compilation Methodology of FSIs for MFBs .................................................................................................. 38
For Queries & Comments:
Dr. Asif Ali [ [email protected] ]
Mariam Abbas [ [email protected] ]
Abdul Rehman Ansari [ [email protected] ]

Quarterly Compendium: Banking Statistics
1
Data Conventions
1. Figures for the calendar years (CY) are based on un-audited accounts for that year except for CY13 and
earlier.
2. Figures for quarters (Mar (Q1), Jun (Q2), Sep (Q3) and Dec (Q4)) are based on unaudited Quarterly
Report of Condition (QRC) submitted by banks/DFIs.
3. Data sources other than at point 1 and 2 are mentioned in respective tables.
4. From Jun-15 onwards, Quarterly Compendium has been revised to:
i. Remove redundancies, streamline and enhance disclosures, and synchronize the overall structure
of the publication.
ii. Incorporate new FSIs (Core and Encouraged) as per IMF’s current Compilation Guide and
forthcoming suggestions that will help towards aligning our FSIs with the international best
practices/definitions.
iii. Streamline reporting of Financings of Islamic Banks/ Islamic Bank Branches to include
inventories and other related item(s) pertaining to Islamic modes of financing, which were
previously reported under ‘Other Assets’.
Data Revision: Some adjustments have been made in statistics pertaining to profitability of the banking
sector for Q1CY18 to Q4CY18, due to data revision by one of the newly established foreign bank.

Quarterly Compendium: Banking Statistics
2
1. Banking System
Quarterly Compendium: Banking Statistics
3
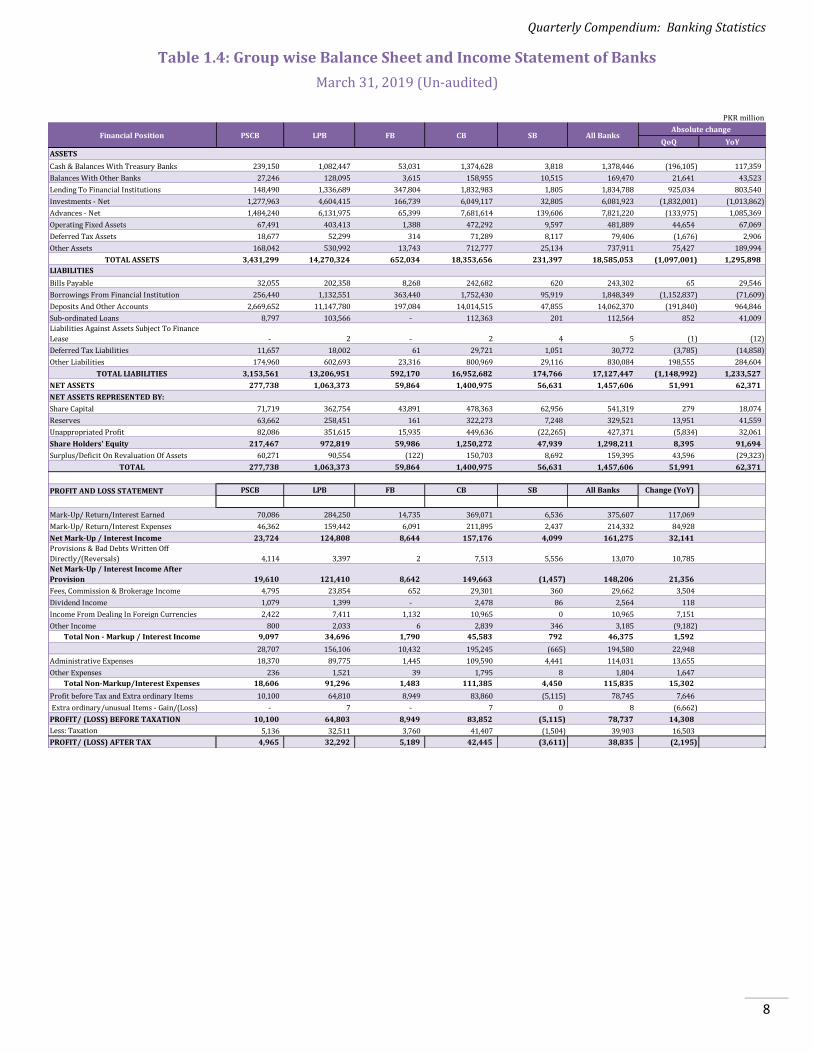
Table 1.1: Financial Soundness Indicators
Percent
CY11 CY12 CY13 Dec-14 Dec-15 Dec-16 Mar-17 Dec-17 Mar-18 Dec-18 Mar-19
CAPITAL ADEQUACY
Risk Weighted CAR^Public Sector Commercial Banks 16.5 16.7 15.4 16.8 17.1 16.5 15.2 15.3 15.3 15.5 14.4
Local Private Banks 14.4 14.9 14.4 15.2 15.7 15.4 15.3 15.1 15.4 15.7 15.8
Foreign Banks 31.3 30.7 30.2 25.0 24.4 22.5 25.9 28.4 26.5 25.5 29.3
Commercial Banks 15.3 15.6 15.0 15.7 16.1 15.7 15.4 15.3 15.6 15.9 15.9
Specialized Banks 8.9 12.3 11.6 72.0 62.2 32.5 33.2 32.2 28.1 25.5 25.4
All Banks 15.1 15.6 14.9 17.1 17.3 16.2 15.9 15.8 15.9 16.2 16.1
Tier 1 Capital to RWA^
Public Sector Commercial Banks 14.4 13.9 11.7 12.5 13.0 12.6 11.7 12.2 11.9 11.8 11.3
Local Private Banks 12.3 12.4 12.4 12.7 12.9 12.3 12.3 12.2 12.4 12.9 13.0
Foreign Banks 31.1 30.5 30.1 24.5 24.2 22.5 25.9 28.4 26.5 25.4 29.2
Commercial Banks 13.3 13.2 12.7 12.9 13.1 12.6 12.4 12.5 12.6 13.0 13.1
Specialized Banks 3.4 6.8 7.9 68.3 59.3 29.6 30.1 28.3 24.1 22.0 22.0
All Banks 13.0 13.0 12.6 14.3 14.4 13.0 12.9 12.9 12.9 13.2 13.3
Capital to Total Assets*Public Sector Commercial Banks 10.6 9.6 10.2 9.8 7.9 6.8 6.3 5.8 6.4 5.9 6.5
Local Private Banks 9.2 8.6 8.5 8.9 7.6 7.7 7.6 7.1 7.7 7.1 7.5
Foreign Banks 16.7 16.5 15.1 14.3 10.4 7.0 6.8 7.7 8.2 8.6 9.2
Commercial Banks 9.7 9.0 9.0 9.2 7.7 7.5 7.3 6.8 7.5 6.9 7.4
Specialized Banks 5.4 8.0 10.1 58.7 52.8 27.1 26.5 23.8 22.5 24.3 23.7
All Banks 9.6 9.0 9.0 10.0 8.4 7.8 7.6 7.1 7.7 7.1 7.6
ASSET QUALITY
NPLs to Total LoansPublic Sector Commercial Banks 21.1 17.3 18.7 17.8 18.3 15.9 16.1 13.4 13.5 12.7 13.3
Local Private Banks 13.8 13.2 11.4 10.4 9.3 8.1 8.0 6.8 6.6 6.2 6.4
Foreign Banks 10.4 13.4 10.1 7.6 7.8 8.3 9.3 6.6 7.0 3.8 4.1
Commercial Banks 15.3 14.2 12.9 11.9 11.1 9.7 9.6 8.1 7.9 7.5 7.8
Specialized Banks 30.1 27.6 25.4 23.3 18.9 21.8 19.5 22.0 21.2 32.9 30.6
All Banks 15.7 14.6 13.3 12.3 11.4 10.1 9.9 8.4 8.3 8.0 8.2
Provision to NPLs
Public Sector Commercial Banks 58.2 63.1 67.4 71.2 79.1 81.4 81.5 87.0 91.5 88.2 85.7
Local Private Banks 74.6 75.2 82.5 85.2 89.8 90.1 89.5 91.0 90.9 87.4 87.3
Foreign Banks 89.3 94.0 101.1 102.0 100.4 100.2 100.2 103.1 103.2 108.4 108.7
Commercial Banks 69.9 72.1 78.0 80.9 86.3 87.3 86.9 89.7 91.2 87.8 86.9
Specialized Banks 59.1 61.3 62.5 61.1 59.3 50.1 60.3 50.7 58.4 38.9 49.5
All Banks 69.3 71.5 77.1 79.8 84.9 85.0 85.4 87.2 89.2 83.8 84.1
Net NPLs to Net LoansPublic Sector Commercial Banks 10.1 7.1 7.0 5.9 4.5 3.4 3.4 2.0 1.3 1.7 2.1
Local Private Banks 3.9 3.6 2.2 1.7 1.0 0.9 0.9 0.6 0.6 0.8 0.9
Foreign Banks 1.2 0.9 -0.1 -0.2 0.0 0.0 0.0 -0.2 -0.2 -0.3 -0.4
Commercial Banks 5.1 4.4 3.2 2.5 1.7 1.4 1.4 0.9 0.8 1.0 1.1
Specialized Banks 14.9 12.9 11.3 10.5 8.7 12.2 8.8 12.2 10.0 23.1 18.2
All Banks 5.4 4.6 3.4 2.7 1.9 1.6 1.6 1.2 1.0 1.4 1.4
Net NPLs to Capital*
Public Sector Commercial Banks 41.8 34.6 30.0 22.9 19.8 17.4 19.4 11.7 7.9 11.1 14.2
Local Private Banks 17.1 15.8 9.9 6.9 4.6 4.0 4.2 3.3 3.3 4.8 4.9
Foreign Banks 1.9 1.3 -0.2 -0.3 0.0 0.0 0.0 -0.2 -0.2 -0.4 -0.4
Commercial Banks 21.6 19.0 13.7 10.0 7.3 6.2 6.4 4.6 3.9 5.6 6.2
Specialized Banks - 11.2 10.6 26.7 19.4 26.5 25.0 58.7 46.4
All Banks 23.1 20.2 14.7 10.1 7.7 7.3 7.1 5.8 4.9 7.8 7.8
Investment in Equities to Capital#
Public Sector Commercial Banks 23.3 21.9 20.5 21.6 20.8 27.6 32.5 23.4 25.8 18.6 18.4
Local Private Banks 10.7 8.2 9.6 11.9 12.2 14.6 14.0 11.3 12.2 10.7 10.8
Foreign Banks 0.1 0.0 0.0 0.0 0.0 0.0 0.0 0.0 0.0 0.0 0.0
Commercial Banks 12.6 10.6 11.3 13.4 13.5 16.5 16.6 13.0 14.0 11.6 11.6
Specialized Banks 4.6 3.3 4.8 4.1 3.1 6.2 6.6 7.6 9.6 7.1 6.2
All Banks 12.5 10.5 11.2 12.4 12.5 15.9 16.0 12.6 13.8 11.4 11.4
Gross Asset Position in Financial Derivatives to Capital^^#
Public Sector Commercial Banks 0.6 1.0 0.3 0.0 0.0 1.6 3.1 0.6
Local Private Banks 0.9 0.4 0.4 0.3 2.7 2.7 4.3 2.5
Foreign Banks 4.9 7.6 29.7 11.7 33.3 38.7 36.2 13.8
Commercial Banks 1.0 0.7 1.1 0.6 3.3 3.8 5.4 2.7
Specialized Banks 0.0 0.0 0.0 0.0 0.0 0.0 0.0 0.0
All Banks 0.9 0.6 1.0 0.5 3.2 3.6 5.2 2.6
Indicators
^ Data for Dec-13 and onwards is based on Basel III, and data from CY08 to Sep-13 is based on Basel II with the exception of IDBL,PPCBL, and SME Bank, which is based on Basel I.
* Effective from June 30, 2015, Regulatory Capital, as defined under Basel requirements, has been used to calculate Capital to Total Assets and Net NPLs to Capital Ratios (highlighted
in Red ). Prior to Jun-15, Balance Sheet Capital was used for calculation of these ratios.
# New Ratios introduced as per IMF's compilation guide on Financial Soundness Indicators (highlighted in Blue ).

Quarterly Compendium: Banking Statistics
4
Table 1.1: Financial Soundness Indicators (Continued)
Percent
CY11 CY12 CY13 Dec-14 Dec-15 Dec-16 Mar-17 Dec-17 Mar-18 Dec-18 Mar-19
ASSET QUALITY
Gross Liability Position in Financial Derivatives to Capital^^#
Public Sector Commercial Banks 1.8 0.8 0.5 0.2 -0.4 0.1 0.1 0.1
Local Private Banks 1.2 0.5 0.6 0.3 1.1 1.2 2.4 1.6Foreign Banks 14.9 15.6 37.6 13.0 15.4 21.9 8.4 3.7
Commercial Banks 1.8 0.9 1.5 0.6 1.4 1.8 2.3 1.5Specialized Banks 0.0 0.0 0.0 0.0 0.0 0.0 0.0 0.0
All Banks 1.6 0.9 1.4 0.6 1.3 1.7 2.2 1.4
EARNINGS
Return on Assets (Before Tax)Public Sector Commercial Banks 2.0 1.5 0.7 1.5 2.0 2.0 1.4 1.4 1.5 1.2 1.1Local Private Banks 2.3 2.1 1.8 2.3 2.5 2.1 2.0 1.6 1.5 1.3 1.8
Foreign Banks 2.3 0.4 1.2 2.4 4.2 2.6 2.4 2.1 2.2 2.5 5.5Commercial Banks 2.2 2.0 1.6 2.2 2.4 2.1 1.9 1.6 1.5 1.4 1.8
Specialized Banks 2.4 2.5 3.3 4.5 7.2 3.3 -0.1 1.9 -2.7 -1.3 -8.9All Banks 2.2 2.0 1.6 2.2 2.5 2.1 1.9 1.6 1.4 1.3 1.6
Return on Assets (After Tax)Public Sector Commercial Banks 1.4 1.1 0.5 1.0 1.2 1.2 0.9 0.9 0.9 0.8 0.5
Local Private Banks 1.5 1.4 1.3 1.5 1.5 1.3 1.3 0.9 1.0 0.8 0.9Foreign Banks 1.5 -0.1 0.6 1.7 2.6 1.5 1.6 1.3 1.4 1.5 3.2
Commercial Banks 1.5 1.3 1.1 1.4 1.5 1.3 1.2 0.9 1.0 0.8 0.9
Specialized Banks 1.6 1.6 2.2 3.0 4.5 2.1 0.9 1.2 -1.8 -1.0 -6.3All Banks 1.5 1.3 1.1 1.5 1.5 1.3 1.2 0.9 0.9 0.8 0.8
ROE (Avg. Equity& Surplus) (Before Tax)Public Sector Commercial Banks 18.0 15.0 6.7 15.5 19.9 23.3 16.7 18.7 20.6 17.9 15.5
Local Private Banks 24.7 24.1 21.3 27.3 28.9 24.9 24.7 20.4 19.5 18.1 24.6Foreign Banks 14.5 2.4 7.3 16.0 31.9 30.7 34.5 33.9 29.6 31.2 62.2
Commercial Banks 22.7 21.1 17.6 24.4 27.2 24.7 23.4 20.4 20.1 18.5 24.4Specialized Banks - - - 21.3 12.4 9.8 -0.2 6.0 -11.0 -5.6 -36.1
All Banks 23.0 21.2 17.9 24.3 25.8 23.9 21.7 19.5 18.5 17.4 22.0ROE (Avg. Equity &Surplus) (After Tax)
Public Sector Commercial Banks 12.2 10.8 4.9 10.2 11.8 14.4 10.6 11.7 12.8 11.7 7.6
Local Private Banks 16.1 15.9 14.7 18.1 17.5 15.0 16.0 11.8 12.5 11.0 12.2Foreign Banks 9.5 -0.4 4.0 11.4 20.2 18.2 22.5 21.0 19.0 19.1 36.1
Commercial Banks 14.9 14.0 12.2 16.2 16.4 15.0 15.1 12.0 12.8 11.5 12.4Specialized Banks - - - 14.1 7.8 6.1 2.2 3.8 -7.4 -4.3 -25.6
All Banks 15.1 14.1 12.4 16.1 15.6 14.4 14.2 11.5 11.8 10.7 10.8
NII/Gross IncomePublic Sector Commercial Banks 69.4 64.1 61.0 62.5 60.4 63.8 65.3 67.2 75.1 71.3 72.3Local Private Banks 77.9 73.2 72.3 72.8 72.3 72.0 70.7 72.3 73.2 75.5 78.2
Foreign Banks 72.2 69.0 81.0 78.2 75.4 97.2 105.2 111.5 94.5 97.2 82.8Commercial Banks 76.2 71.5 70.5 71.1 70.3 71.1 70.5 72.3 74.1 75.4 77.5
Specialized Banks 67.3 63.7 67.1 74.6 74.1 76.7 82.1 84.8 79.5 74.0 83.8
All Banks 76.0 71.3 70.4 71.3 70.4 71.2 70.9 72.7 74.3 75.4 77.7Cost/Income Ratio
Public Sector Commercial Banks 49.9 54.4 58.9 55.5 47.1 53.9 64.1 61.6 58.6 58.5 56.7Local Private Banks 50.8 52.5 56.1 52.9 48.5 53.2 54.2 56.8 57.9 60.8 57.2
Foreign Banks 59.3 75.2 76.5 53.2 32.4 34.7 28.9 31.1 29.4 31.5 14.2Commercial Banks 50.9 53.6 57.1 53.4 47.9 53.0 55.3 57.1 57.3 59.4 54.9
Specialized Banks 60.4 64.4 59.6 51.2 45.6 55.4 59.3 59.9 71.2 92.1 91.0All Banks 51.1 53.9 57.2 53.3 47.8 53.1 55.5 57.1 57.8 60.2 55.8
Indicators
^^ Based on un-audited quarterly numbers only.
# New Ratios introduced as per IMF's compilation guide on Financial Soundness Indicators (highlighted in Blue ).

Quarterly Compendium: Banking Statistics
5
Table 1.1: Financial Soundness Indicators (Continued)
Percent
CY11 CY12 CY13 Dec-14 Dec-15 Dec-16 Dec-17 Mar-18 Dec-18 Mar-19
EARNINGS
Trading Income to Gross Income#
Public Sector Commercial Banks 4.1 6.2 7.3 10.9 18.7 13.9 8.2 3.4 1.5 -1.5
Local Private Banks 1.1 1.7 3.1 4.7 7.9 7.7 5.6 5.4 2.2 0.1
Foreign Banks 4.1 7.1 0.8 1.9 15.4 12.1 0.5 0.3 0.3 0.0
Commercial Banks 1.7 2.7 3.8 5.7 10.0 8.9 5.9 4.9 2.0 -0.2
Specialized Banks 0.0 0.0 0.1 1.0 1.6 1.0 0.3 0.0 0.0 0.0
All Banks 1.7 2.6 3.7 5.5 9.7 8.6 5.8 4.7 2.0 -0.2
Personnel Expenses to Non-interest Expenses#
Public Sector Commercial Banks 60.6 59.1 55.8 53.9 52.2 53.6 50.8 51.7 50.0 52.4
Local Private Banks 43.3 43.6 44.4 42.8 42.6 42.9 42.7 41.6 41.0 40.8
Foreign Banks 39.3 36.4 41.2 45.9 40.6 37.9 43.8 33.2 42.7 37.8
Commercial Banks 45.9 46.0 46.3 44.9 44.2 44.8 44.3 43.3 42.7 42.7
Specialized Banks 78.5 68.0 68.0 74.3 69.5 68.5 77.3 63.4 62.2 58.9
All Banks 46.8 46.7 47.1 45.8 45.1 45.5 45.2 44.1 43.3 43.3
LIQUIDITY
Liquid Assets/Total Assets
Public Sector Commercial Banks 40.9 38.0 41.3 44.0 48.6 51.2 55.2 50.3 50.7 43.9
Local Private Banks 46.2 50.7 50.0 50.5 55.0 53.8 52.7 48.3 47.1 44.2
Foreign Banks 68.6 69.4 73.0 70.7 82.0 88.3 89.3 89.1 84.8 86.5
Commercial Banks 45.9 48.7 49.0 49.6 54.3 54.2 54.3 50.0 49.0 45.6
Specialized Banks 23.5 23.5 25.1 22.5 20.8 27.3 34.3 27.3 19.4 18.1
All Banks 45.5 48.3 48.6 49.2 53.8 53.7 54.0 49.7 48.7 45.3
Liquid Assets/Total DepositsPublic Sector Commercial Banks 51.3 49.5 51.2 58.6 61.4 63.2 75.0 64.4 67.0 56.4
Local Private Banks 59.5 66.5 61.7 64.2 74.3 71.6 72.3 61.9 63.4 56.6
Foreign Banks 104.3 107.9 127.4 156.7 202.1 234.6 293.8 285.1 286.3 286.1
Commercial Banks 59.1 64.1 60.9 64.2 73.1 72.0 75.8 65.4 67.2 59.8
Specialized Banks 202.0 211.5 202.3 125.2 100.3 97.1 124.8 101.7 88.6 87.5
All Banks 59.5 64.4 61.3 64.5 73.3 72.1 76.1 65.6 67.2 59.8
Liquid Assets/Short term Liabilities^^#
Public Sector Commercial Banks 46.6 42.4 60.7 69.4 79.8 82.3 84.0 81.9 80.1 72.3
Local Private Banks 88.1 95.1 100.5 97.7 107.2 117.0 109.9 111.1 99.9 98.6
Foreign Banks 130.9 122.2 117.5 100.9 107.4 112.0 109.8 109.6 104.2 108.1
Commercial Banks 77.7 81.3 91.8 91.3 101.5 108.6 103.5 103.9 95.3 93.1
Specialized Banks 34.0 36.8 40.1 60.7 51.8 41.6 68.3 57.3 48.0 44.1
All Banks 76.8 80.5 90.7 91.0 100.9 107.2 103.0 103.2 94.9 92.6
Advances/DepositsPublic Sector Commercial Banks 55.2 60.7 54.5 51.1 44.1 43.1 46.5 48.8 51.2 55.6
Local Private Banks 52.0 48.9 47.1 46.0 45.6 46.7 50.3 51.5 56.3 55.0
Foreign Banks 39.6 37.4 36.8 53.7 35.4 22.2 24.0 21.7 36.8 33.2
Commercial Banks 52.3 51.0 48.3 47.1 45.2 45.6 49.2 50.5 55.0 54.8
Specialized Banks 540.1 556.9 488.9 346.2 311.9 210.6 187.7 208.2 282.0 291.7
All Banks 53.6 52.2 49.5 48.2 46.4 46.6 50.1 51.4 55.8 55.6
Customer Deposits to Total Loans#
Public Sector Commercial Banks 139.4 130.2 145.0 153.5 183.1 182.8 168.7 166.3 154.3 148.1
Local Private Banks 169.0 182.2 191.2 193.7 192.9 190.6 178.4 174.6 160.3 164.2
Foreign Banks 225.1 229.7 240.4 169.6 256.3 410.0 384.5 422.3 256.8 281.9
Commercial Banks 163.8 170.8 181.7 184.8 191.4 190.3 177.8 174.4 160.0 161.9
Specialized Banks 14.7 15.1 17.9 24.3 28.0 41.9 46.9 41.8 30.6 28.8
All Banks 159.2 166.4 177.2 180.2 186.5 186.2 174.6 171.2 157.4 159.3
Indicators
^^ Based on un-audited quarterly numbers only.
# New Ratios introduced as per IMF's compilation guide on Financial Soundness Indicators (highlighted in Blue ).

Quarterly Compendium: Banking Statistics
6
Table 1.1: Financial Soundness Indicators (Continued)
Dec-11 Dec-12 Dec-13 Dec-14 Dec-15 Dec-16 Dec-17 Mar-18 Dec-18 Mar-19
SECTORAL DISTRIBUTION OF LOANS
Domestic Loans to Total Loans#
Public Sector Commercial Banks 92.3 92.4 92.7 93.7 94.0 95.0 94.5 94.6 94.6 95.0
Local Private Banks 92.9 92.2 90.7 91.2 91.2 91.4 92.9 93.5 93.6 93.5
Foreign Banks 100.0 100.0 100.0 100.0 100.0 100.0 100.0 100.0 100.0 100.0
Commercial Banks 92.9 92.4 91.3 91.9 91.9 92.2 93.2 93.7 93.9 93.9
Specialized Banks 100.0 100.0 100.0 100.0 100.0 100.0 100.0 100.0 100.0 100.0
All Banks 93.2 92.6 91.6 92.1 92.1 92.4 93.4 93.9 94.0 94.0
Public Sector Domestic Loans to Total Loans#
Public Sector Commercial Banks 19.4 25.8 24.8 27.9 25.5 28.5 29.6 29.6 29.9 28.8
Local Private Banks 12.2 18.0 18.0 19.8 20.7 20.2 21.6 22.5 23.2 21.5
Foreign Banks 1.5 4.1 3.5 1.3 0.0 0.0 0.0 0.0 0.0 0.0
Commercial Banks 13.6 19.6 19.3 21.3 21.5 21.8 23.1 23.8 24.3 22.8
Specialized Banks 0.4 0.3 0.4 0.2 0.2 0.2 0.7 0.6 0.7 0.6
All Banks 13.2 19.1 18.7 20.7 20.8 21.2 22.5 23.2 23.9 22.3
Domestic Loans to Fiancial Institutions/Total Loans#
Public Sector Commercial Banks 0.7 0.8 0.7 0.8 0.7 0.8 0.9
Local Private Banks 1.3 1.5 1.9 1.5 1.5 1.6 1.8
Foreign Banks 0.0 0.3 0.4 0.3 0.4 0.0 0.0
Commercial Banks 1.1 1.4 1.7 1.4 1.3 1.4 1.6
Specialized Banks 0.1 0.1 0.1 0.1 0.1 0.1 0.1
All Banks 1.1 1.3 1.6 1.3 1.3 1.4 1.6
Corporate & SME Sector Domestic Loans to Total Loans#
Public Sector Commercial Banks 54.3 46.3 45.4 43.1 45.6 49.4 49.2 49.5 50.3 51.5
Local Private Banks 68.8 62.8 62.0 61.3 60.6 60.8 60.6 59.9 59.7 60.6
Foreign Banks 80.0 81.4 81.6 94.1 97.8 97.6 98.3 98.3 98.9 99.0
Commercial Banks 65.9 59.2 58.6 57.8 57.9 58.7 58.6 58.1 58.2 59.1
Specialized Banks 11.7 11.5 10.9 9.9 8.4 8.0 7.6 7.4 7.6 7.7
All Banks 64.2 57.8 57.3 56.5 56.4 57.3 57.3 56.9 57.2 58.1
Other Domestic Loans to Total Loans#
Public Sector Commercial Banks 22.0 22.1 16.3 14.9 14.7 13.5 13.8
Local Private Banks 8.9 8.5 8.4 9.1 9.6 9.2 9.6
Foreign Banks 4.6 1.8 2.0 1.3 1.3 1.1 1.0
Commercial Banks 11.6 11.1 10.0 10.2 10.6 10.0 10.4
Specialized Banks 89.8 91.3 91.7 91.7 91.9 91.6 91.5
All Banks 13.8 13.5 12.3 12.2 12.5 11.6 12.0
Overseas Loans to Total Loans#
Public Sector Commercial Banks 7.7 7.6 7.3 6.3 6.0 5.0 5.5 5.4 5.4 5.0
Local Private Banks 7.1 7.8 9.3 8.8 8.8 8.6 7.1 6.5 6.4 6.5
Foreign Banks 0.0 0.0 0.0 0.0 0.0 0.0 0.0 0.0 0.0 0.0
Commercial Banks 7.1 7.6 8.7 8.1 8.1 7.8 6.8 6.3 6.1 6.1
Specialized Banks 0.0 0.0 0.0 0.0 0.0 0.0 0.0 0.0 0.0 0.0
All Banks 6.8 7.4 8.4 7.9 7.9 7.6 6.6 6.1 6.0 6.0
Foreign Currency Loans to Total Loans#
Public Sector Commercial Banks 8.6 8.5 8.4 7.1 6.9 5.2 5.7 5.5 4.7 5.1
Local Private Banks 11.5 11.3 14.6 15.1 13.3 12.8 9.7 9.2 8.3 8.2
Foreign Banks 13.0 8.0 15.0 3.2 0.4 0.2 0.2 0.2 0.5 0.5
Commercial Banks 10.9 10.6 13.2 13.3 11.9 11.2 8.9 8.4 7.5 7.5
Specialized Banks 0.0 0.0 0.0 0.0 0.0 0.0 0.0 0.0 0.0 0.0
All Banks 10.6 10.3 12.9 12.9 11.5 10.9 8.7 8.2 7.4 7.3
Foreign Currency Liabilities to Total Liabilities#
Public Sector Commercial Banks 13.0 13.1 7.9 7.0 8.7 4.6 3.7 4.6 5.1 5.2
Local Private Banks 12.8 12.9 15.5 14.4 13.2 12.4 11.9 13.0 12.8 13.8
Foreign Banks 19.6 22.0 33.6 38.2 50.3 58.4 64.8 63.7 68.0 65.0
Commercial Banks 13.0 13.2 14.5 13.4 13.1 12.1 11.9 13.0 13.0 14.0
Specialized Banks 0.0 0.0 0.0 0.0 0.0 0.0 0.0 0.0 0.0 0.0
All Banks 12.8 12.9 14.3 13.3 13.0 11.9 11.8 12.9 12.9 13.8
Residential Real Estate Loans to Total Loans - All Banks#~4.0 3.4 3.9 1.5 3.1 2.7 2.2 2.7
Commercial Real Estate Loans to Total Loans - All Banks#~10.1 8.6 8.9 9.2 9.2 9.6 9.1 9.7
Spread between lending and deposit rates - All Banks#$603 524 505 485 472 512 566
Spread between highest and lowest interbank rates - All Banks#&350 165 55 70 145 135 330
Indicators
basis points
& Interbank rates are taken from DMMD's daily publication of interbank call money rates (O/N maturity).
~ Real Estate numbers are taken from Table 3.11 of Statistical Bulletin.
# New Ratios introduced as per IMF's compilation guide on Financial Soundness Indicators (highlighted in Blue ).
$ Lending and deposit rates are taken from Table 3.31 of Statistical Bulletin, wherein Lending rates are for outstanding loans (including zero mark up and excluding interbank),
and Deposit rates are for outstanding deposits (including zero mark up and excluding interbank).
Quarterly Compendium: Banking Statistics
7
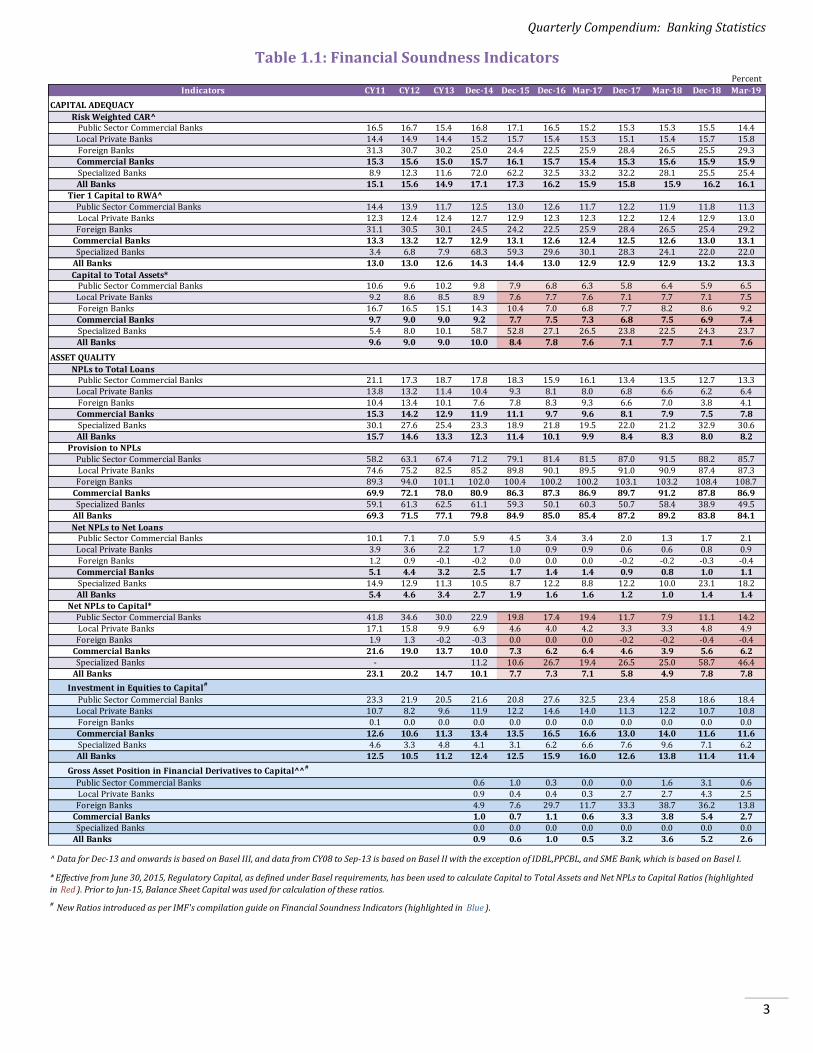
Statistics of the Banking System:
Table 1.2: Key variables of Balance Sheet and Profit & Loss Statement
Table 1.3: Growth Rates of Key Variables and Key Financial Soundness Indicators
PKR billion
CY11 CY12 CY13 Dec-14 Dec-15 Dec-16 Dec-17 Mar-18 Dec-18 Mar-19
Total Assets 8,171 9,720 10,487 12,106 14,143 15,831 18,342 17,289 19,682 18,585
Investments (net) 3,055 4,013 4,313 5,310 6,881 7,509 8,729 7,096 7,914 6,082
Advances (net) 3,349 3,805 4,110 4,447 4,816 5,499 6,512 6,736 7,955 7,821
Borrowings 675 1,033 723 1,001 1,766 1,942 3,125 1,920 3,001 1,848
Deposits 6,244 7,291 8,311 9,230 10,389 11,798 13,012 13,098 14,254 14,062
Liabilities 7,386 8,848 9,544 10,899 12,820 14,478 16,961 15,894 18,276 17,127
Paid up Capital 449 463 482 587 620 580 516 523 541 541
Equity 784 873 943 1,207 1,323 1,353 1,381 1,395 1,406 1,458
Profit Before Tax (ytd) 170 176 162 247 329 314 267 64 243 79
Profit After Tax (ytd) 112 117 112 163 199 190 158 41 149 39
Provisioning Charges (ytd) 50 43 40 25 39 5 4 2 36 13
Non-Performing Loans 592 618 607 605 605 605 593 600 680 690
Provisions Held Against NPLs 411 442 469 483 514 514 517 535 570 581
Non-Performing Loans (net) 182 176 139 122 91 90 76 65 110 110
Percent
CY11 CY12 CY13
Growth Rates YoY YoY YoY YoY YoY YoY QoQ YoY QoQ YoY QoQ YoY QoQ YoY
Assets 14.8 19.0 7.9 14.9 16.8 11.9 4.5 15.9 (5.7) 7.0 8.6 7.3 (5.6) 7.5
Investments (Net) 41.6 31.4 7.5 23.3 29.6 9.1 1.5 16.2 (18.7) (11.3) 14.0 (9.3) (23.1) (14.3)
Advances (Net) (0.3) 12.9 8.0 9.9 8.3 14.2 6.9 18.4 3.4 20.2 7.2 22.2 (1.7) 16.1
Borrowings (17.7) 25.4 53.0 38.4 76.4 10.0 9.8 60.9 (38.6) (12.1) 35.1 (4.0) (38.4) (3.7)
Deposits 14.5 16.8 14.0 11.0 12.6 13.6 3.2 10.3 0.7 10.9 4.8 9.5 (1.3) 7.4
Liabilities 15.0 19.8 7.9 13.5 17.6 12.9 4.6 17.1 (6.3) 7.8 9.3 7.8 (6.3) 7.8
Paid up Capital 25.3 3.2 4.1 22.0 5.6 (6.4) 1.6 (11.0) 1.4 (19.4) 2.3 4.9 0.1 3.5
Equity 12.9 11.3 8.0 28.6 9.6 2.3 2.7 2.1 1.0 (0.7) 0.2 1.8 3.7 4.5
KEY FSIs:
Capital Adequacy Ratio 15.1 15.6 14.9
Capital to Total Assets* 9.6 9.0 9.0
NPLs to Loans (Gross) 15.7 14.6 13.3
Net NPLs to Net Loans 5.4 4.6 3.4
ROA (Before Tax) 2.2 2.0 1.6
ROE^ (Before Tax) 23.0 21.2 17.9
Liquid Assets/ Total Deposits 59.5 64.4 61.3
Advances to Deposit Ratio 53.6 52.2 49.5
Mar-19
16.1
7.6
8.2
1.4
1.6
22.0
59.8
55.6
Dec-18
16.2
7.1
8.0
1.4
1.3
17.4
67.2
55.8
^ Based on Average Equity plus Surplus on Revaluation.
* Effective from June 30, 2015, Regulatory Capital, as defined under Basel requirements, has been used to calculate Capital to Total Assets Ratio
(highlighted in Red ). Prior to Jun-15, Balance Sheet Capital was used for calculation of this ratio.
25.8
2.1
50.1
8.4
76.1 65.6
1.9
2.5
8.4
46.4
73.364.5
48.2
24.3
10.0
12.3
2.7
2.2
11.4
46.6
23.9
72.1
1.6
Dec-16
1.2
1.6
19.5
15.9
7.7
8.3
1.0
1.4
18.5
51.4
15.8
7.1
17.317.1
Dec-15
16.2
7.8
10.1
Dec-14 Mar-18Dec-17
Quarterly Compendium: Banking Statistics
8
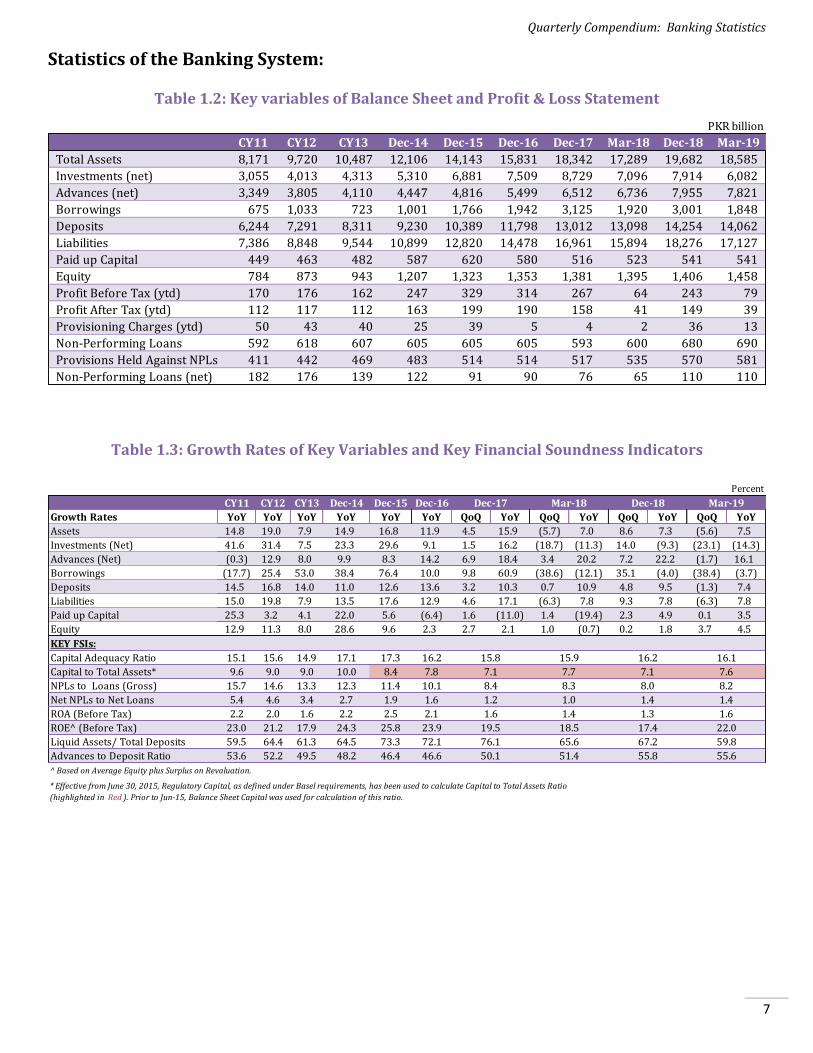
Table 1.4: Group wise Balance Sheet and Income Statement of Banks
March 31, 2019 (Un-audited)
PKR million
QoQ YoY
ASSETS
Cash & Balances With Treasury Banks 239,150 1,082,447 53,031 1,374,628 3,818 1,378,446 (196,105) 117,359
Balances With Other Banks 27,246 128,095 3,615 158,955 10,515 169,470 21,641 43,523
Lending To Financial Institutions 148,490 1,336,689 347,804 1,832,983 1,805 1,834,788 925,034 803,540
Investments - Net 1,277,963 4,604,415 166,739 6,049,117 32,805 6,081,923 (1,832,001) (1,013,862)
Advances - Net 1,484,240 6,131,975 65,399 7,681,614 139,606 7,821,220 (133,975) 1,085,369
Operating Fixed Assets 67,491 403,413 1,388 472,292 9,597 481,889 44,654 67,069
Deferred Tax Assets 18,677 52,299 314 71,289 8,117 79,406 (1,676) 2,906
Other Assets 168,042 530,992 13,743 712,777 25,134 737,911 75,427 189,994
TOTAL ASSETS 3,431,299 14,270,324 652,034 18,353,656 231,397 18,585,053 (1,097,001) 1,295,898
LIABILITIES
Bills Payable 32,055 202,358 8,268 242,682 620 243,302 65 29,546
Borrowings From Financial Institution 256,440 1,132,551 363,440 1,752,430 95,919 1,848,349 (1,152,837) (71,609)
Deposits And Other Accounts 2,669,652 11,147,780 197,084 14,014,515 47,855 14,062,370 (191,840) 964,846
Sub-ordinated Loans 8,797 103,566 - 112,363 201 112,564 852 41,009
Liabilities Against Assets Subject To Finance
Lease - 2 - 2 4 5 (1) (12)
Deferred Tax Liabilities 11,657 18,002 61 29,721 1,051 30,772 (3,785) (14,858)
Other Liabilities 174,960 602,693 23,316 800,969 29,116 830,084 198,555 284,604
TOTAL LIABILITIES 3,153,561 13,206,951 592,170 16,952,682 174,766 17,127,447 (1,148,992) 1,233,527
NET ASSETS 277,738 1,063,373 59,864 1,400,975 56,631 1,457,606 51,991 62,371
NET ASSETS REPRESENTED BY:
Share Capital 71,719 362,754 43,891 478,363 62,956 541,319 279 18,074
Reserves 63,662 258,451 161 322,273 7,248 329,521 13,951 41,559
Unappropriated Profit 82,086 351,615 15,935 449,636 (22,265) 427,371 (5,834) 32,061
Share Holders' Equity 217,467 972,819 59,986 1,250,272 47,939 1,298,211 8,395 91,694
Surplus/Deficit On Revaluation Of Assets 60,271 90,554 (122) 150,703 8,692 159,395 43,596 (29,323)
TOTAL 277,738 1,063,373 59,864 1,400,975 56,631 1,457,606 51,991 62,371
PROFIT AND LOSS STATEMENT PSCB LPB FB CB SB All Banks Change (YoY)
Mark-Up/ Return/Interest Earned 70,086 284,250 14,735 369,071 6,536 375,607 117,069
Mark-Up/ Return/Interest Expenses 46,362 159,442 6,091 211,895 2,437 214,332 84,928
Net Mark-Up / Interest Income 23,724 124,808 8,644 157,176 4,099 161,275 32,141
Provisions & Bad Debts Written Off
Directly/(Reversals) 4,114 3,397 2 7,513 5,556 13,070 10,785
Net Mark-Up / Interest Income After
Provision 19,610 121,410 8,642 149,663 (1,457) 148,206 21,356
Fees, Commission & Brokerage Income 4,795 23,854 652 29,301 360 29,662 3,504
Dividend Income 1,079 1,399 - 2,478 86 2,564 118
Income From Dealing In Foreign Currencies 2,422 7,411 1,132 10,965 0 10,965 7,151
Other Income 800 2,033 6 2,839 346 3,185 (9,182)
Total Non - Markup / Interest Income 9,097 34,696 1,790 45,583 792 46,375 1,592
28,707 156,106 10,432 195,245 (665) 194,580 22,948
Administrative Expenses 18,370 89,775 1,445 109,590 4,441 114,031 13,655
Other Expenses 236 1,521 39 1,795 8 1,804 1,647
Total Non-Markup/Interest Expenses 18,606 91,296 1,483 111,385 4,450 115,835 15,302
Profit before Tax and Extra ordinary Items 10,100 64,810 8,949 83,860 (5,115) 78,745 7,646
Extra ordinary/unusual Items - Gain/(Loss) - 7 - 7 0 8 (6,662)
PROFIT/ (LOSS) BEFORE TAXATION 10,100 64,803 8,949 83,852 (5,115) 78,737 14,308
Less: Taxation 5,136 32,511 3,760 41,407 (1,504) 39,903 16,503
PROFIT/ (LOSS) AFTER TAX 4,965 32,292 5,189 42,445 (3,611) 38,835 (2,195)
Financial Position PSCBAbsolute change
All BanksSBCBFBLPB

Quarterly Compendium: Banking Statistics
9
Table 1.5: Banks’ Group-wise Key Variables
Public Sector Commercial BanksPKR million
CY11 CY12 CY13 Dec-14 Dec-15 Dec-16 Dec-17 Mar-18 Dec-18 Mar-19
Total Assets 1,562,858 1,838,614 1,921,003 2,330,411 2,547,768 2,964,222 3,522,612 3,247,498 3,837,894 3,431,299
Investments (net of Provisions) 479,609 588,623 619,522 850,795 1,174,246 1,314,431 1,808,314 1,491,897 1,650,995 1,277,963
Advances (net of Provision) 689,423 858,633 843,984 893,321 889,248 1,035,158 1,205,899 1,237,217 1,486,100 1,484,240
Borrowings 74,791 152,076 76,763 146,058 126,224 123,006 517,585 304,569 496,014 256,440
Deposits 1,248,199 1,413,501 1,549,011 1,746,666 2,017,464 2,404,246 2,593,404 2,534,077 2,904,443 2,669,652
Liabilities 1,396,686 1,661,450 1,725,717 2,100,909 2,318,532 2,721,154 3,276,557 3,000,641 3,593,490 3,153,561
Paid up Capital 41,414 44,284 53,320 59,323 59,723 60,333 71,719 71,719 71,719 71,719
Equity 166,172 177,165 195,286 229,502 229,236 243,068 246,055 246,857 244,404 277,738
Profit bofore tax 29,359 25,735 12,479 31,917 46,127 53,320 44,764 12,707 44,399 10,100
Profit after tax 19,833 18,589 9,051 20,957 27,440 32,944 28,098 7,866 28,971 4,965
Provisioning Charges (ytd) 7,518 10,661 20,007 11,325 17,793 504 176 (902) 8,566 4,114
Non-Performing Loans 166,289 166,353 180,240 182,324 190,068 189,091 182,998 190,084 213,436 222,462
Provisions Held Against NPLs 96,840 105,020 121,565 129,824 150,256 153,980 159,255 173,871 188,264 190,607
Non-Performing Loans (net) 69,448 61,333 58,675 52,500 39,812 35,111 23,743 16,213 25,172 31,855
Local Private BanksPKR million
CY11 CY12 CY13 Dec-14 Dec-15 Dec-16 Dec-17 Mar-18 Dec-18 Mar-19
Total Assets 6,203,471 7,475,118 8,126,906 9,344,252 11,115,696 12,226,024 13,965,227 13,212,140 14,955,230 14,270,324
Investments (net of Provisions) 2,442,332 3,312,692 3,545,229 4,297,707 5,506,645 5,872,902 6,546,931 5,315,451 5,974,808 4,604,415
Advances (net of Provision) 2,499,799 2,788,332 3,104,573 3,376,319 3,747,469 4,283,219 5,112,744 5,308,800 6,250,768 6,131,975
Borrowings 501,116 777,546 510,010 750,014 1,495,745 1,544,678 2,172,288 1,205,001 2,035,527 1,132,551
Deposits 4,810,209 5,700,887 6,588,746 7,340,944 8,220,517 9,176,308 10,167,561 10,316,309 11,104,811 11,147,780
Liabilities 5,635,806 6,833,231 7,436,911 8,513,972 10,166,781 11,213,676 12,942,394 12,172,739 13,908,900 13,206,951
Paid up Capital 309,306 362,096 371,075 388,493 435,677 438,602 356,922 358,122 362,833 362,754
Equity 567,665 641,868 689,995 830,280 948,915 1,012,348 1,022,833 1,039,401 1,046,331 1,063,373
Profit bofore tax 131,451 145,438 141,587 200,556 258,376 244,954 206,706 50,347 187,165 64,803
Profit after tax 85,716 95,831 98,168 132,859 156,250 147,499 120,222 32,276 114,287 32,292
Provisioning Charges (ytd) 40,966 28,824 19,291 12,706 22,113 3,207 1,048 (163) 22,669 3,397
Non-Performing Loans 383,517 409,931 388,949 385,075 382,042 376,391 368,709 370,735 407,880 414,644
Provisions Held Against NPLs 287,504 308,406 320,691 328,097 342,999 339,172 335,500 337,088 356,661 362,132
Non-Performing Loans (net) 96,013 101,525 68,259 56,978 39,043 37,219 33,208 33,646 51,219 52,511
Foreign BanksPKR million
CY11 CY12 CY13 Dec-14 Dec-15 Dec-16 Dec-17 Mar-18 Dec-18 Mar-19
Total Assets 255,274 246,715 263,787 238,346 260,906 390,804 556,290 557,330 650,143 652,034
Investments (net of Provisions) 113,382 85,519 120,714 126,977 173,356 276,805 293,127 219,328 249,859 166,739
Advances (net of Provision) 66,411 59,322 55,536 57,688 37,538 32,585 40,555 37,807 70,923 65,399
Borrowings 21,464 23,816 51,550 76,235 108,506 188,783 320,013 305,996 373,035 363,440
Deposits 167,870 158,799 151,077 107,509 105,892 147,092 169,161 174,114 192,689 197,084
Liabilities 212,744 205,977 223,974 204,191 233,757 363,327 518,993 511,846 594,947 592,170
Paid up Capital 38,720 41,149 42,344 32,893 18,117 17,989 24,414 30,446 43,532 43,891
Equity 42,530 40,738 39,823 34,155 27,149 27,477 37,297 45,484 55,196 59,864
Profit bofore tax 5,601 999 2,945 6,193 10,210 8,366 10,547 3,059 14,642 8,949
Profit after tax 3,660 (174) 1,605 4,401 6,488 4,954 6,527 1,968 8,946 5,189
Provisioning Charges (ytd) 1,303 1,902 (210) (141) (510) (98) 16 (57) 87 2
Non-Performing Loans 7,600 9,097 6,235 4,756 3,167 2,963 2,895 2,838 2,840 2,830
Provisions Held Against NPLs 6,804 8,550 6,306 4,849 3,178 2,971 2,986 2,929 3,079 3,076
Non-Performing Loans (net) 796 547 (71) (93) (11) (7) (91) (91) (239) (246)
Specialized BanksPKR million
CY11 CY12 CY13 Dec-14 Dec-15 Dec-16 Dec-17 Mar-18 Dec-18 Mar-19
Total Assets 149,169 159,742 174,998 193,252 218,864 250,007 297,415 272,187 238,787 231,397
Investments (net of Provisions) 19,546 26,430 27,859 34,150 26,517 45,027 80,648 69,108 38,262 32,805
Advances (net of Provision) 93,585 98,785 106,065 119,972 141,572 147,852 153,287 152,027 147,403 139,606
Borrowings 77,881 79,753 84,320 29,141 35,670 85,991 115,545 104,392 96,610 95,919
Deposits 17,327 17,738 21,695 34,655 45,388 70,221 81,653 73,024 52,268 47,855
Liabilities 141,179 146,942 157,322 79,744 101,398 180,104 222,811 208,695 179,102 174,766
Paid up Capital 15,508 15,508 15,351 106,344 106,344 62,958 62,958 62,958 62,956 62,956
Equity 7,990 12,801 17,676 113,508 117,467 69,903 74,604 63,492 59,685 56,631
Profit bofore tax 3,518 3,811 5,441 7,873 14,103 7,390 4,762 (1,683) (3,673) (5,115)
Profit after tax 2,388 2,486 3,609 5,151 8,827 4,516 2,945 (1,080) (2,864) (3,611)
Provisioning Charges (ytd) 578 1,248 1,074 1,433 (523) 1,692 2,465 3,407 4,879 5,556
Non-Performing Loans 34,252 32,845 31,985 32,543 30,167 36,220 37,945 36,703 55,587 50,317
Provisions Held Against NPLs 20,244 20,135 19,995 19,886 17,878 18,144 19,223 21,438 21,609 24,887
Non-Performing Loans (net) 14,009 12,709 11,991 12,657 12,288 18,076 18,722 15,265 33,979 25,430

Quarterly Compendium: Banking Statistics
10
Table 1.6: Concentration in the Banking System
March 31, 2019 (Un-audited)
Percent
Top 5 Banks 6-10 Banks 11-20 Banks 21-25 Banks FBs SBs Industry
Asset
Share of Total Assets 50.2 23.0 19.5 2.5 3.5 1.2 100
Share of Total Investments 57.7 21.2 16.2 1.7 2.7 0.5 100
of which investment in Government Securities 85.5 85.2 78.3 59.0 99.9 77.6 84
Advances
Advances:public 55.3 21.6 22.1 1.0 0.0 0.1 100.0
Advances:private 42.4 26.6 23.4 4.1 1.1 2.5 100.0
Sectoral Distribution of Loans
Corporate Sector 45.6 26.8 22.9 3.6 1.1 0.1 100.0
SMEs 37.4 28.3 26.8 5.6 0.0 2.0 100.0
Agriculture 36.0 9.0 8.0 1.4 0.0 45.7 100.0
Consumer Finance 39.5 22.7 33.4 4.4 0.0 0.0 100.0
Commodity Financing 45.0 27.8 25.6 1.5 0.0 0.1 100.0
Staff Loans 54.1 18.5 21.0 4.3 0.4 1.7 100.0
Others 97.1 2.5 0.2 0.1 0.0 0.1 100.0
Total 45.3 25.4 23.1 3.4 0.8 2.0 100.0
NPLs / Gross Loans 9.1 4.5 7.6 16.2 4.1 30.6 8.2
Net NPLs / Capital 3.6 0.4 15.6 65.6 -0.4 46.4 7.8
Liabilities
Share of Total Deposits 51.5 24.3 19.9 2.4 1.4 0.3 100.0
Customer Fixed Deposits 40.5 30.2 23.6 2.6 2.2 1.0 100.0
Customer CASA 54.6 23.1 18.6 2.3 1.2 0.2 100.0
Customer Deposits others 25.7 43.2 24.7 1.8 4.4 0.2 100.0
Financial Institutions Remunerative Deposits 41.6 20.3 32.6 5.2 0.2 0.1 100.0
Financial Institutions Non-Remunerative Deposits 88.5 4.1 5.5 0.6 1.3 0.0 100.0
Capital Adequacy
Capital/RWA (Capital Adequacy Ratio) 17.3 14.4 13.7 8.9 29.3 25.4 16.1
Tier 1 Capital / RWA 13.8 11.8 11.6 8.1 29.2 22.0 13.3
Capital / Total Assets 7.9 6.5 6.8 5.9 9.2 23.7 7.6
Share of Risk Weighted Assets 48.9 22.1 20.7 3.6 2.3 2.5 100.0
Earning & Profitability
Profit/Loss (Before Tax) 52.1 28.7 16.9 -2.6 11.4 -6.5 100.0
Net Interest Income / Gross Income 74.6 82.4 77.3 78.5 82.8 83.8 77.7
Non-Interest Expense / Gross Income 56.6 51.6 60.1 106.9 14.2 91.0 55.8
Provision Expense to Gross Income 2.3 3.0 5.2 40.5 0.0 113.6 6.3
Liquidity
Liquid Assets / Total Assets 50.1 40.5 35.6 24.0 86.5 18.1 45.3
Liquid Assets / Total Deposits 64.5 50.5 46.1 32.8 286.1 87.5 59.8
Advances to deposits ratio 48.1 59.6 65.2 75.6 33.2 291.7 55.6
Indicators

Quarterly Compendium: Banking Statistics
11
Deposits:
Table 1.7a: Total Deposits by Category & Currency
Table 1.7b: Domestic Deposits by Category & Currency
PKR billion
CY11 CY12 CY13 CY14 CY15 CY16 CY17 Mar-18 Dec-18 Mar-19
DEPOSITS 6,244 7,291 8,311 9,230 10,389 11,798 13,012 13,098 14,254 14,062
Customers 5,961 6,970 7,975 8,886 9,943 11,199 12,270 12,448 13,417 13,383
Fixed Deposits 1,941 2,078 2,216 2,268 2,425 2,670 2,841 2,707 2,974 2,944
Saving Deposits 2,137 2,642 3,094 3,467 3,863 4,342 4,699 4,834 5,043 5,138
Current accounts - Remunerative 206 343 381 323 331 409 480 551 561 544
Current accounts - Non-remunerative 1,640 1,867 2,241 2,764 3,254 3,685 4,095 4,199 4,691 4,618
Others 37 41 43 64 69 92 155 157 146 139
Financial Institutions 283 321 336 344 446 599 741 650 837 679
Remunerative Deposits 187 214 217 201 393 385 458 452 471 442
Non-remunerative Deposits 96 107 119 143 53 214 284 198 367 237
Break up of Deposits Currecy Wise 6,244 7,291 8,311 9,230 10,389 11,798 13,012 13,098 14,254 14,062
Local Currency Deposits 5,399 6,308 7,129 7,983 9,042 10,548 11,591 11,670 12,600 12,372
Foreign Currency Deposits 844 983 1,182 1,247 1,347 1,249 1,421 1,428 1,655 1,690
PKR billion
CY11 CY12 CY13 CY14 CY15 CY16 CY17 Mar-18 Dec-18 Mar-19
DEPOSITS 5,868 6,848 7,808 8,672 9,748 11,172 12,418 12,562 13,648 13,461
Customers 5,660 6,611 7,524 8,403 9,426 10,619 11,731 11,945 12,846 12,817
Fixed Deposits 1,785 1,894 1,984 2,037 2,173 2,393 2,560 2,439 2,663 2,651
Saving Deposits 2,120 2,610 3,048 3,405 3,803 4,275 4,636 4,780 4,988 5,080
Current accounts - Remunerative 171 213 245 313 324 401 476 546 555 538
Current accounts - Non-remunerative 1,547 1,851 2,203 2,590 3,063 3,467 3,912 4,033 4,507 4,422
Others 36 42 43 58 63 83 147 148 133 125
Financial Institutions 209 237 284 269 322 552 687 617 801 644
Remunerative Deposits 117 135 173 139 282 346 414 425 440 415
Non-remunerative Deposits 92 102 111 130 41 206 273 191 361 229
Break up of Deposits Currecy Wise 5,868 6,848 7,808 8,672 9,748 11,172 12,418 12,562 13,648 13,461
Local Currency Deposits 5,396 6,296 7,128 7,982 9,039 10,544 11,584 11,668 12,598 12,370
Foreign Currency Deposits 472 552 671 690 709 627 834 894 1,050 1,091

Quarterly Compendium: Banking Statistics
12
Asset Quality:
Table 1.8: Asset Quality of the Banking System
PKR million
CY11 CY12 CY13 Dec-14 Dec-15 Dec-16 Dec-17 Mar-18 Dec-18 Mar-19Advances (Gross) 3,759,235 4,247,183 4,578,716 4,929,957 5,330,138 6,013,080 7,029,449 7,271,177 8,524,808 8,401,922 NPLs 591,579 618,225 607,410 604,698 605,444 604,666 592,547 600,359 679,744 690,253 Provisions (General+Specific) 410,016 442,111 468,557 482,657 514,311 514,267 516,965 535,326 569,613 580,702 Advances (net) 3,349,219 3,805,072 4,110,159 4,447,300 4,815,827 5,498,813 6,512,485 6,735,851 7,955,195 7,821,220 Net NPLs 181,563 176,114 138,853 122,041 91,133 90,399 75,582 65,033 110,131 109,550
PKR million
CY11 CY12 CY13 Dec-14 Dec-15 Dec-16 Dec-17 Mar-18 Dec-18 Mar-19OAEM 15,521 14,320 13,785 15,260 17,475 22,599 19,780 16,148 32,380 19,134 Sub Standard 50,262 46,135 50,202 57,179 40,649 34,260 32,829 45,025 53,898 51,725 Doubtful 58,346 55,011 32,353 36,746 28,044 34,175 35,108 29,718 52,417 67,163 Loss 467,450 502,760 511,070 495,514 519,277 513,631 504,831 509,468 541,049 552,231 Total 591,579 618,225 607,410 604,698 605,444 604,666 592,547 600,359 679,744 690,253
PKR million
CY11 CY12 CY13 Dec-14 Dec-15 Dec-16 Dec-17 Mar-18 Dec-18 Mar-19OAEM - - 26 - - - - - - - Sub Standard 9,669 9,879 11,320 14,748 8,539 7,291 6,446 8,677 8,331 9,129 Doubtful 20,196 21,348 14,336 16,306 11,523 16,746 14,912 13,171 17,742 20,494 Loss 364,059 397,522 428,513 433,552 468,847 466,870 463,536 482,094 511,601 517,857 Total 393,924 428,750 454,195 464,606 488,909 490,907 484,894 503,941 537,675 547,480
Selected Indicators of Asset Quality
Category-wise Break up of Non Performing Loans (NPLs)
Category-wise Break up of Provisions against NPLs (specific)

Quarterly Compendium: Banking Statistics
13
Table 1.9: Segment-wise Advances and Non- Performing Loans (NPLs)
Table 1.10: Sector-wise Advances and Non- Performing Loans (NPLs)
Advances NPLsInfection
RatioAdvances NPLs
Infection
RatioAdvances NPLs
Infection
RatioAdvances NPLs
Infection
RatioAdvances NPLs
Infection
Ratio
Corporate Sector 4,056,705 431,280 10.6 4,829,625 425,369 8.8 5,103,991 431,373 8.5 6,030,582 490,571 8.1 5,990,960 503,185 8.4
Fixed Investments 1,911,196 193,440 10.1 2,243,326 191,776 8.5 2,408,090 193,405 8.0 2,653,814 223,414 8.4 2,694,107 231,005 8.6
Working Capital 1,371,703 155,375 11.3 1,636,075 150,380 9.2 1,713,212 154,845 9.0 2,227,674 181,982 8.2 2,161,412 184,135 8.5
Trade Finance 773,806 82,465 10.7 950,225 83,212 8.8 982,689 83,122 8.5 1,149,093 85,176 7.4 1,135,441 88,044 7.8
SMEs Sector 404,618 82,095 20.3 452,415 76,680 16.9 419,967 75,511 18.0 504,979 75,437 14.9 463,041 76,148 16.4
Fixed Investments 88,294 11,149 12.6 98,353 11,319 11.5 103,672 12,730 12.3 118,481 12,287 10.4 116,740 13,160 11.3
Working Capital 270,820 62,601 23.1 310,720 58,299 18.8 272,186 56,124 20.6 336,903 55,965 16.6 301,150 55,546 18.4
Trade Finance 45,504 8,345 18.3 43,343 7,062 16.3 44,109 6,657 15.1 49,596 7,186 14.5 45,152 7,441 16.5
Agriculture Sector 294,339 38,064 12.9 316,169 38,386 12.1 314,723 39,696 12.6 324,291 54,687 16.9 324,845 52,373 16.1
Consumer sector 371,804 30,142 8.1 448,465 27,846 6.2 471,583 27,958 5.9 535,461 26,839 5.0 546,801 28,120 5.1
i. Credit cards 28,307 2,340 8.3 34,248 2,307 6.7 34,825 2,319 6.7 40,917 2,499 6.1 41,333 2,539 6.1
ii. Auto loans 125,898 2,600 2.1 169,476 2,673 1.6 184,330 2,618 1.4 210,388 2,760 1.3 216,279 2,807 1.3
iii. Consumer durable 318 67 21.2 652 66 10.1 712 67 9.3 866 65 7.5 934 64 6.9
iv. Mortgage loans 61,609 10,894 17.7 79,979 10,634 13.3 84,004 10,944 13.0 94,937 10,858 11.4 96,959 11,251 11.6
v. Other personal loans 155,671 14,241 9.1 164,109 12,166 7.4 167,712 12,011 7.2 188,353 10,657 5.7 191,296 11,460 6.0
Commodity financing 619,347 4,571 0.7 735,365 5,911 0.8 726,166 5,472 0.8 863,976 5,443 0.6 799,617 5,900 0.7
Cotton 17,816 1,140 6.4 24,808 1,050 4.2 24,550 994 4.0 41,065 994 2.4 36,046 1,032 2.9
Rice 18,858 2,761 14.6 21,010 2,676 12.7 22,778 2,642 11.6 31,886 2,614 8.2 31,281 2,616 8.4
Sugar 46,097 392 0.8 43,787 1,132 2.6 78,588 986 1.3 62,117 1,199 1.9 91,596 1,449 1.6
Wheat 467,010 135 0.0 580,290 136 0.0 543,018 136 0.0 664,304 115 0.0 574,835 163 0.0
Others 69,566 145 0.2 65,470 916 1.4 57,231 714 1.2 64,604 521 0.8 65,859 640 1.0
Staff Loans 104,139 1,409 1.4 115,449 1,779 1.5 118,039 1,683 1.4 126,997 2,037 1.6 131,338 1,701 1.3
Others 162,128 17,104 10.5 131,961 16,576 12.6 116,707 18,665 16.0 138,522 24,730 17.9 145,319 22,826 15.7
Total 6,013,080 604,666 10.1 7,029,449 592,547 8.4 7,271,177 600,359 8.3 8,524,808 679,744 8.0 8,401,922 690,253 8.2
Amount in PKR million, ratio in percent
Dec-17 Mar-18 Dec-18 Mar-19Dec-16
amount in PKR million, ratio in percent
Advances NPLsInfection
RatioAdvances NPLs
Infection
RatioAdvances NPLs
Infection
RatioAdvances NPLs
Infection
RatioAdvances NPLs
Infection
Ratio
Agribusiness 548,099 41,706 7.6 623,438 41,387 6.6 604,390 42,717 7.1 690,985 57,576 8.3 685,009 55,396 8.1
Automobile/Transportation 95,292 12,604 13.2 108,707 12,027 11.1 106,061 12,121 11.4 129,666 15,820 12.2 135,644 16,217 12.0
Cement 71,722 6,789 9.5 109,561 6,472 5.9 120,685 6,455 5.3 166,962 5,059 3.0 174,886 4,040 2.3
Chemical & Pharmaceuticals 250,092 12,780 5.1 236,955 12,864 5.4 225,865 12,318 5.5 291,291 13,029 4.5 286,028 15,450 5.4
Electronics 78,173 13,326 17.0 97,804 12,503 12.8 103,653 11,800 11.4 117,303 16,260 13.9 123,567 18,430 14.9
Financial 182,664 10,544 5.8 172,695 8,782 5.1 164,786 8,655 5.3 228,482 9,928 4.3 229,393 11,180 4.9
Individuals 550,384 58,028 10.5 618,877 54,734 8.8 650,250 59,095 9.1 739,483 62,553 8.5 745,230 61,575 8.3
Insurance 3,013 1 0.0 5,934 1 0.0 5,475 1 0.0 3,914 7 0.2 3,956 7 0.2
Others 2,285,686 205,976 9.0 2,748,079 206,879 7.5 2,810,580 202,618 7.2 3,297,259 232,109 7.0 3,124,184 233,350 7.5
Production/Transmission of Energy 892,059 31,095 3.5 1,043,522 33,589 3.2 1,149,314 36,329 3.2 1,434,622 38,786 2.7 1,408,329 42,596 3.0
Shoes & Leather garments 27,171 3,770 13.9 28,364 5,307 18.7 32,954 5,802 17.6 33,716 5,674 16.8 37,038 5,889 15.9
Sugar 176,250 15,563 8.8 245,590 14,490 5.9 311,677 16,407 5.3 234,844 40,337 17.2 331,024 43,296 13.1
Textile 852,476 192,483 22.6 989,922 183,511 18.5 985,487 186,039 18.9 1,156,283 182,606 15.8 1,117,635 182,826 16.4
Total 6,013,080 604,666 10.1 7,029,449 592,547 8.4 7,271,177 600,359 8.3 8,524,808 679,744 8.0 8,401,922 690,253 8.2
Mar-19Dec-18Dec-17 Mar-18Dec-16

Quarterly Compendium: Banking Statistics
14
Table 1.11: Investments As Per Remaining Maturity
PKR Billion
CY11 CY12 CY13 Dec-14 Dec-15 Dec-16 Dec-17 Mar-18 Dec-18 Mar-19
Upto one month 310 767 1,024 515 782 658 2,042 1,776 2,852 729
Over one month upto three months 286 439 1,202 673 889 1,531 2,705 1,794 2,105 2,189
Over three months upto six months 422 499 514 619 496 515 170 445 408 191
Over six months upto one year 1,130 1,096 308 748 1,957 1,027 637 475 449 585
Over one year upto two years 187 240 315 1,212 499 1,029 1,140 1,150 539 257
Over two years upto three years 184 258 347 434 849 842 505 214 458 688
Over three years upto five years 268 369 196 506 545 843 794 724 414 475
Over five years upto ten years 190 216 279 534 720 897 525 378 530 777
Over ten years 76 125 120 69 144 167 211 139 157 192
Total Investments 3,053 4,009 4,305 5,310 6,881 7,509 8,729 7,096 7,914 6,082

Quarterly Compendium: Banking Statistics
15
Soundness & Resilience:
Table 1.12a: Break-up of Mark-up/Return/Interest Earned
Table 1.12b: Break-up of Mark-up/Return/Interest Expensed
Table 1.13: Distribution of Banks by Capital Adequacy Ratio (CAR)
amount in PKR billion, ratio in percent
Items Amount % Amount % Amount % Amount % Amount % Amount % Amount % Amount %
Loans & advances 396.0 50.9 437.0 47.5 403.8 41.1 383.7 40.9 434.4 43.5 119.7 46.3 570.7 49.5 202.5 53.9
Investments 361.0 46.4 450.2 48.9 544.5 55.5 527.2 56.2 535.8 53.6 129.4 50.1 519.7 45.1 135.5 36.1
Deposits, repo and others 20.4 2.6 32.6 3.5 33.5 3.4 27.1 2.9 28.6 2.9 9.4 3.6 62.6 5.4 37.6 10.0
Total 777.4 100.0 919.8 100.0 981.8 100.0 938.0 100.0 998.7 100.0 258.5 100.0 1,153.0 100.0 375.6 100.0
Mar-19Dec-17 Mar-18 Dec-18CY13 Dec-14 Dec-15 Dec-16
amount in PKR billion, ratio in percent
Items Amount % Amount % Amount % Amount % Amount % Amount % Amount % Amount %
Deposits 372.5 83.9 431.9 85.5 375.0 77.2 343.3 75.8 369.7 74.0 95.8 74.0 461.0 75.8 176.8 82.5
Securities sold under
repurchased agreement31.9 7.2 30.9 6.1 73.2 15.1 76.5 16.9 85.8 17.2 21.5 16.6 86.5 14.2 15.2 7.1
Borrowings 31.2 7.0 39.8 7.9 32.8 6.7 28.9 6.4 41.0 8.2 11.2 8.7 56.2 9.2 19.4 9.1
Others 8.4 1.9 2.5 0.5 4.6 0.9 4.5 1.0 3.4 0.7 0.9 0.7 4.3 0.7 2.9 1.4
Total 444.0 100.0 505.0 100.0 485.6 100.0 453.2 100.0 499.8 100.0 129.4 100.0 608.0 100.0 214.3 100.0
Mar-19Dec-18Dec-17 Mar-18CY13 Dec-14 Dec-15 Dec-16
CY11 CY12 CY13 Dec-14 Dec-15 Dec-16 Dec-17 Mar-18 Dec-18 Mar-19
Less than the minimum
required level5 5 5 3 3 4 4 6 6 5
Above minimum required
level but below 15 percent10 9 12 12 13 13 11 8 10 10
Over 15 percent 23 24 21 22 19 17 18 20 18 19
Total 38 38 38 37 35 34 34 34 34 34

Quarterly Compendium: Banking Statistics
16
Table 1.14: Capital Structure and Capital Adequacy of All Banks and DFIs
March 31, 2019 (Un-audited)
All Banks and
DFIs PSCBs LPB FB SB All Banks DFIs
1.1 Common Equity Tier 1
1.1.1 Fully Paid-up capital/Capital deposited with SBP 607,578 71,456 359,807 44,328 62,956 538,547 69,032
1.1.2 Balance in Share Premium Account 34,685 0 34,685 - - 34,685 -
1.1.3 Reserve for issue of Bonus Shares 33 - 33 - - 33 -
1.1.4 Discount on issue of Shares (enter negative number) (70,954) - (70,954) - - (70,954) -
1.1.5 General/Statutory Reserves as (disclosed on the Balance Sheet) 308,199 42,225 242,663 162 7,248 292,298 15,901
1.1.6 Gain/(Losses) on derivatives held as Cash Flow Hedge - - - - - - -
1.1.7 Un-appropriated/ un-remitted profits/ (Losses) 448,939 82,088 352,245 15,877 (22,265) 427,946 20,993
1.1.8
Minority Interest arising from CET 1 capital instruments issued to
third party by consolidated bank's subsidiaries (amount allowed in
group CET1 - from "Consolidation sheet", ) - - - - - - -
CET 1 before Regulatory Adjustments 1,328,480 195,769 918,479 60,367 47,939 1,222,554 105,926
1.1.9 Regulatory Adjustments for calculation of CET1 - - - - - - -
1.1.10 Goodwill (net of related defered tax liability) 20,117 503 19,612 - 2 20,117 -
1.1.11 All other intangibles (net of any associated defered tax liability) 15,663 842 14,670 42 65 15,620 43
1.1.12
Shortfall in provisions against classified assets (without
considering any tax impact) - - - - - - -
1.1.13
Deferred tax assets that rely on future profitability excluding
those arising from temporary differences (net of related tax
liability) 9,663 998 8,400 265 - 9,663 -
1.1.14 Defined benefit pension fund net assets 8,205 - 8,205 - - 8,205 -
1.1.15
Reciprocal cross holdings in CET1 capital instruments of
banking, financial, and insurance entities 7,766 898 6,868 - - 7,766 -
1.1.16 Cash flow hedge reserve - - - - - - -
1.1.17 Investment in own shares/ CET1 instruments 353 - 272 - 81 353 -
1.1.18 Any increase in equity capital resulting from a securitization - - - - - - -
1.1.19 Capital shortfall of regulated subsidiaries - - - - - - -
1.1.20
Deficit on account of revaluation from bank's holdings of fixed
assets/ AFS 17,673 5,273 11,271 122 346 17,012 661
Regulatory Adjustments for calculation of Common Equity Tier
1 79,440 8,515 69,298 429 494 78,736 704
1.1.21 CET 1 after Regulatory Adjustments above 1,249,040 187,254 849,181 59,938 47,445 1,143,818 105,222
1.1.22 Investments in the capital instruments of banking, financial and
insurance entities (that are outside the scope of regulatory
consolidation), where the bank does not own more than 10% of
the issued share capital (amount above 10% threshold)
3,245 503 966 - - 1,468 1,776
1.1.23 CET1 after Regulatory Adjustment above 1,245,796 186,751 848,216 59,938 47,445 1,142,350 103,446
1.1.24 Significant investments in the common stock of banking,
financial and insurance entities that are outside the scope of
regulatory consolidation (amount above 10% threshold) 18,726 - 6,878 - - 6,878 11,849
1.1.25
Deferred Tax Assets arising from temporary differences
(amount above 10% threshold, net of related tax liability) 16,349 8,207 8,142 - - 16,349 -
1.1.26 CET1 after Regulatory Adjustment above 1,210,720 178,544 833,196 59,938 47,445 1,119,123 91,597
1.1.27
Amount exceeding 15% threshold (significant Investments and
DTA) 674 674 - - - 674 -
1.1.28 CET1 after above adjustment 1,210,046 177,871 833,196 59,938 47,445 1,118,449 91,597
1.1.29 National specific regulatory adjustments applied to CET1 capital 844 - 555 - - 555 289
1.1.30 Investment in TFCs of other banks exceeding the precribed
limit 839 - 555 - - 555 284
1.1.31 Any other deduction specified by SBP 5 - - - - - 5
1.1.32 CET1 after Regulatory Adjustment above 1,209,203 177,871 832,641 59,938 47,445 1,117,894 91,308
1.1.33 Adjustment to CET1 due to insufficient AT 1 and T2 to cover adjustments 12,859 2,094 291 - - 2,385 10,473
1.1.34 Common Equity Tier 1 (after regulatory adjustments) 1,196,344 175,777 832,350 59,938 47,445 1,115,509 80,835
1.2 Additional Tier 1 - - - - - - -
1.2.1
Qualifying Additional Tier-1 instruments plus any related share
premium 48,009 - 48,009 - - 48,009 -
1.2.1.1 of which Classified as equity 3,889 - 3,889 - - 3,889 -
1.2.1.2 of which Classified as liabilities 44,120 - 44,120 - - 44,120 -
1.2.2
Additional Tier-1 capital instruments issued by consolidated
subsidiaries and held by third parties (amount allowed in group
AT1 - from "Consolidation sheet") - - - - - - -
1.2.3 AT1 before Regulatory Adjustments 48,009 - 48,009 - - 48,009 -
1.2.4 Regulatory Adjustments for calculation of Additional Tier 1 Capital - - - - - - -
1.2.5 Investment in mutual funds exceeding the precribed limit 1,221 - 172 - - 172 1,049
1.2.6 Investment in own AT1 capital instruments - - - - - - -
PKR million

Quarterly Compendium: Banking Statistics
17
Table 1.14: Capital Structure and Capital Adequacy of All Banks and DFIs (Continued)
March 31, 2019 (Un-audited)
All Banks and
DFIs PSCBs LPB FB SB All Banks DFIs
1.2.7
Reciprocal cross holdings in Additional Tier 1 capital instruments
of banking, financial, and insurance entities 519 - 519 - - 519 -
1.2.8
Investments in the capital instruments of banking, financial and
insurance entities that are outside the scope of regulatory
consolidation, where the bank does not own more than 10% of 5,530 1,788 188 - - 1,976 3,554
1.2.9
Significant investments in the capital instruments issued by
banking, financial and insurance entities that are outside the - - - - - - -
1.2.10
Portion of deduction applied 50:50 to Tier-1 and Tier-2 capital
based on pre-Basel III treatment which, during transitional 0 - 0 - - 0 -
1.2.11 Adjustment to AT1 due to insufficient Tier 2 to cover 6,177 306 - - - 306 5,871
Regulatory Adjustments for calculation of Additional Tier 1
Capital 13,446 2,094 879 - - 2,972 10,473
1.2.12 Amount of Regulatory Adjustment applied to AT1 capital 587 - 587 - - 587 -
1.2.13 Additional Tier 1 (after regulatory adjustments) 47,422 - 47,422 - - 47,422 -
1.2.14 Additional Tier 1 capital recognized for capital adequacy 46,233 - 46,233 - - 46,233 -
1.2.15 Tier 1 Capital 1,247,566 175,777 883,572 59,938 47,445 1,166,731 80,835
1.2.16 Tier 1 Capital recognized for CAR (CET1 + Admissible AT1) 1,242,577 175,777 878,583 59,938 47,445 1,161,742 80,835
2 Tier 2 Capital - - - - - - -
2.1
Qualifying Tier 2 capital instruments under Basel 3 plus any
related share premium 52,375 7,597 44,778 - - 52,375 -
2.2
Tier 2 capital instruments subject to phase out arrangement
issued under pre-Basel 3 4,396 - 4,396 - - 4,396 -
2.3
Tier 2 capital instruments issued to third party by consolidated
subsidiaries (amount allowed in group tier 2 - from
"Consolidation sheet") - - - - - - -
2.3.1 of which: instruments issued by subsidiaries subject to phase out - - - - - - -
2.4
General Provisions or general reserves for loan losses-up to
maximum of 1.25% of Credit Risk Weighted Assets 35,268 10,716 22,185 244 1,898 35,043 225
2.50 Revaluation Reserves (net of taxes)** 166,803 64,187 95,149 - 5,415 164,751 2,052
2.5.1 Pertaining to Fixed Assets 154,434 45,758 103,021 - 3,623 152,402 2,032
2.5.2 Unrealized Gains/Losses on AFS 12,369 18,429 (7,872) - 1,792 12,349 20
2.6 Foreign Exchange Translation Reserves 64,068 9,700 54,368 - - 64,068 -
2.7 Undisclosed/Other Reserves (if any) - - - - - - -
2.8 T2 before regulatory adjustments 322,910 92,200 220,876 244 7,312 320,633 2,277
2.9 Regulatory Adjustments for calculation of Tier 2 Capital - - - - - - -
2.1
Portion of deduction applied 50:50 to Tier-1 and Tier-2 capital
based on pre-Basel III treatment which, during transitional
period, remain subject to deduction from tier-2 capital 0 - 0 - - 0 -
2.11
Reciprocal cross holdings in Tier 2 of banking, financial, and
insurance entities 1,272 5 1,267 - - 1,272 -
2.12 Investment in own Tier 2 capital instrument 23 - 23 - - 23 -
2.13
Investments in the capital instruments of banking, financial and
insurance entities that are outside the scope of regulatory
consolidation, where the bank does not own more than 10% of the
issued share capital (amount above 10% threshold) 7,860 308 1,279 - - 1,588 6,273
2.14
Significant investments in the capital instruments issued by
banking, financial and insurance entities that are outside the scope
of regulatory consolidation 4,373 - 4,373 - - 4,373 -
Sum regulatory adjustment for calculation of Tier-2 capital 13,529 313 6,943 - - 7,256 6,273
2.15 Amount of Regulatory Adjustment applied to T2 capital 7,352 7 6,943 - - 6,950 401
2.16 Tier 2 Capital (after regulatory adjustments) 315,558 92,193 213,933 244 7,312 313,683 1,875
2.17 Tier 2 Capital recognized for capital adequacy 246,926 48,289 189,205 244 7,312 245,051 1,875
2.18 Portion of Additional Tier 1 capital recognized in Tier 2 Capital 1,180 - 1,180 - - 1,180 -
2.19 Total Tier 2 admissible for capital adequacy 248,106 48,289 190,385 244 7,312 246,231 1,875
- - - - - - -
TOTAL CAPITAL 1,559,324 267,970 1,093,704 60,182 54,757 1,476,614 82,710
3
Total Capital Recognized for Capital Adequacy Ratio (T1
recoginzed + Tier 2 admissible) 1,490,683 224,066 1,068,968 60,182 54,757 1,407,973 82,710
- - - - - - -
4 Total Risk Weighted Assets 8,920,173 1,559,459 6,765,159 205,519 215,435 8,745,571 174,602
4.1 Total Credit Risk Weighted Assets 7,208,357 1,224,445 5,545,159 137,952 173,311 7,080,867 127,490
4.2 Total Market Risk Weighted Assets 480,162 122,015 286,493 37,331 8,769 454,608 25,554
4.3 Total Operational Risk Weighted Assets 1,231,654 212,999 933,507 30,235 33,355 1,210,096 21,558
5 Capital Adequacy Ratios
5.1 CET1 to total RWA 13.4% 11.3% 12.3% 29.2% 22.0% 12.8% 46.3%
5.2 Tier-1 capital to total RWA 13.9% 11.3% 13.0% 29.2% 22.0% 13.3% 46.3%
5.3 Total capital to total RWA 16.7% 14.4% 15.8% 29.3% 25.4% 16.1% 47.4%
PKR million

Quarterly Compendium: Banking Statistics
18
Table 1.15: Stress Testing Results of the Banking System
March 31, 2019 (Un-audited)
< 0% 0% < 8% 8% < 11.9% > 11.9%
Pre-Shock Position 2 1 1 29
Credit Shocks Nature of Shock < 0% 0% < 8% 8% < 11.9% > 11.9%
C-1 10% of performing loans become non-performing, 50% of substandard loans
downgrade to doubtful, 50% of doubtful to loss.
Hypothetical 2 1 6 24
C-2
Default of top 3 private sector borrowers/Groups (fund based ) exposures, including
outstanding or limit which ever is higher and investments in borrowers' TFCs, equity etc.,
as defined under Revised PRs, net of deductions.
Hypothetical
3 1 12 17
C-3
Default of top 3 private sector borrowers/Groups (fund based and Non-Fund based )
exposures, including outstanding or limit which ever is higher and investments in
borrowers' TFCs, equity etc., as defined under Revised PRs, net of deductions.
Hypothetical
3 2 12 16
C-4All NPLs under substandard downgrade to doubtful and all doubtful downgrade to loss. Hypothetical
3 0 3 27
C-5 Increase in provisions against NPLs equivalent to 25% of Net NPLs. Hypothetical 2 1 3 27
C-6Increase in NPLs to Loans Ratio (NPLR) equivalent to the maximum quarterly increase in
NPLs to Loans Ratio of the individual banks during the last 9 years.
Historical2 1 5 25
C-7 Increase in NPLs of all banks by 21% which is equivalent to the maximum quarterly
increase in NPLs of the banking system during the last 9 years (Mar-09).
Historical 2 1 3 27
C-8 Increase in NPLs to Loans Ratio of Textile Sector of the banks equivalent to the
maximum quarterly increase in these banks during the last 5 years.
Historical 2 1 4 26
C-9 Increase in NPLs to Loans Ratio of Consumer Sector of the banks equivalent to the
maximum quarterly increase in these banks during the last 9 years.
Historical 2 1 2 28
C-10 Increase in NPLs to Loans Ratio of Agriculture & SME Sector of the banks equivalent to
the maximum quarterly increase in these banks during the last 9 years.
Historical 2 1 4 26
NPLR Critical NPLR Difference
C-11 Critical Infection Ratio (The ratio of NPLs to Loans where capital would wipe out) Hypothetical 8.2% 35.9% 27.7%
Market Shocks < 0% 0% < 8% 8% < 11.9% > 11.9%
IR-1 Parallel upward shift in the yield curve - increase in interest rates by 300 basis points
along all the maturities.
Hypothetical 3 1 3 26
IR-2
Upward shift coupled with steepening of the yield curve by increasing the interest rates
along 3m, 6m, 1y, 3y, 5y and 10y maturities equivalent to the maximum quarterly
increase experienced during the last 8 years (July-08).
Historical
3 1 3 26
IR-3
Downward Shift plus flattening of the yield curve by decreasing the interest rates along
3m, 6m, 1y, 3y, 5y and 10y maturities equivalevent to the maximum quarterly increase
experienced during the last 8 years (April-09).
Historical
2 1 2 28
IR-4 Impact of Increase in interest rate by 100bps on investment portfolio only Hypothetical 2 1 5 25
ER-1 Depreciation of Pak Rupee exchange rate by 30%. Hypothetical 2 1 1 29
ER-2
Depreciation of Pak Rupee exchange rate by 14.5% equivalent to the quarterly high
depreciation of rupee against dollar experienced during the last 6 years (May08-Aug08).
Historical
2 1 1 29
ER-3
Appreciation of Pak Rupee exchange rate by 7.5% equivalent to the quarterly high level
of appreciation of rupee against dollar experienced during the last 5 years (Jun13-
Sep13)
Historical
2 1 1 29
EQ-1Fall in general equity prices by 41.4% equivalent to maximum decline in the index during
last 9 years (Oct08-Jan09).
Historical2 1 5 25
EQ-2 Fall in general equity prices by 50%. Hypothetical 2 1 5 25
3 Days 4 Days 5 Days
L-1 Withdrawal of customer deposits by 2%, 5%, 10%, 10% and 10% for five consecutive
days respectively.
Hypothetical 0 1 2
1 Day 2 Days 3 Days
L-2 Withdrawal of Wholesale Deposits and Unsecured Borrowings by 10%, 20%, and 50%
for three consecutive days respectively.
Hypothetical 0 0 5
L-3 Shock to Liquidity Coverage Ratio Applying 20% haircut to the value of Investments in
Government Securities*
Hypothetical
* Excluding IDBL
Shock DetailsNumber of Banks with CAR*
LCR<1
2
Number of Banks with CAR*
Liquidity ShocksNo. of Banks with no liquidity after
Number of Banks with

Quarterly Compendium: Banking Statistics
19
Table 1.16: List of Banks
Dec-17 Mar-18 Dec-18 Mar-19A. Public Sector Com. Banks (5) A. Public Sector Com. Banks (5) A. Public Sector Com. Banks (5) A. Public Sector Com. Banks (5)
First Women Bank Ltd. First Women Bank Ltd. First Women Bank Ltd. First Women Bank Ltd.
National Bank of Pakistan National Bank of Pakistan National Bank of Pakistan National Bank of Pakistan
Sindh Bank Ltd. Sindh Bank Ltd. Sindh Bank Ltd. Sindh Bank Ltd.
The Bank of Khyber The Bank of Khyber The Bank of Khyber The Bank of Khyber
The Bank of Punjab The Bank of Punjab The Bank of Punjab The Bank of Punjab
B. Local Private Banks (20) B. Local Private Banks (20) B. Local Private Banks (20) B. Local Private Banks (20)
AlBaraka Bank (Pakistan) Ltd. AlBaraka Bank (Pakistan) Ltd. AlBaraka Bank (Pakistan) Ltd. AlBaraka Bank (Pakistan) Ltd.
Allied Bank Ltd. Allied Bank Ltd. Allied Bank Ltd. Allied Bank Ltd.
Askari Bank Ltd. Askari Bank Ltd. Askari Bank Ltd. Askari Bank Ltd.
Bank AL Habib Ltd. Bank AL Habib Ltd. Bank AL Habib Ltd. Bank AL Habib Ltd.
Bank Alfalah Ltd. Bank Alfalah Ltd. Bank Alfalah Ltd. Bank Alfalah Ltd.
BankIslami Pakistan Ltd. BankIslami Pakistan Ltd. BankIslami Pakistan Ltd. BankIslami Pakistan Ltd.
Dubai Islamic Bank Pakistan Ltd. Dubai Islamic Bank Pakistan Ltd. Dubai Islamic Bank Pakistan Ltd. Dubai Islamic Bank Pakistan Ltd.
Faysal Bank Ltd. Faysal Bank Ltd. Faysal Bank Ltd. Faysal Bank Ltd.
Habib Bank Ltd. Habib Bank Ltd. Habib Bank Ltd. Habib Bank Ltd.
Habib Metropolitan Bank Ltd. Habib Metropolitan Bank Ltd. Habib Metropolitan Bank Ltd. Habib Metropolitan Bank Ltd.
JS Bank Ltd. JS Bank Ltd. JS Bank Ltd. JS Bank Ltd.
MCB Bank Ltd. MCB Bank Ltd. MCB Bank Ltd. MCB Bank Ltd.
MCB Islamic Bank Ltd. MCB Islamic Bank Ltd. MCB Islamic Bank Ltd. MCB Islamic Bank Ltd.
Meezan Bank Ltd. Meezan Bank Ltd. Meezan Bank Ltd. Meezan Bank Ltd.
SAMBA Bank Ltd. SAMBA Bank Ltd. SAMBA Bank Ltd. SAMBA Bank Ltd.
Silk Bank Ltd Silk Bank Ltd Silk Bank Ltd Silk Bank Ltd
Soneri Bank Ltd. Soneri Bank Ltd. Soneri Bank Ltd. Soneri Bank Ltd.
Standard Chartered Bank (Pakistan) Ltd. Standard Chartered Bank (Pakistan) Ltd. Standard Chartered Bank (Pakistan) Ltd. Standard Chartered Bank (Pakistan) Ltd.
Summit Bank Ltd Summit Bank Ltd Summit Bank Ltd Summit Bank Ltd
United Bank Ltd. United Bank Ltd. United Bank Ltd. United Bank Ltd.
C. Foreign Banks (5) C. Foreign Banks (5) C. Foreign Banks (5) C. Foreign Banks (5)
Bank of Tokyo - Mitsubishi UFJ, Ltd. Bank of Tokyo - Mitsubishi UFJ, Ltd. Bank of Tokyo - Mitsubishi UFJ, Ltd. Bank of Tokyo - Mitsubishi UFJ, Ltd.
Citibank N.A. Citibank N.A. Citibank N.A. Citibank N.A.
Deutsche Bank AG Deutsche Bank AG Deutsche Bank AG Deutsche Bank AG
Industrial and Commercial Bank of China Ltd. Industrial and Commercial Bank of China Ltd. Industrial and Commercial Bank of China Ltd. Industrial and Commercial Bank of China Ltd.
Bank of China Limited ^ Bank of China Limited ^ Bank of China Limited ^ Bank of China Limited ^
D. Specialized Banks (4) D. Specialized Banks (4) D. Specialized Banks (4) D. Specialized Banks (4)
Industrial Development Bank Ltd. Industrial Development Bank Ltd. Industrial Development Bank Ltd. Industrial Development Bank Ltd.
Punjab Provincial Co-operative Bank Ltd. Punjab Provincial Co-operative Bank Ltd. Punjab Provincial Co-operative Bank Ltd. Punjab Provincial Co-operative Bank Ltd.
SME Bank Ltd. SME Bank Ltd. SME Bank Ltd. SME Bank Ltd.
Zarai Taraqiati Bank Ltd. Zarai Taraqiati Bank Ltd. Zarai Taraqiati Bank Ltd. Zarai Taraqiati Bank Ltd.
All Commercial Banks (30) All Commercial Banks (30) All Commercial Banks (30) All Commercial Banks (30)
Include A + B + C Include A + B + C Include A + B + C Include A + B + C
All Banks (34) All Banks (34) All Banks (34) All Banks (34)
Include A + B + C + D Include A + B + C + D Include A + B + C + D Include A + B + C + D
# NIB Bank Ltd. was de-scheduled with effect from close of business on July 7, 2017, on account of its merger with and into MCB Bank Limited
^SBP declared "Bank of China Limited" as a scheduled Bank with effect from September 18, 2017.

Quarterly Compendium: Banking Statistics
20
2. Islamic Banking

Quarterly Compendium: Banking Statistics
21
Table 2.1: Financial Soundness Indicators of Islamic Banking^
Percent
Dec-11 Dec-12 Dec-13 Dec-14 Dec-15 Dec-16 Dec-17 Mar-18 Dec-18 Mar-19
Capital
Total Capital to Total RWA* 18.0 15.3 13.4 13.8 13.8 12.9 13.4 13.1 14.0 14.7
Tier 1 Capital to Total RWA* 17.2 14.7 12.4 12.5 12.2 10.5 10.5 10.5 11.6 12.1
Capital to Total Assets 8.7 7.6 6.9 6.5 6.6 6.7 6.2 6.2 6.4 6.4
Asset Quality
NPFs to Total Financing 7.6 7.6 5.7 4.7 4.9 4.1 3.0 2.8 2.4 2.3
Provision to NPFs 63.0 66.5 74.4 83.9 95.6 84.7 82.5 82.7 83.2 89.0
Net NPFs to Net Financing 2.9 2.7 1.5 0.8 0.2 0.7 0.5 0.5 0.4 0.3
Net NPFs to Capital#10.5 9.8 6.9 3.9 1.4 4.3 4.6 4.4 3.7 2.2
Earnings
ROA before Tax 1.9 1.4 1.0 1.5 1.2 1.0 1.1 1.1 1.4 2.0
ROA after Tax 1.6 1.2 0.9 1.2 0.9 0.7 0.8 0.8 1.0 1.3
ROE before Tax 20.8 16.8 14.4 20.9 18.7 15.4 17.1 18.4 22.3 31.8
ROE after Tax 17.3 14.1 12.0 16.5 13.3 10.6 12.4 13.5 16.2 20.1
Net Mark-Up Income to Gross Income 82.4 80.1 78.5 77.9 80.9 80.4 80.7 84.4 83.8 86.2
Operating Expense to Gross Income 60.4 67.3 69.7 66.0 70.0 75.1 69.8 67.5 62.9 54.7
Trading Income to Gross Income#1.2 3.9 4.2 3.7 2.0 2.7 1.7 0.0 -0.4 -0.6
Personnel Expenses to Non-interest Expenses#38.1 37.8 40.8 40.0 41.1 41.4 41.0 42.1 42.5 42.6
Liquidity
Liquid Assets to Total Assets 40.0 46.7 41.9 32.6 35.1 32.9 27.0 24.2 22.4 21.0
Liquid Assets to Total Deposits 49.3 55.3 49.0 38.4 41.2 38.8 32.6 29.5 27.0 26.6
Liquid Assets/Short term Liabilities#
57.5 68.3 62.0 66.4 72.1 72.8 59.7 53.6 48.0 42.6
Financing to Deposits 38.4 32.7 36.3 38.2 46.9 52.2 64.0 67.0 68.6 69.3
Customer Deposits to Total Financing#
229.8 271.3 242.7 236.0 189.6 172.0 142.5 137.6 133.3 132.5
# New Ratios introduced as per IMF's compilation guide on Financial Soundness Indicators (highlighted in Blue ).
^ Statistics for Islamic Banking are also part of the overall Banking Statistics (Section 1)
* Capital Adequacy Ratios pertain to Islamic Banks only, while remaining FSIs are based on statistics of Islamic
Banks and Islamic Banking Branches.

Quarterly Compendium: Banking Statistics
22
Table 2.2: Group-wise Balance Sheet and Income Statement of Islamic Banks/Branches^
March 31, 2019 (Un-audited)
PKR million
Financial PositionIslamic
Banks
Islamic
Banking
Branches
Islamic
Banking
Institutions^
ASSETS QoQ YoY
Cash & Balances With Treasury Banks 119,990 71,859 191,850 (7,013) 38,862
Balances With Other Banks 18,133 15,439 33,572 2,634 18,223
Due from Financial Institutions 112,870 143,794 256,664 (26,574) 4,501
Investments - Net 376,424 241,034 617,458 102,411 88,021
Financing - Net 903,835 620,670 1,524,505 13,694 240,802
Operating Fixed Assets 35,368 9,820 45,188 5,231 7,496
Deferred Tax Assets 14,417 20 14,437 308 1,342
Other Assets 59,121 47,097 106,217 40,715 56,210
TOTAL ASSETS 1,640,159 1,149,732 2,789,891 131,406 455,458
LIABILITIES
Bills Payable 31,349 9,492 40,841 8,861 12,475
Due to Financial Institution 79,780 109,563 189,342 51,546 65,848
Deposits And Other Accounts 1,334,767 864,308 2,199,075 (3,820) 282,929
Sub-ordinated Loans 24,724 - 24,724 (143) 11,224
Liabilities Against Assets Subject To Finance Lease - - - - -
Deferred Tax Liabilities 1,306 166 1,472 442 531
Other Liabilities 74,239 80,638 154,877 65,502 48,718
TOTAL LIABILITIES 1,546,165 1,064,165 2,610,330 122,389 421,725
NET ASSETS 93,994 85,566 179,561 9,018 33,734
NET ASSETS REPRESENTED BY: -
Share Capital 58,284 40,200 98,483 5,021 12,234
Reserves 17,313 97 17,410 384 2,356
Unappropriated Profit 16,564 43,199 59,763 2,699 16,636
Share Holders' Equity 92,160 83,496 175,656 8,104 31,226
Surplus/Deficit On Revaluation Of Assets 1,834 2,070 3,904 914 2,508
TOTAL 93,994 85,566 179,561 9,018 33,734
PROFIT AND LOSS STATEMENTIslamic
Banks
Islamic
Banking
Branches
Islamic
Banking
Institutions^
Absolute
change
YoY
Mark-Up Income 32,724 23,037 55,760 23,403
Mark-Up Expenses 16,755 10,997 27,752 13,613
Net Mark-Up Income 15,969 12,039 28,008 9,791
Provisions & Bad Debts Written Off Directly/(Reversals) 769 24 793 384
Net Mark-Up Income After Provision 15,200 12,016 27,215 9,406
Fees, Commission & Brokerage Income 2,394 903 3,297 416
Dividend Income 53 3 56 (11)
Income From Dealing In Foreign Currencies 639 432 1,071 833
Other Income 6 66 73 (99)
Total Non - Markup Income 3,092 1,405 4,497 1,139
Total Income 18,292 13,420 31,712 10,545
Administrative Expenses 11,245 6,319 17,564 3,118
Other Expenses 102 122 225 97
Total Non-Markup Expenses 11,347 6,442 17,789 3,216
Profit before Tax and Extra ordinary Items 6,945 6,979 13,924 7,330
Extra ordinary/unusual Items -- Gain/(Loss) - - - -
PROFIT/ (LOSS) BEFORE TAXATION 6,945 6,979 13,924 7,330
Less: Taxation 3,380 1,738 5,119 3,366
PROFIT/ (LOSS) AFTER TAX 3,565 5,240 8,805 3,963
^ Statistics for Islamic Banking are also part of the overall Banking Statistics (Section 1)
Absolute change

Quarterly Compendium: Banking Statistics
23
Table 2.3: List of Islamic Banking Institutions
Islamic Banks Islamic Banks
1 AlBaraka Bank (Pakistan) Ltd. 1 AlBaraka Bank (Pakistan) Ltd.
2 BankIslami Pakistan Ltd. 2 BankIslami Pakistan Ltd.
3 Dubai Islamic Bank Pakistan Ltd 3 Dubai Islamic Bank Pakistan Ltd
4 MCB Islamic Bank Ltd. 4 MCB Islamic Bank Ltd.
5 Meezan Bank Ltd 5 Meezan Bank Ltd
Conventional Banks having Islamic Banking Branches Conventional Banks having Islamic Banking Branches
1 Askari Bank Ltd. 1 Askari Bank Ltd.
2 Allied Bank Ltd. 2 Allied Bank Ltd.
3 Bank Al Habib Ltd 3 Bank Al Habib Ltd
4 Bank Alfalah Ltd 4 Bank Alfalah Ltd
5 Faysal Bank Ltd. 5 Faysal Bank Ltd.
6 Habib Bank Ltd 6 Habib Bank Ltd
7 Habib Metropolitan Bank 7 Habib Metropolitan Bank
8 National Bank of Pakistan 8 National Bank of Pakistan
9 Silk Bank Ltd 9 Silk Bank Ltd
10 Sindh Bank Ltd 10 Sindh Bank Ltd
11 Soneri Bank Ltd 11 Soneri Bank Ltd
12 Standard Chartered Bank 12 Standard Chartered Bank
13 Summit Bank Ltd. 13 Summit Bank Ltd.
14 The Bank of Khyber 14 The Bank of Khyber
15 The Bank of Punjab 15 The Bank of Punjab
16 United Bank Ltd. 16 United Bank Ltd.
Grand Total 21 (5+16) Grand Total 21 (5+16)
As of March 31, 2019As of March 31, 2018

Quarterly Compendium: Banking Statistics
24
3. Development Finance Institutions

Quarterly Compendium: Banking Statistics
25
Table 3.1: Financial Soundness Indicators of DFIs
Percent
CY11 CY12 CY13 Dec-14 Dec-15 Dec-16 Dec-17 Mar-18 Dec-18 Mar-19
Capital
Total Capital to Total RWA 56.9 54.8 51.4 44.8 43.6 40.8 47.0 46.2 47.0 47.4
Tier 1 Capital to Total RWA 57.4 54.9 50.7 43.6 42.5 39.6 46.1 45.1 46.3 46.3
Capital to Total Assets 41.2 41.3 40.9 43.4 34.1 32.5 35.8 40.7 34.5 34.3
Asset Quality
NPLs to Total Loans 29.3 31.8 30.0 25.3 22.0 17.5 17.1 17.6 15.8 15.6
Provision to NPLs 59.4 63.1 67.5 74.5 76.5 77.7 71.8 67.5 70.3 70.2
Net NPLs to Net Loans 14.4 14.7 12.2 7.9 6.2 4.5 5.5 6.5 5.3 5.2
Net NPLs to Capital 11.3 11.6 9.1 5.0 4.4 3.8 4.3 5.1 4.1 4.1
Investment in Equities to Capital#
15.6 10.8 11.9 15.4 15.2 15.4 12.8 13.3 12.7 12.7
Earnings
ROA before Tax 1.9 0.9 3.6 5.4 4.8 4.7 3.5 2.8 3.2 3.2
ROA after Tax 0.6 -0.2 8.8 4.5 3.4 3.6 2.4 2.1 2.2 2.3
ROE before Tax 4.4 2.1 3.1 12.7 11.3 11.4 8.6 6.0 7.0 7.1
ROE after Tax 1.5 -0.4 7.5 10.6 7.9 8.7 5.8 4.4 4.9 5.2
Net Interest Income to Gross Income 84.1 71.0 60.7 56.0 55.6 47.8 54.6 56.6 60.3 67.8
Operating Expense to Gross Income 58.7 42.1 40.9 31.0 32.6 38.8 37.3 44.7 40.1 36.9
Trading Income to Gross Income#
2.6 6.0 10.8 16.0 18.5 18.3 12.9 15.4 4.6 0.8
Personnel Expenses to Non-interest Expenses#
35.3 50.0 59.6 59.0 61.0 56.7 54.1 54.2 55.4 55.8
Liquidity
Liquid Assets/Total Assets 40.3 39.5 41.3 43.3 42.8 41.4 40.4 32.7 38.1 36.9
Liquid Assets/Total Deposits 480.6 410.7 688.2 508.6 677.6 790.0 538.0 487.0 780.8 797.8
Liquid Assets/Short term Liabilities^#
80.4 81.3 84.8 84.8 86.3 90.2 90.9 89.0 86.9 93.2
Advances/Deposits 385.5 340.4 505.9 323.9 471.6 627.7 447.9 576.4 707.1 758.1
Customer Deposits to Total Loans#
13.0 15.2 14.0 11.4 7.9 9.5 10.6 11.9 8.8 8.1
^ Based on un-audited quarterly numbers only.
* Effective from June 30, 2015, Regulatory Capital, as defined under Basel requirements, has been used to calculate Capital to Total Assets and Net NPLs to
Capital Ratios (highlighted in Red ). Prior to Jun-15, Balance Sheet Capital was used for calculation of these ratios.
# New Ratios introduced as per IMF's compilation guide on Financial Soundness Indicators (highlighted in Blue ).

Quarterly Compendium: Banking Statistics
26
Table 3.2: Balance Sheet and Income Statement of DFIs
QoQ YoY
ASSETS
Cash & Balances With Treasury Banks 2,341 519 447 550 636 2,794 555 504 593 553 (40) 49
Balances With Other Banks 1,423 3,601 3,041 3,509 5,241 7,676 4,849 3,424 4,541 7,283 2,742 3,859
Lending To Financial Institutions 2,909 2,198 10,788 3,548 863 8,405 12,757 17,784 16,998 13,335 (3,663) (4,449)
Investments - Net 81,379 79,065 79,497 108,317 115,307 108,943 122,126 91,665 122,263 121,894 (369) 30,229
Advances - Net 46,547 45,988 45,263 48,594 56,795 68,630 76,664 78,634 82,331 84,522 2,191 5,888
Operating Fixed Assets 2,930 3,345 3,468 3,392 3,239 3,727 3,570 3,534 3,594 4,345 751 810
Deferred Tax Assets 1,193 1,169 1,392 1,180 1,348 973 1,105 1,140 1,039 1,270 231 130
Other Assets 5,103 4,545 5,240 7,037 7,029 7,656 6,341 6,590 7,097 7,910 814 1,320
TOTAL ASSETS 143,825 140,431 149,137 176,127 190,457 208,802 227,968 203,276 238,455 241,113 2,657 37,837
LIABILITIES
Bills Payable - - - - - - - - - - - -
Borrowings From Financial Institution 64,885 58,165 67,306 74,450 86,520 98,404 100,537 78,134 111,444 104,122 (7,322) 25,988
Deposits And Other Accounts 12,074 13,510 8,947 15,002 12,043 10,934 17,115 13,641 11,644 11,149 (495) (2,492)
Sub-ordinated Loans - - - - - - - - - 7,051 7,051 7,051
Liabilities Against Assets Subject To Finance Lease 19 11 6 0 2 2 1 1 1 107 106 105
Deferred Tax Liabilities 669 897 550 1,195 1,674 1,901 2,054 1,989 1,416 1,737 321 (252)
Other Liabilities 6,899 8,203 9,702 9,063 10,924 15,333 8,800 9,618 7,712 9,557 1,845 (60)
TOTAL LIABILITIES 84,546 80,786 86,511 99,710 111,163 126,574 128,508 103,383 132,217 133,723 1,506 30,340
NET ASSETS 59,279 59,646 62,626 76,417 79,294 82,229 99,460 99,892 106,238 107,390 1,151 7,497
NET ASSETS REPRESENTED BY: - - - - - - - - - - - - -
Share Capital 48,409 48,409 48,627 48,627 49,227 49,227 65,373 65,373 69,032 69,032 - 3,659
Reserves 7,454 6,637 7,248 9,409 10,839 11,941 13,287 14,055 14,317 15,654 1,337 1,599
Unappropriated Profit 2,513 2,485 4,579 14,358 15,867 16,711 18,827 17,956 22,581 21,252 (1,329) 3,296
Share Holders' Equity 58,375 57,532 60,454 72,395 75,934 77,879 97,487 97,384 105,930 105,938 8 8,554
Surplus/Deficit On Revaluation Of Assets 904 443 537 4,022 3,361 4,350 1,973 2,508 308 1,452 1,143 (1,057)
TOTAL 59,279 57,975 60,992 76,417 79,294 82,229 99,460 99,892 106,238 107,390 1,151 7,497
OPERATING POSITION
Mark-Up/ Return/Interest Earned 15,202 14,928 11,320 14,001 13,945 11,985 12,877 2,717 13,807 4,779 2,062
Mark-Up/ Return/Interest Expenses 8,030 8,524 5,906 6,949 5,927 6,027 6,408 1,425 6,764 2,556 1,131
Net Mark-Up / Interest Income 7,172 6,403 5,414 7,052 8,019 5,959 6,469 1,292 7,043 2,223 931
Provisions & Bad Debts Written Off Directly/(Reversals) 941 3,975 63 (6) 920 (1,608) (540) (220) (119) 165 384
Net Mark-Up / Interest Income After Provision 6,231 2,428 5,350 7,059 7,099 7,567 7,009 1,512 7,161 2,059 547
Fees, Commission & Brokerage Income 124 108 134 158 135 275 355 48 206 40 (8)
Dividend Income 854 1,036 1,469 764 803 978 1,258 478 832 820 343
Income From Dealing In Foreign Currencies (160) 148 143 (81) 79 3 60 52 303 17 (35)
Other Income 534 1,329 1,766 4,700 5,384 5,240 3,699 415 3,296 179 (235)
Total Non - Markup / Interest Income 1,352 2,620 3,511 5,541 6,401 6,496 5,372 992 4,637 1,057 65
Total Income 7,583 5,049 8,861 12,600 13,500 14,063 12,381 2,504 11,798 3,116 611
Administrative Expenses 3,102 3,396 3,659 3,866 4,598 4,614 4,208 947 4,478 1,174 228
Other Expenses 1,905 399 (12) 33 101 215 206 74 203 37 (36)
Total Non-Markup/Interest Expenses 5,007 3,795 3,646 3,899 4,699 4,829 4,415 1,020 4,681 1,211 191
Profit before Tax and Extra ordinary Items 2,576 1,254 5,215 8,701 8,801 9,233 7,967 1,484 7,117 1,904 420
Extra ordinary/unusual Items -- Gain/(Loss) - - - - - - - - - - -
Profit/ (Loss) Before Taxation 2,576 1,254 5,215 8,701 8,801 9,233 7,967 1,484 7,117 1,904 420
Less: Taxation 1,690 1,501 758 1,425 2,639 2,248 2,644 377 2,129 513 135
Profit/ (Loss) after Taxation 886 (247) 4,458 7,276 6,162 6,985 5,322 1,106 4,988 1,391 285
Mar-19
Mar-19
Mar-18
Mar-18
Dec-18
Dec-18
Dec-17
Dec-17Change
YoY
Absolute change Financial Position
PKR million
CY11
Dec-15CY13
CY12 CY13 Dec-14
CY12CY11 Dec-14
Dec-16
Dec-16
Dec-15

Quarterly Compendium: Banking Statistics
27
Table 3.3: List of Development Finance Institutions
As of March 31, 2018 As of March 31, 2019
1. House Building Finance Company Ltd. 1. House Building Finance Company Ltd.
2. PAIR Investment Company Ltd. 2. PAIR Investment Company Ltd.
3. Pak Brunei investment Company Ltd. 3. Pak Brunei investment Company Ltd.
4. Pak Libya Holding Company Ltd. 4. Pak Libya Holding Company Ltd.
5. Pak Oman Investment Company Ltd. 5. Pak Oman Investment Company Ltd.
6. Pak-China Investment Company Ltd. 6. Pak-China Investment Company Ltd.
7. Pakistan Kuwait Investment Company Ltd. 7. Pakistan Kuwait Investment Company Ltd.
8. Saudi Pak Industrial & Agricultural Investment Company Ltd. 8. Saudi Pak Industrial & Agricultural Investment Company Ltd.
9. Pakistan Mortgage Refinance Corporation*.
* SBP declared "Pakistan Mortgage Refinance Corporation" as DFI with effect from June 16, 2018

Quarterly Compendium: Banking Statistics
28
4. Microfinance Banks (MFBs)

Quarterly Compendium: Banking Statistics
29
Table 4.1: Financial Soundness Indicators of MFBs
Percent
Dec-11 Dec-12 Dec-13 Dec-14 Dec-15 Dec-16 Sep-17 Dec-17 Sep-18 Dec-18 Mar-19
Capital*
Total Capital to Total RWA 42.6 37.7 29.1 23.7 21.7 21.4 20.1 22.6 22.6
Tier 1 Capital to Total RWA 41.9 36.9 27.9 22.0 19.6 19.5 17.7 20.2 20.2
Capital to Total Assets 20.8 20.2 18.7 14.7 13.9 13.6 14.7 15.5 15.7
Asset Quality
NPLs to Total Loans 2.2 1.0 1.0 1.2 1.3 2.5 2.1 1.5 2.7 2.4 3.2
Provision to NPLs 102.7 163.7 89.5 88.7 88.3 86.4 104.0 124.6 95.9 92.1 84.9
Net NPLs to Net Loans -0.1 -0.7 0.1 0.1 0.2 0.3 -0.1 -0.4 0.1 0.2 0.5
Net NPLs to Capital 0.3 0.3 0.5 1.2 -0.3 -1.5 0.5 0.7 1.9
Earnings
ROA before Tax -0.6 -0.1 1.8 2.4 3.6 3.2 4.2 4.3 3.0 2.9 1.2
ROA after Tax -1.1 -0.7 1.1 1.7 2.4 2.1 2.9 3.0 1.8 1.7 0.3
ROE before Tax -2.6 -0.6 7.8 11.2 17.8 19.5 27.9 29.4 21.9 20.7 7.9
ROE after Tax -4.4 -2.9 4.7 8.0 12.0 12.5 19.1 20.5 13.5 11.9 2.0
Net Interest Income to Gross Income 73.2 72.7 71.7 66.8 63.2 66.3 58.7 58.4 71.4 71.3 74.5
Net Interest Margin (NIM) 14.4 13.5 13.5 15.6 16.3 15.0 17.1 16.7 15.3 15.1 14.9
Cost / Income Ratio 91.4 86.9 83.7 81.2 77.3 73.3 76.8 76.4 74.6 75.1 80.3
Admin Expenses to Total Assets 13.9 12.9 12.9 15.1 16.0 13.6 18.5 18.2 13.1 13.1 13.2
Operational Self Sufficiency (OSS) 80.5 82.5 87.1 83.5 82.4 85.5 78.0 78.4 89.9 89.5 86.2
Cost per Borrower (PKR) 5,019 5,816 6,868 8,541 9,734 9,742 10,030 13,036 11,822 11,850 13,382
Liquidity
Liquid Assets/Total Assets 40.2 40.0 31.8 29.2 27.5 32.5 28.9 30.6 20.0 23.5 22.0
Liquid Assets/Total Deposits 87.4 75.4 55.1 47.8 42.5 46.0 38.9 40.8 27.0 32.4 30.2
Liquid Assets/Short term Liabilities 80.2 74.0 53.8 46.9 39.5 46.1 43.2 45.2 31.4 37.0 35.3
Advances/Deposits 102.9 85.0 83.6 85.4 86.7 73.0 72.9 72.0 83.0 77.7 82.8
Liquid Assets to (Deposits, Borrowings and Bills Payable) 54.9 56.2 44.5 39.7 36.1 40.8 35.7 37.6 25.0 29.5 28.3
* Data on Capital Adequacy is not available prior to Dec-13.

Quarterly Compendium: Banking Statistics
30
Table 4.2: Key variables of Balance Sheet and Profit & Loss Statement of MFBs
Table 4.3: Growth Rates of Key Variables of MFBs
PKR million
Dec-11 Dec-12 Dec-13 Dec-14 Dec-15 Dec-16 Dec-17 Mar-18 Dec-18 Mar-19
Total Assets 30,289 43,631 58,197 70,060 97,476 170,244 247,218 254,844 327,940 325,067
Investments (net) 4,800 10,389 12,913 14,579 13,334 33,433 48,869 43,835 54,576 46,819
Advances (net) 14,327 19,682 28,073 36,505 54,733 87,772 133,707 148,452 185,346 195,493
Borrowings 8,206 7,848 8,002 8,665 10,893 13,714 13,563 13,378 21,495 14,677
Deposits 13,927 23,155 33,580 42,730 63,105 120,172 185,827 188,659 238,561 236,021
Liabilities 23,518 33,797 45,428 55,191 79,145 145,935 214,641 219,050 278,970 276,834
Paid up Capital 6,965 10,373 14,760 16,297 19,114 21,418 24,452 26,390 27,652 28,592
Equity 6,746 9,827 12,770 14,869 18,332 24,309 32,577 35,795 48,970 48,233
Profit Before Tax (ytd) (164) (46) 895 1,529 2,956 4,213 7,548 2,227 7,991 960
Profit After Tax (ytd) (281) (235) 538 1,090 1,997 2,709 5,247 1,468 4,606 238
Provisioning Charges (ytd) 361 552 353 533 754 2,204 2,285 573 4,135 1,719
Non-Performing Loans 315 209 289 426 730 2,200 2,043 2,786 4,556 6,501
Provisions Held Against NPLs (324) (341) (259) (378) (644) (1,900) (2,546) (3,198) (4,195) (5,521)
Non-Performing Loans (net) (9) (133) 30 48 86 300 (503) (411) 362 980
Note: Statistics of profits are on year-to-date (ytd) basis.
Percent
Growth Rates YoY YoY YoY YoY QoQ YoY QoQ YoY QoQ YoY QoQ YoY QoQ YoY
Total Assets 44.0 33.4 20.4 39.1 14.9 74.7 13.8 45.2 3.1 49.6 19.7 32.7 (0.9) 27.6
Investments (net) 116.5 24.3 12.9 (8.5) 43.9 150.7 15.0 46.2 (10.3) 65.3 40.6 11.7 (14.2) 6.8
Advances (net) 37.4 42.6 30.0 49.9 12.6 60.4 13.7 52.3 11.0 50.5 9.9 38.6 5.5 31.7
Borrowings (4.4) 2.0 8.3 25.7 0.7 25.9 5.5 (1.1) (1.4) (8.0) 58.8 58.5 (31.7) 9.7
Deposits 66.3 45.0 27.2 47.7 17.9 90.4 15.2 54.6 1.5 56.8 17.3 28.4 (1.1) 25.1
Liabilities 43.7 34.4 21.5 43.4 17.4 84.4 14.2 47.1 2.1 51.1 18.3 30.0 (0.8) 26.4
Paid up Capital 48.9 42.3 10.4 17.3 0.0 12.1 6.1 14.2 7.9 22.4 2.7 13.1 3.4 8.3
Equity 45.7 29.9 16.4 23.3 1.7 32.6 11.3 34.0 9.9 40.8 28.0 50.3 (1.5) 34.7
Profit Before Tax (ytd) (71.8) (2,037.9) 70.8 93.4 18.1 42.5 46.4 79.1 (70.5) 51.3 35.3 5.9 (88.0) (56.9)
Profit After Tax (ytd) (16.4) (329.0) 102.6 83.3 12.2 35.7 48.4 93.7 (72.0) 47.0 26.7 (12.2) (94.8) (83.8)
Provisioning Charges (ytd) 53.1 (36.2) 51.1 41.6 129.3 192.1 29.7 3.7 (74.9) 18.6 39.4 81.0 (58.4) 200.2
Non-Performing Loans (33.8) 38.6 47.4 71.3 72.7 201.4 (18.3) (7.1) 36.4 23.1 (4.0) 123.0 42.7 133.3
Provisions Held Against NPLs 5.5 (24.2) 46.1 70.4 82.4 194.9 (2.1) 34.0 25.6 51.2 (7.8) 64.8 31.6 72.6
Non-Performing Loans (net) 1,436.1 (122.8) 58.5 78.2 29.1 250.4 402.8 (267.4) (18.2) (377.1) 84.1 (172.0) 171.0 (338.2)
Dec-12 Dec-13 Dec-14 Mar-18Dec-17Dec-15 Mar-19Dec-18Dec-16
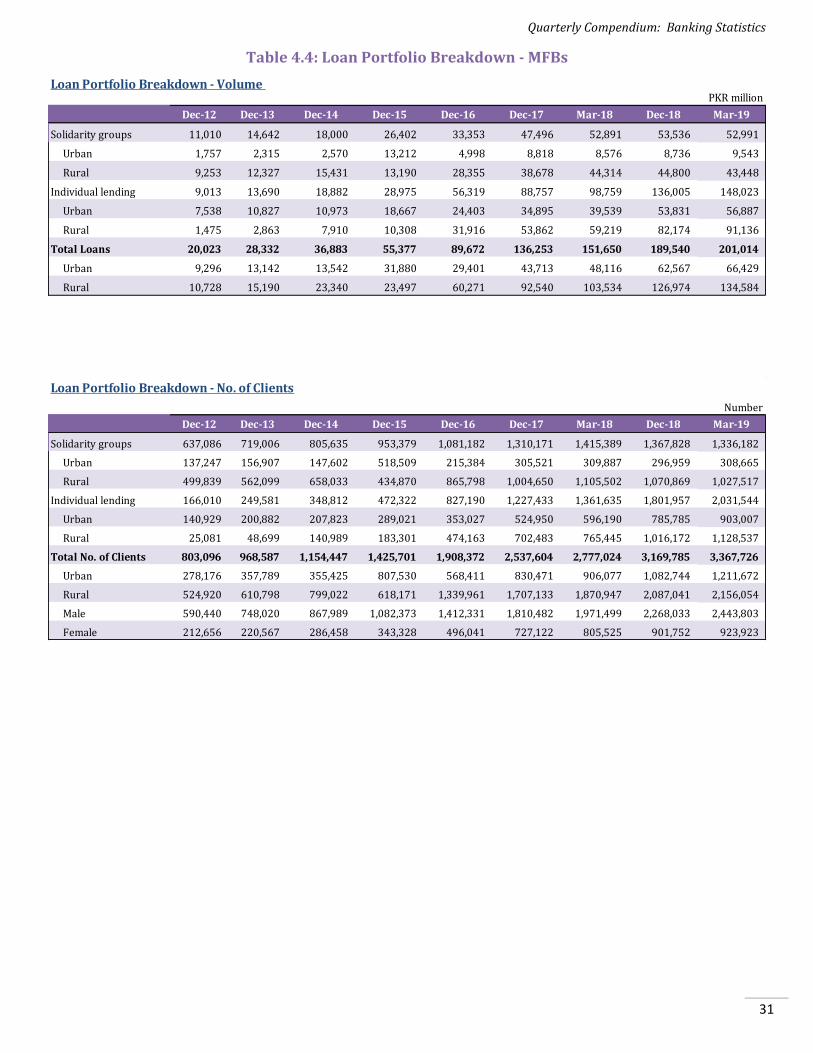
Quarterly Compendium: Banking Statistics
31
Table 4.4: Loan Portfolio Breakdown - MFBs
PKR million
Dec-12 Dec-13 Dec-14 Dec-15 Dec-16 Dec-17 Mar-18 Dec-18 Mar-19
Solidarity groups 11,010 14,642 18,000 26,402 33,353 47,496 52,891 53,536 52,991
Urban 1,757 2,315 2,570 13,212 4,998 8,818 8,576 8,736 9,543
Rural 9,253 12,327 15,431 13,190 28,355 38,678 44,314 44,800 43,448
Individual lending 9,013 13,690 18,882 28,975 56,319 88,757 98,759 136,005 148,023
Urban 7,538 10,827 10,973 18,667 24,403 34,895 39,539 53,831 56,887
Rural 1,475 2,863 7,910 10,308 31,916 53,862 59,219 82,174 91,136
Total Loans 20,023 28,332 36,883 55,377 89,672 136,253 151,650 189,540 201,014
Urban 9,296 13,142 13,542 31,880 29,401 43,713 48,116 62,567 66,429
Rural 10,728 15,190 23,340 23,497 60,271 92,540 103,534 126,974 134,584
Loan Portfolio Breakdown - Volume
Number
Dec-12 Dec-13 Dec-14 Dec-15 Dec-16 Dec-17 Mar-18 Dec-18 Mar-19
Solidarity groups 637,086 719,006 805,635 953,379 1,081,182 1,310,171 1,415,389 1,367,828 1,336,182
Urban 137,247 156,907 147,602 518,509 215,384 305,521 309,887 296,959 308,665
Rural 499,839 562,099 658,033 434,870 865,798 1,004,650 1,105,502 1,070,869 1,027,517
Individual lending 166,010 249,581 348,812 472,322 827,190 1,227,433 1,361,635 1,801,957 2,031,544
Urban 140,929 200,882 207,823 289,021 353,027 524,950 596,190 785,785 903,007
Rural 25,081 48,699 140,989 183,301 474,163 702,483 765,445 1,016,172 1,128,537
Total No. of Clients 803,096 968,587 1,154,447 1,425,701 1,908,372 2,537,604 2,777,024 3,169,785 3,367,726
Urban 278,176 357,789 355,425 807,530 568,411 830,471 906,077 1,082,744 1,211,672
Rural 524,920 610,798 799,022 618,171 1,339,961 1,707,133 1,870,947 2,087,041 2,156,054
Male 590,440 748,020 867,989 1,082,373 1,412,331 1,810,482 1,971,499 2,268,033 2,443,803
Female 212,656 220,567 286,458 343,328 496,041 727,122 805,525 901,752 923,923
Loan Portfolio Breakdown - No. of Clients

Quarterly Compendium: Banking Statistics
32
Table 4.5: Asset Quality of the MFBs
Table 4.6: Sector-wise Advances and Non-Performing Loans (NPLs)
PKR million
Dec-12 Dec-13 Dec-14 Dec-15 Dec-16 Dec-17 Mar-18 Dec-18 Mar-19
Advances (Gross) 20,023 28,332 36,883 55,377 89,672 136,253 151,650 189,540 201,014
NPLs 209 289 426 730 2,200 2,043 2,786 4,556 6,501
Provisions (341) (259) (378) (644) (1,900) (2,546) (3,198) (4,195) (5,521)
Advances (net) 19,682 28,073 36,505 54,733 87,772 133,707 148,452 185,346 195,493
Net NPLs (133) 30 48 86 300 (503) (411) 362 980
PKR million
Dec-12 Dec-13 Dec-14 Dec-15 Dec-16 Dec-17 Mar-18 Dec-18 Mar-19
OAEM* 109 150 191 293 599 411 612 1,014 1,526
Substandard 29 51 68 124 297 255 492 794 1,027
Doubtful 52 68 130 277 500 567 722 1,383 2,250
Loss 19 19 37 36 804 810 960 1,366 1,699
Total 209 289 426 730 2,201 2,043 2,786 4,556 6,501
* break-up available from Dec 2009 onwards
Selected Indicators of Asset Quality
Category-wise Break up of Non Performing Loans (NPLs)
Advances NPLsInfection
RatioAdvances NPLs
Infection
RatioAdvances NPLs
Infection
RatioAdvances NPLs
Infection
RatioAdvances NPLs
Infection
Ratio
Enterprises 24,158 727 3.01 34,113 585 1.72 37,595 996 2.65 46,435 1,567 3.38 47,371 2,419 5.11
Agriculture 34,062 601 1.76 52,799 599 1.13 57,643 705 1.22 62,067 1,084 1.75 65,567 1,483 2.26
Livestock 24,282 612 2.52 41,451 656 1.58 47,631 826 1.73 66,654 1,187 1.78 72,902 1,669 2.29
Long term Housing finance 350 5 1.34 631 3 0.55 978 5 0.53 2,290 8 0.35 3,701 16 0.44
Consumer lending 1 - - 83 0 0.46 3 0 0.17 654 3 0.42 910 13 1.48
others 6,819 256 3.75 7,176 199 2.77 7,799 254 3.26 11,441 707 6.18 10,562 900 8.52
Total 89,672 2,200 2.45 136,253 2,043 1.50 151,650 2,786 1.84 189,540 4,556 2.40 201,014 6,501 3.23
Mar-18
Amount in PKR million, ratio in percent
Mar-19Dec-18Dec-16 Dec-17
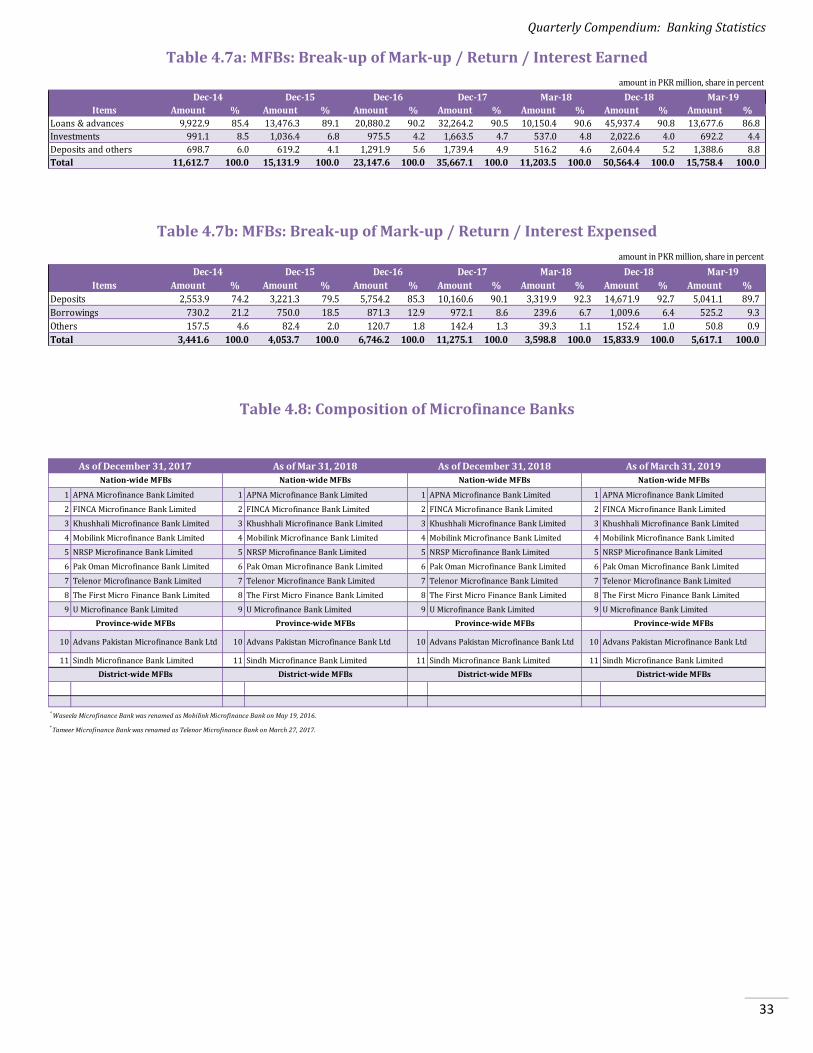
Quarterly Compendium: Banking Statistics
33
Table 4.7a: MFBs: Break-up of Mark-up / Return / Interest Earned
Table 4.7b: MFBs: Break-up of Mark-up / Return / Interest Expensed
Table 4.8: Composition of Microfinance Banks
amount in PKR million, share in percent
Items Amount % Amount % Amount % Amount % Amount % Amount % Amount %
Loans & advances 9,922.9 85.4 13,476.3 89.1 20,880.2 90.2 32,264.2 90.5 10,150.4 90.6 45,937.4 90.8 13,677.6 86.8
Investments 991.1 8.5 1,036.4 6.8 975.5 4.2 1,663.5 4.7 537.0 4.8 2,022.6 4.0 692.2 4.4
Deposits and others 698.7 6.0 619.2 4.1 1,291.9 5.6 1,739.4 4.9 516.2 4.6 2,604.4 5.2 1,388.6 8.8
Total 11,612.7 100.0 15,131.9 100.0 23,147.6 100.0 35,667.1 100.0 11,203.5 100.0 50,564.4 100.0 15,758.4 100.0
Dec-15Dec-14 Dec-17Dec-16 Mar-19Dec-18Mar-18
amount in PKR million, share in percent
Items Amount % Amount % Amount % Amount % Amount % Amount % Amount %
Deposits 2,553.9 74.2 3,221.3 79.5 5,754.2 85.3 10,160.6 90.1 3,319.9 92.3 14,671.9 92.7 5,041.1 89.7
Borrowings 730.2 21.2 750.0 18.5 871.3 12.9 972.1 8.6 239.6 6.7 1,009.6 6.4 525.2 9.3
Others 157.5 4.6 82.4 2.0 120.7 1.8 142.4 1.3 39.3 1.1 152.4 1.0 50.8 0.9
Total 3,441.6 100.0 4,053.7 100.0 6,746.2 100.0 11,275.1 100.0 3,598.8 100.0 15,833.9 100.0 5,617.1 100.0
Dec-14 Dec-15 Dec-16 Mar-19Dec-18Dec-17 Mar-18
1 APNA Microfinance Bank Limited 1 APNA Microfinance Bank Limited 1 APNA Microfinance Bank Limited 1 APNA Microfinance Bank Limited
2 FINCA Microfinance Bank Limited 2 FINCA Microfinance Bank Limited 2 FINCA Microfinance Bank Limited 2 FINCA Microfinance Bank Limited
3 Khushhali Microfinance Bank Limited 3 Khushhali Microfinance Bank Limited 3 Khushhali Microfinance Bank Limited 3 Khushhali Microfinance Bank Limited
4 Mobilink Microfinance Bank Limited 4 Mobilink Microfinance Bank Limited 4 Mobilink Microfinance Bank Limited 4 Mobilink Microfinance Bank Limited
5 NRSP Microfinance Bank Limited 5 NRSP Microfinance Bank Limited 5 NRSP Microfinance Bank Limited 5 NRSP Microfinance Bank Limited
6 Pak Oman Microfinance Bank Limited 6 Pak Oman Microfinance Bank Limited 6 Pak Oman Microfinance Bank Limited 6 Pak Oman Microfinance Bank Limited
7 Telenor Microfinance Bank Limited 7 Telenor Microfinance Bank Limited 7 Telenor Microfinance Bank Limited 7 Telenor Microfinance Bank Limited
8 The First Micro Finance Bank Limited 8 The First Micro Finance Bank Limited 8 The First Micro Finance Bank Limited 8 The First Micro Finance Bank Limited
9 U Microfinance Bank Limited 9 U Microfinance Bank Limited 9 U Microfinance Bank Limited 9 U Microfinance Bank Limited
10 Advans Pakistan Microfinance Bank Ltd 10 Advans Pakistan Microfinance Bank Ltd 10 Advans Pakistan Microfinance Bank Ltd 10 Advans Pakistan Microfinance Bank Ltd
11 Sindh Microfinance Bank Limited 11 Sindh Microfinance Bank Limited 11 Sindh Microfinance Bank Limited 11 Sindh Microfinance Bank Limited
As of Mar 31, 2018
Nation-wide MFBs
Province-wide MFBs
District-wide MFBs
As of December 31, 2017
Nation-wide MFBs
* Tameer Microfinance Bank was renamed as Telenor Microfinance Bank on March 27, 2017.
District-wide MFBs
As of March 31, 2019
Nation-wide MFBs
Province-wide MFBs
District-wide MFBs
As of December 31, 2018
Nation-wide MFBs
Province-wide MFBs
District-wide MFBs
^ Waseela Microfinance Bank was renamed as Mobilink Microfinance Bank on May 19, 2016.
Province-wide MFBs
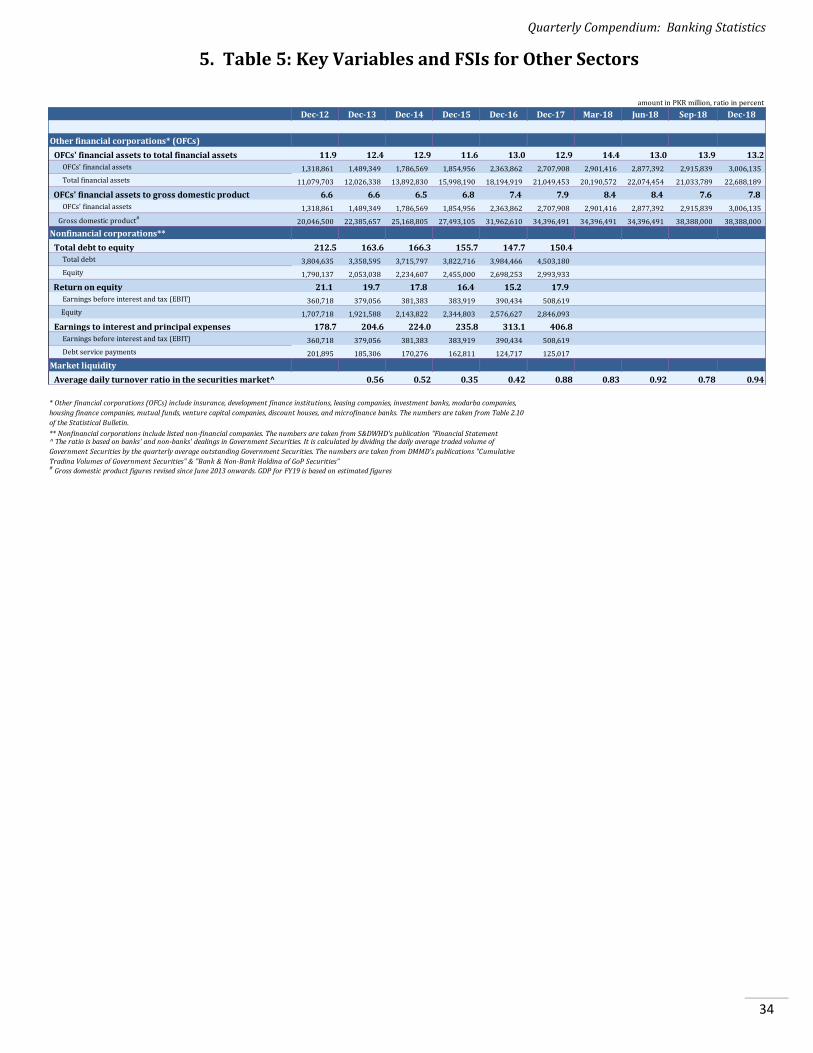
Quarterly Compendium: Banking Statistics
34
5. Table 5: Key Variables and FSIs for Other Sectors
Dec-12 Dec-13 Dec-14 Dec-15 Dec-16 Dec-17 Mar-18 Jun-18 Sep-18 Dec-18
Other financial corporations* (OFCs)
OFCs' financial assets to total financial assets 11.9 12.4 12.9 11.6 13.0 12.9 14.4 13.0 13.9 13.2
OFCs' financial assets 1,318,861 1,489,349 1,786,569 1,854,956 2,363,862 2,707,908 2,901,416 2,877,392 2,915,839 3,006,135
Total financial assets 11,079,703 12,026,338 13,892,830 15,998,190 18,194,919 21,049,453 20,190,572 22,074,454 21,033,789 22,688,189
OFCs' financial assets to gross domestic product 6.6 6.6 6.5 6.8 7.4 7.9 8.4 8.4 7.6 7.8
OFCs' financial assets 1,318,861 1,489,349 1,786,569 1,854,956 2,363,862 2,707,908 2,901,416 2,877,392 2,915,839 3,006,135
Gross domestic product#20,046,500 22,385,657 25,168,805 27,493,105 31,962,610 34,396,491 34,396,491 34,396,491 38,388,000 38,388,000
Nonfinancial corporations**
Total debt to equity 212.5 163.6 166.3 155.7 147.7 150.4
Total debt 3,804,635 3,358,595 3,715,797 3,822,716 3,984,466 4,503,180
Equity 1,790,137 2,053,038 2,234,607 2,455,000 2,698,253 2,993,933
Return on equity 21.1 19.7 17.8 16.4 15.2 17.9
Earnings before interest and tax (EBIT) 360,718 379,056 381,383 383,919 390,434 508,619
Equity 1,707,718 1,921,588 2,143,822 2,344,803 2,576,627 2,846,093
Earnings to interest and principal expenses 178.7 204.6 224.0 235.8 313.1 406.8
Earnings before interest and tax (EBIT) 360,718 379,056 381,383 383,919 390,434 508,619
Debt service payments 201,895 185,306 170,276 162,811 124,717 125,017
Market liquidity
Average daily turnover ratio in the securities market^ 0.56 0.52 0.35 0.42 0.88 0.83 0.92 0.78 0.94
# Gross domestic product figures revised since June 2013 onwards. GDP for FY19 is based on estimated figures
* Other financial corporations (OFCs) include insurance, development finance institutions, leasing companies, investment banks, modarba companies,
housing finance companies, mutual funds, venture capital companies, discount houses, and microfinance banks. The numbers are taken from Table 2.10
of the Statistical Bulletin.
** Nonfinancial corporations include listed non-financial companies. The numbers are taken from S&DWHD's publication "Financial Statement ^ The ratio is based on banks' and non-banks' dealings in Government Securities. It is calculated by dividing the daily average traded volume of
Government Securities by the quarterly average outstanding Government Securities. The numbers are taken from DMMD's publications "Cumulative
Trading Volumes of Government Securities" & "Bank & Non-Bank Holding of GoP Securities"
amount in PKR million, ratio in percent

Quarterly Compendium: Banking Statistics
35
Annexure A: Compilation Methodology of FSIs for Banks, Islamic Banks
and DFIs
1 Risk Weighted CAR Total Eligible Capital / Total Risk Weighted Assets
2 Tier 1 Capital to RWA Core Capital (Tier 1 Capital) / Total Risk Weighted Assets (RWA)
3 Capital to Total Assets Total Eligible Capital / Total Assets
4 NPLs to Total Loans NPLs / Gross Advances
5 Provisions to NPLs Provisions / NPLs
6 Net NPLs to Netloans Net NPLs / Net Advances
7 Net NPLs to Capital Net NPLs / Total Eligible Capital
8 Investment in Equities to Capital Investment in Equities to Total Eligible Capital
9
Gross Asset Position in Financial
Derivatives to Capital Gross Asset Position in Financial Derivatives to Total Eligible Capital
10
Gross Liability Position in Financial
Derivatives to Capital Gross Liability Position in Financial Derivatives to Total Eligible Capital
Annualized Profit/(Loss) before Taxation / Average Assets
Annualized Profit/(Loss) before Taxation
For Q1, multiply by 4
For Q2, multiply by 2
For Q3, multiply by 4/3
For Q4, do nothing
Average Assets
For Q1, take average of current Q1 and last year's Q4
For Q2, take average of current Q1, Q2, and last year's Q4
For Q3, take average of current Q1, Q2, Q3, and last year's Q4
For Q4, take average of current Q1, Q2, Q3, Q4 and last year's Q4
Annualized Profit/(Loss) after Taxation / Average Assets
Annualized Profit/(Loss) after Taxation
For Q1, multiply by 4
For Q2, multiply by 2
For Q3, multiply by 4/3
For Q4, do nothing
Average Assets
For Q1, take average of current Q1 and last year's Q4
For Q2, take average of current Q1, Q2, and last year's Q4
For Q3, take average of current Q1, Q2, Q3, and last year's Q4
For Q4, take average of current Q1, Q2, Q3, Q4 and last year's Q4
12 Return on Assets (After Tax)
11 Return on Assets (Before Tax)
Capital
Asset Quality
Earnings and Profitability

Quarterly Compendium: Banking Statistics
36
Annexure A: Compilation Methodology of FSIs for Banks, Islamic Banks
and DFIs (Continued)
Annualized Profit/(Loss) before Taxation / Average Equity
Annualized Profit/(Loss) before Taxation
For Q1, multiply by 4
For Q2, multiply by 2
For Q3, multiply by 4/3
For Q4, do nothing
Average Equity
For Q1, take average of current Q1 and last year's Q4
For Q2, take average of current Q1, Q2, and last year's Q4
For Q3, take average of current Q1, Q2, Q3, and last year's Q4
For Q4, take average of current Q1, Q2, Q3, Q4 and last year's Q4
Annualized Profit/(Loss) after Taxation / Average Equity
Annualized Profit/(Loss) after Taxation
For Q1, multiply by 4
For Q2, multiply by 2
For Q3, multiply by 4/3
For Q4, do nothing
Average Equity
For Q1, take average of current Q1 and last year's Q4
For Q2, take average of current Q1, Q2, and last year's Q4
For Q3, take average of current Q1, Q2, Q3, and last year's Q4
For Q4, take average of current Q1, Q2, Q3, Q4 and last year's Q4
15 Net Interest Income to Gross Income Net Interest Income / Gross Income
16 Cost / Income Ratio Non-Markup/Interest Expenses / Gross Income
17 Trading Income to Gross Income Trading Income to Gross Income
18Personnel Expenses to Non-interest
Expenses Personnel Expenses to Non-interest Expenses
19 Liquid Assets to Total Assets Liquid Assets / Total Assets
Liquid Assets = Sum of Cash & Balances With Treasury Banks, Balances With Other Banks, Call
Money Lending, and Investment in Approved Securities (PIBs and MTBs)
20 Liquid Assets to Total Deposits Liquid Assets / Total Deposits
Liquid Assets = Sum of Cash & Balances With Treasury Banks, Balances With Other Banks, Call
Money Lending, and Investment in Approved Securities (PIBs and MTBs)
21 Liquid Assets to Short term Liabilities Liquid Assets / Short term Liabilities
Liquid Assets = Sum of Cash & Balances With Treasury Banks, Balances With Other Banks, Call
Money Lending, and Investment in Approved Securities (PIBs and MTBs)
Short term Liabilities = Liabilities having maturity less than one year
22 Advances to Deposits Net Advances / Total Deposits
23 Customer Deposits to Total Loans Customer Deposits to Gross Advances
13 ROE (Avg. Equity& Surplus) (Before
Tax)
14 ROE (Avg. Equity &Surplus) (After Tax)
Liquidity

Quarterly Compendium: Banking Statistics
37
Annexure A: Compilation Methodology of FSIs for Banks, Islamic Banks
and DFIs (Continued)
24 Domestic Loans to Total Loans Domestic Loans to Gross Advances
25
Public Sector Domestic Loans to Total
Loans Public Sector Domestic Loans to Gross Advances
26
Domestic Loans to Fiancial
Institutions/Total LoansDomestic Loans to Fiancial Institutions/Gross Advances
27
Corporate & SME Sector Domestic
Loans to Total LoansCorporate & SME Sector Domestic Loans to Gross Advances
28Other Domestic Loans to Total Loans
Other Domestic Loans to Gross Advances
29Overseas Loans to Total Loans
Overseas Loans to Gross Advances
30Foreign Currency Loans to Total Loans
Foreign Currency Loans to Gross Advances
31
Foreign Currency Liabilities to Total
Liabilities Foreign Currency Liabilities to Gross Advances
32
Residential Real Estate Loans to Total
Loans Residential Real Estate Loans to Gross Advances
33
Commercial Real Estate Loans to Total
Loans Commercial Real Estate Loans to Gross Advances
34
Spread between lending and deposit
rates Weighted Average Lending Rate minus Weighted Average Deposit Rate
35
Spread between highest and lowest
interbank rates Highest Interbank Rate minus Lowest Interbank Rate
Sectroral Distribution of Loans

Quarterly Compendium: Banking Statistics
38
Annexure B: Compilation Methodology of FSIs for MFBs
1
Total Eligible Capital to Total Risk Weighted
Assets (CAR) Total Eligible Capital / Total Risk Weighted Assets
2 Core Capital (Tier 1 Capital) to Total RWA Core Capital (Tier 1 Capital) / Total Risk Weighted Assets (RWA)
3 Capital to Total Assets Total Eligible Capital / Total Assets
4 NPLs to Advances NPLs / Gross Advances
5 Net NPLs to Net Advances Net NPLs / Net Advances
6 Provisions to NPLs Provisions / NPLs
7 Net NPLs to Capital Net NPLs / Total Eligible Capital
Annualized Profit/(Loss) before Taxation / Average Assets
Annualized Profit/(Loss) before Taxation
For Q1, multiply by 4
For Q2, multiply by 2
For Q3, multiply by 4/3
For Q4, do nothing
Average Assets
For Q1, take average of current Q1 and last year's Q4
For Q2, take average of current Q1, Q2, and last year's Q4
For Q3, take average of current Q1, Q2, Q3, and last year's Q4
For Q4, take average of current Q1, Q2, Q3, Q4 and last year's Q4
Annualized Profit/(Loss) after Taxation / Average Assets
Annualized Profit/(Loss) after Taxation
For Q1, multiply by 4
For Q2, multiply by 2
For Q3, multiply by 4/3
For Q4, do nothing
Average Assets
For Q1, take average of current Q1 and last year's Q4
For Q2, take average of current Q1, Q2, and last year's Q4
For Q3, take average of current Q1, Q2, Q3, and last year's Q4
For Q4, take average of current Q1, Q2, Q3, Q4 and last year's Q4
Annualized Profit/(Loss) before Taxation / Average Equity
Annualized Profit/(Loss) before Taxation
For Q1, multiply by 4
For Q2, multiply by 2
For Q3, multiply by 4/3
For Q4, do nothing
Average Equity
For Q1, take average of current Q1 and last year's Q4
For Q2, take average of current Q1, Q2, and last year's Q4
For Q3, take average of current Q1, Q2, Q3, and last year's Q4
For Q4, take average of current Q1, Q2, Q3, Q4 and last year's Q4
10 ROE (Avg. Equity& Surplus) (Before Tax)
9 Return on Assets (After Tax)
8 Return on Assets (Before Tax)
Capital
Asset Quality
Earnings and Profitability

Quarterly Compendium: Banking Statistics
39
Annexure B: Compilation Methodology of FSIs for MFBs (Continued)
Annualized Profit/(Loss) after Taxation / Average Equity
Annualized Profit/(Loss) after Taxation
For Q1, multiply by 4
For Q2, multiply by 2
For Q3, multiply by 4/3
For Q4, do nothing
Average Equity
For Q1, take average of current Q1 and last year's Q4
For Q2, take average of current Q1, Q2, and last year's Q4
For Q3, take average of current Q1, Q2, Q3, and last year's Q4
For Q4, take average of current Q1, Q2, Q3, Q4 and last year's Q4
12 Net Interest Income to Gross Income Net Interest Income / Gross Income
Annualized Net Interest Income / Average Earning Assets
Annualized Net Mark-Up / Interest Income
For Q1, multiply by 4
For Q2, multiply by 2
For Q3, multiply by 4/3
For Q4, do nothing
Earning Assets = Sum of Balances With Other Banks, Lending To Financial Institutions,
Investments - Net and Advances - Net
Average Earning Assets
For Q1, take average of current Q1 and last year's Q4
For Q2, take average of current Q1, Q2, and last year's Q4
For Q3, take average of current Q1, Q2, Q3, and last year's Q4
For Q4, take average of current Q1, Q2, Q3, Q4 and last year's Q4
14 Cost / Income Ratio Non-Markup/Interest Expenses / Gross Income
15 Admin Expenses to Total Assets Admin Expenses / Total Assets
Financial Revenue / (Financial Expenses + Provision for Loan Losses + Operating Expenses)
Financial Revenue = Mark-up /Return /Interest Earned
(Financial Expenses = Markup / Interest Expense)+ Provision for Loan Losses + Operating
Expenses
17 Cost per Borrower (PKR) Operating Expenses / Average Number of Outstanding Borrowers
Liquid Assets / Total Assets
Liquid Assets = Sum of Cash & Balances With Treasury Banks, Balances With Other Banks, Call
Money Lending, and Investment in Approved Securities (PIBs and MTBs)
Liquid Assets / Total Deposits
Liquid Assets = Sum of Cash & Balances With Treasury Banks, Balances With Other Banks, Call
Money Lending, and Investment in Approved Securities (PIBs and MTBs)
Liquid Assets / Short term Liabilities
Liquid Assets = Sum of Cash & Balances With Treasury Banks, Balances With Other Banks, Call
Money Lending, and Investment in Approved Securities (PIBs and MTBs)
Short term Liabilities = Liabilities having maturity less than one year
21 Advances to Deposits Net Advances /Total Deposits
22
Liquid Assets to (Deposits, Borrowings and
Bills Payable) Liquid Assets to (Deposits, Borrowings and Bills Payable)
19 Liquid Assets to Total Deposits
20 Liquid Assets to Short term Liabilities
18 Liquid Assets to Total Assets
13 Net Interest Margin (NIM)
16 Operational Self Sufficiency (OSS)
Liquidity
11 ROE (Avg. Equity &Surplus) (After Tax)


![County: CY 2018* CY 2019 CY 2020 ALAMANCE OO #1 · County: CY 2018* CY 2019 CY 2020 512 55 31.3% 0.8% 18.0% [1] Note: CY 2018 is baseline data [2] *OO #1 is the denominator for OO](https://img.pdfslide.us/doc/110x75/604bda711fef087ac12d0021/county-cy-2018-cy-2019-cy-2020-alamance-oo-1-county-cy-2018-cy-2019-cy-2020.jpg)