Embed Size (px)
Citation preview

FINANCIAL SERVICES
Technical Practices
Survey 2014
Risk and Capital Management
kpmg.co.uk

B TPS 2014
Contents
© 2014 KPMG LLP, a UK limited liability partnership, is a subsidiary of KPMG Europe LLP and a member firm of the KPMG network of independent member fi rms affiliated with KPMG International Cooperative, a Swiss entity. All rights reserved.
1 Foreword 1
2 Executive summary 2
3 Introduction 3
3.1: Objectives 3
3.2: Survey methodology 3
3.3: Topics of interest 4
3.4: Interpretation of the results 4
4 Profi le of Respondents 5
4.1: Profi le 5
4.2: Size of actuarial function 9
4.3: Which Peak is biting? 12
4.4: Which Pillar is biting? 12
5 Assets 13
5.1: Investment Strategy: Current vs. future Solvency II 14
5.2: Asset transition plan for Solvency II 15
5.3: Strategy for issuer options in light of the Matching Adjustment under Solvency II 16
5.4: Pillar 3 readiness for assets 17
5.5: Challenges faced when investing in alternative assets 18
5.6: Total assets and alternative assets 19
5.7: Rationale for investing in alternative assets 23
6 Solvency I 24
6.1: Base mortality assumptions 24
6.2: Mortality improvement model 26
6.3: Choice of CMI model 27
6.4: Long term improvement factor (CMI model) or underpin (cohort model) 28
6.5: Liquidity premium 29
7 With-Profi ts 30
7.1: The with-profi ts landscape 31
7.2: With-profi ts capital strength 33
7.3: Solvency II and with-profi ts 35
7.4: With-profi ts risk management 37
8 Risk Capital 41
8.1: All Risks 41
8.2: Market Risk Modelling 48
8.3: Interest Rate Risk 51
8.4: Credit Spread Risk 57

8.5: Equity risk 62
8.6: Equity, Property and Interest Rate Volatility 63
8.7: Market Risk Diversifi cation 68
8.8: Credit Default Risk 69
8.9: Insurance Risk 72
8.10: Mortality and longevity risk 73
8.11: Morbidity Risk 87
8.12: Persistency Risk 91
8.13: Mass Lapse Risk 99
8.14: Expense Risk 104
8.15: Liquidity risk 107
8.16: Operational Risk 109
8.17: Aggregation 113
8.18: Capital Fungibility 124
9 Modelling 125
9.1: Modelling platforms 125
9.2: Economic Scenario Generators 126
9.3: Projecting the balance sheet 127
9.4: Projecting new business 129
10 Solvency II 131
10.1: Transition from ICA to Solvency II 131
10.2: Solvency II Approach 139
10.3: Profi t and Loss Attribution 156
11 Financial Reporting 158
11.1: Analysis of change 158
11.2: The most important metric to the Board 163
11.3: Experience Analysis 164
11.4: Solvency monitoring 165
11.5: IFRS 4, phase II 170
11.6: Current Embedded Value Reporting 175
11.7: Embedded Value Reporting in the Future 176
11.8: Key differences between Embedded Value Reporting and Solvency II in the Future 177
12 Tax 179
12.1: Deferred Tax on the Stressed Balance Sheet 180
12.2: Future position and tax modelling 184
12.3: Tax Methodology 186
13 Acknowledgements 187
14 List of participants 189
© 2014 KPMG LLP, a UK limited liability partnership, is a subsidiary of KPMG Europe LLP and a member fi rm of the KPMG network of independent member fi rms affi liated with KPMG International Cooperative, a Swiss entity. All rights reserved.

1 Foreword
As always, it gives me great pleasure to present our report on this year’s Technical Practices Survey.
John A Jenkins
Partner, KPMG LLP
Now in its ninth year, our Technical Practices Survey continues to be highly regarded by individuals, respondents and indeed other consultancies as a guide to the range of practices adopted in various areas of UK life actuarial work.
The main focus of our Technical Practices Survey remains on ICA, to identify how practices have changed since last year. However, with the greater clarity around the Solvency II implementation date, we have expanded this section to explore a number of current issues relating to Solvency II. Our approach aims to build on the experience of past surveys and deliver more insights into the UK life industry’s approach to both the ICA and Solvency II.
Working in a top advisory fi rm, some of the most common questions we have been asked by our clients over the last 12 months relate to ICA and the transition towards Solvency II. Therefore, specifi c questions on these areas were included, focusing on what other respondents are doing, how they approach certain problems and what best practice (and the range of practices) on certain items appears to be.
The survey requires a large investment of resources on our part – an investment that we think is well worth the time and effort because of the usefulness of the results. We are grateful to all the respondents who found the time in their busy schedules to take part and would like to extend our thanks to all of you once again. In Section 14 of this report, we have listed the 32 respondents who have contributed to this survey. As I am sure you will agree, the range of fi rms involved by size and type makes the results set out an excellent indication of the UK life industry’s approach to ICA and Solvency II. I hope that if you have not been able to take part in the survey this year that you would be able to do so in 2015.
I would like to extend a very special thank you to all my colleagues for their hard work in carrying out the survey and compiling this report (details of whom can be found in Section 13), whilst at the same time carrying out their client service responsibilities. I would also like to extend particular thanks to Kim Owen, Simon Hogley, and Jane Parker for their hard work in managing the survey.
I believe that you will fi nd this report useful and interesting and look forward to receiving any comments or suggestions you may have on how we can make the questions, analysis or report even more useful or relevant to you.
Regards
John A Jenkins
Partner, KPMG LLP
1 TPS 2014
© 2014 KPMG LLP, a UK limited liability partnership, is a subsidiary of KPMG Europe LLP and a member firm of the KPMG network of independent member fi rms affiliated with KPMG International Cooperative, a Swiss entity. All rights reserved.

2 Executive Summary
The purpose of our Technical Practices Survey is to enable UK life insurance fi rms to identify where the key technical issues lie within the industry, and the range of methodologies and approaches that have been used.
In addition to the insight gained from the responses to each of the distinct survey questions, we have observed some overall themes from our analysis of this year’s responses.
With regard to the calculation of risk capital under the ICA, we have observed that fi rms’ approaches are broadly consistent with last year. Other than the specifi c points noted below, the calibration of stresses and modelling techniques in use has been largely stable.
The standard industry approach for applying longevity stresses under the ICA has been to use a run-off approach. As we move towards Solvency II, the industry has been considering whether this approach is still appropriate. The Solvency II Risk Margin should cover the risk from time 1 onwards and so potentially the run-off approach results in double counting the capital requirement. We have observed that a number of respondents are now using an approach based on a 1-year stress, and increased use of this approach is consistent with our expectation as the implementation of Solvency II approaches. We can understand both approaches and we believe that there are challenges to overcome with both of them.
We observed movement in fi rms’ aggregation methodology, with an increased use of simulation and copula approaches. This movement is also to be expected as fi rms align to Solvency II, however it is interesting to see this borne out by results.
We have increased the granularity with which we asked questions relating to interest rate and credit spread risk, and also relating to correlations. In particular, our questions relating to interest and credit risk have been split by duration in addition to by credit rating. This year is the fi rst time that we have asked respondents to populate a template correlation matrix. We believe that these examples of additional granularity represent an improvement to the survey and will be more useful for fi rms’ benchmarking requirements.
With regard to Solvency II, we observe that larger Internal Model or Partial Internal Model fi rms are focussing on Pillar 3 and IMAP, while the focus of Standard Formula fi rms remains on Pillar 1 valuation and the ORSA. There is still uncertainty over the fi nal form of the regulations, in particular for the Matching Adjustment and Volatility Adjustment, and we have observed that many fi rms are not intending to apply for the Matching Adjustment or use the Volatility Adjustment. In terms of the overall Solvency II impact, half of respondents indicated that they are worse off under Solvency II (including 11 fi rms who stated they will be materially worse off).
We have observed some movement in fi rms’ use or intended use of embedded value. Compared to last year, there are now more fi rms adopting full Market Consistent Embedded Values or Market Consistent European Embedded Values. Of the fi rms who currently produce embedded value results, a quarter of fi rms intend to continue reporting embedded value, just under a quarter of fi rms intend to discontinue reporting embedded value, and just over half of fi rms are undecided.
TPS 2014
© 2014 KPMG LLP, a UK limited liability partnership, is a subsidiary of KPMG Europe LLP and a member firm of the KPMG network of independent member fi rms affiliated with KPMG International Cooperative, a Swiss entity. All rights reserved.
2

3 Introduction
3.1 OBJECTIVES
3.2 SURVEY METHODOLOGY
3 TPS 2014
© 2014 KPMG LLP, a UK limited liability partnership, is a subsidiary of KPMG Europe LLP and a member firm of the KPMG network of independent member fi rms affiliated with KPMG International Cooperative, a Swiss entity. All rights reserved.
The KPMG Life Actuarial team has been carrying out the Technical Practices Survey since 2006. This year our aim has been to provide detailed analysis on how the UK life insurance industry has approached the year end 2013 ICA process and calculation, and also to provide insight into the main technical challenges fi rms are facing with regard to Solvency II implementation.
The data for this project was collected through a survey that was sent out to respondents for completion in May and June. In order to make the data as representative as possible, almost every UK life offi ce with an internal actuarial function was invited to participate. We attempted to keep the survey to a reasonable length and were hopeful it was not too onerous to complete.
For data protection and commercial confi dentiality reasons, individual responses have been, and will continue to be, treated with strictest confi dence. For the purposes of this report, the results have all been presented in an aggregate format or have been made anonymous.
The survey primarily contained multiple choice or numeric response questions. Multiple choice questions typically are quicker to answer than open response questions and so we have used the multiple choice format wherever possible (with a suitable other or not applicable option) so that the survey could be completed in a time-effi cient manner. Each year we review the feedback we receive in order to improve the options for these questions.
Note that where results are presented as percentage of fi rms, there are instances where the sum of the separate components may not total exactly 100% due to rounding.
Introduction
We wanted to highlight any common issues that respondents may be
having, as well as provide a reflection of the variety of approaches adopted
within the industry.
3.3 TOPICS OF INTEREST The survey questions were designed to address the issues that clients have raised over the past 12 months. This year’s survey has kept the main area of focus on the ICA to enable comparisons with last year. However, to refl ect the greater clarity around the Solvency II implementation date, we also expanded this section to cover some of the main technical challenges fi rms are facing with regard to Solvency II implementation.
As with prior years, the survey also covered other areas where fi rms have experienced some diffi culty with actuarial techniques. We asked questions relating to alternative assets, with-profi ts, Solvency I, other reporting metrics, and deferred tax assets. We wanted to highlight any common issues that respondents may be having, as well as providing a refl ection of the variety of approaches adopted within the industry.
3.4 INTERPRETATION OF THE RESULTS
TPS 2014
© 2014 KPMG LLP, a UK limited liability partnership, is a subsidiary of KPMG Europe LLP and a member firm of the KPMG network of independent member fi rms affiliated with KPMG International Cooperative, a Swiss entity. All rights reserved.
4
Our survey was targeted at over 60 UK life offi ces with internal actuarial functions, and we are delighted to have had 32 responses this year.
The true test of the survey is that it continues to retain a signifi cant level of interest. It is pleasing to see that this year we have a high response rate despite the burden presented by reporting requirements and their developments. We believe that this refl ects that fi rms participating in the survey continue to fi nd the results to be very useful and relevant.
While the number of responses should be considered as very healthy for this type of survey, the response rate alone does not convey all the information about the representative nature of the survey. For example, some individual responses were completed on behalf of all the separate insurance businesses within an individual group. The responses have been from fi rms of varying sizes which operated in a wide range of markets. Additionally, respondents varied in structure and have included some that were part of larger (often multi-national) groups; others are large in their own right and listed on various European exchanges.
When presenting our analysis we have also provided the context for our fi ndings by including a profi le of the respondents. A graphical representation of the respondents can be found in Section 4, and a full list of participant is in Section 14 of this report. Most of the major UK life offi ces have taken part in the survey.

4 Profi le of Respondents
In order to set the context for the findings of the survey, this section outlines the profile of survey participants.The profi le captures respondents’ attributes such as size of in-force liabilities in terms of Peak 1 insurance liabilities plus WPICC, ownership status, composition of in-force business by product class and reporting basis.
We have also included in this section an analysis of the number of actuarial staff working in fi rst and second line functions.
4.1 PROFILE
5 TPS 2014
© 2014 KPMG LLP, a UK limited liability partnership, is a subsidiary of KPMG Europe LLP and a member firm of the KPMG network of independent member fi rms affiliated with KPMG International Cooperative, a Swiss entity. All rights reserved.
Our survey received participation from a wide spectrum of respondents in the UK life insurance market, ranging from small to large businesses in terms of their in-force liabilities. We have categorised respondents by size, with reference to the size of their Peak 1 insurance liabilities plus WPICC.
Throughout this year’s survey, we use the following defi nition when referring to the size of the respondent:
Small: Peak 1 liabilities plus WPICC totalling less than £500m
Medium: Peak 1 liabilities plus WPICC totalling more than £500m, but less than £5bn
Large: Peak 1 liabilities plus WPICC totalling more than £5bn

Profile of Respondents
Graph 4.1.1:
Respondents by size of Peak I liabilities plus WPICC as at 31 December 2013
16%
53%
31%
Small
Medium
Large
Graph 4.1.1 shows that out of 32 respondents, 16% are small, 31% are medium and 53% are large. The profi le of respondents is very similar to that in the 2013 survey, hence making it possible to compare trends in responses over recent years.
Graph 4.1.2:
Respondents by ownership status
22%
34%
38%
3% 3%
TPS 2014
© 2014 KPMG LLP, a UK limited liability partnership, is a subsidiary of KPMG Europe LLP and a member firm of the KPMG network of independent member fi rms affiliated with KPMG International Cooperative, a Swiss entity. All rights reserved.
6
Listed Company
Has listed parents
Unlisted company
Part of unlisted group
Mutual
The respondents represent a diverse group by ownership status, as indicated in Graph 4.1.2. Most respondents are listed, either directly (22%) or through a parent company (38%). Mutuals comprise 34% of respondents while just 6% of respondents were unlisted.

Profile of Respondents
Graph 4.1.3:
Composition of in force business of respondents in terms of Peak 1 liabilities plus WPICC
13%
18%
38%
1%
11%
11%
10%
7 TPS 2014
© 2014 KPMG LLP, a UK limited liability partnership, is a subsidiary of KPMG Europe LLP and a member firm of the KPMG network of independent member fi rms affiliated with KPMG International Cooperative, a Swiss entity. All rights reserved.
Conventional with-profits business
Unitised with-profits business
Non-linked non-profit business
Unit-linked business
Annuities
Reinsurance accepted
Other
Graph 4.1.3 shows the average composition of the in-force business by product class in terms of Peak 1 insurance liabilities plus WPICC. Unit-linked business remains the largest product class, as it was in 2013, accounting for over a third of the total. The next largest class is annuities, which accounts for 18% of the total. This is again very similar to previous years; however, we might expect to see a gradual decline in this proportion in the future following the changes to retirement income announced in the budget this year. In total, with-profi ts business comprises around 24% of all business. Other liabilities are largely made up of index-linked products.

8TPS 2014
Profile of Respondents
Graph 4.1.4:
Composition of in force business of respondents in terms of Peak 1 liabilities plus WPICC (split by size of fi rm)
0%
10%
20%
30%
40%
50%
60%
70%
80%
90%
100%
10%
18%
38%
11%
11%
13%
Overall Small Medium Large
Conventional with-profits business
Unitised with-profits business
Non-linked non-profit business
Unit-linked business
Annuities
Reinsurance accepted
Other
1%
40%
22%
27%
11%
1%16%
50%
4%
16%
11%
10%
19%
35%
14%
7%
15%
1%
Further analysis of the results in Graph 4.1.3 shows that the composition of liabilities in medium and large fi rms is broadly consistent with the overall picture in Graph 4.1.4 above. However, the composition of Peak 1 liabilities for small fi rms is signifi cantly different, with none of the small fi rms responding having any unit-linked or unitised with-profi ts business, instead having more non-linked non-profi t business and reinsurance accepted.
© 2014 KPMG LLP, a UK limited liability partnership, is a subsidiary of KPMG Europe LLP and a member fi rm of the KPMG network of independent member fi rms affi liated with KPMG International Cooperative, a Swiss entity. All rights reserved.

Profile of Respondents
4.2 SIZE OF ACTUARIAL FUNCTION
We asked respondents to provide their number of FTE actuarial staff, by area, ignoring line 1 and line 2 differences and internal structure.
Graph 4.2.1:
Number of FTE actuarial staff by size of fi rm
0
10
20
30
40
50
60
70
80
90
22
82
10
Small Medium Large
Mea
n nu
mbe
r of F
TEs
The relationship between the size of the 32 respondents and the number of actuarial staff employed by them is shown in Graph 4.2.1. As expected, this shows that, on average, large fi rms have considerably larger actuarial teams than small and medium sized fi rms.
In the analysis above we have excluded two respondents from the small fi rms category. These were both reinsurers with signifi cantly larger actuarial teams than other fi rms in the same category. Reinsurers typically have larger actuarial teams than other fi rms, refl ecting the importance of pricing and portfolio analysis for these fi rms. Including these responses, the average actuarial team size for a small fi rm would have been 22 staff, the same as for medium-sized fi rms.
9 TPS 2014
© 2014 KPMG LLP, a UK limited liability partnership, is a subsidiary of KPMG Europe LLP and a member firm of the KPMG network of independent member fi rms affiliated with KPMG International Cooperative, a Swiss entity. All rights reserved.
10TPS 2014
Profile of Respondents
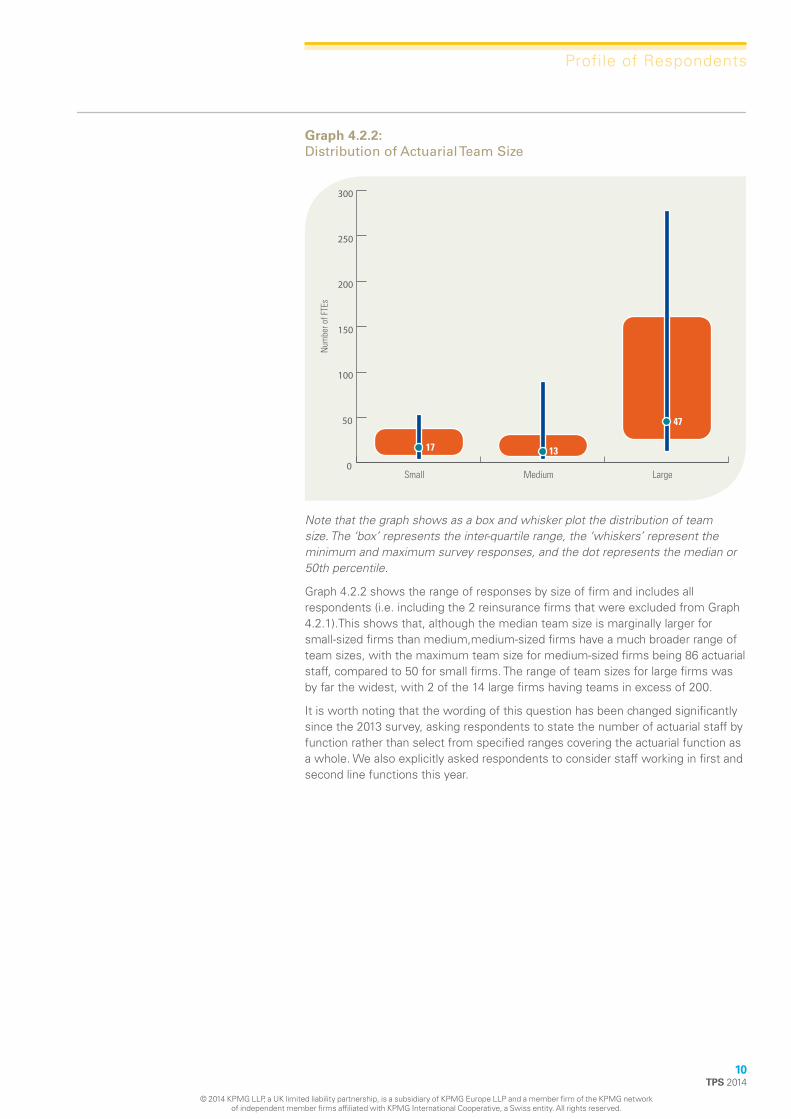
Graph 4.2.2:
Distribution of Actuarial Team Size
0
50
100
150
200
250
300
17
Small Medium Large
Num
ber o
f FTE
s
13
47
Note that the graph shows as a box and whisker plot the distribution of team size. The ‘box’ represents the inter-quartile range, the ‘whiskers’ represent the minimum and maximum survey responses, and the dot represents the median or 50th percentile.
Graph 4.2.2 shows the range of responses by size of fi rm and includes all respondents (i.e. including the 2 reinsurance fi rms that were excluded from Graph 4.2.1).This shows that, although the median team size is marginally larger for small-sized fi rms than medium,medium-sized fi rms have a much broader range of team sizes, with the maximum team size for medium-sized fi rms being 86 actuarial staff, compared to 50 for small fi rms. The range of team sizes for large fi rms was by far the widest, with 2 of the 14 large fi rms having teams in excess of 200.
It is worth noting that the wording of this question has been changed signifi cantly since the 2013 survey, asking respondents to state the number of actuarial staff by function rather than select from specifi ed ranges covering the actuarial function as a whole. We also explicitly asked respondents to consider staff working in fi rst and second line functions this year.
© 2014 KPMG LLP, a UK limited liability partnership, is a subsidiary of KPMG Europe LLP and a member fi rm of the KPMG network of independent member fi rms affi liated with KPMG International Cooperative, a Swiss entity. All rights reserved.

Profile of Respondents
Graph 4.2.3:
Team size by business area
0%
20%
40%
60%
80%
100%
22%
13%
6%
45%
48%
20%
Overall Small Medium Large
Aver
age
split
35%
38%
12%
7%
27%
21%
47%
15%
16%
28%
11 TPS 2014
© 2014 KPMG LLP, a UK limited liability partnership, is a subsidiary of KPMG Europe LLP and a member firm of the KPMG network of independent member fi rms affiliated with KPMG International Cooperative, a Swiss entity. All rights reserved.
Pricing
Valuation and financial reporting (including pillar 2)
Financial and risk management
Other including business support
When considering the split of resources by function, valuation and fi nancial reporting was the largest area overall, accounting for 45% of actuarial employees on average. However, for small respondents, most staff were employed in pricing activity. This may refl ect the nature of the business of these fi rms – as highlighted in Graph 4.1.4, small fi rms have a greater proportion of reinsurance and annuity liabilities than medium and large respondents.
Also of interest is that large fi rms have a greater proportion of staff working in fi nancial reporting and risk management than smaller fi rms. This may be a refl ection of the resources deployed by some large fi rms on the development and validation of Internal Models for Solvency II.

Profile of Respondents
4.3 WHICH PEAK IS BITING?
Graph 4.3.1:
Which UK PRA Pillar 1 Peak was biting at the 2013 year end valuation?
12%
41%
47%
UK PRA Peak 1
UK PRA Peak 2
N/A (Regulatory reporter)
Graph 4.3.1 splits respondents by reporting basis and depicts which peak bites for respondents who report on a realistic basis. Of the 32 respondents, 19 reported on a realistic basis and 13 on a regulatory only basis at year end 2013. Out of the realistic basis life firms, Peak 1 bites for 4 firms (21%) with Peak 2 biting for the remaining 15 firms (79%). The 2013 survey showed that Peak 1 was biting for around 40% of the realistic basis respondents, compared with 21% this year. This is in part due to different respondents between the two surveys, although two respondents have indicated that they switched from Peak 1 biting at the end of 2012, to Peak 2 at the end of 2013.
4.4 WHICH PILLAR IS BITING?
Graph 4.4.1:
Which Pillar will bite as at year end 2013?
41%
59%
TPS 2014
© 2014 KPMG LLP, a UK limited liability partnership, is a subsidiary of KPMG Europe LLP and a member firm of the KPMG network of independent member fi rms affiliated with KPMG International Cooperative, a Swiss entity. All rights reserved.
12
Pillar 1
Pillar 2
As shown in Graph 4.4.1, respondents were split 41% to 59% on whether Pillar 1 or Pillar 2 ICA capital requirements were more onerous as at year end 2013, respectively. This shows little change from the 2013 survey when 60% of firms had Pillar 2 biting .

5 Assets
In this section we consider assets, in particular exploring alternative assets held by insurers as well as investigating asset strategies and planning for a Solvency II environment. Firms who participated in this section hold a combined total of £347bn assets of which £12bn are alternative assets.
We are revisiting alternative assets which were a theme of the 2013 survey. Insurers have shown a growing interest in these asset types in order to obtain higher yields and diversification in a low interest environment. We explore firms’ appetite for various alternative assets and how this compares to the results of the 2013 survey.
Preparation for Solvency II will include considering asset data fl ows for Pillar 3 reporting requirements and reconsidering asset investment strategies to optimise capital positions, in particular, considering admissibility of assets and eligibility of assets in order to apply for the Matching Adjustment.
13 TPS 2014
© 2014 KPMG LLP, a UK limited liability partnership, is a subsidiary of KPMG Europe LLP and a member firm of the KPMG network of independent member fi rms affiliated with KPMG International Cooperative, a Swiss entity. All rights reserved.

14TPS 2014
Assets
5.1 INVESTMENT STRATEGY: CURRENT VS FUTURE SOLVENCY II
Graph 5.1.1:
When setting the investment strategy for your business in the current / future Solvency II environment, rate the following metrics in terms of their importance?
Not Considered
Considered to a small extent to inform or verify investment strategy in parts of the business
Widely used measure for setting investment strategy across most business units
Essential measure for setting investment strategy across all business units
Profit return metric:Current 34% 29% 24% 13%
Solvency II 37% 24% 25% 14%
Capital Measures:Current
Solvency II
16% 22% 27%
15% 14% 26%
34%
45%
Risk adjusted performance metrics:Current
Solvency II
48% 17%
41% 21%
10%
14%
24%
24%
ALM / liquidity coverage:Current
Solvency II
16% 31% 32%
23% 25% 30%
21%
22%
Stress tests:Current
Solvency II
24% 41%
31% 31%
28%
31%
7%
7%
Projected metrics:Current
Solvency II
0%
47% 33%
39% 40%
10% 20% 30% 40% 50% 60% 70% 80%
16% 3%
16% 6%
90% 100%Percentage of firms
Graph 5.1.1 shows an aggregated view of responses to this question, by grouping the different metrics into higher level headings. In general we can see that metrics used for setting investment strategies have the same level of importance in the current environment when compared to a Solvency II environment. This suggests that fi rms aren’t planning signifi cant changes to the use of their metrics when setting investment strategies in a Solvency II environment.
Capital measures are an important investment measure for the majority of fi rms (on the graph this category has combined responses for regulatory solvency measures, economic capital and risk appetite). In particular, risk appetite had most fi rms ranking it as important, with 17 out of 29 respondents ranking it as essential and 6 out of 29 ranking it as a widely used in the current environment. A slightly greater level of importance is expected in the Solvency II environment, which may be driven by the encouragement of fi rms to manage their business using a risk based view.
Projected metrics appear not to be an important investment measure for the majority of fi rms (on the graph this category has combined responses for projected future capital, profi t, risk appetite and liquidity metrics). In particular 14 out of 29 respondents say they do not consider projected liquidity requirements and a further 12 say they only consider it to a small extent in the current environment. Only 3 ranked it as a widely used or essential measure. It is no surprise that when asked, these three fi rms are annuity providers and have a higher proportion relative to their peers invested in alternative assets, which tend to be illiquid by nature. Firms may want to understand their liquidity exposure better so they can explore options in purchasing higher yielding assets via the liquidity premium and avoiding forced asset sales at inopportune times.
© 2014 KPMG LLP, a UK limited liability partnership, is a subsidiary of KPMG Europe LLP and a member fi rm of the KPMG network of independent member fi rms affi liated with KPMG International Cooperative, a Swiss entity. All rights reserved.

Assets
5.2 ASSET TRANSITION PLAN FOR SOLVENCY II
Graph 5.2.1:
What is your current position in terms of developing an asset transition plan for Solvency II?
20%
7%
40%
7%
27%
15 TPS 2014
© 2014 KPMG LLP, a UK limited liability partnership, is a subsidiary of KPMG Europe LLP and a member firm of the KPMG network of independent member fi rms affiliated with KPMG International Cooperative, a Swiss entity. All rights reserved.
Not applicable - we do not intend to change our asset strategy, so no transition
plan is required
We are awaiting further guidance and/or the outcome of our internal analysis of the
Solvency II regulations (e.g. transitional rules) before we decide a formal transition plan
We are currently developing our Solvency II asset transition plan
We have already developed a draft transition plan
Other
Firms may want to reconsider their asset strategy in order to comply with Solvency II admissibility requirements and also for the eligibility of assets in order to apply for the Matching Adjustment.
The highest proportion, 40% of respondents said that they are awaiting further guidance and/or the outcome of their internal analysis of Solvency II regulations before deciding a formal transition plan.
Out of the 20% of fi rms who do not intend to change their strategy, none of them hold alternative assets. This may suggest they are holding simpler assets types and hence no asset transition plans are required.
Only 7% of fi rms have already developed a draft transition plan. The fi rms who selected “other” said that they were already managing their assets based on a Solvency II world but that they will review and reassess when further clarifi cation on Solvency II guidance is issued.
Assets
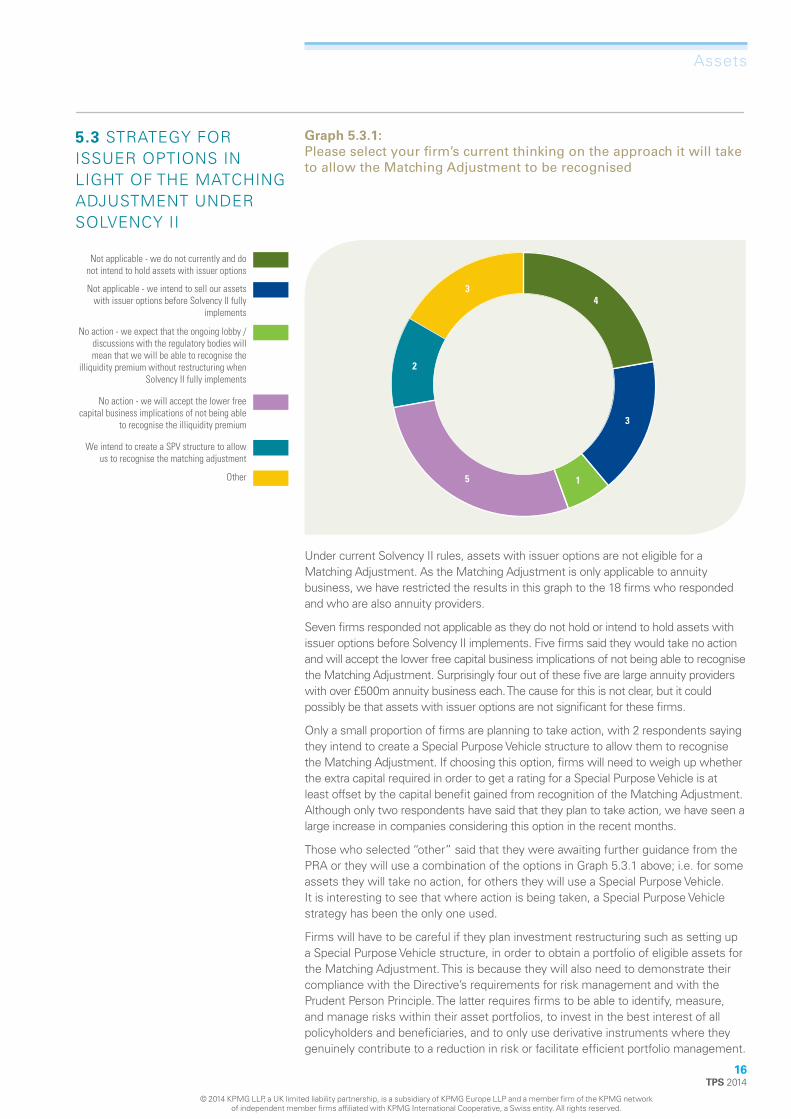
5.3 STRATEGY FOR ISSUER OPTIONS IN LIGHT OF THE MATCHING ADJUSTMENT UNDER SOLVENCY II
Graph 5.3.1:
Please select your firm’ s current thinking on the approach it will take to allow the Matching Adjustment to be recognised
4
2
3
5 1
3
TPS 2014 16
© 2014 KPMG LLP, a UK limited liability partnership, is a subsidiary of KPMG Europe LLP and a member firm of the KPMG network of independent member fi rms affiliated with KPMG International Cooperative, a Swiss entity. All rights reserved.
Not applicable - we do not currently and do not intend to hold assets with issuer options
Not applicable - we intend to sell our assets with issuer options before Solvency II fully
implements
No action - we expect that the ongoing lobby / discussions with the regulatory bodies will mean that we will be able to recognise the
illiquidity premium without restructuring when Solvency II fully implements
No action - we will accept the lower free capital business implications of not being able
to recognise the illiquidity premium
We intend to create a SPV structure to allow us to recognise the matching adjustment
Other
Under current Solvency II rules, assets with issuer options are not eligible for a Matching Adjustment. As the Matching Adjustment is only applicable to annuity business, we have restricted the results in this graph to the 18 firms who responded and who are also annuity providers.
Seven firms responded not applicable as they do not hold or intend to hold assets with issuer options before Solvency II implements. Five firms said they would take no action and will accept the lower free capital business implications of not being able to recognise the Matching Adjustment. Surprisingly four out of these five are large annuity providers with over £500m annuity business each. The cause for this is not clear, but it could possibly be that assets with issuer options are not significant for these fi rms.
Only a small proportion of firms are planning to take action, with 2 respondents saying they intend to create a Special Purpose Vehicle structure to allow them to recognise the Matching Adjustment. If choosing this option, firms will need to weigh up whether the extra capital required in order to get a rating for a Special Purpose Vehicle is at least offset by the capital benefit gained from recognition of the Matching Adjustment. Although only two respondents have said that they plan to take action, we have seen a large increase in companies considering this option in the recent months.
Those who selected “other” said that they were awaiting further guidance from the PRA or they will use a combination of the options in Graph 5.3.1 above; i.e. for some assets they will take no action, for others they will use a Special Purpose Vehicle. It is interesting to see that where action is being taken, a Special Purpose Vehicle strategy has been the only one used.
Firms will have to be careful if they plan investment restructuring such as setting up a Special Purpose Vehicle structure, in order to obtain a portfolio of eligible assets for the Matching Adjustment. This is because they will also need to demonstrate their compliance with the Directive’s requirements for risk management and with the Prudent Person Principle. The latter requires fi rms to be able to identify, measure, and manage risks within their asset portfolios, to invest in the best interest of all policyholders and benefi ciaries, and to only use derivative instruments where they genuinely contribute to a reduction in risk or facilitate efficient portfolio management.

Assets
5.4 PILLAR 3 FOR READINESS FOR ASSETS
Graph 5.4.1:
What is the current status of your Solvency II Pillar 3 Reporting for Assets?
17 TPS 2014
© 2014 KPMG LLP, a UK limited liability partnership, is a subsidiary of KPMG Europe LLP and a member firm of the KPMG network of independent member fi rms affiliated with KPMG International Cooperative, a Swiss entity. All rights reserved.
Overall 1 12 10 4 1 1
Developed methodology for separating investment returns between risks
1 5 7 6 5 5
Developed process for collection of data 2 16 4 5 2
Developed plans / framework to ensure control, quality and ownership of data
3 9 7 7 2 1
Developed delivery plans to set out process to ensure able to meet tighter reporting deadlines
2 9 9 7 2
Engaged with external data providers to remedy the gaps 2 11 9 5 2
Developed tactical and strategic solutions for the sourcing / remediation of data
1 16 5 3 2 2
Data gap analysis on the asset forms 5 17 4 1 2
0 5 10 15 20 25 30
Number of firms
Completed, no further work required Planned for 2015
Currently underway Other
Planned for later this year Not applicable – not relevant for our business
The recent confi rmation that Solvency II will be introduced on 1 January 2016 and the publication by EIOPA in September 2013 of its proposals for the preparation of Solvency II, has put renewed pressure on fi rms to further develop their Pillar 3 plans in the preparatory period and, ultimately, when Solvency II goes live. The fi rst key reporting milestone for fi rms will be the preparatory QRTs and narrative reporting, with Solo reports due end June 2015 and Group reports due in the second week of July 2015.
The overall readiness bar in graph 5.4.1 is calculated as the average of the readiness of fi rms to the seven listed asset development areas in this graph. Overall, very few fi rms have completed the Pillar 3 asset development areas mentioned in the question.
Only one fi rm, which is a large fi rm, has responded to having already completed all areas, whilst no small fi rms have completed any of the areas mentioned in the question. Only one fi rm has stated they will start all tasks in 2015.
The task which is furthest behind in completion is developing methodology for separating investment returns between risks. Only 6 out of the 24 fi rms for whom this task is applicable have completed or started the task. Seven plan to start later in the year and a further 6 to start in 2015.

18TPS 2014
Assets
5.5 CHALLENGES FACED WHEN INVESTING IN ALTERNATIVE ASSETS
Graph 5.5.1:
When assessing the viability of investing in Alternative Asset Classes and/or performing due diligence on the investments, please select the level of diffi culty/challenge the following areas currently pose to your business
Some significant issues exist
Some limited issues but not to the extent they would stop us investing
We have not yet developed our thinking on this issue
Not applicable - we outsource this element
Not an issue, we have a fully developed process
Not applicable - we do not invest in assets where this is an issue
0% 10% 20% 30% 40% 50% 60% 70% 80% 90% 100%
Developing asset selection criteria
Availability of asset / market data
Understanding / developing asset modelling and methodologies
Regulatory constraints / concerns
Developing risk monitoring and governance processes
Developing ALM strategy to balance profit vs capital volatility
Hedging unwanted risk elements
Political and Reputational risk considerations
47% 33% 8% 8%
12%7%6%18%12%
47% 22% 10% 6% 10%
50%9% 18% 24%
47% 38% 4% 11%
53%29%6% 6% 6%
32% 29% 6% 26%
47% 24% 18%6%6%
46%
2% 2%
4%
3%
1%
3%
Political and reputational risk considerations
Graph 5.5.1 shows an aggregated view of responses to this question, by grouping the different challenges into higher level headings. Out of the 28 respondents to this question, 11 fi rms indicated that all of the above areas were not applicable as they do not invest in assets where it is an issue. As such this left 17 fi rms for which the rest of the analysis is based on.
For a given area, roughly half of the fi rms experience some level of issue, whether limited or signifi cant. The aggregated categories causing the greatest issues are ‘availability of assets / market data’ and ‘regulatory constraints / concerns’. In particular, ‘regulatory constraints / concerns’ causes an issue for the largest number of fi rms, with 10 fi rms indicating they are experiencing limited issues and 2 fi rms indicating signifi cant issues.
As noted above, the analysis in Graph 5.5.1 is shown at a grouped level. At an ungrouped level (not shown on the graph) the response for which fi rms indicated they had the greatest number of signifi cant issues is ‘obtaining relevant market data to assess credit risk calibration’, with 3 out of 17 fi rms selecting this option. We have seen fi rms having a number of different issues with credit risk calibration data, including the use of US data to model UK exposures, length of the dataset to use (i.e. credibility vs. appropriateness), the extent to which data should be split by duration, and the extent to which data should be split by sector.
© 2014 KPMG LLP, a UK limited liability partnership, is a subsidiary of KPMG Europe LLP and a member fi rm of the KPMG network of independent member fi rms affi liated with KPMG International Cooperative, a Swiss entity. All rights reserved.

19 TPS 2014
Assets
5.6 TOTAL ASSETS AND ALTERNATIVE ASSETS
Total conventional and alternative assets held
Graph 5.6.1:
Please provide the amount of total assets (conventional and alternative) held in relation to each of the funds
0
20
40
60
80
100
120
140
160
180
Annuity business With-profits Protection business Shareholder funds
£Bn
Total assets
Total alternative assets
£103.6Bn
£166Bn
£38.1Bn £32
Bn£8.9Bn £2.8
Bn£0.1Bn
£0.3Bn
When compared to the 2013 survey results, we observe that annuity business and with-profi ts business remain the funds with the most amounts of alternative assets held. However, out of the £2.8bn of alternative assets held within with-profi ts funds, 41% of this is held by one fi rm. As per the 2013 survey results, a very small proportion of alternative assets are held within protection business and shareholder funds. This is not surprising since protection business is non illiquid and guaranteed in nature.
Alternative assets within the annuity fund and with-profi ts fund represent 8.6% and 1.7% of total assets within each of these funds respectively in 2014. This compares to 6.7% and 2.1% in 2013. This suggests that the proportion of alternative assets held has remained fairly stable over the year. However, it should be noted that the sample of respondents for 2014 does not entirely match that of 2013.
© 2014 KPMG LLP, a UK limited liability partnership, is a subsidiary of KPMG Europe LLP and a member fi rm of the KPMG network of independent member fi rms affi liated with KPMG International Cooperative, a Swiss entity. All rights reserved.

20TPS 2014
Assets
Relative amount of alternative assets held
Graph 5.6.2:
Distribution of alternative asset types held within annuity funds
© 2014 KPMG LLP, a UK limited liability partnership, is a subsidiary of KPMG Europe LLP and a member fi rm of the KPMG network of independent member fi rms affi liated with KPMG International Cooperative, a Swiss entity. All rights reserved.
0%
5%
10%
15%
20%
25%
30%
Asset category
Rela
tive
% o
f alte
rnat
ive
asse
ts h
eld
(%)
PE/venture capital
Infrastructure bonds
Infrastructure loans
Social housing bonds
Social housing loans
Covered bonds
Hedge funds
Residential mortgages
Commercial mortgages
Other structured/securitised assets6.9%
9.6%
4.5%
15.4%
11.7%
23.6% 26.7%
0.5%0.0%1.1%
0.0%Other alternative assets
Most alternative assets invested by insurers are held within the annuity funds. We have therefore provided analysis of the amount of different alternative assets held within annuity funds only.
As per 2013, the most widely held alternative assets within the annuity fund are other structured / securitised assets and other alternative assets, which include equity release and sale and lease back type assets. None of the respondents hold investments in PE / venture capital and hedge funds. In fact, respondents who participated in both the 2013 and 2014 survey have since switched out of PE / Venture capital assets since 2013. Investments in commercial and residential mortgages appear to be more popular. When comparing the fi rms who responded to both the 2013 and 2014 survey, investment in these asset types have increased from £347m and £585m to £1,042m and £1,368m respectively. This could be due to fi rms looking to benefi t from a higher yield through holding more illiquid asset types.

Assets
TPS 2014
Investment of new money in alternative assets
Table 5.6.3:
Number of firms who plan to invest a proportion of new money in alternative assets within each fund over the next 12 months
Nil 0% < x ≤
5% 5% < x ≤
10% 10% < x ≤
25% 25% < x ≤
50% 50% < x ≤
100%
Annuity Business
9 3 4 1 1 1
With- profits 17 2 0 0 0 0
Protection business
19 0 0 0 0 0
Shareholder funds
16 1 0 2 0 0
There were a total of 19 respondents to this question. All of these respondents indicated that they did not plan to newly invest in alternative assets within the protection fund and sixteen said the same for the shareholder fund. This is consistent with the low investments in alternative assets within protection and shareholder funds that we are currently seeing.
Surprisingly, a high proportion, seventeen out of nineteen said they do not plan to newly invest in alternative assets within the with-profits fund. Out of the six respondents who said they currently hold alternative assets in the with-profi ts fund, two did not respond to this question, two said they did not plan to newly invest in alternative assets and two said they would. These results suggest there may be less investment in alternative assets within the with-profits funds over the next 12 months.
Around half (10 out of 19) of the respondents plan to newly invest in alternative assets within the annuity funds. Seven out of these ten firms said they will invest up to 10% of their new assets within the annuity fund on alternative assets. Only one fi rm said they will invest more than 50%. Of these ten firms, two do not currently hold alternative assets and have said that they wish to invest 10% and 15% of new money into alternative assets. Interestingly, there are a further three firms who currently hold alternative assets and do not plan to invest new money in these asset types.
© 2014 KPMG LLP, a UK limited liability partnership, is a subsidiary of KPMG Europe LLP and a member firm of the KPMG network of independent member fi rms affiliated with KPMG International Cooperative, a Swiss entity. All rights reserved.
21

Assets
Graph 5.6.4:
Likelihood of firms investing in different alternative asset types backing annuity business over the next 12 months
0 1 2 3 4 5 6 7
1
0
0
Number of firms
12
13
1
1
2
2
3 1
2 2
1114
1
1
1
2 1 1
Certain Slightly likely
Very likely Moderately likely
PE / Venture Capital
Infrastructure Bonds
Infrastructure Loans
Social Housing Bonds
Social Housing Loans
Covered Bonds
Hedge Funds
Residential Mortgages
Commercial Mortgages
Other Structured / Securitised Assets
Equity release
Commercial Loans
Table 5.6.3 shows that the vast majority of assets to be invested in alternative assets are within annuity funds hence our analysis focuses on the ten respondents who said they plan to newly invest in alternative assets within the annuity fund over the next 12 months.
None of the respondents plan on investing in PE/Venture Capital and hedge funds. The most likely alternative assets for insurers to invest in are infrastructure loans and commercial and residential mortgages. Newly invested money in commercial and residential mortgages would be consistent with the investments we are seeing in the current environment. In fact, 7 out of the 10 fi rms are at least considering investing in commercial mortgages, with 4 of them saying they are certain to invest in this asset type. However, currently a small proportion of total alternative assets (0.5%) are currently held in infrastructure loans. Out of the three fi rms who said they are certain to invest in infrastructure loans, only one of them currently holds this asset type. This may be demonstrating an increased appetite for the purchase of highly illiquid assets in trade off for a higher yield.
One fi rm indicated they were certain to invest in equity release and another one fi rm was certain to invest in commercial loans. These fi rms already have current holdings in these asset types and the choices to invest in them may be due to these fi rms’ overall strategy as opposed to the attractiveness of these asset types.
TPS 2014
© 2014 KPMG LLP, a UK limited liability partnership, is a subsidiary of KPMG Europe LLP and a member firm of the KPMG network of independent member fi rms affiliated with KPMG International Cooperative, a Swiss entity. All rights reserved.
22

Assets
5.7 RATIONALE FOR INVESTING IN ALTERNATIVE ASSETS
Graph 5.7.1:
Where appropriate, please indicate the rationale(s) for investment in
your alternative assets
0
5
10
15
20
13
Num
ber o
f firm
s
15 16
13
8
6
Yield pick-up
Risk/return trade-off
Portfolio diversification
ALM - duration matching
ALM - cash flow matching
Expected capital benefit
We asked insurers to indicate the rationale for their investment in alternative assets and there were 19 respondents to this question.
The most popular rationales for investment in alternative assets are portfolio diversifi cation and risk/return trade off, with 16 and 15 respondents respectively selecting these options. Firms with long term illiquid liabilities such as annuities may already have a high exposure to corporate bonds and will not consider liquidity risk as a material one. Hence, there is no surprise these are the most popular rationales since insurers are able to further diversify their portfolio by investing in new alternative assets that also offer higher yields via the liquidity premium.
The least widely used rationale for investing is expected capital benefi t, with only 6 out of 19 respondents selecting this option, suggesting that the cash fl ow properties of alternative assets are more valuable to insurers than capital considerations.
Five fi rms selected all six options as a rationale for investing in alternative assets.
23 TPS 2014
© 2014 KPMG LLP, a UK limited liability partnership, is a subsidiary of KPMG Europe LLP and a member firm of the KPMG network of independent member fi rms affiliated with KPMG International Cooperative, a Swiss entity. All rights reserved.

6 Solvency I
While the main focus of our Technical Practices Survey is the ICA and Solvency II, we recognise that clients continue to find comparisons of key basis items for Peak 1 and Peak 2 to be very useful.
As such we have continued our questions around the Pillar 1 mortality assumptions and introduced a new question on the assumed level of liquidity premium under Peak 1.
6.1 ANNUITY BASE MORTALITY ASSUMPTIONS
We asked respondents which base annuitant mortality table they use for their most material annuity business. Of 28 respondents who answered the question on the Peak 1 basis, 23 (82%) said they use the ‘00’ tables, with the other 5 respondents saying they use other tables. All respondents who answered ‘00’ tables for their base annuity table use gender-specifi c mortality tables.
Of the 17 respondents who answered the question on the Peak 2 basis, 15 (88%) said they use the ‘00’ tables, with the other 2 respondents saying they use other tables. All respondents who answered ‘00’ tables for their base annuity table use gender-specifi c mortality tables.
We also asked fi rms what table multipliers they apply to their base mortality tables. We received 23 responses to this question, of which all 23 covered Peak 1 and 12 covered Peak 2 bases with the results shown overleaf.
For both the Peak 1 bases and the Peak 2 basis, the majority of respondents use table multipliers lower than 100% (both for males and females).
On the Peak 1 basis, the average table multiplier is 91.5% for males and 80.5% for females. On the Peak 2 basis, the average table multiplier is 93.7% for males and 90.9% for females.
We also compared table multipliers between Peak 1 and Peak 2. Of the 12 respondents on the Peak 2 basis, 8 respondents use higher table multipliers, 2 use the same table multiplier and the remaining 2 use lower table multipliers than their Peak 1 basis.
We note that of those respondents who use higher table multipliers for the Peak 2 basis, 5 use lower mortality improvement factors, 2 use the same mortality improvement factors and one respondent said they use higher mortality improvement factors for the PRA Peak 2 basis.
TPS 2014
© 2014 KPMG LLP, a UK limited liability partnership, is a subsidiary of KPMG Europe LLP and a member firm of the KPMG network of independent member fi rms affiliated with KPMG International Cooperative, a Swiss entity. All rights reserved.
24

Solvency I
Graph 6.1.1:
Mortality table multiplier - Peak 1 Valuation
0
1
2
3
4
5
6
< 80%
Num
ber o
f firm
s
0 0 1
00 0
[80%
, 85%
)
[85%
, 90%
)
[90%
, 95%
)
[95%
, 100
%)
[100%
, 105
%)
[105%
, 110
%)
[110%
, 115
%)
[115%
, 120
%)
≥ 120
%
111
33 3
2
3
4
5
4
555
Male
Female
Graph 6.1.2:
Mortality table multiplier - Peak 2 Valuation
0
1
2
3
4
5
6
< 80%
Num
ber o
f firm
s
11 0 0 0 00
[80%
, 85%
)
[85%
, 90%
)
[90%
, 95%
)
[95%
, 100
%)
[100%
, 105
%)
[105%
, 110
%)
[110%
, 115
%)
[115%
, 120
%)
≥ 120
%
2
4
11111 1
2 2222
25 TPS 2014
© 2014 KPMG LLP, a UK limited liability partnership, is a subsidiary of KPMG Europe LLP and a member firm of the KPMG network of independent member fi rms affiliated with KPMG International Cooperative, a Swiss entity. All rights reserved.

Solvency I
6.2 MORTALITY IMPROVEMENT MODEL
We asked respondents about the mortality improvement model used to calculate their liabilities under Peak 1 and Peak 2.
Graph 6.2.1:
Peak 1 - Mortality Improvement Models
4%12%
28%
Long cohort
CMI 2009
CMI 2011
CMI 2012
CMI 2013
Other
24%
28%
4%
Long cohort
CMI 2009
CMI 2011
CMI 2012
CMI 2013
Other
Graph 6.2.2:
Peak 2 - Mortality Improvement Models
6%7%
20%
27%
40%
Long cohort
CMI 2009
CMI 2011
CMI 2012
CMI 2013
Other
For both Peak 1 and Peak 2 the majority of respondents use the CMI model. In the 2013 survey the majority of respondents used the 2011 model; however we can see that over the past year many respondents have moved to either the 2012 or 2013 models.
Three respondents answered “other”, two of which said they use their own model and the other saying they use average of medium and long cohort models.
TPS 2014
© 2014 KPMG LLP, a UK limited liability partnership, is a subsidiary of KPMG Europe LLP and a member firm of the KPMG network of independent member firms affiliated with KPMG International Cooperative, a Swiss entity. All rights reserved.
26

TPS 2014
© 2014 KPMG LLP, a UK limited liability partnership, is a subsidiary of KPMG Europe LLP and a member firm of the KPMG network of independent member fi rms affiliated with KPMG International Cooperative, a Swiss entity. All rights reserved.
Solvency I
6.3 CHOICE OF CMI MODEL
This question considers only those fi rms who use the CMI models as shown in section 6.2.
14 out of 19 respondents use the Core CMI mortality improvement model to value their Peak 1 liabilities, and 5 use the Advanced model.
10 out of 14 respondents use the Core CMI mortality improvement model to value their Peak 2 liabilities, and 4 use the Advanced model.
Graph 6.3.1:
Peak 1 - Core / advanced version of the CMI mortality improvement model
26%
74%
Core
Advanced
Graph 6.3.2:
Peak 2 - Core / advanced version of the CMI mortality improvement model
29%
71%
These results are in line with our expectation as the Core model is easier to use than the Advanced model given the complexity of calibrating the various parameters in the Advanced model. As expected, out of the fi ve respondents who used the Advanced model, 4 are large insurers and the remaining one is a medium-size reinsurer. The results are similar to those from the 2013 survey. 27
Solvency I
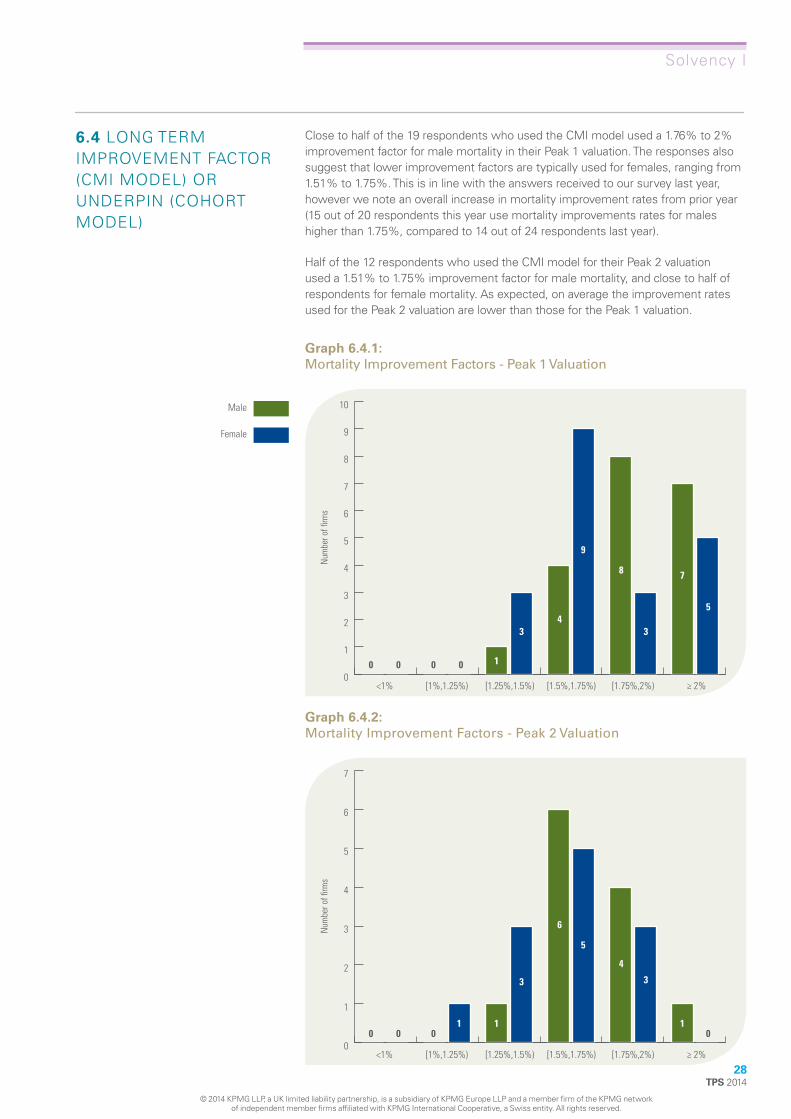
6.4 LONG TERM IMPROVEMENT FACTOR (CMI MODEL) OR UNDERPIN (COHORT MODEL)
Close to half of the 19 respondents who used the CMI model used a 1.76% to 2% improvement factor for male mortality in their Peak 1 valuation. The responses also suggest that lower improvement factors are typically used for females, ranging from 1.51% to 1.75%. This is in line with the answers received to our survey last year, however we note an overall increase in mortality improvement rates from prior year (15 out of 20 respondents this year use mortality improvements rates for males higher than 1.75%, compared to 14 out of 24 respondents last year).
Half of the 12 respondents who used the CMI model for their Peak 2 valuation used a 1.51% to 1.75% improvement factor for male mortality, and close to half of respondents for female mortality. As expected, on average the improvement rates used for the Peak 2 valuation are lower than those for the Peak 1 valuation.
Graph 6.4.1:
Mortality Improvement Factors - Peak 1 Valuation
0
1
2
3
4
5
6
7
8
9
10
1
<1% [1%,1.25%) [1.25%,1.5%)
Num
ber o
f firm
s
0
[1.5%,1.75%) [1.75%,2%) ≥ 2%
0 0 0
3 4
9
8
3
7
5
Male
Female
Graph 6.4.2:
Mortality Improvement Factors - Peak 2 Valuation
28 TPS 2014
0
1
2
3
4
5
6
7
1
<1% [1%,1.25%) [1.25%,1.5%)
Num
ber o
f firm
s
0
[1.5%,1.75%) [1.75%,2%) ≥ 2%
0 0 0
3
6
5
4
3
1 1
© 2014 KPMG LLP, a UK limited liability partnership, is a subsidiary of KPMG Europe LLP and a member firm of the KPMG network of independent member fi rms affiliated with KPMG International Cooperative, a Swiss entity. All rights reserved.

29 TPS 2014
Solvency I
6.5 LIQUIDITY PREMIUM We asked fi rms what proportion of their credit spread was attributed to the liquidity premium in their valuation interest rates for Peak 1 reporting, by credit rating. We received 22 responses to this question. Of these, 8 applied a fl at percentage across all ratings, and 14 applied a percentage that differed by rating. Graph 6.5.1 illustrates the range of responses received.
Graph 6.5.1:
For PRA Peak 1 reporting, what percentage of the spread did you attribute to liquidity when determining your valuation interest rate for the following bond ratings?
0%
20%
40%
60%
80%
100%
60%
AAA AA A
Perc
enta
ge o
f spr
ead
58%53%
BBB BB Flat%
51% 50% 51%
Note that the graph shows as a box and whisker plot the distribution of percentage of spread. The ‘box’ represents the inter-quartile range, the ‘whiskers’ represent the minimum and maximum survey responses, and the dot represents the median or 50th percentile.
The median percentage of yield spread attributable to the liquidity premium generally decreased by credit rating. For stronger credit ratings (AAA and AA) the lower inter-quartile was lower than that for weaker credit ratings (A and BBB), except BB.
For fi rms where the responses differed by rating, a broad range of responses was observed. For example, for AAA rated bonds the minimum and maximum percentage were respectively 21% and 95%.
For fi rms with a fl at percentage across all ratings, responses were between 21% and 60%.
© 2014 KPMG LLP, a UK limited liability partnership, is a subsidiary of KPMG Europe LLP and a member fi rm of the KPMG network of independent member fi rms affi liated with KPMG International Cooperative, a Swiss entity. All rights reserved.

7 With-profi ts
Since publication of the last Technical Practices Survey we have seen fi rms continuing to re-evaluate their strategies with respect to with-profi ts.
The impacts of FSA PS12/04, the Retail Distribution Review and the reduction in customer demand for with-profits products over recent years have caused a number of firms to stop writing new business.
The vast majority of with-profi ts funds are now closed and a signifi cant volume of business is now reaching maturity, driven by the peak in mortgage endowment sales in the late 1980’s. This run-off may be accelerated further for funds with signifi cant amounts of pension savings business if customers choose to take advantage of the increased benefi t fl exibility announced in this year’s Budget.
These factors mean that the past twelve months have seen a number of fi rms take further actions to help ensure an effi cient run-off of their with-profi ts business. For example, a number of fi rms have undertaken transactions to transfer annuity business out of their with-profi ts funds, either to the fi rm’s non-profi t fund or to another provider. Without such measures the ratio of with-profi ts business to non-profi t business within the fund would change rapidly over future years, potentially giving rise to risk exposures that are inconsistent with the expectations of with-profi ts policyholders and constraining the fund’s ability to distribute the estate as it would like.
It is likely that fi rms will continue to explore such options and that, as the withprofi ts run-off accelerates across the industry, further consolidation will take place between providers.
The past year has also seen fi rms increasingly turn their attention to the treatment of their with-profi ts business under Solvency II. This poses a number of challenges, in terms of the reporting requirements of the QRTs, the impact of ring-fenced funds and the extent to which management actions are allowed for within the balance sheet.
This year’s Technical Practices Survey provides excellent coverage of the UK with-profi ts market. 21 of this year’s respondents have with-profi ts funds and these include all but three of the UK’s realistic reporting fi rms. Given the nature of with-profi ts business and the defi nitions used in this survey, the respondents with with-profi ts funds are primarily large fi rms (14 respondents) with 6 medium fi rms and only 1 small fi rm.
TPS 2014
© 2014 KPMG LLP, a UK limited liability partnership, is a subsidiary of KPMG Europe LLP and a member firm of the KPMG network of independent member fi rms affiliated with KPMG International Cooperative, a Swiss entity. All rights reserved.
30

WITH-PROFITS
7.1 THE WITH-PROFITS LANDSCAPE
Number of with-profi ts funds
Graph 7.1.1:
How many with-profits funds are there in your fi rm?
0
2
4
6
8
10
8
1
Num
ber o
f firm
s
Number of funds
6
4
2
1
2 3-5 6-10 >10
Graph 7.1.1 shows the number of with-profi ts funds of each of the respondents. In total, 21 of the 32 participants in this year’s survey have at least 1 with-profi ts fund. Throughout the remainder of this section the analysis considers only these 21 fi rms.
13 of the 21 respondents with with-profits business have more than one with-profi ts fund, and on average each firm has 2.9 with-profits funds. This demonstrates the extent to which the with-profits market has already consolidated, with many of the fi rms with multiple funds having acquired at least one of these through acquisition activity.
A small number of fi rms have been the most active in this area pursuing consolidation strategies, with one respondent having 13 separate with-profi ts funds. Excluding this respondent, the average funds per fi rm would have reduced to 2.4.
31 TPS 2014
© 2014 KPMG LLP, a UK limited liability partnership, is a subsidiary of KPMG Europe LLP and a member firm of the KPMG network of independent member fi rms affiliated with KPMG International Cooperative, a Swiss entity. All rights reserved.

WITH-PROFITS
Number of open and closed with-profi ts funds
Graph 7.1.2:
How many of your with-profits funds are closed to new business and in run-off, or open to new business?
20%
80%
Closed to new business and in run-off
Open to new business
Graph 7.1.2 shows the number of open and closed funds covered by this year’s survey. Only 20% of the funds currently remain open to new business. While this appears to be a signifi cant fall since last year, this is primarily due to a difference in the information requested between the two surveys. The 2013 survey did not ask fi rms to specify how many of their funds were open or closed, asking only whether the main with-profi ts fund remained open.
TPS 2014
© 2014 KPMG LLP, a UK limited liability partnership, is a subsidiary of KPMG Europe LLP and a member firm of the KPMG network of independent member fi rms affiliated with KPMG International Cooperative, a Swiss entity. All rights reserved.
32

WITH-PROFITS
7.2 WITH-PROFITS CAPITAL STRENGTH
Pillar 2 basis
Graph 7.2.1:
How many of your with-profits funds are self-suppor ting on a Pillar 2 basis?
7%
10%
83%
Do not cover their realistic liabilities
Fully cover their own realistic liabilities, but not their ICA & ICG
Fully cover their own realistic liabilities, ICA & ICG
Graph 7.2.1 shows that 83% of the with-profi ts funds covered by the survey are fully self-supporting in that the assets of the fund are suffi cient to cover their own realistic liabilities plus the fund’s ICA and any ICG that applies.
17% of the funds covered (10 funds) are not self-supporting. 6 of these cover their realistic liabilities but not the capital requirements while 4 require external support to cover their realistic liabilities. 9 of the 10 funds that are not fully self-supporting are proprietary funds, and therefore are reliant on capital support from other shareholder owned funds. Only one mutual with-profi ts fund was unable to meet its capital requirements and was receiving capital support from another fund.
Due to the timing of the survey it is likely that some respondents will have answered this question based upon year-end 2012 results while others will have answered with respect to year-end 2013 results.
33 TPS 2014
© 2014 KPMG LLP, a UK limited liability partnership, is a subsidiary of KPMG Europe LLP and a member firm of the KPMG network of independent member fi rms affiliated with KPMG International Cooperative, a Swiss entity. All rights reserved.

WITH-PROFITS
Solvency II framework
Graph 7.2.2:
How many of your with-profits funds do you expect to be self-supporting under the Solvency II framework?
6%
7%
8%
79%
Funds do not cover their BEL
Funds fully cover their own BEL, but not their Risk Margin or SCR
Funds fully cover their own BEL and Risk Margin, but not their SCR
Funds fully cover their own BEL, Risk Margin and SCR
Under Solvency II Pillar 1, 48 of the 61 with-profi ts funds are fully self-supporting and cover their own BEL, Risk Margin and SCR. Of the 13 funds that do not, the split is broadly even – 5 do not have suffi cient assets to cover their best estimate liabilities, 4 cover their BEL but not the Risk Margin and the remaining 4 cover their Risk Margin but not the SCR. This is broadly the same as the pattern observed in the 2013 survey.
A comparison with Graph 7.2.1 shows that slightly more funds are expected not to be fully self-supporting under Solvency II compared to the current ICAS regime. This is perhaps to be expected given some of the Solvency II requirements. However, it is worth noting that not all of the funds requiring additional capital under the ICAS regime also require capital support to meet their Solvency II capital requirements – there are two funds that currently support their Pillar 2 realistic liabilities but not their ICA or ICG which are fully self-supporting under Solvency II.
All 13 of the funds requiring additional capital under Solvency II are owned by proprietary fi rms and 12 of these belong to large fi rms, the remaining fund belonging to a small fi rm.
It is unclear the extent to which respondents have made allowance within their current Solvency II estimates for the revised long-term guarantees (LTG) package. Furthermore, it is possible that the recently published PRA consultation paper CP 16/14 may also change the position shown in graph 7.2.2.
TPS 2014
© 2014 KPMG LLP, a UK limited liability partnership, is a subsidiary of KPMG Europe LLP and a member firm of the KPMG network of independent member fi rms affiliated with KPMG International Cooperative, a Swiss entity. All rights reserved.
34

WITH-PROFITS
7.3 SOLVENCY II AND WITH-PROFITS
Presentation of with-profits funds under the prospective approach required under Solvency II
Graph 7.3.1:
Are you currently able to present your with-profits funds under the prospective approach required under Solvency II?
50%
6%
44%
Yes
No - some further development is required
No - significant further development is required
Graph 7.3.1 shows the proportion of respondents that are able to present their with-profi ts funds under the prospective approach required under Solvency II for QRT reporting. This is a complex area with fi rms being required to value fi rst the future guaranteed benefi ts and then any discretionary benefi ts in excess of this on a prospective basis. The nature of this differs fundamentally from the current Realistic Balance Sheet approach where the liabilities are based on the retrospective asset share plus a value for the cost of guarantees. In addition, fi rms will need to explicitly value and report items such as future premiums and expenses and show liabilities gross and net of reinsurance. Current models may not readily provide these outputs and, in the case of reinsurance, may implicitly allow for this by considering only the net liability.
Half of the respondents indicated that they are currently able to meet the prospective reporting requirements, with 44% recognising that some further system and process development is required to satisfy the QRT requirements. 6% of respondents require signifi cant further development in this area.
35 TPS 2014
© 2014 KPMG LLP, a UK limited liability partnership, is a subsidiary of KPMG Europe LLP and a member firm of the KPMG network of independent member fi rms affiliated with KPMG International Cooperative, a Swiss entity. All rights reserved.

WITH-PROFITS
Consideration of with-profits run-off plan as part of the ORSA
Graph 7.3.2:
Will you be considering your with-profits run-off plan as part of your ORSA going forward?
37%
63%
Yes
No - we will consider it outside of the ORSA process
16 of the respondents indicated that they have one or more run-off plans in place that will need to be considered and reviewed on an ongoing basis. The analysis shows that there is not a consistent approach across the market with approximately one third of respondents intending to consider this as part of their ORSA process and the remainder intending to address this separately. This is a noticeably different picture to that provided by the 2013 survey when 56% of respondents stated that they would consider their run-off plans as part of their ORSA, suggesting that this is an area where fi rms are continuing to develop their thinking.
TPS 2014
© 2014 KPMG LLP, a UK limited liability partnership, is a subsidiary of KPMG Europe LLP and a member firm of the KPMG network of independent member fi rms affiliated with KPMG International Cooperative, a Swiss entity. All rights reserved.
36

WITH-PROFITS
7.4 WITH-PROFITS RISK MANAGEMENT
Structural derisking options
Graph 7.4.1:
Which of the following structural derisking options are you considering in respect of your with-profi ts funds?
37 TPS 2014
© 2014 KPMG LLP, a UK limited liability partnership, is a subsidiary of KPMG Europe LLP and a member firm of the KPMG network of independent member fi rms affiliated with KPMG International Cooperative, a Swiss entity. All rights reserved.
Outsource all/part of the cost base 42% 5%
Remove conventional non profit business 6% 41%
Reinsurance 28% 6%
Buy out any pension scheme deficit 9% 18%
Fund restructuring to allow NP sales without WP sales 22%
Remove unit linked non profit business 21%
Remove subsidiaries from the with-profits fund 11%
Other 17% 33%
0% 5% 10% 15% 20% 25% 30% 35% 40% 45% 50%
% of firms with with-profits funds
Already undertaken Under active consideration
Graph 7.4.1 shows the structural derisking options that fi rms with with-profi ts funds have either already taken or are considering. This graph excludes any respondents who stated that a particular action was not applicable to their with-profi ts funds.
The most widely used structural action is outsourcing all or part of the with-profi ts cost base, either to a third party or an internal service company. 42% of respondents have already taken this action with another 5% giving active consideration to this. This is another example of the effects of with-profi ts run-off, with those responsible for managing with-profi ts funds using such arrangements to protect with-profi ts policyholders from the effects of spreading overhead costs across a rapidly reducing in-force book.
The second most common action overall is removing non-profi t business from the fund. 47% of respondents have either taken this action (6%) or are actively considering this (41%). Although the question did not specifi cally ask about the type of non-profi t business, much of this is likely to be annuities which, given their rate of run-off, otherwise would remain in-force within the fund after the withprofi ts liabilities have all expired. Fewer fi rms (21%) were considering removing unit-linked business from the with-profi ts fund. This perhaps refl ects the uncertainty around the value that will be generated by such business, particularly in light of the recent budget changes which mean future persistency experience on unit-linked pensions business is much more of an unknown quantity, and the likely faster run-off compared to annuities.
A number of fi rms either already have or are actively exploring buying-out the withprofi ts fund’s share of any pension scheme defi cit. Such actions are likely to increase as the with-profi ts run-off accelerates and those responsible for managing the fund seek to limit the fund’s exposure to what can often be a material risk.
WITH-PROFITS
Finally, 22% of respondents indicated that they are considering changing their fund structure to allow the continued sale of non-profit business, should new sales of with-profits cease. This question was only relevant to mutuals. The actions potentially include making use of the rule waiver outlined in PS 14/5: Response to CP12/38 – Mutuality and with-profits funds: a way forward, which would allow mutuals to recognise some of the inherited estate as members’ capital and to use this to fund other commercial activities. This is an interesting development since, as yet, no firm has used this new option.
A number of fi rms indicated that they have taken, or are considering, other options. These included reviewing existing estate distribution mechanisms and converting with-profi ts business to a non-profi t basis.
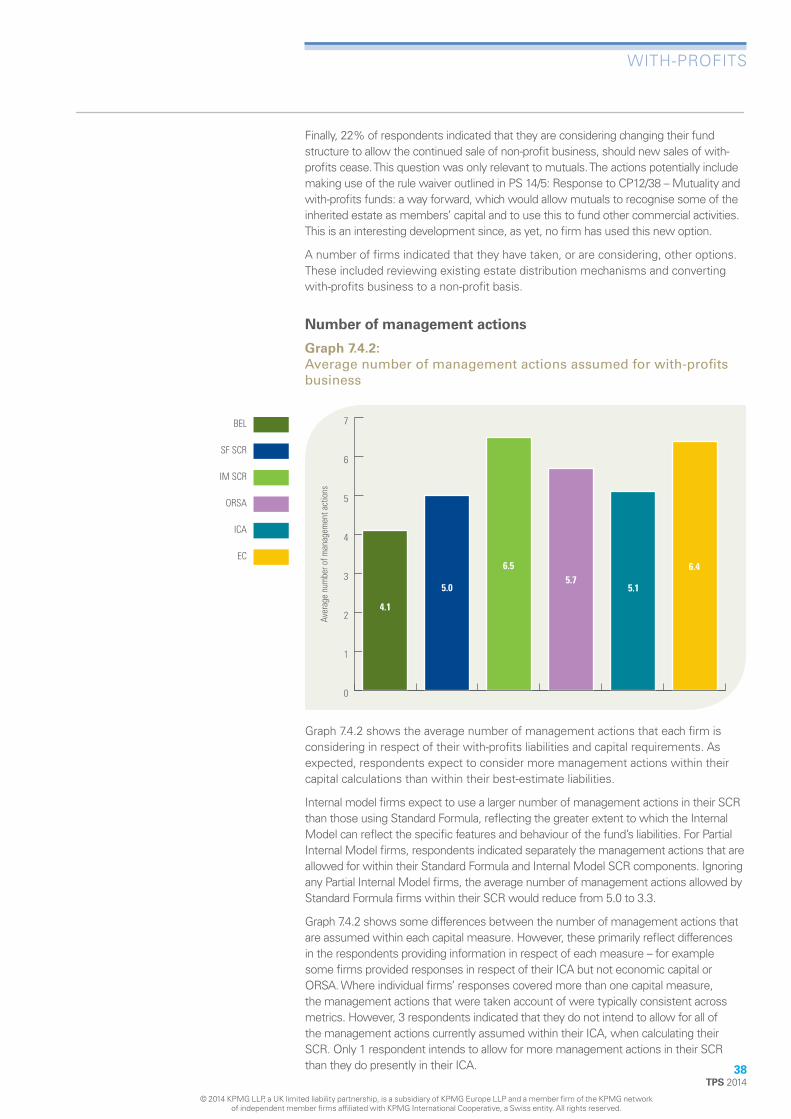
Number of management actions
Graph 7.4.2:
Average number of management actions assumed for with-profi ts business
0
1
2
3
4
5
6
7
4.1
Aver
age
num
ber o
f man
agem
ent a
ctio
ns
BEL
SF SCR
IM SCR
ORSA
ICA
EC
5.0
6.5 5.7
5.1
6.4
Graph 7.4.2 shows the average number of management actions that each fi rm is considering in respect of their with-profi ts liabilities and capital requirements. As expected, respondents expect to consider more management actions within their capital calculations than within their best-estimate liabilities.
Internal model firms expect to use a larger number of management actions in their SCR than those using Standard Formula, reflecting the greater extent to which the Internal Model can reflect the specific features and behaviour of the fund’s liabilities. For Partial Internal Model firms, respondents indicated separately the management actions that are allowed for within their Standard Formula and Internal Model SCR components. Ignoring any Partial Internal Model firms, the average number of management actions allowed by Standard Formula firms within their SCR would reduce from 5.0 to 3.3.
Graph 7.4.2 shows some differences between the number of management actions that are assumed within each capital measure. However, these primarily refl ect differences in the respondents providing information in respect of each measure – for example some firms provided responses in respect of their ICA but not economic capital or ORSA. Where individual firms’ responses covered more than one capital measure, the management actions that were taken account of were typically consistent across metrics. However, 3 respondents indicated that they do not intend to allow for all of the management actions currently assumed within their ICA, when calculating their SCR. Only 1 respondent intends to allow for more management actions in their SCR than they do presently in their ICA.
TPS 2014
© 2014 KPMG LLP, a UK limited liability partnership, is a subsidiary of KPMG Europe LLP and a member firm of the KPMG network of independent member fi rms affiliated with KPMG International Cooperative, a Swiss entity. All rights reserved.
38

39 TPS 2014
0% 10% 20% 30% 40% 50% 60% 70% 80% 90% 100%
Changes in final bonus rates
Market value reductions
Changes in regular bonus rates
Changes to equity backing ratio
Remove misc surplus/planned enhancements
Introduce/change guarantee charge
Day to day ALM decisions
Changes to DB pension scheme
Increase in charges for insurance benefits
Change in hedging strategy
Increases in administration charges
Change in new business levels
Implement/change outsourcing agreements
Other
No management actions
EC ICA ORSA IM SCR SF SCR BEL
Percentage of firms
Number of management actions
Graph 7.4.3:
Most common management actions assumed for with-profi ts business
WITH-PROFITS
© 2014 KPMG LLP, a UK limited liability partnership, is a subsidiary of KPMG Europe LLP and a member fi rm of the KPMG network of independent member fi rms affi liated with KPMG International Cooperative, a Swiss entity. All rights reserved.

WITH-PROFITS
Graph 7.4.3 shows the most common management actions indicated by respondents, with those used in each particular component of their liabilities and capital requirements shown separately.
Allowing for changes to fi nal bonus rates is the most common management action with all respondents intending to allow for this in their SCR, ORSA and economic capital. Only 1 respondent does not allow for this in their ICA, and all but 3 intend to refl ect this in their BEL. Changes to MVRs and regular bonus rates followed closely behind this, with respondents assuming identical treatment of these in their economic capital, ICA, ORSA and SCR. One respondent allowed for MVR reductions but not changes to their regular bonus rates in their BEL, but other wise the responses were identical.
Most fi rms allow for changes to the EBR, but the allowance for this varies between components. It is most commonly used in Internal Model SCRs (82%) and economic capital (73%), with just 44% of respondents allowing for this within their BEL.
Respondents allowed for the removal of past miscellaneous surplus or planned enhancements and the introduction of guarantee charges in similar ways for most measures. Around 65% of respondents allowed for each of these in their economic capital, ORSA and SCR, with 55% refl ecting these in their ICA. Firms were more likely to allow for the removal of past miscellaneous surplus or planned enhancements within their BEL (39% of respondents) than increases to guarantee charges (22% of respondents).
Around 40% of respondents allow for day-to-day ALM decisions such as rebalancing the asset mix or duration matching liabilities within their BEL, Standard Formula SCR, ORSA & ICA, with around 55% refl ecting this in their Internal Model SCR and economic capital.
Respondents indicated that a number of other management actions were also considered but to a much lesser degree. These included increasing administration and risk benefit charges, limiting new business levels and changing their hedging strategy.
TPS 2014
© 2014 KPMG LLP, a UK limited liability partnership, is a subsidiary of KPMG Europe LLP and a member firm of the KPMG network of independent member fi rms affiliated with KPMG International Cooperative, a Swiss entity. All rights reserved.
40

8 Risk Capital
8.1 ALL RISKS Method used to determine 1-in-200 marginal stresses
Graph 8.1.1:
Which method do you primarily use to determine your 1-in-200 marginal stresses for the following risks?
0
10
20
30
40
50
60
70
80
90
100
Equi
ty/
Prop
erty
Inte
rest
rate
Cred
itsp
read
Defa
ults
Mor
talit
y
Long
evity
Pers
iste
ncy
Expe
nse
Oper
atio
nal
Liqu
idity
Perc
enta
ge o
f firm
s
11%
4%
56%
4% 4%
15%
22% 31%
8%
38%
8%
15%
61%
4%
7%
14%
20%
16%
8%
4%
52%
11%
52%
19%
19%
43%
11%
14%
18%
14%
19%
26%
4%
19%
19%
15%
39%
4% 4%
29%
18%
7% 17%
17%
41%
24% 17%
3%
55%
3%
21%
41 TPS 2014
© 2014 KPMG LLP, a UK limited liability partnership, is a subsidiary of KPMG Europe LLP and a member firm of the KPMG network of independent member fi rms affiliated with KPMG International Cooperative, a Swiss entity. All rights reserved.
Fit distributions directly to internal historical data
Fit distributions directly to external historical data
External advice
Judgement
Industry data
Other

RISK CAPITA L
We asked fi rms to state the methods they use to determine their 1-in-200 marginal stresses for a number of risks.
As expected, most fi rms relied primarily on external data to set their market 1-in-200 stresses. This was in part due to the wide availability of good quality external data for market risks. Other responses also indicated the use of internal as well as industry data, expert judgement or “other” methods to set their 1-in-200 stresses for the market risks.
The “other” responses included the use of forward looking economic scenarios to calibrate the interest rate stresses, the use of the modifi ed Merton model for default risk and the use of a stochastic model with parameters determined primarily using expert judgement. A number of fi rms also use the Standard Formula to set their 1-in200 stresses for market risks.
For the non-economic stresses, judgement plays the most signifi cant part in the calibration. A large number of fi rms also use historic data, mainly their own internal experience data, to derive the stresses. As expected, external historical data is less widely used, as such data is less readily available (other than for mortality and longevity where population statistics are available).
The “other” responses included using the QIS5 stresses and scenario analysis for expense risk.
TPS 2014
© 2014 KPMG LLP, a UK limited liability partnership, is a subsidiary of KPMG Europe LLP and a member firm of the KPMG network of independent member fi rms affiliated with KPMG International Cooperative, a Swiss entity. All rights reserved.
42

43 TPS 2014
RISK CAPITAL
Allocation of fi nal risk capital
Graph 8.1.2a:
What percentage of your fi nal risk capital is allocated to the following risks pre-diversifi cation?
0%
10%
20%
30%
40%
50%
60%
70%
80%
90%
100%
6%
7%
36%
48%
All Small
Perc
enta
ge o
f fin
al ri
sk c
apita
l
Medium Large
1%
74%
21%
35%
7%
7%
48%
7%
11%
29%
8%
46%
3%
3%
3%
Market (including credit spread risk)
Credit default
Insurance
Operational risk
Liquidity
Other
We asked fi rms to provide their pre and post-diversifi cation capital risk allocation.
Please note that Graph 8.1.2a refl ects the aggregate allocation of risks across the industry.
Pre-diversifi cation, the largest proportions of the fi nal risk capital requirement were allocated to market risk (48%) and insurance risk (36%). This is not unexpected given the fundamental nature of the protection and savings products. The “other” risks (6%) indicated by respondents included group, counterparty, new business and closure, basis, pension scheme and tax risks. Some insurers have large pension schemes and hence pension scheme risk may be a signifi cant contributor to “other”. However, it is possible that some fi rms have captured the impact of various risks in the pension scheme within the risks themselves.
Operational risk formed a signifi cant component of fi rms’ capital requirements, with medium size fi rms having the largest proportion, while small fi rms have the smallest proportion.
Liquidity risk amounted to less than 0.1% of total risk capital. The majority of fi rms take the view that liquidity risk is better mitigated by means other than holding risk capital. Only 2 out of 25 fi rms indicated that they held capital for liquidity risk.
The difference between the small, medium and large fi rm groupings is likely due to the mix of business written in the specifi c fi rms as well as their size. Looking at the size of the respondents, small fi rms allocated more risk capital to insurance risk (75%) and market risk (21%) and less to the other risks. Medium sized fi rms allocated less risk capital to insurance risk (29%) relative to small and large fi rms.
© 2014 KPMG LLP, a UK limited liability partnership, is a subsidiary of KPMG Europe LLP and a member fi rm of the KPMG network of independent member fi rms affi liated with KPMG International Cooperative, a Swiss entity. All rights reserved.

44TPS 2014
RISK CAPITAL
Graph 8.1.2b:
What percentage of your fi nal risk capital is allocated to the following risks post-diversifi cation?
-10%
0%
10%
20%
30%
40%
50%
60%
70%
80%
90%
100%
110%
5%7%
24%
5%
59%
All Small
Perc
enta
ge o
f fin
al ri
sk c
apita
l
Medium Large
2%
-2%
81%
16%
4%
7%5%
23%
61%
6%
10%
31%
7%
45%
3%
Percentage of firms
Market (including credit spread risk)
Credit default
Insurance
Operational risk
Liquidity
Other
Please note that Graph 8.1.2b refl ects the aggregate allocation of risks across the industry.
Post-diversifi cation, the allocation of risk capital to the various risk drivers broadly mirrors the pre-diversifi cation fi gures. Overall, the results show an overall reduction of insurance risk capital and an increase of all other risk capital. This suggests that respondents observed less diversifi cation of market risks than they observe with insurance risks.
It is interesting to note that the proportion of capital held in respect of operational risk has not changed substantially post diversifi cation.
It is also interesting to note that for small insurers the “other” risks had a small negative contribution to the post diversifi cation capital requirement suggesting negative correlation between the capital requirements between “other” risks and the market, credit, insurance, operational and liquidity risks for some respondents. The fi rms with a negative contribution from “other” risks did not indicate what these risks represented.
Please note section 8.17 (Aggregation) on the correlation assumptions used by fi rms responding to this survey.
© 2014 KPMG LLP, a UK limited liability partnership, is a subsidiary of KPMG Europe LLP and a member fi rm of the KPMG network of independent member fi rms affi liated with KPMG International Cooperative, a Swiss entity. All rights reserved.

RISK CAPITA L
Asset stressing
Graph 8.1.3:
Which of the following best describes where you perform your asset stressing?
13% 3%
17%
7%
60%
Within aggregation model
Within actuarial valuation model
Provided by asset management tool
Calculated in a spreadsheet
Other
We asked fi rms to state the primary tools they used to perform their asset stressing.
The use of spreadsheets is the prevailing method (60%) used to perform asset stresses, followed by performing the stresses in the actuarial valuation model (17%). Not surprisingly, smaller fi rms are more likely to use spreadsheets to perform their asset stressing than their larger counterparts. All small respondents use spreadsheets to perform their asset stressing, while the percentage of respondents using spreadsheets for medium and large fi rms is 78% and 47% respectively.
45 TPS 2014
© 2014 KPMG LLP, a UK limited liability partnership, is a subsidiary of KPMG Europe LLP and a member firm of the KPMG network of independent member fi rms affiliated with KPMG International Cooperative, a Swiss entity. All rights reserved.

RISK CAPITA L
Challenging risks to model
In all of our surveys since 2011, we asked participants which of the risks they found most challenging to model. As in previous years, respondents were asked to select all that apply.
Table 8.1.4:
Which risks are you finding the most challenging to model?
Number of % of % of espondents respondents respondents
(2014) (2014) (2013)
Market Spread risk 16 53% 49%
Interest rate risk 12 40% 43%
Credit default risk 8 27% NA
Currency risk 2 7% 9%
Swap-Gilt Spread risk 1 3% NA
Equity risk 1 3% 6%
Property risk 1 3% 3%
Concentration risk 1 3% 11%
Implied interest volatility risk 0 0% NA
Implied equity volatility risk 1 3% NA
Implied property volatility risk 0 0% NA
Life Longevity risk 12 40% 29%
Lapse risk 7 23% 29%
Expense risk 4 13% 20%
Catastrophe risk 3 10% 9%
Mortality risk 1 3% 6%
Disability / morbidity risk 1 3% 14%
Revision risk 0 0% 3%
Health SLT Expense risk 0 0% 3%
Mortality risk 0 0% 0%
Longevity risk 0 0% 0%
Revision risk 0 0% 0%
Health Non- Catastrophe risk 1 3% 6% SLT Lapse risk 0 0% 3%
Premium and expense risk 0 0% 0%
Non-life Premium and reserve risk 0 0% 0%
Reserve risk 0 0% 0%
Catastrophe risk 0 0% 0%
Other Operational risk 14 47% 54%
r
TPS 2014
© 2014 KPMG LLP, a UK limited liability partnership, is a subsidiary of KPMG Europe LLP and a member firm of the KPMG network of independent member fi rms affiliated with KPMG International Cooperative, a Swiss entity. All rights reserved.
46

RISK CAPITA L
Consistent with the observations in last year’s survey, the risks that fi rms fi nd most challenging to model are operational risk, spread risk, interest rate risk and longevity risk. This refl ects the use of new and more complex methodologies as fi rms align their ICA and their Solvency II methodologies, in particular for Internal Model fi rms.
Responses for other risks were consistent with responses from the 2013 survey, with marginal improvements perhaps indicating that a few more fi rms were overcoming the challenges they previously faced in modelling these risks.
In general the responses indicated that market risks were more onerous to model than life insurance risks. Operational risk was also singled out as a particularly challenging risk to model.
Market Risk
The market risk category includes interest rate, equity, property, credit spread, currency, concentration and counter cyclical premium risks.
In line with the last year’s survey, spread risk and interest rate risk were listed as the most challenging to model with 53% of respondents selecting spread risk and 40% selecting interest rate risk. For the interest rate stress, most fi rms use principal component analysis (see section 8.3 on methods used to model interest rate risk) in order to set the shocks. We have seen fi rms apply expert judgement to the principal component analysis calibrations, as stresses calibrated to historical data might not be severe enough to produce appropriate shocks. Expert judgement overlays may be diffi cult to calibrate, which may be a source of challenge for many fi rms. In addition, extrapolation methods around the interest rate curve have received some attention recently, prompted by the Long Term Guarantees Assessment and adding to the challenges faced by the respondents.
27% of respondents stated that they found credit default to be challenging to model. This was a new question in this year’s survey.
Insurance and Operational Risk
The proportion of fi rms indicating longevity risk as challenging to model has risen to 40% compared to 29% in last year’s survey. 12 fi rms indicated that they found longevity risk challenging to model compared to 10 in last year’s survey. See section 8.10 on the discussion of industry debate around longevity risk, which provides some indication on why fi rms may be fi nding longevity risk challenging to model.
The percentage of fi rms fi nding operational risks diffi cult to model is consistent with previous fi ndings, and is marginally reduced from 54% last year to 47% this year. We saw a large increase in the percentage of fi rms fi nding operational risk modelling challenging in last year’s survey. This refl ected the fi rms’ adoption of more complex operational risk modelling methodologies in order to overcome some of the limitations of more simple approaches.
The responses to the other questions in this section were either consistent with last year’s responses, or showed a decrease in the proportion of fi rms fi nding other insurance risks challenging to model.
47 TPS 2014
© 2014 KPMG LLP, a UK limited liability partnership, is a subsidiary of KPMG Europe LLP and a member firm of the KPMG network of independent member fi rms affiliated with KPMG International Cooperative, a Swiss entity. All rights reserved.

RISK CAPITAL
8.2 MARKET RISK MODELLING
Approach to modelling market risk losses
Graph 8.2.1a:
What technique best describes your approach to modelling market risk loss on assets?
3%23%
64%
10%
Curve fitting
Replicating portfolios
Least squares Monte Carlo
Direct evaluation
Other
Graph 8.2.1b:
What technique best describes your approach to modelling market risk loss on liabilities?
23%
6%
3%
45%
23%
TPS 2014
© 2014 KPMG LLP, a UK limited liability partnership, is a subsidiary of KPMG Europe LLP and a member firm of the KPMG network of independent member fi rms affiliated with KPMG International Cooperative, a Swiss entity. All rights reserved.
48
Curve fitting
Replicating portfolios
Least squares Monte Carlo
Direct evaluation
Other

RISK CAPITA L
We asked fi rms to state their primary approach to modelling market risk losses on assets and liabilities.
Of the fi rms responding to the survey, 45% report using the direct evaluation approach for their liability modelling. This remains the most widely used method of evaluating the values of liabilities under stress and in the main refl ects the proportion of fi rms using the stress and correlation matrix approach for the ICA. All of the fi rms modelling using the direct evaluation approach for liability modelling also use the direct evaluation approach for the assets.
A signifi cant proportion (32%) of respondents reported using either curve fi tting, replicating portfolio or least squares Monte Carlo for liability stressing. Of these fi rms, 9% used curve fi tting for their asset stressing, 16% used the direct evaluation method, 3% used Least Squares Monte Carlo, and 3% reported using “other” methods.
Of the remaining fi rms, 18% reported “other” for both assets and liabilities, while 3% reported “other” for liabilities, and direct evaluation for assets.
The range of approaches used by fi rms for modelling their market risks refl ect the general approaches they are now using for their ICA. Internal model fi rms, who are usually the larger fi rms, have adopted simulation based methods for calculating their ICA. They largely use either curve fi tting, replicating portfolio or Least Squares Monte Carlo for their capital calculation.
49 TPS 2014
© 2014 KPMG LLP, a UK limited liability partnership, is a subsidiary of KPMG Europe LLP and a member firm of the KPMG network of independent member fi rms affiliated with KPMG International Cooperative, a Swiss entity. All rights reserved.

RISK CAPITA L
Tools used for replicating portfolios, curve fitting or Least Squares Monte Carlo (LSMC)
Graph 8.2.2:
If you use replicating portfolios, curve fitting or Least Squares Monto Carlo as part of your model, what tools do you use?
46%
15%
16%
RiskAgility
Internally developed Excel based tool
Externally developed Excel based tool
Algorithmics
23%
We asked fi rms to state which tools they primarily used for replicating portfolio, curve fi tting or for Least Squares Monte Carlo.
RiskAgility™ is the most widely used proxy model tool used by the respondents. All but one fi rm (which uses RiskAgility™ for replicating portfolios along with an internally developed Excel tool) use it for curve fi tting. One fi rm uses RiskAgility™ for both curve fi tting and Least Squares Monte Carlo. A key component of the Least Squares Monte Carlo technique is the ability to produce nested stochastic scenarios during calibration, so typically we would expect to see fi rms using a fi tting / calibration tool alongside suitable Economic Scenario Generator software, such as the B&H Liability Proxy Generator™.
Of the two fi rms using Algorithmics™, one uses it for replicating portfolios, and the other uses it for curve fi tting.
Internally and externally developed Excel based tools are also widely used amongst respondents, with four fi rms using them for curve fi tting, one using alongside RiskAgility™ for replicating portfolios (as also described above) and one using alongside SMART™ for replicating portfolios.
One of the challenges for fi rms using internally developed software, particularly when considered in the context of Solvency II regulations, is ensuring that robust controls are in place. Under Solvency II, users of externally developed software will need to demonstrate a deep understanding of the models which will include the development of their own documentation. Whilst we understand that a number of fi rms have established processes in place and have already chosen their modelling frameworks for Solvency II, it will be interesting to see the regulatory challenges applied dependent on the type of modelling framework that fi rms have adopted (in particular internal vs. external).
TPS 2014
© 2014 KPMG LLP, a UK limited liability partnership, is a subsidiary of KPMG Europe LLP and a member firm of the KPMG network of independent member fi rms affiliated with KPMG International Cooperative, a Swiss entity. All rights reserved.
50

RISK CAPITA L
8.3 INTEREST RATE RISK Use of a relative or absolute shock
Graph 8.3.1:
Do you calibrate a relative or absolute shock for the purposes of your interest rate stress calibration?
45%
10%
45%
Relative
Absolute
Other
We asked fi rms whether they calibrated absolute or relative shocks for the purposes of their interest rate risk calibration. Of the 29 responses, 13 fi rms stated that they calibrate an absolute shock, and 13 fi rms stated they calibrate a relative shock. In the current low interest rate environment, an advantage of using the relative approach is that it does not produce negative interest rate assumptions for downward interest rate stresses.
Of the three fi rms who responded “other”, one uses a principal component analysis based method to calibrate a relative interest rate stress, with an overlay of expert judgement applied to uplift the stress to take into account the prevailing low interest rates.
51 TPS 2014
© 2014 KPMG LLP, a UK limited liability partnership, is a subsidiary of KPMG Europe LLP and a member firm of the KPMG network of independent member fi rms affiliated with KPMG International Cooperative, a Swiss entity. All rights reserved.

RISK CAPITA L
Interest rate stress methodology
Graph 8.3.2:
When determining your interest rate stress, what methods do you use?
4%
11%
53%
32%
Principal component analysis (PCA)
Term dependent shift
Constant shift
Other
We asked fi rms what methods they used to determine their interest rate stress assumption.
Of the 28 responses to this question, 15 fi rms stated that they used the principal component analysis method for setting the interest rate risk stress assumption. Additionally, 9 fi rms stated that they adopted a term dependent shift approach. Three fi rms stated they used a constant shift approach, and two fi rms described other approaches.
Firms adopting the principal component analysis method tend to be larger organisations: 73% of these fi rms have Peak I liabilities above £5 billion, compared to 56% of the survey population.
Compared to last year, there has been an increase in the proportion of fi rms using the principal component analysis method and a decrease in the proportion using the term dependent shift approach. The proportion of fi rms using the constant shift or other approaches has decreased. The change in profi le implies a general move by the market to adopt more complex interest rate stress methodologies.
Of the fi rms using the principal component analysis approach, 80% modelled 3 principal components.
TPS 2014
© 2014 KPMG LLP, a UK limited liability partnership, is a subsidiary of KPMG Europe LLP and a member firm of the KPMG network of independent member fi rms affiliated with KPMG International Cooperative, a Swiss entity. All rights reserved.
52

RISK CAPITA L
Expert judgement overlays
Graph 8.3.3:
Do you apply any expert judgement overlays that influence the level of the yield curve under stress?
46%
54%
Ye s
No
We asked fi rms to state whether or not they applied an expert judgement overlay to their yield curve stresses.
There is a fairly even split between fi rms that do and don’t apply an expert judgement overlay to adjust the yield curve under stress. There is no relationship between the size of the fi rm and whether or not it applies expert judgement.
53 TPS 2014
© 2014 KPMG LLP, a UK limited liability partnership, is a subsidiary of KPMG Europe LLP and a member firm of the KPMG network of independent member fi rms affiliated with KPMG International Cooperative, a Swiss entity. All rights reserved.

RISK CAPITA L
Discount basis
Graph 8.3.4:
Discount basis used in the calculation of best estimate liability (excluding liquidity premium)
35%
3% 3%
7%
Gilts
Gilts +10bps
Swaps
Swaps -10bps
Swaps -35bps
Other
24%
28%
The majority of respondents (55%) calculate their best estimate liability using swaps with or without adjustments, while the rest largely use gilts, with or without adjustment.
The adjustments that fi rms are making to the swap spreads lie in the range of the adjustments for credit risk that the Solvency II requirements specify. Swaps minus 10bps is the most widely used basis with 28% respondents indicating that they use this. Only 3% indicated that they are using a 35bps adjustment, which is the maximum allowed under current Solvency II rules.
We note that 42% of fi rms use a discount rate based on gilts, with 7% making a +10bps adjustment to the gilt discount rates. We note that the use of the discount rate based on gilts is not consistent with Solvency II requirements which require the use of discount rates based on swap rates for calculating the technical provisions.
Historically gilts have been considered risk free, e.g. for the ICA and MCEV. However we are seeing a general trend towards using swap rates for market consistent calculations.
TPS 2014
© 2014 KPMG LLP, a UK limited liability partnership, is a subsidiary of KPMG Europe LLP and a member firm of the KPMG network of independent member fi rms affiliated with KPMG International Cooperative, a Swiss entity. All rights reserved.
54

55 TPS 2014
Level of the 1-in-200 yield curve stresses
Graph 8.3.5:
1-in-200 yield curve stresses in basis points as the difference from the base curve
Term 1 - up stress244
Term 5 - up stress226
Term 10 - up stress 197
Term 15 - up stress170
Term 20 - up stress 150
Term 1 - down stress-50
Term 5 - down stress-127
Term 10 - down stress-142
Term 15 - down stress -140
Term 20 - down stress-125
-700 -500 -300 -100 100
Basis Points
300 500 700 900
Note that the graph shows as a box and whisker plot the distribution of yield curve stresses. The ‘box’ represents the inter-quartile range, the ‘whiskers’ represent the minimum and maximum survey responses, and the dot represents the median or 50th percentile.
We asked fi rms to state their yield curve stresses at terms of 1, 5, 10 and 15 years. Graph 8.3.5 shows that overall, the magnitudes of the interest rate down stresses tend to be lower than the interest rate up stresses. This likely refl ects the current low interest rate environment as well as the application of fl oors to the post-stress interest rates resulting in smaller stresses in comparison.
Overall, we observed a slightly higher magnitude of yield curve stresses this year compared to last year. The inter-quartile ranges for the stresses are fairly tight which suggests a convergence in market practice.
We note that for some fi rms the specifi ed extreme downward stress may result in negative interest rates. Hence, it is possible that some fi rms have stated the whole stress in their response rather than just the stress above the base curve. We note that a large proportion of fi rms apply a fl oor to the stressed yield to avoid negative rates being applied in practice (see Graph 8.3.6a).
RISK CAPITAL
© 2014 KPMG LLP, a UK limited liability partnership, is a subsidiary of KPMG Europe LLP and a member fi rm of the KPMG network of independent member fi rms affi liated with KPMG International Cooperative, a Swiss entity. All rights reserved.

56TPS 2014
Application of a fl oor or a cap on the yield curve in the 1-in-200 interest rate stress
Graph 8.3.6a:
Do you apply a fl oor to the yield?
48%
Yes
No
52%
Graph 8.3.6b:
Do you apply a cap to the yield?
4%
Yes
No
96%
48% of fi rms responding to this question indicated that they applied a fl oor to interest rates, while only 4% (1 out of 25 fi rms) indicated that they also applied a cap to interest rate stresses.
Of the fi rms applying interest rate fl oors, all but one applied a 0% fl oor to the stressed level, while one indicated that they applied a 10bps fl oor to the interest rate.
One fi rm indicated that they capped their interest rate stress at 150bps.
RISK CAPITAL
© 2014 KPMG LLP, a UK limited liability partnership, is a subsidiary of KPMG Europe LLP and a member fi rm of the KPMG network of independent member fi rms affi liated with KPMG International Cooperative, a Swiss entity. All rights reserved.

57 TPS 2014
8.4 CREDIT SPREAD RISK BEL calculation: Spread between government bond yields and corporate bond yields
Graph 8.4.1:
In your BEL calculation, what was the spread between your government bond yields and your corporate bond yields?
AAA 5 years 58
AA 5 years86
A 5 years 118
223BBB 5 years
367BB 5 years
Max: 1029AAA 10 years 61
AA 10 years 91
A 10 years 130
214BBB 10 years
350BB 10 years
AAA 15 years74
AA 15 years91
A 15 years 139
BBB 15 years192
310BB 15 years
AAA 20 years66
AA 20 years90
A 20 years 118
BBB 20 years 175
297BB 20 years
0 100 200 300 400 500 600 700
Basis Points
RISK CAPITAL
© 2014 KPMG LLP, a UK limited liability partnership, is a subsidiary of KPMG Europe LLP and a member fi rm of the KPMG network of independent member fi rms affi liated with KPMG International Cooperative, a Swiss entity. All rights reserved.
Note that graphs 8.4.1 to 8.4.4 show as a box and whisker plot the distribution of spread and the proportion of spread attributed to the liquidity premium under the BEL and stress calculations. The ‘box’ represents the inter-quartile range, the ‘whiskers’ represent the minimum and maximum survey responses, and the dot represents the median or 50th percentile. Note that where whiskers have been truncated, a label indicates the maximum value taken.
We asked respondents to provide the basis point spread they assume between government and corporate bonds for the calculation of the BEL as at year end 2013.
In this year’s survey, we asked for more granular information on the spreads at different terms, therefore these results cannot be directly compared with last year’s survey.
However, in general, the credit spreads were lower this year compared to last year, which is broadly consistent with market movements observed over 2013.

58TPS 2014
BEL calculation: Percentage of the spread attributed to the liquidity premium
Graph 8.4.2:
In your BEL calculation, what percentage of the spread did you attribute to the liquidity premium when determining your valuation interest rate?
AAA 5 years60%
AA 5 years54%
A 5 years 51%
BBB 5 years 50%
BB 5 years50%
AAA 10 years
AA 10 years 54%
A 10 years 51%
BBB 10 years50%
BB 10 years50%
AAA 15 years60%
AA 15 years53%
A 15 years 50%
BBB 15 years50%
BB 15 years50%
AAA 20 years50%
AA 20 years51%
A 20 years 50%
BBB 20 years 50%
BB 20 years50%
0 10% 20% 30% 40% 50% 60% 70% 80% 90% 100%
Percentage of spread
60%
RISK CAPITAL
© 2014 KPMG LLP, a UK limited liability partnership, is a subsidiary of KPMG Europe LLP and a member fi rm of the KPMG network of independent member fi rms affi liated with KPMG International Cooperative, a Swiss entity. All rights reserved.
Graph 8.4.2 shows that most fi rms assume a signifi cant proportion of the spread to be attributed to the liquidity premium, with the average proportion reducing as the rating of the corresponding bonds reduce.
However, as Graph 8.4.2 shows, there is not much variation by term. Only 6 of the 16 fi rms responding to this question indicated that they attributed different proportion of the spread to liquidity at different terms.
There was no clear relationship between the size and type of fi rm and their approach to attributing the credit spread to a liquidity premium in the base assumptions.
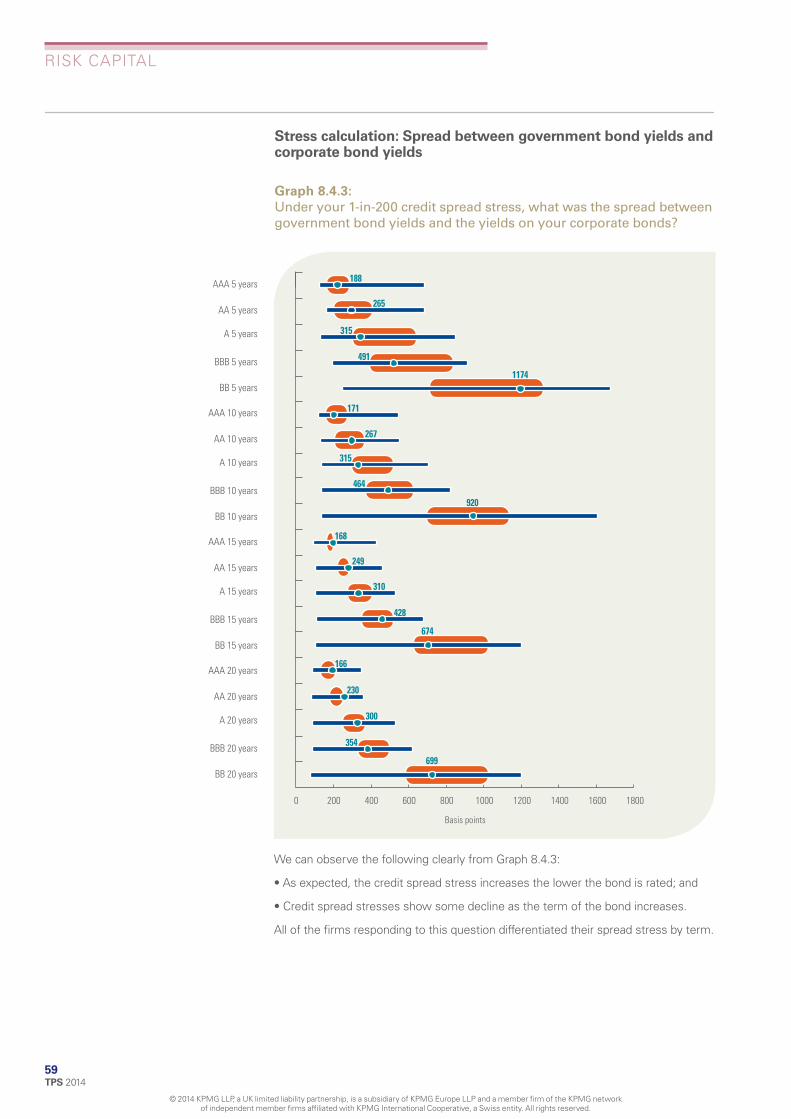
59 TPS 2014
2
491
315
Stress calculation: Spread between government bond yields and corporate bond yields
Graph 8.4.3:
Under your 1-in-200 credit spread stress, what was the spread between government bond yields and the yields on your corporate bonds?
RISK CAPITAL
© 2014 KPMG LLP, a UK limited liability partnership, is a subsidiary of KPMG Europe LLP and a member fi rm of the KPMG network of independent member fi rms affi liated with KPMG International Cooperative, a Swiss entity. All rights reserved.
AAA 5 years 188
AA 5 years265
A 5 years
BBB 5 years1174
BB 5 years
AAA 10 years 171
AA 10 years 267
A 10 years 315
BBB 10 years464
920BB 10 years
AAA 15 years 168
AA 15 years49
A 15 years 310
BBB 15 years428
674BB 15 years
AAA 20 years166
AA 20 years230
A 20 years 300
BBB 20 years 354
699BB 20 years
0 200 400 600 800 1000 1200 1400 1600 1800
Basis points
We can observe the following clearly from Graph 8.4.3:
• As expected, the credit spread stress increases the lower the bond is rated; and
• Credit spread stresses show some decline as the term of the bond increases.
All of the fi rms responding to this question differentiated their spread stress by term.
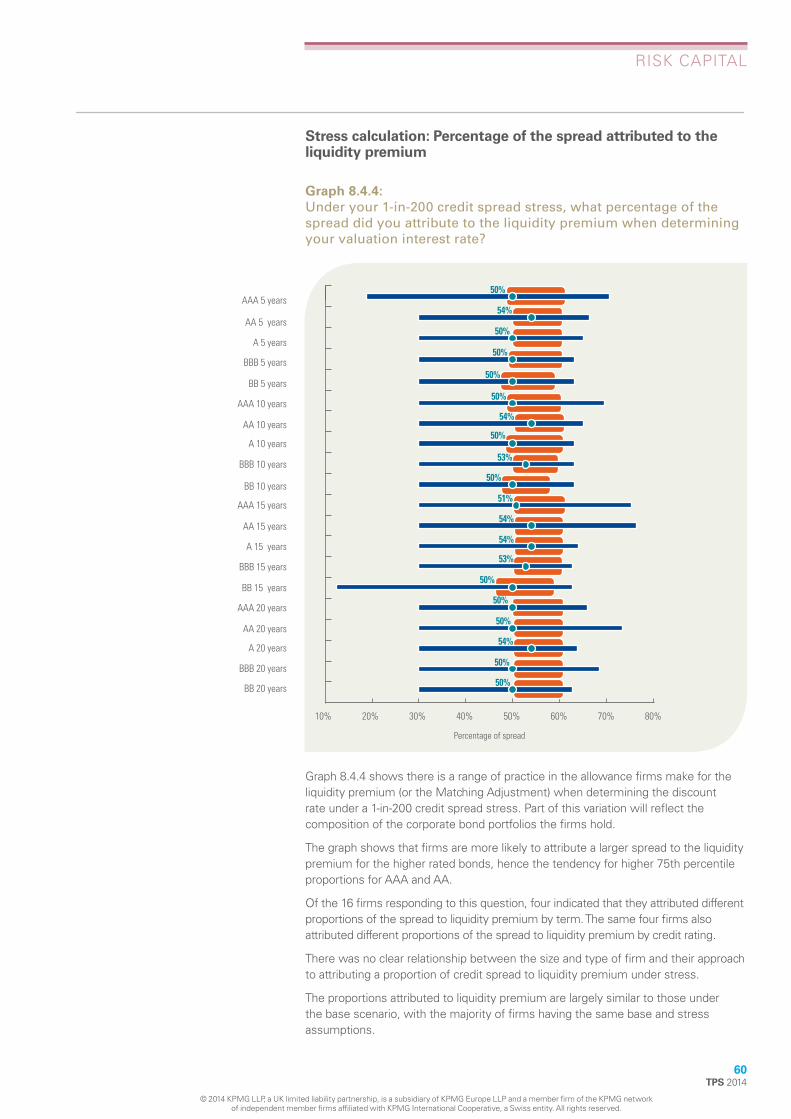
60TPS 2014
%
%
%
Stress calculation: Percentage of the spread attributed to the liquidity premium
Graph 8.4.4:
Under your 1-in-200 credit spread stress, what percentage of the spread did you attribute to the liquidity premium when determining your valuation interest rate?
RISK CAPITAL
© 2014 KPMG LLP, a UK limited liability partnership, is a subsidiary of KPMG Europe LLP and a member fi rm of the KPMG network of independent member fi rms affi liated with KPMG International Cooperative, a Swiss entity. All rights reserved.
50%AAA 5 years
54AA 5 years
50%A 5 years
50%BBB 5 years
50%BB 5 years
50%AAA 10 years
54AA 10 years
50%A 10 years
BBB 10 years53
50%BB 10 years
AAA 15 years51%
54%AA 15 years
A 15 years54%
53%BBB 15 years
50%BB 15 years
50%AAA 20 years
50%AA 20 years
A 20 years54%
BBB 20 years50%
BB 20 years50%
10% 20% 30% 40% 50% 60% 70% 80%
Percentage of spread
Graph 8.4.4 shows there is a range of practice in the allowance fi rms make for the liquidity premium (or the Matching Adjustment) when determining the discount rate under a 1-in-200 credit spread stress. Part of this variation will refl ect the composition of the corporate bond portfolios the fi rms hold.
The graph shows that fi rms are more likely to attribute a larger spread to the liquidity premium for the higher rated bonds, hence the tendency for higher 75th percentile proportions for AAA and AA.
Of the 16 fi rms responding to this question, four indicated that they attributed different proportions of the spread to liquidity premium by term. The same four fi rms also attributed different proportions of the spread to liquidity premium by credit rating.
There was no clear relationship between the size and type of fi rm and their approach to attributing a proportion of credit spread to liquidity premium under stress.
The proportions attributed to liquidity premium are largely similar to those under the base scenario, with the majority of fi rms having the same base and stress assumptions.

61 TPS 2014
Application of a fl oor or cap on the credit spread widening or liquidity premium
Graph 8.4.5a:
Do you apply a fl oor or cap on the credit spread widening?
8%4%
Yes, biting
Yes, not biting
No
88%
Graph 8.4.5b:
Do you apply a fl oor or cap on the liquidity premium (credit default allowance)?
4%Yes, biting
Yes, not biting
No
96%
We asked fi rms to state whether they applied a fl oor or a cap on the credit spread widening or on the liquidity premium.
Most fi rms indicated that they do not apply caps or fl oors on the credit spread widening or liquidity premium in their capital calculations.
Of the three fi rms applying caps or fl oor to the spread widening, 2 indicated that the caps or fl oor were not biting for year end 2013.
Only one fi rm applied a fl oor or a cap to the liquidity premium, and this cap was not biting at year end 2013.
RISK CAPITAL
© 2014 KPMG LLP, a UK limited liability partnership, is a subsidiary of KPMG Europe LLP and a member fi rm of the KPMG network of independent member fi rms affi liated with KPMG International Cooperative, a Swiss entity. All rights reserved.

62TPS 2014
8.5 EQUITY RISK Size of shock to equity and property market values
Graph 8.5.1:
For the most material asset type and/or geography, what is the size of shock to equity and property market values under your 1-in-200 stress?
UK equity Overseas equity Property
Perc
enta
ge re
duct
ion
0%
10%
20%
30%
40%
50%
60%
40% 41%
30%
RISK CAPITAL
© 2014 KPMG LLP, a UK limited liability partnership, is a subsidiary of KPMG Europe LLP and a member fi rm of the KPMG network of independent member fi rms affi liated with KPMG International Cooperative, a Swiss entity. All rights reserved.
Note that the graph shows as a box and whisker plot the distribution of equity and property stresses. The ‘box’ represents the inter-quartile range, the ‘whiskers’ represent the minimum and maximum survey responses, and the dot represents the median or 50th percentile.
We asked fi rms to state the size of their 1-in-200 equity and property shocks.
The responses to this survey question indicate that fi rms model UK equity stresses in a fairly small range – between 39% and 48%. The differences may be due to a number of factors, including the fi rms’ equity investment strategies which may restrict investment in different risk categories e.g. in higher or lower equity risk categories.
There is a wider range of responses on the allowance for overseas equity stresses, with reductions in market values between 25% and 50%. Firms’ assumptions on the appropriate 1-in-200 stresses will refl ect the different overseas markets that fi rms are invested in as well as the investment strategies that the fi rms may follow.
The equity stresses compare to the 46.5% and 56.5% Standard Formula stress under Solvency II as at year end 2013 for type 1 and type 2 exposures. The Standard Formula stresses comprise the base stress of 39% and 49% for type 1 and type 2 exposures respectively, and a symmetric adjustment of 7.5%.

63 TPS 2014
8.6 EQUITY, PROPERTY AND INTEREST RATE VOLATILITY
BEL calculation: Approach to modelling equity, property and interest rates volatility
Graph 8.6.1:
In your BEL calculation, how do you model the volatility of equity, property and interest rates?
RISK CAPITAL
© 2014 KPMG LLP, a UK limited liability partnership, is a subsidiary of KPMG Europe LLP and a member fi rm of the KPMG network of independent member fi rms affi liated with KPMG International Cooperative, a Swiss entity. All rights reserved.
100%
90%30%
18%
4%4%
80%
70%21%
15% 61%
rms 60%
50% 25%
Perc
enta
ge o
f fi
40% 30%
30%
20%
10%26%
36% 32%
0%Equity volatility Interest rate volatility Property volatility
Stochastic volatility model
Term dependent volatility
Fixed level of volatility
Not modelled
We asked fi rms whether they modelled equity, property or interest rate volatility. The majority of fi rms responding indicated that they modelled volatility for equity, property and interest rates in the BEL calculations.
For equity volatility, 20 out of 27 fi rms responding to this question indicated that they modelled equity volatility in their BEL calculations, which is more than last year. Of these, eight modelled a fi xed level volatility, four modelled a term dependent volatility structure and eight used a stochastic volatility model. This was the fi rst time we asked fi rms whether they used stochastic models to model the volatility risk.
For interest rate volatility, 18 out of 28 fi rms responded that they modelled this in their BEL which, again, is more than last year. Of these, seven modelled a fi xed level volatility, six modelled a term dependent structure and fi ve use a stochastic volatility model.
For property volatility, 19 out of 28 fi rms responded that they modelled this in their BEL, which is also a higher proportion than last year. Of these, 17 modelled a fi xed level volatility, one modelled a term dependent volatility structure and another used a stochastic volatility model.

64TPS 2014
BEL calculation: Extrapolating to longer term volatilities
Graph 8.6.2:
In your BEL calculation, how do you extrapolate the following out to longer term volatilities?
RISK CAPITAL
© 2014 KPMG LLP, a UK limited liability partnership, is a subsidiary of KPMG Europe LLP and a member fi rm of the KPMG network of independent member fi rms affi liated with KPMG International Cooperative, a Swiss entity. All rights reserved.
100%
80%
ntag
e of
firm
s
60%
100% 100% 100%
Perc
e
40%
20%
0%Interest rate volatility Equity volatility Property volatility
Flat
Change linearly to long term rate
Change exponentially to long term rate
All fi rms indicated that they extrapolated out to longer term volatilities by assuming the volatility curve was fl at beyond the last point at which they had volatility data. For interest rate volatilities, this point is not necessarily related to the last liquid point, and we would expect this term to be shorter than the last liquid point for the relevant interest rate. This is a new question in this year’s survey and there is no comparative information from last year.

65 TPS 2014
Base volatility assumptions
Graph 8.6.3:
What assumptions do you use for base volatility levels at various terms?
Equity 5 years1890
Equity 10 years 2210
Equity 15 years 2341
Equity 20 years 2385
Interest 5 years1700
Interest 10 years 1550
Interest 15 years1471
Interest 20 years1470
Property 5 years1500
Property 10 years 1500
Property 15 years1500
Property 20 years1500
0 500 1000 1500 2000 2500 3000
Basis points
Note that the graph shows as a box and whisker plot the distribution of base volatility levels. The ‘box’ represents the inter-quartile range, the ‘whiskers’ represent the minimum and maximum survey responses, and the dot represents the median or 50th percentile.
The volatilities in the base assumptions vary signifi cantly between different fi rms.
As Graph 8.6.3 shows, the assumptions used by the respondent show a fairly wide spread for equity and interest rate volatility. In contrast, the majority of fi rms responding to this question had the same volatility assumption for property volatility, and the inter-quartile range was equal to zero at all terms.
Graph 8.6.3 also indicates the presence of signifi cant outliers in either direction for the base equity and property volatility assumptions. The median volatilities increase with the term for equity, while they are constant for property. This refl ects the different approaches taken by fi rms for these volatilities. More than half of fi rms modelling equity volatility use either term dependent volatilities or a stochastic volatility model. In contrast, only one fi rm indicated using a stochastic volatility model for property volatility, with the rest of the fi rms modelling a fl at volatility term structure, and the majority of fi rms using the same volatility assumption.
The inter-quartile ranges show that there is more variation in volatility at shorter terms, with the variation falling as the term increases.
RISK CAPITAL
© 2014 KPMG LLP, a UK limited liability partnership, is a subsidiary of KPMG Europe LLP and a member fi rm of the KPMG network of independent member fi rms affi liated with KPMG International Cooperative, a Swiss entity. All rights reserved.

66TPS 2014
Stress calculation: Approach to modelling equity, property and interest rates volatility
Graph 8.6.4:
Do you apply a 1-in-200 equity volatility, property volatility or interest rate volatility stress? If so, how is this determined?
RISK CAPITAL
© 2014 KPMG LLP, a UK limited liability partnership, is a subsidiary of KPMG Europe LLP and a member fi rm of the KPMG network of independent member fi rms affi liated with KPMG International Cooperative, a Swiss entity. All rights reserved.
Yes, stochastic volatility model 100% 4%12%
4%
Yes, shift is term dependent 90%8%
Yes, shift is a fixed level 80%
No, volatility stress 70% 52%48%
f)
irms
(% 60% 46%
50%
Perc
enta
ge o
f
40%
30%
20% 44%35%
48%
10%
0%Interest rate volatility Equity volatility Property volatility
We asked fi rms whether they modelled equity, property or interest rate volatility risk, and if they did, what their approach to allowing for the risk was.
Of the fi rms modelling a stress for equity, property or interest rate volatility, the majority modelled a fi xed level stress across all terms.
About 20% of fi rms used more sophisticated approaches for equity volatility, with 12% using a stochastic volatility model while approximately 8% used a term dependent volatility stress.
About 4% of fi rms use a term dependent interest rate volatility stress while 4% use a stochastic volatility model for their property volatility stress.

67 TPS 2014
Stresses applied to base volatility levels
Graph 8.6.5:
What level of 1-in-200 stress do you apply to base volatility levels at various terms?
RISK CAPITAL
© 2014 KPMG LLP, a UK limited liability partnership, is a subsidiary of KPMG Europe LLP and a member fi rm of the KPMG network of independent member fi rms affi liated with KPMG International Cooperative, a Swiss entity. All rights reserved.
Equity 5 years 1250 Max: 4807
Equity 10 years 1250 Max: 3215
Equity 15 years1225
Equity 20 years1225
Interest 5 years750
Interest 10 years 750
750Interest 15 years
750Interest 20 years
Property 5 years 788
Property 10 years 788
Property 15 years788
Property 20 years788
0 200 400 600 800 1000 1200 1400 1600 1800 2000
Basis points
Note that the graph shows as a box and whisker plot the distribution of volatility stresses. The ‘box’ represents the inter-quartile range, the ‘whiskers’ represent the minimum and maximum survey responses, and the dot represents the median or 50th percentile. Note that where whiskers have been truncated, a label indicates the maximum value taken.
We asked fi rms to state the level of stress they applied to base volatility levels for their ICA. In contrast to last year’s survey, we asked fi rms to provide more detailed information on the volatility stresses at different terms and therefore the responses are not directly comparable with last year’s results.
Most fi rms’ volatility stresses lie within a fairly narrow range. However, there are a few signifi cant outliers, in particular for the equity volatility stresses, where one fi rm models much larger equity volatility stresses at the 5 and 10 year terms than the other fi rms in the comparison.

RISK CAPITA L
8.7 MARKET RISK DIVERSIFICATION
Approach to allow for diversifi cation benefi ts within market risks
Graph 8.7.1:
How do you allow for diversifi cation benefi ts within your market risks?
TPS 2014
© 2014 KPMG LLP, a UK limited liability partnership, is a subsidiary of KPMG Europe LLP and a member firm of the KPMG network of independent member fi rms affiliated with KPMG International Cooperative, a Swiss entity. All rights reserved.
68
Single correlation matrix for all risks 100
Correlation matrix for market risk 90 31%
Copula approach for market risks 80 41% 44%
Copula approach across all risks 70
Implicit in Economic Scenario Generator
f firm
s
60 75% 13%
Perc
enta
ge o
50 28%
19%
40
30 10%
56% 19%
20
10
10% 25% 19%
10%
0 All Small Medium Large
Firms have adopted different approaches to allowing for diversifi cation between market risks and refl ect their overall ICA methodology.
We received 29 responses to this question. Of the 29 respondents, 20 indicated that they use a correlation matrix approach to allowing for diversifi cation between market risks. Of these, 8 allow for diversifi cation between market risks separately and presumably then allow for diversifi cation between market and non-market risks as an additional step. 12 fi rms use a single correlation matrix to allow for diversifi cation between market risks, and between market and non-market risks.
Only 6 fi rms are using copula approaches to allow for diversifi cation and, of these, 4 use the copula approach across all risks, while 2 allow for diversifi cation separately between market risks. All of the fi rms using the copula approaches were large.

RISK CAPITA L
8.8 CREDIT DEFAU LT RISK Approach to modelling credit default risk
Graph 8.8.1:
What technique best describes your approach to modelling credit default risk?
Econometric or time series approach
Structural model (e.g. Merton)
100
90 19% 25%
14%
25%
Actuarial, or reduced form intensity model Not applicable
Other
firm
s (%
) 80
70
60
15%
11%
14%
14% 25%
age
of
50 15% 13%
Perc
ent
40 75%
30 57% 13%
20 41%
10 25%
0 All Small Medium Large
TPS 2014
© 2014 KPMG LLP, a UK limited liability partnership, is a subsidiary of KPMG Europe LLP and a member firm of the KPMG network of independent member fi rms affiliated with KPMG International Cooperative, a Swiss entity. All rights reserved.
69
We asked respondents about the techniques they used for credit risk modelling, and we provided the following answer categories:
• An econometric approach. This is a technique where the probability of default is assumed to be dependent on user-defi ned economic factors. Under this approach the probability of default for each counterparty is driven by the random values that the macroeconomic factors take.
• A str uctural approach (Merton approach). The risk of default or migration is captured in terms of the random change in a fi rm’s assets relative to its liabilities. Default is assumed to occur when the simulated value of a fi rm’s assets fall below its liabilities.
• A reduced form approach. Key inputs (probability of default, loss given default) are assumed to follow certain specifi ed distributions. Under this approach, it is possible to calculate portfolio losses analytically.
The econometric and the structural approaches are the more sophisticated and tend to be used by larger fi rms. The structural approaches require a lot of counterpartyspecifi c data in order to model the default.
Reduced form models are simpler to calibrate and use than the econometric and structural approaches, and medium size fi rms are more likely to use these models.
5 out of 27 respondents stated that they use the econometric or time series approach. Three respondents stated that they use an actuarial or reduced form intensity model, and four respondents stated that structural models are used. Firms that use structural models typically model the credit spread and credit default risks together (see Graph 8.8.2).
11 respondents stated that they use an approach other than those specifi ed above. Of these, fi ve described that they based their approach on the Solvency II Standard Formula calculation. One further respondent described an approach that is broadly similar to the structural approach described above, and four respondents described approaches broadly similar to the reduced form approach described above.

RISK CAPITA L
Modelling of credit spread risk and default risk together or separately
Graph 8.8.2:
For traded securities (e.g. corporate bonds, ABS), do you model credit spread risk and default risk together or separately?
TPS 2014
© 2014 KPMG LLP, a UK limited liability partnership, is a subsidiary of KPMG Europe LLP and a member firm of the KPMG network of independent member fi rms affiliated with KPMG International Cooperative, a Swiss entity. All rights reserved.
70
Together 100
Separately 90 25%
Not applicable 80
70 54%
63% 56%
ms
(%)
60
Perc
enta
ge o
f fir
50 50%
40
30
20
36% 25% 38%
10
0 11%
All
25%
Small
13%
Medium
6%
Large
We asked whether or not respondents model the credit spread and credit default risks separately.
Of the 28 responses, 15 stated that they model these two parts of credit risk together and 10 stated that these are modelled separately.

RISK CAPITA L
Capital held for default on sovereign debt
Graph 8.8.3:
Does your firm hold capital for the default (on either local or foreign currency denominated debt) of any sovereign debt in the following categories?
71 TPS 2014
© 2014 KPMG LLP, a UK limited liability partnership, is a subsidiary of KPMG Europe LLP and a member firm of the KPMG network of independent member fi rms affiliated with KPMG International Cooperative, a Swiss entity. All rights reserved.
All - UK, US and other sovereigns rated AA or above 14% 82% 4%
All - Other sovereigns with a rating below AA 36% 29% 36%
Small - UK, US and other sovereigns rated AA or above 100%
Small - Other sovereigns with a rating below AA 67% 33%
Medium - UK, US and other sovereigns rated AA or above 11% 89%
Medium - Other sovereigns with a rating below AA 11% 56% 33%
Large - UK, US and other sovereigns rated AA or above 19% 75% 6%
Large - Other sovereigns with a rating below AA
20%
56%
40%
6%
60%
38%
80% 100% 0%
Percentage of firms
Yes No Not applicable (no exposure)
We asked fi rms whether they held capital for default on any sovereign debt.
82% of respondents indicated that they did not hold capital for default on UK, US and other sovereign debt rated AA or above with 14% indicating that they held capital against the risk. Three out of four of the respondents modelling default risk on AA and above rated sovereign debt were large fi rms with operations in multiple geographies and who likely have exposure to overseas sovereign debt.
29% of respondents indicated that they did not hold capital against default risk on sovereign debt rated below AA with 36% holding capital against the risk. There appears to be a split in the approaches used by different fi rms to model default risk on sovereigns rated lower than AA. We also note that for UK fi rms, this exposure related to foreign sovereigns (as UK is currently rated at least AA by the three major rating agencies). Therefore, this may refl ect some fi rms’ general practice to model default risk on foreign sovereign debt.
Other respondents indicated that this risk was not applicable and this and this is likely because they held no exposure to either UK and/or foreign sovereign debt.

RISK CAPITA L
8.9 INSURANCE RISK Approach to insurance risks
We asked fi rms about the approach they use to calculate capital requirements for insurance risks, for each of with-profi ts, annuity, unit linked and protection business.
Graph 8.9.1:
What technique best describes your approach to modelling losses arising from life insurance risks for with-profi ts business?
18%
5%
77%
Curve fitting
Least Squares Monte Carlo
Direct evaluation
For with-profi ts business, 77% (17 out of 22) of respondents calculate insurance risk stresses using direct evaluation. One large respondent uses a Least Squares Monte Carlo approach for with-profi ts, but curve fi tting elsewhere.
The remainder of respondents use a curve fi tting technique. In general, achieving a good fi t for with-profi ts business is challenging given the complex interactions that are typically modelled. These include features such as the asymmetric nature of the liabilities, bonus smoothing mechanisms, use of dynamic hedging algorithms and management actions.
For other products the results were very similar so we have not presented them in graphical form. The proportions using direct evaluation are 75% for annuity business, 72% for unit linked business and 76% for protection business, with the remaining proportions all using curve fitting. Only two firms use different approaches for different classes of business. Overall, the firms using curve fitting and Least Squares Monte Carlo tend to be those who have adopted a simulation based approach to aggregation.
TPS 2014
© 2014 KPMG LLP, a UK limited liability partnership, is a subsidiary of KPMG Europe LLP and a member firm of the KPMG network of independent member fi rms affiliated with KPMG International Cooperative, a Swiss entity. All rights reserved.
72

RISK CAPITA L
8.10 MORTALITY AND LONGEVITY RISK
In this section, we consider insurance risk capital for mortality and longevity risks.
When compared with market risks, the approaches that firms use for modelling insurance risks tend to have more reliance on expert judgement, in part due to the relatively limited amount of data available and the resulting challenges in calibrating stresses. It is also the case that there has been relatively little change in the Solvency II requirements for life insurance risks to drive significant developments in the industry.
Nevertheless, within insurance risks, mortality and in particular longevity certainly stands out as the most material risk for many fi rms and the one which has received most attention from the industry. For example, we see that the CMI model has become the default choice for UK insurers to model mortality improvements.
We have also asked some specifi c questions on annuities due to the regulatory and political focus they have received. Recent years have seen strong sales and the rise of the enhanced annuity market, but fi rms are still thinking through the impact of the budget reform on new business volumes and secondary impacts on expenses, for example.
73 TPS 2014
© 2014 KPMG LLP, a UK limited liability partnership, is a subsidiary of KPMG Europe LLP and a member firm of the KPMG network of independent member fi rms affiliated with KPMG International Cooperative, a Swiss entity. All rights reserved.
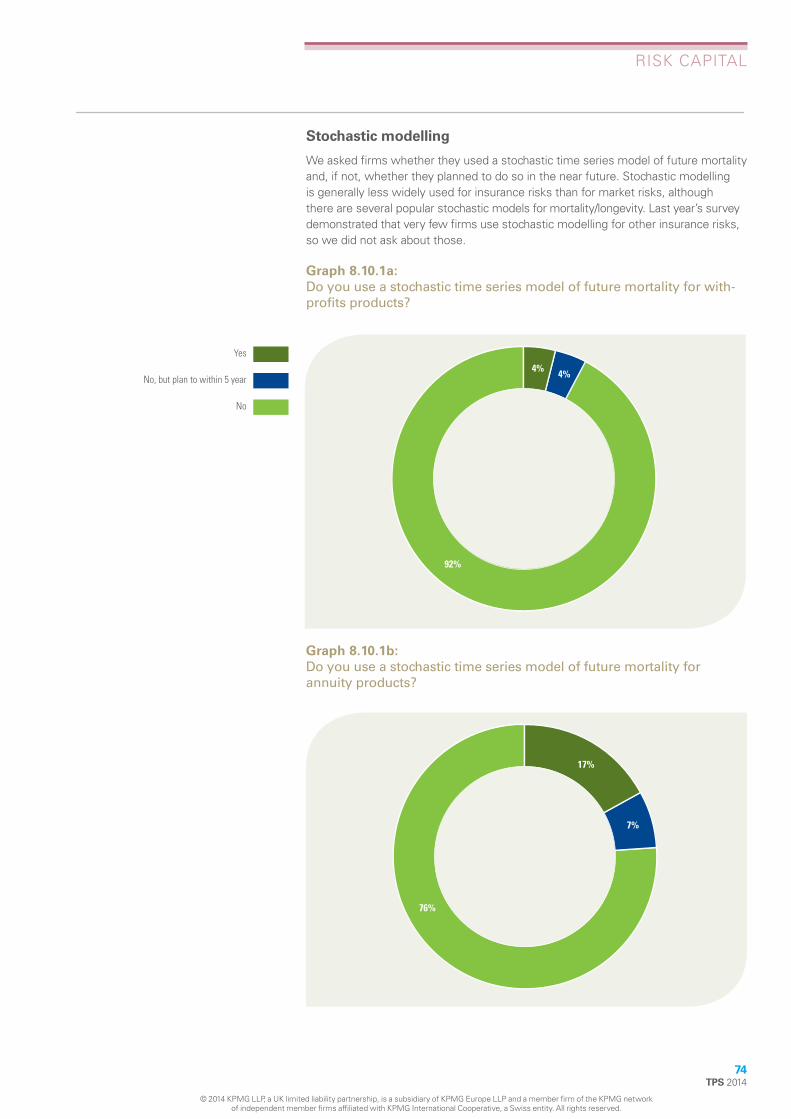
RISK CAPITA L
Stochastic modelling
We asked firms whether they used a stochastic time series model of future mortality and, if not, whether they planned to do so in the near future. Stochastic modelling is generally less widely used for insurance risks than for market risks, although there are several popular stochastic models for mortality/longevity. Last year’s survey demonstrated that very few fi rms use stochastic modelling for other insurance risks, so we did not ask about those.
Graph 8.10.1a:
Do you use a stochastic time series model of future mortality for withprofi ts products?
4% 4%
92%
Yes
No, but plan to within 5 year
No
Graph 8.10.1b:
Do you use a stochastic time series model of future mortality for annuity products?
17%
7%
76%
TPS 2014
© 2014 KPMG LLP, a UK limited liability partnership, is a subsidiary of KPMG Europe LLP and a member firm of the KPMG network of independent member fi rms affiliated with KPMG International Cooperative, a Swiss entity. All rights reserved.
74

RISK CAPITA L
The results demonstrate that the vast majority of respondents do not use stochastic modelling for mortality and have no plans to do so in the near future. This situation has not changed since last year.
In particular, for with-profits business, one firm uses stochastic modelling (and does so for all product classes). In addition one firm (that already uses stochastic modelling for annuity products) plans to do so for with-profits business as well in the next fi ve years. The remaining 92% (25 respondents) do not use or plan to use stochastic modelling.
For annuity business, 5 out of 29 respondents (17%) use stochastic modelling and a further two plan to do so within one year. This reflects the general status of longevity trend risk as one of the most material and uncertain insurance risks for fi rms with annuity portfolios.
Graph 8.10.1c:
Do you use a stochastic time series model of future mortality for unit linked products?
3%
97%
Ye s
No
75 TPS 2014
© 2014 KPMG LLP, a UK limited liability partnership, is a subsidiary of KPMG Europe LLP and a member firm of the KPMG network of independent member fi rms affiliated with KPMG International Cooperative, a Swiss entity. All rights reserved.

RISK CAPITA L
Graph 8.10.1d:
Do you use a stochastic time series model of future mortality for protection products?
7%
93%
Ye s
No
In terms of approaches across other product classes, one fi rm uses stochastic modelling for all product classes (as mentioned above) and one uses stochastic modelling for annuity and protection business only. No further fi rms use or plan to use stochastic modelling for unit linked or protection business.
All of the fi rms who indicated that they do use stochastic modelling use different models. The models used are as follows:
• Lee-Carter (including extensions) • Cairns-Blake-Dowd (including extensions) • Age-Period-Cohort • Cause of death • Other in-house model
It is worth noting that all of the fi rms using or planning to use stochastic modelling for mortality risk are relatively large in size. All except one are (Partial) Internal Model fi rms. This demonstrates that signifi cant scale and expertise is required due to the complexity involved and the lack of an industry standard approach.
TPS 2014
© 2014 KPMG LLP, a UK limited liability partnership, is a subsidiary of KPMG Europe LLP and a member firm of the KPMG network of independent member fi rms affiliated with KPMG International Cooperative, a Swiss entity. All rights reserved.
76

RISK CAPITA L
Mortality stress
Mortality stresses applied
We asked firms about the types of mortality stresses they apply to different classes of business. Across product types, firms most commonly perform a range of individual stresses or perform a combined stress alongside a separate catastrophe stress.
Graph 8.10.2a:
Which of the following 1-in-200 mortality / longevity stresses do you apply to with-profi ts business?
0
2
4
6
8
10
12
14
16
18
20
17Num
ber o
f firm
s
10
3
13
3 2
(1) Mis-estimation of best estimate assumption
(2) Trend
(3) Volatility
(4) Catastrophe
Combined stress of (1) to (3)
Combined stress of (1) to (4)
17 out of 21 respondents perform a standalone level mortality stress with a further 5 performing this stress as part of a combination. As only 3 large insurers perform a standalone volatility stress; it seems that many firms either do not regard this as a material risk or else consider that it is included within their mis-estimation and trend stresses. The Standard Formula includes only a single level stress, but several respondents indicated they assumed this covered both mis-estimation and trend risks.
77 TPS 2014
© 2014 KPMG LLP, a UK limited liability partnership, is a subsidiary of KPMG Europe LLP and a member firm of the KPMG network of independent member fi rms affiliated with KPMG International Cooperative, a Swiss entity. All rights reserved.

RISK CAPITA L
Graph 8.10.2b:
Which of the following 1-in-200 mortality / longevity stresses do you apply to annuity business?
0
2
4
6
8
10
12
14
16
18
20
22
21
Num
ber o
f firm
s
19
5 4 3
1
(1) Mis-estimation of best estimate assumption
(2) Trend
(3) Volatility
(4) Catastrophe
Combined stress of (1) to (3)
Combined stress of (1) to (4)
For annuity business, almost all respondents apply separate level and trend stresses, with very few performing any combination stresses. The PRA has previously stated that they expect longevity stresses to be broken down into at least level and trend components. Interestingly, four fi rms apply a standalone longevity catastrophe stress, the impact of which would be expected to emerge over time rather than occur in a single year.
TPS 2014
© 2014 KPMG LLP, a UK limited liability partnership, is a subsidiary of KPMG Europe LLP and a member firm of the KPMG network of independent member fi rms affiliated with KPMG International Cooperative, a Swiss entity. All rights reserved.
78

RISK CAPITA L
Graph 8.10.2c:
Which of the following 1-in-200 mortality / longevity stresses do you apply to unit linked business?
0
2
4
6
8
10
12
14
16
18
20
18
Num
ber o
f firm
s
7
3
18
5
2
(1) Mis-estimation of best estimate assumption
(2) Trend
(3) Volatility
(4) Catastrophe
Combined stress of (1) to (3)
Combined stress of (1) to (4)
Graph 8.10.2d:
Which of the following 1-in-200 mortality / longevity stresses do you apply to protection business?
(1) Mis-estimation of best estimate assumption
(2) Trend
(3) Volatility
(4) Catastrophe
Combined stress of (1) to (3)
Combined stress of (1) to (4)
0
2
4
6
8
10
12
14
16
18
20
22
24
20Num
ber o
f firm
s
10
4
24
6
2
For unit linked and protection business, the vast majority of fi rms indicated that they perform both a standalone catastrophe stress and either a standalone misestimation or combination stress. A substantial number still perform trend and volatility stresses, either standalone or in combination.
79 TPS 2014
© 2014 KPMG LLP, a UK limited liability partnership, is a subsidiary of KPMG Europe LLP and a member firm of the KPMG network of independent member fi rms affiliated with KPMG International Cooperative, a Swiss entity. All rights reserved.

RISK CAPITA L
Level of mortality stresses applied
The tables below summarise what levels of stress are applied to mortality for each class of business. Note that not all firms who indicated the type of stress applied also provided the level of the stress applied. Several responses have been removed where stresses were provided in a format that is not comparable to other fi rms.
Table 8.10.2e:
Levels of 1-in-200 mortality / longevity stresses applied for with-profi ts business
inimum % M Median % Maximum %
(1) Mis-estimation 9% 17% 25%
(2) Trend (p.a.) 1.00% 1.25% 1.50%
(3) Volatility - - -
(4) Catastrophe 0.15% 0.30% 0.31%
Combined stress of (1) to (3) 18% 20% 20%
Combined stress of (1) to (4) - - -
Table 8.10.2f:
Levels of 1-in-200 mortality / longevity stresses applied for annuity business
Minimum % Median % Maximum %
(1) Mis-estimation 5% 13% 40%
(2) Trend (p.a.) 0.50% 1.25% 1.75%
(3) Volatility 0.40% 0.45% 0.50%
(4) Catastrophe 0.30% 0.30% 0.30%
Combined stress of (1) to (3) 6% 18% 22%
Combined stress of (1) to (4) - - -
Table 8.10.2g:
Levels of 1-in-200 mortality / longevity stresses applied for unit linked business
Minimum % Median % Maximum %
(1) Mis-estimation 8% 15% 25%
(2) Trend (p.a.) 1.00% 1.50% 2.00%
(3) Volatility (*) - - -
(4) Catastrophe 0.15% 0.24% 0.35%
Combined stress of (1) to (3) - 20% 42%
Combined stress of (1) to (4) - - -
Table 8.10.2h :
Levels of 1-in-200 mortality / longevity stresses applied for protection business
Minimum % Median % Maximum %
(1) Mis-estimation 8% 18% 25%
(2) Trend (p.a.) 1.00% 1.45% 2.00%
(3) Volatility 18% n/a (†) 27%
(4) Catastrophe 0.11% 0.21% 0.35%
Combined stress of (1) to (3) 10% 20% 42%
Combined stress of (1) to (4) (*) - - -
(*): not shown as only one respondent (†): not applicable as only two respondents
80 TPS 2014
© 2014 KPMG LLP, a UK limited liability partnership, is a subsidiary of KPMG Europe LLP and a member firm of the KPMG network of independent member fi rms affiliated with KPMG International Cooperative, a Swiss entity. All rights reserved.
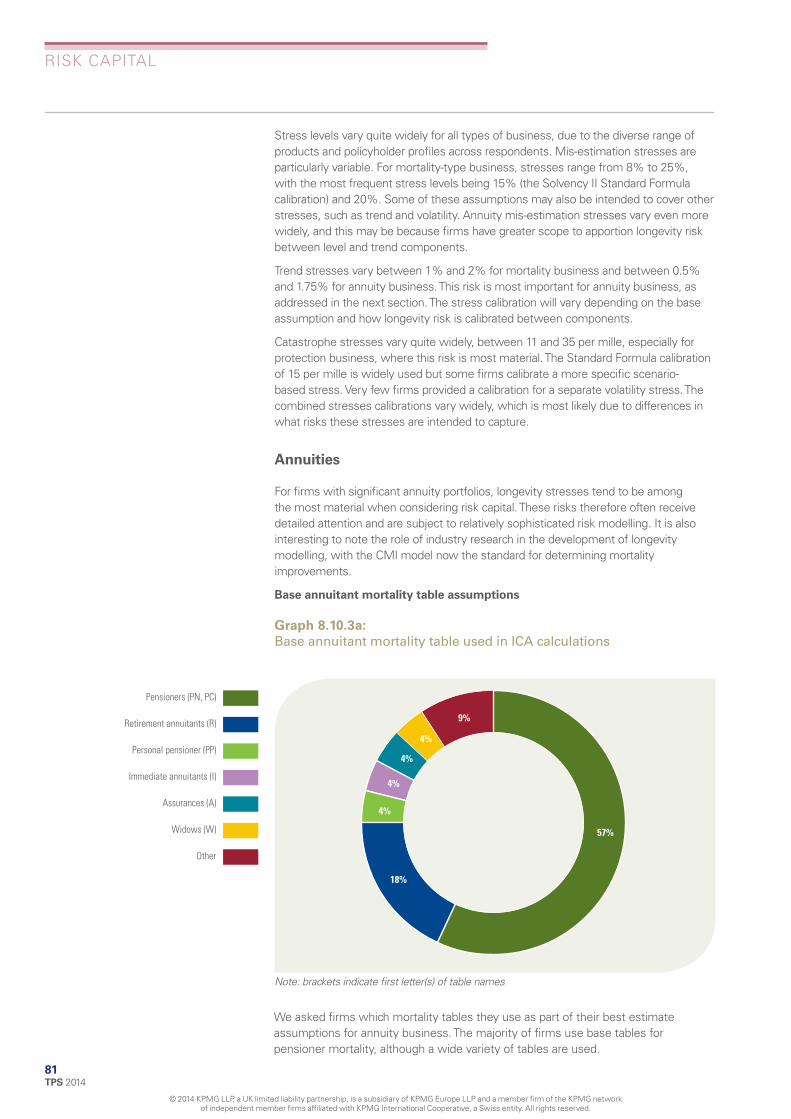
RISK CAPITA L
TPS 2014
© 2014 KPMG LLP, a UK limited liability partnership, is a subsidiary of KPMG Europe LLP and a member firm of the KPMG network of independent member fi rms affiliated with KPMG International Cooperative, a Swiss entity. All rights reserved.
Stress levels vary quite widely for all types of business, due to the diverse range of products and policyholder profiles across respondents. Mis-estimation stresses are particularly variable. For mortality-type business, stresses range from 8% to 25%, with the most frequent stress levels being 15% (the Solvency II Standard Formula calibration) and 20%. Some of these assumptions may also be intended to cover other stresses, such as trend and volatility. Annuity mis-estimation stresses vary even more widely, and this may be because firms have greater scope to apportion longevity risk between level and trend components.
Trend stresses vary between 1% and 2% for mortality business and between 0.5% and 1.75% for annuity business. This risk is most important for annuity business, as addressed in the next section. The stress calibration will vary depending on the base assumption and how longevity risk is calibrated between components.
Catastrophe stresses vary quite widely, between 11 and 35 per mille, especially for protection business, where this risk is most material. The Standard Formula calibration of 15 per mille is widely used but some firms calibrate a more specifi c scenario-based stress. Very few firms provided a calibration for a separate volatility stress. The combined stresses calibrations vary widely, which is most likely due to differences in what risks these stresses are intended to capture.
Annuities
For firms with significant annuity portfolios, longevity stresses tend to be among the most material when considering risk capital. These risks therefore often receive detailed attention and are subject to relatively sophisticated risk modelling. It is also interesting to note the role of industry research in the development of longevity modelling, with the CMI model now the standard for determining mortality improvements.
Base annuitant mortality table assumptions
Graph 8.10.3a:
Base annuitant mortality table used in ICA calculations
9%
4%
4%
4%
4%
57%
18%
Note: brackets indicate first let ter(s) of table names
Pensioners (PN, PC)
Retirement annuitants (R)
Personal pensioner (PP)
Immediate annuitants (I)
Assurances (A)
Widows (W)
Other
We asked fi rms which mortality tables they use as part of their best estimate assumptions for annuity business. The majority of fi rms use base tables for pensioner mortality, although a wide variety of tables are used.
81

RISK CAPITA L
Table 8.10.3b:
Base annuitant table multiplier used in ICA calculations
Minimum % Median % Maximum %
Base - Male 70% 98% 127%
Base - Female 70% 100% 127%
Stress - Male 64% 84% 126%
Stress - Female 60% 88% 110%
Respondents indicated a very wide range of table multipliers for base and stress assumptions, with the median base assumptions being 98% and 100% of the base table for males and females respectively. There was relatively little difference between males and females. A few fi rms indicated that their assumption varies by age.
Annuitant longevity stress
Graph 8.10.3c:
Under your longevity level stress, what is the percentage uplift in expectation of life for your most material annuity product?
0
1
2
3
4
5
6
3
Num
ber o
f firm
s
5 5
3
1 1
Under 5% 5% upto 10% 10% upto 15% 15% upto 20% 25% upto 25% 25% and over
Over half of respondents indicated that the longevity level stress resulted in an uplift in expectation of life for their most material annuity product of between 5% and 15%, although the answers ranged between 1% and 30%. Expectation of life provides an attractive comparison metric as it smoothes out differences in basis and stress approach to relate the impact of the stress to something more fundamental but the following factors should be noted:
• Several fi rms indicated that they based this calculation on a male annuitant aged 65; however, a range of different approaches were used.
• Differences in product mix infl uence the answers. For example, one of the highest values relates to a fi rm whose most material annuity product is deferred annuities, which are more affected by the longevity stress than immediate annuities due to the longer time frame.
• The underlying best estimate mortality basis also infl uences the results.
TPS 2014
© 2014 KPMG LLP, a UK limited liability partnership, is a subsidiary of KPMG Europe LLP and a member firm of the KPMG network of independent member fi rms affiliated with KPMG International Cooperative, a Swiss entity. All rights reserved.
82

RISK CAPITA L
Graph 8.10.3d:
Under your 1-in-200 stress scenario, over what time period do you model longevity risk?
17%
8%
71%
4%
One year, stress applied at time zero
One year, stress applied from end of year 1
Stress applied through to run-off
Other
The majority of fi rms apply longevity stresses for ICA using a run-off approach. This has been the standard approach under ICA, but as we move towards Solvency II, the industry has been considering whether this approach is still appropriate. One of the main arguments in support of a one-year approach is that the Solvency II Risk Margin covers the risks from time 1 onwards. This means that the run-off approach potentially results in some double counting of the capital requirement. Generally this issue can be addressed either by moving to a one year stress, or by using a run-off approach with a lower stress calibration. We can understand both approaches and we believe that there are challenges to overcome with both of them. We note that there is currently debate in the industry regarding the issue.
83 TPS 2014
© 2014 KPMG LLP, a UK limited liability partnership, is a subsidiary of KPMG Europe LLP and a member firm of the KPMG network of independent member fi rms affiliated with KPMG International Cooperative, a Swiss entity. All rights reserved.

RISK CAPITA L
Annuitant mortality improvements
Graph 8.10.3e:
Mortality improvement model used in ICA calculations
21%21%
25%
Other
Interim Cohurt
CMI 2011
CMI 2012
CMI 2013
8%
25%
The majority of fi rms use a version of the CMI model for annuity business mortality improvements, which demonstrates that it has become the industry standard approach. A range of versions is currently in use, which is likely due to the time it takes fi rms to get comfortable with the results of the latest models. Two fi rms use the Interim Cohort projections. The responses are broadly consistent with those for Solvency I, except that several of the fi rms that use more advanced models for longevity risk capital just use the CMI Model for Solvency I.
Of the fi rms in the “other” category, two use an in-house model while the rest use simpler assumptions. Note that two of the fi rms that use the CMI model for best estimate assumptions use a different, more advanced, approach for the stressed scenario.
TPS 2014
© 2014 KPMG LLP, a UK limited liability partnership, is a subsidiary of KPMG Europe LLP and a member firm of the KPMG network of independent member fi rms affiliated with KPMG International Cooperative, a Swiss entity. All rights reserved.
84

RISK CAPITA L
Graph 8.10.3f:
Base scenario - If you use the CMI model, do you use the advanced or core version of the model?
27%
73%
Core
Advanced
Of those fi rms that use the CMI model, the majority (73%) use only the core parameters. The four respondents that use the advanced functionality of the model are all large fi rms, indicating that advanced customisation of the CMI model is not yet standard practice.
Graph 8.10.3g:
What is your long term improvement factor (CMI model) or underpin (cohort model)?
0
1
2
3
4
5
6
7
8
9
10
under 1% 1% up to 1.25%
1.25%up to 1.5%
Num
ber o
f firm
s
0
1.5% up to 1.75%
1.75% up to 2%
2% and over
7
0 0 0 0 0 0 0 0 0 0
8
111 22
3 4 4 4
9 8
Base - Male
Bass - Female
Stress - Male
Stress - Female
The majority of respondents indicated that their base assumption lies between 1% and 2%. A much smaller number of fi rms provided their stress assumption, as many allow for the trend stress in different ways. Of those that provided a stressed long term improvement factor, these were between 0.5% and 1.75% greater than the base assumptions. About half of fi rms use a higher base assumption for males than females, with the difference typically being 0.25% or 0.5%.
TPS 2014
© 2014 KPMG LLP, a UK limited liability partnership, is a subsidiary of KPMG Europe LLP and a member firm of the KPMG network of independent member fi rms affiliated with KPMG International Cooperative, a Swiss entity. All rights reserved.
85

RISK CAPITA L
Enhanced annuities
Graph 8.10.3h:
Do the 1-in-200 longevity stresses you apply to enhanced annuities differ from the stresses you apply to standard annuities?
20%
80%
Stresses are stronger for enhanced annuities
No difference
Of those respondents who have enhanced annuity liabilities, the majority (80%) apply the same stresses to enhanced annuities as to standard annuities. Only 2 out of 10 respondents apply different stresses to enhanced annuities and these are all stronger stresses. Stronger stresses can arise for enhanced annuities simply due to the shorter duration of the liabilities where the CMI model is used to derive the stress. The shorter duration means that greater weight is placed on the current higher rates of mortality improvement through the convergence assumption. However, we are also aware of fi rms considering separate calibrations for stressing enhanced and standard annuities.
TPS 2014
© 2014 KPMG LLP, a UK limited liability partnership, is a subsidiary of KPMG Europe LLP and a member firm of the KPMG network of independent member fi rms affiliated with KPMG International Cooperative, a Swiss entity. All rights reserved.
86

RISK CAPITA L
8.11 MORBIDITY RISK Morbidity is generally a less material stress for firms, so w e asked a smaller number of questions. Nevertheless, we did observe that a number of firms model trend and volatility stresses and that these firms tended to be either larger or more specialised health product writers. On the other hand, several firms inf ormed us that they don’t apply a morbidity stress as they have immaterial volumes of this business.
Morbidity Stress
Graph 8.11.1a:
If you apply a morbidity stress, which of the following do you apply to your incidence and recovery rates for critical illness business?
0
2
4
6
8
10
12
14
(1) Mis-estimation of best
assumption
(2) Trend (3) Volatility
Num
ber o
f firm
s
(4) Catastrophe Combined stress of (1) to (3)
Combined stress of (1) to (4)
0 111 2
3 4
6 4
1
5
13
Indvidual CI incidence
Group CI
For individual critical illness business, all 18 fi rms perform a mis-estimation stress, either on a standalone basis or as part of a combined stress. Seven fi rms perform a catastrophe stress, indicating the relative importance of this stress for health business, while it tends to be only the fi rms more focussed on health and protection business that perform individual trend and volatility stresses. Only seven fi rms responded in respect of group critical illness business, but there was a similar emphasis on level and catastrophe stresses.
87 TPS 2014
© 2014 KPMG LLP, a UK limited liability partnership, is a subsidiary of KPMG Europe LLP and a member firm of the KPMG network of independent member fi rms affiliated with KPMG International Cooperative, a Swiss entity. All rights reserved.
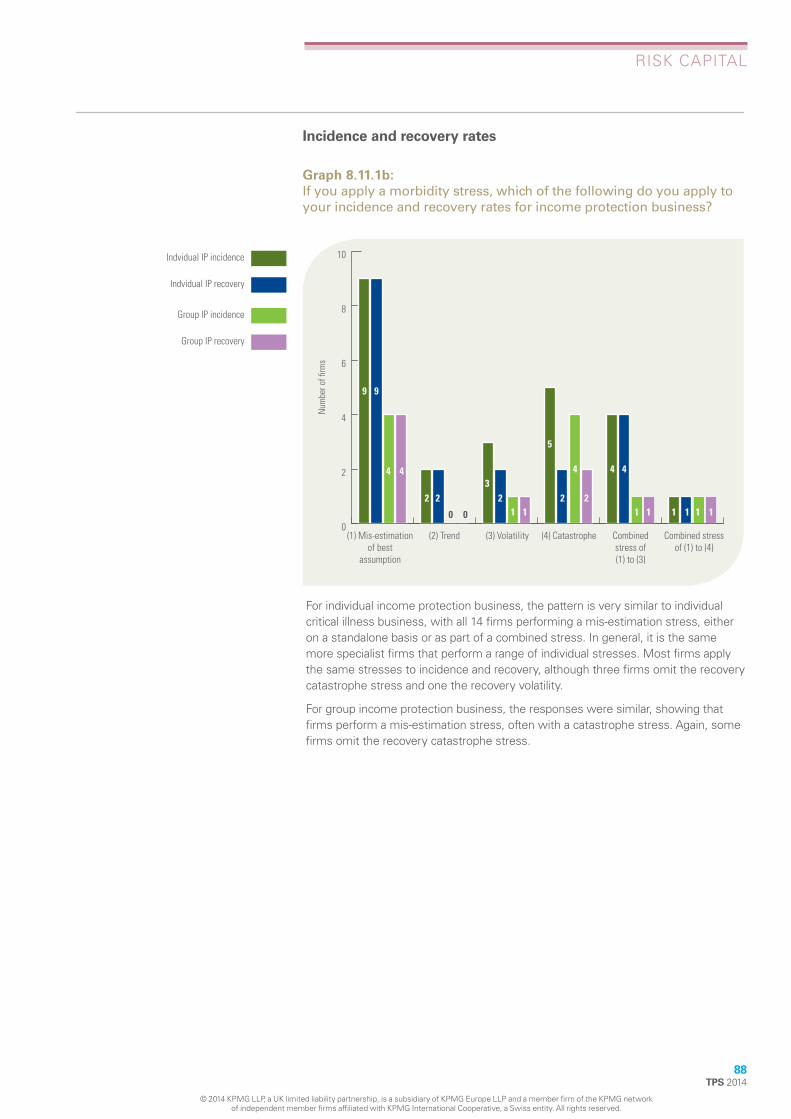
RISK CAPITA L
Incidence and recovery rates
Graph 8.11.1b:
If you apply a morbidity stress, which of the following do you apply to your incidence and recovery rates for income protection business?
0
2
4
6
8
10
(1) Mis-estimation of best
assumption
(2) Trend (3) Volatility
Num
ber o
f firm
s
(4) Catastrophe Combined stress of (1) to (3)
Combined stress of (1) to (4)
0 1 2
3 4 4
5
0 1111111 22 2 2
44
99
4
Indvidual IP incidence
Indvidual IP recovery
Group IP incidence
Group IP recovery
For individual income protection business, the pattern is very similar to individual critical illness business, with all 14 fi rms performing a mis-estimation stress, either on a standalone basis or as part of a combined stress. In general, it is the same more specialist fi rms that perform a range of individual stresses. Most fi rms apply the same stresses to incidence and recovery, although three fi rms omit the recovery catastrophe stress and one the recovery volatility.
For group income protection business, the responses were similar, showing that fi rms perform a mis-estimation stress, often with a catastrophe stress. Again, some fi rms omit the recovery catastrophe stress.
TPS 2014
© 2014 KPMG LLP, a UK limited liability partnership, is a subsidiary of KPMG Europe LLP and a member firm of the KPMG network of independent member fi rms affiliated with KPMG International Cooperative, a Swiss entity. All rights reserved.
88

RISK CAPITAL
Morbidity Tables
Graph 8.11.2a:
Critical illness: In your BEL calculation, what is the primary morbidity table that you use?
29%
19%
14%
38%
CMI
Population table
Reinsurance rates
Own tables
Graph 8.11.2b:
Income protection: In your BEL calculation, what is the primary morbidity table that you use?
53%
18%
17%
12%
89 TPS 2014
© 2014 KPMG LLP, a UK limited liability partnership, is a subsidiary of KPMG Europe LLP and a member firm of the KPMG network of independent member fi rms affiliated with KPMG International Cooperative, a Swiss entity. All rights reserved.

RISK CAPITA L
Tables used for critical illness business are typically informed by data or assumptions from reinsurers (38% of respondents), which indicates that many direct writers are reliant on reinsurers’ technical support. Firms that use tables from the CMI or internally developed tables tend to be the more specialised protection and health writers. The CMI tables are more widely used for income protection than critical illness, with 53% of respondents indicating they use these. Only the more specialised providers tend to write material volumes of income protection business, which explains the lower dependence on external support.
We asked fi rms to provide the morbidity stress levels that they apply for each type of business. Since only a small number of fi rms provided a response for each combination of stress and type of business, we have insuffi cient data to present credible analysis. Furthermore, many of the stress levels reported vary widely due to fundamentally different approaches in terms of combining different risks. The only stress for which there is signifi cant consensus is catastrophe stress, where most fi rms use a stress of around 3 per mille.
TPS 2014
© 2014 KPMG LLP, a UK limited liability partnership, is a subsidiary of KPMG Europe LLP and a member firm of the KPMG network of independent member fi rms affiliated with KPMG International Cooperative, a Swiss entity. All rights reserved.
90
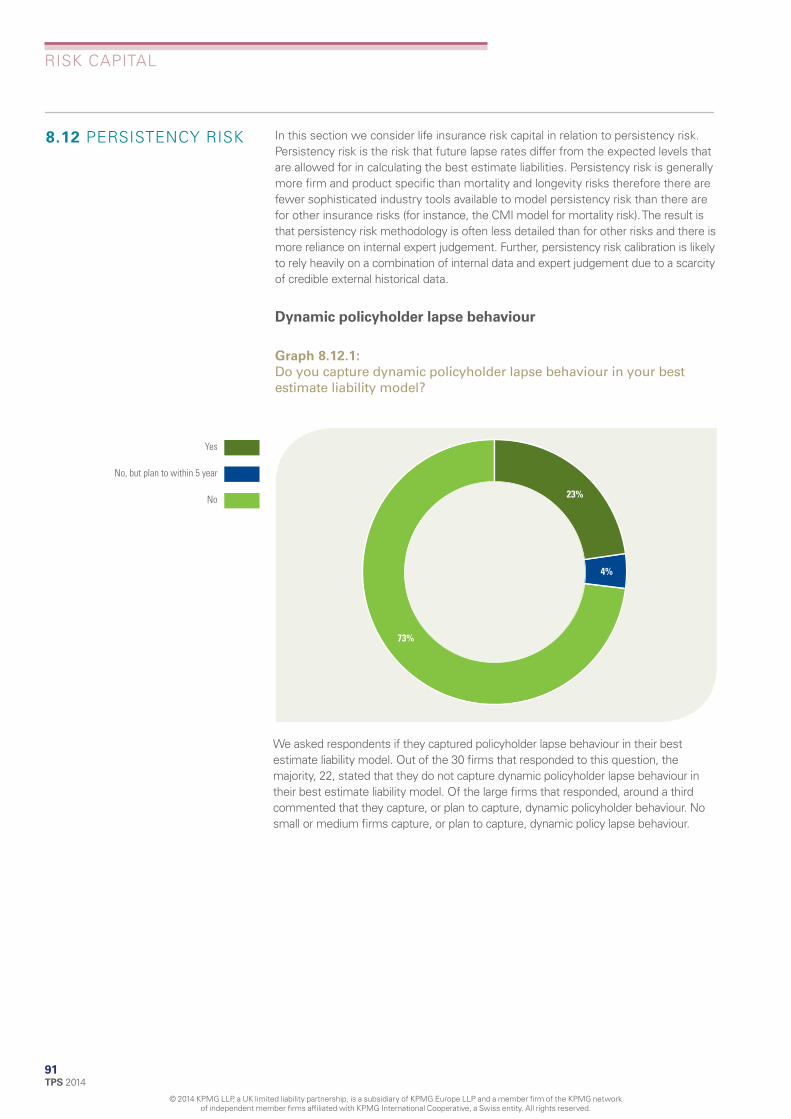
RISK CAPITA L
8.12 PERSISTENCY RISK In this section we consider life insurance risk capital in relation to persistency risk. Persistency risk is the risk that future lapse rates differ from the expected levels that are allowed for in calculating the best estimate liabilities. Persistency risk is generally more fi rm and product specifi c than mortality and longevity risks therefore there are fewer sophisticated industry tools available to model persistency risk than there are for other insurance risks (for instance, the CMI model for mortality risk). The result is that persistency risk methodology is often less detailed than for other risks and there is more reliance on internal expert judgement. Further, persistency risk calibration is likely to rely heavily on a combination of internal data and expert judgement due to a scarcity of credible external historical data.
Dynamic policyholder lapse behaviour
Graph 8.12.1:
Do you capture dynamic policyholder lapse behaviour in your best estimate liability model?
23%
4%
Yes
No, but plan to within 5 year
No
73%
We asked respondents if they captured policyholder lapse behaviour in their best estimate liability model. Out of the 30 firms that responded to this question, the majority, 22, stated that they do not capture dynamic policyholder lapse behaviour in their best estimate liability model. Of the large firms that responded, around a third commented that they capture, or plan to capture, dynamic policyholder behaviour. No small or medium firms capture, or plan to capture, dynamic policy lapse behaviour.
91 TPS 2014
© 2014 KPMG LLP, a UK limited liability partnership, is a subsidiary of KPMG Europe LLP and a member firm of the KPMG network of independent member fi rms affiliated with KPMG International Cooperative, a Swiss entity. All rights reserved.

RISK CAPITA L
Approach to modelling persistency risk
Statistical distribution used to model persistency risk
Graph 8.12.2a:
What statistical distribution do you use for modelling persistency risk?
0%
10%
20%
30%
40%
50%
60%
70%
80%
90%
100%
50%
With-profits Unit linked Protection
Perc
enta
ge o
f firm
s (%
)
17%
33%
48%
14%
38%
50%
19%
31%
Normal
Lognormal
Other
We asked fi rms which statistical distribution they use to model persistency risk. Across all product groups, the most common statistical distribution used was the normal distribution, followed by the lognormal distribution. The use of relatively simple distributions is generally seen to be justifi ed by the scarcity of data available to calibrate persistency risk. Moreover, one fi rm who responded “other” does use more advanced distributions.
Approximately half of the respondents for each of the product groups commented that they do not use a statistical distribution. All of these respondents use a stress based rather than simulation based aggregation approach. Alternative approaches used included using the Solvency II Standard Formula methodology, using a fi xed persistency stress, or using expert judgement and industry benchmarking.
TPS 2014
© 2014 KPMG LLP, a UK limited liability partnership, is a subsidiary of KPMG Europe LLP and a member firm of the KPMG network of independent member fi rms affiliated with KPMG International Cooperative, a Swiss entity. All rights reserved.
92

RISK CAPITA L
Approach to persistency stress tests
Graph 8.12.2b:
Which approach do you use for your persistency stress tests?
0%
10%
20%
30%
40%
50%
60%
70%
80%
90%
100%
79%
With-profits Unit linked Protection
Perc
enta
ge o
f firm
s (%
)
21%
82%
18%
78%
22%
93 TPS 2014
© 2014 KPMG LLP, a UK limited liability partnership, is a subsidiary of KPMG Europe LLP and a member firm of the KPMG network of independent member fi rms affiliated with KPMG International Cooperative, a Swiss entity. All rights reserved.
Different impact at different durations
Level impact at all durations
The majority of respondents use a level impact at all durations for their persistency stress test, across all product groups. These fi rms have likely already captured duration effects in their best estimate assumptions and so retain some duration differences when a level stress is applied.
Those fi rms that used a different impact at different durations were predominantly large fi rms.

RISK CAPITA L
Graph 8.12.2c:
At what level of granularity do you apply your persistency stress tests?
0
2
4
6
8
10
12
14
With-profits Unit linked
Num
ber o
f firm
s
Protection
11 1 0
4
9
13 14
5 6 6 6
3 2 2 2
Surrenders and PUPs stressed differently
Guarantees in and out of the money stressed differently
Different impact for different products
Different changes in different scenarios
Other
The level of granularity that is most frequently used by respondents in their persistency stress testing is to apply a different impact on persistency rates for different products within a defi ned product group. This is the same as last year.
Only two respondents stated that they stress guarantees that are in and out of the money differently; one fi rm does so for unit linked business, and one for with-profi ts business. Whether guarantees are in or out of the money could impact policyholders’ lapse behaviours, however this could be better captured through modelling dynamic policyholder behaviour than through differing stresses.
Two fi rms indicated that they apply a level impact across all products within a product group.
TPS 2014
© 2014 KPMG LLP, a UK limited liability partnership, is a subsidiary of KPMG Europe LLP and a member firm of the KPMG network of independent member fi rms affiliated with KPMG International Cooperative, a Swiss entity. All rights reserved.
94

RISK CAPITA L
The most onerous direction of the lapse stress
Graph 8.12.3a:
Which direction of lapse stress is the most onerous?
Lapses/surrenders up
Lapses/surrenders down
0
10
20
30
40
50
60
70
80
90
100
95%
With-profits Unit linked Protection
Perc
enta
ge o
f firm
s (%
)
5%
100%
12%
88%
We asked respondents which is the most onerous direction of the lapse stress. This will depend on the level of guarantees and the expected pattern of future cash fl ows.
Of the 19 respondents who answered this question for with-profi ts products, all but one stated that a lapse / surrender down stress would be more onerous than an up stress. Lower than expected lapses will increase guarantee costs. Withprofi ts products tend to have more guarantees, and in the current low interest rate environment many of these guarantees will be biting.
All 22 respondents who answered this question for unit linked products stated that a lapse / surrender up stress would be more onerous than a down stress.
Out of the 26 respondents who answered this question for protection business, 23 stated that a lapse / surrender up stress would be more onerous than a down stress. The insurers that stated that an up stress is more onerous generally sell more shorter-term products (e.g. term assurance), whereas the respondents for whom a lapse down stress is more onerous hold more long term business (e.g. whole of life).
95 TPS 2014
© 2014 KPMG LLP, a UK limited liability partnership, is a subsidiary of KPMG Europe LLP and a member firm of the KPMG network of independent member fi rms affiliated with KPMG International Cooperative, a Swiss entity. All rights reserved.

RISK CAPITA L
Graph 8.12.3b:
At what level do you determine which direction is the most onerous policyholder behaviour stress?
0
10
20
30
40
50
60
70
80
90
100
47%
With-profits Unit linked Protection
Perc
enta
ge o
f firm
s (%
)
11%
14%
5%
4%
15%
21%
16%
5%
55%
14%
9%
5%
12%
50%
12%
8% Individual policy level
Modelling class level
Product group level
Fund level
Company level
Other
The most common level at which respondents determined the most onerous policyholder behaviour stress, across with-profi ts, unit linked and protection business, was at product group level. This is the same as in previous years. This level typically offers fi rms the best balance between accuracy and complexity.
TPS 2014
© 2014 KPMG LLP, a UK limited liability partnership, is a subsidiary of KPMG Europe LLP and a member firm of the KPMG network of independent member fi rms affiliated with KPMG International Cooperative, a Swiss entity. All rights reserved.
96
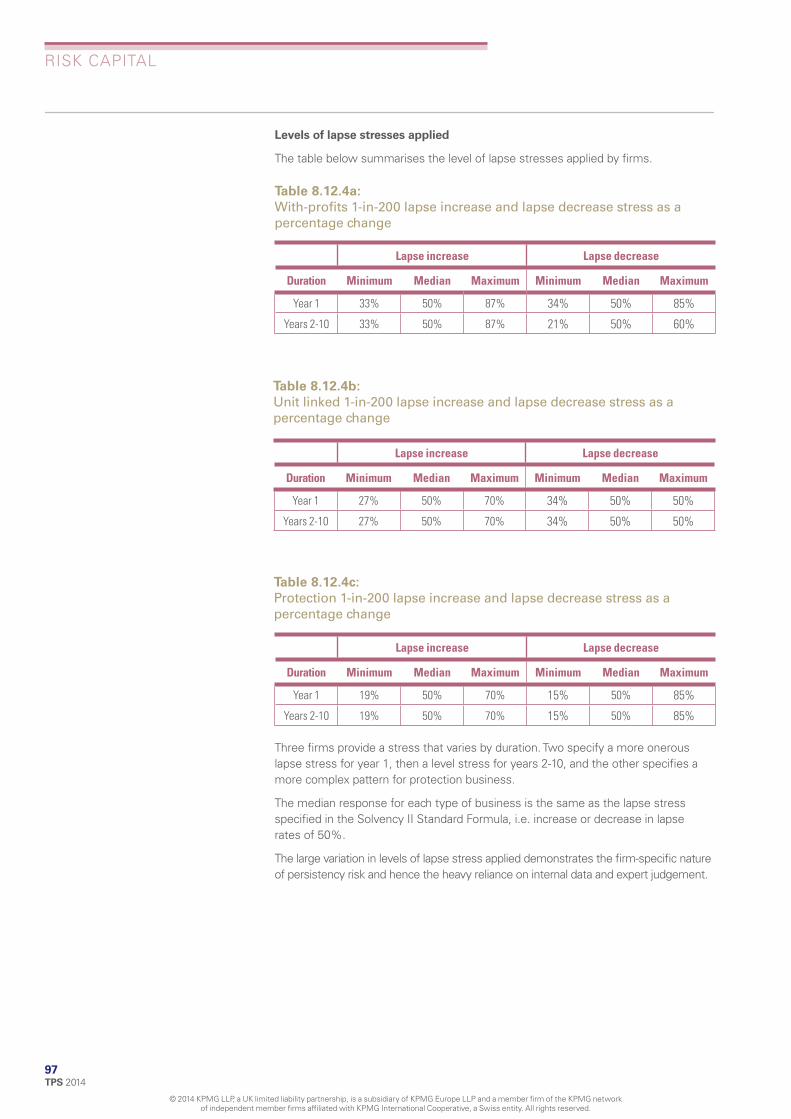
RISK CAPITA L
Levels of lapse stresses applied
The table below summarises the level of lapse stresses applied by fi rms.
Table 8.12.4a:
With-profits 1 -in-200 lapse increase and lapse decrease stress as a percentage change
Lapse increase Lapse decrease
Duration Minimum Median Maximum Minimum Median Maximum
Year 1 33% 50% 87% 34% 50% 85%
Years 2-10 33% 50% 87% 21% 50% 60%
Table 8.12.4b:
Unit linked 1-in-200 lapse increase and lapse decrease stress as a percentage change
Lapse increase Lapse decrease
Duration Minimum Median Maximum Minimum Median Maximum
Year 1 27% 50% 70% 34% 50% 50%
Years 2-10 27% 50% 70% 34% 50% 50%
Table 8.12.4c:
Protection 1-in-200 lapse increase and lapse decrease stress as a percentage change
Lapse increase Lapse decrease
Duration Minimum Median Maximum Minimum Median Maximum
Year 1 19% 50% 70% 15% 50% 85%
Years 2-10 19% 50% 70% 15% 50% 85%
Three fi rms provide a stress that varies by duration. Two specify a more onerous lapse stress for year 1, then a level stress for years 2-10, and the other specifi es a more complex pattern for protection business.
The median response for each type of business is the same as the lapse stress specifi ed in the Solvency II Standard Formula, i.e. increase or decrease in lapse rates of 50%.
The large variation in levels of lapse stress applied demonstrates the fi rm-specifi c nature of persistency risk and hence the heavy reliance on internal data and expert judgement.
97 TPS 2014
© 2014 KPMG LLP, a UK limited liability partnership, is a subsidiary of KPMG Europe LLP and a member firm of the KPMG network of independent member fi rms affiliated with KPMG International Cooperative, a Swiss entity. All rights reserved.

RISK CAPITA L
Impact of budget announcement on persistency risk
Graph 8.12.5:
Do you intend to change your base lapse assumption and 1-in-200 lapse stress in respect of pension business in the light of the recent budget announcement that retirees would no longer be forced to buy an annuity?
0
10
20
30
40
50
60
70
80
90
100
96%
4%
100%
Base Stress
Perc
enta
ge o
f firm
s
Yes
No
We asked if fi rms intended to change their base lapse assumptions and 1-in200 lapse stress in respect of pension business in light of the recent budget announcement that retirees would no longer be forced to buy an annuity. These lapse assumptions would apply at the point of retirement.
There were 25 responses to this question. Only one respondent stated that they would change their base lapse assumptions and no respondents stated that they intended to change their 1-in-200 lapse stresses. The respondent that intended to change their base lapse assumption explained that they intended to change the GAO take up assumptions.
Several insurers who responded “No” noted that they did not intend to make any changes now but would be monitoring experience in the wake of the budget announcement in order to review the appropriateness of their base lapse assumptions and 1-in-200 lapse stresses going forward.
One fi rm noted that they expect the budget announcement to increase lapses. As it was a lapse decrease that was more onerous for this fi rm, not making a change to assumptions was a more prudent approach.
These results refl ect the high level of uncertainty around the impact on policyholder behaviour and suggest the industry is taking a ‘wait and see’ approach.
TPS 2014
© 2014 KPMG LLP, a UK limited liability partnership, is a subsidiary of KPMG Europe LLP and a member firm of the KPMG network of independent member fi rms affiliated with KPMG International Cooperative, a Swiss entity. All rights reserved.
98

RISK CAPITA L
8.13 MASS LAPSE RISK In this section we consider life insurance risk capital in relation to mass lapse risk. Mass lapse risk is the risk of a one-off change in lapse experience over the course of one year. There is a scarcity of available data for mass lapse risk, therefore the approach to modelling and calibration can rely heavily on expert judgement.
Approach to modelling mass lapse risk
Accounting for mass lapse in the risk capital calculation
Graph 8.13.1a:
Do you account for mass lapse in your risk capital calculation?
21%
79%
Ye s
No
We asked respondents whether they currently have a mass lapse stress in their risk capital calculation. Around four-fi fths, 23 out of 29, of the respondents stated that they have a mass lapse stress. This has increased from last year when approximately two-thirds of respondents stated they had a mass lapse stress. Of large insurers who responded, 82% have this stress within their risk capital compared with 75% of small and medium sized respondents.
99 TPS 2014
© 2014 KPMG LLP, a UK limited liability partnership, is a subsidiary of KPMG Europe LLP and a member firm of the KPMG network of independent member fi rms affiliated with KPMG International Cooperative, a Swiss entity. All rights reserved.

RISK CAPITA L
Expense assumptions in mass lapse stress
Graph 8.13.1b:
What assumption do you make about expenses in your mass lapse stress?
17%
58%
25%
Assume that expenses vary in line with policy numbers
Assume that some expenses are overheads which stay fixed and do not vary in line with
policy numbers
Assume that some expenses are overheads which run-off over time but not directly in line
with policy numbers
We asked fi rms about their assumptions regarding expenses in their mass lapse stress. 14 out of 24 fi rms assume that expenses vary in line with policy numbers. This response was particularly common amongst large fi rms with 11 out of 15 large fi rms selecting this response. A large proportion of these fi rms hold a signifi cant amount of unit linked business. For small and medium fi rms, the split between the three approaches was approximately equal.
Several fi rms commented that the risk of increased per policy expenses in a mass lapse would be incorporated via the expense risk and correlation assumptions.
100 TPS 2014
© 2014 KPMG LLP, a UK limited liability partnership, is a subsidiary of KPMG Europe LLP and a member firm of the KPMG network of independent member fi rms affiliated with KPMG International Cooperative, a Swiss entity. All rights reserved.
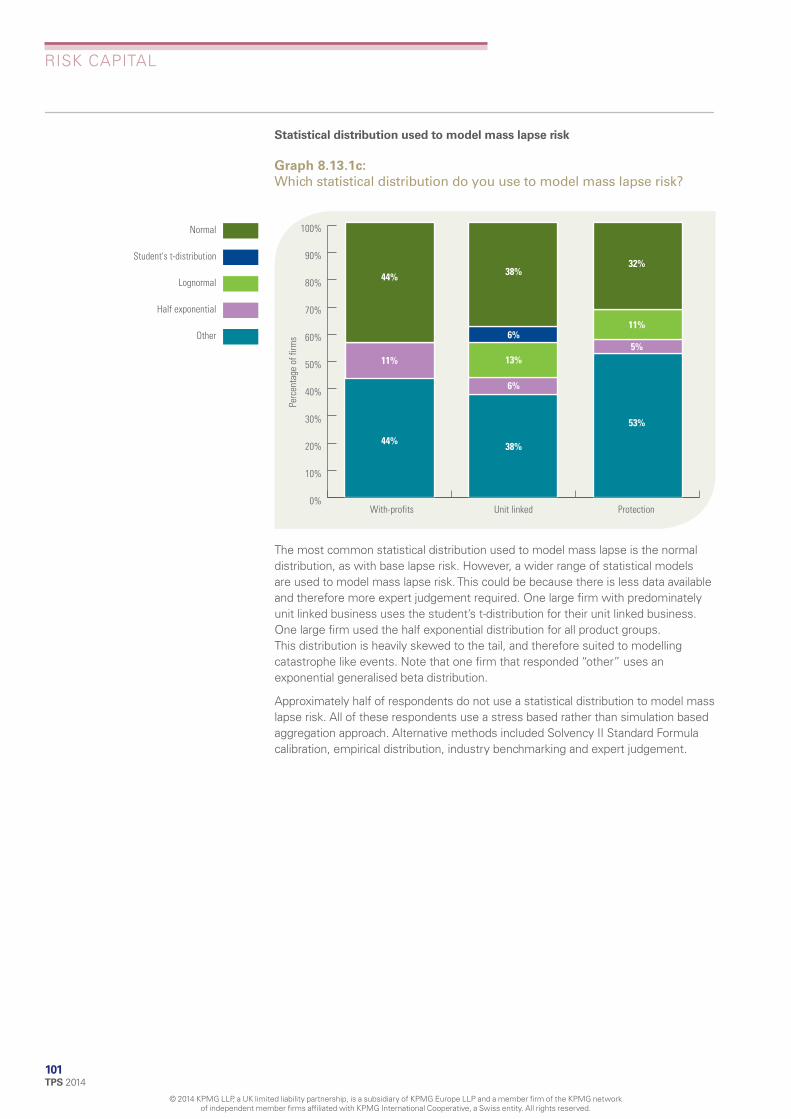
RISK CAPITA L
Statistical distribution used to model mass lapse risk
Graph 8.13.1c:
Which statistical distribution do you use to model mass lapse risk?
0%
10%
20%
30%
40%
50%
60%
70%
80%
90%
100%
Perc
enta
ge o
f firm
s
ProtectionUnit linkedWith-profits
38% 32%
11%
5%
53%
6%
13%
6%
38%44%
11%
44%
Normal
Student's t-distribution
Lognormal
Half exponential
Other
The most common statistical distribution used to model mass lapse is the normal distribution, as with base lapse risk. However, a wider range of statistical models are used to model mass lapse risk. This could be because there is less data available and therefore more expert judgement required. One large fi rm with predominately unit linked business uses the student’s t-distribution for their unit linked business. One large fi rm used the half exponential distribution for all product groups. This distribution is heavily skewed to the tail, and therefore suited to modelling catastrophe like events. Note that one fi rm that responded “other” uses an exponential generalised beta distribution.
Approximately half of respondents do not use a statistical distribution to model mass lapse risk. All of these respondents use a stress based rather than simulation based aggregation approach. Alternative methods included Solvency II Standard Formula calibration, empirical distribution, industry benchmarking and expert judgement.
101 TPS 2014
© 2014 KPMG LLP, a UK limited liability partnership, is a subsidiary of KPMG Europe LLP and a member firm of the KPMG network of independent member fi rms affiliated with KPMG International Cooperative, a Swiss entity. All rights reserved.

RISK CAPITA L
Levels of mass lapse stresses applied
Graph 8.13.2:
1-in-200 mass lapse stress by product as a percentage change above best estimate lapses
0
1
2
3
4
5
6
7
Less than 20% Between 20% and 30%
Num
ber o
f firm
s
Between 30% and 40%
Between 40% and 50%
More than 50%
0000
2
3
6
5
4
3
2 2 2
1 1
With-profits
Unit linked
Protection
We asked respondents to specify their 1-in-200 mass lapse stress by product group as a percentage point additive change in lapse rate applied either above best estimate lapses or above stressed best estimate lapses.
Several respondents commented that they used a similar approach to the Solvency II Standard Formula methodology, i.e. an instantaneous change due to the discontinuance of a set percentage of insurance policies with negative reserves.
For some fi rms, the mass lapse stress varies by product within each product group.
TPS 2014
© 2014 KPMG LLP, a UK limited liability partnership, is a subsidiary of KPMG Europe LLP and a member firm of the KPMG network of independent member fi rms affiliated with KPMG International Cooperative, a Swiss entity. All rights reserved.
102
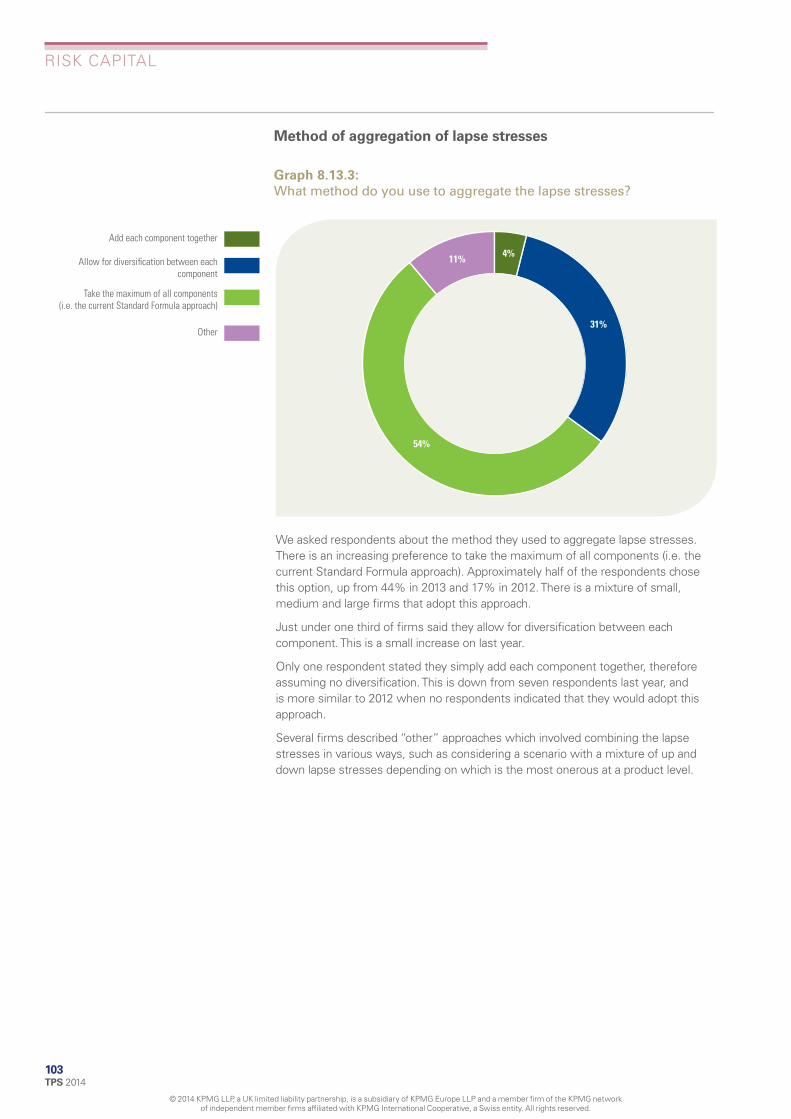
RISK CAPITA L
Method of aggregation of lapse stresses
Graph 8.13.3:
What method do you use to aggregate the lapse stresses?
31%
11%
54%
4%
Add each component together
Allow for diversification between each component
Take the maximum of all components (i.e. the current Standard Formula approach)
Other
We asked respondents about the method they used to aggregate lapse stresses. There is an increasing preference to take the maximum of all components (i.e. the current Standard Formula approach). Approximately half of the respondents chose this option, up from 44% in 2013 and 17% in 2012. There is a mixture of small, medium and large fi rms that adopt this approach.
Just under one third of fi rms said they allow for diversifi cation between each component. This is a small increase on last year.
Only one respondent stated they simply add each component together, therefore assuming no diversifi cation. This is down from seven respondents last year, and is more similar to 2012 when no respondents indicated that they would adopt this approach.
Several fi rms described “other” approaches which involved combining the lapse stresses in various ways, such as considering a scenario with a mixture of up and down lapse stresses depending on which is the most onerous at a product level.
103 TPS 2014
© 2014 KPMG LLP, a UK limited liability partnership, is a subsidiary of KPMG Europe LLP and a member firm of the KPMG network of independent member fi rms affiliated with KPMG International Cooperative, a Swiss entity. All rights reserved.

RISK CAPITA L
8.14 EXPENSE RISK In this section we consider life insurance risk capital in relation to expense and expense infl ation risk. Expense risk is the risk of loss, or an adverse change in the value of liabilities, caused by the fact that the timing and/or the amount of expenses incurred differs from those expected. Firms tend to use historical internal data, expert judgement and industry benchmarking when modelling expense risk. Often published infl ation data, for example the Retail Price Index or published earnings indices, is used to model expense infl ation risk.
Approach to modelling expense risk
Statistical distribution used to model expense and expense infl ation risk
We asked respondents which statistical distribution they use to model expense and expense infl ation risk.
Graph 8.14.1a:
Which statistical distribution do you use for modelling expense risk?
13%
Normal
Lognormal
Other
54%
33%
Over half of respondents do not use a statistical distribution to model expense risk. Other methodologies used included a Solvency II Standard Formula approach, industry benchmarking and expert judgement.
For those fi rms that do use a statistical distribution to model expense risk, the most commonly used distribution is the normal distribution, followed by the lognormal distribution. One fi rm who responded “other” uses an exponential generalised beta distribution.
TPS 2014
© 2014 KPMG LLP, a UK limited liability partnership, is a subsidiary of KPMG Europe LLP and a member firm of the KPMG network of independent member fi rms affiliated with KPMG International Cooperative, a Swiss entity. All rights reserved.
104

RISK CAPITA L
Graph 8.14.1b:
Which statistical distribution do you use for modelling expense infl ation risk?
29%
8%
59%
4%
Normal
Student's t-distribution
Lognormal
Other
The majority of fi rms take the same approach to model expense infl ation risk as they do expense risk.
Expense Stress
Expenses subject to the 1-in-200 expense stress
Graph 8.14.2a:
Which of your expenses are subject to the 1-in-200 expense stress?
4%
25%
53%
18%
All expenses
All expenses except investment expenses
Only internal expenses (i.e. not those governed by outsourcer arrangements)
Other
We asked fi rms which of their expenses are subject to the 1-in-200 expense stress. The majority of respondents subject all expenses to a 1-in-200 expense stress. A greater proportion of large fi rms consider all expenses whereas the approach taken by small and medium fi rms is more mixed.
105 TPS 2014
© 2014 KPMG LLP, a UK limited liability partnership, is a subsidiary of KPMG Europe LLP and a member firm of the KPMG network of independent member fi rms affiliated with KPMG International Cooperative, a Swiss entity. All rights reserved.
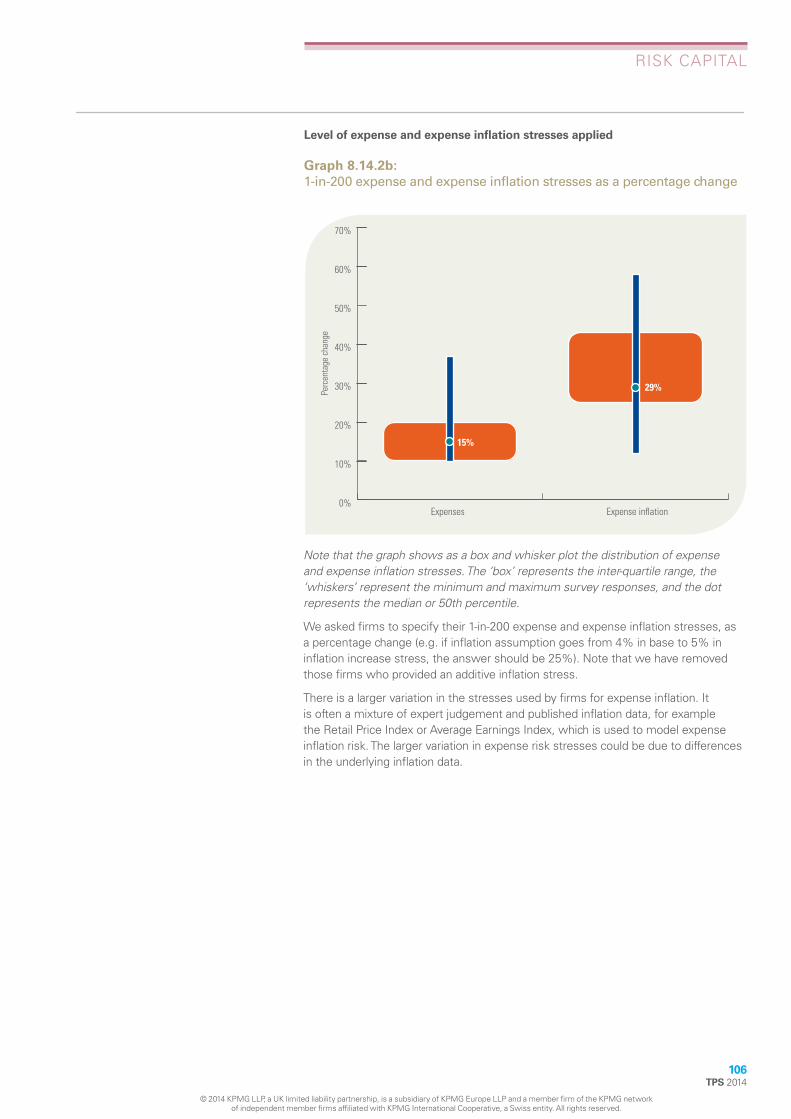
106TPS 2014
RISK CAPITAL
Level of expense and expense infl ation stresses applied
Graph 8.14.2b:
1-in-200 expense and expense infl ation stresses as a percentage change
© 2014 KPMG LLP, a UK limited liability partnership, is a subsidiary of KPMG Europe LLP and a member fi rm of the KPMG network of independent member fi rms affi liated with KPMG International Cooperative, a Swiss entity. All rights reserved.
0%
10%
20%
30%
40%
50%
60%
70%
15%
Expenses Expense inflation
Perc
enta
ge c
hang
e
29%
Note that the graph shows as a box and whisker plot the distribution of expense and expense infl ation stresses. The ‘box’ represents the inter-quartile range, the ‘whiskers’ represent the minimum and maximum survey responses, and the dot represents the median or 50th percentile.
We asked fi rms to specify their 1-in-200 expense and expense infl ation stresses, as a percentage change (e.g. if infl ation assumption goes from 4% in base to 5% in infl ation increase stress, the answer should be 25%). Note that we have removed those fi rms who provided an additive infl ation stress.
There is a larger variation in the stresses used by fi rms for expense infl ation. It is often a mixture of expert judgement and published infl ation data, for example the Retail Price Index or Average Earnings Index, which is used to model expense infl ation risk. The larger variation in expense risk stresses could be due to differences in the underlying infl ation data.

RISK CAPITA L
8.15 LIQUIDITY RISK Liquidity capital requirements
The number of respondents holding capital for liquidity risk has fallen from 21% in 2012, to 14% in 2013, and fi nally to 10% in 2014. Two large fi rms have stopped holding capital for liquidity risk since 2013, whilst one large fi rm has recently started to hold capital for this risk.
We note from the 2012 survey that 38% of respondents were considering liquidity risk as part of their ORSA, and from our experience. Due to increased interest from the PRA in liquidity and funding, we have observed in the market that this number has risen since then.
We anticipate that under Solvency II the majority of fi rms will not hold Pillar 1 capital in respect of liquidity risk but will consider this risk as part of the Pillar 2 requirement.
Graph 8.15.1:
Do you hold capital for liquidity risk?
10%
Ye s
No
90%
Liquidity risk strategy / appetite
We asked fi rms whether they have a clearly defi ned risk strategy / appetite. As predicted in last year’s survey, the number of fi rms stating they had a clearly defi ned liquidity risk strategy and risk appetite has increased (from 60% to 90%). As mentioned above, the PRA has shown an increased interest in liquidity and funding which, combined with ORSA development ahead of Solvency II implementation, is likely to be a key driver of this increase.
107 TPS 2014
© 2014 KPMG LLP, a UK limited liability partnership, is a subsidiary of KPMG Europe LLP and a member firm of the KPMG network of independent member fi rms affiliated with KPMG International Cooperative, a Swiss entity. All rights reserved.

RISK CAPITA L
Degree of mass lapse required to give rise to a liquidity issue
Graph 8.15.2:
What is the degree of mass lapse that you consider would be required to give rise to a liquidity issue?
52%
17%
31%
Beyond a 1-in-200 year event
Not considered in relation to a 1-in-200 year event
Not considered
We asked fi rms the degree of mass lapse (i.e. beyond or within a 1-in-200 year event) that they consider would be required to give rise to a liquidity issue (i.e. liquidity management actions would need to be taken). We also provided respondents with the option to state that they had not considered this (either not considered at all, or not considered in relation to a 1-in-200 year event).
We observe that the number of respondents who do not consider the impact of a mass lapse on liquidity has decreased, with only 17% of fi rms currently not considering this risk, compared to 51% in the 2013 survey. We anticipate the reason for this as increased interest from the PRA on reverse stress testing – particularly the level of mass lapse required to cause a liquidity issue.
For those fi rms who do consider this risk in relation to a 1-in-200 year event, all of these state they perceive the level of mass lapse required to cause a liquidity issue to be beyond a 1-in-200 year event, which now represents 52% of respondents compared to 23% in 2013.
There has been an increase in the number of fi rms considering this risk, but not in relation to a 1-in-200 year event, from 17% to 31%.
TPS 2014
© 2014 KPMG LLP, a UK limited liability partnership, is a subsidiary of KPMG Europe LLP and a member firm of the KPMG network of independent member fi rms affiliated with KPMG International Cooperative, a Swiss entity. All rights reserved.
108

RISK CAPITA L
8.16 OPERATIONAL RISK Operational risk is defi ned under Solvency II as the risk of loss arising from inadequate or failed internal processes, personnel and systems, or from external events. Operational risk should include legal risks, and exclude risks arising from strategic decisions, as well as reputation risks.
In the UK there is already a requirement to quantify operational risk capital under ICA and there has been further significant in vestment in modelling techniques, by Internal Model firms in particular , following the advent of Solvency II. However, the quantification of operational risk remains subjectiv e and expert judgement driven compared to other key risk types, due to the relative lack of internal and external data.
Treatment of operational risk has often been driven by a fi rm’s choice between Solvency II Internal Model and Standard Formula. The Standard Formula specifi es a factor based approach which is relatively simplistic compared to many of the approaches that fi rms have adopted for ICA, as it is not risk sensitive.
Use of an internal loss capture database
Graph 8.16.1:
Does your firm use an internal loss capture database to record operational risk loss data?
81%
Ye s
No 19%
Most respondents (25 out of 31) use an internal loss database to record operational losses. There is no obvious relationship to the size of respondents. It is now generally considered standard practice to record internal operational losses and having such a database will be a governance requirement under Solvency II. However, the implementation of internal loss databases is a recent industry development, with very few fi rms having even 5 years of data and correspondingly few tail events with which to parameterise assumptions. Therefore, there is an increasing tendency for respondents to seek other sources of loss data, such as external loss databases, to complement the internal data.
109 TPS 2014
© 2014 KPMG LLP, a UK limited liability partnership, is a subsidiary of KPMG Europe LLP and a member firm of the KPMG network of independent member fi rms affiliated with KPMG International Cooperative, a Swiss entity. All rights reserved.

RISK CAPITA L
Approach to modelling operational risk loss
Graph 8.16.2:
What technique best describes your approach to modelling operational risk loss?
7%
17%
20%
40%
3%
13%
Scorecard approach
Deterministic scenario
Stochastic modelling with expert judgement
Stochastic modelling with loss data
Factor based (Standard Formula)
Other
We asked fi rms which technique best described their approach to modelling operational risk for ICA. Two fi fths of respondents indicated that they use stochastic modelling for operational risk and only one small fi rm uses the Standard Formula factor based approach. This can be compared with last year, when approximately one third of respondents indicated that they used stochastic modelling and fi ve fi rms responded that they used a Standard Formula factor based approach.
Broadly speaking, the results demonstrate that standard practice has emerged amongst larger Internal Model fi rms to use a scenario based stochastic approach for operational risk capital modelling, where relevant internal and external data is augmented by expert judgement to parameterise the model.
Answers in the “other” category mostly use some form of expert judgement. One of these fi rms reported the use of Bayesian networks. The range of responses refl ects the challenges of effective operational risk capital modelling and the different stages fi rms are at in their development programmes.
TPS 2014
© 2014 KPMG LLP, a UK limited liability partnership, is a subsidiary of KPMG Europe LLP and a member firm of the KPMG network of independent member fi rms affiliated with KPMG International Cooperative, a Swiss entity. All rights reserved.
110
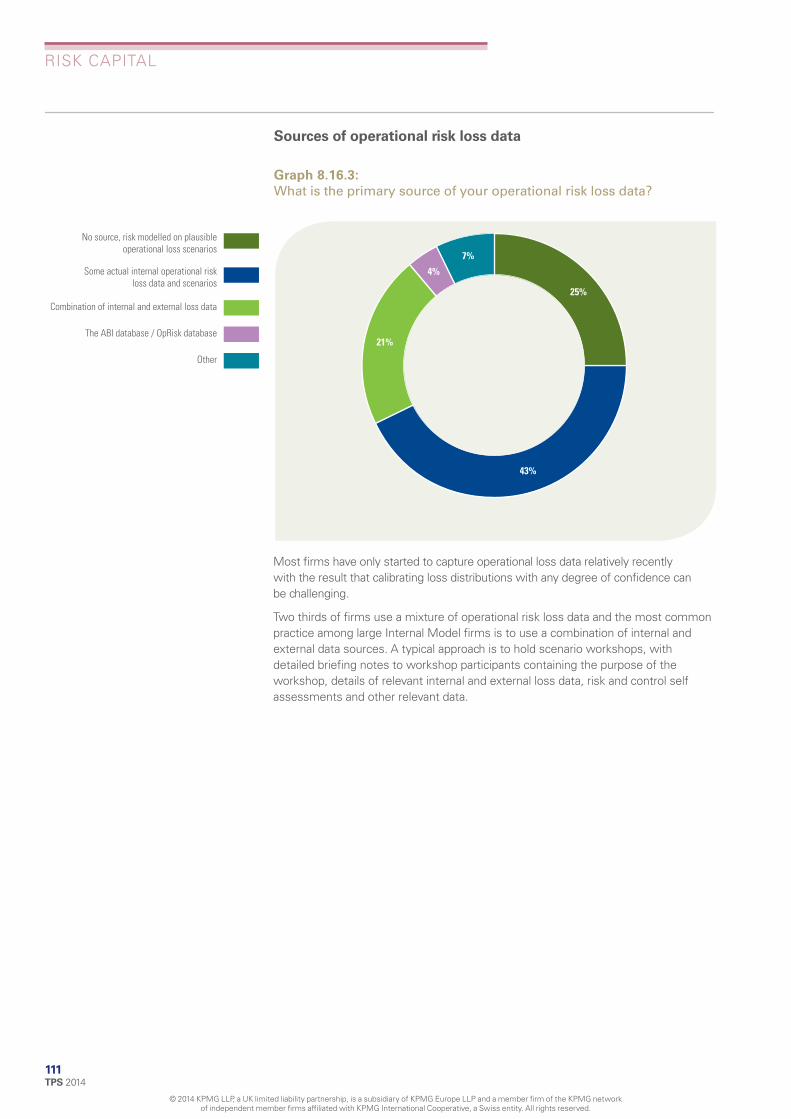
RISK CAPITA L
Sources of operational risk loss data
Graph 8.16.3:
What is the primary source of your operational risk loss data?
25%
7%
4%
21%
43%
No source, risk modelled on plausible operational loss scenarios
Some actual internal operational risk loss data and scenarios
Combination of internal and external loss data
The ABI database / OpRisk database
Other
Most firms have only started to capture operational loss data relatively recently with the result that calibrating loss distributions with any degree of confi dence can be challenging.
Two thirds of fi rms use a mixture of operational risk loss data and the most common practice among large Internal Model fi rms is to use a combination of internal and external data sources. A typical approach is to hold scenario workshops, with detailed briefi ng notes to workshop participants containing the purpose of the workshop, details of relevant internal and external loss data, risk and control self assessments and other relevant data.
111 TPS 2014
© 2014 KPMG LLP, a UK limited liability partnership, is a subsidiary of KPMG Europe LLP and a member firm of the KPMG network of independent member fi rms affiliated with KPMG International Cooperative, a Swiss entity. All rights reserved.

RISK CAPITA L
Comparison of Standard Formula operational risk capital with ICA operational risk capital
Graph 8.16.4:
Does Standard Formula or ICA produce the highest operational risk capital (post diversifi cation)?
14%10%
76%
Standard Formula
ICA
Little material difference
In general, the ICA approach produces higher operational risk capital requirements than the Standard Formula and this year’s result shows 76% of fi rms hold higher capital under ICA than Standard Formula. Interestingly, this is post-diversifi cation, demonstrating that the Standard Formula parameterisation is very different from fi rms own view of their operational risk capital requirements.
In particular, the drivers of the operational risk capital charge under the Standard Formula are premiums, technical provisions and gross expenses in respect of unit linked business. Firms’ own ICA calibrations can be based on a much wider range of risk drivers and incorporate scenario approaches.
112 TPS 2014
© 2014 KPMG LLP, a UK limited liability partnership, is a subsidiary of KPMG Europe LLP and a member firm of the KPMG network of independent member fi rms affiliated with KPMG International Cooperative, a Swiss entity. All rights reserved.

RISK CAPITA L
8.17 AGGREGATION Approach to risk aggregation
We asked fi rms what aggregation approach they use under the current ICA regime. Approaches to aggregation include using a correlation matrix or using copula techniques:
• The correlation matrix approach assumes linear loss functions and dependency. Some components may be calculated based on simulation (for example market risk) but most components are stress based and the ultimate aggregation is via a correlation matrix.
• Copula techniques imply use of a simulation based approach across the full taxonomy of risks. Copulas can allow for non-linear loss functions and non-linear tail dependency, depending on what type of copula is chosen. For example, Gaussian copulas do not allow for tail dependency, whereas this is possible under the Student’s t copula.
As predicted in last year’s survey, the number of fi rms using the correlation matrix approach has declined as Internal Model fi rms move to use their Solvency II methodologies under ICA+. We see that 68% of fi rms are using a correlation matrix approach compared to 82% last year. We note that the proportion of fi rms using copula techniques has increased from 12% to 26% this year, which is indicative of fi rms using their Solvency II methods under ICA+.
Two fi rms out of 31 respondents are using an advanced copula such as a Student’s t copula, with six further fi rms using a Gaussian copula. All fi rms that currently state they use copula methods are large.
Graph 8.17.1:
What is your approach to risk aggregation
6%
7%
68%
19%
113 TPS 2014
© 2014 KPMG LLP, a UK limited liability partnership, is a subsidiary of KPMG Europe LLP and a member firm of the KPMG network of independent member fi rms affiliated with KPMG International Cooperative, a Swiss entity. All rights reserved.
Correlation matrix
Gaussian copula
Advanced copula (e.g. student's t)
Other

RISK CAPITA L
Method of setting correlations between risk categories
As covered in the previous question, most fi rms have indicated that they used a correlation matrix or copula technique for aggregation. We asked these fi rms how they set the correlations between different risk categories (note that fi rms were able to select multiple categories in their response).
Consistent with the responses in last year’s survey, general reasoning / expert judgement is the most widely selected response to this question (28 fi rms). Responses indicated that historical data (18 fi rms) and benchmarking / external advice (18 fi rms) were also widely used. Nine fi rms use internal experience data. As may be expected, 8 of these are large fi rms, as these fi rms typically have access to the volume of data required for suffi cient statistical credibility. No fi rms stated that they used other sources such as rating agencies or reinsurers.
Graph 8.17.2:
If using a correlation matrix or copula approach, how have you set the correlations between different risk categories (e.g. market to insurance risks)?
0
5
10
15
20
25
30
28
18 18
12
9 6
Num
ber o
f firm
s
1
114 TPS 2014
© 2014 KPMG LLP, a UK limited liability partnership, is a subsidiary of KPMG Europe LLP and a member firm of the KPMG network of independent member fi rms affiliated with KPMG International Cooperative, a Swiss entity. All rights reserved.
Using general reasoning and/or expert judgement
Using data/benchmarking/advice provided by external consultants
Using historical insurance industry data and financial market data
Using Solvency II standard formula
Using firm's internal experience data
Using regulatory guidance
Using data provided by other industry bodies

RISK CAPITA L
Correlation assumptions
We asked fi rms to populate a template correlation matrix in respect of their 2013 ICA calculation. Given that fi rms use a variety of risk drivers in aggregation, and also that features of some of these risk drivers are very specifi c to fi rms, caution should be exercised when using these results.
As discussed earlier in this report, the approach to setting correlations varies across fi rms. However, in general, the following statements hold:
• Given the availability of data, market-to-market correlations can be expected to rely less on expert judgement;
• Conversely, market to non-market correlations and non-market to non-market correlations can be expected to rely more heavily on expert judgement.
• Consequently, market-to-market correlation values are often set at a more granular level of rounding than for market to non-market correlations and non-market to nonmarket correlations (which are often set in 25% steps given expert judgement).
Note that graphs 8.17.3a, b & c show as a box and whisker plot the distribution of correlation pairs. The ‘box’ represents the inter-quartile range, the ‘whiskers’ represent the minimum and maximum survey responses, and the dot represents the median or 50th percentile. It should be noted that the number of respondents for each correlation pairing will vary, as different firms model correlations at different granularities.
The correlations shown here are correlations of the directions of the respective risk drivers – for example, a negative correlation between equities and credit spreads would mean that equity markets fall in conjunction with a rise in credit spreads.
115 TPS 2014
© 2014 KPMG LLP, a UK limited liability partnership, is a subsidiary of KPMG Europe LLP and a member firm of the KPMG network of independent member fi rms affiliated with KPMG International Cooperative, a Swiss entity. All rights reserved.

116TPS 2014
RISK CAPITAL
Market-to-Market correlations
Market to market correlations are generally set by reference to historical data, and consequently are set at a more granular level than those involving non-market risk drivers. For many correlations, such as equity versus credit spreads, a large amount of external data exists, and the fi rms’ exposures to these risks are similar in nature. Therefore, we observe a narrow inter-quartile range for these risk pairings.
For correlations involving the interest rate level (PC1), a fall in interest rates is generally the more onerous stress, and hence we observe many fi rms correlating falling interesting rates with other adverse market stresses (such as falling equity and property values, and rising credit spreads), which is generally what recent historical data has suggested. However, we are aware that the interest rate up stress is more onerous for certain fi rms, and hence the rise in interest rate is correlated with other adverse market stresses, as this is more prudent in terms of the capital requirement. As a result, we observe a range of correlations (over positive and negative values) of the interest rate risk driver with other market risks.
In general, where these are comparable, we observe that the median market correlations are generally less onerous than the Standard Formula equivalents.
Graph 8.17.3a:
Market to Market Correlations
© 2014 KPMG LLP, a UK limited liability partnership, is a subsidiary of KPMG Europe LLP and a member fi rm of the KPMG network of independent member fi rms affi liated with KPMG International Cooperative, a Swiss entity. All rights reserved.
Interest rate level/PC1 v Equity
Interest rate level/PC1 v Equity volatility
Interest rate level/PC1 v Property
Interest rate level/PC1 v Credit spread
Interest rate level/PC1 v Credit default
Equity v Equity volatility
Equity v Property
Equity v Credit spread
Equity v Credit default
Equity volatility v Property
Equity volatility v Credit default
Equity volatility v Credit spread
Property v Credit spread
Property v Credit default
Credit spread v Credit default
Correlation
1.00.6 0.80.40.20-0.4 -0.2-0.8 -0.6-1.0
0.29
0.31
0.63
0.75
0.53
0.50
-0.25
-0.25
-0.25
-0.75
-0.75
-0.47
-0.50
-0.47
-0.50

117 TPS 2014
Non-market-to-Non-market correlations
Due to the reduced availability of data (when compared with market to market correlations) non-market to non-market correlations tend to rely to a greater extent on expert judgment.
Generally, we observe that the market medians of correlations involving demographic risks, such as mortality and longevity, are close to zero.
For persistency and mass lapse correlations, we observe a wide variation of assumed correlations. For example, persistency versus expenses varies between 0 and 0.7. We noted earlier that persistency assumptions are very product-specifi c, and we expect these to vary widely between fi rms. We also observe similarly wide variation in the correlations between persistency and mass lapse, and also between mass lapse and operational risk.
For operational risk, the median correlations are generally positive, which is the more onerous direction.
The median of the longevity level versus mortality correlation is 0, which is more onerous than the Standard Formula correlation of -0.25. It may be the case that fi rms view the individuals who buy protection products as generally distinct from annuitants, and hence assume a correlation of 0 for prudence.
Graph 8.17.3b:
Non-market to Non-market Correlations
RISK CAPITAL
© 2014 KPMG LLP, a UK limited liability partnership, is a subsidiary of KPMG Europe LLP and a member fi rm of the KPMG network of independent member fi rms affi liated with KPMG International Cooperative, a Swiss entity. All rights reserved.
Longevity level v Longevity trend
Longevity level v Mortality
Longevity level v Persistency
Longevity level v Mass Lapse
Longevity level v Expenses
Longevity level v Operational
Longevity trend v Mortality
Longevity trend v Persistency
Longevity trend v Mass Lapse
Longevity trend v Expenses
Mortality v Persistency
Longevity trend v Operational
Mortality v Mass Lapse
Mortality v Expenses
Mortality v Operational
Persistency v Mass Lapse
Persistency v Operational
Persistency v Expenses
Mass Lapse v Expenses
Mass Lapse v Operational
Expenses v Operational
Correlation
1.00.6 0.80.40.20-0.4 -0.2-0.8 -0.6-1.0
0.07
0.07
0.00
0.00
0.00
0.00
0.00
0.00
0.00
0.00
0.00
0.00
0.00
-0.01
0.25
0.16
0.10
0.25
0.25
0.25
0.22

118TPS 2014
RISK CAPITAL
Market to Non-market correlations
For the risk drivers involving demographic risks, we observe a near-zero correlation assumed with market risks, and as a result these correlations have not been included in Graph 8.17.3c. The Standard Formula suggests that market risks versus life risks should be correlated at 0.25, we observe that a range of fi rms have adopted a lower correlation than this.
We observe that both persistency and mass lapse risk drivers are generally negatively correlated with improving market conditions, i.e. lapse rates will decrease when property and equity markets are rising. However, we do observe a wide variation of assumptions for persistency correlations with the market, and these are likely to be specifi c to fi rms, such as the types of products sold, and furthermore, the exact features of these contracts. For example, adverse market conditions may increase the moneyness of guarantees under with-profi ts business, thus making them more attractive and reducing lapse rates. However, for unit-linked business, falling equity and property values would lower investment returns, and may be assumed to lead to an increase in lapse rates.
The expense risk drivers are generally correlated in a manner that implies a rise in per policy expenses under adverse market movements. Expenses could be indirectly affected by stresses that reduce the number of in-force policies (through higher lapses), although this depends on the type of product, and wouldn’t be relevant to, for example, annuity business. Furthermore, adverse market movements would tend to increase investment expenses as a proportion of the fund.
The risk driver of operational losses is positively correlated with the most onerous direction of the market risk drivers for all fi rms. This is in line with the expectation that operational losses will increase in times of market turmoil.
Graph 8.17.3c: Market to Non-market correlations
© 2014 KPMG LLP, a UK limited liability partnership, is a subsidiary of KPMG Europe LLP and a member fi rm of the KPMG network of independent member fi rms affi liated with KPMG International Cooperative, a Swiss entity. All rights reserved.
Interest rate level/PC1 v Persistency
Interest rate level/PC1 v Mass lapse
Interest rate level/PC1 v Expenses
Interest rate level/PC1 v Operational
Property v Persistency
Property v Mass lapse
Property v Expenses
Property v Operational
Equity v Persistency
Equity v Mass lapse
Equity v Operational
Equity v Expenses
Credit spread v Persistency
Credit spread v Mass lapse
Credit spread v Expenses
Credit spread v Operational
Credit default v Mass lapse
Credit default v Persistency
Credit default v Expenses
Correlation
1.00.6 0.80.40.20-0.4 -0.2-0.8 -0.6-1.0
-0.05
-0.05
0.00
-0.20
-0.16
-0.25
-0.10
-0.25
-0.25
-0.25
-0.25
-0.22
0.11
0.25
0.12
0.15
0.25
0.25
0.19

RISK CAPITA L
Software used to perform aggregation
We asked fi rms what software they used to perform their aggregation.
Observing similar responses to last year, out of 31 responses, the majority (22 fi rms) indicated that they used an internally or externally developed Excel-based tool.
We note that those fi rms using Excel based tools tend to use a stress-based / expert judgment approaches to aggregation. Only a small proportion of those fi rms using Excel based tools use simulation-based approaches, as these fi rms tend to prefer off-the-shelf solutions, presumably to increase the effi ciency of the calculation.
RiskAgility® is used by 5 respondents for capital aggregation (2 of which have started using RiskAgility® since last year). All respondents using RiskAgility® use copula approaches in capital aggregation.
Two fi rms also responded that they used IBM Algorithmics® software.
Graph 8.17.4:
What software are you using to perform your aggregation?
0
5
10
15
20
25
21
5
2 2
Num
ber o
f firm
s
1
119 TPS 2014
© 2014 KPMG LLP, a UK limited liability partnership, is a subsidiary of KPMG Europe LLP and a member firm of the KPMG network of independent member fi rms affiliated with KPMG International Cooperative, a Swiss entity. All rights reserved.
Algorithmics - IBM
RiskAgility - Towers Watson
Internally developed Excel-based tool
Externally developed Excel-based tool
Other

RISK CAPITA L
Approach used to allocate capital diversifi cation benefi t
Graph 8.17.5:
What approach is used to allocate the capital diversifi cation benefi t to lower levels of granularity?
21%
34%
7%
3%
35%
Pro-rata
Discrete marginal approach
Continuous marginal approach (Euler method)
Variance-covariance method
No allocation of diversification benefit
We asked fi rms what approach is used to allocate the capital diversifi cation benefi t to lower levels of granularity, if this is done. This year, more fi rms are allocating their diversifi cation benefi ts, with 66% of respondents stating they do this, which is an increase from 57% in the 2013 survey.
Consistent with last year’s results, the two most widely used approaches are the pro-rata method (which allocates capital according to some basis, such as reserves or premium income) and the continuous marginal approach (also known as the Euler method, whereby the diversifi cation benefit is allocated with reference to the partial derivative of the capital requirement). However, there is currently no unique and commonly accepted practice of what should be considered as a fair allocation. The percentage of firms using the pro-rata method has remained stable since last year (21% compared to 23% previously), whereas we observe an increase from 23% to 35% in the proportion of firms using the continuous marginal approach (Euler method).
Of the 35% (10 fi rms) that use the Euler method, 8 of these are large fi rms as this method is generally more computationally intensive and is usually adopted by fi rms with more sophisticated approaches for their ICA. The pro-rata and discrete marginal approaches were used more widely by small and medium fi rms, where stress-based approaches to the capital calculation are more common.
TPS 2014
© 2014 KPMG LLP, a UK limited liability partnership, is a subsidiary of KPMG Europe LLP and a member firm of the KPMG network of independent member fi rms affiliated with KPMG International Cooperative, a Swiss entity. All rights reserved.
120

RISK CAPITA L
Level of business that capital is allocated at
Firms allocate risk capital to more granular levels for a number of different purposes, such as:
• Supporting effective capital optimisation across the organisation
• Supporting performance evaluation
• Supporting key decision processes such as pricing and business plan projections
• Regulatory compliance and fi nancial reporting
Allocating to legal entity level is the most widely used approach (13 out of 27 fi rms), with equal splits between product level (6 fi rms) and fund level (6 fi rms). There is no meaningful relationship between the size of the fi rm and the granularity at which it allocated risk capital. This is possibly because smaller fi rms, despite generally taking less complex approaches to allocation, have a lower number of products and funds, thus making it relatively more manageable to allocate capital to this level.
Graph 8.17.6:
At what level of business do you allocate risk capital?
22%
8%
Legal entity
Fund level
Product level
Other
22%
48%
TPS 2014
© 2014 KPMG LLP, a UK limited liability partnership, is a subsidiary of KPMG Europe LLP and a member firm of the KPMG network of independent member fi rms affiliated with KPMG International Cooperative, a Swiss entity. All rights reserved.
121

RISK CAPITA L
Method of allowing for non-linearity
We asked firms about their approach to allowing for non-linearity. Firms may allow for this via a variety of methods, outlined below:
• Under the Killer Scenario approach, all individual risks at a 99.5th percentile are calculated and then a combined scenario of all risks is calculated. The non-linearity adjustment is the capital requirement under the combined scenario divided by the sum of the capital requirements under the individual risk scenarios.
• The Risk Geography approach considers combined scenarios in the proximity of the expected insolvency areas and examines the relative capital requirements of these scenarios, determining a range for the capital requirements.
• Firms who use proxy models for modelling risks can allow for non-linearity by including cross-terms refl ecting the interaction of risk drivers.
Graph 8.17.7:
Which method that best describes your approach to allow for nonlinearity?
52%
17%
21%
3%
7%
Killer scenario approach (e.g. medium bang, big bang, etc)
Inclusion of cross-terms in proxy models
Risk geographies
No allowance
Other
We observe similar results to last year’s survey, with approximately half of fi rms (15 out of 29) stating they use a Killer Scenario (e.g. big bang or medium bang) approach to allowing for non-linearity.
Six firms allow for non-linearity through the inclusion of cross-terms in the proxy models, while “other” approaches include producing scenarios to check the appropriateness of results derived from the correlation matrix approach, simultaneous modelling, as well as using Monte Carlo simulation to derive the adjustment.
TPS 2014
© 2014 KPMG LLP, a UK limited liability partnership, is a subsidiary of KPMG Europe LLP and a member firm of the KPMG network of independent member fi rms affiliated with KPMG International Cooperative, a Swiss entity. All rights reserved.
122
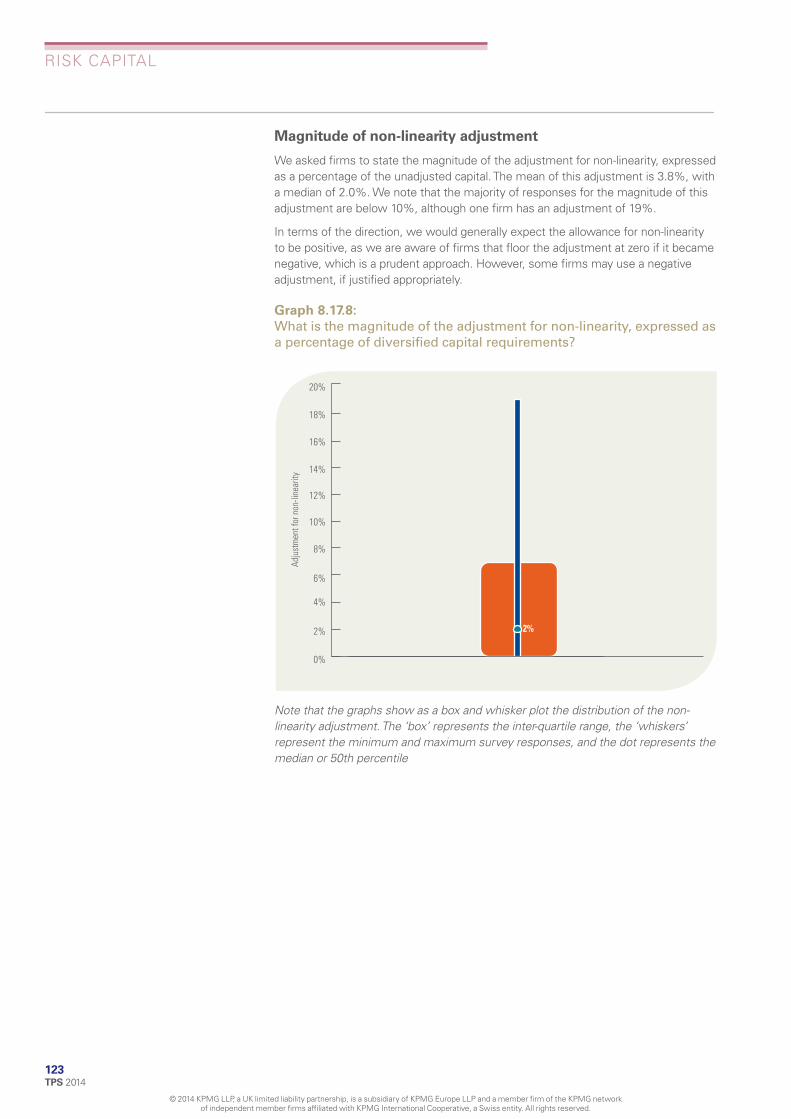
123 TPS 2014
Magnitude of non-linearity adjustment
We asked fi rms to state the magnitude of the adjustment for non-linearity, expressed as a percentage of the unadjusted capital. The mean of this adjustment is 3.8%, with a median of 2.0%. We note that the majority of responses for the magnitude of this adjustment are below 10%, although one fi rm has an adjustment of 19%.
In terms of the direction, we would generally expect the allowance for non-linearity to be positive, as we are aware of fi rms that fl oor the adjustment at zero if it became negative, which is a prudent approach. However, some fi rms may use a negative adjustment, if justifi ed appropriately.
Graph 8.17.8:
What is the magnitude of the adjustment for non-linearity, expressed as a percentage of diversifi ed capital requirements?
Adj
ustm
ent f
or n
on-li
near
ity
0%
4%
6%
14%
16%
18%
20%
2%2%
8%
10%
12%
Note that the graphs show as a box and whisker plot the distribution of the non-linearity adjustment. The ‘box’ represents the inter-quartile range, the ‘whiskers’ represent the minimum and maximum survey responses, and the dot represents the median or 50th percentile
RISK CAPITAL
© 2014 KPMG LLP, a UK limited liability partnership, is a subsidiary of KPMG Europe LLP and a member fi rm of the KPMG network of independent member fi rms affi liated with KPMG International Cooperative, a Swiss entity. All rights reserved.

RISK CAPITA L
8.18 CAPITA L FUNGIBILITY
Approach to accounting for capital fungibility
We asked fi rms to state their approach to account for capital fungibility (i.e. the extent to which capital can be transferred between different legal entities of the group). A similar percentage (43%) to last year’s survey stated that there are no fungibility issues in their business, and consequently do not require consideration. Two fi rms account for fungibility restrictions explicitly in modelling (‘bottom-up approach’), both of which are large fi rms.
We observe improved market practice in this area; the number of fi rms not considering fungibility having decreased from last year (29% to 13%). There has been a corresponding increase in the number of fi rms allowing for fungibility via an out-of-model adjustment (‘top-down approach’), which has risen from 14% to 34%.
Graph 8.18.1:
Which best describes your approach to accounting for capital fungibility?
3%
13%
7%43%
34%
TPS 2014
© 2014 KPMG LLP, a UK limited liability partnership, is a subsidiary of KPMG Europe LLP and a member firm of the KPMG network of independent member fi rms affiliated with KPMG International Cooperative, a Swiss entity. All rights reserved.
124
Top-down approach (i.e. don’t explicitly account for fungibility in actuarial models and
make an adjustment at the end)
Bottom-up (i.e. account for fungibility restrictions in modelling)
Not applicable as fungibility is not relevant to the business
Not applicable, as this risk has not been considered
Other

9 Modelling
9.1 MODELLING PLATFORMS
We asked fi rms what modelling platforms they use for primary modelling purposes (in particular, valuation purposes) and also for pricing purposes. Respondents were able to select multiple modelling platforms.
For primary modelling purposes, 44% of fi rms use Prophet only, a further 25% use Moses only, with the remaining 31% using “other” or “multiple” platforms. In line with our expectations, this is broadly consistent with last year’s survey, where the equivalent proportions were 46%, 20% and 34%.
We see very similar proportions in relation to the modelling platform used for pricing; however we note a marginal increase in the use of Prophet and Moses when compared to last year’s survey.
The other modelling platforms that fi rms included in their responses were Mo.Net, MG-ALFA, AXIS, and Excel.
Graph 9.1.1:
What modelling platform are you using for primary purposes and pricing purposes?
0%
10%
20%
30%
40%
50%
60%
70%
80%
90%
100%
16% 22%
22%
19%
38%
16%
25%
44%
Primary modelling Pricing
Perc
enta
ge o
f firm
s
Single Platform - Prophet
Single Platform - Moses
Single Platform - Other
Using Multiple Platforms
125 TPS 2014
© 2014 KPMG LLP, a UK limited liability partnership, is a subsidiary of KPMG Europe LLP and a member firm of the KPMG network of independent member fi rms affiliated with KPMG International Cooperative, a Swiss entity. All rights reserved.

MODELLING
9.2 ECONOMIC SCENARIO GENERATO RS
Graph 9.2.1:
Which company provides your Risk Neutral ESG?
14%
76%
10%
Moody's (Barrie and Hibbert)
Towers Watson
Internal ESG
Continuing the results seen in recent years, Barrie & Hibbert remains the most widely used ESG provider. In particular, 76% of respondents who use a Risk Neutral ESG indicated that this was provided by Barrie & Hibbert.
We observe that the use of ESG providers has remained stable over the year, but note that two fi rms have swapped provider, both moving to the Towers Watson ESG, from an internal ESG and the Deloitte ESG respectively.
Out of the three respondents who state they use an internal ESG, two of these are large fi rms, and one is a small fi rm.
TPS 2014
© 2014 KPMG LLP, a UK limited liability partnership, is a subsidiary of KPMG Europe LLP and a member firm of the KPMG network of independent member fi rms affiliated with KPMG International Cooperative, a Swiss entity. All rights reserved.
126

MODELLING
9.3 PROJECTING THE BALANCE SHEET
Number of years considered for balance sheet projection and business planning
We asked fi rms how far they project a number of key balance sheet metrics into the future, and also how long a period is considered for business planning purposes. We fi nd that for all balance sheet metrics and business planning, the most frequently used period is 5 years.
For the ORSA and economic capital metrics, we note the majority of fi rms (88% and 83% respectively) project these for 3 to 5 years. This is consistent with what we observe for the business planning period, with 96% of fi rms planning for this length of time. This is not surprising, as we would expect fi rms’ economic capital and ORSA metrics to be an integral part of the business planning exercise.
The projection period of the ICA/ICA+ metric is more varied, with only 61% projecting this between 3 and 5 years. We also observe 4 fi rms projecting this metric beyond 10 years, although we note that none of these fi rms projects an economic capital metric.
Graph 9.3.1:
How many years do you project your balance sheet?
127 TPS 2014
© 2014 KPMG LLP, a UK limited liability partnership, is a subsidiary of KPMG Europe LLP and a member firm of the KPMG network of independent member fi rms affiliated with KPMG International Cooperative, a Swiss entity. All rights reserved.
1
Perc
enta
ge o
f firm
s
0%
10%
20%
30%
40%
50%
60%
17%
2 3 4 5 >5
0%
11%
4% 4% 4% 6%
0%
17%
28%
17%
41%
9% 8%
11%
0%
35%
52%
56% 56%
17%
8%
0% 0%
Years
ICA/ICA+ ORSA EC Business planning

MODELLING
Methodology for projecting future capital requirement
The methodology used for projecting capital requirements has changed over the past few years, refl ecting the fact that fi rms are continuing to develop their approach in advance of the implementation of Solvency II. As in previous years, a risk driver based approach is the most common approach for projecting capital requirements; 56% of respondents have used this approach compared to 50% in last year’s survey. However within this group there has been an increase in respondents selecting drivers at the risk module level, with a corresponding decrease in fi rms selecting drivers at the risk module and block of business level. The number of respondents selecting a single risk driver remains largely unchanged.
We also observe the number of fi rms using a combination of modelling and risk drivers to project future capital requirements increasing from 14% in 2013 to 25% in 2014. The majority of fi rms (5 out of 8) using this technique are large fi rms, but we also observe this approach being taken by 2 medium and 1 small fi rm.
Graph 9.3.2:
How does your company project its future capital requirement?
Other
Whole capital measure is projected using a single risk driver (e.g. assumed to run-off in line with BEL)
A risk driver approach where separate risk drivers are selected for each risk module
A risk driver approach where separate risk drivers are selected for each risk module and each block of
business
A combination of modelling and risk drivers is used for the different capital requirements for each risk
Actuarial model is able to perform stresses at future dates for each risk and capital is then aggregated
outside the model
0% 5% 10% 15% 20% 25% 30%
Percentage of firms
3%
9%
28%
19%
25%
9%
TPS 2014
© 2014 KPMG LLP, a UK limited liability partnership, is a subsidiary of KPMG Europe LLP and a member firm of the KPMG network of independent member fi rms affiliated with KPMG International Cooperative, a Swiss entity. All rights reserved.
128

MODELLING
9.4 PROJECTING NEW BUSINESS
Type of projection method used for new business
52% of respondents stated that they now run representative new business model points through the actuarial model, which is an increase of 10% from last year’s survey, which is offset by a similar decrease in fi rms scaling current business mix to arrive at new business. As the former approach is arguably more sophisticated, this might indicate an improvement in market practice in this area. However, we observe that there has been an increase in the number of fi rms using the approximate method from 16% to 26%.
We note that these movements may have been driven by changes in approach but may also be the result of variation in participants in the survey or in how this survey question has been interpreted.
Graph 9.4.1:
How does your projection method build in new business?
129 TPS 2014
© 2014 KPMG LLP, a UK limited liability partnership, is a subsidiary of KPMG Europe LLP and a member firm of the KPMG network of independent member fi rms affiliated with KPMG International Cooperative, a Swiss entity. All rights reserved.
Representative new business model points are run through the actuarial model
New business is assumed to follow the same mix as current business so results are scaled
New business is added in approximately
Other
52%
4%
26%
18%

MODELLING
How much new business do you allow for in your projections?
Graph 9.4.2:
How much new business do you allow for in your projections?
14%
47%
21%
11%
7%
No allowance for new business
1 year
2 years
3 years
More than 3 years
Last year 69% of respondents indicated that they allowed for more than 1 year’s new business in their projections; this has increased to 75% in this year’s survey and within this group the majority of respondents allow for more than 3 years of new business. This is consistent with the responses discussed above relating to the period for business planning.
With the exception of one medium sized fi rm, the fi rms that do not make any allowance for new business are either closed to new business or are small.
TPS 2014
© 2014 KPMG LLP, a UK limited liability partnership, is a subsidiary of KPMG Europe LLP and a member firm of the KPMG network of independent member fi rms affiliated with KPMG International Cooperative, a Swiss entity. All rights reserved.
130

10 Solvency II
10.1 TRANSITION FROM ICA TO SOLVENCY II
Solvency II elements incorporated in this year’s ICA methodology
Graph 10.1.1:
Which of the following Solvency II elements do you expect to incorporate in this year’s ICA methodology (based on YE13)?
0
5
10
15
20
13
6 65
17
7
1
Num
ber o
f firm
s
Solvency II risk free rate
Contract boundaries
Liquidity premium / matching adjustment
Capital eligibility rules
Volatility adjustment
Risk margin
None
We asked respondents which elements of their Solvency II methodology they were planning to incorporate into their ICA methodology for 2014. Of the 32 respondents, 15 indicated that they are making adjustments to their ICA methodology to align it with Solvency II. The majority (11 out of 17) of the fi rms that have not sought to align the methodologies are Standard Formula fi rms. A number of respondents commented that whilst they have incorporated a liquidity premium into their ICA methodology, this liquidity premium is in line with their internal methodology and not the Solvency II Matching Adjustment rules. Those respondents incorporating Solvency II contract boundaries into their ICA methodology are primarily unit linked and reinsurance providers.
131 TPS 2014
© 2014 KPMG LLP, a UK limited liability partnership, is a subsidiary of KPMG Europe LLP and a member firm of the KPMG network of independent member fi rms affiliated with KPMG International Cooperative, a Swiss entity. All rights reserved.

132TPS 2014
© 2014 KPMG LLP, a UK limited liability partnership, is a subsidiary of KPMG Europe LLP and a member fi rm of the KPMG network of independent member fi rms affi liated with KPMG International Cooperative, a Swiss entity. All rights reserved.
SOLVENCY II
Basis for YE 2013 ICA capital requirement calculation
Graph 10.1.2:
Which of the following are you aligning your ICA calculation to?
0 2 4 6 8 10 12 14
17%
Historic ICA approach
Solvency II or Economic Capital
A partial move to Solvency II or Economic Capital
Other
43%
27%
13%
Solvency II standard formula
Solvency II internal model
Economic capital model (if different)
51 7
Number of firms
We asked respondents what their year-end 2013 ICA calculation would be based on – with the intention of fi nding out whether fi rms were looking to switch to their economic capital or Solvency II bases for the purpose of their ICA. Only 27% of the 30 respondents to this question are looking to maintain their historic ICA approach, with 43% indicating that they would base their ICA calculation on Solvency II or economic capital, with a further 17% partially moving in that direction. As Graph 10.1.2 shows, only one of the 43% is moving to an economic capital basis, with the rest moving towards Solvency II.
Overall, this indicates a high degree of alignment between ICA and Solvency II approaches, much more so than last year where 47% of respondents maintained their historic ICA approach. This is not surprising given the greater degree of certainty around the implementation date of Solvency II and the details of the Solvency II calculation

SOLVENCY II
Respondents time-frame for aligning ICA with Solvency II Internal Model
Graph 10.1.3:
When do you intend to align your ICA with your Solvency II Internal Model?
8
2
2
4
2
Already done
For YE13 reporting
For YE14 reporting
Never
Other
We asked respondents about their time-frame for aligning ICA with the Solvency II Internal model. There were 18 responses to this question.
More than half the fi rms that intend to align their ICA and Solvency II Internal Model have already aligned them.
Two fi rms selected “other” as their answer, for one of these fi rms this was because the ICA capital requirement is aligned but the balance sheet is not. The other fi rm is going to make this transition post 1st January 2016.
Four fi rms stated that they did not intend to align their ICA and Solvency II Internal Model.
133 TPS 2014
© 2014 KPMG LLP, a UK limited liability partnership, is a subsidiary of KPMG Europe LLP and a member firm of the KPMG network of independent member fi rms affiliated with KPMG International Cooperative, a Swiss entity. All rights reserved.

SOLVENCY II
Use of existing ICA documentation for Solvency II Internal Model Application purposes
Graph 10.1.4:
How much use will you make of existing ICA documentation for Solvency II Internal Model Application purposes?
6
2
8
Significant use
Some use
No use
We asked the respondents how much use they will make of existing ICA documentation for the Internal Model Application Process – there were 16 responses to this question, i.e. those with an Internal Model.
Nearly all respondents have used ICA documentation to some degree (14 out of 16) and nearly half of those make signifi cant use of ICA documentation in their IMAP. There doesn’t appear to be any signifi cant difference in the degree to which ICA documentation is used between the firms which have a full Internal Model and those which just have a Partial Internal Model.
TPS 2014
© 2014 KPMG LLP, a UK limited liability partnership, is a subsidiary of KPMG Europe LLP and a member firm of the KPMG network of independent member fi rms affiliated with KPMG International Cooperative, a Swiss entity. All rights reserved.
134

SOLVENCY II
Expected level of changes in resources involved in the ICA when moved to Solvency II
Graph 10.1.5:
How much do you expect the level of resource involved in the current ICA process to change when you move to Solvency II?
5
6
16
3
Significant increase
Moderate increase
No change
Decrease
The respondents were questioned about their expected level of resource involved in producing the ICA when they move to Solvency II. There were 30 responses to this question.
The majority expect to see an increase in resource required for ICA, most of these fi rms expect this to be a moderate increase rather than a signifi cant one. 3 fi rms expect to see a decrease in resource required. There appears to be no clear link between the expected resource requirements and the size of the fi rm or whether they are using an Internal Model.
135 TPS 2014
© 2014 KPMG LLP, a UK limited liability partnership, is a subsidiary of KPMG Europe LLP and a member firm of the KPMG network of independent member fi rms affiliated with KPMG International Cooperative, a Swiss entity. All rights reserved.

SOLVENCY II
Time taken in ICA to produce final report from base balance sheet
Graph 10.1.6:
How long does your ICA take to produce, from production of base balance sheet to finalisation of report (pre Board sign off)?
0
2
4
6
8
10
12
14
16
2
15
5
9
Num
ber o
f firm
s
0
Less than 1 month
1 - 2 months
2 - 3 months
3 - 6 months
Greater than 6 months
A large number of fi rms (15 out of 31) indicated that they take between 1 and 2 months to produce their ICA, which is a signifi cant improvement on recent years. There is no obvious trend between type or size of fi rm and the time taken to produce the ICA. In particular, the 9 who take between 3 and 6 months include small Standard Formula fi rms and large Internal Model fi rms and include those with very simple business and those with complex business.
Some fi rms commented that the process to produce the ICA started before the production of the base balance sheet i.e. including assumption setting, sign off etc and so in reality the timescales presented here are smaller than the total production time. However, we designed this question with ease of comparison in mind.
TPS 2014
© 2014 KPMG LLP, a UK limited liability partnership, is a subsidiary of KPMG Europe LLP and a member firm of the KPMG network of independent member fi rms affiliated with KPMG International Cooperative, a Swiss entity. All rights reserved.
136
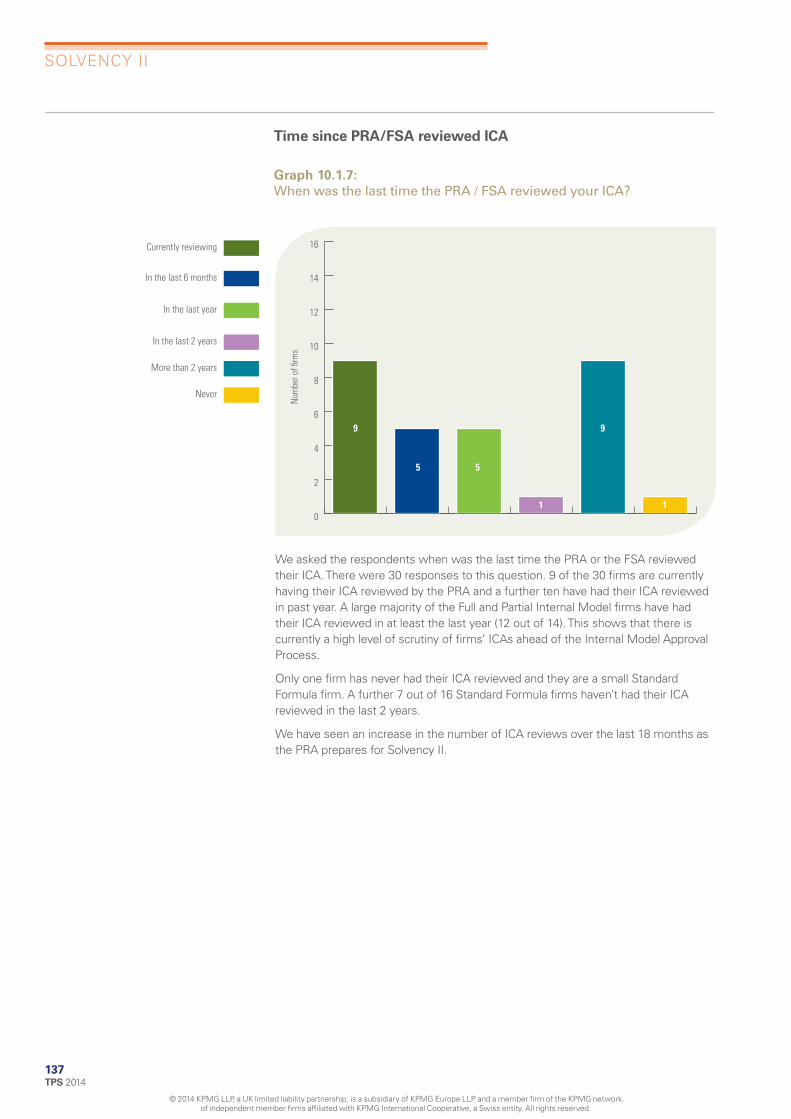
SOLVENCY II
Time since PRA/FSA reviewed ICA
Graph 10.1.7:
When was the last time the PRA / FSA reviewed your ICA?
0
2
4
6
8
10
12
14
16
9 9
5 5
1 1
Num
ber o
f firm
s
Currently reviewing
In the last 6 months
In the last year
In the last 2 years
More than 2 years
Never
We asked the respondents when was the last time the PRA or the FSA reviewed their ICA. There were 30 responses to this question. 9 of the 30 fi rms are currently having their ICA reviewed by the PRA and a further ten have had their ICA reviewed in past year. A large majority of the Full and Partial Internal Model fi rms have had their ICA reviewed in at least the last year (12 out of 14). This shows that there is currently a high level of scrutiny of fi rms’ ICAs ahead of the Internal Model Approval Process.
Only one fi rm has never had their ICA reviewed and they are a small Standard Formula fi rm. A further 7 out of 16 Standard Formula fi rms haven’t had their ICA reviewed in the last 2 years.
We have seen an increase in the number of ICA reviews over the last 18 months as the PRA prepares for Solvency II.
137 TPS 2014
© 2014 KPMG LLP, a UK limited liability partnership, is a subsidiary of KPMG Europe LLP and a member firm of the KPMG network of independent member fi rms affiliated with KPMG International Cooperative, a Swiss entity. All rights reserved.

SOLVENCY II
Distribution of biggest driver in ICA
Graph 10.1.8:
What was the biggest driver of movement in your ICA over this period?
0
2
4
6
8
10
12
14
16
15
4
10
Num
ber o
f firm
s
Market risk
Insurance risk
Credit risk
Operational risk
Liquidity risk
Group risk
Diversification benefits
Model recalibration
Modelling improvements
Other
000
433
The main driver of change in the ICA over the last year appears to be market risk, with 15 of the 30 showing that this was the main driver.
Other than 4 fi rms selecting insurance risk, the other main drivers were related to modelling and model calibrations – all but two of these fi rms are Standard Formula fi rms.
Several fi rms listed “other” reasons for movement in ICA over this period and they included ICG add-ons, moving to an IFRS basis within the ICA, and new business / exposure impacts.
TPS 2014
© 2014 KPMG LLP, a UK limited liability partnership, is a subsidiary of KPMG Europe LLP and a member firm of the KPMG network of independent member fi rms affiliated with KPMG International Cooperative, a Swiss entity. All rights reserved.
138

SOLVENCY II
10.2 SOLVENCY II APPROAC H
Approach used to calculate the Solvency II Solvency Capital Requirement
Graph 10.2.1:
With which method is your firm planning to calculate the Solvency II Solvency Capital Requirement?
19%
53%
28%
Full internal model
Partial internal model
Standard Formula
Over the last two years, fi rms have found the Internal Model Approval Process particularly challenging and while some fi rms have been requested by the regulator to re-enter the approval process, a number have dropped out or reduced the scope of their Internal Model to a Partial Internal Model. This is refl ected in the results of our survey for this year with 19% of respondents indicating that they are taking a full Internal Model approach in comparison to 34% of respondents in 2013 (37% and 43% in 2012 and 2011 respectively).
This result refl ects the recognition within the UK industry that there are signifi cant barriers to achieving Internal Model approval and this is discouraging fi rms from remaining in IMAP. Where a Standard Formula approach is adopted instead, the onus remains on fi rms to justify the appropriateness of the Standard Formula and this is an area that a number of fi rms are currently working on.
139 TPS 2014
© 2014 KPMG LLP, a UK limited liability partnership, is a subsidiary of KPMG Europe LLP and a member firm of the KPMG network of independent member fi rms affiliated with KPMG International Cooperative, a Swiss entity. All rights reserved.

SOLVENCY II
Extent Internal Model currently used when making business decisions
Graph 10.2.2:
If you answered, “Internal Model” or “Partial Internal Model”, have you submitted any pre-application documentation for the approval of your (Partial) Internal Model?
5
10
Ye s
No
In order to ensure that the PRA does not have an excessive amount of documentation to read when an approval is submitted, the documentation has been reviewed in stages or themes. Therefore, some fi rms will have already submitted documentation and received feedback. Of the 9 Partial Internal Model fi rms in our survey, 7 have now submitted pre-application documentation to the PRA. Of the 6 full internal fi rms only 3 have submitted documentation to the PRA. All fi rms who have submitted documentation have received feedback – mainly to a limited extent although one fi rm responded that they have received feedback on everything they have submitted to date.
TPS 2014
© 2014 KPMG LLP, a UK limited liability partnership, is a subsidiary of KPMG Europe LLP and a member firm of the KPMG network of independent member fi rms affiliated with KPMG International Cooperative, a Swiss entity. All rights reserved.
140

SOLVENCY II
Extent Internal Model currently used when making business decisions
Graph 10.2.3:
To what extent do you currently use your Internal Model when making business decisions?
0
2
4
6
8
10
Num
ber o
f firm
s
9
4
2
0 0
Fully
To a large extent
To some extent
Very little
Not at all
All full or Partial Internal Model fi rms indicated that they use their model in making business decisions. The majority (9 out of 15) indicated that they use their model in some business decisions with 4 indicating they use their model to a large extent. The 2 fi rms that indicated that they use their model in very few decisions are full Internal Model fi rms.
While there has been a slight increase in the use the Internal Model for making business decisions, this indicates that fi rms still have a signifi cant amount of work to do to fully embed Solvency II which is crucial to satisfying the requirements of the Use Test. This result also suggests that the decision to remain in IMAP is primarily driven by the inappropriateness of the Standard Formula rather than fi rms having existing and available economic capital/Internal Model data which they use to steer their business.
141 TPS 2014
© 2014 KPMG LLP, a UK limited liability partnership, is a subsidiary of KPMG Europe LLP and a member firm of the KPMG network of independent member fi rms affiliated with KPMG International Cooperative, a Swiss entity. All rights reserved.

SOLVENCY II
Extent to which respondents use their Internal Model for making business decisions
Graph 10.2.4:
Have you rolled your Solvency II programmes into Business As Usual?
0
5
10
15
20
25
30
35
8
8
9
7 5 6 5
12
11
4
8
18
12
15
Reserving Pricing Capital calulations Risk management
Num
ber o
f firm
s
TPS 2014
© 2014 KPMG LLP, a UK limited liability partnership, is a subsidiary of KPMG Europe LLP and a member firm of the KPMG network of independent member fi rms affiliated with KPMG International Cooperative, a Swiss entity. All rights reserved.
142
Yes – fully integrated
Partially integrated
Not at all integrated
N/A
Comparing to the results of our 2013 survey the level of integration of Solvency II calculations in BAU processes remains the same. As expected, risk management and capital calculations are fairly well integrated into the BAU processes with pricing and reserving much less well integrated. A number of respondents indicated that integrating Solvency II into reserving and pricing was simply not applicable; all of these fi rms are adopting a Standard Formula approach.

SOLVENCY II
Time taken to produce Solvency II numbers
Graph 10.2.5:
How long does it currently take you to produce Solvency II numbers, from production of base balance sheet to finalisation of report (pre Board sign off)?
0
2
4
6
8
10
12
14
2
Num
ber o
f firm
s
14
7
4
1
Less than 1 month
1 - 2 months
2 - 3 months
3 - 6 months
Greater than 6 months
The time taken to produce the Solvency II balance sheet is very similar to the production timescales for producing the ICA with the majority of fi rms taking between 1 and 2 months to complete the work. A large proportion of fi rms indicated that they take between 2 and 3 months to produce the Solvency II balance sheet potentially recognising the greater amount of work required for Solvency II submissions. The question did not specify whether this production timescale included production of all of the Solvency II documentation i.e. SFCR, RSR and QRTs. However, it is clear that some fi rms will require signifi cant transformations in their process to be able to meet the ultimate Solvency II reporting requirements of 14 weeks for annual and 5 weeks for quarterly submissions.
143 TPS 2014
© 2014 KPMG LLP, a UK limited liability partnership, is a subsidiary of KPMG Europe LLP and a member firm of the KPMG network of independent member fi rms affiliated with KPMG International Cooperative, a Swiss entity. All rights reserved.

SOLVENCY II
Intention to apply for a Matching Adjustment
Graph 10.2.6:
Do you intend to apply for a Matching Adjustment?
53% 47%
Ye s
No
Graph 10.2.6 shows the proportion of all respondents (both annuity providers and non-annuity providers) that indicated they intend to apply for the Matching Adjustment. Of the 11 fi rms in the survey with over £1bn of annuity liabilities, 10 are planning to apply a Matching Adjustment, as expected. A further 11 have less than £1bn (but greater than zero) of annuity liabilities. Of these, 2 intend to apply for a Matching Adjustment. It is likely that a number of these do not see the capital benefi t given relatively small annuity portfolios. Additionally, some of these reinsure their annuity books or back their annuity portfolio with signifi cant proportions of non traditional fi xed interest assets. There were also reinsurers in the list of those intending to apply.
TPS 2014
© 2014 KPMG LLP, a UK limited liability partnership, is a subsidiary of KPMG Europe LLP and a member firm of the KPMG network of independent member fi rms affiliated with KPMG International Cooperative, a Swiss entity. All rights reserved.
144

SOLVENCY II
Applicability of the Matching Adjustment to assets
Graph 10.2.7:
What is your working assumption with regard to the applicability of the Matching Adjustment for the following assets?
0%
10%
20%
30%
40%
50%
60%
70%
80%
90%
100%
59%
6%
29%
6%
Callable bonds Commercial mortgages without make whole
clauses
Perc
enta
ge o
f firm
s
Commercial mortgages with make whole clauses
Equity release mortgage assets
45%
55%
36%
18%
45%
40%
10%
50%
Matching adjustment is assumed to be fully applicable
Matching adjustment is assumed not to apply
Intend to restructure in order for the matching adjustment to be applicable
Undecided / unclear at present
There is still signifi cant uncertainty over whether certain assets (i.e. non vanilla fi xed interest assets) that are used to back annuities will be admissible for Matching Adjustment purposes. We asked respondents whether they thought the Matching Adjustment would be applicable for a number of these asset types. Respondents included those who were not intending to apply for a Matching Adjustment but who had formed a view on the asset eligibility. Therefore, 21 of the 32 fi rms included in the survey responded.
In the case of callable bonds a signifi cant portion of respondents (59%) indicated that they are undecided or it is not clear whether the Matching Adjustment will apply and 29% indicated that they do not think it will apply. One fi rm has assumed a degree of restructuring will need to be performed to get them to apply and another indicated that they assume it will apply. The latter appears an optimistic view, particularly in the absence of suitable make whole or Spens type clauses.
In the case of commercial mortgages, it was generally felt that unless suitable make whole clauses are in place, these assets would not qualify for a Matching Adjustment although some firms are still undecided/unclear. This is in line with our expectation as it seems this area of the asset eligibility rules is now more certain.
In the case of equity release mortgages, 5 out of 11 respondents indicated that they do not think that they will achieve a Matching Adjustment in respect of these assets. 2 fi rms indicated that they are considering restructuring their portfolio in order to achieve Matching Adjustment and we are aware of a number of other fi rms in the market intending to take this approach as more fi rms are accepting that these assets will not be eligible in their existing form.
145 TPS 2014
© 2014 KPMG LLP, a UK limited liability partnership, is a subsidiary of KPMG Europe LLP and a member firm of the KPMG network of independent member fi rms affiliated with KPMG International Cooperative, a Swiss entity. All rights reserved.

SOLVENCY II
Overall, there is still uncertainty in the industry as to which assets the Matching Adjustment will apply. There are papers written by industry bodies to try to help drive a more consistent approach given that the rules are open to signifi cant interpretation. The PRA has also released letters to help provide clarity and the trial Matching Adjustment submission may also assist with this. It will be diffi cult for the PRA to give a defi nitive ‘yes’ or ‘no’ as they will need to ensure they demonstrate a consistent approach across Europe. However, the emphasis on fi xity of cash fl ows has helped to rule out some asset classes, such as equity release, without some form of restructure.
Use of the Volatility Adjustment
Graph 10.2.8a:
Do you intend to use the Volatility Adjustment for all business where a Matching Adjustment does not apply?
47% 53%
Ye s
No
TPS 2014
© 2014 KPMG LLP, a UK limited liability partnership, is a subsidiary of KPMG Europe LLP and a member firm of the KPMG network of independent member fi rms affiliated with KPMG International Cooperative, a Swiss entity. All rights reserved.
146
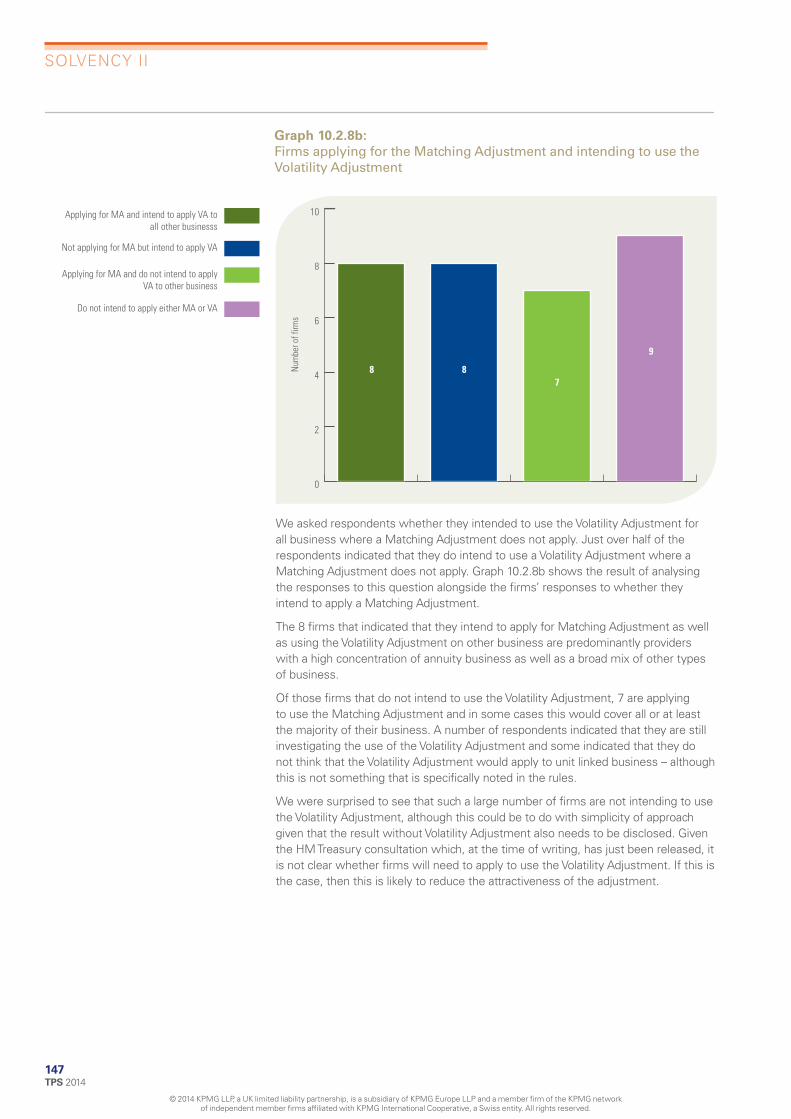
SOLVENCY II
Graph 10.2.8b:
Firms applying for the Matching Adjustment and intending to use the Volatility Adjustment
0
2
4
6
8
10
8 8 7
9
Num
ber o
f firm
s
Applying for MA and intend to apply VA to all other businesss
Not applying for MA but intend to apply VA
Applying for MA and do not intend to apply VA to other business
Do not intend to apply either MA or VA
We asked respondents whether they intended to use the Volatility Adjustment for all business where a Matching Adjustment does not apply. Just over half of the respondents indicated that they do intend to use a Volatility Adjustment where a Matching Adjustment does not apply. Graph 10.2.8b shows the result of analysing the responses to this question alongside the fi rms’ responses to whether they intend to apply a Matching Adjustment.
The 8 fi rms that indicated that they intend to apply for Matching Adjustment as well as using the Volatility Adjustment on other business are predominantly providers with a high concentration of annuity business as well as a broad mix of other types of business.
Of those fi rms that do not intend to use the Volatility Adjustment, 7 are applying to use the Matching Adjustment and in some cases this would cover all or at least the majority of their business. A number of respondents indicated that they are still investigating the use of the Volatility Adjustment and some indicated that they do not think that the Volatility Adjustment would apply to unit linked business – although this is not something that is specifi cally noted in the rules.
We were surprised to see that such a large number of fi rms are not intending to use the Volatility Adjustment, although this could be to do with simplicity of approach given that the result without Volatility Adjustment also needs to be disclosed. Given the HM Treasury consultation which, at the time of writing, has just been released, it is not clear whether fi rms will need to apply to use the Volatility Adjustment. If this is the case, then this is likely to reduce the attractiveness of the adjustment.
147 TPS 2014
© 2014 KPMG LLP, a UK limited liability partnership, is a subsidiary of KPMG Europe LLP and a member firm of the KPMG network of independent member fi rms affiliated with KPMG International Cooperative, a Swiss entity. All rights reserved.

SOLVENCY II
Use of transitional provisions
Graph 10.2.9:
Do you intend to apply to use transitional provisions?
0
2
4
6
8
10
12
14
7
12
13
Num
ber o
f firm
s
0 0
Yes - technical provisions
Yes - risk free rate
Yes - other
No
Not yet decided
Of the 7 fi rms intending to apply for transitional provisions, 6 of these are large fi rms and the remainder is a niche fi rm who is impacted by Matching Adjustment rules. All of those that intend to apply for transitional provisions are intending to use the technical provision transitional, which is the broadest transitional provision.
A large number of respondents (13 out of 32) indicated that they have not yet decided whether they will apply for transitional provisions. This refl ects the uncertainty that still exists around Pillar 1 i.e. whether the Matching Adjustment will be granted. One respondent commented that they are only considering transitional provisions as a contingency plan. We are also aware of a number of other fi rms that are considering transitional provisions as a contingency plan depending on the ultimate position on other aspects of Pillar 1 that are currently uncertain. However, fi rms will need to make these decisions quickly as they will need to apply for approval and will also have had to give an indicative view of whether they intend to apply for this approval to the PRA earlier this year.
TPS 2014
© 2014 KPMG LLP, a UK limited liability partnership, is a subsidiary of KPMG Europe LLP and a member firm of the KPMG network of independent member fi rms affiliated with KPMG International Cooperative, a Swiss entity. All rights reserved.
148

SOLVENCY II
Highest priority part of the Solvency II programme
Graph 10.2.10:
Which part of the Solvency II programme is your current highest priority?
0
2
4
6
8
Pillar 1 methodology
Pillar 1 valuation
ORSA
Num
ber o
f firm
s
Embedding and Use Test
Analysing requirements of the QRT’s
Speed of reporting
0
8
3
0 1111
2
6 5
4
1 0 0
IMAP
Standard formula
Internal Model and Partial Internal Model
We asked respondents which part of their Solvency II program was currently their highest priority. We have not asked this question in previous years but we know from working with a number of clients on Solvency II over the years, that for large fi rms, the focus has shifted from Pillar 1 methodology and ORSA to Pillar 3 over the last year or so. Some smaller fi rms however have just started to consider the Pillar 1 methodology and valuation and the ORSA.
The results largely back up this general observation. For the large Internal Model or Partial Internal Model fi rms, their main focus is IMAP (8 out of 15), with the Pillar 3 requirements, including the speed of reporting (4 out of 15), being the next biggest concern. For the Standard Formula fi rms, the main concerns are around the ORSA (6 out of 17), the Pillar 1 valuation (5 out of 17) and the analysis of Pillar 3 requirements (4 out of 17). The results here are close, which may imply that the Standard Formula fi rms have only recently started to fully engage with Solvency II and are having to pick up their projects across all three pillars.
Only 2 respondents indicated that Pillar 1 methodology was their highest priority refl ecting that fi rms have now, in general, reached a point where their intended methodology is well defi ned and stable or that any uncertainties are dependent on external factors such as emerging regulation or regulatory approval. Interestingly, these two are Internal Model fi rms – it may be that the focus is on the documentation and validation of the methodology rather than the methodology itself.
149 TPS 2014
© 2014 KPMG LLP, a UK limited liability partnership, is a subsidiary of KPMG Europe LLP and a member firm of the KPMG network of independent member fi rms affiliated with KPMG International Cooperative, a Swiss entity. All rights reserved.

SOLVENCY II
Valuation and stress of pension scheme defi cit
Graph 10.2.11:
How do you value/stress your pension scheme deficit for the purpose of the Solvency II balance sheet and SCR?
11
1 1
5
IAS19 basis
Funding basis
Best estimate basis
Other
Not currently stressed
9
1
3
2
3
Solvency balance sheet
SCR
We asked survey participants what methodology they were planning to use to value their defi ned benefi t pension scheme under both the base Solvency II balance sheet and in the SCR. The results above are shown only for the 18 fi rms to whom this question is applicable.
The technical specifi cations for the various assessment exercises (including those for the preparatory phase, released on 30 April 2014) suggest that the IFRS (i.e. IAS19) valuation is consistent with the Solvency II requirements for the base balance sheet. This is the method adopted by most fi rms (62%). However, the funding basis is used by 5 fi rms, which has typically been a requirement of the current ICA regime.
One fi rm uses a funding basis in the base case and then stresses the IAS19 position and a further 2 fi rms use different (unspecifi ed) methods in their stress position compared to the base. In addition 2 do not currently stress the base position – both of these use IAS19 valuation in the base case.
TPS 2014
© 2014 KPMG LLP, a UK limited liability partnership, is a subsidiary of KPMG Europe LLP and a member firm of the KPMG network of independent member fi rms affiliated with KPMG International Cooperative, a Swiss entity. All rights reserved.
150

SOLVENCY II
Risks included when stressing pension scheme defi cit
Graph 10.2.12:
Which risks do you include when stressing your pension scheme defi cit on the Solvency II balance sheet?
Num
ber o
f firm
s
0
2
4
6
8
10
12
14
16
18
16
2
12
5
3
11 1313
17 18
14
0
Property riskInterest rate risk Equity risk Credit risk Currency riskInflation risk
Other Not applicableMortality risk Longevity risk Morbidity risk Expense risk
The Level 3 guidelines and the preparatory phase technical specifi cation have suggested that only market risks need to be stressed when calculating solvency risk capital on the pension scheme under the Standard Formula. However, it isn’t clear whether this will also be the case for an Internal Model calculation – we suspect it will not be the case given the PRA’s general requirement to stress non-market risks under the ICA regime.
From Graph 10.2.12, it is clear that the market risks are the most prevalent stress, but non market risks are also stressed by a large number of fi rms.
Additionally, we asked fi rms whether they allowed for pension scheme risk in their Solvency II Risk Margin calculation. The Solvency II Risk Margin calculation assumes a transfer of the insurance obligations of a fi rm to another (reference) fi rm. As the pension scheme is not a part of the insurance obligations, we were surprised that 20% of fi rms include pension scheme in their Solvency II Risk Margin calculation.
151 TPS 2014
© 2014 KPMG LLP, a UK limited liability partnership, is a subsidiary of KPMG Europe LLP and a member firm of the KPMG network of independent member fi rms affiliated with KPMG International Cooperative, a Swiss entity. All rights reserved.

SOLVENCY II
Overall Solvency II effect
Graph 10.2.13:
Please indicate the overall Solvency II effect for your company by comparing BEL + ICA to Solvency II BEL + RM + SCR
Broadley neutral Beneficial
Adverse, material Adverse, not material
11
11 4
4
We asked respondents what the overall impact of Solvency II was in comparison to ICA. i.e. comparing BEL + ICA to BEL + RM + SCR.
Half of the respondents indicated that they are worse off under Solvency II, and of those 15, 11 indicated that they are materially worse off. It is not a surprise that 8 of those 11 have over £1 billion of annuity liabilities.
The majority of the partial or full Internal Model fi rms (9 out of 14) are worse off under Solvency II than ICA. Given the alignment of ICA and SCR that has been observed, this refl ects the impact of the additional Risk Margin under Solvency II that is absent from the ICA regime.
10 of the 16 Standard Formula fi rms either indicated that they are better off under Solvency II or that the impact is broadly neutral. This indicates that for these fi rms there is a benefi t from replacing the ICA calibration by the Standard Formula calibration that offsets the inclusion of the Solvency II Risk Margin.
TPS 2014
© 2014 KPMG LLP, a UK limited liability partnership, is a subsidiary of KPMG Europe LLP and a member firm of the KPMG network of independent member fi rms affiliated with KPMG International Cooperative, a Swiss entity. All rights reserved.
152

SOLVENCY II
Solvency II Risk Margin as a proportion of SCR for non-profi t business
Graph 10.2.14:
What is the proportion of your Solvency II Risk Margin to your post-diversification SCR for your NP fund?
0
1
2
3
4
5
3 3 3
1
5
4 4
2 2
Mea
n nu
mbe
r of fi
rms
0% ≤ RM < 15%
15% ≤ RM < 20%
20% ≤ RM < 25%
25% ≤ RM < 30%
30% ≤ RM < 35%
35% ≤ RM < 40%
40% ≤ RM < 45%
45% ≤ RM < 50%
RM ≥ 50%
We asked respondents what their Solvency II Risk Margin as a proportion of SCR is for non-profit business. As Graph 10.2.14 shows we received a wide range of responses that are fairly evenly distributed between 0% and over 50%. As the cost of capital is defined as 6%, the variability must be because of differences in the mix of business, the run-off methodology used, as well as differences in the run-off profile driven by the demographics of the book. We aware that a number of firms are using different techniques, the most common being a risk driver approach which can be either fi xed or time dependent. Other approaches taken include using proxies such as BEL or assets as well as a full projection of the base and stressed balance sheet.
153 TPS 2014
© 2014 KPMG LLP, a UK limited liability partnership, is a subsidiary of KPMG Europe LLP and a member firm of the KPMG network of independent member fi rms affiliated with KPMG International Cooperative, a Swiss entity. All rights reserved.

SOLVENCY II
Management actions resulting in a zero SCR for with-profi ts business
Graph 10.2.15:
Does your ability to apply future management actions mean that you have a zero SCR for with-profits business (excluding operational risk)
11%
89%
Ye s
No
We asked respondents whether the application of management actions means that they have a zero SCR for with-profi ts business other than operational risk.
Under Solvency II, the adjustment for the loss absorbency of technical provisions allows a fi rm to reduce the SCR by the amount of loss absorbency i.e. the discretionary element of the BEL that can be removed if a stress scenario occurred. If the discretionary element of the BEL is greater than the Basic SCR then fi rms can report a zero SCR other than the SCR for operational risk which is added to the Basic SCR after the adjustment for loss absorbency of technical provisions is applied.
Under the current regulatory regime, closed with-profi ts funds typically show zero RCM in PRA Form 19 where they have a management action to remove discretionary liabilities in the stress scenario, and this discretionary element is greater than the RCM.
Only 2 fi rms indicated that they expect they will have a zero SCR once management actions are allowed for under Solvency II. Of the 18 fi rms that indicated this question was applicable, 6 fi rms currently show a zero RCM for all of their funds and a further 3 fi rms show a zero RCM for the majority of their funds. This indicates that either funds are not applying the same management actions for Solvency II or that the SCR under Solvency II is signifi cantly more onerous than the current RCM.
For those firms that are in run-off and that are distributing their estate this will have significant implications; in particular, the distribution of their estate in a fair manner, whilst remaining solvent throughout the run-off.
TPS 2014
© 2014 KPMG LLP, a UK limited liability partnership, is a subsidiary of KPMG Europe LLP and a member firm of the KPMG network of independent member fi rms affiliated with KPMG International Cooperative, a Swiss entity. All rights reserved.
154

SOLVENCY II
Differences in treatment between economic capital and Solvency II calculations
Graph 10.2.16:
Which of the following areas do you treat differently when performing Economic Capital versus Solvency II calculations?
Num
ber o
f firm
s
Treatment of subordinated debt
0
2
4
6
8
10
12
14
16
18
20
14 14
6
9 9
4
21
14
19
2
13
00
Risk free rate Contract boundaries Risk margin cost of capital charge
Treatment of asset managers Treatment of pension US equivalence DTA allowance scheme risk
Matching adjustment More management actions in SII
Credit risk adjustment Volatility adjustment
More management actions Other in economic capital
We asked respondents which areas they treat differently between their internal economic capital calculations and Solvency II calculations. As expected, the key areas where the treatment differs is the discount rate (including Matching Adjustment / liquidity premium allowance, Volatility Adjustment, credit risk adjustment), contract boundaries, the cost of capital charge and the treatment of pension scheme risk.
These are the known areas of difference between current ICA and the proposed Solvency II requirements; therefore these are generally in line with our expectations. It is interesting to note that 2 fi rms adopt more management actions in their economic capital calculation (potentially due to there being less rigorous requirements around justifying the actions) and one fi rm adopts more management actions in Solvency II.
155 TPS 2014
© 2014 KPMG LLP, a UK limited liability partnership, is a subsidiary of KPMG Europe LLP and a member firm of the KPMG network of independent member fi rms affiliated with KPMG International Cooperative, a Swiss entity. All rights reserved.

SOLVENCY II
10.3 PROFIT AND LOSS ATTRIBUTION
Items covered by Profit and Loss Attribution
Graph 10.3.1:
Which items will your Profit and L oss Attribution cover?
0
5
10
15
20
25
22
15 12
1
6
15
Num
ber o
f firm
s
Best estimate liability
Risk Margin
SCR
MCR
Assets
Own funds only
The Profi t & Loss Attribution allows a fi rm to defi ne what profi t and loss is and could, for example, either include or exclude capital requirements.
We asked about the granularity of the analysis performed. It is clear that there are various different approaches, with 6 fi rms only considering the change in Own Funds (i.e. not drilling into any more detail) and others considering the change in best estimate liabilities, Solvency II Risk Margin and assets.
There are 12 fi rms who include the SCR in their Profi t & Loss Attribution. Although a change in SCR is likely to be required by Boards and/or senior management to understand the reasons for the movements, it is not a Solvency II requirement. Of those 12 fi rms, 7 are large internal (or partial internal) model fi rms and may have been performing such analyses on an ICA basis.
TPS 2014
© 2014 KPMG LLP, a UK limited liability partnership, is a subsidiary of KPMG Europe LLP and a member firm of the KPMG network of independent member fi rms affiliated with KPMG International Cooperative, a Swiss entity. All rights reserved.
156

SOLVENCY II
Methodology used to quantify the movements
Graph 10.3.2:
If you analyse the change in Risk Margin or SCR, how do you quantify the movements within your Profit and Loss Attribution?
5
31
6
3
4
1
4
Change in Solvency II Risk Margin
Change in SCR
Ratio in line with BEL movements
Perform full model runs
Use sensitivity runs and ratio these to observed events
Other
We asked respondents what methodology they used to analyse the Solvency II Risk Margin and the SCR. We have presented the results of those who indicated that they perform this analysis based on the previous question.
For Solvency II Risk Margin purposes, the most widely used method appears to be to approximate by using a ratio in line with the movements in best estimate liability. However, 3 fi rms do perform full model runs to analyse the change – these are either Standard Formula or small Partial Internal Model fi rms. The “other” responses largely indicated that the methodology is still to be developed.
For the change in SCR, the most widely used method was to use full model runs. These are the same 3 firms mentioned above, but also one of the large Internal Model firms. This was unexpected, given how onerous this calculation is likely to be. Similarly, the “other” responses indicated that the methodology is still to be developed.
157 TPS 2014
© 2014 KPMG LLP, a UK limited liability partnership, is a subsidiary of KPMG Europe LLP and a member firm of the KPMG network of independent member fi rms affiliated with KPMG International Cooperative, a Swiss entity. All rights reserved.
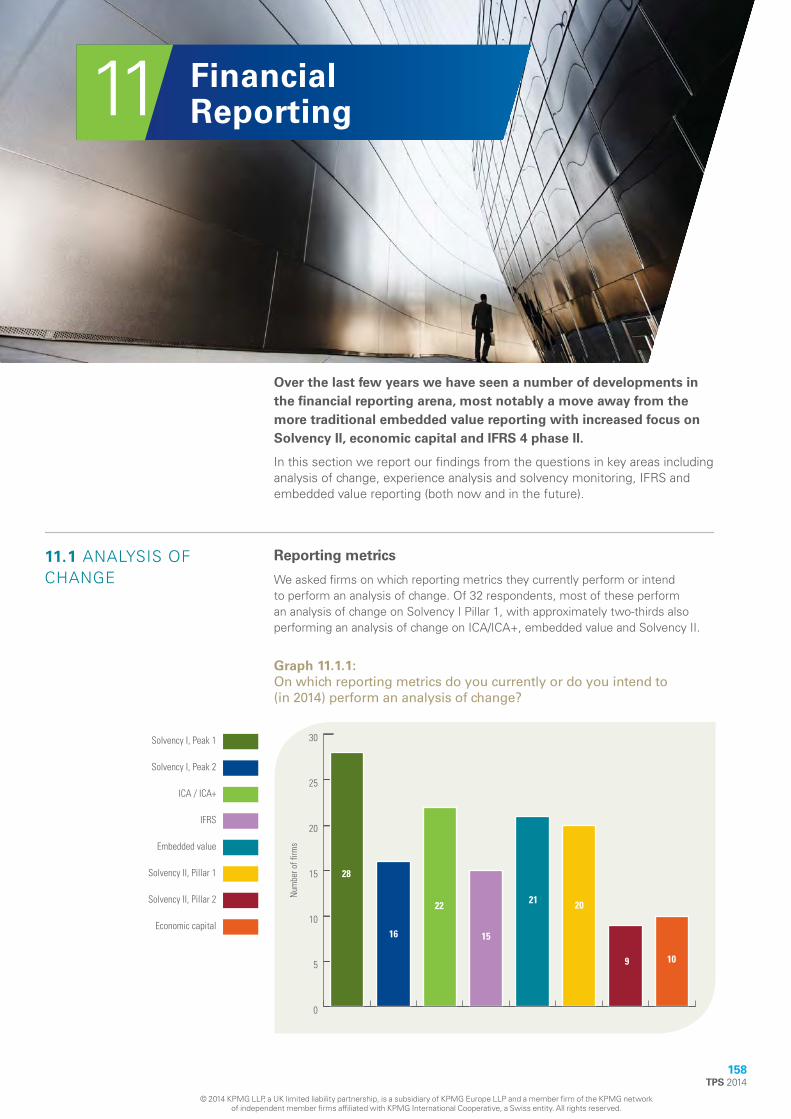
11 Financial Reporting
Over the last few years we have seen a number of developments in
the financial reporting arena, most notably a move away from the
more traditional embedded value reporting with increased focus on
Solvency II, economic capital and IFRS 4 phase II.
In this section we report our fi ndings from the questions in key areas including analysis of change, experience analysis and solvency monitoring, IFRS and embedded value reporting (both now and in the future).
11.1 ANALYSIS OF CHANGE
Reporting metrics
We asked fi rms on which reporting metrics they currently perform or intend to perform an analysis of change. Of 32 respondents, most of these perform an analysis of change on Solvency I Pillar 1, with approximately two-thirds also performing an analysis of change on ICA/ICA+, embedded value and Solvency II.
Graph 11.1.1:
On which reporting metrics do you currently or do you intend to (in 2014) perform an analysis of change?
0
5
10
15
20
25
30
109
2021
15
22
16
28
Num
ber o
f firm
s
TPS 2014
© 2014 KPMG LLP, a UK limited liability partnership, is a subsidiary of KPMG Europe LLP and a member firm of the KPMG network of independent member fi rms affiliated with KPMG International Cooperative, a Swiss entity. All rights reserved.
158
Solvency I, Peak 1
Solvency I, Peak 2
ICA / ICA+
IFRS
Embedded value
Solvency II, Pillar 1
Solvency II, Pillar 2
Economic capital
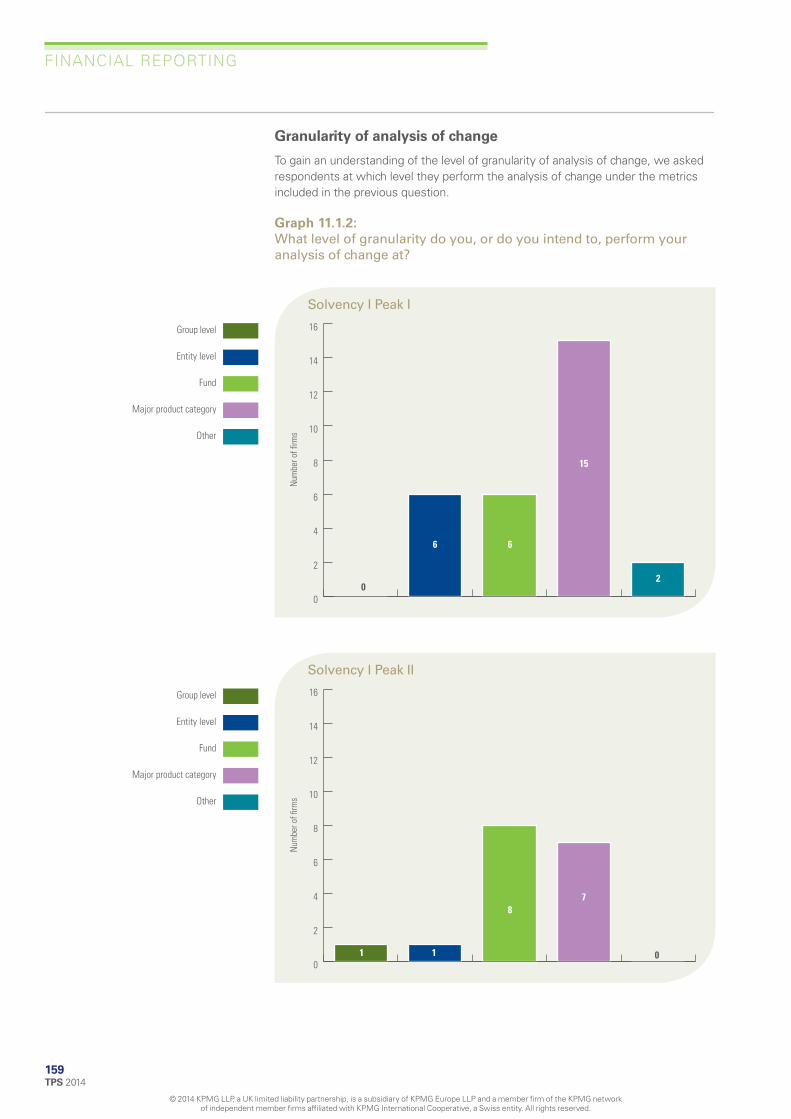
FINANCIAL REPORTING
Granularity of analysis of change
To gain an understanding of the level of granularity of analysis of change, we asked respondents at which level they perform the analysis of change under the metrics included in the previous question.
Graph 11.1.2:
What level of granularity do you, or do you intend to, perform your analysis of change at?
0
2
4
6
8
10
12
14
16
Num
ber o
f firm
s
Group level
Entity level
Fund
Major product category
Other
66
15
2 0
Solvency I Peak I
0
2
4
6
8
10
12
14
16
Num
ber o
f firm
s
Group level
Entity level
Fund
Major product category
Other
8
1 1
7
0
Solvency I Peak II
159 TPS 2014
© 2014 KPMG LLP, a UK limited liability partnership, is a subsidiary of KPMG Europe LLP and a member firm of the KPMG network of independent member fi rms affiliated with KPMG International Cooperative, a Swiss entity. All rights reserved.

FINANCIAL REPORTING
Graph 11.1.2 (continued):
What level of granularity do you, or do you intend to, perform your analysis of change at?
0
2
4
6
8
10
12
14
16 N
umbe
r of fi
rms
Group level
Entity level
Fund
Major product category
Other
7
1 2
11
2
ICA/ICA+
0
2
4
6
8
10
12
14
16
Num
ber o
f firm
s
Group level
Entity level
Fund
Major product category
Other
32
9
10
IFRS
TPS 2014
© 2014 KPMG LLP, a UK limited liability partnership, is a subsidiary of KPMG Europe LLP and a member firm of the KPMG network of independent member fi rms affiliated with KPMG International Cooperative, a Swiss entity. All rights reserved.
160

FINANCIAL REPORTING
Graph 11.1.2 (continued):
What level of granularity do you, or do you intend to, perform your analysis of change at?
0
2
4
6
8
10
12
14
16
Num
ber o
f firm
s
Group level
Entity level
Fund
Major product category
Other
4
2 2
12
1
Embedded Value
0
2
4
6
8
10
12
14
16
Num
ber o
f firm
s
Group level
Entity level
Fund
Major product category
Other
4 3
2
10
1
Solvency II Pillar I
161 TPS 2014
© 2014 KPMG LLP, a UK limited liability partnership, is a subsidiary of KPMG Europe LLP and a member firm of the KPMG network of independent member fi rms affiliated with KPMG International Cooperative, a Swiss entity. All rights reserved.

FINANCIAL REPORTING
Graph 11.1.2 (continued):
What level of granularity do you, or do you intend to, perform your analysis of change at?
0
2
4
6
8
10
12
14
16
Num
ber o
f firm
s
Group level
Entity level
Fund
Major product category
Other
4
2
5
1 1
Solvency II Pillar II
Group level
Entity level
Fund
Major product category
Other
0
2
4
6
8
10
12
14
16
Num
ber o
f firm
s
2
6
1 1 1
Economic Capital
Across the different reporting metrics, by far the most widely used level of granularity is at the major product category. This is a change from last year when majority of respondents were performing the analysis of change at entity or fund level. This change may be driven by the Solvency II profi t and loss requirements.
TPS 2014
© 2014 KPMG LLP, a UK limited liability partnership, is a subsidiary of KPMG Europe LLP and a member firm of the KPMG network of independent member fi rms affiliated with KPMG International Cooperative, a Swiss entity. All rights reserved.
162

FINANCIAL REPORTING
11.2 THE MOST IMPORTANT METRIC TO THE BOARD
The responses to this question indicate that the Board currently gives most weight to IFRS results closely followed by ICA/ICA+ results. It is interesting to note that embedded value was the joint most widely used measure in last year’s survey; however it appears to have had a signifi cant decline in importance to the Board over the last year.
Unsurprisingly, Solvency II and economic capital stand out as being the dominant metrics in the future.
Graph 11.2.1:
What metric is currently given the most weight by Board and senior management, and which do you expect to be in the future?
163 TPS 2014
© 2014 KPMG LLP, a UK limited liability partnership, is a subsidiary of KPMG Europe LLP and a member firm of the KPMG network of independent member fi rms affiliated with KPMG International Cooperative, a Swiss entity. All rights reserved.
Num
ber o
f firm
s
0
2
4
6
8
10
12
14
16
18
5
8
10
4 4 3 3
8
11
2 1 1 1
Solvency I, peak 1
Solvency I, peak 2
ICA / ICA+ IFRS Embedded value Solvency II, Pillar 1
Solvency II, Pillar 2
Economic capital
Other
0 0000
Currently In the future
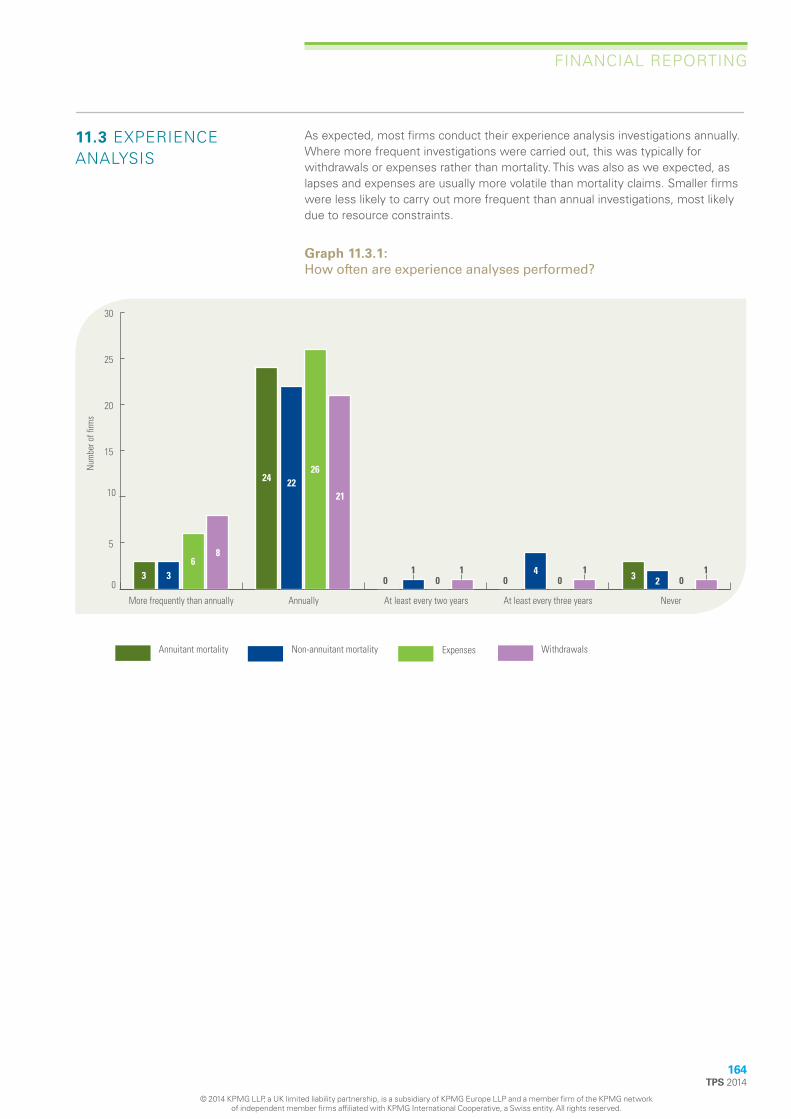
FINANCIAL REPORTING
11.3 EXPERIENCE ANALYSIS
As expected, most fi rms conduct their experience analysis investigations annually. Where more frequent investigations were carried out, this was typically for withdrawals or expenses rather than mortality. This was also as we expected, as lapses and expenses are usually more volatile than mortality claims. Smaller fi rms were less likely to carry out more frequent than annual investigations, most likely due to resource constraints.
Graph 11.3.1:
How often are experience analyses performed?
TPS 2014
© 2014 KPMG LLP, a UK limited liability partnership, is a subsidiary of KPMG Europe LLP and a member firm of the KPMG network of independent member fi rms affiliated with KPMG International Cooperative, a Swiss entity. All rights reserved.
164
Num
ber o
f firm
s
0
5
10
15
20
25
30
234
21
26 2224
8 6
33
More frequently than annually Annually At least every two years At least every three years Never
1 1 1 1 0 0 0 00
Annuitant mortality Non-annuitant mortality WithdrawalsExpenses

FINANCIAL REPORTING
11.4 SOLVENCY MONITORING
This part of the survey focuses on how respondents monitor each of their solvency capital measures both in terms of frequency and approximation of modelling.
Frequency of Solvency I monitoring
The PRA expects life insurers to continuously monitor and meet their capital resource requirements. Under INSPRU, insurers must also continually monitor their solvency.
Graph 11.4.1a:
How frequently are you monitoring your Solvency I Pillar 1 capital measure?
165 TPS 2014
© 2014 KPMG LLP, a UK limited liability partnership, is a subsidiary of KPMG Europe LLP and a member firm of the KPMG network of independent member fi rms affiliated with KPMG International Cooperative, a Swiss entity. All rights reserved.
Num
ber o
f firm
s
0
5
10
15
20
4
1 1
18
5
2
11 11
4
Daily Weekly Monthly Quarterly Half-yearly Annually
0 0 0
Via approximation Via full quantification

FINANCIAL REPORTING
Graph 11.4.1b:
How frequently are you monitoring your Solvency I Pillar 2 capital measure?
Num
ber o
f firm
s
0
5
10
15
20
4
1 1
7
12 11
3
Daily Weekly Monthly Quarterly Half-yearly Annually
0 0 0 0 0
Via approximation Via full quantification
On a Pillar 1 basis most respondents carry out full quantifi cation on either a half-yearly or a quarterly basis, with approximate methods being used to monitor solvency more frequently than this. A similar pattern is observed on the Pillar 2 basis (i.e. ICA), although it is noted that fewer respondents carry out full quantifi cations on a quarterly basis.
It is expected that the approximations will include a subset of risks being monitored more frequently than on a full calculation. These include for example equity, interest rates and credit risks. The derivation of the approximation is likely to be related to movements in particular market indices and other market movements.
TPS 2014
© 2014 KPMG LLP, a UK limited liability partnership, is a subsidiary of KPMG Europe LLP and a member firm of the KPMG network of independent member fi rms affiliated with KPMG International Cooperative, a Swiss entity. All rights reserved.
166
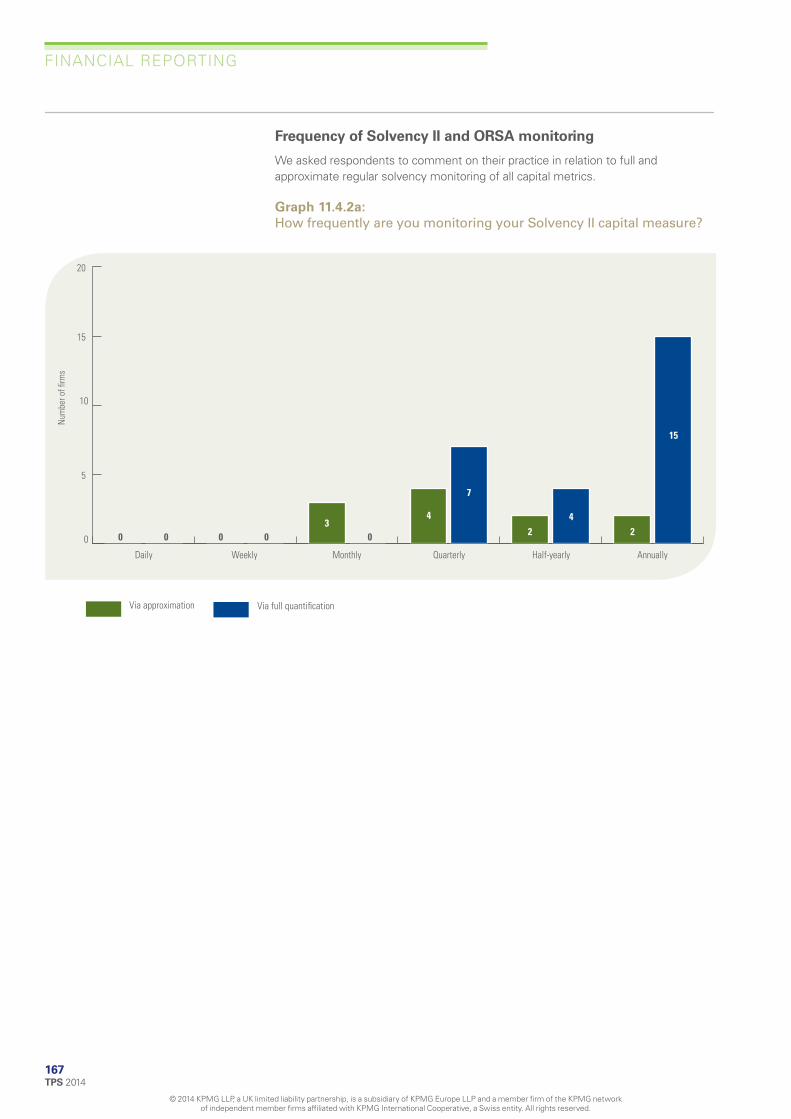
FINANCIAL REPORTING
Frequency of Solvency II and ORSA monitoring
We asked respondents to comment on their practice in relation to full and approximate regular solvency monitoring of all capital metrics.
Graph 11.4.2a:
How frequently are you monitoring your Solvency II capital measure?
167 TPS 2014
© 2014 KPMG LLP, a UK limited liability partnership, is a subsidiary of KPMG Europe LLP and a member firm of the KPMG network of independent member fi rms affiliated with KPMG International Cooperative, a Swiss entity. All rights reserved.
Num
ber o
f firm
s
0
5
10
15
20
2 2
7
3 4
15
Daily Weekly Monthly Quarterly Half-yearly Annually
00 00 0
4
Via approximation Via full quantification

FINANCIAL REPORTING
Graph 11.4.2b:
How frequently are you monitoring your ORSA capital measure?
Num
ber o
f firm
s
0
5
10
15
20
2
6
4
1111
20
Daily Weekly Monthly Quarterly Half-yearly Annually
0000
Via approximation Via full quantification
Just over half of the respondents are monitoring Solvency II Pillar 1 via full quantifi cation on an annual basis, with the rest of the respondents performing half-yearly or quarterly calculations.
A greater proportion of respondents are monitoring the ORSA via full quantifi cation on an annual basis, i.e. there is less monitoring of the ORSA carried out half-yearly or quarterly.
There is limited monitoring of either Solvency II Pillars via approximate methods, which indicates that respondents are still developing these processes.
TPS 2014
© 2014 KPMG LLP, a UK limited liability partnership, is a subsidiary of KPMG Europe LLP and a member firm of the KPMG network of independent member fi rms affiliated with KPMG International Cooperative, a Swiss entity. All rights reserved.
168

FINANCIAL REPORTING
Frequency of Economic Capital monitoring
Graph 11.4.3:
How frequently are you monitoring your Economic Capital?
Num
ber o
f firm
s
0
5
10
15
20
8 5
1
4
11
1211
Daily Weekly Monthly Quarterly Half-yearly Annually
0000
Via approximation Via full quantification
Our survey has shown that half of the respondents monitor their economic capital (via a full quantifi cation) more frequently than annually. The remaining half performs a full calculation on an annual basis.
Monthly monitoring is typically performed via approximation
169 TPS 2014
© 2014 KPMG LLP, a UK limited liability partnership, is a subsidiary of KPMG Europe LLP and a member firm of the KPMG network of independent member fi rms affiliated with KPMG International Cooperative, a Swiss entity. All rights reserved.

FINANCIAL REPORTING
11.5 IFRS 4, PHASE II Preparation for changes
In this section, respondents were asked about the proposed changes to IFRS reporting and their status of preparedness. Approximately two-thirds of the respondents are aware of the changes in IFRS 4 phase II but few have started to understand the balance sheet impacts, the system implications or the programme management requirements to implement this. Those who have started to understand the implications tend to be either large firms or subsidiaries of large fi rms.
Graph 11.5.1:
To what extent are you prepared for the changes in IFRS accounting for insurance contracts (IFRS 4)
TPS 2014
© 2014 KPMG LLP, a UK limited liability partnership, is a subsidiary of KPMG Europe LLP and a member firm of the KPMG network of independent member fi rms affiliated with KPMG International Cooperative, a Swiss entity. All rights reserved.
170
Aware of changes, but not started to consider the implications
Started to think through the numerical impacts on the balance sheet, emergence of profit etc
Started to think through the system implications
Started to think through the programme management implications
Haven't given this any consideration
0
5
10
15
20
20
3
1 1
5
Num
ber o
f firm
s

FINANCIAL REPORTING
Areas causing most concern
In June 2013, the IASB re-exposed the draft standard for IFRS 4 phase II and specifi cally asked for feedback on following six areas,
• the use of other comprehensive income, • unlocking of the contractual service margin (CSM), • mirroring, • presentation, • transitional arrangements; and, • the complexity and clarity of drafting.
We asked respondents which of the above areas were the cause of most concern and the 3 areas causing most concern were presentation, complexity and clarity of drafting, and unlocking of the CSM.
Graph 11.5.2:
Rank the following topics in order of greatest concern under IFRS 4 phase 2
0
2
4
6
8
10
5 5 4
Num
ber o
f firm
s
1
OCI
171 TPS 2014
© 2014 KPMG LLP, a UK limited liability partnership, is a subsidiary of KPMG Europe LLP and a member firm of the KPMG network of independent member fi rms affiliated with KPMG International Cooperative, a Swiss entity. All rights reserved.
High cause for concern
Moderate cause for concern
Low cause for concern
No cause for concern
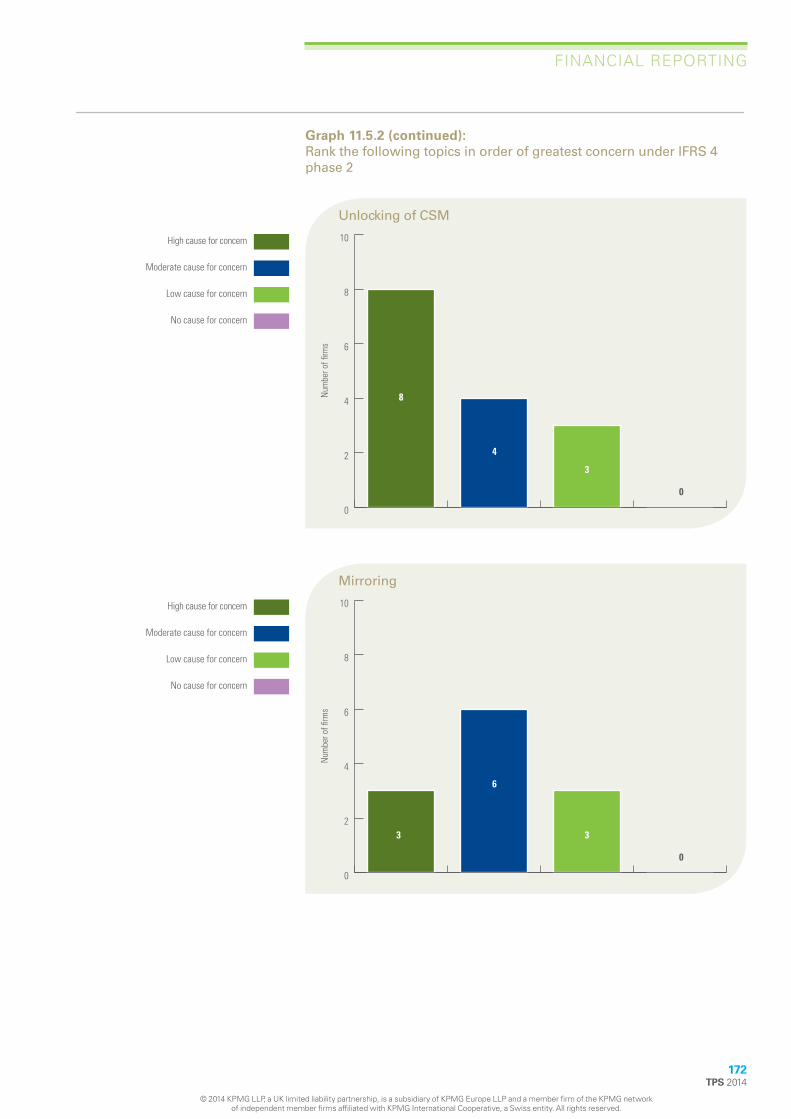
FINANCIAL REPORTING
Graph 11.5.2 (continued):
Rank the following topics in order of greatest concern under IFRS 4 phase 2
0
2
4
6
8
10
8
4
3
Num
ber o
f firm
s
High cause for concern
Moderate cause for concern
Low cause for concern
No cause for concern
0
Unlocking of CSM
0
2
4
6
8
10
6
33
Num
ber o
f firm
s
High cause for concern
Moderate cause for concern
Low cause for concern
No cause for concern
0
Mirroring
TPS 2014
© 2014 KPMG LLP, a UK limited liability partnership, is a subsidiary of KPMG Europe LLP and a member firm of the KPMG network of independent member fi rms affiliated with KPMG International Cooperative, a Swiss entity. All rights reserved.
172

FINANCIAL REPORTING
Graph 11.5.2 (continued):
Rank the following topics in order of greatest concern under IFRS 4 phase 2
0
2
4
6
8
10
10
3
4
Num
ber o
f firm
s
High cause for concern
Moderate cause for concern
Low cause for concern
No cause for concern
0
Presentation
0
2
4
6
8
10
7
5
3
Num
ber o
f firm
s
High cause for concern
Moderate cause for concern
Low cause for concern
No cause for concern
2
Transitional arrangements
173 TPS 2014
© 2014 KPMG LLP, a UK limited liability partnership, is a subsidiary of KPMG Europe LLP and a member firm of the KPMG network of independent member fi rms affiliated with KPMG International Cooperative, a Swiss entity. All rights reserved.

FINANCIAL REPORTING
Graph 11.5.2 (continued):
Rank the following topics in order of greatest concern under IFRS 4 phase 2
0
2
4
6
8
10
10
2
4
Num
ber o
f firm
s
1
Complexity and clarity of drafting
High cause for concern
Moderate cause for concern
Low cause for concern
No cause for concern
The CSM is a new component to the balance sheet and there isn’t an equivalent component under existing balance sheets, so it is not surprising that this is a cause for concern. There are also a number of new presentational requirements which will lead to process, data and system changes; hence it is understandable that this features heavily in the results.
The re-exposure draft issued in 2013 is generally considered to be one of the most complex set of accounting requirements to be issued by the IASB, hence the IASB have said that they will allow approximately 3 years from issuing the fi nal standard to the implementation date. The concerns over the complexity are refl ected in the results above.
TPS 2014
© 2014 KPMG LLP, a UK limited liability partnership, is a subsidiary of KPMG Europe LLP and a member firm of the KPMG network of independent member fi rms affiliated with KPMG International Cooperative, a Swiss entity. All rights reserved.
174

FINANCIAL REPORTING
11.6 CURRENT EMBEDDED VALUE REPORTING
Out of the 32 respondents to the survey, 63% (20) currently compute an embedded value, with the majority of these fi rms disclosing results externally. 37% do not currently compute an embedded value, of which over half are mutual fi rms.
These results are largely unchanged from last year.
Graph 11.6.1:
Do you currently compute an embedded value?
37%
47%
16%
Yes – disclosed externally
Yes – for internal use only
No
The type of embedded value balance sheet produced is shown below. This shows that there is a variety of methods being used, with no single dominant approach being adopted in the market. Compared to last year, there are now more fi rms adopting full Market Consistent Embedded Values or Market Consistent European Embedded Values.
Graph 11.6.2:
What type of embedded value do you currently use?
35%
20%
20%
25%
175 TPS 2014
© 2014 KPMG LLP, a UK limited liability partnership, is a subsidiary of KPMG Europe LLP and a member firm of the KPMG network of independent member fi rms affiliated with KPMG International Cooperative, a Swiss entity. All rights reserved.
Market Consistent Embedded Value (full – in line with CFO Forum Principles)
Market Consistent European Embedded Value
Traditional European Embedded Value
Traditional Embedded Value
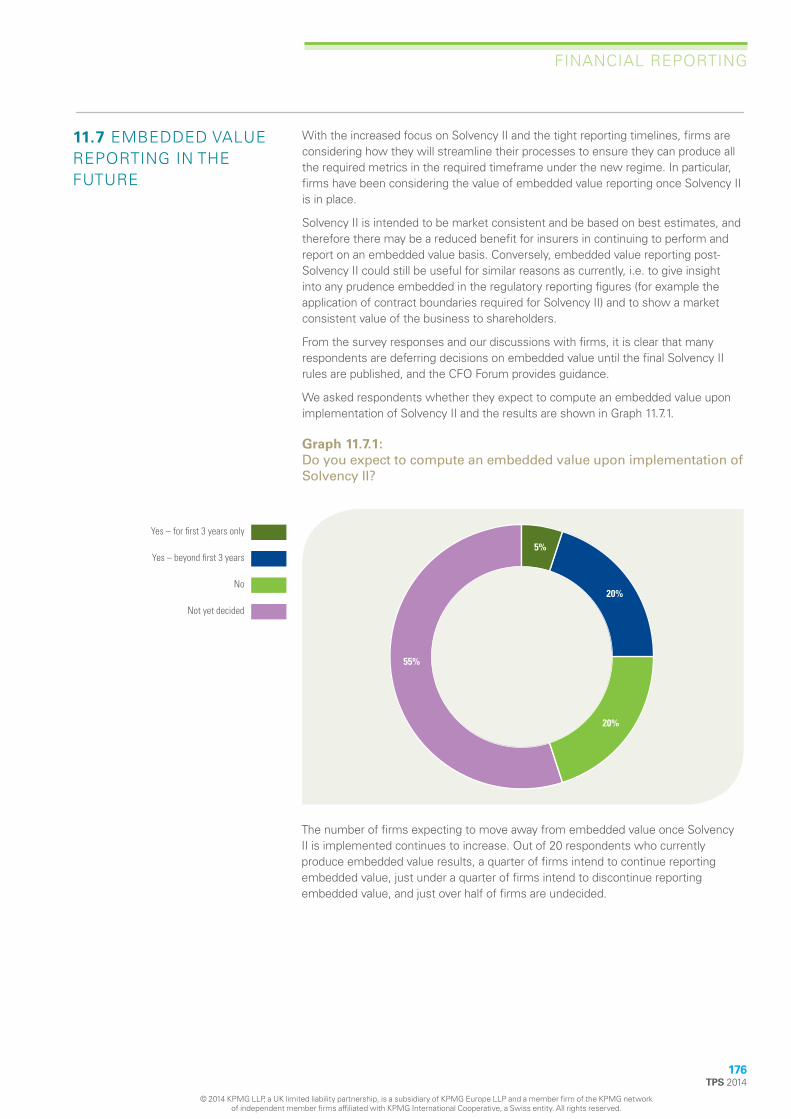
FINANCIAL REPORTING
11.7 EMBEDDED VALUE REPORTING IN THE FUTURE
With the increased focus on Solvency II and the tight reporting timelines, fi rms are considering how they will streamline their processes to ensure they can produce all the required metrics in the required timeframe under the new regime. In particular, fi rms have been considering the value of embedded value reporting once Solvency II is in place.
Solvency II is intended to be market consistent and be based on best estimates, and therefore there may be a reduced benefi t for insurers in continuing to perform and report on an embedded value basis. Conversely, embedded value reporting post-Solvency II could still be useful for similar reasons as currently, i.e. to give insight into any prudence embedded in the regulatory reporting fi gures (for example the application of contract boundaries required for Solvency II) and to show a market consistent value of the business to shareholders.
From the survey responses and our discussions with fi rms, it is clear that many respondents are deferring decisions on embedded value until the fi nal Solvency II rules are published, and the CFO Forum provides guidance.
We asked respondents whether they expect to compute an embedded value upon implementation of Solvency II and the results are shown in Graph 11.7.1.
Graph 11.7.1:
Do you expect to compute an embedded value upon implementation of Solvency II?
20%
20%
55%
5%
Yes – for first 3 years only
Yes – beyond first 3 years
No
Not yet decided
The number of fi rms expecting to move away from embedded value once Solvency II is implemented continues to increase. Out of 20 respondents who currently produce embedded value results, a quarter of fi rms intend to continue reporting embedded value, just under a quarter of fi rms intend to discontinue reporting embedded value, and just over half of fi rms are undecided.
TPS 2014
© 2014 KPMG LLP, a UK limited liability partnership, is a subsidiary of KPMG Europe LLP and a member firm of the KPMG network of independent member fi rms affiliated with KPMG International Cooperative, a Swiss entity. All rights reserved.
176

FINANCIAL REPORTING
11.8 KEY DIFFERENCES BETWEEN EMBEDDED VALUE REPORTING AND SOLVENCY II IN THE FUTURE
Differences between PVFP and Solvency II BEL
For respondents that currently produce an embedded value balance sheet, we asked about the differences in assumptions that will exist between those used to calculate PVFP and Solvency II BEL.
Graph 11.8.1:
What differences in assumptions will there be between those used to calculate your embedded value PVFP and your Solvency II BEL?
0
2
4
6
8
10
12
14
16
9
Num
ber o
f firm
s
7
13
9
5
Embedded value will use a different risk free rate curve to Solvency II
Embedded value will use different liquidity premium assumptions to Solvency II
Embedded value will use different contract boundary definitions to Solvency II
Embedded value will use different investment returns assumptions to Solvency II
Other differences
The contract boundaries assumption continues to be the assumption change most commonly made, followed closely by economic assumptions.
Generally we are seeing a lower number of respondents making a change between the Solvency II and embedded value metrics; however this may simply refl ect the fact that fewer respondents intend to produce an embedded value balance sheet after the implementation of Solvency II.
177 TPS 2014
© 2014 KPMG LLP, a UK limited liability partnership, is a subsidiary of KPMG Europe LLP and a member firm of the KPMG network of independent member fi rms affiliated with KPMG International Cooperative, a Swiss entity. All rights reserved.

FINANCIAL REPORTING
Differences between CNHR and Solvency II Risk Margin
We also asked respondents how their embedded value CNHR will differ from the Solvency II Risk Margin, with results shown below.
Graph 11.8.2:
How will your CNHR differ from the Solvency II Risk Margin
0
2
4
6
8
10
4
Num
ber o
f firm
s
9
6 7
5
Different risks assumed to be non hedgeable
Different cost of capital assumption used
Different diversification benefits used
CNHR not calculated
Other
Out of 20 respondents, 45% of respondents (9) indicated they will use a different cost of capital assumption. 30% of respondents (6) indicated they will use different diversifi cation benefi ts. All of those using different diversifi cation benefi ts are also using a different cost of capital assumption.
TPS 2014
© 2014 KPMG LLP, a UK limited liability partnership, is a subsidiary of KPMG Europe LLP and a member firm of the KPMG network of independent member fi rms affiliated with KPMG International Cooperative, a Swiss entity. All rights reserved.
178

12 Tax
179 TPS 2014
© 2014 KPMG LLP, a UK limited liability partnership, is a subsidiary of KPMG Europe LLP and a member firm of the KPMG network of independent member fi rms affiliated with KPMG International Cooperative, a Swiss entity. All rights reserved.
A balance sheet drawn up under any reporting basis should generally
include deferred tax balances. The Solvency II economic balance sheet
is no exception. Furthermore, tax has an important role to play in the
calculation of the Solvency II SCR, which requires the deferred tax
balances which would appear on a hypothetical post-stress balance
sheet to be computed. The movement in the deferred tax balances
relative to the Solvency II economic balance sheet is referred to as
the loss absorbing capacity of deferred taxes (‘LADT’) and has the
potential to materially mitigate the overall capital requirement under
Solvency II.
There has been increased regulatory focus on tax during 2014, with the PRA releasing Supervisory Statement 2/14 – “Solvency II: recognition of deferred tax” in April and the draft guidance on the Standard Formula LADT, published by EIOPA on 2 June.
While there remain areas of uncertainty, it is becoming clear that large tax credits and/or net deferred tax assets (‘DTAs’) will be a particular area of scrutiny for supervisors. Accordingly, fi rms are assessing the sources and quality of the evidence that supports their LADT, particularly where future profi ts are assumed.
One of our principal observations in this section of the survey is that around half of respondents are recognising net DTAs on their stressed balance sheet. That is broadly in line with last year but there is some evidence of developments in methodology – for example a shift towards relying on a partial release of the Solvency II Risk Margin (as opposed to a full release) as a source of future profi ts.
The fi rst four questions in this chapter consider the calculation of the LADT and the support of the deferred tax position on the post-stress balance sheet; the next two questions consider changes to the methodology in future periods and how tax is dealt with by the Internal Model; the fi nal question concerns the consistency of tax methodologies across different reporting bases.

TA X
12.1 DEFERRED TAX ON THE STRESSED BALANCE SHEET
Treatment of non-zero loss absorbency of tax
The LADT component of the SCR can be thought of as the tax credit which arises as a consequence of the shock event(s) assumed when deriving the SCR. The loss arising from a shock event potentially gives rise to a DTA, which can only be valued to the extent it can be offset against appropriate deferred tax liabilities (‘DTLs’) on the economic balance sheet or to the extent that there is evidence of future profi ts, in line with IAS 12.
In cases where a LADT was calculated in respect of the whole business (or a signifi cant part of the business), we were interested to know the extent to which this LADT was recognised. Graph 12.1.1 sets out the responses to this question. As can be seen, there was a wide range of practices:
Graph 12.1.1:
If for a significant part of your business a non-zero loss absorbency of tax (LADT) is calculated, is that LADT:
32
2
1
7 2
4
Fully recognised on that basis that it was less than the deferred tax liability (DTL) on
unstressed balance sheet
Capped at the level of the DTL on the unstressed balance sheet
Supported by reference to DTLs and prior year income or profits
Supported by reference to future profits (in addition to first four items above)
Supported by reference to future management actions and/or future tax planning
(in addition to the first five items above)
Recognised at the full tax rate but not fully tested
Other
Of the 21 respondents who did not select n/a to this question, 43% (nine) of them indicated that their position was supported by a relatively conservative methodology (i.e. with shock losses offset against DTLs and prior year profi ts and no net DTA being recognised). In 4 of these cases, the LADT was capped at the level of the DTL implying that perhaps there would be scope to recognise a larger LADT if future profi ts were also anticipated.
In contrast, eight of the relevant respondents (38%) also relied on future profi ts to support the LADT and in one case this included future management actions or tax planning.
Taking full credit for the LADT without testing whether it can be supported in full remains a minority practice. “Other” responses referred to the movement in unrealised capital gains and capped at the future tax payments projected by the valuation model.
Overall, the broad pattern of practices was consistent with the 2012 and 2013 surveys.
TPS 2014
© 2014 KPMG LLP, a UK limited liability partnership, is a subsidiary of KPMG Europe LLP and a member firm of the KPMG network of independent member fi rms affiliated with KPMG International Cooperative, a Swiss entity. All rights reserved.
180

TA X
Reasons for zero loss absorbency of tax
We were also interested to understand why some fi rms may not recognise LADT for a signifi cant part of their business. The majority of these respondents were friendly societies or mutual organisations. As can be seen from Graph 12.1.2, for the majority this would seem to be a reasonable result due to unvalued tax losses already existing on the Solvency II base balance sheet. Four respondents were yet to do suffi cient work to recognise a benefi t.
Graph 12.1.2:
If for a significant part of your business, the loss absorbency of deferred tax was assumed to be zero, was this because...
7
4
1
181 TPS 2014
© 2014 KPMG LLP, a UK limited liability partnership, is a subsidiary of KPMG Europe LLP and a member firm of the KPMG network of independent member fi rms affiliated with KPMG International Cooperative, a Swiss entity. All rights reserved.
There were unrecognised deferred tax assets in respect of losses relating to that part of the
business even in unstressed conditions
Preliminary work indicated that the calculation would be too onerous or the
benefit too marginal due to the difficulty of obtaining supporting evidence
No detailed work has been undertaken, therefore no benefit of LADT is recognised

TA X
Assumed sources of future income / profits to value deferred tax assets on the stressed balance sheet
We then asked which sources of future income or profi t were included in the methodology for valuing DTAs on the stressed balance sheet. Where the LADT cannot be netted with DTLs, some projection of future taxable profi ts/income is required. Respondents were asked to select all of the options which applied.
Graph 12.1.3:
Which of the following sources of future income or profits does your tax methodology allow you to anticipate when valuing deferred tax assets on the stressed balance sheet?
0 2 4 6 8 10 12
Number of firms
2
1
5
9
0
2
2
11
9
0
1
Other
We use business as usual forecasts which will include some or all of the above items but these are not separately identified
Post shock management actions (e.g. recapitalisations)
Income or profits in excess of the risk free rate
Post shock tax planning to move income or profits and losses into the same entity
Income or profits from non-insurance entities in the group
Reversal of interest rate shock on bonds which can be held to maturity
Equity markets reverting to mean post-shock
Investment return on excess capital
Taxable profits arising on future new business
Unwind / release of some or all of the risk margin (or equivalent allowance for variation from
the best estimate)
There were 17 respondents to this question and graph 12.1.3 sets out the responses. Note that 17 respondents is considerably more than the number of respondents who stated in the fi rst question that they have recognised an LADT in excess of DTLs; this is not necessarily inconsistent as this question concerned what was allowed in the methodology. Thus these responses indicate that respondents may be considering generalising their methodology so they are not solely dependent on an offset against DTLs and prior year profi ts in future should circumstances change. The four most common sources of income anticipated by respondents were the release of the Solvency II Risk Margin, allowance for new business profi ts, investment return on excess capital and, to a lesser extent, income/ profi ts in excess of the risk free rate. This pattern was consistent with our 2013 survey. Most respondents selected at least two sources.
“Other” responses noted a movement in unrealised capital gains and future tax payments projected by their valuation model.
Two respondents relied on profi ts from non-insurance entities in the group. It is expected that Solvency II guidance will not allow this for the Standard Formula. Of the respondents selecting this option, one was using a Partial Internal Model and one an Internal Model.
TPS 2014
© 2014 KPMG LLP, a UK limited liability partnership, is a subsidiary of KPMG Europe LLP and a member firm of the KPMG network of independent member fi rms affiliated with KPMG International Cooperative, a Swiss entity. All rights reserved.
182

TA X
Release of Solvency II Risk Margin as a source of future profi ts
As a follow-up question, we asked about the extent to which the release of the Solvency II Risk Margin was assumed as a source of future profi t, where applicable.
Graph 12.1.4:
Under Solvency II, when valuing deferred tax assets on the stressed balance sheet, does your methodology consider that the release of the Risk Margin is a source of future profi ts?
2
9
4
2
2
Yes, in full
Yes, for closed books/products only
Yes, to the extent releases are expected within the normal business
Yes, in part, on some other basis
No
It is interesting to note that there is an even split between respondents who anticipate the release of some (or all) of the Solvency II Risk Margin and those who do not. This pattern is consistent with our 2012 and 2013 surveys.
However, fewer respondents are now using the release of the Solvency II Risk Margin in full (two respondents this year compared to nine in 2013). There appears to be a trend towards restricting releases (e.g. to that expected within the normal business planning cycle or which relate to closed products). Probing the data more deeply reveals that 4 respondents have become more conservative on this point since 2013 (generally smaller fi rms moving from full recognition to no recognition) while 5 respondents had become less conservative (generally medium or large fi rms moving from no recognition to partial recognition).
In summary, the current position is that smaller fi rms generally have not anticipated any Solvency II Risk Margin release but that larger ones have adopted a range of different practices to allow for some release.
It will be interesting to see how practice continues to evolve on this point. The PRA’s statement 2/14 indicates their scepticism on the point. It may be the case that either fi rms are not yet prepared to concede the point in full or respondents have yet to reassess their methodology following the release of the PRA supervisory statement.
Three respondents indicated that some Solvency II Risk Margin release was anticipated in this question despite not selecting that option in the previous question. In one case, the release was in respect of closed books/products only, in another it was on “some other basis”. This perhaps indicates that some respondents are being fl exible in their application and depart from their general approach in specifi c circumstances.
183 TPS 2014
© 2014 KPMG LLP, a UK limited liability partnership, is a subsidiary of KPMG Europe LLP and a member firm of the KPMG network of independent member fi rms affiliated with KPMG International Cooperative, a Swiss entity. All rights reserved.

TA X
12.2 FUTURE POSITION AND TAX MODELLING
Following the change to the UK life insurance corporation tax regime from 1 January 2013, a number of firms have large DTLs on their IFRS/ Solvency II base balance sheet reflecting the transitional adjustment arising. In most circumstances this transitional adjustment is released into current tax over a ten year period on a straight line basis. In a new question for 2014, we were interested to know whether the run off of this DTL would materially impact the ability to take credit for the LADT in future.
Graph 12.2.1:
Will the run-off of IFRS deferred tax liabilities relating to the transition to the post-2012 tax regime materially impact your ability to take credit for the loss absorbency of deferred tax?
3
2 7
9
1
Yes but we have quantified the impact and will explore any relevant mitigating steps
The impact on future LADT is expect to be adverse but has not been considered further
No, the impact is immaterial
No, we have net deferred tax assets in respect of trade profits timing differences
Unknown
Of the 22 respondents who did not answer n/a to this question, 9 (41%), including several large fi rms, did not expect a material impact. This could be because the transitional DTLs are not material or because there are material other DTLs or sources of future profi ts.
Comparing the result to Graph 12.1.1 indicates that most of those who expected a material adverse impact are relying only on DTLs and/or prior year profi ts to support LADT. We would expect these fi rms to more actively consider other sources of future profi t as the transitional DTLs run off. Conversely, most of those who expected an immaterial impact are already relying on future profi ts.
TPS 2014
© 2014 KPMG LLP, a UK limited liability partnership, is a subsidiary of KPMG Europe LLP and a member firm of the KPMG network of independent member fi rms affiliated with KPMG International Cooperative, a Swiss entity. All rights reserved.
184

TA X
Determination of the deferred tax asset arising from the shock loss
We next went on to ask about how firms were modelling tax within their Internal Model.
Graph 12.2.2:
In terms of calculating the LADT, how is the deferred tax asset arising from the shock loss determined
10
3
3
2
The internal model (or equivalent) calculates a pre tax SCR and the tax adjustment is a
discrete final step outside of the model
The internal model (or equivalent) works out the loss(es) and the potential DTA but caps
the DTA by reference to a “tax capacity” cap introduced as a user-defined parameter
The Internal Model (or equivalent) works out the loss(es) and the capacity to value tax losses is determined dynamically by
the Internal Model
Other
Just over half of the relevant respondents (10 out of 18) indicated that their Internal Model calculated a pre-tax SCR in the fi rst instance, with the tax adjustment being a discrete fi nal step. A further fi ve respondents (28%) stated that their Internal Model valued tax losses by reference to a measure of tax capacity, and for two of them the tax cap was valued dynamically. The pattern is similar to that observed in the previous two years.
The smaller insurers who answered this question tended to indicate that the tax adjustment was outside the model or selected “other”.
185 TPS 2014
© 2014 KPMG LLP, a UK limited liability partnership, is a subsidiary of KPMG Europe LLP and a member firm of the KPMG network of independent member fi rms affiliated with KPMG International Cooperative, a Swiss entity. All rights reserved.

TA X
12.3 TAX METHODOLOGY Finally, we asked if there are any areas where the tax methodology differed (or was expected to differ after taking into account of planned developments) between the various bases used (ICA, ICAS+, Solvency II and economic capital, where relevant). Graph 12.3.1 shows the range of differences indicated by respondents.
Graph 12.3.1:
After taking into account planned developments, are there any areas where your expected tax methodology will vary between the bases used?
0 2 4 6 8
Number of firms
5
7
3
7
8
4 Other
The future profits used to support deferred tax assets are re-computed (for example as a consequence of taking a
different view on contract boundaries)
Time horizon over which deferred tax assets can be recovered.
The extent to which loss absorbency of tax is taken into account in calculating the capital requirement run-off
used to define the risk margin (or equivalent)
Whether deferred tax assets on the base balance sheet are tested for impairment as a result of a shock
Discounting of deferred tax balances
Half of the respondents (16 out of 32) indicated that they used (or planned to use) differing tax methodologies in at least one of the above areas across different reporting bases. There was a clear bias within this subset in favour of medium-sized / larger fi rms (13 of the 16 relevant respondents).
Where “other” was selected, respondents had still to consider the position.
Interestingly, the responses provide evidence that there is some departure from IAS 12 and/or Solvency II rules as regards the quantification of deferred tax balances on some reporting bases (for example on the discounting of deferred tax balances and writing down DTAs in stressed conditions). Such departures are not necessarily inappropriate.
It will be interesting to see if the areas of divergence become more numerous. If, for example, the Regulator insists on prudent interpretations or an onerous level of evidence we could see divergence of practice between regulatory measures and economic capital measures.
TPS 2014
© 2014 KPMG LLP, a UK limited liability partnership, is a subsidiary of KPMG Europe LLP and a member firm of the KPMG network of independent member fi rms affiliated with KPMG International Cooperative, a Swiss entity. All rights reserved.
186

13 Acknowledgements
Many people dedicated their time to this survey to make it a
success and we would like to take this opportunity to thank each
of them. We had responses from 32 different respondents and
many more actuaries gave up their time for surveys to be
completed. We appreciate the time and care that is put into your
responses, the feedback you provided to us and your willingness
to discuss your answers with us. A list of the respondents
participating in this year’s survey can be found in Section 14.
CORE TEAM
John Jenkins
Partner
Jane Parker
Survey Lead
187 TPS 2014
© 2014 KPMG LLP, a UK limited liability partnership, is a subsidiary of KPMG Europe LLP and a member firm of the KPMG network of independent member fi rms affiliated with KPMG International Cooperative, a Swiss entity. All rights reserved.
Kim Owen
Survey Manager
Simon Hogley
Survey Manager

ACKNOWLEDGEMENTS
AUTHORS
188 TPS 2014
Graeme Tweedy
Executive Advisor
Richard Dyble
Senior Advisor
© 2014 KPMG LLP, a UK limited liability partnership, is a subsidiary of KPMG Europe LLP and a member firm of the KPMG network of independent member fi rms affiliated with KPMG International Cooperative, a Swiss entity. All rights reserved.
Florin Ginghina
Executive Advisor
Thomas Evans
Senior Advisor
Maynard Kuona
Executive Advisor
Jonathan Martin
Senior Advisor
Michael Taylor
Executive Advisor
Kate Fry
Senior Advisor
Vasu Patel
Executive Advisor
Ravi Dubey
Executive Advisor
Simon Tomlinson
Executive Advisor
WITH ADDITIONAL INPUT FROM...
Natasha Naidoo
Executive Advisor
Peter Stanley
Executive Advisor
Bob Gore
Principal Advisor
Danny Hurley
Principal Advisor
David Honour
Principal Advisor
Nick Ford
Principal Advisor
Sandy Trust
Principal Advisor
Gordon Gray
Principal Advisor

14 List of participants
PARTICIPANTS AEGON UK
Ageas Protect
AXA Wealth
Chesnara and Countrywide Assured
Engage Mutual Assurance
Equitable Life
Friends Life
Guardian Assurance
Hannover Re UK Life Branch
Hodge Lifetime
HSBC Life (UK)
Legal and General Assurance Society
Liverpool Victoria Friendly Society
Lloyds Banking Group
National Deposit Friendly Society
NFU Mutual
189 TPS 2014
© 2014 KPMG LLP, a UK limited liability partnership, is a subsidiary of KPMG Europe LLP and a member firm of the KPMG network of independent member fi rms affiliated with KPMG International Cooperative, a Swiss entity. All rights reserved.
LIST OF PARTICIPANTS
We would like to extend a very special thank you to all those who
participated in the survey. We value your contribution and hope that you fi nd the report useful and interesting.
Pacific Life Re
Partnership Assurance
Phoenix Group
Police Mutual Assurance Society
Reliance Mutual Insurance Society Limited
RGA International Reinsurance Company
Royal London Mutual Insurance Society
Sanlam Life and Pensions
Scottish Friendly Assurance Society
Skandia Life Assurance Company
Standard Life Assurance
Sun Life Financial of Canada (UK)
The Prudential Assurance Company
Unum
Wesleyan Assurance Society
Zurich Assurance
TPS 2014
© 2014 KPMG LLP, a UK limited liability partnership, is a subsidiary of KPMG Europe LLP and a member firm of the KPMG network of independent member fi rms affiliated with KPMG International Cooperative, a Swiss entity. All rights reserved.
190

CONTACT US If you would like more information on any of the results set out in this report including electronic copies of the graphs and results set out within, or if you would like more information or assistance with regard to industry and technical actuarial practices, please contact:
Simon Hogley
Executive Advisor
Tel: 0161 246 [email protected]
Kim Owen
Actuarial Analyst
Tel: 020 7311 4165 [email protected]
Listed below for your information are the Partners and Directors of the KPMG UK Life Actuarial practice:
Ferdia ByrnePartnerTel: 020 7694 [email protected]
Richard CarePartnerTel: 020 7694 [email protected]
John JenkinsPartnerTel: 020 7311 6199 The information contained herein is of a general nature and is not intended to address the circumstances of any particular individual or entity . Although we endeavour to provide accurate and timely information, there can be no guarantee that suc h information is accurate as of the date it is received or that it will continue to be accurate in the future. No one should act on such information without appropriate prof essional advice af ter a thorough examination of the particular situation. © 2014 KPMG LLP, a UK limited liability partnership, is a subsidiary of KPMG Europe LLP and a member fi rm of the KPMG network of independent member fi rms affi liated with KPMG International Cooperative, a Swiss entity . All rights reser ved. Printed in the United Kingdom.The KPMG name, logo and “cutting through complexity” are registered trademarks or trademarks of KPMG International. Oliver for KPMG | OM020589A | September 20 14 | Printed on recycled material.
Trevor JonesPartnerTel: 020 7311 [email protected]
Gavin PalmerPartnerTel: 020 7694 [email protected]
Simon PerryPartnerTel: 0117 905 [email protected]
Gina CraskeDirectorTel: 020 7311 [email protected]
James CruttendenDirectorTel: 020 7694 [email protected]
www.kpmg.co.uk
The information contained herein is of a general nature and is not intended to address the circumstances of any particular individual or entity. Although we endeavour to provide accurate and timely information, there can be no guarantee that such information is accurate as of the date it is received or that it will continue to be accurate in the future. No one should act on such information without appropriate professional advice after a thorough examination of the particular situation.
© 2014 KPMG LLP, a UK limited liability partnership, is a subsidiary of KPMG Europe LLP and a member fi rm of the KPMG network of independent member fi rms affi liated with KPMG International Cooperative, a Swiss entity. All rights reserved. Printed in the United Kingdom.
The KPMG name, logo and “cutting through complexity” are registered trademarks or trademarks of KPMG International.
OLIVER for KPMG | OM020589A | September 2014.