Embed Size (px)
Citation preview

Financial SectorFinance 724/824, Spring 2011
Lauren Kirk, Krystal Patel, Bryan McElwain, Matt McHenry, Chris Koenig
Table of ContentsFinancial Sector
Overview of Sector
Business Analysis
Financial Analysis
Valuation Analysis
Recommendation
Economic Analysis
Section 1
Section 2
Section 3
Section 4
Section 5
Section 6
2

Overview of Financial SectorA category of stocks containing firms that provide
financial services to commercial and retail customers.
This sector includes banks, investment funds, insurance
companies and real estate.
3

• Financial Sector is 3rd largest
at 17% of overall market
Overview of Financial Sector
23%
18%
17%
12%
11%
9%
6%
3% 2% Basic Materials
Consumer Goods
Financial
Technology
Industrial Goods
Healthcare
Services
Utilities
Conglomerates
4

• Financial Sector is 2nd
largest at 15.47% of S&P
• Market Cap: $1922.61B
Overview of Financial Sector
5
10.60%
10.42%
13.09%
15.47%
11.27%
11.23%
18.07%
3.66%
2.98%3.21%
Consumer Discretionary
Consumer Staples
Energy
Financials
Health Care
Industrials
Information Technology
Materials
Telecom Services
Utitlies

52%
15%
5%
5%
5%
3%
3%2%
2%
2%
Money Center Banks
Regional - Midwest Banks
Asset Management
Foreign Regional Banks
Property & Casualty
Insurance
Life Insurance
REIT - Diversified
Investment Brokerage -
National
Insurance Brokers
Real Estate Development
Top 10 Industries make up 94% of Financial Sector
Money Center Banks make up 52% of entire Financial Sector
Financial SectorTop Industries
6

Company Ticker Market Cap ($B) EPS P/E NP margin
Operating
Margin ROE
JP Morgan JPM 181.63 4.5 10.12 16.91% 42.10% 9.69%
Wells Fargo WFC 153.53 2.42 11.99 14.86% 22.30% 10.53%
Citigroup Inc C 132.78 0.31 14.64 12.65% 15.22% 6.67%
Bank of America BAC 125 -0.44 - -2.03% -1.20% -1.77%
Goldman Sachs GS 78.93 9.11 16.65 18.17% 28.05% 11.50%
American Express Co AXP 58.93 3.59 13.65 13.42% 19.72% 26.15%
American Intl Group Inc AIG 56.13 14.11 2.21 15.62% 23.20% 30.11%
US Bancorp USB 49.52 1.94 13.28 18.20% 23.41% 12.80%
Metlife Inc MET 49.19 3.17 14.69 5.27% 7.51% 6.51%
Morgan Stanley MS 40.48 1.76 14.87 14.36% 16.31% 7.97%
BlackRock Inc BLK 37.59 11.27 17.4 23.80% 34.81% 8.06%
The Bank of
New York Mellon BK 35.74 2.13 13.5 19.08% 26.62% 8.43%
Simon Property Group SPG 33.62 2.08 54.99 19.04% 35.01% 13.27%
PNC Finl Services Group PNC 32.64 5.97 10.4 19.16% 25.73% 8.77%
Prudential Financial Inc PRU 30.89 5.75 11.02 8.10% 11.51% 9.39%
Lincoln National Corp LNC 9.86 2.56 12.18 9.14% 14.65% 6.60%
CIT Group Inc. CIT 8.5 2.18 19.45 8.19% 12.07% 5.97%
Top Players in Financial Sector
7
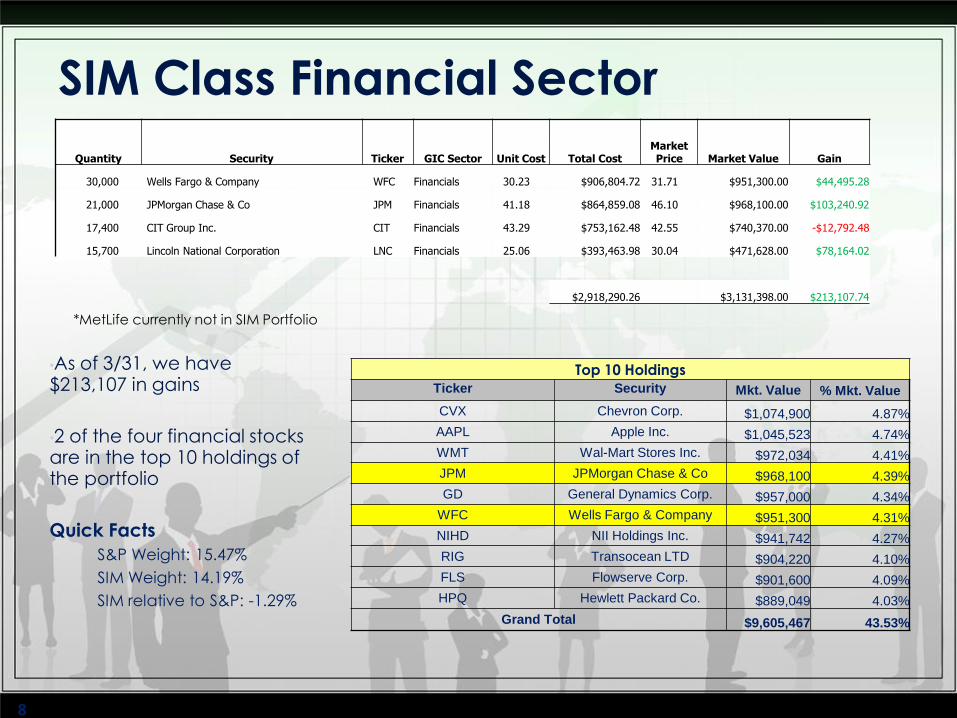
•As of 3/31, we have $213,107 in gains
•2 of the four financial stocks are in the top 10 holdings of the portfolio
Quick Facts
S&P Weight: 15.47%
SIM Weight: 14.19%
SIM relative to S&P: -1.29%
SIM Class Financial Sector
8
Quantity Security Ticker GIC Sector Unit Cost Total CostMarket Price Market Value Gain
30,000 Wells Fargo & Company WFC Financials 30.23 $906,804.72 31.71 $951,300.00 $44,495.28
21,000 JPMorgan Chase & Co JPM Financials 41.18 $864,859.08 46.10 $968,100.00 $103,240.92
17,400 CIT Group Inc. CIT Financials 43.29 $753,162.48 42.55 $740,370.00 -$12,792.48
15,700 Lincoln National Corporation LNC Financials 25.06 $393,463.98 30.04 $471,628.00 $78,164.02
$2,918,290.26 $3,131,398.00 $213,107.74
Top 10 Holdings
Ticker Security Mkt. Value % Mkt. Value
CVX Chevron Corp. $1,074,900 4.87%
AAPL Apple Inc. $1,045,523 4.74%
WMT Wal-Mart Stores Inc. $972,034 4.41%
JPM JPMorgan Chase & Co $968,100 4.39%
GD General Dynamics Corp. $957,000 4.34%
WFC Wells Fargo & Company $951,300 4.31%
NIHD NII Holdings Inc. $941,742 4.27%
RIG Transocean LTD $904,220 4.10%
FLS Flowserve Corp. $901,600 4.09%
HPQ Hewlett Packard Co. $889,049 4.03%
Grand Total $9,605,467 43.53%
*MetLife currently not in SIM Portfolio

Sector PerformanceSector Last 12 months Last 3 months Last 1 month
Energy (XOM.S) 28.68 11.29 2.40
Material (DD.S) 33.66 10.30 6.26
Industrials (GE.S) 28.17 7.59 5.20
Consumer Discretionary (TGT.S) 32.88 9.18 8.26
Consumer Staples (PG.S) 24.73 11.86 8.26
Healthcare (MRK.S) 22.20 13.14 9.48
Financials (JPM.S) 10.26 5.07 2.96
Information Technology (MSFT.S) 25.22 5.69 4.39
Telecom (VZ.S) 29.93 7.73 4.64
Utilities (EXC.S) 15.65 7.10 6.67
9
Morningstar.com

External Factors
Political
Dodd-Frank Legislation
Reform Consumer Protection Act
Unemployment rate
2-year treasury note rate
Velocity of money supply
Federal funds rate
Personal savings rate
10
Economic

• Maturity Phase
• Barriers to entry high
• High Capital Requirements
• Regulations
• Competition and Consolidation
• Bank of America/Merrill Lynch
• JP Morgan buys failed WaMu
• Buyer Power
• Commodity for general customers
• Supplier Power
• Federal Reserve
• Substitution
• Savings, Credit Cards, Investing, Insurance
• Commodity for general customers
Porter’s 5 Forces
11

Economic Analysis
12

FEDERAL FUNDS RATE AND FINANCIALS EMPLOYMENT AND FINANCIALS
Economic Analysis of Financial Sector• Correlation with Economic Indicators
•STRONG CORRELATION W/ FED FUNDS RATE•Cut from 1.0% to .25% in 2008
• Influences short-term interest rates, deposits, bank loans, credit card interest rates, and adjustable-rate mortgages
•STRONG CORRELATION WITH EMPLOYMENT
•Hit high of 10.2% in Oct ‘09
13
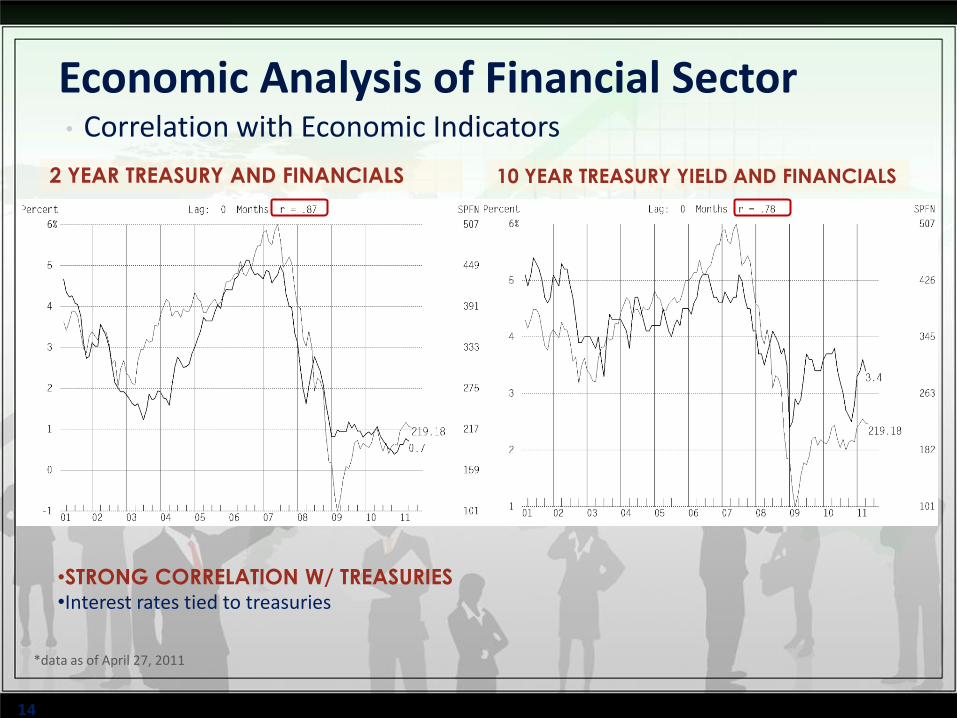
2 YEAR TREASURY AND FINANCIALS 10 YEAR TREASURY YIELD AND FINANCIALS
Economic Analysis of Financial Sector• Correlation with Economic Indicators
*data as of April 27, 2011
14
•STRONG CORRELATION W/ TREASURIES•Interest rates tied to treasuries

HOUSING STARTS AND FINANCIALS CONSUMER CONFIDENCE AND FINANCIALS
Economic Analysis of Financial Sector• Correlation with Economic Indicators
Number of new houses on which construction has been started
•2005: 2,068,300 homes•2010: 586,900 homes
15
Increasing•Now at 65.4•Depends on labor market, global economy, etc.

Financial Analysis
16

•21% drop in 2008
•Downward slope since that point
• Earnings per Share
growth rates:
•5 yr at -52%
•3 yr at 50%
•Current Yr at 14%
•Long term at 7%
Financial Sector Revenues
17

Sector Net Profit Margin Relative to S&P
Net Profit
High 2.3
Low -0.2
Median 2.1
Current 1.3
18

Financial Sector - Industry Revenues
Revenues Historical Growth Rates Expected Growth Rate
Industry10 yr 5 yr 3 yr
Last 12
Months
Current Q
(March)
Current Yr
('11)
Next Yr
('12)
Money Center Banks 1% -5% -5% -22% -24% -10% 5%
Regional Banks 2% -5% -12% -17% -9% -10% 3%
Asset Management 8% -3% -13% 19% 20% 20% 9%
Property & Casualty
Insurance3% 1% 0% -11% 3% 7% 2%
Life Insurance 5% 3% -3% 14% 3% 4% 5%
REIT - Diversified - - -10% 0% -4% -2% -2%
Investment Brokerage -
National1% -19% -2% -2% -12% 4% 8%
Insurance Brokers 4% -7% -5% -7% -15% -9% 1%
Real Estate Development - - -23% 7% 38% 33% 10%
19

Financial Sector - Industry EPS
ESP Historical Growth Rates Expected Growth Rate
Industry10 yr 5 yr 3 yr
Last 12
Months
Current Q
(March)
Current Yr
('11)
Next Year
('12)
Future
Growth Rate
Money Center Banks -14% - 156% 235% -1% 21% 30% 5%
Regional Banks -18% - - 170% - 104% 42% 6%
Asset Management 5% -4% -12% 15% 15% 14% 17% 11%
Property & Casualty
Insurance8% -8% -2% -37% -14% 0% 11% 9%
Life Insurance 8% -2% -3% 21% 9% 10% 12% 12%
REIT - Diversified - - -15% 8% 6% 1% 2% 5%
Investment Brokerage
- National-9% - 387% 14% -73% 6% 31% 12%
Insurance Brokers -10% - 227% -32% 16% -14% 14% 11%
Real Estate
Development- - -15% -1% -1% 14% 16% 7%
20

Valuation Analysis
21

Financial Sector ValuationTrailing P/E
22
*10 year time period

Financial Sector ValuationForward P/E
23
*10 year time period
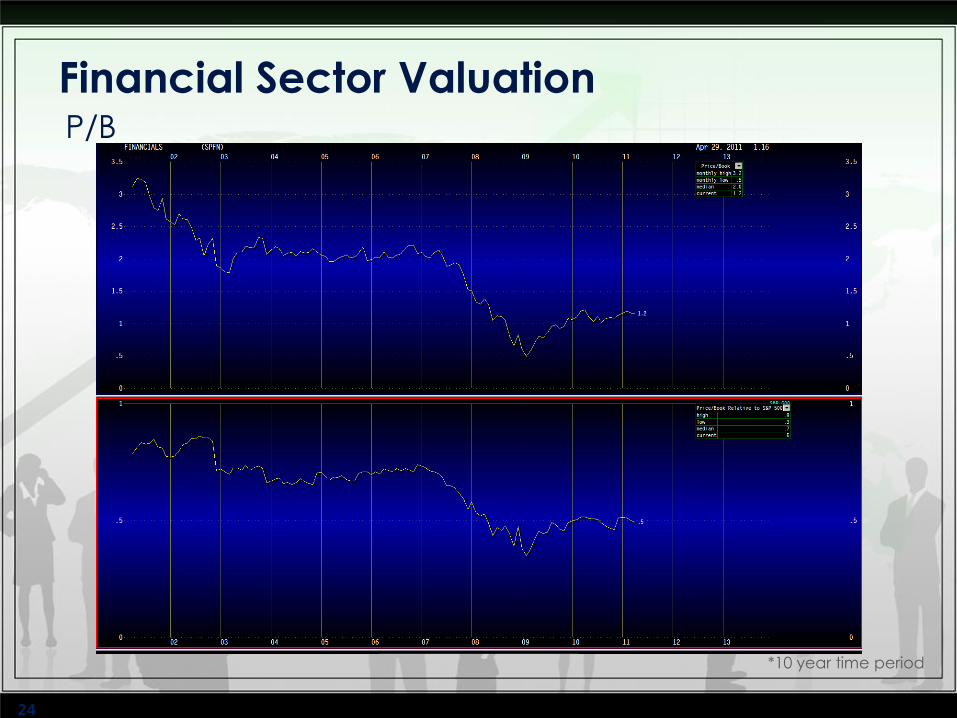
Financial Sector ValuationP/B
24
*10 year time period
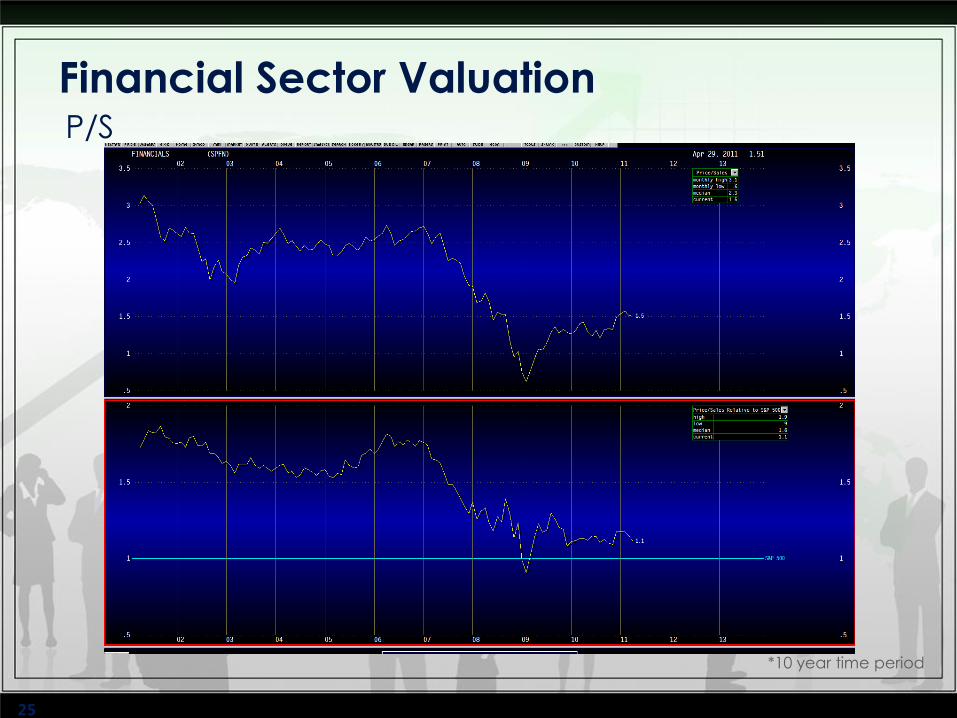
Financial Sector ValuationP/S
25
*10 year time period

•Overall in sector and industries, current valuations are below the median
Financial Sector Valuation
Absolute Basis High Low Median Current
P/Trailing E 135.2 10.5 14.0 13.8
P/Forward E 20.1 10.6 12.7 12.2
P/B 3.2 .5 2.0 1.1
P/S 3.1 .6 2.4 1.5
P/CF 140.7 7.2 9.9 10.8
Relative to SP500 High Low Median Current
P/Trailing E 7.8 .65 .77 .89
P/Forward E 1.4 .60 .77 .87
P/B .9 .3 .7 .5
P/S 1.9 .9 1.6 1.1
P/CF 13.4 .7 .9 1.1
26
*10 year time period

Industry ValuationRelative to S&P 500
Absolute
Basis
High Low Median Current
P/Trailing E 17.2 4.0 13.1 9.8
P/Forward E 15.0 4.4 12.4 8.9
P/B 2.2 .5 1.5 1.0
P/S 1.5 .3 1.1 .9
P/CF 13.8 4.6 10.7 9.3
Relative to
SP500
High Low Median Current
P/Trailing E .87 .38 .69 .64
P/Forward E .90 .35 .70 .64
P/B .7 .3 .5 .4
P/S 1.0 .4 .7 .7
P/CF 1.1 .6 1.0 .9
Insurance/Life Insurance
Mortgage Investment
Absolute
Basis
High Low Median Current
P/Trailing E 54.3 10.4 22.7 18.7
P/Forward E 39.7 11.9 18.1 16.3
P/B 5.7 .7 2.3 1.5
P/S 9.2 1.9 6.4 3.8
P/CF 27.9 6.7 14.6 14.6
Relative to
SP500
High Low Median Current
P/Trailing E 2.9 .90 1.3 1.2
P/Forward E 2.9 .90 1.2 1.2
P/B 2.0 .5 .9 .7
P/S 6.9 2.4 4.2 2.9
P/CF 2.6 .7 1.5 1.5
27
*10 year time period

Industry ValuationRelative to S&P 500
Money Center Banks
28
*10 year time period
Absolute Basis High Low Median Current
P/Trailing E 54.8 9.5 13.7 13.3
P/Forward E 25.2 10.0 12.4 11.0
P/B 2.8 0.7 2.1 1.4
P/S 3.9 0.8 3.3 2.0
P/CF 32.8 5.6 10.3 11.4
Relative to SP500 High Low Median Current
P/Trailing E 4.6 0.61 0.74 0.88
P/Forward E 1.6 0.52 0.75 0.80
P/B 0.9 0.5 0.7 0.6
P/S 2.7 1.2 2.2 1.5
P/CF 2.9 0.7 1.0 1.2

Recommendations
29
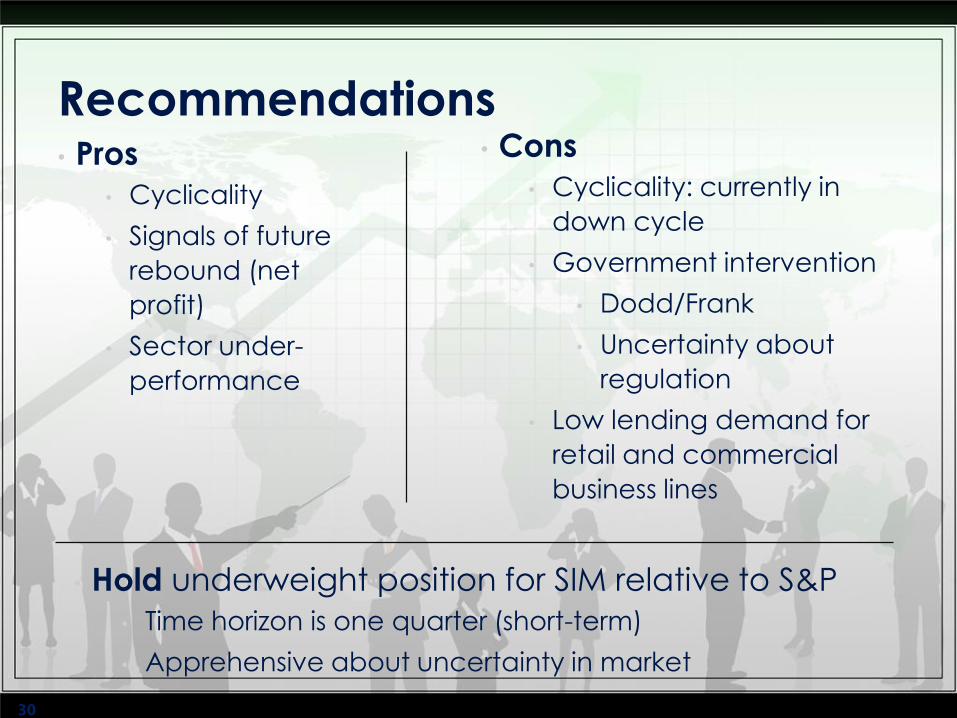
• Pros
• Cyclicality
• Signals of future
rebound (net
profit)
• Sector under-
performance
Recommendations
30
• Cons
• Cyclicality: currently in
down cycle
• Government intervention
• Dodd/Frank
• Uncertainty about
regulation
• Low lending demand for
retail and commercial
business lines
• Hold underweight position for SIM relative to S&P
• Time horizon is one quarter (short-term)
• Apprehensive about uncertainty in market

QUESTIONS?31


![Liziê D. T. Prola, Lilian Buriol, Clarissa P. Frizzo ... · 8a, 10a, 11a, and 1.0 mmol for 9a), 2-aminoacetophenone (1.0 mmol), [HMIM][TsO] (1.0 mmol) and TsOH (1.0 mmol). After](https://img.pdfslide.us/doc/110x75/5f6d314f14e48a24b56ae7a6/lizi-d-t-prola-lilian-buriol-clarissa-p-frizzo-8a-10a-11a-and-10.jpg)