Embed Size (px)
Citation preview
WP/04/201
Financial Sector Development in the Middle East and North Africa
Susan Creane, Rishi Goyal,
A. Mushfiq Mobarak, and Randa Sab
© 2004 International Monetary Fund WP/04/201
IMF Working Paper
Middle East and Central Asia Department
Financial Sector Development in the Middle East and North Africa
Prepared by Susan Creane, Rishi Goyal, A. Mushfiq Mobarak, and Randa Sab1
Authorized for distribution by Mohsin Khan
October 2004
Abstract
This Working Paper should not be reported as representing the views of the IMF. The views expressed in this Working Paper are those of the author(s) and do not necessarily represent those of the IMF or IMF policy. Working Papers describe research in progress by the author(s) and are published to elicit comments and to further debate.
Based on data collected on a wide range of financial sector indicators, new indices of financial development for countries in the Middle East and North Africa (MENA) are constructed, encompassing six themes: development of the monetary sector and monetary policy, banking sector development, nonbank financial development, regulation and supervision, financial openness, and institutional quality. The paper finds that the degree of financial development varies across the region. Some countries have relatively well-developed banking sectors and regulatory and supervisory regimes. However, across the region, more needs to be done to reinforce the institutional environment and promote nonbank financial sector development. Based on a subset of indicators, the MENA region is found to compare favorably with a few other regions, but it ranks far behind the industrialized countries and East Asia. JEL Classification Numbers: E44, E50, G20, O16, O53 Keywords: Financial development, index, measurement, Middle East and North Africa Author(s) E-Mail Address: [email protected]; [email protected];
[email protected]; [email protected]
1 We are grateful to David Burton and Pierre Dhonte for suggesting the project and the MENA country economists at the IMF for their generous cooperation. Without the latter, this paper would not have been possible. We thank Thamar Kechichian and Saeed Mahyoub for their able research assistance, and participants of the 24th MEEA annual meetings and the April 2004 IMF MENA regional conference for their helpful suggestions.
- 2 -
Contents Page
I. Introduction....................................................................................................................3
II. Literature Review...........................................................................................................4 A. Financial Development and Growth .........................................................................4 B. Measuring Financial Development ...........................................................................6 C. Studies on Financial Development in MENA...........................................................6
III. Financial Development in the MENA Region...............................................................7 A. Gathering Data ..........................................................................................................7 B. Rationale Behind the Organization of the Data ........................................................7 C. Analysis.....................................................................................................................9
IV. New Measures of Financial Development for the MENA Region ..............................12 A. Comprehensive Index of Financial Development...................................................12 B. Principal Components Analysis of the Qualitative Data.........................................14 C. MENA and the Rest of the World: Alternative Index.............................................16 D. Regression Analysis................................................................................................18
V. Further Research ..........................................................................................................19
VI. Conclusions..................................................................................................................20 Figures 1. Comprehensive Index of Financial Development, 2002/03 ........................................14 2. Comparing the Comprehensive and Alternative Indices .............................................17 3. Alternative Financial Development Index, 1960s–1990s............................................17 Tables 1. Comprehensive Financial Development Index, 2000/01 and 2002/03........................13 2. Financial Development Index, 2002/03.......................................................................13 3. Comparison of Index Weights by Variable .................................................................15 4. Comparison of Index Weights by Theme ....................................................................16 5. Alternative Financial Development Index, 1960s/1990s.............................................18 Appendices I. Methodology for Computing the Comprehensive Index .............................................21 II. Abbreviated Survey Tables..........................................................................................26 References................................................................................................................................49
- 3 -
I. INTRODUCTION
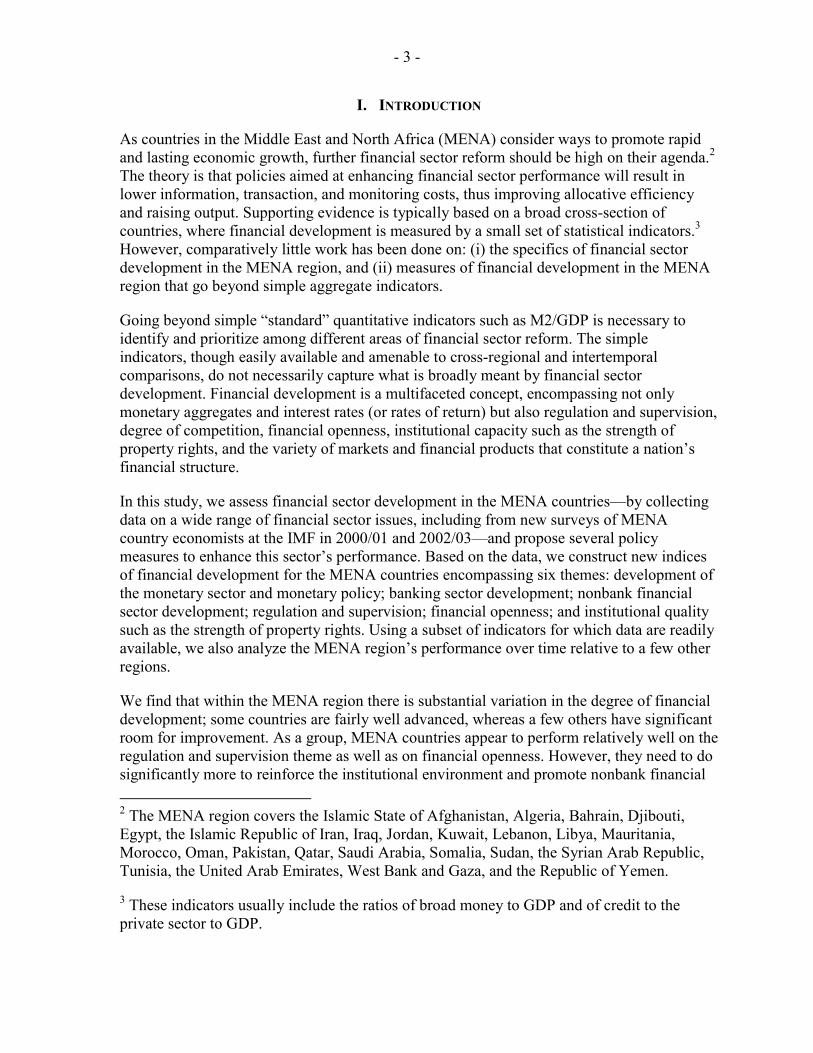
As countries in the Middle East and North Africa (MENA) consider ways to promote rapid and lasting economic growth, further financial sector reform should be high on their agenda.2 The theory is that policies aimed at enhancing financial sector performance will result in lower information, transaction, and monitoring costs, thus improving allocative efficiency and raising output. Supporting evidence is typically based on a broad cross-section of countries, where financial development is measured by a small set of statistical indicators.3 However, comparatively little work has been done on: (i) the specifics of financial sector development in the MENA region, and (ii) measures of financial development in the MENA region that go beyond simple aggregate indicators.
Going beyond simple “standard” quantitative indicators such as M2/GDP is necessary to identify and prioritize among different areas of financial sector reform. The simple indicators, though easily available and amenable to cross-regional and intertemporal comparisons, do not necessarily capture what is broadly meant by financial sector development. Financial development is a multifaceted concept, encompassing not only monetary aggregates and interest rates (or rates of return) but also regulation and supervision, degree of competition, financial openness, institutional capacity such as the strength of property rights, and the variety of markets and financial products that constitute a nation’s financial structure.
In this study, we assess financial sector development in the MENA countries—by collecting data on a wide range of financial sector issues, including from new surveys of MENA country economists at the IMF in 2000/01 and 2002/03—and propose several policy measures to enhance this sector’s performance. Based on the data, we construct new indices of financial development for the MENA countries encompassing six themes: development of the monetary sector and monetary policy; banking sector development; nonbank financial sector development; regulation and supervision; financial openness; and institutional quality such as the strength of property rights. Using a subset of indicators for which data are readily available, we also analyze the MENA region’s performance over time relative to a few other regions.
We find that within the MENA region there is substantial variation in the degree of financial development; some countries are fairly well advanced, whereas a few others have significant room for improvement. As a group, MENA countries appear to perform relatively well on the regulation and supervision theme as well as on financial openness. However, they need to do significantly more to reinforce the institutional environment and promote nonbank financial 2 The MENA region covers the Islamic State of Afghanistan, Algeria, Bahrain, Djibouti, Egypt, the Islamic Republic of Iran, Iraq, Jordan, Kuwait, Lebanon, Libya, Mauritania, Morocco, Oman, Pakistan, Qatar, Saudi Arabia, Somalia, Sudan, the Syrian Arab Republic, Tunisia, the United Arab Emirates, West Bank and Gaza, and the Republic of Yemen.
3 These indicators usually include the ratios of broad money to GDP and of credit to the private sector to GDP.
- 4 -
sector development. Compared to most other developing country regions, the MENA region performs well, but it ranks far behind the industrialized countries and East Asia.
The rest of the paper is organized as follows. We briefly review the literature on financial development and growth and draw general lessons for macroeconomic and financial policy. Then, we describe the data collected, assess common trends, strengths, and weaknesses among MENA countries, and discuss areas for future reform. Finally, we construct several new measures of financial sector development for the MENA countries, and compare the region with other regions.
II. LITERATURE REVIEW
A. Financial Development and Growth
The theoretical argument for linking financial development to growth is that a well-developed financial system performs several critical functions to enhance the efficiency of intermediation by reducing information, transaction, and monitoring costs. A modern financial system promotes investment by identifying and funding good business opportunities, mobilizes savings, monitors the performance of managers, enables the trading, hedging, and diversification of risk, and facilitates the exchange of goods and services. These functions result in a more efficient allocation of resources, in a more rapid accumulation of physical and human capital, and in faster technological progress, which in turn feed economic growth.
What leads to a well-developed financial sector? Conversely, what hinders financial sector development? These questions are the subject of a large and still growing research literature from which some general conclusions can be drawn.4 In general, there is agreement that macroeconomic stability is critical for the growth of financial sector services. Countries should adopt appropriate macroeconomic policies, encourage competition within the financial sector, and develop a strong and transparent institutional and legal framework for financial sector activities. In particular, there is a need for prudential regulations and supervision, strong creditor rights, and contract enforcement.
Financial sector development is often hindered by government-imposed restrictions and price distortions on the financial sector, which are mainly applied so that the government can use the financial system as a source of public finance. In developing countries, examples of these policies include high inflation taxation, high required reserves ratios, subsidized or directed credit, collusive contracts between public enterprises and banks, credit rationing, and ceilings on deposit and loan interest rates (or rates of return). These conditions as a whole are collectively referred to as “financial repression” and a large body of research has shown that these financial repression policies undermine economic growth. Some studies have shown
4 See, for example, Fry (1995) and Beim and Calomiris (2001).
- 5 -
that a strong degree of financial repression results in lower per capita GDP growth of over 1 percentage point a year.5
Empirical research supports the thesis that financial sector development is positively related to levels of income and growth, but the issue of causality is not settled. Most studies find a positive correlation between levels of financial development and growth, controlling for several determinants of growth.6 But the precise magnitude of the relationship remains debated, and depends on the financial development indicators used, estimation method, data frequency, and functional specification.7, 8 In addition, the direction of causation is debated, as financial development can be thought of as following or accommodating growth instead of causing it. For example, improvements in communication technologies could enhance financial sector efficiency, or financial services may grow as incomes grow because people demand more financial services.
In many studies, financial development is a good leading indicator of growth; the initial level of financial development predicts subsequent rates of economic growth, physical capital accumulation, and productivity growth, even after controlling for income, education, political stability, and measures of monetary, trade, and fiscal policy.9 Yet, this does not mean that financial development causes growth since the financial sector could be growing in anticipation of real economic growth. There is suggestive time series evidence that causality runs from finance to growth. Some studies have found bi-directional causality and even reverse causality,10 but others have used longer time series of data, different sets of countries, and econometric methods and have found strong evidence for causality from financial development to growth.11
5 See Roubini and Sala-i-Martin (1992).
6 See King and Levine (1993a, b), Wachtel and Rousseau (1995), and the surveys by Levine (1997, forthcoming) and Wachtel (2001).
7 See Khan and Senhadji (2000) and Favara (2003).
8 Controlling for simultaneous determination of financial development and growth, Beck, Levine, and Loayza (2000) and Levine, Loayza, and Beck (2000) find a strong positive correlation between financial development and growth.
9 See Levine (1997, forthcoming).
10 See Jung (1986), Demetriades and Hussein (1996), and Luintel and Khan (1999). Bi-directional causality could imply causality from finance to growth in the early stages of development and causality from growth to finance in later stages to development. See Calderon and Liu (2003) and Favara (2003).
11 See Neusser and Kugler (1998), Rousseau and Wachtel (1998, 2000), Rousseau and Sylla (1999), Xu (2000), Calderon and Liu (2003), and Christopoulos and Tsionas (2004).
- 6 -
In summary, although research continues on the subject, the current state of knowledge suggests that a lagging financial sector can drag down or inhibit growth prospects and that a well-developed financial sector can facilitate growth. Government decision makers should therefore eliminate financial repression conditions as well as facilitate and support the process of financial development as important elements of their policy package to stimulate and sustain economic growth.
B. Measuring Financial Development
Understanding the impact of financial development on economic growth and assessing the development of the financial sector in the MENA region requires good measures of financial development. Empirical work is usually based on standard quantitative indicators for a broad cross-section of countries such as the ratios of liquid liabilities to GDP, deposit money bank assets to banking sector assets, and credit to the private sector to GDP. As noted above, long time series of these measures are available for a wide range of countries allowing us to compare and analyze development across countries and over time. However, these simple measures do not necessarily capture the different structural and institutional details of what is broadly meant by financial development. The financial structure of a country is composed of a variety of markets and financial products, and it is difficult to conceive of a few measures that could adequately capture all relevant aspects of development. In addition, the standard quantitative indicators may at times give a misleading picture of financial development. For instance, although a higher ratio of broad money (or M2) to GDP is generally associated with greater financial liquidity and depth, the ratio may decline rather than rise as a financial system develops because people have more alternatives to invest in longer-term or less-liquid financial instruments.
Going beyond the standard quantitative indicators, Gelbard and Leite (1999) used measures of market structure, financial products, financial liberalization, institutional environment, financial openness, and monetary policy instruments to construct a comprehensive index for 38 sub-Saharan African countries, for 1987 and 1997. Similarly, Abiad and Mody (2003) created an index for a 24-year period from 1973 to 1996 for 35 countries. They examined six measures of policy liberalization in the areas of credit controls, interest rate controls, entry barriers, regulations and securities markets, financial sector privatization, and restrictions on international financial transactions. These more-detailed measures provide a richer description of financial development and motivate our measures of financial development in the MENA region.
C. Studies on Financial Development in MENA
There has been little work on measuring and assessing financial sector development in the MENA region, mainly because of the paucity of data. Our analysis builds on three studies that have examined financial development in MENA and broadly mirrors their conclusions. Chalk, Jbili, Treichel, and Wilson (1996) found that the 13 MENA countries included in their analysis have made significant progress in financial deepening. But in most of these countries, financial markets are thin and tightly regulated, government ownership is prevalent, and market forces play a limited role. Nashashibi, Elhage, and Fedelino (2001) also found that most Arab countries had made progress over the past decade in financial reform but were still at an early stage in the process. Their financial systems are dominated
- 7 -
by banks and, in some, by public banks; and capital market development is hindered by legal, institutional, financial, and economic factors. In comparison, Jbili, Galbis, and Bisat (1997) concluded that the financial sectors in the Arab states of the Gulf Cooperation Council (GCC)12 are developed, technologically advanced, and more integrated into the world economy than in the rest of the MENA region. This finding reflects the substantial differentiation in the degree of financial development in the region.
III. FINANCIAL DEVELOPMENT IN THE MENA REGION
A. Gathering Data
Against this background, we surveyed the country economists for 20 MENA countries13 at the IMF—in 2000/01 and 2002/03—to collect information on the nature of financial products and institutions in these countries. We organized the data according to six themes, each of which reflects a different facet of financial development: (1) development of the monetary sector and monetary policy; (2) banking sector development; (3) development of the nonbank financial sector; (4) banking regulation and supervision; (5) financial openness; and (6) institutional quality.14 We also collected several macroeconomic and financial time-series data from the International Financial Statistics (IFS), World Economic Outlook (WEO), and World Development Indicators (WDI), as well as measures of institutional development from the International Country Risk Guide (ICRG) and the Heritage Foundation (HF).15 We then developed index values to measure each country’s progress in each of the areas.
B. Rationale Behind the Organization of the Data
Controls on deposit and/or lending rates and on the allocation of credit are common modes of repression in underdeveloped financial systems. Forcing banks to subsidize credit to certain sectors, or restricting the quantity of credit, distorts the credit market and lowers efficiency. Such controls not only prevent banks and other financial intermediaries from adequately funding promising and productive business opportunities but often also lower savings and encourage capital flight. The monetary sector development and monetary policy theme, therefore, examines the extent to which the government uses indirect monetary policy instruments as opposed to direct controls on interest rates (or rates of return) and credit
12 The GCC comprises Bahrain, Kuwait, Oman, Qatar, Saudi Arabia, and the United Arab Emirates.
13 Islamic State of Afghanistan, Iraq, and Somalia were excluded for lack of data. West Bank and Gaza was also excluded for the same reason.
14 The tables in Appendix II are abbreviated responses from the survey.
15 The International Financial Statistics and the World Economic Outlook are published by the IMF; the World Development Indicators are put forth by the World Bank; and the International Country Risk Guide (ICRG) is published by the PRS Group.
- 8 -
allocation. It also considers the efficiency of markets for government securities and the provision of liquidity services by the financial system.
Banks are central to the financial and payments system of most economies, often playing a critical role in the process of mobilizing savings, funding investment opportunities, monitoring managers, and diversifying risk. Consequently, the banking sector development theme examines the size, structure, and efficiency of the banking sector. Among other things, it investigates the profitability of banks, bank competition and concentration, payments systems, ease of private sector access to bank credit, and frequency of noncash transactions. Drawing on recent empirical research, the presumption is that banks operating in competitive environments, including with less government intervention, low market concentration, and foreign bank entry, are likely to be more efficient and conducive to growth. The financial repression literature has convincingly shown that government restrictions on the banking system, such as high reserve requirements, interest rate ceilings, and directed credit repress development. In addition, recent work has shown that concentrated banking systems and larger government ownership of banks have a depressing impact on overall growth, while restrictions on foreign bank entry hinder allocative efficiency.16
The nonbank financial sector development theme explores the development of alternative sources of capital as well as markets for financial products and services. These include stock markets, mortgage or housing finance institutions, corporate bond markets, insurance companies, mutual funds, and pension funds. They reflect the variety of products and markets that allow a financial system to fulfill its functions, namely, enabling firms and households to raise finance in cost-effective ways, mobilizing finance, monitoring managers, and diversifying risk. Research on stock markets has shown that highly liquid stock markets are an important complement to banking sector development in promoting growth.17 Liquidity or the ease of transacting, as opposed to the size of stock markets, is important because it facilitates the exchange of information and assets, thus improving resource allocation and growth. As Levine (2002) notes, “simply listing on the national stock exchange does not necessarily foster resource allocation.” Therefore, in addition to the existence of nonbank financial intermediaries and markets, we pay particular attention to liquidity.
16 Cetorelli and Gambera (2001) find that high banking concentration can facilitate growth of industrial sectors that are more in need of external finance, but find a general negative association of concentration on growth across all sectors and firms. La Porta, Lopez-de-Silanes, and Shleifer (2002) show that countries with higher government ownership of banks are associated with lower subsequent growth. Levine (2003) finds that, controlling for other factors, restrictions on foreign bank entry result in higher bank interest margins.
17 See Levine and Zervos (1998), Demirguc-Kunt and Levine (2001), Levine (2002), and Beck and Levine (2004). Note that this research mainly looks at stock market development and economic growth. Owing to the limited presence and availability of cross-country data, research has not been done on the effect on growth of other financial markets and instruments such as bonds and commercial paper.
- 9 -
Owing to informational asymmetries and associated market failures inherent in financial sector transactions, appropriate regulation and supervision are important aspects of financial development. Regulatory authorities need to ensure that depositors’ interests are protected and fraud is curtailed, which in turn boost confidence in the financial sector and facilitate intermediation. The regulation and supervision theme assesses banks’ performance with respect to minimum (Basel) capital adequacy requirements. Among other items, it evaluates the prudential monitoring of banks and the transparency and openness of the regulatory environment.
Another aspect of development is the degree to which the domestic financial system is able to intermediate funds across borders. This affects the extent to which the country gains from international trade. The financial openness theme assesses the appropriateness of the exchange regime and examines whether there are significant restrictions on the trading of financial assets or currency by foreigners and residents. Restrictions on current account transactions could substantially hinder trade in goods and services. Similarly, multiple exchange practices and misaligned exchange rates could hinder trade and resource allocation. Restrictions on capital account transactions, however, might be needed unless appropriate institutional arrangements, including prudential regulations and supervision are in place. As is being debated in the context of currency and financial crises and the optimal order of liberalization, an open capital account without appropriate oversight and information disclosure could increase the risk of financial collapse. With appropriate institutions, an open economy benefits from the worldwide pool of funds to finance promising domestic investment projects and the allocation of local savings to promising investment alternatives globally.
Finally, the legal and political environment within which the financial system operates is an important determinant of the range and quality of services offered by financial institutions. For instance, in many developing countries, banks are reluctant to extend loans because an inefficient judicial system or a corrupt bureaucracy or political institutions hinder loan recovery. The institutional environment theme tries to judge the quality of institutions such as law and order, property rights, bureaucratic quality, accountability of the government, and the ease of loan recovery through the judicial system that influence the performance of the financial system. Several empirical studies have established the impact of institutions on growth.18
C. Analysis
Having collected and organized the data according to the above themes, an analysis suggests common strengths, trends, and weaknesses, and points to future areas for reform. MENA countries in general perform reasonably well in regulation and supervision. But they need to do more to strengthen the institutional environment and promote nonbank financial sector development. Within the region, progress on financial sector reforms has been uneven. Some countries have well-developed financial sectors, particularly banking sectors, such as the 18 See La Porta, Lopez-de-Silanes, Shleifer, and Vishny (1997, 1998), and Levine (1998, 1999).
- 10 -
GCC countries, Lebanon, and Jordan. Others, such as Egypt, Morocco, and Tunisia, have made important advances in recent years. Overall, however, more remains to be done.
The main findings for the MENA region, according to the six themes, are summarized below.
Monetary policy. For the most part, interest rates (or rates of return) are freely determined, indirect monetary policy tools are employed, and government securities exist. However, in some cases, despite de jure liberalization of interest rates (or rates of return) and removal of credit ceilings, continuing public sector involvement in practice prevents complete market determination of rates and allocation of credit.
In nearly all cases, government securities (whether treasury bills or central bank paper) exist to some degree. In the majority of countries, some open market operations take place. However, in most countries, the incomplete development or nonexistence of secondary markets for government securities hinders the broader use of open market operations by central banks. In addition, a few countries do not follow a comprehensive framework for designing and conducting monetary policy.
Banking sector. In the GCC countries, Jordan, and Lebanon, the banking sector is well developed, profitable, and efficient. However, in about half the region, this is not the case. In seven of the 20 countries, the banking sector is dominated by public sector banks, and in another eight, the government holds significant stakes in financial institutions. These countries are generally characterized by government intervention in credit allocation, losses and liquidity problems, and wide interest rate margins (or spreads in rates of returns). In many parts of the region, there is an urgent need for developing modern banking and financial skills. In seven of the countries, noncash transactions such as credit card use or ATM access were limited or nonexistent.
The banking sector is highly concentrated in eight countries. For example, assets of the three largest banks in these countries exceed 70 percent of total bank assets; the same holds true for loans and deposits. In another seven countries, there is moderate concentration with, for example, four banks accounting for over 60 percent of total bank assets, loans, and deposits. In half the countries, the entry of new banks is difficult.
Generally, there is some correlation among the different attributes of the banking sector. For instance, countries with a highly concentrated banking sector are, in addition, generally also dominated by public sector banks and have limited noncash transactions.
Nonbank financial sector. In most of the region, the nonbank financial sector—comprising the stock market, corporate bond market, insurance companies, pension funds, and mutual funds—needs further development. Where such markets exist, trading is usually quite limited. For instance, stock markets in the region tend to be characterized by high concentration, relatively few listings resulting in low levels of liquidity, and no separate regulatory authority. Moreover, state ownership of utilities and other enterprises in some countries deprives the market of an important source of new issues. The development of these markets is complicated by legal limitations on ownership, the need for a clear and stable legislative framework, weak investor confidence, and inactive or nonexistent secondary markets for financial instruments.

- 11 -
Housing finance institutions have been developed in most MENA countries, primarily through state-owned specialized housing banks. These institutions tend to subsidize credit to low- and middle-income households. However, these quasi-fiscal operations are often not reflected transparently in government budgets. Banks are involved in mortgage finance in countries where specialized mortgage institutions are not present.
Regulation and supervision. Many MENA countries, such as the GCC countries, Jordan, Lebanon, Morocco, and Tunisia, have strengthened banking supervision and regulation, established up-to-date procedures to collect prudential information, and regularly inspect and audit banks. They have taken steps to conform to international Basel standards by increasing capital adequacy ratios and reducing nonperforming loans. However, success in the latter has been limited, and for most countries nonperforming loans remain in the range of 10 percent to 20 percent of total loans.
The independence of the regulatory and supervisory authority, usually the central bank, could be enhanced and supervisors’ skills could be improved. In six of the countries surveyed, the central bank was not considered to be independent, and an additional six had only limited independence. Moreover, the degree of transparency could be improved. About half of the monetary authorities in surveyed countries had created websites to disseminate timely macroeconomic data and relevant financial sector laws and decrees, although coverage could be increased. Reflecting limited overall transparency, only half of the countries posted country staff reports on the IMF web site.
Financial openness. MENA countries have gradually opened up their current as well as capital accounts. However, nearly half the countries continue to maintain restrictions on repatriation of earnings as well as on the domestic purchase of foreign currency.
Most of the countries in the region maintain some form of a pegged exchange rate arrangement, with over half of the countries surveyed pegging to the U.S. dollar. Half of the countries either have or can access easily a forward exchange market.
Three of the 20 countries continued to maintain parallel exchange markets and/or multiple currency rates. At the same time, these three countries, and two others, continued to maintain restrictions on current international transactions, and had not accepted the obligations of Article VIII (Sections 2, 3, and 4) of the IMF’s Articles of Agreement.
Institutional environment. In much of the MENA region, the quality of institutions, including the judicial system, bureaucracy, and property rights, is poor. This hinders banking and commercial activity as well as investment, and hence growth.
In several countries, the judicial system is susceptible to political pressure and long delays, resulting in poor legal enforcement of contracts and loan recovery. Of the 20 countries surveyed, in only two was it considered easy to recover loans through the judicial system. The International Country Risk Guide assigns a low rank to countries in the region for the quality of the bureaucracy, at a level significantly below that of more industrialized countries, including the fast-growing newly industrialized Asian economies.
- 12 -
Property rights enforcement tends to be weak in the region. On the Heritage Foundation’s index of private property protection, only one country in the region (Bahrain) has a rating of very high protection, and two (the United Arab Emirates and Kuwait) have a rating of high protection. Similar to the results presented above, the Heritage Foundation notes significant government involvement in banking and finance in the region. Its index (which weighs government ownership, restrictions, influence over credit allocation, regulations and freedom to offer services in the financial sector) rates only one country (Bahrain) as having very low government restrictiveness in the financial sector for 2002, and two (Jordan and Lebanon) as having low government restrictiveness.
IV. NEW MEASURES OF FINANCIAL DEVELOPMENT FOR THE MENA REGION
A. Comprehensive Index of Financial Development
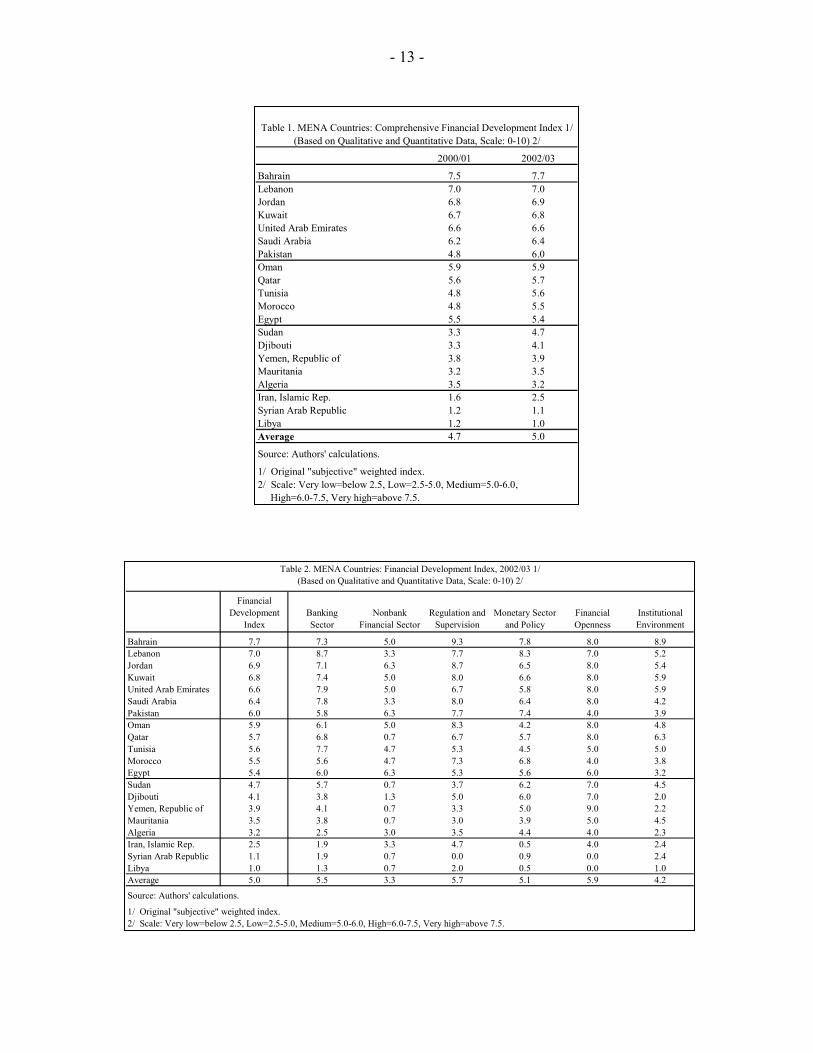
Based on the above-mentioned themes, we developed six different indices, which we then combined to construct a comprehensive index. Each of these six subindices was a composite of between four and eight different indicators that allowed us to measure the various subfacets of each area.19 The comprehensive index therefore was a combination of 35 different indicators and served as a composite measure of financial development. We then grouped countries according to this composite index under five categories of very high, high, medium, low, and very low financial development.
To compute the comprehensive index, we assigned a set of weights to each of the 35 indicators. But to ensure robustness, we calculated it using different sets of weights.20 We found that the grouping of countries into the five financial development categories was robust to the different weighting schemes, although the relative ranking of countries within each grouping changed slightly. We also found that, reflecting continuing reform efforts in the region, Tunisia, Pakistan, and Morocco moved into a higher level between 2000/01 and 2002/03. Within groups, the relative ranking of some countries changed; for example, the increase in Sudan’s ranking reflected reforms carried out during that time across most of the six categories (Tables 1 and 2).
19 Appendix I describes the variables used to compute the comprehensive index.
20 Indices that attempt to capture several different dimensions of an issue in a single or in a small set of measures invariably involve choices of variables to use and weights to assign. This imparts an element of subjectivity to the analysis, and a biased choice of variables or weights could lead to incorrect inferences. Our choice of variables and weights reflect our understanding of what is likely to be important to distinguish more developed financial systems from less developed ones, and what is commonly found in the literature. It also reflects constraints on what could be measured quite easily. By altering the assigned weights, we confirm that our qualitative inferences are not sensitive to the particular choice of weights.
- 13 -
2000/01 2002/03
Bahrain 7.5 7.7Lebanon 7.0 7.0Jordan 6.8 6.9Kuwait 6.7 6.8United Arab Emirates 6.6 6.6Saudi Arabia 6.2 6.4Pakistan 4.8 6.0Oman 5.9 5.9Qatar 5.6 5.7Tunisia 4.8 5.6Morocco 4.8 5.5Egypt 5.5 5.4Sudan 3.3 4.7Djibouti 3.3 4.1Yemen, Republic of 3.8 3.9Mauritania 3.2 3.5Algeria 3.5 3.2Iran, Islamic Rep. 1.6 2.5Syrian Arab Republic 1.2 1.1Libya 1.2 1.0Average 4.7 5.0
Source: Authors' calculations.
1/ Original "subjective" weighted index.2/ Scale: Very low=below 2.5, Low=2.5-5.0, Medium=5.0-6.0,
High=6.0-7.5, Very high=above 7.5.
Table 1. MENA Countries: Comprehensive Financial Development Index 1/(Based on Qualitative and Quantitative Data, Scale: 0-10) 2/
Table 2. MENA Countries: Financial Development Index, 2002/03 1/(Based on Qualitative and Quantitative Data, Scale: 0-10) 2/
Financial Development
IndexBanking Sector
Nonbank Financial Sector
Regulation and Supervision
Monetary Sector and Policy
Financial Openness
Institutional Environment
Bahrain 7.7 7.3 5.0 9.3 7.8 8.0 8.9Lebanon 7.0 8.7 3.3 7.7 8.3 7.0 5.2Jordan 6.9 7.1 6.3 8.7 6.5 8.0 5.4Kuwait 6.8 7.4 5.0 8.0 6.6 8.0 5.9United Arab Emirates 6.6 7.9 5.0 6.7 5.8 8.0 5.9Saudi Arabia 6.4 7.8 3.3 8.0 6.4 8.0 4.2Pakistan 6.0 5.8 6.3 7.7 7.4 4.0 3.9Oman 5.9 6.1 5.0 8.3 4.2 8.0 4.8Qatar 5.7 6.8 0.7 6.7 5.7 8.0 6.3Tunisia 5.6 7.7 4.7 5.3 4.5 5.0 5.0Morocco 5.5 5.6 4.7 7.3 6.8 4.0 3.8Egypt 5.4 6.0 6.3 5.3 5.6 6.0 3.2Sudan 4.7 5.7 0.7 3.7 6.2 7.0 4.5Djibouti 4.1 3.8 1.3 5.0 6.0 7.0 2.0Yemen, Republic of 3.9 4.1 0.7 3.3 5.0 9.0 2.2Mauritania 3.5 3.8 0.7 3.0 3.9 5.0 4.5Algeria 3.2 2.5 3.0 3.5 4.4 4.0 2.3Iran, Islamic Rep. 2.5 1.9 3.3 4.7 0.5 4.0 2.4Syrian Arab Republic 1.1 1.9 0.7 0.0 0.9 0.0 2.4Libya 1.0 1.3 0.7 2.0 0.5 0.0 1.0Average 5.0 5.5 3.3 5.7 5.1 5.9 4.2
Source: Authors' calculations.
1/ Original "subjective" weighted index.2/ Scale: Very low=below 2.5, Low=2.5-5.0, Medium=5.0-6.0, High=6.0-7.5, Very high=above 7.5.
- 14 -
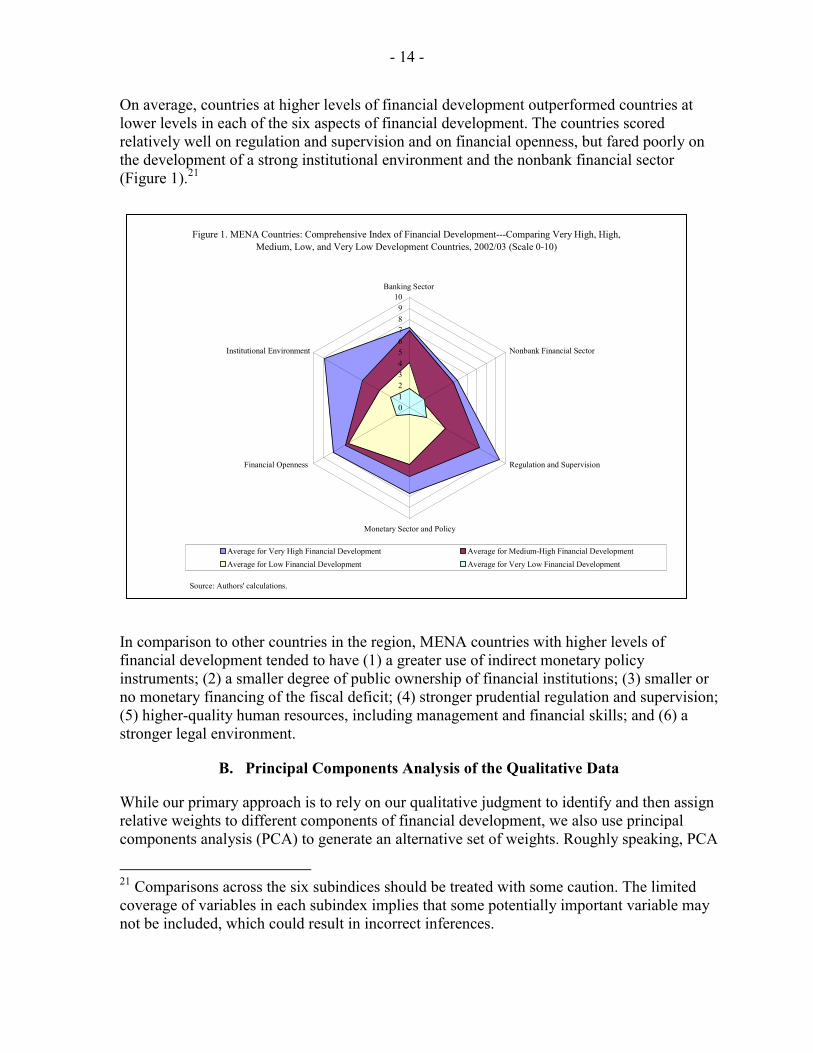
On average, countries at higher levels of financial development outperformed countries at lower levels in each of the six aspects of financial development. The countries scored relatively well on regulation and supervision and on financial openness, but fared poorly on the development of a strong institutional environment and the nonbank financial sector (Figure 1).21
In comparison to other countries in the region, MENA countries with higher levels of financial development tended to have (1) a greater use of indirect monetary policy instruments; (2) a smaller degree of public ownership of financial institutions; (3) smaller or no monetary financing of the fiscal deficit; (4) stronger prudential regulation and supervision; (5) higher-quality human resources, including management and financial skills; and (6) a stronger legal environment.
B. Principal Components Analysis of the Qualitative Data
While our primary approach is to rely on our qualitative judgment to identify and then assign relative weights to different components of financial development, we also use principal components analysis (PCA) to generate an alternative set of weights. Roughly speaking, PCA
21 Comparisons across the six subindices should be treated with some caution. The limited coverage of variables in each subindex implies that some potentially important variable may not be included, which could result in incorrect inferences.
Figure 1. MENA Countries: Comprehensive Index of Financial Development---Comparing Very High, High, Medium, Low, and Very Low Development Countries, 2002/03 (Scale 0-10)
0123456789
10Banking Sector
Nonbank Financial Sector
Regulation and Supervision
Monetary Sector and Policy
Financial Openness
Institutional Environment
Average for Very High Financial Development Average for Medium-High Financial DevelopmentAverage for Low Financial Development Average for Very Low Financial Development
Source: Authors' calculations.
- 15 -
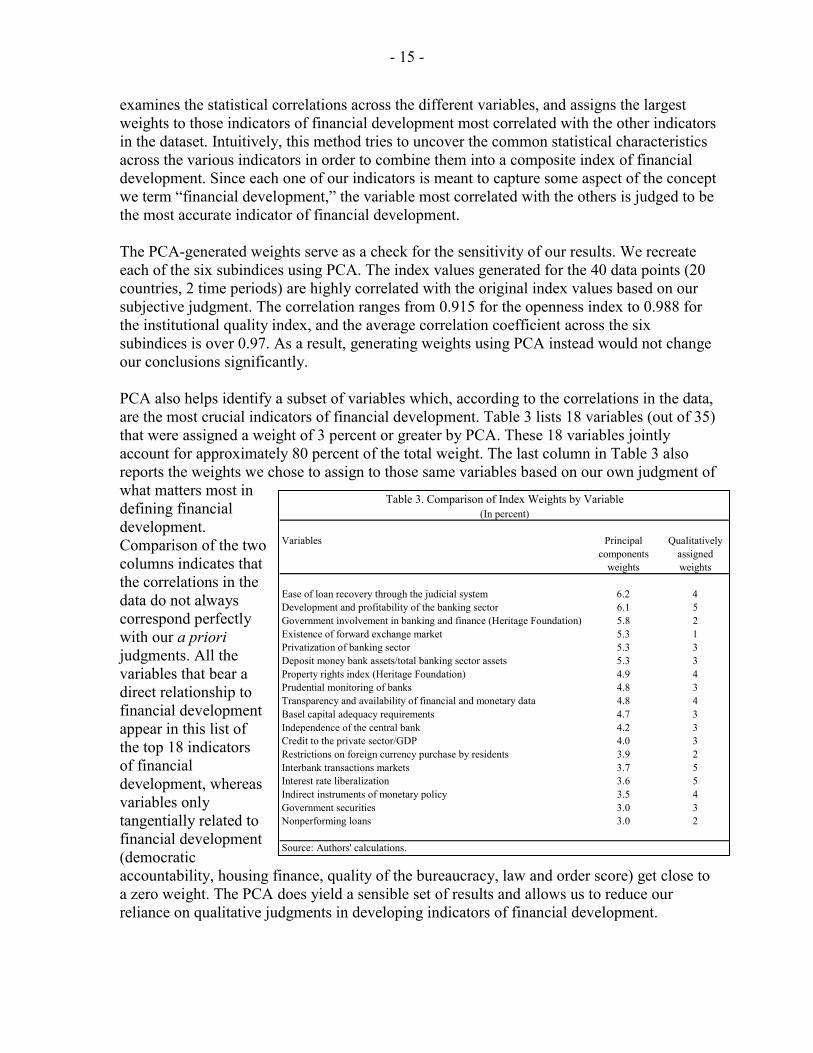
examines the statistical correlations across the different variables, and assigns the largest weights to those indicators of financial development most correlated with the other indicators in the dataset. Intuitively, this method tries to uncover the common statistical characteristics across the various indicators in order to combine them into a composite index of financial development. Since each one of our indicators is meant to capture some aspect of the concept we term “financial development,” the variable most correlated with the others is judged to be the most accurate indicator of financial development. The PCA-generated weights serve as a check for the sensitivity of our results. We recreate each of the six subindices using PCA. The index values generated for the 40 data points (20 countries, 2 time periods) are highly correlated with the original index values based on our subjective judgment. The correlation ranges from 0.915 for the openness index to 0.988 for the institutional quality index, and the average correlation coefficient across the six subindices is over 0.97. As a result, generating weights using PCA instead would not change our conclusions significantly. PCA also helps identify a subset of variables which, according to the correlations in the data, are the most crucial indicators of financial development. Table 3 lists 18 variables (out of 35) that were assigned a weight of 3 percent or greater by PCA. These 18 variables jointly account for approximately 80 percent of the total weight. The last column in Table 3 also reports the weights we chose to assign to those same variables based on our own judgment of what matters most in defining financial development. Comparison of the two columns indicates that the correlations in the data do not always correspond perfectly with our a priori judgments. All the variables that bear a direct relationship to financial development appear in this list of the top 18 indicators of financial development, whereas variables only tangentially related to financial development (democratic accountability, housing finance, quality of the bureaucracy, law and order score) get close to a zero weight. The PCA does yield a sensible set of results and allows us to reduce our reliance on qualitative judgments in developing indicators of financial development.
Variables Principal Qualitativelycomponents assigned
weights weights
Ease of loan recovery through the judicial system 6.2 4Development and profitability of the banking sector 6.1 5Government involvement in banking and finance (Heritage Foundation) 5.8 2Existence of forward exchange market 5.3 1Privatization of banking sector 5.3 3Deposit money bank assets/total banking sector assets 5.3 3Property rights index (Heritage Foundation) 4.9 4Prudential monitoring of banks 4.8 3Transparency and availability of financial and monetary data 4.8 4Basel capital adequacy requirements 4.7 3Independence of the central bank 4.2 3Credit to the private sector/GDP 4.0 3Restrictions on foreign currency purchase by residents 3.9 2Interbank transactions markets 3.7 5Interest rate liberalization 3.6 5Indirect instruments of monetary policy 3.5 4Government securities 3.0 3Nonperforming loans 3.0 2
Source: Authors' calculations.
Table 3. Comparison of Index Weights by Variable(In percent)
- 16 -
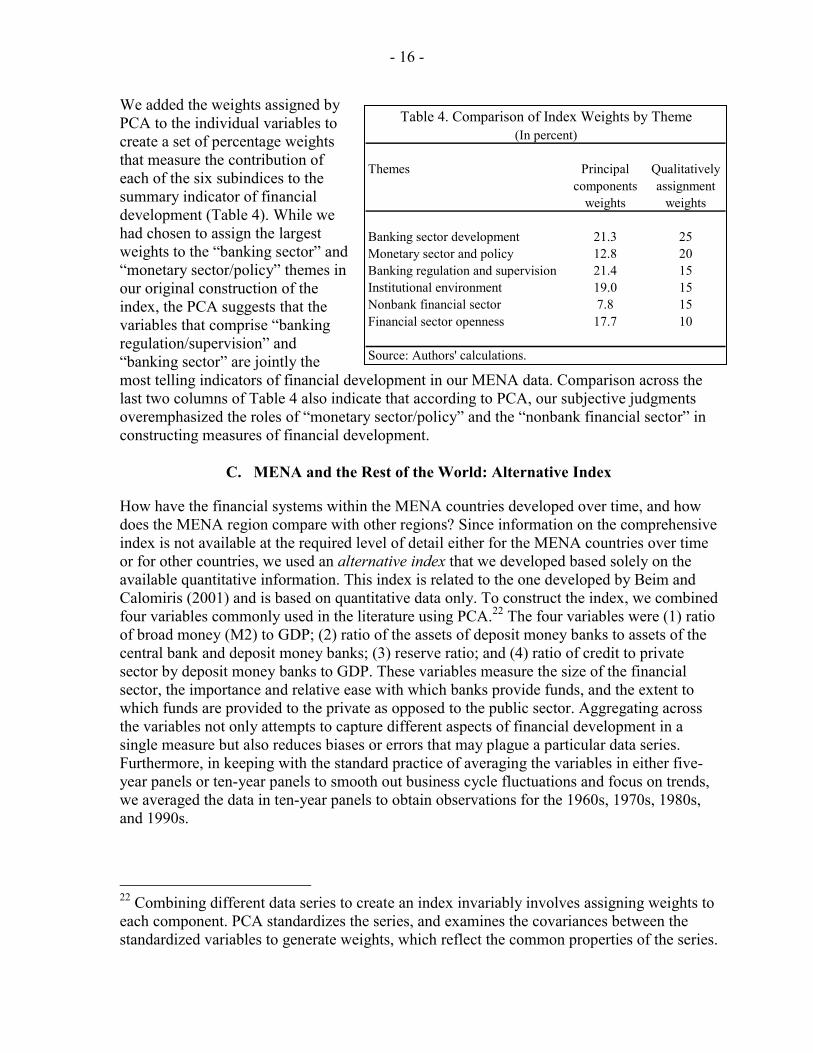
We added the weights assigned by PCA to the individual variables to create a set of percentage weights that measure the contribution of each of the six subindices to the summary indicator of financial development (Table 4). While we had chosen to assign the largest weights to the “banking sector” and “monetary sector/policy” themes in our original construction of the index, the PCA suggests that the variables that comprise “banking regulation/supervision” and “banking sector” are jointly the most telling indicators of financial development in our MENA data. Comparison across the last two columns of Table 4 also indicate that according to PCA, our subjective judgments overemphasized the roles of “monetary sector/policy” and the “nonbank financial sector” in constructing measures of financial development.
C. MENA and the Rest of the World: Alternative Index
How have the financial systems within the MENA countries developed over time, and how does the MENA region compare with other regions? Since information on the comprehensive index is not available at the required level of detail either for the MENA countries over time or for other countries, we used an alternative index that we developed based solely on the available quantitative information. This index is related to the one developed by Beim and Calomiris (2001) and is based on quantitative data only. To construct the index, we combined four variables commonly used in the literature using PCA.22 The four variables were (1) ratio of broad money (M2) to GDP; (2) ratio of the assets of deposit money banks to assets of the central bank and deposit money banks; (3) reserve ratio; and (4) ratio of credit to private sector by deposit money banks to GDP. These variables measure the size of the financial sector, the importance and relative ease with which banks provide funds, and the extent to which funds are provided to the private as opposed to the public sector. Aggregating across the variables not only attempts to capture different aspects of financial development in a single measure but also reduces biases or errors that may plague a particular data series. Furthermore, in keeping with the standard practice of averaging the variables in either five-year panels or ten-year panels to smooth out business cycle fluctuations and focus on trends, we averaged the data in ten-year panels to obtain observations for the 1960s, 1970s, 1980s, and 1990s.
22 Combining different data series to create an index invariably involves assigning weights to each component. PCA standardizes the series, and examines the covariances between the standardized variables to generate weights, which reflect the common properties of the series.
Themes Principal Qualitativelycomponents assignment
weights weights
Banking sector development 21.3 25Monetary sector and policy 12.8 20Banking regulation and supervision 21.4 15Institutional environment 19.0 15Nonbank financial sector 7.8 15Financial sector openness 17.7 10
Source: Authors' calculations.
Table 4. Comparison of Index Weights by Theme(In percent)
- 17 -
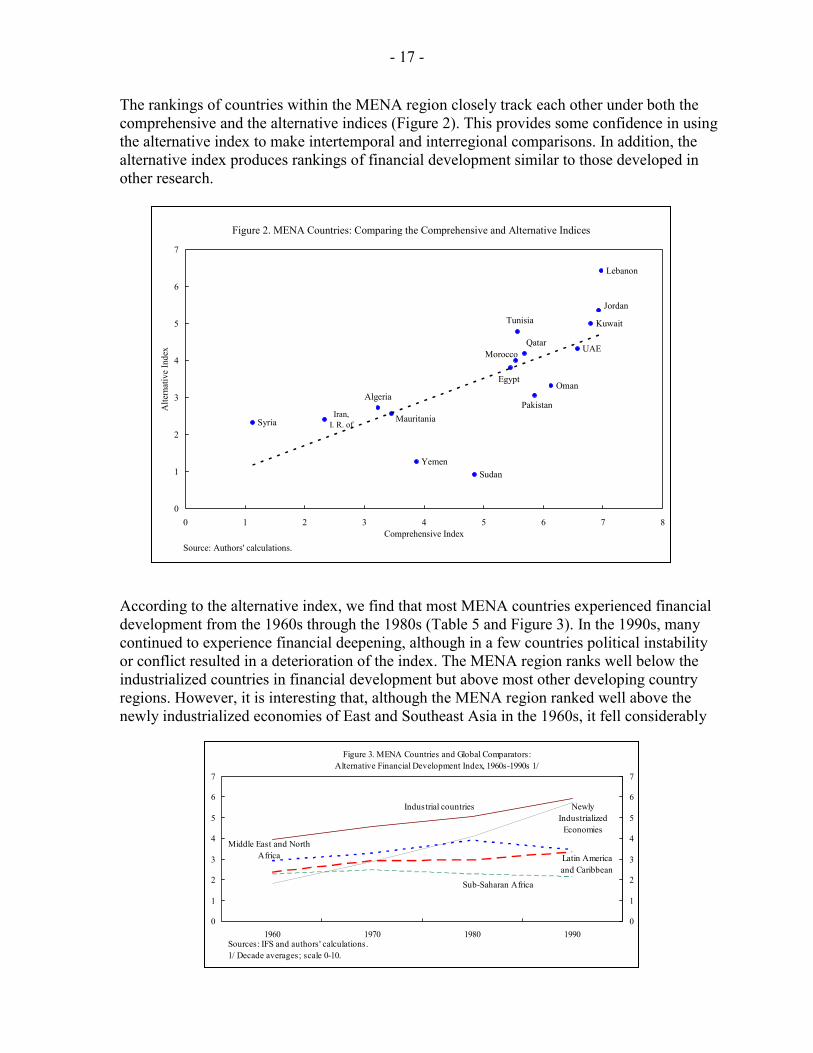
The rankings of countries within the MENA region closely track each other under both the comprehensive and the alternative indices (Figure 2). This provides some confidence in using the alternative index to make intertemporal and interregional comparisons. In addition, the alternative index produces rankings of financial development similar to those developed in other research.
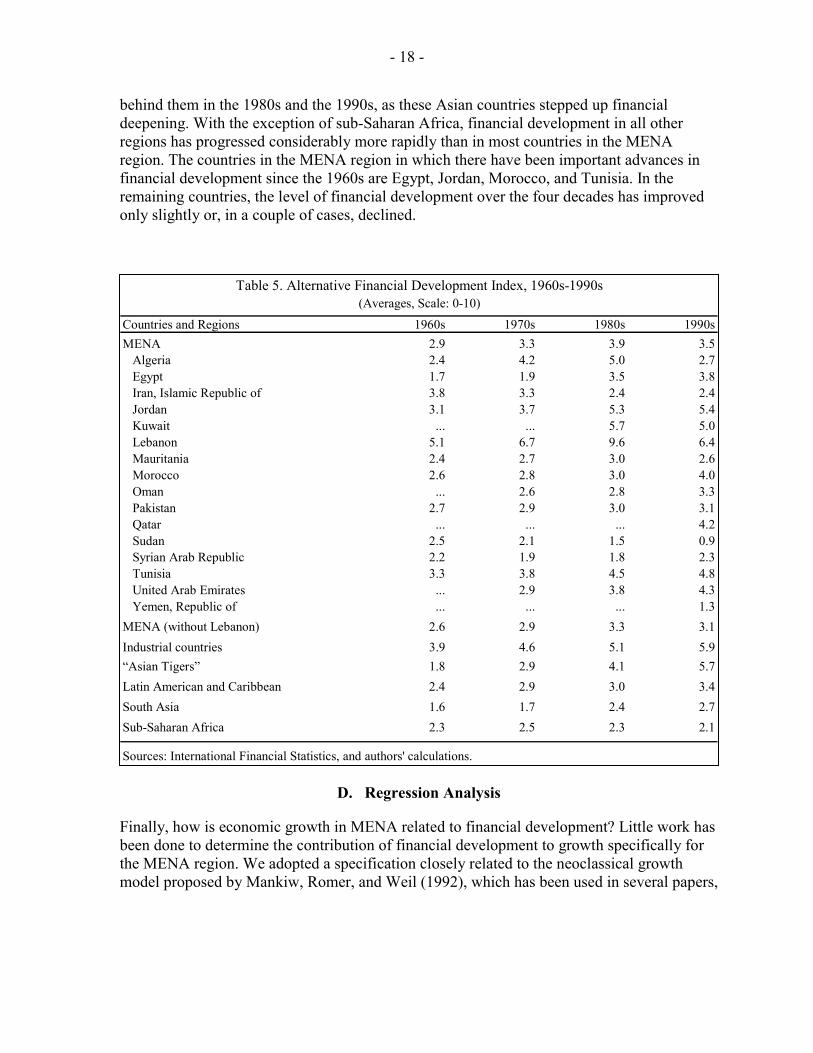
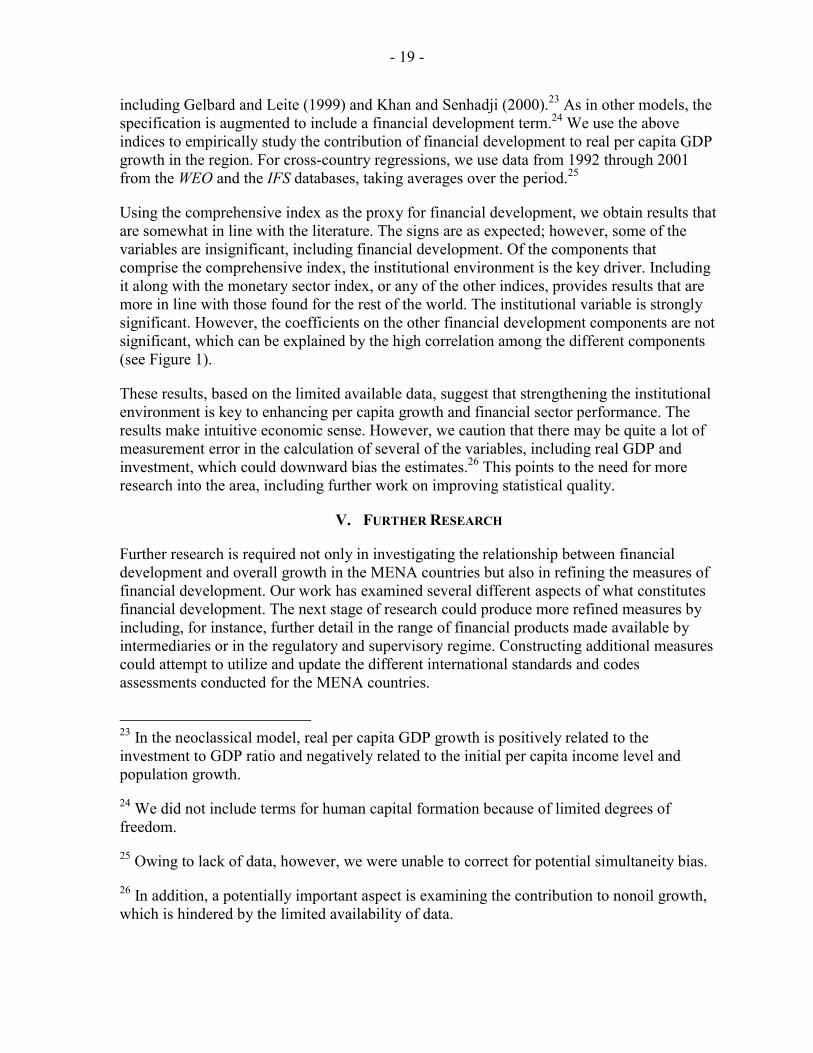
According to the alternative index, we find that most MENA countries experienced financial development from the 1960s through the 1980s (Table 5 and Figure 3). In the 1990s, many continued to experience financial deepening, although in a few countries political instability or conflict resulted in a deterioration of the index. The MENA region ranks well below the industrialized countries in financial development but above most other developing country regions. However, it is interesting that, although the MENA region ranked well above the newly industrialized economies of East and Southeast Asia in the 1960s, it fell considerably
Figure 3. MENA Countries and Global Comparators: Alternative Financial Development Index, 1960s-1990s 1/
Industrial countries
Sub-Saharan Africa
Newly Industrialized
EconomiesMiddle East and North
Africa Latin America and Caribbean
0
1
2
3
4
5
6
7
1960 1970 1980 1990Sources: IFS and authors' calculations.1/ Decade averages; scale 0-10.
0
1
2
3
4
5
6
7
Figure 2. MENA Countries: Comparing the Comprehensive and Alternative Indices
Algeria
Egypt
Iran, I. R. of
Jordan
Kuwait
Lebanon
Mauritania
Morocco
Oman
Pakistan
Qatar
Sudan
Syria
Tunisia
UAE
Yemen
0
1
2
3
4
5
6
7
0 1 2 3 4 5 6 7 8Comprehensive Index
Alte
rnat
ive
Inde
x
Source: Authors' calculations.
- 18 -
behind them in the 1980s and the 1990s, as these Asian countries stepped up financial deepening. With the exception of sub-Saharan Africa, financial development in all other regions has progressed considerably more rapidly than in most countries in the MENA region. The countries in the MENA region in which there have been important advances in financial development since the 1960s are Egypt, Jordan, Morocco, and Tunisia. In the remaining countries, the level of financial development over the four decades has improved only slightly or, in a couple of cases, declined.
D. Regression Analysis
Finally, how is economic growth in MENA related to financial development? Little work has been done to determine the contribution of financial development to growth specifically for the MENA region. We adopted a specification closely related to the neoclassical growth model proposed by Mankiw, Romer, and Weil (1992), which has been used in several papers,
Countries and Regions 1960s 1970s 1980s 1990sMENA 2.9 3.3 3.9 3.5
Algeria 2.4 4.2 5.0 2.7Egypt 1.7 1.9 3.5 3.8Iran, Islamic Republic of 3.8 3.3 2.4 2.4Jordan 3.1 3.7 5.3 5.4Kuwait ... ... 5.7 5.0Lebanon 5.1 6.7 9.6 6.4Mauritania 2.4 2.7 3.0 2.6Morocco 2.6 2.8 3.0 4.0Oman ... 2.6 2.8 3.3Pakistan 2.7 2.9 3.0 3.1Qatar ... ... ... 4.2Sudan 2.5 2.1 1.5 0.9Syrian Arab Republic 2.2 1.9 1.8 2.3Tunisia 3.3 3.8 4.5 4.8United Arab Emirates ... 2.9 3.8 4.3Yemen, Republic of ... ... ... 1.3
MENA (without Lebanon) 2.6 2.9 3.3 3.1Industrial countries 3.9 4.6 5.1 5.9“Asian Tigers” 1.8 2.9 4.1 5.7Latin American and Caribbean 2.4 2.9 3.0 3.4South Asia 1.6 1.7 2.4 2.7Sub-Saharan Africa 2.3 2.5 2.3 2.1
Sources: International Financial Statistics, and authors' calculations.
Table 5. Alternative Financial Development Index, 1960s-1990s(Averages, Scale: 0-10)
- 19 -
including Gelbard and Leite (1999) and Khan and Senhadji (2000).23 As in other models, the specification is augmented to include a financial development term.24 We use the above indices to empirically study the contribution of financial development to real per capita GDP growth in the region. For cross-country regressions, we use data from 1992 through 2001 from the WEO and the IFS databases, taking averages over the period.25
Using the comprehensive index as the proxy for financial development, we obtain results that are somewhat in line with the literature. The signs are as expected; however, some of the variables are insignificant, including financial development. Of the components that comprise the comprehensive index, the institutional environment is the key driver. Including it along with the monetary sector index, or any of the other indices, provides results that are more in line with those found for the rest of the world. The institutional variable is strongly significant. However, the coefficients on the other financial development components are not significant, which can be explained by the high correlation among the different components (see Figure 1).
These results, based on the limited available data, suggest that strengthening the institutional environment is key to enhancing per capita growth and financial sector performance. The results make intuitive economic sense. However, we caution that there may be quite a lot of measurement error in the calculation of several of the variables, including real GDP and investment, which could downward bias the estimates.26 This points to the need for more research into the area, including further work on improving statistical quality.
V. FURTHER RESEARCH
Further research is required not only in investigating the relationship between financial development and overall growth in the MENA countries but also in refining the measures of financial development. Our work has examined several different aspects of what constitutes financial development. The next stage of research could produce more refined measures by including, for instance, further detail in the range of financial products made available by intermediaries or in the regulatory and supervisory regime. Constructing additional measures could attempt to utilize and update the different international standards and codes assessments conducted for the MENA countries.
23 In the neoclassical model, real per capita GDP growth is positively related to the investment to GDP ratio and negatively related to the initial per capita income level and population growth.
24 We did not include terms for human capital formation because of limited degrees of freedom.
25 Owing to lack of data, however, we were unable to correct for potential simultaneity bias.
26 In addition, a potentially important aspect is examining the contribution to nonoil growth, which is hindered by the limited availability of data.
- 20 -
While refining the measure of financial development could be quite resource and time intensive, thus implying somewhat infrequent updates, more frequent monitoring could be undertaken by updating a subset of the variables. The alternative index is one option. However, another option would be to use a subset of the qualitative and quantitative variables used in the comprehensive index. The choice of variables could be driven by the weights provided by the PCA in Table 3. Such a subset would provide a simpler index than the comprehensive index, and would nevertheless be more comprehensive than the alternative index.
VI. CONCLUSIONS
MENA countries have reformed their financial sectors over the past three decades. However, while they have made progress, their efforts have been eclipsed by faster reform and growth in other parts of the world. Against the backdrop of an increasingly globalized world, the challenge for MENA policymakers in moving away from financially repressive policies will be to implement prudent macroeconomic policies, along with structural reforms. Macro-stabilizing measures, in turn, should be complemented by creating the enabling structural environment for financial development, including reduced government intervention in credit allocation and strengthened institutional quality, particularly of the legal system.
Efforts should be concentrated where financial development appears to have been the weakest. For some countries, this means less involvement of the government in the financial system, including cutting back on public ownership of financial institutions and minimizing monetary financing of budget deficits, enhancing competition, investing in human resources, promoting nonbank financial development, and strengthening the legal environment.
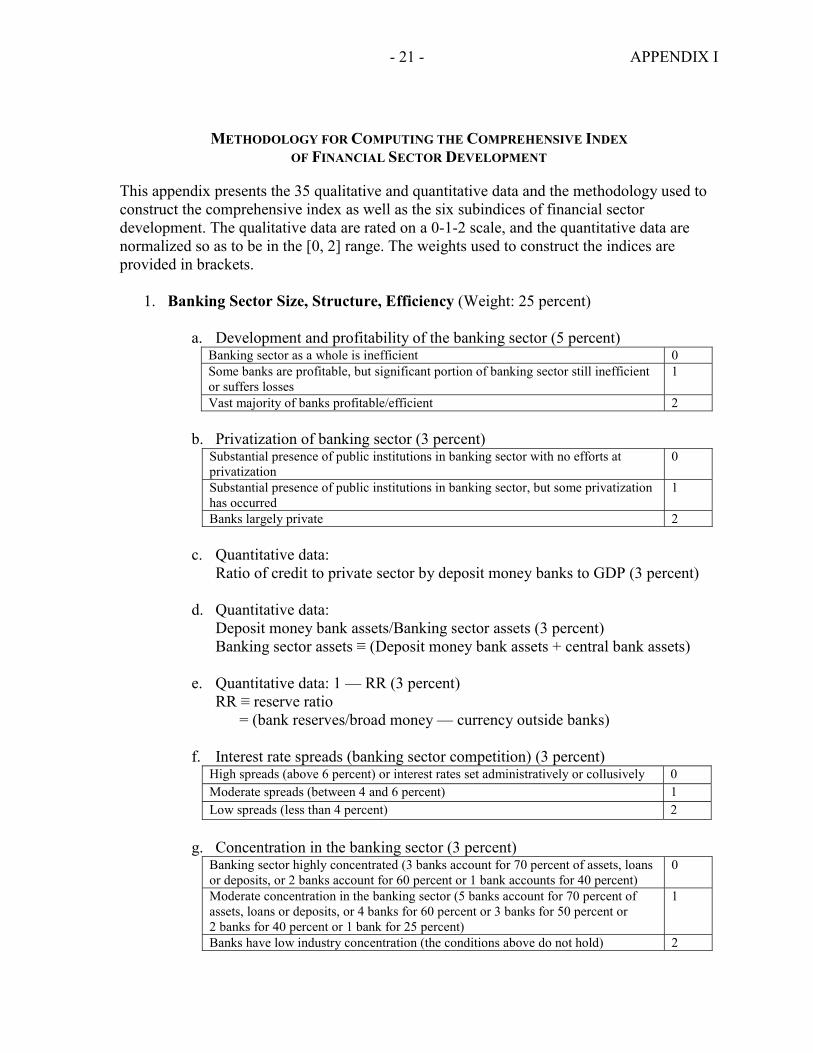
- 21 - APPENDIX I
METHODOLOGY FOR COMPUTING THE COMPREHENSIVE INDEX OF FINANCIAL SECTOR DEVELOPMENT
This appendix presents the 35 qualitative and quantitative data and the methodology used to construct the comprehensive index as well as the six subindices of financial sector development. The qualitative data are rated on a 0-1-2 scale, and the quantitative data are normalized so as to be in the [0, 2] range. The weights used to construct the indices are provided in brackets.
1. Banking Sector Size, Structure, Efficiency (Weight: 25 percent)
a. Development and profitability of the banking sector (5 percent) Banking sector as a whole is inefficient 0 Some banks are profitable, but significant portion of banking sector still inefficient or suffers losses
1
Vast majority of banks profitable/efficient 2
b. Privatization of banking sector (3 percent) Substantial presence of public institutions in banking sector with no efforts at privatization
0
Substantial presence of public institutions in banking sector, but some privatization has occurred
1
Banks largely private 2
c. Quantitative data: Ratio of credit to private sector by deposit money banks to GDP (3 percent)
d. Quantitative data:
Deposit money bank assets/Banking sector assets (3 percent) Banking sector assets ≡ (Deposit money bank assets + central bank assets)
e. Quantitative data: 1 — RR (3 percent)
RR ≡ reserve ratio = (bank reserves/broad money — currency outside banks)
f. Interest rate spreads (banking sector competition) (3 percent)
High spreads (above 6 percent) or interest rates set administratively or collusively 0 Moderate spreads (between 4 and 6 percent) 1 Low spreads (less than 4 percent) 2
g. Concentration in the banking sector (3 percent)
Banking sector highly concentrated (3 banks account for 70 percent of assets, loans or deposits, or 2 banks account for 60 percent or 1 bank accounts for 40 percent)
0
Moderate concentration in the banking sector (5 banks account for 70 percent of assets, loans or deposits, or 4 banks for 60 percent or 3 banks for 50 percent or 2 banks for 40 percent or 1 bank for 25 percent)
1
Banks have low industry concentration (the conditions above do not hold) 2
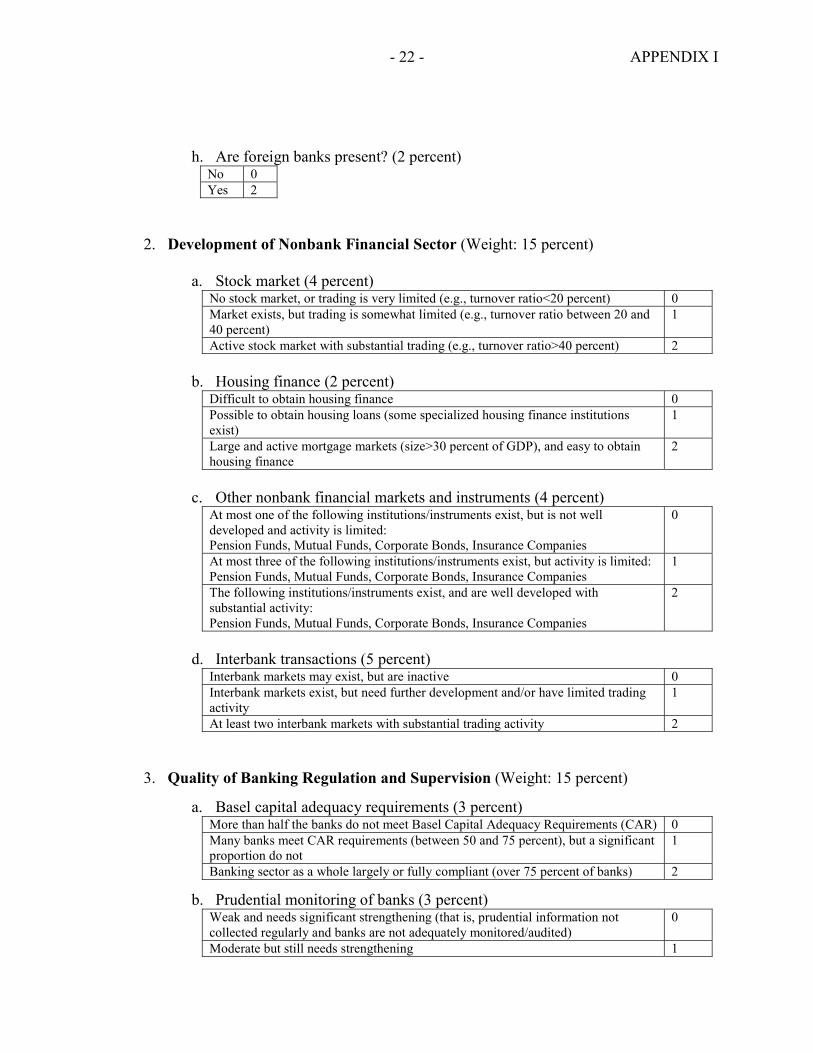
- 22 - APPENDIX I
h. Are foreign banks present? (2 percent)
No 0 Yes 2
2. Development of Nonbank Financial Sector (Weight: 15 percent)
a. Stock market (4 percent)
No stock market, or trading is very limited (e.g., turnover ratio<20 percent) 0 Market exists, but trading is somewhat limited (e.g., turnover ratio between 20 and 40 percent)
1
Active stock market with substantial trading (e.g., turnover ratio>40 percent) 2
b. Housing finance (2 percent) Difficult to obtain housing finance 0 Possible to obtain housing loans (some specialized housing finance institutions exist)
1
Large and active mortgage markets (size>30 percent of GDP), and easy to obtain housing finance
2
c. Other nonbank financial markets and instruments (4 percent)
At most one of the following institutions/instruments exist, but is not well developed and activity is limited: Pension Funds, Mutual Funds, Corporate Bonds, Insurance Companies
0
At most three of the following institutions/instruments exist, but activity is limited: Pension Funds, Mutual Funds, Corporate Bonds, Insurance Companies
1
The following institutions/instruments exist, and are well developed with substantial activity: Pension Funds, Mutual Funds, Corporate Bonds, Insurance Companies
2
d. Interbank transactions (5 percent)
Interbank markets may exist, but are inactive 0 Interbank markets exist, but need further development and/or have limited trading activity
1
At least two interbank markets with substantial trading activity 2
3. Quality of Banking Regulation and Supervision (Weight: 15 percent)
a. Basel capital adequacy requirements (3 percent) More than half the banks do not meet Basel Capital Adequacy Requirements (CAR) 0 Many banks meet CAR requirements (between 50 and 75 percent), but a significant proportion do not
1
Banking sector as a whole largely or fully compliant (over 75 percent of banks) 2
b. Prudential monitoring of banks (3 percent) Weak and needs significant strengthening (that is, prudential information not collected regularly and banks are not adequately monitored/audited)
0
Moderate but still needs strengthening 1
- 23 - APPENDIX I
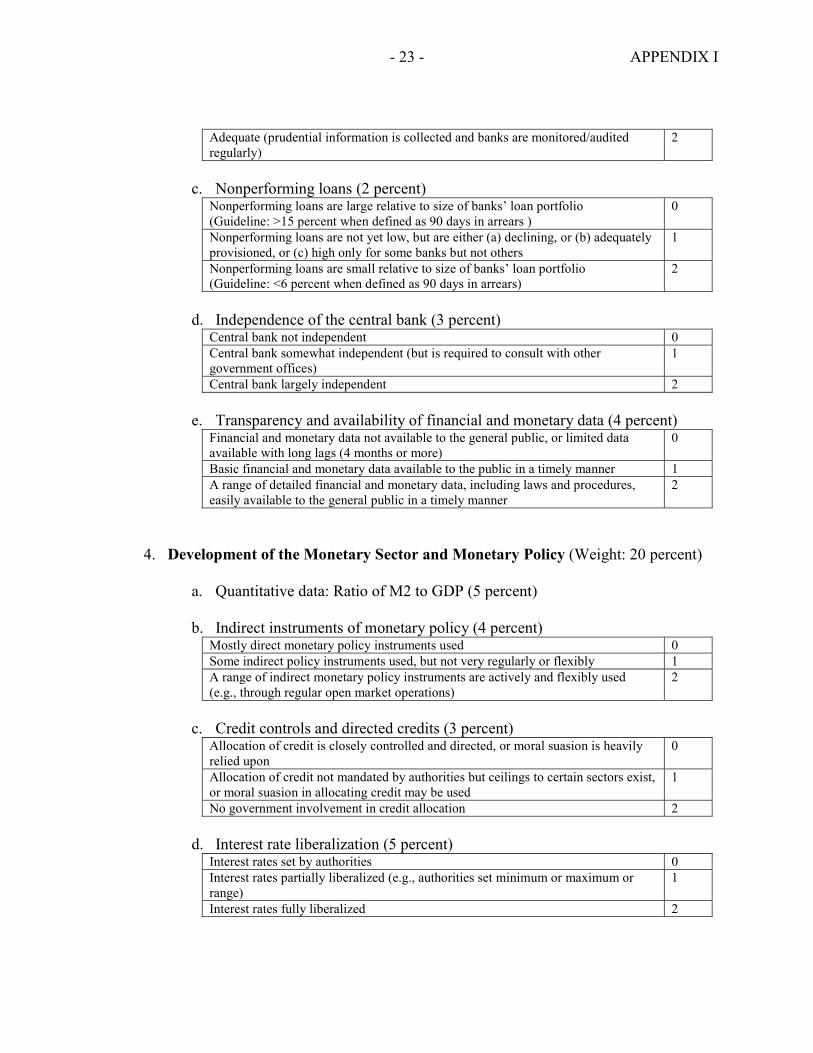
Adequate (prudential information is collected and banks are monitored/audited regularly)
2
c. Nonperforming loans (2 percent)
Nonperforming loans are large relative to size of banks’ loan portfolio (Guideline: >15 percent when defined as 90 days in arrears )
0
Nonperforming loans are not yet low, but are either (a) declining, or (b) adequately provisioned, or (c) high only for some banks but not others
1
Nonperforming loans are small relative to size of banks’ loan portfolio (Guideline: <6 percent when defined as 90 days in arrears)
2
d. Independence of the central bank (3 percent)
Central bank not independent 0 Central bank somewhat independent (but is required to consult with other government offices)
1
Central bank largely independent 2
e. Transparency and availability of financial and monetary data (4 percent) Financial and monetary data not available to the general public, or limited data available with long lags (4 months or more)
0
Basic financial and monetary data available to the public in a timely manner 1 A range of detailed financial and monetary data, including laws and procedures, easily available to the general public in a timely manner
2
4. Development of the Monetary Sector and Monetary Policy (Weight: 20 percent)
a. Quantitative data: Ratio of M2 to GDP (5 percent) b. Indirect instruments of monetary policy (4 percent)
Mostly direct monetary policy instruments used 0 Some indirect policy instruments used, but not very regularly or flexibly 1 A range of indirect monetary policy instruments are actively and flexibly used (e.g., through regular open market operations)
2
c. Credit controls and directed credits (3 percent)
Allocation of credit is closely controlled and directed, or moral suasion is heavily relied upon
0
Allocation of credit not mandated by authorities but ceilings to certain sectors exist, or moral suasion in allocating credit may be used
1
No government involvement in credit allocation 2
d. Interest rate liberalization (5 percent) Interest rates set by authorities 0 Interest rates partially liberalized (e.g., authorities set minimum or maximum or range)
1
Interest rates fully liberalized 2

- 24 - APPENDIX I
e. Government securities (3 percent) Government securities (T-bills) do not exist or are not auctioned or distributed via market mechanisms
0
Government securities exist and are auctioned or distributed using market mechanisms, but there is no active secondary market
1
Government securities exist, are auctioned or distributed through some market mechanism, and there are active secondary markets
2
5. Financial Sector Openness (Weight 10 percent)
a. Appropriate market determined exchange rate (2 percent)
Not appropriate 0 Somewhat appropriate 1 Appropriate 2
b. Multiple exchange rates or parallel markets (1 percent)
Yes 0 No 2
c. Restrictions on foreign currency purchases by residents (2 percent)
Yes 0 No 2
d. Restrictions on the financial activities of nonresidents (2 percent)
Yes 0 No 2
e. Forward exchange market (1 percent)
No 0 Yes 2
f. Repatriation requirements (1 percent)
Yes 0 No 2
g. Article VIII status (1 percent)
No 0 Yes 2
6. Institutional Environment (Weight: 15 percent)
a. Is it easy to recover loans through the judicial system? (4 percent)
Difficult 0 Moderately difficult 1 Yes, the judicial system helps process of loan recovery 2
b. Quantitative data: law and order tradition (Source: ICRG) (1 percent)
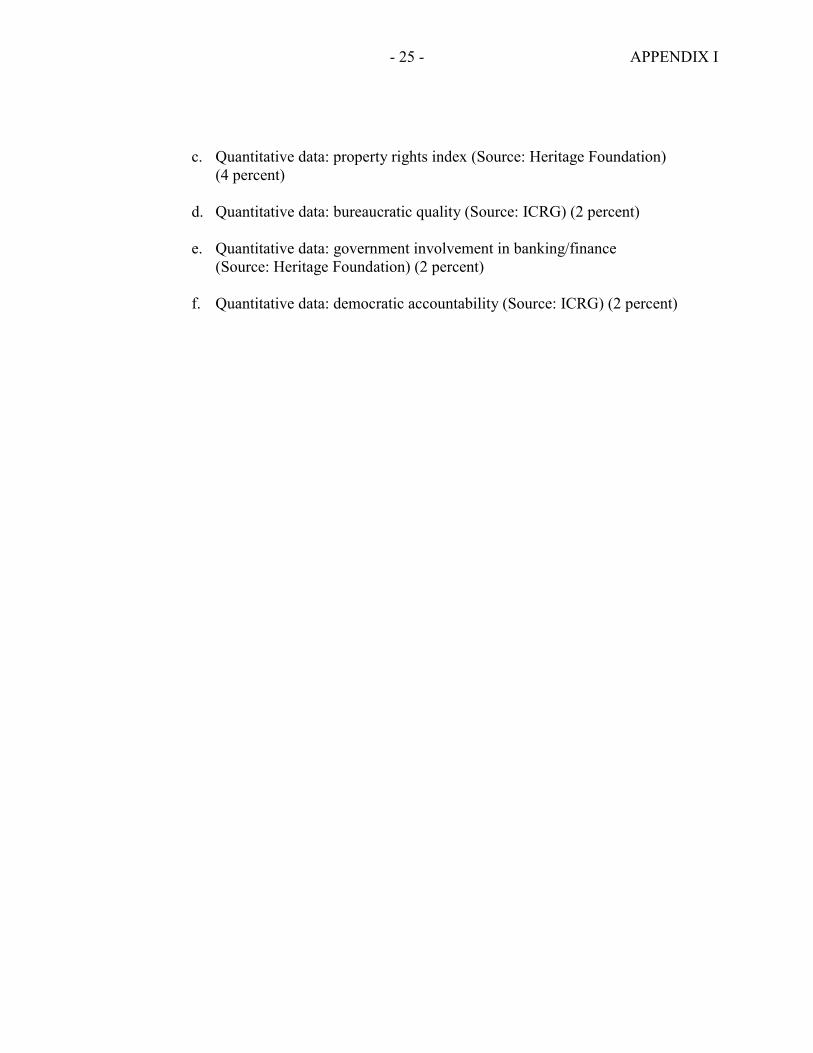
- 25 - APPENDIX I
c. Quantitative data: property rights index (Source: Heritage Foundation)
(4 percent) d. Quantitative data: bureaucratic quality (Source: ICRG) (2 percent) e. Quantitative data: government involvement in banking/finance
(Source: Heritage Foundation) (2 percent) f. Quantitative data: democratic accountability (Source: ICRG) (2 percent)

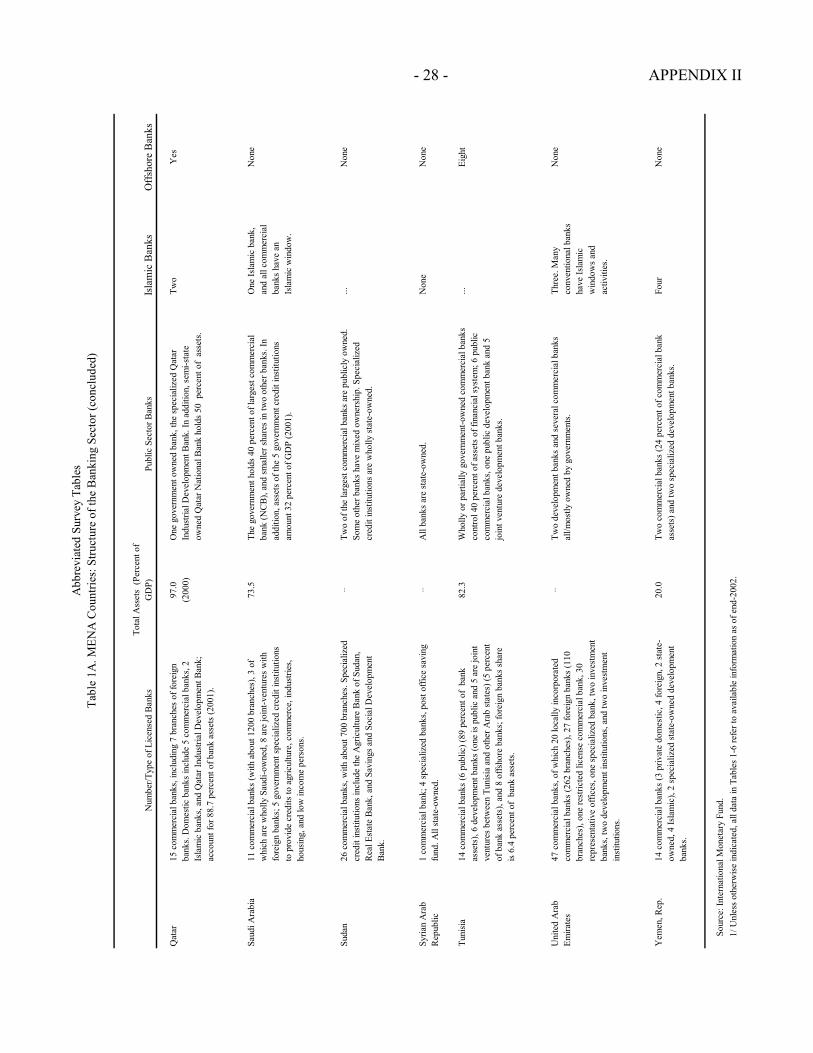
- 26 - APPENDIX II
Num
ber/T
ype
of L
icen
sed
Ban
ks
Tota
l Ass
ets
(Per
cent
of
GD
P)Pu
blic
Sec
tor B
anks
Isla
mic
Ban
ksO
ffsho
re B
anks
Alg
eria
19 c
omm
erci
al b
anks
, of w
hich
6 p
ublic
ban
ks
(incl
udin
g C
NEP
, for
mer
savi
ngs a
nd h
ousin
g ba
nk).
Priv
ate
bank
s allo
wed
to e
nter
sinc
e 19
90s b
ut
repr
esen
t sm
all s
hare
of b
anki
ng se
ctor
.
50.0
6 pu
blic
ban
ks (1
050
bran
ches
); sh
are
of a
sset
s and
de
posit
s 95
perc
ent.
Abo
ut 5
5 pe
rcen
t of n
et
dom
estic
ass
ets a
re c
laim
s on
the
gove
rnm
ent.
One
One
Bahr
ain
21 c
omm
erci
al b
anks
(4 Is
lam
ic);
2 sp
ecia
lized
ban
ks;
47 o
ffsho
re b
anks
; 32
inve
stm
ent b
anks
(14
Isla
mic
); an
d 27
fore
ign
bank
offi
ces.
130.
0
(200
1)Th
e tw
o m
ajor
ity st
ate-
owne
d (s
peci
aliz
ed) b
anks
' as
sets
acc
ount
for 0
.3 p
erce
nt o
f ban
k as
sets
. 4
com
mer
cial
, 14
inve
stm
ent,
2 of
fsho
re b
anks
.
47
Djib
outi
3 ac
tive
com
mer
cial
ban
ks. 2
are
100
per
cent
fore
ign
owne
d, a
third
is 3
3 pe
rcen
t gov
ernm
ent o
wne
d. A
lso a
de
velo
pmen
t ban
k (5
1 pe
rcen
t gov
ernm
ent,
28 p
erce
nt
fore
ign
owne
d) w
hich
is b
eing
liqu
idat
ed. A
priv
ate
sect
or d
evel
opm
ent f
und
has b
een
auth
oriz
ed to
ext
end
cred
it to
smal
l and
med
ium
-siz
e en
terp
rises
.
73.5
1 co
mm
erci
al b
ank
has 3
3 pe
rcen
t gov
ernm
ent
owne
rshi
p. D
evel
opm
ent b
ank
has 5
1 pe
rcen
t go
vern
men
t ow
ners
hip.
Non
eN
one
Egyp
t81
ban
ks:
28 c
omm
erci
al b
anks
(4 st
ate-
owne
d), 3
2 in
vest
men
t and
bus
ines
s ban
ks (o
f whi
ch 2
1 ar
e br
anch
es o
f for
eign
ban
ks),
21 sp
ecia
lized
ban
ks (1
in
dust
rial,
2 re
al e
stat
e an
d 18
agr
icul
tura
l ban
ks).
The
agric
ultu
ral b
anks
ope
rate
thro
ugh
2223
ban
king
uni
ts.
125.
0
(200
1)4
stat
e-ow
ned
com
mer
cial
ban
k an
d N
atio
nal
Inve
stm
ent b
ank;
in a
dditi
on, p
ublic
sect
or b
anks
and
in
sura
nce
com
pani
es o
wn
larg
e sh
ares
of p
rivat
e ba
nks.
Yes
N
one
Iran,
Isla
mic
Rep
. of
10 st
ate-
owne
d ba
nks,
incl
udin
g six
full-
serv
ice
com
mer
cial
ban
ks, f
our
spec
ializ
ed. B
ranc
hes:
14,5
18
in 1
998/
99, 1
1,63
4 in
199
4/95
. Thr
ee p
rivat
e ba
nks a
re
curr
ently
ope
ratio
nal.
42.0
Ten
publ
ic b
anks
.A
ll ba
nks m
ust
conf
orm
to Is
lam
ic
prin
cipl
es.
Non
e
Jord
an9
loca
l com
mer
cial
ban
ks, 2
Isla
mic
com
mer
cial
ban
ks,
5 in
vest
men
t ban
ks, 5
fore
ign
bank
s, an
d 5
spec
ializ
ed
cred
it in
stitu
tions
. For
eign
ban
ks p
lay
a sm
all r
ole
in
the
bank
ing
sect
or.
220.
0N
o pu
blic
sect
or b
anks
.Tw
o co
mm
erci
al
bank
s. N
one
Kuw
ait
7 co
mm
erci
al b
anks
, 2 sp
ecia
lized
ban
ks; n
o fo
reig
n ba
nks.
168.
0G
over
nmen
t has
hol
ding
s in
five
loca
l ban
ks,
incl
udin
g th
e tw
o sp
ecia
lized
ban
ks (t
he K
uwai
t Fi
nanc
e H
ouse
is 6
6 pe
rcen
t ow
ned
and
the
Indu
stria
l Ban
k 50
per
cent
ow
ned
by th
e go
vern
men
t); a
lso sm
alle
r hol
ding
s in
Bank
of
Kuw
ait a
nd M
iddl
e Ea
st a
nd th
e R
eal E
stat
e Ba
nk.
One
Non
e
Tabl
e 1A
. MEN
A C
ount
ries:
Stru
ctur
e of
the
Ban
king
Sec
tor 1
/A
bbre
viat
ed S
urve
y Ta
bles
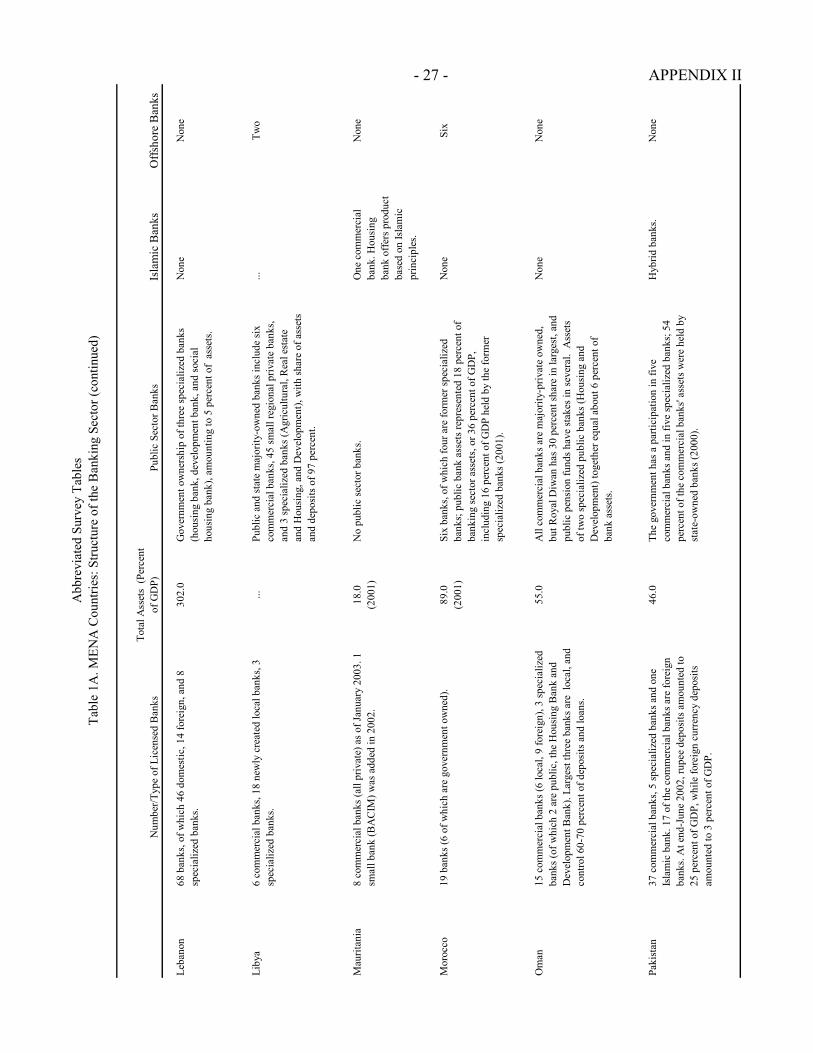
- 27 - APPENDIX II
Num
ber/T
ype
of L
icen
sed
Ban
ks
Tota
l Ass
ets
(Per
cent
of
GD
P)Pu
blic
Sec
tor B
anks
Isla
mic
Ban
ksO
ffsho
re B
anks
Leba
non
68 b
anks
, of w
hich
46
dom
estic
, 14
fore
ign,
and
8
spec
ializ
ed b
anks
.
302.
0G
over
nmen
t ow
ners
hip
of th
ree
spec
ializ
ed b
anks
(h
ousi
ng b
ank,
dev
elop
men
t ban
k, a
nd so
cial
ho
usin
g ba
nk),
amou
ntin
g to
5 p
erce
nt o
f as
sets
.
Non
eN
one
Liby
a6
com
mer
cial
ban
ks, 1
8 ne
wly
cre
ated
loca
l ban
ks, 3
sp
ecia
lized
ban
ks.
...Pu
blic
and
stat
e m
ajor
ity-o
wne
d ba
nks i
nclu
de si
x co
mm
erci
al b
anks
, 45
smal
l reg
iona
l priv
ate
bank
s, an
d 3
spec
ializ
ed b
anks
(Agr
icul
tura
l, R
eal e
stat
e an
d H
ousi
ng, a
nd D
evel
opm
ent),
with
shar
e of
ass
ets
and
depo
sits
of 9
7 pe
rcen
t.
...Tw
o
Mau
ritan
ia8
com
mer
cial
ban
ks (a
ll pr
ivat
e) a
s of J
anua
ry 2
003.
1
smal
l ban
k (B
AC
IM) w
as a
dded
in 2
002.
18
.0
(2
001)
No
publ
ic se
ctor
ban
ks.
One
com
mer
cial
ba
nk. H
ousi
ng
bank
off
ers p
rodu
ct
base
d on
Isla
mic
pr
inci
ples
.
Non
e
Mor
occo
19 b
anks
(6 o
f whi
ch a
re g
over
nmen
t ow
ned)
.89
.0
(2
001)
Six
bank
s, of
whi
ch fo
ur a
re fo
rmer
spec
ializ
ed
bank
s; p
ublic
ban
k as
sets
repr
esen
ted
18 p
erce
nt o
f ba
nkin
g se
ctor
ass
ets,
or 3
6 pe
rcen
t of G
DP,
in
clud
ing
16 p
erce
nt o
f GD
P he
ld b
y th
e fo
rmer
sp
ecia
lized
ban
ks (2
001)
.
Non
eSi
x
Om
an15
com
mer
cial
ban
ks (6
loca
l, 9
fore
ign)
, 3 sp
ecia
lized
ba
nks (
of w
hich
2 a
re p
ublic
, the
Hou
sing
Ban
k an
d D
evel
opm
ent B
ank)
. Lar
gest
thre
e ba
nks a
re l
ocal
, and
co
ntro
l 60-
70 p
erce
nt o
f dep
osits
and
loan
s.
55.0
All
com
mer
cial
ban
ks a
re m
ajor
ity-p
rivat
e ow
ned,
bu
t Roy
al D
iwan
has
30
perc
ent s
hare
in la
rges
t, an
d pu
blic
pen
sion
fund
s ha
ve st
akes
in se
vera
l. A
sset
s of
two
spec
ializ
ed p
ublic
ban
ks (H
ousi
ng a
nd
Dev
elop
men
t) to
geth
er e
qual
abo
ut 6
per
cent
of
bank
ass
ets.
Non
eN
one
Paki
stan
37 c
omm
erci
al b
anks
, 5 sp
ecia
lized
ban
ks a
nd o
ne
Isla
mic
ban
k. 1
7 of
the
com
mer
cial
ban
ks a
re fo
reig
n ba
nks.
At e
nd-J
une
2002
, rup
ee d
epos
its a
mou
nted
to
25 p
erce
nt o
f GD
P, w
hile
fore
ign
curr
ency
dep
osits
am
ount
ed to
3 p
erce
nt o
f GD
P.
46.0
The
gove
rnm
ent h
as a
par
ticip
atio
n in
five
co
mm
erci
al b
anks
and
in fi
ve sp
ecia
lized
ban
ks; 5
4 pe
rcen
t of t
he c
omm
erci
al b
anks
' ass
ets w
ere
held
by
stat
e-ow
ned
bank
s (20
00).
Hyb
rid b
anks
.N
one
Tabl
e 1A
. MEN
A C
ount
ries:
Stru
ctur
e of
the
Ban
king
Sec
tor (
cont
inue
d)A
bbre
viat
ed S
urve
y Ta
bles
- 28 - APPENDIX II
Num
ber/T
ype
of L
icen
sed
Bank
s To
tal A
sset
s (P
erce
nt o
f G
DP)
Publ
ic S
ecto
r Ban
ksIs
lam
ic B
anks
Offs
hore
Ban
ks
Qat
ar15
com
mer
cial
ban
ks, i
nclu
ding
7 b
ranc
hes
of fo
reig
n ba
nks.
Dom
estic
ban
ks in
clud
e 5
com
mer
cial
ban
ks, 2
Is
lam
ic b
anks
, and
Qat
ar In
dust
rial D
evel
opm
ent B
ank;
ac
coun
t for
88.
7 pe
rcen
t of b
ank
asse
ts (2
001)
.
97.0
(200
0)O
ne g
over
nmen
t ow
ned
bank
, the
spec
ializ
ed Q
atar
In
dust
rial D
evel
opm
ent B
ank.
In a
dditi
on, s
emi-s
tate
ow
ned
Qat
ar N
atio
nal B
ank
hold
s 50
per
cent
of
asse
ts.
Two
Yes
Saud
i Ara
bia
11 c
omm
erci
al b
anks
(with
abo
ut 1
200
bran
ches
), 3
of
whi
ch a
re w
holly
Sau
di-o
wne
d, 8
are
join
t-ven
ture
s with
fo
reig
n ba
nks;
5 g
over
nmen
t spe
cial
ized
cre
dit i
nstit
utio
ns
to p
rovi
de c
redi
ts to
agr
icul
ture
, com
mer
ce, i
ndus
tries
, ho
usin
g, a
nd lo
w in
com
e pe
rson
s.
73.5
The
gove
rnm
ent h
olds
40
perc
ent o
f lar
gest
com
mer
cial
ba
nk (N
CB)
, and
smal
ler s
hare
s in
two
othe
r ban
ks. I
n ad
ditio
n, a
sset
s of t
he 5
gov
ernm
ent c
redi
t ins
titut
ions
am
ount
32
perc
ent o
f GD
P (2
001)
.
One
Isla
mic
ban
k,
and
all c
omm
erci
al
bank
s hav
e an
Is
lam
ic w
indo
w.
Non
e
Suda
n26
com
mer
cial
ban
ks, w
ith a
bout
700
bra
nche
s. Sp
ecia
lized
cr
edit
inst
itutio
ns in
clud
e th
e A
gric
ultu
re B
ank
of S
udan
, R
eal E
stat
e Ba
nk, a
nd S
avin
gs a
nd S
ocia
l Dev
elop
men
t Ba
nk.
...Tw
o of
the
larg
est c
omm
erci
al b
anks
are
pub
licly
ow
ned.
So
me
othe
r ban
ks h
ave
mix
ed o
wne
rshi
p. S
peci
aliz
ed
cred
it in
stitu
tions
are
who
lly st
ate-
owne
d.
...N
one
Syria
n A
rab
Rep
ublic
1 co
mm
erci
al b
ank;
4 sp
ecia
lized
ban
ks, p
ost o
ffice
savi
ng
fund
. All
stat
e-ow
ned.
...A
ll ba
nks a
re st
ate-
owne
d.N
one
Non
e
Tuni
sia14
com
mer
cial
ban
ks (6
pub
lic) (
89 p
erce
nt o
f ba
nk
asse
ts),
6 de
velo
pmen
t ban
ks (o
ne is
pub
lic a
nd 5
are
join
t ve
ntur
es b
etw
een
Tuni
sia a
nd o
ther
Ara
b st
ates
) (5
perc
ent
of b
ank
asse
ts),
and
8 of
fsho
re b
anks
; for
eign
ban
ks sh
are
is 6.
4 pe
rcen
t of
bank
ass
ets.
82.3
Who
lly o
r par
tially
gov
ernm
ent-o
wne
d co
mm
erci
al b
anks
co
ntro
l 40
perc
ent o
f ass
ets o
f fin
anci
al sy
stem
; 6 p
ublic
co
mm
erci
al b
anks
, one
pub
lic d
evel
opm
ent b
ank
and
5 jo
int v
entu
re d
evel
opm
ent b
anks
.
...Ei
ght
Uni
ted
Ara
b Em
irate
s47
com
mer
cial
ban
ks, o
f whi
ch 2
0 lo
cally
inco
rpor
ated
co
mm
erci
al b
anks
(262
bra
nche
s), 2
7 fo
reig
n ba
nks (
110
bran
ches
), on
e re
stric
ted
licen
se c
omm
erci
al b
ank,
30
repr
esen
tativ
e of
fices
, one
spec
ializ
ed b
ank,
two
inve
stm
ent
bank
s, tw
o de
velo
pmen
t ins
titut
ions
, and
two
inve
stm
ent
inst
itutio
ns.
...Tw
o de
velo
pmen
t ban
ks a
nd se
vera
l com
mer
cial
ban
ks
all/m
ostly
ow
ned
by g
over
nmen
ts.
Thre
e. M
any
conv
entio
nal b
anks
ha
ve Is
lam
ic
win
dow
s and
ac
tiviti
es.
Non
e
Yem
en, R
ep.
14 c
omm
erci
al b
anks
(3 p
rivat
e do
mes
tic, 4
fore
ign,
2 st
ate-
owne
d, 4
Isla
mic
), 2
spec
ializ
ed st
ate-
owne
d de
velo
pmen
t ba
nks.
20.0
Two
com
mer
cial
ban
ks (2
4 pe
rcen
t of c
omm
erci
al b
ank
asse
ts) a
nd tw
o sp
ecia
lized
dev
elop
men
t ban
ks.
Four
Non
e
Sour
ce: I
nter
natio
nal M
onet
ary
Fund
.
1/ U
nles
s oth
erw
ise
indi
cate
d, a
ll da
ta in
Tab
les 1
-6 re
fer t
o av
aila
ble
info
rmat
ion
as o
f end
-200
2.
Tabl
e 1A
. MEN
A C
ount
ries:
Stru
ctur
e of
the
Ban
king
Sec
tor (
conc
lude
d)A
bbre
viat
ed S
urve
y Ta
bles
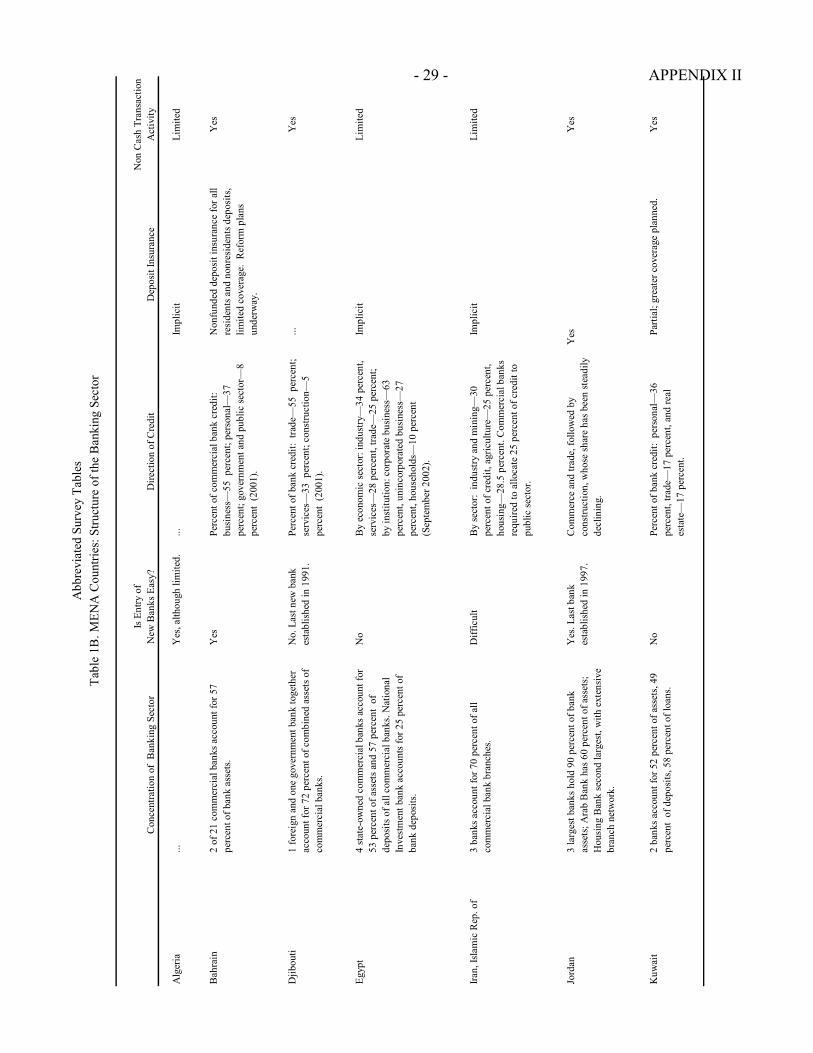
- 29 - APPENDIX II
Con
cent
ratio
n of
Ban
king
Sec
tor
Is E
ntry
of
N
ew B
anks
Eas
y?D
irect
ion
of C
redi
tD
epos
it In
sura
nce
Non
Cas
h Tr
ansa
ctio
n A
ctiv
ity
Alg
eria
...Y
es, a
lthou
gh li
mite
d....
Impl
icit
Li
mite
d
Bah
rain
2 of
21
com
mer
cial
ban
ks a
ccou
nt fo
r 57
perc
ent o
f ban
k as
sets
.Y
esPe
rcen
t of c
omm
erci
al b
ank
cred
it:
busi
ness
—55
per
cent
; per
sona
l—37
pe
rcen
t; go
vern
men
t and
pub
lic se
ctor
—8
pe
rcen
t (2
001)
.
Non
fund
ed d
epos
it in
sura
nce
for a
ll
resi
dent
s and
non
resi
dent
s dep
osits
, lim
ited
cove
rage
. R
efor
m p
lans
un
derw
ay.
Yes
Djib
outi
1 fo
reig
n an
d on
e go
vern
men
t ban
k to
geth
er
acco
unt f
or 7
2 pe
rcen
t of c
ombi
ned
asse
ts o
f co
mm
erci
al b
anks
.
No.
Las
t new
ban
k es
tabl
ishe
d in
199
1.
Perc
ent o
f ban
k cr
edit:
tra
de—
55 p
erce
nt;
serv
ices
—33
per
cent
; con
stru
ctio
n—5
pe
rcen
t (2
001)
.
...Y
es
Egyp
t4
stat
e-ow
ned
com
mer
cial
ban
ks a
ccou
nt fo
r 53
per
cent
of a
sset
s and
57
perc
ent
of
depo
sits
of a
ll co
mm
erci
al b
anks
. Nat
iona
l In
vest
men
t ban
k ac
coun
ts fo
r 25
perc
ent o
f ba
nk d
epos
its.
No
By
econ
omic
sect
or: i
ndus
try—
34 p
erce
nt,
serv
ices
—28
per
cent
, tra
de—
25 p
erce
nt;
by in
stitu
tion:
cor
pora
te b
usin
ess—
63
perc
ent,
unin
corp
orat
ed b
usin
ess—
27
perc
ent,
hous
ehol
ds—
10 p
erce
nt
(Sep
tem
ber 2
002)
.
Impl
icit
Lim
ited
Iran,
Isla
mic
Rep
. of
3 ba
nks a
ccou
nt fo
r 70
perc
ent o
f all
com
mer
cial
ban
k br
anch
es.
Diff
icul
tB
y se
ctor
: in
dust
ry a
nd m
inin
g—30
pe
rcen
t of c
redi
t, ag
ricul
ture
—25
per
cent
, ho
usin
g—28
.5 p
erce
nt. C
omm
erci
al b
anks
re
quire
d to
allo
cate
25
perc
ent o
f cre
dit t
o pu
blic
sect
or.
Impl
icit
Lim
ited
Jord
an3
larg
est b
anks
hol
d 90
per
cent
of b
ank
asse
ts; A
rab
Ban
k ha
s 60
perc
ent o
f ass
ets;
H
ousi
ng B
ank
seco
nd la
rges
t, w
ith e
xten
sive
br
anch
net
wor
k.
Yes
. Las
t ban
k es
tabl
ishe
d in
199
7.C
omm
erce
and
trad
e, fo
llow
ed b
y co
nstru
ctio
n, w
hose
shar
e ha
s bee
n st
eadi
ly
decl
inin
g.
Yes
Y
es
Kuw
ait
2 ba
nks a
ccou
nt fo
r 52
perc
ent o
f ass
ets,
49
perc
ent
of d
epos
its, 5
8 pe
rcen
t of l
oans
.N
o Pe
rcen
t of b
ank
cred
it: p
erso
nal—
36
perc
ent,
trade
—17
per
cent
, and
real
es
tate
—17
per
cent
.
Parti
al; g
reat
er c
over
age
plan
ned.
Yes
Tabl
e 1B
. MEN
A C
ount
ries:
Stru
ctur
e of
the
Ban
king
Sec
tor
Abb
revi
ated
Sur
vey
Tabl
es

- 30 - APPENDIX II
Con
cent
ratio
n of
Ban
king
Sec
tor
Is E
ntry
of N
ew B
anks
Ea
sy?
Dire
ctio
n of
Cre
dit
Dep
osit
Insu
ranc
eN
on C
ash
Tran
sact
ion
Act
ivity
Leba
non
5 ba
nks a
ccou
nt fo
r 90
perc
ent o
f ban
k as
sets
; 54.
5 pe
rcen
t of e
quity
, 38.
2 pe
rcen
t of
loan
s, an
d 41
per
cent
of d
epos
its.
Diff
icul
tPe
rcen
t of b
ank
cred
it: tr
ade
and
serv
ices
—45
.0 p
erce
nt, c
onst
ruct
ion—
19.2
pe
rcen
t, co
nsum
er—
12.8
per
cent
, in
dust
ry—
13.3
per
cent
, fin
anci
al
inst
itutio
ns—
3.3
perc
ent.
Yes
Y
es
Liby
a5
bank
s hol
d 97
per
cent
of d
epos
its a
nd 9
9 pe
rcen
t of c
redi
t am
ong
com
mer
cial
ban
ks.
Yes
. Las
t ban
k es
tabl
ishe
d in
199
6.Pu
blic
ent
erpr
ise
sect
or.
Impl
icit
No
Mau
ritan
ia3
bank
s acc
ount
for 6
0 pe
rcen
t of s
ubsc
ribed
ca
pita
l.
Yes
Fi
shin
g an
d tra
de a
ccou
nt fo
r abo
ut 6
0 pe
rcen
t of c
redi
t pro
vide
d by
ban
ks (2
001)
. ...
Lim
ited
Mor
occo
3 la
rges
t ban
ks h
old
abou
t 50
perc
ent o
f as
sets
.Y
es
Perc
ent o
f ban
k cr
edit:
man
ufac
turin
g—16
pe
rcen
t, se
rvic
e an
d re
tail
sect
ors—
27
perc
ent,
hous
ehol
ds—
23 p
erce
nt,
cons
truct
ion
and
hote
ls—8
perc
ent (
end-
2001
).
Impl
icit
Yes
Om
an3
larg
est b
anks
hol
d 69
per
cent
of b
ank
asse
ts, 6
5 pe
rcen
t of d
epos
its, a
nd 7
0 pe
rcen
t of
cre
dit.
Yes
. Las
t ban
k es
tabl
ishe
d in
199
8.Pe
rcen
t of b
ank
cred
it: p
erso
nal l
oans
—36
pe
rcen
t, im
port
trade
—10
per
cent
, and
m
anuf
actu
ring—
10 p
erce
nt.
Yes
Y
es
Paki
stan
3 ba
nks h
old
49 p
erce
nt o
f dep
osits
and
43
perc
ent o
f loa
ns.
No
Perc
ent o
f ban
k cr
edit:
man
ufac
turin
g lo
ans—
58 p
erce
nt, a
gric
ultu
re/fo
rest
ry—
17
perc
ent,
and
com
mer
ce—
10 p
erce
nt.
No
Lim
ited
Qat
ar3
bank
s con
trol a
bout
70
perc
ent o
f ass
ets o
f ba
nkin
g sy
stem
, 69
perc
ent o
f dep
osits
, and
66
per
cent
of l
oans
(200
1).
No
Perc
ent o
f ban
k cr
edit:
pub
lic se
ctor
—48
pe
rcen
t, m
erch
andi
se—
13 p
erce
nt, a
nd
pers
onal
—26
per
cent
.
No
Yes
Tabl
e 1B
. MEN
A C
ount
ries:
Stru
ctur
e of
the
Ban
king
Sec
tor (
cont
inue
d)A
bbre
viat
ed S
urve
y Ta
bles
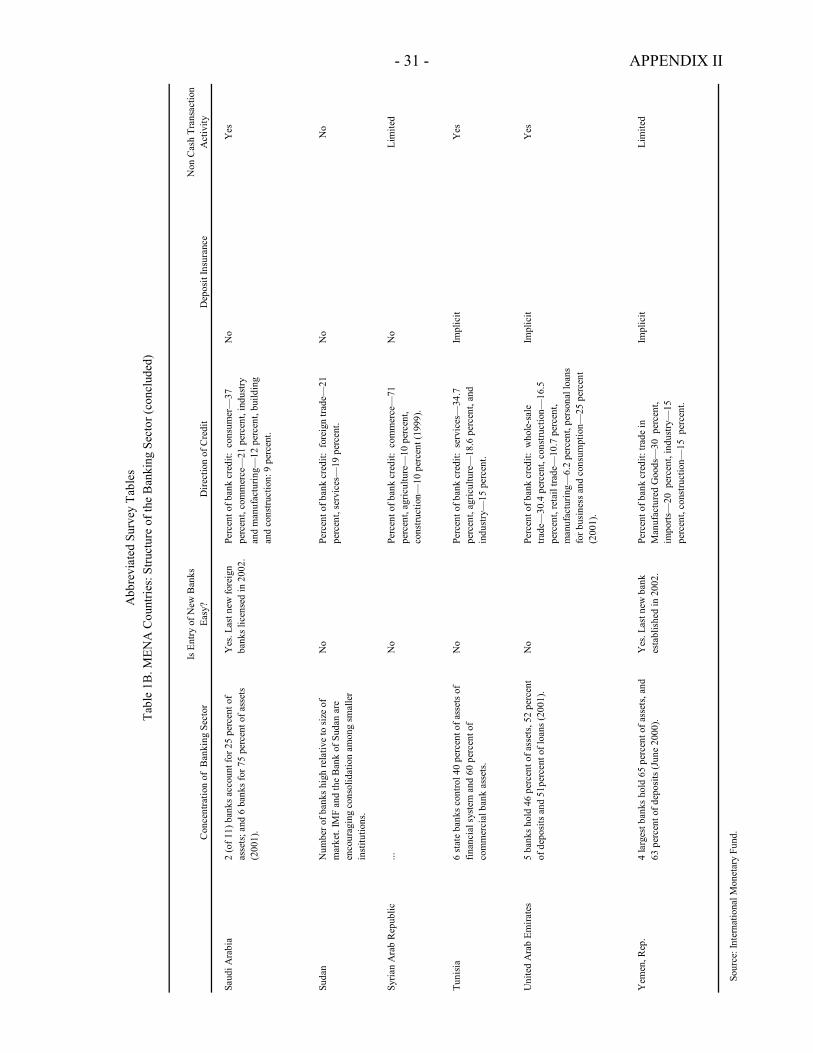
- 31 - APPENDIX II
Con
cent
ratio
n of
Ban
king
Sec
tor
Is E
ntry
of N
ew B
anks
Ea
sy?
Dire
ctio
n of
Cre
dit
Dep
osit
Insu
ranc
eN
on C
ash
Tran
sact
ion
Act
ivity
Saud
i Ara
bia
2 (o
f 11)
ban
ks a
ccou
nt fo
r 25
perc
ent o
f as
sets
; and
6 b
anks
for 7
5 pe
rcen
t of a
sset
s (2
001)
.
Yes
. Las
t new
fore
ign
bank
s lic
ense
d in
200
2.Pe
rcen
t of b
ank
cred
it: c
onsu
mer
—37
pe
rcen
t, co
mm
erce
—21
per
cent
, ind
ustry
an
d m
anuf
actu
ring—
12 p
erce
nt, b
uild
ing
and
cons
truct
ion:
9 p
erce
nt.
No
Yes
Suda
nN
umbe
r of b
anks
hig
h re
lativ
e to
size
of
mar
ket.
IMF
and
the
Ban
k of
Sud
an a
re
enco
urag
ing
cons
olid
atio
n am
ong
smal
ler
inst
itutio
ns.
No
Perc
ent o
f ban
k cr
edit:
for
eign
trad
e—21
pe
rcen
t, se
rvic
es—
19 p
erce
nt.
No
No
Syria
n A
rab
Rep
ublic
...N
o Pe
rcen
t of b
ank
cred
it: c
omm
erce
—71
pe
rcen
t, ag
ricul
ture
—10
per
cent
, co
nstru
ctio
n—10
per
cent
(199
9).
No
Lim
ited
Tuni
sia
6 st
ate
bank
s con
trol 4
0 pe
rcen
t of a
sset
s of
finan
cial
syst
em a
nd 6
0 pe
rcen
t of
com
mer
cial
ban
k as
sets
.
No
Perc
ent o
f ban
k cr
edit:
ser
vice
s—34
.7
perc
ent,
agric
ultu
re—
18.6
per
cent
, and
in
dust
ry—
15 p
erce
nt.
Impl
icit
Yes
Uni
ted
Ara
b Em
irate
s5
bank
s hol
d 46
per
cent
of a
sset
s, 52
per
cent
of
dep
osits
and
51p
erce
nt o
f loa
ns (2
001)
.N
oPe
rcen
t of b
ank
cred
it: w
hole
-sal
e tra
de—
30.4
per
cent
, con
stru
ctio
n—16
.5
perc
ent,
reta
il tra
de—
10.7
per
cent
, m
anuf
actu
ring—
6.2
perc
ent,
pers
onal
loan
s fo
r bus
ines
s and
con
sum
ptio
n—25
per
cent
(2
001)
.
Impl
icit
Y
es
Yem
en, R
ep.
4 la
rges
t ban
ks h
old
65 p
erce
nt o
f ass
ets,
and
63 p
erce
nt o
f dep
osits
(Jun
e 20
00).
Yes
. Las
t new
ban
k es
tabl
ishe
d in
200
2.Pe
rcen
t of b
ank
cred
it: tr
ade
in
Man
ufac
ture
d G
oods
—30
per
cent
, im
ports
—20
per
cent
, ind
ustry
—15
pe
rcen
t, co
nstru
ctio
n—15
per
cent
.
Impl
icit
Lim
ited
Sour
ce: I
nter
natio
nal M
onet
ary
Fund
.
Tabl
e 1B
. MEN
A C
ount
ries:
Stru
ctur
e of
the
Ban
king
Sec
tor (
conc
lude
d)A
bbre
viat
ed S
urve
y Ta
bles
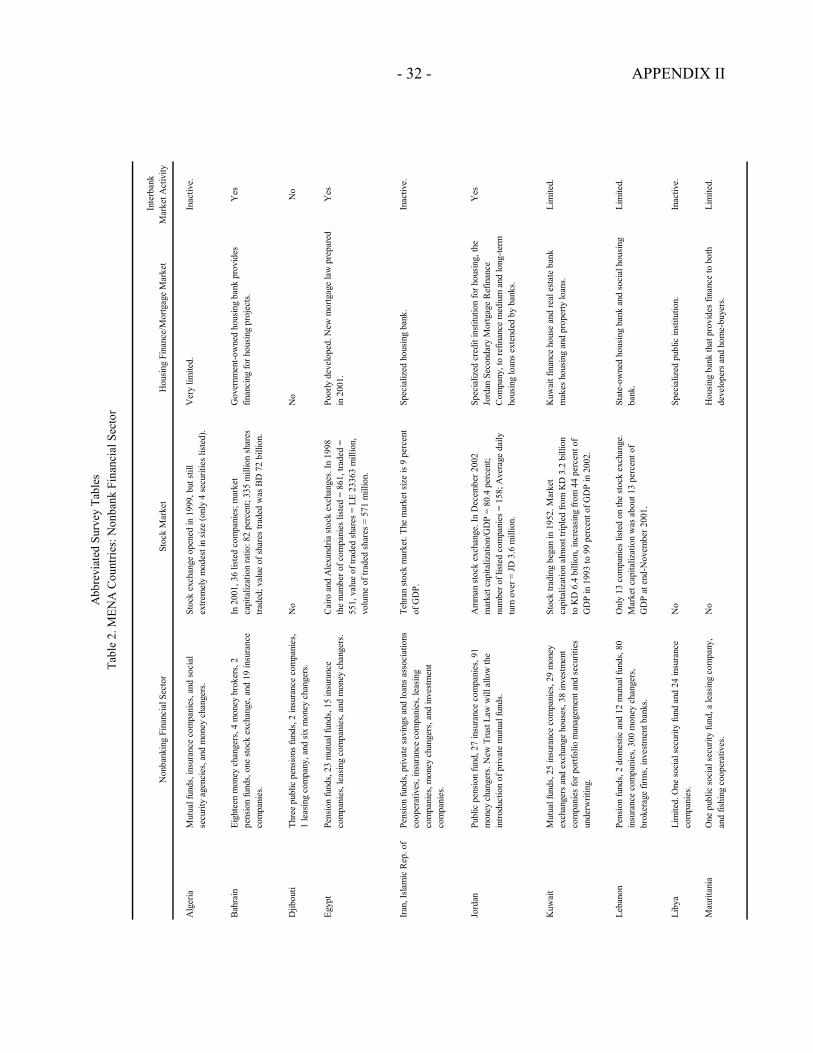
- 32 - APPENDIX II
Non
bank
ing
Fina
ncia
l Sec
tor
Stoc
k M
arke
tH
ousin
g Fi
nanc
e/M
ortg
age
Mar
ket
Inte
rban
k M
arke
t Act
ivity
Alg
eria
Mut
ual f
unds
, ins
uran
ce c
ompa
nies
, and
soci
al
secu
rity
agen
cies
, and
mon
ey c
hang
ers.
Stoc
k ex
chan
ge o
pene
d in
199
9, b
ut st
ill
extre
mel
y m
odes
t in
size
(onl
y 4
secu
ritie
s list
ed).
Ver
y lim
ited.
Inac
tive.
Bahr
ain
Eigh
teen
mon
ey c
hang
ers,
4 m
oney
bro
kers
, 2
pens
ion
fund
s, on
e st
ock
exch
ange
, and
19
insu
ranc
e co
mpa
nies
.
In 2
001,
36
liste
d co
mpa
nies
; mar
ket
capi
taliz
atio
n ra
tio: 8
2 pe
rcen
t; 33
5 m
illio
n sh
ares
tra
ded;
val
ue o
f sha
res t
rade
d w
as B
D 7
2 bi
llion
.
Gov
ernm
ent-o
wne
d ho
usin
g ba
nk p
rovi
des
finan
cing
for h
ousin
g pr
ojec
ts.
Yes
Djib
outi
Thre
e pu
blic
pen
sions
fund
s, 2
insu
ranc
e co
mpa
nies
, 1
leas
ing
com
pany
, and
six
mon
ey c
hang
ers.
No
No
No
Egyp
tPe
nsio
n fu
nds,
23 m
utua
l fun
ds, 1
5 in
sura
nce
com
pani
es, l
easin
g co
mpa
nies
, and
mon
ey c
hang
ers.
Cai
ro a
nd A
lexa
ndria
stoc
k ex
chan
ges.
In 1
998
the
num
ber o
f com
pani
es li
sted
= 8
61, t
rade
d =
551,
val
ue o
f tra
ded
shar
es =
LE
2336
3 m
illio
n,
volu
me
of tr
aded
shar
es =
571
mill
ion.
Poor
ly d
evel
oped
. New
mor
tgag
e la
w p
repa
red
in 2
001.
Yes
Iran,
Isla
mic
Rep
. of
Pens
ion
fund
s, pr
ivat
e sa
ving
s and
loan
s ass
ocia
tions
co
oper
ativ
es, i
nsur
ance
com
pani
es, l
easin
g co
mpa
nies
, mon
ey c
hang
ers,
and
inve
stm
ent
com
pani
es.
Tehr
an st
ock
mar
ket.
The
mar
ket s
ize
is 9
perc
ent
of G
DP.
Spec
ializ
ed h
ousin
g ba
nk.
Inac
tive.
Jord
anPu
blic
pen
sion
fund
, 27
insu
ranc
e co
mpa
nies
, 91
mon
ey c
hang
ers.
New
Tru
st L
aw w
ill a
llow
the
intro
duct
ion
of p
rivat
e m
utua
l fun
ds.
Am
man
stoc
k ex
chan
ge. I
n D
ecem
ber 2
002
mar
ket c
apita
lizat
ion/
GD
P =
80.4
per
cent
; nu
mbe
r of l
isted
com
pani
es =
158
; Ave
rage
dai
ly
turn
ove
r = JD
3.6
mill
ion.
Spec
ializ
ed c
redi
t ins
titut
ion
for h
ousin
g, th
e Jo
rdan
Sec
onda
ry M
ortg
age
Ref
inan
ce
Com
pany
, to
refin
ance
med
ium
and
long
-term
ho
usin
g lo
ans e
xten
ded
by b
anks
.
Yes
Kuw
ait
Mut
ual f
unds
, 25
insu
ranc
e co
mpa
nies
, 29
mon
ey
exch
ange
rs a
nd e
xcha
nge
hous
es, 3
8 in
vest
men
t co
mpa
nies
for p
ortfo
lio m
anag
emen
t and
secu
ritie
s un
derw
ritin
g.
Stoc
k tra
ding
beg
an in
195
2. M
arke
t ca
pita
lizat
ion
alm
ost t
riple
d fro
m K
D 3
.2 b
illio
n to
KD
6.4
bill
ion,
incr
easin
g fro
m 4
4 pe
rcen
t of
GD
P in
199
3 to
99
perc
ent o
f GD
P in
200
2.
Kuw
ait f
inan
ce h
ouse
and
real
est
ate
bank
m
akes
hou
sing
and
prop
erty
loan
s.Li
mite
d.
Leba
non
Pens
ion
fund
s, 2
dom
estic
and
12
mut
ual f
unds
, 80
insu
ranc
e co
mpa
nies
, 300
mon
ey c
hang
ers,
brok
erag
e fir
ms,
inve
stm
ent b
anks
.
Onl
y 13
com
pani
es li
sted
on
the
stoc
k ex
chan
ge.
Mar
ket c
apita
lizat
ion
was
abo
ut 1
3 pe
rcen
t of
GD
P at
end
-Nov
embe
r 200
1.
Stat
e-ow
ned
hous
ing
bank
and
soci
al h
ousin
g ba
nk.
Lim
ited.
Liby
aLi
mite
d. O
ne so
cial
secu
rity
fund
and
24
insu
ranc
e co
mpa
nies
.N
oSp
ecia
lized
pub
lic in
stitu
tion.
Inac
tive.
Mau
ritan
iaO
ne p
ublic
soci
al se
curit
y fu
nd, a
leas
ing
com
pany
, an
d fis
hing
coo
pera
tives
.N
oH
ousin
g ba
nk th
at p
rovi
des f
inan
ce to
bot
h de
velo
pers
and
hom
e-bu
yers
.Li
mite
d.
Tabl
e 2.
MEN
A C
ount
ries:
Non
bank
Fin
anci
al S
ecto
rA
bbre
viat
ed S
urve
y Ta
bles
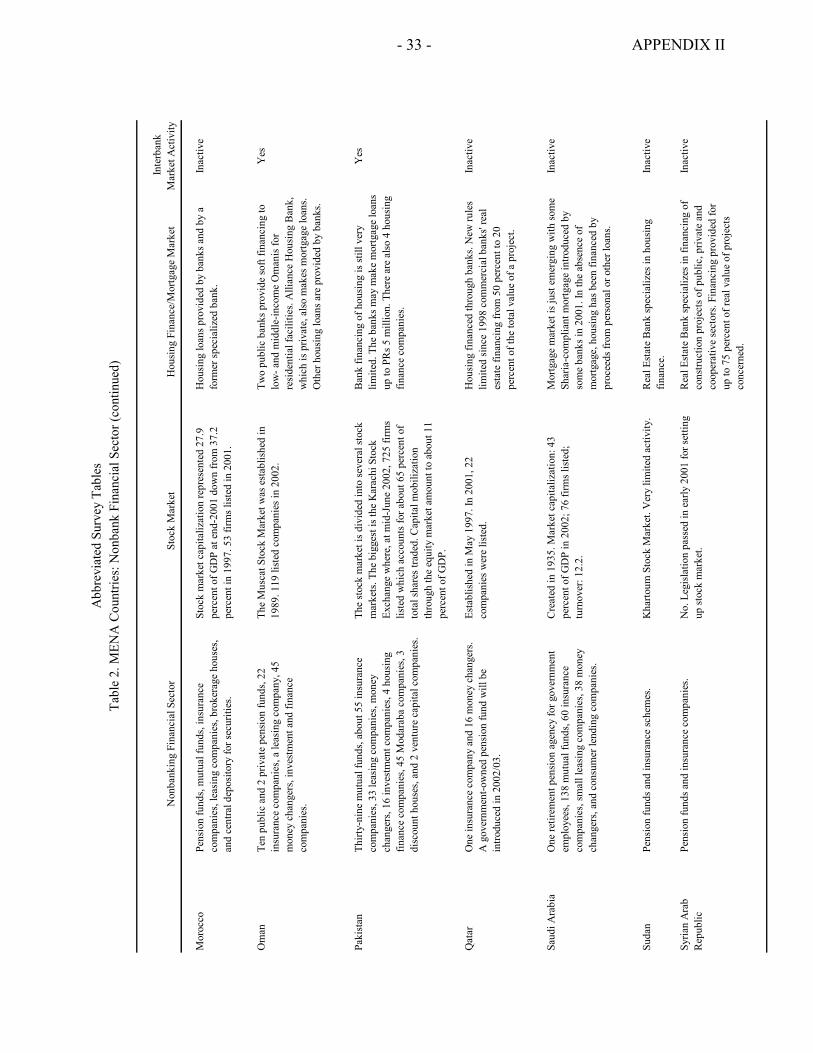
- 33 - APPENDIX II
Non
bank
ing
Fina
ncia
l Sec
tor
Stoc
k M
arke
tH
ousi
ng F
inan
ce/M
ortg
age
Mar
ket
Inte
rban
k M
arke
t Act
ivity
Mor
occo
Pens
ion
fund
s, m
utua
l fun
ds, i
nsur
ance
co
mpa
nies
, lea
sing
com
pani
es, b
roke
rage
hou
ses,
and
cent
ral d
epos
itory
for s
ecur
ities
.
Stoc
k m
arke
t cap
italiz
atio
n re
pres
ente
d 27
.9
perc
ent o
f GD
P at
end
-200
1 do
wn
from
37.
2 pe
rcen
t in
1997
. 53
firm
s lis
ted
in 2
001.
Hou
sing
loan
s pro
vide
d by
ban
ks a
nd b
y a
form
er sp
ecia
lized
ban
k.In
activ
e
Om
anTe
n pu
blic
and
2 p
rivat
e pe
nsio
n fu
nds,
22
insu
ranc
e co
mpa
nies
, a le
asin
g co
mpa
ny, 4
5 m
oney
cha
nger
s, in
vest
men
t and
fina
nce
com
pani
es.
The
Mus
cat S
tock
Mar
ket w
as e
stab
lishe
d in
19
89. 1
19 li
sted
com
pani
es in
200
2.Tw
o pu
blic
ban
ks p
rovi
de so
ft fin
anci
ng to
lo
w- a
nd m
iddl
e-in
com
e O
man
is fo
r re
side
ntia
l fac
ilitie
s. A
llian
ce H
ousi
ng B
ank,
w
hich
is p
rivat
e, a
lso
mak
es m
ortg
age
loan
s. O
ther
hou
sing
loan
s are
pro
vide
d by
ban
ks.
Yes
Paki
stan
Thirt
y-ni
ne m
utua
l fun
ds, a
bout
55
insu
ranc
e co
mpa
nies
, 33
leas
ing
com
pani
es, m
oney
ch
ange
rs, 1
6 in
vest
men
t com
pani
es, 4
hou
sing
fin
ance
com
pani
es, 4
5 M
odar
aba
com
pani
es, 3
di
scou
nt h
ouse
s, an
d 2
vent
ure
capi
tal c
ompa
nies
.
The
stoc
k m
arke
t is d
ivid
ed in
to se
vera
l sto
ck
mar
kets
. The
big
gest
is th
e K
arac
hi S
tock
Ex
chan
ge w
here
, at m
id-J
une
2002
, 725
firm
s lis
ted
whi
ch a
ccou
nts f
or a
bout
65
perc
ent o
f to
tal s
hare
s tra
ded.
Cap
ital m
obili
zatio
n th
roug
h th
e eq
uity
mar
ket a
mou
nt to
abo
ut 1
1 pe
rcen
t of G
DP.
Ban
k fin
anci
ng o
f hou
sing
is st
ill v
ery
limite
d. T
he b
anks
may
mak
e m
ortg
age
loan
s up
to P
Rs 5
mill
ion.
The
re a
re a
lso
4 ho
usin
g fin
ance
com
pani
es.
Yes
Qat
arO
ne in
sura
nce
com
pany
and
16
mon
ey c
hang
ers.
A g
over
nmen
t-ow
ned
pens
ion
fund
will
be
intro
duce
d in
200
2/03
.
Esta
blis
hed
in M
ay 1
997.
In 2
001,
22
com
pani
es w
ere
liste
d.H
ousi
ng fi
nanc
ed th
roug
h ba
nks.
New
rule
s lim
ited
sinc
e 19
98 c
omm
erci
al b
anks
' rea
l es
tate
fina
ncin
g fr
om 5
0 pe
rcen
t to
20
perc
ent o
f the
tota
l val
ue o
f a p
roje
ct.
Inac
tive
Saud
i Ara
bia
One
retir
emen
t pen
sion
age
ncy
for g
over
nmen
t em
ploy
ees,
138
mut
ual f
unds
, 60
insu
ranc
e co
mpa
nies
, sm
all l
easi
ng c
ompa
nies
, 38
mon
ey
chan
gers
, and
con
sum
er le
ndin
g co
mpa
nies
.
Cre
ated
in 1
935.
Mar
ket c
apita
lizat
ion:
43
perc
ent o
f GD
P in
200
2; 7
6 fir
ms l
iste
d;
turn
over
: 12.
2.
Mor
tgag
e m
arke
t is j
ust e
mer
ging
with
som
e Sh
aria
-com
plia
nt m
ortg
age
intro
duce
d by
so
me
bank
s in
2001
. In
the
abse
nce
of
mor
tgag
e, h
ousi
ng h
as b
een
finan
ced
by
proc
eeds
from
per
sona
l or o
ther
loan
s.
Inac
tive
Suda
nPe
nsio
n fu
nds a
nd in
sura
nce
sche
mes
.K
harto
um S
tock
Mar
ket.
Ver
y lim
ited
activ
ity.
Rea
l Est
ate
Ban
k sp
ecia
lizes
in h
ousi
ng
finan
ce.
Inac
tive
Syria
n A
rab
Rep
ublic
Pens
ion
fund
s and
insu
ranc
e co
mpa
nies
.N
o. L
egis
latio
n pa
ssed
in e
arly
200
1 fo
r set
ting
up st
ock
mar
ket.
Rea
l Est
ate
Ban
k sp
ecia
lizes
in fi
nanc
ing
of
cons
truct
ion
proj
ects
of p
ublic
, priv
ate
and
coop
erat
ive
sect
ors.
Fina
ncin
g pr
ovid
ed fo
r up
to 7
5 pe
rcen
t of r
eal v
alue
of p
roje
cts
conc
erne
d.
Inac
tive
Tabl
e 2.
MEN
A C
ount
ries:
Non
bank
Fin
anci
al S
ecto
r (co
ntin
ued)
Abb
revi
ated
Sur
vey
Tabl
es
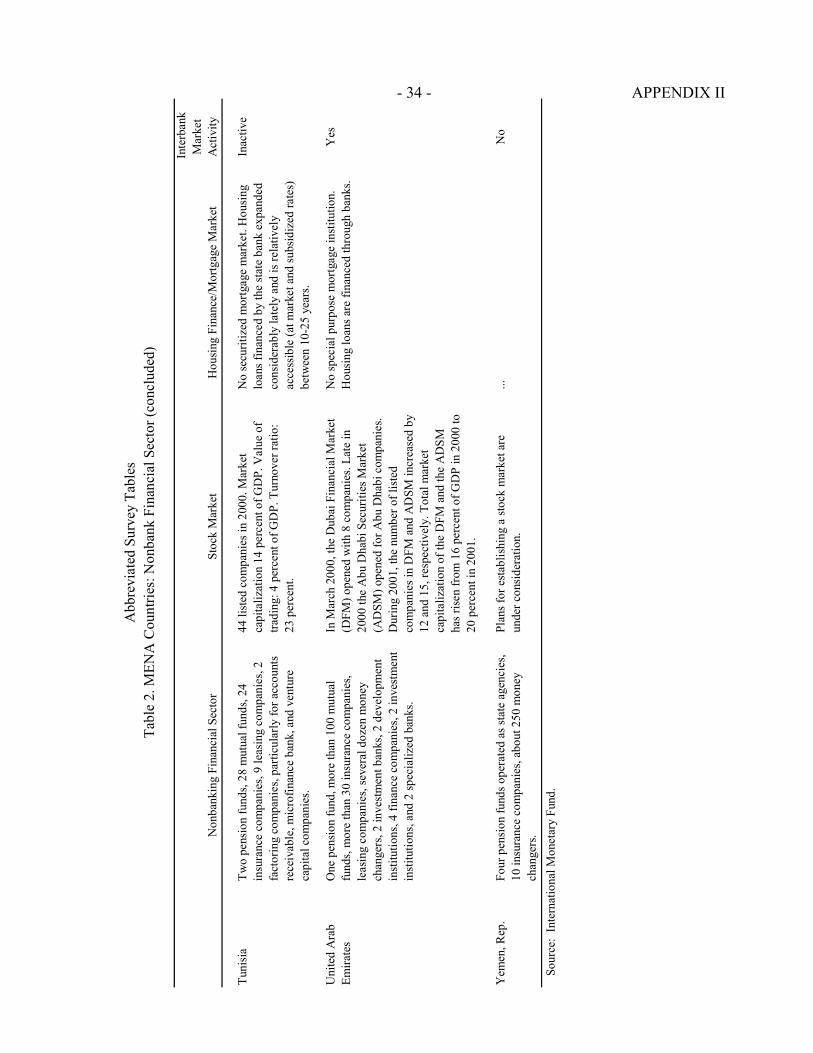
- 34 - APPENDIX II
Non
bank
ing
Fina
ncia
l Sec
tor
Stoc
k M
arke
tH
ousi
ng F
inan
ce/M
ortg
age
Mar
ket
Inte
rban
k M
arke
t A
ctiv
ity
Tuni
sia
Two
pens
ion
fund
s, 28
mut
ual f
unds
, 24
insu
ranc
e co
mpa
nies
, 9 le
asin
g co
mpa
nies
, 2
fact
orin
g co
mpa
nies
, par
ticul
arly
for a
ccou
nts
rece
ivab
le, m
icro
finan
ce b
ank,
and
ven
ture
ca
pita
l com
pani
es.
44 li
sted
com
pani
es in
200
0. M
arke
t ca
pita
lizat
ion
14 p
erce
nt o
f GD
P. V
alue
of
tradi
ng: 4
per
cent
of G
DP.
Tur
nove
r rat
io:
23 p
erce
nt.
No
secu
ritiz
ed m
ortg
age
mar
ket.
Hou
sing
lo
ans f
inan
ced
by th
e st
ate
bank
exp
ande
d co
nsid
erab
ly la
tely
and
is re
lativ
ely
acce
ssib
le (a
t mar
ket a
nd su
bsid
ized
rate
s)
betw
een
10-2
5 ye
ars.
Inac
tive
Uni
ted
Ara
b Em
irate
sO
ne p
ensio
n fu
nd, m
ore
than
100
mut
ual
fund
s, m
ore
than
30
insu
ranc
e co
mpa
nies
, le
asin
g co
mpa
nies
, sev
eral
doz
en m
oney
ch
ange
rs, 2
inve
stm
ent b
anks
, 2 d
evel
opm
ent
inst
itutio
ns, 4
fina
nce
com
pani
es, 2
inve
stm
ent
inst
itutio
ns, a
nd 2
spec
ializ
ed b
anks
.
In M
arch
200
0, th
e D
ubai
Fin
anci
al M
arke
t (D
FM) o
pene
d w
ith 8
com
pani
es. L
ate
in
2000
the
Abu
Dha
bi S
ecur
ities
Mar
ket
(AD
SM) o
pene
d fo
r Abu
Dha
bi c
ompa
nies
. D
urin
g 20
01, t
he n
umbe
r of l
iste
d co
mpa
nies
in D
FM a
nd A
DSM
incr
ease
d by
12
and
15,
resp
ectiv
ely.
Tot
al m
arke
t ca
pita
lizat
ion
of th
e D
FM a
nd th
e A
DSM
ha
s rise
n fr
om 1
6 pe
rcen
t of G
DP
in 2
000
to
20 p
erce
nt in
200
1.
No
spec
ial p
urpo
se m
ortg
age
inst
itutio
n.
Hou
sing
loan
s are
fina
nced
thro
ugh
bank
s.Y
es
Yem
en, R
ep.
Four
pen
sion
fund
s ope
rate
d as
stat
e ag
enci
es,
10 in
sura
nce
com
pani
es, a
bout
250
mon
ey
chan
gers
.
Plan
s for
est
ablis
hing
a st
ock
mar
ket a
re
unde
r con
side
ratio
n....
No
So
urce
: In
tern
atio
nal M
onet
ary
Fund
.
Tabl
e 2.
MEN
A C
ount
ries:
Non
bank
Fin
anci
al S
ecto
r (co
nclu
ded)
Abb
revi
ated
Sur
vey
Tabl
es
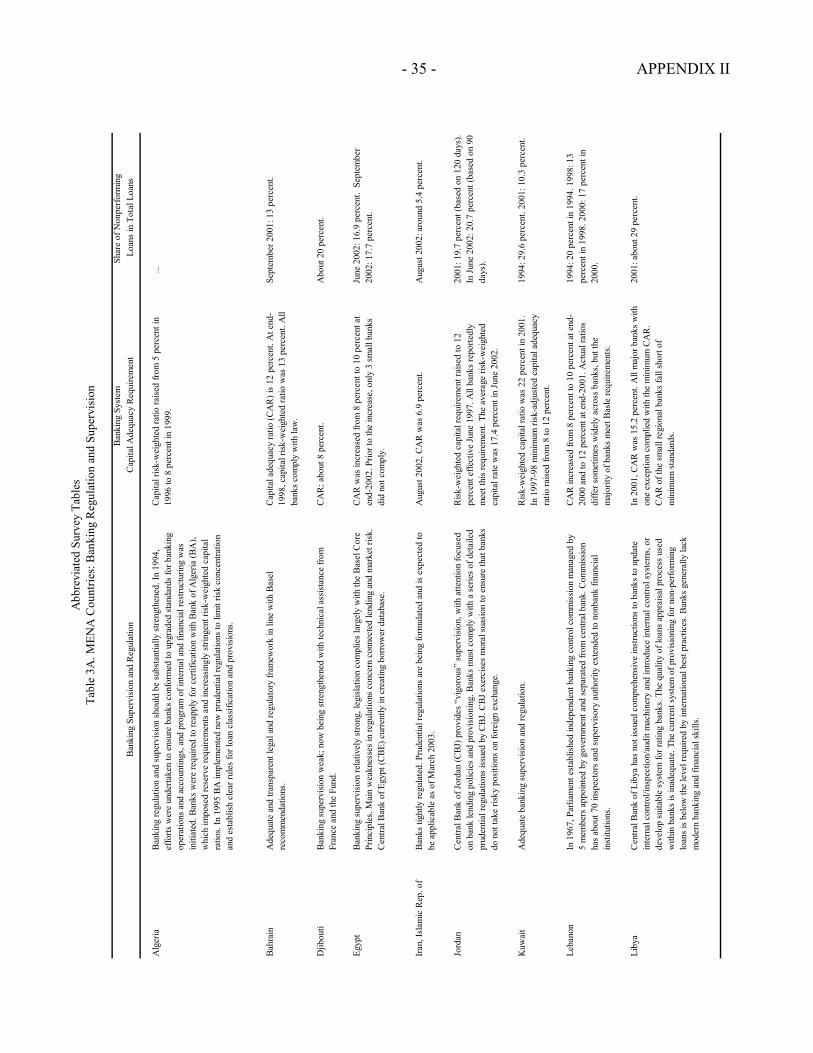
- 35 - APPENDIX II
Bank
ing
Syst
emSh
are
of N
onpe
rform
ing
Bank
ing
Supe
rvis
ion
and
Reg
ulat
ion
Cap
ital A
dequ
acy
Req
uire
men
tLo
ans i
n To
tal L
oans
Alg
eria
Bank
ing
regu
latio
n an
d su
perv
ision
shou
ld b
e su
bsta
ntia
lly st
reng
then
ed. I
n 19
94,
effo
rts w
ere
unde
rtake
n to
ens
ure
bank
s con
form
ed to
upg
rade
d st
anda
rds f
or b
anki
ng
oper
atio
ns a
nd a
ccou
ntin
gs, a
nd p
rogr
am o
f int
erna
l and
fina
ncia
l res
truct
urin
g w
as
initi
ated
. Ban
ks w
ere
requ
ired
to re
appl
y fo
r cer
tific
atio
n w
ith B
ank
of A
lger
ia (B
A),
whi
ch im
pose
d re
serv
e re
quire
men
ts a
nd in
crea
singl
y st
ringe
nt ri
sk-w
eigh
ted
capi
tal
ratio
s. In
199
5 BA
impl
emen
ted
new
pru
dent
ial r
egul
atio
ns to
lim
it ris
k co
ncen
tratio
n an
d es
tabl
ish c
lear
rule
s for
loan
cla
ssifi
catio
n an
d pr
ovisi
ons.
Cap
ital r
isk-w
eigh
ted
ratio
raise
d fro
m 5
per
cent
in
1996
to 8
per
cent
in 1
999.
...
Bahr
ain
Ade
quat
e an
d tra
nspa
rent
lega
l and
regu
lato
ry fr
amew
ork
in li
ne w
ith B
asel
re
com
men
datio
ns.
Cap
ital a
dequ
acy
ratio
(CA
R) i
s 12
per
cent
. At e
nd-
1998
, cap
ital r
isk-w
eigh
ted
ratio
was
13
perc
ent.
All
bank
s com
ply
with
law
.
Sept
embe
r 200
1: 1
3 pe
rcen
t.
Djib
outi
Bank
ing
supe
rvis
ion
wea
k; n
ow b
eing
stre
ngth
ened
with
tech
nica
l ass
istan
ce fr
om
Fran
ce a
nd th
e Fu
nd.
CA
R: a
bout
8 p
erce
nt.
Abo
ut 2
0 pe
rcen
t.
Egyp
tBa
nkin
g su
perv
isio
n re
lativ
ely
stro
ng, l
egis
latio
n co
mpl
ies l
arge
ly w
ith th
e Ba
sel C
ore
Prin
cipl
es. M
ain
wea
knes
ses i
n re
gula
tions
con
cern
con
nect
ed le
ndin
g an
d m
arke
t risk
. C
entra
l Ban
k of
Egy
pt (C
BE) c
urre
ntly
in c
reat
ing
borr
ower
dat
abas
e.
CA
R w
as in
crea
sed
from
8 p
erce
nt to
10
perc
ent a
t en
d-20
02. P
rior t
o th
e in
crea
se, o
nly
3 sm
all b
anks
di
d no
t com
ply.
June
200
2: 1
6.9
perc
ent.
Sep
tem
ber
2002
: 17.
7 pe
rcen
t.
Iran,
Isla
mic
Rep
. of
Bank
s tig
htly
regu
late
d. P
rude
ntia
l reg
ulat
ions
are
bei
ng fo
rmul
ated
and
is e
xpec
ted
to
be a
pplic
able
as o
f Mar
ch 2
003.
Aug
ust 2
002,
CA
R w
as 6
.9 p
erce
nt.
Aug
ust 2
002:
aro
und
5.4
perc
ent.
Jord
anC
entra
l Ban
k of
Jord
an (C
BJ) p
rovi
des “
vigo
rous
” su
perv
ision
, with
atte
ntio
n fo
cuse
d on
ban
k le
ndin
g po
licie
s and
pro
visio
ning
. Ban
ks m
ust c
ompl
y w
ith a
serie
s of d
etai
led
prud
entia
l reg
ulat
ions
issu
ed b
y C
BJ. C
BJ e
xerc
ises m
oral
suas
ion
to e
nsur
e th
at b
anks
do
not
take
risk
y po
sitio
ns o
n fo
reig
n ex
chan
ge.
Risk
-wei
ghte
d ca
pita
l req
uire
men
t rai
sed
to 1
2 pe
rcen
t effe
ctiv
e Ju
ne 1
997.
All
bank
s rep
orte
dly
mee
t thi
s req
uire
men
t. Th
e av
erag
e ris
k-w
eigh
ted
capi
tal r
ate
was
17.
4 pe
rcen
t in
June
200
2.
2001
: 19.
7 pe
rcen
t (ba
sed
on 1
20 d
ays)
. In
June
200
2: 2
0.7
perc
ent (
base
d on
90
days
).
Kuw
ait
Ade
quat
e ba
nkin
g su
perv
ision
and
regu
latio
n.R
isk-w
eigh
ted
capi
tal r
atio
was
22
perc
ent i
n 20
01.
In 1
997-
98 m
inim
um ri
sk-a
djus
ted
capi
tal a
dequ
acy
ratio
raise
d fro
m 8
to 1
2 pe
rcen
t.
1994
: 29.
6 pe
rcen
t. 20
01: 1
0.3
perc
ent.
Leba
non
In 1
967,
Par
liam
ent e
stab
lishe
d in
depe
nden
t ban
king
con
trol c
omm
issio
n m
anag
ed b
y 5
mem
bers
app
oint
ed b
y go
vern
men
t and
sepa
rate
d fro
m c
entra
l ban
k. C
omm
issio
n ha
s abo
ut 7
0 in
spec
tors
and
supe
rviso
ry a
utho
rity
exte
nded
to n
onba
nk fi
nanc
ial
inst
itutio
ns.
CA
R in
crea
sed
from
8 p
erce
nt to
10
perc
ent a
t end
-20
00 a
nd to
12
perc
ent a
t end
-200
1. A
ctua
l rat
ios
diffe
r som
etim
es w
idel
y ac
ross
ban
ks, b
ut th
e m
ajor
ity o
f ban
ks m
eet B
asle
requ
irem
ents
.
1994
: 20
perc
ent i
n 19
94. 1
998:
13
perc
ent i
n 19
98. 2
000:
17
perc
ent i
n 20
00.
Liby
aC
entra
l Ban
k of
Lib
ya h
as n
ot is
sued
com
preh
ensi
ve in
stru
ctio
ns to
ban
ks to
upd
ate
inte
rnal
con
trol/i
nspe
ctio
n/au
dit m
achi
nery
and
intro
duce
inte
rnal
con
trol s
yste
ms,
or
deve
lop
suita
ble
syst
em fo
r rat
ing
bank
s. Th
e qu
ality
of l
oans
app
raisa
l pro
cess
use
d w
ithin
ban
ks is
inad
equa
te. T
he c
urre
nt sy
stem
of p
rovi
sion
ing
for n
on-p
erfo
rmin
g lo
ans i
s bel
ow th
e le
vel r
equi
red
by in
tern
atio
nal b
est p
ract
ices
. Ban
ks g
ener
ally
lack
m
oder
n ba
nkin
g an
d fin
anci
al sk
ills.
In 2
001,
CA
R w
as 1
5.2
perc
ent.
All
maj
or b
anks
with
on
e ex
cept
ion
com
plie
d w
ith th
e m
inim
um C
AR
. C
AR
of t
he sm
all r
egio
nal b
anks
fall
shor
t of
min
imum
stan
dard
s.
2001
: abo
ut 2
9 pe
rcen
t.
Tabl
e 3A
. MEN
A C
ount
ries:
Ban
king
Reg
ulat
ion
and
Supe
rvis
ion
Abb
revi
ated
Sur
vey
Tabl
es

- 36 - APPENDIX II
Ban
king
Sys
tem
Shar
e of
Non
perf
orm
ing
Ban
king
Sup
ervi
sion
and
Reg
ulat
ion
Cap
ital A
dequ
acy
Req
uire
men
tLo
ans i
n To
tal L
oans
Mau
ritan
iaW
eak
bank
ing
supe
rvis
ion
and
regu
latio
n. H
owev
er, s
trict
enf
orce
men
t of
prud
entia
l reg
ulat
ions
und
er 1
995
Ban
king
Law
bei
ng p
ut in
pla
ce w
ith
indi
geno
us in
stitu
tiona
l cap
acity
bui
ldin
g to
mod
erni
ze su
perv
isio
n sy
stem
s an
d po
licie
s.
CA
R is
set a
t 8 p
erce
nt si
nce
1995
. At e
nd-2
001
the
aver
age
CA
R e
xcee
ded
the
Bas
le
requ
irem
ent.
1996
: 80
perc
ent o
f loa
ns w
ere
bad
or d
oubt
ful o
r had
bee
n re
stru
ctur
ed.
Mor
occo
Prud
entia
l and
supe
rvis
ory
fram
ewor
k im
prov
ed in
rece
nt y
ears
. How
ever
, si
gnifi
cant
wea
knes
ses r
emai
n, in
clud
ing
limite
d su
perv
isor
y in
depe
nden
ce,
lack
of e
ffic
ienc
y in
on-
site
and
off
-site
supe
rvis
ion,
and
the
need
to im
prov
e re
gula
tion
on lo
an lo
ss p
rovi
sion
ing.
Ris
k w
eigh
ted
CA
R ro
se to
14.
7 pe
rcen
t in
Dec
embe
r 200
1 fr
om 1
1.2
perc
ent i
n 19
97. F
or
bank
s whi
ch d
omin
ate
the
finan
cial
sect
or, t
he
ratio
is 1
5.7
perc
ent a
nd la
rgel
y re
flect
s the
ir tru
e ca
pita
l ade
quac
y si
tuat
ion.
For
mer
spec
ializ
ed
bank
s had
a C
AR
of 1
2.4
perc
ent b
ut a
re la
rgel
y be
lieve
d to
be
near
ly if
not
inso
lven
t.
2001
: 14.
1 pe
rcen
t.
Om
anC
entra
l Ban
k ha
s sup
ervi
sion
resp
onsi
bilit
y fo
r ban
ks, s
peci
aliz
ed b
anks
, and
m
oney
exc
hang
es (1
2 en
titie
s) th
at h
ave
licen
ses t
o is
sue
draf
ts. B
anki
ng
supe
rvis
ory
fram
ewor
k in
line
with
Bas
le C
ore
Prin
cipl
es.
CA
R w
as 1
2 pe
rcen
t. 20
02 a
vera
ge C
AR
was
ab
out 1
6.5
perc
ent.
1999
: 6 p
erce
nt. 2
002:
11.
3 pe
rcen
t.
Paki
stan
Dur
ing
the
last
yea
rs, S
tate
Ban
k of
Pak
ista
n (S
BP)
has
mad
e st
rides
tow
ard
impl
emen
ting
Bas
el c
ore
prin
cipl
es fo
r eff
ectiv
e ba
nkin
g su
perv
isio
n. F
ew
rem
aini
ng sh
ortfa
lls in
clud
e: b
anks
do
not h
ave
com
preh
ensi
ve ri
sk
man
agem
ent p
roce
ss a
nd b
ank
supe
rvis
ion
not i
mpl
emen
ted
on a
con
solid
ated
ba
sis.
CA
R w
as 8
.8 in
200
1. T
his r
atio
was
5.1
for
publ
ic b
anks
, 9.5
for p
rivat
e do
mes
tic b
anks
, and
18
.6 fo
r for
eign
ban
ks. 5
ban
ks h
ad a
ratio
in
ferio
r to
8 pe
rcen
t.
Mid
-200
1: a
bout
20
perc
ent.
Publ
ic
bank
s: a
bout
25
perc
ent.
Dom
estic
pr
ivat
e ba
nks:
11
perc
ent.
Fore
ign
bank
s: 5
per
cent
.
Qat
arA
dequ
ate
bank
ing
supe
rvis
ion
and
regu
latio
n. S
uper
viso
ry a
utho
ritie
s req
uire
ba
nks t
o ha
ve a
dequ
ate
inte
rnal
syst
ems t
o m
onito
r and
con
trol
liqui
dity
nee
ds
and
esta
blis
h co
ntin
genc
y pl
ans f
or p
erio
ds o
f liq
uidi
ty st
ress
. In
2000
, Qat
ar
Cen
tral B
ank
(QC
B) i
ntro
duce
d re
quire
men
ts fo
r ban
ks to
use
out
side
aud
itors
to
val
idat
e th
eir b
ooks
, and
to re
port
regu
larly
to su
perv
isio
n de
partm
ent o
n cr
edit
faci
litie
s gra
nted
to c
usto
mer
s.
Act
ual C
AR
rang
ed fr
om 1
2.3
perc
ent t
o 53
.3
perc
ent a
t end
-200
1, h
ighe
r tha
n 10
per
cent
m
anda
ted
leve
l.
2000
: 11
perc
ent.
2001
: 10.
7 pe
rcen
t.
Saud
i Ara
bia
Ban
king
supe
rvis
ion
and
regu
latio
n co
nfor
ms t
o in
tern
atio
nal g
ood
prac
tices
. R
egul
atio
ns a
re e
nfor
ced
and
pena
lties
are
bin
ding
. Dat
abas
e m
aint
aine
d on
la
rge
borr
ower
s and
pro
vide
d to
ban
ks. H
owev
er, l
egal
ly th
e Sa
udi A
rabi
an
Mon
etar
y A
genc
y is
not
aut
onom
ous.
CA
R a
vera
ged
20 p
erce
nt in
200
1. M
ajor
ity o
f ba
nks m
eet B
asel
reco
mm
enda
tion.
2001
: 9.6
per
cent
.
Suda
nU
nder
199
1 B
anki
ng R
egul
atio
n A
ct, F
inan
cial
Inst
itutio
ns A
dmin
istra
tion
(FIA
) was
cre
ated
to re
gula
te b
anks
and
non
-ban
k in
stitu
tions
. FIA
mon
itors
po
rtfol
ios,
rese
rves
, and
pro
visi
ons.
Ris
k-w
eigh
ted
capi
tal a
dequ
acy
ratio
was
8
perc
ent i
n Ju
ne 2
002.
June
200
2: 1
5 pe
rcen
t.
Syria
n A
rab
Rep
ublic
Supe
rvis
ion
and
regu
latio
n no
t ade
quat
e....
No
data
, tho
ught
to b
e hi
gh.
Tabl
e 3A
. MEN
A C
ount
ries:
Ban
king
Reg
ulat
ion
and
Supe
rvis
ion
(con
tinue
d)A
bbre
viat
ed S
urve
y Ta
bles
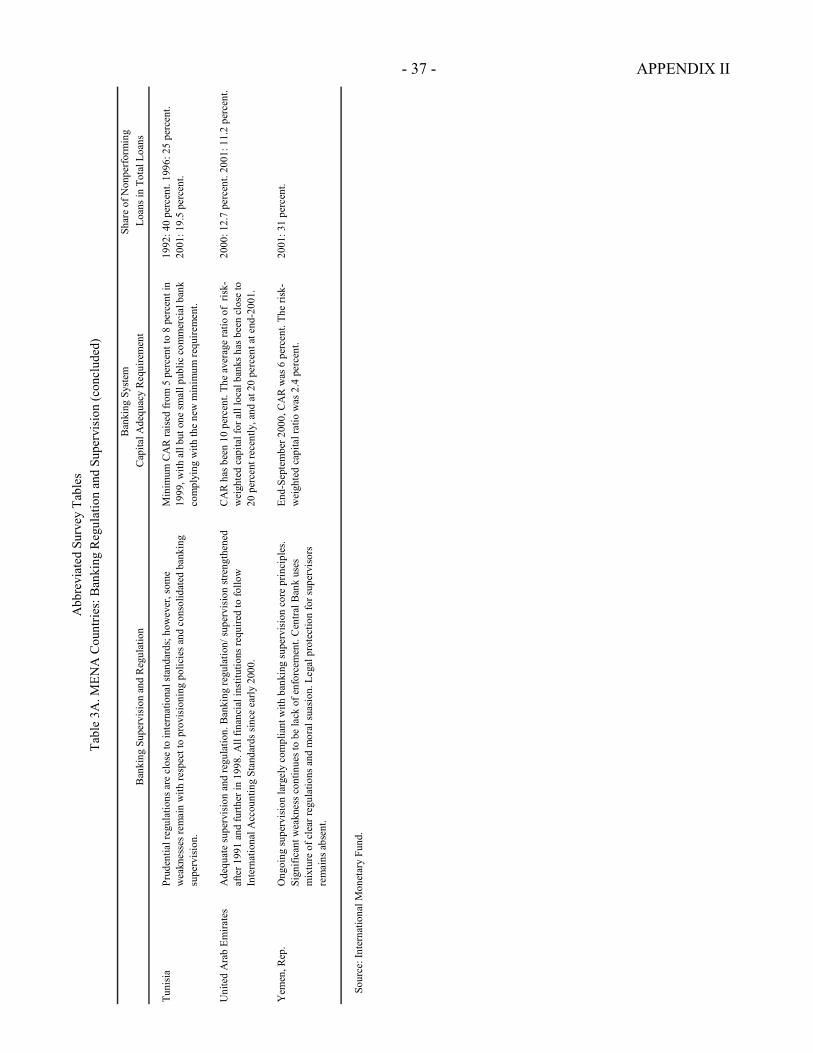
- 37 - APPENDIX II
Ban
king
Sys
tem
Shar
e of
Non
perf
orm
ing
Ban
king
Sup
ervi
sion
and
Reg
ulat
ion
Cap
ital A
dequ
acy
Req
uire
men
t L
oans
in T
otal
Loa
ns
Tuni
sia
Prud
entia
l reg
ulat
ions
are
clo
se to
inte
rnat
iona
l sta
ndar
ds; h
owev
er, s
ome
wea
knes
ses r
emai
n w
ith re
spec
t to
prov
isio
ning
pol
icie
s and
con
solid
ated
ban
king
su
perv
isio
n.
Min
imum
CA
R ra
ised
from
5 p
erce
nt to
8 p
erce
nt in
19
99, w
ith a
ll bu
t one
smal
l pub
lic c
omm
erci
al b
ank
com
plyi
ng w
ith th
e ne
w m
inim
um re
quire
men
t.
1992
: 40
perc
ent.
1996
: 25
perc
ent.
2001
: 19.
5 pe
rcen
t.
Uni
ted
Ara
b Em
irate
sA
dequ
ate
supe
rvis
ion
and
regu
latio
n. B
anki
ng re
gula
tion/
supe
rvis
ion
stre
ngth
ened
af
ter 1
991
and
furth
er in
199
8. A
ll fin
anci
al in
stitu
tions
requ
ired
to fo
llow
In
tern
atio
nal A
ccou
ntin
g St
anda
rds s
ince
ear
ly 2
000.
CA
R h
as b
een
10 p
erce
nt. T
he a
vera
ge ra
tio o
f ris
k-w
eigh
ted
capi
tal f
or a
ll lo
cal b
anks
has
bee
n cl
ose
to
20 p
erce
nt re
cent
ly, a
nd a
t 20
perc
ent a
t end
-200
1.
2000
: 12.
7 pe
rcen
t. 20
01: 1
1.2
perc
ent.
Yem
en, R
ep.
Ong
oing
supe
rvis
ion
larg
ely
com
plia
nt w
ith b
anki
ng su
perv
isio
n co
re p
rinci
ples
. Si
gnifi
cant
wea
knes
s con
tinue
s to
be la
ck o
f enf
orce
men
t. C
entra
l Ban
k us
es
mix
ture
of c
lear
regu
latio
ns a
nd m
oral
suas
ion.
Leg
al p
rote
ctio
n fo
r sup
ervi
sors
re
mai
ns a
bsen
t.
End-
Sept
embe
r 200
0, C
AR
was
6 p
erce
nt. T
he ri
sk-
wei
ghte
d ca
pita
l rat
io w
as 2
.4 p
erce
nt.
2001
: 31
perc
ent.
Sour
ce: I
nter
natio
nal M
onet
ary
Fund
.
Tabl
e 3A
. MEN
A C
ount
ries:
Ban
king
Reg
ulat
ion
and
Supe
rvis
ion
(con
clud
ed)
Abb
revi
ated
Sur
vey
Tabl
es
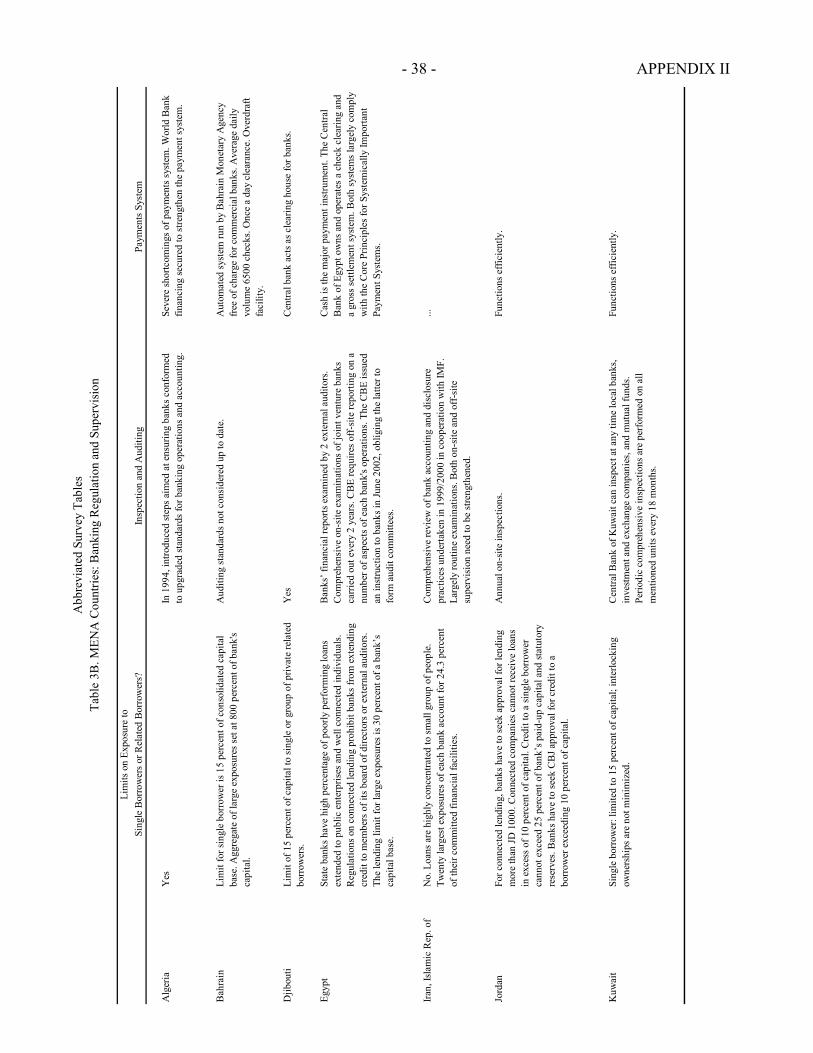
- 38 - APPENDIX II
Lim
its o
n Ex
posu
re to
Si
ngle
Bor
row
ers o
r Rel
ated
Bor
row
ers?
Insp
ectio
n an
d A
uditi
ngPa
ymen
ts S
yste
m
Alg
eria
Yes
In 1
994,
intro
duce
d st
eps a
imed
at e
nsur
ing
bank
s con
form
ed
to u
pgra
ded
stan
dard
s for
ban
king
ope
ratio
ns a
nd a
ccou
ntin
g.Se
vere
shor
tcom
ings
of p
aym
ents
syst
em. W
orld
Ban
k fin
anci
ng se
cure
d to
stre
ngth
en th
e pa
ymen
t sys
tem
.
Bah
rain
Lim
it fo
r sin
gle
borr
ower
is 1
5 pe
rcen
t of c
onso
lidat
ed c
apita
l ba
se. A
ggre
gate
of l
arge
exp
osur
es se
t at 8
00 p
erce
nt o
f ban
k's
capi
tal.
Aud
iting
stan
dard
s not
con
side
red
up to
dat
e.A
utom
ated
syst
em ru
n by
Bah
rain
Mon
etar
y A
genc
y fr
ee o
f cha
rge
for c
omm
erci
al b
anks
. Ave
rage
dai
ly
volu
me
6500
che
cks.
Onc
e a
day
clea
ranc
e. O
verd
raft
faci
lity.
Djib
outi
Lim
it of
15
perc
ent o
f cap
ital t
o si
ngle
or g
roup
of p
rivat
e re
late
d bo
rrow
ers.
Yes
Cen
tral b
ank
acts
as c
lear
ing
hous
e fo
r ban
ks.
Egyp
tSt
ate
bank
s hav
e hi
gh p
erce
ntag
e of
poo
rly p
erfo
rmin
g lo
ans
exte
nded
to p
ublic
ent
erpr
ises
and
wel
l con
nect
ed in
divi
dual
s. R
egul
atio
ns o
n co
nnec
ted
lend
ing
proh
ibit
bank
s fro
m e
xten
ding
cr
edit
to m
embe
rs o
f its
boa
rd o
f dire
ctor
s or e
xter
nal a
udito
rs.
The
lend
ing
limit
for l
arge
exp
osur
es is
30
perc
ent o
f a b
ank’
s ca
pita
l bas
e.
Ban
ks’ f
inan
cial
repo
rts e
xam
ined
by
2 ex
tern
al a
udito
rs.
Com
preh
ensi
ve o
n-si
te e
xam
inat
ions
of j
oint
ven
ture
ban
ks
carri
ed o
ut e
very
2 y
ears
. CB
E re
quire
s off
-site
repo
rting
on
a nu
mbe
r of a
spec
ts o
f eac
h ba
nk's
oper
atio
ns. T
he C
BE
issu
ed
an in
stru
ctio
n to
ban
ks in
June
200
2, o
blig
ing
the
latte
r to
form
aud
it co
mm
ittee
s.
Cas
h is
the
maj
or p
aym
ent i
nstru
men
t. Th
e C
entra
l B
ank
of E
gypt
ow
ns a
nd o
pera
tes a
che
ck c
lear
ing
and
a gr
oss s
ettle
men
t sys
tem
. Bot
h sy
stem
s lar
gely
com
ply
with
the
Cor
e Pr
inci
ples
for S
yste
mic
ally
Impo
rtant
Pa
ymen
t Sys
tem
s.
Iran,
Isla
mic
Rep
. of
No.
Loa
ns a
re h
ighl
y co
ncen
trate
d to
smal
l gro
up o
f peo
ple.
Tw
enty
larg
est e
xpos
ures
of e
ach
bank
acc
ount
for 2
4.3
perc
ent
of th
eir c
omm
itted
fina
ncia
l fac
ilitie
s.
Com
preh
ensi
ve re
view
of b
ank
acco
untin
g an
d di
sclo
sure
pr
actic
es u
nder
take
n in
199
9/20
00 in
coo
pera
tion
with
IMF.
La
rgel
y ro
utin
e ex
amin
atio
ns. B
oth
on-s
ite a
nd o
ff-s
ite
supe
rvis
ion
need
to b
e st
reng
then
ed.
...
Jord
anFo
r con
nect
ed le
ndin
g, b
anks
hav
e to
seek
app
rova
l for
lend
ing
mor
e th
an JD
100
0. C
onne
cted
com
pani
es c
anno
t rec
eive
loan
s in
exc
ess o
f 10
perc
ent o
f cap
ital.
Cre
dit t
o a
sing
le b
orro
wer
ca
nnot
exc
eed
25 p
erce
nt o
f ban
k’s p
aid-
up c
apita
l and
stat
utor
y re
serv
es. B
anks
hav
e to
seek
CB
J app
rova
l for
cre
dit t
o a
borr
ower
exc
eedi
ng 1
0 pe
rcen
t of c
apita
l.
Ann
ual o
n-si
te in
spec
tions
.Fu
nctio
ns e
ffici
ently
.
Kuw
ait
Sing
le b
orro
wer
: lim
ited
to 1
5 pe
rcen
t of c
apita
l; in
terlo
ckin
g ow
ners
hips
are
not
min
imiz
ed.
Cen
tral B
ank
of K
uwai
t can
insp
ect a
t any
tim
e lo
cal b
anks
, in
vest
men
t and
exc
hang
e co
mpa
nies
, and
mut
ual f
unds
. Pe
riodi
c co
mpr
ehen
sive
insp
ectio
ns a
re p
erfo
rmed
on
all
men
tione
d un
its e
very
18
mon
ths.
Func
tions
effi
cien
tly.
Tabl
e 3B
. MEN
A C
ount
ries:
Ban
king
Reg
ulat
ion
and
Supe
rvis
ion
Abb
revi
ated
Sur
vey
Tabl
es
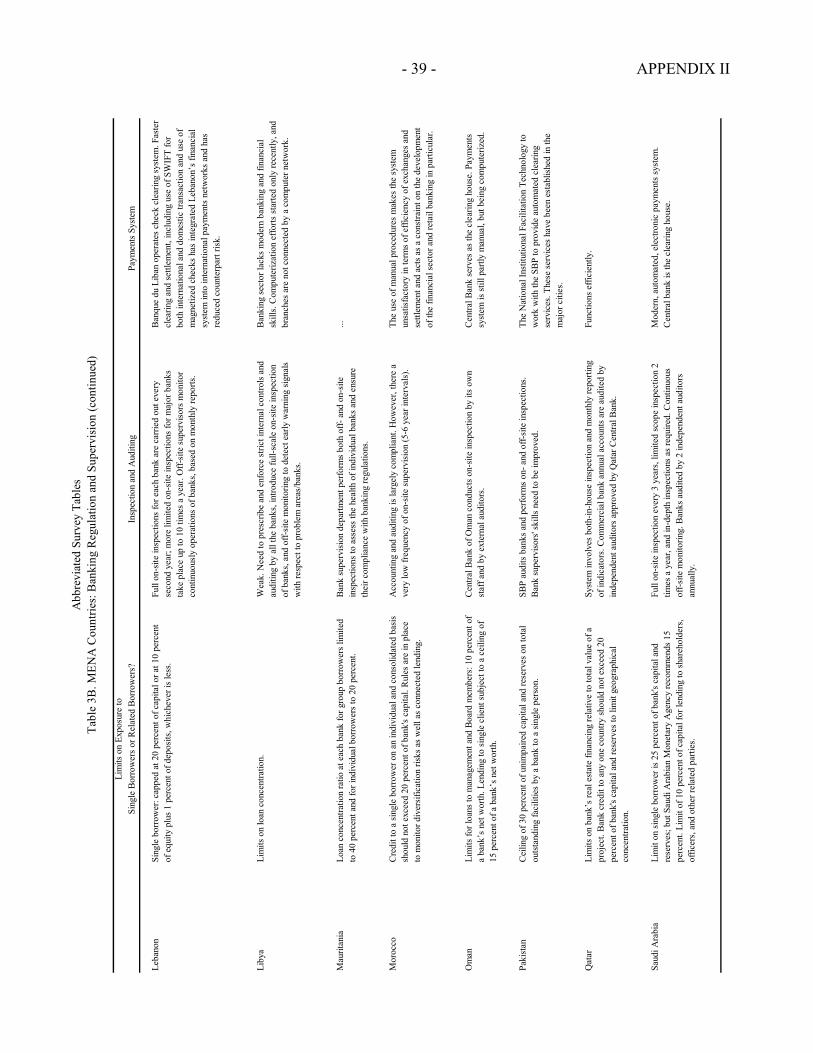
- 39 - APPENDIX II
Lim
its o
n Ex
posu
re to
Si
ngle
Bor
row
ers
or R
elat
ed B
orro
wer
s?In
spec
tion
and
Aud
iting
Paym
ents
Sys
tem
Leba
non
Sing
le b
orro
wer
: cap
ped
at 2
0 pe
rcen
t of c
apita
l or a
t 10
perc
ent
of e
quity
plu
s 1
perc
ent o
f dep
osits
, whi
chev
er is
less
.Fu
ll on
-site
insp
ectio
ns fo
r eac
h ba
nk a
re c
arrie
d ou
t eve
ry
seco
nd y
ear;
mor
e lim
ited
on-s
ite in
spec
tions
for m
ajor
ban
ks
take
pla
ce u
p to
10
times
a y
ear.
Off-
site
sup
ervi
sors
mon
itor
cont
inuo
usly
ope
ratio
ns o
f ban
ks, b
ased
on
mon
thly
repo
rts.
Ban
que
du L
iban
ope
rate
s che
ck c
lear
ing
syst
em. F
aste
r cl
earin
g an
d se
ttlem
ent,
incl
udin
g us
e of
SW
IFT
for
both
inte
rnat
iona
l and
dom
estic
tran
sact
ion
and
use
of
mag
netiz
ed c
heck
s ha
s in
tegr
ated
Leb
anon
’s fi
nanc
ial
syst
em in
to in
tern
atio
nal p
aym
ents
net
wor
ks a
nd h
as
redu
ced
coun
terp
art r
isk.
Liby
aLi
mits
on
loan
con
cent
ratio
n.W
eak.
Nee
d to
pre
scrib
e an
d en
forc
e st
rict i
nter
nal c
ontro
ls a
nd
audi
ting
by a
ll th
e ba
nks,
intro
duce
full-
scal
e on
-site
insp
ectio
n of
ban
ks, a
nd o
ff-si
te m
onito
ring
to d
etec
t ear
ly w
arni
ng s
igna
ls
with
resp
ect t
o pr
oble
m a
reas
/ban
ks.
Ban
king
sec
tor l
acks
mod
ern
bank
ing
and
finan
cial
sk
ills.
Com
pute
rizat
ion
effo
rts s
tarte
d on
ly re
cent
ly, a
nd
bran
ches
are
not
con
nect
ed b
y a
com
pute
r net
wor
k.
Mau
ritan
iaLo
an c
once
ntra
tion
ratio
at e
ach
bank
for g
roup
bor
row
ers
limite
d to
40
perc
ent a
nd fo
r ind
ivid
ual b
orro
wer
s to
20
perc
ent.
Ban
k su
perv
isio
n de
partm
ent p
erfo
rms
both
off-
and
on-
site
in
spec
tions
to a
sses
s the
hea
lth o
f ind
ivid
ual b
anks
and
ens
ure
thei
r com
plia
nce
with
ban
king
regu
latio
ns.
...
Mor
occo
Cre
dit t
o a
singl
e bo
rrow
er o
n an
indi
vidu
al a
nd c
onso
lidat
ed b
asis
shou
ld n
ot e
xcee
d 20
per
cent
of b
ank'
s ca
pita
l. R
ules
are
in p
lace
to
mon
itor d
iver
sific
atio
n ris
ks a
s wel
l as c
onne
cted
lend
ing.
Acc
ount
ing
and
audi
ting
is la
rgel
y co
mpl
iant
. How
ever
, the
re a
ve
ry lo
w fr
eque
ncy
of o
n-si
te s
uper
visi
on (5
-6 y
ear i
nter
vals
). Th
e us
e of
man
ual p
roce
dure
s m
akes
the
syst
em
unsa
tisfa
ctor
y in
term
s of e
ffici
ency
of e
xcha
nges
and
se
ttlem
ent a
nd a
cts a
s a c
onst
rain
t on
the
deve
lopm
ent
of th
e fin
anci
al s
ecto
r and
reta
il ba
nkin
g in
par
ticul
ar.
Om
anLi
mits
for l
oans
to m
anag
emen
t and
Boa
rd m
embe
rs: 1
0 pe
rcen
t of
a ba
nk’s
net
wor
th. L
endi
ng to
sin
gle
clie
nt s
ubje
ct to
a c
eilin
g of
15
per
cent
of a
ban
k’s
net w
orth
.
Cen
tral B
ank
of O
man
con
duct
s on
-site
insp
ectio
n by
its
own
staf
f and
by
exte
rnal
aud
itors
.C
entra
l Ban
k se
rves
as
the
clea
ring
hous
e. P
aym
ents
sy
stem
is s
till p
artly
man
ual,
but b
eing
com
pute
rized
.
Paki
stan
Cei
ling
of 3
0 pe
rcen
t of u
nim
paire
d ca
pita
l and
rese
rves
on
tota
l ou
tsta
ndin
g fa
cilit
ies
by a
ban
k to
a s
ingl
e pe
rson
.SB
P au
dits
ban
ks a
nd p
erfo
rms
on- a
nd o
ff-si
te in
spec
tions
. B
ank
supe
rvis
ors'
skill
s ne
ed to
be
impr
oved
.Th
e N
atio
nal I
nstit
utio
nal F
acili
tatio
n Te
chno
logy
to
wor
k w
ith th
e SB
P to
pro
vide
aut
omat
ed c
lear
ing
serv
ices
. The
se se
rvic
es h
ave
been
est
ablis
hed
in th
e m
ajor
citi
es.
Qat
arLi
mits
on
bank
’s re
al e
stat
e fin
anci
ng re
lativ
e to
tota
l val
ue o
f a
proj
ect.
Ban
k cr
edit
to a
ny o
ne c
ount
ry sh
ould
not
exc
eed
20
perc
ent o
f ban
k's
capi
tal a
nd re
serv
es to
lim
it ge
ogra
phic
al
conc
entra
tion.
Syst
em in
volv
es b
oth-
in-h
ouse
insp
ectio
n an
d m
onth
ly re
porti
ng
of in
dica
tors
. Com
mer
cial
ban
k an
nual
acc
ount
s are
aud
ited
by
inde
pend
ent a
udito
rs a
ppro
ved
by Q
atar
Cen
tral B
ank.
Func
tions
effi
cien
tly.
Saud
i Ara
bia
Lim
it on
sin
gle
borr
ower
is 2
5 pe
rcen
t of b
ank'
s ca
pita
l and
re
serv
es; b
ut S
audi
Ara
bian
Mon
etar
y A
genc
y re
com
men
ds 1
5 pe
rcen
t. Li
mit
of 1
0 pe
rcen
t of c
apita
l for
lend
ing
to sh
areh
olde
rs,
offic
ers,
and
oth
er re
late
d pa
rties
.
Full
on-s
ite in
spec
tion
ever
y 3
year
s, li
mite
d sc
ope
insp
ectio
n 2
times
a y
ear,
and
in-d
epth
insp
ectio
ns a
s req
uire
d. C
ontin
uous
of
f-site
mon
itorin
g. B
anks
aud
ited
by 2
inde
pend
ent a
udito
rs
annu
ally
.
Mod
ern,
aut
omat
ed, e
lect
roni
c pa
ymen
ts sy
stem
. C
entra
l ban
k is
the
clea
ring
hous
e.
Tabl
e 3B
. MEN
A C
ount
ries:
Ban
king
Reg
ulat
ion
and
Supe
rvis
ion
(con
tinue
d)A
bbre
viat
ed S
urve
y Ta
bles
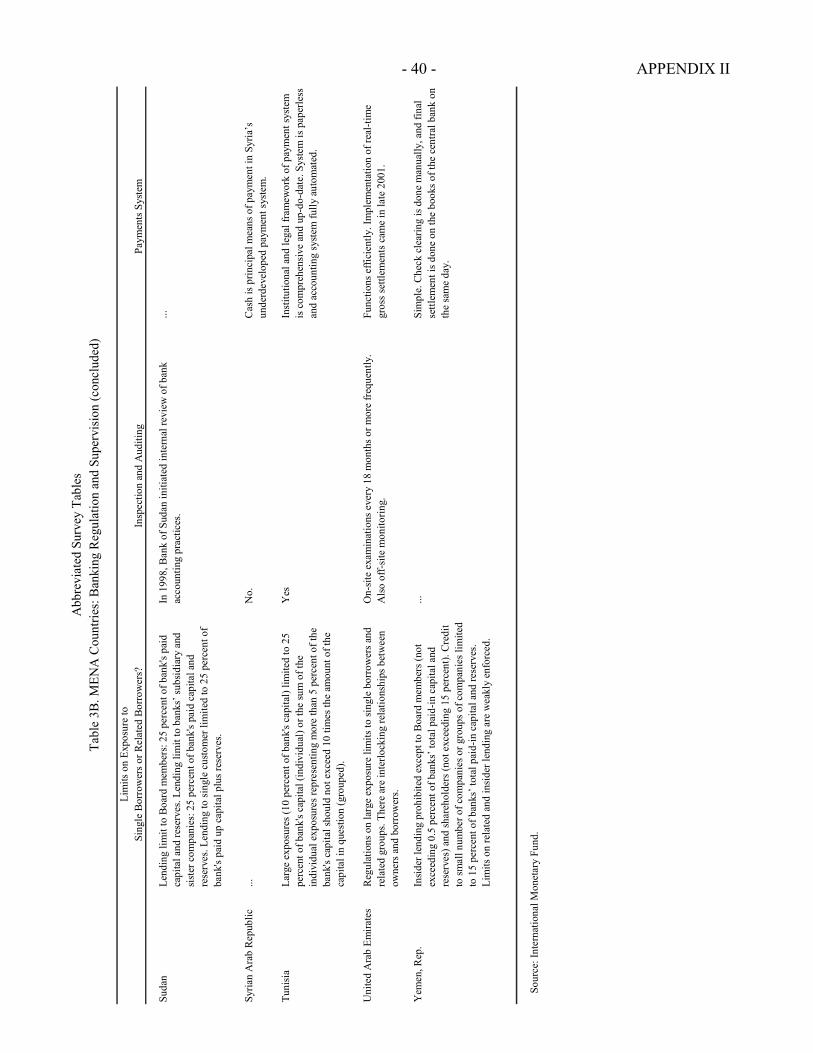
- 40 - APPENDIX II
Lim
its o
n Ex
posu
re to
Si
ngle
Bor
row
ers o
r Rel
ated
Bor
row
ers?
Insp
ectio
n an
d A
uditi
ngPa
ymen
ts S
yste
m
Suda
nLe
ndin
g lim
it to
Boa
rd m
embe
rs: 2
5 pe
rcen
t of b
ank'
s pai
d ca
pita
l and
rese
rves
. Len
ding
lim
it to
ban
ks’ s
ubsi
diar
y an
d si
ster
com
pani
es: 2
5 pe
rcen
t of b
ank'
s pai
d ca
pita
l and
re
serv
es. L
endi
ng to
sing
le c
usto
mer
lim
ited
to 2
5 pe
rcen
t of
bank
's pa
id u
p ca
pita
l plu
s res
erve
s.
In 1
998,
Ban
k of
Sud
an in
itiat
ed in
tern
al re
view
of b
ank
acco
untin
g pr
actic
es.
...
Syria
n A
rab
Rep
ublic
...N
o.
Cas
h is
prin
cipa
l mea
ns o
f pay
men
t in
Syria
’s
unde
rdev
elop
ed p
aym
ent s
yste
m.
Tuni
sia
Larg
e ex
posu
res (
10 p
erce
nt o
f ban
k's c
apita
l) lim
ited
to 2
5 pe
rcen
t of b
ank'
s cap
ital (
indi
vidu
al) o
r the
sum
of t
he
indi
vidu
al e
xpos
ures
repr
esen
ting
mor
e th
an 5
per
cent
of t
he
bank
's ca
pita
l sho
uld
not e
xcee
d 10
tim
es th
e am
ount
of t
he
capi
tal i
n qu
estio
n (g
roup
ed).
Yes
Inst
itutio
nal a
nd le
gal f
ram
ewor
k of
pay
men
t sys
tem
is
com
preh
ensi
ve a
nd u
p-do
-dat
e. S
yste
m is
pap
erle
ss
and
acco
untin
g sy
stem
fully
aut
omat
ed.
Uni
ted
Ara
b Em
irate
sR
egul
atio
ns o
n la
rge
expo
sure
lim
its to
sing
le b
orro
wer
s and
re
late
d gr
oups
. The
re a
re in
terlo
ckin
g re
latio
nshi
ps b
etw
een
owne
rs a
nd b
orro
wer
s.
On-
site
exa
min
atio
ns e
very
18
mon
ths o
r mor
e fr
eque
ntly
. A
lso
off-
site
mon
itorin
g.Fu
nctio
ns e
ffici
ently
. Im
plem
enta
tion
of re
al-ti
me
gros
s set
tlem
ents
cam
e in
late
200
1.
Yem
en, R
ep.
Insi
der l
endi
ng p
rohi
bite
d ex
cept
to B
oard
mem
bers
(not
ex
ceed
ing
0.5
perc
ent o
f ban
ks’ t
otal
pai
d-in
cap
ital a
nd
rese
rves
) and
shar
ehol
ders
(not
exc
eedi
ng 1
5 pe
rcen
t). C
redi
t to
smal
l num
ber o
f com
pani
es o
r gro
ups o
f com
pani
es li
mite
d to
15
perc
ent o
f ban
ks’ t
otal
pai
d-in
cap
ital a
nd re
serv
es.
Lim
its o
n re
late
d an
d in
side
r len
ding
are
wea
kly
enfo
rced
.
...Si
mpl
e. C
heck
cle
arin
g is
don
e m
anua
lly, a
nd fi
nal
settl
emen
t is d
one
on th
e bo
oks o
f the
cen
tral b
ank
on
the
sam
e da
y.
Sour
ce: I
nter
natio
nal M
onet
ary
Fund
.
Tabl
e 3B
. MEN
A C
ount
ries:
Ban
king
Reg
ulat
ion
and
Supe
rvis
ion
(con
clud
ed)
Abb
revi
ated
Sur
vey
Tabl
es
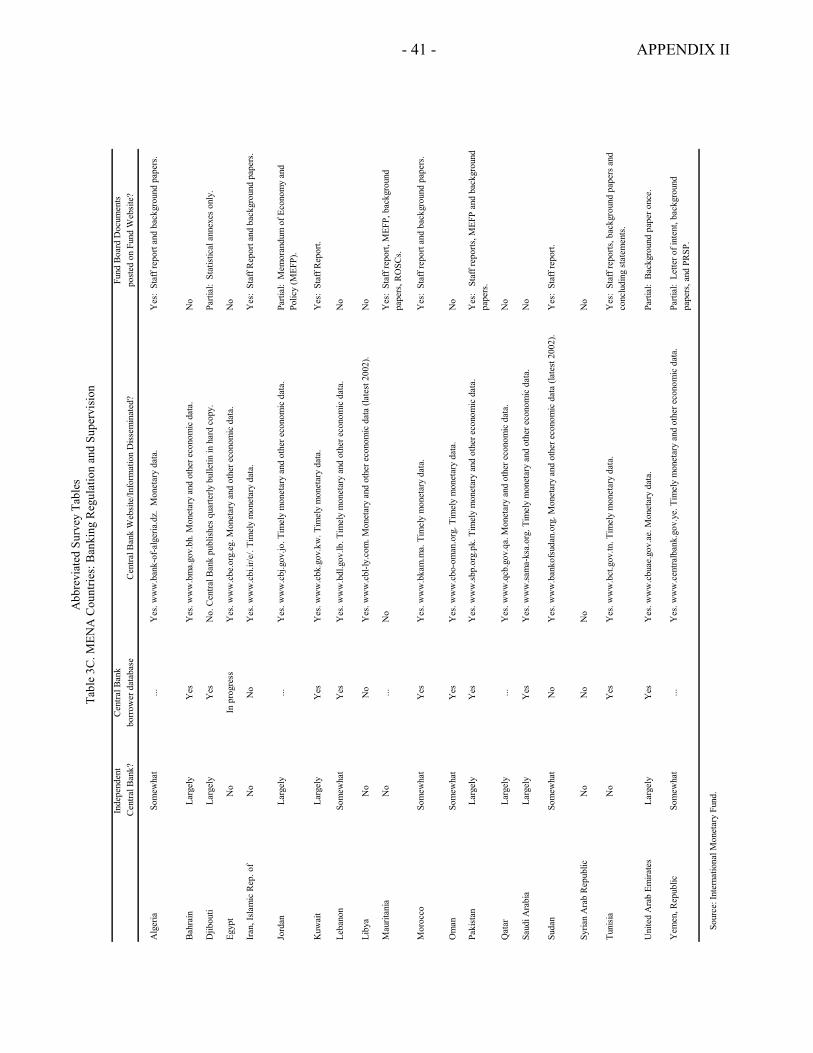
- 41 - APPENDIX II
Inde
pend
ent
Cen
tral B
ank
Fund
Boa
rd D
ocum
ents
C
entra
l Ban
k?bo
rrow
er d
atab
ase
Cen
tral B
ank
Web
site/
Info
rmat
ion
Diss
emin
ated
?po
sted
on
Fund
Web
site?
Alg
eria
Som
ewha
t...
Yes
. ww
w.b
ank-
of-a
lger
ia.d
z. M
onet
ary
data
.Y
es:
Staf
f rep
ort a
nd b
ackg
roun
d pa
pers
.
Bahr
ain
Larg
ely
Yes
Yes
. ww
w.b
ma.
gov.
bh. M
onet
ary
and
othe
r eco
nom
ic d
ata.
No
Djib
outi
Larg
ely
Yes
No.
Cen
tral B
ank
publ
ishes
qua
rterly
bul
letin
in h
ard
copy
.Pa
rtial
: St
atist
ical
ann
exes
onl
y.
Egyp
tN
oIn
pro
gres
sY
es. w
ww
.cbe
.org
.eg.
Mon
etar
y an
d ot
her e
cono
mic
dat
a.N
o
Iran,
Isla
mic
Rep
. of
No
No
Yes
. ww
w.c
bi.ir
/e/.
Tim
ely
mon
etar
y da
ta.
Yes
: St
aff R
epor
t and
bac
kgro
und
pape
rs.
Jord
anLa
rgel
y...
Yes
. ww
w.c
bj.g
ov.jo
. Tim
ely
mon
etar
y an
d ot
her e
cono
mic
dat
a.Pa
rtial
: M
emor
andu
m o
f Eco
nom
y an
d Po
licy
(MEF
P).
Kuw
ait
Larg
ely
Yes
Yes
. ww
w.c
bk.g
ov.k
w. T
imel
y m
onet
ary
data
.Y
es:
Staf
f Rep
ort.
Leba
non
Som
ewha
tY
esY
es. w
ww
.bdl
.gov
.lb. T
imel
y m
onet
ary
and
othe
r eco
nom
ic d
ata.
N
o
Liby
aN
oN
oY
es. w
ww
.cbl
-ly.c
om. M
onet
ary
and
othe
r eco
nom
ic d
ata
(late
st 2
002)
.N
o
Mau
ritan
iaN
o...
No
Yes
: St
aff r
epor
t, M
EFP,
bac
kgro
und
pape
rs, R
OSC
s.
Mor
occo
Som
ewha
tY
esY
es. w
ww
.bka
m.m
a. T
imel
y m
onet
ary
data
.Y
es:
Staf
f rep
ort a
nd b
ackg
roun
d pa
pers
.
Om
anSo
mew
hat
Yes
Y
es. w
ww
.cbo
-om
an.o
rg. T
imel
y m
onet
ary
data
.N
o
Paki
stan
Larg
ely
Yes
Yes
. ww
w.sb
p.or
g.pk
. Tim
ely
mon
etar
y an
d ot
her e
cono
mic
dat
a.
Yes
: S
taff
repo
rts, M
EFP
and
back
grou
nd
pape
rs.
Qat
arLa
rgel
y...
Yes
. ww
w.q
cb.g
ov.q
a. M
onet
ary
and
othe
r eco
nom
ic d
ata.
N
o
Saud
i Ara
bia
Larg
ely
Yes
Yes
. ww
w.sa
ma-
ksa.
org.
Tim
ely
mon
etar
y an
d ot
her e
cono
mic
dat
a.
No
Suda
nSo
mew
hat
No
Yes
. ww
w.b
anko
fsud
an.o
rg. M
onet
ary
and
othe
r eco
nom
ic d
ata
(late
st 2
002)
. Y
es:
Staf
f rep
ort.
Syria
n A
rab
Rep
ublic
No
No
No
No
Tuni
siaN
oY
esY
es. w
ww
.bct
.gov
.tn. T
imel
y m
onet
ary
data
.Y
es:
Staf
f rep
orts
, bac
kgro
und
pape
rs a
nd
conc
ludi
ng st
atem
ents
.
Uni
ted
Ara
b Em
irate
sLa
rgel
yY
es
Yes
. ww
w.c
buae
.gov
.ae.
Mon
etar
y da
ta.
Parti
al:
Back
grou
nd p
aper
onc
e.
Yem
en, R
epub
licSo
mew
hat
...Y
es. w
ww
.cen
tralb
ank.
gov.
ye. T
imel
y m
onet
ary
and
othe
r eco
nom
ic d
ata.
Parti
al:
Lette
r of i
nten
t, ba
ckgr
ound
pa
pers
, and
PR
SP.
Sour
ce: I
nter
natio
nal M
onet
ary
Fund
.
Tabl
e 3C
. MEN
A C
ount
ries:
Ban
king
Reg
ulat
ion
and
Supe
rvis
ion
Abb
revi
ated
Sur
vey
Tabl
es
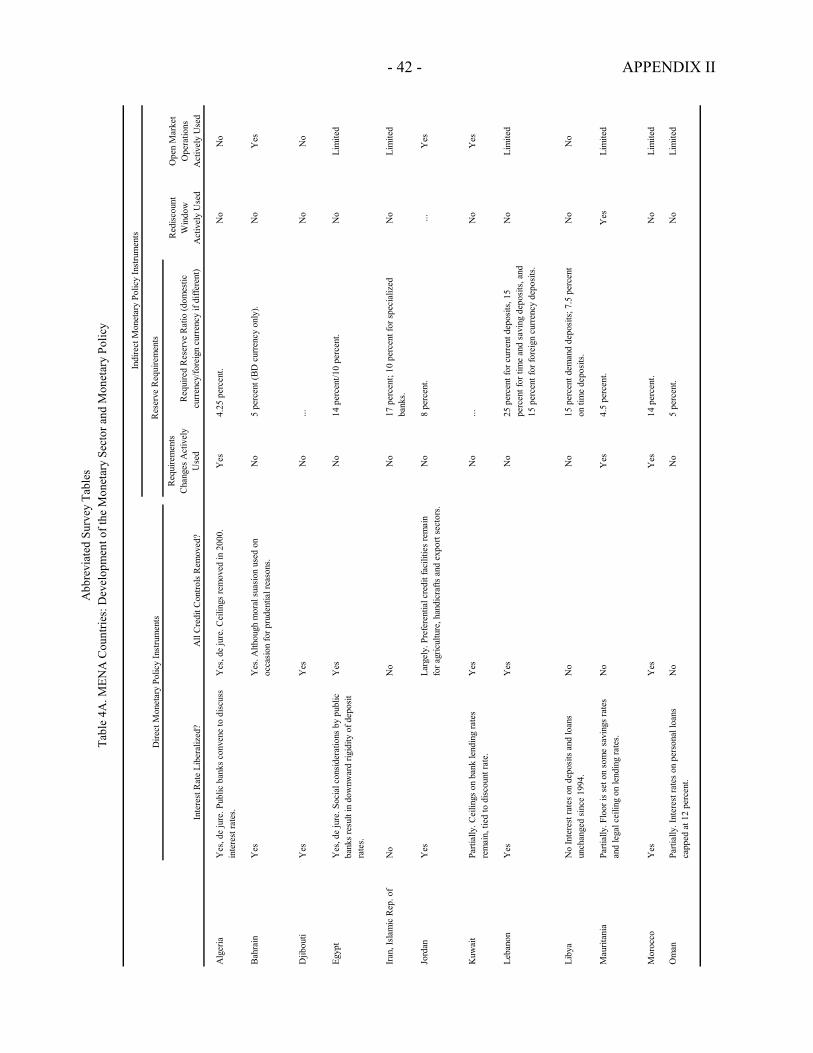
- 42 - APPENDIX II
Res
erve
Req
uire
men
ts
Inte
rest
Rat
e Li
bera
lized
?A
ll C
redi
t Con
trols
Rem
oved
?
Req
uire
men
ts
Cha
nges
Act
ivel
y U
sed
Req
uire
d R
eser
ve R
atio
(dom
estic
cu
rrenc
y/fo
reig
n cu
rrenc
y if
diffe
rent
)
Alg
eria
Yes
, de
jure
. Pub
lic b
anks
con
vene
to d
iscus
s in
tere
st ra
tes.
Yes
, de
jure
. Cei
lings
rem
oved
in 2
000.
Y
es4.
25 p
erce
nt.
No
No
Bahr
ain
Yes
Yes
. Alth
ough
mor
al su
asio
n us
ed o
n oc
casio
n fo
r pru
dent
ial r
easo
ns.
No
5 pe
rcen
t (BD
cur
renc
y on
ly).
N
oY
es
Djib
outi
Yes
Yes
No
...N
oN
o
Egyp
tY
es, d
e ju
re. S
ocia
l con
sider
atio
ns b
y pu
blic
ba
nks r
esul
t in
dow
nwar
d rig
idity
of d
epos
it ra
tes.
Yes
No
14 p
erce
nt/1
0 pe
rcen
t.N
oLi
mite
d
Iran,
Isla
mic
Rep
. of
No
No
No
17 p
erce
nt; 1
0 pe
rcen
t for
spec
ializ
ed
bank
s. N
oLi
mite
d
Jord
anY
esLa
rgel
y. P
refe
rent
ial c
redi
t fac
ilitie
s re
mai
n fo
r agr
icul
ture
, han
dicr
afts
and
exp
ort s
ecto
rs.
No
8 pe
rcen
t....
Yes
Kuw
ait
Parti
ally
. Cei
lings
on
bank
lend
ing
rate
s re
mai
n, ti
ed to
disc
ount
rate
.Y
esN
o...
No
Yes
Leba
non
Yes
Yes
No
25 p
erce
nt fo
r cur
rent
dep
osits
, 15
perc
ent f
or ti
me
and
savi
ng d
epos
its, a
nd
15 p
erce
nt fo
r for
eign
cur
renc
y de
posit
s.
No
Lim
ited
Liby
aN
o In
tere
st ra
tes o
n de
posit
s and
loan
s un
chan
ged
since
199
4.
No
No
15 p
erce
nt d
eman
d de
posit
s; 7
.5 p
erce
nt
on ti
me
depo
sits.
No
No
Mau
ritan
iaPa
rtial
ly. F
loor
is se
t on
som
e sa
ving
s rat
es
and
lega
l cei
ling
on le
ndin
g ra
tes.
No
Yes
4.5
perc
ent.
Yes
Li
mite
d
Mor
occo
Yes
Yes
Yes
14 p
erce
nt.
No
Lim
ited
Om
anPa
rtial
ly. I
nter
est r
ates
on
pers
onal
loan
s ca
pped
at 1
2 pe
rcen
t.
No
No
5 pe
rcen
t.
No
Lim
ited
Abb
revi
ated
Sur
vey
Tabl
esTa
ble
4A. M
ENA
Cou
ntrie
s: D
evel
opm
ent o
f the
Mon
etar
y Se
ctor
and
Mon
etar
y Po
licy
Dire
ct M
onet
ary
Polic
y In
stru
men
ts
Indi
rect
Mon
etar
y Po
licy
Inst
rum
ents R
edisc
ount
W
indo
w
Act
ivel
y U
sed
Ope
n M
arke
t O
pera
tions
A
ctiv
ely
Use
d
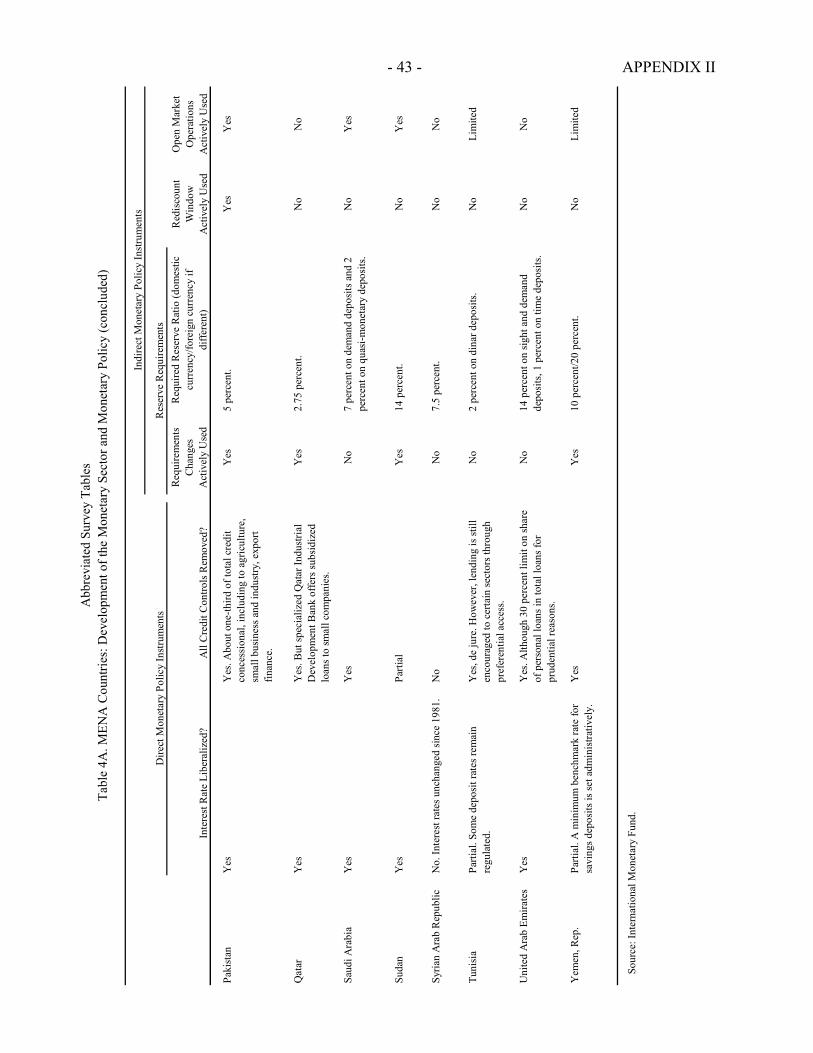
- 43 - APPENDIX II
Res
erve
Req
uire
men
ts
Inte
rest
Rat
e Li
bera
lized
?A
ll C
redi
t Con
trols
Rem
oved
?
Requ
irem
ents
C
hang
es
Act
ivel
y U
sed
Req
uire
d R
eser
ve R
atio
(dom
estic
cu
rrenc
y/fo
reig
n cu
rren
cy if
di
ffere
nt)
Paki
stan
Yes
Yes
. Abo
ut o
ne-th
ird o
f tot
al c
redi
t co
nces
sion
al, i
nclu
ding
to a
gric
ultu
re,
smal
l bus
ines
s and
indu
stry
, exp
ort
finan
ce.
Yes
5 pe
rcen
t.Y
esY
es
Qat
arY
esY
es. B
ut sp
ecia
lized
Qat
ar In
dustr
ial
Dev
elop
men
t Ban
k of
fers
subs
idiz
ed
loan
s to
smal
l com
pani
es.
Yes
2.75
per
cent
.N
oN
o
Saud
i Ara
bia
Yes
Yes
No
7 pe
rcen
t on
dem
and
depo
sits
and
2
perc
ent o
n qu
asi-m
onet
ary
depo
sits
. N
oY
es
Suda
nY
esPa
rtial
Yes
14 p
erce
nt.
No
Yes
Syria
n A
rab
Rep
ublic
No.
Inte
rest
rate
s unc
hang
ed si
nce
1981
. N
oN
o 7.
5 pe
rcen
t.N
oN
o
Tuni
sia
Parti
al. S
ome
depo
sit r
ates
rem
ain
regu
late
d.Y
es, d
e ju
re. H
owev
er, l
endi
ng is
still
en
cour
aged
to c
erta
in se
ctor
s thr
ough
pr
efer
entia
l acc
ess.
No
2 pe
rcen
t on
dina
r dep
osits
.N
oLi
mite
d
Uni
ted
Ara
b Em
irate
sY
esY
es. A
lthou
gh 3
0 pe
rcen
t lim
it on
shar
e of
per
sona
l loa
ns in
tota
l loa
ns fo
r pr
uden
tial r
easo
ns.
No
14 p
erce
nt o
n sig
ht a
nd d
eman
d de
posi
ts, 1
per
cent
on
time
depo
sits
.N
oN
o
Yem
en, R
ep.
Parti
al. A
min
imum
ben
chm
ark
rate
for
savi
ngs d
epos
its is
set a
dmin
istra
tivel
y.Y
esY
es10
per
cent
/20
perc
ent.
N
oLi
mite
d
Sour
ce: I
nter
natio
nal M
onet
ary
Fund
.
Abb
revi
ated
Sur
vey
Tabl
esTa
ble
4A. M
ENA
Cou
ntrie
s: D
evel
opm
ent o
f the
Mon
etar
y Se
ctor
and
Mon
etar
y Po
licy
(con
clud
ed)
Indi
rect
Mon
etar
y Po
licy
Instr
umen
ts
Dire
ct M
onet
ary
Polic
y In
strum
ents
Red
isco
unt
Win
dow
A
ctiv
ely
Use
d
Ope
n M
arke
t O
pera
tions
A
ctiv
ely
Use
d
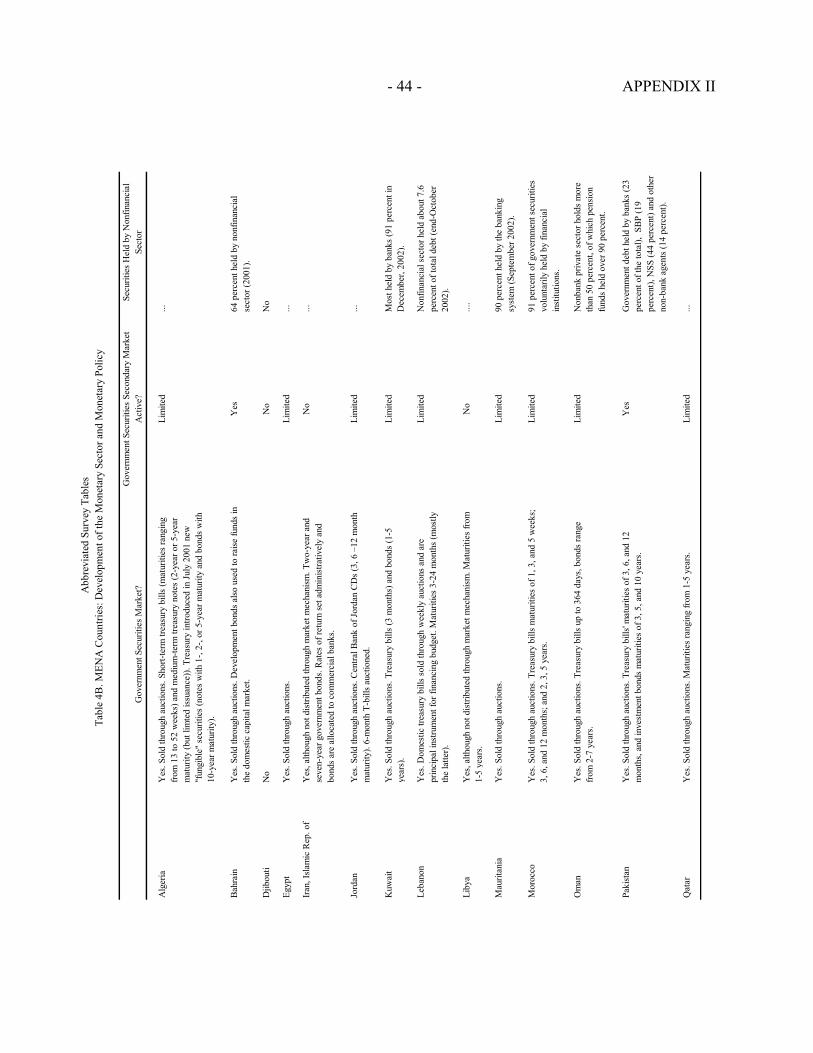
- 44 - APPENDIX II
Gov
ernm
ent S
ecur
ities
Mar
ket?
Gov
ernm
ent S
ecur
ities
Sec
onda
ry M
arke
t A
ctiv
e?Se
curit
ies H
eld
by N
onfin
anci
al
Sect
or
Alg
eria
Yes
. Sol
d th
roug
h au
ctio
ns. S
hort-
term
trea
sury
bill
s (m
atur
ities
rang
ing
from
13
to 5
2 w
eeks
) and
med
ium
-term
trea
sury
not
es (2
-yea
r or 5
-yea
r m
atur
ity (b
ut li
mte
d is
suan
ce))
. Tre
asur
y in
trodu
ced
in J
uly
2001
new
"f
ungi
ble"
sec
uriti
es (n
otes
with
1-,
2-, o
r 5-y
ear m
atur
ity a
nd b
onds
with
10
-yea
r mat
urity
).
Lim
ited
...
Bah
rain
Yes
. Sol
d th
roug
h au
ctio
ns. D
evel
opm
ent b
onds
als
o us
ed to
rais
e fu
nds
in
the
dom
estic
cap
ital m
arke
t. Y
es64
per
cent
hel
d by
non
finan
cial
se
ctor
(200
1).
Djib
outi
No
No
No
Egyp
tY
es. S
old
thro
ugh
auct
ions
. Li
mite
d...
Iran
, Isl
amic
Rep
. of
Yes
, alth
ough
not
dis
tribu
ted
thro
ugh
mar
ket m
echa
nism
. Tw
o-ye
ar a
nd
seve
n-ye
ar g
over
nmen
t bon
ds. R
ates
of r
etur
n se
t adm
inis
trativ
ely
and
bond
s are
allo
cate
d to
com
mer
cial
ban
ks.
No
...
Jord
anY
es. S
old
thro
ugh
auct
ions
. Cen
tral B
ank
of J
orda
n C
Ds
(3, 6
–12
mon
th
mat
urity
). 6-
mon
th T
-bill
s au
ctio
ned.
Lim
ited
...
Kuw
ait
Yes
. Sol
d th
roug
h au
ctio
ns. T
reas
ury
bills
(3 m
onth
s) a
nd b
onds
(1-5
ye
ars)
.Li
mite
dM
ost h
eld
by b
anks
(91
perc
ent i
n D
ecem
ber,
2002
).
Leba
non
Yes
. Dom
estic
trea
sury
bill
s so
ld th
roug
h w
eekl
y au
ctio
ns a
nd a
re
prin
cipa
l ins
trum
ent f
or fi
nanc
ing
budg
et. M
atur
ities
3-2
4 m
onth
s (m
ostly
th
e la
tter)
.
Lim
ited
Non
finan
cial
sec
tor h
eld
abou
t 7.6
pe
rcen
t of t
otal
deb
t (en
d-O
ctob
er
2002
).
Liby
aY
es, a
lthou
gh n
ot d
istri
bute
d th
roug
h m
arke
t mec
hani
sm. M
atur
ities
from
1-
5 ye
ars.
No
....
Mau
ritan
iaY
es. S
old
thro
ugh
auct
ions
. Li
mite
d90
per
cent
hel
d by
the
bank
ing
syst
em (S
epte
mbe
r 200
2).
Mor
occo
Yes
. Sol
d th
roug
h au
ctio
ns. T
reas
ury
bills
mat
uriti
es o
f 1, 3
, and
5 w
eeks
; 3,
6, a
nd 1
2 m
onth
s; a
nd 2
, 3, 5
yea
rs.
Lim
ited
91 p
erce
nt o
f gov
ernm
ent s
ecur
ities
vo
lunt
arily
hel
d by
fina
ncia
l in
stitu
tions
.
Om
anY
es. S
old
thro
ugh
auct
ions
. Tre
asur
y bi
lls u
p to
364
day
s, b
onds
rang
e fro
m 2
-7 y
ears
. Li
mite
dN
onba
nk p
rivat
e se
ctor
hol
ds m
ore
than
50
perc
ent,
of w
hich
pen
sion
fu
nds
held
ove
r 90
perc
ent.
Paki
stan
Yes
. Sol
d th
roug
h au
ctio
ns. T
reas
ury
bills
' mat
uriti
es o
f 3, 6
, and
12
mon
ths,
and
inve
stm
ent b
onds
mat
uriti
es o
f 3, 5
, and
10
year
s.
Yes
Gov
ernm
ent d
ebt h
eld
by b
anks
(23
perc
ent o
f the
tota
l), S
BP
(19
perc
ent),
NSS
(44
perc
ent)
and
othe
r no
n-ba
nk a
gent
s (1
4 pe
rcen
t).
Qat
arY
es. S
old
thro
ugh
auct
ions
. Mat
uriti
es ra
ngin
g fro
m 1
-5 y
ears
.Li
mite
d...
Tabl
e 4B
. MEN
A C
ount
ries:
Dev
elop
men
t of t
he M
onet
ary
Sect
or a
nd M
onet
ary
Polic
y
Abb
revi
ated
Sur
vey
Tabl
es
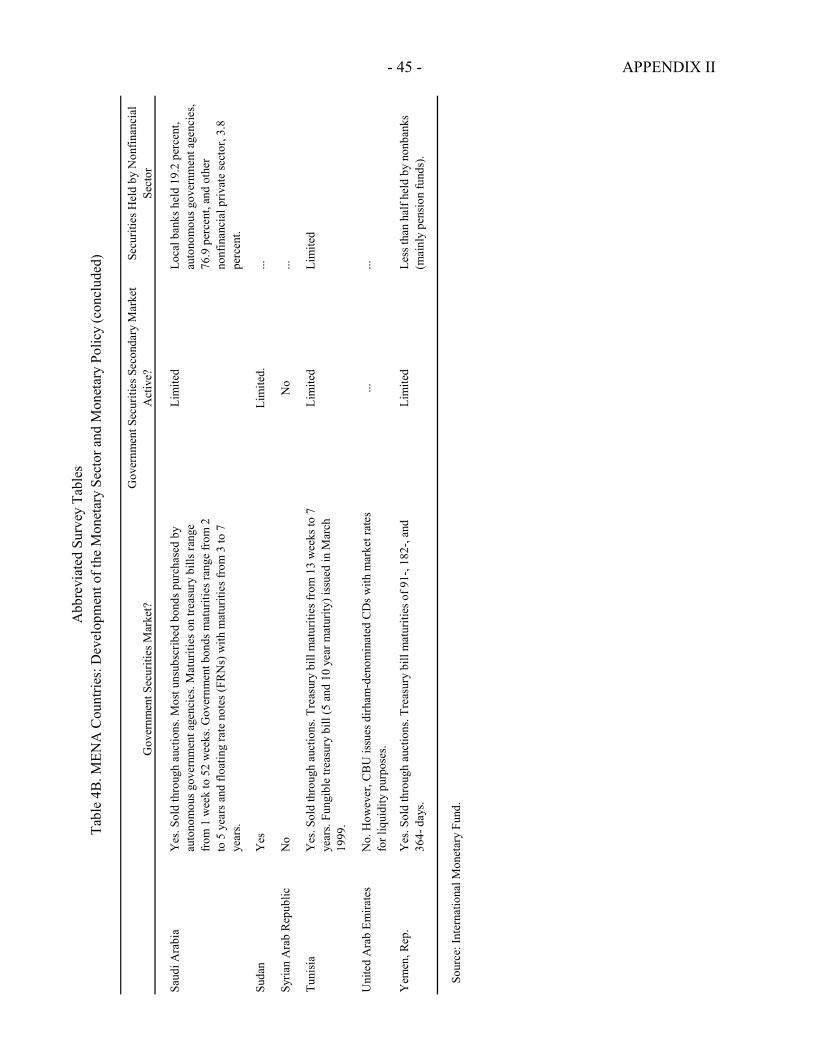
- 45 - APPENDIX II
Gov
ernm
ent S
ecur
ities
Mar
ket?
Gov
ernm
ent S
ecur
ities
Sec
onda
ry M
arke
t A
ctiv
e?Se
curit
ies H
eld
by N
onfin
anci
al
Sect
or
Saud
i Ara
bia
Yes
. Sol
d th
roug
h au
ctio
ns. M
ost u
nsub
scrib
ed b
onds
pur
chas
ed b
y au
tono
mou
s gov
ernm
ent a
genc
ies.
Mat
uriti
es o
n tre
asur
y bi
lls ra
nge
from
1 w
eek
to 5
2 w
eeks
. Gov
ernm
ent b
onds
mat
uriti
es ra
nge
from
2
to 5
yea
rs a
nd fl
oatin
g ra
te n
otes
(FR
Ns)
with
mat
uriti
es fr
om 3
to 7
ye
ars.
Lim
ited
Loca
l ban
ks h
eld
19.2
per
cent
, au
tono
mou
s gov
ernm
ent a
genc
ies,
76.9
per
cent
, and
oth
er
nonf
inan
cial
priv
ate
sect
or, 3
.8
perc
ent.
Suda
nY
esLi
mite
d.
...
Syria
n A
rab
Rep
ublic
No
No
...
Tuni
sia
Yes
. Sol
d th
roug
h au
ctio
ns. T
reas
ury
bill
mat
uriti
es fr
om 1
3 w
eeks
to 7
ye
ars.
Fung
ible
trea
sury
bill
(5 a
nd 1
0 ye
ar m
atur
ity) i
ssue
d in
Mar
ch
1999
.
Lim
ited
Lim
ited
Uni
ted
Ara
b Em
irate
sN
o. H
owev
er, C
BU
issu
es d
irham
-den
omin
ated
CD
s with
mar
ket r
ates
fo
r liq
uidi
ty p
urpo
ses.
...
...
Yem
en, R
ep.
Yes
. Sol
d th
roug
h au
ctio
ns. T
reas
ury
bill
mat
uriti
es o
f 91-
, 182
-, an
d 36
4- d
ays.
Lim
ited
Less
than
hal
f hel
d by
non
bank
s (m
ainl
y pe
nsio
n fu
nds)
.
Sour
ce: I
nter
natio
nal M
onet
ary
Fund
.
Tabl
e 4B
. MEN
A C
ount
ries:
Dev
elop
men
t of t
he M
onet
ary
Sect
or a
nd M
onet
ary
Polic
y (c
oncl
uded
)A
bbre
viat
ed S
urve
y Ta
bles
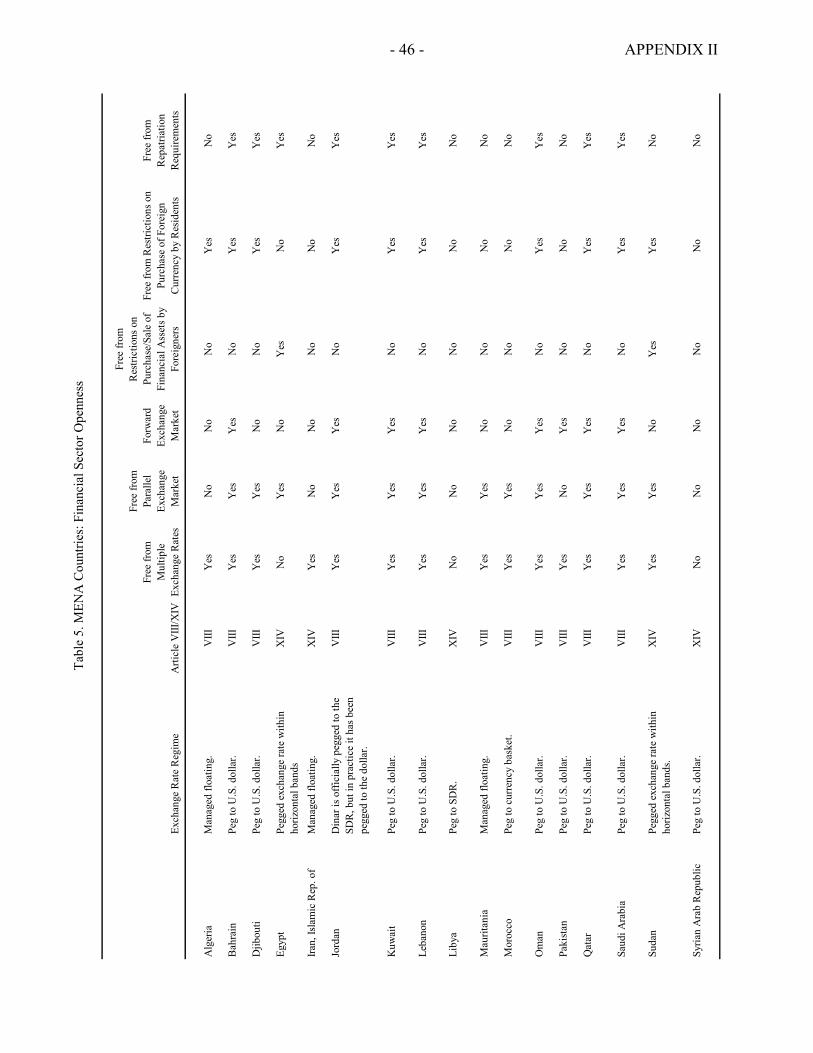
- 46 - APPENDIX II
Tabl
e 5.
MEN
A C
ount
ries:
Fin
anci
al S
ecto
r Ope
nnes
s
Exch
ange
Rat
e R
egim
eA
rticl
e V
III/X
IV
Free
from
M
ultip
le
Exch
ange
Rat
es
Free
from
Pa
ralle
l Ex
chan
ge
Mar
ket
Forw
ard
Exch
ange
M
arke
t
Free
from
R
estri
ctio
ns o
n Pu
rcha
se/S
ale
of
Fina
ncia
l Ass
ets b
y Fo
reig
ners
Free
from
Res
trict
ions
on
Purc
hase
of F
orei
gn
Cur
renc
y by
Res
iden
ts
Free
from
R
epat
riatio
n R
equi
rem
ents
Alg
eria
Man
aged
floa
ting.
VIII
Yes
No
No
No
Yes
No
Bah
rain
Peg
to U
.S. d
olla
r.V
IIIY
esY
esY
esN
oY
esY
es
Djib
outi
Peg
to U
.S. d
olla
r.V
IIIY
esY
esN
oN
oY
esY
es
Egyp
tPe
gged
exc
hang
e ra
te w
ithin
ho
rizon
tal b
ands
XIV
No
Yes
No
Yes
No
Yes
Iran,
Isla
mic
Rep
. of
Man
aged
floa
ting.
XIV
Yes
No
No
No
No
No
Jord
anD
inar
is o
ffici
ally
peg
ged
to th
e SD
R, b
ut in
pra
ctic
e it
has b
een
pegg
ed to
the
dolla
r.
VIII
Yes
Yes
Yes
No
Yes
Yes
Kuw
ait
Peg
to U
.S. d
olla
r.V
IIIY
esY
esY
esN
oY
esY
es
Leba
non
Peg
to U
.S. d
olla
r.V
IIIY
esY
esY
esN
oY
esY
es
Liby
aPe
g to
SD
R.
XIV
No
No
No
No
No
No
Mau
ritan
iaM
anag
ed fl
oatin
g.V
IIIY
es
Yes
No
No
No
No
Mor
occo
Peg
to c
urre
ncy
bask
et.
VIII
Yes
Yes
No
No
No
No
Om
anPe
g to
U.S
. dol
lar.
VIII
Yes
Yes
Yes
No
Yes
Yes
Paki
stan
Peg
to U
.S. d
olla
r.V
IIIY
esN
oY
esN
oN
oN
o
Qat
arPe
g to
U.S
. dol
lar.
VIII
Yes
Yes
Yes
No
Yes
Yes
Saud
i Ara
bia
Peg
to U
.S. d
olla
r.V
IIIY
esY
esY
esN
oY
esY
es
Suda
nPe
gged
exc
hang
e ra
te w
ithin
ho
rizon
tal b
ands
.X
IVY
es
Yes
No
Yes
Yes
No
Syria
n A
rab
Rep
ublic
Peg
to U
.S. d
olla
r.X
IVN
o N
oN
oN
oN
oN
o
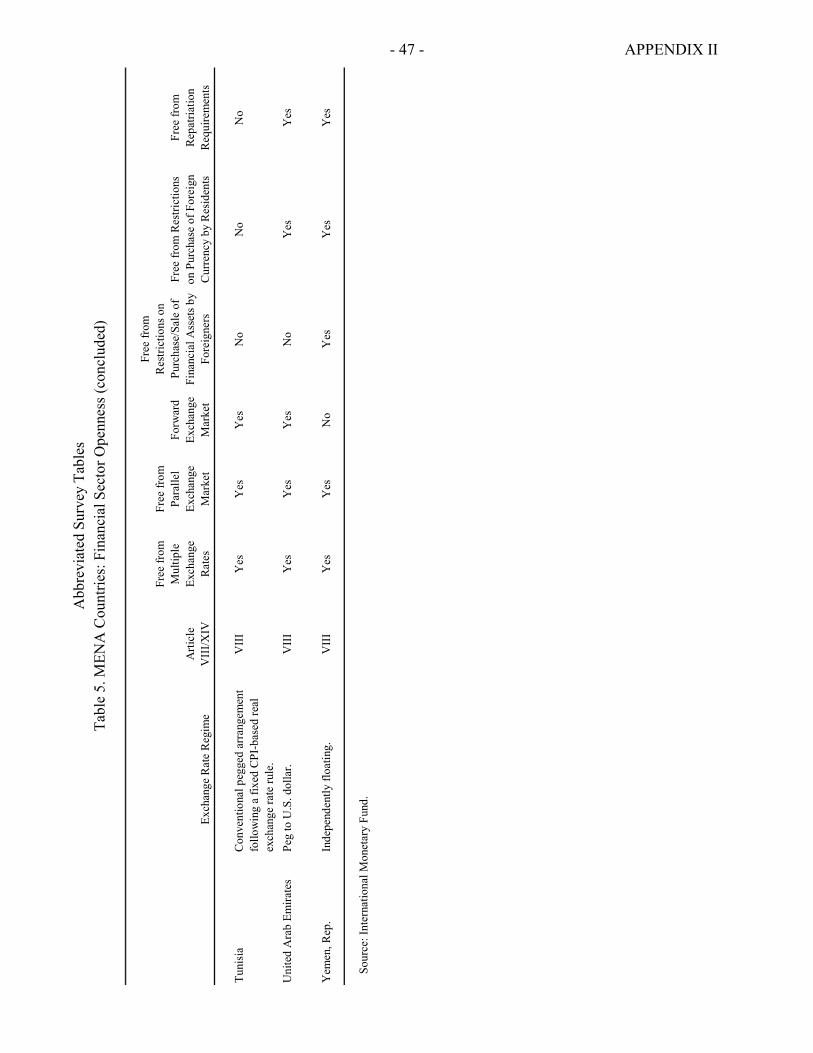
- 47 - APPENDIX II
Tabl
e 5.
MEN
A C
ount
ries:
Fin
anci
al S
ecto
r Ope
nnes
s (co
nclu
ded)
Exch
ange
Rat
e R
egim
eA
rticl
e V
III/X
IV
Free
from
M
ultip
le
Exch
ange
R
ates
Free
from
Pa
ralle
l Ex
chan
ge
Mar
ket
Forw
ard
Exch
ange
M
arke
t
Free
from
R
estri
ctio
ns o
n Pu
rcha
se/S
ale
of
Fina
ncia
l Ass
ets b
y Fo
reig
ners
Free
from
Res
trict
ions
on
Pur
chas
e of
For
eign
C
urre
ncy
by R
esid
ents
Free
from
Re
patri
atio
n R
equi
rem
ents
Tuni
sia
Con
vent
iona
l peg
ged
arra
ngem
ent
follo
win
g a
fixed
CPI
-bas
ed re
al
exch
ange
rate
rule
.
VII
IY
esY
esY
esN
oN
oN
o
Uni
ted
Ara
b Em
irate
sPe
g to
U.S
. dol
lar.
VII
IY
esY
esY
esN
oY
esY
es
Yem
en, R
ep.
Inde
pend
ently
floa
ting.
VII
IY
esY
esN
oY
esY
esY
es
So
urce
: Int
erna
tiona
l Mon
etar
y Fu
nd.
Abb
revi
ated
Sur
vey
Tabl
es
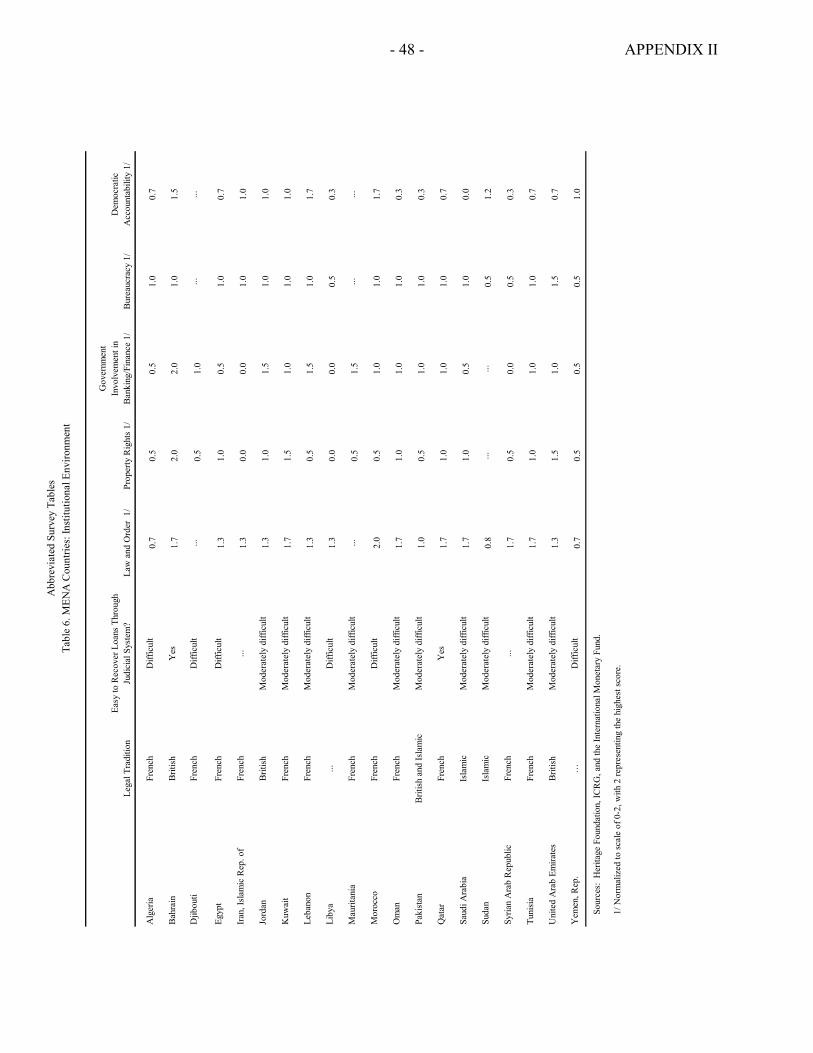
- 48 - APPENDIX II
Lega
l Tra
ditio
nEa
sy to
Rec
over
Loa
ns T
hrou
gh
Judi
cial
Sys
tem
?La
w a
nd O
rder
1/
Prop
erty
Rig
hts
1/
Gov
ernm
ent
Invo
lvem
ent i
n B
anki
ng/F
inan
ce 1
/B
urea
ucra
cy 1
/D
emoc
ratic
A
ccou
ntab
ility
1/
Alg
eria
Fren
chD
iffic
ult
0.7
0.5
0.5
1.0
0.7
Bah
rain
Brit
ish
Yes
1.7
2.0
2.0
1.0
1.5
Djib
outi
Fren
chD
iffic
ult
...0.
51.
0...
...
Egyp
tFr
ench
Diff
icul
t1.
31.
00.
51.
00.
7
Iran
, Isl
amic
Rep
. of
Fren
ch...
1.3
0.0
0.0
1.0
1.0
Jord
anB
ritis
hM
oder
atel
y di
fficu
lt1.
31.
01.
51.
01.
0
Kuw
ait
Fren
chM
oder
atel
y di
fficu
lt1.
71.
51.
01.
01.
0
Leba
non
Fren
chM
oder
atel
y di
fficu
lt1.
30.
51.
51.
01.
7
Liby
a...
Diff
icul
t1.
30.
00.
00.
50.
3
Mau
ritan
iaFr
ench
Mod
erat
ely
diffi
cult
...0.
51.
5...
...
Mor
occo
Fren
chD
iffic
ult
2.0
0.5
1.0
1.0
1.7
Om
anFr
ench
Mod
erat
ely
diffi
cult
1.7
1.0
1.0
1.0
0.3
Paki
stan
Brit
ish
and
Isla
mic
Mod
erat
ely
diffi
cult
1.0
0.5
1.0
1.0
0.3
Qat
arFr
ench
Yes
1.7
1.0
1.0
1.0
0.7
Saud
i Ara
bia
Isla
mic
Mod
erat
ely
diffi
cult
1.7
1.0
0.5
1.0
0.0
Suda
nIs
lam
icM
oder
atel
y di
fficu
lt0.
8...
...0.
51.
2
Syria
n A
rab
Rep
ublic
Fren
ch...
1.7
0.5
0.0
0.5
0.3
Tuni
sia
Fren
chM
oder
atel
y di
fficu
lt1.
71.
01.
01.
00.
7
Uni
ted
Ara
b Em
irate
sB
ritis
hM
oder
atel
y di
fficu
lt1.
31.
51.
01.
50.
7
Yem
en, R
ep.
…D
iffic
ult
0.7
0.5
0.5
0.5
1.0
Sour
ces:
Her
itage
Fou
ndat
ion,
ICR
G, a
nd th
e In
tern
atio
nal M
onet
ary
Fund
.
1/ N
orm
aliz
ed to
sca
le o
f 0-2
, with
2 re
pres
entin
g th
e hi
ghes
t sco
re.
Tabl
e 6.
MEN
A C
ount
ries:
Inst
itutio
nal E
nviro
nmen
tA
bbre
viat
ed S
urve
y Ta
bles
- 49 -
References Abiad, Abdul, and Ashoka Mody, 2003, “Financial Reform: What Shakes It? What Shapes
It?” IMF Working Paper 03/70 (Washington: International Monetary Fund). Beck, Thorsten, and Ross Levine, 2004 “Stock Markets, Banks, and Growth: Panel
Evidence,” Journal of Banking and Finance, Vol. 28, No 3 (March), pp. 423–42. Beck, Thorsten, Ross Levine, and Norman Loayza, 2000, “Finance and the Sources of
Growth,” Journal of Financial Economics, Vol. 58, pp. 261–300. Beim, David O., and Calomiris, Charles W., 2001, Emerging Financial Markets (New York:
McGraw-Hill Irwin). Calderon, Cesar, and Lin Liu, 2003, “The Direction of Causality between Financial
Development and Economic Growth,” Journal of Development Economics, Vol. 72, No. 1 (October), pp. 321–334.
Cetorelli, Nicola, and Michele Gambera, 2001, “Banking Market Structure, Financial
Dependence and Growth: International Evidence from Industry Data,” Journal of Finance, Vol. 56, No. 2 (April), pp. 617–648.
Chalk, Nigel, Abdelali Jbili, Volker Treichel, and John Wilson, 1996, “Financial Structure
and Reforms,” in Building on Progress: Reform and Growth in the Middle East and North Africa (Washington: International Monetary Fund).
Christopoulos, Dimitris, and Efthymios Tsionas, 2004, “Financial Development and
Economic Growth: Evidence from Panel Unit Root and Cointegration Tests,” Journal of Development Economics, Vol. 73, No. 1 (February), pp. 55–74.
Demetriades, Panicos, and Khaled Hussein, 1996, “Does Financial Development Cause
Economic Growth? Time-Series Evidence from Sixteen Countries,” Journal of Development Economics, Vol. 51, No. 2 (December), pp. 387–411.
Demirguc-Kunt, Asli, and Ross Levine, eds., 2001, Financial Structures and Economic
Growth: A Cross-Country Comparison of Banks, Markets, and Development (Cambridge, MA: MIT Press).
Favara, Giovanni, 2003, “An Empirical Reassessment of the Relationship between Finance
and Growth,” IMF Working Paper 03/123 (Washington: International Monetary Fund).
Fry, Maxwell J., 1995, Money, Interest, and Banking in Economic Development (Baltimore:
Johns Hopkins, 2d. ed.).
- 50 -
Gelbard, Enrique A., and Sergio Pereira Leite, 1999, “Measuring Financial Development in Sub-Saharan Africa,” IMF Working Paper 99/105 (Washington: International Monetary Fund).
Jbili, Abdelali, Vicente Galbis, and Amer Biset, 1997, “Financial Systems and Reform in the
Gulf Cooperation Council Countries,” (unpublished; Washington: International Monetary Fund).
Jung, Woo S., 1986, “Financial Development and Economic Growth: International
Evidence,” Economic Development and Cultural Change, Vol. 34, No. 2 (January), pp. 333–346.
Khan, Mohsin S., and Abdelhak S. Senhadji, 2000, “Financial Development and Economic
Growth: An Overview,” IMF Working Paper 00/209 (Washington: International Monetary Fund).
King, Robert G., and Ross Levine, 1993a, “Finance, Entrepreneurship, and Growth: Theory
and Evidence,” Journal of Monetary Economics, Vol. 32, pp. 513–542. ________, 1993b, “Finance and Growth: Schumpeter Might be Right,” Quarterly Journal of
Economics, Vol. 108, pp. 717–737. La Porta, Rafael, Florencio Lopez-de-Silanes, and Andrei Shleifer, 2002, “Government
Ownership of Banks,” Journal of Finance, Vol. 57, No. 1 (February), pp. 265–301. ________, and Robert Vishny, 1997, “Legal Determinants of External Finance,” Journal of
Finance, Vol. 52, No. 3 (July), pp. 1131–1150. ________, 1998, “Law and Finance,” Journal of Political Economy, Vol. 106, No. 6
(December), pp. 1113–1155. Levine, Ross, 1997, “Financial Development and Economic Growth: Views and Agenda,”
Journal of Economic Literature, Vol. 35, No. 2, pp. 688–726. ________, 1998, “The Legal Environment, Banks, and Long-Run Economic Growth,”
Journal of Money, Credit, and Banking, Vol. 30, No. 3 (August), pp. 596–613. ________, 1999, “Law, Finance, and Economic Growth,” Journal of Financial
Intermediation, Vol. 8, No. 1-2 (Jan.-April), pp. 8–35. ________, 2002, “Bank-Based or Market-Based Financial Systems: Which is Better?”
Journal of Financial Intermediation, Vol. 11, No. 4 (October), pp. 398–428. ________, 2003, “Denying Foreign Bank Entry: Implications for Bank Interest Margins,”
University of Minnesota, mimeo.
- 51 -
________, forthcoming, “Finance and Growth: Theory, Evidence, and Mechanisms,” in
Handbook of Economic Growth, ed. by Philippe Aghion and Steven Durlauf (Elsevier).
________, Norman Loayza, and Thorsten Beck, 2000, “Financial Intermediation and
Growth: Causality and Causes,” Journal of Monetary Economics, Vol. 46 (August), pp. 31–77.
________, and Sara Zervos, 1998, “Stock Markets, Banks, and Economic Growth,”
American Economic Review, Vol. 88, No. 3 (June), pp. 537–558. Luintel, Kul, and Mosahid Khan, 1999, “A Quantitative Reassessment of the Finance-
Growth Nexus: Evidence from a Multivariate VAR,” Journal of Development Economics, Vol. 60, pp. 381–405.
Mankiw, N. Gregory, David Romer, and David N. Weil, “A Contribution to the Empirics of
Economic Growth,” Quarterly Journal of Economics, 107 (2), May, 1992, 407–37. Nashashibi, Karim, Mohamad Elhage, and Annalisa Fedelino, 2001, “Financial
Liberalization in Arab Countries,” in Macroeconomic Issues and Policies in the Middle East and North Africa, ed. by Zubair Iqbal (Washington: International Monetary Fund).
Neusser, Klaus, and Maurice Kugler, 1998, “Manufacturing Growth and Financial
Development: Evidence from OECD Countries,” Review of Economics and Statistics, Vol. 80, No. 4 (November), pp. 638–646.
Roubini, Nouriel, and Xavier Sala-i-Martin, 1992, “Financial Repression and Economic
Growth,” Journal of Development Economics, Vol. 39 (July), pp. 5–30. Rousseau, Peter, and Richard Sylla, 1999, “Emerging Financial Markets and Early
U.S. Growth,” NBER Working Paper No. 7448 (Cambridge, Massachusetts: National Bureau of Economic Research).
Rousseau, Peter, and Paul Wachtel, 1998, “Financial Intermediation and Economic
Performance: Historical Evidence from Five Industrialized Countries,” Journal of Money, Credit, and Banking, Vol. 30, No. 4 (November), pp. 657–678.
________, 2000, “Equity Markets and Growth: Cross-Country Evidence on Timing and
Outcomes, 1980-95,” Journal of Banking and Finance, Vol. 24, No. 12 (December), pp. 1933–1957.
Wachtel, Paul, 2001, “Growth and Finance: What Do We Know and How Do We Know It?”
International Finance, Vol. 4, No. 3, pp. 335–62.
- 52 -
________, and Peter Rousseau, 1995, “Financial Intermediation and Economic Growth: A
Historical Comparison of the U.S., U.K., and Canada,” in Anglo-American Financial Systems, ed. by Michael Bordo and Richard Sylla (New York: Irwin), pp. 329–381.
Xu, Zhenhui, 2000, “Financial Development, Investment, and Growth,” Economic Inquiry,
Vol. 38, No. 2 (April), pp. 331–344.