Embed Size (px)
Citation preview

CONTENTS
Inside Cover Consolidated Eleven-Year Summary
02 Management’s Discussion and Analysis
12 1 Financial Statements (IFRS)
Consolidated Financial Statements (IFRS)
12 i) Consolidated Statements of Financial Position
14 ii) Consolidated Statements of Profit or Loss and
Consolidated Statements of Comprehensive Income
(Consolidated Statements of Profit or Loss)
15 (Consolidated Statements of Comprehensive Income)
16 iii) Consolidated Statements of Changes in Equity
18 iv) Consolidated Statements of Cash Flows
19 2 Notes to Consolidated Financial Statements
66 Independent Auditor’s Report
Financial Review
2020For the Year Ended December 31, 2020

Financial Review 2020
(Unit: Millions of yen) (Unit: Millions of yen)(Unit: Thousands of U.S. dollars)
2020/12 2019/12 2018/12 2017/12 2016/12 2015/12 2014/12 2013/12 2012/12 2013/12 2012/12 2011/12 2010/12 2020/12Note IFRS IFRS IFRS IFRS IFRS IFRS IFRS IFRS IFRS JGAAP JGAAP JGAAP JGAAP IFRS
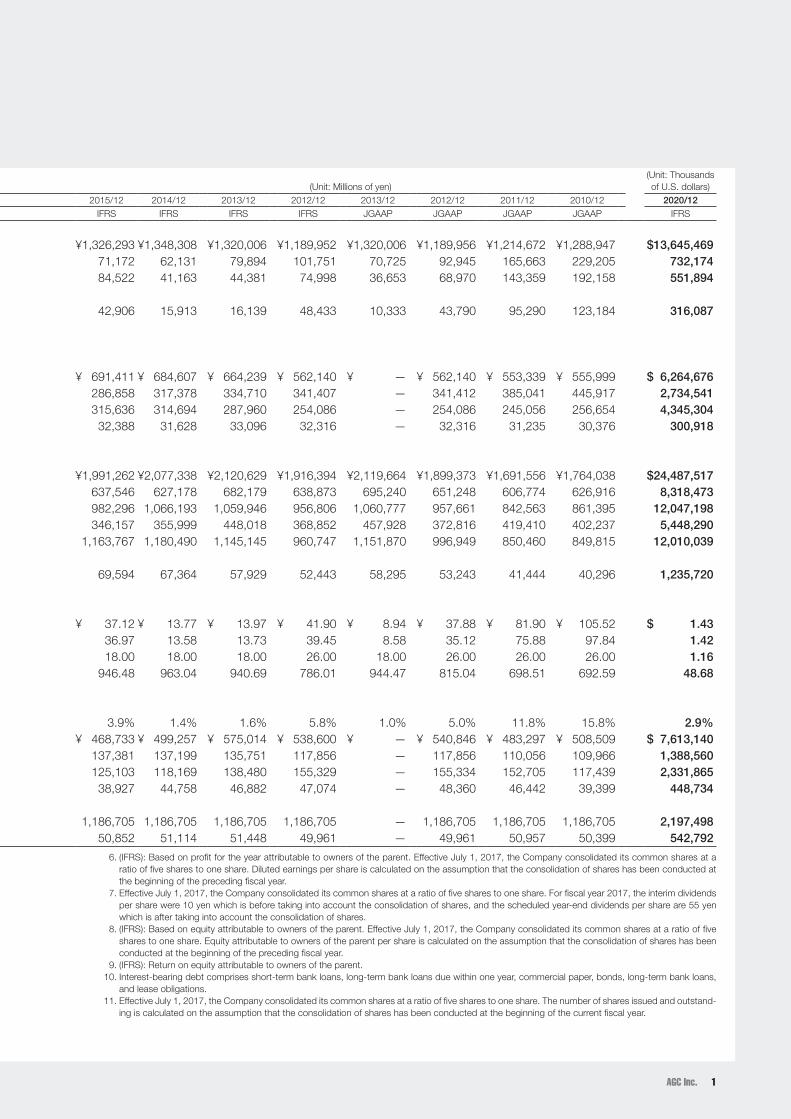
Operating ResultsNet sales . . . . . . . . . . . . . . . . . . . . . . . . . . . . . . . . ¥1,412,306 ¥1,518,039 ¥1,522,904 ¥1,463,532 ¥1,282,570 ¥1,326,293 ¥1,348,308 ¥1,320,006 ¥1,189,952 ¥1,320,006 ¥1,189,956 ¥1,214,672 ¥1,288,947 $13,645,469Operating profit . . . . . . . . . . . . . . . . . . . . . . . . . . . 75,780 101,624 120,555 119,646 96,292 71,172 62,131 79,894 101,751 70,725 92,945 165,663 229,205 732,174Profit before tax . . . . . . . . . . . . . . . . . . . . . . . . . . . 57,121 76,213 128,404 114,424 67,563 84,522 41,163 44,381 74,998 36,653 68,970 143,359 192,158 551,894Profit for the year attributable to owners of the parent . . . . . . . . . . . . . . . . . . . . . . . . . . . . . . 3 32,715 44,434 89,593 69,225 47,438 42,906 15,913 16,139 48,433 10,333 43,790 95,290 123,184 316,087
Segment Information 4Sales to external customers
Glass Operations . . . . . . . . . . . . . . . . . . . . . . . . ¥ 648,394 ¥ 740,920 ¥ 756,160 ¥ 733,953 ¥ 679,071 ¥ 691,411 ¥ 684,607 ¥ 664,239 ¥ 562,140 ¥ — ¥ 562,140 ¥ 553,339 ¥ 555,999 $ 6,264,676Electronics Operations . . . . . . . . . . . . . . . . . . . . 283,025 265,215 250,285 260,626 257,069 286,858 317,378 334,710 341,407 — 341,412 385,041 445,917 2,734,541Chemicals Operations . . . . . . . . . . . . . . . . . . . . 449,739 474,417 482,097 435,145 314,392 315,636 314,694 287,960 254,086 — 254,086 245,056 256,654 4,345,304Ceramics/Other Operations . . . . . . . . . . . . . . . . 31,145 37,485 34,361 33,807 32,037 32,388 31,628 33,096 32,316 — 32,316 31,235 30,376 300,918
Financial Position Total assets . . . . . . . . . . . . . . . . . . . . . . . . . . . . . . ¥2,534,458 ¥2,335,415 ¥2,235,776 ¥2,228,560 ¥1,981,451 ¥1,991,262 ¥2,077,338 ¥2,120,629 ¥1,916,394 ¥2,119,664 ¥1,899,373 ¥1,691,556 ¥1,764,038 $24,487,517Total current assets . . . . . . . . . . . . . . . . . . . . . . . . 860,962 742,612 733,196 722,522 673,436 637,546 627,178 682,179 638,873 695,240 651,248 606,774 626,916 8,318,473Property, plant and equipment . . . . . . . . . . . . . . . . 1,246,885 1,177,691 1,108,934 1,060,601 937,869 982,296 1,066,193 1,059,946 956,806 1,060,777 957,661 842,563 861,395 12,047,198Total current liabilities . . . . . . . . . . . . . . . . . . . . . . . 563,898 482,490 463,098 455,288 377,490 346,157 355,999 448,018 368,852 457,928 372,816 419,410 402,237 5,448,290Total equity/Total net assets . . . . . . . . . . . . . . . . . . 1,243,039 1,282,636 1,253,604 1,289,895 1,168,743 1,163,767 1,180,490 1,145,145 960,747 1,151,870 996,949 850,460 849,815 12,010,039Non-controlling interests in consolidated subsidiaries . . . . . . . . . . . . . . . . . . . . . . . . . . . . . 127,897 125,538 116,399 105,860 73,305 69,594 67,364 57,929 52,443 58,295 53,243 41,444 40,296 1,235,720
Per Share Data (Yen) Basic — EPS . . . . . . . . . . . . . . . . . . . . . . . . . . . . . 5 ¥ 147.84 ¥ 200.85 ¥ 399.51 ¥ 302.12 ¥ 205.14 ¥ 37.12 ¥ 13.77 ¥ 13.97 ¥ 41.90 ¥ 8.94 ¥ 37.88 ¥ 81.90 ¥ 105.52 $ 1.43Diluted — EPS . . . . . . . . . . . . . . . . . . . . . . . . . . . . 6 147.24 199.95 397.58 300.65 204.26 36.97 13.58 13.73 39.45 8.58 35.12 75.88 97.84 1.42Cash dividends . . . . . . . . . . . . . . . . . . . . . . . . . . . 120.00 120.00 115.00 (Note 7) 18.00 18.00 18.00 18.00 26.00 18.00 26.00 26.00 26.00 1.16Equity/Net assets . . . . . . . . . . . . . . . . . . . . . . . . . . 8 5,038.52 5,229.58 5,141.43 5,239.70 4,736.59 946.48 963.04 940.69 786.01 944.47 815.04 698.51 692.59 48.68
Other Data Return on equity (ROE) . . . . . . . . . . . . . . . . . . . . . 9 2.9% 3.9% 7.7% 6.1% 4.3% 3.9% 1.4% 1.6% 5.8% 1.0% 5.0% 11.8% 15.8% 2.9%Interest-bearing debt . . . . . . . . . . . . . . . . . . . . . . . 10 ¥ 787,960 ¥ 602,843 ¥ 541,780 ¥ 489,085 ¥ 433,968 ¥ 468,733 ¥ 499,257 ¥ 575,014 ¥ 538,600 ¥ — ¥ 540,846 ¥ 483,297 ¥ 508,509 $ 7,613,140Depreciation and amortization . . . . . . . . . . . . . . . . 143,716 143,361 121,668 128,226 121,803 137,381 137,199 135,751 117,856 — 117,856 110,056 109,966 1,388,560Capital expenditures . . . . . . . . . . . . . . . . . . . . . . . 241,348 207,661 230,598 165,095 126,025 125,103 118,169 138,480 155,329 — 155,334 152,705 117,439 2,331,865Research and development expenses . . . . . . . . . . 46,444 47,450 45,755 43,912 39,212 38,927 44,758 46,882 47,074 — 48,360 46,442 39,399 448,734Number of shares issued and outstanding (Thousands of shares) . . . . . . . . . . . . . . . . . . . . . 11 227,441 227,441 227,441 235,177 1,186,705 1,186,705 1,186,705 1,186,705 1,186,705 — 1,186,705 1,186,705 1,186,705 2,197,498
Number of employees . . . . . . . . . . . . . . . . . . . . . . 56,179 55,598 54,101 53,224 50,963 50,852 51,114 51,448 49,961 — 49,961 50,957 50,399 542,792
AGC Inc. and Consolidated SubsidiariesFor the years ended December 31
Notes: 1. The Company maintains its accounting records in Japanese yen. The U.S. dollar amounts included in this consolidated eleven-year summary represent the arithmetical results of translating Japanese yen to U.S. dollars on the basis of ¥103.50=US$1, the approximate exchange rate as of December 31, 2020. The inclusion of such U.S. dollar amounts is solely for convenience and is not intended to imply that Japanese yen amounts have been or could be converted, realized or settled in U.S. dollars at ¥103.50=US$1 or at any other rate.
2. The Company has prepared consolidated financial statements in accordance with International Financial Reporting Standards (“IFRS”) from the fiscal year ended December 31, 2013 instead of Japanese Generally Accepted Accounting Principles (“JGAAP”). The date of transition to IFRS was January 1, 2012.
3. (IFRS): Under IFRS, profit for the year is presented before deducting non-controlling interests. For comparison, the Company shows profit for the year attributable to owners of the parent.
4. Beginning from fiscal year 2011, the Company adopted the “Accounting Standard for Disclosures about Segments of an Enterprise and Related Information” (ASBJ Statement No. 17, March 27, 2009) and the “Guidance on the Accounting Standard for Disclosures about Segments of an Enterprise and Related Information” (ASBJ Guidance No. 20, March 21, 2008) and restated the amount of the previous year.
5. (IFRS): Based on profit for the year attributable to owners of the parent. Effective July 1, 2017, the Company consolidated its common shares at a ratio of five shares to one share. Basic earnings per share is calculated on the assumption that the consolidation of shares has been conducted at the beginning of the preceding fiscal year.
CONSOLIDATED ELEVEN-YEAR SUMMARY
1AGC Inc.
(Unit: Millions of yen) (Unit: Millions of yen)(Unit: Thousands of U.S. dollars)
2020/12 2019/12 2018/12 2017/12 2016/12 2015/12 2014/12 2013/12 2012/12 2013/12 2012/12 2011/12 2010/12 2020/12Note IFRS IFRS IFRS IFRS IFRS IFRS IFRS IFRS IFRS JGAAP JGAAP JGAAP JGAAP IFRS
Operating ResultsNet sales . . . . . . . . . . . . . . . . . . . . . . . . . . . . . . . . ¥1,412,306 ¥1,518,039 ¥1,522,904 ¥1,463,532 ¥1,282,570 ¥1,326,293 ¥1,348,308 ¥1,320,006 ¥1,189,952 ¥1,320,006 ¥1,189,956 ¥1,214,672 ¥1,288,947 $13,645,469Operating profit . . . . . . . . . . . . . . . . . . . . . . . . . . . 75,780 101,624 120,555 119,646 96,292 71,172 62,131 79,894 101,751 70,725 92,945 165,663 229,205 732,174Profit before tax . . . . . . . . . . . . . . . . . . . . . . . . . . . 57,121 76,213 128,404 114,424 67,563 84,522 41,163 44,381 74,998 36,653 68,970 143,359 192,158 551,894Profit for the year attributable to owners of the parent . . . . . . . . . . . . . . . . . . . . . . . . . . . . . . 3 32,715 44,434 89,593 69,225 47,438 42,906 15,913 16,139 48,433 10,333 43,790 95,290 123,184 316,087
Segment Information 4Sales to external customers
Glass Operations . . . . . . . . . . . . . . . . . . . . . . . . ¥ 648,394 ¥ 740,920 ¥ 756,160 ¥ 733,953 ¥ 679,071 ¥ 691,411 ¥ 684,607 ¥ 664,239 ¥ 562,140 ¥ — ¥ 562,140 ¥ 553,339 ¥ 555,999 $ 6,264,676Electronics Operations . . . . . . . . . . . . . . . . . . . . 283,025 265,215 250,285 260,626 257,069 286,858 317,378 334,710 341,407 — 341,412 385,041 445,917 2,734,541Chemicals Operations . . . . . . . . . . . . . . . . . . . . 449,739 474,417 482,097 435,145 314,392 315,636 314,694 287,960 254,086 — 254,086 245,056 256,654 4,345,304Ceramics/Other Operations . . . . . . . . . . . . . . . . 31,145 37,485 34,361 33,807 32,037 32,388 31,628 33,096 32,316 — 32,316 31,235 30,376 300,918
Financial Position Total assets . . . . . . . . . . . . . . . . . . . . . . . . . . . . . . ¥2,534,458 ¥2,335,415 ¥2,235,776 ¥2,228,560 ¥1,981,451 ¥1,991,262 ¥2,077,338 ¥2,120,629 ¥1,916,394 ¥2,119,664 ¥1,899,373 ¥1,691,556 ¥1,764,038 $24,487,517Total current assets . . . . . . . . . . . . . . . . . . . . . . . . 860,962 742,612 733,196 722,522 673,436 637,546 627,178 682,179 638,873 695,240 651,248 606,774 626,916 8,318,473Property, plant and equipment . . . . . . . . . . . . . . . . 1,246,885 1,177,691 1,108,934 1,060,601 937,869 982,296 1,066,193 1,059,946 956,806 1,060,777 957,661 842,563 861,395 12,047,198Total current liabilities . . . . . . . . . . . . . . . . . . . . . . . 563,898 482,490 463,098 455,288 377,490 346,157 355,999 448,018 368,852 457,928 372,816 419,410 402,237 5,448,290Total equity/Total net assets . . . . . . . . . . . . . . . . . . 1,243,039 1,282,636 1,253,604 1,289,895 1,168,743 1,163,767 1,180,490 1,145,145 960,747 1,151,870 996,949 850,460 849,815 12,010,039Non-controlling interests in consolidated subsidiaries . . . . . . . . . . . . . . . . . . . . . . . . . . . . . 127,897 125,538 116,399 105,860 73,305 69,594 67,364 57,929 52,443 58,295 53,243 41,444 40,296 1,235,720
Per Share Data (Yen) Basic — EPS . . . . . . . . . . . . . . . . . . . . . . . . . . . . . 5 ¥ 147.84 ¥ 200.85 ¥ 399.51 ¥ 302.12 ¥ 205.14 ¥ 37.12 ¥ 13.77 ¥ 13.97 ¥ 41.90 ¥ 8.94 ¥ 37.88 ¥ 81.90 ¥ 105.52 $ 1.43Diluted — EPS . . . . . . . . . . . . . . . . . . . . . . . . . . . . 6 147.24 199.95 397.58 300.65 204.26 36.97 13.58 13.73 39.45 8.58 35.12 75.88 97.84 1.42Cash dividends . . . . . . . . . . . . . . . . . . . . . . . . . . . 120.00 120.00 115.00 (Note 7) 18.00 18.00 18.00 18.00 26.00 18.00 26.00 26.00 26.00 1.16Equity/Net assets . . . . . . . . . . . . . . . . . . . . . . . . . . 8 5,038.52 5,229.58 5,141.43 5,239.70 4,736.59 946.48 963.04 940.69 786.01 944.47 815.04 698.51 692.59 48.68
Other Data Return on equity (ROE) . . . . . . . . . . . . . . . . . . . . . 9 2.9% 3.9% 7.7% 6.1% 4.3% 3.9% 1.4% 1.6% 5.8% 1.0% 5.0% 11.8% 15.8% 2.9%Interest-bearing debt . . . . . . . . . . . . . . . . . . . . . . . 10 ¥ 787,960 ¥ 602,843 ¥ 541,780 ¥ 489,085 ¥ 433,968 ¥ 468,733 ¥ 499,257 ¥ 575,014 ¥ 538,600 ¥ — ¥ 540,846 ¥ 483,297 ¥ 508,509 $ 7,613,140Depreciation and amortization . . . . . . . . . . . . . . . . 143,716 143,361 121,668 128,226 121,803 137,381 137,199 135,751 117,856 — 117,856 110,056 109,966 1,388,560Capital expenditures . . . . . . . . . . . . . . . . . . . . . . . 241,348 207,661 230,598 165,095 126,025 125,103 118,169 138,480 155,329 — 155,334 152,705 117,439 2,331,865Research and development expenses . . . . . . . . . . 46,444 47,450 45,755 43,912 39,212 38,927 44,758 46,882 47,074 — 48,360 46,442 39,399 448,734Number of shares issued and outstanding (Thousands of shares) . . . . . . . . . . . . . . . . . . . . . 11 227,441 227,441 227,441 235,177 1,186,705 1,186,705 1,186,705 1,186,705 1,186,705 — 1,186,705 1,186,705 1,186,705 2,197,498
Number of employees . . . . . . . . . . . . . . . . . . . . . . 56,179 55,598 54,101 53,224 50,963 50,852 51,114 51,448 49,961 — 49,961 50,957 50,399 542,792
6. (IFRS): Based on profit for the year attributable to owners of the parent. Effective July 1, 2017, the Company consolidated its common shares at a ratio of five shares to one share. Diluted earnings per share is calculated on the assumption that the consolidation of shares has been conducted at the beginning of the preceding fiscal year.
7. Effective July 1, 2017, the Company consolidated its common shares at a ratio of five shares to one share. For fiscal year 2017, the interim dividends per share were 10 yen which is before taking into account the consolidation of shares, and the scheduled year-end dividends per share are 55 yen which is after taking into account the consolidation of shares.
8. (IFRS): Based on equity attributable to owners of the parent. Effective July 1, 2017, the Company consolidated its common shares at a ratio of five shares to one share. Equity attributable to owners of the parent per share is calculated on the assumption that the consolidation of shares has been conducted at the beginning of the preceding fiscal year.
9. (IFRS): Return on equity attributable to owners of the parent. 10. Interest-bearing debt comprises short-term bank loans, long-term bank loans due within one year, commercial paper, bonds, long-term bank loans,
and lease obligations. 11. Effective July 1, 2017, the Company consolidated its common shares at a ratio of five shares to one share. The number of shares issued and outstand-
ing is calculated on the assumption that the consolidation of shares has been conducted at the beginning of the current fiscal year.

22 Financial Review 2020
The discussion and analysis herein of sales and operating profit are based on reportable segment
information. Sales for reportable segments include all inter-segment transactions.
Scope of Consolidation
Number of consolidated subsidiaries: 217
Major subsidiaries:
AGC Techno Glass Co., Ltd., Ise Chemicals Corporation, AGC Glass Europe S.A. and AGC Flat
Glass North America, Inc.
Currency Fluctuations
The Japanese yen strengthened against the U.S. dollar and on the other hand weakened against
the euro during fiscal year 2020. The year-end yen-U.S. dollar rate was ¥103.50=US$1.00, com-
pared with ¥109.56=US$1.00 in fiscal year 2019, and the year-end yen-euro rate was ¥126.95=€1.00,
compared with ¥122.54=€1.00 in the previous fiscal year.
Overview of the Period Ended December 31, 2020
■ OverviewDuring the fiscal year ended December 31, 2020, the global economy surrounding the AGC Group
(“the Group”) was impacted significantly by the COVID-19 pandemic. In China, although the
economy slowed from February, it recovered from April onward. In Europe, the U.S. and Japan, the
economy deteriorated rapidly from March, and signs of recovery were seen from July onward in
conjunction with the gradual resumption of economic activity that started around May. However,
the economy in Europe weakened once more from around December as infections started spread-
ing again.
The Group formulated the long-term management strategy Vision 2025 in 2016. Under the
strategy, the Group aims to be a “Highly Profitable, Leading Global Material and Solution Provider”
with two business pillars in Core Businesses for ensuring stable sources of earnings over the long
term and Strategic Businesses for driving the growth of the Group as a whole. The Group positioned
the three years starting in 2018 as “a period for laying the foundation to achieve the Vision 2025”
and worked on the mid-term management plan AGC plus-2020.
During the fiscal year ended December 31, 2020, the final year of the plan, the Group’s business
performance was affected by a decline in demand for automotive glass, architectural glass, and
fluorine-related products for use in transportation equipment due to the COVID-19 pandemic. On
the other hand, electronic materials, LCD glass substrates, and life science products were not
affected by the COVID-19 pandemic, and shipments of them increased. In addition, prices for caustic
soda in Southeast Asia, LCD glass substrate, and architectural glass fell.
Given this business environment, the Group decided to significantly expand the supply system
for EUVL mask blanks, under the Electronics category of the Strategic Businesses. Furthermore, in
the life science business, the Group actively expanded its business, including the acquisitions of a
biopharmaceutical API manufacturing plant in the U.S. and Molecular Medicine S.p.A. (now AGC
Biologics S.p.A.), which is engaged in gene and cell therapy CDMO, as well as increasing production
capacity in Japan and overseas. For the Core Businesses, initiatives to reduce fixed costs com-
menced in the glass business, including the closure of a glass furnace in Europe and personnel
reductions, as the Group worked to improve earnings.
As a result, the Group posted net sales of ¥1,412.3 billion, down ¥105.7 billion, or a 7.0% decrease
from the previous fiscal year. Operating profit decreased by ¥25.8 billion, or a 25.4% decrease, from
the previous fiscal year to ¥75.8 billion. Profit before tax decreased ¥19.1 billion, or a 25.0% decrease
from the previous fiscal year to ¥57.1 billion. Profit for the year attributable to owners of the parent
fell ¥11.7 billion, or a 26.4% decrease from the previous fiscal year to ¥32.7 billion.
MANAGEMENT’S DISCUSSION AND ANALYSIS

3AGC Inc.
■ Consolidated Net SalesConsolidated net sales were ¥1,412.3 billion in fiscal year 2020.
By reportable segment, the Glass Operations recorded sales of ¥651.0 billion in the year under
review. Demand for architectural glass fell in all regions except for some regions such as South
America, due to the impact of the COVID-19 pandemic. In addition, we experienced falling prices in
all regions except Japan and South America. For those reasons, the Group’s sales of architectural
glass fell compared to the previous fiscal year.
In the Automotive glass business, the Group’s shipments decreased based on the impact of the
COVID-19 pandemic and a decline in global vehicle production due to deteriorating business con-
fidence, and the Group’s sales of automotive glass fell compared to the previous fiscal year.
Sales in the Electronics Operations were ¥289.4 billion. In the display business, shipments of
specialty glass for display applications decreased because of lower smartphone sales due to the
impact of the COVID-19 pandemic. On the other hand, although sales prices for LCD glass sub-
strate fell, shipments increased. As a result, net sales in the display business increased from the
previous fiscal year. Regarding electronic materials, the Group’s shipments of both optoelectronic
materials and semiconductor-related products such as EUV lithography photomask blanks
increased. Net sales of the printed circuit board business of Taconic, which was acquired in June
2019, also contributed. Consequently, sales in the category of electronic materials increased from
the previous fiscal year.
Sales in the Chemicals Operations were ¥451.2 billion. Sales of chlor-alkali products and urethane
products decreased from the previous fiscal year, mainly because of the decrease in shipments due
to impact of the COVID-19 pandemic and a decline in sales prices of caustic soda in Southeast Asia.
In the categories of fluorine products and specialty products, sales declined from the previous fiscal
year because of a decline in shipments of fluorine-related products for use in transportation equip-
ment such as aircraft due to the impact of the COVID-19 pandemic. In the life science category,
sales increased from the previous fiscal year due to an increase in the number of contracts for both
synthetic medical/agrochemicals and biopharmaceuticals.
Sales by Reportable Segment
(Unit: Millions of yen)
FY2019 FY2020
Glass Operations . . . . . . . . . . . . . . . . . . . . . . . . . . . . . . . . . . . . ¥ 742,934 ¥ 650,965
Electronics Operations . . . . . . . . . . . . . . . . . . . . . . . . . . . . . . . . 276,678 289,353
Chemicals Operations . . . . . . . . . . . . . . . . . . . . . . . . . . . . . . . . 475,778 451,156
Ceramics/Other Operations . . . . . . . . . . . . . . . . . . . . . . . . . . . . 83,241 81,122
Corporate or Elimination . . . . . . . . . . . . . . . . . . . . . . . . . . . . . . (60,594) (60,291)
Net sales . . . . . . . . . . . . . . . . . . . . . . . . . . . . . . . . . . . . . . . . . . ¥1,518,039 ¥1,412,306
■ Profit and ExpensesCost of sales decreased by ¥62.1 billion or 5.6% to ¥1,053.2 billion from the previous fiscal year.
The cost-to-sales ratio stood at 74.6%.
Cost of Sales and SG&A Expenses
(Unit: Millions of yen)
FY2019 FY2020
Cost of sales . . . . . . . . . . . . . . . . . . . . . . . . . . . . . . . . . . . . . . . ¥1,115,323 ¥1,053,243
Cost-to-sales ratio . . . . . . . . . . . . . . . . . . . . . . . . . . . . . . . . . . . 73.5% 74.6%
Gross profit . . . . . . . . . . . . . . . . . . . . . . . . . . . . . . . . . . . . . . . . 402,715 359,062
SG&A expenses . . . . . . . . . . . . . . . . . . . . . . . . . . . . . . . . . . . . 302,179 283,867
SG&A expenses as a percentage of net sales . . . . . . . . . . . . . . 19.9% 20.1%
Sales by Reportable Segment(Billions of yen)
Glass Operations Electronics Operations Chemicals Operations Ceramics/Other Operations
FY2020FY20190
600
1,200
1,800
1,412.3
1,518.0

44 Financial Review 2020
Operating profit, the net result of gross profit minus selling, general and administrative (SG&A)
expenses and share of profit (loss) of associates and joint ventures accounted for using equity
method, was ¥75.8 billion, down ¥25.8 billion or 25.4% year-on-year. The operating margin
decreased from 6.7% to 5.4%.
Other expenses were ¥22.8 billion, compared with ¥38.4 billion in fiscal year 2019.
Losses on disposal of non-current assets of ¥9.9 billion and expenses for restructuring programs
of ¥8.0 billion were recorded.
In addition, the Group recorded a foreign exchange gain, net of ¥3.6 billion, compared to a ¥6.0
billion foreign exchange gain in the previous fiscal year.
Profit before tax decreased by ¥19.1 billion year-on-year to ¥57.1 billion.
Consequently, profit for the year attributable to owners of the parent was ¥32.7 billion, down
¥11,7 billion or a 26.4% decrease from ¥44.4 billion in the previous fiscal year. Basic earnings per
share decreased by 26.4% year on year from ¥200.85 to ¥147.84. ROE decreased by 1.0 percent-
age point to 2.9%.
Profit
(Unit: Millions of yen)
FY2019 FY2020
Operating profit . . . . . . . . . . . . . . . . . . . . . . . . . . . . . . . . . . . . . ¥101,624 ¥75,780
Operating margin . . . . . . . . . . . . . . . . . . . . . . . . . . . . . . . . . . . . 6.7% 5.4%
Profit before tax . . . . . . . . . . . . . . . . . . . . . . . . . . . . . . . . . . . . . 76,213 57,121
Profit for the year attributable to owners of the parent . . . . . . . . 44,434 32,715
Percentage of net sales . . . . . . . . . . . . . . . . . . . . . . . . . . . . . . . 2.9% 2.3%
Per share data (Yen)
—Net income—basic . . . . . . . . . . . . . . . . . . . . . . . . . . . . . . . 200.85 147.84
—Net income—diluted . . . . . . . . . . . . . . . . . . . . . . . . . . . . . . 199.95 147.24
Return on equity (ROE) . . . . . . . . . . . . . . . . . . . . . . . . . . . . . . . 3.9% 2.9%
Performance by Reportable Segment
■ Glass OperationsDemand for architectural glass fell in all regions except for some regions such as South America,
due to the impact of the COVID-19 pandemic. In addition, we experienced falling prices in all regions
except Japan and South America. For those reasons, the Group’s sales of architectural glass fell
compared to the previous fiscal year.
In the Automotive glass business, the Group’s shipments declined, due to the decline in global
automobile production, which was influenced by COVID-19 pandemic and the deteriorating business
confidence. For those reasons, the Group’s sales of automotive glass fell compared to the previous
fiscal year.
As a result, net sales of the Glass Operations for the fiscal year were ¥651.0 billion, a decrease
of ¥92.0 billion, or a 12.4% decrease, from the previous fiscal year. Operating profit recorded a loss
of ¥16.6 billion, a decrease of ¥25.8 billion from the previous fiscal year, owing to the abovementioned
factors underlying the decrease in sales as well as an increase in manufacturing costs due to signifi-
cant capacity adjustments for production facilities.
Total Equity (left scale) ROE (right scale)
Total Equity and ROE(Billions of yen/%)
FY2020FY2019
1,243.01,282.6
2.9
3.9
1,500
1,000
0
2
6
4
0
500
Operating Profit and Operating Margin(Billions of yen/%)
Operating Profit (left scale) Operating Margin (right scale)
FY2020FY2019
5.4
75.8
101.6
6.7
100
0
2
4
6
8
0
25
50
75

5AGC Inc.
■ Electronics OperationsIn the display business, shipments of specialty glass for display applications decreased because of
lower smartphone sales due to the impact of the COVID-19 pandemic. On the other hand, although
sales prices for LCD glass substrate fell, shipments increased. As a result, net sales in the display
business increased from the previous fiscal year. Regarding electronic materials, the Group’s ship-
ments of both optoelectronic materials and semiconductor-related products such as EUV lithography
photomask blanks increased. Net sales of the printed circuit board business of Taconic, which was
acquired in June 2019, also contributed. Consequently, sales in the category of electronic materials
increased from the previous fiscal year.
As a result, net sales from the Electronics Operations for the fiscal year were ¥289.4 billion, up
¥12.7 billion, or a 4.6% increase, from the previous fiscal year. Operating profit was ¥37.8 billion, up
¥12.2 billion, or a 47.8% increase, from the previous fiscal year.
■ Chemicals OperationsSales of chlor-alkali products and urethane products decreased from the previous fiscal year,
mainly because of the decrease in shipments due to impact of the COVID-19 pandemic and a
decline in sales prices of caustic soda in Southeast Asia. In the categories of fluorine products
and specialty products, sales declined from the previous fiscal year because of a decline in ship-
ments of fluorine-related products for use in transportation equipment such as aircraft due to the
impact of the COVID-19 pandemic. In the life science category, sales increased from the previous
fiscal year due to an increase in the number of contracts for both synthetic medical/agrochemicals
and biopharmaceuticals.
As a result, net sales of the Chemicals Operations for the fiscal year were ¥451.2 billion, down
¥24.6 billion, or a 5.2% decrease, from the previous fiscal year. Operating profit was ¥50.5 billion,
down ¥12.5 billion, or a 19.8% decrease, from the previous fiscal year.
Sales and Operating Profit by Reportable Segment
(Unit: Millions of yen)
FY2019 FY2020
Glass Operations
Sales . . . . . . . . . . . . . . . . . . . . . . . . . . . . . . . . . . . . . . . . . . . ¥742,934 ¥650,965
Operating profit . . . . . . . . . . . . . . . . . . . . . . . . . . . . . . . . . . . 9,266 (16,579)
Operating margin . . . . . . . . . . . . . . . . . . . . . . . . . . . . . . . . . . 1.2% —%
Electronics Operations
Sales . . . . . . . . . . . . . . . . . . . . . . . . . . . . . . . . . . . . . . . . . . . 276,678 289,353
Operating profit . . . . . . . . . . . . . . . . . . . . . . . . . . . . . . . . . . . 25,581 37,797
Operating margin . . . . . . . . . . . . . . . . . . . . . . . . . . . . . . . . . . 9.2% 13.1%
Chemicals Operations
Sales . . . . . . . . . . . . . . . . . . . . . . . . . . . . . . . . . . . . . . . . . . . 475,778 451,156
Operating profit . . . . . . . . . . . . . . . . . . . . . . . . . . . . . . . . . . . 62,961 50,477
Operating margin . . . . . . . . . . . . . . . . . . . . . . . . . . . . . . . . . . 13.2% 11.2%
Sales and Operating Profit of Glass Operations(Billions of yen)
Sales (left scale) Operating Profit (right scale)
FY2020FY2019
651.0
742.9
–400
0
–200
200
800
–20
0
–10
10
600
400 20
30
40
9.3
–16.6
Sales and Operating Profit of Electronics Operations(Billions of yen)
Sales (left scale) Operating Profit (right scale)
FY2020FY20190
100
200
300
0
20
40
60289.4
276.7
37.8
25.6
Sales and Operating Profit of Chemicals Operations(Billions of yen)
Sales (left scale) Operating Profit (right scale)
FY2020FY20190
100
200
300
400
500
0
20
60
40
80
100
451.2475.8
50.5
63.0

66 Financial Review 2020
Assets, Liabilities and Equity
We continue to adhere to a policy of maintaining appropriate liquidity, securing the funds necessary
to conduct our operations and ensuring the soundness of our balance sheet. With the aim of facilitat-
ing the stable procurement of long-term funds, we have obtained an A– rating from Standard &
Poor’s, an A2 rating from Moody’s Investors Service and an AA– rating from Rating and Investment
Information, Inc.
Total assets as of the end of the fiscal year under review were ¥2,534.5 billion, up ¥199.0 billion
from the end of the previous fiscal year. This increase was mainly due to an increase in cash and
cash equivalents.
Total liabilities as of the end of the fiscal year under review were ¥1,291.4 billion, up ¥238.6 billion
from the end of the previous fiscal year. This increase was mainly due to an increase in interest-
bearing debt.
Total equity as of the end of the fiscal year under review was ¥1,243.0 billion, down ¥39.6 billion
from the end of the previous fiscal year. This decrease was mainly due to a decrease in exchange
differences on translation of foreign operations affected by the appreciation of the yen compared to
the end of the previous fiscal year.
As a consequence of the above, the equity attributable to owners of the parent ratio for fiscal year
2020 decreased by 5.5 percentage points from 49.5% to 44.0%. Equity attributable to owners of
the parent per share decreased from the previous fiscal year to ¥5,038.52.
Summary of Assets, Liabilities and Equity
(Unit: Millions of yen)
FY2019 FY2020
Total assets . . . . . . . . . . . . . . . . . . . . . . . . . . . . . . . . . . . . . . . ¥2,335,415 ¥2,534,458
Total current assets . . . . . . . . . . . . . . . . . . . . . . . . . . . . . . . . . . 742,612 860,962
Inventories . . . . . . . . . . . . . . . . . . . . . . . . . . . . . . . . . . . . . . . . . 291,224 274,835
Property, plant and equipment . . . . . . . . . . . . . . . . . . . . . . . . . . 1,177,691 1,246,885
Total current liabilities . . . . . . . . . . . . . . . . . . . . . . . . . . . . . . . . . 482,490 563,898
Interest-bearing debt . . . . . . . . . . . . . . . . . . . . . . . . . . . . . . . . . 602,843 787,960
Total equity . . . . . . . . . . . . . . . . . . . . . . . . . . . . . . . . . . . . . . . . 1,282,636 1,243,039
Equity attributable to owners of the parent ratio . . . . . . . . . . . . . 49.5% 44.0%
Equity attributable to owners of the parent per share (Yen) . . . . . 5,229.58 5,038.52
Debt-to-equity ratio (Times) . . . . . . . . . . . . . . . . . . . . . . . . . . . . 0.47 0.63
Interest-bearing Debt and Debt-to-equity Ratio(Billions of yen/Times)
* Debt-to-equity Ratio = Interest-bearing Debt/Total Equity
Interest-bearing Debt (left scale) Debt-to-equity Ratio (right scale)
FY2020FY2019
788.0
602.8 0.63
0.47
0
0.2
0.4
0.6
0.8
0
200
400
600
800
Equity Attributable to Owners of the Parent Ratio(%)
FY2020FY2019
44.0
49.5
0
20
40
60

7AGC Inc.
Cash Flows
The free cash flow for the fiscal year under review, which is the sum of cash flows from operating
activities and investing activities, was negative ¥4.9 billion (positive ¥9.3 billion in the previous year)
mainly due to a decrease in profit before tax and proceeds from sale of other financial assets. Cash
and cash equivalents as of the end of the period (net cash) increased ¥122.3 billion or 107.5% from
the end of the previous year to ¥236.1 billion mainly due to proceeds from borrowing long-term
interest-bearing debt in financing activities.
■ Cash Flows from Operating ActivitiesNet cash from operating activities for the fiscal year under review was ¥225.4 billion, up ¥33.5 billion
or 17.4% from the previous year.
■ Cash Flows from Investing ActivitiesNet cash from investing activities for the fiscal year under review was ¥230.2 billion, up ¥47.6 billion
or 26.1% from the previous year. This expenditure was mainly due to purchase of property, plant
and equipment and purchase of subsidiaries.
■ Cash Flows from Financing ActivitiesNet cash from financing activities for the fiscal year under review was ¥128.4 billion (expenditure of
¥17.3 billion in the previous year). This increase was mainly due to proceeds from borrowing long-
term interest-bearing debt.
Summary of Cash Flow Statements
(Unit: Millions of yen)
FY2019 FY2020
Net cash from operating activities . . . . . . . . . . . . . . . . . . . . . . . ¥ 191,906 ¥ 225,392
Profit before tax . . . . . . . . . . . . . . . . . . . . . . . . . . . . . . . . . . . 76,213 57,121
Depreciation and amortization . . . . . . . . . . . . . . . . . . . . . . . . 143,361 143,716
Net cash from investing activities . . . . . . . . . . . . . . . . . . . . . . . . (182,636) (230,248)
Purchase of property, plant and equipment and intangible assets . . . . . . . . . . . . . . . . . . . . . . . . . . . . . . . . . (197,928) (191,469)
Free cash flow . . . . . . . . . . . . . . . . . . . . . . . . . . . . . . . . . . . . . . 9,269 (4,855)
Net cash from financing activities . . . . . . . . . . . . . . . . . . . . . . . . (17,284) 128,443
Effect of exchange rate changes on cash and cash equivalents . . . (1,704) (1,246)
Net increase (decrease) in cash and cash equivalents . . . . . . . . (9,719) 122,340
Cash and cash equivalents at beginning of year . . . . . . . . . . . . 123,503 113,784
Cash and cash equivalents at end of year . . . . . . . . . . . . . . . . . 113,784 236,124
Net Cash from Operating Activities(Billions of yen)
FY2020FY2019
225.4
191.9
0
50
100
150
200
250
Free Cash Flow(Billions of yen)
FY2020FY2019
–4.9
9.3
–5
0
5
10

88 Financial Review 2020
Business Risks
Set out below are risks associated with the Group’s operations and other risks that may materially influence the decisions of investors to invest in the Group. However, this section does not include all possible risks relating to the Group; there may exist additional risks not stated below. Any such risks are also likely to influence investors’ decisions.
Having identified these risks, the Group has established the AGC Group Enterprise Risk Manage-ment Basic Policies, which define the Group’s basic policies concerning risk management, and has formulated a system for risk management and crisis response.
Forward-looking statements in this section are based on information available as of March 30, 2021.
(1) Economic conditions in markets in which the Group’s products are soldDemand for the Group’s products is impacted by trends in industries such as construction and building materials, automobiles, electronics, displays, and chemicals. The Group’s products are supplied throughout the world, for example in Asia, the United States and Europe, as well as in Japan, and sales are therefore influenced by local economic conditions. Although the Group is working hard to build an earnings structure that is resilient to changes in the business environment by improving productivity and reducing fixed and variable costs, through falling sales volumes and prices, its performance and financial position are susceptible to declining demand from the industries as well as economic downturns in the regions where its products are primarily sold.
The situation in each segment is as follows.1) GlassIn the Glass segment, the Group has established development and production bases in Japan/Asia, Europe and the Americas and supplies products throughout the world. Demand for archi-tectural glass is correlated with construction investment, which varies with economic conditions in each region and country. Accordingly, earnings in this business could be impacted by fluctua-tions in demand for architectural glass. In addition, demand for automotive glass is influenced by automobile sales volume, which is correlated with factors such as economic fluctuations in each region and country. Accordingly, earnings in this business could be impacted by fluctuations in demand for automotive glass.2) ElectronicsProducts in the display business are used in LCD TVs, smartphones, and tablets, etc. In the LCD glass substrate business, changes in the market shares of panel manufacturers, which are the Group’s customers, shifts in market trends, and other developments are expected to occur. The Group has been working to expand sales based on its customer portfolio. Nonetheless, customer and market trends could have an impact on the profitability of the display business. In the elec-tronic materials business, the Group’s main customers are companies involved in industries such as semiconductors and optoelectronics. The performance of these customers depends on market trends in areas such as semiconductors, smartphones, communications infrastructure and industrial equipment. For this reason, earnings in the electronic materials business could be influenced by the impact of these trends.3) ChemicalsIn chlor-alkali products, the Group has established production bases primarily in Japan and Southeast Asia, where progress is being made on infrastructure development, and is expanding its business. Demand for these products is mainly correlated with economic growth rates and capacity utilization in core industries in each region and country. Accordingly, earnings in this business could be impacted by fluctuations in demand for chlor-alkali products. In the fluoro-chemicals & specialty business, the Group’s main customers are companies involved in trans-portation equipment, semiconductor and construction industries. Accordingly, earnings in the fluorochemicals & specialty business could be impacted by market trends in these industries. In the life science business, the Group is greatly impacted by business conditions and the develop-ment status of new products in the pharmaceuticals and agrochemicals industries. Accordingly, earnings in the life science business could be impacted by these trends.

9AGC Inc.
(2) Expansion of overseas operationsThe Group, in addition to its operations in Japan, has overseas operations, including exports and imports of products and manufacturing abroad. The risks associated with these global business activities include deteriorating political and economic conditions, the imposition of regulations on exports and imports and foreign investments, unexpected changes in laws and regulations, the worsening of public security, economic sanctions between countries, and the occurrence of social turmoil or other disruptions due to terrorist attacks, war, infectious diseases or other factors in the countries and regions where the Group operates. For its part, the Group carefully monitors factors such as political and economic conditions and regulatory trends in each country and region and strives to mount effective responses appropriate to the situation. However, the occurrence of these events may hinder the Group’s overseas operations and have a serious effect on its performance and financial position.
(3) Competitive edge and development and commercialization of new technologies and products
In every field in which the Group operates, there are competitors supplying products similar to those of the Group. Accordingly, to maintain its competitive edge, the Group is striving to identify the needs of customers, and to develop and commercialize new technologies and products. However, should the Group fail to appropriately respond to technical changes and customer needs or take too long to develop and commercialize new technologies and products, growth could be hampered and profit-ability could decline. This may significantly impact the Group’s performance and financial position.
(4) ManufacturingThe Group strives to carry out preventive maintenance on all plant equipment and facilities, and it is working to strengthen priorities such as systems for safety review and maintenance and repair of equipment and facilities. If there are any serious production disruptions, this could have a significant impact on the Group’s performance and financial position.
(5) Procurement of production materials and resourcesIf there are fluctuations in the prices of electricity, fuel gas, heavy oil or raw materials used in the Group’s production activities, the Group’s performance and financial position could be affected. The Group hedges the risk of price fluctuations for certain raw materials and fuel through instruments such as commodity contracts. Nevertheless, the Group may be unable to completely eliminate the impact of rising raw material and fuel prices. Additionally, as part of the Group’s production activities, the Group uses certain special raw materials, supplies and other resources for which suppliers are limited. The Group considers alternative materials and strives to promote the purchasing of such raw materials, supplies and other resources from multiple suppliers. However, if the supply of these materials tightens or is delayed, or price fluctuations occur, the Group’s performance and financial position may be greatly affected.
(6) Government regulationsIn the countries and regions where it operates, the Group is subject to the local government approval and authorization of investments, regulations on exports and imports, and laws governing com-mercial transactions, labor, patents, taxation, foreign exchange, and other issues. The Group will closely monitor trends in amendments to relevant laws and regulations and strive to gather informa-tion. Meanwhile, amendments to relevant laws and regulations may significantly influence the Group’s performance and financial position.
(7) Environmental regulationsAt the Group, we have defined “Environment” as one of Our Shared Values in the AGC Group Vision. While complying with various laws and regulations related to the environment, the Group works to mitigate the environmental impacts arising from its operations through such means as voluntarily setting and implementing stricter chemical substance management standards. In addition, the Group conducts activities such as reducing greenhouse gas emissions, minimizing the landfill waste dis-posal amount, and preserving biodiversity.

1010 Financial Review 2020
However, in the event of unintended environmental pollution or other such incidents due to reasons such as emissions in the Group’s manufacturing process or chemical or other substances contained in products, the Group may have to bear costs for environmental remediation and treatment, compen-sation for loss or damage, or other measures. Such costs could have a large impact on AGC Group’s performance and financial position. Moreover, the Group will likely need to deal with the emergence of new laws in connection with heightened corporate social responsibility toward environmental issues such as climate change, resource recycling, environmental pollution prevention, chemical substances management, water risk countermeasures, and biodiversity preservation. Specifically, the Group may have to bear higher costs needed to comply with laws and meet various environmental regulatory values, scale down production, and reduce production efficiency. Consequently, the Group’s perfor-mance and financial position may be significantly impacted.
(8) Product liabilityThe Group is making every effort to ensure that products are of the highest quality, according to their individual characteristics. Despite these efforts, the possibility remains that quality problems may occur because of unanticipated factors, prompting a major recall, for example. This could substan-tially influence the Group’s performance and financial position.
(9) Intellectual property rightsThe Group endeavors to acquire intellectual property rights that are useful for its present business activities and future operations alike, while investigating the rights and business conditions of third parties, in order to prevent intellectual property issues from arising. However, there is the possibility that the Group will have disputes with third parties over intellectual property or that third parties will infringe the Group’s intellectual property rights. This has the potential to materially influence the Group’s performance and financial position.
(10) Litigation and legal proceduresThere is always a risk that other firms, corporate groups, or individuals may take legal actions against the Group with respect to its operations at home and abroad. As of March 30, 2021, there were some lawsuits and legal proceedings pending. If these lawsuits and proceedings result in an unfavorable outcome for the Group, its performance and financial position may be significantly impacted.
(11) Effect of natural disasters and accidentsThe Group endeavors to prevent occupational accidents and other accidents involving equipment and facilities, such as production machinery, through the establishment and operation of a systematic management system for occupational safety and health, and for industrial safety and security, along with efforts to promote and ensure machinery safety, and to manage inspections, maintenance and repairs. However, the Group faces the risk of unforeseeable events such as a severe occupational accident, serious fire, explosion or leakage incident.
Regarding preparedness for natural disasters, the Group has assessed risks concerning earth-quakes, high winds, flooding and other natural events at its major bases, and has drawn up business continuity plans for bases that are exposed to significant hazards. Despite these efforts, the Group faces the risk of unforeseeable events such as damage to production facilities and the suspension of product shipments due to severed transportation networks, as a result of natural disasters such as major earthquakes, typhoons, and floods.
If production is suspended temporarily or for an extended period in the Group or the Group’s supply chain as a result of the occurrence of such unforeseen events, the supply of products to customers may be disrupted given that alternative production is not possible for certain products, and this could have a significant impact on the Group’s performance and financial position.
The impact of the spread of COVID-19 and the Group’s responses to the crisis are outlined as follows.
In January 2020, the Group launched a Group Taskforce Headquarters with the President and CEO serving as the headquarters leader, in order to address the spread of COVID-19. With this structure, the Group has promptly grasped conditions throughout the Group and has dealt with the crisis. At present, the Group continues to operate its businesses while working to ensure the health and safety of employees and their family members and prevent the spread of infections outside the Group, in accordance with the guidance of the national and local governments of each country and region.

11AGC Inc.
With the spread of COVID-19 from February 2020 onward, the Group’s performance has been impacted by factors such as declining demand across several businesses. The details are disclosed in “Overview of the Period Ended December 31, 2020” in “Management’s Discussion and Analysis.” As of the reporting date, the Group’s performance is expected to gradually recover, but the outlook remains uncertain. Depending on conditions in the future, the Group’s performance may be signifi-cantly impacted. For its part, the Group will implement earnings improvement measures such as developing production systems commensurate with demand and enhancing the balance of cost reductions and investments.
(12) Exchange rate fluctuationsThe Group manufactures and sells products worldwide, and converts transaction accounts in local currencies, including sales, costs, and assets, into Japanese yen when preparing its consolidated financial statements. Even if the values of these items remain unchanged in local currency terms, they may change when converted into Japanese yen depending on exchange rates.
The Group also manufactures products at its facilities worldwide, including Japan, and exports the products to a number of countries. The Group generally procures raw materials and sells prod-ucts in the local currency of each country/region, but there are some product sales and material purchases denominated in foreign currencies. Accordingly, fluctuations in exchange rates influence the prices of materials the Group procures and the pricing for its products. The Group implements measures such as hedge transactions to address short-term exchange rate fluctuations, along with striving to reduce risk through steps such as conducting production from production bases located globally. Despite these efforts, the Group’s performance and financial position could be impacted heavily as a result of large movements in exchange rates.
(13) Retirement benefit obligationsThe Group calculates costs for employee retirement benefits and obligations based on actuarial assumptions of the returns on pension funds and a specific discount rate. If the actuarial assumptions and results diverge substantially because of deterioration in the market environment for pension fund management, future costs for retirement benefits will increase, and this may seriously impact the Group’s performance and financial position.
(14) Fixed assets, goodwill and intangible assetsIf the impairment losses occur in the Group’s fixed assets, goodwill and intangible assets because of
a drop in profitability, the Group’s performance and financial position may be substantially impacted.
The operating results of the automotive glass business in Europe, which is part of the Glass
segment, deteriorated primarily due to a decrease in automotive production volume affected by the
spread of the novel coronavirus disease (COVID-19), which resulted in an indication of impairment
for the cash-generating unit to which its property, plant and equipment (¥77,769 million) belong. In
addition, the operating results of the business unit that produces specialty glass for display applica-
tions, which are part of the Electronics segment, were unfavorable compared to the budget due to
changes in the market, which resulted in an indication of impairment for the cash-generating unit to
which its property, plant and equipment (¥13,232 million) belong. For this reason, the Group carried
out impairment tests. As a result of the impairment tests, no impairment loss was recognized.
However, the recoverability is subject to the impact of economic conditions and other factors in the
market going forward.
(15) Information securityInformation systems are now playing an extremely important role in the Group’s business activities, and the Group strives to protect its information assets, such as systems and data. Moreover, the Group implements measures to prevent security incidents and measures to minimize the impact of such incidents when they occur. However, if important operations are interrupted or confidential data is leaked and so forth due to a natural disaster, cyberattack, unauthorized access, or other unforeseen situation, this may have a significant impact on the Group’s performance and financial position.

Financial Review 202012
Consolidated Financial Statements (IFRS)
(Unit: Millions of yen)
Note
FY2019 (as of December 31,
2019)
FY2020 (as of December 31,
2020)
ASSETSCurrent assets
Cash and cash equivalents � � � � � � � � � � � � � � � � � � � � � � � � � � � � � � � � � � � 5, 25 ¥ 113,784 ¥ 236,124Trade receivables � � � � � � � � � � � � � � � � � � � � � � � � � � � � � � � � � � � � � � � � � � � 6, 25 264,102 266,177Inventories � � � � � � � � � � � � � � � � � � � � � � � � � � � � � � � � � � � � � � � � � � � � � � � � 7 291,224 274,835Other receivables � � � � � � � � � � � � � � � � � � � � � � � � � � � � � � � � � � � � � � � � � � � 6, 25 46,387 62,468Income tax receivables � � � � � � � � � � � � � � � � � � � � � � � � � � � � � � � � � � � � � � � 6,849 5,169Other current assets � � � � � � � � � � � � � � � � � � � � � � � � � � � � � � � � � � � � � � � � 25 20,263 16,186
Total current assets � � � � � � � � � � � � � � � � � � � � � � � � � � � � � � � � � � � � � � � 742,612 860,962
Non-current assetsProperty, plant and equipment � � � � � � � � � � � � � � � � � � � � � � � � � � � � � � � � � 8, 10 1,177,691 1,246,885Goodwill � � � � � � � � � � � � � � � � � � � � � � � � � � � � � � � � � � � � � � � � � � � � � � � � � � 9 103,946 118,063Intangible assets � � � � � � � � � � � � � � � � � � � � � � � � � � � � � � � � � � � � � � � � � � � 9 69,964 72,660Investments in associates and joint ventures accounted for using equity method � � � � � � � � � � � � � � � � � � � � � � � � � � � � � � � � � � � � � � � � 11 33,204 32,014
Other financial assets � � � � � � � � � � � � � � � � � � � � � � � � � � � � � � � � � � � � � � � � 25 138,053 130,919Deferred tax assets � � � � � � � � � � � � � � � � � � � � � � � � � � � � � � � � � � � � � � � � � 12 21,297 25,944Other non-current assets � � � � � � � � � � � � � � � � � � � � � � � � � � � � � � � � � � � � � 48,644 47,008
Total non-current assets � � � � � � � � � � � � � � � � � � � � � � � � � � � � � � � � � � � � 1,592,802 1,673,495Total assets � � � � � � � � � � � � � � � � � � � � � � � � � � � � � � � � � � � � � � � � � � � � � � � � ¥2,335,415 ¥2,534,458
1 FINANCIAL STATEMENTS (IFRS)
i) Consolidated Statements of Financial Position

AGC Inc. 13
(Unit: Millions of yen)
Note
FY2019 (as of December 31,
2019)
FY2020 (as of December 31,
2020)
LIABILITIES AND EQUITYLIABILITIESCurrent liabilities
Trade payables � � � � � � � � � � � � � � � � � � � � � � � � � � � � � � � � � � � � � � � � � � � � � 13, 25 ¥ 152,502 ¥ 151,874Short-term interest-bearing debt � � � � � � � � � � � � � � � � � � � � � � � � � � � � � � � 14, 25 78,439 106,884Long-term interest-bearing debt due within one year � � � � � � � � � � � � � � � � 14, 25 80,101 87,163Other payables � � � � � � � � � � � � � � � � � � � � � � � � � � � � � � � � � � � � � � � � � � � � 13, 25 140,722 186,310Income tax payables � � � � � � � � � � � � � � � � � � � � � � � � � � � � � � � � � � � � � � � � 8,867 12,426Provisions � � � � � � � � � � � � � � � � � � � � � � � � � � � � � � � � � � � � � � � � � � � � � � � � 15 3,968 1,563Other current liabilities � � � � � � � � � � � � � � � � � � � � � � � � � � � � � � � � � � � � � � � 25 17,887 17,676
Total current liabilities � � � � � � � � � � � � � � � � � � � � � � � � � � � � � � � � � � � � � � 482,490 563,898
Non-current liabilitiesLong-term interest-bearing debt � � � � � � � � � � � � � � � � � � � � � � � � � � � � � � � � 14, 25 444,301 593,912Deferred tax liabilities � � � � � � � � � � � � � � � � � � � � � � � � � � � � � � � � � � � � � � � � 12 41,846 35,153Post-employment benefit liabilities � � � � � � � � � � � � � � � � � � � � � � � � � � � � � � 16 62,454 64,736Provisions � � � � � � � � � � � � � � � � � � � � � � � � � � � � � � � � � � � � � � � � � � � � � � � � 15 8,286 12,353Other non-current liabilities � � � � � � � � � � � � � � � � � � � � � � � � � � � � � � � � � � � � 25 13,399 21,363
Total non-current liabilities � � � � � � � � � � � � � � � � � � � � � � � � � � � � � � � � � � � 570,288 727,519Total liabilities � � � � � � � � � � � � � � � � � � � � � � � � � � � � � � � � � � � � � � � � � � � � 1,052,778 1,291,418
EQUITYShare capital � � � � � � � � � � � � � � � � � � � � � � � � � � � � � � � � � � � � � � � � � � � � � � 18 90,873 90,873Capital surplus � � � � � � � � � � � � � � � � � � � � � � � � � � � � � � � � � � � � � � � � � � � � � 18 92,593 83,501Retained earnings � � � � � � � � � � � � � � � � � � � � � � � � � � � � � � � � � � � � � � � � � � 18 811,589 818,701Treasury shares � � � � � � � � � � � � � � � � � � � � � � � � � � � � � � � � � � � � � � � � � � � � 18 (28,468) (28,170)Other components of equity � � � � � � � � � � � � � � � � � � � � � � � � � � � � � � � � � � � 18 190,510 150,236Total equity attributable to owners of the parent � � � � � � � � � � � � � � � � � � � � 1,157,097 1,115,142Non-controlling interests � � � � � � � � � � � � � � � � � � � � � � � � � � � � � � � � � � � � � 125,538 127,897
Total equity � � � � � � � � � � � � � � � � � � � � � � � � � � � � � � � � � � � � � � � � � � � � � � 1,282,636 1,243,039Total liabilities and equity � � � � � � � � � � � � � � � � � � � � � � � � � � � � � � � � � � � � � ¥2,335,415 ¥2,534,458

Financial Review 202014
ii) Consolidated Statements of Profit and Consolidated Statements of Comprehensive Income(Consolidated Statements of Profit)
(Unit: Millions of yen)
Note
FY2019 (Jan� 1 through Dec� 31, 2019)
FY2020 (Jan. 1 through Dec. 31, 2020)
Net sales � � � � � � � � � � � � � � � � � � � � � � � � � � � � � � � � � � � � � � � � � � � � � � � � � � 20 ¥ 1,518,039 ¥ 1,412,306Cost of sales � � � � � � � � � � � � � � � � � � � � � � � � � � � � � � � � � � � � � � � � � � � � � � � 21 (1,115,323) (1,053,243)
Gross profit � � � � � � � � � � � � � � � � � � � � � � � � � � � � � � � � � � � � � � � � � � � � � � � 402,715 359,062Selling, general and administrative expenses � � � � � � � � � � � � � � � � � � � � � 21 (302,179) (283,867)Share of profit of associates and joint ventures accounted for using equity method � � � � � � � � � � � � � � � � � � � � � � � � � � � � � � � � � � � � � � � � 11 1,088 584Operating profit � � � � � � � � � � � � � � � � � � � � � � � � � � � � � � � � � � � � � � � � � � � � 101,624 75,780
Other income � � � � � � � � � � � � � � � � � � � � � � � � � � � � � � � � � � � � � � � � � � � � � � � 21 12,743 6,743Other expenses � � � � � � � � � � � � � � � � � � � � � � � � � � � � � � � � � � � � � � � � � � � � � 21 (38,365) (22,812)
Business profit � � � � � � � � � � � � � � � � � � � � � � � � � � � � � � � � � � � � � � � � � � � � � 76,002 59,711Finance income � � � � � � � � � � � � � � � � � � � � � � � � � � � � � � � � � � � � � � � � � � � � � 22 13,906 5,903Finance costs � � � � � � � � � � � � � � � � � � � � � � � � � � � � � � � � � � � � � � � � � � � � � � 22 (13,696) (8,492)
Net finance costs � � � � � � � � � � � � � � � � � � � � � � � � � � � � � � � � � � � � � � � � � � � 210 (2,589)Profit before tax � � � � � � � � � � � � � � � � � � � � � � � � � � � � � � � � � � � � � � � � � � � � 76,213 57,121
Income tax expenses � � � � � � � � � � � � � � � � � � � � � � � � � � � � � � � � � � � � � � � � 23 (20,698) (15,957)
Profit for the year � � � � � � � � � � � � � � � � � � � � � � � � � � � � � � � � � � � � � � � � � � � ¥ 55,515 ¥ 41,164
Attributable to owners of the parent � � � � � � � � � � � � � � � � � � � � � � � � � � � ¥ 44,434 ¥ 32,715Attributable to non-controlling interests � � � � � � � � � � � � � � � � � � � � � � � � � 11,080 8,448
Earnings per shareBasic earnings per share (Yen) � � � � � � � � � � � � � � � � � � � � � � � � � � � � � � � � � 24 ¥ 200�85 ¥ 147.84Diluted earnings per share (Yen) � � � � � � � � � � � � � � � � � � � � � � � � � � � � � � � � 24 199�95 147.24

AGC Inc. 15
(Consolidated Statements of Comprehensive Income)
(Unit: Millions of yen)
Note
FY2019 (Jan� 1 through Dec� 31, 2019)
FY2020 (Jan. 1 through Dec. 31, 2020)
Profit for the year � � � � � � � � � � � � � � � � � � � � � � � � � � � � � � � � � � � � � � � � � � � � ¥55,515 ¥ 41,164Other comprehensive income
Components of other comprehensive income that will not be reclassified to profit or loss, net of taxRemeasurement of the net defined benefit liability (asset) � � � � � � � � � � � 19 6,702 (41)Net gain (loss) on revaluation of financial assets measured at FVTOCI(Note) � � � � � � � � � � � � � � � � � � � � � � � � � � � � � � � � � � � � � � � � � � � 19 5,844 (3,258)
Share of other comprehensive income of associates and joint ventures accounted for using equity method � � � � � � � � � � � � � � � � 11, 19 (799) (2)
Total � � � � � � � � � � � � � � � � � � � � � � � � � � � � � � � � � � � � � � � � � � � � � � � � � � � 11,748 (3,302)Components of other comprehensive income that may be reclassified to profit or loss, net of taxNet gain (loss) in fair value of cash flow hedges � � � � � � � � � � � � � � � � � � 19 (811) 1,173Exchange differences on translation of foreign operations � � � � � � � � � � � 19 (5,956) (42,349)Total � � � � � � � � � � � � � � � � � � � � � � � � � � � � � � � � � � � � � � � � � � � � � � � � � � � (6,767) (41,175)
Other comprehensive income, net of tax � � � � � � � � � � � � � � � � � � � � � � � 4,980 (44,478)Total comprehensive income for the year � � � � � � � � � � � � � � � � � � � � � � � � ¥60,495 ¥ (3,314)
Attributable to owners of the parent � � � � � � � � � � � � � � � � � � � � � � � � � � � � � ¥48,239 ¥ (6,426)Attributable to non-controlling interests � � � � � � � � � � � � � � � � � � � � � � � � � � 12,256 3,111
Note: FVTOCI: Fair Value Through Other Comprehensive Income
Financial Review 202016
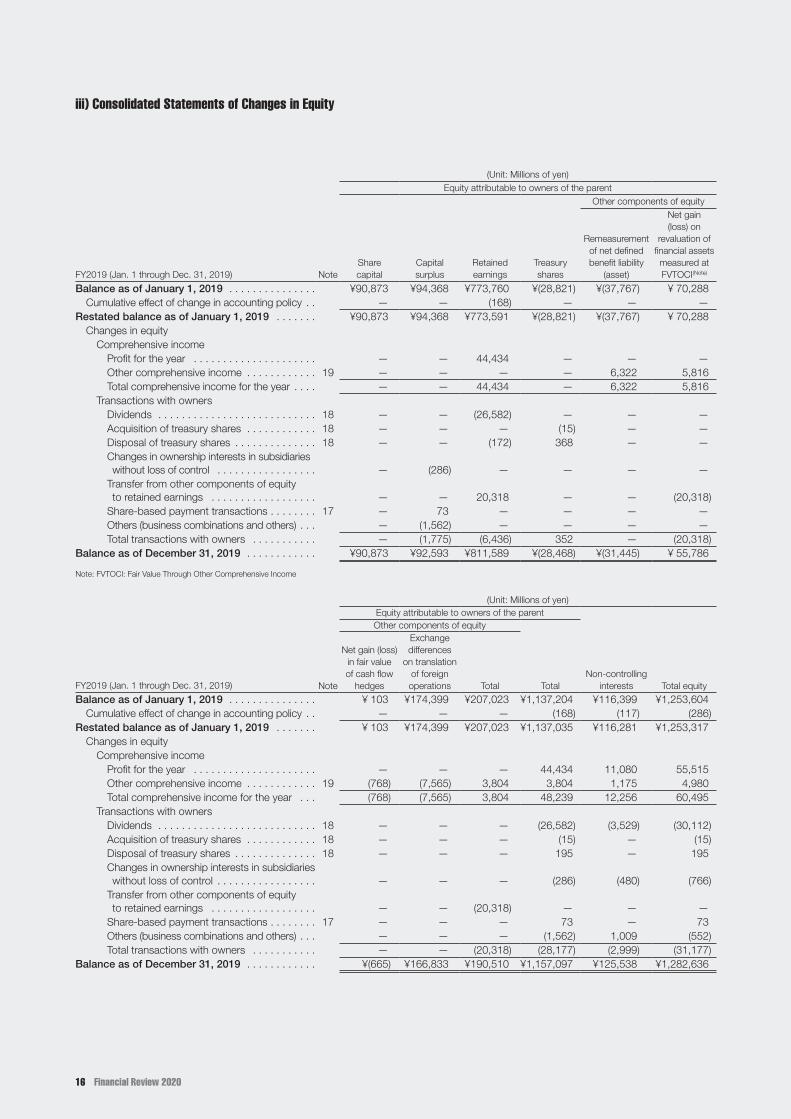
iii) Consolidated Statements of Changes in Equity
(Unit: Millions of yen)Equity attributable to owners of the parent
Other components of equity
FY2019 (Jan� 1 through Dec� 31, 2019) NoteShare capital
Capital surplus
Retained earnings
Treasury shares
Remeasurement of net defined benefit liability
(asset)
Net gain (loss) on
revaluation of financial assets measured at FVTOCI (Note)
Balance as of January 1, 2019 � � � � � � � � � � � � � � � ¥90,873 ¥94,368 ¥773,760 ¥(28,821) ¥(37,767) ¥ 70,288Cumulative effect of change in accounting policy � � — — (168) — — —
Restated balance as of January 1, 2019 � � � � � � � ¥90,873 ¥94,368 ¥773,591 ¥(28,821) ¥(37,767) ¥ 70,288Changes in equity
Comprehensive incomeProfit for the year � � � � � � � � � � � � � � � � � � � � � — — 44,434 — — —Other comprehensive income � � � � � � � � � � � � 19 — — — — 6,322 5,816Total comprehensive income for the year � � � � — — 44,434 — 6,322 5,816
Transactions with ownersDividends � � � � � � � � � � � � � � � � � � � � � � � � � � � 18 — — (26,582) — — —Acquisition of treasury shares � � � � � � � � � � � � 18 — — — (15) — —Disposal of treasury shares � � � � � � � � � � � � � � 18 — — (172) 368 — —Changes in ownership interests in subsidiaries without loss of control � � � � � � � � � � � � � � � � � — (286) — — — —
Transfer from other components of equity to retained earnings � � � � � � � � � � � � � � � � � � — — 20,318 — — (20,318)
Share-based payment transactions � � � � � � � � 17 — 73 — — — —Others (business combinations and others) � � � — (1,562) — — — —Total transactions with owners � � � � � � � � � � � — (1,775) (6,436) 352 — (20,318)
Balance as of December 31, 2019 � � � � � � � � � � � � ¥90,873 ¥92,593 ¥811,589 ¥(28,468) ¥(31,445) ¥ 55,786
Note: FVTOCI: Fair Value Through Other Comprehensive Income
(Unit: Millions of yen)Equity attributable to owners of the parentOther components of equity
FY2019 (Jan� 1 through Dec� 31, 2019) Note
Net gain (loss) in fair value of cash flow
hedges
Exchange differences
on translation of foreign operations Total Total
Non-controlling interests Total equity
Balance as of January 1, 2019 � � � � � � � � � � � � � � � ¥ 103 ¥174,399 ¥207,023 ¥1,137,204 ¥116,399 ¥1,253,604Cumulative effect of change in accounting policy � � — — — (168) (117) (286)
Restated balance as of January 1, 2019 � � � � � � � ¥ 103 ¥174,399 ¥207,023 ¥1,137,035 ¥116,281 ¥1,253,317Changes in equity
Comprehensive incomeProfit for the year � � � � � � � � � � � � � � � � � � � � � — — — 44,434 11,080 55,515Other comprehensive income � � � � � � � � � � � � 19 (768) (7,565) 3,804 3,804 1,175 4,980Total comprehensive income for the year � � � (768) (7,565) 3,804 48,239 12,256 60,495
Transactions with ownersDividends � � � � � � � � � � � � � � � � � � � � � � � � � � � 18 — — — (26,582) (3,529) (30,112)Acquisition of treasury shares � � � � � � � � � � � � 18 — — — (15) — (15)Disposal of treasury shares � � � � � � � � � � � � � � 18 — — — 195 — 195Changes in ownership interests in subsidiaries without loss of control � � � � � � � � � � � � � � � � � — — — (286) (480) (766)
Transfer from other components of equity to retained earnings � � � � � � � � � � � � � � � � � � — — (20,318) — — —
Share-based payment transactions � � � � � � � � 17 — — — 73 — 73Others (business combinations and others) � � � — — — (1,562) 1,009 (552)Total transactions with owners � � � � � � � � � � � — — (20,318) (28,177) (2,999) (31,177)
Balance as of December 31, 2019 � � � � � � � � � � � � ¥(665) ¥166,833 ¥190,510 ¥1,157,097 ¥125,538 ¥1,282,636

AGC Inc. 17
(Unit: Millions of yen)Equity attributable to owners of the parent
Other components of equity
FY2020 (Jan. 1 through Dec. 31, 2020) NoteShare capital
Capital surplus
Retained earnings
Treasury shares
Remeasurement of net defined benefit liability
(asset)
Net gain (loss) on
revaluation of financial assets measured at FVTOCI (Note)
Balance as of January 1, 2020 � � � � � � � � � � � � � � � ¥90,873 ¥92,593 ¥811,589 ¥(28,468) ¥(31,445) ¥55,786Changes in equity
Comprehensive incomeProfit for the year � � � � � � � � � � � � � � � � � � � � � — — 32,715 — — —Other comprehensive income � � � � � � � � � � � � 19 — — — — 241 (3,257)Total comprehensive income for the year � � � — — 32,715 — 241 (3,257)
Transactions with ownersDividends � � � � � � � � � � � � � � � � � � � � � � � � � � � 18 — — (26,591) — — —Acquisition of treasury shares � � � � � � � � � � � � 18 — — — (13) — —Disposal of treasury shares � � � � � � � � � � � � � � 18 — — (143) 311 — —Changes in ownership interests in subsidiaries without loss of control � � � � � � � � � � � � � � � � � — (1,442) — — — —
Transfer from other components of equity to retained earnings � � � � � � � � � � � � � � � � � � — — 1,131 — — (1,131)
Share-based payment transactions � � � � � � � � 17 — (218) — — — —Others (business combinations and others) � � � — (7,431) — — — —Total transactions with owners � � � � � � � � � � � — (9,091) (25,603) 297 — (1,131)
Balance as of December 31, 2020 � � � � � � � � � � � � ¥90,873 ¥83,501 ¥818,701 ¥(28,170) ¥(31,203) ¥51,397
Note: FVTOCI: Fair Value Through Other Comprehensive Income
(Unit: Millions of yen)Equity attributable to owners of the parentOther components of equity
FY2020 (Jan. 1 through Dec. 31, 2020) Note
Net gain (loss) in fair value of cash flow
hedges
Exchange differences
on translation of foreign operations Total Total
Non-controlling interests Total equity
Balance as of January 1, 2020 � � � � � � � � � � � � � � � ¥ (665) ¥166,833 ¥190,510 ¥1,157,097 ¥125,538 ¥1,282,636Changes in equity
Comprehensive incomeProfit for the year � � � � � � � � � � � � � � � � � � � � � — — — 32,715 8,448 41,164Other comprehensive income � � � � � � � � � � � � 19 1,104 (37,231) (39,142) (39,142) (5,336) (44,478)Total comprehensive income for the year � � � 1,104 (37,231) (39,142) (6,426) 3,111 (3,314)
Transactions with ownersDividends � � � � � � � � � � � � � � � � � � � � � � � � � � � 18 — — — (26,591) (4,291) (30,883)Acquisition of treasury shares � � � � � � � � � � � � 18 — — — (13) — (13)Disposal of treasury shares � � � � � � � � � � � � � � 18 — — — 167 — 167Changes in ownership interests in subsidiaries without loss of control � � � � � � � � � � � � � � � � � — — — (1,442) (559) (2,001)
Transfer from other components of equity to retained earnings � � � � � � � � � � � � � � � � � � — — (1,131) — — —
Share-based payment transactions � � � � � � � � 17 — — — (218) — (218)Others (business combinations and others) � � � — — — (7,431) 4,098 (3,332)Total transactions with owners � � � � � � � � � � � — — (1,131) (35,528) (753) (36,281)
Balance as of December 31, 2020 � � � � � � � � � � � � ¥ 439 ¥129,602 ¥150,236 ¥1,115,142 ¥127,897 ¥1,243,039

Financial Review 202018
iv) Consolidated Statements of Cash Flows
(Unit: Millions of yen)
Note
FY2019 (Jan� 1 through Dec� 31, 2019)
FY2020 (Jan. 1 through Dec. 31, 2020)
Cash flows from operating activitiesProfit before tax � � � � � � � � � � � � � � � � � � � � � � � � � � � � � � � � � � � � � � � � � � � � ¥ 76,213 ¥ 57,121Depreciation and amortization � � � � � � � � � � � � � � � � � � � � � � � � � � � � � � � � � 143,361 143,716Impairment losses � � � � � � � � � � � � � � � � � � � � � � � � � � � � � � � � � � � � � � � � � � 24,454 1,213Interest and dividend income � � � � � � � � � � � � � � � � � � � � � � � � � � � � � � � � � � (13,578) (5,702)Interest expenses � � � � � � � � � � � � � � � � � � � � � � � � � � � � � � � � � � � � � � � � � � � 12,281 7,620Share of profit of associates and joint ventures accounted for using equity method � � � � � � � � � � � � � � � � � � � � � � � � � � � � � � � � � � � � � � � � (1,088) (584)
Loss on sale or disposal of non-current assets � � � � � � � � � � � � � � � � � � � � � 2,463 9,378Increase in trade receivables � � � � � � � � � � � � � � � � � � � � � � � � � � � � � � � � � � (2,979) (3,328)Decrease (increase) in inventories � � � � � � � � � � � � � � � � � � � � � � � � � � � � � � � (9,079) 11,691Decrease in trade payables � � � � � � � � � � � � � � � � � � � � � � � � � � � � � � � � � � � (4,518) (605)Others � � � � � � � � � � � � � � � � � � � � � � � � � � � � � � � � � � � � � � � � � � � � � � � � � � � (7,086) 24,574
Subtotal � � � � � � � � � � � � � � � � � � � � � � � � � � � � � � � � � � � � � � � � � � � � � � � � 220,444 245,095Interest and dividends received � � � � � � � � � � � � � � � � � � � � � � � � � � � � � � � � 13,753 6,244Interest paid � � � � � � � � � � � � � � � � � � � � � � � � � � � � � � � � � � � � � � � � � � � � � � � (13,073) (7,786)Income taxes paid and refund � � � � � � � � � � � � � � � � � � � � � � � � � � � � � � � � � 23 (29,217) (18,160)
Net cash from operating activities � � � � � � � � � � � � � � � � � � � � � � � � � � � � � 191,906 225,392
Cash flows from investing activitiesPurchase of property, plant and equipment and intangible assets � � � � � � (197,928) (191,469)Proceeds from sale of property, plant and equipment � � � � � � � � � � � � � � � � 7,350 4,404Purchase of other financial assets � � � � � � � � � � � � � � � � � � � � � � � � � � � � � � (3,790) (33,106)Proceeds from sale and redemption of other financial assets � � � � � � � � � � 51,302 20,911Purchase of subsidiaries or other businesses � � � � � � � � � � � � � � � � � � � � � � 26 (40,093) (27,019)Others � � � � � � � � � � � � � � � � � � � � � � � � � � � � � � � � � � � � � � � � � � � � � � � � � � � 523 (3,969)
Net cash from investing activities � � � � � � � � � � � � � � � � � � � � � � � � � � � � � (182,636) (230,248)
Cash flows from financing activitiesChanges in short-term interest-bearing debt � � � � � � � � � � � � � � � � � � � � � � 14 12,653 28,896Proceeds from borrowing or issuing long-term interest-bearing debt � � � � 14 80,313 228,064Repayment or redemption of long-term interest-bearing debt � � � � � � � � � 14 (81,636) (99,167)Payments for acquisition of subsidiary’s interests from non-controlling interests � � � � � � � � � � � � � � � � � � � � � � � � � � � � � � � � � � � � � — (2,001)
Proceeds from non-controlling interests � � � � � � � � � � � � � � � � � � � � � � � � � � 1,500 3,540Acquisition of treasury shares � � � � � � � � � � � � � � � � � � � � � � � � � � � � � � � � � � 18 (15) (13)Dividends paid � � � � � � � � � � � � � � � � � � � � � � � � � � � � � � � � � � � � � � � � � � � � � 18 (26,582) (26,591)Dividends paid to non-controlling interests � � � � � � � � � � � � � � � � � � � � � � � � (3,529) (4,291)Others � � � � � � � � � � � � � � � � � � � � � � � � � � � � � � � � � � � � � � � � � � � � � � � � � � � 14 6
Net cash from financing activities � � � � � � � � � � � � � � � � � � � � � � � � � � � � � (17,284) 128,443Effect of exchange rate changes on cash and cash equivalents � � � � � � (1,704) (1,246)
Net increase (decrease) in cash and cash equivalents � � � � � � � � � � � � � � (9,719) 122,340Cash and cash equivalents at beginning of year � � � � � � � � � � � � � � � � � � � 5 123,503 113,784Cash and cash equivalents at end of year � � � � � � � � � � � � � � � � � � � � � � � � 5 ¥ 113,784 ¥ 236,124

AGC Inc. 19
Note 1: Reporting entityAGC Inc� (the “Company”) is a company domiciled in Japan� The consolidated financial statements of the Company as of and for the year ended December 31, 2020 comprise the Company and its subsidiaries (the “Group”), and interests in associates and jointly controlled entities, etc� (the “Group entities”)�
The Group is engaged in business activities primarily in the areas of Glass Operations, Electronics Operations, and Chemicals Operations� Please see Note 4 “Segment information” for details on the Group’s businesses�
Note 2: Basis of preparations(1) Statement of compliance with IFRSThe Group’s consolidated financial statements have been prepared in accordance with International Financial Reporting Standards (“IFRS”), based on the stipulations of Article 93 of the Ordinance on Consolidated Financial Statements� The Group’s consolidated financial statements satisfy all of the requirements for a “Specified Company” prescribed by Article 1-2 of the Ordinance on Consolidated Financial Statements�
On March 30, 2021, the consolidated financial statements were approved by President & CEO Yoshinori Hirai and Representative Director & CFO Shinji Miyaji�
(2) Basis of measurementThe consolidated financial statements have been prepared on a historical cost basis, except for the following significant items on the consolidated statements of financial position:
— Derivative financial instruments are measured at fair value�— Equity instruments are measured at fair value�— Contingent consideration liabilities are measured at fair value�— Defined benefit pension plan assets and liabilities are measured at the present value of defined benefit obligations less the fair
value of the plan assets�
(3) Presentation currencyThe consolidated financial statements are presented in Japanese yen� The currency unit is millions of yen, with figures less than one million yen rounded down�
(4) Use of estimates and judgmentsThe preparation of consolidated financial statements in accordance with IFRS requires management to make judgments, estimates and assumptions that affect the adoption of accounting policies and the reported amounts of assets, liabilities, income and expenses� Actual results could differ from these estimates�
The estimates and their underlying assumptions are reviewed continuously� Changes in accounting estimates are recognized prospectively�
With regard to the impact of the spread of COVID-19, the Group has made accounting estimates and judgments related to impairment of property, plant and equipment, impairment of goodwill and intangible assets, the recoverability of deferred tax assets, and related items� Those accounting estimates and judgments were made based on the assumption that the Group’s performance will gradually recover as economic activity successively resumes, despite some differences depending on the business or region�
The following notes include information about the judgements made in applying accounting policies that have the most significant effect on the amounts in the financial statements, and uncertainty of assumptions and estimates as of December 31, 2020 that have a significant risk of resulting in a material adjustment to the carrying amounts of assets and liabilities in the year ending December 31, 2021�
— Estimates of useful lives and residual values of property, plant and equipment and intangible assets (See Note 3 “Significant accounting policies” (6) (7), Note 8 “Property, plant and equipment” and Note 9 “Goodwill and intangible assets”)
— Calculation of the value in use in cash-generating units, the smallest unit of measurement for impairment of property, plant and equipment, goodwill and intangible assets (See Note 3 “Significant accounting policies” (9), Note 8 “Property, plant and equip-ment” and Note 9 “Goodwill and intangible assets”)
— The recoverability of deferred tax assets (See Note 3 “Significant accounting policies” (16) and Note 12 “Deferred tax assets and liabilities”)
— Actuarial assumptions for defined benefit pension plans (See Note 3 “Significant accounting policies” (11) and Note 16 “Employee benefits”)
— Fair value measurement of assets and liabilities acquired through business combinations (See Note 3 “Significant accounting policies” (1) and Note 26 “Business combinations”)
2 NOTES TO CONSOLIDATED FINANCIAL STATEMENTS

Financial Review 202020
(5) Changes in accounting policiesThe significant accounting policies adopted for the Group’s consolidated financial statements are the same as those for the consolidated financial statements for the year ended December 31, 2019, with the exception of the items described below�
The following are the accounting standards applied by the Group from fiscal year 2020, in compliance with each transitional provi-sion� The effect of the application of the following standards on the Group’s consolidated financial statements is immaterial�
IFRS Title Summaries of new IFRS and amendments
IFRS 3 (amended in October 2018) Business Combinations Clarification of the definition of a businessIAS 1IAS 8 (amended in October 2018)
Presentation of Financial StatementsAccounting Policies, Change in Accounting Estimates and Errors
Clarification of the definition of materiality
Note 3: Significant accounting policies(1) Basis of consolidationi) Business combinations
Business combinations are accounted for using the acquisition method when control is obtained� The Group recognizes goodwill as any excess of the aggregate of the consideration transferred, the amount of any non-controlling interest and, in the case of a business combination achieved in stages, the acquisition-date fair value of the equity interest of the acquiree previously held by the acquirer, over the net of the acquisition-date amounts of the identifiable assets acquired from the acquiree and the liabilities assumed� If the consideration transferred is lower than the latter net amount, the Group immediately recognizes the difference as profit or loss� Impairment test of goodwill is conducted annually, regardless of any indication of impairment� (See (9) “Impairment of non-financial assets”)� Business combinations of entities under common control are accounted for based on carrying amounts� These business combinations are those in which all the combining entities or businesses are ultimately controlled by the same party or parties both before and after the business combination, and that control is not transitory�
ii) SubsidiariesSubsidiaries are entities controlled by the Group� A subsidiary is controlled when the Group is exposed or has rights to variable returns from its involvement with the investee, and has the ability to use power over the investee to affect those returns� The accounting policies of subsidiaries have been adjusted in order to ensure conformity with the accounting policies adopted by the Group, as necessary�
iii) Non-controlling interestsThe components of profit or loss and other comprehensive income are attributed to owners of the parent and non-controlling interests� Of transactions giving rise to a change in the interest between the Company and the non-controlling interests of a subsidiary, for transactions that do not result in a loss of control, changes in the non-controlling interests in the subsidiary and the net amount of consideration paid (or received) are recognized directly in equity, and are not recognized as goodwill or as profit or loss�
iv) Investments in associates and joint venturesAn associate is an entity over which the Group has significant influence over its financial and operating policies, but does not exercise control of it� Significant influence is presumed to exist when the Group holds 20% or more of the voting rights in another entity� Considering not only the ratio of the voting rights, but also other elements, such as participation in management, an associate is included if the Group can exercise significant influence� A joint venture is a joint arrangement whereby the parties that have joint control of the arrangement have rights to the net assets of the arrangement� Investments in associates and joint ventures are recognized at cost initially on acquisition and are subsequently accounted for using the equity method (hereinafter “Investments in associates and joint ventures accounted for using equity method”)� Any differences between the investment on the investment date and the corresponding equity of the investee are included in the carrying amount of the investment as goodwill� The consolidated financial statements reflect the investments in associates and joint ventures’ share of profit or loss and other comprehensive income of the investee from the date on which the Group obtains significant influence until the end of the reporting period� In the event that the Group’s burden of loss exceeds the investment in the investee, the carrying amount of the Group’s share is reduced to zero� Except for when the Group incurs obligations or makes payments on behalf of the equity-accounted investee, the Group shall recognize no further loss� Goodwill that forms part of the carrying amount of investments in associates and joint ventures is not separately recognized, and therefore is not tested for impairment separately� Instead, whenever there is any objective evidence that an investment in an associate or joint venture may be impaired, the entire carrying amount of the investment is tested for impairment as a single asset�
v) Transactions eliminated on consolidationAll intergroup balances, transactions and unrealized gains and losses arising from intragroup transactions are eliminated in preparing the consolidated financial statements� Unrealized losses are eliminated only to the extent that there is no evidence of impairment�

AGC Inc. 21
(2) Foreign currencyi) Foreign currency transactions
Foreign currency transactions are translated into functional currencies of the individual Group entities by applying the rates of exchange prevailing at the dates of transactions� Monetary assets and liabilities denominated in foreign currencies are translated into the respective functional currencies at the prevailing exchange rates at the reporting date� Foreign exchange differences on translation are recognized as profit or loss� Exchange differences for any gains or losses on the assets and liabilities recognized in other comprehensive income are recognized in other comprehensive income� Non-monetary assets and liabilities measured in terms of historical cost in foreign currencies are translated at the exchange rate at the date of the transaction�
ii) Foreign operationsAssets and liabilities of foreign operations, including goodwill and fair value adjustments arising on the acquisition of foreign opera-tions, are translated into functional currency at the exchange rates prevailing at the reporting date� Income and expenses of foreign operations are translated into functional currency at the average exchange rate for the period�
(3) Financial instrumentsThe Group recognizes financial instruments on the contract date when the Group becomes a party to the contractual provisions of the instrument�
The Group derecognizes a financial asset in the following circumstances:— When the contractual rights to receive the cash flows from the financial asset expire; or— When the contractual rights to receive the cash flows from the financial asset in transactions in which substantially all the risks
and rewards of ownership of the financial asset are transferred to another entity�In regard to transferred financial assets, the Group recognizes any retained interest of the transferred financial asset as a separate
asset or liability�Financial assets and financial liabilities are offset and presented as a net amount on the consolidated statements of financial
position only when the Group has a legally enforceable right to set off the recognized amounts and intends either to settle on a net basis or to realize the asset and settle the liability simultaneously�i) Non-derivative financial assets
The Group holds non-derivative financial assets that are classified into financial assets measured at amortized cost, financial assets measured at fair value through other comprehensive income and financial assets measured at fair value through profit or loss�
Financial assets measured at amortized costFinancial assets are classified as financial assets measured at amortized cost if the following two conditions are met:— The foregoing financial assets are held within a Group business model whose objective is to hold the assets in order to collect
contractual cash flows from the assets; and— The contractual terms of the foregoing financial assets give rise on specified dates to cash flows that are solely payments of
principal and interest on the principal amount outstanding� The foregoing financial assets are initially recognized at fair value plus directly attributable transaction costs except for trade receivables, etc�, that do not contain a significant financing component� The trade receivables, etc�, that do not contain a significant financial component are initially recognized plus transaction cost� After initial recognition, the financial assets are measured at amortized cost using the effective interest method�
Financial assets measured at fair value through other comprehensive incomeThe Group designates equity instruments as financial assets measured at fair value through other comprehensive income when an irrevocable election has been made on initial recognition to measure the gains and losses arising from changes in the fair value of such instruments in other comprehensive income� When the foregoing financial assets measured at fair value through other comprehensive income are derecognized through sale, etc�, the cumulative gains or losses are reclassified from other components of equity to retained earnings�
Financial assets measured at fair value through profit or lossThe Group measures financial assets at fair value and recognizes any changes in the fair value of such assets as profit or loss, unless the foregoing financial assets are classified as financial assets measured at amortized cost or financial assets measured at fair value through other comprehensive income�
Impairment of financial assetsAt the end of each reporting period, the Group evaluates whether the credit risk on financial assets has increased significantly since the initial recognition� If the credit risk of a financial asset has increased significantly, the allowance for such financial assets is measured at an amount equal to the lifetime expected credit losses� If the credit risk has not increased significantly, the allowance for such financial assets is measured at an amount equal to the 12-month expected credit losses� However, with regards to trade receivables and contract asset that do not contain a significant financing component, the allowance is always measured at an amount equal to the lifetime expected credit losses� In estimating the allowance, expected credit losses of certain financial assets are measured on a collective basis such as every past due date�

Financial Review 202022
The Group determines if credit risk has increased significantly by evaluating changes in default risk after initial recognition with reference to factors including significant downgrading of ratings, stopping transaction due to delayed receivable, and other indica-tions of insolvency� If it is more than 90 days past due, the Group determines that default is occurred� In measuring credit losses, the Group uses reasonable and supportable information on the past events, current conditions and forecasts on future economic conditions, which is available without undue cost or effort at the reporting date� The Group assesses a credit-impairment based on objective evidence such as a borrower’s significant financial difficulty, etc� When it is reasonably determined that all or part of the financial assets are not collectable, the carrying amount of financial assets is directly written off�
ii) Non-derivative financial liabilitiesThe Group recognizes non-derivative financial liabilities that are classified into financial liabilities measured at amortized cost and contingent consideration liabilities�
Financial liabilities measured at amortized costThe Group recognizes the following as financial liabilities measured at amortized cost: trade payables, other payables, and interest-bearing debts (borrowings, commercial paper, corporate bonds, and bonds with subscription rights to shares (excluding share subscription rights)), among other items� The foregoing financial liabilities are initially recognized at fair value less directly attributable transaction costs� After initial rec-ognition, non-derivative financial liabilities are measured at amortized cost using the effective interest method� The Group derecognizes financial liabilities when the obligation specified in the contract is exempted, cancelled or expired�
Contingent consideration liabilitiesThe Group recognizes contingent consideration liabilities in business combinations as financial liabilities measured at fair value through profit or loss� The foregoing financial liabilities are measured at fair value, with changes recognized in profit or loss�
iii) Bonds with subscription rights to sharesThe Group classifies proceeds from the issue of bonds with subscription rights to shares into a liability component and an equity component based on the issuing conditions� Upon initial recognition, the liability component of bonds with subscription rights to shares is initially recognized at the fair value of similar liabilities without equity conversion options� The equity component is initially recognized as the total fair value of the bonds with subscription rights to shares less the fair value of the liability component� The transaction cost related to the issue of the bonds with subscription rights to shares is prorated according to the ratio of the initial carrying amounts of the liability and equity components on initial recognition, and deducted from the amounts of the liability and equity components� After initial recognition, the liability component of the bonds with subscription rights to shares is measured at amortized cost using the effective interest method� The equity component of the bonds with subscription rights to shares is not remeasured�
iv) Derivative financial instruments (including hedge accounting)The Group holds derivative financial instruments to hedge foreign currency exchange risk, interest rate risk, and commodity price risk� The Group initially recognizes derivative financial instruments at fair value, with the related transaction costs recognized in profit or loss when incurred� After initial recognition, derivative financial instruments are measured at fair value, with changes in fair value accounted for as follows, depending on whether or not derivatives qualify for hedge accounting:
(Derivatives not qualifying for hedge accounting)Changes in the fair value of derivative financial instruments which do not qualify for hedge accounting are recognized in profit or loss�
(Derivatives qualifying for hedge accounting)When applying hedge accounting, at the inception of hedges, the Group formally designates and documents hedging relationships to which hedge accounting is applied and the objectives and strategies of risk management for undertaking hedges� At the inception of hedges, the Group evaluates whether or not the hedging instrument can be predicted to be effective� Thereafter, the Group continuously evaluates whether the derivative is highly effective in offsetting changes in future cash flows from the hedged items� The Group applies cash flow hedges by designating qualified derivative financial instruments as hedging instruments� Cash flow hedges are designed to hedge exposure to variations in cash flows that are attributable to a particular risk associated with recognized assets or liabilities or highly probable forecast transactions which will affect profit or loss� The effective portion of gains or losses on hedging instruments is recognized in other comprehensive income� The amounts recognized in other comprehensive income are reclassified to profit or loss in the consolidated reporting periods when the cash flows of the hedged items affect profit or loss� The ineffective portion of changes in the fair value of hedging instruments is recognized in profit or loss� Hedge accounting is discontinued prospectively when: the hedging instrument expires or is sold, terminated, or exercised; the hedge no longer meets the criteria for hedge accounting; a forecast transaction is no longer expected to occur; or the hedging designation is revoked� A hedge designation may not be voluntarily revoked unless there is a change in the risk management objective� Therefore, if a hedging relationship ceases to meet the hedge effectiveness requirement relating to the hedge ratio, but the risk management objective for that designated hedging relationship remains the same, the Group adjusts the hedge ratio of the hedging relationship so that it meets the hedge effectiveness requirement again�

AGC Inc. 23
v) Equity Ordinary shares
Ordinary shares are classified as equity� Incremental costs (net of tax) directly attributable to the issue of ordinary shares or stock options are deducted from equity�
Treasury sharesIf the Company purchases treasury shares, the consideration paid, including net of directly attributable transaction costs and tax, is recognized as a deduction from equity� If the Company disposes of treasury shares, any gains or losses arising from the disposal of treasury shares are recognized in equity�
(4) Cash and cash equivalentsCash and cash equivalents comprise cash on hand, bank deposits available for withdrawal on demand, and short-term investments due within three months or less, which are readily convertible into cash and subject to insignificant risk of changes in value�
(5) InventoriesInventories are measured at the lower of cost and net realizable value� The cost of inventories is measured based on the moving average method, and includes costs of purchase and costs of conversion (including fixed and variable manufacturing overheads)� Net realizable value is the estimated selling price in the ordinary course of business less the estimated costs of completion and the estimated costs necessary to make the sale�
(6) Property, plant and equipmenti) Recognition and measurement
Property, plant and equipment is presented at cost less accumulated depreciation and accumulated impairment losses� Cost of property, plant and equipment includes any costs directly attributable to the acquisition of the asset� The cost of self-constructed assets includes material costs, direct labor costs, direct costs attributable to bringing the asset to the location and conditions necessary for its intended use, and the cost of dismantling, removing, and restoring the asset, as well as borrowing costs that satisfy the requirements for being capitalized� After acquisition of property, plant and equipment, the Group recognizes costs as the carrying amount of an asset only if it is probable that future economic benefits associated with the item will flow to the Group and the cost can be measured reliably� Differences between the carrying amount and the consideration received for the disposal of property, plant and equipment are recognized in profit or loss�
ii) DepreciationDepreciation of property, plant and equipment excluding non-depreciable property, plant and equipment, such as land, is computed under the straight-line method over the estimated useful lives of each item and the depreciable amount which is the cost of the asset less its residual value� The estimated useful lives of major property, plant and equipment are as follows: — Buildings and structures: 10 to 50 years — Machinery, equipment and vehicles: 4 to 15 years — Tools, fixtures and fittings: 2 to 15 years The depreciation methods, estimated useful lives and residual values are reviewed at the end of each reporting period, and changed when necessary�
(7) Goodwill and intangible assetsi) Goodwill
Goodwill may be recognized on the acquisition of a subsidiary� The measurement of goodwill on initial recognition is shown in (1) i) “Business combinations�” After initial recognition, goodwill is measured at cost less any accumulated impairment losses� Measurement of goodwill impairment is shown in (9) “Impairment of non-financial assets�”
ii) Research and development expensesExpenditure related to research activities to obtain new scientific or technical knowledge and understanding are recognized as an expense when incurred� Expenditure on development activities is capitalized as an intangible asset if it is reliably measurable, products or processes are technically and commercially feasible, it is probable to generate future economic benefits, and the Group has an intention and adequate resources to complete those assets and use or sell them� Other expenditure is recognized as an expense when incurred� Capitalized development expenditure is presented at cost less any accumulated amortization and accumulated impair-ment losses�
iii) Intangible assets other than goodwill acquired through business combinationsIntangible assets acquired through business combinations and recognized separately from goodwill are initially measured at fair value as of the acquisition date� After initial recognition, the foregoing intangible assets are presented at cost less any accumulated amortization and accumulated impairment losses�

Financial Review 202024
iv) Other intangible assetsOther intangible assets are initially recognized at cost� After initial recognition, intangible assets with finite useful lives are presented at cost less any accumulated amortization and accumulated impairment losses� Intangible assets with indefinite useful lives are presented at cost less any accumulated impairment losses�
v) AmortizationAmortization of intangible assets with finite useful lives is recognized as an expense under the straight-line method over their estimated useful lives from the date when the assets are available for use� The estimated useful lives of major intangible assets with finite useful lives are as follows:— Patents and trademarks: 5 to 10 years— Software: 5 years— Customer relationships: 7 to 30 years The amortization methods and useful lives are reviewed at the end of each reporting period and changed when necessary�
(8) LeasesThe Group, in accordance with IFRS 16, has determined whether a contract is, or contains, a lease, at the inception of the contract� A contract is determined to be a lease or contain a lease, if the contract conveys the right to control the use of an identified asset for a period of time in exchange for a consideration�
When a contract is determined to be a lease or contain a lease, the Group initially recognizes a right-of-use asset and a lease liability at the commencement date of the contract� A lease liability is initially measured at the discounted present value of unpaid lease payments at the commencement date of the contract� The right-of-use asset is initially measured at cost, which comprises the amount of the initial measurement of the lease liability, any initial direct costs incurred and prepaid lease payments, etc� The right-of-use asset is regularly depreciated over the economic life or the lease term of the underlying asset, whichever is shorter, from the commencement date of the contract� The Group does not recognize right-of-use assets and lease liabilities for leases with a lease term of 12 months or less or when the underlying assets are of low value, and recognizes lease payments as an expense on a straight-line basis over the lease term� In the consolidated statement of financial position, the right-of-use assets are included in Property, plant and equip-ment, and lease liabilities are included in Long-term debt due within one year or Long-term debt�
(9) Impairment of non-financial assetsAt the end of each reporting period, the Group assesses the carrying amounts of non-financial assets, excluding inventories and deferred tax assets, to determine whether there is any indication of impairment of each asset or the cash-generating unit to which the asset belongs� If any such indication exists, impairment of each asset or each cash-generating unit is tested� Goodwill is tested annually, regardless of any indication of impairment�
Assets that are not individually tested are integrated into the smallest identifiable group of assets that generates cash inflows from continuing use that are largely independent of the cash inflows from other assets or groups of assets (cash-generating unit)� When testing for impairment of goodwill, the goodwill is allocated to cash-generating units which are not larger than an operating segment and represent the lowest level at which the goodwill is monitored for internal management purposes�
The recoverable amount of an asset or a cash-generating unit is the higher of its fair value less costs to disposal and its value in use� In calculating an asset’s value in use, estimated future cash flows are discounted to the present value using a pre-tax discount rate that reflects the time value of money and the risks specific to the asset�
If the carrying amount of an asset or a cash-generating unit exceeds the recoverable amount, an impairment loss is recognized� The impairment loss recognized with respect to a cash-generating unit is allocated first to reduce the carrying amount of any goodwill allocated to the cash-generating unit, and then to the other assets of the unit on a pro-rata basis based on the carrying amount of each asset in the unit�
An impairment loss on other non-financial assets recognized in prior periods is reversed if there are indications of the possibility of reversing such an impairment loss and if the recoverable amount exceeds the carrying amount as a result of an estimation of the recoverable amount� An impairment loss is reversed up to the carrying amount that would have been determined if there had been no impairment loss recognized for the asset in prior years and depreciation or amortization had been continuously recognized up to the reversal� An impairment loss for goodwill is not reversed in subsequent periods�
(10) Non-current assets held for saleThe Group classifies an asset or asset group which is expected to be recovered through a sale transaction rather than through continuous use as a non-current asset or disposal group held for sale when the following conditions are met: it is highly probable that the asset or asset group will be sold within one year, the asset or asset group is available for immediate sale in its present condition, and there is assurance of a plan to sell the asset or asset group� In such cases, the non-current asset is not depreciated or amortized and is measured at the lower of its carrying amount and its fair value less costs to sell�

AGC Inc. 25
(11) Employee benefitsEmployee benefits include post-employment benefit plans, short-term employee benefits, and share-based payments� Post-employment benefit plans comprise defined benefit plans and defined contribution plans�i) Defined benefit plans
Obligations for defined benefit plans are recognized as the present value of defined benefit obligations less the fair value of any plan assets� The present value of defined benefit obligations is calculated annually by qualified actuaries using the projected unit credit method� The discount rates are based on the market yields of high quality corporate bonds at the end of each reporting period that have terms consistent with the discount period, which is established as the estimated term of the post-employment benefit obligations through to the estimated dates for payments of future benefits in every fiscal year� Actuarial gains and losses are recognized immediately in other comprehensive income when incurred, while past service costs and gains or losses on settlement are recognized in profit or loss�
ii) Defined contribution plansExpenses related to post-employment benefits for defined contribution plans are expensed as the related services are provided�
iii) Short-term employee benefitsShort-term employee benefit obligations are measured on an undiscounted basis and are recognized as expenses as the related service is provided� For bonus payments, a liability is recognized for the amount expected to be paid under short-term cash bonuses if the Group has a present legal or constructive obligation to pay this amount as a result of past service provided by the employee, and the obligation can be estimated reliably�
iv) Share-based paymentsThe Company provided the Group’s directors, executive officers, and other employees with stock options, which grant the holder the right to purchase the Company’s stock until the year ended December 31, 2017� The fair value of stock options at the grant date is recognized in profit or loss over the vesting period from the grant date, with a corresponding increase in equity� The Group has elected to adopt the exemptions of IFRS 1 First-time Adoption of International Financial Reporting Standards (“IFRS 1”)� Accordingly, the Group has elected not to retrospectively apply IFRS 2 Share-based Payment (“IFRS 2”) to stock options granted after November 7, 2002 that vested before the transition date to IFRS� The Company has employed a framework referred to as the Board Incentive Plan Trust (hereinafter referred to as the “BIP Trust”) as equity-settled share-based payment arrangement granted to directors and executive officers (excluding non-residents of Japan)� The shares of the Company held by the BIP Trust are recognized as treasury shares� The Company recognizes the consideration in profit or loss measured at the grant-date fair value of its shares, with corresponding increase in equity over the vesting period of the awards�
(12) ProvisionsA provision is recognized when the Group has a reasonably estimable legal or constructive obligation as a result of a past event, and it is probable that an outflow of resources embodying economic benefits will be required to settle the obligation� Where the effect of the time value of money is material, the estimated future cash flows are discounted to the present value using a pre-tax rate that reflects the time value of money and the risks specific to the liability� The unwinding of the discount is recognized as finance costs�
The Group has established a provision for restructuring costs arising from restructuring actions to improve the business structure and the reorganization of certain operations� Such costs are recognized when they can be reasonably estimated and include an expansion in the severance compensation program�
(13) RevenueThe Group recognizes revenue based on the following five-step model�
Step 1: Identify the contract with a customerStep 2: Identify the performance obligations in the contractStep 3: Determine the transaction priceStep 4: Allocate the transaction price to the performance obligations in the contractStep 5: Recognize revenue when the entity satisfies a performance obligationThe Group sells a range of products including architectural glass, automotive glass, glass substrates for displays, electronic
materials, chlor-alkali & urethane, fluorochemicals & specialty chemicals, and life science products� For the sales of these products, revenue is recognized upon delivery of these products as its performance obligation is satisfied when customers obtain control over these products at the time of delivery� For revenue associated with construction works such as the installation of architectural glass and contract development and manufacturing services for biological active pharmaceutical ingredient (API), revenue is recognized according to the progress toward completion of the performance obligation� Progress toward completion is measured by the input method based on the costs incurred, etc� Also, revenue is measured based on the consideration specified in contracts with customers, less discounts, rebates, returned products, and other items�

Financial Review 202026
(14) Operating profit and business profit“Operating profit” in the Group’s consolidated statements of profit or loss is an indicator that facilitates continuous comparisons and evaluations of the Group’s business performance� Main items of “other income” and “other expenses” are foreign exchange gains and losses, gains on sale of non-current assets, losses on disposal of non-current assets, impairment losses and expenses for restructuring programs� “Business profit” includes all income and expenses before finance income, finance costs and income tax expenses�
(15) Finance income and finance costsFinance income mainly comprises interest income, dividend income and gains on hedging instruments that are not recognized in other comprehensive income� Interest income is recognized as incurred using the effective interest method� Dividend income is recognized as of the date when the Group’s right to receive payment is established�
Finance costs mainly comprise interest expenses and losses on hedging instruments that are not recognized in other compre-hensive income�
(16) Income taxIncome tax comprises current income tax and deferred income tax� These are recognized in profit or loss, except to the extent that it relates to a business combination, or items recognized directly in equity or in other comprehensive income�
Current income tax is measured at the amount that is expected to be paid to or refunded from the taxation authorities using the tax rates enacted or substantively enacted at the end of the reporting period�
Deferred income tax is recognized on temporary differences between the carrying amounts of assets and liabilities for accounting purposes and their tax basis, using the tax rates that are expected to apply to the period when the temporary differences will reverse, based on tax laws that have been enacted or substantively enacted by the end of the reporting period� Deferred tax assets are recognized for all deductible temporary differences, and the carry forward of unused tax losses and unused tax credits to the extent that it is probable that future taxable profit will be available against which they can be utilized� Deferred tax assets are reviewed at the end of each reporting period and are recognized only to the extent that it is probable that the tax benefits can be realized�
However, deferred tax assets are not recognized if the initial recognition of an asset or liability in a transaction that is not a business combination affects neither accounting profit nor taxable profit at the time of the transaction�
Deductible temporary differences associated with investments in subsidiaries, associates and interests in joint arrangements are recognized only to the extent of the following circumstances:
— The temporary difference will reverse in the foreseeable future; and— Taxable profit will be available against which the temporary difference can be utilized�Deferred tax liabilities are recognized for all taxable temporary differences, in principle�However, deferred tax liabilities are not recognized in the following circumstances:— On the initial recognition of goodwill�— On the initial recognition of an asset or liability in a transaction that is not a business combination affecting neither accounting
profit nor taxable profit at the time of the transaction�— There are taxable temporary differences associated with investments in subsidiaries, associates and interests in joint arrange-
ments to the extent that the parent company is able to control the timing of the reversal of the temporary difference and it is probable that the temporary difference will not reverse in the foreseeable future�
Deferred tax assets and deferred tax liabilities are offset when there is a legally enforceable right to offset current tax assets against current tax liabilities and in either of the following circumstances:
— Income taxes are levied by the same taxation authority on the same taxable entity; or— Different taxable entities intend either to settle current tax assets and liabilities on a net basis, or to realize the current tax assets
and settle the current tax liabilities simultaneously�
(17) Earnings per shareBasic earnings per share is calculated by dividing profit for the year attributable to owners of the parent by the weighted average number of ordinary shares outstanding during the period, adjusted by the number of treasury shares during the period�
Diluted earnings per share is calculated by adjusting the effects of all dilutive potential ordinary shares�

AGC Inc. 27
(18) New standards and interpretations not yet adoptedNew standards, interpretations, and amendments to standards and interpretations that have not been adopted in the year ended December 31, 2020, and which the Group has yet to apply to the preparation of the consolidated financial statements, are mainly as follows�
The potential impacts on the consolidated financial statements by the application of standards and interpretations are currently being evaluated and cannot be estimated as of the date of the report�
IFRS Title
Effective date (annual periods beginning on
or after)Adoption by the Group (annual periods ending)
Summaries of new IFRS and amendments
IFRS 16 (amended in May 2020)
Leases June 1, 2020 Fiscal year ending December 2021
Covid-19-Related Rent Concessions
IFRS 16 (amended in May 2020)
Property, Plant and Equipment
January 1, 2022 Fiscal year ending December 2022
Property, Plant and Equipment – Proceeds before Intended Use
IAS 37 (amended in May 2020)
Provisions, Contingent Liabilities and Contingent Assets
January 1, 2022 Fiscal year ending December 2022
Onerous Contracts – Cost of Fulfilling a Contract
IFRS 3 (amended in May 2020)
Business Combinations
January 1, 2022 Fiscal year ending December 2022
Reference to the Conceptual Framework
IAS 1 (amended in January 2020)
Presentation of Financial Statements
January 1, 2022 Fiscal year ending December 2022
Classification of Liabilities as Current or Non-current
Note 4: Segment informationThe Group’s reportable segments are components of the Group for which discrete financial information is available, and whose operating results are reviewed regularly by the Group’s chief operating decision maker to make decisions about resources to be allocated to the segment and assess performance�
The Group had four in-house companies by product and service: Building & Industrial Glass, Automotive, Electronics and Chemicals� Each in-house company operates worldwide, formulating comprehensive domestic and overseas strategies for its products and services�
The Building & Industrial Glass Company and Automotive Company shares the same float glass manufacturing facilities (glass melting furnace), etc�, which are the largest assets and are located at the highest point in the supply chain� The two in-house companies share assets and liabilities, and the ratio of utilization is influenced by fluctuations in supply and demand� Considering these situations, it is difficult to divide financial statements for the two in-house companies� Therefore, the Group prepares the financial statements of the Building & Industrial Glass Company and Automotive Company as the Glass segment� In addition, decisions on assigning manage-ment resources are closely tied to the results of each business and inseparable from their performance evaluation� Therefore, with the participation of presidents of both in-house companies, the Group has established a Glass Segment Council, which primarily functions to maintain synergies and maximize overall production in the Glass segment, and collaborates to maximize profits for the Group� Based on these circumstances, the Group reports the Glass segment as one segment�
Thus, the Group has three reportable segments: Glass, Electronics, and Chemicals�The main products of each reportable segment are as follows:
Reportable segment Main products
Glass Float flat glass, Figured glass, Polished wired glass, Low-E glass, Decorative glass, Fabricated glass for architectural use (Heat Insulating/shielding glass, Disaster-resistant/Security glass, Fire-resistant glass, etc�), Automotive glass, Cover glass for car-mounted displays, etc�
Electronics LCD glass substrates, OLED glass substrates, Specialty glass for display applications, Display related materials, Glass for solar power system, Fabricated glass for industrial use, Semiconductor process materials, Optoelectronic materials, Printed circuit board materials, Lighting glass products, Laboratory use ware, etc�
Chemicals Polyvinyl chloride, Vinyl chloride monomer, Caustic soda, Urethane, Fluorinated resins, Water and oil repellents, Gases, Solvents, Pharmaceutical and agrochemical intermediates and active ingredients, Iodine-related products, etc�
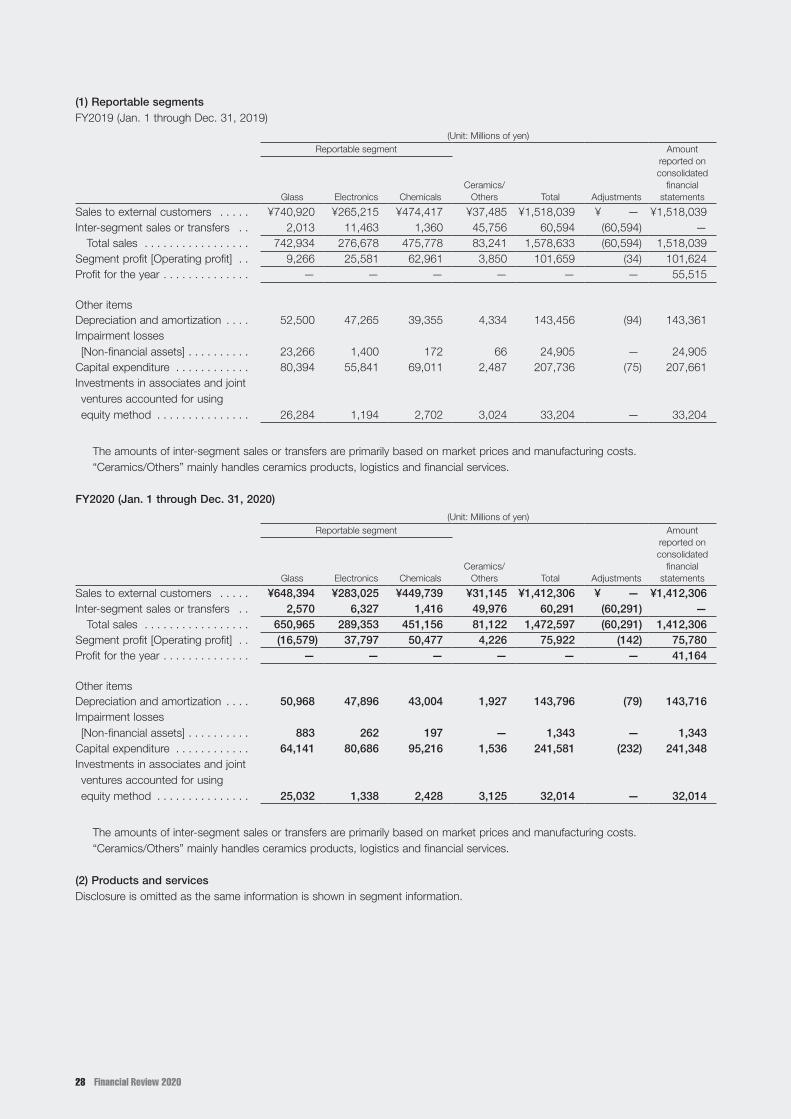
Financial Review 202028
(1) Reportable segmentsFY2019 (Jan� 1 through Dec� 31, 2019)
(Unit: Millions of yen)Reportable segment
Ceramics/ Others Total Adjustments
Amount reported on consolidated
financial statementsGlass Electronics Chemicals
Sales to external customers � � � � � ¥740,920 ¥265,215 ¥474,417 ¥37,485 ¥1,518,039 ¥ — ¥1,518,039Inter-segment sales or transfers � � 2,013 11,463 1,360 45,756 60,594 (60,594) —
Total sales � � � � � � � � � � � � � � � � � 742,934 276,678 475,778 83,241 1,578,633 (60,594) 1,518,039Segment profit [Operating profit] � � 9,266 25,581 62,961 3,850 101,659 (34) 101,624Profit for the year � � � � � � � � � � � � � � — — — — — — 55,515
Other itemsDepreciation and amortization � � � � 52,500 47,265 39,355 4,334 143,456 (94) 143,361Impairment losses [Non-financial assets] � � � � � � � � � � 23,266 1,400 172 66 24,905 — 24,905
Capital expenditure � � � � � � � � � � � � 80,394 55,841 69,011 2,487 207,736 (75) 207,661Investments in associates and joint ventures accounted for using equity method � � � � � � � � � � � � � � � 26,284 1,194 2,702 3,024 33,204 — 33,204
The amounts of inter-segment sales or transfers are primarily based on market prices and manufacturing costs�“Ceramics/Others” mainly handles ceramics products, logistics and financial services�
FY2020 (Jan. 1 through Dec. 31, 2020)
(Unit: Millions of yen)Reportable segment
Ceramics/ Others Total Adjustments
Amount reported on consolidated
financial statementsGlass Electronics Chemicals
Sales to external customers � � � � � ¥648,394 ¥283,025 ¥449,739 ¥31,145 ¥1,412,306 ¥ — ¥1,412,306Inter-segment sales or transfers � � 2,570 6,327 1,416 49,976 60,291 (60,291) —
Total sales � � � � � � � � � � � � � � � � � 650,965 289,353 451,156 81,122 1,472,597 (60,291) 1,412,306Segment profit [Operating profit] � � (16,579) 37,797 50,477 4,226 75,922 (142) 75,780Profit for the year � � � � � � � � � � � � � � — — — — — — 41,164
Other itemsDepreciation and amortization � � � � 50,968 47,896 43,004 1,927 143,796 (79) 143,716Impairment losses [Non-financial assets] � � � � � � � � � � 883 262 197 — 1,343 — 1,343
Capital expenditure � � � � � � � � � � � � 64,141 80,686 95,216 1,536 241,581 (232) 241,348Investments in associates and joint ventures accounted for using equity method � � � � � � � � � � � � � � � 25,032 1,338 2,428 3,125 32,014 — 32,014
The amounts of inter-segment sales or transfers are primarily based on market prices and manufacturing costs�“Ceramics/Others” mainly handles ceramics products, logistics and financial services�
(2) Products and servicesDisclosure is omitted as the same information is shown in segment information�

AGC Inc. 29
(3) Major customersDisclosure is omitted as sales to external customers did not exceed 10% to any single external customer�
(4) Geographical segmentsThe analysis of sales by geographical area for the years ended December 31, 2019 and 2020 is as follows:
(Unit: Millions of yen)FY2019
(Jan� 1 through Dec� 31, 2019)
FY2020 (Jan. 1 through Dec. 31, 2020)
Japan � � � � � � � � � � � � � � � � � � � � � � � � � � � � � � � � � � � � � � � � � � � � � � � � � � � � � � � � � � � � � � � ¥ 530,875 ¥ 496,412Asia � � � � � � � � � � � � � � � � � � � � � � � � � � � � � � � � � � � � � � � � � � � � � � � � � � � � � � � � � � � � � � � � � 475,792 448,875America � � � � � � � � � � � � � � � � � � � � � � � � � � � � � � � � � � � � � � � � � � � � � � � � � � � � � � � � � � � � � � 172,629 154,532Europe � � � � � � � � � � � � � � � � � � � � � � � � � � � � � � � � � � � � � � � � � � � � � � � � � � � � � � � � � � � � � � 338,741 312,485
Total � � � � � � � � � � � � � � � � � � � � � � � � � � � � � � � � � � � � � � � � � � � � � � � � � � � � � � � � � � � � � � � ¥1,518,039 ¥1,412,306
Note: Sales are based on the location of each company, and “Brazil” is included in “America�”
The analysis of non-current assets by geographical area as of December 31, 2019 and 2020 is as follows:
(Unit: Millions of yen)FY2019
(as of December 31, 2019)
FY2020 (as of December 31,
2020)
Japan � � � � � � � � � � � � � � � � � � � � � � � � � � � � � � � � � � � � � � � � � � � � � � � � � � � � � � � � � � � � � � � ¥ 375,913 ¥ 417,546Asia � � � � � � � � � � � � � � � � � � � � � � � � � � � � � � � � � � � � � � � � � � � � � � � � � � � � � � � � � � � � � � � � � 645,990 667,452America � � � � � � � � � � � � � � � � � � � � � � � � � � � � � � � � � � � � � � � � � � � � � � � � � � � � � � � � � � � � � � 99,849 101,616Europe � � � � � � � � � � � � � � � � � � � � � � � � � � � � � � � � � � � � � � � � � � � � � � � � � � � � � � � � � � � � � � 278,493 298,002
Total � � � � � � � � � � � � � � � � � � � � � � � � � � � � � � � � � � � � � � � � � � � � � � � � � � � � � � � � � � � � � � � ¥1,400,247 ¥1,484,617
Notes: 1� Non-current assets do not include “Investments in associates and joint ventures accounted for using equity method,” “other financial assets” and “deferred tax assets�”
2� Non-current assets are based on the location of assets, and Brazil is included in “America�”
Note 5: Cash and cash equivalents
(Unit: Millions of yen)FY2019
(as of December 31, 2019)
FY2020 (as of December 31,
2020)
Cash on hand and deposits � � � � � � � � � � � � � � � � � � � � � � � � � � � � � � � � � � � � � � � � � � � � � � ¥114,849 ¥251,494Negotiable certificates of deposit � � � � � � � � � � � � � � � � � � � � � � � � � � � � � � � � � � � � � � � � � � � 5 5Time deposits due over three months � � � � � � � � � � � � � � � � � � � � � � � � � � � � � � � � � � � � � � � (1,070) (15,375)
Total � � � � � � � � � � � � � � � � � � � � � � � � � � � � � � � � � � � � � � � � � � � � � � � � � � � � � � � � � � � � � � � ¥113,784 ¥236,124
The balances of cash and cash equivalents on the consolidated statements of financial position as of December 31, 2019 and 2020 agree to the respective balances on the consolidated statements of cash flows�
Note 6: Trade and other receivablesTrade receivables
(Unit: Millions of yen)FY2019
(as of December 31, 2019)
FY2020 (as of December 31,
2020)
Notes receivable � � � � � � � � � � � � � � � � � � � � � � � � � � � � � � � � � � � � � � � � � � � � � � � � � � � � � � � ¥ 17,144 ¥ 17,461Accounts receivable � � � � � � � � � � � � � � � � � � � � � � � � � � � � � � � � � � � � � � � � � � � � � � � � � � � � 248,801 251,100Allowance account for credit losses � � � � � � � � � � � � � � � � � � � � � � � � � � � � � � � � � � � � � � � � (1,843) (2,385)
Total � � � � � � � � � � � � � � � � � � � � � � � � � � � � � � � � � � � � � � � � � � � � � � � � � � � � � � � � � � � � � � � ¥264,102 ¥266,177

Financial Review 202030
The Group’s exposure to currency risk with respect to trade receivables, and impairment losses, are presented in Note 25 “Financial instruments�”
Other receivables
(Unit: Millions of yen)FY2019
(as of December 31, 2019)
FY2020 (as of December 31,
2020)
Other accounts receivable � � � � � � � � � � � � � � � � � � � � � � � � � � � � � � � � � � � � � � � � � � � � � � � � ¥18,130 ¥15,082Others � � � � � � � � � � � � � � � � � � � � � � � � � � � � � � � � � � � � � � � � � � � � � � � � � � � � � � � � � � � � � � � 28,257 47,386
Total � � � � � � � � � � � � � � � � � � � � � � � � � � � � � � � � � � � � � � � � � � � � � � � � � � � � � � � � � � � � � � � ¥46,387 ¥62,468
Note 7: Inventories
(Unit: Millions of yen)FY2019
(as of December 31, 2019)
FY2020 (as of December 31,
2020)
Merchandise and finished goods � � � � � � � � � � � � � � � � � � � � � � � � � � � � � � � � � � � � � � � � � � � ¥125,707 ¥107.310Work in progress � � � � � � � � � � � � � � � � � � � � � � � � � � � � � � � � � � � � � � � � � � � � � � � � � � � � � � � 57,005 58,799Raw materials and supplies � � � � � � � � � � � � � � � � � � � � � � � � � � � � � � � � � � � � � � � � � � � � � � � 108,511 108,725
Total � � � � � � � � � � � � � � � � � � � � � � � � � � � � � � � � � � � � � � � � � � � � � � � � � � � � � � � � � � � � � � � ¥291,224 ¥274,835
The amount of write-downs of inventories recognized as expenses and the amount of reversal of write-downs are as follows:
(Unit: Millions of yen)FY2019
(Jan� 1 through Dec� 31, 2019)
FY2020 (Jan. 1 through Dec. 31, 2020)
Amount of write-downs of inventories recognized as expenses � � � � � � � � � � � � � � � � � � � � ¥(8,136) ¥(6,614)Amount of reversal of write-downs � � � � � � � � � � � � � � � � � � � � � � � � � � � � � � � � � � � � � � � � � 7,100 5,966
Note 8: Property, plant and equipment(1) Reconciliation“Construction in progress” includes expenditures on property, plant and equipment under construction�
The amount in “additions” for each “property, plant and equipment” includes the amount which is transferred from “construction in progress�”
Depreciation is recorded in “cost of sales” and “selling, general and administrative expenses” on the consolidated statements of profit or loss�
FY2019 (Jan� 1 through Dec� 31, 2019)Cost
(Unit: Millions of yen)
Buildings and structures
Machinery, equipment and
vehiclesTools, fixtures
and fittings LandConstruction in progress Total
Balance as of January 1 � � � � � � � � � � � � ¥681,174 ¥2,026,532 ¥134,514 ¥78,162 ¥217,891 ¥3,138,275Cumulative effect of change in accounting policy � � � � � � � � � � � � � � � � 27,058 6,595 387 4,860 — 38,901
Restated balance as of January 1 � � � � � 708,233 2,033,127 134,901 83,022 217,891 3,177,177Additions � � � � � � � � � � � � � � � � � � � � � � � � 54,723 207,768 12,962 9,102 (86,081) 198,474Acquisitions due to business combinations � � � � � � � � � � � � � � � � � � � � � 1,017 2,308 128 928 1,210 5,591
Disposals or sales � � � � � � � � � � � � � � � � � (7,747) (52,432) (7,469) (1,694) (739) (70,082)Net foreign exchange differences on translation � � � � � � � � � � � � � � � � � � � � � � (3,158) (12,137) (394) 136 (2,671) (18,226)
Others � � � � � � � � � � � � � � � � � � � � � � � � � � 2,709 3,730 1,230 (98) (829) 6,742Balance as of December 31 � � � � � � � � � ¥755,778 ¥2,182,365 ¥141,358 ¥91,397 ¥128,778 ¥3,299,677

AGC Inc. 31
Accumulated depreciation and impairment losses
(Unit: Millions of yen)
Buildings and structures
Machinery, equipment and
vehiclesTools, fixtures
and fittings LandConstruction in progress Total
Balance as of January 1 � � � � � � � � � � � � ¥(398,141) ¥(1,514,159) ¥(113,766) ¥(2,747) ¥ (526) ¥(2,029,340)Depreciation � � � � � � � � � � � � � � � � � � � � � (29,363) (94,339) (9,246) (910) — (133,859)Impairment losses � � � � � � � � � � � � � � � � � (3,492) (15,659) (2,358) (88) (3,212) (24,812)Disposals or sales � � � � � � � � � � � � � � � � � 6,156 48,152 7,089 1 59 61,459Net foreign exchange differences on translation � � � � � � � � � � � � � � � � � � � � � � 1,049 7,627 281 (32) (41) 8,884
Others � � � � � � � � � � � � � � � � � � � � � � � � � � (1,469) (2,003) (844) — — (4,317)Balance as of December 31 � � � � � � � � � ¥(425,259) ¥(1,570,382) ¥(118,844) ¥(3,778) ¥(3,720) ¥(2,121,985)
Carrying amounts
(Unit: Millions of yen)
Buildings and structures
Machinery, equipment and
vehiclesTools, fixtures
and fittings LandConstruction in progress Total
Balance as of January 1 � � � � � � � � � � � � ¥283,033 ¥512,373 ¥20,747 ¥75,414 ¥217,365 ¥1,108,934Restated balance as of January 1 � � � � � 310,092 518,968 21,135 80,275 217,365 1,147,836Balance as of December 31 � � � � � � � � � ¥330,518 ¥611,982 ¥22,513 ¥87,618 ¥125,058 ¥1,177,691
FY2020 (Jan. 1 through Dec. 31, 2020)Cost
(Unit: Millions of yen)
Buildings and structures
Machinery, equipment and
vehiclesTools, fixtures
and fittings LandConstruction in progress Total
Balance as of January 1 � � � � � � � � � � � � ¥755,778 ¥2,182,365 ¥141,358 ¥91,397 ¥128,778 ¥3,299,677Additions � � � � � � � � � � � � � � � � � � � � � � � � 71,571 115,130 10,989 2,470 36,452 236,615Acquisitions due to business combinations � � � � � � � � � � � � � � � � � � � � � 1,535 987 80 0 21 2,625
Disposals or sales � � � � � � � � � � � � � � � � � (21,553) (61,192) (7,792) (1,154) (712) (92,405)Net foreign exchange differences on translation � � � � � � � � � � � � � � � � � � � � � � (10,568) (30,073) (1,724) (954) (1,287) (44,609)
Others � � � � � � � � � � � � � � � � � � � � � � � � � � 100 (536) (899) (23) 35 (1,323)Balance as of December 31 � � � � � � � � � ¥796,863 ¥2,206,680 ¥142,011 ¥91,735 ¥163,288 ¥3,400,579
Accumulated depreciation and impairment losses
(Unit: Millions of yen)
Buildings and structures
Machinery, equipment and
vehiclesTools, fixtures
and fittings LandConstruction in progress Total
Balance as of January 1 � � � � � � � � � � � � ¥(425,259) ¥(1,570,382) ¥(118,844) ¥(3,778) ¥(3,720) ¥(2,121,985)Depreciation � � � � � � � � � � � � � � � � � � � � � (29,538) (93,387) (9,158) (1,009) — (133,093)Impairment losses � � � � � � � � � � � � � � � � � (238) (963) (17) (124) — (1,343)Disposals or sales � � � � � � � � � � � � � � � � � 19,607 52,049 7,001 413 174 79,246Net foreign exchange differences on translation � � � � � � � � � � � � � � � � � � � � � � 3,938 16,488 1,561 17 174 22,180
Others � � � � � � � � � � � � � � � � � � � � � � � � � � 433 (439) 554 24 729 1,302Balance as of December 31 � � � � � � � � � ¥(431,057) ¥(1,596,634) ¥(118,902) ¥(4,457) ¥(2,642) ¥(2,153,694)
Carrying amounts
(Unit: Millions of yen)
Buildings and structures
Machinery, equipment and
vehiclesTools, fixtures
and fittings LandConstruction in progress Total
Balance as of January 1 � � � � � � � � � � � � ¥330,518 ¥611,962 ¥22,513 ¥87,618 ¥125,058 ¥1,177,691Balance as of December 31 � � � � � � � � � ¥365,806 ¥610,046 ¥23,108 ¥87,277 ¥160,646 ¥1,246,885

Financial Review 202032
2) Impairment lossesProperty, plant and equipment is grouped into a cash-generating unit, based on business units� The cash-generating unit is the smallest identifiable group of assets that generates cash inflows that are largely independent of the cash inflow from other assets or groups of assets�
The recoverable amount of a cash-generating unit is recorded as the higher of its fair value less costs of disposal and its value in use� Value in use is calculated based on the following major assumptions�
On an annual basis, future cash flows for each cash-generating unit are based on the most recent budgets and medium-term business forecasts, while future cash flows for subsequent periods take into account the growth potential of businesses� The cash flow projection periods are set appropriately according to the business of each cash-generating unit�
The discount rate applied to each cash-generating unit is calculated mainly based on the pre-tax weighted average cost of capital, and adjusted to properly reflect risks and other factors related to the business using information from external and internal sources�
During the year ended December 31, 2019, the Group recognized the following impairment losses�Due to changes in business environment such as declining vehicle production and a change in product mix in North America, the
Group identified impairment indication that the group of assets, related to automotive glass business in the region included in the Glass segment, experienced decreases in profitability� Accordingly, the Group estimated recoverable amounts and recognized an impairment loss of ¥22,223 million� The recoverable amounts are based on fair value less costs of disposal�
In addition, the Group identified impairment indications that the group of assets of the Architectural glass included in the Glass segment and of various businesses included in the Electronics segment, experienced decreases in profitability, which was due to sluggish market conditions and changes in market developments� Accordingly, the Group estimated recoverable amounts and rec-ognized impairment losses of ¥2,588 million� The recoverable amounts are mainly based on fair value less costs of disposal, but a part is based on value in use and calculated by discounting estimated future cash flow to the present value� The discount rate used to calculate value in use is 9%�
During the year ended December 31, 2020, the Group recognized the following impairment losses�The Group recognized indications of impairment, due to significant decrease in profitability in the group of assets of the Automotive
glass included in the Glass segment and of various businesses included in the Electronics segment and the Chemicals segment� This was mainly due to sluggish market conditions and other market developments� Due to the downturn of market conditions and changes, the Group recognized an impairment loss of ¥1,343 million� The recoverable amounts are mainly based on fair value less costs of disposal, but a part is based on value in use and calculated by discounting estimated future cash flow to the present value� The discount rate used to calculate value in use is 15%�
Impairment losses are included in and shown as “other expenses” on the consolidated statements of profit or loss�During the year ended December 31, 2020, the Group mainly performed the following impairment tests�The operating results of the automotive glass business in Europe deteriorated primarily due to a decrease in automotive
production volume affected by the spread of the novel coronavirus disease (COVID-19), which resulted in an indication of impair-ment for the cash-generating unit to which its property, plant and equipment (¥77,769 million) belong� Therefore, an impairment test was performed at the end of the current fiscal year� Since the recoverable amount exceeded the carrying amount of the cash-generating unit, no impairment loss was recognized� The five-year business plan of the automotive glass business in Europe that formed the basis for estimating value in use included certain key assumptions such as the prospects for an increase in sales volume on the premise that automotive production volume would gradually recover from the impact of COVID-19, improved productivity, and cost reductions�
The operating results of the business unit that produces specialty glass for display applications were unfavorable compared to the budget due to changes in the market, which resulted in an indication of impairment for the cash-generating unit to which its property, plant and equipment (¥13,232 million) belong� Therefore, an impairment test was performed at the end of the current fiscal year� Since the recoverable amount exceeded the carrying amount of the cash-generating unit, no impairment loss was recognized� The five-year business plan of specialty glass for display applications products that formed the basis for estimating value in use included certain key assumptions such as an increase in sales volume of specialty glass due to an increasing overall market demand for display glasses based on the forecasts for the number of smartphones and tablets produced, as well as an expansion in market share and the unit sales price estimated considering, among others, changes in the market demand toward high-end products�

AGC Inc. 33
Note 9: Goodwill and intangible assets(1) ReconciliationCost
(Unit: Millions of yen)FY2019 (Jan� 1 through Dec� 31, 2019)
Intangible assets
GoodwillCustomer
relationships Other Total
Balance as of January 1 � � � � � � � � � � � � � � � � � � � � � � � � � � � � � � � � � � � � � ¥110,537 ¥30,298 ¥131,368 ¥161,667Additions � � � � � � � � � � � � � � � � � � � � � � � � � � � � � � � � � � � � � � � � � � � � � � � — — 9,186 9,186Additions through business combinations � � � � � � � � � � � � � � � � � � � � � � 21,808 9,316 354 9,671Disposals or sales � � � � � � � � � � � � � � � � � � � � � � � � � � � � � � � � � � � � � � � � — — (5,640) (5,640)Net foreign exchange differences on translation � � � � � � � � � � � � � � � � � (1,954) (359) (1,546) (1,906)Others � � � � � � � � � � � � � � � � � � � � � � � � � � � � � � � � � � � � � � � � � � � � � � � � � (5,732) 3,226 2,106 5,333Balance as of December 31 � � � � � � � � � � � � � � � � � � � � � � � � � � � � � � � � ¥124,659 ¥42,482 ¥135,829 ¥178,311
(Unit: Millions of yen)FY2020 (Jan. 1 through Dec. 31, 2020)
Intangible assets
GoodwillCustomer
relationships Other Total
Balance as of January 1 � � � � � � � � � � � � � � � � � � � � � � � � � � � � � � � � � � � � � ¥124,659 ¥42,482 ¥135,829 ¥178,311Additions � � � � � � � � � � � � � � � � � � � � � � � � � � � � � � � � � � � � � � � � � � � � � � � — — 4,733 4,733Additions through business combinations � � � � � � � � � � � � � � � � � � � � � � 13,545 9,433 59 9,493Disposals or sales � � � � � � � � � � � � � � � � � � � � � � � � � � � � � � � � � � � � � � � � — — (1,511) (1,511)Net foreign exchange differences on translation � � � � � � � � � � � � � � � � � 1,182 (641) 753 112Others � � � � � � � � � � � � � � � � � � � � � � � � � � � � � � � � � � � � � � � � � � � � � � � � � — — 320 320Balance as of December 31 � � � � � � � � � � � � � � � � � � � � � � � � � � � � � � � � ¥139,387 ¥51,274 ¥140,186 ¥191,460
Accumulated amortization and impairment losses
(Unit: Millions of yen)FY2019 (Jan� 1 through Dec� 31, 2019)
Intangible assets
GoodwillCustomer
relationships Other Total
Balance as of January 1 � � � � � � � � � � � � � � � � � � � � � � � � � � � � � � � � � � � ¥(21,460) ¥(2,902) ¥(102,119) ¥(105,021)Amortization � � � � � � � � � � � � � � � � � � � � � � � � � � � � � � � � � � � � � � � � � � � � — (2,354) (7,146) (9,501)Impairment losses � � � � � � � � � � � � � � � � � � � � � � � � � � � � � � � � � � � � � � � � — — (93) (93)Disposals or sales � � � � � � � � � � � � � � � � � � � � � � � � � � � � � � � � � � � � � � � � — — 5,196 5,196Net foreign exchange differences on translation � � � � � � � � � � � � � � � � � 724 40 1,031 1,072Others � � � � � � � � � � � � � � � � � � � � � � � � � � � � � � � � � � � � � � � � � � � � � � � � � 23 — 0 0Balance as of December 31 � � � � � � � � � � � � � � � � � � � � � � � � � � � � � � � � ¥(20,713) ¥(5,216) ¥(103,131) ¥(108,347)
(Unit: Millions of yen)FY2020 (Jan. 1 through Dec. 31, 2020)
Intangible assets
GoodwillCustomer
relationships Other Total
Balance as of January 1 � � � � � � � � � � � � � � � � � � � � � � � � � � � � � � � � � � � ¥(20,713) ¥(5,216) ¥(103,131) ¥(108,347)Amortization � � � � � � � � � � � � � � � � � � � � � � � � � � � � � � � � � � � � � � � � � � � � — (2,919) (7,703) (10,622)Impairment losses � � � � � � � � � � � � � � � � � � � � � � � � � � � � � � � � � � � � � � � � — — — —Disposals or sales � � � � � � � � � � � � � � � � � � � � � � � � � � � � � � � � � � � � � � � � — — 1,295 1,295Net foreign exchange differences on translation � � � � � � � � � � � � � � � � � (610) 15 (824) (808)Others � � � � � � � � � � � � � � � � � � � � � � � � � � � � � � � � � � � � � � � � � � � � � � � � � — — (316) (316)Balance as of December 31 � � � � � � � � � � � � � � � � � � � � � � � � � � � � � � � � ¥(21,323) ¥(8,120) ¥(110,679) ¥(118,800)

Financial Review 202034
Carrying amounts
(Unit: Millions of yen)FY2019 (Jan� 1 through Dec� 31, 2019)
Intangible assets
GoodwillCustomer
relationships Other Total
Balance as of January 1 � � � � � � � � � � � � � � � � � � � � � � � � � � � � � � � � � � � ¥ 89,076 ¥27,396 ¥29,248 ¥56,645Balance as of December 31 � � � � � � � � � � � � � � � � � � � � � � � � � � � � � � � � ¥103,946 ¥37,265 ¥32,698 ¥69,964
(Unit: Millions of yen)FY2020 (Jan. 1 through Dec. 31, 2020)
Intangible assets
GoodwillCustomer
relationships Other Total
Balance as of January 1 � � � � � � � � � � � � � � � � � � � � � � � � � � � � � � � � � � � ¥103,946 ¥37,265 ¥32,698 ¥69,964Balance as of December 31 � � � � � � � � � � � � � � � � � � � � � � � � � � � � � � � � ¥118,063 ¥43,153 ¥29,506 ¥72,660
Amortization is recorded in “cost of sales” and “selling, general and administrative expenses” on the consolidated statements of profit or loss�
(2) Impairment test of cash-generating units including goodwillThe total carrying amount of goodwill allocated to each cash-generating unit is as follows:
(Unit: Millions of yen)FY2019
(as of December 31, 2019)
FY2020 (as of December 31,
2020)
Glass � � � � � � � � � � � � � � � � � � � � � � � � � � � � � � � � � � � � � � � � � � � � � � � � � � � � � � � � � � � � � � � � ¥ 24,656 ¥ 25,275Electronics � � � � � � � � � � � � � � � � � � � � � � � � � � � � � � � � � � � � � � � � � � � � � � � � � � � � � � � � � � � � 36,773 36,478Chemicals � � � � � � � � � � � � � � � � � � � � � � � � � � � � � � � � � � � � � � � � � � � � � � � � � � � � � � � � � � � � 42,516 56,309
Total � � � � � � � � � � � � � � � � � � � � � � � � � � � � � � � � � � � � � � � � � � � � � � � � � � � � � � � � � � � � � � � ¥103,946 ¥118,063
The recoverable amount of goodwill allocated to each cash-generating unit is mainly calculated based on value in use�Assumptions for value in use are presented in Note 8 “Property, plant and equipment�”The Group acquired AGC Biologics A/S and AGC Biologics, Inc�, a contract development and manufacturing organization (CDMO)
offering biological active pharmaceutical ingredient (API) manufacturing services� The goodwill in connection with this acquisition is included in the corresponding amount for the Chemicals segment� As of December 31, 2019 and 2020, the amount is ¥36,479 million and ¥37,135 million, respectively� In testing for the impairment of goodwill from this acquisition, the Group calculated the value in use by adding the perpetuity value to the future five-year cash flows, which takes into account the average growth rate of the biophar-maceutical market (estimated at 10%) and growth due to synergy effects within the Group� In addition, the discount rates (pre-tax) used to determine the outcome of the impairment test were 9% and 11% for the years ended December 31, 2019 and 2020, respectively� In the event that the growth rate falls below the projected rate, or the discount rate increases by 11 percentage points and 11 percentage points during the years ended December 31, 2019 and 2020, respectively, an impairment loss could be incurred�
The Group acquired the global operations of the Advanced Dielectric Division (ADD) of US-based Taconic, Inc�, which mainly conducts manufacturing and sales of high-end rigid Copper Clad Laminate (CCL) and industrial films� The goodwill in connection with this acquisition is included in the corresponding amount for the Electronics segment� The amounts were ¥22,275 million and ¥22,416 million in the years ended December 31, 2019 and 2020, respectively� In testing for the impairment of goodwill from this acquisition, the Group calculated the value in use by adding the perpetuity value to the future five-year cash flows, considering sales growth and the establishment of a business platform in the high-end rigid CCL market� In addition, the discount rates (pre-tax) used to determine the outcome of the impairment test were 12% and 13% in the years ended December 31, 2019 and 2020, respectively� In the event that the growth rate falls below the projected rate, or the discount rate increases by 1 percentage point and 3 percentage points during the years ended December 31, 2019 and 2020, respectively, an impairment loss could be incurred�
The main discount rates (pre-tax) used for impairment tests for cash-generating units including goodwill, except for the above, ranged from 6 to 12% and 6 to 14% for the years ended December 31, 2019 and 2020, respectively�
There were no impairment losses regarding goodwill recognized during the years ended December 31, 2019 and 2020�

AGC Inc. 35
(3) Impairment losses of intangible assetsDuring the year ended December 31, 2019, the Group recognized an impairment loss of ¥93 million for several business units included in the Glass segment and Electronics segment�
There were no impairment losses recognized during the year ended December 31, 2020�Impairment losses are included in and shown as “other expenses” on the consolidated statements of profit or loss� Assumptions
for value in use and circumstances that resulted in recognition of impairment loss are presented in Note 8 “Property, plant and equipment�”
Note 10: LeasesThe Group leases certain buildings, production facilities, etc� and accounts for them based on the terms of contract�
(1) Right-of-use assets
(Unit: Millions of yen)FY2019 (Jan� 1 through Dec� 31, 2019)
Buildings and structures
Machinery, equipment and
vehiclesTools, fixtures
and fittings Land Total
Balance as of January 1 � � � � � � � � � � � � � � � � � � � � � � � � ¥35,380 ¥ 7,257 ¥ 581 ¥4,860 ¥ 48,080Depreciation � � � � � � � � � � � � � � � � � � � � � � � � � � � � � � � � � (8,510) (2,847) (410) (910) (12,679)Additions � � � � � � � � � � � � � � � � � � � � � � � � � � � � � � � � � � � � 5,930 6,262 337 4,678 17,209Balance as of December 31 � � � � � � � � � � � � � � � � � � � � � ¥32,252 ¥10,524 ¥ 505 ¥8,702 ¥ 51,985
(Unit: Millions of yen)FY2020 (Jan. 1 through Dec. 31, 2020)
Buildings and structures
Machinery, equipment and
vehiclesTools, fixtures
and fittings Land Total
Balance as of January 1 � � � � � � � � � � � � � � � � � � � � � � � � ¥32,252 ¥10,524 ¥ 505 ¥ 8,702 ¥ 51,985Depreciation � � � � � � � � � � � � � � � � � � � � � � � � � � � � � � � � � (8,317) (2,924) (399) (1,009) (12,650)Additions � � � � � � � � � � � � � � � � � � � � � � � � � � � � � � � � � � � � 26,364 1,939 550 1,932 30,786Balance as of December 31 � � � � � � � � � � � � � � � � � � � � � ¥50,353 ¥ 9,146 ¥ 657 ¥ 9,372 ¥ 69,530
(2) Lease liabilitiesThe contractual maturity of the lease liabilities is described in “Note 25 Financial instruments (3) Liquidity risk�”
(3) Amounts recognized in profit or loss
(Unit: Millions of yen)FY2019
(Jan� 1 through Dec� 31, 2019)
FY2020 (Jan. 1 through Dec. 31, 2020)
Interest on lease liabilities � � � � � � � � � � � � � � � � � � � � � � � � � � � � � � � � � � � � � � � � � � � � � � � � ¥(1,548) ¥(1,661)Expenses related to short-term leases and leases of low-value assets � � � � � � � � � � � � � � (8,019) (8,234)
(4) Amounts recognized in the consolidated cash flow statementTotal cash outflows for leases are ¥21,400 and ¥21,665 million for the year ended December 31, 2019 and 2020, respectively�
Note 11: Equity method affiliatesThe carrying amounts of investments accounted for using the equity method are as follows:
(Unit: Millions of yen)FY2019
(as of December 31, 2019)
FY2020 (as of December 31,
2020)
Investments in associates and joint ventures accounted for using equity method � � � � � � ¥33,204 ¥32,014

Financial Review 202036
Share of profit and other comprehensive income of associates and joint ventures accounted for using the equity method are as follows:
(Unit: Millions of yen)FY2019
(Jan� 1 through Dec� 31, 2019)
FY2020 (Jan. 1 through Dec. 31, 2020 )
Share of profit of associates and joint ventures accounted for using equity method � � � � ¥1,088 ¥584Share of other comprehensive income of associates and joint ventures accounted for using equity method � � � � � � � � � � � � � � � � � � � � � � � � � � � � � � � � � � � � � � � � � � � � � � � � � (799) (2)Total � � � � � � � � � � � � � � � � � � � � � � � � � � � � � � � � � � � � � � � � � � � � � � � � � � � � � � � � � � � � � � � ¥ 289 ¥582
During the years ended December 31, 2019 and 2020, there was no individually significant associate or joint venture accounted for using the equity method�
Note 12: Deferred tax assets and liabilities(1) Unrecognized deferred tax assetsThe Group recognizes deferred tax assets, taking into account deductible temporary differences, projected future taxable profit and tax planning� However, deferred tax assets have not been recognized for the following items:
(Unit: Millions of yen)FY2019
(as of December 31, 2019)
FY2020 (as of December 31,
2020)
Carry-forwards of unused tax losses � � � � � � � � � � � � � � � � � � � � � � � � � � � � � � � � � � � � � � � � ¥328,077 ¥376,834Deductible temporary differences � � � � � � � � � � � � � � � � � � � � � � � � � � � � � � � � � � � � � � � � � � 254,856 331,182
Total � � � � � � � � � � � � � � � � � � � � � � � � � � � � � � � � � � � � � � � � � � � � � � � � � � � � � � � � � � � � � � � ¥582,933 ¥708,016
The amounts of carry-forwards of unused tax losses, for which deferred tax assets have not been recognized, and the expiries of the carry-forwards are as follows:
(Unit: Millions of yen)FY2019
(as of December 31, 2019)
FY2020 (as of December 31,
2020)
1st year � � � � � � � � � � � � � � � � � � � � � � � � � � � � � � � � � � � � � � � � � � � � � � � � � � � � � � � � � � � � � � ¥ 21,644 ¥ 3,7802nd year � � � � � � � � � � � � � � � � � � � � � � � � � � � � � � � � � � � � � � � � � � � � � � � � � � � � � � � � � � � � � 1,809 4,4443rd year � � � � � � � � � � � � � � � � � � � � � � � � � � � � � � � � � � � � � � � � � � � � � � � � � � � � � � � � � � � � � � 2,150 4,3404th year � � � � � � � � � � � � � � � � � � � � � � � � � � � � � � � � � � � � � � � � � � � � � � � � � � � � � � � � � � � � � � 4,668 8,7955th year and thereafter � � � � � � � � � � � � � � � � � � � � � � � � � � � � � � � � � � � � � � � � � � � � � � � � � � 297,804 355,473
Total � � � � � � � � � � � � � � � � � � � � � � � � � � � � � � � � � � � � � � � � � � � � � � � � � � � � � � � � � � � � � � � ¥328,077 ¥376,834
(2) Unrecognized deferred tax liabilitiesAs of December 31, 2019 and 2020, the total amounts of taxable temporary differences for which deferred tax liabilities have not been recognized, which relate to investment in subsidiaries, associates and interest in joint arrangements, were ¥182,116 million and ¥125,850 million, respectively�
The Group has not recognized deferred tax liabilities relating to the preceding taxable temporary differences because it is able to control the timing of the reversal of the temporary difference and it is probable that the temporary difference will not reverse in the foreseeable future�

AGC Inc. 37
(3) Recognized deferred tax assets and liabilitiesDeferred tax assets and liabilities were attributable to the following items:
(Unit: Millions of yen)FY2019
(as of December 31, 2019)
FY2020 (as of December 31,
2020)
Deferred tax assetsPost-employment benefit liabilities � � � � � � � � � � � � � � � � � � � � � � � � � � � � � � � � � � � � � � � � ¥ 9,062 ¥ 9,904Depreciation � � � � � � � � � � � � � � � � � � � � � � � � � � � � � � � � � � � � � � � � � � � � � � � � � � � � � � � � 4,141 4,683Impairment losses � � � � � � � � � � � � � � � � � � � � � � � � � � � � � � � � � � � � � � � � � � � � � � � � � � � � 1,118 1,201Carry-forwards of unused tax losses � � � � � � � � � � � � � � � � � � � � � � � � � � � � � � � � � � � � � � 21,224 23,007Lease liabilities � � � � � � � � � � � � � � � � � � � � � � � � � � � � � � � � � � � � � � � � � � � � � � � � � � � � � � � 10,762 13,890Others � � � � � � � � � � � � � � � � � � � � � � � � � � � � � � � � � � � � � � � � � � � � � � � � � � � � � � � � � � � � � 21,024 25,906
Total deferred tax assets � � � � � � � � � � � � � � � � � � � � � � � � � � � � � � � � � � � � � � � � � � � � � 67,332 78,593Deferred tax liabilities
Financial assets measured at fair value through other comprehensive income � � � � � � � (21,117) (21,305)Gain on establishment of trust for retirement benefits � � � � � � � � � � � � � � � � � � � � � � � � � (5,663) (5,770)Depreciation � � � � � � � � � � � � � � � � � � � � � � � � � � � � � � � � � � � � � � � � � � � � � � � � � � � � � � � � (21,374) (20,481)Deferred capital gain reserve � � � � � � � � � � � � � � � � � � � � � � � � � � � � � � � � � � � � � � � � � � � � (4,199) (3,873)Right-to-use assets � � � � � � � � � � � � � � � � � � � � � � � � � � � � � � � � � � � � � � � � � � � � � � � � � � � (10,801) (13,862)Others � � � � � � � � � � � � � � � � � � � � � � � � � � � � � � � � � � � � � � � � � � � � � � � � � � � � � � � � � � � � � (24,726) (22,510)
Total deferred tax liabilities � � � � � � � � � � � � � � � � � � � � � � � � � � � � � � � � � � � � � � � � � � � � (87,881) (87,803)Net deferred tax assets � � � � � � � � � � � � � � � � � � � � � � � � � � � � � � � � � � � � � � � � � � � � � � ¥(20,549) ¥ (9,209)
(4) Increase and decrease of deferred tax assets and liabilitiesIncrease and decrease of deferred tax assets and liabilities are as follows:
(Unit: Millions of yen)FY2019
(as of December 31, 2019)
FY2020 (as of December 31,
2020)
Balance as of January 1 (net amount) � � � � � � � � � � � � � � � � � � � � � � � � � � � � � � � � � � � � � � � ¥(14,848) ¥(20,549)Recognized in profit or loss � � � � � � � � � � � � � � � � � � � � � � � � � � � � � � � � � � � � � � � � � � � � � � � (3,746) 5,896Recognized in other comprehensive income � � � � � � � � � � � � � � � � � � � � � � � � � � � � � � � � � � (8,544) (22)Others (business combinations and others) � � � � � � � � � � � � � � � � � � � � � � � � � � � � � � � � � � � 6,590 5,466Balance as of December 31 (net amount) � � � � � � � � � � � � � � � � � � � � � � � � � � � � � � � � � � � � ¥(20,549) ¥ (9,209)
Note 13: Trade and other payablesTrade payables
(Unit: Millions of yen)FY2019
(as of December 31, 2019)
FY2020 (as of December 31,
2020)
Notes payable � � � � � � � � � � � � � � � � � � � � � � � � � � � � � � � � � � � � � � � � � � � � � � � � � � � � � � � � � ¥ 1,409 ¥ 10,140Trade accounts payable � � � � � � � � � � � � � � � � � � � � � � � � � � � � � � � � � � � � � � � � � � � � � � � � � 151,093 141,734
Total � � � � � � � � � � � � � � � � � � � � � � � � � � � � � � � � � � � � � � � � � � � � � � � � � � � � � � � � � � � � � � � ¥152,502 ¥151,874
Other payables
(Unit: Millions of yen)FY2019
(as of December 31, 2019)
FY2020 (as of December 31,
2020)
Other accounts payable � � � � � � � � � � � � � � � � � � � � � � � � � � � � � � � � � � � � � � � � � � � � � � � � � ¥ 64,736 ¥ 73,837Accrued expenses � � � � � � � � � � � � � � � � � � � � � � � � � � � � � � � � � � � � � � � � � � � � � � � � � � � � � � 39,126 40,614Others � � � � � � � � � � � � � � � � � � � � � � � � � � � � � � � � � � � � � � � � � � � � � � � � � � � � � � � � � � � � � � � 36,859 71,858
Total � � � � � � � � � � � � � � � � � � � � � � � � � � � � � � � � � � � � � � � � � � � � � � � � � � � � � � � � � � � � � � � ¥140,722 ¥186,310

Financial Review 202038
Note 14: Interest-bearing debt
(Unit: Millions of yen)FY2019
(as of December 31, 2019)
FY2020 (as of December 31,
2020)
Short-term bank loans � � � � � � � � � � � � � � � � � � � � � � � � � � � � � � � � � � � � � � � � � � � � � � � � � � � ¥ 53,845 ¥102,229Commercial paper � � � � � � � � � � � � � � � � � � � � � � � � � � � � � � � � � � � � � � � � � � � � � � � � � � � � � � 24,594 4,654Long-term bank loans due within one year � � � � � � � � � � � � � � � � � � � � � � � � � � � � � � � � � � � 69,096 75,815Short-term lease liabilities � � � � � � � � � � � � � � � � � � � � � � � � � � � � � � � � � � � � � � � � � � � � � � � � 11,005 11,347
Total current liabilities � � � � � � � � � � � � � � � � � � � � � � � � � � � � � � � � � � � � � � � � � � � � � � � � � � 158,541 194,047Long-term bank loans � � � � � � � � � � � � � � � � � � � � � � � � � � � � � � � � � � � � � � � � � � � � � � � � � � � 341,037 473,162Corporate bonds � � � � � � � � � � � � � � � � � � � � � � � � � � � � � � � � � � � � � � � � � � � � � � � � � � � � � � � 59,859 59,885Long-term lease liabilities � � � � � � � � � � � � � � � � � � � � � � � � � � � � � � � � � � � � � � � � � � � � � � � � 43,404 60,865
Total non-current liabilities � � � � � � � � � � � � � � � � � � � � � � � � � � � � � � � � � � � � � � � � � � � � � � 444,301 593,912Total interest-bearing debt � � � � � � � � � � � � � � � � � � � � � � � � � � � � � � � � � � � � � � � � � � � � � � ¥602,843 ¥787,960
Please see Note 25 “Financial instruments” for further information on the Group’s interest rate risk, currency risk, and liquidity risk�Assets pledged as collateral are presented in Note 28 “Collateral�”
(1) Bonds
Company Name of bond Date of issuance
As of January 1,
2020 (Millions of yen)
As of December 31,
2020 (Millions of yen)
Interest rate (% annum)(Note 2) Collateral Date of maturity
Asahi Glass Co�, Ltd� 14th straight bond Jun� 3, 2013 ¥19,973 ¥19,981 1�01 None Jun� 2, 2023Asahi Glass Co�, Ltd� 15th straight bond May 29, 2017 19,944 19,951 0�31 None May 28, 2027AGC Inc� 1st straight bond Oct� 12, 2018 19,941 19,952 0�23 None Oct� 10, 2025
Total(Note 1) — — ¥59,859 ¥59,885 — — —(—) (—)
Notes: 1� The component figures disclosed in parentheses in the “As of January 1, 2020” and “As of December 31, 2020” columns represent balances due within one year�
2� The interest rate column shows the coupon rates applicable to each bond� Accordingly, these rates are different from the effective annual interest rates�
(2) BorrowingsAs of December 31, 2020, the weighted average effective interest rate for “short-term bank loans,” “commercial paper,” “long-term bank loans due within one year” and “long-term bank loans” are 0�8%, 0�3%, 0�4% and 0�5% per annum, respectively�
The maturities of “long-term bank loans” are from 2022 to 2030�
(3) Liabilities arising from financing activitiesThe changes of liabilities arising from financing activities are as follows:
(Unit: Millions of yen)FY2019 (Jan� 1 through Dec� 31, 2019)
BorrowingsCommercial
paperCorporate
bonds Lease liabilities
Total liabilities arising from
financing activities
Balance as of January 1 � � � � � � � � � � � � � � � � � � � � � � � � ¥422,518 ¥18,745 ¥ 89,834 ¥ 10,681 ¥541,780Cumulative effect of change in accounting policy � � � � � — — — 39,247 39,247Restated balance as of January 1 � � � � � � � � � � � � � � � � � 422,518 18,745 89,834 49,929 581,028Cash flows � � � � � � � � � � � � � � � � � � � � � � � � � � � � � � � � � � 47,078 6,083 (30,000) (11,832) 11,329Non-cash changes
Increase in finance lease liabilities � � � � � � � � � � � � � � � — — — 17,209 17,209Foreign exchange differences � � � � � � � � � � � � � � � � � � (5,942) (234) — (166) (6,343)Changes in the scope of consolidation � � � � � � � � � � � 323 — — 106 430Others � � � � � � � � � � � � � � � � � � � � � � � � � � � � � � � � � � � � — — 25 (836) (810)
Balance as of December 31 � � � � � � � � � � � � � � � � � � � � � ¥463,978 ¥24,594 ¥ 59,859 ¥ 54,409 ¥602,843

AGC Inc. 39
(Unit: Millions of yen)FY2020 (Jan. 1 through Dec. 31, 2020)
BorrowingsCommercial
paperCorporate
bonds Lease liabilities
Total liabilities arising from
financing activities
Balance as of January 1 � � � � � � � � � � � � � � � � � � � � � � � � ¥463,978 ¥ 24,594 ¥59,859 ¥ 54,409 ¥602,843Cash flows � � � � � � � � � � � � � � � � � � � � � � � � � � � � � � � � � � 189,431 (19,867) — (11,769) 157,794Non-cash changes
Increase in finance lease liabilities � � � � � � � � � � � � � � � — — — 30,209 30,209Foreign exchange differences � � � � � � � � � � � � � � � � � � (2,420) (72) — (944) (3,436)Changes in the scope of consolidation � � � � � � � � � � � 217 — — 1,071 1,289Others � � � � � � � � � � � � � � � � � � � � � � � � � � � � � � � � � � � � — — 25 (764) (738)
Balance as of December 31 � � � � � � � � � � � � � � � � � � � � � ¥651,207 ¥ 4,654 ¥59,885 ¥ 72,213 ¥787,960
Note 15: Provisions
(Unit: Millions of yen)FY2019
(as of December 31, 2019)
FY2020 (as of December 31,
2020)
Provisions for restructuring costs � � � � � � � � � � � � � � � � � � � � � � � � � � � � � � � � � � � � � � � � � � � ¥2,178 ¥ 593Other provisions � � � � � � � � � � � � � � � � � � � � � � � � � � � � � � � � � � � � � � � � � � � � � � � � � � � � � � � 1,789 969
Total current liabilities � � � � � � � � � � � � � � � � � � � � � � � � � � � � � � � � � � � � � � � � � � � � � � � � � � ¥3,968 ¥ 1,563Provisions for restructuring costs � � � � � � � � � � � � � � � � � � � � � � � � � � � � � � � � � � � � � � � � � � � ¥ 930 ¥ 5,008Other provisions � � � � � � � � � � � � � � � � � � � � � � � � � � � � � � � � � � � � � � � � � � � � � � � � � � � � � � � 7,355 7,345
Total non-current liabilities � � � � � � � � � � � � � � � � � � � � � � � � � � � � � � � � � � � � � � � � � � � � � � ¥8,286 ¥12,353
“Other provisions” consists of various provisions for undetermined obligation related to identifiable risks, such as asset retirement obligations and environment-related provisions�
There is no significant balance of asset retirement obligations as of December 31, 2019 and 2020�
A reconciliation of opening and closing balances for each class of provision is as follows:
(Unit: Millions of yen)FY2020 (Jan. 1 through Dec. 31, 2020)
Provisions for restructuring costs Other provisions Total
Balance as of January 1 � � � � � � � � � � � � � � � � � � � � � � � � � � � � � � � � � � ¥ 3,109 ¥ 9,145 ¥12,254Amounts increased during the period � � � � � � � � � � � � � � � � � � � � � � � � 5,893 1,591 7,484Amounts used during the period � � � � � � � � � � � � � � � � � � � � � � � � � � � � (2,863) (2,388) (5,252)Unused amounts reversed during the period � � � � � � � � � � � � � � � � � � � (589) (114) (704)Others � � � � � � � � � � � � � � � � � � � � � � � � � � � � � � � � � � � � � � � � � � � � � � � � 53 81 134Balance as of December 31 � � � � � � � � � � � � � � � � � � � � � � � � � � � � � � � ¥ 5,601 ¥ 8,314 ¥13,916
During the year ended December 31, 2020, the Group recognized a provision for restructuring programs measured at estimated future losses arising from restructuring actions such as an expansion in the additional severance compensation program to improve the business structure and the reorganization of certain operations� The timing of the payment may be affected by future business plans�
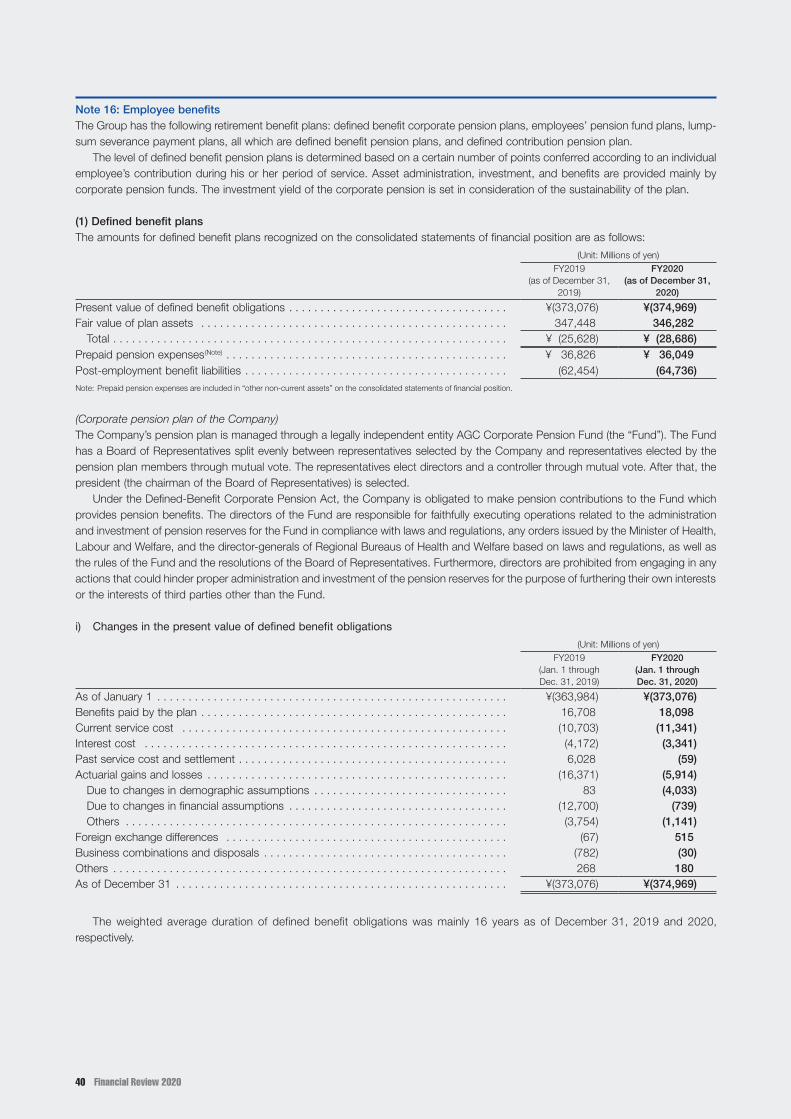
Financial Review 202040
Note 16: Employee benefitsThe Group has the following retirement benefit plans: defined benefit corporate pension plans, employees’ pension fund plans, lump-sum severance payment plans, all which are defined benefit pension plans, and defined contribution pension plan�
The level of defined benefit pension plans is determined based on a certain number of points conferred according to an individual employee’s contribution during his or her period of service� Asset administration, investment, and benefits are provided mainly by corporate pension funds� The investment yield of the corporate pension is set in consideration of the sustainability of the plan�
(1) Defined benefit plansThe amounts for defined benefit plans recognized on the consolidated statements of financial position are as follows:
(Unit: Millions of yen)FY2019
(as of December 31, 2019)
FY2020 (as of December 31,
2020)
Present value of defined benefit obligations � � � � � � � � � � � � � � � � � � � � � � � � � � � � � � � � � � � ¥(373,076) ¥(374,969)Fair value of plan assets � � � � � � � � � � � � � � � � � � � � � � � � � � � � � � � � � � � � � � � � � � � � � � � � � 347,448 346,282
Total � � � � � � � � � � � � � � � � � � � � � � � � � � � � � � � � � � � � � � � � � � � � � � � � � � � � � � � � � � � � � � � ¥ (25,628) ¥ (28,686)Prepaid pension expenses (Note) � � � � � � � � � � � � � � � � � � � � � � � � � � � � � � � � � � � � � � � � � � � � � ¥ 36,826 ¥ 36,049Post-employment benefit liabilities � � � � � � � � � � � � � � � � � � � � � � � � � � � � � � � � � � � � � � � � � � (62,454) (64,736)Note: Prepaid pension expenses are included in “other non-current assets” on the consolidated statements of financial position�
(Corporate pension plan of the Company)The Company’s pension plan is managed through a legally independent entity AGC Corporate Pension Fund (the “Fund”)� The Fund has a Board of Representatives split evenly between representatives selected by the Company and representatives elected by the pension plan members through mutual vote� The representatives elect directors and a controller through mutual vote� After that, the president (the chairman of the Board of Representatives) is selected�
Under the Defined-Benefit Corporate Pension Act, the Company is obligated to make pension contributions to the Fund which provides pension benefits� The directors of the Fund are responsible for faithfully executing operations related to the administration and investment of pension reserves for the Fund in compliance with laws and regulations, any orders issued by the Minister of Health, Labour and Welfare, and the director-generals of Regional Bureaus of Health and Welfare based on laws and regulations, as well as the rules of the Fund and the resolutions of the Board of Representatives� Furthermore, directors are prohibited from engaging in any actions that could hinder proper administration and investment of the pension reserves for the purpose of furthering their own interests or the interests of third parties other than the Fund�
i) Changes in the present value of defined benefit obligations
(Unit: Millions of yen)FY2019
(Jan� 1 through Dec� 31, 2019)
FY2020 (Jan. 1 through Dec. 31, 2020)
As of January 1 � � � � � � � � � � � � � � � � � � � � � � � � � � � � � � � � � � � � � � � � � � � � � � � � � � � � � � � � ¥(363,984) ¥(373,076)Benefits paid by the plan � � � � � � � � � � � � � � � � � � � � � � � � � � � � � � � � � � � � � � � � � � � � � � � � � 16,708 18,098Current service cost � � � � � � � � � � � � � � � � � � � � � � � � � � � � � � � � � � � � � � � � � � � � � � � � � � � � (10,703) (11,341)Interest cost � � � � � � � � � � � � � � � � � � � � � � � � � � � � � � � � � � � � � � � � � � � � � � � � � � � � � � � � � � (4,172) (3,341)Past service cost and settlement � � � � � � � � � � � � � � � � � � � � � � � � � � � � � � � � � � � � � � � � � � � 6,028 (59)Actuarial gains and losses � � � � � � � � � � � � � � � � � � � � � � � � � � � � � � � � � � � � � � � � � � � � � � � � (16,371) (5,914)
Due to changes in demographic assumptions � � � � � � � � � � � � � � � � � � � � � � � � � � � � � � � 83 (4,033)Due to changes in financial assumptions � � � � � � � � � � � � � � � � � � � � � � � � � � � � � � � � � � � (12,700) (739)Others � � � � � � � � � � � � � � � � � � � � � � � � � � � � � � � � � � � � � � � � � � � � � � � � � � � � � � � � � � � � � (3,754) (1,141)
Foreign exchange differences � � � � � � � � � � � � � � � � � � � � � � � � � � � � � � � � � � � � � � � � � � � � � (67) 515Business combinations and disposals � � � � � � � � � � � � � � � � � � � � � � � � � � � � � � � � � � � � � � � (782) (30)Others � � � � � � � � � � � � � � � � � � � � � � � � � � � � � � � � � � � � � � � � � � � � � � � � � � � � � � � � � � � � � � � 268 180As of December 31 � � � � � � � � � � � � � � � � � � � � � � � � � � � � � � � � � � � � � � � � � � � � � � � � � � � � � ¥(373,076) ¥(374,969)
The weighted average duration of defined benefit obligations was mainly 16 years as of December 31, 2019 and 2020, respectively�

AGC Inc. 41
ii) Changes in the fair value of plan assets
(Unit: Millions of yen)FY2019
(Jan� 1 through Dec� 31, 2019)
FY2020 (Jan. 1 through Dec. 31, 2020)
As of January 1 � � � � � � � � � � � � � � � � � � � � � � � � � � � � � � � � � � � � � � � � � � � � � � � � � � � � � � � � ¥302,974 ¥347,448Employer contributions � � � � � � � � � � � � � � � � � � � � � � � � � � � � � � � � � � � � � � � � � � � � � � � � � � 35,336 6,050Employee contributions � � � � � � � � � � � � � � � � � � � � � � � � � � � � � � � � � � � � � � � � � � � � � � � � � � 141 140Benefits paid by the plan � � � � � � � � � � � � � � � � � � � � � � � � � � � � � � � � � � � � � � � � � � � � � � � � � (14,939) (16,507)Interest income(Note) � � � � � � � � � � � � � � � � � � � � � � � � � � � � � � � � � � � � � � � � � � � � � � � � � � � � � 2,591 2,276Settlement � � � � � � � � � � � � � � � � � � � � � � � � � � � � � � � � � � � � � � � � � � � � � � � � � � � � � � � � � � � � (6,183) (15)Income related to plan assets (excluding interest income) � � � � � � � � � � � � � � � � � � � � � � � � 28,154 6,857Foreign exchange differences � � � � � � � � � � � � � � � � � � � � � � � � � � � � � � � � � � � � � � � � � � � � � (801) 202Business combinations and disposals � � � � � � � � � � � � � � � � � � � � � � � � � � � � � � � � � � � � � � � 790 10Others � � � � � � � � � � � � � � � � � � � � � � � � � � � � � � � � � � � � � � � � � � � � � � � � � � � � � � � � � � � � � � � (615) (180)As of December 31 � � � � � � � � � � � � � � � � � � � � � � � � � � � � � � � � � � � � � � � � � � � � � � � � � � � � � ¥347,448 ¥346,282
Note: Interest income is measured as the fair value of plan assets multiplied by the discount rate�
The Group plans to contribute ¥8,703 million to retirement benefit plans during the year ending December 31, 2021�
In accordance with the rules of the Fund, every five years the Company is required to recalculate the amount of pension contribu-tions, with the end of the Fund’s business year set as the record date� This is to maintain the Fund’s financial stability into the future�
In the recalculation process, the Company reviews the base rates related to the pension contributions (assumed interest rate, assumed mortality rate, assumed withdrawal rate, assumed salary increase rate, assumed number of new pension plan members, etc�) in order to re-examine the appropriateness of the pension contributions�
iii) Components of plan assetsPlan assets are invested with the aim of ensuring the sustainability of the defined benefit plans� Plan assets are invested mainly in bonds and equities, and are exposed to market risk in each area� The Group has formulated a policy on risk and return targets for the investment of plan assets� The Group properly monitors investment performance, and regularly reviews this policy, taking into account the funding status and market developments surrounding investments�
The components of plan assets are as follows:
(Unit: Millions of yen)FY2019 (as of December 31, 2019) FY2020 (as of December 31, 2020)
Assets with quoted market
prices in an active market
Assets without quoted market
prices in an active
market (Note) Subtotal
Assets with quoted market
prices in an active market
Assets without quoted market
prices in an active
market (Note) Subtotal
Equity securities � � � � � � � � � � � ¥ 72,573 ¥ 59,360 ¥131,934 ¥ 91,399 ¥ 50,027 ¥141,426Bonds � � � � � � � � � � � � � � � � � � � 53,098 88,223 141,321 65,096 97,352 162,449Others � � � � � � � � � � � � � � � � � � � 3,264 70,927 74,192 3,072 39,334 42,406
Total � � � � � � � � � � � � � � � � � � � ¥128,937 ¥218,511 ¥347,448 ¥159,567 ¥186,714 ¥346,282
Note: Equity securities include privately placed investment trusts that do not have quoted market prices in an active market, and comprise publicly traded shares in Japan and overseas�
Others mainly include cash equivalents and insurance contracts�

Financial Review 202042
iv) Analysis of post-employment benefit expensesAmounts recognized as expenses related to post-employment benefits are as follows:
(Unit: Millions of yen)FY2019
(Jan� 1 through Dec� 31, 2019)
FY2020 (Jan. 1 through Dec. 31, 2020)
Current service cost � � � � � � � � � � � � � � � � � � � � � � � � � � � � � � � � � � � � � � � � � � � � � � � � � � � � ¥(10,703) ¥(11,341)Interest cost � � � � � � � � � � � � � � � � � � � � � � � � � � � � � � � � � � � � � � � � � � � � � � � � � � � � � � � � � � (4,172) (3,341)Interest income � � � � � � � � � � � � � � � � � � � � � � � � � � � � � � � � � � � � � � � � � � � � � � � � � � � � � � � � 2,591 2,276Past service cost and gains or losses on settlement � � � � � � � � � � � � � � � � � � � � � � � � � � � � (154) (74)
Total � � � � � � � � � � � � � � � � � � � � � � � � � � � � � � � � � � � � � � � � � � � � � � � � � � � � � � � � � � � � � � � ¥(12,439) ¥(12,481)
The foregoing expenses are included in “cost of sales,” “selling, general and administrative expenses” and certain other accounts on the consolidated statements of profit or loss�
v) Actuarial assumptionsPrincipal actuarial assumptions as of December 31, 2019 and 2020 are as follows:
FY2019 (as of December 31,
2019)
FY2020 (as of December 31,
2020)
Discount rate (%) � � � � � � � � � � � � � � � � � � � � � � � � � � � � � � � � � � � � � � � � � � � � � � � � � � � � � � � 0�5 0.6
In addition to the above, actuarial assumptions include future salary increases, the mortality rate and the expected retirement rate�
vi) Sensitivity analysis of actuarial assumptionsThe followings are changes in defined benefit obligations that would result from the changes below in the discount rate as of December 31, 2020� This analysis assumes that all other variables are held constant�
(Unit: Millions of yen)FY2020
(as of December 31, 2020)
Discount rate (0�5% increase) � � � � � � � � � � � � � � � � � � � � � � � � � � � � � � � � � � � � � � � � � � � � � � � � � � � � � � � � � � � � � ¥ 25,485Discount rate (0�5% decrease) � � � � � � � � � � � � � � � � � � � � � � � � � � � � � � � � � � � � � � � � � � � � � � � � � � � � � � � � � � � � (28,293)
(2) Defined contribution plansAmounts recognized as expenses related to defined contribution plans are as follows:
(Unit: Millions of yen)FY2019
(Jan� 1 through Dec� 31, 2019)
FY2020 (Jan. 1 through Dec. 31, 2020)
Expenses related to defined contribution plans � � � � � � � � � � � � � � � � � � � � � � � � � � � � � � � � ¥(2,268) ¥(2,348)
The abovementioned expenses are included in “cost of sales” and “selling, general and administrative expenses” on the consolidated statements of profit or loss�
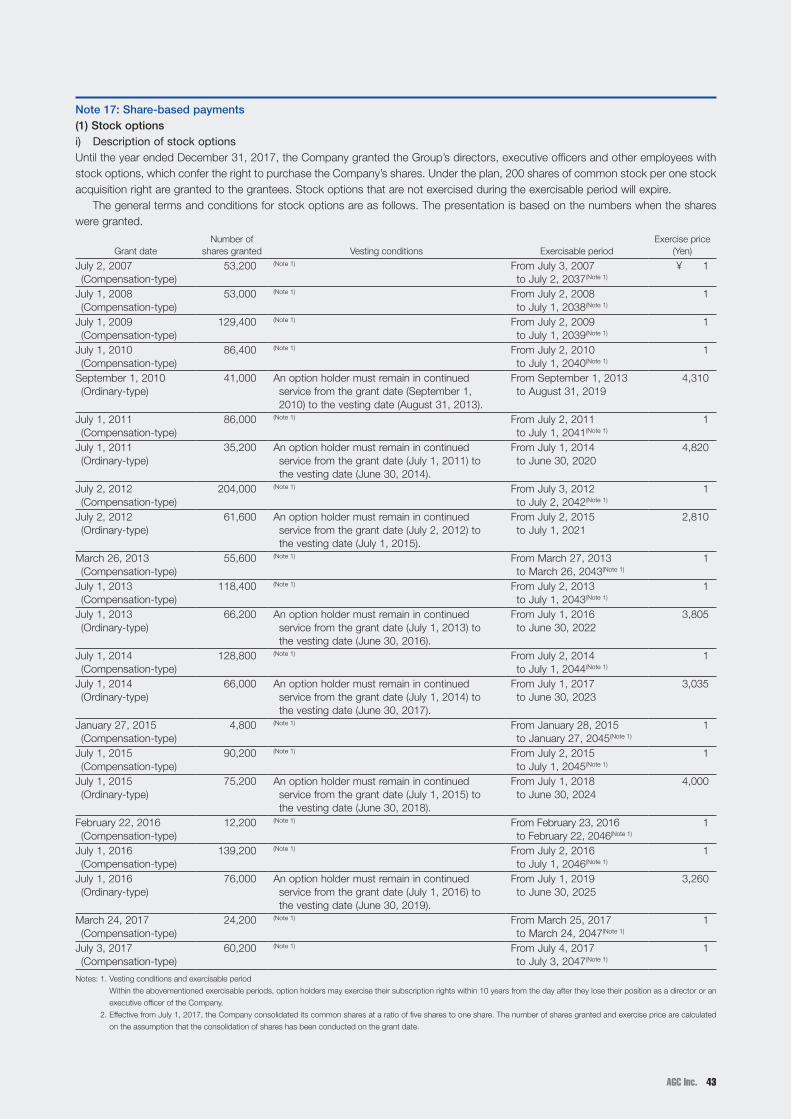
AGC Inc. 43
Note 17: Share-based payments(1) Stock optionsi) Description of stock optionsUntil the year ended December 31, 2017, the Company granted the Group’s directors, executive officers and other employees with stock options, which confer the right to purchase the Company’s shares� Under the plan, 200 shares of common stock per one stock acquisition right are granted to the grantees� Stock options that are not exercised during the exercisable period will expire�
The general terms and conditions for stock options are as follows� The presentation is based on the numbers when the shares were granted�
Grant dateNumber of
shares granted Vesting conditions Exercisable periodExercise price
(Yen)
July 2, 2007 (Compensation-type)
53,200 (Note 1) From July 3, 2007 to July 2, 2037(Note 1)
¥ 1
July 1, 2008 (Compensation-type)
53,000 (Note 1) From July 2, 2008 to July 1, 2038(Note 1)
1
July 1, 2009 (Compensation-type)
129,400 (Note 1) From July 2, 2009 to July 1, 2039(Note 1)
1
July 1, 2010 (Compensation-type)
86,400 (Note 1) From July 2, 2010 to July 1, 2040(Note 1)
1
September 1, 2010 (Ordinary-type)
41,000 An option holder must remain in continued service from the grant date (September 1, 2010) to the vesting date (August 31, 2013)�
From September 1, 2013 to August 31, 2019
4,310
July 1, 2011 (Compensation-type)
86,000 (Note 1) From July 2, 2011 to July 1, 2041(Note 1)
1
July 1, 2011 (Ordinary-type)
35,200 An option holder must remain in continued service from the grant date (July 1, 2011) to the vesting date (June 30, 2014)�
From July 1, 2014 to June 30, 2020
4,820
July 2, 2012 (Compensation-type)
204,000 (Note 1) From July 3, 2012 to July 2, 2042(Note 1)
1
July 2, 2012 (Ordinary-type)
61,600 An option holder must remain in continued service from the grant date (July 2, 2012) to the vesting date (July 1, 2015)�
From July 2, 2015 to July 1, 2021
2,810
March 26, 2013 (Compensation-type)
55,600 (Note 1) From March 27, 2013 to March 26, 2043(Note 1)
1
July 1, 2013 (Compensation-type)
118,400 (Note 1) From July 2, 2013 to July 1, 2043(Note 1)
1
July 1, 2013 (Ordinary-type)
66,200 An option holder must remain in continued service from the grant date (July 1, 2013) to the vesting date (June 30, 2016)�
From July 1, 2016 to June 30, 2022
3,805
July 1, 2014 (Compensation-type)
128,800 (Note 1) From July 2, 2014 to July 1, 2044(Note 1)
1
July 1, 2014 (Ordinary-type)
66,000 An option holder must remain in continued service from the grant date (July 1, 2014) to the vesting date (June 30, 2017)�
From July 1, 2017 to June 30, 2023
3,035
January 27, 2015 (Compensation-type)
4,800 (Note 1) From January 28, 2015 to January 27, 2045(Note 1)
1
July 1, 2015 (Compensation-type)
90,200 (Note 1) From July 2, 2015 to July 1, 2045(Note 1)
1
July 1, 2015 (Ordinary-type)
75,200 An option holder must remain in continued service from the grant date (July 1, 2015) to the vesting date (June 30, 2018)�
From July 1, 2018 to June 30, 2024
4,000
February 22, 2016 (Compensation-type)
12,200 (Note 1) From February 23, 2016 to February 22, 2046(Note 1)
1
July 1, 2016 (Compensation-type)
139,200 (Note 1) From July 2, 2016 to July 1, 2046(Note 1)
1
July 1, 2016 (Ordinary-type)
76,000 An option holder must remain in continued service from the grant date (July 1, 2016) to the vesting date (June 30, 2019)�
From July 1, 2019 to June 30, 2025
3,260
March 24, 2017 (Compensation-type)
24,200 (Note 1) From March 25, 2017 to March 24, 2047(Note 1)
1
July 3, 2017 (Compensation-type)
60,200 (Note 1) From July 4, 2017 to July 3, 2047(Note 1)
1
Notes: 1� Vesting conditions and exercisable period
Within the abovementioned exercisable periods, option holders may exercise their subscription rights within 10 years from the day after they lose their position as a director or an
executive officer of the Company�
2� Effective from July 1, 2017, the Company consolidated its common shares at a ratio of five shares to one share� The number of shares granted and exercise price are calculated
on the assumption that the consolidation of shares has been conducted on the grant date�

Financial Review 202044
ii) Number and average exercise price of stock optionsThe number and weighted average exercise prices of stock options granted during the period are as follows� The number of stock options is shown after conversion into the number of shares�
FY2019 (Jan� 1 through Dec� 31, 2019) FY2020 (Jan. 1 through Dec. 31, 2020)
Number (Shares) Weighted average exercise price (Yen) Number (Shares)
Weighted average exercise price (Yen)
Outstanding as of January 1 � � � � � � � � � � � � � 1,333,200 ¥ 932 1,219,000 ¥ 882Granted during the period � � � � � � � � � � � � � � � — — — —Forfeited during the period � � � � � � � � � � � � � � 2,800 3,970 1,600 3,903Exercised during the period � � � � � � � � � � � � � � 78,400 173 61,400 91Expired during the period � � � � � � � � � � � � � � � 33,000 4,310 34,400 4,820Outstanding as of December 31 � � � � � � � � � � 1,219,000 ¥ 882 1,121,600 ¥ 800
Exercisable as of December 31 � � � � � � � � � � � 1,219,000 ¥ 882 1,121,600 ¥ 800
The weighted average remaining contractual period was 18�9 years and 18�3 years as of December 31, 2019 and 2020, respectively�
The weighted average share price on the exercise dates of stock options exercised in the years ended December 31, 2019 and 2020 were ¥3,593 and ¥3,115, respectively�
iii) Fair value of stock optionsThere were no stock options granted during the years ended December 31, 2019 and 2020�
iv) Equity-settled share-based payment transactions for which IFRS 2 is not appliedOut of the description in i) above, due to optional exemptions by IFRS 1, details of stock options for which IFRS 2 has not been applied are as follows:
Grant dateNumber of
shares granted Vesting conditions Exercisable periodExercise price
(Yen)
July 2, 2007 (Compensation-type) 53,200 (Note 1) From July 3, 2007 to July 2, 2037(Note 1) ¥1July 1, 2008 (Compensation-type) 53,000 (Note 1) From July 2, 2008 to July 1, 2038(Note 1) 1July 1, 2009 (Compensation-type) 129,400 (Note 1) From July 2, 2009 to July 1, 2039(Note 1) 1July 1, 2010 (Compensation-type) 86,400 (Note 1) From July 2, 2010 to July 1, 2040(Note 1) 1July 1, 2011 (Compensation-type) 86,000 (Note 1) From July 2, 2011 to July 1, 2041(Note 1) 1Notes: 1� Vesting conditions and exercisable period
Within the abovementioned exercisable periods, option holders may exercise their subscription rights within 10 years from the day after they lose their position as a director or an
executive officer of the Company�
2� Effective from July 1, 2017, the Company consolidated its common shares at a ratio of five shares to one share� The number of shares granted is calculated on the assumption that
the consolidation of shares has been conducted on the grant date�
v) Expenses recorded under stock optionsExpenses recorded under stock options were ¥5 million during the year ended December 31, 2019�
These expenses were included in “cost of sales” and “selling, general and administrative expenses” on the consolidated statements of profit or loss� In addition, there were no expenses recorded under the plan during the year ended December 31, 2020, because all the stock options under the plan vested until the year ended December 31, 2019�
(2) Share-based compensation plan that uses a structure called BIP Trusti) Description of share-based compensation plan that uses a structure called BIP TrustThe Company has introduced a plan to its directors and executive officers (excluding non-residents of Japan; hereinafter referred to as “directors, etc�”)� The purpose is to further motivate the contributions to the increase of the Group’s corporate value in medium-to-long-term, and the achievement of performance targets as set out in the medium-term management plan�
In the plan, the BIP Trust acquires the Company’s shares, and delivers the shares and provides the amount of money equivalent to the value of the shares to directors, etc�, based on their positions and the level of achievement of the performance targets and other factors�
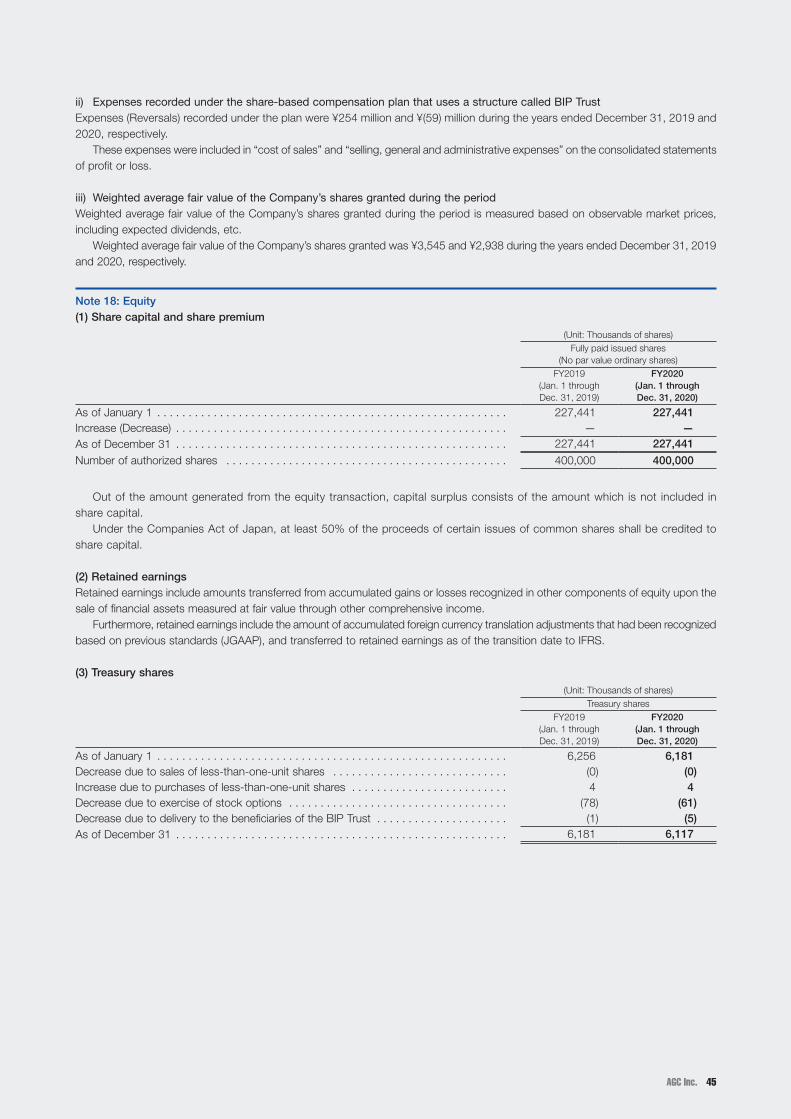
AGC Inc. 45
ii) Expenses recorded under the share-based compensation plan that uses a structure called BIP TrustExpenses (Reversals) recorded under the plan were ¥254 million and ¥(59) million during the years ended December 31, 2019 and 2020, respectively�
These expenses were included in “cost of sales” and “selling, general and administrative expenses” on the consolidated statements of profit or loss�
iii) Weighted average fair value of the Company’s shares granted during the periodWeighted average fair value of the Company’s shares granted during the period is measured based on observable market prices, including expected dividends, etc�
Weighted average fair value of the Company’s shares granted was ¥3,545 and ¥2,938 during the years ended December 31, 2019 and 2020, respectively�
Note 18: Equity(1) Share capital and share premium
(Unit: Thousands of shares)Fully paid issued shares
(No par value ordinary shares)FY2019
(Jan� 1 through Dec� 31, 2019)
FY2020 (Jan. 1 through Dec. 31, 2020)
As of January 1 � � � � � � � � � � � � � � � � � � � � � � � � � � � � � � � � � � � � � � � � � � � � � � � � � � � � � � � � 227,441 227,441Increase (Decrease) � � � � � � � � � � � � � � � � � � � � � � � � � � � � � � � � � � � � � � � � � � � � � � � � � � � � � — —As of December 31 � � � � � � � � � � � � � � � � � � � � � � � � � � � � � � � � � � � � � � � � � � � � � � � � � � � � � 227,441 227,441
Number of authorized shares � � � � � � � � � � � � � � � � � � � � � � � � � � � � � � � � � � � � � � � � � � � � � 400,000 400,000
Out of the amount generated from the equity transaction, capital surplus consists of the amount which is not included in share capital�
Under the Companies Act of Japan, at least 50% of the proceeds of certain issues of common shares shall be credited to share capital�
(2) Retained earningsRetained earnings include amounts transferred from accumulated gains or losses recognized in other components of equity upon the sale of financial assets measured at fair value through other comprehensive income�
Furthermore, retained earnings include the amount of accumulated foreign currency translation adjustments that had been recognized based on previous standards (JGAAP), and transferred to retained earnings as of the transition date to IFRS�
(3) Treasury shares
(Unit: Thousands of shares)Treasury shares
FY2019 (Jan� 1 through Dec� 31, 2019)
FY2020 (Jan. 1 through Dec. 31, 2020)
As of January 1 � � � � � � � � � � � � � � � � � � � � � � � � � � � � � � � � � � � � � � � � � � � � � � � � � � � � � � � � 6,256 6,181Decrease due to sales of less-than-one-unit shares � � � � � � � � � � � � � � � � � � � � � � � � � � � � (0) (0)Increase due to purchases of less-than-one-unit shares � � � � � � � � � � � � � � � � � � � � � � � � � 4 4Decrease due to exercise of stock options � � � � � � � � � � � � � � � � � � � � � � � � � � � � � � � � � � � (78) (61)Decrease due to delivery to the beneficiaries of the BIP Trust � � � � � � � � � � � � � � � � � � � � � (1) (5)As of December 31 � � � � � � � � � � � � � � � � � � � � � � � � � � � � � � � � � � � � � � � � � � � � � � � � � � � � � 6,181 6,117

Financial Review 202046
(4) Other components of equityThe following is a breakdown of other components of equity:
(Unit: Millions of yen)FY2019
(as of December 31, 2019)
FY2020 (as of December 31,
2020)
Remeasurement of the net defined benefit liability (asset) � � � � � � � � � � � � � � � � � � � � � � � � ¥ (31,445) ¥ (31,203)Net gain on revaluation of financial assets measured at FVTOCI � � � � � � � � � � � � � � � � � � � 55,786 51,397Net gain (loss) in fair value of cash flow hedges � � � � � � � � � � � � � � � � � � � � � � � � � � � � � � � � (665) 439Exchange differences on translation of foreign operations � � � � � � � � � � � � � � � � � � � � � � � � 166,833 129,602
Total � � � � � � � � � � � � � � � � � � � � � � � � � � � � � � � � � � � � � � � � � � � � � � � � � � � � � � � � � � � � � � � ¥190,510 ¥150,236
Remeasurement of the net defined benefit liability (asset)Remeasurement of the net defined benefit liability (asset) includes the effects of differences between the actuarial assumptions at the beginning of the period and the actual numbers at the end of the period, and differences between actual income from plan assets and projected interest income from plan assets�
Net gain on revaluation of financial assets measured at FVTOCIThis includes the cumulative amount of net gain (loss) on revaluation of financial assets measured at FVTOCI�
Net gain (loss) in fair value of cash flow hedgesThis is the effective portion of the cumulative amount of the net gain (loss) in fair value of cash flow hedges relating to hedge transac-tions that have not yet been realized�
Exchange differences on translation of foreign operationsThese are foreign currency differences arising from the translation of the financial statements of foreign operations�
(5) DividendsDividends paid during the years ended December 31, 2019 and 2020 are as follows:
(Year ended December 31, 2019)
Date of approval Type of share
Total amount of dividends
(Millions of yen)Dividends per
share (Yen) Record date Effective date
Shareholders’ meeting held on March 28, 2019 � � � � Ordinary shares ¥13,289 ¥60�00 December 31, 2018 March 29, 2019
Board of Directors meeting held on July 30, 2019 � � � � � � � � � � Ordinary shares 13,292 60�00 June 30, 2019 September 6, 2019
Notes 1: The year end dividend based on the resolution of the Shareholders’ meeting held on March 28, 2019 includes dividend payment of ¥18 million paid for the shares held by the BIP Trust�
2: The interim dividend based on the resolution of the Board of Directors meeting held on July 30, 2019 includes dividend payment of ¥18 million paid for the shares held by the BIP Trust�
(Year ended December 31, 2020)
Date of approval Type of share
Total amount of dividends
(Millions of yen)Dividends per
share (Yen) Record date Effective date
Shareholders’ meeting held on March 27, 2020 � � � � Ordinary shares ¥13,294 ¥60.00 December 31, 2019 March 30, 2020
Board of Directors meeting held on July 31, 2020 � � � � � � � � � � Ordinary shares 13,296 60.00 June 30, 2020 September 8, 2020
Notes 1: The year end dividend based on the resolution of the Shareholders’ meeting held on March 27, 2020 includes dividend payment of ¥18 million paid for the shares held by the BIP Trust�
2: The interim dividend based on the resolution of the Board of Directors meeting held on July 31, 2020 includes dividend payment of ¥18 million paid for the shares held by the BIP Trust�

AGC Inc. 47
Dividends for which the effective date falls in the period subsequent to the fiscal year are as follows:
(Year ended December 31, 2019)
Date of approval Type of share
Total amount of dividends
(Millions of yen)Dividends per
share (Yen) Record date Effective date
Shareholders’ meeting held on March 27, 2020 � � � Ordinary shares ¥13,294 ¥60�00 December 31, 2019 March 30, 2020
Note: Total amount of dividends includes dividend payment of ¥18 million paid for the shares held by the BIP Trust�
(Year ended December 31, 2020)
Date of approval Type of share
Total amount of dividends
(Millions of yen)Dividends per
share (Yen) Record date Effective date
Shareholders’ meeting held on March 30, 2021 � � � Ordinary shares ¥13,297 ¥60.00 December 31, 2020 March 31, 2021
Note: Total amount of dividends includes dividend payment of ¥18 million paid for the shares held by the BIP Trust�
Note 19: Other comprehensive incomeChanges in other comprehensive income during the years ended December 31, 2019 and 2020 are as follows:
(Unit: Millions of yen)FY2019
(Jan� 1 through Dec� 31, 2019)FY2020
(Jan. 1 through Dec. 31, 2020)Before
tax effects Tax effects Net amountBefore
tax effects Tax effects Net amount
Remeasurement of the net defined benefit liability (asset) � � � � � � � � � � � � � � � � � � � � � � � � � � � ¥11,782 ¥(5,080) ¥ 6,702 ¥ 943 ¥ (985) ¥ (41)
Financial assets measured at FVTOCI � � � � � � � � � 8,879 (3,034) 5,844 (4,644) 1,386 (3,258)Net gain (loss) in fair value of cash flow hedges � � � (1,085) 273 (811) 1,572 (398) 1,173Exchange differences on translation of foreign operations � � � � � � � � � � � � � � � � � � � � � � � (5,252) (704) (5,956) (42,324) (25) (42,349)
Share of other comprehensive income of associates and joint ventures accounted for using equity method � � � � � � � � � � � � � � � � � � � � � (799) (0) (799) (2) 0 (2)Total � � � � � � � � � � � � � � � � � � � � � � � � � � � � � � � � � ¥13,525 ¥(8,544) ¥ 4,980 ¥(44,456) ¥ (22) ¥(44,478)
During the year ended December 31, 2019, the reclassification adjustments of exchange differences on translation of foreign operations were ¥(625) million (before tax effects) and ¥220 million (tax effects)� During the year ended December 31, 2020, there were no reclassification adjustments of exchange differences on translation of foreign operations�
Amounts attributable to non-controlling interests are as follows:
(Unit: Millions of yen)FY2019
(Jan� 1 through Dec� 31, 2019)FY2020
(Jan. 1 through Dec. 31, 2020)Before tax
effects Tax effects Net amountBefore
tax effects Tax effects Net amount
Remeasurement of the net defined benefit liability (asset) � � � � � � � � � � � � � � � � � � � � � � � � � � � ¥ (454) ¥61 ¥ (393) ¥ (305) ¥ 21 ¥ (283)
Financial assets measured at FVTOCI � � � � � � � � � 3 (1) 2 (5) 1 (3)Net gain (loss) in fair value of cash flow hedges � � � (59) 16 (42) 96 (28) 68Exchange differences on translation of foreign operations � � � � � � � � � � � � � � � � � � � � � � � 1,609 — 1,609 (5,117) — (5,117)Total � � � � � � � � � � � � � � � � � � � � � � � � � � � � � � � � � ¥1,099 ¥76 ¥1,175 ¥(5,331) ¥ (5) ¥(5,336)

Financial Review 202048
Note 20: Revenue(1) Disaggregation of revenueAs disclosed in Note 4 “Segment information,” the Group has three reportable segments: Glass, Electronics, and Chemicals� In addition, sales are disaggregated by product groups and geographical segments� The reconciliations of the disaggregated revenue with the Group’s sales components are as follows�
i) Disaggregation by product groups
(Unit: Millions of yen)
FY2019 (Jan� 1 through Dec� 31, 2019)
FY2020 (Jan. 1 through Dec. 31, 2020)
Glass Building & Industrial glass � � � � � � � � � � � � � � � � � � � � � � � � � ¥ 352,659 ¥ 324,875
Automotive glass � � � � � � � � � � � � � � � � � � � � � � � � � � � � � � � � 388,261 323,519
Subtotal � � � � � � � � � � � � � � � � � � � � � � � � � � � � � � � � � � � � � � � 740,920 648,394
Electronics Display � � � � � � � � � � � � � � � � � � � � � � � � � � � � � � � � � � � � � � � 174,716 177,225
Electronics materials � � � � � � � � � � � � � � � � � � � � � � � � � � � � � 90,498 105,799
Subtotal � � � � � � � � � � � � � � � � � � � � � � � � � � � � � � � � � � � � � � � 265,215 283,025
Chemicals Chlor-alkali & urethane � � � � � � � � � � � � � � � � � � � � � � � � � � � � 292,766 264,087
Fluorochemical & specialty � � � � � � � � � � � � � � � � � � � � � � � � 119,919 105,710
Life science � � � � � � � � � � � � � � � � � � � � � � � � � � � � � � � � � � � � 61,731 79,941
Subtotal � � � � � � � � � � � � � � � � � � � � � � � � � � � � � � � � � � � � � � � 474,417 449,739
Ceramics/Others � � � � � � � � � � � � � � � � � � � � � � � � � � � � � � � � � � � � � � � � � � � � � � � � � � � � � � � � 37,485 31,145
Total � � � � � � � � � � � � � � � � � � � � � � � � � � � � � � � � � � � � � � � � � � � � � � � � � � � � � � � � � � � � � � � � ¥1,518,039 ¥1,412,306
ii) Disaggregation by geographical segmentsFY2019 (Jan� 1 through Dec� 31, 2019)
(Unit: Millions of yen)Glass Electronics Chemicals Ceramics/Others Total
Japan/Asia � � � � � � � � � � � � � ¥329,036 ¥245,151 ¥394,994 ¥37,485 ¥1,006,667America � � � � � � � � � � � � � � � � 116,497 19,167 36,964 — 172,629Europe � � � � � � � � � � � � � � � � 295,387 895 42,458 — 338,741
Total � � � � � � � � � � � � � � � � � ¥740,920 ¥265,215 ¥474,417 ¥37,485 ¥1,518,039
Note: Sales by region are based on the location of each company, and “Brazil” is included in “America�”
FY2020 (Jan. 1 through Dec. 31, 2020)
(Unit: Millions of yen)Glass Electronics Chemicals Ceramics/Others Total
Japan/Asia � � � � � � � � � � � � � ¥293,130 ¥258,735 ¥362,276 ¥31,145 ¥ 945,288America � � � � � � � � � � � � � � � � 100,215 23,237 31,079 — 154,532Europe � � � � � � � � � � � � � � � � 255,048 1,052 56,383 — 312,485
Total � � � � � � � � � � � � � � � � � ¥648,394 ¥283,025 ¥449,739 ¥31,145 ¥1,412,306
Note: Sales by region are based on the location of each company, and “Brazil” is included in “America�”
In the Glass segment, the Group sells architectural glass and automotive glass and delivers and installs related products, etc� Main customers are domestic and overseas housing, building and automotive companies�
In the Electronics segment, the Group delivers glass for display such as LCD glass, optoelectronics materials, semiconductor-related products, etc� Main customers are domestic and overseas panel manufactures and electronics companies�
In the Chemicals segment, the Group delivers chlor-alkali & urethane, fluorochemical & specialty chemicals, and life science products, etc� and sells products worldwide through trading companies and the Group’s sales companies�
These are accounted for in accordance with the accounting policy described in Note 3 “Significant accounting policies�” The consideration for performance obligations is mainly recovered within one year after performance obligations are satisfied� In addition, the consideration for performance obligations does not include a significant financing component�

AGC Inc. 49
(2) Contract balancesInformation on contract assets and liabilities arising from contracts with customers is as follows:
(Unit: Millions of yen)FY2019
(as of December 31, 2019)
FY2020 (as of December 31,
2020)
Contract Assets � � � � � � � � � � � � � � � � � � � � � � � � � � � � � � � � � � � � � � � � � � � � � � � � � � � � � � � ¥ 1,068 ¥ 946Contract Liabilities � � � � � � � � � � � � � � � � � � � � � � � � � � � � � � � � � � � � � � � � � � � � � � � � � � � � � � 17,159 39,086
Contract assets primarily relate to the Group’s rights to receive consideration for performance obligations that have been com-pleted, but not yet billed for, as of the reporting date� Contract assets are reclassified as receivables when the Group’s right to payment becomes unconditional�
Contract liabilities mainly relate to consideration received from customers before the Group delivers products to them, based on receivables management and other considerations� There are no significant amounts of revenue from the balance of contract liabilities as of January 1, 2020, the beginning of the fiscal year under review, that the Group will recognize in the following fiscal year onward� There are no significant amounts of revenue recognized during the year ended December 31, 2020 from performance obligations satisfied in the prior fiscal year�
(3) Transaction price allocated to the remaining performance obligationsThe Group applies the practical expedients for exemption on disclosure of information on remaining performance obligations that have original expected duration of one year or less� The Group has no significant transactions with original expected duration exceeding one year� In addition, there are no significant amounts in consideration from contracts with customers that are not included in transac-tion prices�
(4) Assets recognized from the costs of obtaining or fulfilling contracts with customersThere are no assets recognized from the costs of obtaining or fulfilling contracts with customers as of the year ended December 31, 2020� In addition, if the amortization period of the assets that the Group otherwise would have recognized is one year or less, the Group applies the practical expedient of recognizing the incremental costs of obtaining the contract as an expense when incurred�
Note 21: Classification of expenses by natureThe classification of expenses by nature and reconciliation with business profit are as follows:
(Unit: Millions of yen)FY2019
(Jan� 1 through Dec� 31, 2019)
FY2020 (Jan. 1 through Dec. 31, 2020)
Net sales � � � � � � � � � � � � � � � � � � � � � � � � � � � � � � � � � � � � � � � � � � � � � � � � � � � � � � � � � � � � � ¥1,518,039 ¥1,412,306Personnel expenses � � � � � � � � � � � � � � � � � � � � � � � � � � � � � � � � � � � � � � � � � � � � � � � � � � � � � (314,806) (304,949)Depreciation and amortization � � � � � � � � � � � � � � � � � � � � � � � � � � � � � � � � � � � � � � � � � � � � � (143,361) (143,716)Others � � � � � � � � � � � � � � � � � � � � � � � � � � � � � � � � � � � � � � � � � � � � � � � � � � � � � � � � � � � � � � � (958,246) (887,859)Operating profit � � � � � � � � � � � � � � � � � � � � � � � � � � � � � � � � � � � � � � � � � � � � � � � � � � � � � � � � 101,624 75,780Foreign exchange gain � � � � � � � � � � � � � � � � � � � � � � � � � � � � � � � � � � � � � � � � � � � � � � � � � � � 5,983 3,608Gains on sale of non-current assets � � � � � � � � � � � � � � � � � � � � � � � � � � � � � � � � � � � � � � � � � 2,241 516Reversal of provisions for restructuring programs � � � � � � � � � � � � � � � � � � � � � � � � � � � � � � � 805 589Others � � � � � � � � � � � � � � � � � � � � � � � � � � � � � � � � � � � � � � � � � � � � � � � � � � � � � � � � � � � � � � � 3,713 2,028Other income � � � � � � � � � � � � � � � � � � � � � � � � � � � � � � � � � � � � � � � � � � � � � � � � � � � � � � � � � � 12,743 6,743Losses on disposal of non-current assets � � � � � � � � � � � � � � � � � � � � � � � � � � � � � � � � � � � � (4,705) (9,894)Impairment loss � � � � � � � � � � � � � � � � � � � � � � � � � � � � � � � � � � � � � � � � � � � � � � � � � � � � � � � � (24,454) (1,213)Expenses for restructuring programs � � � � � � � � � � � � � � � � � � � � � � � � � � � � � � � � � � � � � � � � (6,492) (7,951)Others � � � � � � � � � � � � � � � � � � � � � � � � � � � � � � � � � � � � � � � � � � � � � � � � � � � � � � � � � � � � � � � (2,713) (3,752)Other expenses � � � � � � � � � � � � � � � � � � � � � � � � � � � � � � � � � � � � � � � � � � � � � � � � � � � � � � � � (38,365) (22,812)Business profit � � � � � � � � � � � � � � � � � � � � � � � � � � � � � � � � � � � � � � � � � � � � � � � � � � � � � � � � � ¥ 76,002 ¥ 59,711
The total amounts of research and development expenses were ¥47,450 million and ¥46,444 million during the years ended December 31, 2019 and 2020, respectively�
The total amount of impairment losses included in expenses for restructuring programs was ¥450 million and ¥130 million during the years ended December 31, 2019 and 2020 respectively�
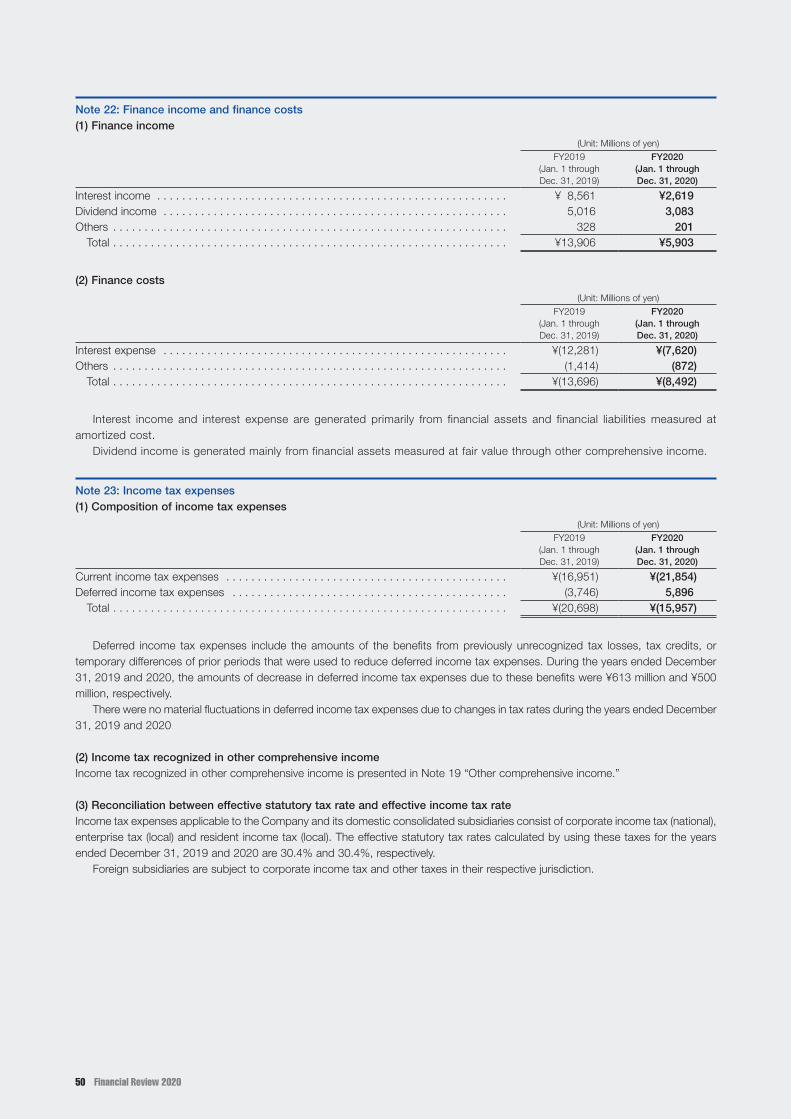
Financial Review 202050
Note 22: Finance income and finance costs(1) Finance income
(Unit: Millions of yen)FY2019
(Jan� 1 through Dec� 31, 2019)
FY2020 (Jan. 1 through Dec. 31, 2020)
Interest income � � � � � � � � � � � � � � � � � � � � � � � � � � � � � � � � � � � � � � � � � � � � � � � � � � � � � � � � ¥ 8,561 ¥2,619Dividend income � � � � � � � � � � � � � � � � � � � � � � � � � � � � � � � � � � � � � � � � � � � � � � � � � � � � � � � 5,016 3,083Others � � � � � � � � � � � � � � � � � � � � � � � � � � � � � � � � � � � � � � � � � � � � � � � � � � � � � � � � � � � � � � � 328 201
Total � � � � � � � � � � � � � � � � � � � � � � � � � � � � � � � � � � � � � � � � � � � � � � � � � � � � � � � � � � � � � � � ¥13,906 ¥5,903
(2) Finance costs
(Unit: Millions of yen)FY2019
(Jan� 1 through Dec� 31, 2019)
FY2020 (Jan. 1 through Dec. 31, 2020)
Interest expense � � � � � � � � � � � � � � � � � � � � � � � � � � � � � � � � � � � � � � � � � � � � � � � � � � � � � � � ¥(12,281) ¥(7,620)Others � � � � � � � � � � � � � � � � � � � � � � � � � � � � � � � � � � � � � � � � � � � � � � � � � � � � � � � � � � � � � � � (1,414) (872)
Total � � � � � � � � � � � � � � � � � � � � � � � � � � � � � � � � � � � � � � � � � � � � � � � � � � � � � � � � � � � � � � � ¥(13,696) ¥(8,492)
Interest income and interest expense are generated primarily from financial assets and financial liabilities measured at amortized cost�
Dividend income is generated mainly from financial assets measured at fair value through other comprehensive income�
Note 23: Income tax expenses(1) Composition of income tax expenses
(Unit: Millions of yen)FY2019
(Jan� 1 through Dec� 31, 2019)
FY2020 (Jan. 1 through Dec. 31, 2020)
Current income tax expenses � � � � � � � � � � � � � � � � � � � � � � � � � � � � � � � � � � � � � � � � � � � � � ¥(16,951) ¥(21,854)Deferred income tax expenses � � � � � � � � � � � � � � � � � � � � � � � � � � � � � � � � � � � � � � � � � � � � (3,746) 5,896
Total � � � � � � � � � � � � � � � � � � � � � � � � � � � � � � � � � � � � � � � � � � � � � � � � � � � � � � � � � � � � � � � ¥(20,698) ¥(15,957)
Deferred income tax expenses include the amounts of the benefits from previously unrecognized tax losses, tax credits, or temporary differences of prior periods that were used to reduce deferred income tax expenses� During the years ended December 31, 2019 and 2020, the amounts of decrease in deferred income tax expenses due to these benefits were ¥613 million and ¥500 million, respectively�
There were no material fluctuations in deferred income tax expenses due to changes in tax rates during the years ended December 31, 2019 and 2020
(2) Income tax recognized in other comprehensive incomeIncome tax recognized in other comprehensive income is presented in Note 19 “Other comprehensive income�”
(3) Reconciliation between effective statutory tax rate and effective income tax rateIncome tax expenses applicable to the Company and its domestic consolidated subsidiaries consist of corporate income tax (national), enterprise tax (local) and resident income tax (local)� The effective statutory tax rates calculated by using these taxes for the years ended December 31, 2019 and 2020 are 30�4% and 30�4%, respectively�
Foreign subsidiaries are subject to corporate income tax and other taxes in their respective jurisdiction�

AGC Inc. 51
The following is a reconciliation between the effective statutory tax rates and the effective income tax rates for corporate income tax expenses appearing on the consolidated statements of profit or loss�
FY2019 (Jan� 1 through Dec� 31, 2019)
FY2020 (Jan. 1 through Dec. 31, 2020)
Effective statutory tax rate of the Company � � � � � � � � � � � � � � � � � � � � � � � � � � � � � � � � � � � 30�4% 30.4%Entertainment expenses, etc�, nondeductible � � � � � � � � � � � � � � � � � � � � � � � � � � � � � � � � � 0�9 1.4Dividend income, not taxable � � � � � � � � � � � � � � � � � � � � � � � � � � � � � � � � � � � � � � � � � � � � � (1�4) (2.1)Difference in tax rates applied to foreign subsidiaries � � � � � � � � � � � � � � � � � � � � � � � � � � � � (4�0) (7.1)Changes in unrecognized temporary differences � � � � � � � � � � � � � � � � � � � � � � � � � � � � � � � 0�9 6.3Others � � � � � � � � � � � � � � � � � � � � � � � � � � � � � � � � � � � � � � � � � � � � � � � � � � � � � � � � � � � � � � � 0�4 (1.0)
Effective income tax rate after tax effect accounting applied � � � � � � � � � � � � � � � � � � � � 27�2% 27.9%
Note 24: Earnings per share(1) Basic earnings per shareBasic earnings per share and the basis for calculating basic earnings per share are as follows:
FY2019 (Jan� 1 through Dec� 31, 2019)
FY2020 (Jan. 1 through Dec. 31, 2020)
Profit for the year attributable to owners of the parent (Millions of yen) � � � � � � � � � � � � � � ¥ 44,434 ¥ 32,715Weighted average number of ordinary shares outstanding (Thousands of shares) � � � � � � 221,232 221,297Basic earnings per share (Yen) � � � � � � � � � � � � � � � � � � � � � � � � � � � � � � � � � � � � � � � � � � � � ¥ 200�85 ¥ 147.84
(2) Diluted earnings per shareDiluted earnings per share and the basis for calculating diluted earnings per share are as follows:
FY2019 (Jan� 1 through Dec� 31, 2019)
FY2020 (Jan. 1 through Dec. 31, 2020)
Profit for the year attributable to owners of the parent (Millions of yen) � � � � � � � � � � � � � � ¥44,434 ¥32,715Adjustments to profit or loss used to calculate diluted earnings per share (Millions of yen) � � � � � � � � � � � � � � � � � � � � � � � � � � � � � � � � � � � � � � � � � � � � � � � � � � � � � � � — —
Profit or loss used to calculate diluted earnings per share (Millions of yen) � � � � � � � � � � � ¥44,434 ¥32,715
Weighted average number of ordinary shares outstanding (Thousands of shares) � � � � � � 221,232 221,297Effects of dilutive potential ordinary shares
Stock options based on subscription rights (Thousands of shares) � � � � � � � � � � � � � � � 994 895Diluted weighted average number of ordinary shares outstanding (Thousands of shares) � � � 222,226 222,193
Diluted earnings per share (Yen) � � � � � � � � � � � � � � � � � � � � � � � � � � � � � � � � � � � � � � � � � � � ¥199�95 ¥147.24
Note 25: Financial instruments(1) Capital managementThe Group has adopted return on equity attributable to owners of the parent (ROE) and the debt-to-equity ratio (ratio of interest-bearing debt to equity) as its financial targets� The Group aims to attain those financial targets by improving not only profits but also the asset turnover ratio�
(2) Credit riskCredit risk is the risk of financial losses to the Group if a counterparty to a financial instrument fails to meet its contractual obligations�
Trade and other receivables including notes receivables, accounts receivables, and other financial assets are exposed to customer credit risks� To manage these risks, each Group company performs due date controls and balance controls for each customer, and identifies and mitigates risks regarding the collection of receivables caused by factors such as deterioration of financial conditions at an early stage, in accordance with each Group entity’s credit management rules�
In its derivative transactions, the Group uses only creditworthy financial institutions to reduce its credit risks�The total carrying amount of financial assets represents the maximum amount of exposure to credit risk�

Financial Review 202052
i) Credit risk exposureAn analysis of the aging of trade receivables, other receivables and other financial assets is as follows:
FY2019 (as of Dec. 31, 2019)
(Unit: Millions of yen)FY2019 (as of Dec� 31, 2019)
Financial assets of which 12-month
expected credit losses are measured
as allowance for doubtful accounts
Financial assets of which lifetime expected credit losses are measured as allowance for doubtful accounts
Total
Financial assets whose credit risk increased
significantly since initial recognition
Financial assets of which expected credit
losses are always measured at their expected lifetime as allowance for
doubtful accounts
Not past due � � � � � � � � � � � � � � � � � � � � � � � � � � � ¥27,085 ¥ — ¥248,540 ¥275,626Past due not later than 30 days � � � � � � � � � � � � 155 — 11,004 11,159Past due over 30 days but within 90 days � � � � � — 187 3,916 4,103Past due over 90 days � � � � � � � � � � � � � � � � � � � — 5,315 5,798 11,114
Total � � � � � � � � � � � � � � � � � � � � � � � � � � � � � � � � ¥27,241 ¥5,502 ¥269,260 ¥302,004
FY2020 (as of Dec. 31, 2020)
(Unit: Millions of yen)FY2020 (as of Dec. 31, 2020)
Financial assets of which 12-month
expected credit losses are measured
as allowance for doubtful accounts
Financial assets of which lifetime expected credit losses are measured as allowance for doubtful accounts
Total
Financial assets whose credit risk increased
significantly since initial recognition
Financial assets of which expected credit
losses are always measured at their expected lifetime as allowance for
doubtful accounts
Not past due � � � � � � � � � � � � � � � � � � � � � � � � � � � ¥36,412 ¥ — ¥255,542 ¥291,955Past due not later than 30 days � � � � � � � � � � � � 26 — 10,266 10,292Past due over 30 days but within 90 days � � � � � — 12 1,946 1,958Past due over 90 days � � � � � � � � � � � � � � � � � � � — 5,433 3,795 9,228
Total � � � � � � � � � � � � � � � � � � � � � � � � � � � � � � � � ¥36,438 ¥5,446 ¥271,551 ¥313,435
ii) Allowance for doubtful debtsChanges in the allowance account for credit losses on trade receivables, other receivables and other financial assets are as follows:
There was no significant increase or decrease in gross carrying amount of the financial instruments which contributed to changes in the allowance account for credit losses during the year ended December 31, 2020�
FY2019 (Jan� 1 through Dec� 31, 2019)
(Unit: Millions of yen)FY2019 (Jan� 1 through Dec� 31, 2019)
12-month expected credit losses
Lifetime expected credit losses
Total
Financial assets whose credit risk increased
significantly since initial recognition
Financial assets of which expected credit
losses are always measured at their expected lifetime as allowance for
doubtful accounts
As of January 1 � � � � � � � � � � � � � � � � � � � � � � � � � � � ¥ 516 ¥3,019 ¥4,182 ¥7,717Write-off � � � � � � � � � � � � � � � � � � � � � � � � � � � � � � � � — — (795) (795)Remeasurements � � � � � � � � � � � � � � � � � � � � � � � � � (270) 104 133 (32)Others � � � � � � � � � � � � � � � � � � � � � � � � � � � � � � � � � � — — 7 7As of December 31 � � � � � � � � � � � � � � � � � � � � � � � ¥ 246 ¥3,123 ¥3,527 ¥6,897

AGC Inc. 53
FY2020 (Jan. 1 through Dec. 31, 2020)
(Unit: Millions of yen)FY2020 (Jan. 1 through Dec. 31, 2020)
12-month expected credit losses
Lifetime expected credit losses
Total
Financial assets whose credit risk increased
significantly since initial recognition
Financial assets of which expected credit
losses are always measured at their expected lifetime as allowance for
doubtful accounts
As of January 1 � � � � � � � � � � � � � � � � � � � � � � � � � � � ¥246 ¥3,123 ¥3,527 ¥6,897Write-off � � � � � � � � � � � � � � � � � � � � � � � � � � � � � � � � (0) — (741) (742)Remeasurements � � � � � � � � � � � � � � � � � � � � � � � � � 26 471 1,161 1,660Others � � � � � � � � � � � � � � � � � � � � � � � � � � � � � � � � � � — — 0 0As of December 31 � � � � � � � � � � � � � � � � � � � � � � � ¥272 ¥3,595 ¥3,948 ¥7,815
(3) Liquidity riskLiquidity risk is the risk that the Group will encounter difficulty in discharging its financial liabilities using cash or other financial assets�
Financial liabilities such as loans and corporate bonds are exposed to liquidity risks� The Group manages these risks by diversifying fund procurement methods, establishing commitment lines with various financial institutions, and keeping an appropriate balance between direct and indirect fund procurements and a proper mixture of short-term and long-term loans and bonds�
An analysis of the contractual maturities of financial liabilities is as follows:
(Unit: Millions of yen)FY2019 (as of December 31, 2019)
Carrying amount
Contractual cash flows
Due within one year or less
Due between one year
and two years
Due between two years
and three years
Due between
three years and
four years
Due between four years
and five years
Due after five years
Non-derivative financial liabilitiesLoans payable � � � � � � � � � � ¥463,978 ¥479,554 ¥127,720 ¥80,147 ¥ 85,202 ¥52,208 ¥57,319 ¥ 76,955Commercial paper � � � � � � � 24,594 24,691 24,691 — — — — —Corporate bonds � � � � � � � � 59,859 61,431 309 309 309 20,208 108 40,188Finance lease liabilities � � � � 54,409 68,701 12,352 8,544 6,716 5,835 7,542 27,710Total interest-bearing debt � � 602,843 634,378 165,073 89,000 92,228 78,252 64,969 144,854Others(Note) � � � � � � � � � � � � � 266,065 266,635 256,115 1,631 8,888 — — —
Total � � � � � � � � � � � � � � � � ¥868,908 ¥901,014 ¥421,189 ¥90,632 ¥101,116 ¥78,252 ¥64,969 ¥144,854
Note: Others consist of “trade payables,” “other payables” and “other non-current liabilities�”
Carrying amount
Contractual cash flows
Due within one year
Due after one year
Derivative financial liabilitiesForeign exchange contracts � � � � � � � � � � � � � ¥1,075 ¥1,075 ¥1,049 ¥ 26
Interest rate contracts � � � � 819 786 403 383Commodity contracts � � � � 943 943 931 11
Total � � � � � � � � � � � � � � � � ¥2,837 ¥2,804 ¥2,383 ¥420

Financial Review 202054
(Unit: Millions of yen)FY2020 (as of December 31, 2020)
Carrying amount
Contractual cash flows
Due within one year or less
Due between one year
and two years
Due between two years
and three years
Due between
three years and
four years
Due between four years
and five years
Due after five years
Non-derivative financial liabilitiesLoans payable � � � � � � � � � � ¥ 651,207 ¥ 663,249 ¥181,570 ¥ 92,539 ¥ 85,898 ¥81,803 ¥69,973 ¥151,464Commercial paper � � � � � � � 4,654 4,669 4,669 — — — — —Corporate bonds � � � � � � � � 59,885 61,323 309 309 20,309 208 20,100 20,087Finance lease liabilities � � � � 72,213 90,244 12,500 10,844 9,384 8,610 7,703 41,200Total interest-bearing debt � � 787,960 819,486 199,048 103,693 115,592 90,623 97,777 212,752Others(Note) � � � � � � � � � � � � � 293,530 294,137 275,254 18,883 — — — —
Total � � � � � � � � � � � � � � � � ¥1,081,491 ¥1,113,624 ¥474,302 ¥122,576 ¥115,592 ¥90,623 ¥97,777 ¥212,752
Note: Others consist of “trade payables,” “other payables” and “other non-current liabilities�”
Carrying amount
Contractual cash flows
Due within one year
Due after one year
Derivative financial liabilitiesForeign exchange contracts � � � � � � � � � � � � � ¥2,523 ¥2,529 ¥1,756 ¥ 772
Interest rate contracts � � � � 766 697 325 372Commodity contracts � � � � 301 302 172 129
Total � � � � � � � � � � � � � � � � ¥3,591 ¥3,528 ¥2,253 ¥1,273
The Group does not expect the cash flows included in the maturity analysis to occur much earlier than anticipated or to differ significantly from the anticipated monetary amounts�
(4) Currency riskThe Group operates businesses globally, and is therefore exposed to currency fluctuation risks associated with transactions undertaken in currencies other than the functional currency of the individual Group companies� To manage such risks, the Group hedges the risks with foreign exchange forward contracts, currency swap contracts, and other instruments�
The principal exchange rates are as follows:
(Unit: Yen)FY2019
(Jan� 1 through Dec� 31, 2019)FY2020
(Jan. 1 through Dec. 31, 2020)
Average rateRate at the end of
the reporting period Average rateRate at the end of
the reporting period
U�S� dollars � � � � � � � � � � � � � � � � � � � � � � � � � � � � ¥109�05 ¥109�56 ¥106.82 ¥103.50Euros � � � � � � � � � � � � � � � � � � � � � � � � � � � � � � � � � 122�07 122�54 121.81 126.95
i) Currency risk exposureThe Group’s maximum amount of exposure to currency fluctuation risk is as follows�
The exposure excludes amounts for which currency fluctuation risk is hedged using foreign exchange forward contracts, currency swap contracts, and other instruments�
FY2019 (as of December 31, 2019)
FY2020 (as of December 31, 2020)
Thousands of U�S� dollars Thousands of euros
Thousands of U�S� dollars Thousands of euros
Financial instruments dominated in foreign currency � � � � � � � � � � � � � � � � � � � � � � � � $(231,948) €(46,456) $(196,836) €840

AGC Inc. 55
ii) Sensitivity analysis of currency fluctuation riskIn the event of a 1% appreciation against the U�S� dollar and euro at the end of the reporting period, the monetary impact of this exchange rate movement on profit before tax is shown below�
This analysis is performed by multiplying the currency fluctuation risk exposures by 1%, assuming that movements in various exchange rates have no impact on other variables (other exchange rates, interest rates, etc�)� It was conducted on the same basis as the analysis for the year ended December 31, 2019�
(Unit: Millions of yen)FY2019
(Jan� 1 through Dec� 31, 2019)
FY2020 (Jan. 1 through Dec. 31, 2020)
U�S� dollars (1% yen appreciation) � � � � � � � � � � � � � � � � � � � � � � � � � � � � � � � � � � � � � � � � � � ¥254 ¥203Euros (1% yen appreciation) � � � � � � � � � � � � � � � � � � � � � � � � � � � � � � � � � � � � � � � � � � � � � � 56 (1)
(5) Interest rate riskInterest-bearing debts with floating rates are exposed to interest rate fluctuation risks� For some long-term floating-rate loans, the Group uses derivative transactions (interest rate swaps) as hedging instruments to avoid the interest rate fluctuation risks and convert the floating rates into fixed rates�
i) Exposure to interest rate riskThe Group’s exposure to interest rate fluctuation risk is as follows�
The monetary amount of exposure excludes monetary amounts for which currency fluctuation risk is hedged using interest rate swap contracts�
(Unit: Millions of yen)FY2019 (as of December 31, 2019) FY2020 (as of December 31, 2020)
Due within one year
Due after one year Total
Due within one year
Due after one year Total
Loans payable � � � � � � � � � � � � � � � � � � � � � � � � � � � � � ¥53,845 ¥ — ¥ 53,845 ¥102,229 ¥ — ¥102,229Commercial paper � � � � � � � � � � � � � � � � � � � � � � � � � � 24,594 — 24,594 4,654 — 4,654
Current interest-bearing debt � � � � � � � � � � � � � � � � ¥78,439 ¥ — ¥ 78,439 ¥106,884 ¥ — ¥106,884Loans payable � � � � � � � � � � � � � � � � � � � � � � � � � � � � � ¥47,773 ¥178,118 ¥225,891 ¥ 54,860 ¥210,477 ¥265,338
Non-current interest-bearing debt � � � � � � � � � � � � ¥47,773 ¥178,118 ¥225,891 ¥ 54,860 ¥210,477 ¥265,338
ii) Sensitivity analysis of interest rate riskIn the event of a 1% interest rate increase, the monetary impact of financial instruments affected by the interest rate movement on profit before tax is shown below�
This analysis is performed by multiplying the currency fluctuation risk exposures by 1%, assuming that movements in various exchange rates have no impact on other variables (other exchange rates, etc�)� It was conducted on the same basis as the analysis for the year ended December 31, 2019�
(Unit: Millions of yen)FY2019
(Jan� 1 through Dec� 31, 2019)
FY2020 (Jan. 1 through Dec. 31, 2020)
Floating interest rate financial instruments � � � � � � � � � � � � � � � � � � � � � � � � � � � � � � � � � � � � ¥(3,043) ¥(3,722)
(6) Fair valuei) Fair value measurement approachThe fair values of financial assets and financial liabilities are determined as follows:
(Derivatives)Foreign exchange contracts are mainly based on forward exchange rates and prices quoted by financial institutions with which contracts are concluded� Interest rate contracts are mainly based on prices quoted by financial institutions with which contracts are concluded� Commodity contracts are mainly based on prices quoted by counterparties with whom contracts are concluded�(Financial assets measured at fair value through other comprehensive income)When market values are available, such values are used as fair values of the financial instruments� The fair values whose market values are unavailable are measured by using the method of discounted future cash flows, by third party appraisals, or by other appropriate measurement techniques�
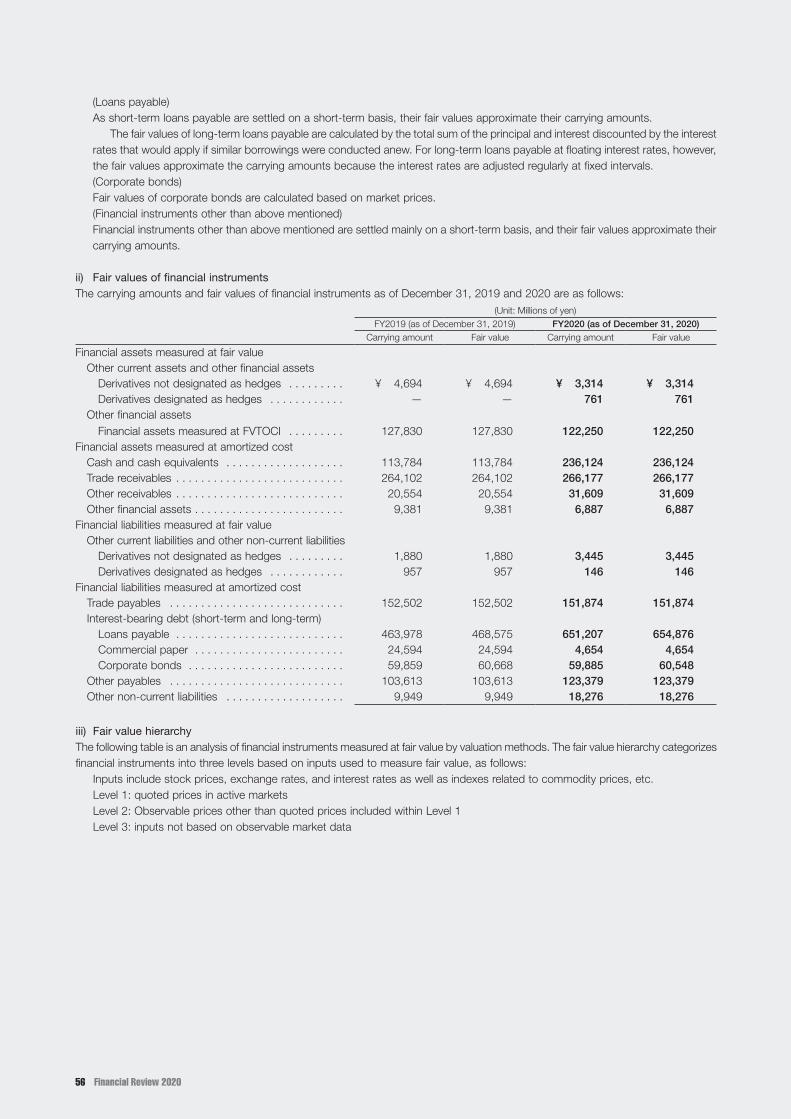
Financial Review 202056
(Loans payable)As short-term loans payable are settled on a short-term basis, their fair values approximate their carrying amounts� The fair values of long-term loans payable are calculated by the total sum of the principal and interest discounted by the interest rates that would apply if similar borrowings were conducted anew� For long-term loans payable at floating interest rates, however, the fair values approximate the carrying amounts because the interest rates are adjusted regularly at fixed intervals�(Corporate bonds)Fair values of corporate bonds are calculated based on market prices�(Financial instruments other than above mentioned)Financial instruments other than above mentioned are settled mainly on a short-term basis, and their fair values approximate their carrying amounts�
ii) Fair values of financial instrumentsThe carrying amounts and fair values of financial instruments as of December 31, 2019 and 2020 are as follows:
(Unit: Millions of yen)FY2019 (as of December 31, 2019) FY2020 (as of December 31, 2020)
Carrying amount Fair value Carrying amount Fair value
Financial assets measured at fair valueOther current assets and other financial assets
Derivatives not designated as hedges � � � � � � � � � ¥ 4,694 ¥ 4,694 ¥ 3,314 ¥ 3,314Derivatives designated as hedges � � � � � � � � � � � � — — 761 761
Other financial assetsFinancial assets measured at FVTOCI � � � � � � � � � 127,830 127,830 122,250 122,250
Financial assets measured at amortized costCash and cash equivalents � � � � � � � � � � � � � � � � � � � 113,784 113,784 236,124 236,124Trade receivables � � � � � � � � � � � � � � � � � � � � � � � � � � � 264,102 264,102 266,177 266,177Other receivables � � � � � � � � � � � � � � � � � � � � � � � � � � � 20,554 20,554 31,609 31,609Other financial assets � � � � � � � � � � � � � � � � � � � � � � � � 9,381 9,381 6,887 6,887
Financial liabilities measured at fair valueOther current liabilities and other non-current liabilities
Derivatives not designated as hedges � � � � � � � � � 1,880 1,880 3,445 3,445Derivatives designated as hedges � � � � � � � � � � � � 957 957 146 146
Financial liabilities measured at amortized costTrade payables � � � � � � � � � � � � � � � � � � � � � � � � � � � � 152,502 152,502 151,874 151,874Interest-bearing debt (short-term and long-term)
Loans payable � � � � � � � � � � � � � � � � � � � � � � � � � � � 463,978 468,575 651,207 654,876Commercial paper � � � � � � � � � � � � � � � � � � � � � � � � 24,594 24,594 4,654 4,654Corporate bonds � � � � � � � � � � � � � � � � � � � � � � � � � 59,859 60,668 59,885 60,548
Other payables � � � � � � � � � � � � � � � � � � � � � � � � � � � � 103,613 103,613 123,379 123,379Other non-current liabilities � � � � � � � � � � � � � � � � � � � 9,949 9,949 18,276 18,276
iii) Fair value hierarchyThe following table is an analysis of financial instruments measured at fair value by valuation methods� The fair value hierarchy categorizes financial instruments into three levels based on inputs used to measure fair value, as follows:
Inputs include stock prices, exchange rates, and interest rates as well as indexes related to commodity prices, etc�Level 1: quoted prices in active marketsLevel 2: Observable prices other than quoted prices included within Level 1Level 3: inputs not based on observable market data

AGC Inc. 57
(Unit: Millions of yen)
FY2019 (as of December 31, 2019)Level 1 Level 2 Level 3 Total
Derivative financial assets � � � � � � � � � � � � � � � � � � � � � � ¥ — ¥4,694 ¥ — ¥ 4,694Derivatives not designated as hedges � � � � � � � � � � � — 4,694 — 4,694Derivatives designated as hedges � � � � � � � � � � � � � � — — — —
Equity instruments � � � � � � � � � � � � � � � � � � � � � � � � � � � � 118,910 — 8,919 127,830Financial assets measured at FVTOCI � � � � � � � � � � � 118,910 — 8,919 127,830
Derivative financial liabilities � � � � � � � � � � � � � � � � � � � � � — 2,837 — 2,837Derivatives not designated as hedges � � � � � � � � � � � — 1,880 — 1,880Derivatives designated as hedges � � � � � � � � � � � � � � — 957 — 957
(Unit: Millions of yen)
FY2019 (as of December 31, 2019)Level 1 Level 2 Level 3 Total
Derivative financial assets � � � � � � � � � � � � � � � � � � � � � � ¥ — ¥4,075 ¥ — ¥ 4,075Derivatives not designated as hedges � � � � � � � � � � � — 3,314 — 3,314Derivatives designated as hedges � � � � � � � � � � � � � � — 761 — 761
Equity instruments � � � � � � � � � � � � � � � � � � � � � � � � � � � � 111,425 — 10,825 122,250Financial assets measured at FVTOCI � � � � � � � � � � � 111,425 — 10,825 122,250
Derivative financial liabilities � � � � � � � � � � � � � � � � � � � � � — 3,591 — 3,591Derivatives not designated as hedges � � � � � � � � � � � — 3,445 — 3,445Derivatives designated as hedges � � � � � � � � � � � � � � — 146 — 146
The presence of any financial instruments subject to significant transfers between fair value hierarchy levels is determined at the end of every period� There were no financial instruments subject to significant transfers between the fair value hierarchy levels during the years ended December 31, 2019 and 2020�
Changes in financial instruments categorized within Level 3 of the fair value hierarchy during the year are as follows:
(Unit: Millions of yen)FY2019
(Jan� 1 through Dec� 31, 2019)
FY2020 (Jan. 1 through Dec. 31, 2020)
Balance as of January 1 � � � � � � � � � � � � � � � � � � � � � � � � � � � � � � � � � � � � � � � � � � � � � � � � � ¥8,342 ¥ 8,919Purchases � � � � � � � � � � � � � � � � � � � � � � � � � � � � � � � � � � � � � � � � � � � � � � � � � � � � � � � � � � � � 543 1,797Sales � � � � � � � � � � � � � � � � � � � � � � � � � � � � � � � � � � � � � � � � � � � � � � � � � � � � � � � � � � � � � � � � (58) (364)Other comprehensive income � � � � � � � � � � � � � � � � � � � � � � � � � � � � � � � � � � � � � � � � � � � � � 162 611Other changes � � � � � � � � � � � � � � � � � � � � � � � � � � � � � � � � � � � � � � � � � � � � � � � � � � � � � � � � (69) (139)Balance as of December 31 � � � � � � � � � � � � � � � � � � � � � � � � � � � � � � � � � � � � � � � � � � � � � � ¥8,919 ¥10,825
iv) Equity instrumentsEquity instruments such as equity securities are held mainly for the purpose of maintaining and strengthening business relationships over the medium and long terms, and are designated as financial assets measured at FVTOCI� The following is a breakdown of the major stocks within equity instruments and their fair values:
(Unit: Millions of yen)FY2019
(as of December 31, 2019)
FY2020 (as of December 31,
2020)
Toyota Motor Corporation � � � � � � � � � � � � � � � � � � � � � � � � � � � � � � � � � � � � � � � � � � � � � � � � ¥ 28,172 ¥ 29,059Mitsubishi Estate Co�, Ltd� � � � � � � � � � � � � � � � � � � � � � � � � � � � � � � � � � � � � � � � � � � � � � � � 31,643 25,093Suzuki Motor Corporation � � � � � � � � � � � � � � � � � � � � � � � � � � � � � � � � � � � � � � � � � � � � � � � 13,563 14,202Mitsubishi Gas Chemical Company, Inc� � � � � � � � � � � � � � � � � � � � � � � � � � � � � � � � � � � � � � 8,093 10,501Honda Motor Co�, Ltd� � � � � � � � � � � � � � � � � � � � � � � � � � � � � � � � � � � � � � � � � � � � � � � � � � � 10,536 9,783Others � � � � � � � � � � � � � � � � � � � � � � � � � � � � � � � � � � � � � � � � � � � � � � � � � � � � � � � � � � � � � � � 35,820 33,612
Total � � � � � � � � � � � � � � � � � � � � � � � � � � � � � � � � � � � � � � � � � � � � � � � � � � � � � � � � � � � � � � � ¥127,830 ¥122,250

Financial Review 202058
Equity instruments are sold taking into consideration the fair value such as market value of shares and the need to hold shares for business purposes� The fair values of and cumulative gains or losses (Before tax effects) recognized in other components of equity on stocks sold during the years ended December 31, 2019 and 2020 are shown below� The cumulative gains or losses recognized are transferred on sale from other components of equity to retained earnings�
(Unit: Millions of yen)FY2019 (Jan� 1 through Dec� 31, 2019) FY2020 (Jan. 1 through Dec. 31, 2020)
Fair valueCumulative gains or losses
(Before tax effects) Fair valueCumulative gains or losses
(Before tax effects)
¥50,832 ¥30,228 ¥2,509 ¥1,583
The following is a breakdown of dividend income recognized from equity instruments:
(Unit: Millions of yen)FY2019 (Jan� 1 through Dec� 31, 2019) FY2020 (Jan. 1 through Dec. 31, 2020)
Financial assets derecognized during the year
Financial assets held as of the end of the reporting year
Financial assets derecognized during the year
Financial assets held as of the end of the reporting year
¥1,571 ¥3,445 ¥45 ¥3,037
(7) Derivatives and hedge accountingThe Group uses commodity futures and foreign exchange forward contracts to hedge variations in cash flows associated with forecast transactions and interest rate swaps and instruments to hedge variations in cash flows associated with loans payable with floating interest rates� The Group uses these derivatives only for transactions justified by actual demand, and does not hold these derivatives for speculative or trading purposes�
When applying hedge accounting, at the inception of hedges, the Group formally designates and documents hedging relationships to which hedge accounting is applied and the objectives and strategies of risk management for undertaking hedges� Moreover, at the inception of hedges, the Group evaluates whether or not the hedging instrument can be predicted to be effective� Thereafter, the Group continuously evaluates whether the derivative is highly effective in offsetting changes in future cash flows from the hedged item�
For the purpose of hedging variations in cash flows associated with raw material and fuel costs, the Group enters into raw material and fuel swap contracts for natural gas, oil and other commodities to hedge the risk of price fluctuations� The Group has determined that there is an economic relationship between the raw materials and fuel it uses, which reflects market prices, and the hedging instruments that are correlated with market prices for raw materials and fuel� The risk of price fluctuations has an impact on the Group’s consolidated financial statements through fluctuations in raw material and fuel costs� Therefore, the Group applies hedge accounting by designating only raw material and fuel costs as risk factors� The designated risk factor accounts for most of the risk of price fluctuations� Moreover, at the inception of hedging relationships, the Group sets an appropriate hedge ratio based on the quantity of the hedged item and the quantity of hedging instruments� In principle, the Group sets the hedge ratio so as to obtain a one-to-one relationship between those quantities�
The ineffective portion of hedging instruments arises mainly because changes in the fair value of the hedging instruments are unable to fully cover the fluctuations in the hedged item, namely the fluctuations in raw material and fuel costs�
For the purpose of hedging variations in cash flows associated with foreign currency-denominated forecast transactions, the Group enters into forward exchange contracts to hedge the risk of exchange rate fluctuations� In applying hedge accounting to the above-mentioned risk, the Group confirms that an economic relationship exists between the hedged item and the hedging instrument through a qualitative evaluation of whether the critical terms of the hedged item and the hedging instrument are the same or closely match� This is in order to confirm that the economic relationship is such that the risk of exchange rate fluctuations, which is the hedged item, is offset by changes in the fair value of the hedging instrument�
Details on cash flow hedges for commodity price risk and exchange rate fluctuations risk are as follows:

AGC Inc. 59
i) Impact of hedge accounting on the consolidated statements of financial positionAs of December 31, 2019 and 2020, the carrying amount of hedging instruments on the consolidated statements of financial position and the changes in the fair value of hedging instruments used as a basis for calculating hedge ineffectiveness are as follows:
(Unit: Millions of yen)FY2019 (as of December 31, 2019)
Type of risk Hedging instrument Carrying amount of hedging instrument
Changes in fair value of hedging
instrument
Commodity price risk (Note) Swap contract � � � � � � � � � � � � �
Other current assets ¥ —
¥(2,742)Other financial assets —Other current liabilities 770Other non-current liabilities 187
Note: The delivery month of foregoing contracts are expected to mature within three years from December 31, 2019 and most parts of contracts are expected to mature within one year from
December 31, 2019�
The delivery month of foregoing contracts are expected to mature within three years from December 31, 2019 and most parts of contracts are expected to mature within one year from December 31, 2019�
(Unit: Millions of yen)FY2020 (as of December 31, 2020)
Type of risk Hedging instrument Carrying amount of hedging instrument
Changes in fair value of hedging
instrument
Commodity price risk (Note) Swap contract � � � � � � � � � � � � �
Other current assets ¥530
¥(807)Other financial assets 231Other current liabilities 73Other non-current liabilities 53
Exchange rate fluctuations risk Forward exchange contract � � �
Other current assets ¥ —
¥ 154Other financial assets —Other current liabilities 20Other non-current liabilities —
Note: The delivery month of foregoing contracts are expected to mature within three years from December 31, 2020 and most parts of contracts are expected to mature within one year from
December 31, 2020�
The notional amount of hedging instruments as of December 31, 2019 and 2020 are as follows:
(Unit: Millions of yen)FY2019 (as of
December 31, 2019)FY2020 (as of
December 31, 2020)Type of risk Hedging instrument Notional amount Notional amount
Commodity price risk Swap contract � � � � � � � � � � � � � � � � � � � � � � � � � � � � � � � ¥5,709 ¥6,741Exchange rate fluctuations risk Forward exchange contract � � � � � � � � � � � � � � � � � � � � � ¥ — ¥4,638
The changes in value of the hedged items used as the basis for calculating hedge ineffectiveness and the balances remaining in the cash flow hedge reserve as of December 31, 2019 and 2020 are as follows:
(Unit: Millions of yen)FY2019 (as of December 31, 2019)
Type of riskChanges in value of
hedged itemCash flow hedge
reserve
Commodity price risk � � � � � � � � � � � � � � � � � � � � � � � � � � � � � � � � � � � � � � � � � � � � � � � � � � � ¥2,742 ¥(957)
(Unit: Millions of yen)FY2020 (as of December 31, 2020)
Type of riskChanges in value of
hedged itemCash flow hedge
reserve
Commodity price risk � � � � � � � � � � � � � � � � � � � � � � � � � � � � � � � � � � � � � � � � � � � � � � � � � � � ¥ 807 ¥635Exchange rate fluctuations risk � � � � � � � � � � � � � � � � � � � � � � � � � � � � � � � � � � � � � � � � � � � � ¥(154) ¥ (20)

Financial Review 202060
ii) Impact of hedge accounting on the consolidated statements of profit or loss and consolidated statements of comprehensive income
Profit or loss items recorded on the consolidated statements of profit or loss and consolidated statements of comprehensive income during the years ended December 31, 2019 and 2020 are as follows:
(Unit: Millions of yen)FY2019 (Jan� 1 through Dec� 31, 2019)
Type of risk
Hedging gains or losses that were recognized in other comprehensive income
Hedge ineffectiveness recognized in profit or loss reclassification adjustment
Amount reclassified from cash flow hedge reserve into the cost of inventories as
reclassification adjustment
Commodity price risk � � � � � � � � � � ¥(2,742) ¥— ¥(1,784)
During the year ended December 31, 2019, no cash flow hedges were discontinued as a result of not executing forecast transac-tions within the initially anticipated time period�
(Unit: Millions of yen)FY2020 (Jan. 1 through Dec. 31, 2020)
Type of risk
Hedging gains or losses that were recognized in other comprehensive income
Hedge ineffectiveness recognized in profit or loss reclassification adjustment
Amount reclassified from cash flow hedge reserve into the
cost of inventories as reclassification adjustment
Commodity price risk � � � � � � � � � � ¥(807) ¥— ¥(1,442)
(Unit: Millions of yen)FY2020 (Jan. 1 through Dec. 31, 2020)
Type of risk
Hedging gains or losses that were recognized in other comprehensive income
Hedge ineffectiveness recognized in profit or loss reclassification adjustment
Amount reclassified from cash flow hedge reserve into profit or loss as reclassification adjustment
Exchange rate fluctuations risk � � � ¥154 ¥— ¥174
During the year ended December 31, 2020, no cash flow hedges were discontinued as a result of not executing forecast transac-tions within the initially anticipated time period�
Note 26: Business combinationsFY2019 (Jan� 1 through Dec� 31, 2019)Acquisition of US-based Taconic’s global operations of the Advanced Dielectric DivisionThe Group has acquired the US-based Taconic’s global operations of the ADD which manufactures and sells high-end rigid CCL and industrial films, on June 11, 2019� Although a provisional accounting treatment had been applied in the previous fiscal year, the accounting treatment was finalized in the fiscal year ended December 31, 2020� As a result, mainly intangible assets increased and goodwill decreased by ¥7,929 million from the provisionally estimated amount�
The following (2)–(5) were revised from the provisionally estimated amount�
(1) Outline of the acquisition1� Name of the acquiree and main business Name of the acquiree: Taconic, Inc� USA Main business: Manufacturing and sales of high-end rigid CCL and industrial films2� Main reason for the acquisition
The Group has made a commitment to positioning mobility-related business, electronics-related business and life science-related business at its strategic initiatives� Through the acquisition of Taconic’s business, the Group will reinforce its mobility-related and electronics-related business� The Group believes that the acquisition of Park Electrochemical’s electronics business completed on December 2018 and the acquisition of Taconic’s businesses will help establish its business platform in the high-end rigid CCL market, which is expected to grow significantly with the spread of 5G and automated vehicles in the years ahead� The Group also committed to satisfy broader customer needs through combining its fluorine and glass materials with Taconic’s business�
3� Acquisition date: June 11, 20194� Legal structure of acquisition: Transfer of business for cash as consideration
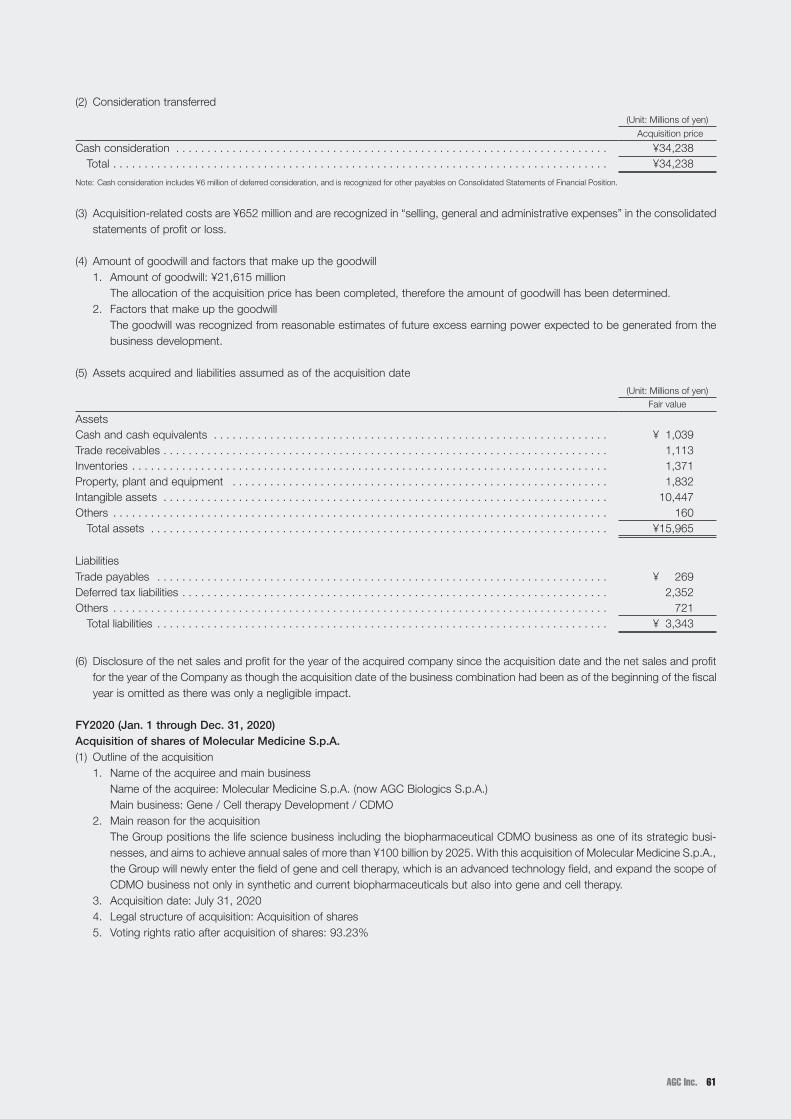
AGC Inc. 61
(2) Consideration transferred
(Unit: Millions of yen)
Acquisition price
Cash consideration � � � � � � � � � � � � � � � � � � � � � � � � � � � � � � � � � � � � � � � � � � � � � � � � � � � � � � � � � � � � � � � � � � � � � ¥34,238Total � � � � � � � � � � � � � � � � � � � � � � � � � � � � � � � � � � � � � � � � � � � � � � � � � � � � � � � � � � � � � � � � � � � � � � � � � � � � � � � ¥34,238
Note: Cash consideration includes ¥6 million of deferred consideration, and is recognized for other payables on Consolidated Statements of Financial Position�
(3) Acquisition-related costs are ¥652 million and are recognized in “selling, general and administrative expenses” in the consolidated statements of profit or loss�
(4) Amount of goodwill and factors that make up the goodwill1� Amount of goodwill: ¥21,615 million
The allocation of the acquisition price has been completed, therefore the amount of goodwill has been determined�2� Factors that make up the goodwill
The goodwill was recognized from reasonable estimates of future excess earning power expected to be generated from the business development�
(5) Assets acquired and liabilities assumed as of the acquisition date
(Unit: Millions of yen)Fair value
AssetsCash and cash equivalents � � � � � � � � � � � � � � � � � � � � � � � � � � � � � � � � � � � � � � � � � � � � � � � � � � � � � � � � � � � � � � � ¥ 1,039Trade receivables � � � � � � � � � � � � � � � � � � � � � � � � � � � � � � � � � � � � � � � � � � � � � � � � � � � � � � � � � � � � � � � � � � � � � � � 1,113Inventories � � � � � � � � � � � � � � � � � � � � � � � � � � � � � � � � � � � � � � � � � � � � � � � � � � � � � � � � � � � � � � � � � � � � � � � � � � � � 1,371Property, plant and equipment � � � � � � � � � � � � � � � � � � � � � � � � � � � � � � � � � � � � � � � � � � � � � � � � � � � � � � � � � � � � 1,832Intangible assets � � � � � � � � � � � � � � � � � � � � � � � � � � � � � � � � � � � � � � � � � � � � � � � � � � � � � � � � � � � � � � � � � � � � � � � 10,447Others � � � � � � � � � � � � � � � � � � � � � � � � � � � � � � � � � � � � � � � � � � � � � � � � � � � � � � � � � � � � � � � � � � � � � � � � � � � � � � � 160
Total assets � � � � � � � � � � � � � � � � � � � � � � � � � � � � � � � � � � � � � � � � � � � � � � � � � � � � � � � � � � � � � � � � � � � � � � � � � ¥15,965
LiabilitiesTrade payables � � � � � � � � � � � � � � � � � � � � � � � � � � � � � � � � � � � � � � � � � � � � � � � � � � � � � � � � � � � � � � � � � � � � � � � � ¥ 269Deferred tax liabilities � � � � � � � � � � � � � � � � � � � � � � � � � � � � � � � � � � � � � � � � � � � � � � � � � � � � � � � � � � � � � � � � � � � � 2,352Others � � � � � � � � � � � � � � � � � � � � � � � � � � � � � � � � � � � � � � � � � � � � � � � � � � � � � � � � � � � � � � � � � � � � � � � � � � � � � � � 721
Total liabilities � � � � � � � � � � � � � � � � � � � � � � � � � � � � � � � � � � � � � � � � � � � � � � � � � � � � � � � � � � � � � � � � � � � � � � � � ¥ 3,343
(6) Disclosure of the net sales and profit for the year of the acquired company since the acquisition date and the net sales and profit for the year of the Company as though the acquisition date of the business combination had been as of the beginning of the fiscal year is omitted as there was only a negligible impact�
FY2020 (Jan. 1 through Dec. 31, 2020)Acquisition of shares of Molecular Medicine S.p.A.(1) Outline of the acquisition
1� Name of the acquiree and main business Name of the acquiree: Molecular Medicine S�p�A� (now AGC Biologics S�p�A�) Main business: Gene / Cell therapy Development / CDMO2� Main reason for the acquisition
The Group positions the life science business including the biopharmaceutical CDMO business as one of its strategic busi-nesses, and aims to achieve annual sales of more than ¥100 billion by 2025� With this acquisition of Molecular Medicine S�p�A�, the Group will newly enter the field of gene and cell therapy, which is an advanced technology field, and expand the scope of CDMO business not only in synthetic and current biopharmaceuticals but also into gene and cell therapy�
3� Acquisition date: July 31, 20204� Legal structure of acquisition: Acquisition of shares5� Voting rights ratio after acquisition of shares: 93�23%

Financial Review 202062
(2) Consideration transferred
(Unit: Millions of yen)
Acquisition price
Cash consideration � � � � � � � � � � � � � � � � � � � � � � � � � � � � � � � � � � � � � � � � � � � � � � � � � � � � � � � � � � � � � � � � � � � � � ¥27,782Total � � � � � � � � � � � � � � � � � � � � � � � � � � � � � � � � � � � � � � � � � � � � � � � � � � � � � � � � � � � � � � � � � � � � � � � � � � � � � � � ¥27,782
(3) Acquisition-related costs are ¥885 million and are recognized in “selling, general and administrative expenses” in the consolidated statements of profit or loss�
(4) Amount of goodwill and factors that make up the goodwill1� Amount of goodwill: ¥13,394 million
The allocation of the acquisition price has not been completed, therefore the amount of goodwill has been provisionally estimated�
2� Factors that make up the goodwillThe goodwill was recognized from reasonable estimates of future excess earning power expected to be generated from the business development�
(5) Assets acquired and liabilities assumed as of the acquisition date
(Unit: Millions of yen)Fair value
AssetsCash and cash equivalents � � � � � � � � � � � � � � � � � � � � � � � � � � � � � � � � � � � � � � � � � � � � � � � � � � � � � � � � � � � � � � � ¥ 1,794Trade receivables � � � � � � � � � � � � � � � � � � � � � � � � � � � � � � � � � � � � � � � � � � � � � � � � � � � � � � � � � � � � � � � � � � � � � � � 1,358Inventories � � � � � � � � � � � � � � � � � � � � � � � � � � � � � � � � � � � � � � � � � � � � � � � � � � � � � � � � � � � � � � � � � � � � � � � � � � � � 328Property, plant and equipment � � � � � � � � � � � � � � � � � � � � � � � � � � � � � � � � � � � � � � � � � � � � � � � � � � � � � � � � � � � � 2,358Intangible assets � � � � � � � � � � � � � � � � � � � � � � � � � � � � � � � � � � � � � � � � � � � � � � � � � � � � � � � � � � � � � � � � � � � � � � � 9,482Deferred tax assets � � � � � � � � � � � � � � � � � � � � � � � � � � � � � � � � � � � � � � � � � � � � � � � � � � � � � � � � � � � � � � � � � � � � � 3,813
Others � � � � � � � � � � � � � � � � � � � � � � � � � � � � � � � � � � � � � � � � � � � � � � � � � � � � � � � � � � � � � � � � � � � � � � � � � � � � � 498Total assets � � � � � � � � � � � � � � � � � � � � � � � � � � � � � � � � � � � � � � � � � � � � � � � � � � � � � � � � � � � � � � � � � � � � � � � ¥19,634
LiabilitiesTrade payables � � � � � � � � � � � � � � � � � � � � � � � � � � � � � � � � � � � � � � � � � � � � � � � � � � � � � � � � � � � � � � � � � � � � � � � � ¥ 1,672Others � � � � � � � � � � � � � � � � � � � � � � � � � � � � � � � � � � � � � � � � � � � � � � � � � � � � � � � � � � � � � � � � � � � � � � � � � � � � � � � 2,528
Total liabilities � � � � � � � � � � � � � � � � � � � � � � � � � � � � � � � � � � � � � � � � � � � � � � � � � � � � � � � � � � � � � � � � � � � � � � � � ¥ 4,200
Note: Consideration paid was allocated to the assets acquired and liabilities assumed based on the fair value at the acquisition date� In the fourth quarter of the current fiscal year, the initial
provisional amount was revised� As a result, mainly intangible assets increased and goodwill decreased by ¥6,684 million from the previously estimated ¥20,078 million� The fair value
of non-controlling interests calculated in proportion to equity in the recognized amounts of the abovementioned assets and liabilities was ¥1,045 million�
(6) Disclosure of the net sales and profit for the year of the acquired company since the acquisition date and the net sales and profit for the year of the Company as though the acquisition date of the business combination had been as of the beginning of the fiscal year is omitted as there was only a negligible impact�
(7) The Group made Molecular Medicine S�p�A a wholly owned subsidiary by additional acquisition of shares on September 30, 2020�
Note 27: CommitmentsAs of December 31, 2019 and 2020, significant contractual commitments relating to the acquisition of property, plant and equipment amounted to ¥30,368 million and ¥19,324 million, respectively�

AGC Inc. 63
Note 28: CollateralAssets pledged as collateral and obligation secured by collateral are as follows:
Assets pledged as collateral
(Unit: Millions of yen)FY2019
(as of December 31, 2019)
FY2020 (as of December 31,
2020)
Property, plant and equipment � � � � � � � � � � � � � � � � � � � � � � � � � � � � � � � � � � � � � � � � � � � � ¥5,941 ¥5,138Other financial assets � � � � � � � � � � � � � � � � � � � � � � � � � � � � � � � � � � � � � � � � � � � � � � � � � � � — 180
Total � � � � � � � � � � � � � � � � � � � � � � � � � � � � � � � � � � � � � � � � � � � � � � � � � � � � � � � � � � � � � � � ¥5,941 ¥5,318
Obligation secured by collateral
(Unit: Millions of yen)FY2019
(as of December 31, 2019)
FY2020 (as of December 31,
2020)
Long-term bank loans � � � � � � � � � � � � � � � � � � � � � � � � � � � � � � � � � � � � � � � � � � � � � � � � � � � ¥98 ¥61Total � � � � � � � � � � � � � � � � � � � � � � � � � � � � � � � � � � � � � � � � � � � � � � � � � � � � � � � � � � � � � � � ¥98 ¥61
Other than the abovementioned, no ownership restrictions or rights of pledge as collateral for obligation have been established�
Note 29: ContingenciesThe Group provides guarantees, etc�, for borrowings from financial institutions taken out by companies outside the Group amounting to ¥90 million and ¥71 million as of December 31, 2019 and 2020, respectively� This includes commitments to guarantees, etc�, amounting to ¥37 million and ¥25 million as of December 31, 2019 and 2020, respectively�
Note 30: Related partiesRelated party transactionsRelated party transactions were made on terms equivalent to those that prevail in arm’s length transactions�
Breakdown of compensation to directors
(Unit: Millions of yen)FY2019
(Jan� 1 through Dec� 31, 2019)
FY2020 (Jan. 1 through Dec. 31, 2020)
Monthly compensation and bonuses � � � � � � � � � � � � � � � � � � � � � � � � � � � � � � � � � � � � � � � � ¥420 ¥384Share-based payment (Note) � � � � � � � � � � � � � � � � � � � � � � � � � � � � � � � � � � � � � � � � � � � � � � � � 147 65
Total � � � � � � � � � � � � � � � � � � � � � � � � � � � � � � � � � � � � � � � � � � � � � � � � � � � � � � � � � � � � � � � ¥567 ¥449
Note: Share-based payment amount only consisted of fixed expenses during the year ended December 31, 2020� Reversals of performance-liked expenses recorded until the year ended
December 31, 2019 were ¥(93) million in the current fiscal year�

Financial Review 202064
Note 31: Group entitiesMajor subsidiaries as of December 31, 2020 are as follows:
Subsidiary name Location Capital Main business
Voting rights held by the
Company (%)
Consolidated subsidiaries
GlassAGC Glass Kenzai Co�, Ltd� � � � � � � � Japan ¥450 million Production and sales of flat glass,
fabricated glass for architectural use and building materials
100�0(0�0)
AGC Glass Products Co�, Ltd� � � � � � Japan ¥1,287 million Production and sales of fabricated glass for architectural use, and cutting and sales of flat glass
70�0(0�0)
AGC Automotive (Suzhou) Inc� � � � � � China US$236 million Production and sales of automotive glass
100�0(0�0)
PT Asahimas Flat Glass Tbk (Note 3) � � � Indonesia 217 billion rupiah Production and sales of flat glass, automotive glass and fabricated glass for industrial use
44�5(0�0)
AGC Flat Glass North America, Inc� � � U�S�A� US$250 million Production and sales of flat glass and automotive glass
100�0(100�0)
AGC Vidros do Brasil Ltda� � � � � � � � � Brazil 1,270 million real Production and sales of flat glass and automotive glass
100�0(0�0)
AGC Automotive Europe S�A� � � � � � � Belgium €148 million Production and sales of automotive glass
100�0(100�0)
AGC Glass Europe S�A� � � � � � � � � � � Belgium €346 million Production and sales of flat glass 100�0(0�0)
AGC Flat Glass Czech A�S� � � � � � � � � Czech Republic 3,560 million koruna Production and sales of flat glass 100�0(100�0)
AGC Bor Glassworks � � � � � � � � � � � � Russia 418 million rubles Production and sales of flat glass and automotive glass
94�7(94�7)
ElectronicsAGC Display Glass Taiwan Co�, Ltd� � � � � � � � � � � � � � � � � � � � � �
Taiwan NT$3,120 million Production and sales of glass for electronics
100�0(100�0)
AGC Display Glass (Shenzhen) Co�, Ltd� � � � � � � � � � � � � � � � � � � � � �
China ¥14,200 million Production and sales of glass for electronics
100�0(0�0)
AGC Display Glass (Huizhou) Co�, Ltd� � � � � � � � � � � � � � � � � � � � � �
China ¥28,900 million Production and sales of glass for electronics
100�0(0�0)
AGC Advanced Electronics Display Glass (Shenzhen) Co�, Ltd� � � � � � � �
China ¥30,400 million Production and sales of glass for electronics
70�0(0�0)
AGC Fine Techno Korea Co�, Ltd� � � � South Korea 227,000 million won Production and sales of glass for electronics
100�0(33�0)
ChemicalsIse Chemicals Corporation* � � � � � � � � Japan ¥3,599 million Production and sales of iodine-
related products and metallic compounds, extraction and sales of natural gas
53�2(0�0)
P�T� Asahimas Chemical � � � � � � � � � � Indonesia US$84 million Production and sales of vinyl chloride, vinyl chloride monomer and caustic soda
52�5(0�0)
Vinythai Public Company Limited � � � Thailand 7,111 million baht Production and sales of vinyl chloride, vinyl chloride monomer and caustic soda
58�8(0�0)
AGC Biologics A/S � � � � � � � � � � � � � � Denmark 42 million Danish krone
Development and manufacturing contract of biopharmaceutical
100�0(0�0)

AGC Inc. 65
Subsidiary name Location Capital Main business
Voting rights held by the
Company (%)
Ceramics/OthersAGC Ceramics Co�, Ltd� � � � � � � � � � � Japan ¥3,500 million Production and sales of various
ceramic products100�0
(0�0)AGC Singapore Services Pte� Ltd� � � � Singapore US$88 million Procurement of funds and financing
services for affiliates in Asia, and holding of shares in affiliates
100�0(0�0)
AGC America, Inc� � � � � � � � � � � � � � � � U�S�A� US$725 million Holding of shares in affiliates in North America, and information collection
100�0(0�0)
Other consolidated subsidiaries � � � � � � � � � � � � � � � 195Total consolidated subsidiaries � � � � � � � � � � � � � � � 217Equity method affiliates � � � � � � � � � � � � � � � � � � � � � 35Notes: 1� Figures disclosed in parentheses in the “Voting rights held by the Company” column represent voting rights held indirectly by the Company�
2� Subsidiaries marked with * in the “Subsidiary name” column have filed a marketable securities report�
3� Although the Group holds less than half of the voting rights, it includes the entity in consolidated subsidiary because it substantially controls the entity�
During the years ended December 31, 2019 and 2020, there was no individually significant subsidiary having non-controlling interests�
Information for equity method affiliates is presented in Note 11 “Equity method affiliates�”
Note 32: Subsequent eventsThe Company to Integrate and Reorganize the 3 Chlor-Alkali Companies in Thailand and CLMV MarketsThe Company’s Board of Directors, at a meeting held on March 18, 2021, passed a resolution to integrate and reorganize its three consolidated subsidiary companies, AGC Chemicals (Thailand) Co�, Ltd, Vinythai Public Company Limited, and AGC Chemicals Vietnam Co�, Ltd, and to form a new company which will promote the business development of chlor-alkali products and services in Thailand and Cambodia, Laos, Myanmar, and Vietnam markets, with a target completion by first half of 2022�
The Company believes that the impact on the consolidated financial statements will be minimal�

Financial Review 202066
Independent Auditor’s Report

AGC Inc. 67

Financial Review 202068
AGC Inc. 69

Financial Review 202070

AGC Inc. 71

Financial Review 202072


AGC Inc.www.agc.com/en
1-5-1, Marunouchi, Chiyoda-ku, Tokyo, 100-8405, JAPANCorporate Communications & Investor Relations DivisionTel: +81-3-3218-5603 Fax: +81-3-3218-5390