Embed Size (px)
Citation preview
www.allahabadbank.in
Financial Results
Q2 & H1 FY18
10th November 2017

2
The Bank’s Key Strengths
Robust CASA
Strong Rural and Semi-Urban Branch Network
Widespread Centralized Retail Banking Boutique (CRBB) Network
More than 45 million loyal clientele
Stable Operating Profit
Young & energetic workforce
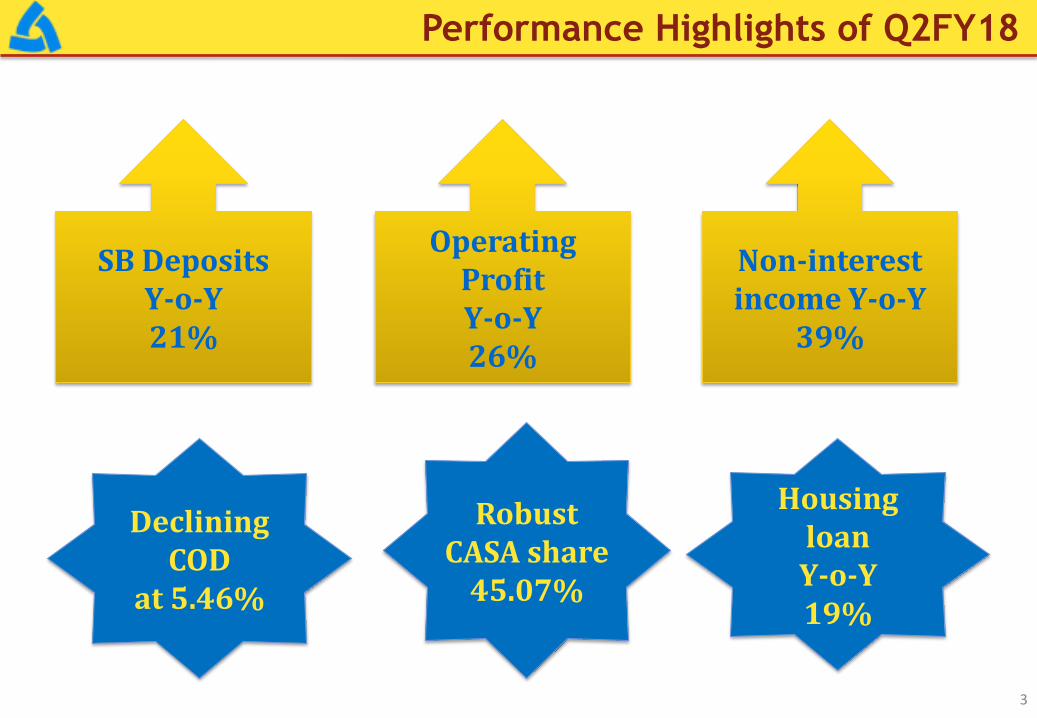
Performance Highlights of Q2FY18
3
SB Deposits Y-o-Y 21%
Operating
Profit Y-o-Y 26%
Non-interest income Y-o-Y
39%
Declining COD
at 5.46%
Robust CASA share
45.07%
Housing loan Y-o-Y 19%

Contents
Business Mix
Investment
Profitability
Asset Quality
Capital & Shareholding Pattern
Networth
Digital
Domestic Branch & ATM Network
Financial Inclusion
MUDRA & Stand Up India Schemes
4

Terminal Business Mix
Rs. in crore
5
Amount %
1 Business 355738 359974 359450 3712 1.04
Domestic 342931 345843 343843 912 0.27
Overseas 12808 14131 15607 2799 21.86
Percentage Share of overseas to total business
3.60 3.93 4.34
2 Deposits 200194 201870 207269 7075 3.53
Domestic 197499 199335 204268 6769 3.43
Overseas 2696 2536 3001 306 11.35
3 Advances 155544 158103 152180 -3364 -2.16
Domestic 145432 146508 139575 -5857 -4.03
Overseas 10112 11595 12605 2493 24.66
4 CD Ratio 78.37 79.03 74.20
5Total No. of Domestic
Branches3244 3245 3248
Y-o-Y VariationSep'17
Sl. No.
Parameters Mar'17Sep'16
Rs. in crore
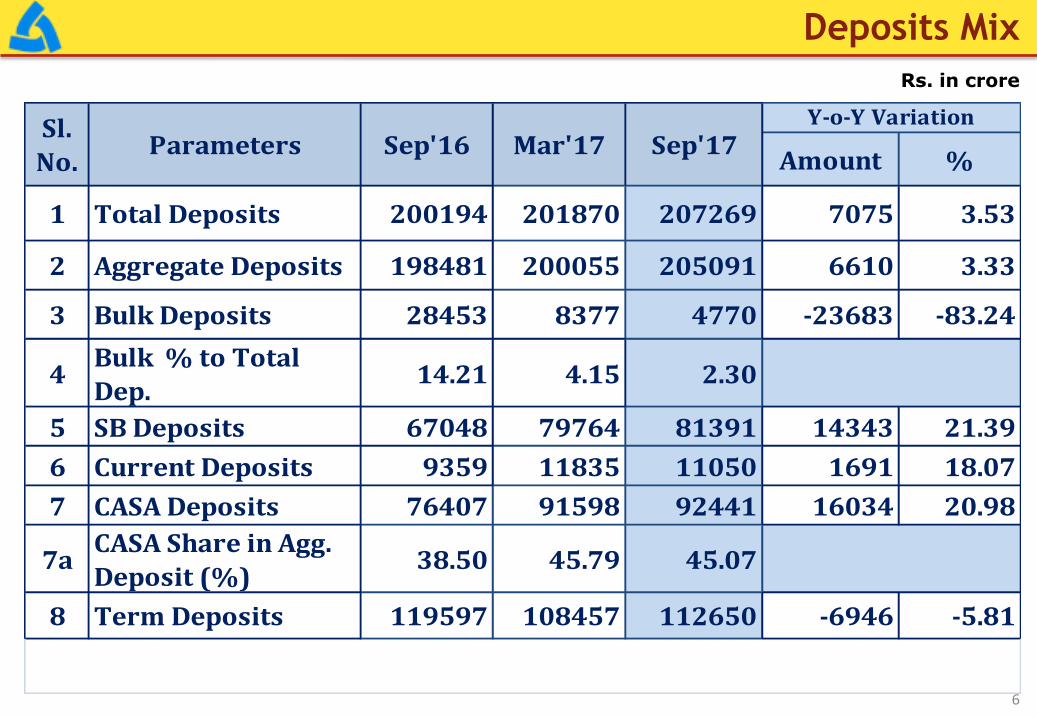
Deposits Mix
6
Amount %
1 Total Deposits 200194 201870 207269 7075 3.53
2 Aggregate Deposits 198481 200055 205091 6610 3.33
3 Bulk Deposits 28453 8377 4770 -23683 -83.24
4Bulk % to Total
Dep.14.21 4.15 2.30
5 SB Deposits 67048 79764 81391 14343 21.39
6 Current Deposits 9359 11835 11050 1691 18.07
7 CASA Deposits 76407 91598 92441 16034 20.98
7aCASA Share in Agg.
Deposit (%)38.50 45.79 45.07
8 Term Deposits 119597 108457 112650 -6946 -5.81
Sep'17Sl.
No.Parameters Mar'17Sep'16
Y-o-Y Variation

Movement of CASA & SB Deposits
7
CASA
SB

Way forward : Deposits
10
Periodic SB Campaigns
Convert inoperative a/cs to operative ones
Renewed Thrust on SB including Salary
a/c Opening
Utilization of Bank Mitras
8

Advances Mix Rs. in crore
9
Amount %
1 Total Advances 155544 158103 152180 -3364 -2.16
2 Large Industries 43904 42648 39391 -4513 -10.28
3Agriculture and
Allied Activities26997 27075 27003 6 0.02
4 MSME 29646 31182 30777 1131 3.82
5 Retail Loans 16289 17172 18399 2110 12.96
6 Others* 38709 40026 36610 -2098 -5.42
* Includes food credit, export credit, trade & rent loan schemes.
Sep'16 Mar'17ParametersY-o-Y VariationSl.
No.Sep'17

Small, Micro, Agriculture and Retail Loans
10
Amt. %
1 Small 13285 12409 12226 -1059 -7.97
2 Micro 12047 13225 13002 956 7.93
3 Agriculture 26997 27075 27003 6 0.02
4 Retail 16289 17172 18399 2110 12.96
5 Total 68618 69881 70631 2013 2.93
Sl.
No.Mar'17
Variation Parameters Sep'16 Sep'17
Rs. in crore

Small, Micro, Agriculture and Retail Loans
11
Rs. in crore
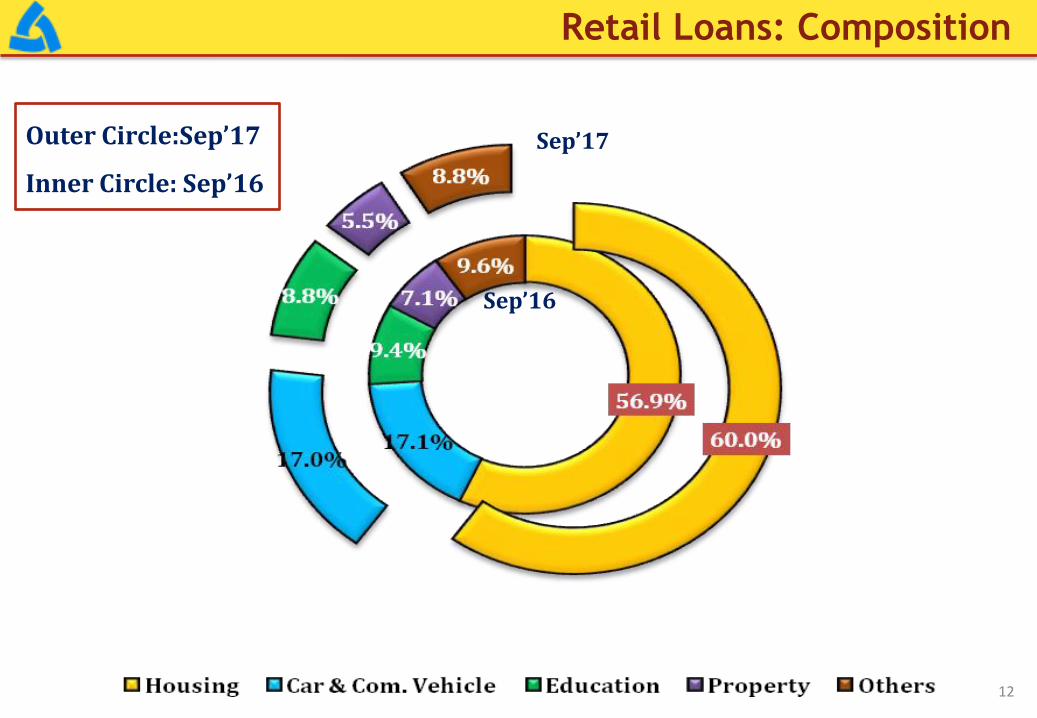
Retail Loans: Composition
Outer Circle:Sep’17
Inner Circle: Sep’16
12
Sep’17
Sep’16

Retail Loans: Product Performance
13
Rs. in crore/
Y-o-Y Growth % Key Segments of Retail Loans
13%
19%
12%
6% 3% 12%

Rs. in crore
Industry-wise Deployment of Credit
14
1 Food Processing 3170 2.04 2665 1.75 -505 -15.932 Textiles 5000 3.21 4828 3.17 -172 -3.44
3Chemical & Chemical
Products3059 1.97 3768 2.48 709 23.18
4Cement & Cement
Products1217 0.78 990 0.65 -227 -18.65
5Basic Metal & Metal
Products9550 6.14 9051 5.95 -499 -5.23
5a Iron & Steel 8280 5.32 7897 5.19 -383 -4.63
6All Engineering
Products3880 2.49 3924 2.58 44 1.13
7 Gems & Jewellery 1022 0.66 963 0.63 -59 -5.778 Construction 3477 2.24 3199 2.10 -278 -8.00
9Infrastructure
of which,19005 12.22 17506 11.50 -1499 -7.89
9a Power 10554 6.79 8679 5.70 -1875 -17.779b Tele-communication 1229 0.79 1411 0.93 182 14.819c Road & Ports 4542 2.92 3936 2.59 -606 -13.34
Sep'17
Amt.
% share
to Total
Adv
Sep'16
Amt.
% share
to Total
Adv
Sl.
No.Major Industries
Y-o-Y Variation
Amt. %

Way forward : Advances
15
Focus on MUDRA & Standup India
loans
Focused approach on SMARt Loans
Modification in Retail Loan
Schemes
Focus on Affordable
Housing (PMAY)
To launch credit card business

Rs. in crore
Investment
16
Amount %
1 Gross Investment 55725 55712 60672 4947 8.88
2 Held To Maturity (HTM) 39202 38527 39606 404 1.03
3 Available For Sale (AFS) 16523 17185 21060 4538 27.47
4 Held For Trading (HFT) 0 0 5
5 Duration (AFS+HFT) 4.27 5.25 4.54
6 Modified Duration (AFS+HFT) 4.13 5.07 4.39
7 Total Duration 5.00 5.57 5.27
8 Total Modified Duration 4.84 5.38 5.10
9 Net Demand & Time Liabilities 193851 203860 204942 11091 5.72
10 SLR (%) 24.10 23.35 26.76
11 HTM to SLR (%) 83.90 80.94 72.21
12 HTM to Gross Investment (%) 70.35 69.15 65.28
Parameters Mar'17Y-o-Y Variation
Sep,16 Sep'17

Rs. in crore
Profit
17
1 Interest Income 4422 4372 4190 -232 -5.26 8993 8338 -655 -7.28
2 Interest Expenses 3073 3011 2936 -137 -4.47 6250 5841 -410 -6.55
3 NII (Spread) (1-2) 1349 1361 1254 -95 -7.04 2743 2497 -245 -8.95
4Non-Interest
Income629 733 878 249 39.52 1182 1698 517 43.75
5Operating
Expenses 1008 1028 909 -99 -9.81 1986 1802 -184 -9.26
6 Contribution (4-5) -379 -295 -32 348 -91.68 -805 -104 701 -87.09
7Operating Profit
(3+6)970 1066 1223 253 26.03 1938 2393 455 23.50
8 Provisions 905 955 1153 247 27.33 2438 2294 -144 -5.89
9 Net Profit 65 111 70.19 5 7.93 -500 99.04 599 -119.81
Y-o-Y Variation
Amt. %Sl. Parameters
HY
Sep'16
HY
Sep'17%Amt.
Q4
FY17
Q2
FY17
Q2
FY18
Y-o-Y Variation

Break-up : Income Rs. in crore
18
1Interest on
Advances3303 2860 2880 -423 -12.81 6683 5729 -954 -14.27
2Interest on
Investments974 1058 955 -19 -1.96 2038 1919 -119 -5.83
3Other Interest Income
145 454 355 210 144.23 273 690 417 153.20
4Interest Income (1+2+3)
4422 4372 4190 -232 -5.26 8993 8338 -655 -7.28
5 Fee Based Income 306 417 284 -22 -7.10 617 604 -14 -2.20
6 Trading Profit 233 173 272 39 16.76 428 604 176 41.02
7 Other Income 91 143 322 231 255.24 136 491 355 260.88
8Non-Interest Income (5+6+7)
629 733 878 249 39.52 1182 1698 517 43.75
9 Total Income (4+8) 5052 5105 5068 16 0.32 10175 10036 -138 -1.36
Y-o-Y Variation
Amt.
Q4
FY17
HY
Sep'17
Y-o-Y Variation
Amt. %
HY
Sep'16
Q2
FY17
Q2
FY18 %Sl. Parameters

Fee Based Income
Rs. in crore
19
1 Bills/LC/BG 73 62 66 -6 -8.89 162 152 -10 -6.38
2 Processing Fees 54 75 45 -10 -17.68 92 90 -2 -2.10
3 Exchange 76 121 44 -33 -42.77 141 101 -40 -28.35
4 Wealth Products 6 8 6 0 4.60 11 12 1 12.80
5Incidental
Charges12 12 16 4 37.95 20 18 -3 -12.80
6 Others** 85 139 107 22 26.19 191 231 40 20.86
7 Total 306 417 284 -22 -7.10 617 604 -14 -2.20
Y-o-Y Variation
Amt.
HY
Sep'17
Y-o-Y Variation
Amt. %
HY
Sep'16
Q2
FY18
Q4
FY17Sl.
No.Particulars
Q2
FY17
** Includes locker rent, commission- govt. business, ATM, NPCI Acquirer, service tax collection, documentation &
supervision charges, etc.
%

Rs. in crore
Break – up : Expenditure
20
1Interest Paid on
Deposits2919 2861 2758 -162 -5.54 5938 5480 -458 -7.71
2Interest Paid on
Borrowings154 150 178 24 15.78 313 361 48 15.44
3Total Interest Paid
(1+2)3073 3011 2936 -137 -4.47 6250 5841 -410 -6.55
4Establishment
Expenses581 538 454 -127 -21.84 1152 902 -250 -21.72
5Other Operating
Expenses427 491 455 28 6.53 835 901 66 7.92
6Operating Expenses
(4+5)1008 1028 909 -99 -9.82 1986 1802 -184 -9.26
7 Total Expenses (3+6) 4081 4039 3845 -236 -5.79 8237 7643 -594 -7.21
HY
Sep'16
HY
Sep'17
Y-o-Y Variation
Amt. %Q2
FY18
Sl.
No.Parameters
Q2
FY17
Q4
FY17
Y-o-Y Variation
Amt. %

Rs. in crore
Provisions
21
1 NPA 692 1490 1470 777 112.33 2267 3156 890 39.24
2 Standard Advance 85 -121 17 -68 -80.01 79 -113 -192
3Depreciation on
Investment28 233 76 48 172.72 -5 -32 -27
4 Income Tax 91 -476 -344 -435 293 -538 -831
5 Others 9 -172 -65 -75 -196 -179 17 -8.66
6 Total Provision 905 955 1153 247 27.33 2438 2294 -144 -5.89
HY
Sep'17
Y-o-Y
Variation
Amt. %
HY
Sep'16
Y-o-Y
Variation
Amt. %
Sl.
No.Parameters
Q2
FY17
Q2
FY18
Q4
FY17

Cost & Yield Ratios (Quarterly)
22
Sep'16 Mar'17 Jun'17 Sep'17
6.02
5.655.49 5.46
CoD
Sep'16 Mar'17 Jun'17 Sep'17
5.83
5.46
5.36 5.35
CoF
Sep'16 Mar'17 Jun'17 Sep'17
2.67
2.54
2.35 2.37
NIM
Sep'16 Mar'17 Jun'17 Sep'17
9.24
8.018.18 8.30
YoA
Sep'16 Mar'17 Jun'17 Sep'17
7.297.20
6.92
6.58
YoI
Sep'16 Mar'17 Jun'17 Sep'17
8.74
7.87 7.86 7.90
YoF
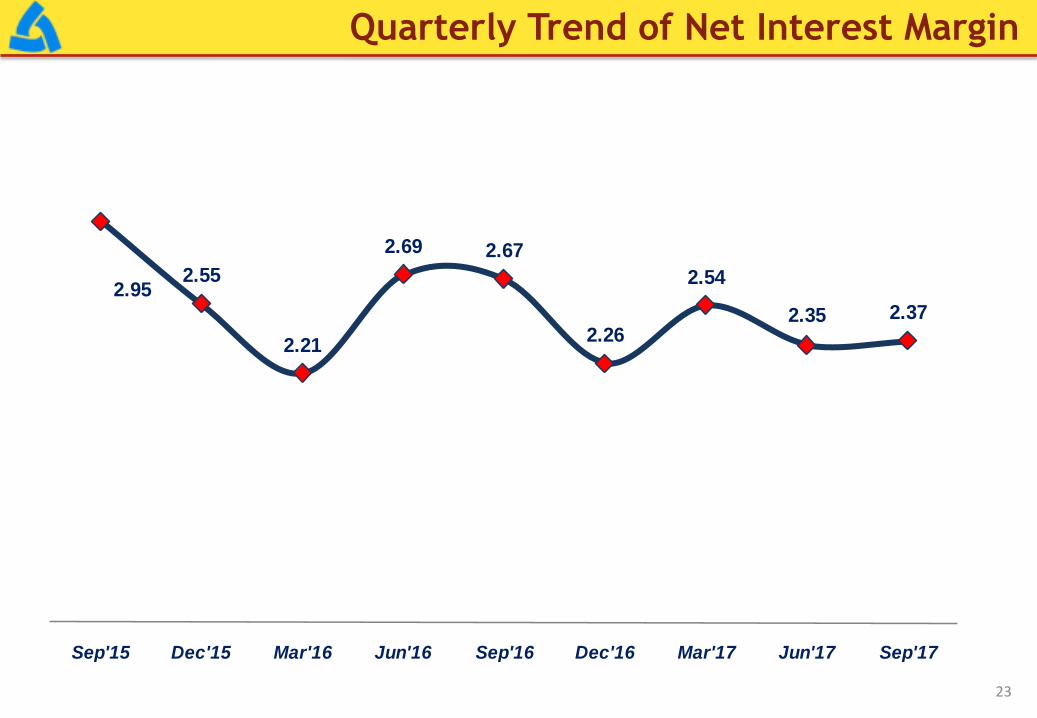
Quarterly Trend of Net Interest Margin
23
2.952.55
2.21
2.69 2.67
2.26
2.54
2.35 2.37
Sep'15 Dec'15 Mar'16 Jun'16 Sep'16 Dec'16 Mar'17 Jun'17 Sep'17

Profitability Ratios
24
Sl. ParametersQ2
FY17
Q4
FY17
Q2
FY18
HY
Sep'16
HY
Sep'17
1Return on Assets (%)
(Annualised)0.11 0.19 0.12 -0.44 0.08
2 Return on Networth (%) 2.25 3.78 2.30 -8.69 1.64
3 Operating Profit to AWF (%) 1.70 1.79 2.06 1.69 2.03
4 Cost to Income Ratio (%) 50.96 49.11 42.65 50.62 42.96
5 Estb. Exp. to Total Exp. (%) 14.23 13.31 11.81 13.98 11.80
6 Operating Exp. to AWF (%) 1.77 1.72 1.53 1.74 1.53
7 Book Value Per Share (Rs) 161 157 156 161 156
8Earnings per share (Rs)
(Non-annualised)0.90 1.49 0.90 -7.18 1.30

Ratios: Productivity
25
Sl. ParametersQ2
FY17FY17
Q2
FY18
1Average Business per
Branch (Rs. crore)104.70 106.52 107.35
2Average Business per
Employee (Rs. crore)13.89 14.44 14.27
3Profit/Loss per Employee
(Rs. Lac) (Annualised)1.06 -1.31 1.15

NPA Movement Rs. in crore
26
Sl. ParametersQ2
FY17FY17 Q2 FY18
HY
Sep'16
HY
Sep'17
1 NPA as at the beginning of the Qtr./ Half Year/ Year 19209 15385 21032 15385 20688
2 Cash Recovery 371 1612 457 655 1024
3 Upgradation 575 2060 295 1117 777
4Recovery in written-off debt A/cs
Intt. Received/derecognised Intt.253 767 355 415 519
5 Prudential Write Off done in the Qtr./ Half Year/ Year 632 2378 766 1069 1455
6 Sale of Assets to ARC 0 64 65 0 227
7 Total Reduction 1578 6114 1583 2841 3483
8 Fresh Addition for the Qtr./ Half Year/ Year 1365 10904 1702 6336 3706
8a Addition in existing NPA 99 513 303 215 544
9 NPA as at the end of the Qtr./ Half Year/ Year 19095 20688 21454 19095 21454
10 Provisions for Bad Debts 6224 7177 8668 6224 8668
11Counter Cyclical Provisions/DICGC/ECGC Claim received & Part
payment received and held in suspense A/c etc. 71 77 124 71 124
12 Net NPAs 12800 13434 12662 12800 12662
13Total NPA Reduction/ Recovery in NPA including
written-off debt A/cs1201 4439 1106 2187 2319

NPA Ratios
27
1 155544 158103 152180
Amount
(Rs. crore)19095 20688 21454
Ratio 12.28 13.09 14.10
Amount
(Rs. crore)12800 13434 12662
Ratio 8.59 8.92 8.84
4 47.60 50.11 54.33
Q2 FY17
Q2 FY18
FY17
3 NNPA
2 GNPA
Provision Coverage Ratio (%)
Total Advances
ParametersSl.

Restructured Accounts during Sep’17 quarter
Rs. in crore
28
No. 8 452 2683 3143
Amt. 704 318 2426 3449
0.46 0.21 1.59 2.27
OthersSME
Debt
Under
CDR
No./
Amt.ParticularsSl. Total
% to Gross Credit
1Standard
Advances
Flexible Restructuring under Different Schemes
Scheme S4A SDR 5/25 Total
No. of
accounts 8 18 12 38
Amount 1248.85 2479.62 5043.56 8772.03

Rs. in crore
29
Stressed Assets (Standard Restructured + GNPA)
Sep’16 Mar’17 Jun’17 Sep’17
Stressed
Assets
(Rs. Crore)
25642 25344 25097 24903
% to total
advances 16.85 16.65 16.49 16.36

Capital Adequacy Ratio- Basel III
CRAR
10.49%
Tier I
8.09%
CET
7.98%
AT1
0.11% Tier II
2.40%
SEP’16
SEP’17
CRAR
11.74%
Tier I
8.77%
CET
8.41%
AT1
0.36%
Tier II
2.97%
30

Capital Adequacy Ratio- Basel III
Rs. in crore
31
Sl. CRAR (under Basel-III): Regulatory Capital Sep'16 Sep'17
1 Common Equity Tier 1 Capital 12596 12782
2 Additional Tier 1 Capital 169 550
3 Total Tier 1 Capital (1+2) 12765 13332
4 Tier 2 Capital 3784 4513
5 Total Capital (3+4) 16549 17845
6 Common Equity Tier 1 Ratio (%) 7.98 8.41
7 Total Tier 1 Capital Ratio (%) 8.09 8.77
8 Tier 2 Capital (%) 2.40 2.97
9 Total Capital Ratio (%) 10.49 11.74
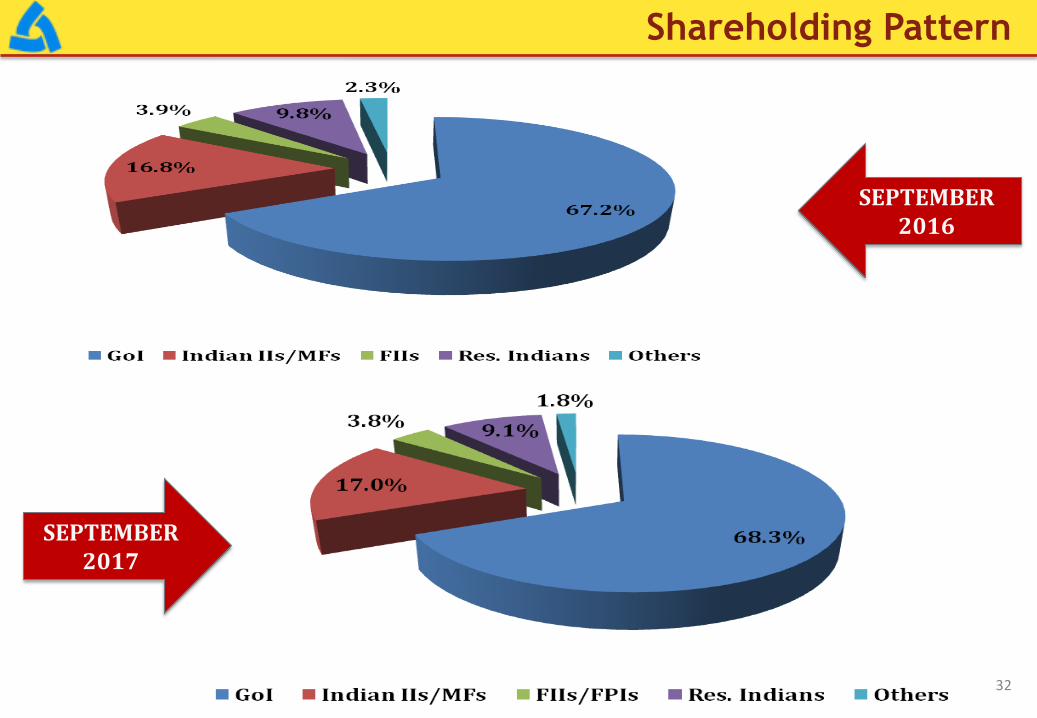
Shareholding Pattern
SEPTEMBER 2016
SEPTEMBER 2017
32

Networth of the Bank
33
Sl. No.
Components of Networth
Sep’16 Mar’17 Jun’17 Sep’17
1. Capital 723 744 744 800.21
2. Reserves 13510 13553 13813 14239
3. Networth (excluding revaluation reserve)
11609 11696 11968 12461
Rs. in crore

Domestic Branch Network as on 30.09.2017
Geography
Branches (% share to Total
Branches)
Central 253
(7.79%)
Eastern 1029
(31.68%)
Northern 1361
(41.90%)
North-Eastern 94
(2.89%)
Southern 223
(6.87%)
Western 288
(8.87%)
34
Population Branches
Rural 1206 (37.13%)
Semi-urban 766 (23.58%)
Urban 647 (19.92%)
Metro 629 (19.37%)
Total 3248

Financial Inclusion
35
Particulars Sep'16 Mar'17 Sep'17
FI Accounts Bank
(in lakh)119.01 130.92 138.35
Deposit Balance
(Rs crore)1661.84 2461.75 2724.51

MUDRA and Stand up India: Sep’17
36
PARAMETERS Bank as a whole
Disbursement Target (Rs. crore) (FY18) 2990
Amount Sanctioned (Rs. crore) Q2FY18 835
Achievement % (Sanction) 27.93%
Amount Disbursed (Rs. crore) Q2FY18 821
Achievement % (Disbursement) 27.46%
Since inception From 01.04.17 to 30.09.17
No. of A/cs
Amt. Sanctioned (Rs in Cr))
Amt. Disbursed
No. of A/cs
Amt. Sanctioned (Rs in Cr))
Amt. Disbursed
787 210.77 164.11 286 82.34 69.60

Forward Guidance
37
Low cost deposits
Asset quality management
Shifting of loan book to retail side
Profit maximisation

Thank You
www.allahabadbank.in