Embed Size (px)
Citation preview

Consolidated Financial Results for the Six Months ended March 31, 2008May 16, 2008
ID number : 6965 Stock listing : Tokyo Stock Exchange First SectionURL : http://www.hamamatsu.com/Representative : Teruo Hiruma, Chairman of the Board and Chief Executive OfficerContact : Yukiaki Suzuki, Director and General Manager of Accounting Div. (Phone : +81-53-452-2141)Scheduled date to submit interim securities report : June 17, 2008 Scheduled date to begin dividend payments : June 3, 2008
Note : All amounts are rounding down to the nearest million yen1. Consolidated financial results for the six months ended Mar. 31, 2008 (From Oct. 1, 2007 through Mar. 31, 2008)(1) Consolidated operating results
Notes: Percentage figures represent changes from the same period of the previous year.
Millions of yen % Millions of yen % Millions of yen % Millions of yen %
Yen Yen
Notes: Gain or (loss) on investments accounted for by equity method Six months ended Mar. 31, 2008 : 33 million yenSix months ended Mar. 31, 2007 : 71 million yen Fiscal year ended Sep. 30, 2007 : 95 million yen
(2) Consolidated financial position
Millions of yen Millions of yen % Yen
Notes: Shareholders' equity Six months ended Mar. 31, 2008 : 116,359 million yenSix months ended Mar. 31, 2007 : 96,200 million yen Fiscal year ended Sep. 30, 2007 : 112,995 million yen
(3) Consolidated cash flows
Millions of yen Millions of yen Millions of yen Millions of yen
2. Dividends
Yen Yen Yen
3. Forecast of consolidated results for the fiscal year ended Sep. 30, 2008 (From Oct. 1, 2007 through Sep. 30, 2008)Notes: Percentage figures represent changes from the same period of the previous year.
Millions of yen % Millions of yen % Millions of yen % Millions of yen % Yen
1.1 4.1 9.7
Cash and cash equivalentsat end of period
21,000 13,200
Net income per share
164.29
Ordinary income Net income
Dividends per share
Fiscal year endedSep. 30, 2008
Net sales Operating income
99,500 20,100
23.0043.00
3.3
Fiscal year endedSep. 30, 2008 (Outlook)
(Base date) Year end TotalInterim
20.00
20.00
23.00 43.00
18,188 (18,243) (11,597) 35,067
1,407.96
88.56 87.80
92.03 84.46
159.86 148.63
1,278.63
170,143 113,897
Fiscal year endedSep. 30, 2007
Six months endedMar. 31, 2007
Six months endedMar. 31, 2008
Net incomeper share
21.1
-
7,112 4.0
6,836 31.4
- 12,036
Net income
Six months endedMar. 31, 2008 49,475 2.1 10,780 (4.2) 11,454 0.0
Fiscal year endedSep. 30, 2007
Net sales Operating income Ordinary income
Six months endedMar. 31, 2007 48,435 11.7 11,257 20.9 11,449
67.5172,350
96,316 - 19,873
Diluted netincome per share
20,175-
(3,011) 6,084 48,121
Company name : Hamamatsu Photonics K.K.
1,448.26
Total assets Net Assets Shareholders' equityratio Net Assets per share
117,989
9,350 (13,627) (2,282) 40,030
Cash flows frominvesting activities
Cash flows fromfinancing activities
164,594 97,006 58.4
66.4
as of Mar. 31, 2008
as of Mar. 31, 2007
Six months endedMar. 31, 2008
Cash flows fromoperating activities
10,418
as of Sep. 30, 2007
Fiscal year endedSep. 30, 2007
Fiscal year endedSep. 30, 2007Fiscal year endedSep. 30, 2008
Six months endedMar. 31, 2007
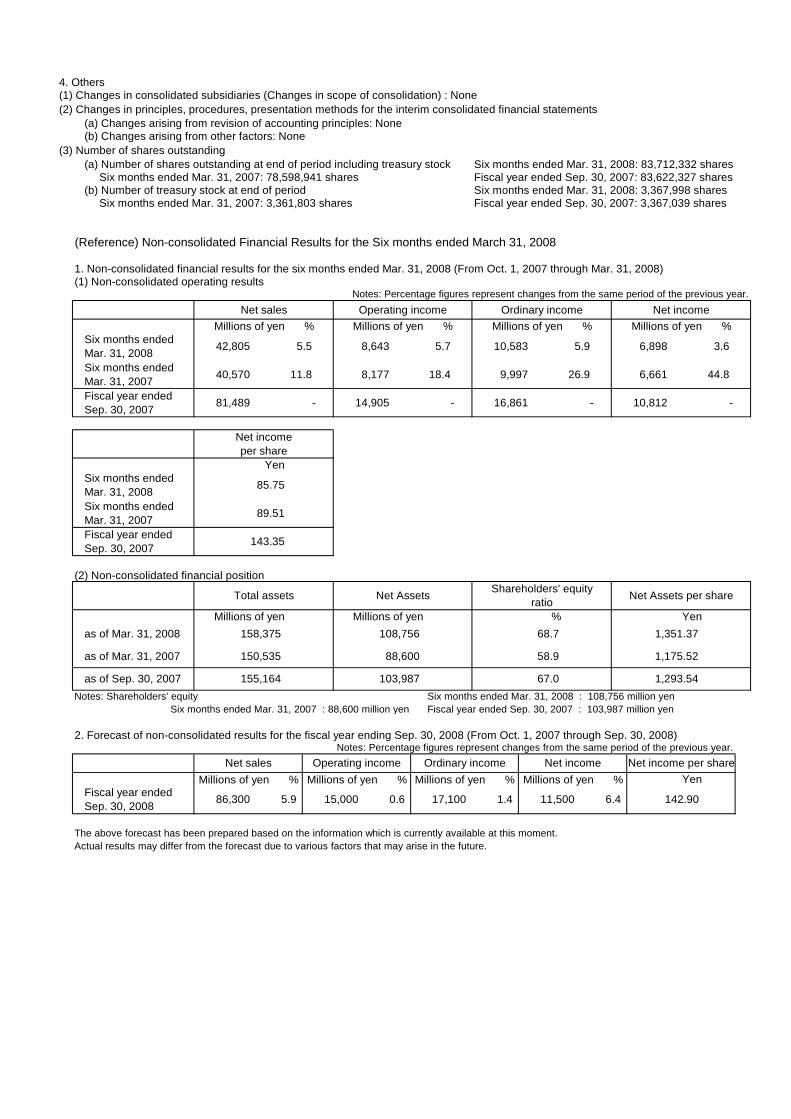
4. Others(1) Changes in consolidated subsidiaries (Changes in scope of consolidation) : None(2) Changes in principles, procedures, presentation methods for the interim consolidated financial statements
(a) Changes arising from revision of accounting principles: None(b) Changes arising from other factors: None
(3) Number of shares outstanding(a) Number of shares outstanding at end of period including treasury stock Six months ended Mar. 31, 2008: 83,712,332 shares
Six months ended Mar. 31, 2007: 78,598,941 shares Fiscal year ended Sep. 30, 2007: 83,622,327 shares(b) Number of treasury stock at end of period Six months ended Mar. 31, 2008: 3,367,998 shares
Six months ended Mar. 31, 2007: 3,361,803 shares Fiscal year ended Sep. 30, 2007: 3,367,039 shares
(Reference) Non-consolidated Financial Results for the Six months ended March 31, 2008
1. Non-consolidated financial results for the six months ended Mar. 31, 2008 (From Oct. 1, 2007 through Mar. 31, 2008)(1) Non-consolidated operating results
Notes: Percentage figures represent changes from the same period of the previous year.
Millions of yen % Millions of yen % Millions of yen % Millions of yen %
Yen
(2) Non-consolidated financial position
Millions of yen Millions of yen % Yen
Notes: Shareholders' equity Six months ended Mar. 31, 2008 : 108,756 million yenSix months ended Mar. 31, 2007 : 88,600 million yen Fiscal year ended Sep. 30, 2007 : 103,987 million yen
2. Forecast of non-consolidated results for the fiscal year ending Sep. 30, 2008 (From Oct. 1, 2007 through Sep. 30, 2008)Notes: Percentage figures represent changes from the same period of the previous year.
Millions of yen % Millions of yen % Millions of yen % Millions of yen % Yen
The above forecast has been prepared based on the information which is currently available at this moment. Actual results may differ from the forecast due to various factors that may arise in the future.
as of Mar. 31, 2008
as of Mar. 31, 2007 150,535 88,600
Net Assets per share
108,756 68.7158,375
81,489 - 14,905Fiscal year endedSep. 30, 2007
Net sales Operating income Ordinary income Net income
Six months endedMar. 31, 2008 42,805 5.5
Six months endedMar. 31, 2007 40,570 11.8
8,643 5.7
8,177 18.4
10,583 5.9
9,997 26.9
-
6,898 3.6
6,661 44.8
16,861 - 10,812-
Fiscal year endedSep. 30, 2007
Six months endedMar. 31, 2007
Six months endedMar. 31, 2008
Net incomeper share
1,293.54
85.75
89.51
143.35
1,175.5258.9
1,351.37
Total assets Net Assets Shareholders' equityratio
as of Sep. 30, 2007 155,164 103,987 67.0
Fiscal year endedSep. 30, 2008
Net sales Operating income
86,300 15,0005.9 0.6
Net income per share
142.90
Ordinary income Net income
1.4 6.417,100 11,500
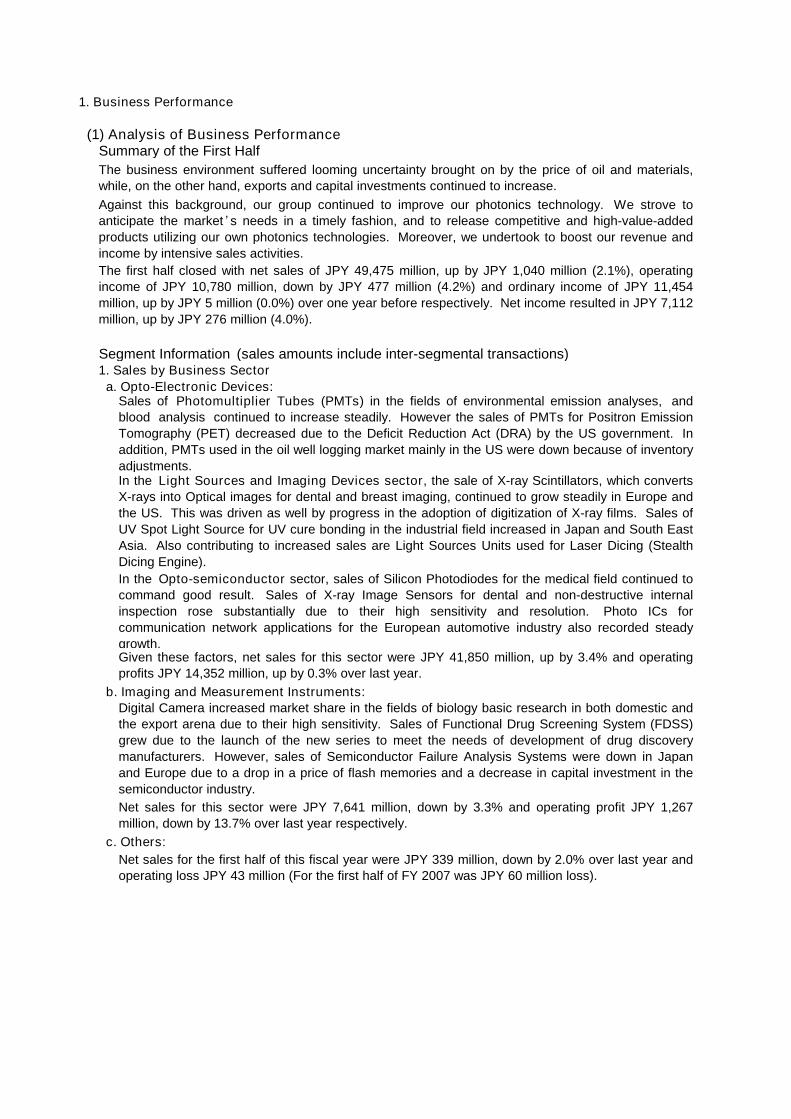
1. Business Performance
(1) Analysis of Business PerformanceSummary of the First Half
Segment Information (sales amounts include inter-segmental transactions)1. Sales by Business Sector a. Opto-Electronic Devices:
b. Imaging and Measurement Instruments:
c. Others:
The business environment suffered looming uncertainty brought on by the price of oil and materials,while, on the other hand, exports and capital investments continued to increase.Against this background, our group continued to improve our photonics technology. We strove toanticipate the market’s needs in a timely fashion, and to release competitive and high-value-addedproducts utilizing our own photonics technologies. Moreover, we undertook to boost our revenue andincome by intensive sales activities.The first half closed with net sales of JPY 49,475 million, up by JPY 1,040 million (2.1%), operatingincome of JPY 10,780 million, down by JPY 477 million (4.2%) and ordinary income of JPY 11,454million, up by JPY 5 million (0.0%) over one year before respectively. Net income resulted in JPY 7,112million, up by JPY 276 million (4.0%).
Sales of Photomultiplier Tubes (PMTs) in the fields of environmental emission analyses, andblood analysis continued to increase steadily. However the sales of PMTs for Positron EmissionTomography (PET) decreased due to the Deficit Reduction Act (DRA) by the US government. Inaddition, PMTs used in the oil well logging market mainly in the US were down because of inventoryadjustments.
Net sales for this sector were JPY 7,641 million, down by 3.3% and operating profit JPY 1,267million, down by 13.7% over last year respectively.
Net sales for the first half of this fiscal year were JPY 339 million, down by 2.0% over last year andoperating loss JPY 43 million (For the first half of FY 2007 was JPY 60 million loss).
In the Light Sources and Imaging Devices sector, the sale of X-ray Scintillators, which convertsX-rays into Optical images for dental and breast imaging, continued to grow steadily in Europe andthe US. This was driven as well by progress in the adoption of digitization of X-ray films. Sales ofUV Spot Light Source for UV cure bonding in the industrial field increased in Japan and South EastAsia. Also contributing to increased sales are Light Sources Units used for Laser Dicing (StealthDicing Engine).In the Opto-semiconductor sector, sales of Silicon Photodiodes for the medical field continued tocommand good result. Sales of X-ray Image Sensors for dental and non-destructive internalinspection rose substantially due to their high sensitivity and resolution. Photo ICs forcommunication network applications for the European automotive industry also recorded steadygrowth.Given these factors, net sales for this sector were JPY 41,850 million, up by 3.4% and operatingprofits JPY 14,352 million, up by 0.3% over last year.
Digital Camera increased market share in the fields of biology basic research in both domestic andthe export arena due to their high sensitivity. Sales of Functional Drug Screening System (FDSS)grew due to the launch of the new series to meet the needs of development of drug discoverymanufacturers. However, sales of Semiconductor Failure Analysis Systems were down in Japanand Europe due to a drop in a price of flash memories and a decrease in capital investment in thesemiconductor industry.
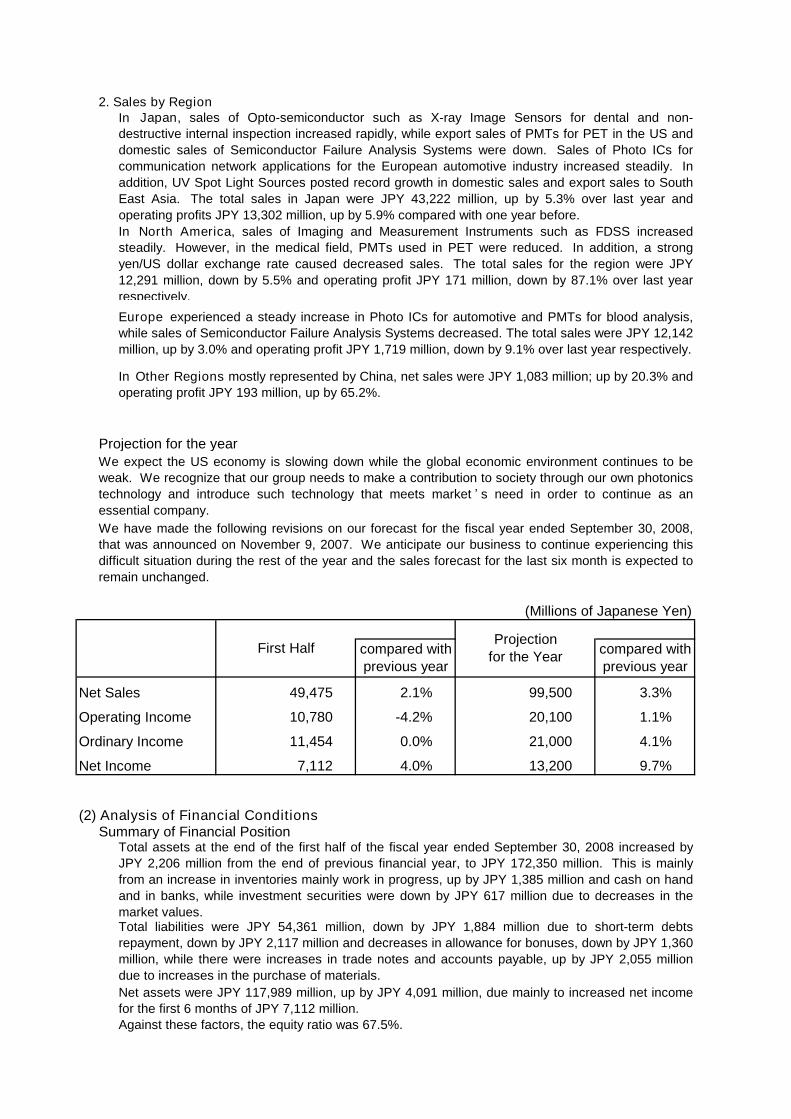
2. Sales by Region
Projection for the year
(Millions of Japanese Yen)
Net Sales
Operating Income
Ordinary Income
Net Income
(2) Analysis of Financial ConditionsSummary of Financial Position
Total assets at the end of the first half of the fiscal year ended September 30, 2008 increased byJPY 2,206 million from the end of previous financial year, to JPY 172,350 million. This is mainlyfrom an increase in inventories mainly work in progress, up by JPY 1,385 million and cash on handand in banks, while investment securities were down by JPY 617 million due to decreases in themarket values.Total liabilities were JPY 54,361 million, down by JPY 1,884 million due to short-term debtsrepayment, down by JPY 2,117 million and decreases in allowance for bonuses, down by JPY 1,360million, while there were increases in trade notes and accounts payable, up by JPY 2,055 milliondue to increases in the purchase of materials.
Against these factors, the equity ratio was 67.5%.
Net assets were JPY 117,989 million, up by JPY 4,091 million, due mainly to increased net incomefor the first 6 months of JPY 7,112 million.
We expect the US economy is slowing down while the global economic environment continues to beweak. We recognize that our group needs to make a contribution to society through our own photonicstechnology and introduce such technology that meets market ’s need in order to continue as anessential company.
compared withprevious year
compared withprevious year
First Half Projectionfor the Year
We have made the following revisions on our forecast for the fiscal year ended September 30, 2008,that was announced on November 9, 2007. We anticipate our business to continue experiencing thisdifficult situation during the rest of the year and the sales forecast for the last six month is expected toremain unchanged.
In Japan, sales of Opto-semiconductor such as X-ray Image Sensors for dental and non-destructive internal inspection increased rapidly, while export sales of PMTs for PET in the US anddomestic sales of Semiconductor Failure Analysis Systems were down. Sales of Photo ICs forcommunication network applications for the European automotive industry increased steadily. Inaddition, UV Spot Light Sources posted record growth in domestic sales and export sales to SouthEast Asia. The total sales in Japan were JPY 43,222 million, up by 5.3% over last year andoperating profits JPY 13,302 million, up by 5.9% compared with one year before.In North America, sales of Imaging and Measurement Instruments such as FDSS increasedsteadily. However, in the medical field, PMTs used in PET were reduced. In addition, a strongyen/US dollar exchange rate caused decreased sales. The total sales for the region were JPY12,291 million, down by 5.5% and operating profit JPY 171 million, down by 87.1% over last yearrespectively.Europe experienced a steady increase in Photo ICs for automotive and PMTs for blood analysis,while sales of Semiconductor Failure Analysis Systems decreased. The total sales were JPY 12,142million, up by 3.0% and operating profit JPY 1,719 million, down by 9.1% over last year respectively.
In Other Regions mostly represented by China, net sales were JPY 1,083 million; up by 20.3% andoperating profit JPY 193 million, up by 65.2%.
11,454
7,112
2.1%
-4.2%
0.0%
4.0%
49,475
10,780
21,000
13,200
3.3%
1.1%
4.1%
9.7%
99,500
20,100

Summary of Cash Flow
(Reference) Trends in Cash-Flow Indicators
Net Assets Ratio (%)
Notes: Calculation Methods of the above indicators are as following;Net Assets Ratio: Net Assets / Total assetsNet Assets Ratio based on Current Market Price: Total market value of common stock / Total assets
Interest Coverage Ratio: Net cash provided by operating activities / interest payments* All indicators are calculated based on consolidated financial figures.*
*
*
(3) Basic Policy for Allocation of Profit and Dividend for FY 2007Our group understands that investment in technical development and the creation of a new industryaimed towards the increase in our business value is essential for establishing our status as theleading company in the industry of Light in the 21st century. We maintain a high level of retainedearnings to reach that goal.Regarding our shareholders, we will continue to place the highest priority on an allocation of profit asdividends. Our dividend policy centers on efforts to maintain stable growth of profit per share anddividend along with increased corporate profitability based on our long-term vision.
Interest-bearing debt refers to all the debts in the Consolidated Balance Sheets which involveinterest payment. Interest payments refer to the figure for the amount of interest paid in theConsolidated Statements of Cash Flows.
At the end of the first half of this fiscal year, cash and cash equivalent stood at JPY 48,121 million,up by JPY 13,054 million from the end of the previous fiscal year.
Debt Redemption Period(Years)Interest Coverage Ratio(Times)
Debt Redemption Period: Interest-bearing debt / Net cash provided by operating activities
2.8 2.2 1.5
Investment activity required a cash flow of JPY 3,011 million, down by JPY 10,616 million fromprevious year due mainly to decreases in time deposits and acquisitions of tangible fixed assets.Financial activity increased cash flow of JPY 6,084 million due mainly to reimbursement ofredemption of convertible debentures, while there was long-term debts repayment.
Cash flow created from operations for the period was JPY 10,418 million, up by JPY 1,067 millionover last year. This is mainly from an increase in accounts payable and depreciations, while therewere increases in inventories.
Net Assets Ratio Based onCurrent Market Price (%) 129.6
FY 2006 FY 2007
101.0 117.9 166.2
1.2
FY 2008Interim
42.8 40.4 54.2 66.4 67.5
FY 2004 FY 2005
Based on this policy, for the first half of FY 2008, we are schedule to pay JPY 20 per share as aninterim dividend. We anticipate paying another JPY 23 per share as a year-end dividend.
156.6
Total market value of common stock is calculated by multiplying the closing stock price at the end ofeach period by the number of shares issued (excluding treasury stock) at that end of the period.Net cash provided by operating activities refers to activities detailed in the Consolidated Statementsof Cash Flows.
118.354.7 82.7 111.1 123.0
0.8
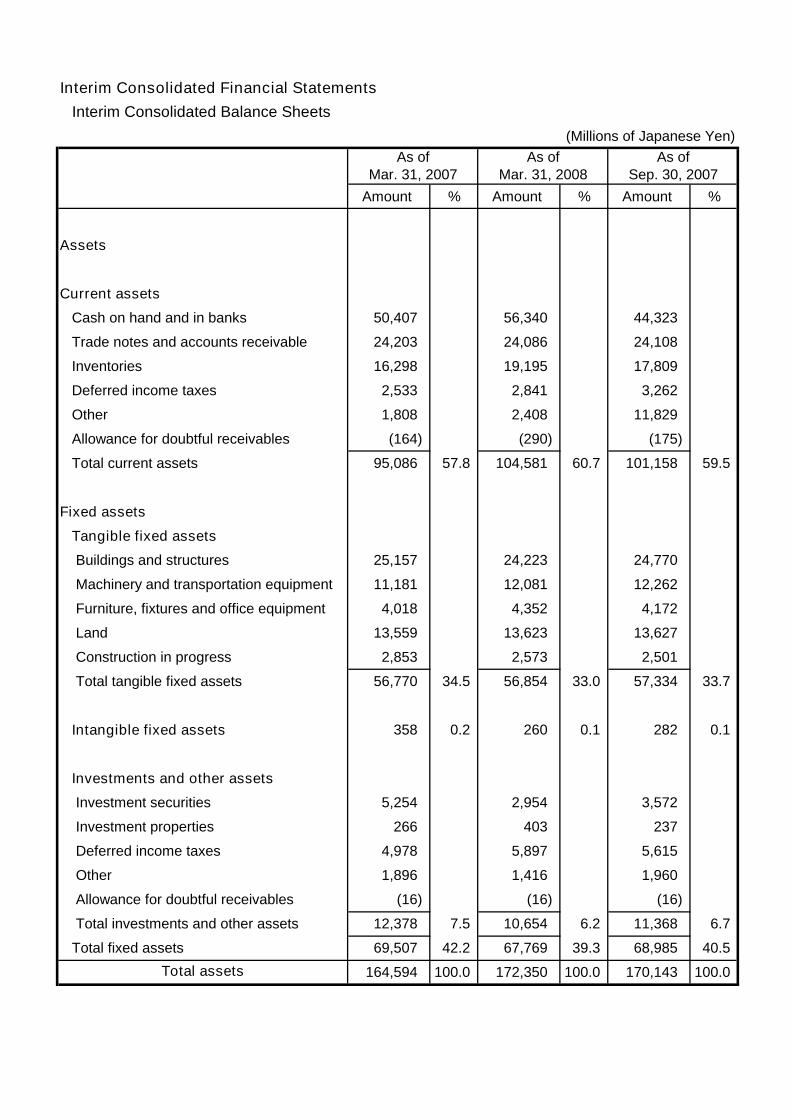
Interim Consolidated Financial StatementsInterim Consolidated Balance Sheets
(Millions of Japanese Yen)
Amount % Amount % Amount %
Assets
Current assetsCash on hand and in banks 50,407 56,340 44,323
Trade notes and accounts receivable 24,203 24,086 24,108
Inventories 16,298 19,195 17,809
Deferred income taxes 2,533 2,841 3,262
Other 1,808 2,408 11,829
Allowance for doubtful receivables (164) (290) (175)
Total current assets 95,086 57.8 104,581 60.7 101,158 59.5
Fixed assetsTangible fixed assets Buildings and structures 25,157 24,223 24,770
Machinery and transportation equipment 11,181 12,081 12,262
Furniture, fixtures and office equipment 4,018 4,352 4,172
Land 13,559 13,623 13,627
Construction in progress 2,853 2,573 2,501
Total tangible fixed assets 56,770 34.5 56,854 33.0 57,334 33.7
Intangible fixed assets 358 0.2 260 0.1 282 0.1
Investments and other assets Investment securities 5,254 2,954 3,572
Investment properties 266 403 237
Deferred income taxes 4,978 5,897 5,615
Other 1,896 1,416 1,960
Allowance for doubtful receivables (16) (16) (16)
Total investments and other assets 12,378 7.5 10,654 6.2 11,368 6.7
Total fixed assets 69,507 42.2 67,769 39.3 68,985 40.5
164,594 100.0 172,350 100.0 170,143 100.0Total assets
As ofSep. 30, 2007
As ofMar. 31, 2008
As ofMar. 31, 2007

Interim Consolidated Financial StatementsInterim Consolidated Balance Sheets
(Millions of Japanese Yen)
Amount % Amount % Amount %
Liabilities
Current liabilitiesTrade notes and accounts payable 12,174 13,580 11,525Short-term bank loans and current portion of long-term debt 8,517 2,699 3,726
Current portion of convertible debentures 12,580 - -Income taxes payable 3,446 3,505 3,458Accrued bonuses 2,613 2,654 4,014Notes payable - construction 1,725 762 797Other 8,591 8,471 8,885Total current liabilities 49,649 30.2 31,673 18.4 32,407 19.1
Long-term liabilitiesNon-collateral bonds with warrants to buy stocks 2,568 1,473 1,673
Long-term bank loans 1,946 7,307 8,398Allowance for employees' retirement and severance benefits 11,831 12,315 12,085
Allowance for retirement benefits for directors and corporate auditors 1,419 1,487 1,452
Other 174 104 229Total long-term liabilities 17,938 10.9 22,687 13.1 23,838 14.0
Total liabilities 67,588 41.1 54,361 31.5 56,246 33.1
Net asset
Shareholders' equity
Common stock 28,057 34,870 34,770
Capital surplus 27,805 34,614 34,514
Retained earnings 44,156 53,146 47,835
Less treasury stock, at cost (6,021) (6,042) (6,039)
Total shareholders' equity 93,998 57.1 116,588 67.7 111,080 65.3
Unrealized gains and adjustment
Unrealized gain on securities, net of tax 1,764 627 1,103
Deferred Hedge Gain (Loss) (22) 62 0
Foreign Currency Translation Adjustment 460 (919) 811
Total Unrealized gains and adjustment 2,202 1.3 (228) (0.1) 1,915 1.1
Minority interests in consolidated subsidiaries 805 0.5 1,629 0.9 901 0.5
97,006 58.9 117,989 68.5 113,897 66.9
164,594 100.0 172,350 100.0 170,143 100.0
Total net assetTotal liabilities and net asset
As ofSep. 30, 2007
As ofMar. 31, 2007
As ofMar. 31, 2008

Interim Consolidated Financial StatementsInterim Consolidated Statements of Income
(Millions of Japanese Yen)
% % %
Net sales 48,435 100.0 49,475 100.0 96,316 100.0Cost of sales 21,856 45.1 22,565 45.6 44,356 46.1
Gross profit 26,578 54.9 26,909 54.4 51,960 53.9Selling, general and administrative expenses 15,321 31.7 16,129 32.6 32,086 33.3
Operating income 11,257 23.2 10,780 21.8 19,873 20.6Non-operating income
Interest income 147 242 342Dividend income 10 20 46Rental income on fixed assets 57 55 115Rental income on investment property 72 68 129Foreign exchange gain - 309 -Gain on investments accounted for by the equity method 71 33 95Other 118 479 1.0 108 839 1.7 192 923 1.0
Non-operating expensesInterest expenses 75 88 147Expenses for investment property 43 65 64Foreign exchange loss 166 - 387Other 1 287 0.6 11 165 0.3 21 621 0.7Ordinary income 11,449 23.6 11,454 23.2 20,175 20.9
Extraordinary incomeGain on sales of fixed assets 7 59 14Subsidy income 173 178 327Gain on sales of investment securities - 180 0.4 26 264 0.5 5 346 0.4
Extraordinary lossLoss on sales and disposal of fixed assets 110 62 238Advanced depreciations 71 153 222Loss on revaluation of investment securities - 7 33Impairment of assets held for sale 121 - 122Loss on reorganization of subsidiary 27 - 65Provision of retirement benefit for directors and corporate auditors for prior years 8 339 0.7 - 223 0.5 8 691 0.7
Income before income taxes and minority interests 11,290 23.3 11,494 23.2 19,831 20.6Income taxes 3,635 3,877 7,464Income taxes in previous years - 245 100Income taxes refund in previous years - - (257)Deferred income taxes 760 4,395 9.1 197 4,320 8.7 381 7,688 8.0Minority interests in consolidated subsidiaries 57 0.1 61 0.1 106 0.1Net income 6,836 14.1 7,112 14.4 12,036 12.5
Six months endedMar. 31, 2007
Six months endedMar. 31, 2008
Fiscal year endedSep. 30, 2006
Amount Amount Amount

Interim Consolidated Financial Statements
Interim Consolidated Statements of Changes in Shareholders' Equity
Six Months ended March 31, 2007(Millions of Japanese Yen)
Balance at Sep. 30, 2006 26,487 26,236 38,802 (6,016) 85,509
Changes during the period
Conversion of convertible debentures 1,043 1,043 - - 2,086
Exercise of stock subscription rights 525 526 - - 1,052
Dividends from surplus - - (1,482) - (1,482)
Net income for the period - - 6,836 - 6,836
Purchases of treasury stock - - - (4) (4)Changes, net, in items other than shareholders' equity - - - - -
Total changes during the period 1,569 1,569 5,353 (4) 8,488
Balance at Mar. 31, 2007 28,057 27,805 44,156 (6,021) 93,998
(Millions of Japanese Yen)
Balance at Sep. 30, 2006 1,712 (53) 135 1,794 839 88,143
Changes during the period
Conversion of convertible debentures - - - - - 2,086
Exercise of stock subscription rights - - - - - 1,052
Dividends from surplus - - - - - (1,482)
Net income for the period - - - - - 6,836
Purchases of treasury stock - - - - - (4)Changes, net, in items other than shareholders' equity 51 30 324 407 (33) 373
Total changes during the period 51 30 324 407 (33) 8,862
Balance at Mar. 31, 2007 1,764 (22) 460 2,202 805 97,006
Commonstock
Capitalsurplus
Retainedearnings
Totalnet assets
Totalshareholders'
equity
Treasurystock,at cost
Shareholders' Equity
Revaluation and Translation Adjustments
Minorityinterests
Unrealizedgain/loss on
securities
Deferredhedge
gain/loss
Foreigncurrency
translationadjustments
Totalrevaluation &
translationadjustments

Consolidated Financial Statements
Consolidated Statements of Changes in Shareholders' Equity
Six Months ended March 31, 2008(Millions of Japanese Yen)
Balance at Sep. 30, 2007 34,770 34,514 47,835 (6,039) 111,080
Changes during the period
Exercise of stock subscription rights 99 100 - - 200
Dividends from surplus - - (1,848) - (1,848)
Net income for the period - - 7,112 - 7,112
Employee's bonus and welfare fund - - (16) - (16)
Changes of interests in subsidiaries - - 64 - 64
Purchases of treasury stock - - - (3) (3)Changes, net, in items other than shareholders' equity - - - - -
Total changes during the period 99 100 5,311 (3) 5,507
Balance at Mar. 31, 2008 34,870 34,614 53,146 (6,042) 116,588
(Millions of Japanese Yen)
Balance at Sep. 30, 2007 1,103 0 811 1,915 901 113,897
Changes during the period
Exercise of stock subscription rights - - - - - 200
Dividends from surplus - - - - - (1,848)
Net income for the period - - - - - 7,112
Employee's bonus and welfare fund - - - - - (16)
Changes of interests in subsidiaries - - - - - 64
Purchases of treasury stock - - - - - (3)Changes, net, in items other than shareholders' equity (476) 62 (1,730) (2,144) 728 (1,416)
Total changes during the period (476) 62 (1,730) (2,144) 728 4,091
Balance at Mar. 31, 2008 627 62 (919) (228) 1,629 117,989
Totalnet assets
Totalshareholders'
equity
Treasurystock,at cost
Shareholders' Equity
Revaluation and Translation Adjustments
Minorityinterests
Unrealizedgain/loss on
securities
Deferredhedge
gain/loss
Foreigncurrency
translationadjustments
Totalrevaluation &
translationadjustments
Commonstock
Capitalsurplus
Retainedearnings

Consolidated Financial Statements
Consolidated Statements of Changes in Shareholders' Equity
Fiscal year ended September 30, 2007(Millions of Japanese Yen)
Balance at Sep. 30, 2006 26,487 26,236 38,802 (6,016) 85,509
Changes during the period
Conversion of convertible debentures 7,309 7,304 - - 14,613
Exercise of stock subscription rights 973 973 - - 1,947
Dividends from surplus - - (2,990) - (2,990)
Net income for the period - - 12,036 - 12,036
Employee's bonus and welfare fund (13) - (13)
Purchases of treasury stock - - - (22) (22)Changes, net, in items other than shareholders' equity - - - - -
Total changes during the period 8,282 8,277 9,033 (22) 25,570
Balance at Sep. 30, 2007 34,770 34,514 47,835 (6,039) 111,080
(Millions of Japanese Yen)
Balance at Sep. 30, 2006 1,712 (53) 135 1,794 839 88,143
Changes during the period
Conversion of convertible debentures - - - - - 14,613
Exercise of stock subscription rights - - - - - 1,947
Dividends from surplus - - - - - (2,990)
Net income for the period - - - - - 12,036
Employee's bonus and welfare fund - - - - - (13)
Purchases of treasury stock - - - - - (22)Changes, net, in items other than shareholders' equity (608) 53 676 120 61 182
Total changes during the period (608) 53 676 120 61 25,753
Balance at Sep. 30, 2007 1,103 0 811 1,915 901 113,897
Totalnet assets
Totalshareholders'
equity
Treasurystock,at cost
Shareholders' Equity
Revaluation and Translation Adjustments
Minorityinterests
Unrealizedgain/loss on
securities
Deferredhedge
gain/loss
Foreigncurrency
translationadjustments
Totalrevaluation &
translationadjustments
Commonstock
Capitalsurplus
Retainedearnings

Interim Consolidated Financial StatementsInterim Consolidated Statements of Cash Flow
(Millions of Japanese Yen)
Cash flows from operating activitiesIncome before income taxes and minority interests 11,290 11,494 19,831Depreciation 3,630 4,281 8,031Increase (decrease) in allowance for doubtful accounts 15 140 26Increase (decrease) in allowance for bonuses (2,395) (1,351) (1,004)Increase in allowance for retirement and severance benefits 355 230 609Increase in allowance for retirement benefit for directors and corporate auditors 33 34 66
Interest and dividend income (158) (263) (389)Interest expense 75 88 147Foreign exchange (gain) loss (18) (32) (55)(Gain) loss on investments accounted for by the equity method (71) (33) (95)
Loss on disposal of fixed assets 105 55 233(Gain) loss on sales of fixed assets (2) (51) (9)(Increase) decrease in receivables, trade (1,001) (687) (839)(Increase) decrease in inventories (804) (1,829) (2,231)Increase (decrease) in payables, trade 711 2,673 72Payment of bonuses to directors and corporate auditors (60) - (60)Other 1,966 (811) 2,055Subtotal 13,673 13,937 26,390Interest and dividend received 158 263 394Interest expense paid (75) (88) (147)Income taxes paid (4,405) (3,694) (8,449)Net cash provided by operating activities 9,350 10,418 18,188
Cash flows from investing activities(Increase) decrease in time deposits (7,242) 1,529 (6,142)Payments for acquisition of marketable securities (73) (1,925) (75)Proceeds from sales of marketable securities - 1,398 -Payments for acquisition of fixed assets (6,220) (4,060) (11,889)Proceeds from sales of fixed assets 19 119 33Payments for acquisition of intangible fixed assets (74) (87) (164)Proceeds from sales of investment securities - 35 8Other (36) (21) (12)Net cash used in investing activities (13,627) (3,011) (18,243)
Cash flows from financing activitiesIncrease (decrease) in short-term debt (675) (19) (785)Proceeds from long-term debt 26 16 6,676Payment of long-term debt (110) (2,115) (5,008)Payments for acquisition of treasury stock (4) (3) (22)Proceeds from redemption of convertible debenture - 9,372 -Dividends paid by the parent company (1,479) (1,849) (2,988)Other (40) 683 (9,470)Net cash provided by (used in) financing activities (2,282) 6,084 (11,597)
157 (438) 286
(6,402) 13,054 (11,365)Cash and cash equivalents at beginning of period 46,433 35,067 46,433Cash and cash equivalents at end of period 40,030 48,121 35,067
Fiscal year endedSep. 30, 2007
Net increase (decrease) in cash and cash equivalents
Effect of exchange rate changes on cash and cash equivalents
Six months endedMar. 31, 2007
Six months endedMar. 31, 2008

Segment InformationBusiness Segment
Six months ended March 31, 2007 (Millions of Japanese Yen)
Net salesOutside customers 40,190 7,898 346 48,435 - 48,435Intersegment 275 4 - 280 (280) -
Total net sales 40,465 7,903 346 48,715 (280) 48,435Operating expenses 26,152 6,433 407 32,993 4,184 37,177Operating income(loss) 14,313 1,469 (60) 15,722 (4,464) 11,257
Six months ended March 31, 2008 (Millions of Japanese Yen)
Net salesOutside customers 41,518 7,617 339 49,475 - 49,475Intersegment 332 23 - 356 (356) -
Total net sales 41,850 7,641 339 49,831 (356) 49,475Operating expenses 27,498 6,373 382 34,254 4,440 38,695Operating income(loss) 14,352 1,267 (43) 15,577 (4,796) 10,780
Fiscal year ended September 30, 2007 (Millions of Japanese Yen)
Net salesOutside customers 79,966 15,685 664 96,316 - 96,316Intersegment 542 10 - 552 (552) -
Total net sales 80,509 15,695 664 96,869 (552) 96,316Operating expenses 53,476 13,012 788 67,278 9,164 76,442Operating income(loss) 27,032 2,682 (124) 29,590 (9,716) 19,873
Notes:1. Business segments are classified based on the similarities of products, markets and so on.2. Major products in each business segment ;
3.
Consolidatedtotal
Operating expenses in elimination or corporate are principally basic research and corporate general andadministrative expenses which can not be allocated to each business segment. The amounts of thoseexpenses were 4,336 million yen, 4,632 million yen and 9,472 million yen for the six months ended Mar. 31,2007, 2008 and the fiscal year ended Sep. 30, 2007, respectively.
Opto-electronic devices
Imaging and measurementinstruments
Other
Photomultiplier Tubes, Imaging Devices and Light Sources (X-rayScintillator, X-ray Image Intensifier, Microchannel Plate, Deuterium Lamp,Spot Light Source, Microfocus X-ray Source), Opto-semiconductors (PhotoDiode, Infrared Detector, Image Sensor, Light Emitting Diode, Photo IC)Image Processing and Measurement Systems (Special Purpose VideoCamera, Image Processing System, Low-Level Light Image AcquisitionSystem, Ultrafast Optical Measurement System, Image Processing andAnalysis System for Optical Microscope, Nondestructive InspectionSystem)Photosensitizer R&D, Hotel operations
Opto-electronicdevices
Imaging andmeasurementinstruments
Other Segmenttotal
Eliminationor corporate
Segmenttotal
Eliminationor corporate
Consolidatedtotal
Opto-electronicdevices
Imaging andmeasurementinstruments
Other Segmenttotal
Eliminationor corporate
Consolidatedtotal
Opto-electronicdevices
Imaging andmeasurementinstruments
Other
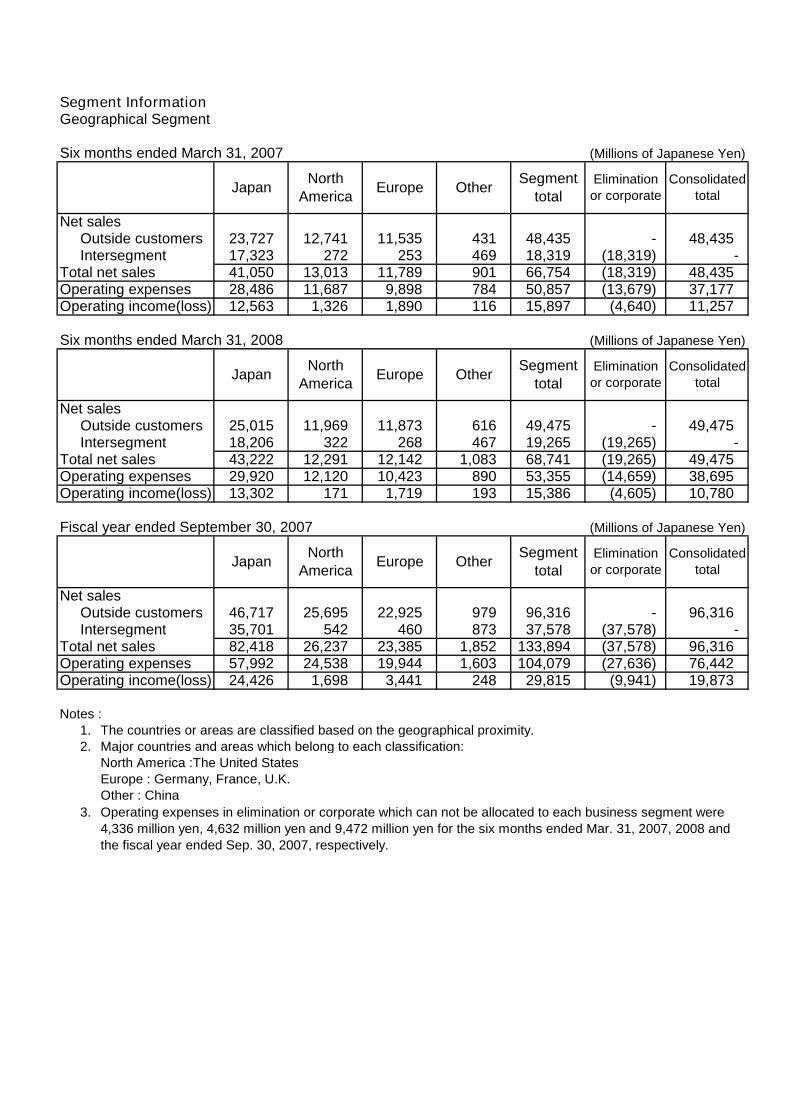
Segment InformationGeographical Segment
Six months ended March 31, 2007 (Millions of Japanese Yen)
Net salesOutside customers 23,727 12,741 11,535 431 48,435 - 48,435Intersegment 17,323 272 253 469 18,319 (18,319) -
Total net sales 41,050 13,013 11,789 901 66,754 (18,319) 48,435Operating expenses 28,486 11,687 9,898 784 50,857 (13,679) 37,177Operating income(loss) 12,563 1,326 1,890 116 15,897 (4,640) 11,257
Six months ended March 31, 2008 (Millions of Japanese Yen)
Net salesOutside customers 25,015 11,969 11,873 616 49,475 - 49,475Intersegment 18,206 322 268 467 19,265 (19,265) -
Total net sales 43,222 12,291 12,142 1,083 68,741 (19,265) 49,475Operating expenses 29,920 12,120 10,423 890 53,355 (14,659) 38,695Operating income(loss) 13,302 171 1,719 193 15,386 (4,605) 10,780
Fiscal year ended September 30, 2007 (Millions of Japanese Yen)
Net salesOutside customers 46,717 25,695 22,925 979 96,316 - 96,316Intersegment 35,701 542 460 873 37,578 (37,578) -
Total net sales 82,418 26,237 23,385 1,852 133,894 (37,578) 96,316Operating expenses 57,992 24,538 19,944 1,603 104,079 (27,636) 76,442Operating income(loss) 24,426 1,698 3,441 248 29,815 (9,941) 19,873
Notes :1. The countries or areas are classified based on the geographical proximity.2. Major countries and areas which belong to each classification:
North America :The United StatesEurope : Germany, France, U.K.Other : China
3. Operating expenses in elimination or corporate which can not be allocated to each business segment were4,336 million yen, 4,632 million yen and 9,472 million yen for the six months ended Mar. 31, 2007, 2008 andthe fiscal year ended Sep. 30, 2007, respectively.
Eliminationor corporate
Consolidatedtotal
Consolidatedtotal
Consolidatedtotal
Japan NorthAmerica Europe
Japan
Eliminationor corporate
Eliminationor corporate
SegmenttotalOther
Segmenttotal
Segmenttotal
Japan NorthAmerica Europe Other
OtherEuropeNorthAmerica

Segment InformationOverseas sales
Six months ended March 31, 2007 (Millions of Japanese Yen)
Overseas sales 12,446 11,475 5,909 257 30,088
Consolidated net sales - - - - 48,435
25.7% 23.7% 12.2% 0.5% 62.1%
Six months ended March 31, 2008 (Millions of Japanese Yen)
Overseas sales 11,778 11,772 7,002 255 30,809
Consolidated net sales - - - - 49,475
23.8% 23.8% 14.2% 0.5% 62.3%
Fiscal year ended September 30, 2007 (Millions of Japanese Yen)
Other
Overseas sales 25,108 22,690 12,825 534 61,159
Consolidated net sales - - - - 96,316
26.1% 23.6% 13.3% 0.5% 63.5%
Notes :1. The countries or areas are classified based on the geographical proximity.2. Major countries and areas which belong to each classification:
North America :The United StatesEurope : Germany, France, U.K.Asia : Israel, India, China, Korea, TaiwanOther : Australia
Ratio of overseas sales to consolidated net sales
Europe Asia
Ratio of overseas sales to consolidated net sales
Ratio of overseas sales to consolidated net sales
Consolidatedtotal
NorthAmerica Europe Asia Other
NorthAmerica
Consolidatedtotal
NorthAmerica Europe Asia
Other
Consolidatedtotal
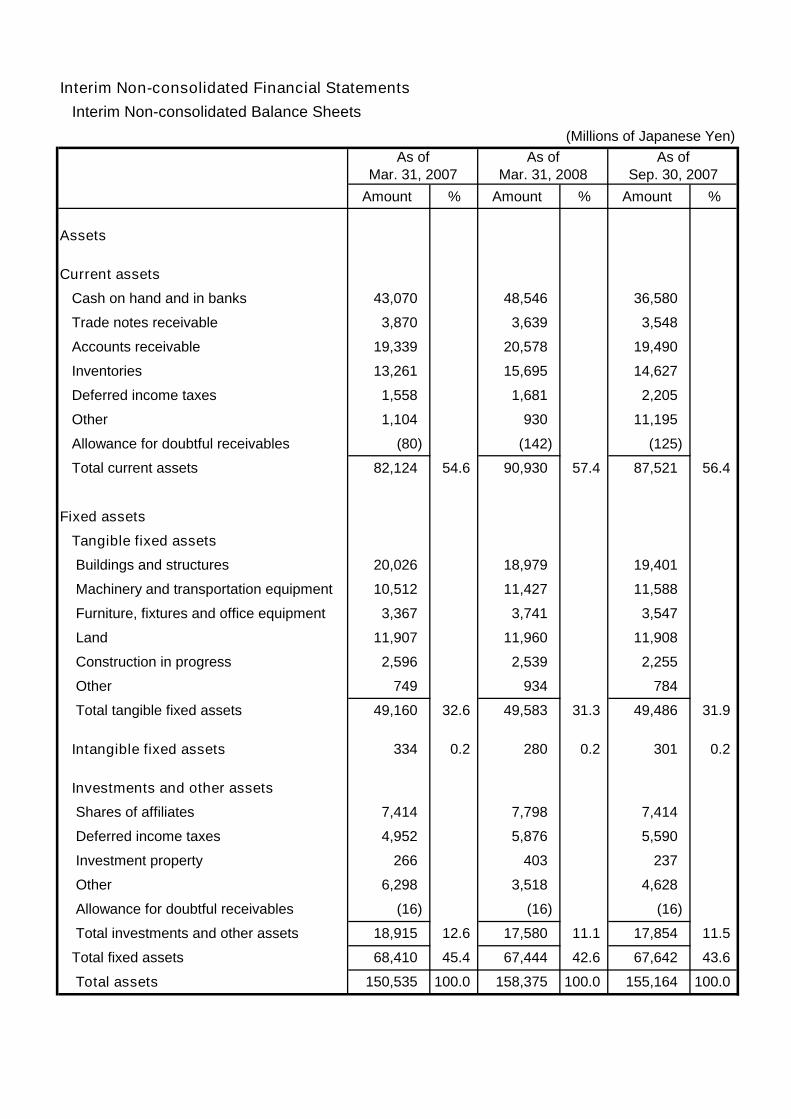
Interim Non-consolidated Financial StatementsInterim Non-consolidated Balance Sheets
(Millions of Japanese Yen)
Amount % Amount % Amount %
Assets
Current assetsCash on hand and in banks 43,070 48,546 36,580
Trade notes receivable 3,870 3,639 3,548
Accounts receivable 19,339 20,578 19,490
Inventories 13,261 15,695 14,627
Deferred income taxes 1,558 1,681 2,205
Other 1,104 930 11,195
Allowance for doubtful receivables (80) (142) (125)
Total current assets 82,124 54.6 90,930 57.4 87,521 56.4
Fixed assetsTangible fixed assets Buildings and structures 20,026 18,979 19,401
Machinery and transportation equipment 10,512 11,427 11,588
Furniture, fixtures and office equipment 3,367 3,741 3,547
Land 11,907 11,960 11,908
Construction in progress 2,596 2,539 2,255
Other 749 934 784
Total tangible fixed assets 49,160 32.6 49,583 31.3 49,486 31.9
Intangible fixed assets 334 0.2 280 0.2 301 0.2
Investments and other assets Shares of affiliates 7,414 7,798 7,414
Deferred income taxes 4,952 5,876 5,590
Investment property 266 403 237
Other 6,298 3,518 4,628
Allowance for doubtful receivables (16) (16) (16)
Total investments and other assets 18,915 12.6 17,580 11.1 17,854 11.5
Total fixed assets 68,410 45.4 67,444 42.6 67,642 43.6
Total assets 150,535 100.0 158,375 100.0 155,164 100.0
As ofSep. 30, 2007
As ofMar. 31, 2008
As ofMar. 31, 2007

Interim Non-consolidated Financial StatementsInterim Non-consolidated Balance Sheets
(Millions of Japanese Yen)
Amount % Amount % Amount %
Liabilities
Current liabilitiesTrade notes payable 4,771 5,406 4,751Trade accounts payable 7,252 7,937 6,946Current portion of convertible debentures 12,580 - -Current portion of long-term debt 6,263 1,263 2,263Income taxes payable 2,399 3,001 2,843Accrued bonuses 2,411 2,437 3,707Notes payable - construction 1,717 760 794Other 7,032 7,118 7,149 Total current liabilities 44,428 29.5 27,924 17.6 28,456 18.3
Long-term liabilitiesNon-collateral bonds with warrants to buy stocks 2,568 1,473 1,673
Long-term debt 1,706 6,442 7,530Allowance for employees' retirement and severance benefits 11,813 12,291 12,065
Allowance for retirement benefits for directors and corporate auditors 1,419 1,487 1,452
Total long-term liabilities 17,506 11.6 21,693 13.7 22,721 14.7 Total liabilities 61,935 41.1 49,618 31.3 51,177 33.0
As ofMar. 31, 2007
As ofMar. 31, 2008
As ofSep. 30, 2007

Interim Non-consolidated Financial StatementsInterim Non-consolidated Balance Sheets
(Millions of Japanese Yen)
Amount % Amount % Amount %
Net asset
Shareholders' equityCommon stock 28,057 18.6 34,870 22.0 34,770 22.4
Capital surplusAdditional paid-in capital 27,769 34,578 34,478
Total Capital surplus 27,769 18.5 34,578 21.8 34,478 22.2
Retained earningsLegal reserve 695 695 695
Other earned surplus 36,331 44,024 38,974
Reserve for special depreciation 260 186 186
Reserve for dividends 3,500 3,500 3,500
General reserve 23,600 28,600 23,600
Earned surplus carried forward 8,971 11,738 11,688
Total Retained earnings 37,026 24.6 44,719 28.3 39,670 25.6
Less treasury stock, at cost (6,017) (4.0) (6,038) (3.8) (6,035) (3.9)
Total Shareholders' equity 86,836 57.7 108,129 68.3 102,883 66.3
Revaluation and Translation AdjustmentsUnrealized gain on securities, net of tax 1,764 627 1,103
Total Revaluation and Translation Adjustments 1,764 1.2 627 0.4 1,103 0.7
Total net asset 88,600 58.9 108,756 68.7 103,987 67.0
Total liabilities and net asset 150,535 100.0 158,375 100.0 155,164 100.0
As ofSep. 30, 2007
As ofMar. 31, 2008
As ofMar. 31, 2007

Interim Non-consolidated Financial StatementsInterim Non-consolidated Income Statements
(Millions of Japanese Yen)
Amount % Amount % Amount %
Net sales 40,570 100.0 42,805 100.0 81,489 100.0
Cost of sales 21,520 53.0 22,828 53.3 43,279 53.1
Gross profit 19,049 47.0 19,977 46.7 38,209 46.9
Selling, general and administrative expenses 10,872 26.8 11,333 26.5 23,304 28.6
Operating income 8,177 20.2 8,643 20.2 14,905 18.3
Non-operating income 1,966 4.8 2,354 5.5 2,245 2.8
Non-operating expenses 145 0.4 414 1.0 289 0.4
Ordinary income 9,997 24.6 10,583 24.7 16,861 20.7
Extraordinary income 180 0.4 211 0.5 342 0.4
Extraordinary loss 177 0.4 221 0.5 479 0.6
Income before income taxes 10,000 24.6 10,573 24.7 16,723 20.5
Income taxes 2,417 3,058 5,442
Income taxes in previous years - 245 97
Income taxes return in previous years - - (257)
Deferred income taxes 921 371 628
Net income 6,661 16.4 6,898 16.1 10,812 13.3
Six months endedMar. 31, 2007
Six months endedMar. 31, 2008
Fiscal year endedSep. 30, 2007
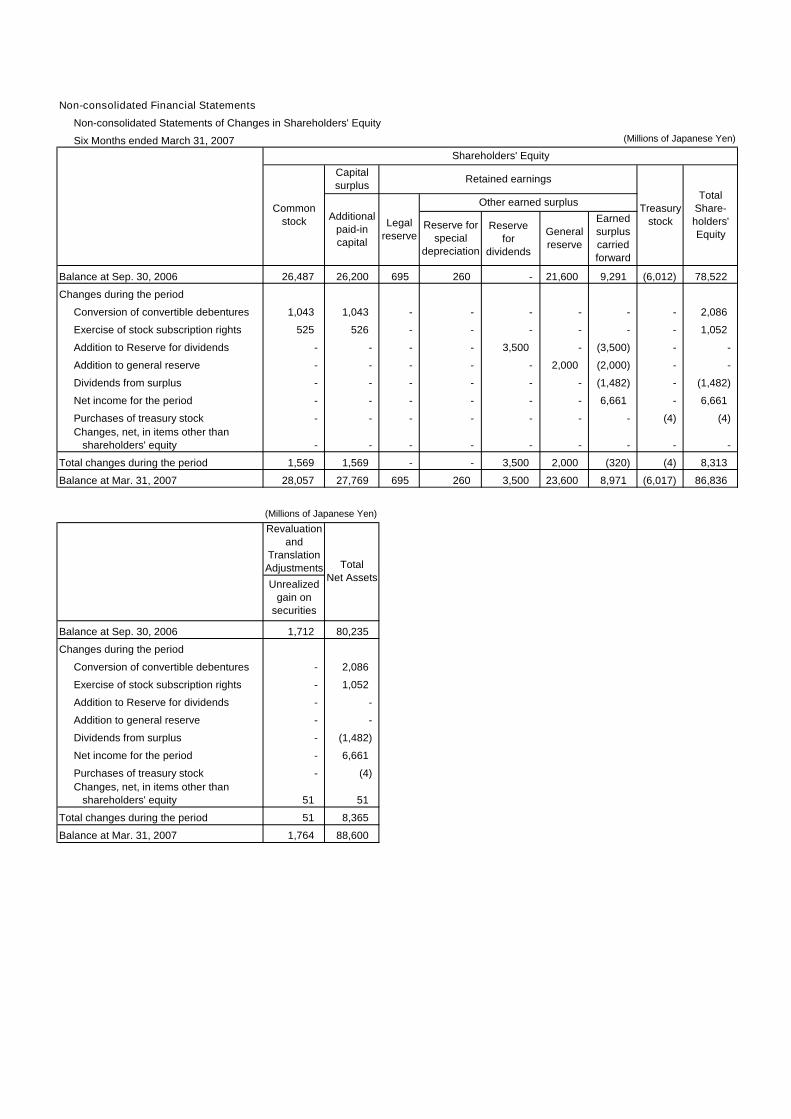
Non-consolidated Financial StatementsNon-consolidated Statements of Changes in Shareholders' Equity
Six Months ended March 31, 2007 (Millions of Japanese Yen)
Reservefor
dividends
Balance at Sep. 30, 2006 26,487 26,200 695 260 - 21,600 9,291 (6,012) 78,522
Changes during the period
Conversion of convertible debentures 1,043 1,043 - - - - - - 2,086
Exercise of stock subscription rights 525 526 - - - - - - 1,052
Addition to Reserve for dividends - - - - 3,500 - (3,500) - -
Addition to general reserve - - - - - 2,000 (2,000) - -
Dividends from surplus - - - - - - (1,482) - (1,482)
Net income for the period - - - - - - 6,661 - 6,661
Purchases of treasury stock - - - - - - - (4) (4)Changes, net, in items other than shareholders' equity - - - - - - - - -
Total changes during the period 1,569 1,569 - - 3,500 2,000 (320) (4) 8,313
Balance at Mar. 31, 2007 28,057 27,769 695 260 3,500 23,600 8,971 (6,017) 86,836
(Millions of Japanese Yen)
Balance at Sep. 30, 2006 1,712 80,235
Changes during the period
Conversion of convertible debentures - 2,086
Exercise of stock subscription rights - 1,052
Addition to Reserve for dividends - -
Addition to general reserve - -
Dividends from surplus - (1,482)
Net income for the period - 6,661
Purchases of treasury stock - (4)Changes, net, in items other than shareholders' equity 51 51
Total changes during the period 51 8,365
Balance at Mar. 31, 2007 1,764 88,600
Revaluationand
TranslationAdjustments Total
Net AssetsUnrealizedgain on
securities
Legalreserve
Commonstock Additional
paid-incapital
Shareholders' EquityCapitalsurplus
Treasurystock
TotalShare-holders'Equity
Earnedsurpluscarriedforward
Retained earnings
Other earned surplus
Generalreserve
Reserve forspecial
depreciation

Non-consolidated Financial StatementsNon-consolidated Statements of Changes in Shareholders' Equity
Six Months ended March 31, 2008 (Millions of Japanese Yen)
Reservefor
dividends
Balance at Sep. 30, 2007 34,770 34,478 695 186 3,500 23,600 11,688 (6,035) 102,883
Changes during the period
Exercise of stock subscription rights 99 100 - - - - - - 200
Addition to general reserve - - - - - 5,000 (5,000) - -
Dividends from surplus - - - - - - (1,848) - (1,848)
Net income for the period - - - - - - 6,898 - 6,898
Purchases of treasury stock - - - - - - - (3) (3)Changes, net, in items other than shareholders' equity - - - - - - - - -
Total changes during the period 99 100 - - - 5,000 49 (3) 5,246
Balance at Mar. 31, 2008 34,870 34,578 695 186 3,500 28,600 11,738 (6,038) 108,129
(Millions of Japanese Yen)
Balance at Sep. 30, 2007 1,103 103,987
Changes during the period
Exercise of stock subscription rights - 200
Addition to general reserve - -
Dividends from surplus - (1,848)
Net income for the period - 6,088
Purchases of treasury stock - (3)Changes, net, in items other than shareholders' equity (476) (476)
Total changes during the period (476) 4,769
Balance at Mar. 31, 2008 627 108,756
Shareholders' EquityCapitalsurplus
Treasurystock
TotalShare-holders'Equity
Earnedsurpluscarriedforward
Retained earnings
Other earned surplus
Generalreserve
Reserve forspecial
depreciation
Revaluationand
TranslationAdjustments Total
Net AssetsUnrealizedgain on
securities
Legalreserve
Commonstock Additional
paid-incapital

Non-consolidated Financial StatementsNon-consolidated Statements of Changes in Shareholders' Equity
Fiscal year ended September 30, 2007 (Millions of Japanese Yen)
Reservefor
dividends
Balance at Sep. 30, 2006 26,487 26,200 695 260 - 21,600 9,291 (6,012) 78,522
Changes during the period
Conversion of convertible debentures 7,309 7,304 - - - - - - 14,613
Exercise of stock subscription rights 973 973 - - - - - - 1,947
Reversal of reserve for special depreciation - - - (74) - - 74 - -
Addition to Reserve for dividends - - - - 3,500 - (3,500) - -
Addition to general reserve - - - - - 2,000 (2,000) - -
Dividends from surplus - - - - - - (1,482) - (1,482)
Interim dividends from surplus - - - - - - (1,507) - (1,507)
Net income for the period - - - - - - 10,812 - 10,812
Purchases of treasury stock - - - - - - - (22) (22)Changes, net, in items other than shareholders' equity - - - - - - - - -
Total changes during the period 8,282 8,277 - (74) 3,500 2,000 2,396 (22) 24,360
Balance at Sep. 30, 2007 34,770 34,478 695 186 3,500 23,600 11,688 (6,035) 102,883
(Millions of Japanese Yen)
Balance at Sep. 30, 2006 1,712 80,235
Changes during the period
Conversion of convertible debentures - 14,613
Exercise of stock subscription rights - 1,947
Reversal of reserve for special depreciation - -
Addition to Reserve for dividends - -
Addition to general reserve - -
Dividends from surplus - (1,482)
Interim dividends from surplus - (1,507)
Net income for the period - 10,812
Purchases of treasury stock - (22)Changes, net, in items other than shareholders' equity (608) (608)
Total changes during the period (608) 23,751
Balance at Sep. 30, 2007 1,103 103,987
Shareholders' EquityCapitalsurplus
Treasurystock
TotalShare-holders'Equity
Earnedsurpluscarriedforward
Retained earnings
Other earned surplus
Generalreserve
Reserve forspecial
depreciation
Revaluationand
TranslationAdjustments Total
Net AssetsUnrealizedgain on
securities
Legalreserve
Commonstock Additional
paid-incapital


![SUMMARY OF FINANCIAL STATEMENTS [IFRS] (CONSOLIDATED) Financial Results … · SUMMARY OF FINANCIAL STATEMENTS [IFRS] (CONSOLIDATED) Financial Results for the Fiscal Year Ended March](https://img.pdfslide.us/doc/110x75/5e92676282566416065a9900/summary-of-financial-statements-ifrs-consolidated-financial-results-summary.jpg)